ELECTROCARDIOGRAPHY • KEVIN REBECK PA-C For more presentations www.medicalppt.blogspot.com

Welcome message from author
This document is posted to help you gain knowledge. Please leave a comment to let me know what you think about it! Share it to your friends and learn new things together.
Transcript

ELECTROCARDIOGRAPHY
• KEVIN REBECK PA-C
For more presentations www.medicalppt.blogspot.com

Objectives
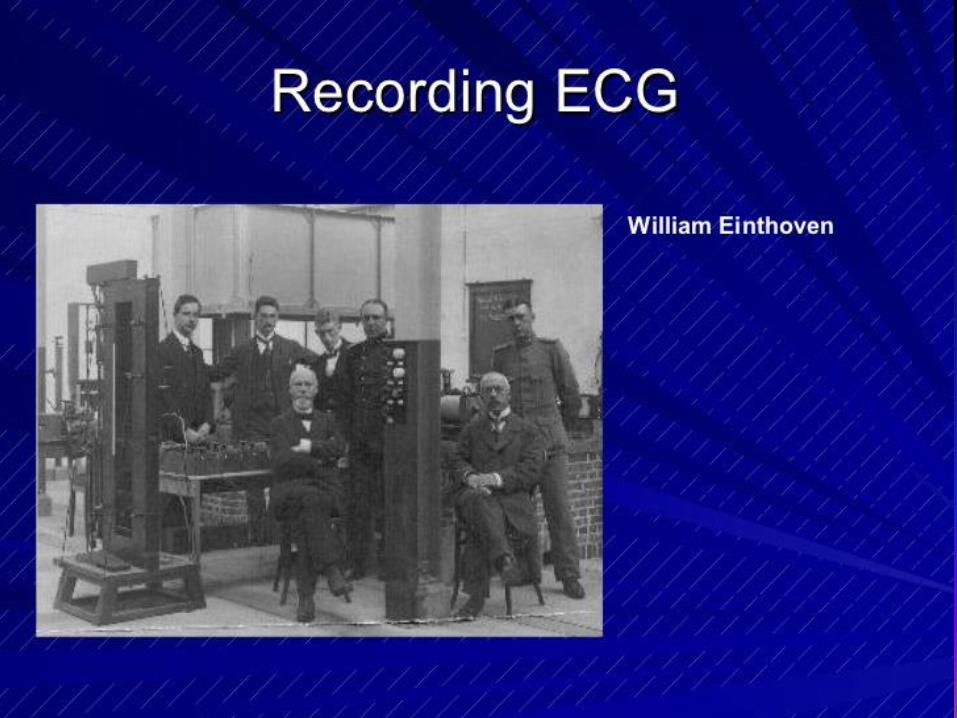
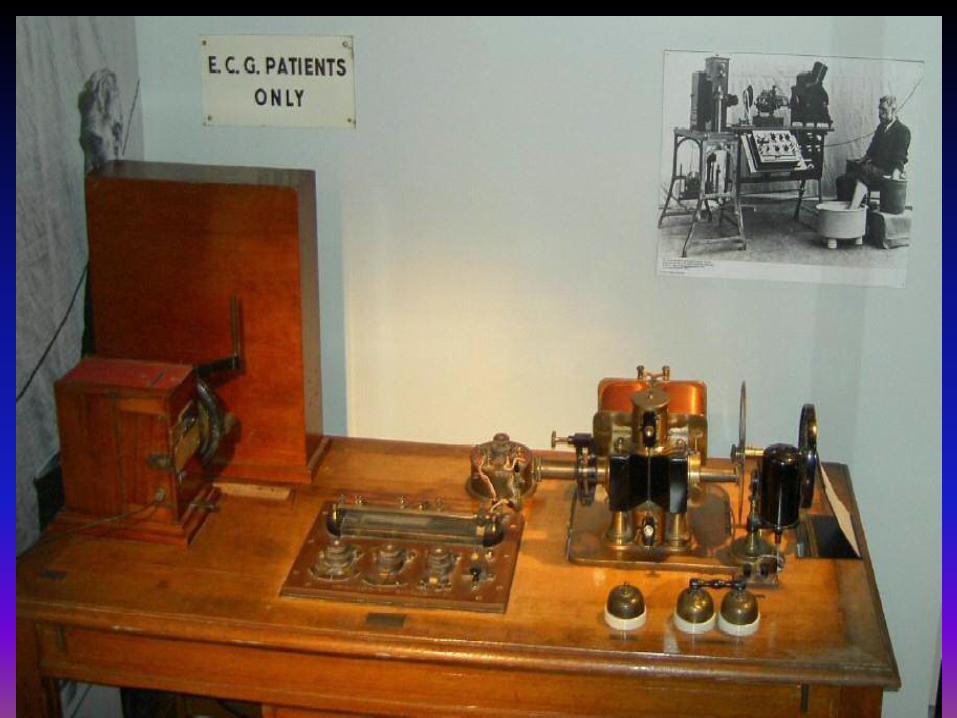
• ECG History
Pathophysiology
Basics
Case Historys


Electrical activation of the
heart
• In the heart muscle cell, or myocyte,
electric activation takes place by means
of the same mechanism as in the nerve
cell, i.e., from the inflow of Na ions
across the cell membrane.
• The amplitude of the action potential is
also similar, being 100 mV for both
nerve and muscle.

• The duration of the cardiac impulse is, however, two orders of magnitude longer than in either nerve cell or sceletal muscle cell.
• As in the nerve cell, repolarization is a consequence of the outflow of K ions.
• The duration of the action impulse is about 300 ms.

Electrophysiology of the cardiac muscle
cell

Mechanical contraction
of Cardiac Muscle
• Associated with the electric activation of cardiac
muscle cell is its mechanical contraction,
which occurs a little later.
• An important distinction between cardiac muscle
tissue and skeletal muscle is that in cardiac muscle,
activation can propagate from one cell to another
in any direction.
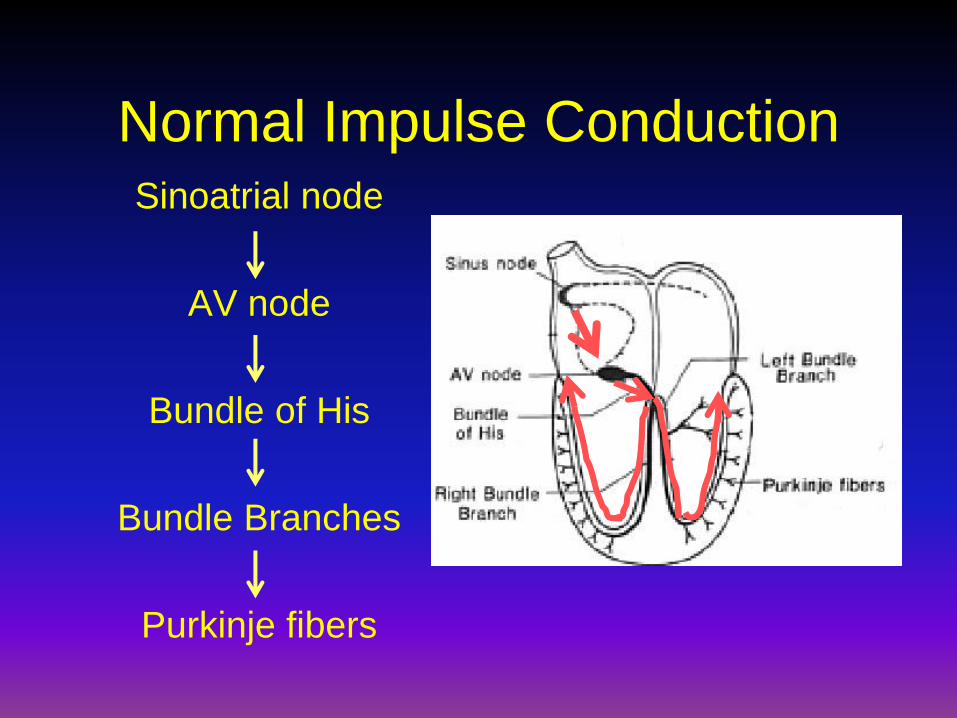
Normal Impulse ConductionSinoatrial node
AV node
Bundle of His
Bundle Branches
Purkinje fibers

Impulse Conduction & the ECGSinoatrial node
AV node
Bundle of His
Bundle Branches
Purkinje fibers

The “PQRST”
• P wave - Atrial
depolarization
• T wave - Ventricular
repolarization
• QRS - Ventricular
depolarization
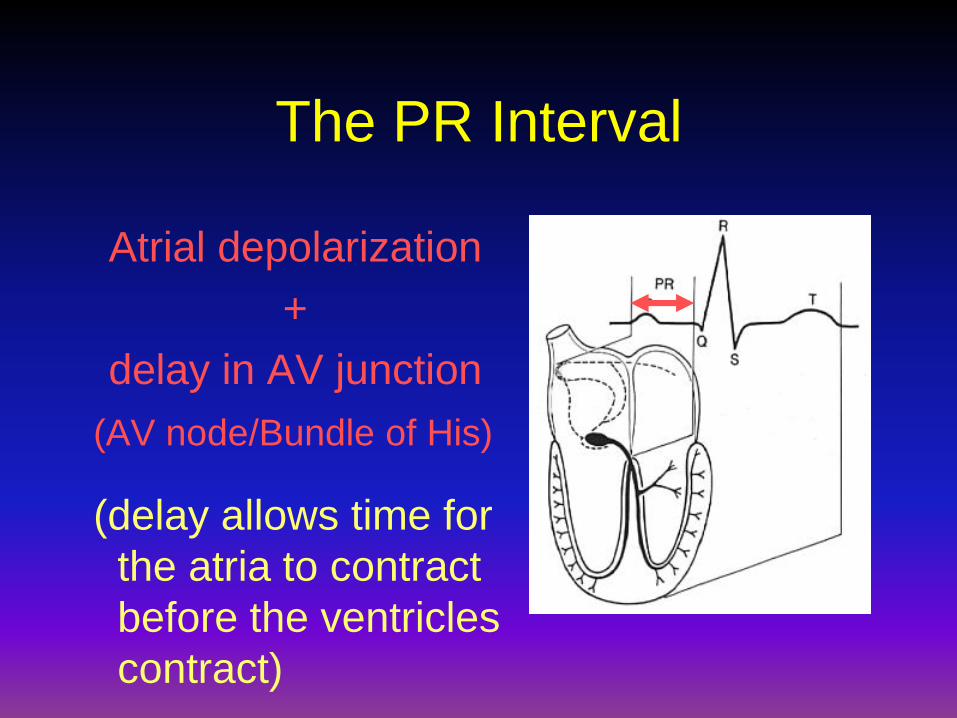
The PR Interval
Atrial depolarization
+
delay in AV junction
(AV node/Bundle of His)
(delay allows time for
the atria to contract
before the ventricles
contract)

Pacemakers of the Heart
• SA Node - Dominant pacemaker with an
intrinsic rate of 60 - 100 beats/minute.
• AV Node - Back-up pacemaker with an
intrinsic rate of 40 - 60 beats/minute.
• Ventricular cells - Back-up pacemaker
with an intrinsic rate of 20 - 45 bpm.

The ECG Paper
• Horizontally
– One small box - 0.04 s
– One large box - 0.20 s
• Vertically
– One large box - 0.5 mV

The ECG Paper (cont)
• Every 3 seconds (15 large boxes) is
marked by a vertical line.
• This helps when calculating the heart
rate.
NOTE: the following strips are not marked
but all are 6 seconds long.
3 sec 3 sec

Rhythm Analysis
• Step 1: Calculate rate.
• Step 2: Determine regularity.
• Step 3: Assess the P waves.
• Step 4: Determine PR interval.
• Step 5: Determine QRS duration.

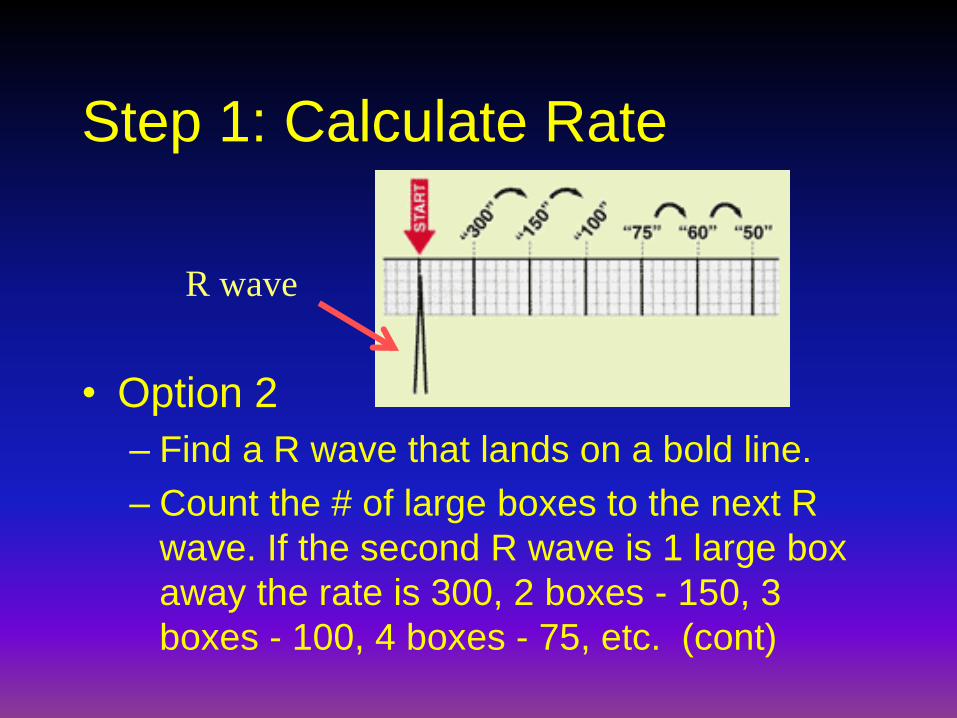
Step 1: Calculate Rate
• Option 1
– Count the # of R waves in a 6 second
rhythm strip, then multiply by 10.
– Reminder: all rhythm strips in the Modules
are 6 seconds in length.
Interpretation? 9 x 10 = 90 bpm
3 sec 3 sec
Step 1: Calculate Rate
• Option 2
– Find a R wave that lands on a bold line.
– Count the # of large boxes to the next R
wave. If the second R wave is 1 large box
away the rate is 300, 2 boxes - 150, 3
boxes - 100, 4 boxes - 75, etc. (cont)
R wave

Step 1: Calculate Rate
• Option 2 (cont)
– Memorize the sequence:
300 - 150 - 100 - 75 - 60 - 50
Interpretation?
3
0
0
1
5
0
1
0
0
7
5
6
0
5
0
Approx. 1 box less than
100 = 95 bpm
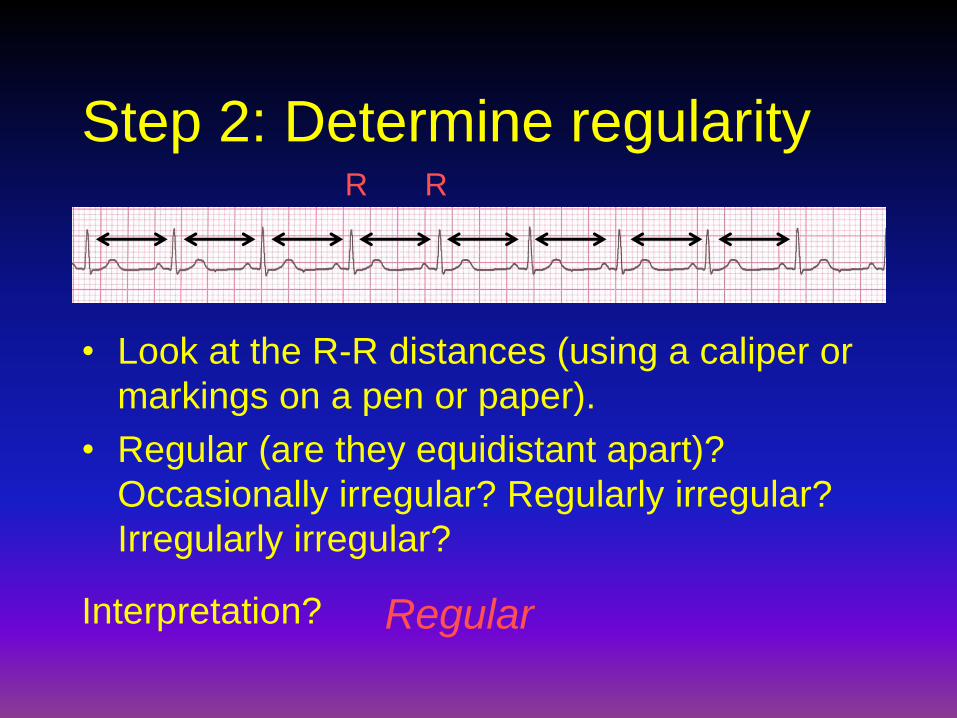
Step 2: Determine regularity
• Look at the R-R distances (using a caliper or
markings on a pen or paper).
• Regular (are they equidistant apart)?
Occasionally irregular? Regularly irregular?
Irregularly irregular?
Interpretation? Regular
R R

Step 3: Assess the P waves
• Are there P waves?
• Do the P waves all look alike?
• Do the P waves occur at a regular rate?
• Is there one P wave before each QRS?
Interpretation? Normal P waves with 1 P
wave for every QRS

Step 4: Determine PR interval
• Normal: 0.12 - 0.20 seconds.
(3 - 5 boxes)
Interpretation? 0.12 seconds

Step 5: QRS duration
• Normal: 0.04 - 0.12 seconds.
(1 - 3 boxes)
Interpretation? 0.08 seconds

Rhythm Summary
• Rate 90-95 bpm
• Regularity regular
• P waves normal
• PR interval 0.12 s
• QRS duration 0.08 s
Interpretation? Normal Sinus Rhythm
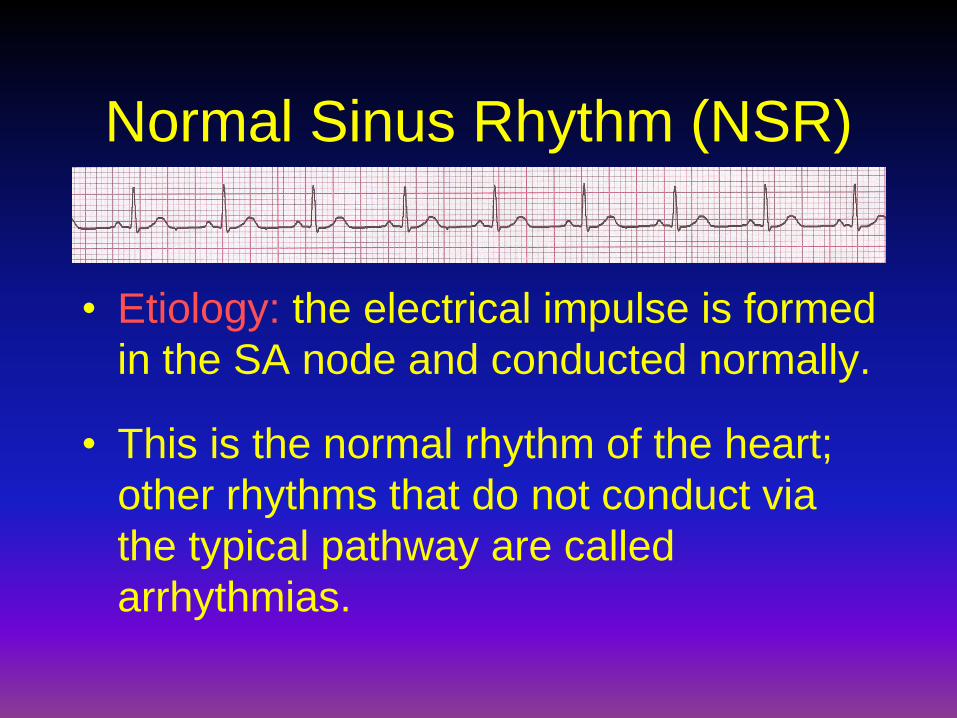
Normal Sinus Rhythm (NSR)
• Etiology: the electrical impulse is formed
in the SA node and conducted normally.
• This is the normal rhythm of the heart;
other rhythms that do not conduct via
the typical pathway are called
arrhythmias.
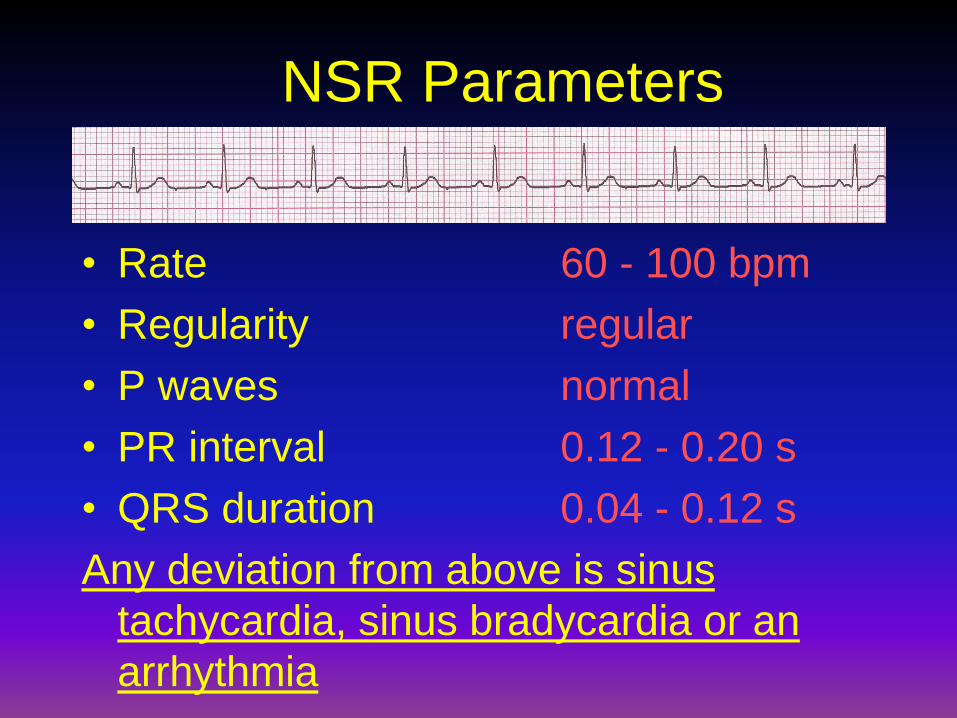
NSR Parameters
• Rate 60 - 100 bpm
• Regularity regular
• P waves normal
• PR interval 0.12 - 0.20 s
• QRS duration 0.04 - 0.12 s
Any deviation from above is sinus
tachycardia, sinus bradycardia or an
arrhythmia

Arrhythmia Formation
Arrhythmias can arise from problems in
the:
• Sinus node
• Atrial cells
• AV junction
• Ventricular cells
SA Node Problems
The SA Node can:
• fire too slow
• fire too fast
Sinus Bradycardia
Sinus Tachycardia
Sinus Tachycardia may be an appropriate
response to stress.
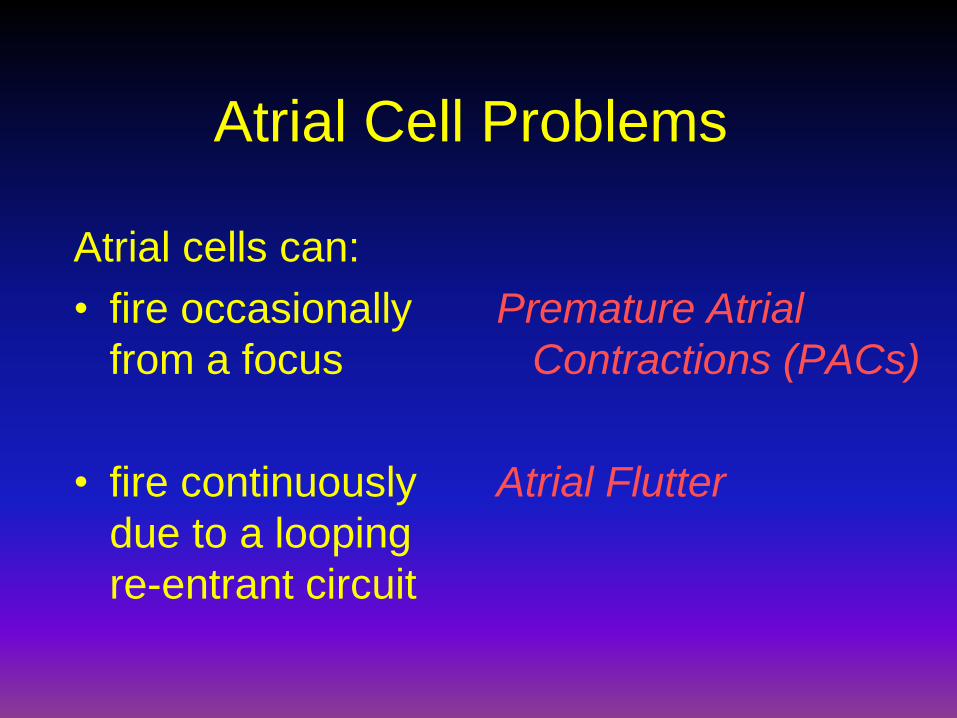
Atrial Cell Problems
Atrial cells can:
• fire occasionally
from a focus
• fire continuously
due to a looping
re-entrant circuit
Premature Atrial
Contractions (PACs)
Atrial Flutter

Teaching Moment
• A re-entrant
pathway occurs
when an impulse
loops and results
in self-
perpetuating
impulse
formation.

Atrial Cell Problems
Atrial cells can also:
• fire continuously
from multiple foci
or
fire continuously
due to multiple
micro re-entrant
“wavelets”
Atrial Fibrillation
Atrial Fibrillation

Teaching Moment
Multiple micro re-
entrant “wavelets”
refers to wandering
small areas of
activation which
generate fine chaotic
impulses. Colliding
wavelets can, in turn,
generate new foci of
activation.
Atrial tissue

AV Junctional Problems
The AV junction can:
• fire continuously
due to a looping
re-entrant circuit
• block impulses
coming from the
SA Node
Paroxysmal
Supraventricular
Tachycardia
AV Junctional Blocks
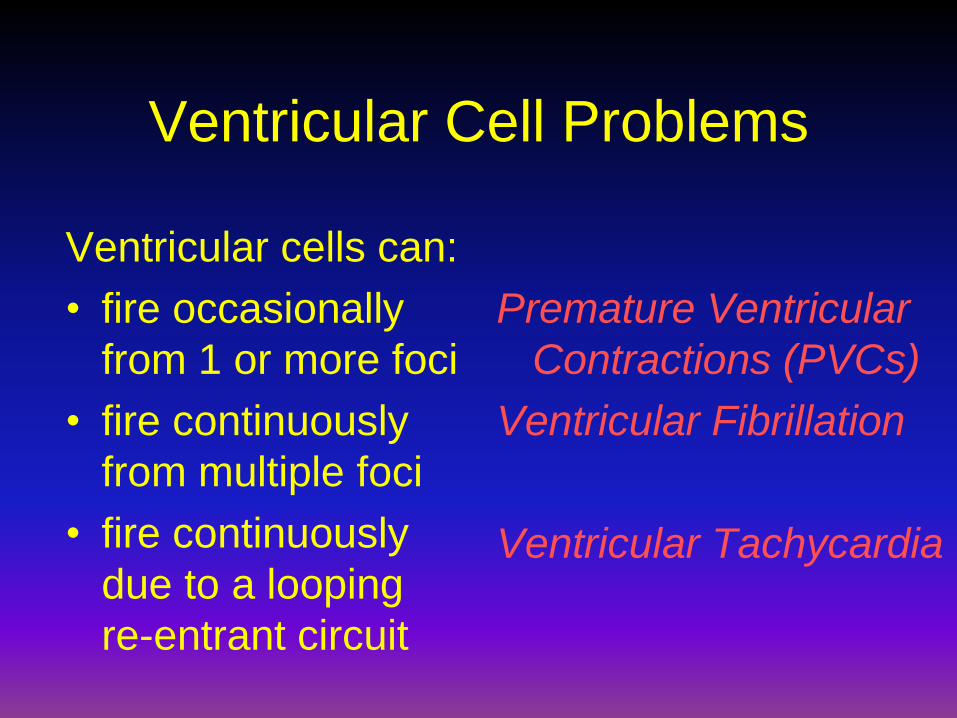
Ventricular Cell Problems
Ventricular cells can:
• fire occasionally
from 1 or more foci
• fire continuously
from multiple foci
• fire continuously
due to a looping
re-entrant circuit
Premature Ventricular
Contractions (PVCs)
Ventricular Fibrillation
Ventricular Tachycardia
Sinus Rhythms
• Sinus Bradycardia
• Sinus Tachycardia

Rhythm #1
30 bpm• Rate?
• Regularity? regular
normal
0.10 s
• P waves?
• PR interval? 0.12 s
• QRS duration?
Interpretation? Sinus Bradycardia

Sinus Bradycardia
• Deviation from NSR
- Rate < 60 bpm

Sinus Bradycardia
• Etiology: SA node is depolarizing slower
than normal, impulse is conducted
normally (i.e. normal PR and QRS
interval).

Rhythm #2
130 bpm• Rate?
• Regularity? regular
normal
0.08 s
• P waves?
• PR interval? 0.16 s
• QRS duration?
Interpretation? Sinus Tachycardia

Sinus Tachycardia
• Deviation from NSR
- Rate > 100 bpm
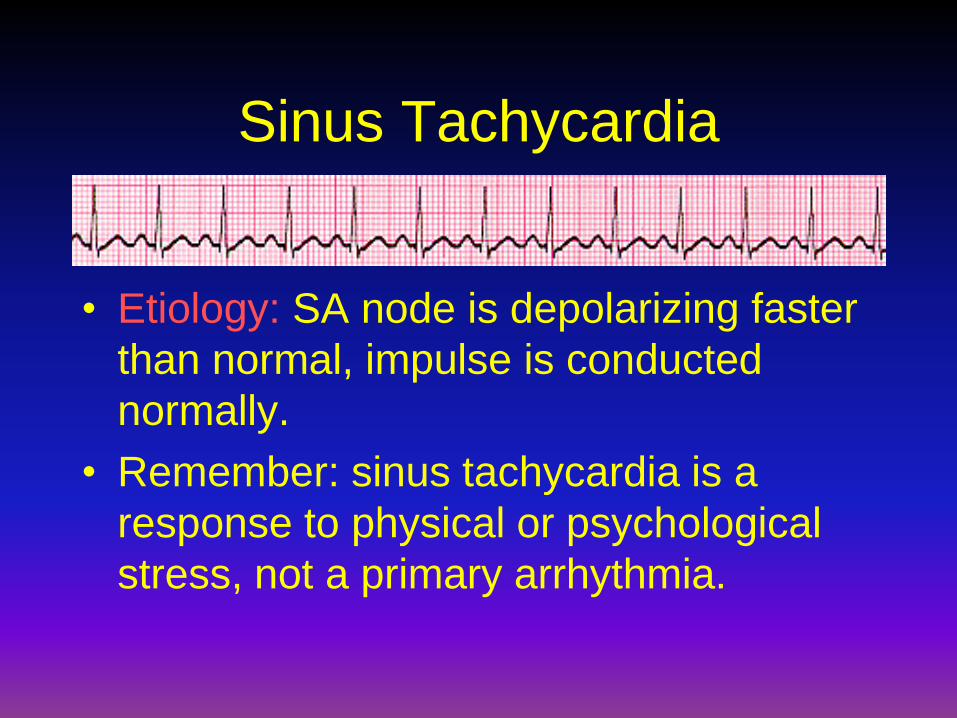
Sinus Tachycardia
• Etiology: SA node is depolarizing faster
than normal, impulse is conducted
normally.
• Remember: sinus tachycardia is a
response to physical or psychological
stress, not a primary arrhythmia.

Premature Beats
• Premature Atrial Contractions
(PACs)
• Premature Ventricular Contractions
(PVCs)

Rhythm #3
70 bpm• Rate?
• Regularity? occasionally irreg.
2/7 different contour
0.08 s
• P waves?
• PR interval? 0.14 s (except 2/7)
• QRS duration?
Interpretation?

Premature Atrial Contractions
• Deviation from NSR
– These ectopic beats originate in the
atria (but not in the SA node),
therefore the contour of the P wave,
the PR interval, and the timing are
different than a normally generated
pulse from the SA node.
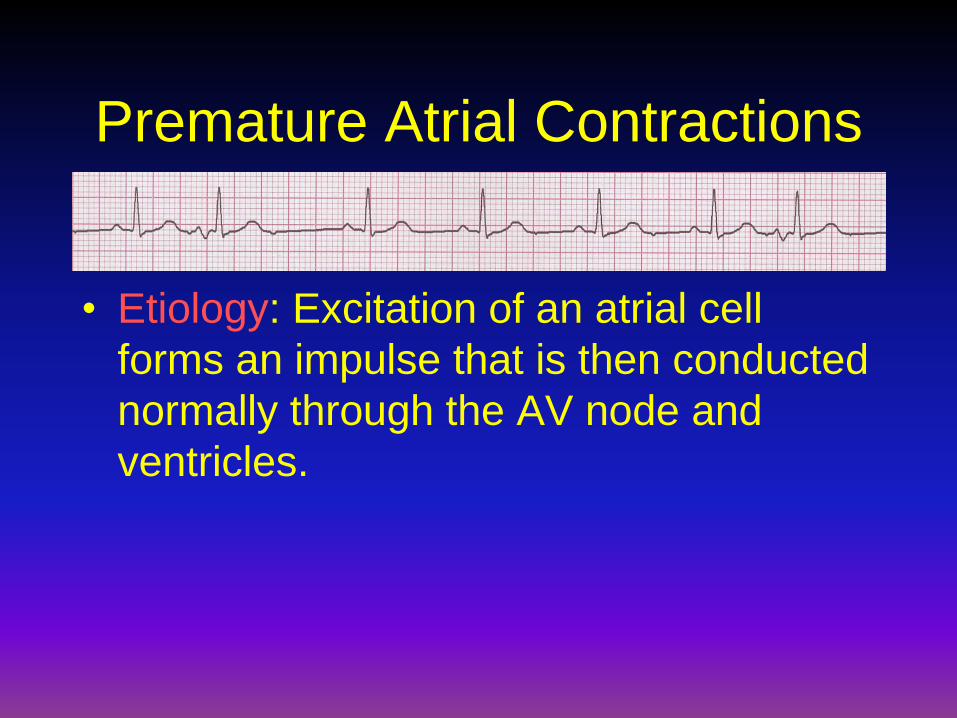
Premature Atrial Contractions
• Etiology: Excitation of an atrial cell
forms an impulse that is then conducted
normally through the AV node and
ventricles.
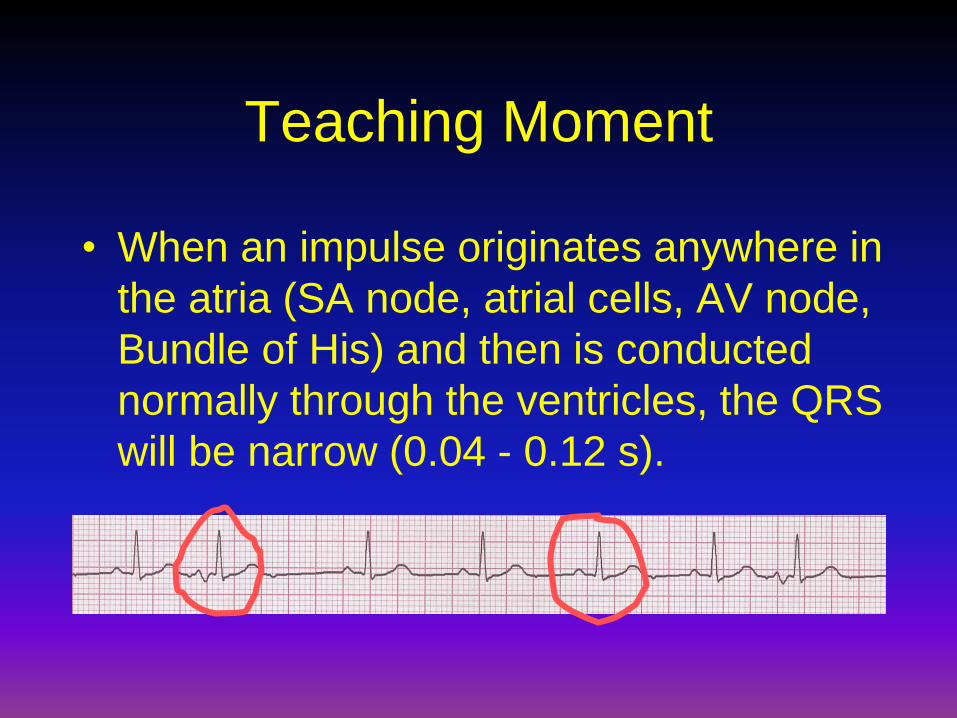
Teaching Moment
• When an impulse originates anywhere in
the atria (SA node, atrial cells, AV node,
Bundle of His) and then is conducted
normally through the ventricles, the QRS
will be narrow (0.04 - 0.12 s).
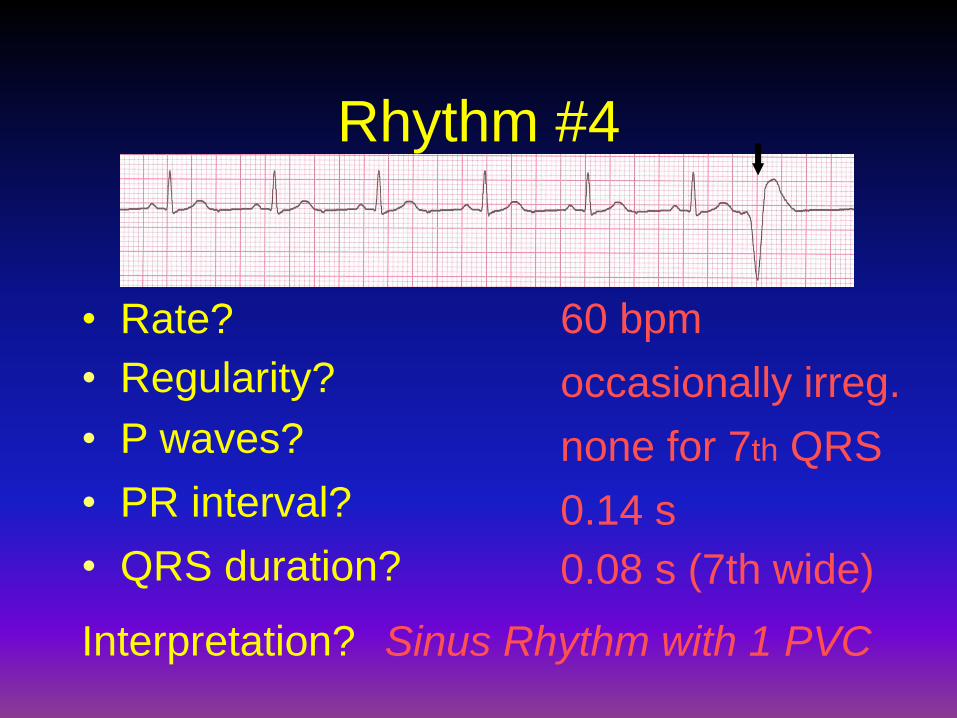
Rhythm #4
60 bpm• Rate?
• Regularity? occasionally irreg.
none for 7th QRS
0.08 s (7th wide)
• P waves?
• PR interval? 0.14 s
• QRS duration?
Interpretation? Sinus Rhythm with 1 PVC
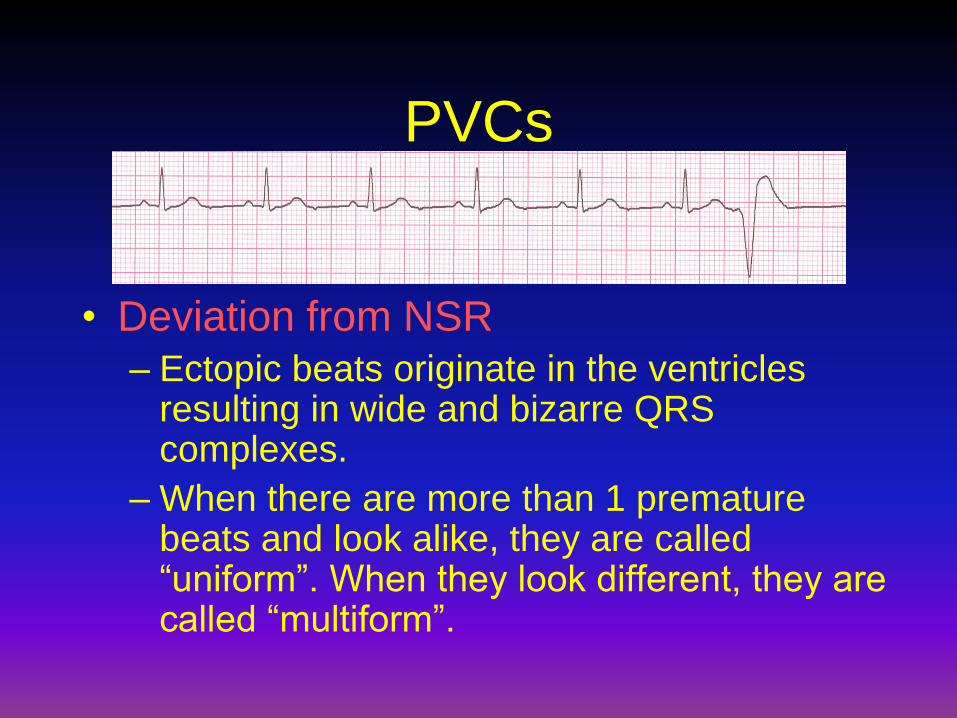
PVCs
• Deviation from NSR
– Ectopic beats originate in the ventricles resulting in wide and bizarre QRS complexes.
– When there are more than 1 premature beats and look alike, they are called “uniform”. When they look different, they are called “multiform”.

PVCs
• Etiology: One or more ventricular cells
are depolarizing and the impulses are
abnormally conducting through the
ventricles.

Teaching Moment
• When an impulse originates in a
ventricle, conduction through the
ventricles will be inefficient and the QRS
will be wide and bizarre.

Ventricular Conduction
NormalSignal moves rapidly
through the ventricles
AbnormalSignal moves slowly
through the ventricles
Supraventricular Arrhythmias
• Atrial Fibrillation
• Atrial Flutter
• Paroxysmal Supraventricular
Tachycardia
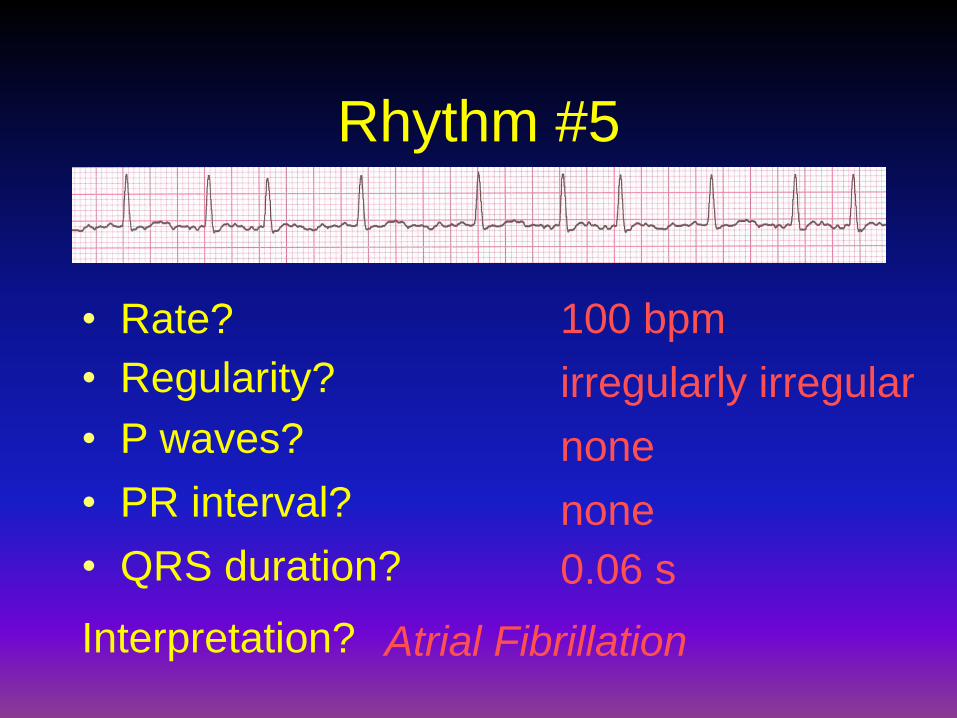
Rhythm #5
100 bpm• Rate?
• Regularity? irregularly irregular
none
0.06 s
• P waves?
• PR interval? none
• QRS duration?
Interpretation? Atrial Fibrillation
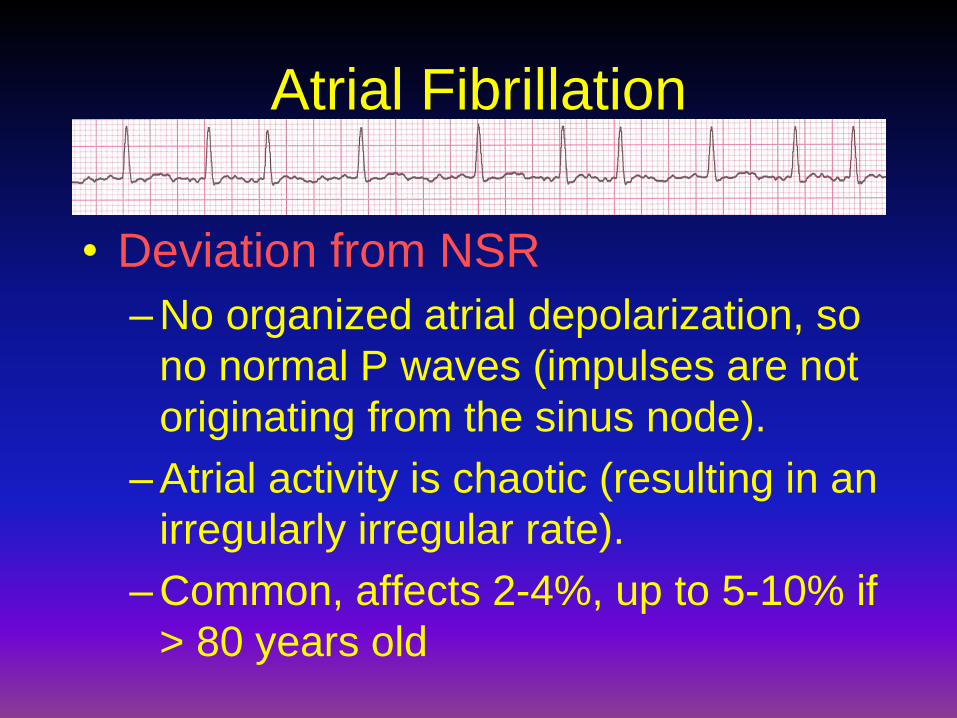
Atrial Fibrillation
• Deviation from NSR
– No organized atrial depolarization, so
no normal P waves (impulses are not
originating from the sinus node).
– Atrial activity is chaotic (resulting in an
irregularly irregular rate).
– Common, affects 2-4%, up to 5-10% if
> 80 years old

Atrial Fibrillation
• Etiology: Recent theories suggest that it
is due to multiple re-entrant wavelets
conducted between the R & L atria.
Either way, impulses are formed in a
totally unpredictable fashion. The AV
node allows some of the impulses to
pass through at variable intervals (so
rhythm is irregularly irregular).


Rhythm #6
70 bpm• Rate?
• Regularity? regular
flutter waves
0.06 s
• P waves?
• PR interval? none
• QRS duration?
Interpretation? Atrial Flutter

Atrial Flutter
• Deviation from NSR
– No P waves. Instead flutter waves (note “sawtooth” pattern) are formed at a rate of 250 - 350 bpm.
– Only some impulses conduct through the AV node (usually every other impulse).

Atrial Flutter
• Etiology: Reentrant pathway in the right
atrium with every 2nd, 3rd or 4th
impulse generating a QRS (others are
blocked in the AV node as the node
repolarizes).

For more presentations www.medicalppt.blogspot.com
Rhythm #7
74 148 bpm• Rate?
• Regularity? Regular regular
Normal none
0.08 s
• P waves?
• PR interval? 0.16 s none
• QRS duration?
Interpretation? Paroxysmal Supraventricular
Tachycardia (PSVT)

PSVT
• Deviation from NSR
– The heart rate suddenly speeds up,
often triggered by a PAC (not seen
here) and the P waves are lost.

PSVT
• Etiology: There are several types of
PSVT but all originate above the
ventricles (therefore the QRS is narrow).
• Most common: abnormal conduction in
the AV node (reentrant circuit looping in
the AV node).
Ventricular Arrhythmias
• Ventricular Tachycardia
• Ventricular Fibrillation

Rhythm #8
160 bpm• Rate?
• Regularity? regular
none
wide (> 0.12 sec)
• P waves?
• PR interval? none
• QRS duration?
Interpretation? Ventricular Tachycardia

Ventricular Tachycardia
• Deviation from NSR
– Impulse is originating in the ventricles
(no P waves, wide QRS).
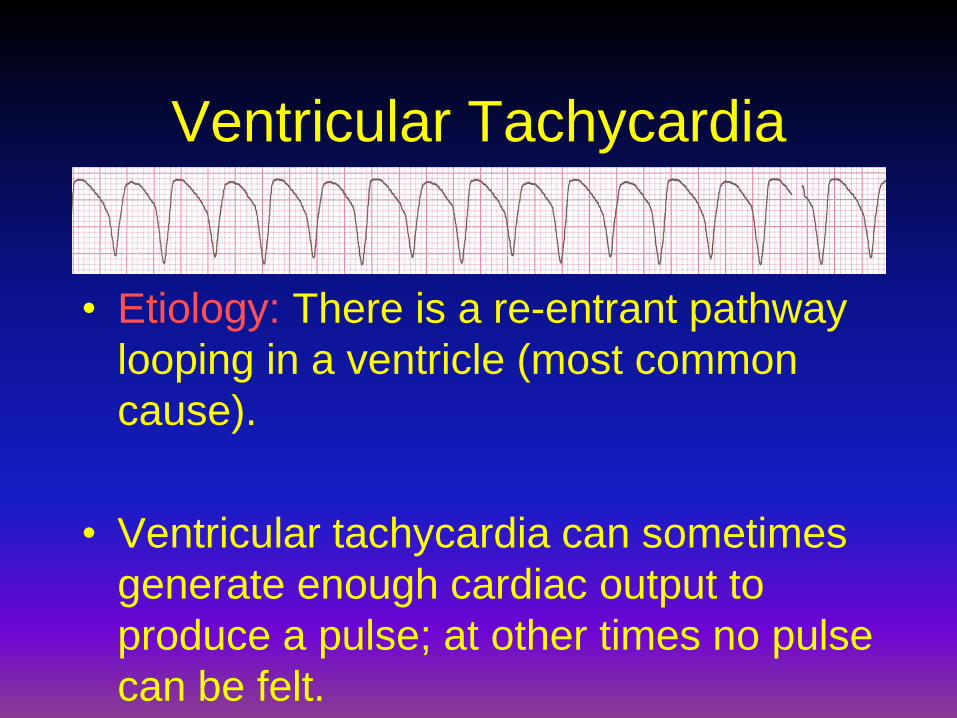
Ventricular Tachycardia
• Etiology: There is a re-entrant pathway
looping in a ventricle (most common
cause).
• Ventricular tachycardia can sometimes
generate enough cardiac output to
produce a pulse; at other times no pulse
can be felt.

Rhythm #9
none• Rate?
• Regularity? irregularly irreg.
none
wide, if recognizable
• P waves?
• PR interval? none
• QRS duration?
Interpretation? Ventricular Fibrillation

Ventricular Fibrillation
• Deviation from NSR
– Completely abnormal.

Ventricular Fibrillation
• Etiology: The ventricular cells are
excitable and depolarizing randomly.
• Rapid drop in cardiac output and death
occurs if not quickly reversed

AV Nodal Blocks
• 1st Degree AV Block
• 2nd Degree AV Block, Type I
• 2nd Degree AV Block, Type II
• 3rd Degree AV Block
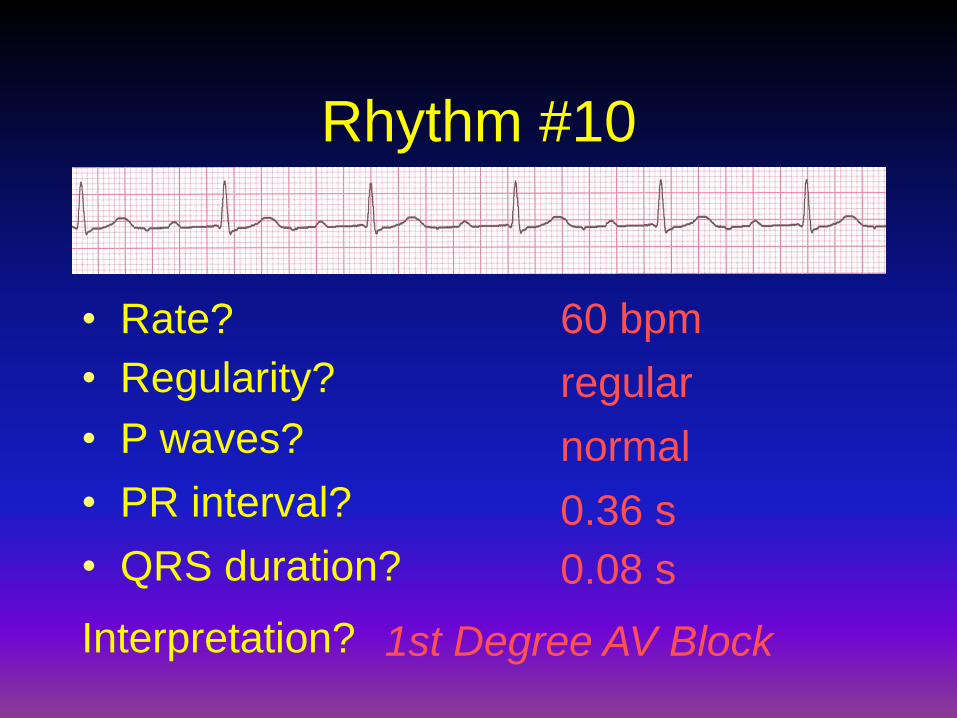
Rhythm #10
60 bpm• Rate?
• Regularity? regular
normal
0.08 s
• P waves?
• PR interval? 0.36 s
• QRS duration?
Interpretation? 1st Degree AV Block
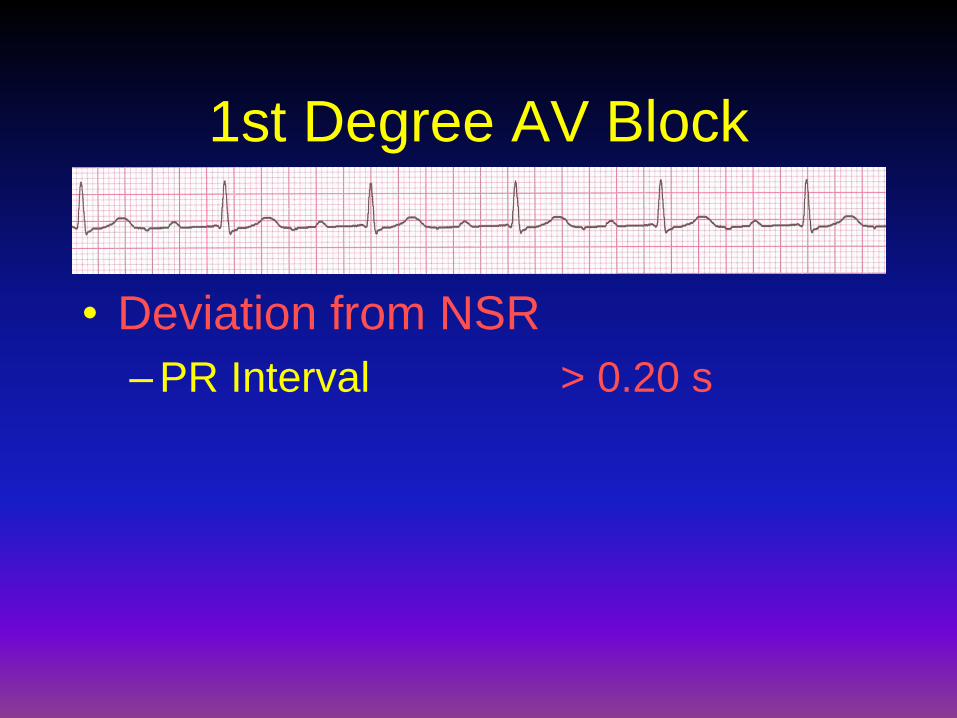
1st Degree AV Block
• Deviation from NSR
– PR Interval > 0.20 s

1st Degree AV Block
• Etiology: Prolonged conduction delay in
the AV node or Bundle of His.
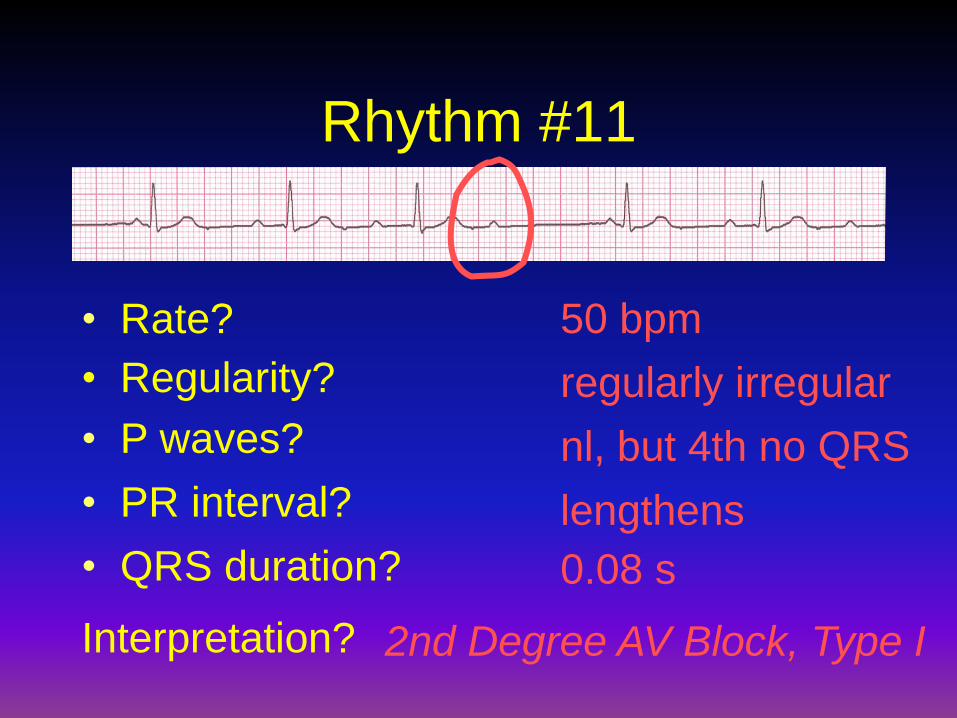
Rhythm #11
50 bpm• Rate?
• Regularity? regularly irregular
nl, but 4th no QRS
0.08 s
• P waves?
• PR interval? lengthens
• QRS duration?
Interpretation? 2nd Degree AV Block, Type I

2nd Degree AV Block, Type I
• Deviation from NSR
– PR interval progressively lengthens,
then the impulse is completely blocked
(P wave not followed by QRS).
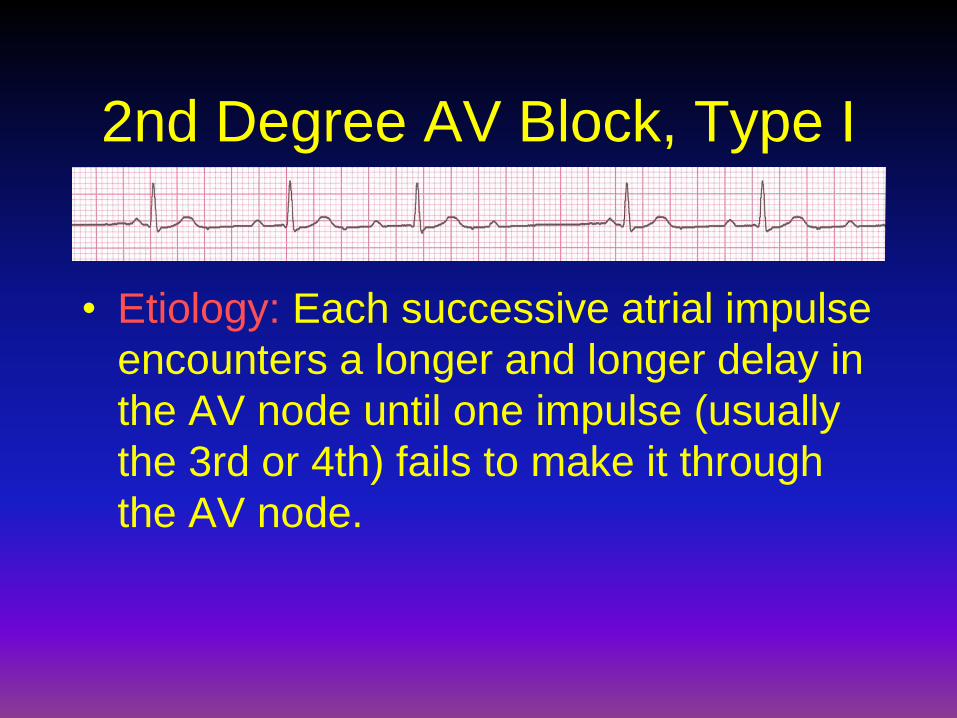
2nd Degree AV Block, Type I
• Etiology: Each successive atrial impulse
encounters a longer and longer delay in
the AV node until one impulse (usually
the 3rd or 4th) fails to make it through
the AV node.

Rhythm #12
40 bpm• Rate?
• Regularity? regular
nl, 2 of 3 no QRS
0.08 s
• P waves?
• PR interval? 0.14 s
• QRS duration?
Interpretation? 2nd Degree AV Block, Type II

2nd Degree AV Block, Type II
• Deviation from NSR
– Occasional P waves are completely
blocked (P wave not followed by QRS).

2nd Degree AV Block, Type II
• Etiology: Conduction is all or nothing
(no prolongation of PR interval);
typically block occurs in the Bundle of
His.

Rhythm #13
40 bpm• Rate?
• Regularity? regular
no relation to QRS
wide (> 0.12 s)
• P waves?
• PR interval? none
• QRS duration?
Interpretation? 3rd Degree AV Block

3rd Degree AV Block
• Deviation from NSR
– The P waves are completely blocked in
the AV junction; QRS complexes
originate independently from below the
junction.

3rd Degree AV Block
• Etiology: There is complete block of
conduction in the AV junction, so the
atria and ventricles form impulses
independently of each other. Without
impulses from the atria, the ventricles
own intrinsic pacemaker kicks in at
around 30 - 45 beats/minute.
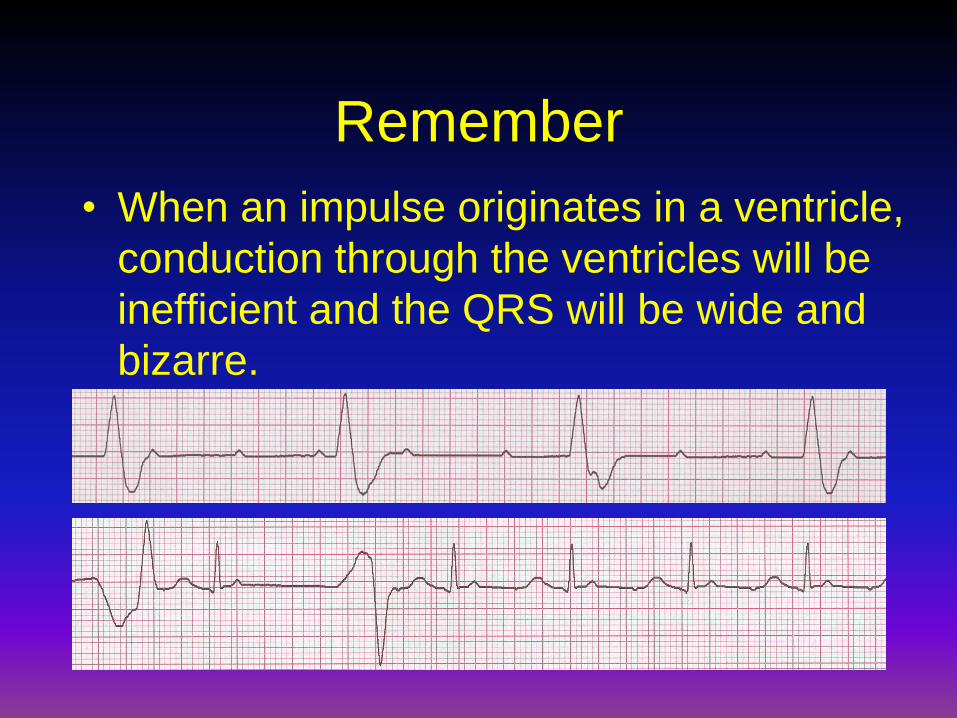
Remember
• When an impulse originates in a ventricle,
conduction through the ventricles will be
inefficient and the QRS will be wide and
bizarre.

Diagnosing a MI
To diagnose a myocardial infarction you
need to go beyond looking at a rhythm
strip and obtain a 12-Lead ECG.
Rhythm
Strip
12-Lead
ECG

The 12-Lead ECG
• The 12-Lead ECG sees the heart
from 12 different views.
• Therefore, the 12-Lead ECG helps
you see what is happening in
different portions of the heart.
• The rhythm strip is only 1 of these 12
views.

The 12-Leads
The 12-leads include:
–3 Limb leads
(I, II, III)
–3 Augmented leads
(aVR, aVL, aVF)
–6 Precordial leads
(V1- V6)

Views of the Heart
Some leads get a
good view of the:
Anterior portion
of the heart
Lateral portion
of the heart
Inferior portion
of the heart
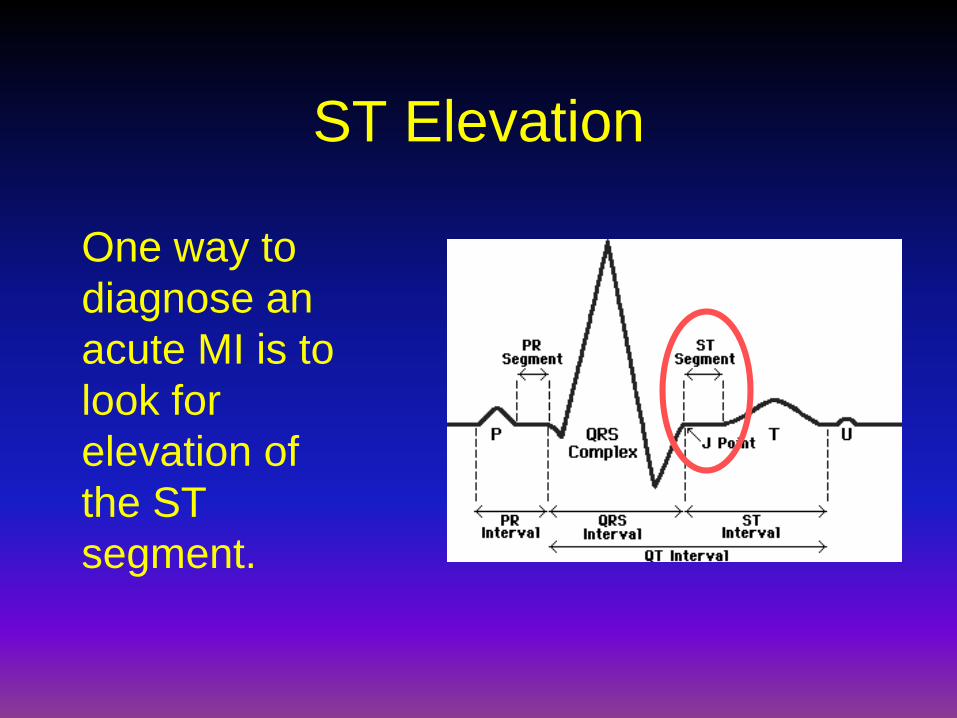
ST Elevation
One way to
diagnose an
acute MI is to
look for
elevation of
the ST
segment.

ST Elevation (cont)
Elevation of the
ST segment
(greater than 1
small box) in 2
leads is
consistent with a
myocardial
infarction.

Anterior View of the Heart
The anterior portion of the heart is best
viewed using leads V1- V4.

Anterior Myocardial Infarction
If you see changes in leads V1 - V4
that are consistent with a myocardial
infarction, you can conclude that it is
an anterior wall myocardial infarction.
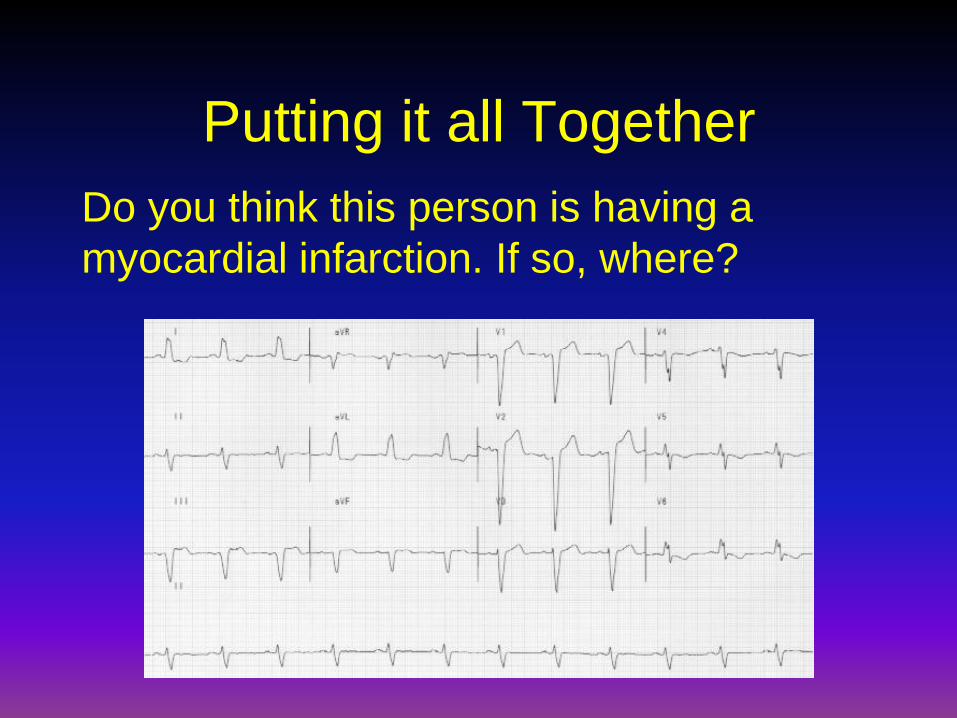
Putting it all Together
Do you think this person is having a
myocardial infarction. If so, where?

Interpretation
Yes!, this person is having an acute
anterior wall myocardial infarction.

Other MI Locations
Now that you know where to look for an
anterior wall myocardial infarction let’s
look at how you would determine if the MI
involves the lateral wall or the inferior wall
of the heart.
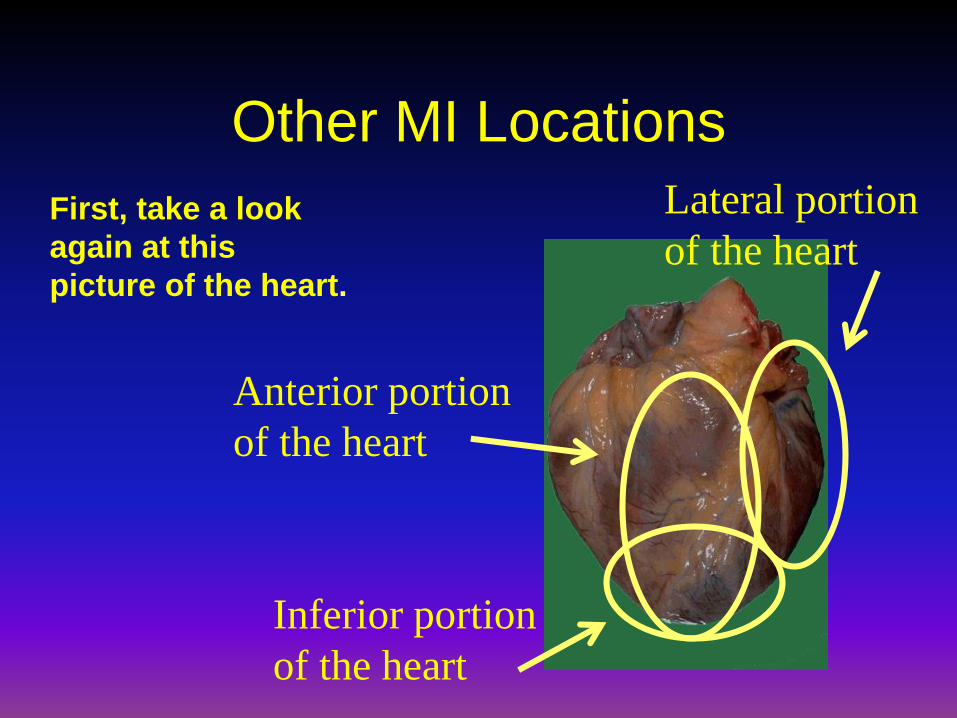
Other MI Locations
First, take a look
again at this
picture of the heart.
Anterior portion
of the heart
Lateral portion
of the heart
Inferior portion
of the heart

Other MI Locations
Second, remember that the 12-leads of the ECG look at different portions of the heart. The limb and augmented leads “see” electrical activity moving inferiorly (II, III and aVF), to the left (I, aVL) and to the right (aVR). Whereas, the precordial leads “see” electrical activity in the posterior to anterior direction.
Limb Leads Augmented Leads Precordial Leads
Other MI Locations
Now that you know where to look for an
anterior wall myocardial infarction let’s
look at how you would determine if the MI
involves the lateral wall or the inferior wall
of the heart.

Other MI Locations
First, take a look
again at this
picture of the heart.
Anterior portion
of the heart
Lateral portion
of the heart
Inferior portion
of the heart

Other MI Locations
Now, using these 3 diagrams let’s figure where to look for a lateral wall and inferior wall MI.
Limb Leads Augmented Leads Precordial Leads

Anterior MI
Remember the anterior portion of the heart is
best viewed using leads V1- V4.
Limb Leads Augmented Leads Precordial Leads
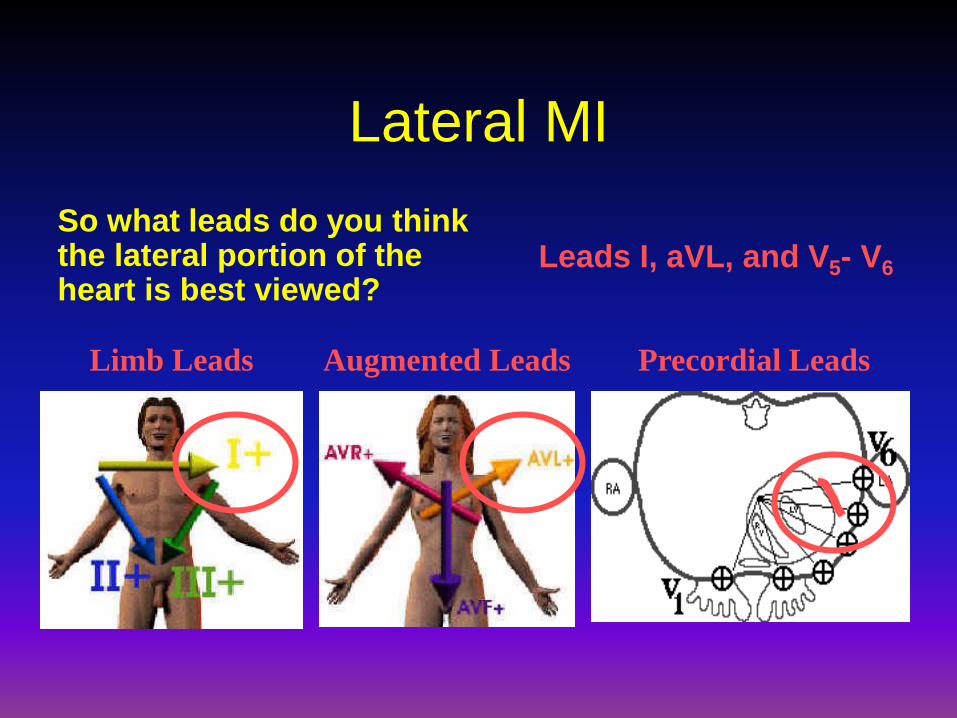
Lateral MI
So what leads do you think the lateral portion of the heart is best viewed?
Limb Leads Augmented Leads Precordial Leads
Leads I, aVL, and V5- V6

Inferior MI
Now how about the inferior portion of the heart?
Limb Leads Augmented Leads Precordial Leads
Leads II, III and aVF

Putting it all Together
Now, where do you think this person is
having a myocardial infarction?
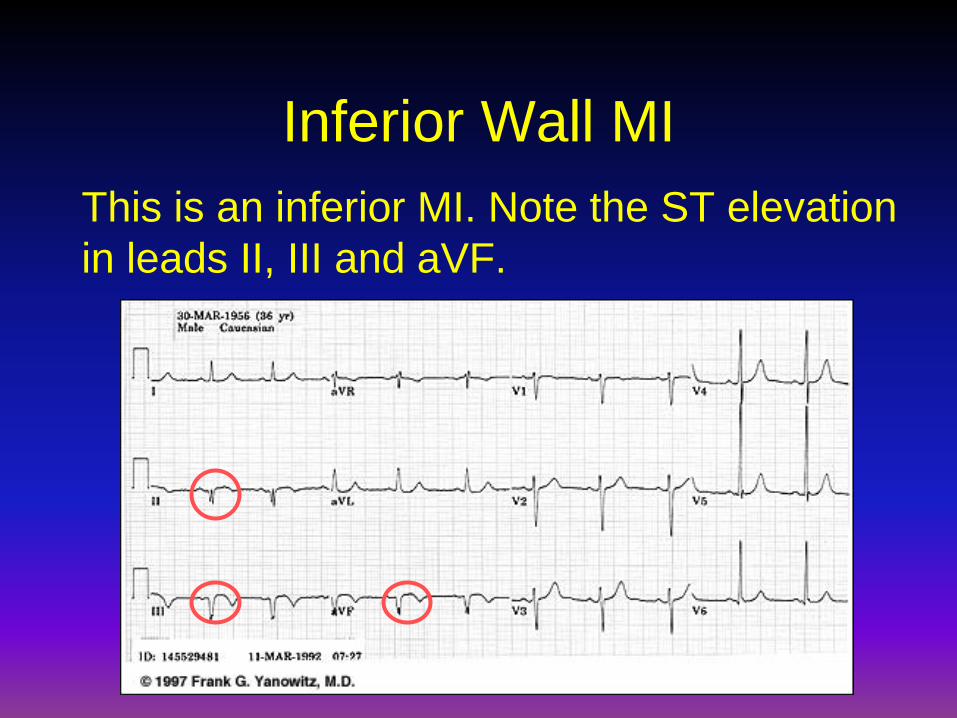
Inferior Wall MI
This is an inferior MI. Note the ST elevation
in leads II, III and aVF.

Putting it all Together
How about now?

Anterolateral MI
This person’s MI involves both the anterior wall
(V2-V4) and the lateral wall (V5-V6, I, and aVL)!

ST Elevation and
non-ST Elevation MIs
ST Elevation and non-ST Elevation MIs
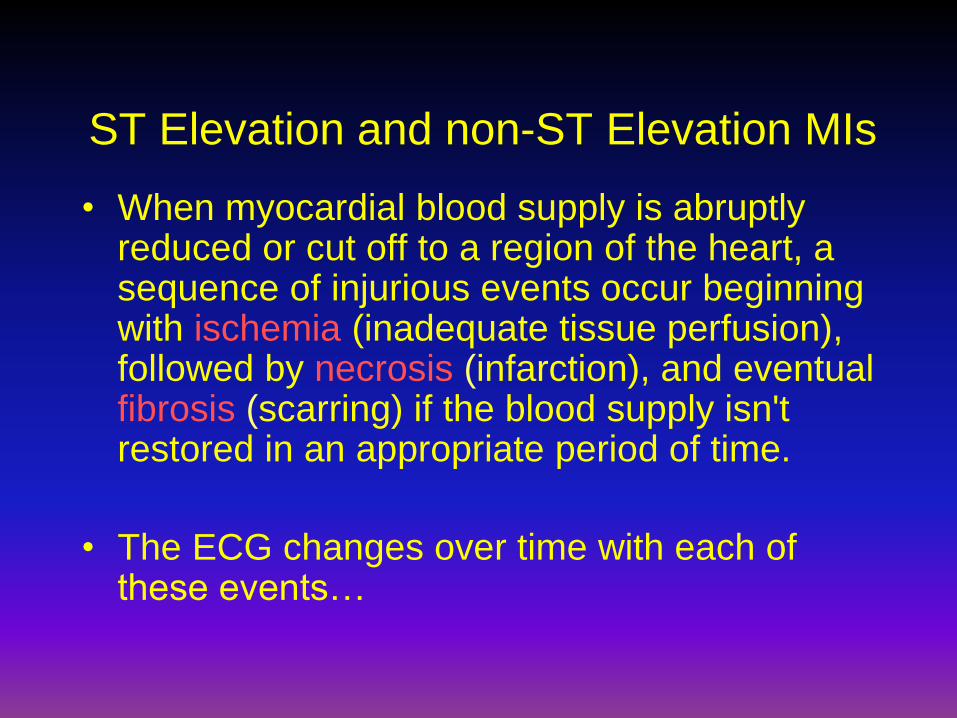
• When myocardial blood supply is abruptly reduced or cut off to a region of the heart, a sequence of injurious events occur beginning with ischemia (inadequate tissue perfusion), followed by necrosis (infarction), and eventual fibrosis (scarring) if the blood supply isn't restored in an appropriate period of time.
• The ECG changes over time with each of these events…

ECG Changes
Ways the ECG can change include:
Appearance
of pathologic
Q-waves
T-waves
peaked flattened inverted
ST elevation &
depression
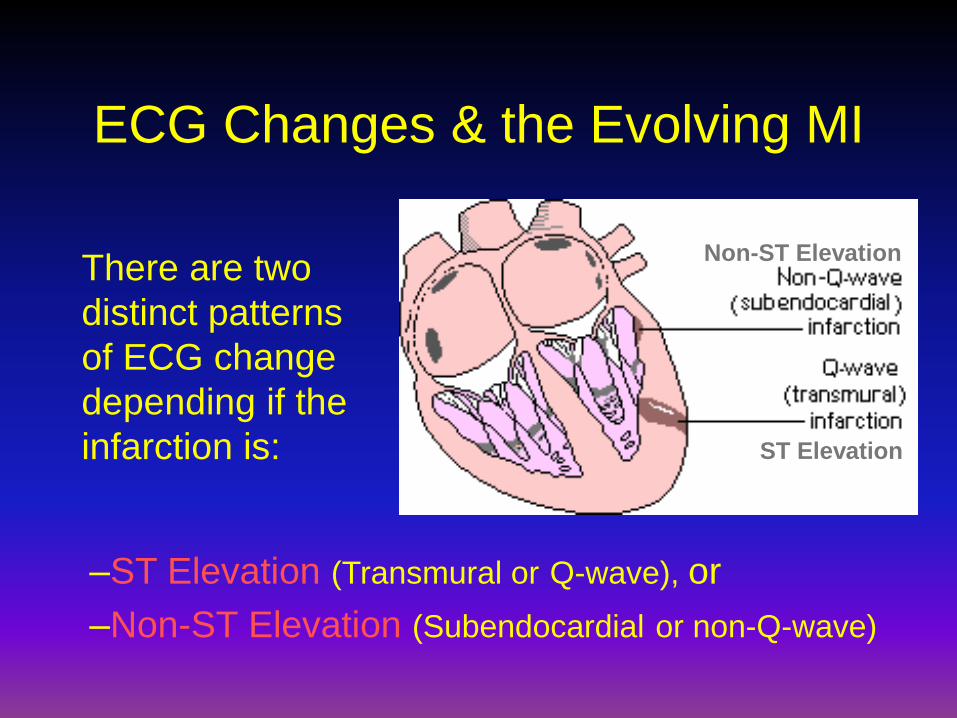
ECG Changes & the Evolving MI
There are two
distinct patterns
of ECG change
depending if the
infarction is:
–ST Elevation (Transmural or Q-wave), or
–Non-ST Elevation (Subendocardial or non-Q-wave)
Non-ST Elevation
ST Elevation

ST Elevation Infarction
ST depression, peaked T-waves, then T-wave inversion
The ECG changes seen with a ST elevation infarction are:
Before injury Normal ECG
ST elevation & appearance of
Q-waves
ST segments and T-waves return to
normal, but Q-waves persist
Ischemia
Infarction
Fibrosis

ST Elevation Infarction
Here’s a diagram depicting an evolving infarction:
A. Normal ECG prior to MI
B. Ischemia from coronary artery occlusion results in ST depression (not shown) and peaked T-waves
C. Infarction from ongoing ischemia results in marked ST elevation
D/E. Ongoing infarction with appearance of pathologic Q-waves and T-wave inversion
F. Fibrosis (months later) with persistent Q-waves, but normal ST segment and T-waves

ST Elevation Infarction
Here’s an ECG of an inferior MI:
Look at the
inferior leads
(II, III, aVF).
Question:
What ECG
changes do
you see?
ST elevation
and Q-waves
Extra credit:What is the
rhythm? Atrial fibrillation (irregularly irregular with narrow QRS)!

Non-ST Elevation Infarction
Here’s an ECG of an inferior MI later in time:
Now what do
you see in the
inferior leads?
ST elevation,
Q-waves and
T-wave
inversion

Non-ST Elevation Infarction
ST depression & T-wave inversion
The ECG changes seen with a non-ST elevation infarction are:
Before injury Normal ECG
ST depression & T-wave inversion
ST returns to baseline, but T-wave
inversion persists
Ischemia
Infarction
Fibrosis

Non-ST Elevation Infarction
Here’s an ECG of an evolving non-ST elevation MI:
Note the ST
depression
and T-wave
inversion in
leads V2-V6.
Question:What area of
the heart is
infarcting?
Anterolateral

Left Ventricular
Hypertrophy

LVH

Left Ventricular Hypertrophy
Compare these two 12-lead ECGs. What stands
out as different with the second one?
Normal Left Ventricular Hypertrophy
Answer: The QRS complexes are very tall
(increased voltage)
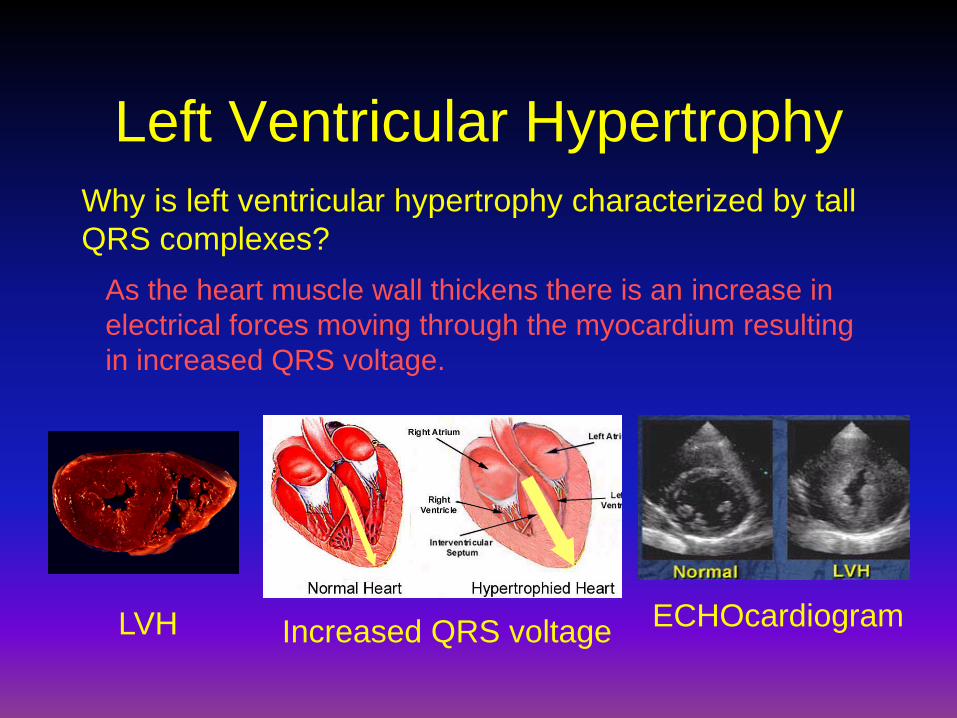
Left Ventricular Hypertrophy
Why is left ventricular hypertrophy characterized by tall
QRS complexes?
LVH ECHOcardiogramIncreased QRS voltage
As the heart muscle wall thickens there is an increase in
electrical forces moving through the myocardium resulting
in increased QRS voltage.
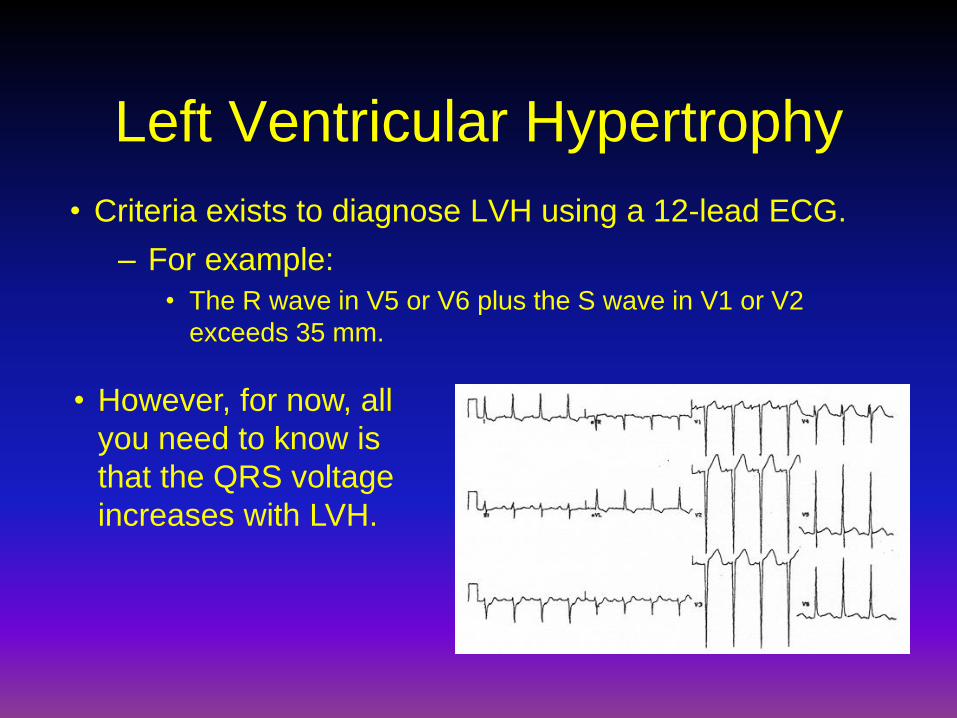
Left Ventricular Hypertrophy
• Criteria exists to diagnose LVH using a 12-lead ECG.
– For example:
• The R wave in V5 or V6 plus the S wave in V1 or V2
exceeds 35 mm.
• However, for now, all
you need to know is
that the QRS voltage
increases with LVH.

Bundle Branch Blocks

Bundle Branch Blocks
Turning our attention to bundle branch blocks…
Remember normal
impulse conduction is
SA node
AV node
Bundle of His
Bundle Branches
Purkinje fibers
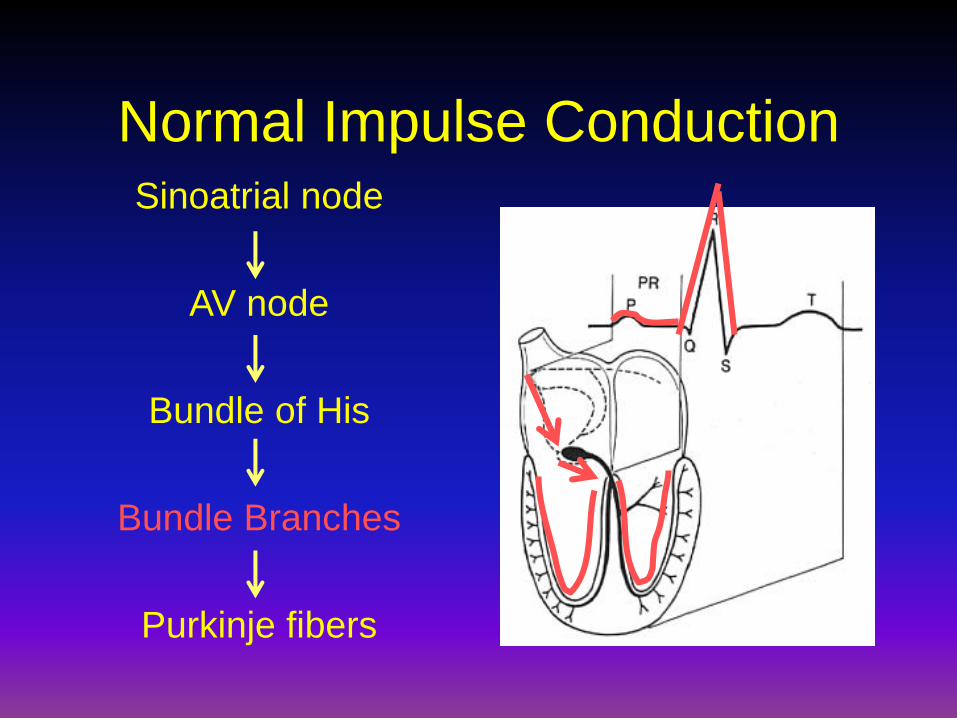
Normal Impulse ConductionSinoatrial node
AV node
Bundle of His
Bundle Branches
Purkinje fibers
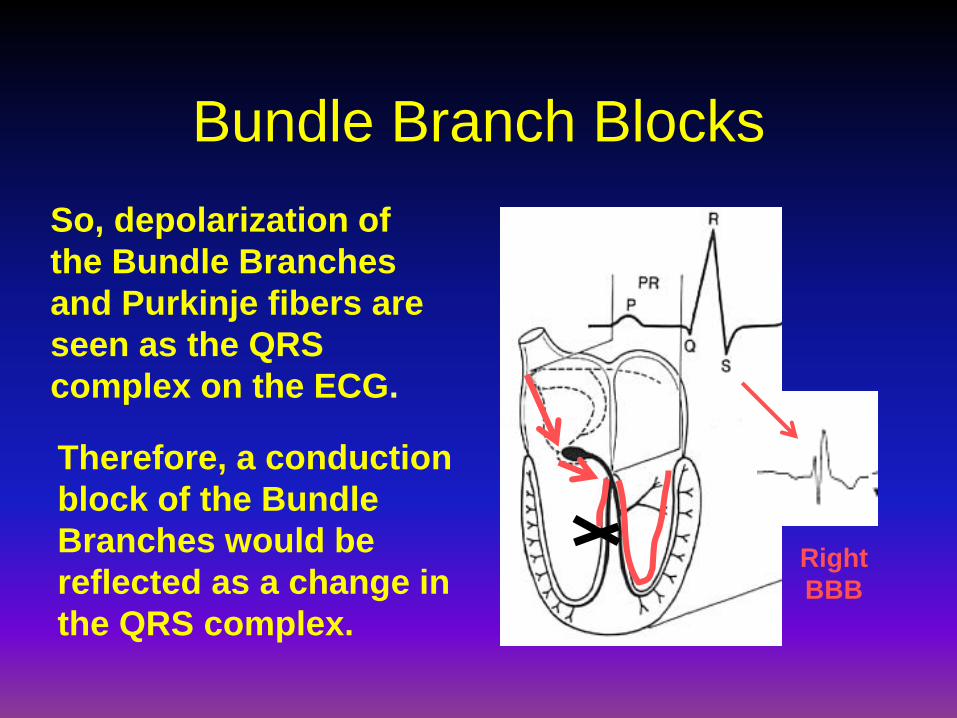
Bundle Branch Blocks
So, depolarization of
the Bundle Branches
and Purkinje fibers are
seen as the QRS
complex on the ECG.
Therefore, a conduction
block of the Bundle
Branches would be
reflected as a change in
the QRS complex.
Right
BBB

Bundle Branch Blocks
With Bundle Branch Blocks you will see two changes
on the ECG.
1. QRS complex widens (> 0.12 sec).
2. QRS morphology changes (va ries depending on ECG lead,
and if it is a right vs. left bundle branch block).

Bundle Branch Blocks
Why does the QRS complex widen?
When the conduction
pathway is blocked it
will take longer for
the electrical signal
to pass throughout
the ventricles.

Right Bundle Branch Blocks
What QRS morphology is characteristic?
V1
For RBBB the wide QRS complex assumes a
unique, virtually diagnostic shape in those
leads overlying the right ventricle (V1 and V2).
“Rabbit Ears”

Left Bundle Branch Blocks
What QRS morphology is characteristic?
For LBBB the wide QRS complex assumes a
characteristic change in shape in those leads
opposite the left ventricle (right ventricular
leads - V1 and V2).
Broad,
deep S
wavesNormal

135
ARTIFACT ON THE
ECG
136
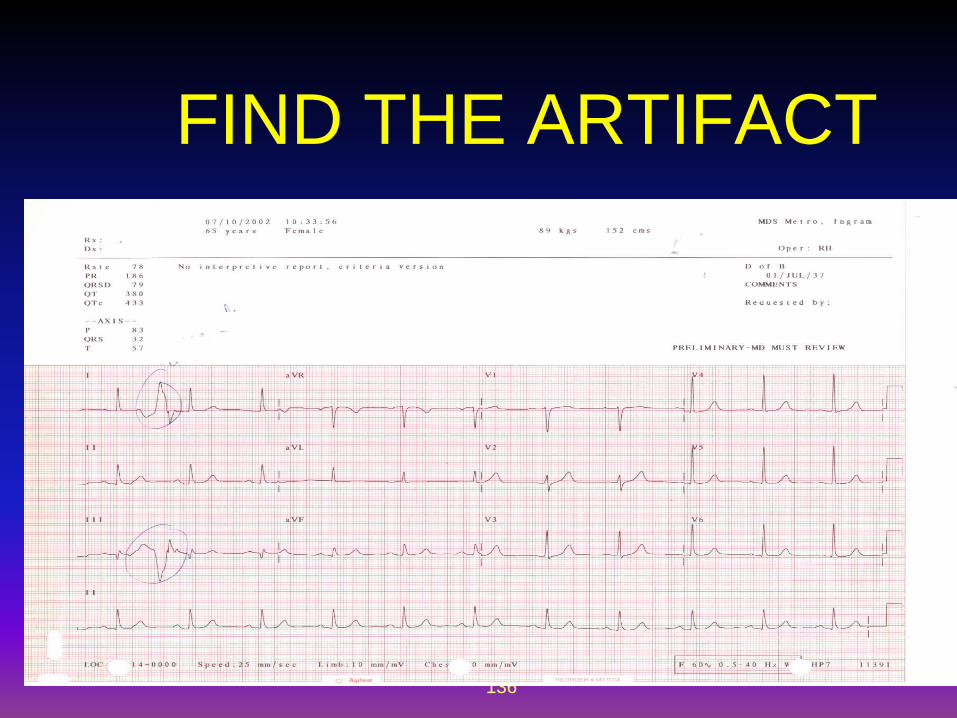
FIND THE ARTIFACT

137
WANDERING BASELINE

138
SOMATIC
TREMOR

139
ELECTRICAL INTERFERANCE

Lateral MI
Reciprocal changes

Inferolateral MI
ST elevation II, III, aVF
ST depression in aVL, V1-V3 are reciprocal changes

Anterolateral / Inferior
Ischemia
LVH, AV junctional rhythm, bradycardia

Left Bundle Branch Block
Monophasic R wave in I and V6, QRS > 0.12 sec
Loss of R wave in precordial leads
QRS T wave discordance I, V1, V6
Consider cardiac ischemia if a new finding

Left Bundle Branch Block
Monophasic R wave in I and V6, QRS > 0.12 sec
Loss of R wave in precordial leads
QRS T wave discordance I, V1, V6
Consider cardiac ischemia if a new finding

First Degree Heart Block, Mobitz Type I(Wenckebach)
PR progressively lengthens until QRS drops

Right Ventricular Myocardial Infarction
Found in 1/3 of patients with inferior MI
Increased morbidity and mortality
ST elevation in V4-V6 of Right-sided EKG

Right Sided Leads

Ventricular Tachycardia

Case #1
70 year old male with history of
diabetes mellitus and
hypertension occasionally feels
lightheaded. He recently fainted
while standing.


Case #1 ECG
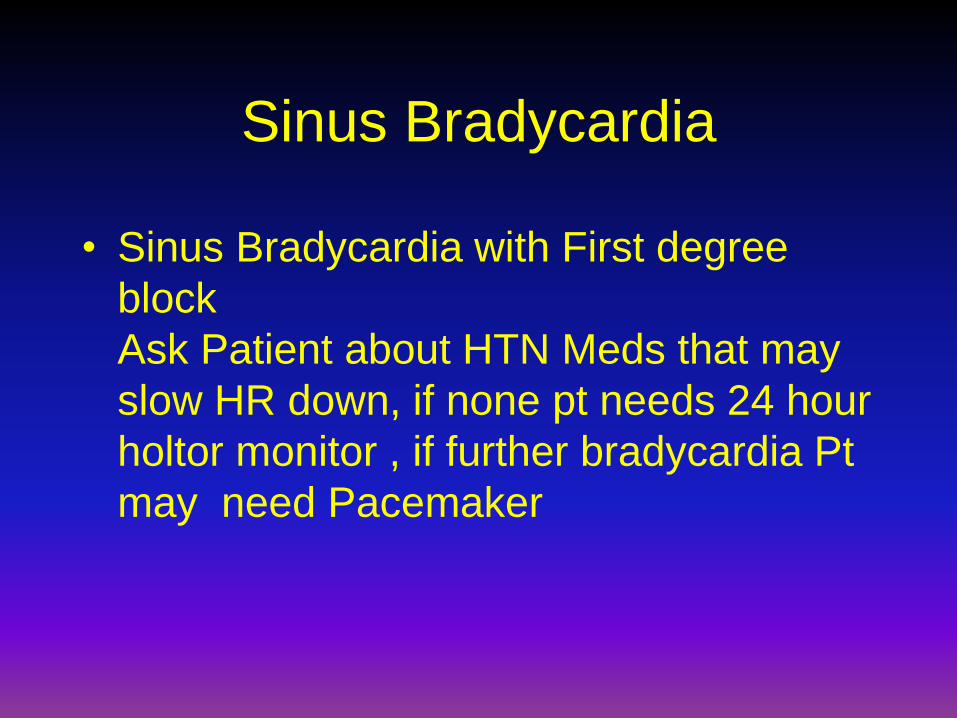
Sinus Bradycardia
• Sinus Bradycardia with First degree
block
Ask Patient about HTN Meds that may
slow HR down, if none pt needs 24 hour
holtor monitor , if further bradycardia Pt
may need Pacemaker


Case #2
58 year old Female with no
significant past medical history
presents with Fatigue,
lightheadedness and shortness
of breath.

Case #2 ECG
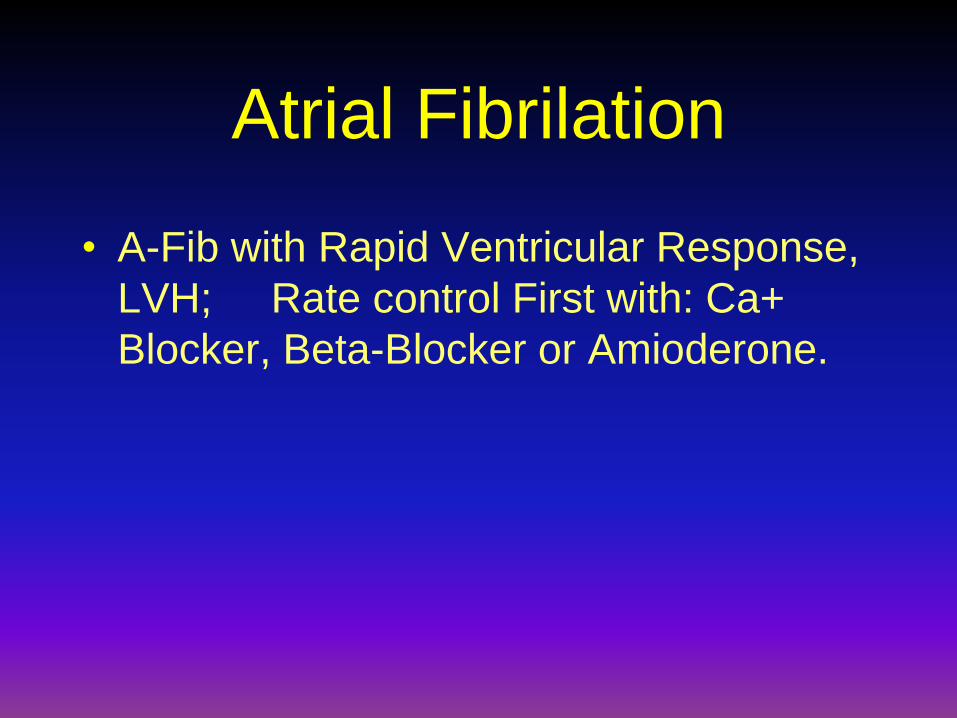
Atrial Fibrilation
• A-Fib with Rapid Ventricular Response,
LVH; Rate control First with: Ca+
Blocker, Beta-Blocker or Amioderone.
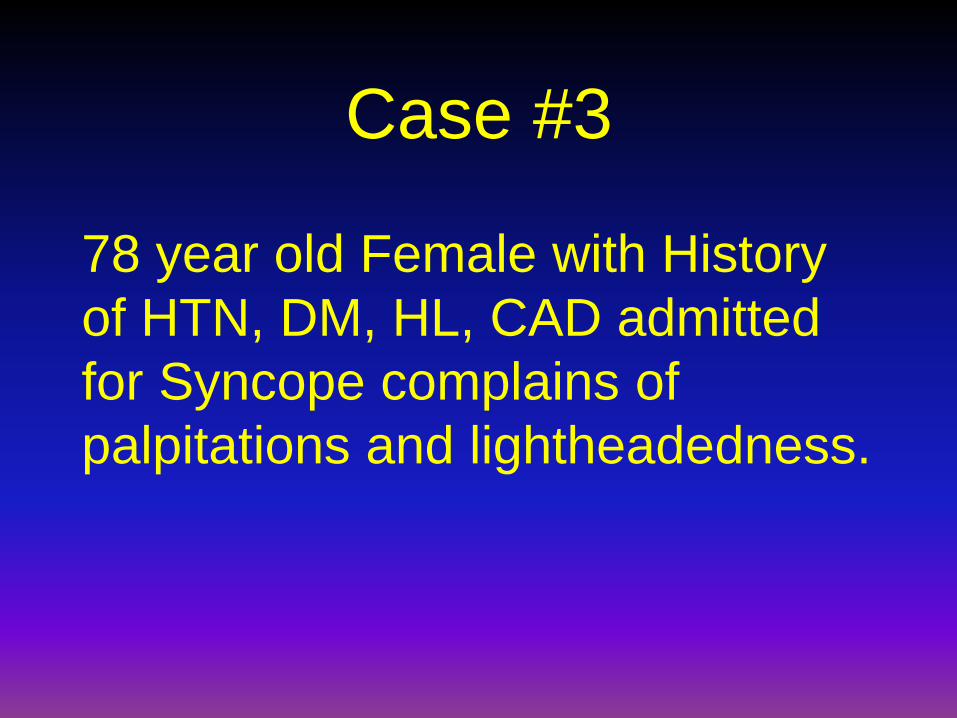
Case #3
78 year old Female with History
of HTN, DM, HL, CAD admitted
for Syncope complains of
palpitations and lightheadedness.
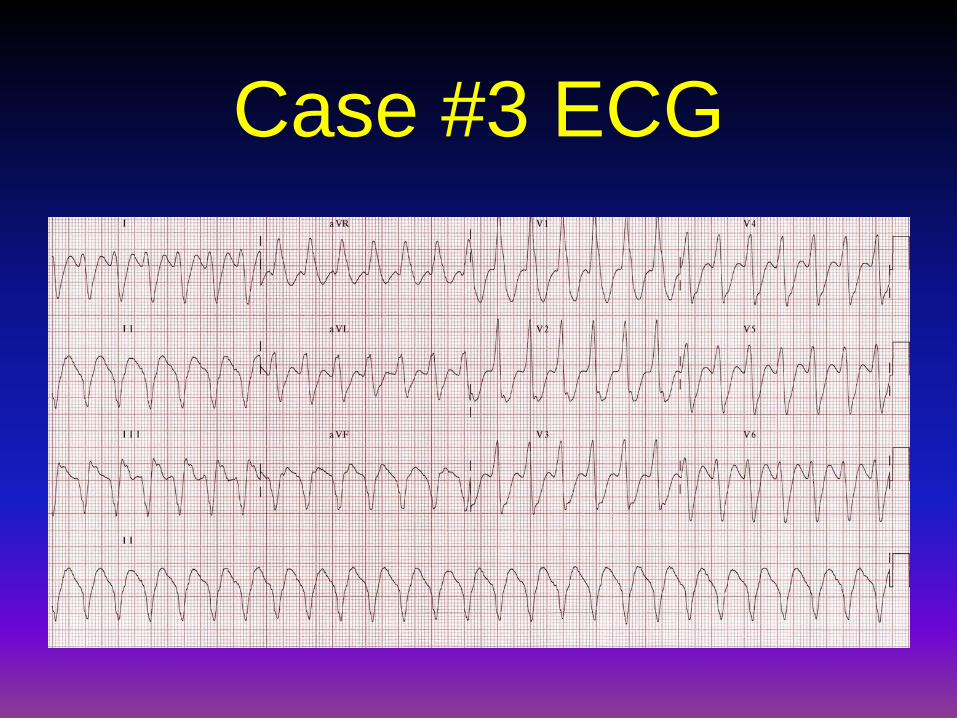
Case #3 ECG

Monomorphic VT
• Activate: ACLS protocol
Wide complex : ventricular
pacing
Prepare for cardioversion

Case #4
67 year old male with history
of diabetes,
hypertension,Pacemaker,
COPD presents with chest
pain.

Case #4 ECG

Case #5
38 year old female with
history of DM, HTN,
CKD presents with 2
days of nausea and
abdominal pain.

Case #5 ECG
Hyperkalemia
• Peaked T waves with a K of: 7.7.
As Hyperkalemia progresses:
PR interval increases
QRS then widens , P –Waves
dissapear
A Sine wave pattern developes
Next step:
• Calcium Gluconate ( Stablilizes Cell
Membrane)
Insulin & D50 - (Drives Potasium into
the cells)
Kavexalate ( Removes Potasium &
Albuterol inhaler & Lasix)

Case #6
60 year-old man with
history of HTN, HL, CAD
presents with nausea,
shortness of breath and
chest pain.

Case #6 ECG
STEMI
• + STTW elevation in Inferior Lateral
leads.
Inferior MI + for Right Coronary Artery
Etiology

Case # 7
• 53 year old hypertensive black
male smoker presents with two
hours of : diaphoresis, nausea,
vomiting, and the worst tooth
ache of his life …
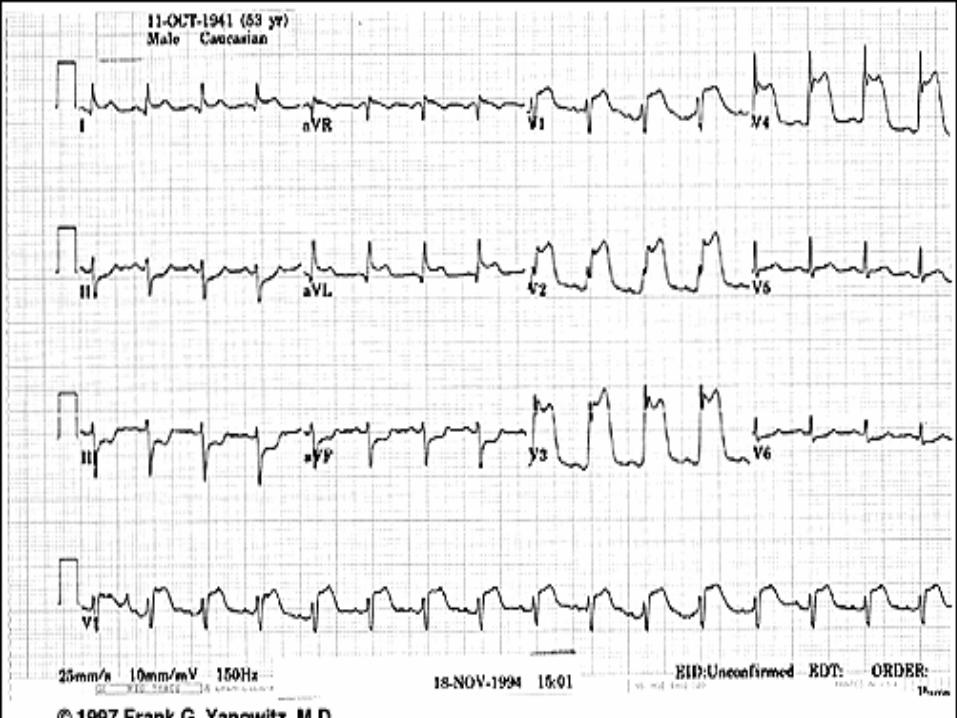
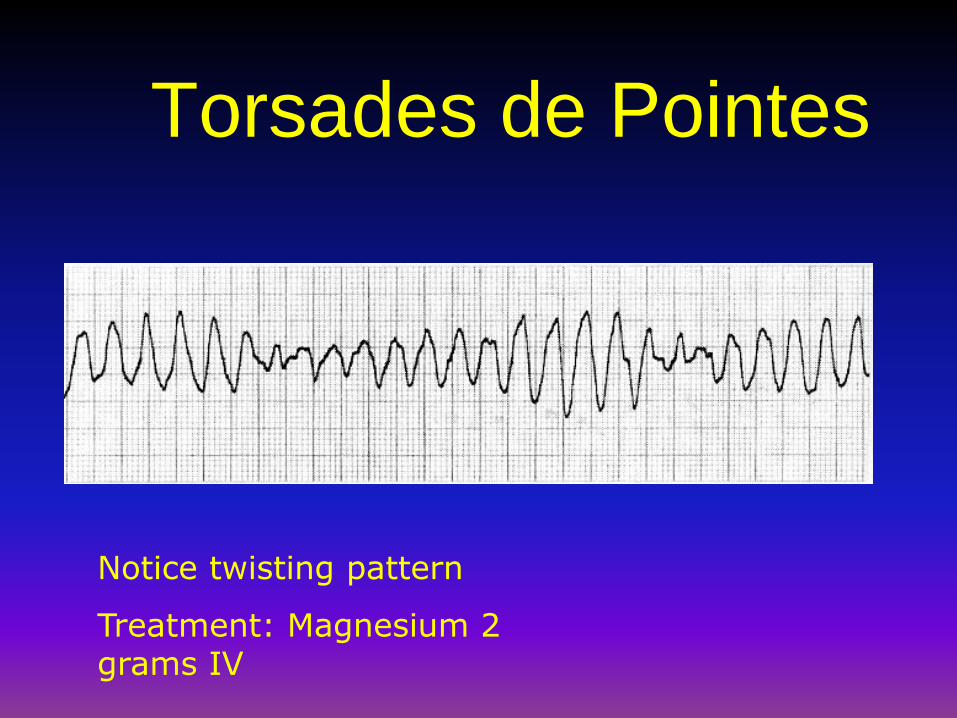
Torsades de Pointes
Notice twisting pattern
Treatment: Magnesium 2 grams IV

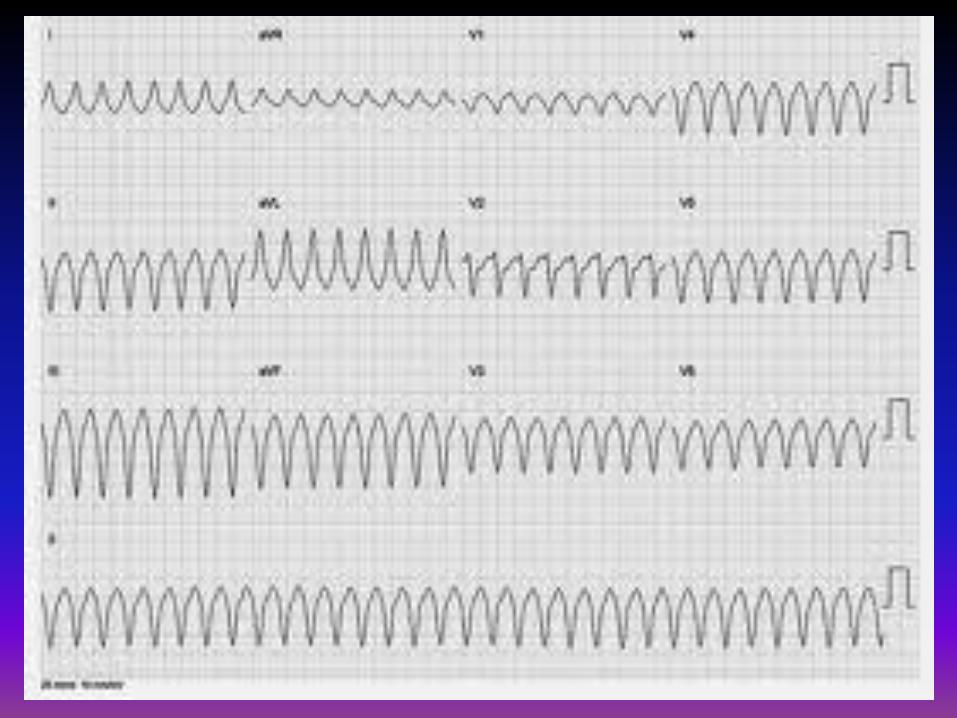
56 year old white
female
• Racing heart after
dialysis
Mg++ 1.6 K-3.5
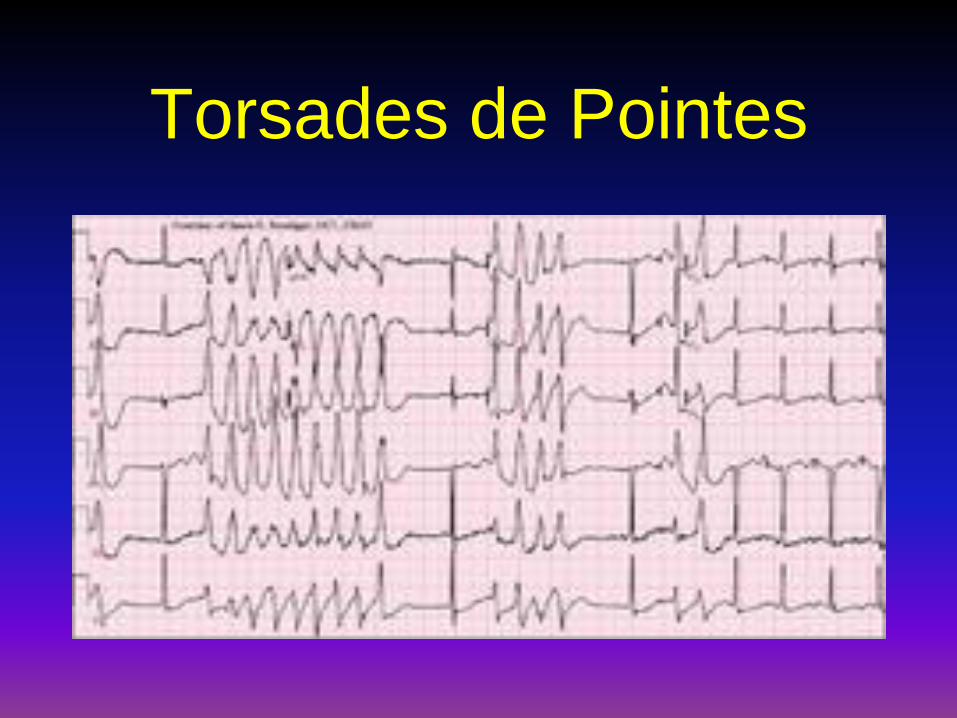
Torsades de Pointes

Prolonged QT
• Normal – Men 450ms– Women 460ms
• Corrected QT (QTc)– QTm/√(R-R)
• Causes– Drugs (Na channel blockers)– Hypocalcemia, hypomagnesemia,
hypokalemia– Hypothermia – AMI– Congenital– Increased ICP

Prolonged QT
QT > 450 ms
Inferior and anterolateral ischemia

34 year old white female
• + sharp CP , worse with
inspiration, 3 hours duration,
+ smoking, +anxiety, +
Family History CAD

Nuclear Stress Test
180

Your Grandmother
• 76 year old 3 weeks post-op
left hip replacement, ex-smoker,
+HTN , + Hemoptysis.
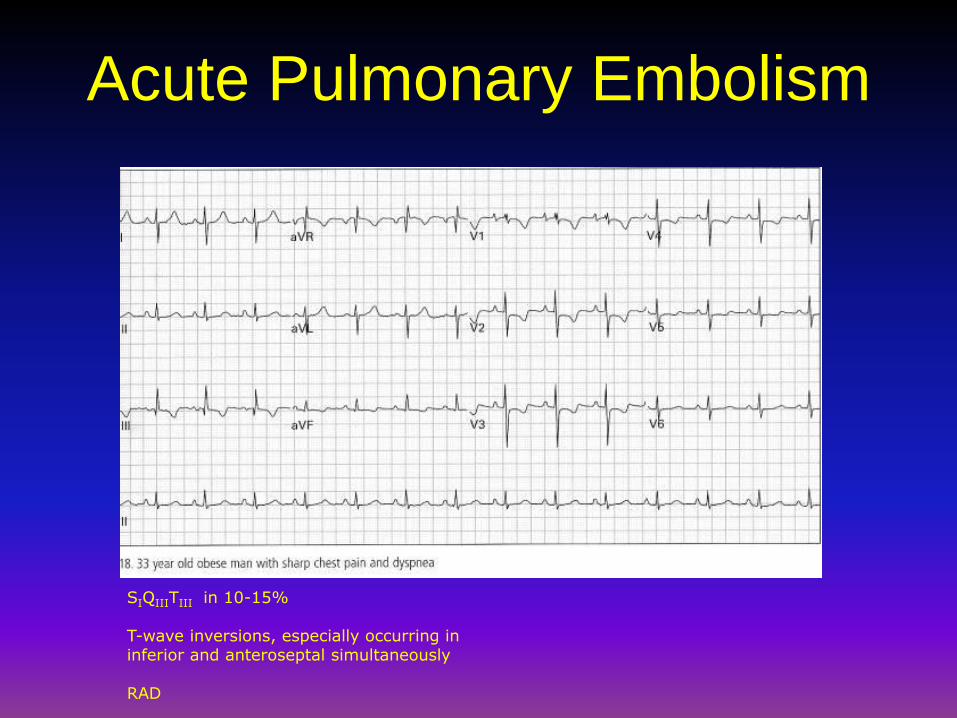
Acute Pulmonary Embolism
SIQIIITIII in 10-15%
T-wave inversions, especially occurring in inferior and anteroseptal simultaneously
RAD
62 Year Old Male Dialysis
Patient
• +Lupus etilogy for Renal failure.
Felt so good didn’t have dialysis
for two weeks, started having:
Nausea & Vomiting…
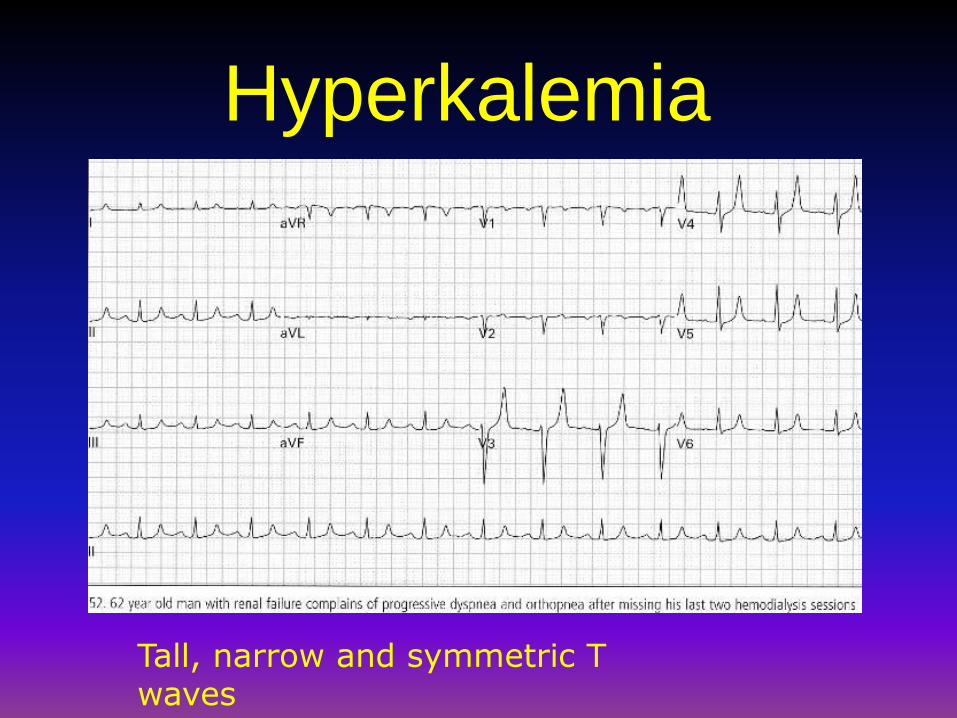
Hyperkalemia
Tall, narrow and symmetric T waves

46 Year Old Female
Hypertensive
• First line treatment for HTN:
Thiazide diuretic and ACE
Inhibator for one month, One
month follow up labs with K of:
2.7

Hypokalemia
U wavesCan also see PVCs, ST depression, small T waves
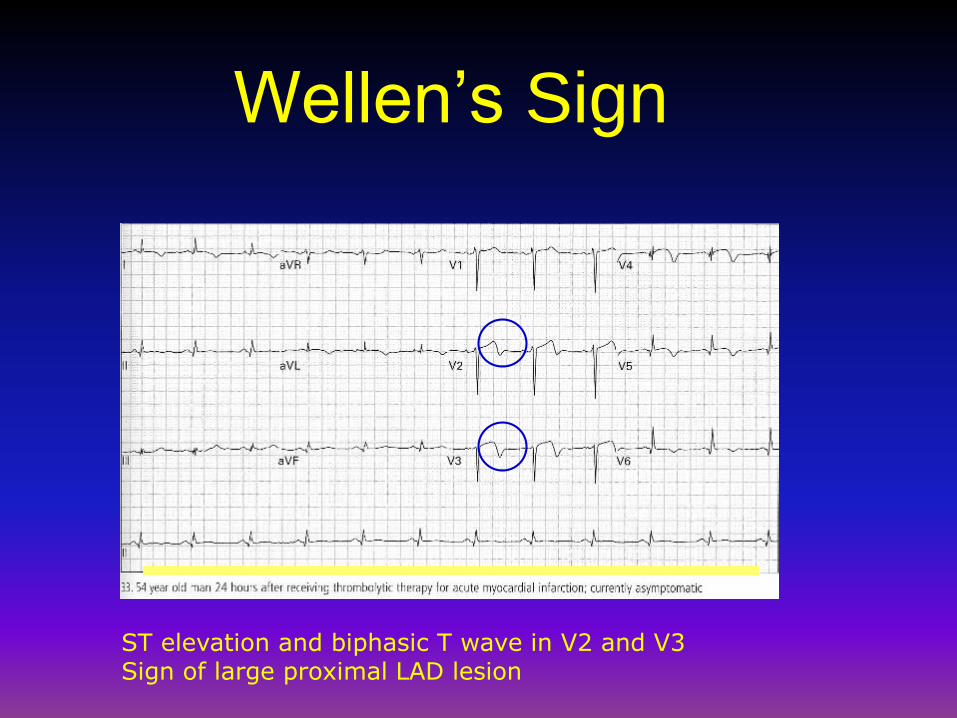
Wellen’s Sign
ST elevation and biphasic T wave in V2 and V3Sign of large proximal LAD lesion


44 Year Old white female
• + Palpatations, dizzyness,
diaphoresis, SOB, near
syncope, racing heart beat
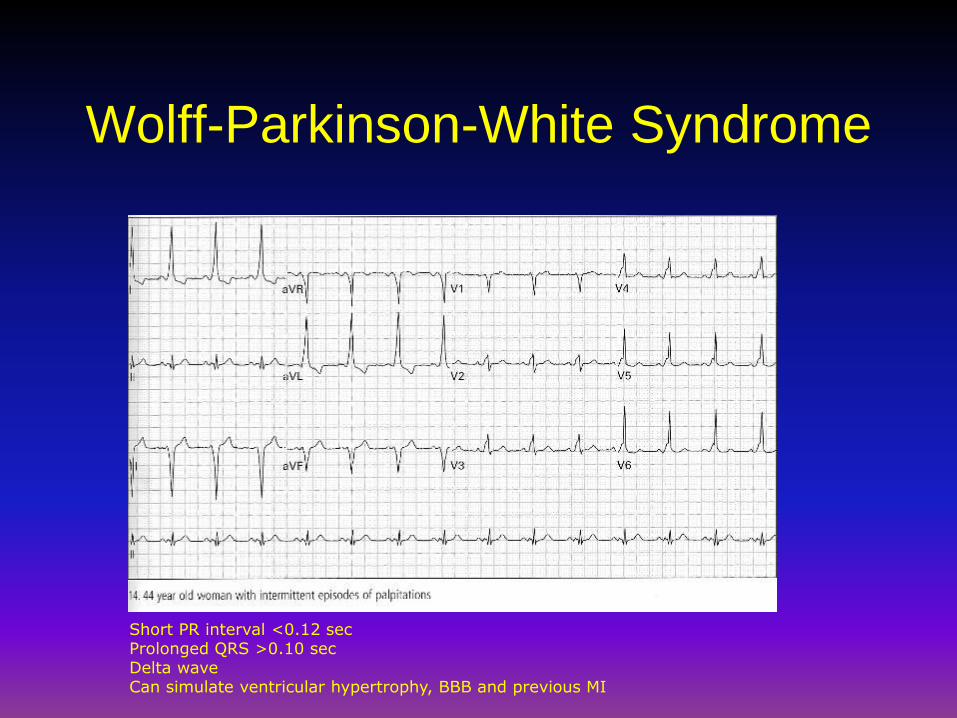
Wolff-Parkinson-White Syndrome
Short PR interval <0.12 secProlonged QRS >0.10 secDelta waveCan simulate ventricular hypertrophy, BBB and previous MI

74 Year Old male with CHF
• CHF 20% EF, HTN,
CAD/CABG, A-fib ,Dementia,
DM, Hyperlipidemia, Renal
Insufficinecy, Gout,
Meds: Betablocker, ACE,
Digoxin, ASA, Lasix & K
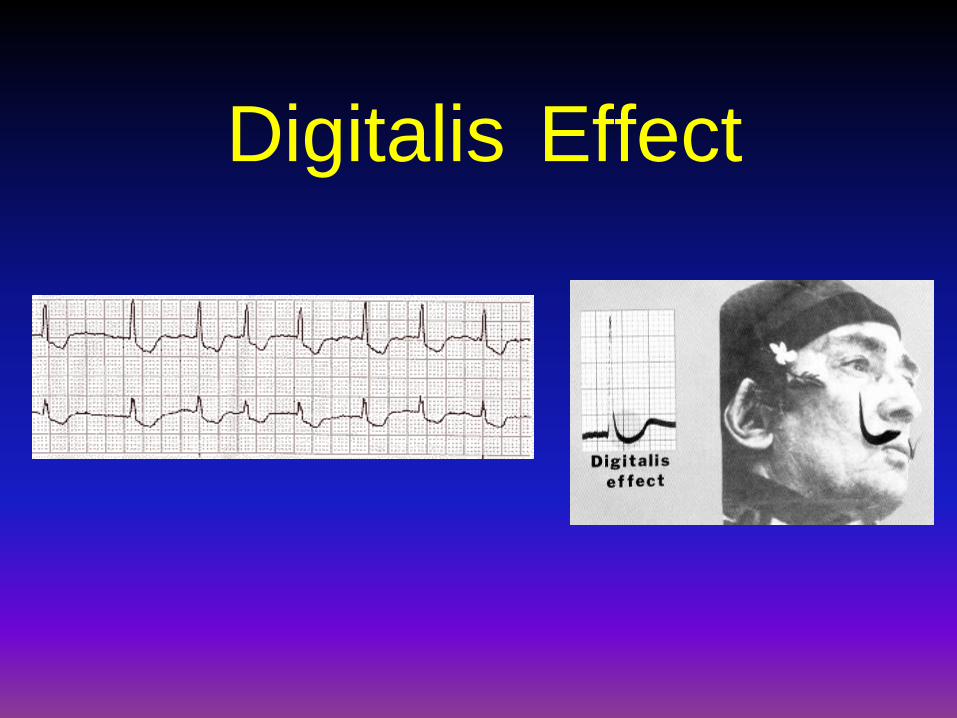
Digitalis Effect
Related Documents