NBSIR 76-847 ELECTROCALORIC REFRIGERATION FOR SUPERCONDUCTORS Ray Radebaugh and J.D. Siegwarth Cryogenics Division Institute for Basic Standards National Bureau of Standards Boulder, Colorado 80302 and W.N. Lawless Research and Development Laboratories Corning Glass Works Corning, New York 14830 and A.J. Morrow Development Laboratory Corning Glass Works Raleigh, North Carolina 27604 February 1977 Sponsored by Advanced Research Projects Agency ARPA Order No. 2535 Arlington, VA 22209 Covers May 1, 1973 to June 30, 1975

Welcome message from author
This document is posted to help you gain knowledge. Please leave a comment to let me know what you think about it! Share it to your friends and learn new things together.
Transcript

NBSIR 76-847
ELECTROCALORIC REFRIGERATION FOR SUPERCONDUCTORS
Ray Radebaugh and J.D. Siegwarth
Cryogenics Division
Institute for Basic StandardsNational Bureau of Standards
Boulder, Colorado 80302
and
W.N. Lawless
Research and Development Laboratories
Corning Glass WorksCorning, New York 14830
and
A.J. Morrow
Development Laboratory
Corning Glass WorksRaleigh, North Carolina 27604
February 1977
Sponsored by
Advanced Research Projects AgencyARPA Order No. 2535Arlington, VA 22209
Covers May 1, 1973 to June 30, 1975


NBSIR 76-847
ELECTROCALORIC REFRIGERATION FOR SUPERCONDUCTORS
Ray Radebaugh and J.D. Siegwarth
Cryogenics Division
Institute for Basic StandardsNational Bureau of Standards
Boulder, Colorado 80302
and
W.N. Lawless
Research and Development Laboratories
Corning Glass WorksCorning, New York 14830
and
A.J. Morrow
Development Laboratory
Corning Glass Works
Raleigh, North Carolina 27604
February 1977
Sponsored by
Advanced Research Projects AgencyARPA Order No. 2535Arlington, VA 22209
Covers May 1, 1973 to June 30, 1975
U.S. DEPARTMENT OF COMMERCE, Juanita M. Kreps, Secretary
Dr. Betsy Ancker-Johnson . Assistant Secretary for Science and Technology
NATIONAL BUREAU OF STANDARDS, Ernest Ambler, Acting Director


CONTENTS
Page
1. INTRODUCTION 1
1.1. Purpose of Work 1
1.2. Description of Refrigerator 1
1.3. History and Organization of Project 2
2. HEAT SWITCHES 6
2.1. Types of Heat Switches and Minimum Requirements 6
2.2. Mechanical Heat Switches 7
2.2.1. Multiple leaf switch 7
2.2.2. Helium gap switch 15
2.3. Magnetothermal Heat Switches 16
2.3.1. Survey of various metals 16
2.3.2. Beryllium 20
2.3.3. Magnesium 26
2.3.4. Thermal conductance of joints 29
2.3.5. Magnet requirements 3 5
3. REFRIGERATION MATERIALS 3 6
3.1. Theoretical 36
3.1.1. Thermodynamics 36
3.1.2. Criteria for materials selection 38
3.2. Previous Work 39
3.3. SrTiO^ Glass-Ceramic Research Samples 4 0
3.3.1. Dielectric properties 40
3.3.2. Relation to capacitance thermometer manufacturing . . 42
3.4. SrTiO^ Glass-Ceramic Multilayer Samples 42
3.4.1. Fabrication method 42
3.4.2. Fabrication problems 51
3.5. Alternate Materials Investigated 57
3.5.1. Glass-ceramics 57
3.5.2. Ceramics 57 »
3.6. Experimental Methods 66
3.6.1. Dielectric properties 66
3.6.2. Thermodynamic properties 7 0
3.6.3. Thermal conductivity 80
3.7. Experimental Results 82"
3.7.1. SrTi03glass-ceramics 82
3.7.2. KTa03glass-ceramics 108
3.7.3. Single crystals . 108
3.7.4. Ceramics 113
iii

3.8. Discussion of Experimental Results 143
3.8.1. Dielectric Properties 143
3.8.2. Thermal Properties 150
3.8.3. Recommendations for further work 175
4. CONCLUSIONS i76
5. REFERENCES i78
iv

DISCLAIMER
Certain commercial materials are identified in this report in order to specify adequately
the experimental procedure. In no case does such identification imply recommendation or
endorsement by the National Bureau of Standards, nor does it imply that the material identi-
fied is necessarily the best available for the purpose.
The views and conclusions contained in this document are those of the authors and should
not be interpreted as necessarily representing the official policies, either expressed or
implied, of the Advanced Research Projects Agency, the U. S. Government, Corning Glass Works
or its subsidiaries.
v

PROJECT SUMMARY
The purpose of this work was to investigate a technique for the refrigeration of super-
conductors at 4 K which has the potential of better reliability and lower cost than present
4 K refrigerators. The poor reliability in present 4 K refrigerators is a major handicap in
the technological use of superconductors. In this project a solid-state type of refrigeration
was investigated for use as the final stage of refrigeration to span the range between 4 and
15 K. This proposed new technique uses the electrocaloric effect in certain dielectric
materials and is the electrical analog of cooling by adiabatic demagnetization. In essence,
a high electric field is used to change the entropy of a paraelectric material. The advan-
tage over the magnetic case is that electric fields in thin layers are easier to apply than
magnetic fields.
A continuous refrigerator operating with a load at 4 K and a heat sink at 15 K is accom-
plished by separating the refrigeration material from the load and heat sink by heat switches.
The original problems in the project were to develop appropriate heat switches for use on a
prototype, 1-watt refrigerator and to develop the refrigeration material based on SrTiO^
glass-ceramic technology. Preliminary studies had indicated that certain SrTiO^ glass-
ceramics would be the most promising refrigeration material in this temperature range. The
program was well along before it was found that SrTiO^ glass-ceramics would not be suitable
as the refrigeration material; this conclusion then led to the investigation of other poten-
tial materials.
The heat-switch problem was attacked by investigating both mechanical and magnetothermal
heat switches. The mechanical switch, which has moving parts, used forced contact between
multiple leaves of gold-plated copper. Conductances on the order of 5 W/K could be achieved
with about 10 such contacts and with on-to-off heat transfer ratios on the order of 1000.
Such a ratio is significantly higher than the required value of about 30.
A literature review showed that both single crystal gallium and tungsten would be useful
materials for the lower (between refrigerator and 4 K load) heat switch. Such materials show
large changes in the thermal conductivity at low temperatures when a transverse magnetic
field is applied. Switch ratios on the order of 100 are possible. The magnetothermal conduc-
tivity of single crystal beryllium was measured in this program and the results show that
this material can be used for both the upper and lower heat switches with a switch ratio of
about 100 in both cases.
A compilation of literature data on the thermal conductance of joints (solder, grease,
adhesive, pressure) was made and revealed a lack of data between 4 K and room temperature on
solder joints. Such joints have higher conductances at room temperature than any other type
and would be used in the electrocaloric refrigerator. Measurements were made on the thermal
conductance of indium solder joints between 2 K and 120 K. The conductance per unit area2
reached a peak of 100 W/cm K at 20 K, which is sufficiently high to eliminate most problems
with joint conductances.
In any dielectric material the entropy change or refrigeration power brought about by a
change in electric field is proportional to the change of polarization with respect to tem-
vi

perature. When no remanent polarization occurs in the material, the polarization can be
derived from the dielectric constant, an easily measured quantity. Therefore, early in the
program the change zz dielectric ccr.star.t with respect tc temperature was a. pritary guar.city
for estimating the refrigeration power of a material. The SrTiC^ glass-ceramic showed a peak
in the dielectric constant at about 30 K with a large positive slope below that. The posi-
tive slope implied cooling would occur when the electric field was increased.
Many manufacturing problems had to be overcome in making satisfactory multilayer SrTiO
glass—ceramics with large temperature derivatives of the dielectric constant and large electric
field breakdown strengths and over half the experimental work on the program was devoted to
these problems. Sample porosity was the major unsolvable problem. However, it was then
discovered that the inherent electrocaloric effect in SrTiO^ multilayer glass-ceramics at 4 K
not only was very small and dominated by hysteretic effects, but that it probably had the
wrong sign. Definite electrocaloric cooling was seen in the 10-40 K temperature range when
the field was decreased, but the temperature changes were only about 0.03 K. Direct measure-
ments of dc polarization were made on the samples and the results were consistent with the
electrocaloric measurements but inconsistent with the dielectric constant behavior. The dc
polarization showed only a negative slope with temperature, and the polarization became
essentially independent cf temperature below about 10 K. The dielectric constant, on the
ether hand , had a teak at about 3C K with a large positive slope below that-.
Extensive dc polarization and dielectric constant measurements were made on the SrTiO^
glass-ceramics as well as many other materials to try to understand the fundamental discrep-
ancy between the two types of dielectric measurements. It was found that many dielectric
materials show a broad peak in the dielectric constant at low temperatures. In the past such
peaks have usually been taken as an indication of ferro- or antiferroelectric ordering. The
model developed here to explain the peak in the dielectric constant is based on the electret
behavior of impurity-vacancy dipoles in the material. Impurity levels in the parts per
million range car. give rise tc such effects. Application of an electric field produces a
remanent polarization which remains after the field is removed. It is a result of the elec-
tret behavior and not that of a ferroelectric. The polarization, and not the dielectric
constant, is then the proper thermodynamic quantity for predicting the electrocaloric effects.
Many other materials were investigated by polarization, electrocaloric, and specific
heat measurements to find a suitable material for electrocaloric refrigeration. These other
materials included glass-ceramics, ceramics, and single crystals. Most of the investigations
-
were on SrTiO^ and KTaO^ based materials. Other materials investigated were of the Pb^Jtt^C^
type ceramics, the polar PZT ceramics, and TIBr single crystal. The largest electrocaloric
effects were seen in SrTiC^ ceramics, followed closely by KTaO^ single crystal. In SrTiO^
ceramics electrocaloric temperature changes on the order of 0.5 K were observed at about 10 K.
The effect decreased significantly at 4 K. Jcr various practical reasons the electric fields
applied to these samples were usually limited tc relatively modest values . Without any
existing theoretical model for the thermodynamics of the materials, it was uncertain how much
larger the electrocaloric effects would be if higher fields were applied.
vii

A theoretical model, based on the lattice dynamics of the materials, was then developed
to explain the observed cooling effects. Dielectrically active materials are classified as
either displacive type or order-disorder type. The materials studied in this program were of
the displacive type since they are usually more active at low temperatures than the order-
disorder materials. The theoretical model developed is valid for the displacive type mate-
rials. In this model only the entropy associated with transverse optic phonons can be altered
with an applied electric field. The calculated temperature changes for SrTiO^ , KTaO^, and
TlBr agree reasonably well with the observed values. This model shows that at 4 K the maxi-
mum possible entropy changes in the displacive type materials are at least an order of mag-
nitude too small to make a practical refrigerator.
The report is concluded by stressing the need to concentrate on a search for an approp-
riate order-disorder type of dielectric because the possible entropy changes are orders of
magnitude higher than the displacive type materials. Unfortunately order-disorder materials
order at rather high temperatures, thus removing the available entropy for cooling. It is
suggested that for any future work thermodynamic studies be made on lithium thallium tartrate
and NH^H^PO^, which may be order-disorder materials with enough entropy at 4 K for useful
refrigeration. However, at this time the basic physics of the dielectric materials must be
better understood before a worthwhile development program could begin.
viii

ABSTRACT
A solid state type of refrigeration, which utilizes the electrocaloric effect in certain
dielectric materials, has been investigated. Such a refrigerator would operate with a load
at 4 K and reject heat to a reservoir at 15 K. Heat switches for such a refrigerator were
studied. One type was a multiple leaf contact switch. The other type was a magnetothermal
switch utilizing single crystal beryllium. Based upon earlier preliminary work, the refri-
geration material was to be a SrTiO^ glass-ceramic. It was found here that such a material
has no useful electrocaloric effect at 4 K. Many other materials were studied but none were
found with sufficiently high reversible electrocaloric effects for a practical refrigerator.
The largest effects were seen in SrTiO^ ceramics, followed by KTaO^ single crystal. Tempera-
ture reductions of about 0.5 K at 10 K were observed during depolarization. A theoretical
model, based on the electret behavior of impurity-vacancy dipoles was developed to explain
the observed dielectric behavior in the materials investigated. Another theoretical model,
based on the lattice dynamics of displacive dielectrics, was used to explain the observed
entropy and temperature changes seen in such materials. The model points out that displa-
cive type materials have too low entropies at 4 K for practical refrigeration. An investi-
gation of certain order-disorder dielectrics is suggested.
Key words: Beryllium; ceramics; cryogenics; dielectric-constant; electrets; electrocaloric
effect; entropy; ferroelectrics; glass-ceramics; heat switches; magnetothermal conductivity;
polarization; potassium tantalate; refrigeration; specific heat; strontium titanate.
ix


1 . INTRODUCTION
1.1. Purpose of Work
One of the largest applications of cryogenics is in the area of superconductivity.
These applications range from the low-power level devices employing the Josephson effect up
to the large scale superconducting magnets and rotating machinery. These superconducting
devices require temperatures below 15 K, and in most cases temperatures of about 4 K. In
certain limited cases, infrared detection also requires 4 K temperatures or lower to gain
sensitivity.
The unreliability of present 4 K refrigerators is probably the main reason for the
relatively slow growth of applied superconductivity in commercial markets. A mean-time-
between-failure (MTBF) of about 3000 hours is a typical figure for such machines. Special-
ized mechanics are required to work on such machines and their presence every few thousand
hours serves as a reminder that 4 K is not easily achieved. Rotating compressors and ex-
panders now offer some hope for a MTBF of about 10,000 hours for large 4 K refrigerators.
The Stirling cycle and Gifford-McMahon cycle refrigerators can also achieve a MTBF of 10,000
hours even on a small size machine of about 1 watt. Unfortunately the regenerative heat
exchangers used on such machines become ineffective below about 10 K. What is needed then to
reach 4 K with such a machine is a very reliable last stage to span the gap between about
15 K and 4 K. In addition, this last stage should operate close to Carnot efficiency to
maintain a good overall efficiency. A survey of cryogenic refrigerators"'' shows that 4 K
refrigerators operate at the same fraction of Carnot efficiency as do 10-30 K refrigerators
of the same power rating.2
Preliminary studies showed that a refrigerator utilizing the electrocaloric effect in
certain glass-based materials would make a promising last stage to span the gap between 15 K
and 4 K. Since it is inherently a solid state type of device, the reliability of the elec-
trocaloric refrigerator should far exceed that of the 15 K upper stage. Thus 4 K can be
reached with the reliability of a 15 K regenerative type refrigerator.
The purpose of this project was to study the feasibility of an electrocaloric refriger-
ator which would absorb roughly 1 watt at 4 K and reject the heat to a reservoir at about 15
K. Originally the refrigeration material was to have been a glass-ceramic of SrTiO^. That2
choice was based on preliminary mea surements and calculations of the thermodynamic proper-
ties of research samples of SrTiO^ glass-ceramics. Subsequent measurements on multilayer
samples manufactured from this material showed relatively small cooling effects and the
program was altered to study the potential of using other materials with large electrocaloric
effects.
1.2. Description of Refrigerator
The electrocaloric refrigerator is analogous to a magnetic refrigerator, which is often
referred to as adiabatic demagnetization.3
The difference is that in the electrocaloric
refrigerator the entropy of the working material is changed by an electric field rather than
a magnetic field. The first experiments with the electrocaloric effect were on Rochelle salt
by Kobeko and Kurtschatov4
in 1930. Since then several measurements of electrocaloric cool-

ing effects in various materials have been measured, but until now no attempt has been made
to make a refrigerator utilizing the electrocaloric effect. Quasicontinuous refrigeration is
achieved by taking the refrigerating material through a closed loop on an entropy versus
temperature diagram. Such a path is shown in figure 1. The entropy of the material is shown
for four different values of electric field. If we start at the temperature in a field of
E^ and then change the field to E^, the material cools adiabatically to the temperature T^.
When going from the field to E^ in an isothermal process, heat in the amount = T^AS is
absorbed. The change in field from E^ to E^ causes the sample to heat adiabatically to T^.
An amount of heat = T2AS is then rejected to a thermal reservoir at T^ during the field
change from E^ to E^. The ratio of heat rejected at T^ to the heat absorbed at T^ is then
simply the Carnot result S^/Qj = T2^T 1 ^or t^ie -"-^ea^ cYc ^-e discussed here. If now two re-
frigerators are operated simultaneously such that at any time one or the other is in that2
part of the cycle where T = T , then continuous refrigeration at T, is achieved . Prelimi-2
nary studies showed that cycle times on the order of 1 second would be optimum for a re-
frigerator of SrTi03glass-ceramic operating between 4 and 15 K.
2A schematic diagram of an electrocaloric refrigerator capable of continuous refrigera-
tion is shown in figure 2. The working material is separated from the reservoir at 15 K and
the load at 4 K by heat switches. The working material has closely spaced metal fins in it,
as in a capacitor, to provide heat transfer and a means of obtaining a high electric field
with a reasonable voltage. The two halves can be made in the form of two half cylinders (see
Fig. 2b) to conserve space.
A rather unique refrigeration cycle was proposed by van Geuns^ which has applications to
the electrocaloric refrigerator. His idea is to use high pressure helium gas as a regenera-
tive material to change the temperature of a paramagnetic or paraelectric material between 15
and 4 K. In that case the adiabatic lines in figure 1 are replaced by constant field lines.
In the real cycle, however, there must be a small adiabatic segment at the end of the cooling
or heating step to account for the finite AT required between the helium gas and the refrig-
eration material. With this regenerative cycle the heat load due to the lattice heat capac-
ity is nearly eliminated from each cycle, but the initial cool down from 15 K is then done in
very small steps until equilibrium is established in the helium gas. The helium gas must be
at a high pressure (above the critical pressure) to provide a high heat capacity. The high
pressure can pose certain mechanical problems in displacing the gas with respect to the
refrigeration material. Whether this type of mechanical device would be any more reliable
than a mechanical 4 K refrigerator can only be determined by experiment. We have not pursued
this type of cycle in this project. Instead the heat switch arrangement has been pursued
since it can be made with no moving parts.
1.3. History and Organization of Project
Glass-ceramics of SrTiO^ developed by Lawless show large changes in dielectric constan
with respect to temperature. Because of that behavior, such a material has been useful for
6 7low temperature capacitance thermometers. ' Corning Glass Works and the Cryogenics Divisio
of NBS collaborated on extending measurements of the capacitance thermometer to temperatures
2

TEMPERATUREFigure 1. The entropy vs. temperature curves for a material useful
for electrocaloric refrigeration. The ideal refrigerationcycle, shown by the arrows, is traced out by changing the
electric field from E to E3 to E4 to E2 and back to Ej_
.
3
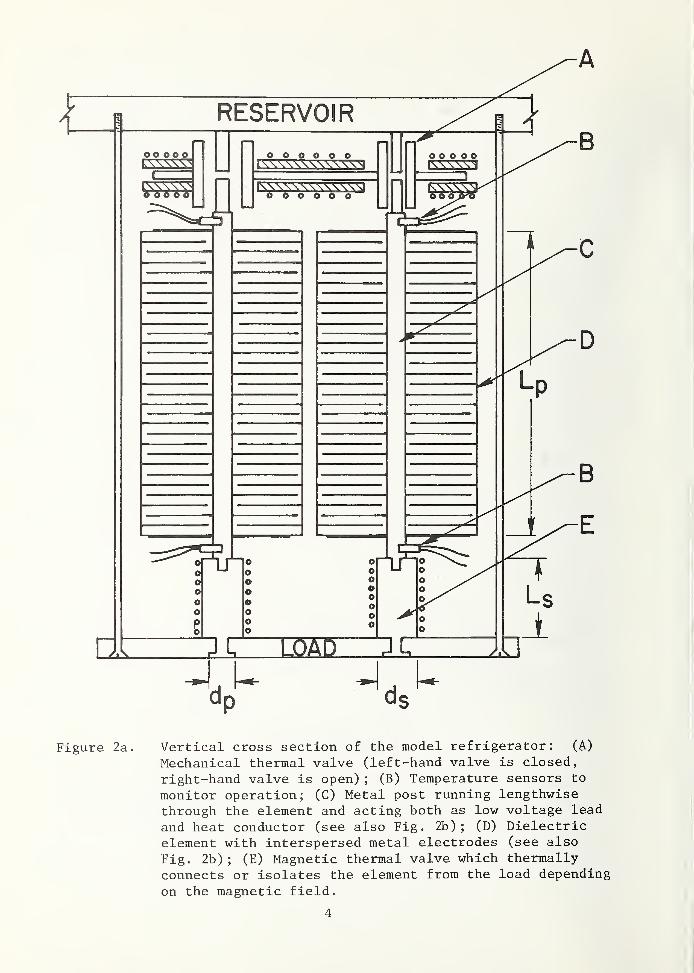
Figure 2a. Vertical cross section of the model refrigerator: (A)
Mechanical thermal valve (left-hand valve is closed,
right-hand valve is open) ; (B) Temperature sensors to
monitor operation; (C) Metal post running lengthwisethrough the element and acting both as low voltage lead
and heat conductor (see also Fig. 2b); (D) Dielectricelement with interspersed metal electrodes (see also
Fig. 2b) ; (E) Magnetic thermal valve which thermallyconnects or isolates the element from the load depending
on the magnetic field.
4

Figure 2b
.
Horizontal and partial vertical cross sections of the modelrefrigeration showing the arrangement of the metal post andelectrodes with the dielectric material.

below 2.4 K . In addition, the material has been proposed for use as a low temperature9
bolometer
.
2 10Lawless then proposed ' that the SrTiO^ glass-ceramics be used as an electrocaloric
refrigerator. This proposal was based on several factors. First, thermodynamic calculations
from the dielectric constant behavior showed large cooling effects would occur in the 4-15 K
temperature range. Second, large breakdown strengths had been achieved in similar materials.
Third, it is possible to fabricate glass-ceramic materials into almost any size and shape.
In addition to the refrigeration materials, the construction of an actual refrigerator
required the development of heat switches and a general experience in cryogenics in order
to put together an efficient refrigerator. Thus, a collaboration between Corning Glass
Works and the Cryogenics Division of the National Bureau of Standards evolved as. a sound
approach to the development of the electrocaloric refrigerator. A two year project came
about with ONR and ARPA funding for two men for two years. The Cryogenics Division subcon-
tracted half of those funds to Corning Glass Works for manufacturing the refrigeration
samples. In addition, Corning Glass Works and the Cryogenics Division each funded one
additional man for the two years. Thus the project became a four man effort for two years.
The Cryogenics Division was responsible for the heat switches, Corning Glass Works was
responsible for manufacturing the refrigeration material, and Dr. Lawless of Corning Glass
Works became a guest worker at the Cryogenics Division to make the properties measurements
on the refrigeration samples and to oversee the development of the glass-ceramic processes
and compositions. Subsequent problems with the refrigeration materials led the Cryogenics
Division to change its effort in the last six months from heat switches to studies of
refrigeration materials.
2. HEAT SWITCHES
2.1. Types of Heat Switches and Minimum Requirements
Two heat switches are required for the electrocaloric refrigerator, one to connect the
cooling element with the 15 K reservoir, and the other to connect the cooling element with
the 4 K load. The ratio of heat conducted in the "on" state of the switch to that conducted
in the "off" case will be called the switch ratio and should be as high as possible. The
switch ratio should probably be at least 30 to maintain a high refrigerator efficiency. In
the "off" condition the switch must span the temperature difference between 15 K and 4 K.
In the "on" case the upper heat switch will be at about 15 K whereas the lower heat switch
will be at 4 K. The temperature drop across these switches in the "on" case should be as
small as possible. As a first approximation we take this AT to be 1 K for both switches.
For the refrigerator size considered in this project, the lower switch must then have an
"on" conductance of about 1 W/K and the upper switch about 5 W/K. To achieve a switch
ratio of 30 means that the conductance ratio must be about 11 x 30 = 330 because the AT in
the "off" case is 11 times that of the "on" case. These switches must be able to operate
at roughly one cycle per second.
6

There are several ways in which the switch conductance can be varied with some external
parameter. These parameters could be such things as force, magnetic field, and electric
field. We know of no other parameters which could reversibly change the conductance of a
heat switch. An electric field controlled heat switch is especially attractive since
electric fields are easy to establish and are already being used for the cooling element.
Though the thermal conductivity of a material like SrTiO can be changed with an electric11
field, the effect is too small to make a useful heat switch.
Superconducting heat switches are commonly used for adiabatic demagnetization but
their use is restricted to temperatures below about IK. A large difference in the normal
state and superconducting state thermal conductivity occurs only for temperatures much
below the transition temperature. The operation of the switch requires a magnetic field to
drive the material into the normal state. The mechanical switches commonly used in calorim-12
etry will operate in the 4-15 K temperature range but their conductances are usually on
the order of only a few milliwatts per kelvin instead of watts per kelvin.
Previously developed heat switches have been designed for lower temperatures, lower
power levels, or longer cycle times than that required for this electrocaloric refrigerator.
Hence, a program was necessary to develop the proper heat switches. Several types were
investigated and compared.
2.2. Mechanical Heat Switches
2.2.1. Multiple leaf switch
Most pressed contact switches have conductances, k, of only a few mW/K at 4 K. Gener-
ally, the forces, F, applied have been only a few kg because opening the switch causes
heating that increases with increasing forces. The conductance of a switch has been found
to be dependent on Fn
where n is usually less than 1. The conductance is generally indepen-13 14
dent of the macroscopic surface area of the contacts.'
14Berman and Mate have measured the conductance of solid gold contacts at 4 K that
were closed at room temperature and found a value of 0.2 W/K at 4 K for a 43 kg closing
force. This suggests that a mechanical contact type switch might achieve the desired
conductance. The conductance of the gold switch might be expected to be qualitatively14
similar to copper, so k is reduced by a factor of 4 when the switch is closed at 4 K and
3/4is proportional to F . This being the case, several hundred kilograms closing force
would be required to achieve the desired conductance. High forces are undesirable because
of the structural parts that must extend to room temperature. In addition, it is possible
that the surfaces can be mechanically damaged causing a reduction in the conductance of the
contact. It is conceivable that a high switch conductance could be achieved if the heat
could flow through several independent contacts instead of one contact. The geometry could
be arranged so that a single applied force could close all of the contacts.
Switch design : A switch designed to achieve high conductance with a low closing force
is shown in figure 3. The contacts are stacked in parallel so that the single clamp mecha-
nism closes several. When the clamp is opened, the spring of the leaves can move them
apart. The stiffness and alignment of the leaves will determine how much residual closing
force remains between contact surfaces.
7

In figure 3 the leaves A, A are either copper with free ends gold plated or silver.
They are soldered into slots in copper base blocks B, B with pure indium. Carbon thermom-
eters are mounted either on copper tabs indium soldered to top and bottom outer leaves C, C,
or on the copper blocks as shown by D, D, since only two carbon thermometers are used at a
time. A heater E is attached to the lower copper block to establish the desired heat flux.
A germanium thermometer F is used to calibrate the carbon thermometers in place. A second
heater (not shown) is attached to the upper block and used to heat the whole switch assembly
during calibration. The upper base block B is thermally anchored to the flat circular heat
exchanger G. Liquid helium is admitted through needle valve H and the vapour is removed
through the pump line and valve I. This line is jacketed to a point above the bath so the
enthalpy of the gas as well as the latent heat can be used to cool the switch when measure-
ments are being made above 4 K.
The switch is clamped shut by the two brass jaws J, J. The force is applied over an
area of 3.2 mm times the leaf width, about 9 mm. The closing force is applied by an air
piston K. The forces are transmitted through the wire L and a stainless steel tube M. The
jaws are moved by two pairs of bell cranks N, N which are coupled to the pull wire L through
an equalizing device P. The wire is thermally anchored with copper braid at Q at 4 K and
vacuum jacketed so a sliding O-ring seal R can be placed at room temperature. The switch
assembly is placed in a vacuum container S sealed by a Woods metal joint near the top. The
vacuum can is immersed in liquid helium in a set of glass dewars T.
There are a number of questions that must be answered about the switch shown in figure
3. For example: Can a switch of this geometry be fabricated out of high conductivity
materials? Can plated contacts be used or must they be solid gold? How high is the con-
ductance when the switch is closed at low temperature? What is the effect of cycling the
switch while cold? How large is the on-to-off ratio? Is there a surface cleaning problem?
Can such a switch be adapted to a small dielectric cooling stage? These questions are
resolved to varying degrees by measurements on four modifications of the switch.
Switch 1
This switch had 13 leaves made of copper with a residual resistance ratio (RRR) of
500. This ratio is the ratio of the electrical resistances at 300 K and 4 K. The
leaves were approximately 0.33 mm thick, 8-1/2 mm wide, 25 mm long and arranged to give
12 parallel contacts. The contact ends were plated with about 2 . 5 x 103mm thickness
of commercial gold plating.
Switch 2
This switch had 3 leaves, hence two contact surfaces. The leaves were high
purity copper with an RRR of 1900, and were 0.75 mm thick, about 10 mm wide and 18 mm
long. The contact ends were plated with pure gold to a thickness of about 8 x 103mm
The leaves were mechanically polished before plating.
Switch 3
This switch was the same as switch 2 in every way except that the leaves and
contacts were silver with an RRR of 1400. Silver contacts were tried because measure-
ments at 77 K showed the contact conductance of silver higher than gold.15
The con-
tacts were mechanically polished.
9
Switch 4
This switch used identical leaves to those of switch 2. The base blocks were
larger, made of high purity copper and there were 11 leaves, hence 10 contacts.
All the leaf materials were rolled from 6.3 mm or 9.5 mm rod and annealed. The switch
2 material was rolled to size, etched with HNO and oxygen annealed at 1000°C in air at 5 x-4
10 torr for 24 hr. The high purxty copper was annealed once during rolling, and annealed
afterward at 750°C in a vacuum for 1 hr. The silver was rolled to size and annealed at
550°C in hydrogen for 1-1/2 hr. The residual resistance ratios were measured after all
rolling and annealing was completed. All the leaves were soldered into the base blocks with
pure indium. High temperature solders were not used to avoid damaging the contact surfaces
or diffusing impurities into the leaf material.
Since the proposed electrocaloric refrigerator is to reject heat at about 15 K, most of
the conductance measurements were made at that temperature. Temperature measurements were
made either on the base blocks, to get the conductance of the whole switch, or at the leaves,
so the results could be corrected to the contact conductance. The latter results can be14
compared directly to the pure gold contact results. Because of the geometry of the leaf
switches, the temperature drop between contacts cannot be directly measured.
For the temperature measurements on switch 1, a calibrated carbon thermometer was used
to measure the temperature on one side of the switch. The carbon thermometer on the other
side of the switch was calibrated against this each run. The switch was closed during
calibration and heat was supplied by a heater on the heat exchanger, figure 3, to bring the
switch assembly to a constant temperature. Under these conditions the heat flow in the
switch should be zero. For the remainder of the switches, both carbon thermometers were
calibrated by a germanium thermometer. The calibrations were done at three temperatures
between 4 and 15 K, and the results were used to find A, B, and P of the equation^
-PLog R = A + BT
where R is the thermometer resistance at the temperature T.
The conductance measurements were made by adjusting the needle valve, H, figure 3, to
fix the heat exchanger temperature at the desired value while heat is applied to the oppo-
site side of the switch. The heater power, temperatures and closing force were recorded
when the temperatures reached equilibrium. The closing force was determined from the cy-
linder air pressure and area of the piston.
The switch contacts were cleaned with an abrasive copper-cleaning powdered soap, rinsed
with distilled water, then rinsed with freon liquid and dried with freon gas. Switch 4 was
also cleaned with freon in an ultrasonic cleaner. There was a slight increase in contact
conductance. Switch 2 was cleaned only with freon liquid at first. The contact conductance
was about 1/3 the conductance after cleaning with the soap. There was some variation in
conductance from run to run and occasionally it was necessary to reclean the contacts. The
higher conductance results are presented in the figures below.
10
Results : So that the switch conductances can be more readily compared to the measure-14
ments of Berman and Mate for solid gold, the conductances are given in figure 4 as W/K per
contact. Most of the measurements presented were done around 15 K since this was the tem-
perature at which the switch was to be used. Data are shown for switch 3 at 4 K, however.
The switches were cycled from 1 to 150 times while cold. Since there was no change observed
in conductance after cycling the switch, the data are presented without specifying the
number of cycles.
The conductance of switch 1 is shown by point 1 after it was cooled from room tempera-
ture to 15.2 K with a 54 kg closing force. The contact conductance is about 1/4 that of
solid gold contacts. After opening and closing the switch at 15 K, the switch conductance
per contact is shown by curve 1A. The measured conductance is from base block to base
block.
The conductivity of the leaf material of switch 1 was measured and found to be 160 W/cmK
at 12 K. This is high for an RRR of 500 when compared to other conductivity measurements on17
high purity copper. This measurement indicated that most of the measured aT was in the
contact. Cobalt or silver impurities are used in the commercial gold plating for hardening.
Since this impurity could possibly affect the contact conductance, pure gold was used to2
plate the remaining switches. The indium joint conductance was estimated to be 10 W/K cm
from the conductivity measurements.
The contact conductance of pure gold plated contacts is shown by curve 2 of figure 4
for switch 2. The switch was closed with a 54 kg force before cooling. At 15 K the force
was increased resulting in some increase in conductance.
The contact conductance of the switch, after cycling at 15 K, is shown by curve 2A.
The conductance is reduced by slightly more than two by opening and closing the switch cold.
There is a thermometer on both sides of the indium solder joint for this measurement, a
carbon thermometer on the leaf and the germanium thermometer on the base block. If the AT
is corrected for the leaf conductance and the conductance of the 0.9 cm square base block,
then the conductance of the indium joint can be determined. This gave an indium joint
conductance of 00 to 20 W/K depending on whether 7 or 14 W/cmK was used for the OFHC copper
conductivity
.
The total switch conductance per contact is shown in curve 2B. The thermometers were
mounted on the blocks. A correction has been applied to exclude the AT due to the base
blocks since they can be made of a much higher conductivity material than the OFHC copper
used here. There is only one set of low-temperature conductivity data^ for OFHC copper and
for that the state of work hardening is unspecified. The error bars on the data are for a
7 W/cmK minimum conductivity and a 14 W/cmK maximum conductivity for OFHC copper at 15 K.
The section of curve 2B showing little force dependence was measured while reducing the
air cylinder pressure. This apparently different force dependence is due in large part to
drag in the air cylinder and linkage to the switch. Applying the force with a spring scale
brought the pressure applied and pressure released curves closer together.
The conductance of the silver contacts of switch 3 after opening and closing at 15 K is
shown by curve 3A. The point 3 is the conductance of the switch after cooling closed to
11

12

15 K. This conductance is about the same as for gold plated copper. The conductance of the
silver at 4 K is shown by curve 3B.
The conductance per contact of switch 4 after cooling closed was essentially the same
as for switches 2 and 3. The closed cold contact conductance, however, was only about 3/4
of the conductance observed in the earlier switches. This could perhaps result from the
stiffness of the leaves or a movement of one set with respect to the other. If, for some
reason, one or both of the leaves on which the thermometers were mounted made poorer contact
than the next, the measured AT would be between the AT of the contacts and the AT of the
whole switch.
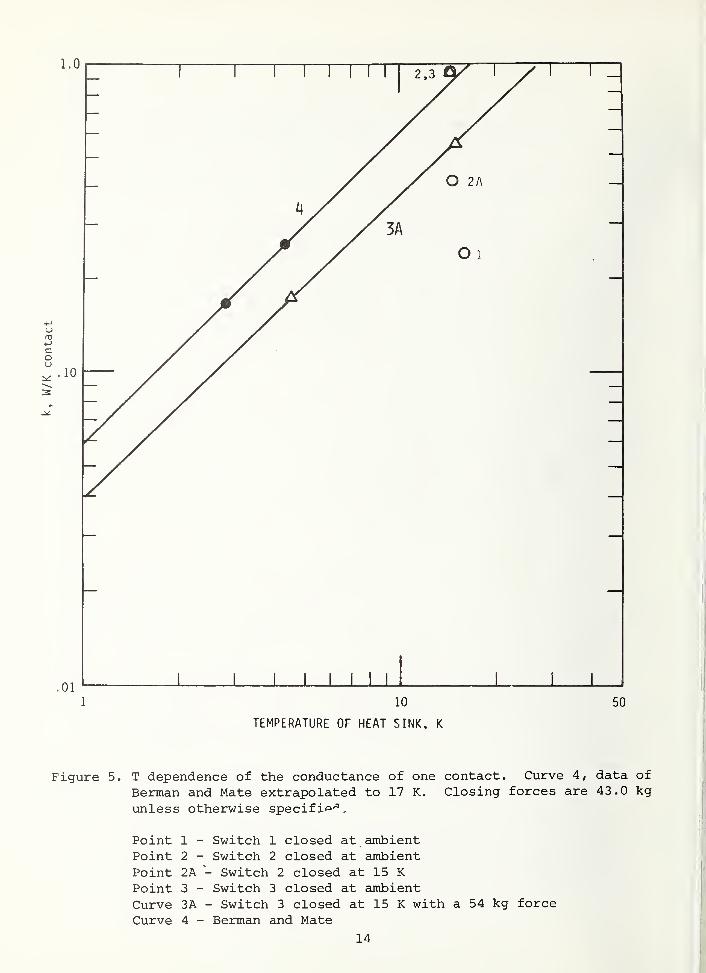
In figure 5, the conductances of the switch contacts of switches 1, 2, and 3 (switches
cooled from ambient while closed) are compared to the solid gold contacts of Berman and
Mate. Switches 2 and 3 were cooled at a higher closing force so the conductance was cor-3/4rected to a 43 kg closing force assuming the conductance varies as F . The conductances
agree well with the results of Ref. 14. The temperature dependence of the conductance of
the silver contacts, after cycling cold, was found to be proportional to T in agreement with
Ref. 14.
On-to-off conductance ratios were measured for switches 1, 2 and 4 for closing forces
around 90 kg. For switch 1, this ratio was about 2000. For switch 2, this ratio varied for
different runs from 900 to 3000, probably depending on the alignment of the leaves. This
ratio was actually measured for an open AT of about 10 K and no radiation corrections have
been applied. Switch 4 had an on-to-off ratio of about 45. The low ratio is due to the
impracticability of aligning a large number of relatively stiff leaves so there are no
appreciable contact forces remaining when the switch is open. The longer and thinner leaves
of the first switch were sufficiently flexible so that the open conductance was low in spite
of the even larger number of leaves.
Discussion : A maximum conductance of 1.2 W/K at 15 K with a 90 kg closing force and a
103on-to-off ratio was achieved with the switches reported above. Although 5 W/K at 15 K
was desired, the obtained value is sufficient for testing a refrigerator. The conductances
of both pure gold plated copper and silver contacts are comparable to the solid gold mea-14
surements when the contacts are closed before cooling. The conductance after reclosing
the switch cold is reduced by a factor of 2 or 3.
The pure gold plated contacts used for switch 2 were definitely superior to the com-
mercial plating, which contained a dilute impurity. This difference may be caused by the
presence of the impurity, but it should be noted that the leaves of switch 2 were mechani-
cally polished before plating, and the plating was thicker, either of which may have caused
the improvement
.
The power, n, of the relation k a Fn
for the contact conductances was found to be about
0.66 for switch 2 and 0.6 for switch 3 from log-log plots of k as a function of F. These
slopes do not extrapolate to k = 0 at F = 0 on a linear plot. No corrections have been made
to the indicated forces for friction in the switch mechanism.
The above measurements show that a high conductance switch (on the order of 1 W/K) can
be made by plating and that the fabrication can be done using pure indium solder. The
13
.01
1 10 50
TEMPERATURE OF HEAT SINK, K
Figure 5. T dependence of the conductance of one contact. Curve 4, data of
Berman and Mate extrapolated to 17 K. Closing forces are 43.0 kg
unless otherwise specific
.
Point 1 - Switch 1 closed at ambientPoint 2 - Switch 2 closed at ambientPoint 2A - Switch 2 closed at 15 KPoint 3 - Switch 3 closed at ambientCurve 3A - Switch 3 closed at 15 K with a 54 kg force
Curve 4 - Berman and Mate
14
conductance is not degraded by cold cycling the switches 150 times. On-to-off ratios of
greater than 10^ are possible if the leaves are properly aligned (switches 2 and 3) or
sufficiently flexible (switch 1) . Cleaning and maintaining that cleanliness appears to be
no problem. No heating was observed due to opening or closing the switch, which is not
surprising due to the heat fluxes present.
The conductance of a switch of the above design can probably be increased by optimizing
the leaf dimensions and the number of leaves. Probably, a switch with even higher conduc-
tance is possible using a more elaborate disengaging mechanism for the leaves.
2.2.2 Helium gap switch .
In order to transfer heat across contacts in a vacuum (previous section) large forces
are required. A second mechanical switch considered uses a low pressure of helium gas
around the contacts to provide good heat transfer without using high contact forces. The
thermal conductivity of helium gas is independent of pressure until the pressure becomes so
low that the mean free path of the molecules becomes comparable to the gap spacing. For a
pressure of 1 torr the mean free path of helium gas is 1.1 ym at 4 K and 2.1 ym at 15 K.
Therefore, for a gap of 5 um or more the thermal conductivity of the gas will be the classi-
cal bulk value. The thermal conductance across the helium gap is simply
K = kA/£,
where k is the thermal conductivity of the helium, A is the cross sectional area of the gap,
and £ is the gap spacing. The conductance can then be varied by changing the gap spacing.
For the "on" case the two copper surfaces are brought into light contact. For reasonably
smooth surfaces, the average gap spacing may be about 5 ym. The "off" condition is achieved
by separating the two plates by a gap of about 5 mm. The conductance then decreases by a
factor of 1000. For a AT of 11 K in the off case, the switch ratio would be £ -,/ll £off on
for k independent of temperature. Actually k varies from 0.084 mW/cmK at 4 K to 0.22 mW/cmk18
at 15 K, so the switch ratio becomes £ __/7.5 £ = 133 for the upper switch andor r on
£ ,/19-4 £ =52 for the lower switch as £ changes from 5 ym to 5 mm. The biggest uncer-of f ontainty is the "on" conductance since the spacing depends on the quality of the surfaces. In
2order to transfer 5 watts at 15 K with a AT of 1 K, a surface area of 11.4 cm is required
with a gap of 5 ym.
An apparatus to test the heat conductance across a helium gap was designed and built.
However, a shift in emphasis from heat switches to refrigeration materials prevented a test
of the helium gap heat switch.
An actual working heat switch would have a cycle time of about 1 second so that the
heat absorbed from one surface during the first half second can actually be stored in a
movable plate with a high heat capacity. During the next one half second the plate is moved
to make contact with the upper reservoir and transfers its stored heat to it. Thus a simple
solenoid could move the plate from one position to the other. A 200 g movable plate of lead
could be used for an upper switch but a lower switch would require as much as 8 kg of lead.
Thus such a helium gap heat switch would only be practical for the upper switch.
15

2.3. Magnetothermal Heat Switches
2.3.1. Survey of various metals .
The thermal conductivity of a metal is composed of the lattice and the electronic term,
i.e., k = k^ + k^. The electronic contribution can be reduced considerably in many metals
by the application of a transverse magnetic field. The amount of reduction is proportional19
to the electrical magnetoresistive effect. A reduced Kohler diagram of the transverse
magnetoresistivity of most metals is very helpful in selecting those metals with high mag-
netoresistive effects. A high magnetoresistive effect also reduces the eddy current heat-
ing. However, additional conditions must be met to obtain a large change in thermal con-
ductivity with a magnetic field. The zero field thermal conductivity, which should be high,
is proportional to the residual resistivity ratio (RRR = P295/p o^ ' w^ere p
o^ s usua^y
measured at 4.2 K. The lattice thermal conductivity, which should be low, is given theoret-20
ically by the expression3.1 x 10 k
00 2kl
= 2 2 T (W/Cm K)'
GNo %
where k is the constant thermal conductivity at high temperatures, e.g., room temperature,
G is a numerical factor which is about 70, is the number of free electrons per atom, and
6^ is the Debye temperature at 0 K. From this expression it is obvious that a high 9^ will
give a low k^. The important properties of a metal which would make a good heat switch are
summarized as follows:
(1) high magnetoresistive effect
(2) high residual resistance ratio (RRR > 1000)
(3) high Debye temperature, 6 > 300 K.o
Even though some materials, such as bismuth, have extremely high magnetoresistive
effects, they are inappropriate as heat switches since they do not satisfy conditions (2)
and (3) above. Table 1 lists the various metals which are known to satisfy all three con-
ditions above and therefore would be potential heat switch materials.
Table I. A summary of metals which have the potential for making good magnetothermal
heat switches in the 4-15 K range. The metals are listed in order of de-
creasing magnetoresistive effect.
highest RRR 9 sufficient literatureMetal ^ o
to date (K) data on k(T,H) exists
Ga 2 x 10 324 yes
Be 3 x 10³
1160 no
Mg 106
- 107
342 no
W 3 x 10⁴
405 yes
3Fe 3 x 10 464 no
3Ru > 10 600 no
16

Of the six possible candidate materials only Be and possibly Ru have high enough 6q
to be
potentially useful as the upper switch where the "on" temperature is about 15 K. The other
materials would be useful only for the lower switch where the "on" temperature is 4 K.
Until now, only Ga and W had been measured in enough detail to predict the heat switch
performance. In fact Ga has already been used as a heat switch in the 1-4 K temperature21
range. Our first efforts were then to make a switch of Ga.
Gallium ; Figure 6 shows the behavior of the thermal conductivity of gallium as a
function of temperature for various transverse magnetic fields. The H = 0 curves are from22 21
the work of Boughton and Yaqub, and the H ^ 0 curves are from Engels, et al. In the
"off" state of the switch (H j- 0) the temperature will be 15 K on one side of the switch and
4 K on the other side. The heat flow must be evaluated by integration over the k(T) curve.
2For k^T the average conductivity is the value of k at about 11 K. For the lower switch,
the switch ratio is then approximately (1/11) k^/k^^ and for the upper switch the ratio is
(1/11) k^/k^. Table 2 lists these switch ratios for gallium as well as for several other
metals
.
Table 2. Measured or estimated thermal conductivity at three different temperatures
and the switch ratio for several heat switch metals. Units for k are W/cm K.
H = 0 H = 14 k Oe Switch Ratios
Metal k (4 K) k (15 K) k (11 K) lower upper
Gallium 200 5.0 0.20 91 2. 3
Beryllium 23 73 0.040 52 166
Magnesium 60 28 1.6 38 18
Tungsten 800 115 0.45 162 23
Iron 50 70 y 0.5 9 13
Ruthenium 50 80 0.1 - 0.3 15 - 45 24 - 73
Two gallium magnetothermal heat switches were made by growing a single crystal of
2399.9999% Ga in a teflon mold like that described by Yaqub and Cochran. Each crystal had
relatively large diameter discs grown on each end to reduce the thermal resistance at the
bond between gallium and copper. Both crystals broke upon cooldown. The first was subject
to slight tension from the stainless steel support system, whereas the second was subject to
compression from the teflon support system. Because of the brittleness and low melting
point (29.9°C) of gallium, and because of the encouraging results obtained with beryllium,
further work on gallium was abandoned.
Tungsten : The magnetothermal conductivity appears to be quite well characterized from
24 25the measurements by de Haas and de Nobel and by Long. Figure 7 shows the thermal conduc-
tivity behavior and table 2 gives the expected switch ratios. The results show that tung-
sten would make a satisfactory lower switch.
17

1 2 4 6 10 20 40 60 100
Figure 6. The thermal conductivity of single crystal gallium in transversemagnetic fields^l. The heat flow is parallel to the a axis and
the field is parallel to the c axis. The thermal conductivity in
zero field is somewhat size dependent because of the long electronmean free path^2 #

1 2 4 6 10 20 40 60 100
T,K
Figure 7. The measured thermal conductivity of single crystal tungsten in
transverse magnetic fields 2^* 25. A size dependence occurs at
low temperatures in zero field for the higher purity sample.
19

Other metals : The rest of the metals listed in table 1 have not been measured in
enough detail to permit an evaluation of them in regard to heat switches. Magnetothermal
conductivity measurements were then made on two of these metals (beryllium and magnesium) to
permit an evaluation of them. The estimates in table 2 show that it is not fruitful to
study iron and ruthenium.
2.3.2. Beryllium .
Until now the only measurements of the thermal conductivity of beryllium in a magnetic26 27
field were those of Griineisen. ' His sample had a resistance ratio, P295/po'
°^ 9^8. He
found that the maximum field effect occurred with the heat flow along the hexagonal c axis
and the magnetic field along an a axis such as {1120>. Unfortunately his measurements were
made at only 23.5 K and 81 K. Our measurements on the magnetothermal conductivity of beryl-
lium have shown this material to be superior to all other metals for heat switches in the 4-
15 K temperature range. For that reason a fairly extensive study of its thermal and elec-
trical conductivity was made.
Samples . Two different single crystal beryllium samples were measured. Most of the
measurements were made on a very high purity sample, which we will denote as sample 1. This
sample was loaned to us by Dr. R. J. Soulen of the Heat Division of the National Bureau of
Standards. He in turn received the sample from Dr. W. Reed of Bell Telephone Laboratories.
That sample was one of several that Dr. Reed cut out from a much larger single crystal grown
by Nuclear Metals, Inc. The size of the crystal we received was 3 mm x 3 mm x 25 mm. The
orientation of the crystal was determined from back scattered x-ray Laue photographs. The
hexagonal c axis was along the long axis of the crystal to within one degree. The resis-
tivity ratio, p /p , was found to be 1340.z. y b u
Sample 2 was spark cut from a single crystal disc piece given to us by Dr. S. K. Sinha
of Iowa State University. This sample was 2.3 mm x 3.7 mm x 16 mm with the c axis within
two degrees of the long axis of the crystal. The resistivity ratio, P 1Qr/P n > was found to295 0
be 79. After the sample was spark cut, it was etched in a solution with composition: 26.5
ml cone. H2S0^, 450 ml cone. H
3P0
4, 53 g Cr0
3, held at a temperature of about 70°C. The ends
of this etched sample were then tinned with 99.99% pure indium using an ultrasonic soldering
iron and zinc chloride flux.
Experimental techniques . The thermal conductivities of the two beryllium samples were
measured by using the standard technique of observing the temperature drop across a portion
of the sample while a steady heat current flowed through the sample. Carbon thermometers of
1/8 watt size and 220 U normal resistance with a flat ground on one side were used as tem-
perature sensors. Two thermometers were varnished to the sample to measure the AT across it
and one thermometer was mounted on the reservoir close to the sample. The reservoir ther-
mometer then allowed measurements of the thermal resistance at the boundary between the
sample and the reservoir. A constant current source and a digital voltmeter were used to
read the carbon thermometers. A germanium thermometer, calibrated by the manufacturer, was
also mounted on the reservoir to calibrate the three carbon thermometers. A capacitance
thermometer, also mounted on the reservoir, served to calibrate the other thermometers in a
magnetic field. Between 100 K and 300 K thermocouples of type KP versus Au-0.07% Fe were
20
used for measurements of both T and AT. Published thermocouple tables were used to
convert voltages to temperatures.
An aluminum foil radiation shield surrounded the sample and was attached to the reser-
voir. The reservoir, made entirely of copper, was a 10 cm3pot suspended inside a vacuum
can by a 6 mm diameter stainless steel pumping tube. Liquid nitrogen or liquid helium
outside the vacuum can could be let into the reservoir through a stainless steel capillary
tube with a valve in the liquid bath. With such an arrangement the reservoir could be
cooled down to the bath temperature within a few minutes by opening the valve in the liquid
bath while the pumping tube on the reservoir is vented to the atmosphere. Measurements
below the bath temperature were made by closing the needle valve and pumping on the reser-
voir. Measurements above the bath temperature were made by first closing the needle valve
and applying current to a reservoir heater to boil off the liquid in the reservoir. When
the temperature rose to the desired point the needle valve was opened just enough to provide
a cooling effect to nearly balance the heat input to the reservoir. The carbon thermometers
were calibrated during that procedure. Next the power to the reservoir heater was turned
off as the same power was applied to the sample heater for measurement of the thermal con-
ductivity. This procedure gave rather rapid equilibrium times and usually yielded very
stable temperatures.
The reservoir and vacuum can were made small in diameter so as to fit in the tails of
nested glass dewars. These tails, in turn, were fit between the poles of an iron core
electromagnet which could attain a field of 955 kA/m (12 kOe)
.
The high purity sample 1 was thermally anchored to the reservoir with a low temperature
varnish. The heater was attached to the other end of the sample with varnish also. The
thermal boundary resistance of the varnish joint was much higher than the thermal resistance
of the sample in zero field. Thus accurate measurements in zero field were difficult to
make because of the necessity for low power levels. That sample was to be used later for
superconducting fixed point measurements and contamination with solder was not desirable.
Sample 2 however was tinned with pure indium on each end as described previously. One end
of this sample was then indium soldered to the reservoir and the heater mounting bracket
soldered to the other end. The indium solder provided much better thermal contact for this
sample.
The electrical conductivities of both beryllium samples were measured potentiometrically
.
Current and voltage leads were pressure contacts to the sample. Pointed screws were used
for the voltage taps. Currents up to 2A were used when the sample conductivity was high.
The same thermometers used for the thermal conductivity measurements were also used to
determine the sample temperature during the electrical conductivity measurements.
Experimental Results . The temperature dependence of the electrical resistivity of
sample 1 is shown in figure 8. These data are for the current along the hexagonal c axis26 29 30
and the magnetic field along the a axis. Previous measurements ' ' in zero field on
less pure samples are also shown for comparison. The total resistivity pfc
is conventionally
expressed as
P t= P
i+ P
r(2.D
21

10
St.
Figure 8
id5
11
|I I I I
|
Beryllium
1 1—I|
I I I l
H=955kA/m (12kOe)
637kA/m (8kOe)
/ ^ Reich et al
318kA/m (4kOe)
B
0^
159kA/m (2kOe)
80k A/m (IkOe)
O This Work
R.W. Powell
A Gruneisen and Adenstedt
10 20 50 100 200 500 1000
The electrical resistivity of high purity single crystal berylliumas a function of temperature in various transverse magnetic fieldsPrevious work26,29,30 on iess pUr e samples is shown for comparison
22

where is the intrinsic resistivity due to scattering of electrons by phonons and is
the residual resistivity due to impurity scattering of the electrons. For sample 1 we have-3 -9 4
p = 3.35 x 10 ufi'cm and p. =1.0 * 10 T ufi'cm. This expression for p. is identicalr 1
301
with that found by Reich, et al. on a less pure sample. For our sample we find p 0 _-. =
3.69 viQ'cm and p__ c , „ = 4.48 yfi*cm. These data are in good agreement with the value
p =3.58 u^*cm found by Grtineisen and Adenstedt.2/3 • Id K
Figure 9 shows the thermal conductivity of beryllium sample 1 as a function of tempera-
ture for several magnetic fields. The heat flow was along the hexagonal c axis [OOOl]
and the transverse magnetic field was along one of the a axes, e.g. [ll20], of the crystal.26
Such an orientation has been shown to give the maximum field effect on the thermal con-
ductivity. Figure 10 shows how the thermal conductivity varies with the angle of the mag-
netic field within the basal plane. As expected, a 60° symmetry exists. Such a plot was
used to find the exact orientation of the a axis before taking the data shown in figure 9.
29The data taken near room temperature blend very well with the data of Powell above room
26temperature on his purest sample in the annealed state. The data of Grtineisen and Adenstedt
on a less pure sample is shown for comparison. Their data is for H = 0 and H = 955 kA/m (12
kOe) and is consistent with the present data considering the differences in purity.
For H = 0 and T < 150 K the thermal conductivity of the high purity sample is dominated
by electron conduction. For that range the data are fit very well by the theoretically
expected form
2 -1W = W. + W = ctT + (BT) , (2.2)e i o
where Wg
is the total electronic thermal resistivity, is the ideal resistivity due to
phonon scattering, and Wq
is the resistivity due to impurity scattering. The data of figure
9 give a = 1.04 x 10 ^ cmW ^"K ^ and B = 5.7 W cm ^. This was the first beryllium sample
measured that was pure enough to allow a determination of the ideal thermal resistivity.
The total thermal conductivity, k, has a contribution from the electrons, k , and from
the lattice, k , such that k = k + k . The electronic thermal conductivity is so easilyg eg
reduced by the application of a transverse magnetic field that the lattice thermal conduc-
tivity can contribute a sizeable fraction to the overall conductivity in sufficiently high
fields. The application of a magnetic field then allows a separation of the electronic and
lattice components of conduction. Several methods exist for separating the two components
from measurements in magnetic fields. In this work we use the method of Grtineisen and
26Adenstedt in which they write
k(H) = k (H) + k = L To (H) + k , (2.3)e g e g
where L is the electronic Lorenz number and a (H) is the electrical conductivity in a mag-e
netic field. In this expression L and k are assumed independent of magnetic field. Aegplot of k(H) versus Tcr(H) for different field strengths yields a rather straight line for
H > 150 kA/m (2k0e) . Thus L and k are determined simultaneously. This technique was usede g
23

EU
^-Extrapolated Latti
Conductivity
Gruneisen and Adenstedt(RRR = 948)
O This Work(RRR = 1340)
10 20 50 100 200
T,K
Figure 9
.
The thermal conductivity of high purity single crystal berylliumas a function of temperature for various transverse magnetic fieldsThe work of Gruneisen and Adenstedt^^ is shown for comparison.
24

Eu
E
16
15
i r
b — A x i
30 50 70 90 110 130 150 170 190
<f>, deg
Figure 10. The thermal conductivity of single crystal beryllium at 2.1 K as
a transverse magnetic field of 796 kA/m (10 kOe) is rotated aboutthe basal plane. The angle 0 is an arbitrary angle.
25

at several temperatures to obtain the lattice conductivity shown in figure 9. For T < 30 K
for the lattice conductivity can be expressed as
kg
= YT2
, (2.4)
-4 3 31 -4 3where y = 1-6 x 1° W/cm K . Powell, et al. estimated y = 2.0 x 10 W/cm K from
thermal conductivity measurements of beryllium alloys. The value of y is lower than that
of any other metal and is to be expected because of the high Debye temperature of beryllium.
For temperatures below about 20 K the thermal conductivity of this high purity beryl-
lium sample can be changed by over three orders of magnitude with a magnetic field of 955
kA/m (12 kOe) . This is roughly equivalent to going from the thermal conductivity of high
purity copper to that of stainless steel. Table 2 lists the heat switch ratios which could
be obtained with such a sample. As this table shows, beryllium is the only metal which can
be used as the upper switch. It can be used as the lower switch also, but for that switch
tungsten would be just as good.
The relative change of electrical resistivity at 4 K of beryllium sample 1 is shown as32 n
a Kohler diagram in figure 11. This figure shows that Ap/p <* H , where n = 2.00 ± 0.02.o
This field dependence agrees with the theoretical value n = 2 for a compensated metal with
no open orbits. Also shown in figure 11 is the relative change in electronic thermal2
resistivity. This change is nearly proportional to H also, except that the coefficient of2
H is smaller than for Ap/p^. The difference, however, is about within the experimental
uncertainty of AW^/W^O). The biggest uncertainty is in We(0), the electronic thermal
resistivity in zero field. The rather small value of We(0) at low temperatures along with
the large cross section of the sample made it difficult to measure we(0) accurately. The
uncertainty in Wg(0) for T < 70 K is about ± 25%. At higher temperatures and in magnetic
fields the thermal resistivity increases considerably and the uncertainty eventually drops
to about ± 5%.
2The fact that AW
e/W
e(0) is proportional to (H/p
Q ) points out the importance of using
samples with a low p Q , i.e., high resistance ratio. A lower pQnot only means that a
higher ratio between k(H = 0) and k can be attained but also that a lower field can beg
used to make k(H) approach k , the lattice thermal conductivity. Such behavior is evidentg
in figure 12, which shows the magneto-thermal conductivity of sample 2, a less pure beryl-
lium single crystal (RRR = 79) . The thermal conductivity for H = 0 is considerably
lower than for sample 1, but also the thermal conductivity for H = 955 kA/m (12 kOe) is
considerably higher for this sample than that for sample 1.
Beryllium crystals with resistance ratios as high as 3000 were made several years ago
for a government contract, but these samples (our sample #1 is one of those) are now essen-
tially all gone. About $5 , 000-$15, 000 would be required to establish facilities for grow-
ing more of these crystals.
2.3.3. Magnesium
The magnesium sample measured in this work was kindly grown for us by R. Reifenberger
of the University of Arizona. It was a rather small crystal with dimensions 0.5 mm * 1.0 *
5.0 mm. The long axis was along the [ll20] direction and the rectangular sides were {0001}
26

O &p/pQ
a AWe /We (o)
i i i ii
i i i i i i iii12 5 10 20 50
H/yo0 , 10
13A/fim
Electrical and thermal KohsLer diagram for high purity single
crystal beryllium at 4 K. The relative change in electricalresistivity, Ap/p , and of the electronic thermal resistivity,AW /W (0) , are shown as a function of magnetic field divided
e eby the residual electrical resistivity.
27

1 5 10 50 100 300
TEMPERATURE, K
Figure 12. The thermal conductivity of low purity single crystal beryllium as
a function of temperature for various transverse magnetic fields.The lattice conductivity derived from the measurements on highpurity beryllium is shown for comparison.
28

and {1010} type crystal faces. The resistance ratio of similar crystals were greater than6 33
10 , which makes these crystals among the purest substances known to man. These crystals
were grown from the vapor phase by a vacuum sublimation technique.33
Copper was sputtered
onto the ends of the sample to provide a base for indium solder.
The crystal was indium soldered to the copper reservoir of the thermal conductivity
apparatus described previously. The holder for the heater was indium soldered to the other
end. Small copper spots had been sputtered on the side of one of the {0001} faces but it
was not possible to tin those spots. Consequently, a low temperature varnish was used to
mount the two carbon thermometers on the {0001} face. These thermometers were mounted by
first varnishing them to a piece of 0.05 mm thick copper foil. The copper foil had a
narrow tab (*V 0.4 mm) which was wound around the sample and varnished in place. The two
thermometers were placed 2.1 mm apart on the sample. Because of the small size of the
sample the measurement inaccuracy was at least 15%. In zero magnetic field where the
thermal conductivity is extremely high the inaccuracy is even greater.
Figure 13 shows how the thermal conductivity of magnesium at 4 K varies with the angle
of the magnetic field. In this case the heat flow is along the [ll20] axis (a axis) and
the field is rotated in the plane perpendicular to this axis . The minimum thermal conduc-
tivity occurs when the angle of the magnetic field is halfway between the c and b axes. A
somewhat larger transverse magnetic field effect may occur for heat flow along the hexagonal26
c axis as in the case in beryllium. The data in figure 14 were taken with the magnetic
field aligned so as to give the minimum thermal conductivity. The zero field thermal
conductivity below about 10 K was so high that it could hardly be measured in this small
sample. The data above 30 K agree to within experimental error with previously published
data for H = 0. Until now there has been no measurement of the thermal conductivity of
magnesium in a magnetic field. The thermal conductivity shown in figure 14 for a given
magnetic field is not as low as those for beryllium, gallium, or tungsten. However, even
at 955 kA/m (12 kOe) there is no indication that the thermal conductivity is approaching
the lattice conductivity. Thus it may be as much as an order of magnitude below the highest
field curve in figure 14.
For heat switches made of very high purity magnesium, the switch ratios would be
approximately those given in table 2. As is evident from this table, magnesium would not
make as good a heat switch as beryllium or tungsten.
2.3.4. Thermal conductance of joints
Any low temperature apparatus is composed of many parts. In the electrocaloric refrig-
erator there will be a 15 K reservoir, refrigeration element, heat switches, and load.
Each of these parts must be joined together in some fashion that will allow large amounts
of thermal power to be transferred between these parts. An improperly designed joint may
have a thermal resistance which could be larger than most other resistances in the system.
The electrocaloric refrigerator has a cyclic operation mode so that the mass of material
connected to the cyclic element must be kept small enough to prevent its heat capacity from
thermally overloading the system. This is accomplished by using a small amount of high
purity copper for the transfer of heat. The size of a magnetothermal heat switch also
2 9

Eo
60 80 100 120 140 160 180 200 220 \
b-axis 0 degb-axis
Figure 13. The thermal conductivity of single crystal magnesium at 4.3 K asa transverse field of 955 kA/m (12 kOe) is rotated through thearbitrary angle 0.
30

Magnesium
1 5 10 50 100
T, K
Figure 14. The thermal conductivity of single crystal magnesium as a functionof temperature for various transverse magnetic fields.
31

needs to be kept small for the additional reason that the magnet size should be small. The
small volumes of copper and of the magnetothermal switch material mean that the surface
area of the joints will necessarily be quite small and therefore may have high joint resis-
tances .
Figure 15 is a compilation of existing data on the thermal conductance of solder
joints, grease joints, and pressure joints. In the case of the pressure joints the thermal
conductance, in units of W/K, is for the whole joint, independent of the surface area. For2
the grease and solder joints the thermal conductance is for 1 cm .
The curves shown in figure 15 are taken from the following references
:
Solder joints (T < IK): ref. 34,35
Solder joints (1 K < T <4 K) : ref. 36,37
Solder joints (room temperature) : ref. 38
Grease and adhesive joints: ref. 34,39-42
Pressure contacts: ref. 12,14,41-43.
It is rather amazing that there are no data in the literature on the thermal conduc-
tance of solder joints in the region between 4 K and room temperature. But rough inter-
polations (shown by the dashed lines in figure 15) , based somewhat on values of the bulk
thermal conductivity of certain solders, suggest that solder joints are superior to all
other joints in the region above 4 K.
Because of the importance of and uncertainty of the thermal conductance in solder
joints, measurements were made on such joints in this work. Indium solder was chosen since
it has a higher thermal conductivity than alloy solders. Indium of 99.99% purity was used
for these tests. Two joints were measured. The first was between beryllium sample 2 and
an ETP copper surface. The second joint was between an annealed 99.999+% pure copper
sample and the same ETP copper surface. Each joint was made by first tinning the two
surfaces with generous amounts of indium. The parts were than pushed and rubbed together
as heat was applied to the joint. The excess indium was trimmed off with a razor blade.
The resultant joint thickness was on the order of 25 ym.
Figure 16 shows the thermal conductance of the two indium solder joints. These con-
ductances were measured during the same time the thermal conductivity of each sample was
being measured. It was necessary to extrapolate the temperature gradient in the sample to
the surface. This correction was less than 10% for temperatures below 30 K with the annealed
99.999+% pure copper sample. For the beryllium sample, however, this correction amounted
to as much as 90% for temperatures around 10 K. Thus only the high temperature data for
beryllium is fairly reliable. With that in mind, the two sets of data (beryllium and
copper) are in good agreement with each other. This agreement shows that even though it is
difficult to wet beryllium with the indium, successful solder joints can still be made to
it. The thermal resistance of the joint is more than an order of magnitude larger than
that expected across a 25 ym thick pure indium sample. The increased resistance, which is
typical in solder joints, is probably due to imperfections both in the solder layer and in
the actual bond.
32

Figure 15. The thermal conductance of grease, adhesive, solder, and pressurejoints as a function of temperature. The conductance is per cm^of contact for the grease, adhesive, and solder joints. However,the curves for the pressure joints give the total conductance ofthe joint, independent of the area, but dependent on the total forceapplied. The dashed lines are our estimates of the conductance in
areas where no data exist.
33

evj
E
500
200
100
5 0
20
10
- Normal
11 I I I I I I I I I I I I
o Cu — In —Cu
Be— In—Cu
Superconducting
I 1I 111 L
10 20 50 100 200
T, K
Figure 16. Thermal conductance as a function of temperature for two indiumsoldered joints. The normal state is produced by applying a
magnetic field.
34
The indium joint conductance in the 4-15 K temperature range is considerably higher
than estimated in figure 15. In order to transfer 5 W of power with a AT much less than 1 K. . 2would require a joint area on the order of 0.1-0.5 cm .
2.3.5. Magnet requirements
The magnetothermal switches require a transverse magnetic field on the order of 1200
kA/m (15 kOe) to operate them. This is low enough that iron can be used for most of the
magnetic flux path. A gap in the iron on the order of 1 cm in length would be large enough
to fit around, but not touch, the heat switch material. The magnet must be able to operate
at 15 K, since it will be thermally anchored to the upper reservoir. Even if it were
attached to the load, it would have to start operation at 15 K. Other requirements for the
magnet are that the heat load to the 15 K reservoir be small compared with 5 W and that the
rise time of the magnetic field be much less than 1 s.
The magnet wire could be made superconducting if Nb3Sn were used. It has a transition
temperature of about 18 K. The only heat load would be from heat conduction down the leads
but this could be made much less than 5 W. It should be possible to apply or take off the
field in a Nb^Sn magnet in less than one second in light of the present superconducting
magnet technology. However, tests were not made of the possible cycle times in a Nb3Sn
magnet.
For resistive windings the power dissipation in an air core solenoid can be expressed44
as
w = fc]
2
A (Gj ' (2.5)
where p is the resistivity in ohm-cm, r is the inside radius of the magnet coil in cm, A is
the fraction of coil volume occupied by conductor, H is the field in Oe, G is a geometry
factor typically in the range 0.15 to 0.2, and W is the power in watts. For commercial
purity copper at 15 K, for r = 0.5 cm, and for H = 1200 kA/m (15 kOe) , the power dissipation
is about 200 watts. The use of an iron core with a 1 cm gap can reduce the power to about 2
watts. High purity copper wire could reduce the power dissipated by another order of mag-
nitude. A commercial iron core transformer was modified to make a C-type magnet capable of
generating the required fields. The copper wire in the coil was 0.5 mm diameter. The rise
and fall times for generating the field were on the order of 0.2 s.
The magnets for the magnetothermal heat switches could be made of copper windings and
it would be certain to work. The power dissipated in that case would be higher than desired
unless high purity copper were used. The use of Nb Sn would probably be better but there is
the uncertainty of how fast the field can be changed.
35

3. REFRIGERATION MATERIALS
3.1. Theoretical
3.1.1. Thermodynami c s
The general TdS equation for a dielectric material is
TdS = C„dT + T(3P/3T)„dE, (3.1)
where C is the specific heat in the electric field E and P is the polarization of the
sample. The refrigeration absorbed during the isothermal step from E^ to E^ in figure 1 is
given by
QL= TlAS = T
1(3P/3T) dE.
E(3.2)
The temperature change during the adiabatic step from E^ to E^ is best determined by equat-
ing the entropy changes along a fictious path from E^ to at the temperature T^ and then
from T to T^ along the field line E^. These entropy changes are given by
dT = (3P/3T) dE.
2
(3.3)
The specific heat in an electric field is given by45
= C + T ,
I Ut2
o
E^23 P
dE, (3.4)
where CQ
is the specific heat in zero field. Equations (3.2) to (3.4) point out the fact
that the thermodynamic behavior of a dielectric material can be determined entirely from
CQ
(T) and P(T,E). This fact can be visualized by considering the entropy in figure 1 as a
surface in (T, E) space. The entropy at a point (T^, E^) is found by integrating (3.1) from
(0, 0) where S=0. One may choose any integration path, but the path considered at the
moment follows the E=0 plane from T=0 to T=T^ and then along the T plane from E=0 to E=E1
-
Each of the two segments of the path use only one of the terms in eq. (3.1) because first
the field is held constant and then the temperature is held constant. The total entropy is
then given as
S(T1,E
1)=
1 c„^dT +T
0
3P
3TjdE
T1# E
36

The dielectric constant e of a dielectric is given as e
tion can be derived from the dielectric constant by the expression
(3P/3E)T
so that the polariza-
P(T,E) = e K' (T ,E
' ) dE 1 + P(T,0) , (3.5)
where eQ
is the dielectric constant of free space and K 1 is the relative dielectric con-
stant. The last term accounts for any remanent polarization in the material. A material
with any remanent polarization is normally referred to as a pyroelectric. If the direction
of polarization can be reversed, then it is called a ferroelectric. Dielectric absorption,
or the storage of charges, can also make a contribution to any measured remanent polariza-
tion. In addition, at low temperatures there may be some very long dipole relaxation times
which can given rise to a measured remanent polarization. These last two contributions were
not considered at the beginning of this program. Much has been learned about the charge
storage and relaxation mechanisms during this project, but there still remains much to be
learned. The presence of a remanent polarization usually implies irrversibility in P(T,E).
Therefore, P(T,E) would no longer be a state function from which other thermodynamic pro-
perties could be derived. Irreversibility in P(T,E) would also give rise to hysteretic
heating.
The temperature-entropy diagram of a dielectric material can also be determined en-
tirely from specific heat measurements without recourse to polarization measurements. This
can be done by choosing the integration path for eq. (3.1) to be first along the T=0 plane
In that case the totalx " i
entropy is given as
from E=0 to E=E^ and then along the E^ plane from T=0 to T=T1<
S(T1,E
1)=
•El r 3p'
3TdE +
E,T=0
Tl
CE.
dT,
which must be the same as that derived from any other path. The third law of thermodynamics
requires S=0 at T=0, so the first term for S(T, ,E,) must be zero, i.e., (3P/3T)„ = 0 at T=0.11 &
The entropy in any electric field is then simply given as
S(T,E) =
T crrr dT'
0(3.6)
To use this type of expression for the entropy requires measurements of the specific heat in
electric fields down to temperatures much less than T^ in figure 1. In that case, the
uncertainty in the entropy due to the extrapolation of the specific heat down to 0 K is
usually negligible. Equation 3.6 includes the lattice entropy, so that field-induced entropy
changes small compared with the lattice entropy would be difficult to detect from eq. (3.6).
Because of that reason and because specific measurements are time-consuming, polarization
measurements were used more often in this work to find AS upon a field change via eq. (3.2).
The uncertainty in AS determined from 3P/3T is unaffected by the size of the lattice entropy
37

Large entropy changes upon a change in the field will occur at temperatures not too far
removed from a transition. The entropy curves shown in figure 1 are indicative of a zero
field transition near T^. Such a transition in a dielectric could be associated with a
change from a ferroelectric or antiferroelectric state to the paraelectric state. The
minimum entropy change required at T^ can be roughly estimated. In going from T^ to T^ in
figure 1, the dielectric material must be able to cool itself as well as metallic heat
conductors and any inactive dielectric. If we assume that the metallic parts and the inac-
tive dielectric occupy about 10% of the total volume of the refrigeration material, then the3
entropy change in the active dxelectric would be on the order of 1 mJ/K cm in cooling down
the other materials from 15 K to 4 K. The lattice entropy at 15 K of the active dielectric
would also be about 1 mJ/K cm^. Therefore, the entropy available at T needs to be somewhat3
larger than 2 mJ/K cm if any isothermal refrigeration is to be performed. In terms of the-2
gas constant we require > 10 R. If the cool-down from 15 K to 4 K is to be done in a
regenerative mode or in several stages instead of one, then the entropy at 4 K can be smaller-2 3
than 10 R. Since the lattice specific heat of the dielectric material increases as T , the
upper limit of refrigeration cannot be much above 15 K.
3.1.2. Criteria for materials selection
The previous section established the thermodynamic groundwork upon which criteria were
established for selecting materials to try for electrocaloric cooling effects. It should be
mentioned at this point that much was learned during the course of this project in regard to
the criteria for selection of materials. For instance the original set of criteria was not
adequate and the material (SrTiO^ glass-ceramics) originally chosen turned out to be
unsatisfactory
.
Originally it was thought that the P(T,0) term in eq. (3.5) would be zero or negligibly
small for a paraelectric or antiferroelectric material. In that case the dielectric con-
stant could be used to find P(T,E) and the related thermodynamic properties. From eq. (3.1)
it is evident that large refrigeration effects require a large 3K'/9T. The original set of
criteria then consisted of the following points: (1) a large zero field 9K'/3T in the 4-15
K temperature range, (2) the term 9K'/9T must remain sufficiently high up to the maximum
field to be used, (3) a high breakdown strength to provide wide limits of integration in eq.
(3.2), (4) negligible hysteresis in K' (T,E) , and (5) the phonon-dipole relaxation time be
much less than 1 s. Experimental results before the program began on research samples and
on small plant manufactured samples of SrTiO^ glass-ceramics indicated that all these con-
ditions could be met. However, only the plant-manufactured multiple layer samples could
give the high breakdown strengths. Considerable effort was then put into making large2
(about 5 cm area) multilayer samples with process variable that maximized both 9K'/9T
at zero field and the 4 K breakdown strength.
After it was found that cooling effects did not exist at 4 K in the SrTiO^ glass ceram-
ics, measurements of the DC polarization were made on these samples. These measurements
showed a relatively large P(T,0) term in the total polarization. The resulting temperature
dependence of this total polarization turned out to be considerably different from that
derived from the dielectric constant at ac frequencies greater than 100 Hz. The dc
38

polarization showed zero temperature dependence at 4 K in the SrTiO^ glass-ceramics, consis-
tent with the electrocaloric measurements. A negative slope in P vs T did occur in the 10-
15 K temperature range and some cooling effects were observed there.
Several variations in the SrTiO^ glass-ceramics were then tried to try to understand
the origin of the remanent polarization. These variations included changing the crystalliza-
tion temperature, which changes the SrTiO^ crystallite size and changing the composition of
the glass phase. It was felt that these variations would determine if the remanent polariza-
tion came from the glass phase or the SrTiO^.
We also decided to measure the DC polarization and the electrocaloric effect in several
other candidate materials. The hope was to find a material with a large enough 8P/3T at
4 K to make an effective refrigerator. The study of the other materials would also allow
us to obtain a more general understanding of the behavior of dielectrics in an electric
field. In general, the alternate materials chosen had high dielectric constants which
showed a temperature dependence near 4 K. Several of the materials chosen were reported in
the literature to have a transition to either the ferroelectric or antiferroelectric state
in the vicinity of the 4-15 K temperature range. Various solid solutions in SrTiO^ and
KTaO^ were tried in the hopes that such solutions may lower the temperature at which the dc
polarization still shows a temperature dependence.
3.2. Previous Work
4The first measurements of the electrocaloric effect were done in 1930, only four
46years after the first measurements of the magnetocaloric effect. The magnetocaloric
effect was utilized for adiabatic demagnetization below 1 K within a few years after the
first measurements. However, further work on electrocaloric effect was not done until some
twenty years later, probably because so little was known at that time of the dielectric
behavior of materials. After the ferroelectric state was better understood, several more
:ic
48
47measurements of the electrocaloric effect were made on such materials. The electrocaloric
measurements on these ferroelectric materials were all done near room temperature. Granicher
first suggested the use of SrTiC>3
for electrocaloric cooling at low temperatures. His
suggestion was based on his dielectric constant measurements of SrTiO^. This material has
a large negative temperature derivative around 20 K even though it does not become ferro-
49electric. At 3 K and below the dielectric constant of SrTiC>
3is independent of tempera-
ture. That behavior is consistent with Barrett's theory50
and means that no transition to
the ferroelectric state occurs.
Hegenbarth51
was the first to make electrocaloric effect measurements on SrTiC^,
which in that case were ceramic samples. With an electric field of 8 kV/cm, he saw adiabatic
depolarization cooling of 6 mK at 78 K and 60 mK cooling at 17.5 K. Somewhat larger effects
52 53were seen in later measurements ' on single crystal SrTiC>
3, but these cooling effects
disappeared below about 4-5 K. The temperature changes observed in the single crystal
SrTiO were in reasonable agreement with values calculated from the specific heat and the
52 54observed dielectric constant versus temperature and electric field. ' The uncertainty
in the calculation was dominated by that of the specific heat, since no accurate specific
heat data existed in the liquid helium temperature range.
39

Electrocaloric cooling at still lower temperatures was first demonstrated in OH doped
KC1 by three independent investigations.55 57
Cooling to 0.36 K from a starting temperature
of 1.3 K was reported.57
Various theoretical studies^5 ' 58 and experimental investigations
59 '^0
on other doped alkali halides followed shortly. Cooling to as low as 0.05 K was demonstrated60 61
in CN doped RbCl. Electrocaloric refrigeration using KC1:0H has been used for ther-
mostating crystals below 1 K while they were being radiated with short light pulses. Patents
have been issued^2 ' 63 for electrocaloric refrigeration with doped alkali halides as the
refrigerant.
Of all the materials studied previously, none showed large enough electrocaloric effects
to be useful as a refrigerator in the 4-15 K temperature range. The doped alkali halides
appear to be quite powerful for temperatures below 1 K. However, because of the very low20 21 3
ordering temperature and the limit of about 10 -10 impurities per cm , these materials
have only very small cooling effects in the 4-15 K range. The studies on SrTiO^ (single
crystal and ceramic) indicate that material is better suited for cooling at higher tempera-
tures than the doped alkali halides. Unfortunately it tends to order at too high a tempera-
ture so that almost no cooling is available at 4 K. Development of a practical 4 K electro-
caloric refrigerator was then dependent upon the discovery of a more suitable material.
3.3. SrTiO^ Glass-Ceramic Research Samples
3.3.1. Dielectric properties
A new class of dielectric materials were discovered recently by one of the authors6
(WNL) . The dielectric properties of these materials in the 1-20 K temperature range appeared
ideal for an electrocaloric refrigerator operating in this temperature range. A patent"*"0was
issued for an electrocaloric refrigerator utilizing such materials. These new dielectric
materials are the SrTiO^ glass-ceramics. The useful glass-ceramics are select compositions
in the SrO-Ti02-Nb
20,.-Al202-Si02 system, where the Al
20^-Si02 component is the glass phase.
The initial work on these materials was done with bulk material ground down into thin sheets.
The field of the glass chemistry of crystallized glasses has grown steadily following the64
work of Stookey at the Corning Research Laboratory, and the reader is referred to the
literature^'55
for a detailed account of the preparation of these materials. In brief,
crystals of SrTiO^ about 5-10 ym in size are grown in situ at about 50 volume percent in an
alumino-silicate glass matrix at temperatures near and above 900°C
The SrTi03glass-ceramics exhibit large changes in the dielectric constant with respect
to temperature below 20 K, as shown in figure 17. For some research samples 3K'/3T was as
high as 25 K . The positive value of 3K'/3T at low temperatures is in marked contrast to49 54 66-69
that found in single crystal SrTiO^/ ' ' which has only a negative derivative. The
dielectric constant in figure 17 follows a Curie-Weiss law from room temperature down to
approximately the temperature of the peak at 33 K. The loss tangent (tan 6) has a maximum at
20 K. The lattice parameter data from the two diffraction lines shown in figure 17 were
identical above 77 K but showed a splitting at and below 50. This structural transformation
was tentatively identified as cubic-*tetragonal, but the data were too limited to determine
the c/a ratio. Measurements of the loss tangent as a function of frequency indicated the
dipole-lattice relaxation times were much less than 1 second.
40
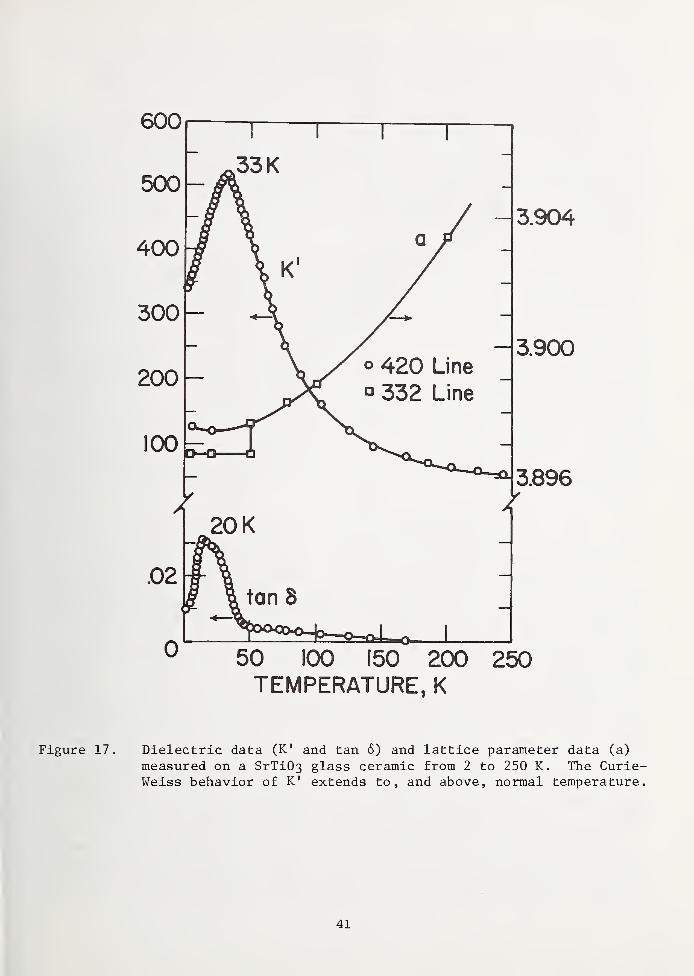
400
3.904
3.900
3.896
50 100 150 200 250TEMPERATURE, K
Figure 17. Dielectric data (K' and tan 6) and lattice parameter data (a)
measured on a SrTiU3 glass ceramic from 2 to 250 K. The Curie-
Weiss behavior of K' extends to, and above, normal temperature,
41
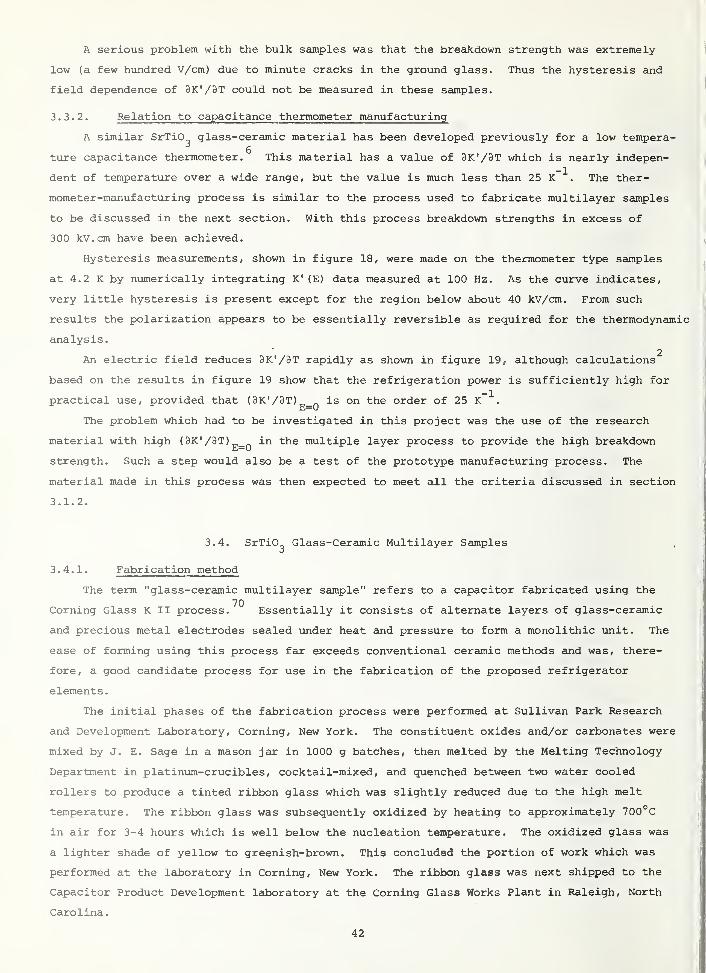
A serious problem with the bulk samples was that the breakdown strength was extremely
low (a few hundred V/cm) due to minute cracks in the ground glass. Thus the hysteresis and
field dependence of 9K'/3T could not be measured in these samples.
3.3.2. Relation to capacitance thermometer manufacturing
A similar SrTiO glass-ceramic material has been developed previously for a low tempera-6
ture capacitance thermometer. This material has a value of 3K'/<)T which is nearly indepen-
dent of temperature over a wide range, but the value is much less than 25 K \ The ther-
mometer-manufacturing process is similar to the process used to fabricate multilayer samples
to be discussed in the next section. With this process breakdown strengths in excess of
300 kV.cm have been achieved.
Hysteresis measurements, shown in figure 18, were made on the thermometer type samples
at 4.2 K by numerically integrating K' (E) data measured at 100 Hz. As the curve indicates,
very little hysteresis is present except for the region below about 40 kV/cm. From such
results the polarization appears to be essentially reversible as required for the thermodynamic
analysis.2
An electric field reduces 3K'/9T rapidly as shown in figure 19, although calculations
based on the results in figure 19 show that the refrigeration power is sufficiently high for
practical use, provided that OK'/3T) i s on the order of 25 K ^
.
E—
0
The problem which had to be investigated in this project was the use of the research
material with high (9K'/3T) in the multiple layer process to provide the high breakdownE—
U
strength. Such a step would also be a test of the prototype manufacturing process. The
material made in this process was then expected to meet all the criteria discussed in section
3.1.2.
3.4. SrTi03Glass-Ceramic Multilayer Samples
3.4.1. Fabrication method
The term "glass-ceramic multilayer sample" refers to a capacitor fabricated using the
Corning Glass K II process. Essentially it consists of alternate layers of glass-ceramic
and precious metal electrodes sealed under heat and pressure to form a monolithic unit. The
ease of forming using this process far exceeds conventional ceramic methods and was, there-
fore, a good candidate process for use in the fabrication of the proposed refrigerator
elements.
The initial phases of the fabrication process were performed at Sullivan Park Research
and Development Laboratory, Corning, New York. The constituent oxides and/or carbonates were
mixed by J. E. Sage in a mason jar in 1000 g batches, then melted by the Melting Technology
Department in platinum-crucibles, cocktail-mixed, and quenched between two water cooled
rollers to produce a tinted ribbon glass which was slightly reduced due to the high melt
temperature. The ribbon glass was subsequently oxidized by heating to approximately 700°C
in air for 3-4 hours which is well below the nucleation temperature. The oxidized glass was
a lighter shade of yellow to greenish-brown. This concluded the portion of work which was
performed at the laboratory in Corning, New York. The ribbon glass was next shipped to the
Capacitor Product Development laboratory at the Corning Glass Works Plant in Raleigh, North
Carolina.
42

0 100 200 300
E. kV/cm
Figure 18. Polarization vs. electric field at 4,2 K for SrTi03 glass-ceramic
from integration of dielectric constant data.
43

0 50 100 150
FIELD STRENGTH, kV/cm
Figure 19. Empirical dependence of 9K'/3T on field strength for three glass-ceramics, 2 < T < 6 K. The solid curve through the points is a
plot of the g(E) function shown. Samples cerammed at threedifferent temperatures were measured.
44

The work in Raleigh was performed by A. J. Morrow, R. P. Ruddock, and W. D. Claborn.
The first step was to grind the ribbon glass in water in a 1.33 gallon carburundum ball mill
with Al2°3
cylindrical media. A grind of 44 hours at 60 rpm reduced the glass to a particle
size of 2.75 ym. It was dried overnight, mixed with an aqueous binder system, and ball
milled for 4 more hours. The resulting slurry was de-aired for 16 hours and cast into a thin
film which, when fired, was approximately 28 ym thick.
In order to produce capacitors, a wet stacking method was used in which the electrodes
are screened onto the dielectric film. The screen is shifted after each application to
effectively produce several capacitors in parallel. The electrode metals used are listed in
table 3.
TABLE 3
Manufacturer 1 s
Number
Electrode Metal Compositions3
Weight Percent
Pt Au Pd Vehicle
A-2664 4.5 42 13.5 40
A-2860 49 12 — 39
9545b
48 12 — 40
A-2721 — 45 15 40
All inks manufacturered and composition information supplied by
Engelhard Industries, 1 W. Central Avenue, E. Newark, New Jersey.
A different (and less satisfactory) vehicle was used for this ink.
A-2664, Pd-Pt-Au, was used as a standard metal throughout most of the work. Normally, 8
weight percent glass frit was added to the paste using a 3 roll mill. The geometry of the
samples for this project was limited in large part by the screening operation. Since an 11.5
x 11.5 cm area is the maximum practical area which can be screened, the maximum sample which
could be made would be approximately 10 x 10 cm. This size is impractical, however, since
only one sample is produced per stack. Therefore a 1.9 x 1.9 cm sample was agreed upon which
would yield 25 samples per stack and yet give a thermally efficient volume. In the original
design (Fig. 20) a so-called "floating electrode" was inserted in the center of each effec-
tive capacitor and a generous "pullback" was allowed. It was thought that it would be possi-
ble to apply larger voltages with these modifications. In a later design, the "floating
electrode" was removed, the pullback was reduced to increase the amount of dielectric exposed
to the electric field, and the dielectric thickness was increased. The thicker dielectric
layers were made by pressing 11.5 cm squares of green film together at a pressure of 30 psi.
This procedure allowed a uniform thickness of film to be used and also made it highly
45

FIGURE 20
GLASS -CERAMIC MULTILAYER SAMPLE DIMENSIONS*
Front Cross-Section Side Cross-Section
19.43
14.13 >
2.65 1
19.30
12.54
1.56•3.38
FloatingElectrodes
ORIGINAL CONFIGURATION
19.05
17.40
-0.83-1.78
19.05
15.401.02
Floati ng
Electrodes
Configuration for
Increased Efficiency.
-19.05
17.53
0.76
No FloatingElectrodes
BOTH CONFIGURATIONS :
Glass Thickness: 0.028 mm/pieces
Electrode Thickness: 3.81 urn
ORIGINAL CONFIGURATION :
215 effective layers of 0.056 mm, 2.06 cm (15 floating layers)
NEW CONFIGURATION:
Floating: 15 eff. of 0.056 mm, 2.87 cm (15 floating layers)
.002 Type: 15 eff. of 0.056 mm, 3.05 cm
.003 Type: 10 eff. of 0.084 mm, Same area as above
.004 Type: 6 eff. of 0.112 mm, Same area as above
.006 Type: 5 eff. of 0.168 mm, Same area as above
* All measurements in millimeters.
46
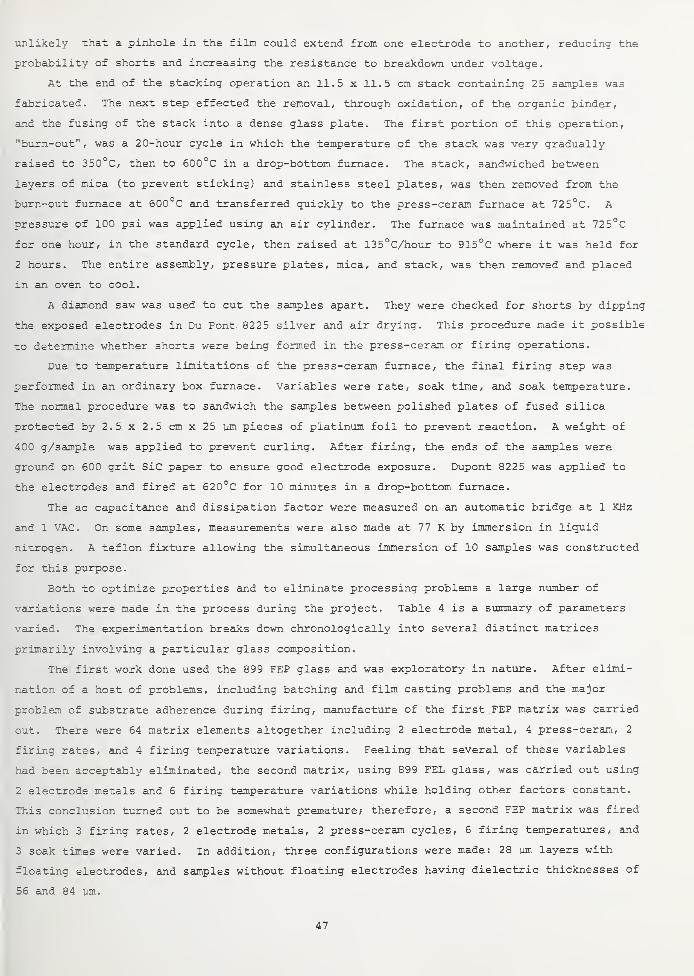
unlikely that a pinhole in the film could extend from one electrode to another, reducing the
probability of shorts and increasing the resistance to breakdown under voltage.
At the end of the stacking operation an 11.5 x 11.5 cm stack containing 25 samples was
fabricated. The next step effected the removal, through oxidation, of the organic binder,
and the fusing of the stack into a dense glass plate. The first portion of this operation,
"burn-out", was a 20-hour cycle in which the temperature of the stack was very gradually
raised to 350°C, then to 600°C in a drop-bottom furnace. The stack, sandwiched between
layers of mica (to prevent sticking) and stainless steel plates, was then removed from the
burn-out furnace at 600°C and transferred quickly to the press-ceram furnace at 725°C. A
pressure of 100 psi was applied using an air cylinder. The furnace was maintained at 725°C
for one hour, in the standard cycle, then raised at 135°C/hour to 915°C where it was held for
2 hours. The entire assembly, pressure plates, mica, and stack, was then removed and placed
in an oven to cool.
A diamond saw was used to cut the samples apart. They were checked for shorts by dipping
the exposed electrodes in Du Pont 8225 silver and air drying. This procedure made it possible
to determine whether shorts were being formed in the press-ceram or firing operations
.
Due to temperature limitations of the press-ceram furnace, the final firing step was
performed in an ordinary box furnace. Variables were rate, soak time, and soak temperature.
The normal procedure was to sandwich the samples between polished plates of fused silica
protected by 2.5 x 2.5 cmx 25 urn pieces of platinum foil to prevent reaction. A weight of
400 g/sample was applied to prevent curling. After firing, the ends of the samples were
ground on 600 grit SiC paper to ensure good electrode exposure. Dupont 8225 was applied to
the electrodes and fired at 620°C for 10 minutes in a drop-bottom furnace.
The ac capacitance and dissipation factor were measured on an automatic bridge at 1 KHz
and 1 VAC. On some samples, measurements were also made at 77 K by immersion in liquid
nitrogen. A teflon fixture allowing the simultaneous immersion of 10 samples was constructed
for this purpose.
Both to optimize properties and to eliminate processing problems a large number of
variations were made in the process during the project. Table 4 is a summary of parameters
varied. The experimentation breaks down chronologically into several distinct matrices
primarily involving a particular glass composition.
The first work done used the 899 FEP glass and was exploratory in nature. After elimi-
nation of a host of problems, including batching and film casting problems and the major
problem of substrate adherence during firing, manufacture of the first FEP matrix was carried
out. There were 64 matrix elements altogether including 2 electrode metal, 4 press-ceram, 2
firing rates, and 4 firing temperature variations. Feeling that several of these variables
had been acceptably eliminated, the second matrix, using 899 FEL glass, was carried out using
2 electrode metals and 6 firing temperature variations while holding other factors constant.
This conclusion turned out to be somewhat premature; therefore, a second FEP matrix was fired
in which 3 firing rates, 2 electrode metals, 2 press-ceram cycles, 6 firing temperatures, and
3 soak times were varied. In addition, three configurations were made: 28 um layers with
floating electrodes, and samples without floating electrodes having dielectric thicknesses of
56 and 84 um.
47

Table 4
Glass-Ceramic Multilayer Experimentation Summary
Initial Matrix: Sticking Problem Solved, 9 Samples Tested.
Glass
:
Firing Temperature:Press-Ceram:Firing Rate:Metals
:
Floating ElectrodesFiring Substrates:
899 FEP1075-1200°CSeal A (Standard)150°C/Hr. (2 Hr. Soak)A2664
Zr02
, Mica, BN, A1203 ,
Si02
, Graphite,
Platinum Foil.
FEP-1 : 132 Samples Tested.
Glass
:
Firing Temperature:Press-Ceram:
Firing Rates:Metals
:
Floating Electrodes
899 FEP1100, 1120, 1140, 1160°CSeals A, B, C, D (Variation in Soak Timeat 725°C and 915°C)100, 150°C/Hr. (2 Hr. Soak)A2664, 9545
FEL-1 Porosity Problem First Identified, 78 Samples.
Glass
:
Firing Temperature:Press-Ceram:Firing Rate:Metals
:
Floating Electrodes
FEP-2 : 209 Samples
Glass
:
Dielectric Thickness:
Firing Temperature:Firing Rate:Firing Soak Times:Metals
:
Electrode Fritting:Press-Ceram:
899 FEL1100, 1120, 1145, 1160, 1180, 1215°CC150°C/Hr. (2 Hr. Soak)A2664, 9545, A2860 (Detective)
899 FEP.001" Layers Floating Electrodes.002" Layers.003" LayersNew Artwork (Better Efficiency)1080-1200°C30, 60, 90°C/Hr.2, 8, 20 HoursA2664, A2860, A27210, 8 (Normal), 12% by WeightNormal (A) , High Pressure, Extended Pressure
FHJ-1 : Processing Matrix, Approximately 400 Samples
Glasses
:
Firing Temperature:Firing Rates:Samples
:
Burnout:Metals
:
Binder
:
Press-Ceram:
899 FHJ (Primarily), 899 FEL (Control),899 FEP1100-1200°C30, 60, 90°C/Hr. (10 Hr. Soak)Multilayer (.002"), Bulk Glass, Unelec-troded Samples, Small SamplesNormal, Extra LongA2664, A2721, A2860Aqueous, Toluene (FEP), Methacel (FEP)Capacitance Thermometer (DXO) Variations(involves application of pressure duringcycle and soak times)
AVC Suggested Variations (rates and tem-perature changes).
48

Table 4 (Continued)
FEL-2 : 75 Samples Tested.
Glass
:
Firing Temperature:
Samples
:
Metal:
899 FEL1080-1200 in 10° Increments 60°C/Hr,(10 Hr. Soak).003", .004", .006" Layers3/4", 1-3/8", 2" Square SamplesA2664
FEP-FHN : Approximately 100 Samples.
Glasses: 899 FEP and 899 FHN (Niobium-Free)Firing Temperature: 1100, 1115, 1130, 1145, 1160Samples: .003" Dielectric, A2664 Metal
60°C/Hr. (10 Hr. Soak)Press-Ceram: Low Temperature (825, 850°C Max. Temp.)
(FEP)
FHS-FID : Boroaluminosilicates , 20 Samples Tested.
Glasses: 899 FHS , 899 FID (Niobium-Free)Firing Temperature: No Fire, 1100°CSamples: .003" Dielectric, A2664 Metal.
60°C/Hr. (10 Hr. Soak)
49
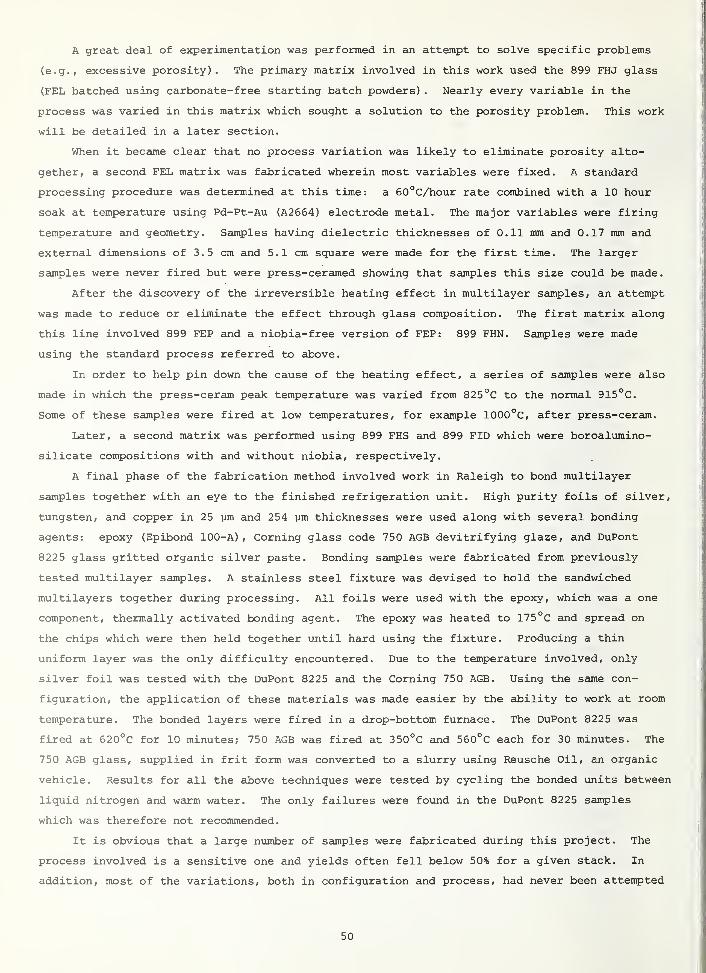
A great deal of experimentation was performed in an attempt to solve specific problems
(e.g., excessive porosity). The primary matrix involved in this work used the 899 FHJ glass
(FEL batched using carbonate-free starting batch powders) . Nearly every variable in the
process was varied in this matrix which sought a solution to the porosity problem. This work
will be detailed in a later section.
When it became clear that no process variation was likely to eliminate porosity alto-
gether, a second FEL matrix was fabricated wherein most variables were fixed. A standard
processing procedure was determined at this time: a 60°C/hour rate combined with a 10 hour
soak at temperature using Pd-Pt-Au (A2664) electrode metal. The major variables were firing
temperature and geometry. Samples having dielectric thicknesses of 0.11 mm and 0.17 mm and
external dimensions of 3.5 cm and 5.1 cm square were made for the first time. The larger
samples were never fired but were press-ceramed showing that samples this size could be made.
After the discovery of the irreversible heating effect in multilayer samples, an attempt
was made to reduce or eliminate the effect through glass composition. The first matrix along
this line involved 899 FEP and a niobia-free version of FEP: 899 FHN. Samples were made
using the standard process referred to above.
In order to help pin down the cause of the heating effect, a series of samples were also
made in which the press-ceram peak temperature was varied from 825°C to the normal 915°C.
Some of these samples were fired at low temperatures, for example 1000°C, after press-ceram.
Later, a second matrix was performed using 899 FHS and 899 FID which were boroalumino-
silicate compositions with and without niobia, respectively.
A final phase of the fabrication method involved work in Raleigh to bond multilayer
samples together with an eye to the finished refrigeration unit. High purity foils of silver,
tungsten, and copper in 25 \im and 254 ym thicknesses were used along with several bonding
agents: epoxy (Epibond 100-A) , Corning glass code 750 AGB devitrifying glaze, and DuPont
8225 glass gritted organic silver paste. Bonding samples were fabricated from previously
tested multilayer samples. A stainless steel fixture was devised to hold the sandwiched
multilayers together during processing. All foils were used with the epoxy, which was a one
component, thermally activated bonding agent. The epoxy was heated to 175°C and spread on
the chips which were then held together until hard using the fixture. Producing a thin
uniform layer was the only difficulty encountered. Due to the temperature involved, only
silver foil was tested with the DuPont 8225 and the Corning 750 AGB. Using the same con-
figuration, the application of these materials was made easier by the ability to work at room
temperature. The bonded layers were fired in a drop-bottom furnace. The DuPont 8225 was
fired at 620°C for 10 minutes; 750 AGB was fired at 350°C and 560°C each for 30 minutes. The
750 AGB glass, supplied in frit form was converted to a slurry using Reusche Oil, an organic
vehicle. Results for all the above techniques were tested by cycling the bonded units between
liquid nitrogen and warm water. The only failures were found in the DuPont 8225 samples
which was therefore not recommended.
It is obvious that a large number of samples were fabricated during this project. The
process involved is a sensitive one and yields often fell below 50% for a given stack. In
addition, most of the variations, both in configuration and process, had never been attempted
50
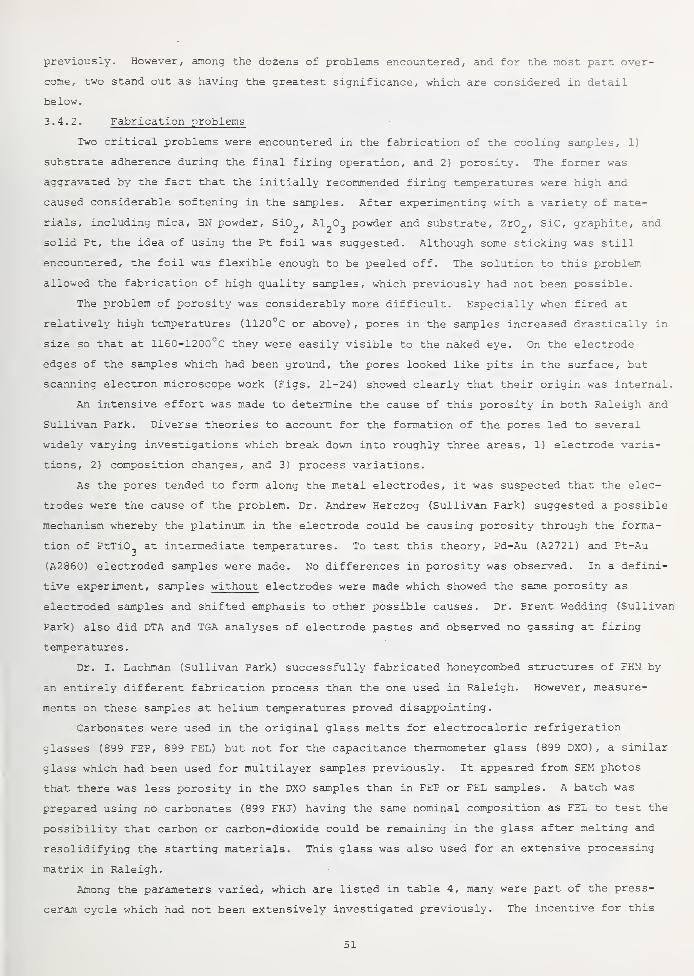
previously. However, among the dozens of problems encountered, and for the most part over-
come, two stand out as having the greatest significance, which are considered in detail
below.
3.4.2. Fabrication problems
Two critical problems were encountered in the fabrication of the cooling samples, 1)
substrate adherence during the final firing operation, and 2) porosity. The former was
aggravated by the fact that the initially recommended firing temperatures were high and
caused considerable softening in the samples. After experimenting with a variety of mate-
rials, including mica, BN powder, Si02 ,
Al2°3 Powder and substrate, ZxO^, SiC, graphite, and
solid Pt, the idea of using the Pt foil was suggested. Although some sticking was still
encountered, the foil was flexible enough to be peeled off. The solution to this problem
allowed the fabrication of high quality samples, which previously had not been possible.
The problem of porosity was considerably more difficult. Especially when fired at
relatively high temperatures (1120°C or above) , pores in the samples increased drastically in
size so that at 1160-1200°C they were easily visible to the naked eye. On the electrode
edges of the samples which had been ground, the pores looked like pits in the surface, but
scanning electron microscope work (Figs. 21-24) showed clearly that their origin was internal.
An intensive effort was made to determine the cause of this porosity in both Raleigh and
Sullivan Park. Diverse theories to account for the formation of the pores led to several
widely varying investigations which break down into roughly three areas, 1) electrode varia-
tions, 2) composition changes, and 3) process variations.
As the pores tended to form along the metal electrodes , it was suspected that the elec-
trodes were the cause of the problem. Dr. Andrew Herczog (Sullivan Park) suggested a possible
mechanism whereby the platinum in the electrode could be causing porosity through the forma-
tion of PtTiO^ at intermediate temperatures. To test this theory, Pd-Au (A2721) and Pt-Au
(A2860) electroded samples were made. No differences in porosity was observed. In a defini-
tive experiment, samples without electrodes were made which showed the same porosity as
electroded samples and shifted emphasis to other possible causes. Dr. Brent Wedding (Sullivan
Park) also did DTA and TGA analyses of electrode pastes and observed no gassing at firing
temperatures
.
Dr. I. Lachman (Sullivan Park) successfully fabricated honeycombed structures of FHN by
an entirely different fabrication process than the one used in Raleigh. However, measure-
ments on these samples at helium temperatures proved disappointing.
Carbonates were used in the original glass melts for electrocaloric refrigeration
glasses (899 FEP, 899 FEL) but not for the capacitance thermometer glass (899 DXO) , a similar
glass which had been used for multilayer samples previously. It appeared from SEM photos
that there was less porosity in the DXO samples than in FEP or FEL samples. A batch was
prepared using no carbonates (899 FHJ) having the same nominal composition as FEL to test the
possibility that carbon or carbon-dioxide could be remaining in the glass after melting and
resolidifying the starting materials. This glass was also used for an extensive processing
matrix in Raleigh.
Among the parameters varied, which are listed in table 4, many were part of the press-
ceram cycle which had not been extensively investigated previously. The incentive for this
31

Xoooo
U)o
I
03
w03
rHSO
J-l
CD
od
rH•HUrH
0
PhH•
Ua> o<3> O00 ro
rHcd r-f
o a
CD
bfl OT3 OCD rH
XooCM
U0oorH
CD
rC
<H T3o a)
co 6M cfl
a r-l
co cd
>-( aooor-l
a•H0
eou
O cd
CD r-l
rH 01
a
CD
U
60H
52

Xro
HOCN
u0ooHH
I
01
CO
CO
i—
I
00
uCD
>,CO
3=
cc
o •
uCD 0iC—
— 3_ —
XrH
U3
u)ooHH
J=-
- ^s- a60c -i_ —
- -—
CNCN
CU
Uztz
•H
53

XCMCOCMCM
UDoCO
XCOCMCM
uooCO
I
CO
CD
03
I—
I
00
uQJ
03
w
o>ON00
0!
M-4
O
QJ ©bO O
CO01 H
iH01
UU cd
4-1
O QJ
CO
4=a i-t
cd QJ
>-i O00o QJ
s-l iHa•H e6 (0
CO
Co a}-< •Hu ea 03
QJ J-J
QJ
w O
COCN
QJ
H=1
oo•H
54

XmoCN
UDooCN
I
to
CO
00
u
CtJ
wp*<
o>ON00
cd
4-1
o •
u(1) oM OT3 OCD CN
XoCN
uDooCN
<+-l T3O D
CO £X cfl
CL ^03 <D
j-i aooO Q)
S-i ^-i
CJ CX•H Ee co
CO
co
uCJ
QJ
CJ
•H6ctj
Ucu
W CJ
CM
Q)
U
00•H
55

research was the observation that DXO produced lower porosity samples than did FHJ. Aside
from a slight difference in composition, the major difference in the processing of this glass
involved the application of pressure and soak times in the press-ceram cycle. Samples of FHJ
produced using the so-called "DXO Cycle" did in fact produce lower porosity samples than
those produced using the so-called "ECR Cycle" described previously. However, these samples
exhibited no capacitance; the electrodes were apparently discontinuous. A search to repro-
duce the low porosity effect without loss of capacitance was performed by exhaustively
varying all differences between the two cycles. The result was that all variations produced
higher porosity chips with capacitance.
Also involved in the processing matrix was a change in binder system. FEP glass was
used and a slurry was developed using a toluene base. The resulting samples showed increased
porosity compared to the normal aqueous batch.
In a third approach, 152 pm sheets of glass 1.27 cm square were fabricated from solid
glass at Sullivan Park by John Sage. Platinum electrodes were sputtered onto both sides of
the squares in the typical pullback configuration. In Raleigh, each square was sandwiched
between two layers of cover glass and 3 samples were press-ceramed at approximately normal
pressure using the standard press-ceram furnace. The resulting samples, which were elec-
trically satisfactory after press-ceram, lost capacitance during the final firing. Apparent-
ly the thickness of the platinum was not sufficient to maintain continuity at elevated tem-
peratures. By the time this experiment had been completed, the irreversible heating effect
was discovered by Dr. Lawless in Boulder. It was therefore not repeated using thicker
electrodes.
Other variations in the process were suggested by work done in Sullivan Park by R. J.
Colegrove using the Automatic Viscosity Control (AVC) furnace. The rate of increase in
temperature in this device is controlled by a feedback loop to the viscosity of a piece of
sample glass in the furnace. A minimum limit of viscosity can be maintained using this
system. It was discovered that significant crystallization occurred at 960°C, above the
final press-ceram temperature. Therefore, a new press-ceram cycle was devised having 960°C
as its upper limit. No improvement was observed in Raleigh samples using this cycle.
Several samples fired under viscosity control appeared less porous than average and were
measured, however.
Chips without electrodes were made from FHJ and showed the same porosity as FEL. This
eliminated the possibility that the carbonates were causing the problems. Despite the fact
that blisters formed on the surface of samples during firing were shown to be carbon dioxide
by Dr. Hans Holland at Sullivan Park using mass spectragraphic analysis, no evidence of
carbon could be found in the unfired chips.
It is evident from the above that a considerable amount of effort was devoted to solving
the fabrication problems associated with making these larger samples, an effort which in-
volved manpower and resources at Corning Glass works in excess of what the contract called
for.
In the final analysis, undeniable progress was made in learning how to make these sam-
ples, which involved temperature ranges, composition fields, and plate sizes previously not
attempted
.
56
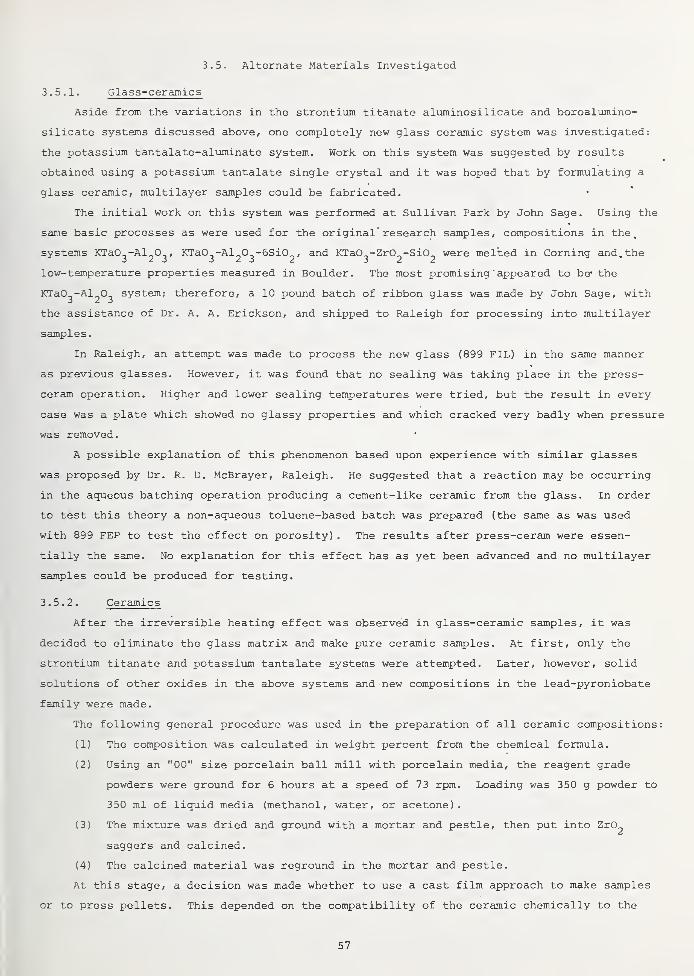
3.5. Alternate Materials Investigated
3.5.1. Glass-ceramics
Aside from the variations in the strontium titanate aluminosilicate and boroalumino-
silicate systems discussed above, one completely new glass ceramic system was investigated:
the potassium tantalate-aluminate system. Work on this system was suggested by results
obtained using a potassium tantalate single crystal and it was hoped that by formulating a
glass ceramic, multilayer samples could be fabricated.
The initial work on this system was performed at Sullivan Park by John Sage. Using the
same basic processes as were used for the original research samples, compositions in the.
systems KTa03-Al
2C>3 ,
KTa03-Al
2C>
3-6Si0
2, and KTa0
3-ZrC>
2-Si0
2were melted in Corning and. the
low-temperature properties measured in Boulder. The most promising ' appeared to be* the
KTaC>3-Al
203
system; therefore, a 10 pound batch of ribbon glass was made by John Sage, with
the assistance of Dr. A. A. Erickson, and shipped to Raleigh for processing into multilayer
samples.
In Raleigh, an attempt was made to process the new glass (899 FIL) in the same manner
as previous glasses. However, it was found that no sealing was taking place in the press-
ceram operation. Higher and lower sealing temperatures were tried, buc the result in every
case was a plate which showed no glassy properties and which cracked very badly when pressure
was removed.
A possible explanation of this phenomenon based upon experience with similar glasses
was proposed by Dr. R. D. McBrayer, Raleigh. He suggested that a reaction may be occurring
in the aqueous batching operation producing a cement-like ceramic from the glass. In order
to test this theory a non-aqueous toluene-based batch was prepared (the same as was used
with 899 FEP to test the effect on porosity) . The results after press-ceram were essen-
tially the same. No explanation for this effect has as yet been advanced and no multilayer
samples could be produced for testing.
3.5.2. Ceramics
After the irreversible heating effect was observed in glass-ceramic samples, it was
decided to eliminate the glass matrix and make pure ceramic samples. At first, only the
strontium titanate and potassium tantalate systems were attempted. Later, however, solid
solutions of other oxides in the above systems and new compositions in the lead-pyroniobate
family were made.
The following general procedure was used in the preparation of all ceramic compositions:
(1) The composition was calculated in weight percent from the chemical formula.
(2) Using an "00" size porcelain ball mill with porcelain media, the reagent grade
powders were ground for 6 hours at a speed of 73 rpm. Loading was 350 g powder to
350 ml of liquid media (methanol, water, or acetone).
(3) The mixture was dried and ground with a mortar and pestle, then put into Zr02
saggers and calcined.
(4) The calcined material was reground in the mortar and pestle.
At this stage, a decision was made whether to use a cast film approach to make samples
or to press pellets. This depended on the compatibility of the ceramic chemically to the
57
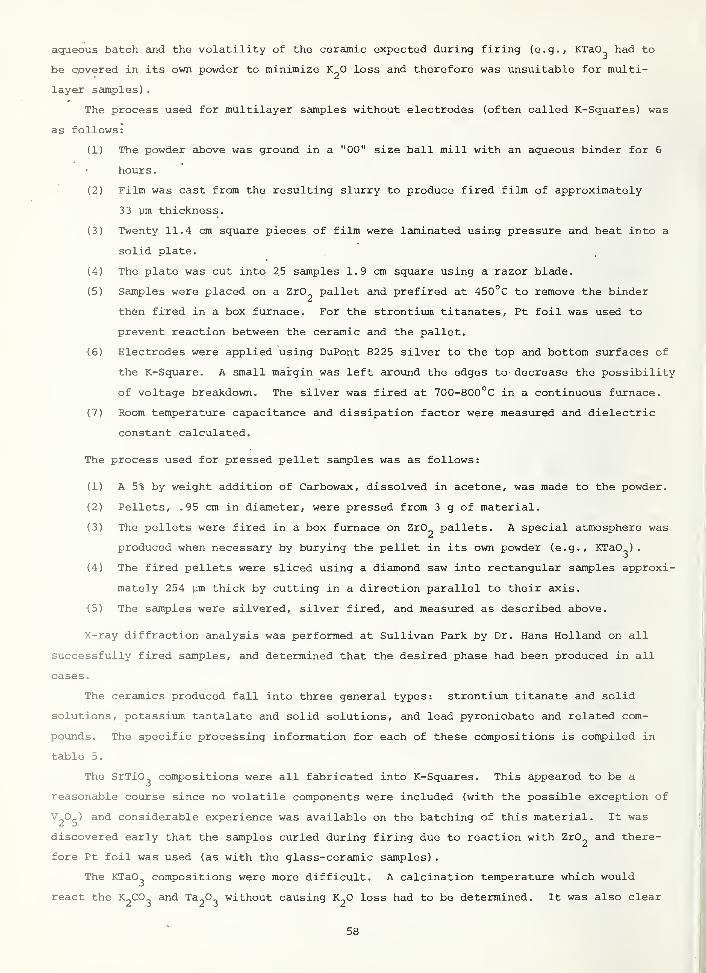
aqueous batch and the volatility of the ceramic expected during firing (e.g., KTaO^ had to
be covered in its own powder to minimize K^O loss and therefore was unsuitable for multi-
layer samples)
.
The process used for multilayer samples without electrodes (often called K-Squares) was
as follows:
(1) The powder above was ground in a "00" size ball mill with an aqueous binder for 6
hours.
(2) Film was cast from the resulting slurry to produce fired film of approximately
33 pm thickness.
(3) Twenty 11.4 cm square pieces of film were laminated using pressure and heat into a
solid plate.
(4) The plate was cut into 2.5 samples 1.9 cm square using a razor blade.
(5) Samples were placed on a ZrO^ pallet and prefired at 450°C to remove the binder
then fired in a box furnace. For the strontium titanates, Pt foil was used to
prevent reaction between the ceramic and the pallet.
(6) Electrodes were applied using DuPont 8225 silver to the top and bottom surfaces of
the K-Square. A small margin was left around the edges to decrease the possibility
of voltage breakdown. The silver was fired at 700-800°C in a continuous furnace.
(7) Room temperature capacitance and dissipation factor were measured and dielectric
constant calculated.
The process used for pressed pellet samples was as follows:
(1) A 5% by weight addition of Carbowax, dissolved in acetone, was made to the powder.
(2) Pellets, .95 cm in diameter, were pressed from 3 g of material.
(3) The pellets were fired in a box furnace on ZrC>2pallets. A special atmosphere was
produced when necessary by burying the pellet in its own powder (e.g., KTaO^)
.
(4) The fired pellets were sliced using a diamond saw into rectangular samples approxi-
mately 254 ym thick by cutting in a direction parallel to their axis.
(5) The samples were silvered, silver fired, and measured as described above.
X-ray diffraction analysis was performed at Sullivan Park by Dr. Hans Holland on all
successfully fired samples, and determined that the desired phase had been produced in all
cases
.
The ceramics produced fall into three general types : strontium titanate and solid
solutions, potassium tantalate and solid solutions, and lead pyroniobate and related com-
pounds. The specific processing information for each of these compositions is compiled in
table 5.
The SrTiO^ compositions were all fabricated into K-Squares. This appeared to be a
reasonable course since no volatile components were included (with the possible exception of
V^Oj.) and considerable experience was available on the batching of this material. It was
discovered early that the samples curled during firing due to reaction with Zr02
and there-
fore Pt foil was used (as with the glass-ceramic samples)
.
The KTaO^ compositions were more difficult. A calcination temperature which would
react the K2C0
3and Ta
2C>3without causing K
20 loss had to be determined. It was also clear
58

COMMENTS
Reacted
with
ZrO
pallet.
2
Only
1450°C
firing
was
densely
sintered
.
Curled
during
firing
.
Analyzed
as
solid
solution
.
FIRING CONDITION
4-> +J
0) C Or-l O rHrH rHIXI rH (TJ
Pi -H PiO
CN fci CNO OiH -U Uta Pi n
+>
C CU
O rHrH
rH (TJ
•H piOfa CN
O-P uCu N
-pC 0)
O rHrH
rH (TJ
•H Ol0fa CN
o4J UCU N
-PC CO
O -HrH
rH (TJ
•H Pi0fa CN
O-P UCu N Pt
Foil
On
Zr0
2
Pallet
Pt
Foil
On
Zr0
2
Pallet
FIRING TEMPERATURES
U —0 Uo Einm cnrH »»
U U UX X ECN CN CN
u u u0 0 0o o oin o inIn *TrH rH rH
1450°C
(2
Hr)
O ~0 HO Ein*3" CNH
CJ0 HO EmTf CNrH «—
u ->0 uO EinT (N<H •-»
TEST CONFIGURATION
K-Squares K-Squares K-Squares K-Squares K-Squares K-Squares
CALCINE TEMPERATURE
Pre-Calcined Pre-Calcined
1200°C
12
Hrs
1200°C
12
Hrs
1200°C
12
Hrs
12
00°C
12
Hrs
GRINDING MEDIUM
|
Pre-Ground Pre-Ground
oCNB
oCNE
oCN
E
oCN
X
COMPONENTS
Wt.
%
TAM
505
Commercial
Grade TAM
854
CP.
Grade
rH
vo in
i mm i
O CN
CJ OIH *HCO Eh
CNCn Cr>
CN • •
r4 lf>
1 ro |
en | inO (NOCJ O CNM -H X)CO Eh 2
in o>\o
Ch . rHin 03 rH
1 CN 1m | inO CN oCJ O CNU -H X)tO Eh 2
f~ o. n .
VO • COin in rH
1 CN 1
m i mO CN OCJ O CNU -H XICO H 2
INTENDED COMPOSITION
mo•HEh
Hto
no-HHSh
CO
to
o•HEh
CO
1
tnn oo XI•H 2Eh JfrH IH
CO CO(Xl rH
O O
L nro o
o X!-H 2Eh JfU )H
CO CO00 CN
o o
1
com oo XI•H 2Eh Jo-
in UCO tor— ei
o o
LOTNUMBER
ST-1 ST-2 ST-3
STN
(10)
-1
STN
(20)
-1
STN
(30)
-1
59

COMMENTS
Both
firings
too
low.Over
calcined.
Over
calcined.
1350°C
firing
optimum.
FIRING CONDITION
-p
C <D
O rHrH
rH rg
•h en0fci CM
oP uPh N
i
i
I
pC 0)
O rHrH
rH rd
•HOCh ro
oP uPh CSJ
i
|
Pt
Foil
On
Zr0
2
Pallet
-p
c ai
O rHrH
rH Id
•H Pn0Cn CM
o•P uPn tsj
FIRING TEMPERATURES
1450°C
(2
Hr)
1500°C
(4
Hr)i
i
U —0 uo Kinro rHrH »»
i
i
i
u -»o uo ainro rHrH »-
1350°C
(2
Hr)
1450°C
(2
Hr)
TEST CONFIGURATION
K-Squares
i
i
i
K-Squares
i
i
K-Squares K-Squares
CALCINE TEMPERATURE
1200°C
12
Hrs
RepeatedTwice
o wo uO ECO(N (NrH rH
1000°C
6
Hrs
1200°C
12
Hrs.
1000°C
6
Hrs
1100°C
6
Hrs
GRINDING MEDIUM Methanol
Acetone
Methanol
Acetone
Methanol Methanol
COMPONENTS
Wt.
%in cn
. .
to H1 ro 1
ro i inO (NOCJ O (NM -H X)CO E-i Z
>*in
ro . rHvo fN .
1 roro I Io oj in
U o oU -H (NCO Eh >
inro • rHId (N
1 ro u-ro I I
o (N in
U o oM -H CNCO Eh >
00• r-
rH . inVO CTl
1 (N 00ro 1 1
o cn inC_> o oU -H CNCO Eh >
00
rH • inVO <T\ '
1 CN 00ro I Io cn in
CJ O OU -H (NCO Eh >
VD. VOT . 00vo *r •
1 ro oro 1 1o cm inU o oU -H CMCO Eh >
INTENDED COMPOSITION
I roro oo XI-H 2EH JT"
H MCO CO00 (Ncn oo o
1.
ro roo o•H >Eh JCU UCO COCTl rH
O O
1
ro mo o•H >Eh JfH HCO COCTl rH
o o
1
ro roo oH >H -)C
U Uco co00 CN
O O
1
ro roO O•H >Eh JfU UCO CO00 CN
o o
1
ro roO O•H >Eh JCU UCO CO00 CNCTv OO O
LOTNUMBER
STN
(2)
-1
STV(10)-1 STV
(10)
-2
STV(20)-1 STV
(20)
-2
STV
(2)
-1
1
60
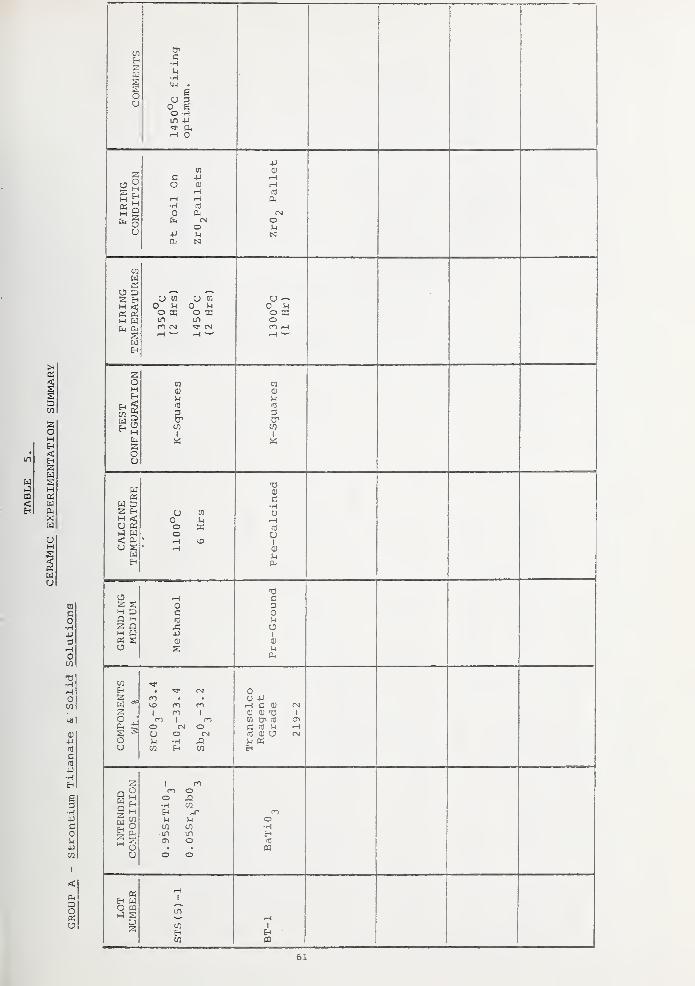
CJ*
-H
u 30 ea •Hin +J
OirH 0
«
W2OMH<
in Eh
2W
w SJ H
OSW
IS GjXwuM
Hu
<D
id
cm
u °
M QV. z
tn <u
c 4J rHo cu rH
i-i ns
rH rH 0<tH IC
0 <N(N OO M
-U 14 NN
u M u m0 n 0o sc o =in IT)
n >* CNrH H
O CQH 0)Eh
(H
Eh id
W 3aEh
IGLcrwi
2
CJ —0 MO Sof-0 rH
w(U
iH
<0
3cr
u CO
o MoorHH
2 QrH CJ
oerd
cu
E
<u
c•HorH
ui
0)
H
2
M ou
noX!CO
uCOin
OU 4J
rH C CU
CD CD TJ10 C7> rd
c « nra CD UM KEh
CNI
61

OjEh
W
o•J
Q
w«
2 EhM rtj
ft KH Wft ft
aWH
t7>
c TJ TJH O QJ QJ
Sh P w JH in TJ u w TJ•H rd • *H 3 0) H 3 QJ
m CD QJ 0 IM o p M-( 0 Pw p QJ rH P P rH )H •H U U rH-P >i <HJ rd rH 1 TJ Tj QJ 0 0) QJ O QJ
h XI M -H Eh M M TJ ft TJ ft a3 Jh 4h ^ C Cui TJ QJ M M M ID 1 1 D 1 1
<U OJ TJ • -P UJ 33 X 1 1
>H C 2 O 13 \ \ U U o U U o•H O uo c U u o 0 o 0 0 o
-p rd do o 1—
1
o o o o o o O o10 P o in TJ rH o o o o in o o inqj X) C3 in cm •H Q) in m CM co CO CM CO com o -h CM rH a s CM CM rH rH rH rH rH rH
ID TJ0J I)
Q,Q. Oj
CM rd CM ITJ C C c co C U O C M H H M MU -H s U -H 5rxi 1 iH 1 rH TJ M TJ Sh TJ U TJ H
TJ rH -H tj IH -H qj a) QJ QJ QJ QJ QJ QJ
C QJ QJ 0 C CD QJ 0 H •H TJ H TJ •H TJO *H -a fa O -H TJ ft M S U IS >H S U S
H in 3 0 3 O 3 O 3 O3 o c 3 0 c CQ ft CQ ft m ft CQ ftPQ ft h cq ft -H
U U u u U u u u u u u u M U U U uX 33 33 33 X XXX X S3 33 33 33 33
<N (N CN CM CM CM CM CM CM CM CM rH rH rH rH rH rH
O U u U U cj u u U U O u U U o o CJ0 o o o o O 0 0 O 0 0 0 O 0 0 O 0o o o o o o o o O O O o O o o o oo in o in O o in o o m o o o in o o inCM CM co CM co CM CM CO CM CM CO CM co co CM CO COrH rH rH rH rH iH rH iH rH rH rH rH rH rH rH rH rH
in
-p 0}
tt) P Ifl ia W (A
rH 0) p •p +J Pi-l rH <D a> QJ QJ
QJ H rH rH rH rHft QJ rH rH rH rH
ft QJ <1J QJ 0)
ft ft ft ft
U o (A u • U • U •
0 >H o M o u 0 u 0 U 0 Mo 33 o 33 O 33 O EC o 33 o 3300 o CO CO CO COCT\ rH o <J\ rH G\ rH on rH CJ°1 rH
rH
rH H rH rH I-t rH
0 O 0 O 0 0c C C C C C3
rd rd irj (TJ a) fd
X! x: X! x: X! XIP p P -p +> -p
Q) qj QJ 0) QJ 0)
a £ S S £ a
00 CM CO CM CTt CO CM 0> o o in• • • • • • • • in
co ro ^ ^3* rH ro IjO CJV o • co r» •
oj t— cm r> cm • CM • CM r~ CM CM vo1 1 1 1 1 CO 1 1 U3 1 1 1 1 1
c*i in ro in co m i co in t CO in co co in ino o o o o o in o o in o o o o o ou CM U CM CJ CM o O CMO u CM CM U CM CM(N rd CM rd CM CO CM cm rrj cm CM rd X) cm nj X)« Eh « Eh « Eh > « H > Eh W « Eh Z
1 'ro co 1
CO CO O o co com CO o co O CO id XI o oo o rd o (d o EH w rd XIrd rd Eh > Eh i> « « Eh ZEh H m in « «« 0> rH CO CM cr> o CTl rH
o o O O o o O O
rH rH rH1 1 H 1
1 1 ' - 1
rH CM o O O1 rH CM in rH
Eh Eh '
« en ZH Eh H Eh
«
CJ2 aH DQ2 QH Wa a
wEh
03Eh UO mi-l £
S3
62

XK
Dw
oHH<
in 2W
wH
n Cm-
< CmCm
XUUH
uCJ
o a
-H XIa,
•HC MHCn 0•r)
U) w
0 02 rH
pqj -a a>rH <D urH id
ia CJ 3Cm a cr
p wCM wOu
uO D CJ
2 Eh 0 •
O Uin X
M U rH
Cm Cm rH rH
wEh
•
CnC c•H •H
- C - cU) *H 01 -«H
O cd J US
O -P O -Pm in M V)
o oa +j a -p
QJ ID
>lH >irHM rH U rHQJ (0 QJ cfl
> a > a
cjoo
2
iTIO
(/I
D in
ri |1 ^
(0 Wirl
W-P
H 3 Cd d) QJ QJ
V)«
1 i rH
"§H HCm
U rH 1 i rH1 U/ QJ i QJ
i r\.1 MhPm
Cm Cm Cm
2OU
WOh
,CINE 1RATU
CJ •
O in
O Mo xoo°c
Hrs.
Uoo uo x
U •
0 uO X00
oo°cHrs.
U •
0 UO X00M w
< CmrH rH o CM rH rH <Tl rHrH (N rH (N rH rH rH CN
U 2Cm£h
rH rH rH rH rH2 2 0 0 0 O OM D c c c c CQ M O cB CO ca ccjcfl2 Q CN x: x: x: £. JZM U X -p 4J p P *>« 2 QJ at QJ QJ QJO x 2 X X X
W in m GO 00 T o r- o r-H r- x~-
2<*>U * a\ o cr> o CTN O CN CN . in CN in
>x> m 00 CN IT) oo CN r- in yo -T rH r- rH2 . 1 l 1 l 1 1 i 1 1 1 l 1
O '
rr in cn in *r CT> m vo in rr r- ro irt r- ro ma 2 o o o l o o 1 o O l o o 1 o o O 1 o o2 3
in cn w o CN w o CN w o CN in o CN CN m O CN CNo XI XI XJ •a XI XI T) XJ XI c XI Xl -a C XI XI T> C Xlu Cm 2 Cm u 2 Cm U 2 Cm C-4 2 Cm u S 2 Cm U X 2
o or~i rn m KD
^ o \ \ \ O o
SENDEE OSITI
T XI XIr-~ X3 X! XI 2 2o 2 2 2 JT JT*
CN n n ro C CXI \ \ \ ^ X
2 22 CN CN CN -rCN -O XI c T3
6 XI CJ U CS3 u Uu Cm CN
XICm
CNXICm
CNXICm
CNXICm
CNXICm
rH CN rH rH CN
o mJ 2
rH1
1
21
21
21
21
22 CJ U tsi 2Cm a. Cm Cm U o
Cm Cm
CJoo
uoo
•HC•HCO
O 4J
)H in
oa -p
01
rHM rHQJ
> a
uoo
Uoo
63
BLANK
64

05
PW2oM
<Eh
2asH05Wcux:HUM
u
wdc30
6ouTJII)
4-1
13
r-l
<U
05
dxo
ou
TJd0
* *
fH r*
03 ^ *rjQJ
G2rj
2g
u U 4Jtn
Q uQ n | i —u
Very
pallc
0r-i
Hdcu
OverVery pa
lie
(04J M
*! 4->2.. oU
i |
01 0)rH
_~'
:
rHrH rH
£ Eh d I d« o pj I Pi
£ i CN CNfa o c—
)
ou M
inH
^
M >H
P5 XO D2 Eh H
'.
rH rH
H <05 05
I
iM rj C
)
I u CJ
fci Cu o 0 o Q 0 0Xa&
Q o o oin tn o
Q 1-1 rH CNrH rH rH rH rH
Qin 0]
TEST IGURA
4J CJ 4-1
CU l II
rH d I rHrH
irH
QJ U 4)
b C* CO CU2 1
Ou
w05
U D u w U • u2 Eh 0 u J uj 0 W 0M c£ o x o u o uCJ 05 00
,
* O E o xj a Cft rH 1—
1
o< p. rH CN rH rH
U SwEn
O H rH rH
2 E 0 w 0 0M p C c aQ ^ fl rri
JHid d
2 a X xH CJ +J 4-1 4-1
05 S ID QJ 0) aO s
CO cn cn m in iH r»
2 CN rH LD n ui mmr- rH rH •43 CN
2 1 1 1f • »r 1 • 1
o . ^3" ro lo ^5 1Lfl ^ \D 1 IT)
o o o _ _1 CN O 1
CN OW CN CN CO O O WOO CN
XI d A (J TJ- -rl XI TJ du O 2 u u s Eh Eh 04 vj £h tn
2 o 0Q 2
d
J.
1JT " -r
o o •rl •H^ rr
g s
X! n Eh Eh
2 JC Jf*
0 T3 TJ
o U CJM o CN CN CN
u XI X Xa. u Oh Cm
05 —t rH rH CNE-i W
1 1 1 1o a 2 Eh
O Eh Eh
Oh
".
|
O u2-
Pi Pi

that K-Squares were unsuitable due to the "soft" calcine and necessity of firing the samples
in an atmosphere. Considerable experimentation in firing procedure eventually produced
dense KTaO^ ceramic samples.
The PbO-Nb20,_ system also had the disadvantage of a volatile component, PbO. However,
this was not as severe a problem as with KTaO^. Two niobates: Pb2Nb
207
and Cd^rNbO^ were
produced in K-Squares although significant loss of PbO in the former and probably Cr2°3 an<^
CdO in the latter caused considerable staining of the ZrO^ pallets upon which they were
fired. The remainder of the niobates were made using pressed pellets, often producing
somewhat porous samples (perhaps due to low temperature calcination) . Some compositions
would not fire to a dense ceramic at the conditions tried and had to be abandoned. PbSO,4
was used in all Pb compositions due to its high temperature of decomposition. It was thought
that this would allow better reaction during calcine with the very refractory Nb20^.
3.6. Experimental Methods
3.6.1 Dielectric properties
Dielectric constant and derivative ; The quantity OK'/3T) was the main property of
the multilayer samples to be tested. Such measurements had to be made on hundreds of these
samples to test the effects of various manufacturing procedures. A cryostat insert was made
whereby a fifteen sample teflon holder was mounted on the end of the stainless steel tube.
The holder was immersed in a bath of liquid helium which could be pumped down to about
1.5 K. A germanium thermometer was used to measure the temperature of the helium bath,
which was controlled with a manostat. Each of the fifteen samples were connected in turn to
a commercial capacitance bridge operating at 1 kHz. The capacitance of each sample was
measured at 4.2 K and at a few lower temperatures. The data were computer analyzed to find
K' and 3K'/8T for each sample.
For measurements of the dielectric constant at temperatures above 4 K, the specific
heat apparatus was used. In that apparatus (described in section 3.6.2) only two samples
could be run at the same time.
Breakdown strength at 4 K : The breakdown strengths of the glass ceramic capacitors
were measured at 4 K in liquid helium. The dewars used were unsilvered so any external
breakdown could be observed. The breakdown voltage was applied to the capacitor and monitored
using the simple circuit shown in figure 25. The leakage current appears on the ammeters
placed in the ground return leads. Currents of about 1 yA could be detected. A 1.5 megohm
current limiting resistor was placed in the high voltage lead.
DC polarization ; As shown in section 3.1.1. on thermodynamics, the polarization P(T,E)
is used to determine the refrigeration power. When a remanent polarization is present,
P(T,E) can no longer be determined from the dielectric constant but must be measured directly
with a dc technique.
The circuit in figure 26 was built to measure P(T) directly. A similar technique has
recently been used by Gesi.7
^" This circuit can be used to measure both P(T)1 and P(E)] .
E TA voltage, V, is applied across a series combination of the unknown capacitor C and a known
5and much larger capacitor, C . Both capacitors must have very low leakage, RC > 10 sec
66

0)
E
c
e0)
CO
0)
E
o4-1
P•H3OS-i
•Ha
&oc•H •
•H
•Hi—I -u
JJ
4-1
aoti
cu
)-l
4J
CO
c&o
cu
1-1
ud
mo
6
M ^ctf 03
•H CU
CJ
•rl
4J l—
I
ca cu
e incu iw
U 4-1
cn o
mCM
cu
u
•rl
II'
67

(3
O•HUcO
N•HMcO
>HOauQCD
X)<D
CO
3
•u•H
as-i
•Ho
cu
BcO
too
cfl
•rl
T3
O O)
01 wX CO
a <u
CN
S-i
=>
•H
68

for this system to work. When the ratio of C-^/C <K 1 the voltage across C^, i.e., V^, is
very nearly the applied voltage V. The voltage, V on C is measured with a vibrating reeds s
5electrometer. The input impedance, R^
n f is so high that R^n
cs
>> 10 sec. The output of
the electrometer is measured with a digital voltmeter. The precision of the measurement is
about 0.01% for the larger capacitors measured.
For the capacitors connected in series with no leakage,
q = q = C V = C.V.
.
1 s s s 11
For parallel plate geometry,
D = q/s,
where D is the electric displacement and s is the plate surface area. Since P = D - £QE,
then
p = q-,/Si - e E = C V /s- for e/e >> 1. (3.7)1 1 o s s 1 o
The quantity P is the total induced polarization and will be called Pfc
.
If any ferroelectric ordering takes place or an electret is formed when the field is
applied, then a charge will remain on V when V is removed. Thens
P = [c V /s,lr s s 1 ^
where P^ is the remanent polarization. An AC measurement of polarization will presumably
measure P^ - P .
t r
A liquid helium cryostat was used for these measurements. The samples were mounted in
a vacuum can on a heat exchanger through which liquid helium could be valved. After a
desired temperature was reached, the valve was closed. A carbon resistor sensor coupled to
a heater by an electronic feedback circuit kept the temperature constant. The cryostat was
the same as used for the multi-leaf switch measurements.
Most of the P^CT) measurements, where pt
(T ) is the total polarization observed when a
field is applied, were made by applying the field to the sample around 77 K then cooling it
to 4 K and recording P at several temperatures between. The temperature was brought to
equilibrium at each point. Then the field was removed and P^, the remanent field, was
measured by warming the sample back to about 77 K. Hysteresis loops were measured by re-
cording Vswhile switching through E values at a constant T and calculating P from eq.
(3.7) .
The dielectric constant at low frequencies could be measured with the same system by
measuring hysteresis loops as a function of T. The high frequency measurements were done by
connecting a commercial capacitance bridge to the leads in place of the polarization system.
Most all of the materials on which measurements of P and P were desired had a suf-t r
ficiently high R such that the decay time was negligible.
69
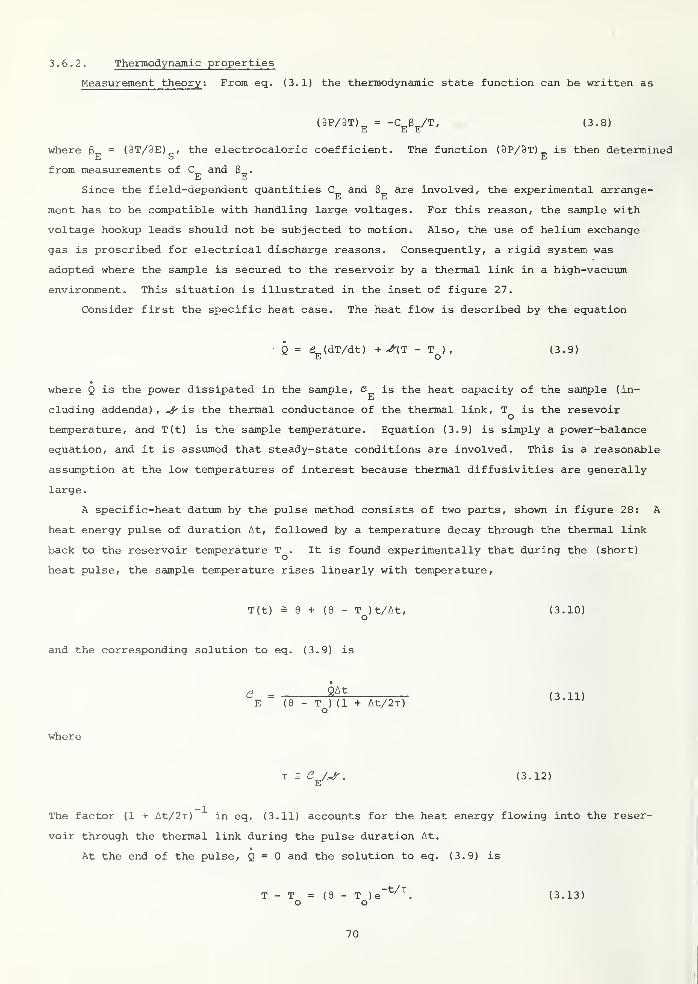
3.6.2. Thermodynamic properties
Measurement theory : From eq. (3.1) the thermodynamic state function can be written as
(3P/3T)E
= -CE6E/T, (3.8)
where g = (9T/9E) , the electrocaloric coefficient. The function (9P/9T)_ is then determinedE S E
from measurements of C and g .
E E
Since the field-dependent quantities C and g are involved, the experimental arrange-E E
ment has to be compatible with handling large voltages. For this reason, the sample with
voltage hookup leads should not be subjected to motion. Also, the use of helium exchange
gas is proscribed for electrical discharge reasons. Consequently, a rigid system was
adopted where the sample is secured to the reservoir by a thermal link in a high-vacuum
environment. This situation is illustrated in the inset of figure 27.
Consider first the specific heat case. The heat flow is described by the equation
Q = <2_(dT/dt) + ^(T - T ), (3.9)E O
where Q is the power dissipated in the sample, <2 is the heat capacity of the sample (in-E
eluding addenda) , ^ is the thermal conductance of the thermal link, Tq
is the resevoir
temperature, and T(t) is the sample temperature. Equation (3.9) is simply a power-balance
equation, and it is assumed that steady-state conditions are involved. This is a reasonable
assumption at the low temperatures of interest because thermal diffusivities are generally
large.
A specific-heat datum by the pulse method consists of two parts, shown in figure 28: A
heat energy pulse of duration At, followed by a temperature decay through the thermal link
back to the reservoir temperature T . It is found experimentally that during the (short)
heat pulse, the sample temperature rises linearly with temperature,
T(t) = 6 + (6 - T )t/At, (3.10)o
and the corresponding solution to eq. (3.9) is
e = 2£t_
E (6 - T ) (1 + At/2x)(3.11)
where
t = e/Jr . (3.12)hi
The factor (1 + At/2x) in eq. (3.11) accounts for the heat energy flowing into the reser-
voir through the thermal link during the pulse duration At.
At the end of the pulse, Q = 0 and the solution to eq. (3.9) is
T - T = (9 - T )e"t/T
. (3.13)o o
70
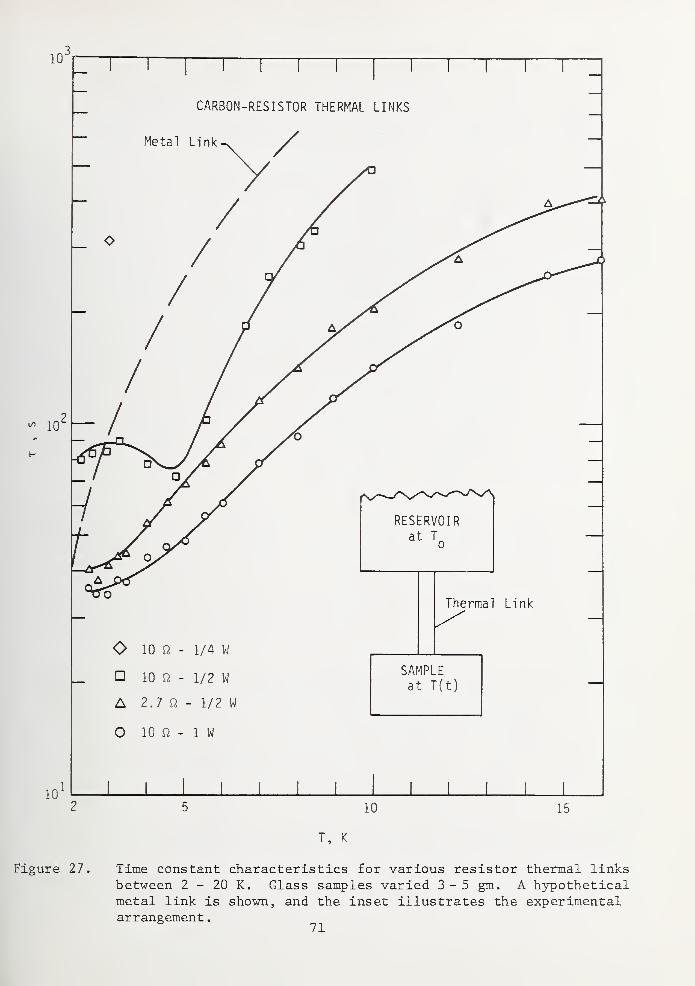
10'
io-
CARBON-RESISTOR THERMAL LINKS
Link^ /
O 10 n - 1/4 w
_ 10 ft - 1/2 W
A 2.7 ft - 1/2 W
O 10 ft - 1 w
RESERVOIRat T
Thermal Link
SAMPLEat T(t)
10 15
T, K
Figure 27 Time constant characteristics for various resistor thermai linksbetween 2 - 20 K. Glass samples varied 3-5 gm. A hypotheticalmetal link is shown, and the inset illustrates the experimentalarrangement
.
71

72

That is, the sample temperature decays exponentially to the reservoir temperature with the
time constant x, eq. (3.12).
Therefore, measuring Q, At, T and determining 6 and x from a T - t plot, the heato
capacity of £- can be determined from eq. (3.11). Finally, the specific heat of interest,E
C (T) , is obtained from <3 by making the addenda correction,E E
C_(T) = (C_(T) - £m.C.(T))/m, (3.14)E E j j
where m is the mass of the dielectric sample, and the m.C.(T) are mass times specific heat3 3
of the addenda.
Considering next the electrocaloric coefficient, 3„> the exp«rimental situation is toE
make a field change AE about E and measure a temperature change, AT. A special considera-
tion here is the phonon-polarization relaxation time. That is, following a polarization
change the phonon spectrum will come into equilibrium with the polarization exponentially
with a characteristic time called the phonon-polarization relaxation time. For the type of2 72
dielectric materials of interest, this relaxation time is faster than 10 ys. ' This fact
insures that adiabatic conditions are fulfilled in the experiment [i.e., 3 = (9T/3E) J
.
E b
Therefore, for the time scales involved experimentally the dielectric material exposed
to the field instantaneously changes in temperature from T^ -> T. , whereas (6 - T ) is the
temperature change of the entire sample. The energy balance condition is
T. - T = (9 - T )[mC (T) + Tm.C. (T) ]/mC_(T) , (3.15)
l o o E 3 3 E
and it is important to recognize that m in eqs. (3.14) and (3.15) refers to the mass of the
dielectric exposed to the field. Those portions of the dielectric not exposed to the field
are included in the addenda.
Following the temperature change due to AE, eq. (3.9) with Q - 0 applies, so the sample
temperature decays back to Tqwith the time constant x, as in the specific heat case, eq.
(3.13). The electrocaloric coefficient is then given by
(6 - T )[mC (T) + lm ,C (T) ]
3 = (T. - T )/AE = -e-—— J-3 " (3.16)E i o mC
E(T)AE
The eqs. (3.14) and (3.16) describe the means for measuring CE
and 3E » respectively,
from which the state function (9P/3T) , eq. (3.8), can in principle be determined. NoteE
that the zero-field specific heat has to be known for the dielectric so that the addendum
correction can be made for the dielectric material not exposed to the field. Also the
field-dependent specific heat C (T) has to be known to determine the electrocaloric coeffi-E
cient, eq. (3. 16)
.
We will now describe a scheme for considerably expediting these measurements. Suppose
that a sample has been fixtured and wired for field-dependent measurements, and suppose that
the zero-field specific heat has been measured. These measurements will yield Cq(T) from
eq. (3.11) and x (T) from fitting the T - t data. Consequently, the thermal link is cali-
brated,
73

Jf (T) = 6 (T)/T(T) , (3.17)
and it is important in what follows to recognize that m#\T) is field-independent.
Without altering the sample fixturing, the field-dependent properties are measured.
Specifically, a field change AE about E leads to temperature change (G - T ) followed by an
exp(-t/x) decay. If the resulting T-t data are analyzed for x, then
<2E(T) = t^HT) (3.18)
where *y(T) comes from the calibration, eq. (3.17). Substituting in eq. (3.14),
CE(T) = [V(T) - £m.C. (T)]/m, (3.19)
and in eq. (3 . 16)
,
(6 - T ) t (T)
6E(T) = AELx^T) -V-C.(T)J "
(3 ' 20)
Finally, combining eqs. (3.8), (3.19), and (3.20),
(3P/9T) = - ( 0 - T )x>*(T)/mT . (3.21)E o
The measurement scheme then is to measure first the zero-field specific heat, thus
calibrating the link, eq. (3.17). Then, from a single AE-AT event, the field-dependent
specific heat, eq. (3.17), the electrocaloric coefficient, eq. (3.20), and the state func-
tion, eq. (3.21), can all be determined at those T- and E- values.
The result eq. (3.21) is particularly attractive because it means that the state func-
tion, which is of primary interest, can be measured directly rather than by synthesizing 8
and c data. The cancellation of the addenda corrections in arriving at eq. (3.21) isE
fortunate experimentally, because these corrections, though small, are difficult to deter-
mine to high accuracy.
The application of the method for measuring zero-field specific heat will be emphasized,
because measurements of the field-dependent properties are a straightforward extension of
the zero-field methods.
Cryostat insert : The calorimeter is a two-can system where the inner can is a tempera-
ture-controlled isothermal shield, and the vacuum spaces of the two cans are connected.
Hookup leads (0.015-cm manganin) run from an interchange can at room temperature down the
pumping line and are heat sunk to a copper collar bolted onto the flange of the outer can.
The highvoltage leads are encased in Teflon sleeving and are heat sunk to a sapphire rod
mounted in the collar with varnish.
The lid of the inner can is suspended from the flange with copper straps, chosen to
give 77->-4 K cooldown times of about 12 nr. A second heat-sinking station and interchange is
mounted on the underside of this lid and a sapphire rod is provided for heat-sinking the
voltage leads. In this fashion, all leads to the samples are tempered to the reservoir
74
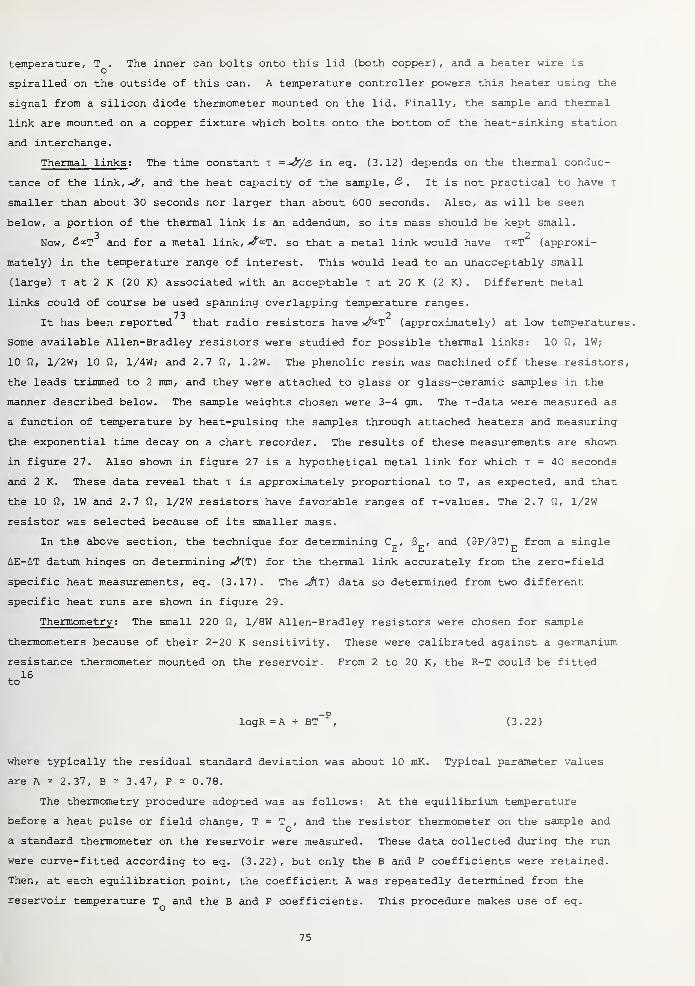
temperature, T . The inner can bolts onto this lid (both copper) , and a heater wire is
spiralled on the outside of this can. A temperature controller powers this heater using the
signal from a silicon diode thermometer mounted on the lid. Finally, the sample and thermal
link are mounted on a copper fixture which bolts onto the bottom of the heat-sinking station
and interchange.
Thermal links : The time constant x in eq. (3.12) depends on the thermal conduc-
tance of the link,^, and the heat capacity of the sample, & . It is not practical to have t
smaller than about 30 seconds nor larger than about 600 seconds. Also, as will be seen
below, a portion of the thermal link is an addendum, so its mass should be kept small.3 2
Now, C^T and for a metal link,
^
aT. so that a metal link would have TaT (approxi-
mately) in the temperature range of interest. This would lead to an unacceptably small
(large) x at 2 K (20 K) associated with an acceptable x at 20 K (2 K) . Different metal
links could of course be used spanning overlapping temperature ranges.73 2
It has been reported that radio resistors have (approximately) at low temperatures.
Some available Allen-Bradley resistors were studied for possible thermal links: 10 ft, 1W;
10 ft, 1/2W; 10 ft, 1/4W; and 2.7 ft, 1.2W. The phenolic resin was machined off these resistors,
the leads trimmed to 2 mm, and they were attached to glass or glass-ceramic samples in the
manner described below. The sample weights chosen were 3-4 gm. The x-data were measured as
a function of temperature by heat-pulsing the samples through attached heaters and measuring
the exponential time decay on a chart recorder. The results of these measurements are shown
in figure 27. Also shown in figure 27 is a hypothetical metal link for which x = 40 seconds
and 2 K. These data reveal that x is approximately proportional to T, as expected, and that
the 10 ft, 1W and 2.7 ft, 1/2W resistors have favorable ranges of x-values. The 2.7 ft, 1/2W
resistor was selected because of its smaller mass.
In the above section, the technique for determining C , 3 , and (3P/3T) from a singleE E E
AE-AT datum hinges on determining v^(T) for the thermal link accurately from the zero-field
specific heat measurements, eq. (3.17). The JKt) data so determined from two different
specific heat runs are shown in figure 29.
Thermometry : The small 220 ft, 1/8W Allen-Bradley resistors were chosen for sample
thermometers because of their 2-20 K sensitivity. These were calibrated against a germanium
resistance thermometer mounted on the reservoir. From 2 to 20 K, the R-T could be fitted
to
logR = A + BT~P
, (3.22)
where typically the residual standard deviation was about 10 mK. Typical parameter values
are A = 2.37, B = 3.47, P = 0.78.
The thermometry procedure adopted was as follows : At the equilibrium temperature
before a heat pulse or field change, T = T , and the resistor thermometer on the sample and
a standard thermometer on the reservoir were measured. These data collected during the run
were curve-fitted according to eq. (3.22), but only the B and P coefficients were retained.
Then, at each equilibration point, the coefficient A was repeatedly determined from the
reservoir temperature T and the B and P coefficients. This procedure makes use of eq.
75

76

BLANK
77

(3.22) in such a way that the temperature changes AT reflect the accuracy of the overall fit
while insuring that at equilibrium the sample thermometer matches exactly the standard
thermometer
.
Sample fixturing : A schematic of the fixtured sample is shown in figure 30 (voltage
leads are not shown) . The sample consists of two plates (labelled J) varnished together
with a heater wire (G,H) sandwiched between. A thin layer of fritted silver (DuPont 8225)
is fired (680°) on a portion of one edge of each plate (C) . The manganin heater wire is
next mounted on the face of one of the samples with varnish, and this step requires con-
siderable care because of the relatively large specific heat of the varnish (^ 30 times
larger than that of copper) and its dependence on curing conditions.
The fired-on silver section (C) is indium-soldered to the thermal link (B) and the
solder joint (D) is trimmed with a knife. The machined-down resistor thermometer (F) is
varnished to the sample, and short portions (about 1 cm) of the hookup leads (E) are tempered
to the sample with varnish. Finally, the other end of the thermal link is indium-soldered
to the reservoir (A)
.
The addenda weights are determined by cumulative weighings. The weight of the manganin
heater wire is determined by measuring the room-temperature resistance and using the cali-
bration, 5.7 x 10 ^ g/fi. Typically the heat capacity of the addenda amounted to about 4% of
that of the sample above 10 K and about 20% at 2 K.
The components attached to both the sample and reservoir involve two types of correc-
tions: A temperature gradient is established across, say, the thermal link, and it is easy
to show that one-half the mass of the link is "on" the sample as an addendum. The second
consideration involves the power flow in the manganin hookup leads (I) . Note that if these74
leads were copper, they would constitute the thermal link. Neighbor has shown that to a
very good approximation, one-half the power generated in these leads flows to the sample.
This means that one-half the resistance of these hookup leads has to be added to the heater
resistance to obtain the total effective heater resistance at room-temperature
.
Instrumentation : For the specific heat case, the heat dissipated in the sample is
Q = i2RH(T)At (3.23)
where i is the d.c. current, Rjj(T) is the heater current, and At is the pulse duration. The
current supply was a 9-volt battery bank and the current was measured by measuring the
voltage drop across a 1 kfi standard resistor. A switching panel was assembled where the
pre-set current could be applied to the sample heater by depressing a relay switch which
also triggered a digital clock. Releasing the switch stopped both the current flow and the
clock.
The exciting current to the resistor thermometer on the sample was battery-supplied and
measured by measuring the voltage drop across a 1 kfi standard. The current was adjusted
during the run to maintain the thermometer voltage at ^ 20 mV, and this signal level pro-
duced negligible self-heating. All but 1 mV of this voltage signal was "bucked" potentio-
metrically, and the residual voltage was displayed on the 1 mV scale of a strip-chart
78

79

recorder. For a specific heat datum, the heater current was interrupted when the chart pen
deflection reached 0.5-0.8 mV, and this AV/V corresponded to AT/T values ^ 2-4%.
Electric fields were produced by applying a voltage to the samples from a decade high
voltage dc power supply. The power supply could provide up to 3000 volts. Step changes in
field were produced by changing the decade setting on the power supply.
Accuracy of the method : The major sources of error in the method are: (1) The addenda
corrections, ^ ± 0.5%, including some imponderables such as solder joints; (2) The heater
resistance, R^(300), ^ ± 1%, due to uncertainties in correcting for hook-up leads; (3) The
uncertainty in determining t = 0 from the chart trace which translates into an uncertainty
in computing the intercept 6, ^ ± 2%; and (4) The curve-fitting uncertainties both in the
exp(-t/x) fits and the thermometer handling according to eq. (3.22). These uncertainties
reflected in x and 6 are believed to be ho greater than ^ ± 2%.
The uncertainty in t = 0 does not affect x, because this uncertainty is absorbed in the
amplitude in the curve-fitting.
The repeatability of the method is an approximate measure of precision. At the same
reservoir temperature, a sample was pulsed ten times using different heater currents, pulse
times, and chart speeds. The resulting zero-field specific-heat values agreed to ± 2%.
This repeatability is about the value expected from the t = 0 uncertainty.
The inaccuracy of the method was expected to be ^ ± 5%. An attempt was made to verify
this by measuring the zero-field specific heat of Si0_. A sample of Corning fused silica,-3
Code 7940, was measured and these data are shown in figure 31 plotted as CT vs T. Also75 76
shown in figure 31 are literature data for I. R. Vitreosil and vitreous silica. The
position of the peak in CT3agrees well with the literature data, - 10 K but the height of
the peak is = 16% higher than the literature data. At 3 and 20 K, the measured and litera-
ture data agree to 1.5% and 6.5%, respectively.-3
The difference in the heights of the CT peaks in figure 31 appears to be much larger
than the experimental error in the method. This difference is believed due to the different
sources of Si02
. That is, the temperature of the peak in the CT3
curve is related to the
frequency at which the phonon density of states reaches its first maximum, and the height of77
the peak correlates with the number of phonon modes in the density of states peak. Low-
frequency defect modes related to the open structure of SiO are believed responsible forZ
3this departure of the specific heats of amorphous materials from a T law. Consequently,
the height of the CT3peak can be expected to depend on the pre-history of the Si0
2samples.
3.6.3 Thermal conductivity
Knowledge of the thermal conductivity of the glass-ceramic was needed for eventual
prototype design, so a method for measuring thermal conductivity in the range 2-20 K was
established in parallel with the above specific heat-electrocaloric coefficient. The two
methods involve much of the same equipment and thermometry handling. The conventional
techniques of using two carbon thermometers on the sample with a heater attached to one end
of the sample was used in the initial runs. The carbon thermometers were calibrated against
a germanium resistance thermometer mounted on the reservoir. From the first set of measure-
ments it was determined that the thermal resistance of the heater-sample joint and the
80

6
2
1 1 1 1 1 1 1 1
|
Corning FusedSi0
2(Code 7940) —
o/ / V >?v
I.R. Vitreosil P / Vitreous Silica \(White & Birch) / / (Flubacher et al.& Simon)\
1 1 11
2 5 10
TEMPERATURE , K
Figure 31. Comparison of specific heat data measured on a sample of Si02 withliterature data. The difference between the measured and literaturedata at the maximum in CT~3 is too large to be attributed to experi-mental uncertainty but is believed due to differences in the numberof low frequency phonon modes in the different samples of SiC>2.
81

sample-reservoir joint were negligible. Subsequent measurements were then done with the
thermometers permanently mounted on the heater and reservoir. That procedure greatly
simplified the mounting procedures.
3.7 Experimental Results
3.7.1. SrTi03glass-ceramics
Maximizing (9K'/9T)0and the breakdown strength: The quantity (9K'/9T)q at 4 K was
measured for over 200 samples in the FEP composition series. The series consisted of a
preliminary matrix and two main matrices. About 64 different combinations of fabrication
variables were used in these matrices. The most important variable was the ceram tempera-
ture and so the plot in figure 32 is of (9K'/9T)g vs the ceram temperature. The figure
compares (9K'/9T)0
for the FEP matrices with that of the bulk research samples. All the
data for the matrices lie within the cross-hatched region.
Two features are immediately evident from figure 32. First, the high values of (9K'/9T)
as seen in the research samples could not be duplicated in the FEP matrices. Second, for
low ceram temperatures the FEP values are higher than that of the research samples, but the
FEP values drop abruptly for ceram temperatures above 1100°C. As discussed in section 3.4
it is just that temperature at which pitting in the samples began to occur. A plot of
dlnK'/clT increases smoothly through the pitting regime which indicates the sudden drop of
9K'/9T is probably not an intrinsic material behavior. Most likely the pits cause the rapid
decrease in K' and 9K'/9T. The maximum value of K' at 4 K is about 250 and also occurs just
before the onset of pitting. There appears to be only a slight correlation between 9K'/9T
and the other process variables. Slower heating rates and longer soak times have the most
influence in increasing 9K'/9T. The use of seal A with paste A2664 gives a slightly higher
3K'/9T.
The first measurements of voltage breakdown strengths on 0.025 mm thick samples showed
three types of behavior: (i) conducting at all voltages, (ii) conducting above a certain
voltage, and (iii) a classical breakdown with a sudden appearance of large current flow at
the breakdown voltage. Arcing was often seen in this last case. It is difficult to define
a breakdown strength for the first two cases, but it was arbitrarily taken as that field
strength where 10 pA of current was drawn. If each element in the refrigerator drew that
much current, then the heating effect would be comparable to the refrigeration power desired.
As defined, the breakdown strength ranged from less than 10 kV/cm for the first case to as
high as 600 kV/cm for the third case.
A study of the breakdown data for this first matrix suggested that flaws or pin holes
clear through the 0.025 mm dielectric layer could account for the conducting behavior seen
in many of the samples. It was then suggested that two or more layers of dielectric between
the electrodes be used. With two or more layers the chances of having two pinholes line up
to penetrate straight through the dielectric becomes essentially negligible. The second FEP
matrix was then made with many samples containing two and three layers of the basic 0.025 mm
thick dielectric and with no floating electrodes between the layers. For the cases where
pitting did not occur, the breakdown strengths of these samples averaged about 550 kV/cm,
82

50
Figure 32. The temperature derivative at 4 K of the dielectric constant for
the FEP multilayer samples as a function of the ceram temperature.
Shown for comparison is the results on a bulk research sample.
83

whereas that of the samples with floating electrodes between the layers was about 160 kV/cm.
The other process variables appeared to have little effect on the breakdown strengths. The2
550 kV/cm is well above the 300 kV/cm strength used in the original design calculations.
It was found that some correlation existed between the loss factor, tan 6, in the
dielectric constant and the breakdown strength. Large values of tan 6, i.e., greater than
about 0.01, are associated with low breakdown strengths although very small tan <5 values do
not necessarily mean large breakdown strengths. Measurements of tan 6 were then useful in
eliminating most of the samples which had low breakdown strengths.
A second series of samples with a different composition (FEL series) was made to test
the effect of composition on the dielectric properties. The only difference between the FEP
and FEL compositions is that FEP has a SiC^/A^O ratio of 4 while FEL has a ratio of 3.
The FEL series also consisted of two matrices with essentially the same process variables as
used with the FEP series. The results of measurements on (3K'/3T) at 4 K are shown ino
figure 33 as a function of the ceram temperature. The behavior is somewhat similar to the
FEP series in that the maximum (3K'/3T)ovalues are about 3.5 K ^" and that a rapid decrease
in 3K'/9T occurs above a certain ceram temperature where pitting occurs. The onset of
pitting for the second FEL matrix occurred at about 1160°C compared with 1100-1110°C for the
FEP series and the first matrix of FEL. Extensive tests on the composition of the two FEL
matrices showed no differences between the two, although there was a difference in color.
No satisfactory explanation could be found for the difference in behavior. In any case, the
maximum (3K'/3T)ovalues still did not exceed 3.5 K which is about an order of magnitude
below that of the bulk research samples. The largest values of K' at 4 K are about 250,
which are the same as for the FEP series.
The results of breakdown measurements on the FEL series gave similar results as for the
FEP series except that there were far fewer samples which were conducting at low voltages.
The average breakdown strength for the better samples was about 650 kV/cm, which is slightly
higher than the FEP series.
As discussed in section 3.4 the FEP and FEL series contain 2 mole % SrNb-O doping. To2 o
test the effect of this niobium doping, the FHN series was made which is just FEP without
the niobium oxide. The resulting K' and (3K'/3T)ovalues are decreased by about a factor of
three and two, respectively. Consequently, niobium has a rather strong effect on (3K'/9T) .
One approach to solve the pitting problem was to inhibit strontium feldspar crystalliza-
tion. This was accomplished by adding B2°3" Single layer research samples were made from
this material and are known as the SrTiO^ boroaluminosilicates. Two compositions were
tested, FHS, which has 1% niobate and FID, which is niobate free. The ceram temperatures
were mainly 1050 and 1100°C. For the FHS composition with 1100°C. ceram temperatures the K'
and (3K'/8T)ovalues were about 550 and 10 K , respectively. The dielectric constant reached
a peak of about 600 at a temperature of 50 K. The niobate free FID samples had K' and
(3K'/9T) values of about 300 and 3 K , respectively. Since these were only single layero
research samples the breakdown strengths would be very low and were not even measured.
Further attempts to increase (3K'/3T) were halted when electrocaloric and polarizationo
measurements showed that (3K'/3T) was not the relevant parameter as far as predictingo
cooling effects at 4 K.
84

1100 1200 1300
Tceram
The temperature derivative at 4 K of the dielectric constant for
the FEL multilayer samples as a function of the ceram temperature.Shown for comparison is the results on a bulk research sample.
85
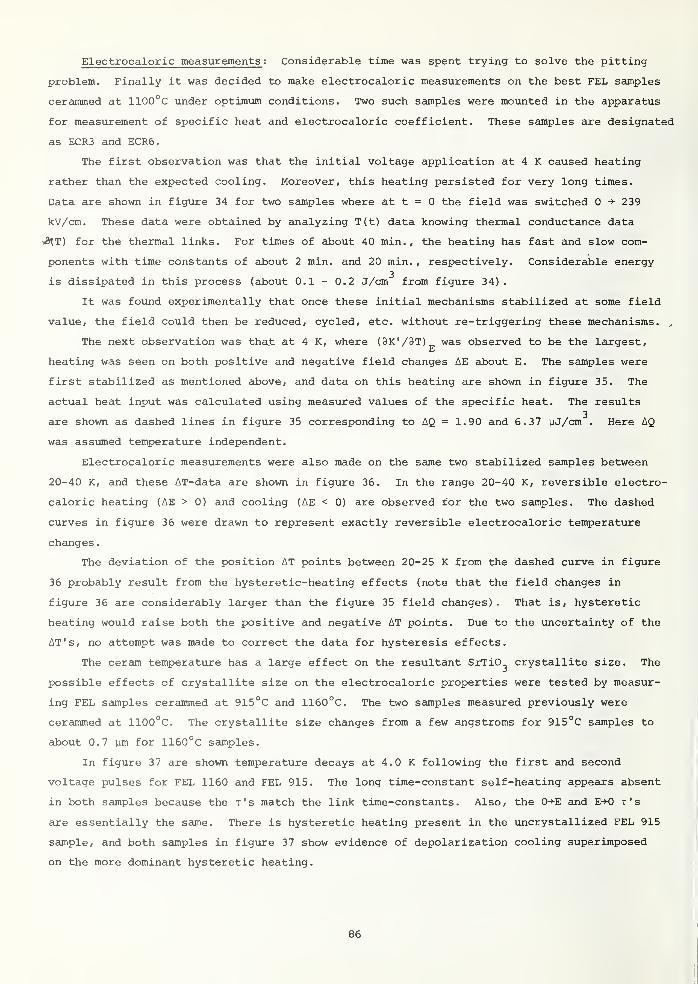
Electrocaloric measurements ; Considerable time was spent trying to solve the pitting
problem. Finally it was decided to make electrocaloric measurements on the best FEL samples
cerammed at 1100°C under optimum conditions. Two such samples were mounted in the apparatus
for measurement of specific heat and electrocaloric coefficient. These samples are designated
as ECR3 and ECR6.
The first observation was that the initial voltage application at 4 K caused heating
rather than the expected cooling. Moreover, this heating persisted for very long times.
Data are shown in figure 34 for two samples where at t = 0 the field was switched 0 * 239
kV/cm. These data were obtained by analyzing T(t) data knowing thermal conductance data
for the thermal links. For times of about 40 min. , the heating has fast and slow com-
ponents with time constants of about 2 min. and 20 min. , respectively. Considerable energy3
is dissipated in this process (about 0.1 - 0.2 J/cm from figure 34).
It was found experimentally that once these initial mechanisms stabilized at some field
value, the field could then be reduced, cycled, etc. without re-triggering these mechanisms. ,
The next observation was that at 4 K, where (3K'/3T) was observed to be the largest,
heating was seen on both positive and negative field changes AE about E. The samples were
first stabilized as mentioned above, and data on this heating are shown in figure 35. The
actual heat input was calculated using measured values of the specific heat. The results
are shown as dashed lines in figure 35 corresponding to AQ = 1.90 and 6.37 uJ/cm^. Here AQ
was assumed temperature independent.
Electrocaloric measurements were also made on the same two stabilized samples between
20-40 K, and these AT-data are shown in figure 36. In the range 20-40 K, reversible electro-
caloric heating (AE > 0) and cooling (AE < 0) are observed tor the two samples. The dashed
curves in figure 36 were drawn to represent exactly reversible electrocaloric temperature
changes.
The deviation of the position AT points between 20-25 K from the dashed curve in figure
36 probably result from the hysteretic-heating effects (note that the field changes in
figure 36 are considerably larger than the figure 35 field changes) . That is, hysteretic
heating would raise both the positive and negative AT points. Due to the uncertainty of the
AT's, no attempt was made to correct the data for hysteresis effects.
The ceram temperature has a large effect on the resultant SrTiO^ crystallite size. The
possible effects of crystallite size on the electrocaloric properties were tested by measur-
ing FEL samples cerammed at 915°C and 1160°C. The two samples measured previously were
cerammed at 1100°C. The crystallite size changes from a few angstroms for 915°C samples to
about 0.7 ym for 1160°C samples.
In figure 37 are shown temperature decays at 4.0 K following the first and second
voltage pulses for FEL 1160 and FEL 915. The long time-constant self-heating appears absent
in both samples because the t's match the link time-constants. Also, the 0-»-E and E-*0 x's
are essentially the same. There is hysteretic heating present in the uncrystallized FEL 915
sample, and both samples in figure 37 show evidence of depolarization cooling superimposed
on the more dominant hysteretic heating.
86

TIME, s
Figure 34. The time dependence of self heating in two FEL glass-ceramic afteran electric field is first applied to the samples at 4 K. Bothsamples had ceram temperature of 1100°C.
87

100
5G
EI—'
<CD
<10—
5-
a r
\
HYSTERETIC HEATING
Open Symbols 59.6—71.6 kV/cm
^ Closed Symbols 71.6—59.6 kV/cm
\\/-AQ=6.37/*J/cm 3
\ "\
\o \D
\ \ECR6
\- v\° \
ECR3 \ \\
°
AQ=1.9/*J/cm 3-v"\
\\
\\\L
8
TEMPERATURE. K
ure 35 The temperature rise in two previously polarized FEL samples duringa change in the electric field. The open symbols are for an increase
in field and the closed symbols are for a decrease in field.
88

E
40
30
20
10
0
-10 -
-20
-30
-40
i r
FEL 1100
Polarization Heating
0— 120kV/cm
o
A
ECR3
ECR6
Depolarization Cooling
120—0 kV/cm
_ 6
/
A
\\
1
20 30
TEMPERATURE, K
40
Figure 36. The temperature change in two previously polarized FEL samples during
a change in the electric field. This data is for the 20 - 40 Ktemperature range where cooling is seen for a decrease in field.
89

5000 -
1000
E
TIME, s
Figure 37. Temperature decays at 4 K following the first and second voltagepulses for FEL 1160 and FEL 915. The open symbols are for the
first pulse, 0—72 kV/cm and the full symbols are for the second
pulse, 72 kV/cm—0.
90

In figure 38 are shown data on the effects of polarity reversal at 4.0 K for the two
samples. For example, on switching CH- + 72 kV/cm, FEL 1160 heated 2.2 K; after decay back
to 4.0 K, the field change + 72 -> 0 resulted in a temperature rise AT = 0.8 K; the subsequent
CH- - 72 switch yielded AT = 3.5 K, etc.
The residual polarization +P remaining in the sample after a +E -> 0 switch is reversed
to -P on the subsequent 0 -* -E switch and results in the large AT = 3.5 K in FEL 1100. The
±E -» 0 switch involves a smaller amount of heating, AT = 0.8 K for FEL 1160.
Also shown in figure 38 for FEL 1160 are the AT's obtained on subsequent 0 + +E > 0 -» +E,
etc., switches (measured in a second run). The initial 0 -* +E switch gives a larger AT (2.2
K) than subsequent 0 -+ +E switches (AT = 1.2 K) provided polarity is not changed (this
initial AT decays quickly, figure 37)
.
The FEL 915 data in figure 38 track the FEL 1160 data, implying that the heating
mechanisms are qualitatively the same in these end members. In figure 39 are shown the2
hysteretic and electrocaloric components for FEL 1160 at 4.0 K plotted vs E . These data
show that at 4.0 K the hysteretic component is not only larger than the electrocaloric
component but is apparently increasing more rapidly with applied field. The electrocaloric
component is defined as the reversible part of the temperature change and the hysteretic
component is that which always causes heating. This definition assumes the nysteretic
heating is the same for both increasing and decreasing fields. Because the hysteretic
component is much larger than the electrocaloric component in figure 39, the inaccuracy of
the electrocaloric component is rather large. The first resolvable cooling effects were
seen at about 7 K. By 15 K, electrocaloric heating and cooling effects are well established,
and electrocaloric data are shown in figure 40 on FEL 1160 from 15 to 31 K.
Polarization measurements : All the SrTiO^ glass ceramics show qualitatively the same
behavior for P^(T) and Pt(E), where P is the total polarization. The most extensive polari-
zation studies were done on the FEL glass ceramics, however, so the representative curves
shown will be mostly for this material. Measurements of dc polarization for FEL glasses
crystallized at different temperatures are shown in figure 41 for a 3.6 kV/cm field applied
around 77 K. This pfc
(T) data and most subsequent P (T) data are normalized to P (T) = 1 at
4 K so the temperature dependence can be compared easily. The normalized values of P and
P are designated P^ and P , respectively, where P „ = P /P^ (4 K) . There is no maximum inr tN rN rN r t
P (T) evident above 4 K for any crystallization temperature. The slope of P does increase
with increasing crystallization temperature since pt(4) and 9P
tN/8T increases with increas-
ing crystallization temperature up to 1150°C. The 1160°C glass has a slightly smaller
3Pt/3T because the maximum value of P is smaller even though ^P
^N/^T ^ s larger. The maxi-
mum dP^/dT with crystallization temperature cannot be confirmed without more samples measure-
ments. None of the materials show any appreciable change of P with temperature below 10 K,
unlike that of K' . All of the materials with any temperature dependence of P displayed a
25 to 30% remanent at 4 K when the field was removed after cooling from 77 K. This remanent
was quasi-stable; a very slow but detectable decay was observed at constant T. This remanent
rapidly decreased as T was increased. The remanent curves approach P^ = 0 assymptotically
at some value of T above 77 K. Figure 42 shows normalized polarization curves measured at 3
91

COCO
CDCO
I
—
LOCM
II
i
LO
COII
CSlCD
LO
CO
CSJ
COTT
CDII
1—
1
LUk:-a
CO CM COCD
CMCD CD
CM
+CM
oM-4
rH OrH
t-4 oW •rl
4->
CJ
r-i 0)
O r-l
M-l •HTj
0)<!-
4->
4->
cd CO
>rH ocd
CO CO
Mcu a)
> r-l
U M•H
4J
•H a)
}-i
cd 4-1
rHo 14-1
a o
4J
ucd
aCOCU ^60 cu
fi &cd o
rHa
cu
13rH HCD
•HM-l CU
LO bCM-4 rH GO CTi cd
CO hJ a4-> wOCD rH
14-4 T3 cuiw C •HW cd
>l IV 3SIH 3HniVH3dlAI31 iua/A>| '3V
92
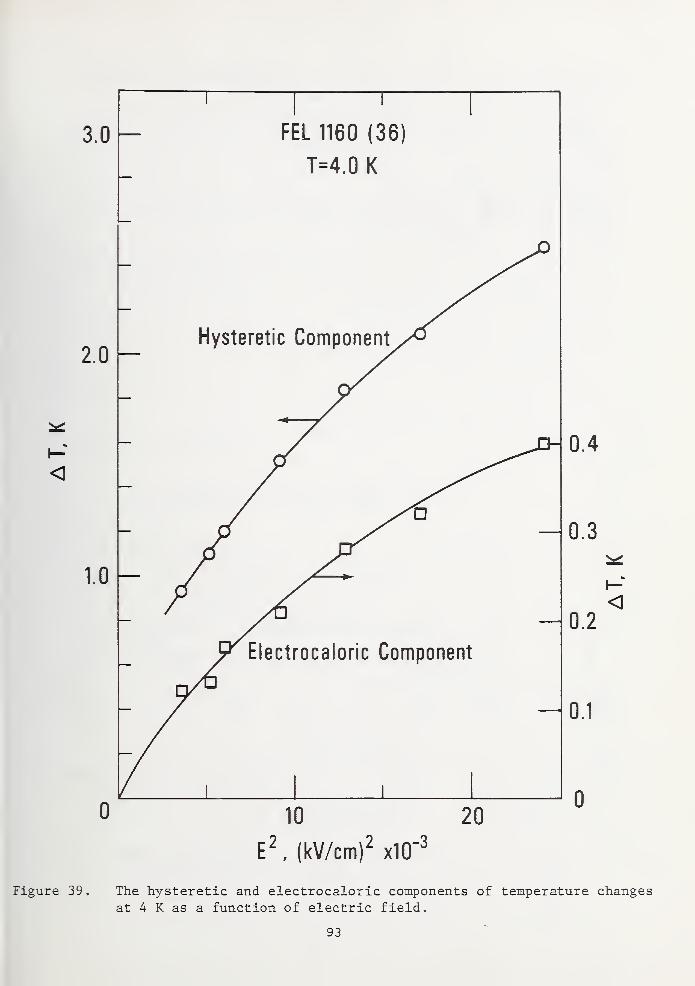
FEL 1160 (36)
T=4.0 K
E2
, (kV/cm)2
x10"3
Figure 39. The hysteretic and electrocaloric components of temperature changes
at 4 K as a function of electric field.
93
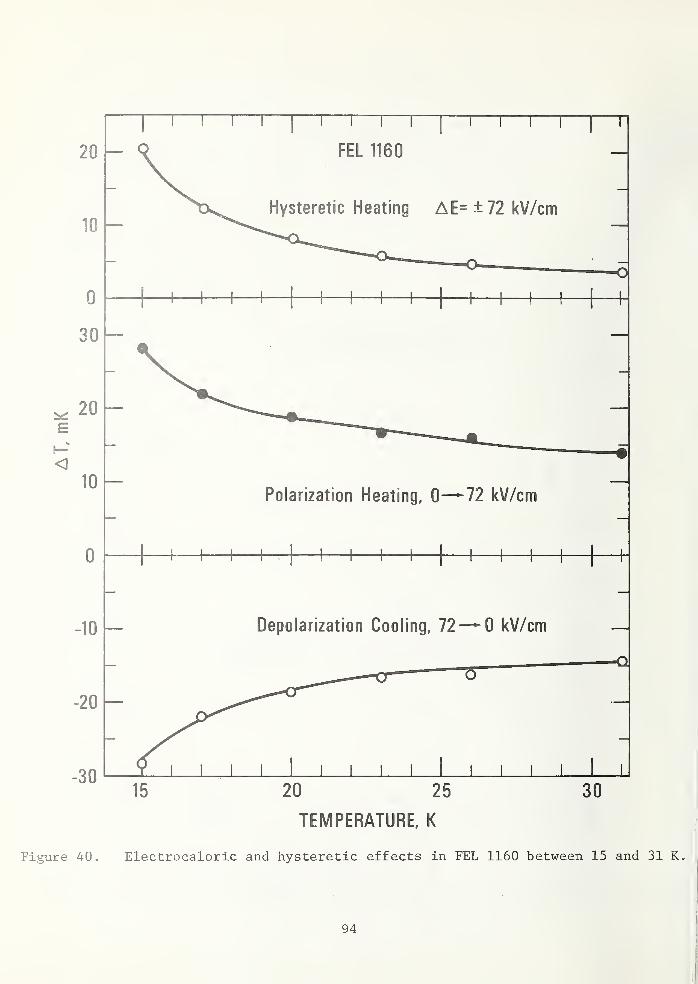
20
E
0
30
20
10 -
0
-10 -
-20 —
-30
i—i—
r
i—i—
r
FEL 1160
Hysteretic Heating AE= ±72 kV/cm
-| I— I
h H 1 h
Polarization Heating, 0—-72 kV/cm
H 1 h -\ 1 h
Depolarization Cooling, 72—^0 kV/cm
J I I I I I I L
Figure 40
,
20 25 30
TEMPERATURE, K
Electrocaloric and hysteretic effects in FEL 1160 between 15 and 31 K,
94

Temperature, K
Figure 41. Curves of P tN and Pr^ for FEL materials crystallized at varioustemperatures
.
Specimen P^(4 K),ycoul/cm E, kV/cm
FEL 915 0.0058 3.63FEL 1000 0.046 3.66FEL 1090 0.116 3.66FEL 1150 0.141 3.66FEL 1160 0.118 3.64
95

0 10 20 30 40 50 60 70 80
Temperature, K
Figure 42. Curves of PtI
r and Pr^ for FEL 1090 and various fields. Curve 1,
E = 3.7 kV/cm, P t (4 K) = 0.11 ycoul/cm2 ; Curve 2, E = 7.3 kV/cm,P t (4 K) = 0.18 ycoul/cm2 ; Curve 3 , E = 59 kV/cm, P t (4 K) = 0.89coul/cm2
; Curve 4, E = 167 kV/cm, P t (4 K) = 1.6 ycoul/cm2.
96

different field values for FEL 1090°C. The normalized slope decreases in magnitude with
increasing field. The relative magnitudes of compared to Pfc
at 4 K for voltages applied
at 77 K decreases from about 33% to about 14% as E is increased. The remanent appears to
approach the same percentage around 70 K for all three field values. The remanent was
measured once after applying a field of 167 kV/cm to the sample at 4 K. There was only a
very slight decrease, one part in nearly 700, in P^ upon warming the samples to 67 K. This
remanent may have resulted from a momentary breakdown of the FEL capacitor during the appli-
cation of the field. Such occurrences were observed during the breakdown tests. This would
leave a net charge on the standard capacitor when the high voltage lead is shorted. However,
sufficient remanent would be expected to remain on the FEL capacitor for a temperature
dependence to be observed even though it is superimposed on a leakage generated charge.
This question was not pursued any further.
Figure 43 shows normalized P^CT) and P^ (T) curves for three other glasses of approxi-
mately the same crystallization temperature. The P curves of FEP 1130 and FEL 1150 curves
are essentially co-linear though P is larger for FEL. Removing the niobate from FEP (FHN
1130) reduces the T dependence of P . The DXO 1199 glass ceramic (used for capacitance
thermometers) is unfairly displayed. It has twice the field applied to it because the plate
spacing was half that of the other capacitors. A rough estimate of the P curve at half the
field using the field dependent P data of figure 42 would bring the high temperature end of
this curve down to the FHN curve.
Hysteresis loops for FEL glasses to a field of ± 2.2 kV/cm are shown in figure 44. In
figure 45 the hysteresis loop is shown to fields of ± 228 kV/cm. The 0 to +345 kV/cm hys-2
teresis loop which has been offset by P^ = 1.0 ucoul/cm in figure 45, shows a very small
opening. This is further reduced if the field is not brought below 60 kV/cm. The maximum
field in the SrTiO is probably less than 30 kV/cm due to the presence of the glass matrix
with a low dielectric constant.2
The half width of the hysteresis loop in figure 44 is about 0.0034 ucoul/cm . This2
would be about 0.006 ucoul/cm for a field of 3.7 kV/cm. When 3.7 kV/cm is applied while2
cooling the sample from 77 to 4 K, the remanent is about 0.035 ucoul/cm , which is about 5
times larger.
For a period of time after a field is applied, the polarization increases with time.
In figure 46, Pt
(°°) - Pt(t), where t is time and P (») is the estimated P at t = <*>, is
plotted as a function of time after E is raised to 300 kV/cm from 240 kV/cm. The curve can
be approximated by two exponentials.
A maximum was observed in polarization measurements made while decreasing T if the
electric field was switched off at each temperature point to measure P . Figure 47 shows
the results of a P measurement of FEL 1150 for E first applied at 4 K and measured as T is
increased to 56 K. The temperature then was decreased and P measured without changing the
applied field. A peak is observed in P measured while increasing T. The 4 K to 56 K
section of the curve is a quasiequilibrium curve as P increases slowly with time up to the
peak, then decreases slowly with time above the peak. The peak of P occurs around 25 K
while the peak of K' at 1 kHz occurs at 35 K.
97
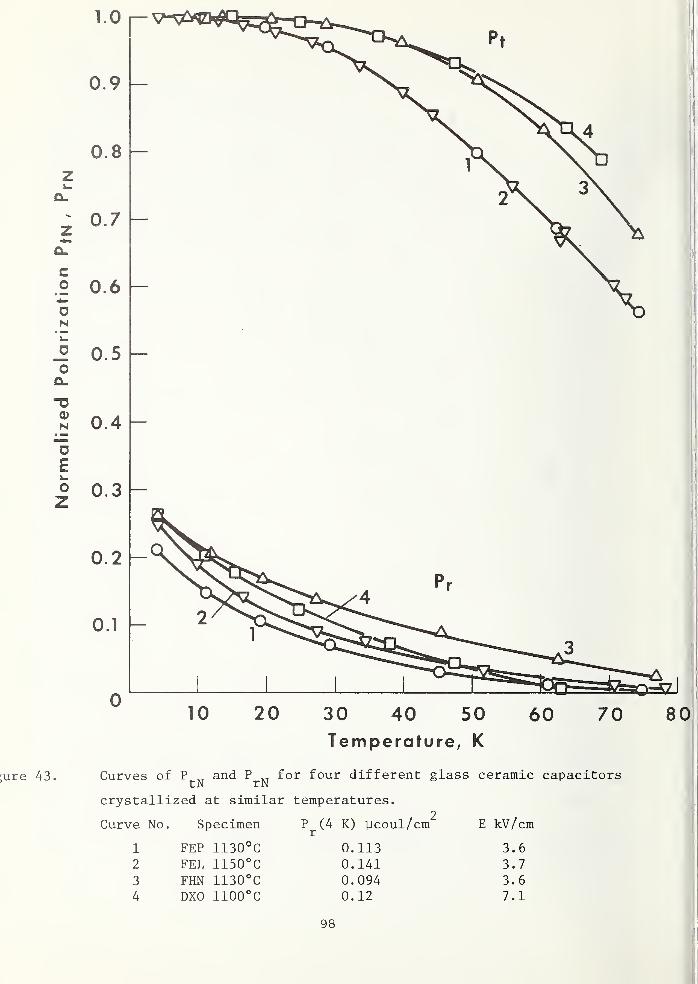
Temperature, K
Curves of P „ and P „ for four different glass ceramic capacitorstN rN
crystallized at similar temperatures.2
Curve No. Specimen Pr(4 K) ycoul/cm E kV/cm
1 FEP 1130°C 0.113 3.6
2 FEL 1150°C 0.141 3.7
3 FHN 1130°C 0.094 3.6
4 DXO 1100°C 0.12 7.1
98
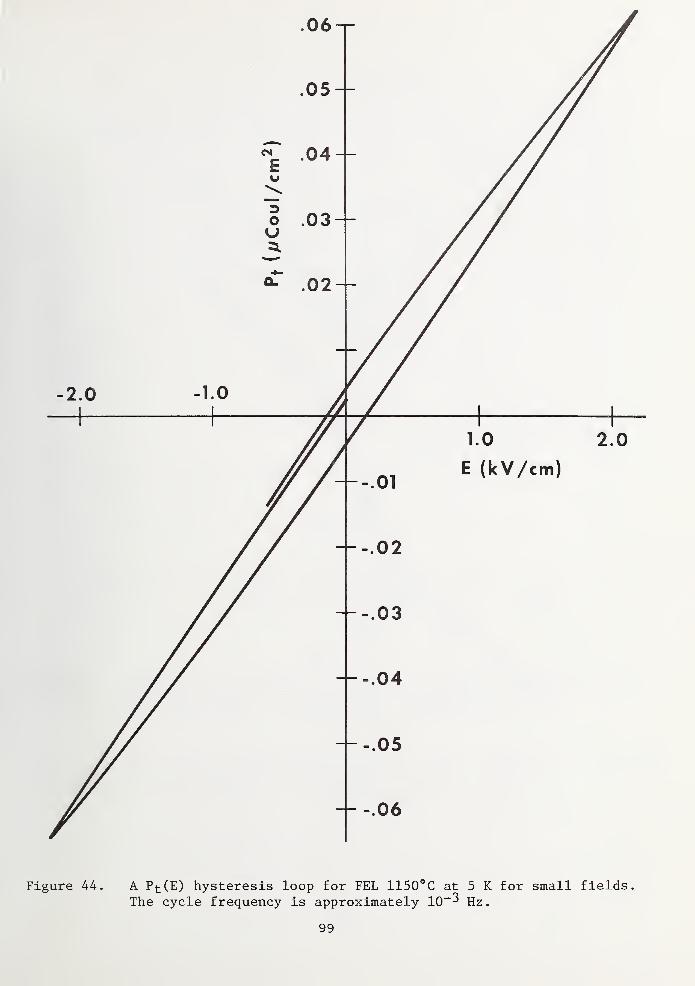
Figure 44. A P t (E) hysteresis loop for FEL 1150°C at 5 K for small fields.The cycle frequency is approximately 10~3 Hz.
99

-300 -200
200 300
E (kV/cm)
-^-2.4
Figure 45. Hysteresis loops of Pt(E) for FEL 1090 at 4 K and high field
strengths. The cycle frequency is about 10~3 Hz. The upper curve
is P t (E) for cycling E between 0 and maximum field. The zero of
the Ptscale is arbitrary.
100

1(T
FEL 1090
TIME, s
Figure 46. Change of P t of EEL 1090 with time after increasing the field to
300 kV/cm from 240 kV/cm. The data are plotted as [? t (~) " PtC*)]/P t
(oo) where PtC 33) is the estimated maximum value of Pt .
:::
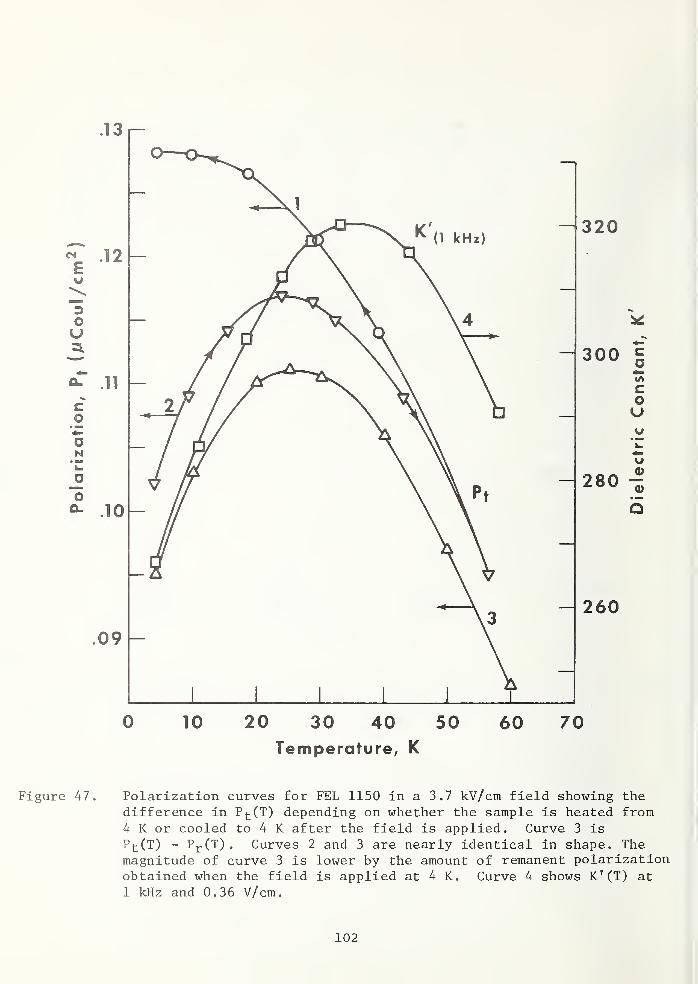
.13,-
10 20 30 40 50
Temperature, K
60 70
Figure 47. Polarization curves for FEL 1150 in a 3.7 kV/cm field showing thedifference in P t (T) depending on whether the sample is heated from4 K or cooled to 4 K after the field is applied. Curve 3 is
Pt(T) - Pr (T) . Curves 2 and 3 are nearly identical in shape. Themagnitude of curve 3 is lower by the amount of remanent polarizationobtained when the field is applied at 4 K. Curve 4 shows K'(T) at
1 kHz and 0.36 V/cm.
102

Judging from the results of K' (T) measured for FEL (1090) for four frequencies between
0.01 Hz and 10 kHz, figure 48, the peak in K' (T) for 0.01 Hz could be about 10 K lower than
the 1 kHz peak for FEL 1150 bringing it down to the same temperature as the observed peak in
Pt(T) warming. The curves of K' (T) of FEL (1090) show obvious dispersion. The loss tangents
measured were small and probably dominated by lead losses. Dispersion exists in other glass
ceramics as shown by the plot of C as a function of f in figure 49 for a DXO glass ceramic
at 3 K.
No cooling is possible in the temperature region where P has a positive slope (curve 2
in Fig. 47) since the field must be applied to cause cooling, but the P^fT) curve would then
follow a negative slope curve similar to curve 1. Only adiabatic depolarization cooling is
possible since Pt(T) always has a negative slope when the material is cooled. Such behavior
is consistent with the electrocaloric measurements.
Specific heat : The zero field specific heat of an unelectroded FEP sample cerammed at
1100°C is shown in figure 50. Specific heat measurements between 3 and 5 K on an unelectroded
FEL sample cerammed at 1100°C gave essentially identical results as the FEP sample. This
figure also shows the specific heat of a glass, fused SiO^, and the specific heat of a
single crystal SrTiO . The single crystal SrTiO^ specific heat curve is from unpublished
data by J. H. Colwell of NBS, Washington. The FEP glass-ceramic is approximately 50% SrTiC>3
and 50% glass phase, though the glass phase is an alumino silicate rather than fused SiO^.
The specific heat of the FEP glass-ceramic appears consistent with what would be expected of
a mixture of SrTiO^ and glass. The data show no indication of an anomaly in the range 3-20
K. A transition from an antiferroelectric state (or ferroelectric state) to a paraelectric
state would give rise to a peak in the specific heat at the transition temperature. Such
peaks are usually spread out somewhat in temperature, but the specific heat of FEP at 20 K
shows no apparent indication of any approaching peak at 33-40 K. The possibility of a sharp
peak at 33-40 K cannot be ruled out until zero field specific heat data are obtained in that
temperature range.
The specific heats of the two FEL samples used in the electrocaloric effect experiments
were measured at 4.4 K as a function of electric field. For an electric field of 220 kV/cm
the specific heat decreased less than about 5% compared with the zero field specific heat.
Thus the change in entropy at 4 K with electric field is also probably less than about 5%.
2 2From eq. (3.4) it can be seen that a decrease of C with electric field implies 3 P/3T < 0.
2 2A negative value of 3 P/3T at 4 K is also seen in the polarization measurements.
Thermal conductivity : The results of thermal conductivity measurements on several
different glass-ceramics are shown in figure 51. The results are typical of values seen in
glass or some plastics. Results on fused SiO^ are also shown in figure 51. The amount of
glass phase decreases from FEP to FEO to Code 9658. These results suggest that the ceramic
component contributes significantly to the thermal conductivity above about 7 K. Though the
thermal conductivity values are low in comparison with metals or single crystal dielectrics,
the values are sufficiently high that thermal equilibrium times in thin sections between
electrodes are much less than 1 second.
103

0 10 20 30 40 50 60 70 80 90Temperature, K
Figure 48. Curves of K'(T) at 4 frequencies between 0.01 Hz and 10 kHz for
FEL 1090. E = 3.6 kV/cm max. at 0.01 Hz and 0.036 kV/cm max. at
the higher frequencies.
104

(jd) aoueinedeQ
105

105
TEMPERATURE. K
Figure 50. Specific heat of unelectroded FEP 1100 SrTi03 glass-ceramic samplecompared with fused Si02 and single crystal SrTi03.
106

10-2
Eo
oa 10
-3
2x10"
Figure 51.
V
Machinable Glass
Ceramic, Code 9658
SrTi03 Glass Ceramic,
Code FED
SrTi03 Glass Ceramic,
Code FEP
Fused SiO
2
5 10
TEMPERATURE, K
20 30
Thermal conductivity of three different Corning Glass Works glass-ceramics as compared with fused SiG^. The slopes for T^ and T^ areshown in the graph for visual comparison.
107

3.7.2. KTa03Glass-Ceramics
Large crystallization yields of KTaO^ were realized in the glass-ceramic system K^O-
Ta^O^-Al^O^. The dielectric constants and their temperature derivatives were measured for
three different compositions, 75%, 80%, and 85% KTaO^. The 80% composition had nearly an
order of magnitude higher K' and 9K'/3T as the other two compositions. This composition
gave K' and 9K'/3T at 4 K of 731 and 9.4 K , respectively. The dielectric constant reached
a peak of about 800 at a temperature of 19.6 K. The behavior is thus qualitatively the same
as that of the SrTiO^ glass-ceramics. The loss tangent of 0.006 is quite low for this type
of research sample.
Polarization measurements on these samples were not possible due to the low dc resis-12
tance (< 10 Q) . Likewise reliable electrocaloric measurements could not be made on such
samples.
3.7.3. Single crystals
The difficulties in growing single crystals would make the proposed refrigerator more
difficult but not necessarily impractical. A study of some single crystals was done to
better understand the fundamentals of the dielectric behavior. In the case of the SrTiO^
glass-ceramics, measurements of Pt(T) showed that 3P
t/3T approaches zero well above 4 K.
Thus cooling at 4 K would not be expected, in agreement with the actual electrocaloric
measurements. Polarization measurements are much easier to make than electrocaloric measure-
ments, thus many of the subsequent materials were tested only by polarization. A material
with a relatively large 3Pt/3T at 4 K would then be a good candidate for cooling.
KTaO^: A KTaO^ single crystal obtained from Dr. Lou Grabner, NBS Washington, was
first tried in the P (T) apparatus and found to be conducting over the temperature range of
interest. All the measurements presented below for a single crystal were made on a single
crystal obtained from Dr. George Samara of Sandia Corporation.
In figure 52, Pt(T) and P^_ (T) are shown for the KTaO^ single crystal from 77 to 2 K at
fields of 0.25, 0.84, and 4.05 kV/cm. The polarizations again are normalized to P = 1.0 at
4 K. The data were taken without warming the crystal above 77 K after the initial cooldown.
Some hysteresis curves were run before the data for curves 2 and 3 were taken, then 2 and 3
were measured using the opposite polarity from 1. The application of a high field before
measuring the remaining two P (T) curves is most probably responsible for the relationship
of the P curves and the fact that P is higher at 77 K. In any case, there is a fairlyrN tN '
?8large remanent in this crystal also. There would be maxima in ITC, the ionic thermal
current, which is proportional to SP^/ST, in the 13 to 18 K range, unlike the glass ceramics
in which any ITC maximum appears to be below 4 K. The hysteresis was measured at 4 K at
about 0.001 Hz. The loop was wide initially then closed down by a factor of 6 after two
cycles. No saturation effects were evident at either 4 or 77 K, figures 53 and 54, and only
a very slight hysteresis appears at 77 K. Hysteresis was measured when the field on the
crystal was cycled between 0 and 3 kV/cm in figure 55. This loop opens more than the similar
loop for the FEL glass ceramic.
The change in temperature of the crystal estimated from P (T) for a field reduced from
15 kV/cm to 0 at 10 K is AT = 0.26 K. This can be compared to the measured value of about
0.3 K, which is discussed below.
108

u10 20 30 40 50 60 70 80
Temperature, K
Figure 52. Polarization temperature curves for the KTaC>3 single crystal forvarious applied fields
.
Curve 1, P t (4 K) = 0.076 ycoul/cm2
, E = 0.25 kV/cm;Curve 2, P t (4 K) = 0.23 ycoul/cm2
, E = 0.84 kV/cm;Curve 3, P t (4 K) = 1.27 ycoul/cm2 , E = 4.05 kV/cm.
109


Ill

112

Results of the electrocaloric measurements on the same KTaO^ single crystal are shown
in figure 56 as a function of temperature. The results are separated into the hysteretic
and reversible electrocaloric components. Addenda corrections have not been made for this
data, but such a correction could give intrinsic values about twice that shown. Figure 57
shows the same data as a function of electric field at T = 10 K. These electrocaloric
effects are considerably larger than those seen in the SrTiO^ glass-ceramic and about com-
parable to published values for single crystal SrTiO^.
The specific heat of the KTaO single crystal was measured with the results shown in3
figure 58. A rapid increase in C/T is observed from 2 K to 8 K, but such behavior is quite79
typical of many solids in this temperature range. Both adiabatic and pulse methods were
used as described in section 3.6.2. The agreement between the two methods serves as a check
on the accuracy. The results are expected to be accurate to about 5%.
_ 80TIBr and T1C1 : The dielectric constants of TIBr, T1C1, and Til were measured by Samara
between 76 and 400 K. All three materials show very similar behavior of the dielectric
constant, which increases with a decrease in temperature. At 76 K and below values of
3K'/3T are the order of -0.02 K1
compared to about -80 K1
for SrTiC^. Measurements in
this laboratory on T1C1 between 0.015 and 10 K show that the dielectric constant levels off
and becomes independent of temperature below about 3 K. The dielectric constant of TIBr is
expected to behave the same way in that temperature range. Such behavior is typical for a
material which remains paraelectric at all temperatures down to 0 K.
The electrocaloric effect in both T1C1 and TIBr were undetectable. This was to be
expected because of the small value of 3K'/3T. The specific heat of each of these materials
was measured between 2 and 20 K. The results for TIBr are shown in figure 59 and are similar
to that of T1C1. The peak in C/T^ is typical of most solids and will be discussed more in
section 3.8.
3.7.4. Ceramics
SrTiO^ and solid solutions: The polarization as a function of temperature was measured
for various SrTiO^ ceramics. Curves of Pt(T) and P
r(T) are shown in figure 60. The slope,
9PtN
/3T, of the KTaO^ single crystal is larger over the whole region below 40 K, though
3Pt/3T of SrTiO^ ceramics is larger by virtue of a higher value of P
fc
at 4 K. Unfortunately,
3Pt/3T is essentially zero at 4 K and so refrigeration at 4 K is not possible. All the
materials show a remanent though the temperature dependencies vary somewhat. The unique
feature of P^ of the SrTiO^ ceramics is that in three cases, P^ apparently changed sign.
A partial hysteresis loop for a SrTiC>3ceramic at 4 K is shown in figure 61. The
material seems to be less prone to breakdown than the KTaO^ single crystal so data could be
taken to higher fields. The first time the fields were applied momentary breakdowns
appeared at 14 and 24 kV/cm as shown. Subsequent cycles showed no further discontinuities.
The hysteresis loops for E between 0 and +30 kV/cm had small areas such as observed in the
glass ceramics.
Electrocaloric measurements were made on sample ST2(1450). The hysteretic heating
component and the reversible electrocaloric component were separated from the results and
shown in figures 62 and 63. The reversible electrocaloric component for this SrTiO^ ceramic
113

500i i .1 i
|i i i i
|
i I I I
|
I I I I
|I I I I
100
10 —
0
AE=15 kV/cm
KTa0 3
AE=4.1 kV/cm
Electrocaloric
Component
Hysteretic
Component
ATn oc 1/T
(Uncorrected
for Addenda)
10 15
TEMPERATURE, K
20 25
Figure 56. Electrocaloric and hysteretic effects in KTa03 single crystal for a
field change of 4.1 and 15 kV/cm.
114

Figure 57. Electrocaloric and hysteretic effects in KTaO-^ single crystal at
10 K as a function of electric field change.
115

116

25
5 -
02 5
]—i—i—i—i—|—i—i—
r
i i I i i i i I i i i i i i I i i i i
10 15 20
TEMPERATURE. K
25
Figure 59. Specific heat of TIBr single crystal between 2 and 22 K.
117

0 10 20 30 40 50 60 70 80
Temperature, K
Figure 60. Pt(T) and Pr (T) curves for various SrTi0 3 ceramic samples.
Curve E P t (4 K) P t (4 K)/E
No. Specimen (kV/cm) (yCoul/cm 2) (uCoul/kV cm)
1 Commercial grade 0.53 0.21 0.40
2 ST2 (1450) 0.46 0.33 0.71
3 ST2 (1350) 0.39 .064 0.16
4 ST3 (1450) 0.34 .068 0.20
118

8.0
0 5 10 15 20 25 30
Electrical Field (kV/cm)
Figure 61. A partial P^CE) hysteresis loop for SrTiC^ ceramic ST2 (1450) overthe field range 0 to +30 kV/cm. Discontinuities are due to momentarycharge leakage or breakdowns
.
119

1000
_o-\
I
I I JST2(1450)
500rV-1\
\- \
\
\
100
50
10
Figure 62.
\
\ •
\ 7.69 kV/cm
\\
AQh =213/*J-g-L
AQh=22.7-^"
\
\\\
Open Symbols - AT^
Closed Symbols - ATe
J I l_10
TEMPERATURE, K
15 18
Electrocaloric and hysteretic effects in SrTi03 ceramic as a functionof temperature for two different values of field change.
120

0 100 200 300 400 500 600 700
E2
, (kV/cm)2
Figure 63. Electrocaloric and hysteretic effects in SrTiC^ ceramic as a function
of electric field change for several temperatures.
121

is somewhat larger than that seen in KTaO^ single crystal, as predicted by the polarization
results. Total cooling effects of about 0.1 K were seen at 10 K. Without the hysteretic
component, a cooling effect of about 0.5 K would be expected at 10 K for a field of 23
kV/cm. Because of the hysteretic component, no cooling appears possible at 4 K in this
sample.
The specific heat of the ST2(1450) SrTiO ceramic is shown in figure 64. For the sake81 82 83
of comparison, the specific heat of single crystal and polycrystal ' SrTiO^ are also
shown in this figure. The reason for the slight upturn in the ceramic curve below 4 K is
not clear, but it could be a result of the specific heat of metallic impurities such as
iron. The impurity level in this ceramic is probably on the order of 1%, which is large
enough to account for the upturn in the specific heat.
Also shown in figure 64 are specific heat curves for vanadium doped SrTiO^ ceramics.
This doping appears to increase the specific heat to some extent, though anomalous effects
begin to dominate below about 4 K. The higher specific heat of the vanadium doped samples
could mean a higher entropy would be available for refrigeration at 4 K. That would be true
only if the additional specific heat is electric field sensitive. Polarization measurements
would be able to indicate if the additional specific heat and entropy are field dependent.
The SrTiO. ceramics containing various amounts of SrV_0. or SrNb-O,. show dc polariza-3 z o z b
tions that have less T dependence than nominally pure SrTiO^ ceramics. Curves of Pt<T) are
shown in figure 65 for STV(IO) and STV(20) compared to nominally pure SrTiO^ and in figure
66, curves for STN(IO), STN(20) and STN(30) are shown compared to a nominally pure SrTiC>3
ceramic made at the same T. A couple of points on the remanent curve for a few of the
samples were measured. The STV(IO) and STN(30) specimens have very large remanents. The
polarization measurement was repeated a second time for STV(IO) to measure in more de-
tail. The results are plotted in figure 65 along with the earlier data. The temperature at
which the field was applied was higher in the earlier measurement so both P^_ and P^ were
reduced at 4 K. The fact that P^ seems to drop below 0 will be discussed later.
Hysteresis curves were then measured for the STV(IO) sample at 4 K, 39.4 K and 70 K,
figure 67. The maximum field applied at 4 K is almost 10 times the field that was applied
at 70 K to measure Pfc
(T) while cooling. After cooling the sample to 4 K, however, the two
remanents are about the same size. This was observed before for some of the glass ceramics.
The magnitude of Pfc(4 K) is dependent on the temperature at which the field is applied.
This was noted but not appreciated in the initial glass ceramic measurements. The first
actual measurement of Pt(T) when the field was applied at 4 K for the first time was for
this STV(10) sample. The dielectric constant was measured first and found to have a peak at
about 45 K about 1.5 times larger than the 4 K value in figure 68. The polarization, Pt
,
shows a similar peak, figure 68, when the field is applied at 4 K and P is measured while
warming. The curve is a quasi equilibrium curve since P increases slowly with time at
temperatures below the peak and decreases slowly with time at temperatures above the peak.
The curve of Pt(T) after the field is applied at the high temperature end seems to be Stable
with time. Subtracting Pr(T) from P^tT) measured while cooling gives a curve the same as
P (T) warming. Measurements of K' (T) for four frequencies between 0.01 Hz and 10 kHz are
shown in figure 69 for the STV(10) sample. The applied maximum field was 10 times larger
122

1 5 10 50
TEMPERATURE, K
Figure 64. The specific heat of SrTiC^ ceramic and SrTi03 ceramic doped withvarious amounts of V. The behavior of single crystal"-'- and
O O Q Opolycrystal 0 ^ °-> SrTiC^ from other measurements are shown forcomparison.
123
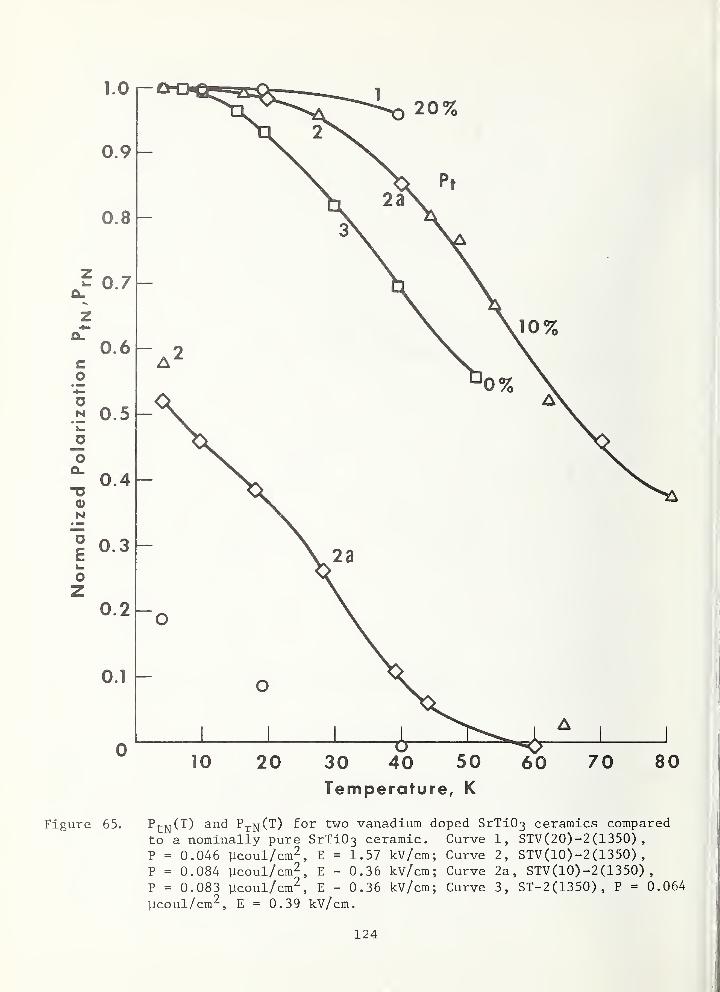
Temperature, K
Figure 65. P tN (T) and PrN (T) for two vanadium doped SrTi03 ceramics comparedto a nominally pure SrTi03 ceramic. Curve 1, STV(20) -2 (1350)
,
P = 0.046 Ucoul/cm2, E = 1.57 kv/cm; Curve 2, STV(IO) -2 (1350) ,
P = 0.084 ycoul/cm2, E - 0.36 kv/cm; Curve 2a, STV(10)-2(1350)
,
P = 0.083 ucoul/cm2 , E - 0.36 kV/cm; Curve 3, ST-2(1350), P = 0.064
ucoul /cm2 , E = 0.39 kV/cm
.
124

10 20 30 40 50 70 80
Temperature, K
Figure 66. PtN and PrN for SrTi03 containing Srltt^O^ compared to a nominallypure SrTi03 ceramic.
"rvee P (4 K) ycoul/cm
2E(kV/cm)
No . Specimen t
1 STN(30)-1(1450) 0.031 0.37
2 STN(20)-1(1450) 0.028 0.35
3 STN(10)-1(1450) 0.026 0.39 >
4 ST2-(1450) 0.33 0.46

_ .5CM
Eu
^ -4 +ou3.
c» rwm
oN
o
.3
-3.0 -2.0 -1.0
70K
— -.1
— -.2
-.3
~-.4
1.0 2.0 3.0
Electric Field (IcV/cm)
-.5
Figure 67. P t (E) hysteresis curve for STV(IO) at 4, 39.5 and 70 K. The 39.4 K
loop opening is the same as the opening at 4 K. At 70 K the loop
opening was only 1/5 that at lower T.
126

0*ooK«om^-cocNoooooooo( 2ujD/|noDrY) *j 'uojjdz u d joj
Figure 68. The P t (T) curves for STV-10 for E = 0.36 kV/cm. Curve 1, field
applied at 81 K then the sample was cooled. Curve 2, field applied
at 4 K then the sample was warmed. The diamond points on curve 2
are from Pt (T) - P r (T) for curve 2a of figure 65. Curve 3, K T
measured at 10-^ Hz
.
127
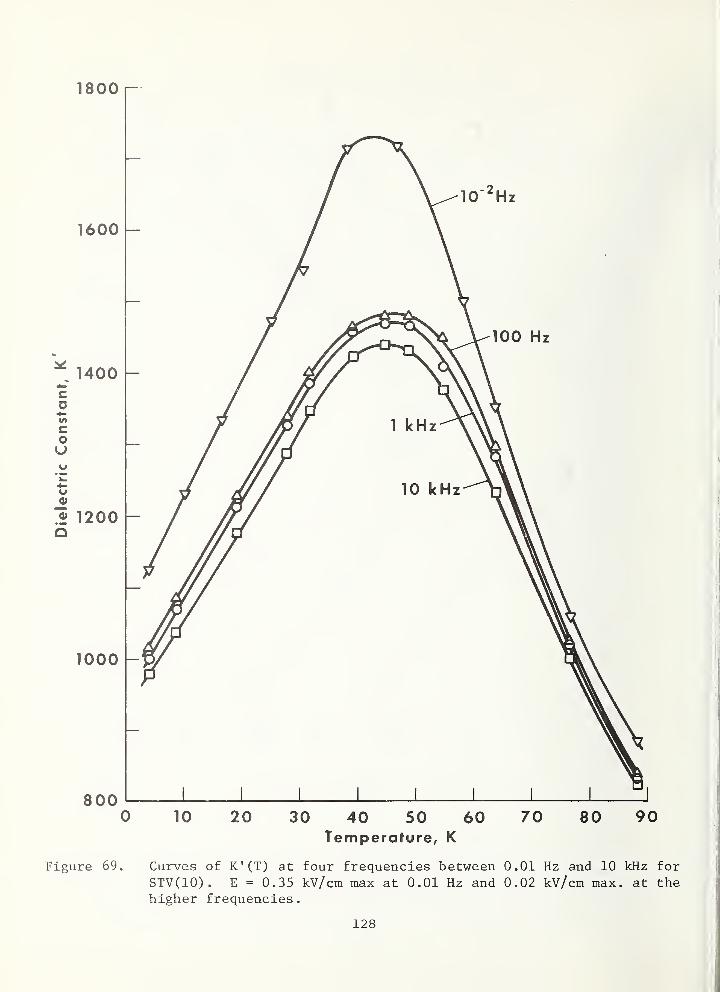
0 10 20 30 40 50 60 70 80 90Temperature, K
Figure 69. Curves of K'(T) at four frequencies between 0.01 Hz and 10 kHz for
STV(IO). E = 0.35 kV/cm max at 0.01 Hz and 0.02 kV/cm max. at thehigher frequencies.
128
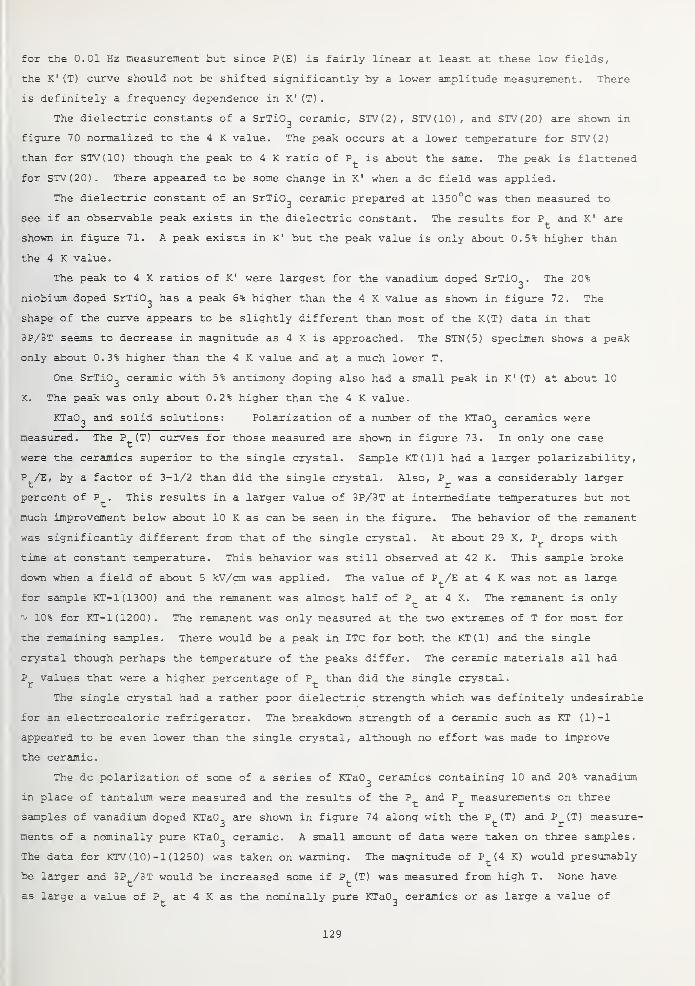
for the 0.01 Hz measurement but since P(E) is fairly linear at least at these low fields,
the K' (T) curve should not be shifted significantly by a lower amplitude measurement. There
is definitely a frequency dependence in K' (T)
.
The dielectric constants of a SrTiO^ ceramic, STV(2), STV(IO), and STV(20) are shown in
figure 70 normalized to the 4 K value. The peak occurs at a lower temperature for STV(2)
than for STV(IO) though the peak to 4 K ratio of P is about the same. The peak is flattened
for STV(20). There appeared to be some change in K' when a dc field was applied.
The dielectric constant of an SrTiO^ ceramic prepared at 1350°C was then measured to
see if an observable peak exists in the dielectric constant. The results for P and K ' are
shown in figure 71. A peak exists in K' but the peak value is only about 0.5% higher than
the 4 K value.
The peak to 4 K ratios of K' were largest for the vanadium doped SrTiO^ . The 20%
niobium doped SrTiO^ has a peak 6% higher than the 4 K value as shown in figure 72. The
shape of the curve appears to be slightly different than most of the K(T) data in that
3P/3T seems to decrease in magnitude as 4 K is approached. The STN(5) specimen shows a peak
only about 0.3% higher than the 4 K value and at a much lower T.
One SrTiO^ ceramic with 5% antimony doping also had a small peak in K' (T) at about 10
K. The peak was only about 0.2% higher than the 4 K value.
KTaO^ and solid solutions: Polarization of a number of the KTaO^ ceramics were
measured. The Pt
(T ) curves for those measured are shown in figure 73. In only one case
were the ceramics superior to the single crystal. Sample KT(1)1 had a larger polarizability
,
Pt/E, by a factor of 3-1/2 than did the single crystal. Also, P was a considerably larger
percent of P . This results in a larger value of 3P/3T at intermediate temperatures but not
much improvement below about 10 K as can be seen in the figure. The behavior of the remanent
was significantly different from that of the single crystal. At about 29 K, P drops with
time at constant temperature. This behavior was still observed at 42 K. This sample broke
down when a field of about 5 kV/cm was applied. The value of P /E at 4 K was not as large
for sample KT-K1300) and the remanent was almost half of P at 4 K. The remanent is only
^ 10% for KT-K1200). The remanent was only measured at the two extremes of T for most for
the remaining samples. There would be a peak in ITC for both the KT(1) and the single
crystal though perhaps the temperature of the peaks differ. The ceramic materials all had
P^ values that were a higher percentage of P than did the single crystal.
The single crystal had a rather poor dielectric strength which was definitely undesirable
for an electrocaloric refrigerator. The breakdown strength of a ceramic such as KT (1)-1
appeared to be even lower than the single crystal, although no effort was made to improve
the ceramic.
The dc polarization of some of a series of KTaO^ ceramics containing 10 and 20% vanadium
in place of tantalum were measured and the results of the P^ and P measurements on threet r
samples of vanadium doped KTaO^ are shown in figure 74 along with the Pfc
(T) and P^CT) measure-
ments of a nominally pure KTaO^ ceramic. A small amount of data were taken on three samples.
The data for KTV (10) -1 (1250) was taken on warming. The magnitude of P (4 K) would presumably
be larger and 3Pt/3T would be increased some if P (T) was measured from high T. None have
as large a value of P at 4 K as the nominally pure KTaO^ ceramics or as large a value of
129

0)
b^s co
CNCO
« 4->
O C•H
00 Od a•Hd T3•H03
-Ul
do
o00
«
oiH II
v >
> ^C/3 <f
O -
II omO ^ Hon cu CMo•H H HEHHE/D
S oS-l £O •H CJ rHIW a o-»
co >4-1
II
•H4J
rou 00CO 0. O
•HiH O II
03
O H u w4J a P
cu wTD \
0) CNN +J
•H 3 •H >rH •H HtO T)6 CTJ
u fi oO CO CN OC > >
EH Ho cnCsl II
MH MHo o
aCO CO
CD
>QJ
d ou H 4-J
N » '4UD4SU03 Dijpd|8g(3 paziptujofsj
o
a)
IH
doo•HPL4
130

0 2 4 6 8 10 12 14 16
Temperature, K
Figure 71. K' (T) and P t (T) curves of ST 2(1350) normalized to 1 at 4 K.
There is a very small peak at about 6 K observed in K '
.
131

0 10 20 30 40 50 60 70 80
Temperature, K
Figure 72. P t (T) and K*(T) for STN ceramics. Curve 1, K f (T) of STN(20)
,
K' (4 K) = 1370. Curve 2 P t (T) of STN(20) , E = 0.35 kV/cm,
Pt (4 K) = 0.0028 ycoul/cm^. Curve 3, K'(T) of STN2
.
K' (4 K) = 1702.
132
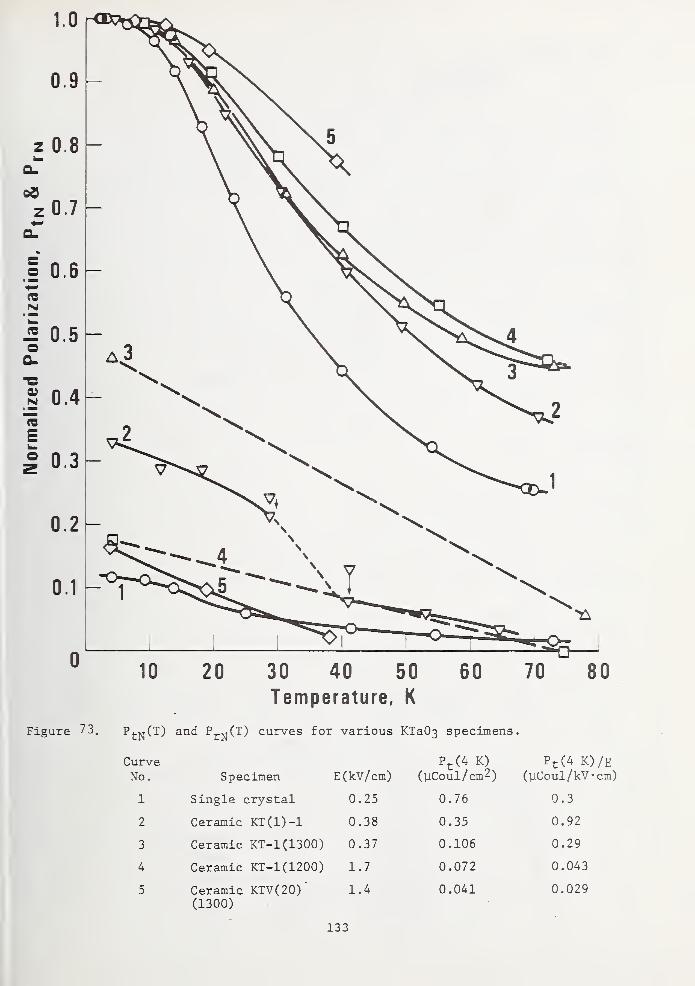
010 20 30 40 50 60 70 80
Temperature, K
Figure 73. PtN (T) and P r^(T) curves for various KTa03 specimens.
CurveNo. Specimen E(kV/cm)
Pt (4 K)
(yCoul/cm 2)
P t (4 K)/ E(yCoul/kV'cm)
1 Single crystal 0.25 0.76 0.3
2 Ceramic KT(1)-1 0.38 0.35 0.92
3 Ceramic KT-1(1300) 0.37 0.106 0.29
4 Ceramic KT-1(1200) 1.7 0.072 0.043
5 Ceramic KTV(20) ' 1.4(1300)
0.041 0.029
133

0)N75E
0.3
0.2
i 10 20 o 40 50 60
Temperature, K
n so
Figure 74. P t^ and PrN for vanadium doped KTaO-^ ceramics compared to a nominallypure KTaO^ ceramic, curve #4,
CurveNo.
1
2
3
4
Specimen
KTV(20)-1(1250)
KTV(10)-1(1250)
KTV(20)-1(1300)
KT-1(1300)
P (4 K)y Coul/cm"
.0093
.027
.041
.106
E(kV/cm)
0.42
1.38
1.40
0.37
134

3P/3T. The dielectric constant of KTV (20) -1 (1300) was measured at 1 kHz. The normalized
curve of K' (T) is shown in figure 75 and compared to ptN
- There is a peak in K' at about
12 K. The dielectric constant shows a field dependence.
Polar ceramics: A well known series of polar ceramics is that of the PbZr Ti, 0„x 1-x 3
(PZT) system. The system is ferroelectric at room temperature for x < 93% but for x > 93%84
the system is antiferroelectric. The antiferroelectric 95/5 PZT is interesting for this
program since hysteresis effects should be small. Polarization measurements at low tempera-
tures had not been done previously. However, the high ordering temperature would suggest
that 3P/3T is small at 4 K.
Measurements of P(T) below 77 K were made for both 65/35 PZT and 95/5 PZT with very
similar results. Both showed negative 3P/3T values, but for the antiferroelectric 95/5 PZT
the slope should be positive. We have no explanation for the observed behavior except to
say that 95/5 PZT appears to be a ferroelectric below 77 K.
Electrocaloric measurements were made on the 95/5 PZT sample with depolarization result-
ing in cooling. Such an effect is consistent with the observed negative 3P/3T. Figure 76
shows the results of the electrocaloric measurements made at 12 K and figure 77 shows the
temperature dependence of the electrocaloric effect. This material showed only heating
effects at 4 K. The specific heat is shown in figure 78. The effective Debye temperature
varies from 185 K at low temperatures to 119 K at the peak in C/T3
.
Pb_Nb„0_ type ceramics: The dc polarizations of PCTT (Pb_Cdn,_Ti
n. TaO.) , PN (Pb_Nb„0_)
,
2 2 1 2 1/ 2 1/2d 2 2/and CCN (Cd CrNbO ) are shown in figure 79. The remanent was measured at only one temperature
2 o
on each. Only CCN showed appreciable Pr
and that was measured only at 48 K. The remanent
for PN is zero at 4 K to within the limits of the resolution of the measuring system. Both
PCTT and PN exhibit the typical Pfc
(T) curve. The magnitude of Pfc
(T) asymptotically approaches
the limiting valve at 4 K. It has been suggested that PCTT is an antiferroelectric below85
the peak in K' (T) at 40 K. A discontinuity appears in the P (T) of CCN somewhere between86
31 and 42.5 K. A discontinuity appears in the K' (T) measurements also but at a temperature
of about 25 K.
Detailed measurements were made on Pb Nb 0 . A peak was noted in K' (T) at 15.4 K for a87 2 2 7
1 kHz measuring frequency. In figure 80, P (T) and K' (T) at a number of frequencies are
plotted as a function of T on a much expanded scale. This work shows a peak at about 17 K
but the percent decrease of the 1 kHz value of K' (T) at 2 K from the peak value is almost87
exactly the same as measured by Hulm, about 2.6%. This peak has been attributed to an
antiferroelectric phase transition. If an antiferroelectric transition takes place, then
Pfc
(T) should decrease with decreasing temperature. There was no apparent decrease in P^(T)
except in one measurement, curve P, figure 80 which rules out an antiferroelectric transition.
Perhaps the measuring field used destroyed the antiferroelectric ordering. Measurements of
P were made at a field less than 1/3 the field used for the data in figure 80. No peak was
observed in P (T) . Also, neither the slope or magnitude of K' (T) were changed by applying a
steady electric field during the measurement. Furthermore, a hysteresis loop was measured
at 4 K to E = ± 7 kV/cm, figure 81. pt
(E ' is linear with E over this range and there is no
loop opening to within the uncertainty of the instruments. If an antiferro- to ferroelectric
transition is caused by the dc field, there should be hysteresis loops above some value of E.
135

36 \
CO«—
'
c/>
coou
OS
o
20 30 40
Temperature, K
50
Figure 75. Details of PfcN
and Kvr for KTV(20) -1 (1300) . The P t-Pr curve is
calculated from the data for curves 3, figure 73,
field applied reduces K'
.
A steady state
136

Hysteretic Heating
0 100 200 300 400 500
E2
, (kV/cm)2
Figure 76- Electrocaloric and hysteretic effects in 95/5 PZT at 12 K as a
function of electric field change.
137
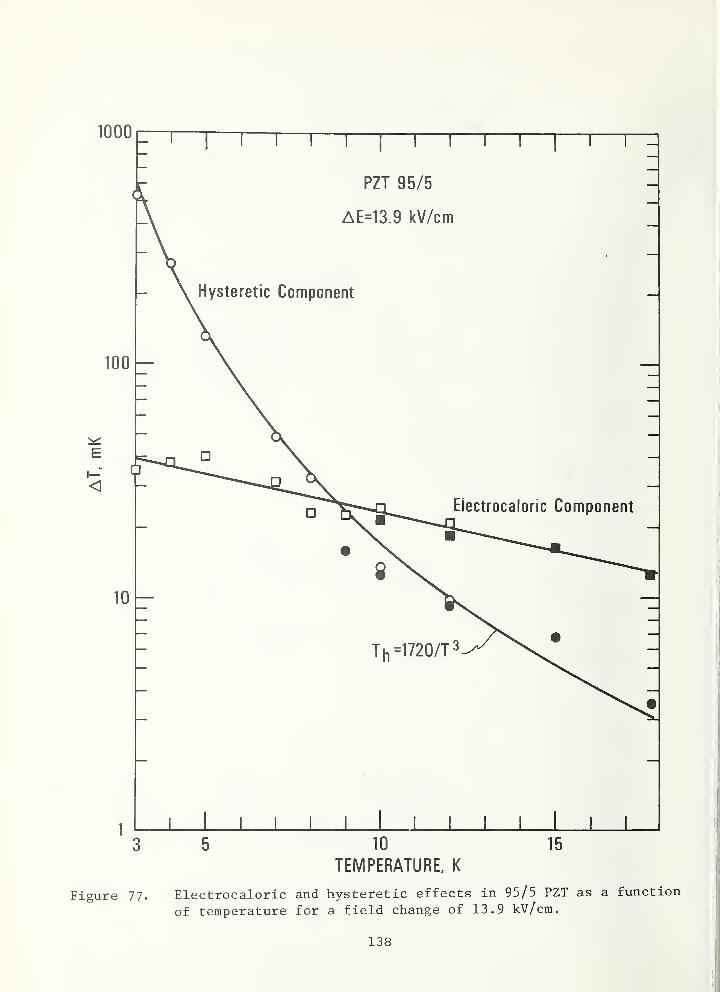
l! I I I
—
\
—I—I—i—I
—
\
—i—
r
-:
3 5 10 15
TEMPERATURE, K
Figure 77. Electrocaloric and hysteretic effects in 95/5 PZT as a function
of temperature for a field change of 13.9 kV/cm.
138

Figure 78. Specific heat of PZT 95/5 between 2 and 23 K.
139

0.8
08 0.7
1-1
Q.
~ 0.6©CO
to
©Q_
to
E
0.5
0.4
0.3
0.2
0.1
10 20 30 40 50
Temperature, K
60 70 80
Figure 79. Pt(T ) °f tne pyrochlores Pb2Nb20y and Cd2CrNb06, and the antiferro-electric perovskite Pb2Cd^^2Ti-L^TaO^ . This latter material showsno evidence of any antiferroelectric ordering over the range measured
CurveNo.
1
2
3
Specimen
Pb2Nb
2°7
Cd2CrNb0
6
Pb2Cd
l/2Ti
l/2Ta0
6
Pt (4 K)
2(UCoul/cm )
0.0066
0.016
0.021
E (kV/cm)
1.47
0.30
1.0
140

0 10 20 30 40 50 60Temperature, K
Figure 80. Polarization and dielectric constant of PD2ND2O7 on an expanded axis.The polarization curve is for a 1.47 kV/cm electric field. 'The
K'(T) curve at 1 kHz and = 0.44 kV/cm was unchanged from the
zero steady state field curve when a 1.47 kV/ cm field was applied.The other K'(T) curves were measured at the same field amplitudeexcept the 0.01 curve, for which Emax = 1.47 kV/cm.
141

142

This result along with the lack of a maximum in Pfc
(T ) suggests that neither a ferro- nor
antiferroelectric transition takes place around the maximum of K' (T) . In figure 80, K' (T)
is shown for frequencies of 10, 1, and 0.1 kHz as well as for a frequency of about 0.01 Hz.
The curve of K 1 (T) at 0.01 Hz was determined by measuring hysteresis loops at a series of
temperatures with the dc polarization instrument. The dielectric constant measured using
the dc system gave a slightly lower value for K' at higher T. This curve is raised by 0.8%
to place it slightly above the higher frequency K' values at 52 K. The voltage out of the
electrometer read by the DVM was found to be ^ 1% low for one polarity which agrees with the
correction made. The observed loss tangents are quite small but increase monotonically with
decreasing T by about a factor of 100 when an estimated lead loss is subtracted. The in-
crease in tan 6 and the dispersion in the K' (T) curves along with the dc polarization mea-
surements suggest that the peak in K' (T) is the result of a dielectric relaxation mechanism
rather than an ordering transition.
The specific heat of the Pb2Nb.,0^ ceramic is shown in figure 82. Measurements were
made for E = 0 and E = 27.3 kV/cm. To within the precision of about 1%, there is no dif-
ference in specific heat for the two electric field values. Such behavior argues against
the material being in an antiferroelectric state below 15 K. Also, the lack of an anomaly
in the specific heat seems to suggest no transition to the antiferroelectric state. Thus,
both the polarization measurements and the specific heat measurements are consistent with
each other and indicate the material remains in the paraelectric state down to at least 3 K.
3.8. Discussion of Experimental Results
Several questions have been brought to light by the measurements in this program. In
this section we discuss and attempt to explain the following observations, (i) the lack of
cooling in SrTiO^ glass ceramics at 4 K, (ii) the agreement between polarization and electro-
caloric measurements, (iii) the peak in the dielectric constant in most dielectrics at low
temperatures, (iv) the reason for the remanent polarization in most dielectrics at low
temperatures, and (v) the specific heat and its relation to electrocaloric refrigeration.
Then finally we make some general conclusions regarding the low temperature behavior of
dielectrics and the potential of electrocaloric refrigeration.
Adiabatic polarization cooling of SrTiO^ glass ceramics was predicted because of large
positive values of 3K'/3T at 4 K. The polarization calculated from K' , assuming no remanent,
would also have this positive slope. However, actual measurements of P on glass ceramics,
ceramics, and single crystals not only showed the presence of hysteresis, but also no sign
of a positive slope in P(T) when cooled in a field. Electrocaloric measurements agreed well
with that predicted from measured P(T) data. What then gives rise to the peak in the dielec-
tric constant and the remanent polarization?
3.8.1. Dielectric properties66
Earlier measurements of the electrical properties of SrTiO by Weaver have shown88
hysteresis in the P-E data up to 45 K. Burke and Pressley saw hysteresis in the P-E
curves with stress applied and attributed the hysteresis to surface charge build up. Saifi
and Cross^ have measured apparent antiferroelectric hysteresis loops in some cases. Earlier89
work on ceramic SrTiO^ showed a peak in K' (T) in one case but not in another.
143

TEMPERATURE, K
Figure 82. Specific heat of PD2ND2O7 ceramic between 3 and 23 K in zero fieldand in a field of 27.3 kV/cm. The arrow indicates the temperatureof the observed peak in K' (T)
.
144

Similar results have been obtained for KTaO . A peak in K' (T) was observed originally90 91
by Hulm, et al. Recent measurements by Demurov and Venevtsev have shown a peak at 10 K.
92Dielectric measurements in this laboratory on the single crystal of Samara and Morosin
showed a slight peak in K' (T) at 3 K. Hysteresis loops have been observed in P-E curves up
to 56 K.91
There exists no model of electrical behavior for SrTiO^ or KTaO^ that explains hysteresis
or peaks in K' (T) without assuming a ferroelectric or an antiferroelectric transition. In
this section, a model consisting of permanent dipoles, due to impurities, that have an
electret state and give rise to dielectric relaxation effects will be proposed and used to
explain the behavior of the materials measured here. The model also explains the presence
of apparent ferroelectric hysteresis curves without requiring an ordering transition.93
The total polarization per unit volume, Pfc
, can be described as the sum of three parts,
P = P + p + pt e a d
where P is the polarization due to displacement of the electrons, P is the polarization6 Si
due to displacement of the atoms, and P^ is the polarization due to alignment of any perma-
nent dipoles. For many substances, all the temperature dependence of P comes from the
dipole term. Any T dependence in P^ is negligible. For many materials the only T dependence
in P^ would be expected to come from lattice transformations or thermal expansion. The
thermal expansion contribution would be expected to be small compared to the T dependence of
the dipole term. For the soft mode materials such as SrTiO^ and KTaO^, however, P^ can have
a larger T dependence than the dipole term. The Pt(T) measurements reported here show
3Pt(T)/3T = o for all specimens at 4 K so both P^ and P^ are T independent at 4 K. The
P^CE) data taken at 4 K should only measure the stretch of the electronic and atomic dipoles.
If the dipoles are in harmonic potential wells, the pt(E) curves should be linear until
electrical breakdown occurs. The fact that the curves deviate from linearity at high fields
suggests anharmonicity due to a flat bottomed potential well, which would be expected for
soft mode materials. The shape of the P(E) curves in the T independent region tell nothing
about the electrocaloric cooling capabilities of the material.
Measurements of P (T)] for a number of applied fields should have been made to highert E
fields to determine 9P/3T as a function of E in the temperature region of interest. The
data on the KTaO^ single crystal show only that P is about proportional to E up to E = 4
kV/cm for all temperatures. Some correction may be required for the temperature dependence
of the remanent since it adds a nonreversible part to Pt
- This correction would be expected
to be large for the glass ceramic where most of the T dependence is associated with the
remanent.
Because of the lattice symmetry, there are presumably no permanent dipoles in puref
SrTiO^ and KTaO^ . Since remanent polarizations and hysteresis effects are present in the
materials, permanent dipoles of some sort must exist in these samples.
Usually, a peak in K' (T) is assumed to indicate a transition to ferroelectric or anti-
ferroelectric ordering. If the ordering is antiferroelectric then both pt(T) and K' (T)
145

should decrease below the transition temperature. Since P^.(T ) does not decrease with T for
any of the specimens measured here, an antiferroelectric state is immediately ruled out.
The observed T dependence of K 1 and do not exclude a ferroelectric phase, but P (T) does
not behave as would be expected. The remanent would be expected to remain nearly constant71
as T increases then decrease rapidly to zero at the Curie temperature, T , as seen by Gesi
using the same dc technique. The polarization must go to zero around the same temperature
that the peak of K 1 (T) occurs, though there can be some asymtotic behavior at T^ if there is
a spread of transition temperatures in the material. Contrary to the expected behavior, the
SrTiO^ and KTaO^ materials showed the most rapid decrease of P (T) with increasing T at the
lowest temperatures. Then P^fT) asymtotically approaches zero at temperatures well above 77
K, though the peaks of K' (T) occur from 6 K to 45 K. In addition, some of the Pr(T) data
reverse sign. Only a formation of domains that proceeds rapidly at low T then slows down at
higher T could account for such behavior. If domains form and the domain walls move so
easily, then the walls should move easily under fields. The P(E) data, however, show no
sign of saturation at the highest fields applied indicating that domain walls do not move
easily or do not exist.
An alternative cause of the K' (T) peaks might be dielectric relaxation. A simple model
for the peak in K' (T) is that motion of the dipoles in the material is increasingly inhibited
as the temperature decreases and also they are less able to follow a field at constant T as
the frequency increases. A decrease in dielectric constant and an increase in dissipation94
results. This was first reported by Skanavi and Matveeva for impurity doped SrTiO^ and
was later observed by Tien and Cross^"' and Johnson, Cross and Hummel^ for a number of97
different impurities in SrTiO^. Nomura and Kojima have observed similar effects in some
tantalates and niobates containing potassium, bismuth and magnesium. The dielectric relaxa-
tion effects in solids have been observed mainly in the perovskites. The peaks in the
dielectric constant are accompanied by a large increase in dissipation. The loss tangents
observed in the specimens measured in this work increased as T decreased. Detailed results
were not obtained because the loss tangents were small and apparently dominated by lead
losses. There was some insensitivity to the dissipation factor also, perhaps because of the
poor lead shielding in the cryostat.
The observed remanent polarization is not a necessary result of relaxation effects but
is probably the cause of them. The perovskites are nonpolar prior to a ferroelectric tran-
sition. There is another common source of polarization in dielectrics known as the electret
state. There is not a large number of papers in the literature dealing with the electrets
probably because they are commercially important. Some review papers on electrets have been98-101
published.
Electrets are sometimes specified by the activating process used in their formation.
Those formed by lowering the specimen temperature in a field are called thermoelectrets.
Their formation is thought to result from the trapping of charge or dipoles in a material
after it had been cooled in the presence of an electric field. The dipoles would be trapped
so they cannot freely rotate, or charge may be trapped on the surface, at defects or on
grain boundaries. It may be difficult to establish which mechanism or how many of the
mechanisms are causing the remanent polarization. An electret can be formed without raising
146
the temperature of the material though the polarization is not as large. The electret may
have a final charge after the field is removed that gives a field the same direction as
(homocharge) or opposite to (heterocharge) the forming electric field. The heterocharge is
due to the induced polarization while the homocharge results from charge leaking from the
electrodes on to the surface of the dielectric. The polarization of an electret can actually
reverse if both charges are formed initially and the heterocharge leaks off more rapidly.
This polarization reversal is common, especially after poling in high fields.
The reviews do not make a distinction between an electret and a ferroelectric. For
this discussion, we will make the distinction that a ferroelectric is the result of a col-
lective interaction that reduces the lattice energy by reducing the symmetry in such a way
that polarization results. The electret, on the other hand, is a mechanical trapping of
dipoles or charge and a polarization results only if a field has been applied. If only one
dipole or charge existed in the whole of the material an electret can be formed.102
Gubkin and Skanavi reported thermoelectric behavior in a number of ceramics, includ-
ing SrTiO^, at room temperature. The apparent sign reversal on some of the measurements
in this work indicate an electret behavior where both homocharge and heterocharge are present.
The fact that a much higher value of at 4 K results when the specimen is cooled in a
field rather than when the field is applied at 4 K suggests the electret state also. If
this was due to refusal of domain walls to move at 4 K under a field, then P would not haver
the high T dependence around 4 K that was generally noted for these specimens.
The model being suggested here is that of a thermoelectret formed from permanent dipoles.
Grain boundary charging is assumed negligible since a similar Pr(T) was observed even for
single crystal KTaO^. Space and surface charge effects may contribute but such effects are
considered negligible because the remanent seems to be repeatable. The dependence on impuri-
ties suggest permanent dipoles similar to the impurity-vacancy (I-V) dipole that has been
studied extensively in alkali halides. The I-V dipole in alkali halides consists
of a divalent metal ion accompanied by the metal ion vacancy required to maintain charge
neutrality. Permanent dipoles consisting of impurities and vacancies should be considerably
more complex in the perovskites because the impurity valancy is not a simple 2 to 1 ratio
with the lattice cation and the valancy of both the lattice cation and the impurity are
variable. Because of the range of valances available, the electret properties should vary
depending on the temperature, and atmosphere present when the material is manufactured as
well as on the impurity included.
Dreyfus"'"0^ measured polarization current vs. time and found a charging current decaying
as the sum of two exponentials. He interpreted the double exponential as being the sum of
at least two different rate processes, one being the alignment of impurity-nearest neighbor
vacancy dipoles and the other with impurity-next nearest neighbor vacancy dipoles. The
polarization current of FEL (1090) is the time derivative of the polarization Pt
(°°) - Pfc
(T)
and is shown in figure 46. This polarization current is approximately the sum of two ex-
ponentials. In this respect, at least, an I-V dipole model seems compatible with the mea-
sured results.
The presence of permanent dipoles with long relaxation times can cause the hysteresis
loops observed for almost all the specimens measured. Since electrets can be formed at low
147
temperatures by field application, there is a source of polarization of long relaxation
time.
The suggested model is one in which I-V type dipoles in SrTiO^ and KTaO^ base materials
are sufficiently free to move and contribute to the ac dielectric constant. As the tempera-
ture is reduced, these dipoles freeze out. The dispersion noted arises from the freezing
out process. A low frequency field can move more of the dipoles at any given T.
The remanent in STV(IO) is quite large but a fairly large amount of vanadium was added.
The peaks in K' (T) in the glass-ceramics are very similar but the SrTiO^ crystallites are
supposed to be pure. The crystals are grown in glass which certainly can be a source of
impurities. If it is assumed that the dipoles in STV(IO), for instance, are a positive and
negative electronic charge one lattice spacing apart then around 10 parts per million im-
purities, if all form dipoles, are all that is required to give the observed P at 4 K.
This impurity level for the precipitated crystals is quite conceivable. The electrical
behavior of the glass ceramics is similar to that of STV(IO), suggesting that the glass
matrix is making no significant contribution to the behavior of the glass ceramics.
Curves of K' (T), P^ (T) , and P „(T) are shown in figure 83 for the simple model justN tN rN
discussed. The model assumes that the dielectric constant due to the soft mode effects,
K' . varies as 1/T down to 20 K whereupon it curves over and becomes constant at ^ 5 K.smN
This polarization is normalized to 1 at 0 K and is arbitrarily set to be 0.2 at 80 K. £he,T_T ^
o cdielectric constant due to permanent dipoles, K,
£N» is assumed to be proportional to e
where T is 14 K and T is zero for the K' ,„ curve shown. This quantity divided by K' ,„ ato c dN dN
T = 00 is the fraction of dipoles not trapped by the potential kT^. The trapped dipoles can
no longer contribute to the ac dielectric constant, but can contribute to the remanent if
polarized. The ac polarization measured is the K'N(T) curve of figure 83, which is the sum
of K' and K' . This gives a peak in K' at 12.5 K that is 1.066 times the 0 K dielectricdN smN N
constant. This peak is changed in temperature and size when Tq
, or K^N
at T = », or the
value of T for which K '
smdeparts from 1/T behavior, is changed. A wide range of peak
temperatures and peak to 0 K ratios of K' are possible by varying all three parameters.
The remanent polarization could be proportional to KjN
(°°) ~ K(jN^
T ^ ^ a^ ^'•P0^es are
aligned by the applied field while cooling the specimen. Since the ac dielectric constant,
K'^, has a strong T dependence, the measured polarization would be expected to be proportional
to K' also. Thus,
P "[k (<») - K (T) ]K' (T) .
This relation gives the P (T) curve shown in figure 83. This assumes a long lifetime forrN
trapped dipoles and that any dipoles falling into the traps align with the remainder. It is
not obvious what mechanism might produce such dipole alignment but the curve is similar to
the remanent polarization observed when heating the specimen.
When a specimen is cooled in an applied field, E, a polarization £0EK '
(
T ) is observed.
Assuming that the remanent contribution is the same cooling as observed in 0 field while
heating, then
148

1.1 r-
Temperature, K
Figure 83. Normalized dielectric constant, Kjj, and polarization, P ™ and P^Njas a function of temperature based on the mathematical model describedin the text
.
149

(T) = e EK 1 (T) + P (T) .to r
The Pj_„ (T) curve in figure 83 is derived from the above equation by assuming a value for e EtN o
such that e EK' (0) + P (0) = 1. No peak is generated in P. (T) regardless of the T depen-ONrN t
dence of P (T) and K' (T) because of the relationship between K' ., and P . The curves obtainedr d r
from this simple model have temperature dependences for P^, ptN
? and K" similar to those
observed, though the model doesn't specifically fit any particular specimen. For the ceramic
materials containing additives,sm
probably deviates from 1/T at a much higher T, then the
peak in K' (T) and the peak temperatures are increased. The T dependence of P^N
is probably
less than calculated since all the dipoles would presumably not align in the applied field.
Of the materials measured in any detail, only Pb2Nb
2C>7differed significantly from the
behavior discussed above. The peak in K' (T) is probably due to dielectric relaxation but
there is no significant remanent at 4 K or hysteresis in the P-E curve. Apparently the
relaxing dipoles are not sufficiently inhibited to form an electret state even at 2 K.
3.8.2. Thermal properties
For temperatures somewhat above 4 K, the term 3P/3T in most materials studied became
reasonably large and negative, expecially for SrTiO^ and KTaO^ (single crystal, ceramic, or
glass-ceramic). The largest 3P/3T values, and hence largest entropy changes, occur in the
20-50 K temperature range. The observed adiabatic depolarization cooling in this temperature
range agreed well with that predicted from the measured 3P/3T and specific heat via eq.
(3.3). The actual tmeperature changes were always less than 1 K for the field strengths
used. It was uncertain how much further the temperature could be reduced by using much
larger fields, since 3P/3T was not known at higher fields. If 3P/3T could be measured in suf-
ficiently high fields to make 3P/3T apprach zero, then the maximum entropy change could be
calculated. Since all the materials studied had 3P/3T<0, an applied electric field always
decreases the entropy. The maximum entropy change then would be just the value of the field
dependent entropy of the material, or the dipolar entropy in zero field. When that is
subtracted from the zero field entropy, the remainder is the intrinsic lattice entropy,
which is field independent. As will be discussed later the lattice entropy can be influenced
slightly by an electric field in some cases. In those cases the maximum entropy change can
be larger than the case where the lattice entropy is field independent. In any case the
maximum entropy change can be no larger than the total entropy in zero field. Such a limit
indicates the maximum refrigeration power which can be expected from a material, even though
the material could cool itself down from any temperature.
At this point we are faced with the problem of determining the total zero field entropy
and then separating that into the dipolar and lattice contributions. Equation (3.6) can be
used to determine the total zero field entropy if the specific heat is measured to a suffi-
ciently low temperature.2 2
For low enough temperatures, 3P/3T = 0 and 3 P/3T = 0, and the dipolar contribution to
the specific heat should be negligible. According to eq. (3.4) the specific heat is indepen-
dent of field in that temperature region. For all the materials studied in this program, 2
2 2K was a sufficiently low temperature to insure 3P/3T and 3 P/3T were zero. Specific heat
150

results on these samples showed that C/T3was beginning to level off in the range 2 - 4 K and
approach the value predicted by elastic constants. For some of the materials, such as
SrTiO and KTaO , it would be desirable to have specific heat measurements down to 1 K or3 3
below to accurately extrapolate C/T to 0 K. However, because C « T , the temperature range
below 1 K contributes only about 2% to the entropy at 4 K. Considerable uncertainties in
3C/T below 1 - 2 K are then of little consequence.
The only cause for concern in extrapolating the specific heat to 0 K is that an anomaly
in the specific heat may be present in that temperature interval. Only an anomaly which is
influenced by an electric field is of any consequence since any other type would simply
shift all the curves in figure 1 by the same amount. For the case of SrTiO the dielectric49
constant shows no anomaly down to 0.025 K. The dielectric constant of SrTiO glass-8
ceramics goes through a minimum at about 0.1 K and continues to increase as the temperature
is decreased even to 7 mK."'"^ Similar behavior has been seen in measurements in this labora-
tory on a KTaO^ single crystal. Because other work in this laboratory has shown that in
SrTiO^ glass-ceramics the minimum in dielectric constant is a function of the ac measuring
field amplitude and frequency, it is probable that a thermodynamic anomaly does not occur
there. That also is consistent with the specific heat measurements on a SrTiO^ glass-
ceramic sample at 4 K as a function of electric field. Since the change in specific heat at
4 K was only 5% or less in a field of 220 kV/cm, the entropy at 4 K is little affected by
such a field. That suggests that if any anomaly did exist, it must be orders of magnitude
lower in temperature than 4 K and thus has no influence on the relative entropy at 4 K and
above. In addition, there is no theoretical reason to expect any anomaly in the range below
1 K.
Separation of the total entropy into the lattice and dipolar parts could be done experi-
mentally if a sharp transition occurred. The dipolar part would simply be the transition
entropy and the lattice part would be the background entropy. This separation is commonly88
done for materials with ferroelectric transitions near room temperature. When the dipolar
entropy is small and there are no sharp transitions, it becomes difficult to separate the
two from experimental specific heat results. Such is the case with all the materials studied
in this program. To help in the separation, we will make use of theoretical models.
Order-disorder materials : Ferroelectric and antiferroelectric transitions are usually88,108
classified into order-disorder or displacive type transitions. For order-disorder
materials a permanent dipole moment exists even in the non-polar phase which implies the
existence of a double potential well for the ion or group of ions. This kind of dielectric
material is very much analogous to magnetic substances. The elementary magnetic moment of a
material is independent of temperature and exists both above and below the transition tem-
perature. In such materials the thermal energy tends to randomize the direction of each
moment so that no net moment exists in the material above the transition temperature . In
magnetic materials short range forces of the exchange, super-exchange, or double exchange
type bring about an ordering of the dipoles below the transition temperature. For dielectric
and ferroelectric materials long range forces, such as the Columb interaction, are just as
important as the short range forces in bringing about ordering of the moments. Nevertheless
151

the thermodynamic treatment of the magnetic and dielectric cases is identical. Thus depolari
zation cooling with an order-disorder dielectric should be completely analogous to adiabatic
demagnetization of a paramagnetic material. In paramagnetic materials with total angular
momentum of j there are 2j + 1 possible orientations of the magnetic moment and so the
entropy in the disordered state is S = Rln(2j +1). A pseudo-spin model may be used to109
describe order-disorder dielectrics. For a material with two minimums in the single
particle potential well, spin 1/2 operators are used in the description. Because of the two
equilibrium positions of the particle in the disordered state, the dipolar entropy is S =
Rln2 in the disordered state. Sufficiently high electric fields can order the dipole moments
and so maximum entropy changes of the order of Rln2 are possible with order-disorder dielec-
trics above the transition temperature.
There are a few materials such as potassium dihydrogen phosphate and tri-glycine sulfate
which are typically order-disorder type ferroelectrics. Specific heat measurements do
indeed show entropy changes on the order of Rln2 at the transition from the ferroelectric to
the paraelectric state. The transitions, however, occur at much too high a temperature to
be useful for refrigeration at 4 K. The lowest transition temperature for a known order-108 108
disorder ferroelectric is 96 K for KH AsO and 122 K for KH PO . The theoretical109
entropy and spontaneous polarization of such materials were derived by Devonshire and
are shown in figure 84 as a function of the reduced temperature. According to that calcula--2
tion S/R falls below 10 for T/T < 0.3 and continues to drop exponentially. Thus forc
KH AsO below about 30 K the dipolar entropy is too small to make a useful refrigerator. In-2
order to meet the requirement of S/R £ 10 at 4 K, it would be necessary to have an order-
disorder material with a transition lower than about 13 K. If the ordered state is ferro-
electric, then there still would be the problem of hysteretic heating during field changes.
The material lithium thallium tartrate (LiTIC .H .0 *H„0) , hereafter abbreviated as LTT,4462110-113
has shown indications of a ferroelectric transition at about 11 K. A fairly pro-
nounced peak in the dielectric constant occurs at 11 K for semi-transparent electrodes as
112well as a rapid softening of the lattice. Both the elastic compliance and dielectric
constant are strong functions of electric field in the region around 11 K. The structural
similarity to Rochelle salt indicates it may be an order-disorder ferroelectric. Unfor-
tunately there was not time to measure the specific heat and electrocaloric effects of this
material because of the difficulties in obtaining a sample. Existing measurements "'""'" ~* of the
spontaneous polarization P^ can be used to give estimates of the entropy change near the
transition. This estimate is done via the Clapeyron equation,
AS = P2
/2e C, (3.24)s o
where e is the dielectric constant and C is the Curie constant in the Curie-Weiss expression
K' = C/(T - T ) . (3.25)o
3 -7 2 3If we use C = 1.4 x 10 K and P = 2 x 10 C/cm and a molar volume of about 40 cm /mole,
S-4
the entropy change is only AS/R = 8 x 10 . Such a change would be too small for useful
152

153

refrigeration but further measurements on LTT would be useful.
Displacive materials : The other class of dielectric transitions is the displacive type.
In these materials the potential well, V(X), has only one minimum and is only slightly anhar-
monic. A permanent dipole moment does not exist in these materials above the transition tem-
perature, but the application of an electric field induces a moment. As the temperature is
lowered in such a dielectric, the long and short range forces on the ion can change in such2 2
a way that they tend to cancel each other at some termperature . When this occurs, 3 V/3X =
0 at X = 0 and the ion becomes unstable at X = 0. A small displacement of the ion can occur
at and below that temperature and the material becomes a displacive ferroelectric or anti-114
ferroelectric. A lattice dynamic description of such materials, as introduced by Cochran,
and Anderson^"'" has proven very useful."'"0^ In this description the frequency, oi, of the optic
phonon mode decreases as the temperature is lowered. At the transition temperature cj becomes
zero at some value of the wave number q. The process is called a condensation of a soft mode.
If the condensation occurs at q = 0, the transition is to the ferroelectric state, whereas if
it occurs at the Brillouin zone boundary, an antiferroelectric transition occurs. An electric
field has a strong effect on the soft mode.
The ABO^ compounds having the perovskite structure usually display the displacive type
transitions. The material PbTiO^ is the most ideal example in the sense that the soft optic
mode is sharp and underdamped in contrast to BaTiO where the soft optic mode is highly over-116
damped. Both SrTiO^ and KTaO^ are good examples of displacive or soft optic materials
though the optic mode never quite condenses at q = 0 even for T = 0 K. These materials
could be called incipient ferroelectrics . All of the materials studied in this program are
probably of the displacive type.
The lattice dynamic description of the displacive materials provides a simple way of
separating the lattice and dipolar entropies. In such a model the lattice entropy is that
associated with the acoustic modes and the dipolar entropy is that of the optic mode. Recent
neutron scattering experiments using high flux reactors have been valuable for mapping out the
phonon dispersion curves of several of the materials studied in this program. Various ther-
modynamic properties of the material can then be calculated from these phonon dispersion
curves. For instance, when the phonon dispersion curves are independent of the temperature,117
the specific heat is given as
where V is the volume, k is Boltzmann's constant, q is the wave number, p refers to summation
over all polarizations, and x is given by
The summation over the polarizations refers to the various transverse and longitudinal modes
in the acoustic and optic branches. The transverse modes are doubly degenerate in both the
acoustic and optic branches. In general, the phonon dispersion curves have not been measured
in enough directions or in enough detail to warrant solving eq. (3.26) exactly. Instead we
(3.26)
x(q,T) = fra)(q)/kT. (3.27)
154

make the assumption that the phonon dispersion curves are the same in all directions and
approximate the Brillouin zone with a sphere. With those approximations we get
E 1 2 x
Y dy, (3.28)3R , . X ,,2p ' 0 (e - 1)
where y = q/q . For a cubic crystal with a zone boundary of q^ _ along a [lOO] direction,
for the spherical approximation is
w -3/^%.z- (3 - 29)
With these approximations the entropy is given as
3R " o J 0 eX
- 1
-x 1 2-ln(l - e )
| y dy. (3.30)
J
If the dispersion curves are functions of temperature, the entropy is still given by eq. (3.30),
but then the specific heat must be calculated from
C = T3S/3T. (3.31)
The materials studied in this program had phonon dispersion curves that were nearly tempera-
ture independent below 15 K. Thus, eqs. (3.28) and (3.30) were used in all the calculations
since the region of main interest in this program is that below 15 K. The calculations for
C and S were carried out to 40 K and, in general, the error introduced in C at that tempera-
ture by not using the exact technique of eq. (3.31) is probably the order of 10%. That
uncertainty is still smaller than that of the complete phonon dispersion carves.
Figure 85 shows the phonon dispersion curves for SrTiO^ used for the thermodynamic
calculations. For low q the curves are based on the neutron scattering work of Yamada and118
Shirane. ~ The slopes of the acoustic modes at q = 0 are consistent with the elastic119
constant measurements of Bell and Rupprecht. Ir.e rebye temperature, normalizes, tc cr.e
atom per molecule, derived from the elastic constants is 390 K. The double valued part of
the transverse optic (TO) curve at low q and E = 0 indicates the uncertainty of the curve." " z
The upper curve is based on the neutron work* and the lower curve is based on Raman scatter-120
ing work. The difference is outside experimental error and has been attributed to thermal
aging which causes an increase in the energy with time. The lower curve was used in our
calculations because it is more consistent with that derived from dielectric constants using
the Lyddane-Sachs-Teller relation,
kvk'~ = (3 - 32)
133

Figure 85. Phonon dispersion curves for SrTi03 used for thermodynamic calculations
The curves are based on neutron and Raman scattering work.
156

where K 1 and K' are the static and high frequency dielectric constants, io„ and u _ referO « 3 -i j LO TO
to the longitudinal and transverse optical phonon frequencies. In any case the total entropy
or specific heat would be reduced by less than 1% if the upper curve was used. The dispersion
curves for various values of electric field are estimates based on the q = 0 values from120
Raman scattering cara.
For high values of q the dispersion curves in figure 85 are based on the work of Shirane
and Yamada2 ^ and of Cowley.
2The dashed line in figure 85 shows the soft acoustic mode,
?25' a-^on<3 ^e [m] direction which is responsible for the antiferrodistortive structural
transition at 105 K. The curve as drawn is the position of the mode below about 40 K. The
highly anisotropic nature of the T mode means that its contribution to the specific heat
and entropy cannot be calculated by eqs. (3.28) and (3.30) since they assume an isotropic
mode. Its contribution, however, is probably small and so a crude estimate was made. This
was done by using eqs. (3.28) and (3.30) and multiplying the resultant C and S by a constant
factor to give reasonable agreement with experiment. The factor used here turned out to be
lO"2
.
3Figure 86 shows the calculated specific heat curves for SrTi0
3» plotted as C/RT to
rer.cve z.csz zz z'r.e units ar.d the temperature dependence . The lever lashed, curve is the
contribution from the three acoustic modes. The middle dashed curve is the specific heat
after adding on the contribution from the soft T^- mode. Notice the hump it tends to give
near 5-6 K, which is in reasonable agreement with that seen experimentally in SrTiO^ ceramic.
The top dashed line is the specific heat after the addition of the contribution from the
doubly degenerate soft TO mode for E = 0. For E = 12 kV/cm the specific heat contribution
from the TO mode is decreased. The maximum effect occurs between 5 and 10 K but the total
specific heat is lowered only about 2-3%. Such a small change in specific heat with field is
consistent with our observation of less than 5% change at 4.4 K for a field of 220 kV/cm on a
123SrTiO^ glass-ceramic. It is also consistent with the results of Lombardo, et al., who
found no change within 3% in the specific heat of single crystal SrTiO^ for a field of 1.8
kV/cm. Shown in the same figure are the results of measurements on a ceramic in this labora-81 82 83
tory, a single crystal, and a polycrystal. ' The agreement between the theoretical and
experimental curves is very good over most of the temperature range. The difference is
largest below 4 K, which could be a result of impurity contributions and an uncertainty in
the details of the acoustic dispersion curves for hu/k < 20 K. The elastic constant value
is based on measurements above the 105 K transition and may not be correct for the 4 K value.124
The phonon dispersion curves for KTaO^ have been measured by Shirane, et al. and Axe,
et al.^"2 ^ The curves shown in figure 87 are based on their work. The slopes of the LA and
126TA modes are consistent with elastic constant measurements made at 2 K and give a Debye
temperature, normalized to one atom per molecule, of 327 K. A slight flattening of the TA
mode occurs at about q/a = 0.2, which has been attributed to an interaction between the TO125
Wand TA modes. Figure 88 shows the calculated specific heat of KTaO^ in comparison with
the measured value. The agreement is good except for the region of 10-15 K. The discrepancy
there indicates the TA mode is too low near <3/ <3max= 1- That may be possible since the TA
mode shown in figure 87 is based on neutron measurements only along the [lOO] direction. The
TA mode could be higher along other directions which would mean the average value shown in
157

30
20
CO
COCD
10
0
1 l|
i I l_M
SrTiO.
polycrystai
elastic
constants
1_L J L I l I I I
200
5 10
TEMPERATURE, K
50 100
Figure 86. Specific heat of SrTi03 calculated from the phonon dispersion curves
as compared with experimental measurements. See text for explanation
of the three theoretical curves
.
158

Figure 87. Phonon dispersion curves for KTa03 used for thermodynamic calculations.
The curves are based on neutron scattering work.
159

150i1 | I I I
KTa0 3
100
COI
COCD
Experimental
Theoretical
50 —
elastic constants
0
I I I I
L 1i I M
125
- 150
200
250
350
5 10
TEMPERATURE, K
50 100
Figure Specific heat of KTa03 calculated from the phonon dispersion curves
as compared with experimental measurements
.
160

figure 87 would have to be raised. The TO mode contribution to the specific heat is much
less than that in SrTiO^. It is only for temperatures above about 30 K where the TO mode
begins to contribute significantly to the total specific heat (see upper dashed line in
figure 88)
.
A material studied in this program which showed no cooling effects was TIBr. For the
sake of comparison we also have calculated the thermodynamic properties of this material.
Figure 89 shows the phonon dispersion curve, which are based on the neutron scattering work. 127
of Cowley and Okazaki. The TA mode is fairly anisotropic with the (0,0,1) direction
giving the lowest values and the (1,1,1) direction the highest. Thus, instead of considering
the TA mode doubly degenerate as for SrTi03
and KTaO^ , these two curves were used in the
thermodynamic calculations. Such a process tends to average the two curves. As drawn, the
acoustic modes are consistent with a Debye temperature, normalized to one atom per molecule,128
of 100 K. Elastic constant measurements yield a Debye temperature of 131 K, which is
rather high to be consistent with the dispersion curves. The TO mode is quite high and inde-
pendent of temperature and would not be considered a soft mode. The dielectric constant
obeys a Curie-Weiss law but the temperature dependence is a result of anharmonic lattice80
effects rather than a softening of the TO mode. The material is paraelectric for all
temperatures and never even approaches a ferroelectric transition as do SrTiO^ and KTaO^.
The calculated specific heat is shown in figure 90 and compared with the experimental
curve. There is excellent agreement between the two curves. This material has a rather
large specific heat which is a result of the fairly soft acoustic modes. As shown by the
upper dashed line, the TO mode contributes little to the total specific heat.
Theoretical calculations for the thermodynamic properties of PZT and P2Nb
207
cannot be
done since there have been no measurements of the phonon dispersion curves. The three specif
i
heat comparisons (SrTiO^, KTaO^, and TIBr) between theory and experiment indicate that the
lattice dynamic model gives a good description of the thermodynamic properties of the displa-
cive type materials. In all three cases, however, the TO mode contributed only a small part
to the total specific heat. Thus the specific heat measurements are not a very sensitive
measure of the thermodynamic properties associated with the TO mode. The TO mode contribu-
tion could be factors of 2-5 higher before the agreement with experiment is deteriorated.
Nevertheless, because of the good agreement in the total specific heat, we shall proceed with
the assumption that both the acoustic and TO mode contributions to the thermodynamic propertie
are well described by the lattice dynamic model.
With the lattice dynamic model, we now have the means for separating the dipolar and
lattice entropies for the displacive type materials. The soft transverse optic (TO) mode is
in general strongly temperature dependent and is responsible for the polarization of the
material. We then assign the dipolar entropy as that associated with the soft TO mode and
the lattice entropy as that of the acoustic modes. Electric fields have a strong effect on
the static dielectric constant and by the LST relation in eq. (3.32) they also have a strong
effect on the frequency of the soft TO mode. An applied electric field has the effect of
hardening the TO mode, i.e., increasing the frequency of the mode. The effect is greatest
for that part of the Brillouin zone with the lowest frequency of the TO mode. This is the
zone center for ferroelectric type materials and the zone edge for antiferroelectric type
161
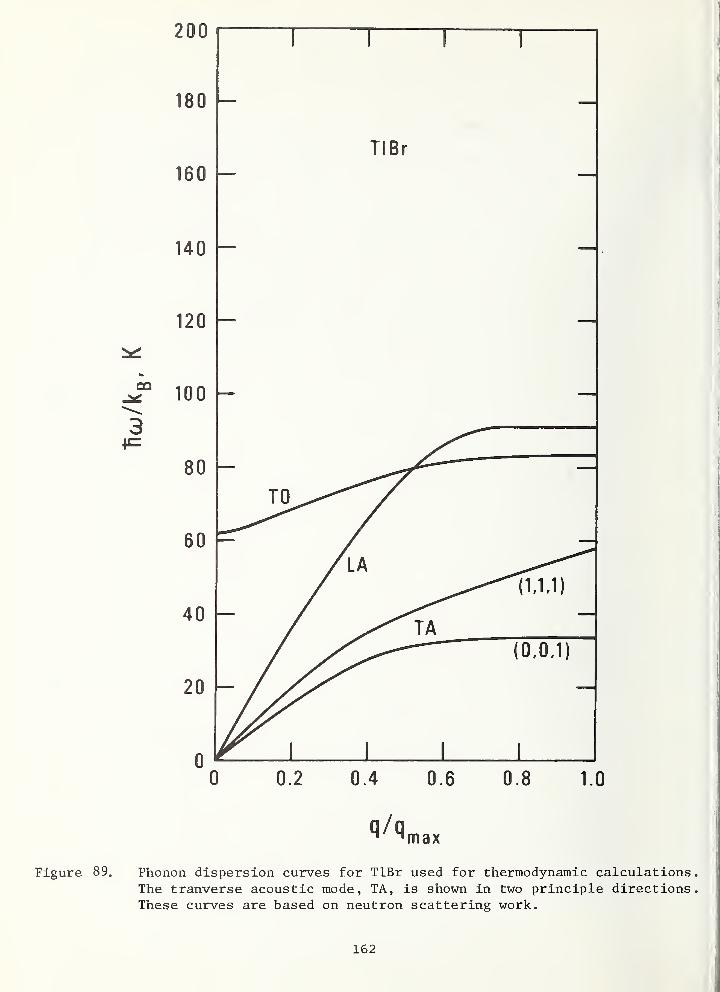
CO
34=
q/q max
Figure 89. Phonon dispersion curves for TIBr used for thermodynamic calculationsThe tranverse acoustic mode, TA, is shown in two principle directionsThese curves are based on neutron scattering work.
162

900
800
700
600
500
400
300
200
100
I l I 1 I I I I I
TIBr
0
Experimental
Theoretical
1 J I I I II I
65
70
CD
80
90
- 100
- 125
5 10
TEMPERATURE, K
50 100
e 90. Specific heat of TIBr calculated from the phonon dispersion curvesas compared with experimental measurements
.
163
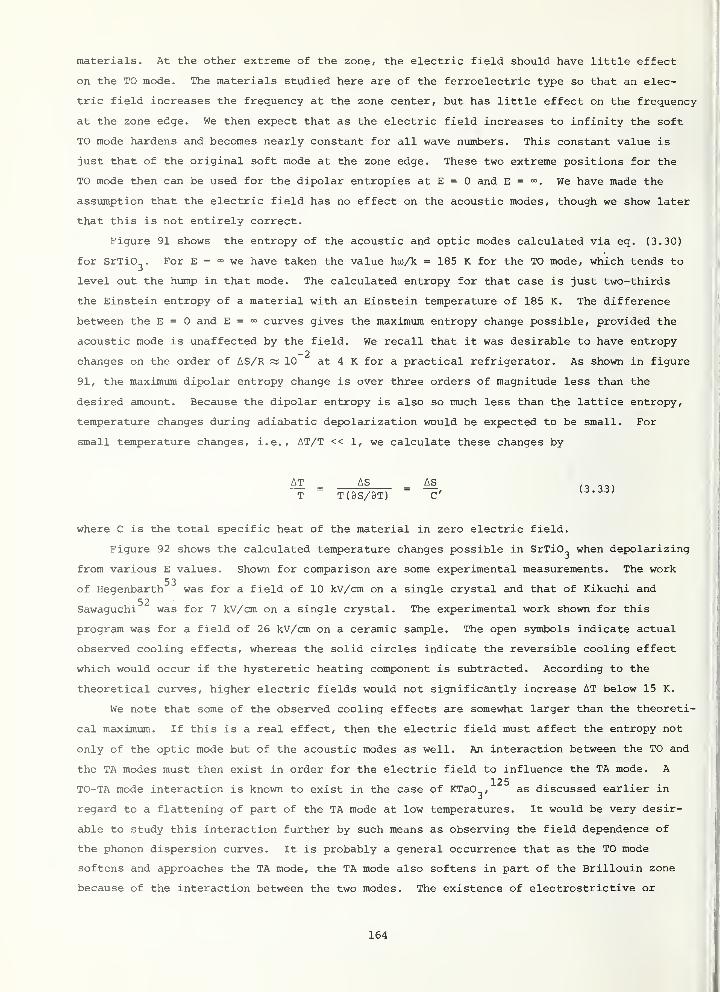
materials. At the other extreme of the zone, the electric field should have little effect
on the TO mode. The materials studied here are of the ferroelectric type so that an elec-
tric field increases the frequency at the zone center, but has little effect on the frequency
at the zone edge. We then expect that as the electric field increases to infinity the soft
TO mode hardens and becomes nearly constant for all wave numbers. This constant value is
just that of the original soft mode at the zone edge. These two extreme positions for the
TO mode then can be used for the dipolar entropies at E = 0 and E = 00. We have made the
assumption that the electric field has no effect on the acoustic modes, though we show later
that this is not entirely correct.
Figure 91 shows the entropy of the acoustic and optic modes calculated via eq. (3.30)
for SrTiO^. For E = 00 we have taken the value hco/k = 185 K for the TO mode, which tends to
level out the hump in that mode. The calculated entropy for that case is just two-thirds
the Einstein entropy of a material with an Einstein temperature of 185 K. The difference
between the E = 0 and E = °° curves gives the maximum entropy change possible, provided the
acoustic mode is unaffected by the field. We recall that it was desirable to have entropy_2
changes on the order of AS/R « 10 at 4 K for a practical refrigerator. As shown in figure
91, the maximum dipolar entropy change is over three orders of magnitude less than the
desired amount. Because the dipolar entropy is also so much less than the lattice entropy,
temperature changes during adiabatic depolarization would be expected to be small. For
small temperature changes, i.e. , AT/T << 1, we calculate these changes by
=AS AS
T TOS/3T) C'1
'
where C is the total specific heat of the material in zero electric field.
Figure 92 shows the calculated temperature changes possible in SrTiO^ when depolarizing
from various E values. Shown for comparison are some experimental measurements. The work53
of Hegenbarth was for a field of 10 kV/cm on a single crystal and that of Kikuchi and52
Sawaguchi was for 7 kV/cm on a single crystal. The experimental work shown for this
program was for a field of 26 kV/cm on a ceramic sample. The open symbols indicate actual
observed cooling effects, whereas the solid circles indicate the reversible cooling effect
which would occur if the hysteretic heating component is subtracted. According to the
theoretical curves, higher electric fields would not significantly increase AT below 15 K.
We note that some of the observed cooling effects are somewhat larger than the theoreti-
cal maximum. If this is a real effect, then the electric field must affect the entropy not
only of the optic mode but of the acoustic modes as well. An interaction between the TO and
the TA modes must then exist in order for the electric field to influence the TA mode. A125
TO-TA mode interaction is known to exist in the case of KTaO^, as discussed earlier in
regard to a flattening of part of the TA mode at low temperatures. It would be very desir-
able to study this interaction further by such means as observing the field dependence of
the phonon dispersion curves. It is probably a general occurrence that as the TO mode
softens and approaches the TA mode, the TA mode also softens in part of the Brillouin zone
because of the interaction between the two modes. The existence of electrostrictive or
164

TEMPERATURE, K
Figure 91. Entropy of the acoustic and optic modes of SrTiC^ calculated fromthe phonon dispersion curves
.
165
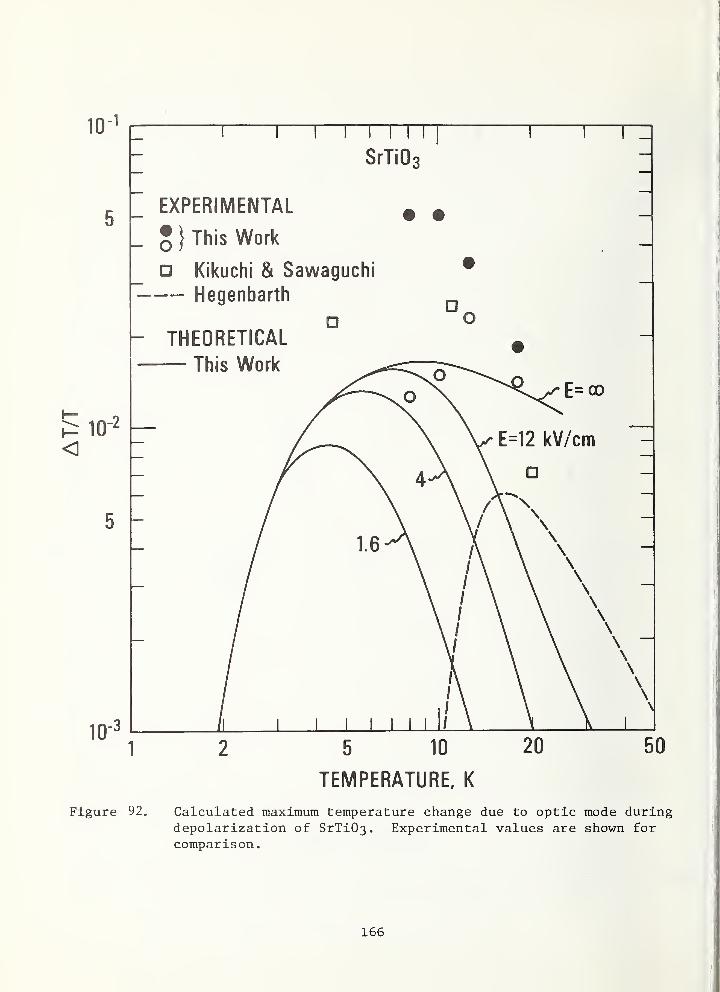
SrTi0 3
EXPERIMENTAL #• } This Work
Kikuchi & Sawaguchi— Heqenbarth
- THEORETICAL
TEMPERATURE, K
Figure 92. Calculated maximum temperature change due to optic mode duringdepolarization of SrTi03. Experimental values are shown for
comparison
.
166

piezoelectric effects in a material is an indication of coupling between optic and acoustic119
modes. It is known that an electric field does have an effect on the elastic constants,
i.e., the slopes of the acoustic modes at the zone center. A field of 20 kV/cm decreases
the slope by 4% at 125 K, which is the opposite direction for the effect we are looking for.
Presumably the field increases the acoustic phonon frequency farther out from the zone
center. Because the entropy associated with the acoustic mode is so much higher than that
of the TO mode, a rather small shift of the acoustic mode with electric field can make a
large correction to calculated temperature changes. In the case of SrTiO^ a shift of the
acoustic mode entropy by 15% would account for the observed high values of AT/T. Even if
the total entropy of the acoustic modes is completely removed by the electric field, the-4
resulting entropy change of AS/R = 10 is still two orders of magnitude less than the
desirable amount for a practical refrigerator.
Figure 93 shows the calculated optic and acoustic mode entropies for KTaO^ . The soft
optic mode entropy is less than that for SrTiO , whereas the acoustic mode entropy is higher-2
than that of SrTi03
- The entropies at 4 K are much less than the desired value of S/R = 10
The calculated electrocaloric temperature changes for field changes from E = 00 to E = 0 are
sho.-.T in figure 94. Experimental results on a KTaO^ single crystal with a depolarizing
field of 15 kV/cm are shown for comparison. Both the experimental results and the calculated
limit are less than for SrTiO^. As for the case of SrTiO^, the experimental values for AT/T
are higher than the theoretical limit. A 10% reduction of the acoustic mode entropy in an
applied field would account for the larger observed AT/T.
The entropies of the acoustic and TO modes for TlBr are shown in figure 95. The TO
mode (shown in figure 89) for TlBr, unlike SrTiO^ and KTaO^, does not soften at the zone
center, i.e., the phonon frequency is nearly independent of wave number. Thus an electric
field should have little effect on the TO mode and its entropy, as is indicated by the
calculated curves in figure 95. The entropy of the acoustic mode is on the order of S/R =
-210 , but little interaction would be expected between the TO and acoustic modes because of
the large difference in energy between the two modes. Thus, the electric field should have
little effect on the acoustic mode. Theoretically the temperature changes during adiabatic
depolarization are very small (about 1 mK at 7 K) and probably not observable. As expected,
no temperature changes could be detected experimentally.
Except for PZT, none of the displacive type materials showed a transition to the ferro-
electric or antiferroelectric state. Instead they remained incipient ferroelectrics down
to OK. If a displacive transition to the ferroelectric state did occur at a low-temperature
would the dipolar entropy then be high enough for a practical refrigerator? To answer this
question we look at the general behavior of the soft TO mode dispersion curve. For the TO
129mode we consider a fairly simple but reasonable dispersion curve of the form
2 2 2 2u (q) = A^ + s q , (3.34)
where Aq
is the phonon frequency at q = 0 and s is a constant. Putting this equation in
temperature units and in units of y = <3/ <3maxgives
167

TEMPERATURE, K
Figure 93. Entropy of the acoustic and optic modes of KTaO^ calculated from
the phonon dispersion curves.
168

10-1
10-
10-3
KTaO
q }Experimental
— Theoretical Limit
10"
5 10
TEMPERATURE, K
50 100
Figure 94. Calculated maximum temperature change due to optic mode during
depolarization of KTaO.
comparison
.
Experimental values are shown for
169

TEMPERATURE, K
Figure 95. Entropy of the acoustic and optic modes of TlBr calculated from
phonon dispersion curves
.
170

nco/k = [(fiAQ/k)
2+ (cy)
2
J
1/2. (3.35)
Figure 96 is a plot of equation (3.35) for various values of A as c is varied to keep fiw/ko
at 200 K for y = 1. Condensation of the TO mode would follow the behavior of these curves
as Aq
approaches zero. The condensation of the mode, which gives rise to a ferroelectric
transition, can occur at any temperature.
Figure 97 shows the entropy of the TO mode, calculated via equation (3.30), at various
temperatures as a function of ftA^/k. From these curves we note that the dipolar entropy at
the transition (A =0) increases with temperature. Whereas S/R is significantly greater-2 ° -2
than 10 for a transition at 50 K, it is significantly less than 10 for a transition at 5
K. In SrTiO_ a transition does not occur and instead -fiA /k comes down to only 16 K. At 5 K3 ° -4
the dipolar entropy for this case as shown in figure 97 is about 3 x 10 R. If the transi-
tion did occur, the entropy is increased by only a factor of three as seen in figure 97.
Thus a transition in SrTiO^ to the ferroelectric state would not significantly increase the
dipolar entropy. The entropy change which can be brought about by an electric field change
from E = 0 to E = 00 is just the entropy at a given value of fiA^/k minus the entropy at hAQ/k =
200 K. For -fiA^/k = 200 K the phonon dispersion curve is independent of phonon momentum (see
figure 96) and probably cannot be raised any further by an electric field. The maximum
entropy change an electric field causes on the mode occurs when the model undergoes a transi-
tion (fiA^/k = 0) . This maximum entropy change caused by a change in field from E = 0 to E =
°° is the entropy at fiA^/k = 0 minus the entropy at fiA^/k = 200 K. The curve marked displacive
material in figure 98 shows this entropy change as a function of temperature. The signifi-
cance of the curve is apparent when it is compared with the region of practical refrigeration,
also shown in figure 98. The lower boundary for that region is defined by AT/Tf
= 1 below
about 20 K and gradually decreasing to AT/T^ = 1/3 at higher temperatures. In this expres-
sion Tf
is the final temperature reached after cooling from some higher temperature. The
curve was calculated using the Debye specific heat of a material with Debye temperature of
200 K. This definition of practical refrigeration pertains only to the ability of a material
to cool itself to T^ and says nothing about the refrigeration power once T^ is reached. If
the refrigeration power were also considered, the lower limit of the practical refrigeration
would be at least a factor of two higher, depending on the specific refrigeration require-
ments. In any case it is clear that the lower boundary for practical refrigeration is in
reality a somewhat fuzzy band with a width of at least a factor of two centered on the sharp
line drawn in figure 98.
The example worked out for figure 98 is for a material with a Debye temperature of 200 K.
The low temperature part of the AS/R curves for the displacive material and the region of
practical refrigeration will change for different Debye temperatures. However, each of the
two curves will change by the same percentage amount so the relative position of the curves
in figure 98 remains unchanged. It is evident from figure 98 that the possible entropy
change in a displacive material is much too small to be useful for practical refrigeration
at any temperature. This results from the fact that the TO mode is always higher than the
TA mode and thus the dipolar entropy is always less than the lattice entropy. This means
171

Figure 96. Plot of equation (3.35) for various values of A and c. These curvesare typical of the dispersion curves for transverse optic modes as
they soften and condense.
172

1 II
I I I
1
11 1—I—I I I I I
I
T=100 K
TiAo/k, K
Figure 97. Calculated entropy of a transverse optic mode from the dispersioncurves of figure 96 as a function of hA /k for various temperatures.
173

T. K
Calculatea maximum entropy change for a field change fromE=0 to E=°° in a model displacive material in which the TOmode has condensed at the zone center. The dispersioncurves used in the calculations are from Figure 96. Shownfor comparison are the maximum entropy change expected inan order-disorder material and the region of practical re-frigeration.
174

that a displacive material cannot cool itself significantly in any temperature range, unless
the TO-TA mode interaction is large. In a material with a large TO-TA mode interaction the
Debye temperature would have to be less than about 80 K (normalized to one atom per molecule)
to provide enough lattice entropy for practical refrigeration. No such a material is known
to exist.
For an order-disorder material with a two position dipole the maximum dipolar entropy
change is simply AS/R = ln2 for all temperatures. The ordering temperature must be below
the desired refrigeration temperature in order for the entropy to be changed by R£n2 . As
shown by figure 98 an order-disorder material could provide practical refrigeration below
about 30 K. Adiabatic demagnetization of a paramagnetic salt below 1 K is a classic example
of the practicality of the magnetic order-disorder materials. Because of the many spin
orientations possible in some magnetic substances, e.g., gadolinium, the entropy changes may
be as high as R5,n8. In that case the order-disorder line in figure 98 is moved up into the
region of practical refrigeration even at room temperature. It should be noted however that
the removal of most of the R£n8 entropy at 200-300 K requires extremely high magnetic fields.
In the case of dielectric materials, either order-disorder or displacive, extremely high
electric fields are required to remove most of the dipolar entropy at room temperature,
whereas at lower temperatures more moderate fields would be sufficient.
3.8.3. Recommendations for further work .
We consider here one final possibility in the search for materials useful for electro-
caloric refrigeration at 4 K. Suppose we use an order-disorder material and by some means
we lower the transition temperature down to about 5 K. There are a couple of methods where-
by this can be done. One method uses hydrostatic pressure to lower the transition tempera-
ture and the other uses an electric field bias on an antiferroelectric material. Samara130
has measured the transition temperature as a function of pressure for the ferroelectric
material KH„P0„ and the antiferroelectric material NH„H„P0„. The transition temperatures2 4 4 2 4
decrease to 0 K at 17 kbar for KH P0„ and 33 kbar for NH„H PO,,. The transition temperatures2 4 4 2 4
in zero pressure are 122 K for KH„P0„ and 151 K for NH„H P0„. What happens then to the2 4 4 2 4
transition entropy, or the dipolar entropy, as the transition temperature is lowered? To
answer this we use the Clapeyron equation,
AS = Av^-, (3.36)dT
c
where Av is the change in molar volume at the transition from the ferroelectric to the
paraelectric state and dp/dT is the slope of the pressure vs. temperature curve separating° 89
the two phases. At p = 0 the entropy change is AS/R = 0.37. This number is used with
Samara's130
value for dp/dT at p = 0 to calculate Av at p = 0. Then if Av is assumed inde-
pendent of temperature, we get the following expression for the entropy change below 50 K by
using Samara's data for T^ vs p:
AS/R = 6.0 x 10~ 3T . (3.37)c
175

-2At T = 5 K the entropy change is then AS/R = 3 x 10 , which is sufficiently high for a
c-2
refrigerator. For NH^H^PO^ we expect the entropy change at 5 K to be about AS/R = 2 x 10
Because NH^H^PO^ is antiferroelectric, it would not have the problem of hysteresis. However,
the need for a pressure of 33 kbars probably makes such a method impractical.
In the case of an antiferroelectric, such as NH^H^PO^, an electric field also reduces
the transition temperature. For that case the Clapeyron equation is
dEAS = -P
s—
, (3.38)
c
where Pg
is the sublattice polarization and E is the electric field along the transition
from the antiferroelectric to the paraelectric state. No data exists for dE/dT , but wec
assume it falls off linearly with temperature below about 50 K, just as for the case of-2
dp/dTc>
At 5 K we then expect the entropy change to be about AS/R = 2 x 10 . The field
necessary to lower the transition to 5 K may be on the order of 100 kV/cm. The application
of a field to an antiferroelectric in some cases may introduce a ferroelectric state between
the antiferroelectric and paraelectric states. If this occurs in NH4H2PO^ the entropy
change at 5 K would be reduced but the field required to push the transition down to 5 K
would also be reduced. A study of NH„H P0„ in an electric field would be very desirable in4 2 4
establishing its usefulness as a refrigerator material.
For a material to have a transition to a ferroelectric or antiferroelectric state at a
very low temperature requires a very small dipole moment. In fact the transition temperature
will be proportional to the square of the distance between ions. At some point the zero
point motion of the atoms would tend to make smaller displacements, and hence lower transi-
tion temperatures, unstable. Kurtz"*"3 ^ has shown that 20 K is an approximate cutoff tempera-
ture below which a transition to a dielectrically ordered state cannot occur. Naturally a
lower transition could occur in dilute materials, but the entropy per unit volume is also
decreased by the dilution.
4. CONCLUSIONS
This study showed that the SrTiO^ and KTaO^ glass-ceramics and doped ceramics have more
pronounced peaks in the dielectric constant vs. temperature curves than do the other nominally
pure dielectric materials studied. The positive slope at temperatures below the peak cannot
be used for electrocaloric refrigeration as originally believed. The fundamental thermody-
namic quantity, the dc polarization, had only negative values for 3P/3T when the sample was
cooled in the applied field. The slope was nearly zero for temperatures below about 5 K in
all samples tested. It was concluded that the peaks in the dielectric constant were a
result of the thermal electret behavior of impurity-vacancy dipoles.
Electrocaloric cooling effects could be seen in many of the samples tested for the
temperature range 10-30 K where 3P/9T is large and negative. The largest effects were seen
in SrTi03ceramics rather than glass-ceramics with similar effects seen in a KTaO^ single
crystal. The observed cooling effects were the order of 0.5 K or less for fields of 2 7
kV/cm. Such effects were not large enough for a practical refrigerator, although the fields
were not very high.
176

In this study, glass-ceramics, ceramics, and single crystals were investigated to
better understand the general principles of dielectric behavior and to search for possible
cooling materials. All of the materials studied for possible cooling materials were of the
soft optic phonon mode (displacive) type dielectrics. Theoretical calculations using the
phonon dispersion curves were made of the thermodynamic quantities and showed good agreement
with the experimental results. From these calculations it was concluded that the entropy in
such materials is one to three orders of magnitude too small for practical refrigeration at
4 K even with infinitely high electric fields. However, discovery of a material with a low
Debye temperature and a large TO-TA mode interaction would warrent further investigation.
Dielectric materials of the order-disorder type have orders of magnitude higher entropy
(AS/R ss 1) above their transition to the paraelectric state than do the displacive type
materials. Unfortunately, an order-disorder dielectric with a low enough transition tempera-
ture has not been found. It is recommended that the material lithium thallium tartrate,
which has anomalous dielectric behavior at 11 K, be investigated further. Further low
temperature studies are also needed on NH^H^PO^, which from theoretical estimates could have
enough entropy change remaining at 5 K in a high field to make a useful refrigerator.
Both mechanical and magnetothermal types of heat switches can be used successfully for
a cyclic refrigerator operating between 15 and 4 K. Multiple leaf contact switches are
useful for loads up to the order of 5 W/K. The magnetothermal switches where a transverse
magnetic field alters the thermal conductivity of a metal single crystal are particularly
useful because they have no moving parts. Single crystal beryllium can be used for both the
upper and lower switch. It is also possible to use tungsten, but for the lower switch only.
Further engineering work on an electrocaloric refrigerator is not practical at this
time. Instead more basic research on the thermodynamic behavior of dielectrics must be done
to find a suitable refrigeration material or to show that such a material cannot exist
because of certain fundamental reasons.
177

5 . REFERENCES
1. Strobridge, T. R. , Cryogenic Refrigerators - An Updated Survey, Nat.Bur. Stand. (U.S.) Tech. Note 655 (1974).
2. Lawless, W. N. , Dielectric Cooling Technology: 15-4.2 K, Proc. Cryo.Cooler Conf. (1973), Tech. Report AFFDL-TR-7 3-149 , vol. 1, p. 417.
3. Garrett, C. G. B. , Magnetic Cooling (John Wiley and Sons, Inc., NewYork, 1954).
4. Kobeko, P. and Kurtschatov, J., Dielektrische Eigenschaften derSeignettesalzkristalle, Zeit, fur Physik 6J5, 192 (1930).
5. van Geuns, J. R. , a Study of a New Magnetic Refrigerating Cycle, PhilipsRes. Repl Suppl. No. 6 (1966); U.S. Patent 3,413,814 (1968), Method andApparatus for Producing Cold.
6. Lawless, W. N. , A Low Temperature Glass-Ceramic Capacitance Thermometer,Rev. Sci. Instrum. £2, 561 (1971).
7. Rubin, L. G. and Lawless, W. N. , Studies of a Glass-Ceramic CapacianceThermometer in an Intense Magnetic Field at Low Temperatures, Rev. Sci.Instrum. 42, 571 (1971).
8. Lawless, W. N. , Radebaugh, R. , and Soulen, R. J., Studies of a Glass-Ceramic Capacitance Thermometer between 0.025 and 2.4 K, Rev. Sci.Instrum. 4_2, 567 (1971).
9. Lawless, W. N. , Low-Temperature Dielectric Bolometer, J. Opt. Soc. Am.62 , 1449 (1972); Improvements on "Low-Temperature Dielectric Bolometer,"J. Opt. Soc. Am. 6_4, 820 (1974).
10. Lawless, W. N. , Closed-Cycle Electrocaloric Refrigerator and Method,U.S. Patent No. 3,638,440 (1972).
11. Steigmeier, E. F., Field Effect on the Cochran Modes in SrTiO., and KTaO.,Phys. Rev. 168, 523 (1968).
12. See, for example, Colwell, J. H. , The Performance of a Mechanical HeatSwitch at Low Temperatures, Rev. Sci. Instrum. 4_0, 1182 (1969), andreferences cited therein.
13. Berman, R. , Some Experiments on Thermal Contact at Low Temperatures, J.
Appl. Phys. 2J7, 318 (1956).
14. Berman, R. and Mate, C. F., Thermal Contact at Low Temperatures, Nature182, 1661 (1958).
15. Jacobs, R. B. and Starr, C. , Thermal Conductance of Metallic Contacts,Rev. Sci. Instrum. 10, 140 (1939)
.
16. Kopp, F. J. and Ashworth, J., Carbon Resistors as Low Temperature Ther-mometers, Rev. Sci. Instrum. 4_3, 327 (1972).
17. Childs, G. E., Ericks, L. J., and Powell, R. L. , Thermal Conductivity ofSolids at Room Temperature and Below, NBS Monograph 131 (1973)
.
18. McCarty, R. D. , Thermophysical Properties of Helium-4 from 2 to 1500 Kwith Pressures to 1000 Atmospheres, Nat. Bur. Stand. (U.S.) Tech. Note631 (1972).
178

19. Aschermann, Von G. , and Justi, E. , Elektrische Leitfahigkeit , magnetischeWiderstandsvermehrung, Hall-effekt und Supraleitung von Rhenium, Phys. Z.
43, 207 (1942).
20. Rosenberg, H. M. , Low Temperature Solid State Physics (Oxford at theClarendon Press, 1963) Chapter 5.
21. Engels, J. M. L. , Gorter, F. W. , and Miedema, A. R. , Magnetoresistance ofGallium - A Practical Heat Switch at Liquid Helium Temperatures, Cryo-genics 12/ 141 (1972)
.
22. Boughton, R. I. and Yaqub, M. , Anisotropy of the Electron Mean Free Pathin the Thermal Conductivity of Very Pure Gallium, Phys. kondens . Materie9, 138 (1969).
23. Yaqub, M. and Cochran, J. F., Mean Free Path of Electrons and Magneto-morphic Effects in Small Single Crystals of Gallium, Phys. Rev. 137 ,
All 8 2 (1965).
24. DeHaas, W. J. and DeNobel, J., The Thermal and the Electrical Resistanceof a Tungsten Single Crystal at Low Temperatures and in Magnetic Fields,Physica 5_, 449 (1938); DeNobel, J., Thermal and Electrical Resistivityof Some Tungsten Single Crystals at Low Temperatures and in StrongMagnetic Fields, Physica 23, 261 (1957).
25. Long, J. R. , Thermal and Electrical Transport in a Tungsten Crystal forStrong Magnetic Fields and Low Temperatures, Phys. Rev. B_3, 1197 (1971) .
26. Griineisen, e. and Adenstedt, H. , Enfluss Transversaler Magnetfel^erauf Elektrizitats-und Warmeleitung reiner Metalle bei tiefer Temperatur,Ann. Physik [5] 31, 714 (1938).
27. Griineisen, e. and Erfling, H. S., Electrischer und ThermischerWiderstand von Berylliumkristallen lm Transversalen Magnetfeld, Ann.Physik [5] 38_, 399 (1940) .
28. Sparks, L. L. and Powell, R. L. , Low Temperature Thermocouples: KP,"Normal" Silver, and Copper versus Au-0.02 at %Fe and Au-0.07 at %Fe,Journal of Research NBS 76A , 263 (1972).
29. Powell, R. W. , The Thermal and Electrical Conductivities of Beryllium,Phil. Mag. 44_, 645 (1953).
30. Reich, R. , Kink, V. Q. , and Bonmarin, J., Etude de la resistivited' echantillons de beryllium de differentes puretes en fonction de latemperature et determination de la temperature de Debye de ce metal,Compt. Rend. Acad. Sci. 256, 555 8 (1963)
.
31. Powell, R. L. , Harden, J. L. , and Gibson, E. F. , Low Temperature Trans-port Properties of Commercial Metals and Alloys. IV. Reactor Grade Be,Mo, and W, J. Appl. Phys. 31, 1221 (1960).
32. Meaden, G. T. , Electrical Resistance of Metals (Plenum Press, New York,1965) p. 132.
33. Friedberg, C. B., Effects of Alloying in the Dilute Limit on theQuantum States of Electrons in Magnesium, J. Low Temp. Phys. 14_, 147(1974) .
34. Anderson, A. C. and Peterson, R. E., Selection of a Thermal BondingAgent for Temperatures below 1 K, Cryogenics 10_, 430 (1970).
179

35. Steyert, W. A., Thermal Transport Across Superconducting Solder JointsNear 0.1 K, Rev. Sci. Instrum. 38_, 964 (1967).
36. Challis, L. J. and Cheeke, J. D. N. , Thermal Conduction Across Copper-Leand-Copper Sandwiches at Helium Temperatures, Proc. Phys. Soc. (London)83, 109 (1964).
37. Barnes, L. J. and Dillinger, J. R. , Thermal Resistivity at Pb-Cu and Sn-Cu Interfaces between 1.3 and 3.1 K, Phys. Rev. 141 , 615 (1966).
38. Yovanovich, M. M. and Tuarze, M. , Experimental Evidence of Thermal Resis-tance at Soldered Joints, J. Spacecraft 6, 855 (1969); Yovanovich, M. M.
,
A Correlation of the Minimum Thermal ResTstance at Soldered Joints, J.Spacecraft 7, 1013 (1970).
39. Ashworth, T. , Loomer, J. E., and Kreitman, M. M. , Thermal Conductivity ofNylonds and Apiezon Greases, Adv. Cry. Eng. 18^, 271 (1973) .
40. McTaggart, J. H. and Slack, G. A., Thermal Conductivity of General Elec-tric No. 7031 Varnish, Cryogenics 9^, 384 (1969).
41. Sauer, H. J., Jr., Remington, C. R. , Stewart, W. E., Jr., and Lin, J. T.
,
Thermal Contact Conductance with SEveral Interstitial Materials, XI Int'l.Thermal Cond. Conf., Albuquerque, NM, 1971, p. 22.
42. Sauer, H. J., Jr., Remington, C. R. , and Heizer, G. A., Thermal ContactConductance of Lubricant Films, XI Int'l. Thermal Cond. Conf., Albuquerque,NM, 1971, p. 24.
43. Gmelin, E. , A Cryostat for Measuring Heat Capacities from 1.2 to 300 Kand Measurements of the Specific Heat of Magnesium Oxide below 36 K,Cryogenics 7, 225 (1967).
44. Bitter, F. , Water-Cooled Magnets, Proc. Int'l. Conf. High MagneticFields, M.I.T., 1961, p. 85.
45. Lawless, W. N. , Thermodynamics of Electrocaloric Phenomena in KC1:0H.Paraelectric Cooling, J. Phys. Chem. Solids 3_0, 1161 (1969).
46. Weiss, P. and Forrer, R. , Ann. Phys. Pariz 5, 153 (1926).
47. See, For example, Thacher, P. D. , Electrocaloric Effects in Some Ferro-electric and Antiferroelectric Pb(Zr, Ti)0- Compounds, J. Appl. Phys.39 , 1996 (1968), and references cited therin.
48. Granicher, H. , Induzierte Ferroelektrizitat von SrTiO- bei sehr tiefenTemperaturen und iiber die Kalteerzeugung durch adiabatische Entpolari-sierung, Helv. Phys. Acta 2_9, 210 (1956).
49. Frenzel, C. , Gladun, A., Gladun, C, Hegenbarth, E., and Knorn, M. ,
Measurement of the Dielectric Constant of SrTiO, in the Temperature Rangefrom 1.2 to 0.025 K, phys. stat. sol. (a)15, K6I (1973).
50. Barrett, J. H. , Dielectric Constant in Perovskite Type Crystals, Phys. Rev.86, 118 (1952).
51. Hegenbarth, E. , Studies of the Electrocaloric Effect of FerroelectricCeramics at Low Temperatures, Cryogenics 1, 242 (1961).
52. Kikuchi, A. and Sawaguchi, E., Electrocaloric Effect in SrTiO,, J. Phys.Soc. Japan 19, 1497 (1964).
180

53. Hegenbarth, E. , Die Temperaturabhangigkeit des elektrokalorischenEffects bei SrTiC^-Einkristallen , phys . stat. sol. 8_, 59 (1965).
54. Sawaguchi, E. , Kikuchi, A., and Kodera, Y. , Dielectric Constant ofStrontium Titanate at Low Temperatures, J. Phys. Soc. Japan 17 , 1666(1962)
.
55. Kanzig, W. , Hart, H. R. , Jr., and Roberts, S., Paraelectricity andFerroelectricity Due to Hydroxyl Ions in Alkali Halides; ParaelectricCooling, Phys. Rev. Letters 13, 543 (1964).
56. Kuhn, U. and Ltity, F. , Paraelectric Heating and Cooling with OH~-Dipolesin Alkali Halides, Solid State Commun. 4_, 31 (1965).
57. Shepherd, I. and Feher, G. , Cooling by Adiabatic Depolarization of OHMolecules in KC1, Phys. Rev. Letters 15, 194 (1965); Shepherd, I. W.
,
Electrocaloric Properties of OH Molecules in KC1, J. Phys. Chem.Solids 28, 2027 (1967) .
58. Lawless, W. N. , Ideal Paraelectric Refrigeration in KC1;0H and RbCl:CN,J. Appl. Phys. 40_, 4448 (1969).
59. Lombardo, G. and Pohl, R. 0., Electrocaloric Effect and a New Type ofImpurity Mode, Phys. Rev. Letters 15, 291 (19 65)
.
60. Pohl, R. 0., Taylor, V. L. , and Gouban, W. M. , Electrocaloric Effect inDoped Alkali Halides, Phys. Rev. 178 , 1431 (1969).
61. Korrovits, V. Kh. , Luud'ya, G. G. , and Mikhkel'soo, V. T. , ThermostatingCrystals at Temperatures Below 1 K by Using the Electrocaloric Effect,Cryogenics 14_, 44 (1974) .
62. Lawless, W. N. , Paraelectric Refrigeration Method and Apparatus, U. S.
Patent 3,436, 924 (1969) .
63. Robinson, M. C. and Wertheimer, M. R. , Paraelectric Refrigerator, U. S.
Patent 3,650,117 (1972).
64. Stookey, S. D., Glastech. Ber. , 32K , 5th Int'l. Congress on Glass (Verlayder Deutschen Glastechnischen Gesellschaf t , Frankfurt am Main, 1959),p. 574.
65. Herczog, A., Microcrystalline BaTiO, by Crystallization from Glass, J.
Amer. Ceram. Soc. 4_7, 107 (1964); Layton, M. M. and Herczog, A.,Nucleation and Crystallization of NaNbO., from Glasses in the Na»0-Nb_Oj.-Si0
2System, ibid. 50, 369 (1967) .
66. Weaver, H. E. , Dielectric Properties of Single Crystals of SrTiO.. at Lowre-peratures, Z. Phys, "hem. Solids 11, 274 [1959).
67. Saifi, M. A. and Cross, L. E . , Dielectric Properties of Strontium Titanateat Low Temperature, Phys. Rev. 82_, 677 (1970).
68. Sakudo, T. and Unoki, H. , Dielectric Properties of SrTiO- at Low Temper-atures, Phys. Rev. LEtters 2_6 , 851 (1971).
69. Neville, R. C. Hoeniesen, B. , and Mead, C. A., Permittivity of StrontiumTitanate, J. Appl. Phys. 43, 2124 (1972).
70. McBrayer, R. D., Peters, F. I., and Smith, R. D. , Method of Making aCapacitor, U. S. Patent 3,604,082 (1971).
181

71. Gesi, K. , Pyroelectric Study on the Spontaneous Polarization in AgNa(N0
2)
2, J. Phys. Soc. Japan 33_, 108 (1972).
72. Knop, K. , Pfister, G. , and Kanzig, Dielectric Relaxation of KBr Dopedwith KOH and KOD, Phys. kondene. Materie T, ^.07 (1968); K^pphan, S.and Liity, F., Electro-Caloric Effects of Li , OH and Ag Dipoles inAlkali Halides, Solid State Commun. 6_, 907 (1968).
73. Pandorf, R. C. , Chen, C. Y. , and Daunt, J. G. , Heat Transport ThroughCarbon Radio Resistors at Low Temperatures and Their Use in Conjunctionwith Superconducting Thermal Valves, Cryogenics 2_, 239 (1962).
74. Neighbor, J. E. , Leads Power Calorimentry , Rev. Sci. Instrum. 3_7, 497(1966) .
75. White, G. K. and Birch, J. A., Thermal Properties of Silica at LowTemperatures, Phys. Chem. Glasses 6_, 85 (1965).
76. Flubacher, P., Leadbetter, A. J., Morrison, J. A., and Stoicheff, B. P.,The Low Temperature Heat Capacity and the Raman and Brillouin Spectraof Vitreous Silica, J. Phys. Chem. Solids 12, 53 (1959); Simon, F.,Untersuchungen , uber die spezifische warme
-b~ei tiefen temperaturen
,
Ann. Physik 68, 241 (1922).
77. Leadbetter, A. J., The Thermal Properties of Glasses at Low Temperatures,Phys. Chem. glasses 9_, 1 (1968).
78. Bucci, C, Fieschi, R. , and Guidi, G. , Ionic Thermocurrents in Dielectrics,Phys. Rev. 148, 816 (1966).
79. Gopal, E. S. R. , Specific Heats at Low Temperatures, (Plenum Press, NewYork, 1966).
80. Samara, G. A., Temperature and Pressure Dependence of the DielectricConstants of the Thallous Halides, Phys. Rev. 165 , 959 (1968).
81. Colwell, J. H. , private communication, 1975.
82. Hegenbarth, E., Dielecktrische und kalorische Untersuchungen an ferro-elektrischen Keramiken bei tiefen Temperaturen, phys. stat. sol. 2_, 1544(1962) .
83. Todd, S. S. and Lorenson, R. E. , Heat Capacities at Low Temperatures andEntropies at 298.16 K of Metatitanates of Barium and Strontium, J. Amer.Chem. Soc. 74, 2043 (1952).
84. Sawaguchi, E. , Ferroelectricity versus Antiferroelectricity in the SolidSolutions of PbZr0
3and PbTi0
3, J. Phys. Soc. Japan 8, 615 (1953).
85. Demurov, D. G. , Nikiforov, L. G., Viskov, A. S. and Venevtsev, Yu. N.,New Antiferroelctrics Having the Pyrochlore Structure, Soviet Physics-Solid State 11, 3089 (1970).
86. Venevtsev, Yu. N. , Kapyshev, A. G. , Shvorneva, L. I., et al., New Ferro-electrics and Seignettomagnets of the Perovskite and Pyrochlore Type:Synthesis and Study of the Crystal Structure and Properties, Proc. 2ndInt'l. Meeting on Ferroelectricity, 1969, J. Phys. Soc. Japan, Supple-ment 2_8, 139 (1970) .
87. Hulm, J. K. , Low-Temperature Dielectric Properties of Cadmium and LeadNiobates, Phys. Rev. 9_2, 504 (1953).
182

88. Burke, W. J. and Pressley, R. J., Stress Induced Ferroelectricity inSrTi0
3, Solid State Commun. 9_, 191 (1971).
39. Jona, F. and Shirane, G., Ferroelectric Crystals (Macmillan, New York,1962) , p. 251.
90. Hulm, J. K. , Matthias, B. T. , and Long, E. A., A Ferromagnetic CuriePoint in KTaO^ at Very Low Temperatures, Phys . Rev. 7_9, 885 (1950 ).
91. Demurov, D. G. , and Venevtsev, Yu. N. , Character of Phase Transitionof Ferroelectric KTaO, , Sov. Phys. Solid State 13, 553 (1971), [Fiz.Tverd. Tela. 13, 669 11971) ]
.
92. Samara, G. A., and Morosin, B., Anharmonic Effects in KTaO-: Ferro-electric Mode, Thermal Expansion, and Compressibility, Phys. Rev. B8
,
1256 (1973).
93. Dekker, A. J., Solid State Physics (Prentice Hall, NJ, 1957), p. 144.
94. Skanavi, G. I., and Matveeva, E. N. , New Nonpiezoelectric Dielectricswith Very High Dielectric Permeability and Small Conductivity, Sov.Phys. JETP. 3_, 905 (1957).
95. Tien, T. Y., and Cross, L. E . , Dielectric Relaxation in Strontium TitanateSolid Solutions Containing Lanthania, Jap. J. Appl. Phys. 6_, 459 (1967).
96. Johnson, D. W. , Cross, L. E., and Hummel, F. A., Dielectric Relaxation inStrontium Titanates Containing Rare-Earth Ions, J. Appl. Phys. 41_, 2828(1970) .
97. Nomura, S., and Kojima, F., Dielectric Relaxation and Thermal StimulatedCurrent in
(K3/ 4
Bi]_/4 ^ ^ Znl/6
Nb 5/6 ' °3 and ItS Solid Solutions, Jap. J.
Appl. Phys. 1_2, 205 (1972); Dielectric Properties of Perovskite-Type(K3/4
Bi1/4 ) (Mg
1/6Ta
5/6)0
3and (K
3/4Bi
1/4 ) (Mg1/g
Nb5/6
)
0
3Ceramics, ibid.
14, 907 (1975).
98. Gutmann, F., The Electret, Rev. Mod. Phys. 2_0, 4 57 (19 48).
99. Fridkin, V. M. and Zheludev, I. S., Photo Electrets and the Electro-photographic Process, (Consultants Bureau, New York, 1960).
100. Pillai, P. K. C. , Jain, K. , and Jain, V. K. , Thermoelectrets and TheirApplications, phys. stat. sol. (a)l_3 , 341 (1972).
101. Gross, 3., Electret Devices for Pollution Control, T. Kallard, Ed.,(Optsonic Press, New York, 1974).
102. Gubkin, A. N. , and Skanavi, G. I., Akad. Nauk SSSR, Bulletin, Phys. Ser.2_2, 327 (1958).
103. Cook, J. S., and Dryden, J. S . , An Investigation of the Aggregation ofDivalent Cationic Impurities in Alkali Halides by Dielectric Absorption,Proc. Phys. Soc. (London) 80_, 479 (1962).
104. Crawford, J. H. , Jr., Aggregation of Divalent Metal Impurity in AlkaliHalide Crystals, J. Phys. Chem. Solids 31, 399 (1970).
105. Stcebe, T. G. and Watanabe, S., Thermoluminescence and Lattice Defectsin LiF, phys. stat. sol. (a) 29, 11 (1975).
1S3

106. Dryefus, R. W. , Dielectric Relaxation Due to Impurity-Vacancy Complexesin NaCl Crystals, Phys. Rev. 121 , 1675 (1961).
107. Bakalyar, D. , Swinehart, R. , Weyhmann, W. , and Lawless, W. N. , Studiesof a Glass-Ceramic Capacitance Thermometer between 0.007 and 0.040 K,Rev. Sci. Instrum. 4_2, 1221 (1972).
108. Blinc, R. , and Zeks, B. , Soft Modes in Ferroelectrics and Antiferroelec-trics, Selected Topics in Solid State Physics, Vol. 13 (North-Holland,New York, 1974)
.
109. Devonshire, A. F., Theory of Ferroelectrics, Adv. Phys. 3, 85 (1954).
110. Matthias, B. T. and Hulm, J. K. , New Ferroelectric Tartrates, Phys. Rev.82_, 108 (1951).
111. Sawaguchi, E. , and Cross, L. E. , Electric Field Control of the ElasticCompliance in Lithium Thallium Tartrate, Appl. Phys. Letters 1£, 1 (1971);Control of the Elastic Compliance of Ferroelectric LiTlC .H .0,-H_ ) byElectric field, Ferroelectrics 3, 327 (1972). 4 4b z
112. Sawaguchi, E. and Cross, L. E. , Electromechanical Coupling Effects on theDielectric Properties and Ferroelectric Phase Transition in LithiumThallium Tartrate, Ferroelectrics 2_, 37 (1971) .
113. Abe, R. , Kamiya, N. , and Matsuda, M. , Dielectric Behavior of LLT andCalculation of Dipole-Dipole Interaction Energy in LAT, Ferroelectrics8, 557 (1974).
114. Cochran, W. , Crystal Stability and the Theory of Ferroelectricity , Adv.Phys. 9_, 387 (1960); Crystal Stability and the Theory of Ferroelectricity,Part II. Piezoelectric Crystals, Adv. Phys. 10_, 401 (1961).
115. Anderson, P. W. , Proceedings of the Conference on the Physics of Dielec-trics (Academy of Science, USSR, Moscow, 1958), p. 290.
116. Burns, G. and Scott, B. A., Lattice Modes in Ferroelectric Perovskites
:
PbTi03
, Phys. Rev. B7, 3088 (1973).
117. Ziman, J. M. , Principles of the Theory of Solids, 2nd. ed. (CambridgeUniversity Press, 1972)
.
118. Yamada, Y., and Shirane, G., Neutron Scattering and Nature of the SoftOptical Phonon in SrTi0
3, J. Phys. Soc. Japan 2_6, 396 (1969).
119. Bell, R. 0. and Rupprecht, G. , Elastic Constants of Strontium Titanate,Phys. Rev. 129, 90 (1963).
120. Worlock, J. M. and Fleury, P. A., Electric Field Dependence of Optical-Phonon Frequencies, Phys. Rev. Letters 19_, 1176 (1967).
121. Shirance, G. and Yamada, Y., Lattice-Dynamical Study of the 110 K PhaseTransition in SrTiC>
3, Phys. Rev. 177 , 858 (1969).
122. Cowley, R. A., Lattice Dynamics and Phase Transitions of StrontiumTitanate, Phys. Rev. A134 , 981 (1964).
123. Lombardo, G. , Sievers, A. J., and Pohl, R. 0., Low-Temperature HeatCapacity of SrTi0
3, Bull. Am. Phys. Soc. 10, 44 (1965).
124. Shirane, G. , Nathans, R. , and Minkiewicz, V. J., Temperature Dependenceof the Soft Ferroelectric Mode in KTaO,, Phys. Rev. 157, 396 (1967).
184
125. Axe, J. D., Harada , J., and Shirane, G. , Anomalous Acoustic Dispersionin Centrosymmetric Crystals with Soft Optic Phonons , Phys. Rev. Bl, 1227(1970)
.
126. Barrett, H. H. , Ultrasonic Propagation Velocity in KTaO_, Phys. Letters26A, 217 (1968)
.
127. Cowley, E. R. , and Okazaki, A., The Lattice Dynamics of Thallous Bromide,Proc. Roy. Soc. (London) A300 , 45 (1967)
.
128. Vallin, J., Marklund, K. and Sikstrom, J. 0., Second Nordic Solid StateConference, Tylosand, Sweden, 1966.
129. Khmel ' nitskii , D. E . , and Sheneerson, V. L. , Phase Transitions of theDisplacement Type in Crystals at Very Low Temperatures, Sov. Phys.-JETP3_7, 164 (1973) .
130. Samara, G. A., Vanishing of the Ferroelectric and AntiferroelectricStates in KH-PO- Type Crystals at High Pressure, Phys. Rev. Letters 27_,
103 (1971).
131. Kurtz, S. K. , Electrooptic Materials, Trans. Amer. Crystallographic Assoc.,Vol. II on Appl. Crystal Chem. 19 75.
185

NBS-114A (REV. 7-73)
U.S. DEPT. OF COMM.BIBLIOGRAPHIC DATA
SHEET
1. PUBLICATION OR REPORT NO.
NBSIR 76-847
2. Gov't AccessionNo.
3. Recipient's Accession No.
4. TITLE AND SUBTITLE 5. Publication Date
February 19776. Performing Organization Code
275.08
7. AUTHOR(S)
Ray Radebaugh, J. D. Siegwarth, W. N. Lawless & A. J. Morrow8. Performing Organ. Report No.
9. PERFORMING ORGANIZATION NAME AND ADDRESS
NATIONAL BUREAU OF STANDARDSDEPARTMENT OF COMMERCEWASHINGTON, D.C. 20234
10. Project/Task/Work Unit No.
275048911. Contract/Grant No.
NAonr-1-75 and
ARPA 253512. Sponsoring Organization Name and Complete Address (Street, City, State, ZIP)
Advanced Research Projects AgencyArlington, VA 22209
13. Type of Report & PeriodCovered ,
FinalMay 1973 - June 1975
14. Sponsoring Agency Code
15. SUPPLEMENTARY NOTES
16. ABSTRACT (A 200-word or less tactual summary of most significant information. If document includes a significant
bibliography or literature survey, mention it here.)
A solid state type of refrigeration, which utilizes the electrocaloric effectin certain dielectric materials, has been investigated. Such a refrigerator wouldoperate with a load at 4 K and reject heat to a reservoir at 15 K. Heat switches
for such a refrigerator were studied. One type was a multiple leaf contact switch.The other type was a magnetothermal switch utilizing single crystal beryllium.Based upon earlier preliminary work, the refrigeration material was to be a SrTiO^
glass-ceramic. It was found here that such a material has no useful electrocaloriceffect at 4 K. Many other materials were studied but none were found with suffi-
ciently high electrocaloric effects for a practical refrigerator, the largesteffects were seen in SrTiO^ ceramics, followed by KTaO^ single crystal. Temperature
reductions of about 0.5 K at 10 K were observed during depolarization. A theoreticalmodel, based on the electret behavior of impurity-vacancy dipoles,was developed to
explain the observed dielectric behavior in the materials investigated. Anothertheoretical model, based on the lattice dynamics of displacive dielectrics, was used
to explain the observed entropy and temperature changes seen in such materials. The
model points out that displacive type materials have too low entropies at 4 K for
practical refrigeration. An investigation of certain order-disorder dielectricsis suggested.
17. KEY WORDS (six to twelve entries; alphabetical order; capitalize only the first letter of the first key word unless a proper
name; separated by semicolons) Beryllium; ceramics ; cryogenics ; dielectric-constant; electretsa
electrocaloric effect; entropy; ferroelectrics ;glass-ceramics; heat switches;
magnetothermal conductivity; polarization; potassium tantalate; fefrigeration;
specific heat: strontium titanate.18. AVAILABILITY [x2 Unlimited
! For Official Distribution. Do Not Release to NTIS
|
1 Order From Sup. of Doc, U.S. Government Printing OfficeWashineton. D.C. 20402. SD Cat. No. C13
Pyl Order From National Technical Information Service (NTIS)Springfield, Virginia 22151
19. SECURITY CLASS(THIS REPORT)
UNCL ASSIFIED
21. NO. OF PAGES!
194
20. SECURITY CLASS(THIS PAGE)
UNCLASSIFIED
22. Price
$7.50
USCOMM.DC 29042-P741
USC0MM EM. I
Related Documents