• • •

Welcome message from author
This document is posted to help you gain knowledge. Please leave a comment to let me know what you think about it! Share it to your friends and learn new things together.
Transcript

Durham E-Theses
Electroabsorption measurements of conjugated organic
materials
Pomfret, Stephen J.
How to cite:
Pomfret, Stephen J. (1995) Electroabsorption measurements of conjugated organic materials, Durhamtheses, Durham University. Available at Durham E-Theses Online: http://etheses.dur.ac.uk/5473/
Use policy
The full-text may be used and/or reproduced, and given to third parties in any format or medium, without prior permission orcharge, for personal research or study, educational, or not-for-pro�t purposes provided that:
• a full bibliographic reference is made to the original source
• a link is made to the metadata record in Durham E-Theses
• the full-text is not changed in any way
The full-text must not be sold in any format or medium without the formal permission of the copyright holders.
Please consult the full Durham E-Theses policy for further details.
Academic Support O�ce, Durham University, University O�ce, Old Elvet, Durham DH1 3HPe-mail: [email protected] Tel: +44 0191 334 6107
http://etheses.dur.ac.uk

Electroabsorption Measurements of
Conjugated Organic Materials
by
Stephen J. Pomfret
The copyright of this thesis rests with the author.
No quotation from it should be published without
his prior written consent and information derived
from it should be acknowledged.
A thesis submitted to the Faculty of Science,
Durham University, For the degree of Doctor of Philosophy.
Department of Physics,
University of Durham,
November 1995.

Electroabsorption Measurements of Conjugated Organic Materials Stephen John Pomfret: Submitted for degree of PhD, 1995
Abstract
This thesis reports the results of electroabsorption measurements undertaken on three materials that are all, to some degree, conjugated: polymeric and oUgomeric emeraldine base, and polysquaraine. The aim of these experiments has been to investigate the nature of the optical excitations occuring within the materials.
Electroabsorption (EA) spectroscopy involves the measurement of the change in absorption coefficient of a material with the application of an external field. The fields required are high and the resulting signals small, hence to perform such experiments a dedicated spectrometer was constructed. To achieve high sensitivity lock-in ampUfication techniques were used, and the sample kept at low temperatures. Such techniques resulted in the spectrometer being able to resolve changes in absorption of the order 1 in 5x10 .̂
The sample configuration consisted of thin films of the materials which were spun coated onto sapphire substrates, with interdigitated gold electrodes deposited on top. This configuration allowed the absorption of the material to be measured while alternating fields of up to 200 kVcm-1 were appUed.
The EA data of the oUgomeric and polymeric emeraldine base are seen to closely resemble each other - indicating that the same photoexcitation processes are occurring. Using existing theories the spatial extent of the 2 eV excitation is calculated as -0.4 nm, i.e. greater than one phenyl ring repeat unit. This is consistent with previously suggested models of 2 eV photoexcitation in emeraldine base. Similar calculations suggest a spatial extent of the 4 eV transition of -0.25 nm, i.e. restricted to one phenyl ring. A feature in the EA spectra of the oUgomeric emeraldine base has been observed at 1.35 eV - below the onset of linear absorption, and it is suggested that this may be evidence of a normally one photon forbidden transition becoming allowed in the presence of an external field.
Due to the fully conjugated namre of polysquaraine a different model has been used to interpret the EA spectrum. An energy level scheme for the material is suggested, including the possible location of a normally one photon forbidden transition at 1.75 eV.
Declaration
The material contained in this thesis has not been submitted for the
examination for any other degree, or part thereof at the University of Durham or any
other institution. The material contained in this thesis is the work of the author except
where formally acknowledged by reference.
The copyright of this thesis rests with the author. No quotation from it should
be published without his prior consent and information derived from it should be
acknowledged.

Acknowledgements
I would like to thank Dr. Andy Monkman for arranging this project, and for
the patience and encouragement he has shown in the past few years.
Thanks to BICC and the DRA for being generous with both time and
equipment.
Norman and Davey deserve a special mention for generally showing me the
ropes, and keeping the whole system well oiled.
Thanks are also due to all the members of the workshops - both in physics
and engineering - without whom all the gadgets, thingumies and whadyamacallits
would never have been conjoured into existance.
Without the materials synthesised by Dr. Phil Adams and Dr. Eymard Rebourt
there would have been nothing for me to study - thank you. Special thanks to Phil
'the chemist' for being patient with a physicist
Thanks also go to my Mum and Dad who have always supported me. The
biggest thanks of all go to Debbie, who has been with me through the bleakest of
times - and generally put up with me being a pain in the butt
Dedication
To Mr. Gregory the Surgeon
and
Sandra the Physio
Contents
Chapter 1 Introduction 1
Chapter 2 An Introduction to Some Relevant Concepts 4 2.1 Tran^-polyacetylene - a Model Compound 4
2.1.1 Bond Alternation Defects 10 2.1.2 Photoexcitations in franj'-polyacetylene 12
2.2 Coulomb Interactions 17 2.3 Disorder in Conjugated Polymers 19 2.4 Non-degnerate Ground State Polymers 20 2.5 Excitons in Organic Materials 21
2.5.1 The Exciton Model of Conjugated Polymers 24 2.6 Summary
References
30
Chapters Theory of Electroabsorption Spectroscopy 34 3.1 An Overview of Modulation Spectroscopy 34 3.2 Electromodulation of Inorganic Systems 36 3.3 Electromodulation of Organic Systems 38
References
Chapter 4 Review of Materials 58 4.1 Emeraldine Base 58
4.1.1 Chemical and Geometric Structure 60 4.1.2 Review of the Optical Properties of Emeraldine Base 63
4.1.2.1 Linear Absorption 64 4.1.2.2 Photoinduced Absorption 69 4.1.2.3 Photoconductivity 75
4.1.3 Ring Rotations in Polyaniline 75 4.1.4 Emeraldine Salt 77 4.1.5 Summary 80
4.2 Polysquaraine 81 References
Chapter 5 Experimental Procedures 90 5.1 Sample Preparation 90
5.1.1 Chemical Synthesis 90 5.1.1.2 Polyemeraldine Base 91 5.1.1.2 Oligomeric Emeraldine Base 91
5.1.2 Sample Construction 92 5.2 EA Spectrometer 96 5.3 Measurement of Absorption Coefficients 102
References
Chapter 6 Results and Discussion 105 6.1 Emeraldine Base 105
6.1.1 Polymeric Emeraldine Base 105 6.1.1.1 Linear Absorption 105 6.1.1.2 Electroabsorption 107 6.1.1.3 Discussion 114
6.1.2 Oligomeric Eraeraldine Base 116 6.1.2.1 Linear Absorption 116 6.1.2.2 Electroabsorption 117 6.1.2.3 Discussion 117
6.1.3 Comparison of Polymeric and Oligomeric Emeraldine 123 Base
6.2 Polysquaraine 128 6.2.1 Linear Absorption 128 6.2.2 Electroabsorption 130 6.2.3 Discussion 130 6.2.4 Summary 139
6.3 Comparison of the Interpretation of the Results of Emeraldine 140 Base and Polysquaraine References
Chapter 7 Summary 143
Chapter 1
Introduction
Much attention is being focused upon the physical properties of conjugated
polymers. A combination of unusual optical and electrical properties combined with
ease of manufacture and processability has ensured that both academic and industrial
institutions have realised the wealth of possible applications of such materials. Apart
from the much publicised polymer LEDs, there have been advances in the use of
polymers for electrical shielding, optical third harmonic generation, rechargeable
batteries and gas sensing appUcations.
This thesis concentrates on the optical properties of three materials -
polymeric and oligomeric emeraldine base, and polysquaraine. It describes the
investigation of electroabsorption responses in thin films of these materials.
Electroabsorption spectroscopy is the study of the change in absorption coefficient
under the application of an external field. The fields required to cause measurable
perturbations in such systems are large - of the order of 100 kVcm"l - and even with
such large fields the resulting perturbations are small. The combination of the
requirements of high voltages and the detection of small signals meant that a
dedicated spectrometer had to be designed and constructed.
From the data acquired from such experiments certain theories may be
employed to deduce information about the nature of the photoexcited states of
materials.
Chapter two gives a brief overview of the basic concepts of the field of
conjugated polymers. Initially it concentrates on the simplest of 7t-conjugated

polymers - polyacetylene. Due to its relative simplicity it has been extensively
theoretically modelled in an effort to understand the mechanisms involved in optical
and electrical excitations within the material. Many of these models, however, are
based on a 'perfect' system, neglecting the effects of disorder and chemical impurities.
Later work has shown that the effects of disorder may, in fact, be dominant in certain
polymeric systems. Such effects are discussed, including the suggestion that excitons
may be the dominant photoexcited species in a large group of polymers.
Chapter three introduces the concept of electroabsorption spectroscopy. It
begins with a brief history of the use of the technique, from its first use with inorganic
materials to its modem-day use with organics. Various theories are presented as to
the origin of the variation in absorption coefficient, and as to the information that can
be gained from its interpretation.
Chapter four contains a review of the relevant previous research undertaken
on the materials investigated in this thesis. Due to the fact that the polyaniline family
of polymers (of which emeraldine base is a member) was first synthesised over 100
years ago, this material has been extensively studied - especially so in the last fifteen
years, during which interest in conjugated polymers has blossomed. Theoretical
modelling of any polymer is a large task, hence most approaches to modelling
concentrate on extrapolating results of calculations on oligomers. This has been the
case for the semi-conjugated polymer emeraldine base, with four and five ring repeat
unit oligomers being used to model the polymer. A phenyl capped oUgomer of
eraeraldine base has been included in these electroabsorption studies so that the
results can be compared with those of the polymer, and in doing so see if such
theoretical extrapolation techniques are valid for this material.
Polysquaraine, however, is a relatively new material, having been specifically
designed and synthesised with the aim of producing a fully conjugated polymer with a
low energy optical band gap. Chapter 4 contains a brief description of the theory
behind its production, and a review of its characterisation. Comparisons are drawn
between emeraldine base and polysquaraine.
Chapter five describes the experimental techniques involved in the
measurement of the electroabsorption response of these materials. Firstiy, a brief
explanation of the chemical synthesis of the materials is given, followed by a
desription of the method of sample preparation. The design and construction of the
electroabsorption spectrometer is explained. The small size of the signal being
measured necessitated the use of lock in amphfication techniques, along with many
other noise reduction methods. The interpretation of electroabsorption data requires
knowledge of the absorption coefficient spectrum of each material - the method of
acquisition of this data is included in this chapter.
The results are presented and discussed in chapter 6. The theories presented
in chapter 3 are used to interpret the data, with die choice of approach being
governed by the suggested nature of the photoexcited states of the material - as
discussed in chapter 4. The electroabsorption response of the polymeric and
oligomeric emeraldine base are compared and contrasted, followed by a discussion of
the results for polysquaraine.
Finally, a summary of the thesis is given in chapter 7.

Chapter 2
An Introduction To Some Relevant Concepts.
This chapter aims to put the work of this thesis in perspective in relation to
the ever broadening field of organic electroactive materials. It begins with the
simplest model compound of its type, fron^-polyacetylene, with the purpose of
describing the basic concepts of energy levels and optical transitions within a n-
conjugated molecule. The following sections broaden these ideas to encompass
more complicated systems, and introduce the deviation from idealised models
caused by disorder.
2.1 rra/is-polyacetylene - a Model Compound
TVflAzj'-polyacetylene is a fully 7t-conjugated polymer with an idealised
chemical structure of the form shown in Fig. 2.1a. Three other structures shown are
the other possible configurations of the polymer, of which cis-cisoidal (d) is
considered unstable due to steric considerations.
The term 'TT-conjugation' refers to the delocalisation of electrons along a
chain of atoms arising from the natare of covalent bonding between them.
Polyacetylene (PA), like most of the polymers of interest to physicists, comprises of
a polymer backbone of purely carbon atoms. The configuration of die electrons in
the outer shell of a carbon atom is S1P3. Mixing of these orbitals can form four sp3
hybrids, allowing carbon to form four covalent bonds - bonds of this type are termed
'single' bonds, or altemativley 'sigraa' (a) bonds. If, however, three electrons form

H H H
c c c' - \ > = \ /
H H H
\ / \ C / C
/ = c c = C
\ / \ H H H
H
/ C
H H H H
(a) (b)
H H H H
/ % / \
H
C C C C / \ . /
H H H H
(c) (d)
Fig. 2.1 Isomers of Polyacetylene, a) trans-transoidal, b) cis-transoidal, c) trans-cisoidal, d) cis-cisoidal.
(after Yu[l]).
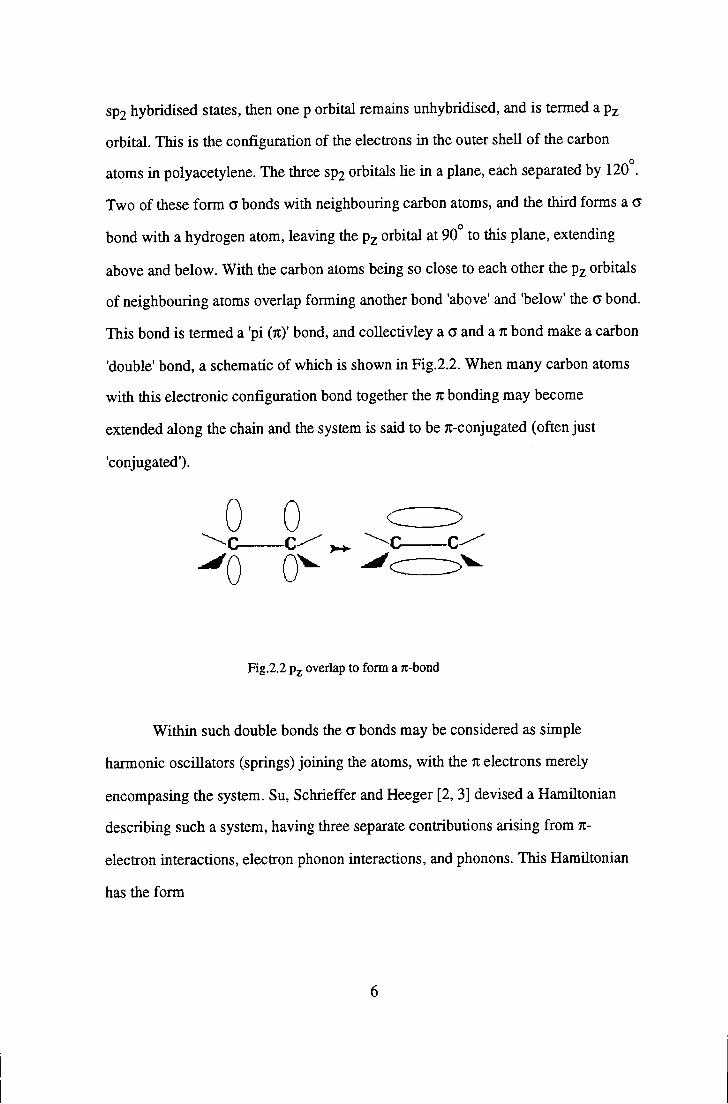
sp2 hybridised states, then one p orbital remains unhybridised, and is termed a p^
orbital. This is the configuration of the electrons in the outer shell of the carbon
atoms in polyacetylene. The three sp2 orbitals lie in a plane, each separated by 120°.
Two of these form a bonds with neighbouring carbon atoms, and the third forms a a
bond with a hydrogen atom, leaving the p^ orbital at 90° to this plane, extending
above and below. With the carbon atoms being so close to each other the Pz orbitals
of neighbouring atoms overlap forming anotiier bond 'above' and 'below' the a bond.
This bond is termed a 'pi (n)' bond, and collectivley a a and a K bond make a carbon
'double' bond, a schematic of which is shown in Fig.2.2. When many carbon atoms
with this electronic configuration bond together the K bonding may become
extended along the chain and the system is said to be Tt-conjugated (often just
'conjugated').
0 0 c c-'0 0̂
Fig.2.2 P 2 overlap to form a 7c-bond
Within such double bonds the c bonds may be considered as simple
harmonic oscillators (springs) joining the atoms, witii the n electrons merely
encompasing the system. Su, Schrieffer and Heeger [2,3] devised a Hamiltonian
describing such a system, having three separate contributions arising from 71-
electron interactions, electron phonon interactions, and phonons. This HamUtonian
has the form
and is termed the SSH (Su-Schreiffer-Heeger) Hamiltonian. It is used to
describe how the distortion of the fron^-polyacetylene chain away from its regular
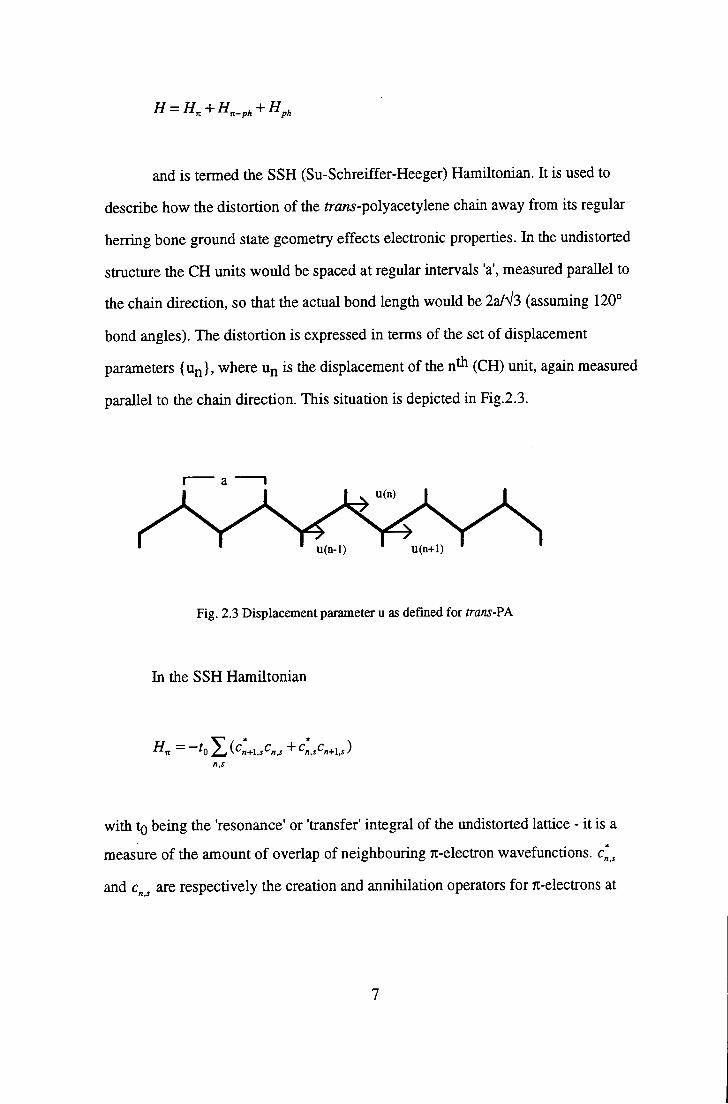
herring bone ground state geometry effects electronic properties. In the undistorted
structure the CH units would be spaced at regular intervals 'a', measured parallel to
the chain direction, so that the actual bond length would be 2a/V3 (assuming 120°
bond angles). The distortion is expressed in terms of the set of displacement
parameters {u^}, where u^ is the displacement of the n^^ (CH) unit, again measured
parallel to the chain direction. This situation is depicted in Fig.2.3.
U(n)
U(n-l) U(n+1)
Fig. 2.3 Displacement parameter u as defined for trans-PA
In the SSH Hamiltonian
with to being the 'resonance' or 'transfer' integral of the undistorted lattice - it is a
measure of the amount of overlap of neighbouring K-electron wavefunctions. c* ̂
and c„ ̂ are respectively the creation and annihilation operators for 7t-electrons at
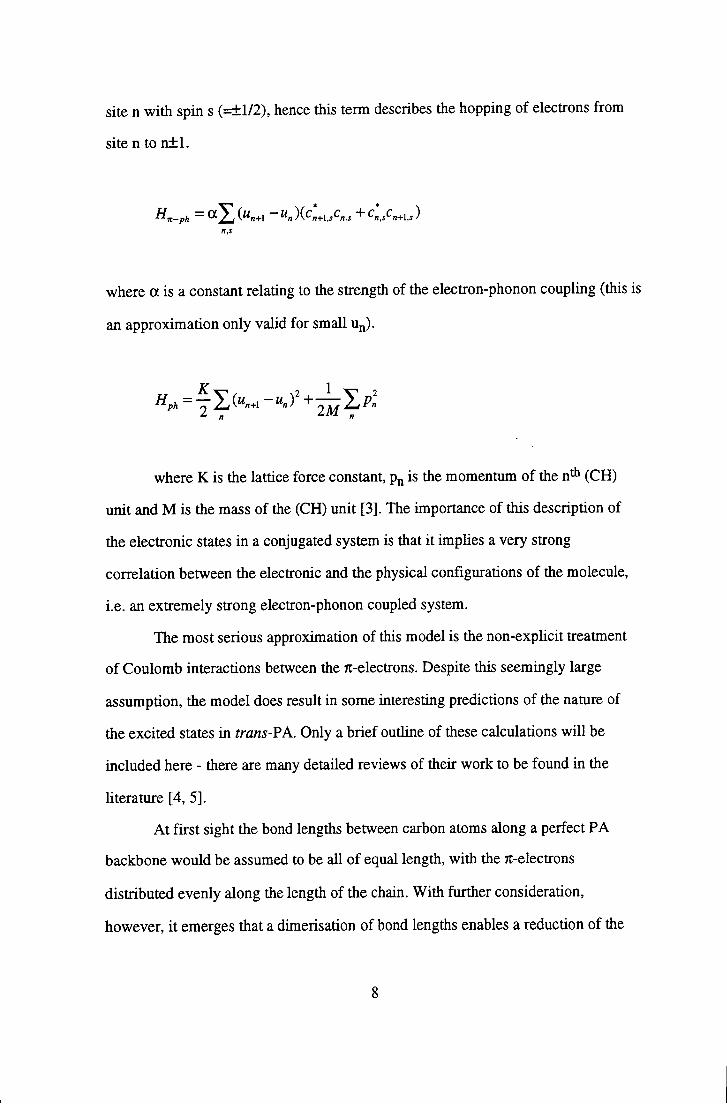
site n witii spin s (=±1/2), hence this term describes the hopping of electrons from
site n to n±l.
where a is a constant relating to the strength of the electron-phonon coupling (this is
an approximation only valid for small U Q ) .
K 1
where K is the lattice force constant, Pn is the momentum of the n^ (CH)
unit and M is the mass of the (CH) unit [3]. The importance of this description of
the electronic states in a conjugated system is that it implies a very strong
correlation between the electronic and the physical configurations of the molecule,
i.e. an extremely strong electron-phonon coupled system.
The most serious approximation of this model is the non-explicit treatment
of Coulomb interactions between the Tt-electrons. Despite this seemingly large
assumption, the model does result in some interesting predictions of the namre of
the excited states in trans-PA. Only a brief outline of these calculations will be
included here - there are many detailed reviews of their work to be found in the
literature [4, 5].
At first sight the bond lengths between carbon atoms along a perfect PA
backbone would be assumed to be all of equal length, with the Tt-electrons
distributed evenly along the length of the chain. With further consideration,
however, it emerges that a dimerisation of bond lengths enables a reduction of the
total energy of the electrons [2, 3] Direct evidence of this dimerisation has been
observed using X-ray diffraction [6] and NMR [7] studies. This dimerisation is
analogous to the Peierls instability for one dimensional metals, in which a static
lattice deformation opens up a band gap at the Fermi level [8]. The conjugated n-
electron band in the PA backbone is half fiUed (according to the Pauli exclusion
principle - each p^ orbital contains only one of a possible two electrons: one spin up,
one spin down). In the un-dimerised form trans-PA would therefore be a metal,
having a finite density of states at the Fermi energy. This configuration is unstable
with respect to a dimerised lattice, since the total energy of the occupied band states
in the dimerised form is reduced by the presence of the band gap. A diagram
depicting the manner in which energy can be reduced upon dimerisation is shown in
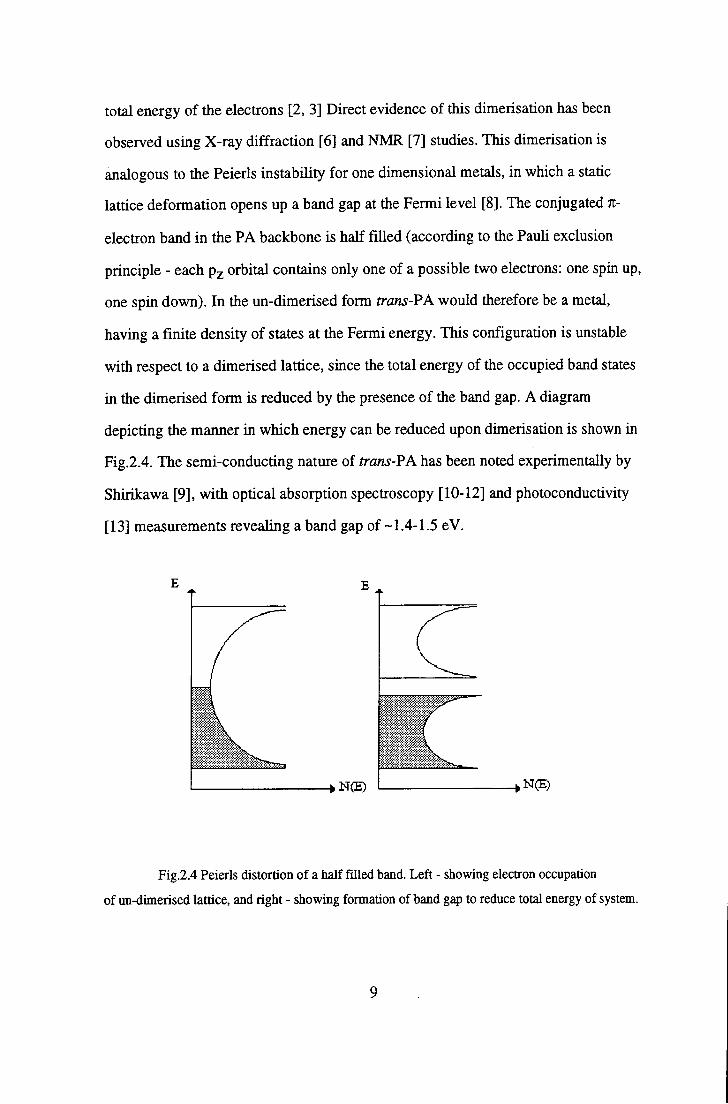
Fig.2.4. The semi-conducting nature of trans-PA has been noted experimentally by
Shirikawa [9], with optical absorption spectroscopy [10-12] and photoconductivity
[13] measurements revealing a band gap of -1.4-1.5 eV.
- •N(E)
Fig.2.4 Peierls distortion of a half filled band. Left - showing electron occupation
of un-dimerised lattice, and right - showing formation of band gap to reduce total energy of system.
The energy decrease available from such a distortion has been predicted to
be dependent upon the number of repeat units in the conjugated system - i.e. the
chain length of an ideal system. The value of band gap should therefore be observed
to decrease with increasing length of polymer chain - especially when starting from
short chain oligomers, as the value of the band gap is highly dependent upon chain
length for short chain lengths. Such a phenomena has been observed experimentally
by Hudson [14] and Brassett [15].
2.1.1 Bond Alternation Defects
If a chain has an odd number of carbon atoms, then, in order to satisfy
boundary conditions, a bond alternation defect must occur somewhere along the
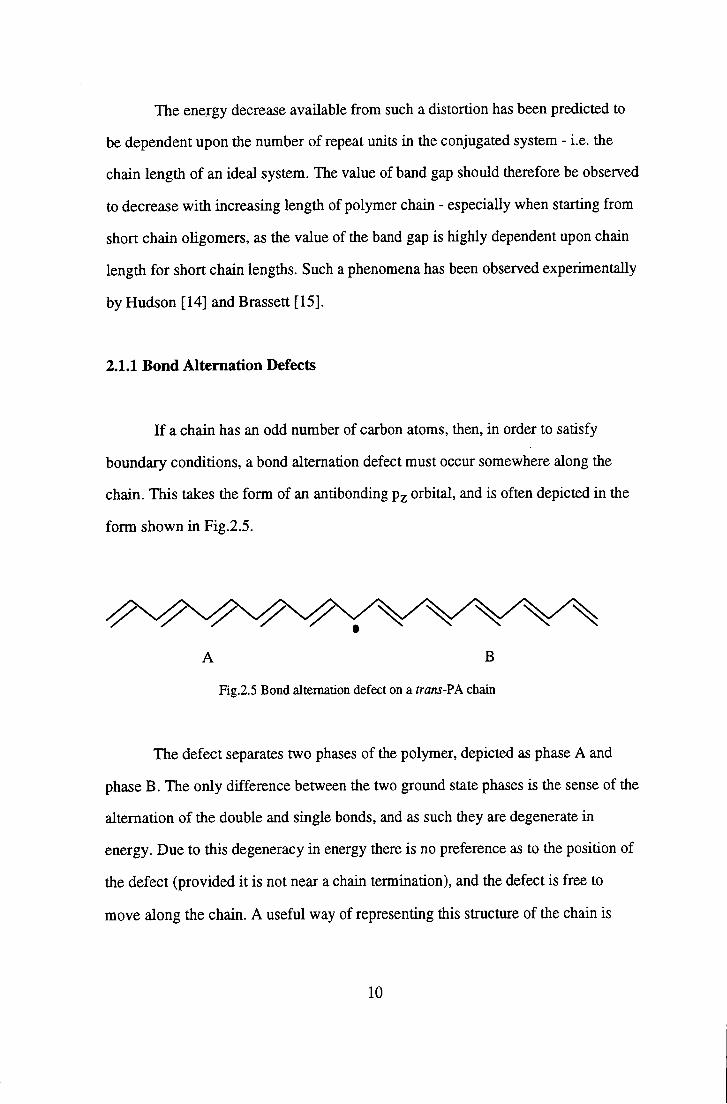
chain. This takes the form of an antibonding Px orbital, and is often depicted in the
form shown in Fig.2.5.
A B
Fig.2.5 Bond alternation defect on a trans-PA chain
The defect separates two phases of the polymer, depicted as phase A and
phase B. The only difference between the two ground state phases is the sense of the
alternation of the double and single bonds, and as such they are degenerate in
energy. Due to this degeneracy in energy there is no preference as to the position of
the defect (provided it is not near a chain termination), and the defect is free to
move along the chain. A useful way of representing this structure of the chain is
10

through the introduction of an order parameter (j)„ defined by ([)„ = (-1)" y ,
where UQ is the amphtude of dislacement in the ground state. The two degenerate
ground states then correspond to <^„=-l or +1 for all n. This order parameter is
useful when visualising the processes involved during photoexcitations, as will be
seen later.
The representation of the defect in Fig.2.5 is, in fact, rather simplistic. It
depicts the defect as occuring on one site - phase A changing to phase B over the
space of just one carbon atom. Calculations have shown [2, 3] that the phase change
extends over approximatley 14 bonds, having a form more like that depicted in
Fig.2.6. This defect/ phase change/kink is known as a 'sohton'.
Fig.2.6 A soliton as an extended state
Fig.2.7 shows where a soliton is predicted to lie within the band energy
structure of trans-PA - half way between the valence and conduction bands [2,3].
The neutral soliton contains one electron (the antibonding Pz electron) and hence
has spin 1/2. This spin-charge relationship is unusual, since usually only charged
entities have spin.
Non-topological excitations that do not involve the reversal of bond
alternation are also possible and are termed polarons. If on one chain a soliton
changes the sense of bond alternation from A to B, then another soliton on the same
chain that reverses this, and changes B to A, is termed an antisoUton. A polaron is
effectively a bound soliton-antisoliton pair. The creation of a polaron depletes the
11

valence and conduction bands by one whole state each, creating two localised states
symmetrically split about midgap, each being able to accomodate two electrons due
conduction band
„,'' , ' valence band
Fig.2.7 Location of soliton level in semi-conductor band picture
to spin degeneracy [16,17]. Fig.2.8 shows the electronic structure of the positive
polaron P+. It should be noted that polaronic states obey the conventional spin-
charge relationships.
conduction band
P+
valence band
Fig.2.8 Location of a polaron level in the semi-conductor band picture
2.1.2 Photoexcitations in ira/is-polyacetylene
According to the Bom-Oppenheimer approximation, the difference between
the masses of electrons and nuclei is such that the two systems may be treated
independently of one another. This leads to the Franck-Condon principle of
electronic transitions, where it is assumed that such transitions occur so rapidly that
12
the nuclei can be assumed static. Thus, in trans-FA, when an electron is
photoexcited it has been proposed that an electron-hole pair is produced in a
perfectly dimerised lattice. After the photoproduction of the pair the lattice responds
to the new electronic state by deforming to a more energetically favourable
conformation, producing a soliton-antisoliton pair at raid gap [2, 3].
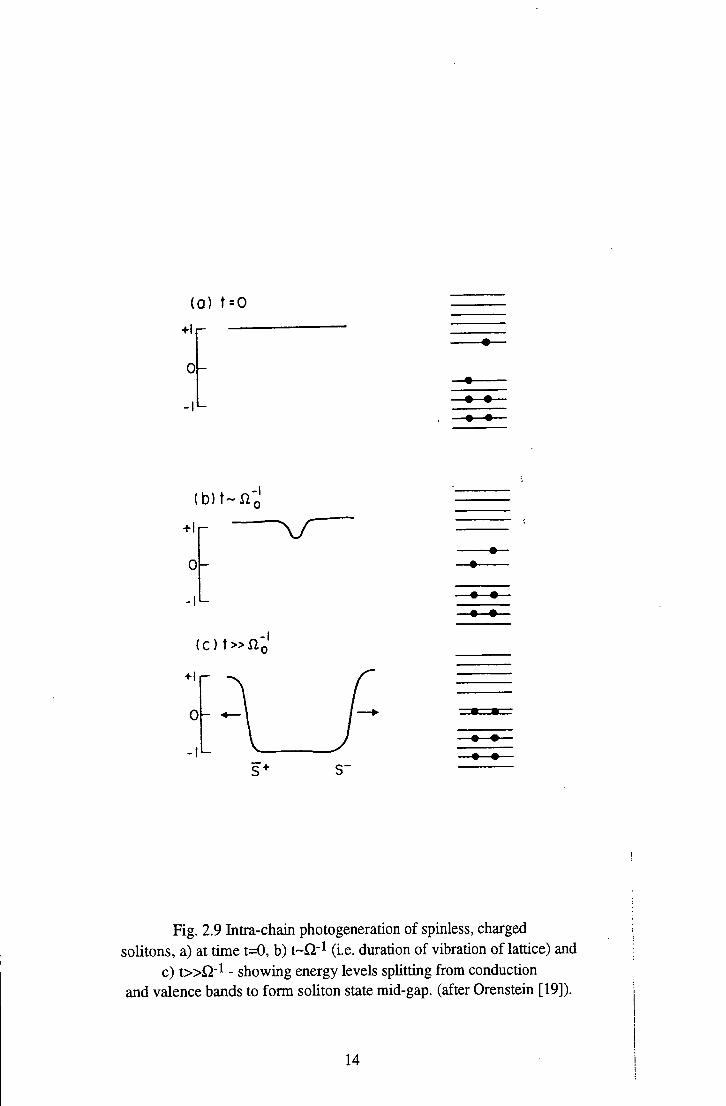
Numerical integrations of the SSH Hamiltonian for trans-PA have been
performed by Su and Schrieffer [2, 3] which demonstrate how an electron-hole pair
can generate such a soliton-antisoliton pair. A schematic of the process is shown in
Fig.2.9: the left hand side of the diagram shows the response of the ID lattice in
terms of the order parameter (j)„, and the right hand side shows the corresponding
changes in the spectrum of electronic levels. The first stage of the process is the
promotion of an electron to the lowest unoccupied state at time t=0. If ())„=+1 is the
initial ground state, then within a single vibrational period (~ lO'̂ ^s) the lattice
deforms adiabatically, and simultaneously a pair of electronic states split off
symmetrically from the valence and conduction bands. At times large compared
with the vibrational period the localised defect develops into a charged soliton-
antisoliton pair and the pair of electronic states, now at mid gap, become spatially
localised at the instantaneous positions of the separating solitons. The calculations
of Ball [18] show that the symmetry of the Hamiltonian forbids the production of a
pair of neutral solitons.
So far the processes described have only involved the ID case of single PA
chains. Most systems, however, consist of many chains closely packed together
allowing interactions between chains. If these interactions are sufficiently large it is
possible for inter-chain photoexcitations to occur resulting in the electron and the
hole being located on different chains. Su and Schrieffer [20] have demonstrated
how an individual electron or hole could produce a polaron; a schematic of the
process is shown in Fig.2.10. At time t=0 a single electron is added to a neutral
13
(a ) t = o
0
- I
( b ) t ~ i i ;
0 -
-•—•-
( c ) t » n o
0
- I
Fig. 2.9 Intra-chain photogeneration of spinless, charged solitons, a) at time t=0, b) t-Qr^ (i.e. duration of vibration of lattice) and
c) t»Q"^ - showing energy levels splitting from conduction and valence bands to form soUton state mid-gap. (after Orenstein [19]).
14

( a ) t = o
+ lr- -
0
(b ) t - x i ' o
0
+1 • • - • — • -
( C ) t » fto'
• •
Fig. 2.10 Inter-chain photogeneration of polarons at times a) t=0, b) t~n-l, and c) t » Q - l , showing energy levels splitting off
from conduction and valence bands to form level at mid-gap. (after Orenstein [19]).
15
trans-PA chain, and the lattice distorts in much the same way as before. In this case,
however, a polaron is more energetically stable than a soliton-antisoliton pair. Thus
inter-chain photoexcitation is expected to initially produce polarons.
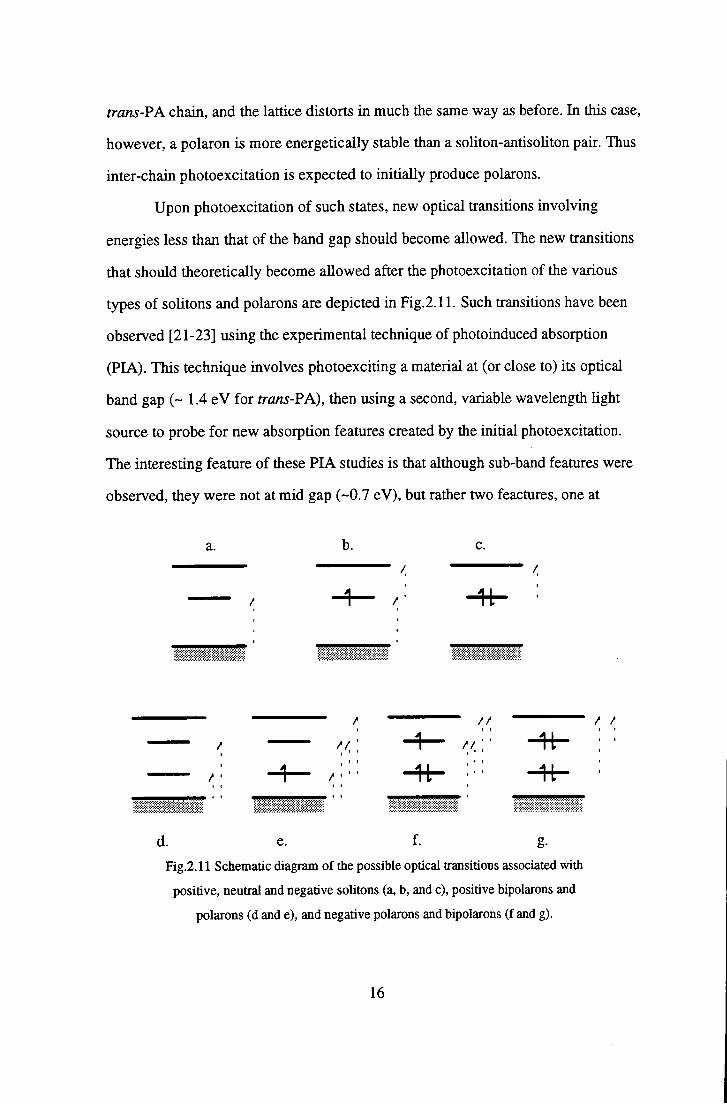
Upon photoexcitation of such states, new optical transitions involving
energies less than that of the band gap should become allowed. The new transitions
that should theoretically become allowed after the photoexcitation of the various
types of solitons and polarons are depicted in Fig.2.11. Such transitions have been
observed [21-23] using the experimental technique of photoinduced absorption
(PIA). This technique involves photoexciting a material at (or close to) its optical
band gap (~ 1.4 eV for trans-PA), then using a second, variable wavelength light
source to probe for new absorption features created by the initial photoexcitation.
The interesting feature of these PIA studies is that although sub-band features were
observed, they were not at mid gap (-0.7 eV), but rather two feacmres, one at
a. b. c.
d. e. f. g. Fig.2.11 Schematic diagram of the possible optical transitions associated with
positive, neutral and negative solitons (a, b, and c), positive bipolarons and
polarons (d and e), and negative polarons and bipolarons (f and g).
16

0.45 eV and one at 1.35 eV [19, 22]. These two feactures have been assigned to
charged and neutral solitons, respectively. The deviation of their positions away
from mid gap has been attributed to the neglect of Coulomb interactions in the
original SSH Hamiltonian, a topic which will be discussed later in this chapter.
The technique of photoinduced absorption is a very powerful experimental
tool for probing the energy levels of excited states of a system, and has been used
extensively with organic systems (see chapt. 4 for example). The time resolution of
these experiments can also reveal important information about the material in
question. Most PIA experiments involve the chopping of the pump beam with an
optical chopper at frequencies around 100 Hz. This is slow in comparison with the
excitation processes occuring within the system and is hence considered 'steady
state' PIA - only observing the excited states well after the excitation process has
occured. It is possible to perform time resolved PIA experiments, using a pulsed
laser as the both pump and probe. This method allows investigation of the
photoexcitation dynamics on a picosecond or femtosecond time scale. In this
manner Shank et al. [24] revealed that the 1.35 eV photoexcitations in trans-Y'Pi. are
intrinsic to the polymer chains, rather than the possible alternative of the
photoexcitations only occuring at defect sites.
2.2 Coulomb Interactions
The main assumption of the SSH model is the neglect of Coulomb
interactions within the system. There have been many attempts to develop rigorous
models including such interactions [4, 5] in an effort to account for the
experimentally observed deviations from the predictions of the simple SSH model.
These calculations agree on the dimerisation of trans-PA, and that solitons and
polarons may be photoexcited within the material - though the energies predicted for
17
these states differ from those when Coulomb interactions are not included. Coulomb
interactions are introduced into the SSH model as perturbations, and as pointed out
by Campbell et al, [25] the validity of treating such large effects as perturbations is
dubious, and the debate looks set to continue [26-28].
If the Coulombic interactions in a system are large, then upon
photoexcitation a bound electron-hole pair may be formed rather than the
completely dissociated entity predicted in the SSH model. Such a pair is termed an
exciton, and has an energy below that of the conduction band in the system - the
energy reduction being due to the attractive Coulomb force between the electron and
the hole. Excitons, unless trapped, are considered free to move through the system
and hence transport energy; their movement does not result in the transport of
charge as an exciton is electrically neutral. All excitons are unstable with respect to
the ultimate recombination process in which the electron drops back into the hole.
There is abundant evidence that exciton formation is the primary
photoexcitation in an important group of polymers, the polydiacetylenes (PDAs)
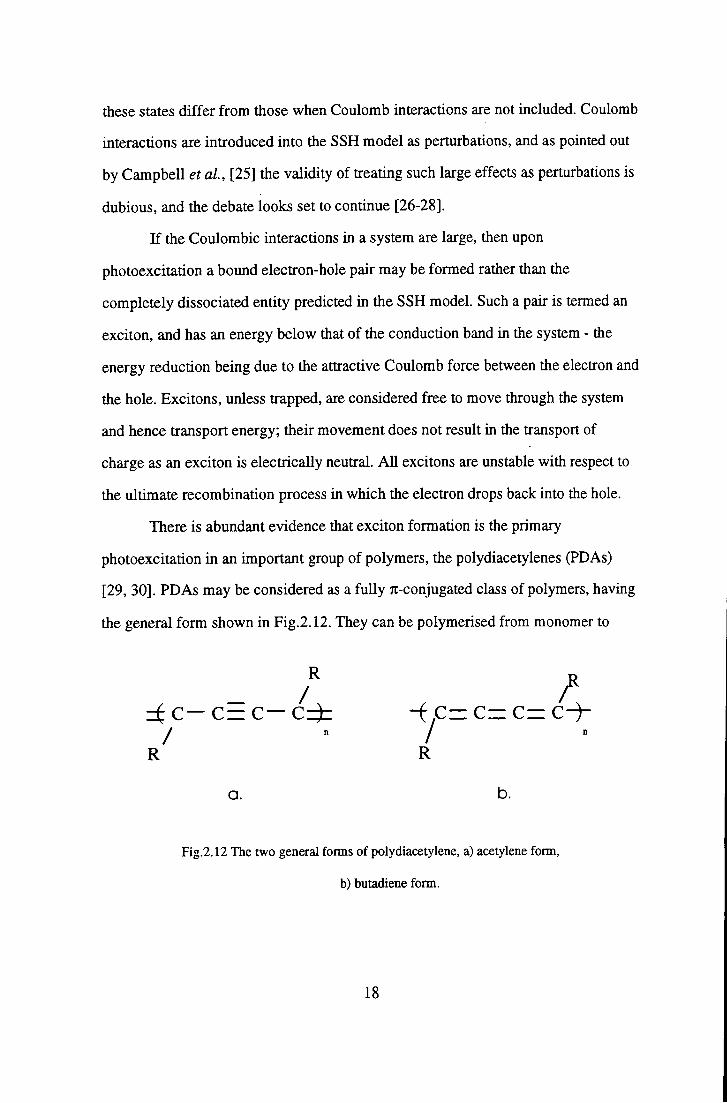
[29, 30]. PDAs may be considered as a fuUy Tt-conjugated class of polymers, having
the general form shown in Fig.2.12. They can be polymerised from monomer to
R /
C — C— C — C z t - ( , C = C = C = C - ^ / " /
R R
a. b.
Fig.2.12 The two general forms of polydiacetylene, a) acetylene form,
b) butadiene form.
18
polymer while in the crystalline form (solid state polymerisation), resulting in the
formation of a highly ordered conjugated polymer system. This alone makes PDAs
very important, as it allows the study of conjugated systems relatively free from
disorder. The electronic structure of PDAs, as investigated using electroabsorption
techniques, will be discussed further in chapter 3. The various types of excitons and
their related properties will be dicussed in more detail in the section 2.5.
2.3 Disorder in Conjugated Polymers
The systems considered in the previous sections have been that of idealised
polymer chains. No system, however, is completely free from some form of
imperfection or discontinuity - chain terminations (ends), for instance, are always
present.
There are many types of disorder, though they usually result in the same
effect - a reduction of the effective length over which conjugation extends, termed
the 'conjugation length'. Within a real polymer chain the following forms of disorder
must be taken into consideration:
a) defects in chemical structure - such as chain terminations, crosslinkages,
structural impurities [31].
b) variations in configuration - departures from the ideal geometrical
structure involving the disruption of double or triple bonds. Since it involves a
change in the electriconic structure of the system, it is considered to be a change in
the chemical structure.
19

c) variations in conformation - departures from the ideal geometrical
structure involving rotation about single bonds. This does not involve the breaking
of bonds, and is hence considered to be a change in the physical state of the
molecule. This type of disorder is often temperature dependent [32], such as the
phenyl ring rotations in polyaniline [33] and cis and trans isomerism in
polyacetylene. Rotation of bonds may change the orientation of p̂ orbitals and
hence the degree of Jt-electron delocalisation - and hence the conjugation length -
may be affected.
The number of defects present in a system is obviously important, as the
more defects, the shorter the effective conjugation length. In the case of a polymer
with a high degree of disorder, the semi-conductor band picture may break down;
the short conjugated segments being more appropriately modelled by molecular
states. To this end Eckhardt [34] suggested that trans-PA should be treated as a
collection of short conjugated units with the lowest optical excitation being
excitonic, rather than solitonic in nature. The question of whether conjugated
polymers are best described in terms of excitons or band states is discussed in the
section 2.5.
2.4 Non-degenerate Ground State Polymers
Solitons can only occur in systems which have two ground state
configurations that are degenerate in energy. This is true for trans-PA, but not for
most other conjugated polymer systems. The more general case is that a polymer
exists in its lowest energy configuration 'A', and any change in this configuration -
for instance upon photoexcitation - leads to the polymer being in a higher energy
configuration ,'B'. If, then, a photoexcitation occurred that produced a bond
alternation with configation A on one side and B on the other, the defect would tend
20
to migrate along the chain so as to leave the whole chain in the lower energy
configuration, A.
However, if two such excitations were to occur close to each other with the
higher energy configuration, B, trapped in between them (ABA), then the overall
excitation would be stable with respect to its position on the chain. This type of
excitation has already been described in section 2.1.1 for trans-?A - a polaron. An
example of the chemical structure suggested for such an excited state in a non-
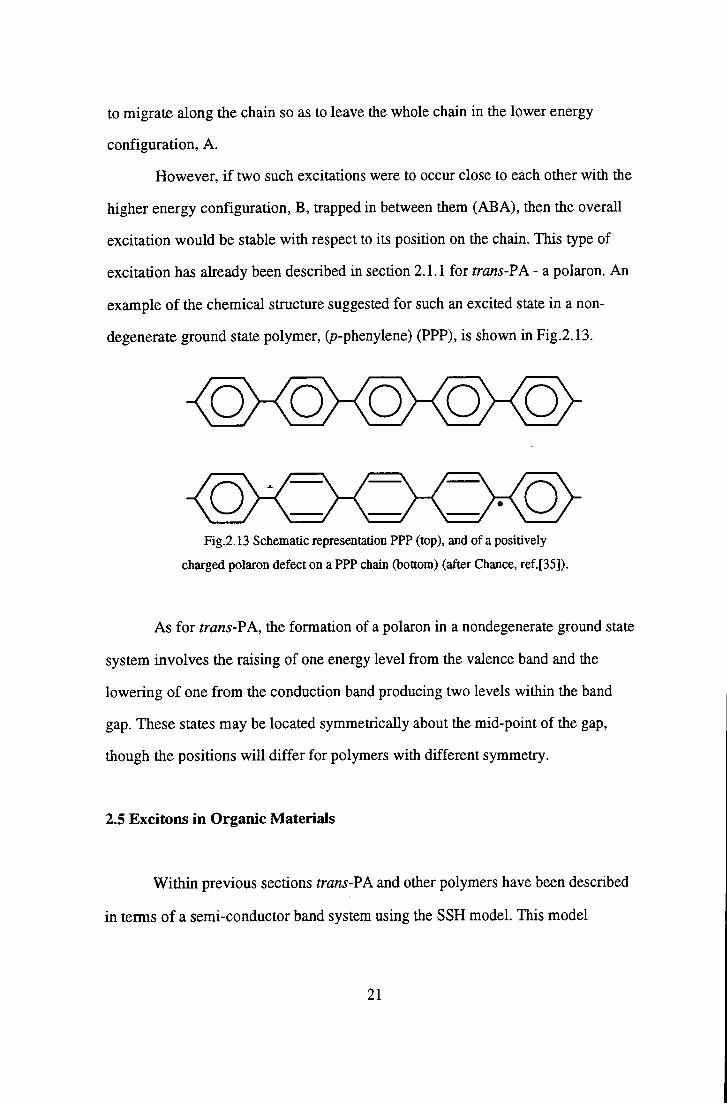
degenerate ground state polymer, (p-phenylene) (PPP), is shown in Fig.2.13.
o o o o o o o
Fig.2.13 Schematic representation PPP (top), and of a positively
charged polaron defect on a PPP chain (bottom) (after Chance, ref.[35]).
As for trans-?A, the formation of a polaron in a nondegenerate ground state
system involves the raising of one energy level from the valence band and the
lowering of one from the conduction band producing two levels within the band
gap. These states may be located symmetrically about the mid-point of the gap,
though the positions will differ for polymers with different symmetry.
2.5 Excitons in Organic Materials
Within previous sections trans-VA and other polymers have been described
in terms of a semi-conductor band system using the SSH model. This model
21

neglects, amongst other things, electron-electron interactions - as pointed out in
section 2.2. For some systems the inclusion of such interactions may result in
excitons becoming the primary photoexcitations.
The SSH model requires a high degree of coupling between structural sub-
units of the system. In systems where this is not the case the SSH model is not
appropriate. In cases of weak intersite coupling a photoexcited electron will remain
on the initial site of photoexcitation, bound to the resulting hole. Such a bound pair
is termed a Frenkel exciton. The separation of the electron from the hole in such an
exciton is small - less than the distance to the nearest neigbouring site, i.e. the
interatomic distance in a normal crystal or the intermolecular distance in a
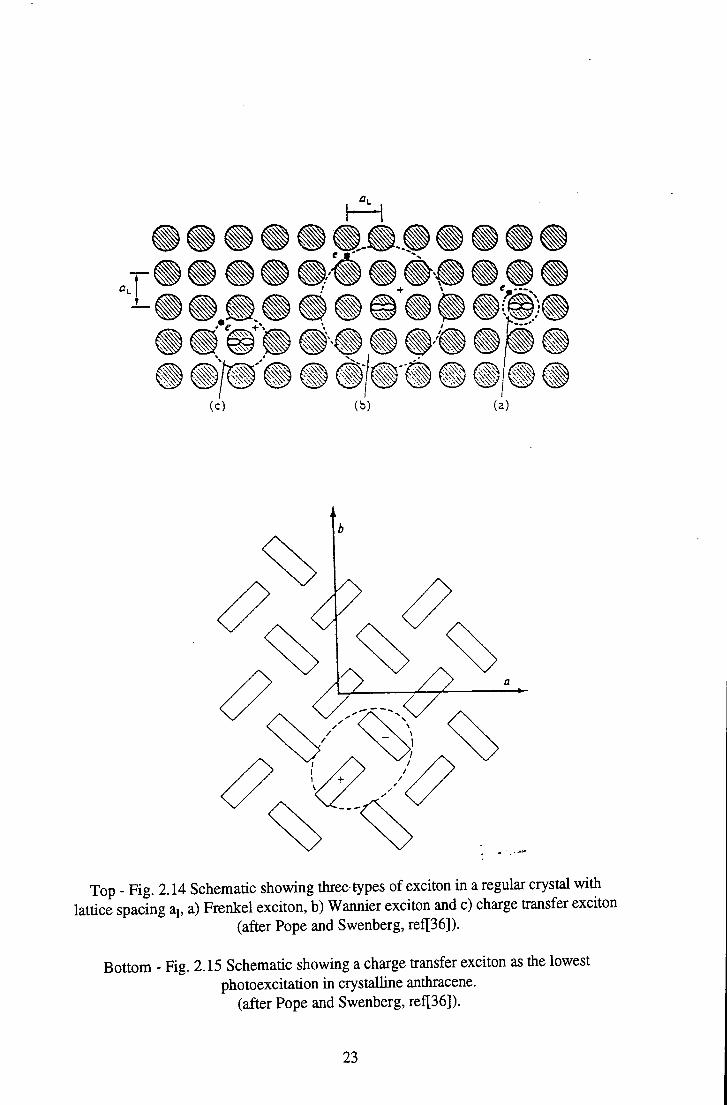
molecular crystal. Such an exciton in a crystal lattice is depicted in Fig. 2.14. The
exciton may move through the system as a bound pair, transferring energy - but as
with all excitons no charge is transferred. The electron in a Frenkel exciton may be
considered as freely orbiting its respective hole, and as such the pair has no
permanent dipole moment.
At the other extreme one can have excitons where the electron-hole
separation distance is more than an order of magnitude larger than the site
separation distance. This type of exciton is known as a Wannier (or sometimes
Wannier-Mott) exciton, and is depicted in Fig.2.14. In such a situation the
intervening medium between the electron and the hole may be approximated as a
dielectric continuum, and hence the exciton can be seen as analogous to a large
positronium atom. The Coulombic interaction between hole and electron is given by
~ / ^ r ' (̂ '̂ "̂'̂ ^ electron hole seperation distance) and optical transitions of
such an excitation have been seen to resemble the Rydberg transitions in a hydrogen
atom [36]. Such excitons occur mainly in inorganic systems where the interaction
energy is great and the dielectric constant high. Even so, calculations by Bounds and
22
»»i • » « W »l» ® II«
Top - Fig. 2.14 Schematic showing three types of exciton in a regular crystal with lattice spacing aj, a) Frenkel exciton, b) Wannier exciton and c) charge transfer exciton
(after Pope and Swenberg, ref[36]).
Bottom - Fig. 2.15 Schematic showing a charge transfer exciton as the lowest photoexcitation in crystalline anthracene,
(after Pope and Swenberg, ref[36]).
23
Siebrand [37] for the molecular crystal anthracene suggest that all but the lowest
lying excited states in this organic material can be treated as Wannier excitons. Once
again, with the electron freely orbiting the hole, these excitons have no permanent
dipole moment.
Frenkel and Wannier excitons represent the two extremes with respect to
charge separation distances within excitons. Between these two lies the intermediate
case of the charge transfer (CT) exciton. The basic distinction of a CT exciton, as
opposed to Frenkel and Wannier exciton, is that the electron is considered to be
excited to a particular site rather than being free to 'orbit' the hole. This site is
usually the nearest or next nearest neighbour. Such a transition results in a state with
a permanent dipole moment being formed - as depicted in Fig.2.15 for the lowest
photoexcitation in crystalline anthracene - in contrast to the non-polar Frenkel and
Wannier excitons.
CT excitons occur mainly in heteromolecular structures such as charge
transfer complexes, evidence of which is seen in, for instance, anthracene PMDA
(pyromelitic dianlhydride). In such non-isotropic heteromolecular systems electron
excitation is favoured from one constituent to the other (i.e. from donor to acceptor).
2.5.1 The Exciton Model of Conjugated Polymers
The question now arises as to which model should be used to desribe
conjugated polymers; the semi-conductor band model or the exciton model. The
problem is, as yet, unresolved.
Bassler et al. [28] have suggested that for a large group of conjugated
polymer systems the semi-conductor band model is not appropriate. Instead, they
suggest that the disorder inherent within most polymers shortened the conjugation
length to such an extent that the SSH model breaks down. Instead of a semi-
24
conductor band model, the energy levels of the short conjugated chains are more
appropriately described in terms of molecular states. Within these states the electron
correlation effects are dominant over the electron-phonon interactions. To
investigate the appUcability of the exciton model to amorphous systems Bassler and
co-workers investigated the conjugated polymer systems of
poly(phenylphenylenevinylene) (PPPV) and poly(dodecylthiophene) (PDT). They
use the results of absorption, luminescence, electroabsorption, and
photoconductivity experiments for these materials to demonstrate that such a model
is consistent with observed physical properties.
Firstly, a direct comparison is made between the absorption spectra of PPPV
and related short chain oligomer compounds of varying chain length. The spectra
indicate that the chromophores involved in the absorption process in PPPV are
equivalent to oligomers containing around 10 repeat units. This implies that the
average conjugation length within the polymer chain is only 10 repeat units long.
Bassler et al attribute this short conjugation length to disorder within the system - a
similar proposition having been made by Eckhardt for trans-PA [34]. Since the size
of the optical band gap depends upon conjugation length, the spread of conjugation
lengths due to disorder causes the experimentally observed inhomogeneous
broadening of the absorption peaks in the polymer. This broadening of absorption
peaks in the polymer system compared to related short chain oUgomers is observed
for almost all conjugated organic systems, only being obscured when a more
dominant broadening effect is present.
Bassler suggests that the absorption profile of such a system does not depict
that of a semi-conductor band model, but more that of transitions to locally excited
states of chromophores randomly distributed along the polymer chain. Further
evidence to support this argument comes from the results of fluorescence
25
experiments [38-40], and the observed magnitude of the Stokes shift, as discussed
below.
In a polymer system of the type suggested by Bassler [28], electronic
coupling would exist between neighbouring sites on the chain and on neighbouring
chains, allowing transfer of excited states through the system. It would be expected,
therefore, that in a system of this kind the magnitude of the Stokes shift would be
dependent upon the photoexcitation energy - for the following reason. I f it is
assumed that the coupling energy between sites allows transfer only to nearest
neighbouring sites, then when an excitation occurs the excited state wil l migrate
through the system until it reaches a site of minimum energy - all its neighbouring
sites having higher energy values. It will be from this site that the excited state
would radiatively recombine with energy V I Q ^ - this energy would be similar
throughout the system. This being the case, photoexcited states of any energy above
Vjoc should thermalise until they reach Vio^, and then fluoresce with that energy. The
Stokes shift - the difference between excitation energy and photoemitted energy -
should therefore increase with increasing photoexcitation energy above Vi^^.. For
photoexcitations below Vjoc there should be no Stokes shift, since there is no method
for non-radiative decay.
Such fluorescence experiments have been carried out for PPV [40], PPPV
[38], and PDT [39], all had simUar responses to that shown for PPV in Fig.2.16. In
each case the emission energy is independent of the excitation energy as long as Vg^c
-^loc- Below Vjoc the emission energy is dependent upon the excitation energy, V^Q^.
therefore indicates the energy threshold between states that participate in energy
transport and those that do not.
This, however, is not conclusive proof that the system is excitonic, it merely
indicates that the results are compatible with such a proposed model. The
localisation energy Vjoc may also be interpreted as the energy that distinguishes
26

CJJ
18.9 ^
^ 18.7
cz o 'to CO
17.A
17.2 h
1535cm"'
18.8 19.0 19.2 19.4 196 Excitat ion energy OO^cm"^)
Fig. 2.16 Plot of emission vs. excitation energy for the 0-0 and 0-1 vibronic bands of a PPV film
(after Bassler, ref[28]).
27
localised from delocalised states within a band model. More evidence is needed for
the excitonic argument to be convincing - Bassler et al. [28] use the results of
electroabsorption studies on thin films of the polymer as evidence that the systems
are, indeed, excitonic in nature. As will be described in chapter 3, there are several
ways to interpret the results of electroabsorption experiments. Using the assumption
that excitons are the primary photoexcited species, from their results Bassler
estimates the spatial extent of such excited states as being no more than 2-3 repeat
units of the polymers. With the average conjugation length of 10 repeat units, this
presents the picture of excitons moving coherently within a polymer segment,
confined by topological faults.
The conclusion that the photoexcitations of PPPV and PDT are excitonic in
origin and should be described in the above manner is then shown to be compatible
with the results of photoconductivity (PC) investigations. In PDAs the onset of PC
is found to occur some 0.4 eV above the exciton energy [29]. Excitons occurring in
PDA exist for only short times on very ordered chain segments, so it is unlikely for
them to escape geminate recombination. The exciton requires more energy to
dissociate, and hence the onset of PC is at higher energies than the absorption. In
PPPV, however, the onset of PC is found to occur at similar energies to the onset of
absorption [28]. To explain this Bassler invokes disorder effects. If the system
consists of an array of chromophores with different conjugation lengths - and hence
different excitation energies, as well as different ionisation energies and electron
affinities - an exciton created on a higher energy segment has the option to expand if
the electron or the hole can jump to an adjacent, more extended chromophore with
higher electron affinity/lower ionisation energy. In that case the expense of
Coulombic binding energy can be more than compensated for by the gain in
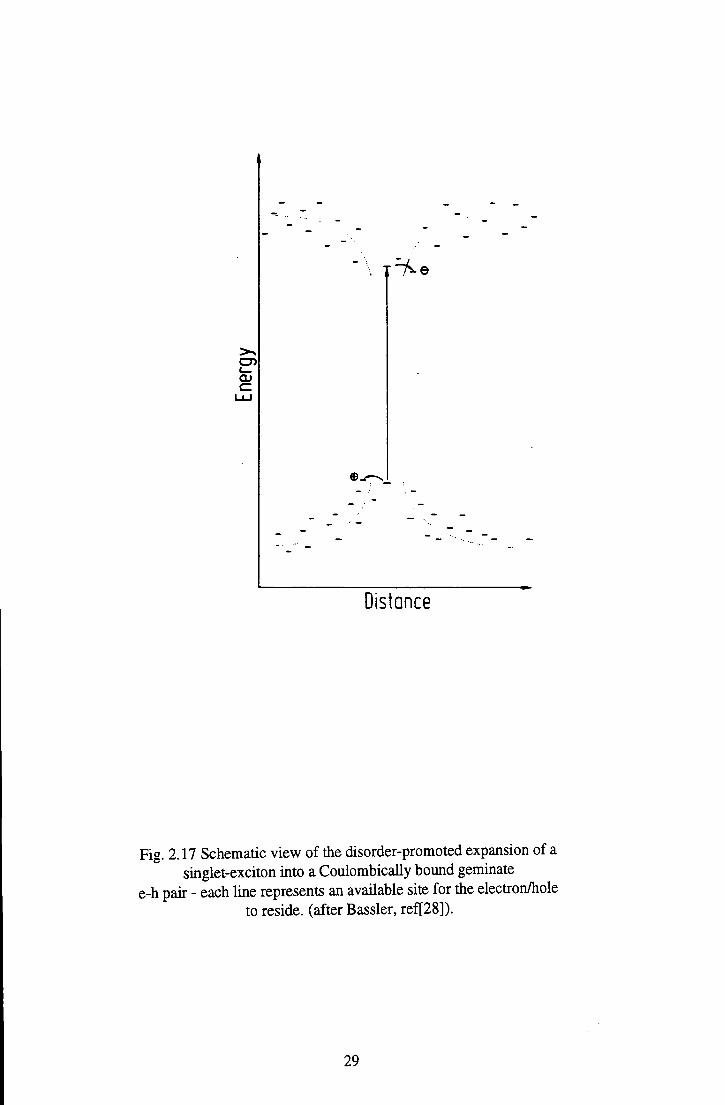
delocalisation energy, as illustrated in Fig.2.17. Even low energy excitons may
escape geminate recombination through this disorder induced process, and hence the
28
e
Distance
Fig. 2.17 Schematic view of the disorder-promoted expansion of a singlet-exciton into a Coulombically bound geminate
e-h pair - each line represents an available site for the electron/hole to reside, (after Bassler, ref[28]).
29

onset of PC becomes approximately coincident with the onset of absorption.
The results of all these experiments are consistent with the idea of
photoproduction of excitons within a diosdered polymer system, and hence Bassler
et al. [28] suggest that such a model may be applicable to many amorphous
polymers.
2.6 Summary
This chapter has introduced the basic idea of conjugation in polymer
systems, concentrating mainly on the simplest of conjugated polymers, trans-
polyacetylene. The semi-conductor band model was used to describe the energy
levels of the electrons within the system and the extension of this using the SSH
model has been briefly outlined, introducing the concept of solitons, polarons and
bipolarons. The deficiencies of such a model have been indicated, including the
neglect of electron-electron interactions and the possible effects that disorder may
introduce. This leads to the question as to whether it would be better to consider
many of 7C-conjugated polymers as having excitons as the primary photoexcitations,
located on short conjugated sub-units of the polymer chain.
This thesis investigates the primary photoexcitations of three materials,
polymeric and oligomeric emeraldine base, and polysquaraine, with the aim of
further understanding the nature of the excited states produced. Combined with the
results of previous investigations, it may be possible to gain a better insight into the
photoexcitation processes occuring in these materials.
30
References
1. Yu, L. , Solitons and Polarons in Conducting Polymers. 1988, Singapore:
World Scientific Publishing Co. Pte. Ltd.
2. Su, W.P., J.R. Schrieffer, and A.J. Heeger, Phys. Rev. Lett, 1979. 42: p.
1698.
3. Su, W.P., Phys. Rev. B, 1980. 22: p. 2099.
4. Baeriswyl, B., D.K. Campbell, and S. Mazumdar, in Conducting Polymers,
H. Keiss, Editor. 1991, Springer, New York.
5. Heeger, A.J., et al., Rev. Mod. Phys, 1988. 60: p. 781.
6. Fincher, C.R., et al, Phys. Rev. Lett, 1982. 48: p. 100.
7. Yannoni, C.S. and T.C. Clarke, Phys. Rev. Lett, 1983. 51: p. 1191.
8. Peierls, R.E., Quantum Theory of Solids. 1955: Oxford University Press.
9. Shirakawa, H., Makromol. Chem, 1978.179: p. 1565.
10. Suzuki, H., et al., Phys. Rev. Lett, 1980. 45: p. 1209.
11. Etemad, S., A.J. Heeger, and A.G. MacDiarmid, Ann. Rev. Phys. Chem,
1982. 33: p. 443.
12. Fincher, C.R., et al., Phys. Rev. B, 1979. 20: p. 1589.
13. Blanchet, G.B., C.R. Fincher, and A.J. Heeger, Phys. Rev. Lett, 1983. 51: p.
2132.
14. Hudson, B.S. and B. Kohler, Ann. Rev. Phys. Chem, 1974. 25: p. 437.
15. Brasset, To be published in Synth. Met,.
16. Fesser, K., A.R. Bishop, and D.K. CampeU, Phys. Rev. B, 1983. 27: p.
4804.
17. Campbell, D.K. and A.R. Bishop, Nucl. Phys. B, 1982. 200: p. 297.
31
18. Ball, R., W.P. Su, and J.R. Schrieffer, J. Phys. (Paris) Colloq, 1983. 44: p.
C3-429.
19. Orenstein, J., Handbook Of Conducting Polymers, T.A. Skotheim, Editor.
1986, Marcel Decker, New York.
20. Su, W.P. and J.R. Schrieffer, Proc. Nad. Acad. Sci. USA, 1980. 77: p.
5626.
21. Colaneri, N.F., et al, Phys. Rev. B, 1988. 38: p. 3960.
22. Orenstein, J., G.L. Baker, and Z. Vardeny, J. Phys. Colloq. C3, 1983. 44: p.
407.
23. Vardeny, Z.V. and J. Truac, Phys. Rev. Lett, 1985. 54: p. 1844.
24. Shank, C.V., et al., Phys. Rev. Lett, 1982. 49: p. 1660.
25. CampbeU, D.K., D. Baeriswyl, and S. Mazumdar, Synth. Met, 1987.17: p.
197.
26. Abe, S., et al., Phys. Rev. B, 1992. 45: p. 9432.
27. Abe, S., J. Yu, and W.P. Su, Phys. Rev. B, 1992. 45: p. 8262.
28. Bassler, H., et al., Synth. Met., 1992. 49: p. 341.
29. Lochner, K., et al., Phys. Status Solidi (b), 1978. 88: p. 653.
30. Sebastian, L. and G. Weiser, Chem. Phys, 1981. 62: p. 447.
31. Rossi, G., Synth. Met, 1992. 49: p. 221.
32. Salaneck, W.R., Contemp. Phys, 1989. 30: p. 403.
33. Monkman, A.P., et al., Mol. Cryst. Liq. Cryst., 1993. 236: p. 189.
34. Eckhardt, H., J. Chem. Phys, 1983. 79(4): p. 2085.
35. Chance, R., et al., Solitons, Polarons, and Bipolarons in Conjugated
Polymers, in Handbook of Conducting Polymers., T.A. Skotheim, Editor.
1986, Marcel Dekker, Inc, New York.
32
36. Pope, M. and C.E. Swenberg, Electronic Processes in Organic Crystals.
Monographs on the Physics and Chemistry of Materials. Vol. 39. 1982:
Oxford University Press.
37. Bounds, P.J. and W. Siebrand, Chem. Phys. Lett, 1980. 75: p. 144.
38. Mahrt, R.F., et al., Makromol. Chem. Rapid Commun., 1990.11: p. 415.
39. Mahrt, R.F. and H. Bassler, Synth. Met, 1991. 45: p. 107.
40. Rauscher, U., et al., Phys. Rev. B, 1990. 42: p. 9830.
33

Chapter 3
Theory of Electroabsorption Spectroscopy.
This chapter aims to give an overview of the theory behind electroabsorption
spectroscopy. Detailed description of the actual techniques used within the
experiment wi l l be discussed later, in chapter 4.
3.1 An Overview of Modulation Spectroscopy
There are many various types of modulation spectroscopy, all of which have
the aim of revealing more information about the energy level structure of materials
than is available from linear absorption or reflection spectra. Measurements involve
the monitoring of transraittance, or reflectance, of a sample in the presence of a
periodic perturbation. The use of modulated perttirbations allows phase sensitive
detection methods to be used, and hence small induced changes may be detected -
signals with resolution of the order 1 in 10^ are regularly reported [1-7]. Broad
structures present in the unperturbed spectra do no not mask these feactures, as it is
only the difference spectra (spectrum with applied perturbation minus the spectrum
withouth the applied pertubation) which are recorded.
The sample in question may be periodically altered in some physical way,
such as the application of heat or pressure, or the measurement parameters
themselves may be periodically adjusted. An example of the latter is wavelength
modulation, in which the wavelength of the incident hght is modulated. This is
considered to be an 'inherent modulation', meaning that it is a variation of the
measuring system rather than 'external modulation' - variation of the physical
conditions of the sample.
34
The work presented within this thesis is concerned with electroabsorption
(EA) spectroscopy. It is an external form of modulation spectroscopy - the electric
field through the sample being the modulated parameter. The resulting change in
absorption of the sample can give information concerning the energy level structure
of the material. Closely related to EA is electroreflection (ER) spectroscopy, which,
as its name implies, is the same technique apart from the fact that it is the
reflectivity of the sample which is monitored. The choice of measuring EA as
opposed to ER of any one material mostly depends on the nature of the samples.
The measurement of the EA response of a material requires an optically thin sample,
and so ER instead of EA would have to be used for the study of the
electromodulated optical response of samples which by their nature cannot produced
optically thin, i.e. free standing stretch aligned polymer films.
The first electro-modulation spectroscopy was performed by Seraphin in
1964 [8], reporting electroreflectance data for germanium. Following on from this
there was rapid development of modulation techniques, and much research
undertaken into probing the band structures of inorganic semiconductors [9, 10].
Subsequent work on organic materials has shown that, though similar in some
crystalline cases, organic and inorganic systems have different electromodulation
responses. This is hardly suprising, considering the difference in structure between
regular, three dimensional crystalline inorganic semiconductors and the quasi one-
dimensional, often disordered organic materials.
There have been several theories put forward to explain the observed
electromodulated spectra observed in organic systems, each with its own set of
approximations and assumptions. The rest of this chapter wi l l attempt to outUne
both the theories for inorganic and organic materials, so as to put the discussion of
the results of this thesis in context.
35

3.2 Electromodulation of Inorganic Systems
In 1958 Franz [11] and Keldysh [12] predicted that the application of a
uniform electric field should induce optical absorption below the energy gap of an
inorganic semiconductor. The effect, which came to be known as the 'Franz-Keldysh
effect', was based upon the concept of holes and electrons being able to tonnel
through the energy gap in the presence of an applied electric field by the process of
photon-assisted tunneling. Above the gap a series of oscillations (the Franz-Keldysh
oscillations) were also predicted. These predictions were confirmed in
electroabsorption and electroreflection experiments in the mid-60's [8,13-16].
Further calculations by Aspnes and Rowe [17,18] indicated that ful l quantum
mechanical expressions for the electric field induced broadening reduced to a simple
form when only low fields are applied to the system. Resulting from their
calculations there appeared three distinct regimes of applied field strength [19]:
a) the low field limit; a fu l l quantum mechanical treatment of the electric
field induced changes in the band structure was unnecassery to provide a good fit to
the experimental results. Only a first order perturbation treatment was required,
which resulted in a third order differential of absorption lineshape. This low field
regime has been widely investigated, and led to electric field modulation
spectroscopy becoming known as 'third derivative spectroscopy'.
The physical mechanism responsible for the electric field modulation is the
coupling of the external field to the electrons within the crystal, causing them to
accelerate through the lattice. The quantum mechanical perturbation calculation for
this low field regime includes the term H' = - e E » x (electric field E in direction x)
to account for the appUcation of the uniform electric field in the Hamiltonian
(H = HQ+ H' ). This term is not lattice periodic and therefore destroys the
36
translational invariance of the Hamiltonian in the field direction (x). This results in
the one-electron Bloch states of adjacent momentum (k) becoming mixed, and hence
non-vertical optical transitions become allowed. Physically, this means that an
electron accelerates and occupies a large number of k states before undergoing a
collision process. It is this acceleration that leads to the third derivative lineshape
behaviour in inorganic semiconductors.
b) intermediate field; the Franz-Keldysh effect - oscUiations become
apparent above the band gap (Franz-Keldysh oscillations). Even though this is the
intermediate field case, it was often termed 'high field', as it was often difficult to
achieve experimentally the fields necessary to leave this regime and enter the true
high field regime described below. This intermediate regime is the one described by
Franz and Keldysh using ful l quantum mechanical descriptions - rather than just a
first order perturbation approach - of an electron being accelerated in a crystal band
structure.
c) high field limit; the Stark effect. The applied fields necessary to acheive
this regime are very high (-10'^ Vcm-^) and are not normally achieved. The field
gradient across a unit cell of the crystal is so large that the band structure of the
material is altered and the selection rules for optical transitions are modified.
The effects of impurity levels and strongly bound excitons in
electromodulated spectroscopy of inorganic systems have also been considered. The
picture of an electron being accelerated in an external field cannot be used in these
cases, and hence more involved theoretical approaches are required. For localised
states the problem has often been analysed in terras of the Stark effect. Reviews of
electromodulation spectroscopy of localised excitations have been presented by Luty
37
[20], Dow [21], and Grassano [22]. Some of these theories, such as the use of the
Stark effect, have been utilised in the consideration of electroabsorption response of
polymer systems - as wiU be outlined in the next section.
3.3 Electromodulation of Organic Systems
It is obvious that unless an extremely ordered crystal of an organic system
can be synthesised, the Franz-Keldysh approach used for crystalline inorganic
semiconductors cannot be used for organic systems. EA experiments have revealed
feactures in some PDAs [23] that have been attributed to the Franz-Keldysh effect,
but this is confined to exceptionally high quaUty single crystals and in general a new
approach must be sought to interpret the electromodulation spectra of the disordered
polymer systems.
The field gradients present in an inorganic material are small and the
bandwidths large due to the long range order and symmetry of the system, and
hence an external applied electric field does not have to be large to cause a
measurable permrbation to the system. In organic systems however, the internal
field gradients are large and the bandwidths small, and hence much larger external
electric fields need to be applied before any perturbation of the system may be
observed. It is for this reason that electroabsorption responses in organics were not
detected until much later than inorganic materials.
In the early '80's electroabsorption and electroreflectance techniques were
applied to molecular crystals and organic polymers with conjugated Tt-electron
systems [7, 24-26]. The extended electronic order and large bandwidths of these
delocalised Tc-electron systems are sensitive to the applied electric fields as the
38

potential drop across these states forms a significant perturbation to the average
internal fields.
Some of the first EA experiments performed by Sebastian and Weiser were
on films of solid pentacene and tetracene [7]. An example of their EA spectra for
pentacene is given in Fig.3.1. From this data they concluded that the photoexcited
states were a combination of charge transfer and Frenkel excitons. The argument
they used is as follows.
The absorption spectrum of a molecular system responds to the application
of an electric field via the field induced change in absorption AE(F) of the transition
energy. I f E(0) is the transition energy in zero applied field, then
AE{F) = E{F)-EiO) = -(mf-mi)»F-)^F»ApF eqn. 3.1
where mj is the dipole moment of the ground state, mf the dipole moment of the
excited state, and Ap is the change in the polarisability upon photoexcitation. For
apolar molecules, such as tetracene and pentacene, mi=0. Using the idea of charge
transfer occuring upon photoexcitation the dipole moment of the final state (mf) is
equal to qr, where q is the charge transferred (which is assumed to be one electron,
and hence q=-l), and r is the separation distance.
The change in absorption coefficient as a function of AE may be expressed
as a McLaurin series truncated at the second term
Aa = ^ A £ - H ^ {AEf eqn. 3.2 oE oE
39

F--50kV/cm
T = 77K
Fig. 3.1 Absorption (a) and EA (Aa) for pentacene, at a temperature of 77 K and an appUed field of 50 kV/cm. Solid lines represent experimental
results, dashed Unes represent the f i t from theoretical modelling, (after Sebastian, ref[7])
40

Combining eqn. 3.1 and eqn. 3.2 gives the change in Aa as a function of the
modulating electric field. Sebastian points out two cases of importance - the
production of excited states with and without a dipole moment.
A Frenkel exciton is small and may be considered to be a freely orbiting
electron hole pair - and hence overall neutral. Photoproduction of such a state, or
any centrosymmetric state, results in (mf.F)=0, with the consequence that the only
contribution to AE comes from the change in polarisability. Truncating eqn. 3.2 at
the first term gives
Aa = ) 4 A p F ^ | | eqn. 3.3
where Ap is the average over the change in components of the polarisability tensor.
Eqn. 3.3 describes the Stark effect. This effOect is always present, smce the
polarisability of a molecule changes as a result of the change in electron distribution
upon electronic excitation.
When a charge, q, is transferred a distance, r, upon photoexcitation the
predicted EA is different. The final state now has a dipole moment mf=qr, and
AE=-mf.F, (the contribution from Ap being small in comparison). Isotropic
averaging over the randomly oriented charge transfer dipoles gives
iAEy=}^(qrFf eqn. 3.4
and
41
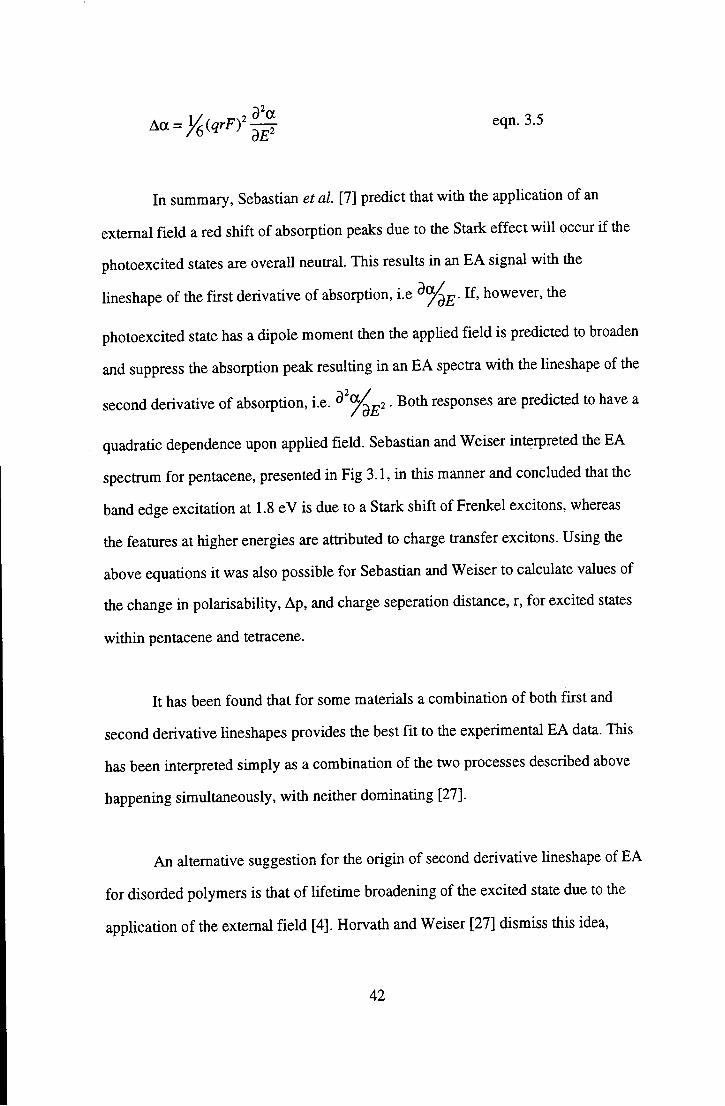
In summary, Sebastian et al. [7] predict that with the application of an
external field a red shift of absorption peaks due to the Stark effect will occur if the
photoexcited states are overall neutral. This results in an EA signal with the
lineshape of the first derivative of absorption, i.e If> however, the
photoexcited state has a dipole moment then the appUed field is predicted to broaden
and suppress the absorption peak resulting in an EA spectra with the lineshape of the
second derivative of absorption, i.e. ^^^^2 • Both responses are predicted to have a
quadratic dependence upon applied field. Sebastian and Weiser interpreted the EA
spectrum for pentacene, presented in Fig 3.1, in this manner and concluded that the
band edge excitation at 1.8 eV is due to a Stark shift of Frenkel excitons, whereas
the features at higher energies are attributed to charge transfer excitons. Using the
above equations it was also possible for Sebastian and Weiser to calculate values of
the change in polarisability, Ap, and charge seperation distance, r, for excited states
within pentacene and tetracene.
It has been found that for some materials a combination of both first and
second derivative lineshapes provides the best fit to the experimental EA data. This
has been interpreted simply as a combination of the two processes described above
happening simultaneously, with neither dominating [27].
An alternative suggestion for the origin of second derivative lineshape of EA
for disorded polymers is that of lifetime broadening of the excited state due to the
application of the external field [4]. Horvath and Weiser [27] dismiss this idea.
42

using the argument that if it were the case, then the same physical processes and
hence the same second derivative lineshape should be observed in crystalline
samples.They point out that PDAs, and even weakly bound excitons in
semiconductor systems such as CdS [28], respond to applied fields primarily with a
first order lineshape - indicative of a quadratic Stark shift.
Recent work by Horvath and Weiser [27] has shown that materials which are
theoretically predicted to have centrosymmetric, and hence neutral excited states,
may have EA spectra corresponding to lineshapes of the second derivative of
absorption, apparently in contradiction to this earUer argument concerning charge
transfer excitons. They consider that the disorder present within an amorphous
material may produce non-uniform internal fields that in turn may cause idealy non-
polar states to become polarised. This idea is important in the discussion of the EA
of emeraldine base, as will be discussed later in this thesis.
Sebastian and Weiser also carried out electroreflectance studies on various
PDAs [25]. The EA signals in these compounds were around two orders of
magnitude larger than those of pentacene and tetracene. Using their previous method
to analyse the data produced polarisabilities and separation distances of the charges
so large that they were considered incompatible with the polymer systems. In an
effort to reconcile the results with theory they introduced a new dimension to their
model. As before, they proposed that the photoinduced species is a charge transfer
exciton. PDAs are centro-symmetric, and so the charge is transferred in no
preferential direction - it can be excited equally well to the 'left' as to the 'right', as
depicted in Fig.3.2. In the presence of an applied field, however, the charge will be
excited in a preferential direction - 'down field'. This preference was designated 5,
and incorporated into their previous calculations. It turned out that 6 had much the
43
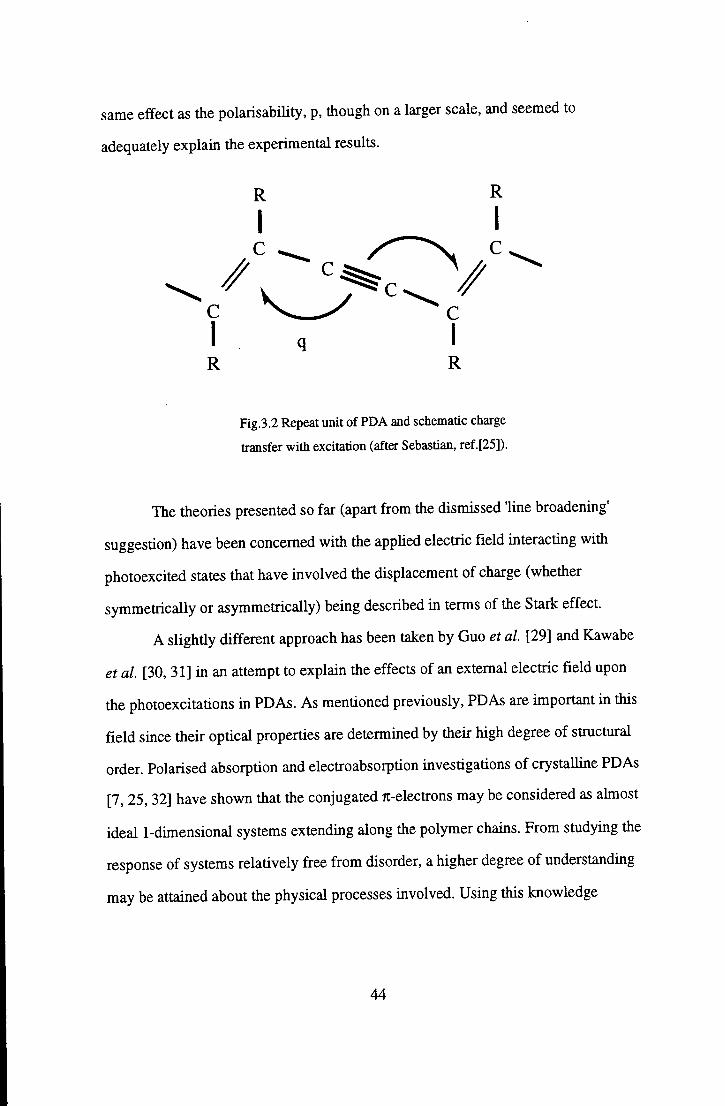
same effect as the polarisability, p, though on a larger scale, and seemed to
adequately explain the experimental results.
Fig.3.2 Repeat unit of PDA and schematic charge
transfer with excitation (after Sebastian, ref.[25]).
The theories presented so far (apart from the dismissed 'line broadening'
suggestion) have been concerned with the applied electric field interacting with
photoexcited states that have involved the displacement of charge (whether
symmetrically or asymmetrically) being described in terms of the Stark effect.
A slighdy different approach has been taken by Guo et al. [29] and Kawabe
et al. [30,31] in an attempt to explain the effects of an external electric field upon
the photoexcitations in PDAs. As mentioned previously, PDAs are important in this
field since their optical properties are determined by their high degree of structural
order. Polarised absorption and electroabsorption investigations of crystalline PDAs
[7, 25,32] have shown that the conjugated 7C-electrons may be considered as almost
ideal 1-dimensional systems extending along the polymer chains. From studying the
response of systems relatively free from disorder, a higher degree of understanding
may be attained about the physical processes involved. Using this knowledge
44

attempts can be made to model the more corapHcated disordered systems, assuming
that the same physical processes are involved.
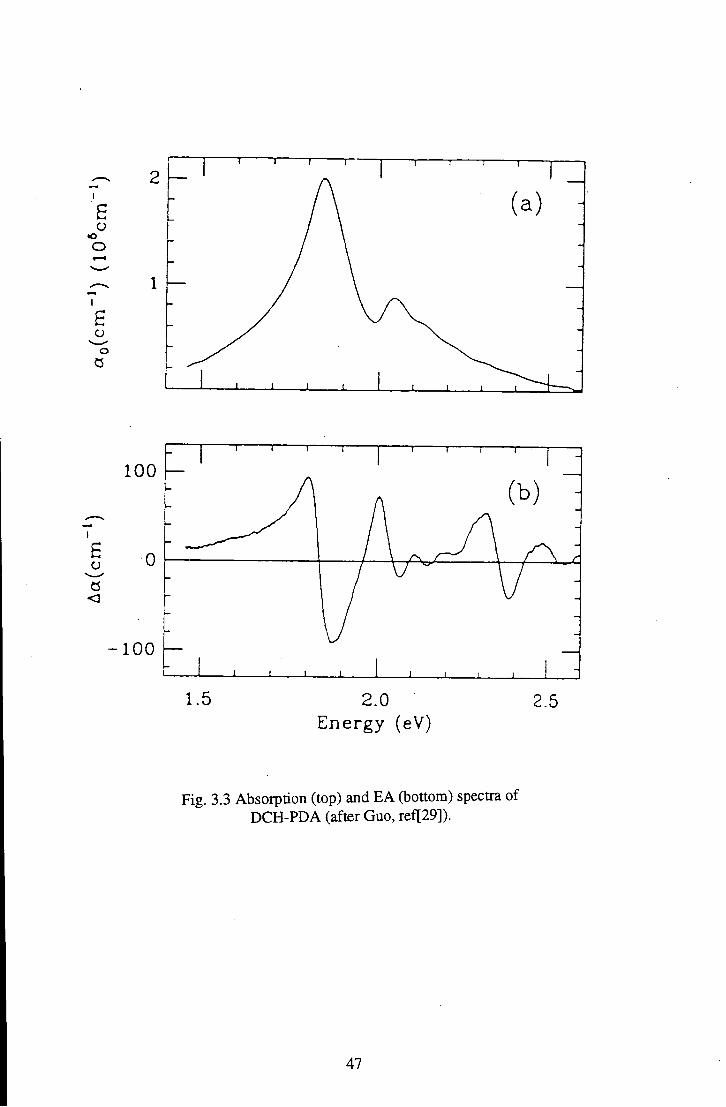
Guo et al. [29] undertook a detailed theoretical and experimental study of
the EA response of PDAs in response to the pubUcation of several conflicting
theories on the subject. Their investigations concentrated on the PDA poly[l,6-di(N-
carbozolyl-2,4-hexadiyne] (DCH-PDA), the absorption and EA spectra of which are
shown in Fig.3.3. In agreement with previous work they conclude that the linear
absorption and the EA response originates from the PDA backbone. Also in
agreement with previous work they assign the main low energy EA peak to a Stark
shift of an exciton. The necessity for an alternative approach to the analysis of the
EA data for PDAs originates from the higher energy EA feacture, observed around
2.4 eV, which is consistently observed above the exciton peak in a region where
linear absorption is negligible.
Sebastian and Weiser, who noted the occurrance of this peak in 1981 [25],
ascribed it to a transfer of oscillator strength to a normally forbidden transition at
the band edge. Later work by Tokura et al. [32] and Hasegawa et al. [33], however,
proposed that this EA feacture was due to a normally dipole forbidden state
becoming weakly allowed in the presence of a symmetry breaking external field.
Guo suggested that this could not be the case, due to the oscillatory nature of the
signal around zero, evident in Fig.3.3, which is not consistent with a transfer of
oscillator strength to a new state. The EA signal associated with a transferral of
oscillator strength to a new state would have no negative portion at the energy of the
new state, but would involve die loss of oscillator strength from the nearest
normally allowed state.
Guo attempted to resolve the disagreement by carrying out a detailed
theoretical investigation of the processes involved in two photon absorption, third
harmonic generation and electroabsorption in PDAs [29]. He concluded that the
45
high energy EA feacture is due to the conduction band threshold, as explained
below.
Eigenstates of linear conjugated polyenes and polymers with a center of
inversion, such as PDAs, are classified as Ag if they are symmetric with respect to
the inversion center, and B„ if they are asymmetric. Each state is further characterised
by a quanmm number describing its relative ordering in terms of energy, thus lAg is
the ground state. Dipole allowed transitions may only occur between Ag and By
states, making excitation from the ground state to an Ag state one-photon forbidden,
but two photon allowed. The system can be significantly altered in the presence of a
weak static applied electric field, F, (weak relative to the internal fields of the
system). The Ag and By states can become mixed according to
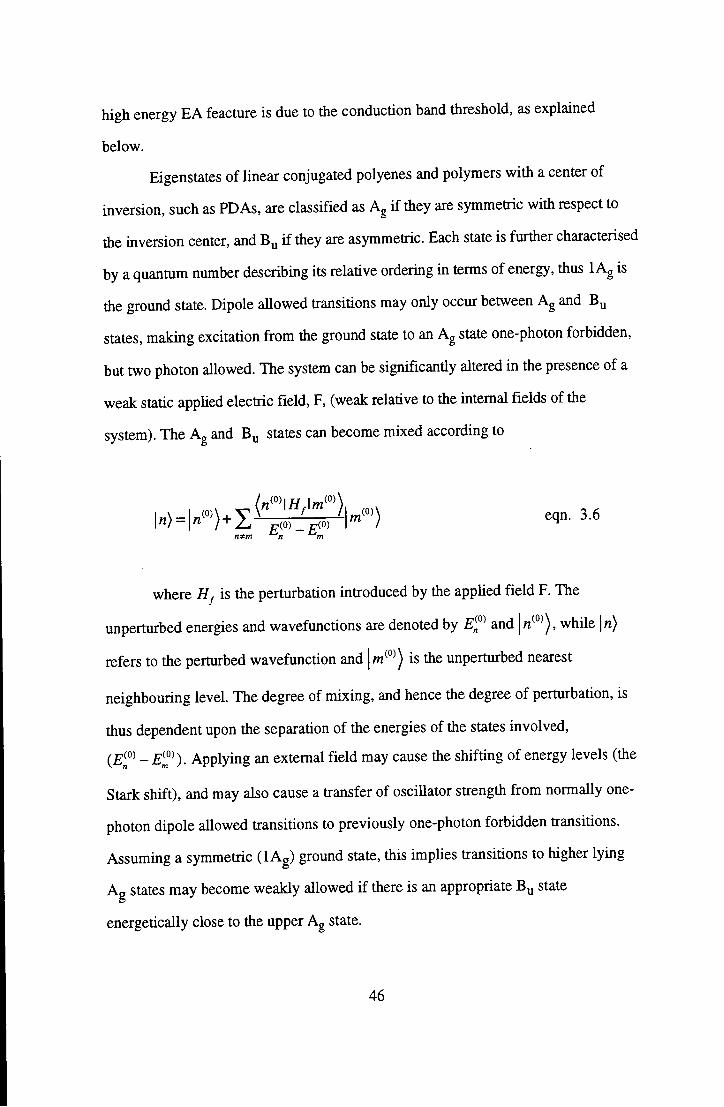
i")H«"VI^?^".">> n^m n m
where is the perturbation introduced by the applied field F. The
unperturbed energies and wavefunctions are denoted by and while |n)
refers to the perturbed wavefunction and /n^°'̂ is the unperturbed nearest
neighbouring level. The degree of mixing, and hence the degree of perturbation, is
thus dependent upon the separation of the energies of the states involved,
{Ej,°^ -EI^^). Applying an external field may cause the shifting of energy levels (the
Stark shift), and may also cause a transfer of oscillator strength from normally one-
photon dipole allowed transitions to previously one-photon forbidden transitions.
Assuming a symmetric (lAg) ground state, this implies transitions to higher lying
Ag states may become weakly allowed if there is an appropriate Bu state
energetically close to the upper Ag state.
46
1 I I r
G o o
E o o
O
100
£ o 0
-100
1 1 ' ' ' 1 j 1 1 1 1—•-—̂ 2
" I I I !
7 \ 7—
, 1 , , , , ! -
1.5 2.0 Energy (eV)
2.5
Fig. 3.3 Absorption (top) and EA (bottom) spectra of DCH-PDA (after Guo, ref[29]).
47

Using the above model Guo et al. [29] propose the high energy EA feacture
is due to an increase in the oscillator strength of the Ag states at the band edge, with
an accompanying decrease in probability of transitions to the By states in the same
energy range. Based on these results, and those of third harmonic generation
experiments, they propose an energy level scheme for PDAs of the form shown in
Fig.3.4.
This model has been extended to other, more disordered polymeric systems,
including polyacetylene (PA) [34], poly(phenylene acetylene) (PPA) and
polydiethyl silane (PDES) [35] by Jeglinsky and Vardeny. The EA spectra of these
polymers have many similar generic feactures; a peak at or near the optical band
edge, followed by a trough, returning to zero. To illustrate the form of such spectra,
the EA responses of PPA and PDES are given in Fig.3.5.
The initial peak (a) may have the lineshape of the first or second derivative
of the linear absorption, but is often found to depart from this lineshape before the
negative peak. Both these cases are recognised in Fig.3.5, with PPA being related to
the first derivative and PDES to the second derivative of their linear absorption
spectra. Jeglinsky [35] suggests that the difference between polymers with the
different lineshape may be due to the positioning of the nearest one-photon
forbidden (2Ag) state with relation to the lowest normally allowed (IBy) state. He
suggests that if there is no near neighbouring state, then the resulting EA spectrum
will have a first derivative lineshape as for PPA, consistent with the peak being
Stark shifted. The presence of an Ag state just below the IBy state, however, causes
the predominant perturbation to be a transferral of oscillator strength to this lower
lying state, resulting in a second derivative lineshape of the EA spectrum, as for
PDES. The feactures marked (b) are proposed to be evidence of previously dipole
48

forbidden mAg states (labelled 'mAg' due to their exact positioning in the energy level
ordering being unknown) becoming allowed in the presence of the applied field.
To provide further evidence for this energy level configuration, Jeglinski [35]
subtracts the absorption first derivative lineshape, the lineshape expected if the Stark
shift were the only process occuring, from the EA spectra of each material, the
results of which are shown in Fig.3.6. These spectra should indicate the energies to
and from which oscillator strength has been transferred. As a method of verifying the
validity of these subtractions, the integral of the transfer of oscillator strength over
the energy range of their spectra had to be assumed to be zero, i.e. it was assumed
that no states of energies outside the range of their spectra were involved in
transferral of oscillator strength. For PPA (Fig.3.6a) it can be seen that oscillator
strength has been lost from the IBy exciton at 2.5 eV - marked (a) - and gained by
some feature at (b) 3.2 eV, which they assign to an mAg state. There is also a feature
at (c) 3.8 eV for which they have no suggestion.
The picture is somewhat different for PDES (Fig.3.6b). The loss of oscillator
strength at (a) is once again assigned to a IBy exciton, perhaps with evidence of a
vibronic sideband, and (b) again assigned to an mAg state. The difference occurs
below the IBy state, at (d), where there appears to be a gain in osciillator strength. It
is this which they assign to a transferral of oscillator strength to a 2Ag state - the
state that initially caused the second derivative lineshape of the EA spectrum. The
positioning of this state also ties in with the fact that luminescence has not been
observed in PDES - such a state just below the opticlal gap provides an alternative,
non-radiative route for relaxation of the excited state.
It appears, therefore, that the theory proposed by Guo et al. [29] for
interpreting the EA results of highly ordered PDAs can be extended to much more
disordered 7t-conjugated systems, and provide a model that is consistent with
experimental results.
49
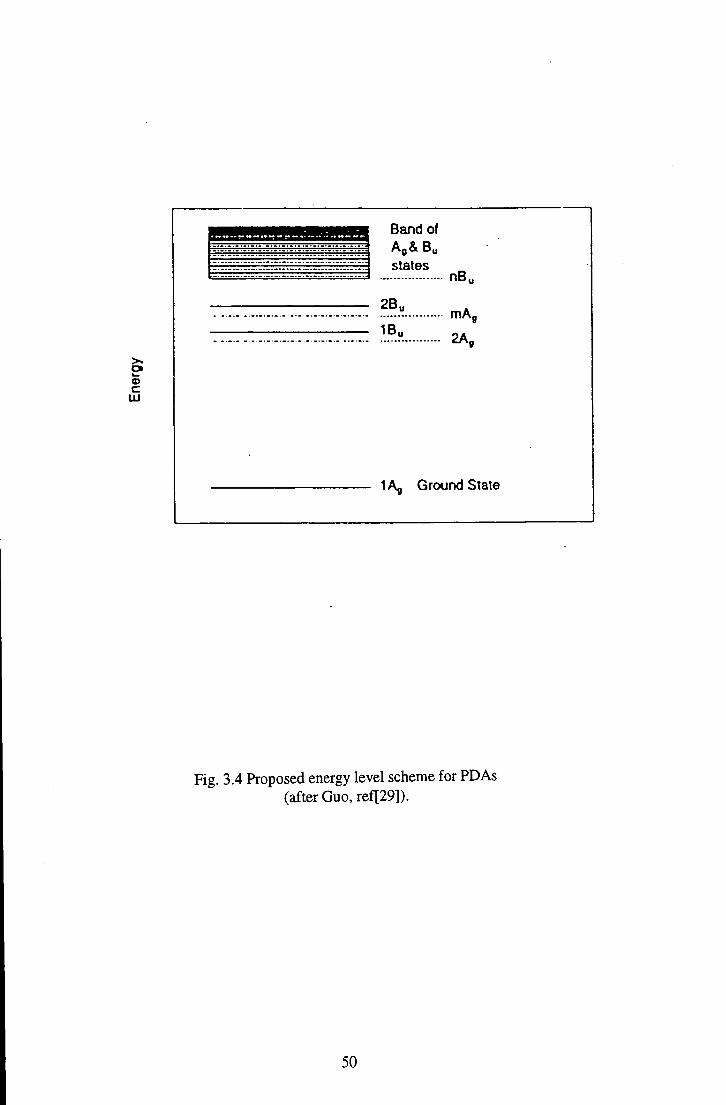
Band of
states
2B,
1B„
Ol
c UJ
nB.
mAj
2A„
1A, Ground State
Fig. 3.4 Proposed energy level scheme for PDAs (after Guo, ref[29]).
50
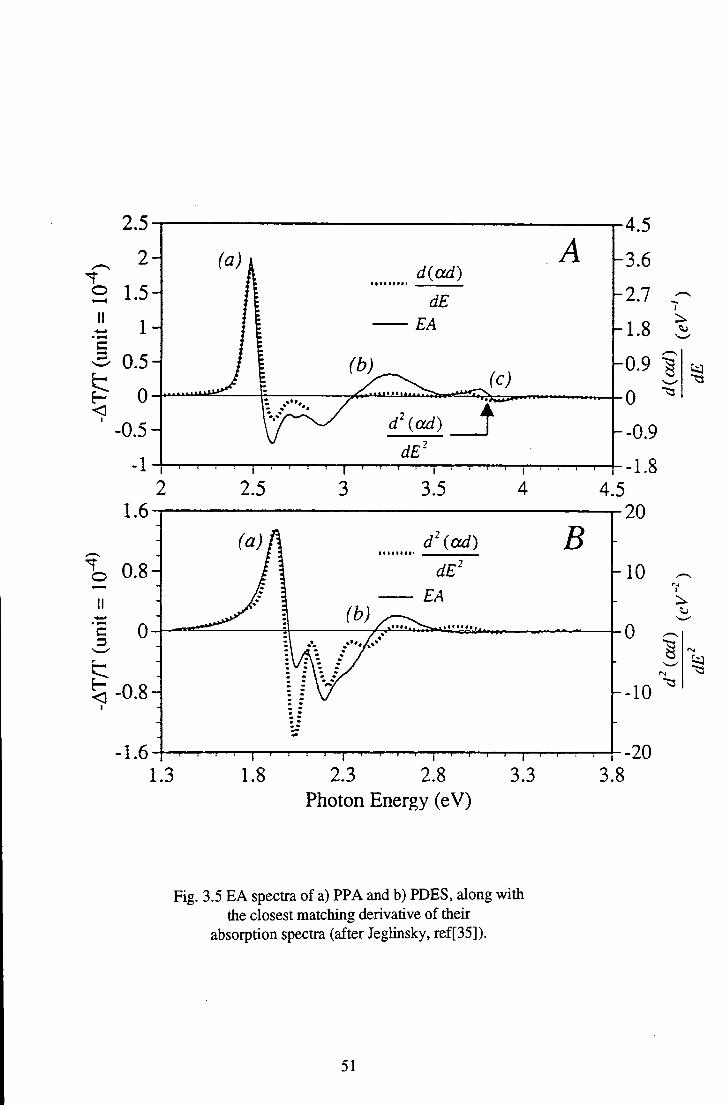
2.5
o
c
0
fa) 4 d(czd)
dE EA
A -
_ i , , - ,v'^^>*'^ r
-
1-d\ad) J
dE'
1.6
? o
0.8-II -
'c 0-3
0-r -
< 1 -0.8-
-1.6 1.3
2.5 3.5
d'(ad)
1.8 2.3 2.8 3.3 Photon Energy (eV)
•4.5
0
•1.8 4.5
B 20
h i o
0
-10
-20 3.8
Fig. 3.5 EA spectra of a) PPA and b) PDES, along with the closest matching derivative of their
absorption spectra (after Jeglinsky, ref[35]).
51
It has become apparent from various EA studies [32, 36-38] that if the
incident optical field is polarised, the relative orientation of the optical field to the
applied electric field can reveal further information about the material in question.
The technique of electroabsorption spectroscopy involves the mixing of two
independently polarised electric fields, the quasi-dc applied electric filed and the
optical field. If the whole optical probe is polarised, then the polarisation
dependence of the EA response may be investigated. As mentioned previously, the
polarisation dependence of the EA signal of PDAs has helped show that the n-
electron systems in such materials are quasi ID, being oriented along the back-bone
of the system. Polarisation dependencies have also been shown to occur in stretch
oriented polymer films, as reported by Hagler et al. for PPV [36], and also for
unoriented films [38].
Horvath et al. [37] have desribed the polarisation dependence of the EA
response of poly-(phenylphenylenevinylene) (PPPV) and poly-(dodecylthiophene)
(PDT). They consider the photoexcitations to occur on ordered subunits of the
polymer chain, and that the transition dipole moment lies along the backbone of the
chain. In an unoriented film these transition dipole moments will be randomly
oriented, and they have shown that in such a system a ratio of die EA response of
3:1 should be found for the two cases of the fields being parallel and perpendicular.
Polarisation dependent spectra for PPPV and PDT show this ratio of 3:1, adding
weight to their argument. This is constant over the whole spectral range, indicating
that the whole spectrum has a common origin
Hagler [38], however, has subsequentiey suggested that the approach of
Horvath et al. is rather simplistic. By considering the field amplitudes, rather than
intensities, and taking into account the two dominant transition dipole moments
(ljB„|r|G) and ^/nA^|r|lB„^ (G is ground state) Hagler predicts ratios of EA response
52

0.6-
0-
^ -0.6-- 1 ^
-1.2- - 1 — I — r
PPA
- 1 1 ! - • 1 — I — I — I — I — r — r
2.5 3 3.5 Photon Energy (eV)
I I—I I I
4 4.5
1
t 0.5 H c s
0
0.5
- H
< •1.5
PDES
1.3 . • . . 1 ' • ' • I ' ' ' ' I • ' ' ' ' ' ' ' '
1.8 2.3 2.8 3.3 Photon Energy (eV)
3.8
Fig. 3.6 Difference between EA and first derivative for PPA (top), and PDES (bottom)
(after Jeglinsky, ref[35]).
53
ranging from 3:1 to 1:3 for the polarisation dependencies. The value is dependent
upon the angle between the transition dipole moments involved.
This chapter has given a brief overview of the current theories concerning
electroabsorption spectroscopy in organic materials. It is obvious that the choice of
method of analysing the EA data of any one material is, to some extent, up to the
judgement of the individual. The choice must be guided by taking into consideration
the morphology of the sample, the nature of the chemical composition, and any
theoretical predictions as to the nature of the excited states. The early model of
Sebastian and Weiser [7] would still seem to be more appropriate for localised
exciton states, whereas the more recent model presented by Guo et al. [29] is more
appropriate for fully it-conjugated systems described by molecular states.
54

References
1. Botta, C., G. Zhuo, CM. Gelsen, D.D.C. Bradley, and A. Musco, Synth.
Met, 1993. 55-57: p. 85.
2. Gelsen, O.M., D.D.C. Bradley, H. Murata, T. Tsutsui, S. Saito, J. Ruhe, and
G. Wegner, Synth. Met, 1991(41-43): p. 875.
3. Gelsen, O.M., D.D.C. Bradley, H. Murata, N. Takada, T. Tsutsui, and S.
Saito, J. Appl. Phys, 1992. 71: p. 1064.
4. PhUUps, S.D., et al., Phys. Rev. B, 1989. 40(14): p. 9751.
5. Worland, R.S., Electroabsorption in Conjugated Polymers, PhD Thesis.
1989, Santa Barbra: California, p. 255.
6. Worland, R., S.D. Phillips, W.C. Walker, and A.J. Heeger, Synth. Met,
1989.28: p. D663.
7. Sebastian, L., G. Weiser, and H. Bassler, Chem. Phys, 1981. 61: p. 125.
8. Seraphin, B.O. in Proc. 7th Intern. Conf. Physics of Semiconductors. 1964.
Paris: Dunod, Paris.
9. Hamakawa, Y. and T. Nishino, in Optical Properties of Solids, B.O.
Seraphin, Editor. 1980, North Holland Publ. Co., New York.
10. Aspnes, D.E., in Handbook on Semiconductors, T.S. Moss, Editor. 1980,
North-Holland Publ. Co.
11. Franz, W., Z. Naturforsch Teil, 1958. A13: p. 484.
12. Keldysh, L.V., Zh. Eksp. Teor. Fiz, 1958. 34(54): p. 1138.
13. Seraphin, B.O. and N. Bottka, Phys. Rev, 1965.139(A): p. 560.
14. Seraphin, B.O., R.B. Hess, and N. Bot&a, J. App. Phys, 1965. 36: p. 2242.
15. Frova, A. and P. Handler, Appl. Phys. Lett., 1964. 5: p. 11.
16. Frova, A. and P. Handler, Phys. Rev, 1965.135(A): p. 1856.
17. Aspnes, D.E. and J.E. Rowe, Solid. Stat. Comm., 1970. 8: p. 1145.
55

18. Aspnes, D.E. and J.E. Rowe, Phys. Rev. B, 1972. 5(10): p. 4022.
19. Aspnes, D.E.. in Proc. 11th Int. Conf. on the Physics of Semiconductors.
1972. Warsaw: Polish Scientific Publishers, Warsaw.
20. Luty, F., Surf. Sci, 1973. 37: p. 120.
21. Dow, J.D., in Optical Properties of Solids, B.O. Seraphin, Editor. 1976,
Nortii-HoUand Publ. Co., New York. Chp. 2.
22. Grassano, U.M., Nuovo Cimento, 1977. 39: p. 368.
23. Weiser, G., Phys. Rev. B, 1992. 45(24): p. 14076.
24. Sebastian, L., G. Weiser, G. Peter, and H. Bassler, Chem. Phys, 1983. 75: p.
103.
25. Sebastian, L. and G. Weiser, Chem. Phys, 1981. 62: p. 447.
26. Sebastian, L. and G. Weiser, Chem. Phys. Lett, 1979. 64(2): p. 396.
27. Horvath, A. and G. Weiser, Mol. Cryst. Liq. Cryst, 1994. 256: p. 79.
28. Lange, H. and E. Gutsche, Phys. Sta. Sol, 1969. 32: p. 293.
29. Guo, D., S. Mazumdar, S.N. Dixit, F. Kajzar, F. Jarka, Y. Kawabe, and N.
Peyghambarian, Phys. Rev. B., 1993. 48(3): p. 1433.
30. Kawabe, Y., F. Jarka, N. Peygambarian, D. Guo, S. Mazumdar, S.N. Dixit,
and F. Kayzar, 1991. 44(12): p. 6530.
31. Kawabe, Y., F. Jarka, N. Peyghambrarian, D. Guo, S. Mazumdar, S.N.
Dixit, and F. Kajzar, Syntii. Met, 1992. 49-50: p. 517.
32. Tokura, Y., Y. Oowaki, T. Koda, and R.H. Baughman, Chem. Phys., 1984.
88: p. 437.
33. Hasegawa, T., K. Ishikawa, T. Koda, K. Takeda, H. Kobayashi, and K.
Kubodera, Syntii. Met, 1991. 41-43: p. 3151.
34. Jeglinski, S. and Z.V. Vardeny, Syntii. Met, 1992. 49-50: p. 509.
35. Jeglinski, S.A., Z.V. Vardeny, Y. Ding, and T. Barton, Mol. Cryst. Liq.
Cryst., 1994. 256: p. 87.
56
36. Hagler, T., K. Pakbaz, and A.J. Heeger, Phys. Rev. B, 1994. 49(16): p.
10968.
37. Horvath, A., H. Bassler, and G. Weiser, Phys. Stat. Sol. (b), 1992.173: p.
755. 38. Hagler, T., Cem. Phys. Lett., 1994. 218: p. 195.
57
Chapter 4
Review of Materials.
The three materials used in the electroabsorption investigations of this thesis
will be reviewed; polyaniline - concentrating on the polymeric and oligomeric forms
of emeraldine base - and a recently developed fully conjugated polymer,
polysquaraine.
4.1 Emeraldine Base
Emeraldine base (EB) is the half oxidised form of the polyaniline family of
polymers. A schematic of its chemical structore is depicted in Fig.4.1 alongside the
other two oxidation states, leucoemeraldine base (LB) and pemigraniline base
(PNB).
Polyaniline is the oldest known synthetic organic polymer, having first been
discovered by Letherby [1] as a result of the anodic oxidation of aniline. The
product formed was a dark green precipitate that came to be known as aniline black.
Soon after, Green and Woodhead [2, 3] determined that the polymer existed in
distinct oxidation states. Following its discovery there was very little research into
the material, other than that of the dye industry, until the mid '60s and early '70s
when work by Josefowitz et al. [4-6] led to a more detailed understanding of the
polymer. In particular, the conductive nature of the protonated emeraldine oxidation
state was discovered (although the structure of this conductive form was still
unknown), and its possible use in electrolyte rechargeable batteries reported [4-7].
The discovery of an electrically conductive form of polyaniline, and further
reports of an electrochromic response [8], resulted in a high degree of research
58
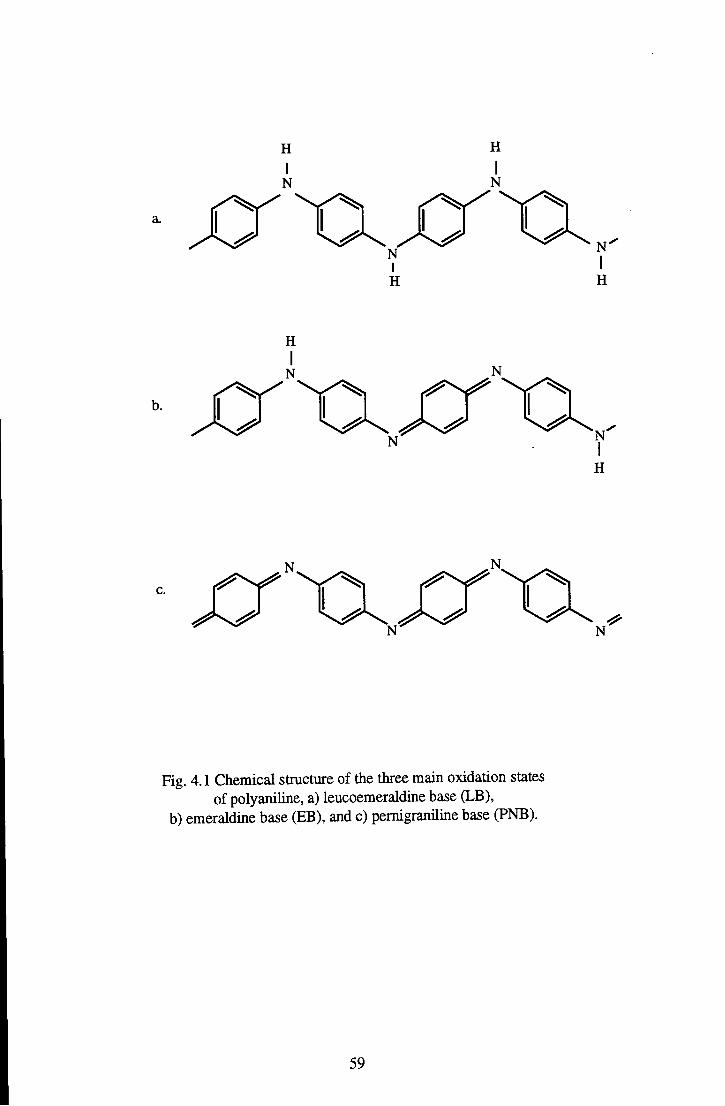
a.
Fig. 4.1 Chemical structure of the three main oxidation states of polyaniline, a) leucoemeraldine base (LB),
b) emeraldine base (EB), and c) pemigraniline base (PNB).
59
being undertaken into the polyaniline family. In particular, the groups of
MacDiarmid [9-11] and Heeger [12-14] undertook detailed investigations into the
electrical and optical nature of the polymer.
This large degree of interest is stUl very evident in academic and industrial
institutions, and further applications are still being presented [15]. While there is
interest in the eraeraldine base, the primary photoexcitations of the material have not
been fully characterised. The electroabsorption investigations reported in this thesis
aim to expand the current knowledge concerning these photoexcitations.
4.1.1 Chemical and Geometric Structure
The deduction of the idealised chemical structures of the three base forms of
polyaniline shown in Fig.4.1 have been achieved through comparison to model
compounds [16, 17], elemental analysis [11], direct chemical synthesis models [18,
19], and infrared spectroscopy [20, 21]. There have also been investigations into the
solution-state carbon-13 nuclear magnetic resonance of polyaniline [22], which have
shown that the vast majority (>95%) of the material present in a sample of LB had
the postulated structure (pam-substituted phenyl rings linked by amine groups). By
comparing the data for LB with those of EB it was shown that the two had the same
skeletal structure, indicating that the structure for EB given in Fig.4.1 is indeed
correct. The ^^C-NMR spectra for EB is considerably more complicated than that
for LB, indicating that there is a number of conformations of the EB molecule. The
authors attribute this to the presence of quinoid rings in the EB form which, due to
their restricted rotational degree of freedom (as discussed later), cause certain
conformations to become inequivalent. Some of these various conformations (often
termed 'conformers') are shown in Fig.4.2. The authors also attribute the difference
in the complexity of the spectra to the fact that the quinoid rings in EB are not
60
necessarily located every fourth ring, as indicated in the idealised structure, but may
be distributed at varying intervals along the chain. This deviation from the ideal case
allows further conformations to be formed from combinations of the various
conformers shown in Fig.4.2.
The fully reduced form, LEB, is a white/grey solid that is relatively unstable
in air. It is non-conjugated and an insulator. The proposed structure of the purple
fully oxidised form, PNB, however, is fully conjugated. The symmetry of the
chemical structure of PNB, depicted in Fig.4.1, means that it has two degenerate
ground state configurations. This, in theory, makes PNB the 'big brother' of trans-
PA and implies that it should be able to sustain the formation of solitons. Indeed,
Coplin et al. [23] report that they have observed soliton feactures in photoinduced
absorption studies of the material.
The third oxidation state of polyaniline is the half oxidised emeraldine base -
an air stable, electrically insulating blue/purple soUd. It is proposed to be semi-
conjugated; the conjugation extending over the quinoid ring to the two neighbouring
benzenoid rings through the imine nitrogen atoms. The polymeric form of EB is
found to be soluble in N-methyl-2-pyrolidine (NMP) [24], m-cresol [25] and cone,
sulpuric acid (H2SO4) [26]. From these solvents films of polyaniline may be cast
and otherwise processed. The polyaniline films cast from NMP remain in the EB
oxidation state, whereas the films cast from sulphuric acid are protonated to the
emeraldine salt (ES) form (providing the acid is not too concentrated, as the lack of
water prevents the acid from dissociating). It has been found that the NMP acts as a
plasticiser [27], resulting in the films of EB being far more mechanically robust than
those processed in the ES form - hence processing in the EB form is usually the
preferred method. These films may then be converted to a conducting form using a
protonic acid. The electrical properties of free standing films are still currently
61
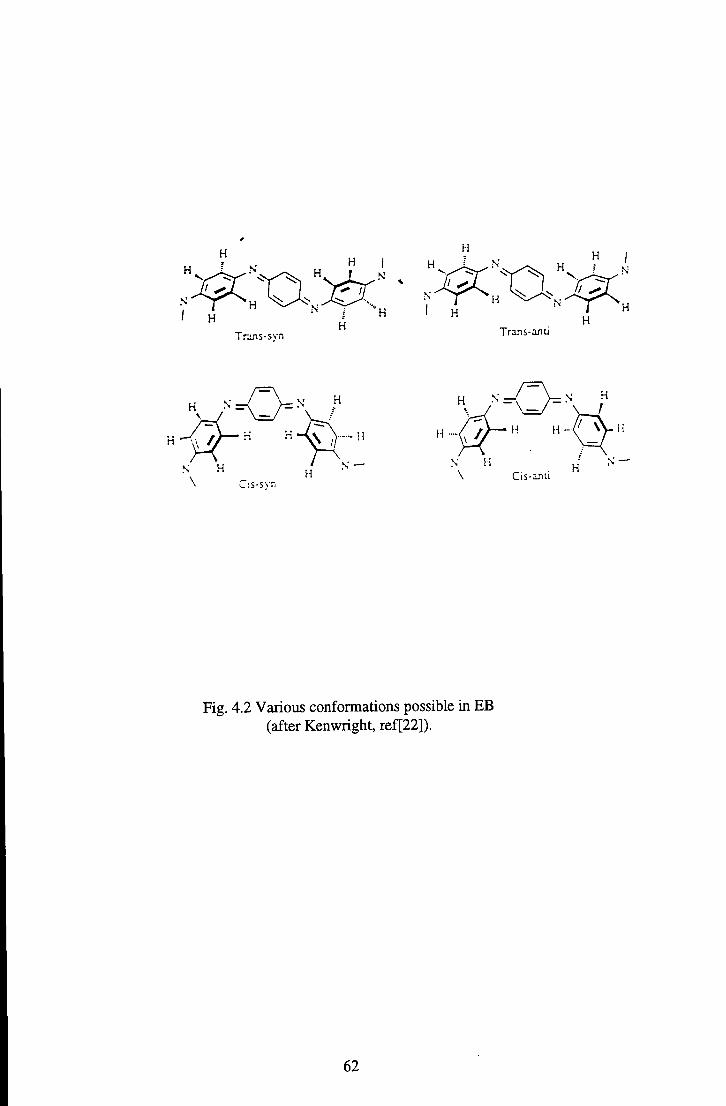
TrjJis-syn Trajis-anli
\ C:s-syn
N H N —
Fig. 4.2 Various conformations possible in EB (after Kenwright, ref[22]).
62

being investigated, including stretch orientation of the films with the aim of
increasing the conductivity along the stretch axis [27].
The chemical formula given in Fig.4.1 is actually rather simplistic as it
presents only a two dimensional representation of the molecule. It is beUeved that
the Cg rings are forced to twist away from a planar configuration due to the steric
hindrance of the hydrogen atoms attached to the ring units [22,28-32]. The twisting
of the rings effectivley reduces the amount of p̂ orbital overlap, and hence the
extent of Tt-electron delocalisation along the chain is reduced for EB and PNB.
Theoretical investigations into the optimum geometry of the chains has been carried
out by several groups, including those of Bredas [33], Epstein [30], and Duke [28,
29] - a balance between the steric hindrance driving the system away from planarity
and the reduction of energy by electron delocalisation driving the system towards its
planar form. Considerations of the effects of ring rotations with respect to the
physical properties of PANi have also been reviewed by Monkman et al. [31] .The
electronic states of EB will be discussed in the next section of this chapter.
4.1.2 Review of the Optical Properties of Emeraldine Base.
The main method of experimental investigation of the configuration of the
elctronic levels of a material is by optical spectroscopy; linear absorption,
photoinduced absorption (PIA), photoluminecsence (PL), photoconductivity (PC),
and electroabsorption (EA). Relevant reported investigations of emeraldine base wiU
be reviewed in this section, along with the interpretations of the results.
63
4.1.2.1 Linear Absorption.
The linear optical absorption spectra of EB as measured by Monkraan et al.
[34] is presented in Fig.4.3. All reports of the absorption spectra have the same
general shape and peak positions, though the relative heights of the absorption peaks
do vary between measurements. The differences that occur may be attributed to the
different methods of preparation of the material, and further, the method of
preparing the sample for optical spectroscopy.
There have been many theoretical investigations into the origin of these
absorption features. The calculations involved in such investigations are complex
and hence in practice only short chain oligomers are considered; the results are then
extrapolated to the case of the polymeric system. These extrapolations would seem
reasonable in the case of EB and LB as they are not fully conjugated; each sub-unit
acts independently, much as the oligomeric equivalent. Methods used in calculating
the properties of ES must be treated with a little more caution due to the proposed
fully conjugated nature of the polymer.
The absorption spectra of such short chain oligomers have been compared
with their associated polymeric systems [35, 36], and their similarity has been taken
as evidence of the validity of such theoretical extrapolations. With the aim of further
extending this comparison between oligomer and polymer for polyaniline, the
phenyl capped tetramer [4-(phenylamino)phenyl]-l,4-benzenediamine, whose
chemical structure is shown in Fig.4.4, has been included in these electroabsorption
investigations. The result of such an experimental comparison should further test the
extent to which the theoretical extrapolations are valid.
64

c a JD t— o to <
EmeraldinG base
200 600 1000
Wavelength/(nm)
1400
Fig. 4.3 Linear absorption spectrum of emeraldine base, (after Monkman et al. [34]).
65

Fig.4.4 Chemical structure of phenyl capped tetramer.
Presented in Fig.4.5 are diagrams of the band structures of oligomeric LB,
PNB and EB calculated by Bredas et al. [37] using a Valence Effective Hamiltonian
(VEH) model. This model neglects electron correlation effects. The fully reduced
LB is predicted to have a large optical gap of 3.8 eV, while the band gap of PNB is
predicted to be as low as 1.4 eV.
The energy level structure presented for EB is slightly more complicated due
to the fact that the unit cell is twice as large. This results in twice as many bands
appearing in the structure, with a the resulting band gap of ca. 1.4 eV. This is not
the experimentally observed value, implying that the VEH approach is not
completely applicable to EB. The problem arises from the nature of the origin of the
four bands labeled in the diagram, a, a', b and b'. The first three are located on the
benzenoid rings, whereas b', the lowest unoccupied band, is located on the quinoid
ring.
This difference in localisation was first identified by Duke et al. [28] .They
based their discussion of the energy states on a localised orbital approach in terms of
the 2p7j atomic orbitals. CNDO (complete neglect of differential overlap)
calculations were used, which involve neglecting all interactions except those of
nearest neighbours. Within this picture the 3.8 eV excitation of LEB is assigned to a
66
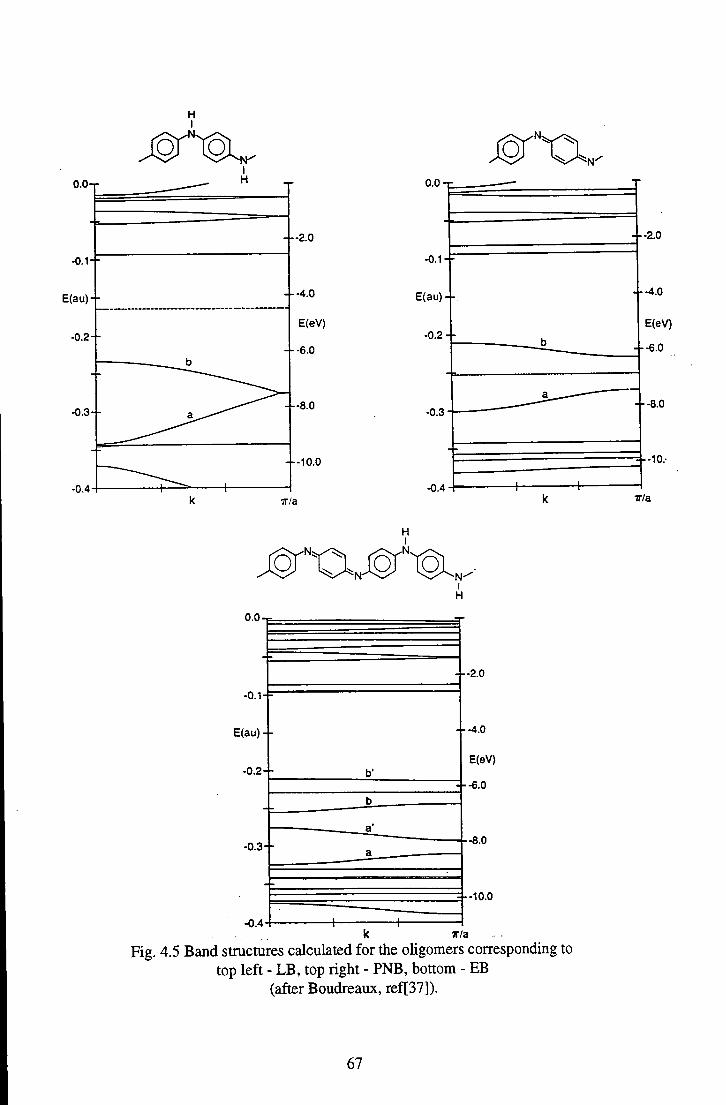
0.0-
-0.1-
E ( a u ) -
-0.2-h
-0.3+
I H 0.0-T-
-2.0
+ -4.0
E(eV)
-6.0
4-8.0
-0.1 - -
E(au)--
-0.2--
-0.3
-h-10.0
TT/a -0.4-t
H I
I H
O . O - T : .
-0.1-F
E(au)4-
-0.2-
-0.3
-0.4
+-2.0
+ -4.0
E(eV)
-6.0
-8.0
3-10.0
ir/a Fig. 4.5 Band structures calculated for the oligomers cortesponding to
top left - LB, top right - PNB, bottom - EB (after Boudreaux, ref[37]).
-2.0
+ -4.0
E(eV)
+ -6.0
+ -8.0
-10.'
ir/a
67

n-Tt* transition on a benzenoid ring. This assignation is confirmed by the presence
of such an absorption from the highest occupied molecular orbital (HOMO) to the
lowest unoccupied molecular orbital (LUMO) in the oligomers of aniline occurring
at a similar energy. (Such transitions are not observed in benzene at these energies
due to symmetry considerations). Using this model Duke proposes that the lowest
optical excitation of EB should be due to the formation of a self trapped molecular
exciton at ca. 2.2 eV. Upon photoexcitation an electron is predicted to be excited to
the LUMO of the quinoid ring from the HOMO levels of the two neighbouring
benzene rings, as depicted in Fig.4.6. The quinoid ring is then predicted to twist
away from its ground state configuration by ca 90°, trapping the state while making
it more stable.
Fig.4.6 Schematic of proposed CT exciton formed upon 2 eV photoexcitation.
The large change in conformation of this ring effectively results in the trapping of
the exciton on a particular site. This photoexcitation involves a degree of charge
transfer and so is designated a charge transfer exciton, even though the final state is
predicted to be symmetrical and hence possesses no permanent dipole moment.
Later work by Stafstrom et al. [38] using various different theoretical models also
predicts the formation of such an exciton upon 2 eV photoexcitation.
68

4.1.2.2 Photoinduced Absorption.
Photoinduced absorption involves photoexciting a material at (or close to)
its optical band gap using a 'pump' beam, and then using a 'probe' beam to scan the
spectrum and detect any variations in the absorption coefficient caused by the initial
photoexcitation. In practice the pump beam is usually a laser so as to acheive high
light intensities, which is then chopped to facilitate the use of lockin techniques.
1 2 5 Energy (eV)
Fig.4.7 Photoinduced absorption spectrum for E B .
The first report of PIA for EB was by Roe et al. in "88 [39], the results of
which are shown in Fig.4.7. The sample was pumped at 2.54 eV, i.e. into the
'exciton' absorption band. Photoinduced absorptions are seen at 0.9, 1.4 and 3.0 eV,
and bleachings at 1.8 and 3.7 eV. From the dependence of the various peaks upon
light intensity and chopper frequency, and by analogy with the absorption spectrum
of ES, Roe proposed a unimolecular origin for the lower bleaching, and bimolecular
processes for the other feactures. They assign the 1.4 and 3.0 eV feactures as being
new optically allowed transitions due to the initial pump beam photoproducing
69

positive polarons, P"*". These polarons are formed upon the decay of an exciton to a
pair of positive and negative polarons, P"*" and P'. The 1.8 eV feacture is assigned to
the filling of the molecular exciton states by the pumping laser photons, and the 3.7
eV feacture to the depopulation of the n levels required for the production of the
aforementioned polarons. They have no suggestion as to the origin of the 0.9 eV
feacture.
An alternative explanation for the results which Roe does not rule out is that
the features are due to the formation of a triplet manifold of exciton states.
Stafstrom et al. [38] extended their calculations of linear absorption to
include the PIA results of Roe, and also tend to assign the features to polaron and
bipolaron formation, although they too cannot rule out the formation of triplet
excitons. Nor could their calculations explain the feature at 0.9 eV.
EB has also been investigated using the technique of photoinduced infrared
absorption (PIIRA). McCall et al. [40] use their results from this method to estimate
the effective mass of the proposed photogenerated polaron, with the result Mp^j ~
60me. They propose that this high effective mass is due to the polaron being
associated with changes in the phenyl ring torsion angles - ring flipping - as
mentioned previously. The photogenerated species are observed as having long
lifetimes - up to 2 hours when measured at 80 K, becoming shorter with increasing
temperature. Again this is consistent with the idea of the polaron being associated
with ring flipping, as the low temperatures may be considered as 'freezing out' the
rotational degrees of freedom and 'freezing in' any photoproduced ring torsional
polarons. Monkman et al. [31] report a phase transition in EB at -190 K, which they
assign to the temperatore below which ring rotational degrees of freedom are
restricted.
Kim et a/.[12] also performed PIIRA spectroscopy investigations on EB, and
found different responses when pumping into the 2 eV and the 4 eV absorption
70
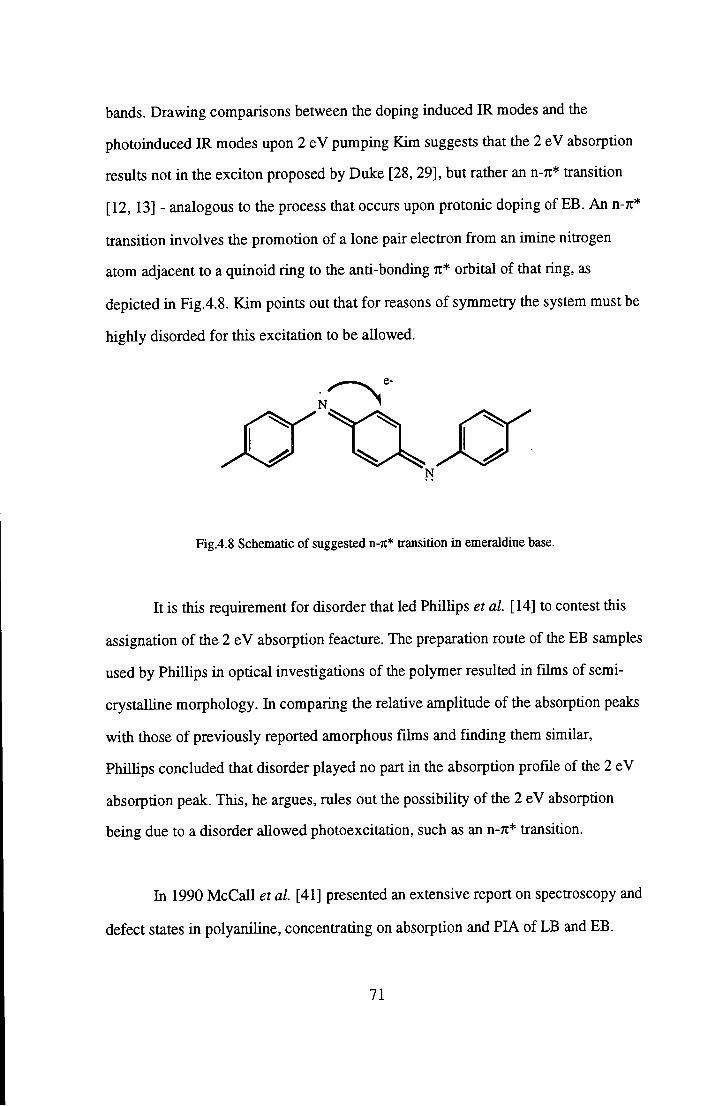
bands. Drawing comparisons between the doping induced IR modes and the
photoinduced IR modes upon 2 eV pumping Kim suggests that the 2 eV absorption
results not in the exciton proposed by Duke [28, 29], but rather an n-7r* transition
[12, 13] - analogous to the process that occurs upon protonic doping of EB. An n-n*
transition involves the promotion of a lone pair electron from an imine nitrogen
atom adjacent to a quinoid ring to the anti-bonding n* orbital of that ring, as
depicted in Fig.4.8. Kim points out that for reasons of symmetry the system must be
highly disorded for this excitation to be allowed.
Fig.4.8 Schematic of suggested n-rc* transition in emeraldine base.
It is this requirement for disorder that led Phillips et al. [14] to contest this
assignation of the 2 eV absorption feacture. The preparation route of the EB samples
used by Phillips in optical investigations of the polymer resulted in films of semi-
crystalline morphology. In comparing the relative amplitude of the absorption peaks
with those of previously reported amorphous films and finding them similar,
Phillips concluded that disorder played no part in the absorption profile of the 2 eV
absorption peak. This, he argues, rules out the possibility of die 2 eV absorption
being due to a disorder allowed photoexcitation, such as an n-n* transition.
In 1990 McCaU et al. [41] presented an extensive report on spectroscopy and
defect states in polyaniline, concentrating on absorption and PIA of LB and EB.
71
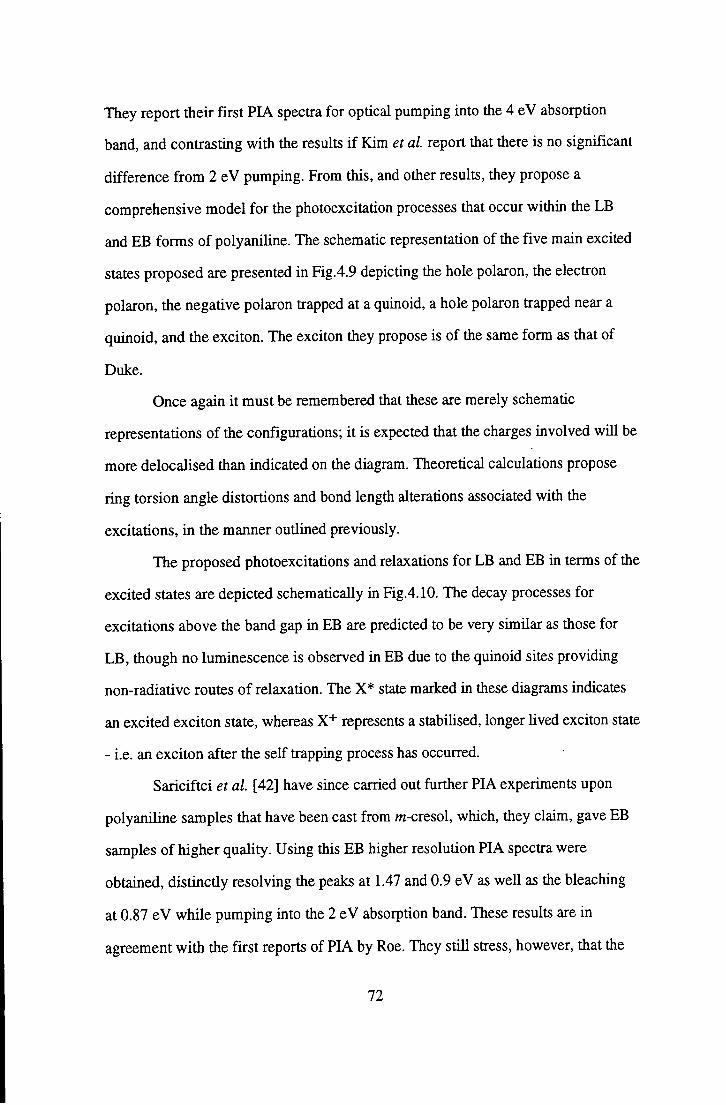
They report their first PIA spectra for optical pumping into the 4 eV absorption
band, and contrasting with the results if Kim et al. report that there is no significant
difference from 2 eV pumping. From this, and other results, they propose a
comprehensive model for the photoexcitation processes that occur within the LB
and EB forms of polyaniline. The schematic representation of the five main excited
states proposed are presented in Fig.4.9 depicting the hole polaron, the electron
polaron, the negative polaron trapped at a quinoid, a hole polaron trapped near a
quinoid, and the exciton. The exciton they propose is of the same form as that of
Duke.
Once again it must be remembered that these are merely schematic
representations of the configurations; it is expected that the charges involved will be
more delocalised than indicated on the diagram. Theoretical calculations propose
ring torsion angle distortions and bond length alterations associated with the
excitations, in the manner outiined previously.
The proposed photoexcitations and relaxations for LB and EB in terms of the
excited states are depicted schematically in Fig.4.10. The decay processes for
excitations above die band gap in EB are predicted to be very similar as those for
LB, though no luminescence is observed in EB due to the quinoid sites providing
non-radiative routes of relaxation. The X* state marked in these diagrams indicates
an excited exciton state, whereas X"*" represents a stabiUsed, longer lived exciton state
- i.e. an exciton after the self trapping process has occurred.
Sariciftci et al. [42] have since carried out further PIA experiments upon
polyaniline samples that have been cast from m-cresol, which, they claim, gave EB
samples of higher quality. Using this EB higher resolution PIA spectra were
obtained, distinctly resolving the peaks at 1.47 and 0.9 eV as well as the bleaching
at 0.87 eV while pumping into the 2 eV absorption band. These results are in
agreement with the first reports of PIA by Roe. They still stress, however, that the
72
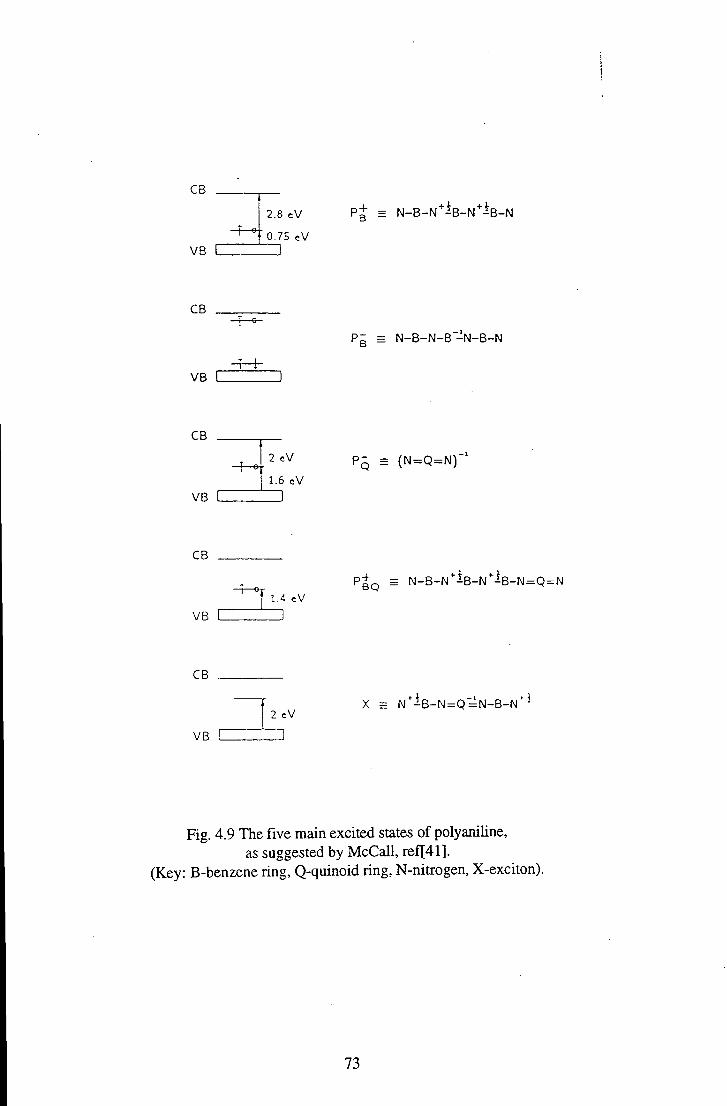
CB
VB
2.8 cV
0.75 eV
P + = N-B-N^'-^B-N^'iB-N
CB
Pg = N - B - N - B - N - B - N
V B
CB
VB
-4—©• 2 =V p - = (N=Qz=:N)"
1.6 cV
CB
VB
1.4 eV P+Q = N-B-N'' iB-N'"-^B-N=Q=N
CB
2 cV
VB I I
X = N * ' - ^ B - N = Q = N - B - N ' ^
Fig. 4.9 The five main excited states of polyaniline, as suggested by McCall, ref[41].
(Key: B-benzene ring, Q-quinoid ring, N-nitrogen, X-exciton).
73
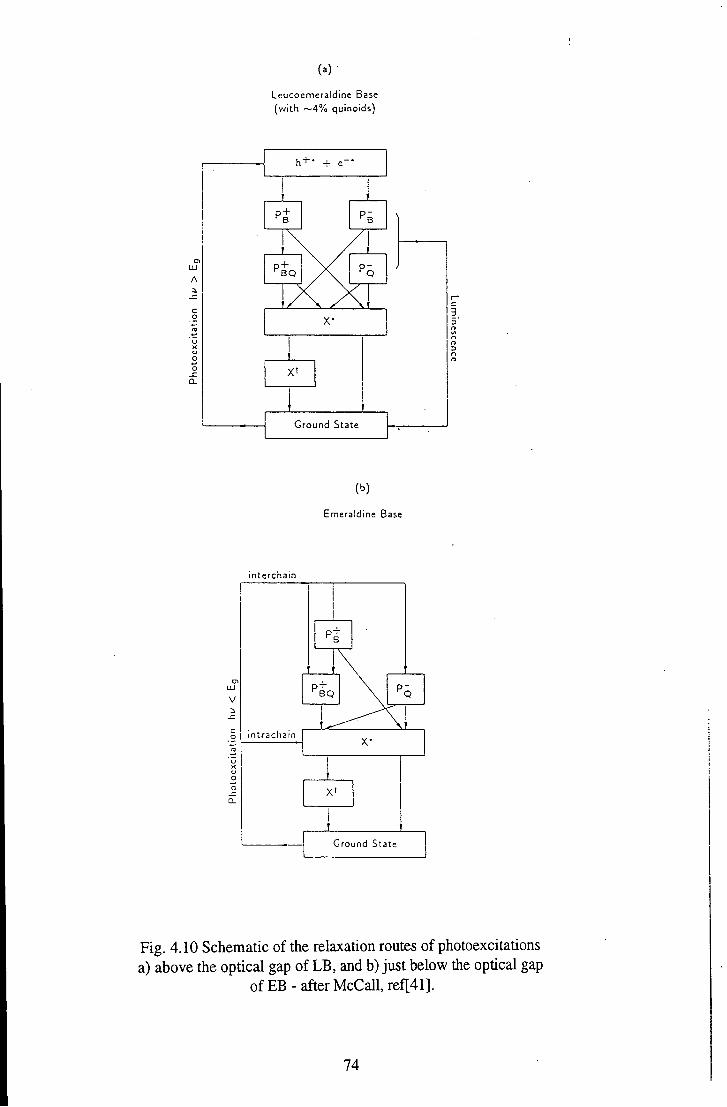
( a )
Leucoemera ld ine B a s e (with ~ 4 % quinoids)
G r o u n d State
(b)
Emera ld ine B a s e
in tercnain
in t rachain
Ground State
Fig. 4.10 Schematic of the relaxation routes of photoexcitations a) above the optical gap of LB, and b) just below the optical gap
of EB - after McCaU, ref[41].
74

occurrence of long lived triplet exciton states cannot be ruled out as being the origin
of these photoinduced feactures.
4.1.2.3 Photoconductivity.
There have also been investigations into the photoconductive (PC) properties
of EB [14,43]. As its name implies, PC spectroscopy is the observation of the
variation of the conductivity of a sample upon illumination with light of a specific
wavelength. The PC reports of EB are fairly consistent; very small PC for the 4 eV
absorption, with even less for the 2 eV peak. The variations are so small that some
groups have attributed their origin to heating effects. Such low PC signals have been
attributed to the low mobility of any carriers produced due to their association with
ring torsion defects. The smaller signals associated with the 2 eV absorption are
attributed to the fact that the excitons that are photoproduced are energetically
trapped, and even when free must dissociate before being able to transfer charge.
4.1.3 Ring Rotations in Polyaniline.
Some of the first considerations of phenyl ring containing polymers simply
applied the SSH Hamiltonian to the system in question, the results of which had
varying degrees of accuracy. More recent approaches have included the role of
phenyl ring torsion angle in determining the nature of the ground and excited states.
This has been especially relevant in the case of polyaniline since the presence of
nitrogen atoms between the phenyl rings means that the rings have a relatively large
degree of rotational freedom. The ring torsion angle is of great importance in the
determination of the electronic levels of any ring-containing 7t-conjugated system.
As the angle between rings increases, the degree of it orbital overlap decreases, and
75

hence alters the electronic structure of the system. Delocalisation of the electrons in
a system affords a reduction in the potential energy and so, if there were no other
factors involved, all the rings in a ring-containing polymer would lie in the same
plane so as to increase n orbital overlap, and hence decrease the total energy of the
system. This, however, is not the case for polyaniline as there is substantial steric
repulsion that favours ring conformations out of the nitrogen plane. Several groups
have carried out theoretical studies to investigate the effect of ring torsion angle
upon the electronic states of the simplest forms of polyaniline - LB and PNB [28-30,
33].
The most extensive of these investigations has been carried out by Ginder
and Epstein [30], who introduced a ring torsion order parameter with which they
modelled the physical properties of the LB and PNB molecules. They calculated a
minimum in potential energy as having a structure of alternate rings being twisted
away from the plane of the nitrogens by =56° and ==-56° respectively. In such a
conformation, both LB and PNB have two degenerate ground states, and as such
should be able to support the fromation of solitons. Indeed, there have been reports
of experimental evidence to imply the existence of solitons in PNB [23].
The modelling of the ring rotations in EB, however, is made more
complicated by the nature of the nitrogen-ring bonding. The formation of a double
bond between the nitrogens and the respective quinoid rings reduces the degree of
freedom with which this ring can rotate away from the nitrogen plane, and hence a
simple alternating ring torsion angle model cannot be employed. The significance of
the ring rotations in the electronic structure of EB is, however, evident in the
proposed exciton model of the 2 eV absorption, as described in the previous section.
The ring torsion approach to modelling the excited states of LB and PNB
also predicts the formation of polaron states on the chain; an excitation that results
in a change in ring torsion angle may affect the extent of 7i-electron overlap and
76

hence create a state at mid gap. The effective mass of such a state would be large
and the mobility low due to its association with a large chain deformation. This is in
good agreement with the experimentally derived large effective mass Mpoj~60mg
mentioned earlier.
From this evidence it would seem that ring rotations play an important role in
determining the physical properties of polyaniline. The existence of the long lived
excited states that have been attributed to hindered ring rotations has even led to the
suggestion that polyaniline may used as an optical storage medium at some time in
the future [15].
4.1.4 Emeraldine Salt
Emeraldine salt is the protonated form of EB, and has been receiving a great
deal of attention since the discovery of its high degree of electrical conductivity
[44].
Upon doping of EB using a protonic acid - hydrochloric acid for example -
the emeraldine salt (ES) form of polyaniline is formed. This form of polyaniline is
proposed to be fully conjugated, and the conductivity has been noted to increase by
a factor of lO^l, reaching 1 Scm'l [44].
In 1987 Stafstrom et al. [44] proposed that doping of EB leads to the
segregation of unprotonated and fully protonated domains. Within the fully
protonated domains it is proposed that bipolarons are formed initially, which then
separate to form two polarons - as depicted in Fig.411. The polarons are predicted to
stabelise in the form of a lattice, and it is proposed that this polaron lattice is the
origin of the metallic characteristics of ES. A diagram of the band structure
calculated for ES is shown in Fig.4.12. It shows the half filled polaron band, with a
finite density of states at the Fermi energy indicating metallic behaviour in these fully
77
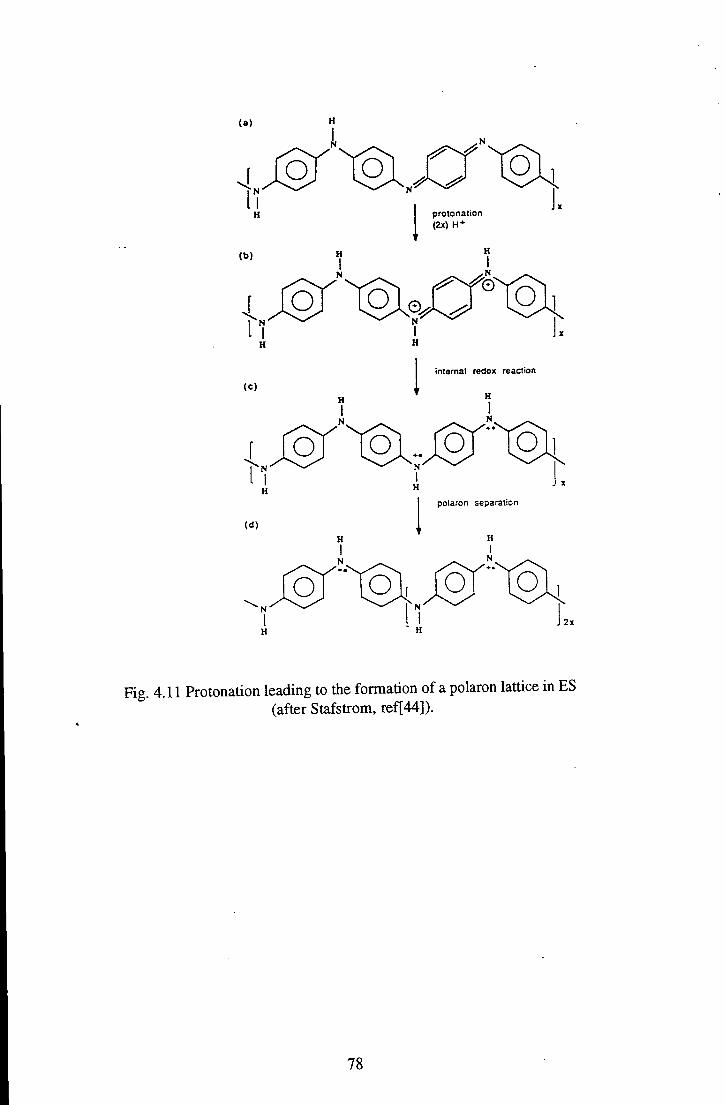
prolonation (2x) H*
internal redox reaction
H
polafon separation
Fig. 4.11 Protonation leading to the formation of a polaron lattice in ES (after Stafstrom, ref[44]).
78

ao
Polaron band
Fig 4.12 Energy level structure calculated for ES - showing 'metaUic' polaron band (after Stafstrom, ref[44]).
79

protonated regions. Within this model the resulting conductivity values measured for
ES are predicted to be limited by percolation effects between the protonated and
unprotonated regions of the system.
4.1.5 Summary.
An overview of the chemical structure and physical properties of polyaniline
has been presented. There seems to be general agreement over the photoexcitations
in EB; the 3.8 eV absorption is associated with a n-K* transition located on a
benzenoid ring, and the 2 eV absorption with a charge transfer exciton associated
with a ring rotation [28]. The n-iz* transition proposed by Kim [12,13] has been
dismissed by some, tiiough there is no conclusive proof either way. After
photoexcitation, the excited states are proposed to decay back to the ground state via
some combination of exciton or polaron formation. Unlike LB, EB is not observed
to photoluminesce due to the high concentration of quinoid rings.
80
4.2 Polysquaraine
The band gap of most conjugated polymers is generally rather large, usually
between 1.5 and 4.0 eV. Having a band gap smaller than this would be
advantageous as the reduced optical gap could allow such polymers to be utilised as
infra red detectors and sensors.
With this in mind Havinga et al. [45, 46] set out to develop new families of
low energy band gap conjugated polymers - polysquaraines and polycroconaines.
The novel idea behind their development is the concept that the space charge effects
produced upon the formation of a chain of regularly alternating donor and acceptor
moieties wi l l reduce the energy gap. If the donor and acceptor regions are extended
the system can be considered similar to an inorganic n-i-p-i super lattice structure.
The actual band gap is not changed at any point, but a small gap, Eg^ is found if the
spatial alternation of the level of the bands is taken into account - as depicted in
Fig.4.13. I f the HOMO levels of the donor and the LUMO levels of the acceptor are
energetically close a small effective band gap Eg wil l result. In order to achieve
strong band curvature strong donors and acceptors are required such that there is
appreciable charge transfer in the ground state of the material. To this end squaric
acid and croconic acid have been used as the acceptor-like moieties, with an ample
choice of donor moieties available. The ideahsed structure of the particular
polysquaraine studied in this thesis is shown in Fig.4.14.
There are analogies to be drawn between emeraldine base and polysquaraine.
Both may be decribed as 'AB' type polymers, indicating a regular alternation of two
different structures within the polymer chain. This is obvious for polysquaraine, as it
has been designed with this structure in mind. From the structure of EB depicted in
Fig.4.1 it is clear that EB may be described as an AB polymer in two ways. As with
all oxidation states of PANi it may be described as a regular alternation of phenyl
81
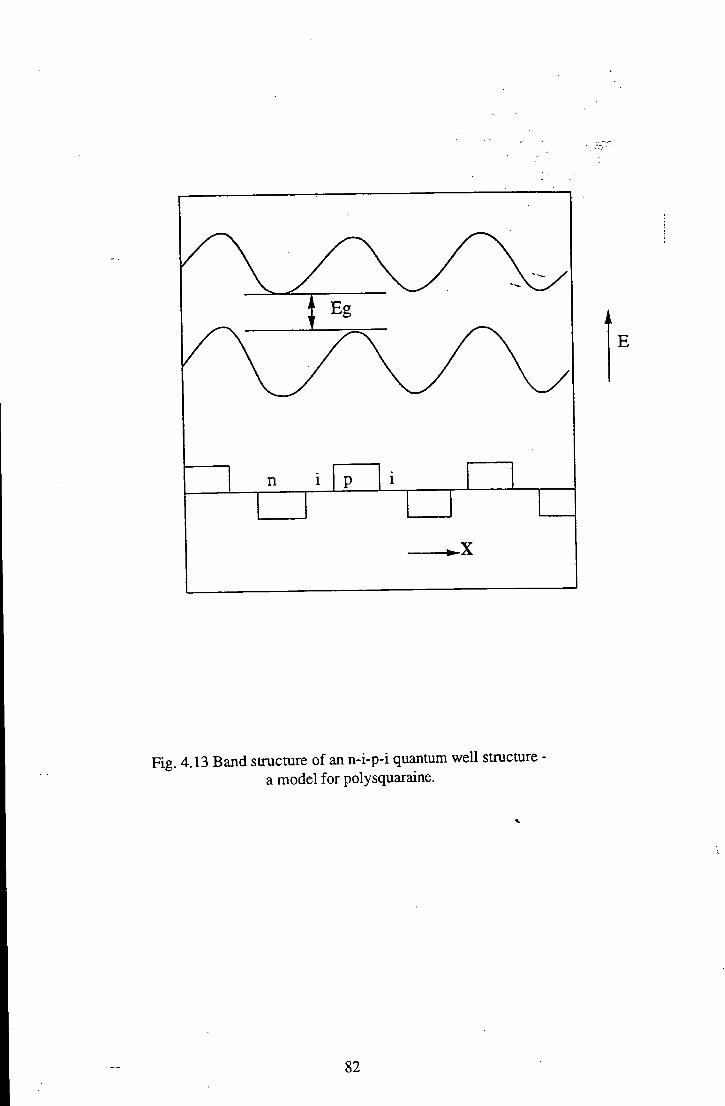
Fig. 4.13 Band structure of an n-i-p-i quanmm well structure a model for polysquaraine.
82
rings and nitrogen atoms. EB may also be considered as an alternation of three
benzenoid rings with their associated amines, and quinoid rings with their associated
imines. In this context the 2 eV exciton proposed by Duke [28] may be thought of
as occuring from donor (A) to acceptor (B), allowing EB to be thought of as having
some degree of charge transfer characteristics - analogous to polysquaraine. One of
the main differences between the two polymers is the fact that EB is semi-
conjugated, while polysquaraine is proposed to be fully conjugated - a fact that
should result in a marked difference in the EA response of the two materials.
Polysquaraine is relatively new and hence there has been little work reported
in the literature. The absorption spectrum of the material taken during the initial
characterisation, Fig.4.15, indicates an optical band gap of around 1.3 eV. This is
slightly smaller than that for polyacetylene at 1.4 eV, indicating that the donor-
acceptor concept does in fact produce a small optical gap. Gel permeation
chromatography (GPC) studies have indicated that the chain length of the material is
around 15 - 20 donor-acceptor repeat units [45,46]. The material is air stable,
making it easy to work with - though it does seem to deteriorate with time when
exposed to light. Being soluble in chloroform meant that optically thin films' were
easily prepared.
83

J n
Fig. 4.14 Chemical strucmre of polysquaraine.
84

290
• Solution
Loyer
690 890
Wavelength (nm)
1090 1290
Fig. 4.15 Absorption spectrum of polysquaraine, data from E. E. Havinga , Einhoven.
85

References
1. Letherby, H., J. Chem. Soc, 1862.15: p. 161.
2. Green, A.G. and A.E. Woodhead, J. Chem. Soc. Trans, 1910. 97: p. 2388.
3. Grenn, A.G. and A.E. Woodhead, J. Chem. Soc. Trans, 1910.101: p. 1117.
4. Constantini, P., G. Belorgey, M. Jozefowicz, and R. Buvet, Comm. Symp.
Int. Chim. Macromol. lUPAC. Prague, 1965: p. A481.
5. Doriomedoff, M. , F.H. Cristofini, R. DeSurville, M . Jozefowicz, L.T. Yu,
and R. Buvet, J. Chim. Phys, 1971. 68: p. 1055.
6. Jocefowicz, M. , L.T. Yu, G. Belorgey, and R. Buvet, J. Polym. Sci, 1967.
16: p. 2931.
7. Nakajuma, T. and T. Kawagoe, Synth. Met, 1989. 28: p. C629.
8. Diaz, A.F. and J.A. Logan, J. Electroanal. Chem, 1980.11: p. 11.
9. MacDiarmid, A.G., J.-C. Chiang, M . Halpem, W.S. Huang, S.L. Mu, N.L.D.
Somasisi, W. Wu, and S.I. Yaniger, Mol. Cryst. Liq. Cryst, 1985.121: p.
173.
10. MacDiarmid, A.G., N.L.D. Somasisi, W.R. Salaneck, L Lunsdtrom, B.
Liedberg, M . Hasan, R. Erlandsson, and P. Konrasson,. Springer Series in
Solid State Sciences. Vol. 63. 1985, Berlin: Springer.
11. MacDiarmid, A.G., J.-C. Chiang, A.F. Richter, N.L.D. Somasisi, and A.J.
Epstein, Conducting Polymers, L. Acaer, Editor. 1987, D. Reidel Pub. Co.
p. 105.
12. Kim, Y.H., C. Foster, J. Chiang, and A.J. Heeger, Synth. Met., 1989. 29: p.
E285.
13. Kim, Y.H., S.D. Phillips, M.J. Nowak, D. Spiegel, C M . Foster, G. Yu, J.C.
Chiang, and A.J. Heeger, Synth. Met., 1989. 29: p. E291.
86
14. Phillips, S.D., G. Yu, C. Y, and A.J. Heeger, Phys. Rev. B, 1989. 39(15): p.
10702.
15. Epstein, A.J. and A.G. MacDiarmid, Synth. Met, 1995.69: p. 179.
16. Baughman, R.H., J.F. Wolf, E. Eckhardt, and L.W. Schaklette, Synth. Met,
1988. 25: p. 121.
17. Schaklette, L.W., J.F. Wolf, S. Gould, and R.H. Baughman, J. Chem. Phys,
1988. 88: p. 3955.
18. Vachon, D.J., R.O. Angus Jr, F.L. Lu, M . Nowak, H. Schaffer, F. Wudl, and
A. J. Heeger, Synth. Met, 1987.18: p. 297.
19. Wudl, F., R.O. Angus Jr, F.L. Lu, P.M. AUemand, D.J. Vachon, M . Nowak,
Z.X. Liu, and A.J. Heeger, J. Am. Chem. Soc, 1987.109: p. 3677.
20. Ohsaka, T., Y. Ohnuki, N. Oyama, G. Katagiri, and K. Kamisaka, J.
Electroanal. Chem, 1984.161: p. 399.
21. Furakawa, Y., F. Ueda, H. Y, I . Harada, T. Nakajuma, and T. Kawayoe,
Macromolecules, 1989. 21: p. 1297.
22. Kenwright, A.M. , W.J. Feast, P.N. Adams, A.J. Milton, A.P. Monkman, and
B. J. Say, Polymer, 1992. 33(20): p. 4292.
23. Coplin, K.A., J.M. Leng, R.P. McCall, and A.J. Epstein, Synth. Met, 1993.
55-57: p. 7.
24. Angelopolous, M. , G.E. Asturias, S.P. Emer, A. Ray, E.M. Scher, A.G.
MacDiarmid, M . Akhtar, Z. Kiss, and A.J. Epstein, Mol. Cryst. Liq. Cryst,
1988.160: p. 151.
25. Cao, Y., P. Smith, and A.J. Heeger, Synth. Met, 1992. 48: p. 91.
26. Andreatta, A., Y. Cao, J.-C. Chiang, A.J. Heeger, and P. Smith, Synth. Met,
1988. 26: p. 383.
27. Milton, A.J., Structural Properties of Polyaniline Films, PhD Thesis.
1993, Durhana University: Durham.
87

28. Duke, C.B., E.M. Conwel, and A. Paton, Chem. Phys. Lett, 1986.131(1-2):
p. 82.
29. Duke, C.B., A. Paton, E.M. Conwell, W.R. Salaneck, and I. Lundstrom, J.
Chem. Phys, 1987. 86(6): p. 3414.
30. Ginder, J.M. and A.J. Epstein, Phys. Rev. B, 1990. 41(15): p. 10674.
31. Monkman, A.P., P.N. Adams, A. Milton, M . Scully, S.J. Pomfret, and A.M.
Kenwright, Mol. Cryst. Liq. Cryst., 1993. 236: p. 189.
32. Sjogren, B. and S. Stafstrom, J. Chem. Phys, 1987. 88(6): p. 3840.
33. Stafstrom, S. and J.L. Bredas, Synth. Met, 1986.14: p. 297.
34. Monkman, A.P. and P.N. Adams, Synth. Met, 1991. 40: p. 87.
35. Rodrigue, D., M . Domingue, J. Riga, and J.J. Verbist, Synth. Met, 1993. 55-
57: p. 4802.
36. Javadi, H.H.S., S.R Treat, J.M. Ginder, J.F. Wolf, and A.J. Epstein, J. Phys.
Chem. Solids., 1990. 51(2): p. 107.
37. Boudreaux, D.S., R.R. Chance, J.F. Wolf, L.W. Shacklette, J.L. Bredas, B.
Themas, J.M. Andre, and R. Silbey, J . Chem. Phys, 1986. 85(8): p. 4584.
38. Stafstrom, S., B. Sjorgen, and J.L. Bredas, Synth. Met., 1989. 29: p. E219.
39. Roe, M.G., J.M. Ginder, P.E. Wigen, A.J. Epstein, M . Angelopoulos, and
A.G. MacDiarmid, Phys. Rev. Lett, 1988. 60(26): p. 2789.
40. McCall, R.P., M.G. Roe, J.M. Ginder, T. Kusumoto, A.J. Epstein, G.E.
Asturias, E.M. Scherr, and A.G. MacDiarmid, Synth. Met., 1989. 29: p.
E433.
41. McCall, R.P., J.M. Ginder, J.M. Leng, H.J. Ye, S.K. Monahar, J.G. Masters,
G.E. Asturias, A G . MacDiarmid, and A.J. Epstein, Phys. Rev. B, 1990.
41(8): p. 5202.
42. Sariciftci, N.S., L. Smilowitz, Y. Cao, and A.J. Heeger, J. Chem. Phys,
1993. 98(4): p. 2664.
88
43. McCall, R.P., J.M. Ginder, M.G. Roe, G.M. Asturias, E.M. Scherr, A.G.
MacDiarmid, and A.J. Epstein, Phys. Rev. B, 1989. 39(14): p. 10174.
44. Stafstrom, S., J.L. Bredas, A.J. Epstein, H.S. Woo, D.B. Tanner, W.S.
Huang, and A.G. MacDiarmid, Phys. Rev. Lett, 1987. 59(13): p. 1464.
45. Havinga, E.E., W.T. Hoeve, and H. Wynberg, Synth. Met, 1993. 55(1): p.
299.
46. Havinga, E.E., W.T. Hoeve, and H. Wynberg, Polym. Bul l , 1992. 49(1-2):
p. 119.
89

Chapter 5.
Experimental Procedures
This chapter contains three main sections describing the experimental
techniques involved in the measurement of electroabsorption signals. The first
section describes the preparation of the samples; cleaning of substrates, preparation
and spinning of polymer solutions, and deposition of electrodes. Section two is
concerned with the EA spectrometer itself - its design and construction. Following
this there is a brief description of the methods used for measuring the thickness and
absorption spectra of the films, as this data is required in the analysis of the EA
spectra.
5.1 Sample Preparation
5.1.1 Chemical Synthesis
The chemical synthesis of the polymeric and oligomeric forms of emeraldine
base wi l l be briefly outlined here, as they were synthesised in Durham. The
chemical synthesis route of the polysquaraine will not be included, as it was
synthesised in the Philips laboratories, Einhoven - a description of the preparation
route may be found in the literature [1,2].
90

5.1.1.1 Polyemeraldine Base
12.96 g (0.100 mol) of aniline hydrochloride were disolved in 150 ml of
distilled water and stirred in a jacketed reaction vessel at a temperature of 0 °C. 28.5
g (0.125 mol) of ammonium persulphate were then dissolved in 80 ml of distilled
water and this solution added dropwise to the reaction mixture over a period of 4 h.
After stirring for a total of 24 h the reaction mixture was filtered under vaccum and
washed with 3x100 ml of water. The filter cake was then stirred in 33 % aqueous
ammonia solution (to deprotonate the polyaniline) for 8 h before filtering, washing
with 2x100 ml of water followed by 100 ml of isopropanol, and drying under vaccum
at 60 °C to give the emeraldine base form of polyaniline in approximately 90 % yield.
The molecular weight of the polymer used exceeded a minimum value of
about 30 000, as measured by gel permeation chromatography, using
polyvinylpyridine as molecular weight standards in solutions containing 0.1 % lithium
chloride in N-methyl-2-pyrrolidone. The use of solution state ^^C-NMR to further
characterise the chemical structure of the material has been described in section 4.1.1.
5.1.1.2 Oligomeric Emeraldine Base
The structure of the oligomeric form of emeraldine base form of the
oligomer [4-(phenylamino)phenyl]-l,4-phenyIdiamine is shown in Fig. 4.4. It was
first synthesised by Honzl in 1968 [3], and the preparation in Durham used a
modified version of this preparation.
To produce the LB form of the oligomer the following synthesis route was
used. 0.2 g of 2,5-Dioxo-l,4-cyclohexanedicarboxylic acid (1 mmol, 200 g/raol) and
0.55 g of N-phenyl-l,4-phenylenediamine from Aldrich (3 mmol, 184.24 g/mol)
were mixed in 30 ml of degassed m-cresol. The mixture was heated to 80 °C in an
91
oil bath and refluxed for three days under nitrogen, followed by overnight exposure
to air at room temperature. 100 ml of diethyl ether was then added, and a solid
collected by filtration from the resulting mixture. Washing with diethyl ether afforded
a pale blue-grey powder, which was recrystallised in dioxane. This LB oligomer was
then converted to the EB oxidation state via oxidation with silver oxide. 150 mg of
the LB oligomer (0.34 mmol, 442 g/mol) was added to 50 ml of THE at room
temperature. 78 mg of silver(I) oxide Ag20 (0.37 mmol, 231.74 g/mol) was added
and the mixture left stirring for 48 hrs. The solution was then filtered and the THE
removed by distillation. The residue was a blue soUd, as expected for EB. The sample
was characterised using FAB (fast atomic bombardment) mass spectroscopy (yielding
m.w. 441), and JR absorption spectroscopy. The use of FAB, as opposed to EI
(electronic impact) mass spectroscopy, allowed the EB form to be analysed without
the sample being reduced back to the LB form.
5.1.2 Sample Construction
A diagram of the sample configuration used is shown in Fig. 5.1. The
substrate of either glass or sapphire was coated with a thin film of the polymer,
which in turn had a set of interdigitated electrodes deposited on top. Sapphire was
used due to its high thermal conductivity combined with transparency in the UV -
glass was used merely as a cheap alternative.
The first stage of preparation was the cleaning of the substrate to remove any
grease or particles form its surface. This was achieved by placing substrates in an
ultra-sonic bath, using cleaning solutions of first water and detergent, then water,
then acetone - each for a duration of half an hour. The substrate was then dried of
acetone using a nitrogen gun - a process that was found to prevent smears occuring.
92
The thin films of polymer were deposited on the substrates by spinning from
solution - a detailed discussion of this topic may be found in ref.[4]. This process
required the polymer to be homogenised in solution. For emeradine base and the
tetramer the solvent used was N-methyl-2-pyrrolidine (NMP), and for
polysquaraine, chloroform (CHCI3). After preparing a solution of around 3 % by
weight, it was homogenised using an Ultra-Turrax T25 homogeniser, then
centrifuged at 4000 rpm for one hour. A few drops of solution were then pipetted
onto the substrate on the spinner, and the spinning speed slowly increased until the
surface tension of the film was overcome leaving a thin uniform film in the centre of
the disc with a thicker ring around the edge. This thicker ridge was often removed
using the comer of a paper towel to enable faster drying of the f i lm. The films were
better left to dry while still being being spun to prevent the migration of solution at
the edge of the fi lm back to the centre. The films containing NMP could take up to
four hours to dry i f left, and so drying was often assisted with judicious use of a hot
air gun. The films of EB and tetramer produced in this way were uniform, without
grains or pinholes.
The same preparation was used for the polysquaraines in chloroform -
though even after this treatment the films still had a slightiy granular appearance, as
though many small crystallites had formed upon the evaporation of the solvent.
Despite this, the majority of the film's composition was amorphous, and in the main,
pinhole free.
The electrodes used for these investigations were interdigitated gold
electrodes (as depicted in Fig. 5.1) with a finger spacing of 160 i-im. The advantage
93

1
u — _ u — _
1
u — _ u — _
I
u — _ u — _
1
u — _ u — _
^
u — _ u — _
1 u — _ u — _
160|im
12mm
electrodes
polymer film
sapphire substrate
-0.4|im
Fig. 5.1 Sample configuration
94

of using electrodes of this configuration, as opposed to just a single slit, is that the
large light throughput results in a higher signal to noise ratio.
Originally these electrodes were deposited on the substrates via the process
of chemical etching. This consisted of spinning a thin layer of photoresist on top of
the substrate, then exposing the photoresist to UV negative image of the required
electrodes. The photoresist image of the electrodes was removed using a suitable
etching fluid. A thin layer of gold was deposited on the substrate using the technique
of thermal evaporation deposition. The remaining photoresist was removed using an
appropriate etching fluid, thus removing the gold that had been deposited on top of
it and leaving an image of the electrodes on the substrate. Due to the narrow finger
spacing required to achieve the high electric fields necessary in these experiments it
took some time to perfect this technique. Once perfected on glass substrates the
technique was used to form electrodes on sapphire. It was found, however, that the
solvents used in the preparation of the polymer films tended to remove the
electrodes from the polished sapphire surface. Attempts were made to improve the
gold adhesion - including using a thin layer of chrome under the gold and
chemically roughening the sapphire by sUght etching with hydroflouric acid - with
no positive results.
The problem of electrode adhesion was overcome by the acquisition of
several sets of evaporation shadow masks in the form of the required electrodes.
Using these masks it was possible to deposit the electrodes on the surface of the
polymer films. It is possible that the heat involved in the deposition of the gold onto
the polymer surface may have caused damage to the polymer. The only area that
may have been effected, however, would be that under the electrodes. Since EA
investigations are concerned with the optical properties of the polymer between the
electrodes such damage would have been of no consequence.
95

Contacts were then made to the electrodes by bonding fine gauge wire to the
the gold using silver loaded paint.
5.2 E A Spectrometer
The EA spectrometer consisted of a choice of appropriate Ught source and
detector, a monochromator, a cryostat within which the sample was placed - all
mounted on an optical bench. Electric fields were generated across the sample using
an oscillator and amplifier. The EA signals were measured using lock-in techniques,
with the whole experiment contolled by a PC allowing precision timing and remote
data collection. A schematic of the apparatus is shown Fig.5.2.
There was a choice of two light sources. For work in the BRA^S a fan cooled
UV enhanced 100 W tungsten halogen filament lamp was employed. This lamp was
powered by 12 V car batteries in order to reduce the electrical noise and possible
lamp intensity variations that might occur i f powered by a mains rectified dc source.
For work in the VIS/UV a 250 W fan cooled xenon arc lamp was used: the high
voltages required to power this lamp meant that it had the potential of being
electrically noisy, so a mains isolator was used in an attempt to minimise any such
noise.
To complement these light sources there was a choise of two photodetectors.
For work in the IR a nitrogen cooled Laser Monitoring Systems In/As detector was
available, while for the VIS/UV a UV enhanced SiTek silicon photodetector was
used.
As shown in Fig.5.2 the light from the source was pre-monochromated,
using a Bentham M300 monochromator which contained suitable filters to prevent
96

s i s £ "O
o S
o n. c •4—t
& o XI
s •4—»
o
O
a S
Si o
00
97
second order re-entry. The monochromated beam was then focussed down onto the
sample using a quartz lens (f = 60 mm), and then further on to the detector using a
second lens similar to the first.
The sample was kept under a vacuum of -10"^ torr on a purpose built holder
mounted on the cold finger of a Leybold helium fridge, allowing study in the range
10-300 K. The vacuum was maintaned with a turbo molecular pump, backed by a
rotary pump. Most spectra were recorded at the lOK, the lowest temperature
attainable with the system, to reduce thermal noise.
The large sinusoidal electric fields necessary for EA spectroscopy were
attained by amplifying the output of the internal oscillator of the EG&G 5209 lock-
in amplifier using a Trek 10/10 soUd state amplifier. These high fields combined
with the closely spaced electrodes allowed fields of up to 125 kVcm"! to be attained.
Prior to the purchase of the Trek 10/10 amplifier attempts were made to attain the
high fields required using a step up transformer. It soon became apparent, however,
that the integrity of the sinsoidal voltage was lost during such large step up, and that
an amplifier of some type was required. The Trek 10/10 was chosen because it
exactly matched the needs of the experiment: the input voltage range (0-10 V)
matched the output of the lock-in's internal amplifier (0-2 V), and with a fixed gain
of 1000 the output matched the voltages required across the electrodes (0-2000 V).
An output was available on the amplifier to check the integrity of the amplified
signal on a CRO.
The current signal from either of the photodetectors was first converted to a
voltage signal and amplified - using a low input impedance transimpedance
amplifier - then split to allow simultaneous monitoring of the ac and dc components.
The dc signal, T, was measured using a K195 DVM, while the ac component, AT,
was analysed using the lock-in. The quotient of these two signals is the desired
98
perturbation due to the electric field, normalised to the transmission of the sample.
The process of recording these two signals simultaneously had the effect of reducing
possible causes of error in the data that existed if the spectra were recorded
consecutively, such as variations in temperature of the sample, variations in
intensity of the lamp, and exact positioning of the monochromator grating.
Simultaneous measurement also reduced the amount of time taken in recording
spectra: it was advantageous to take as short a time as possible on each spectrum as
it was found that under such high fields many of the samples quickly de-natured.
The exact process involved in the break down is unclear, though it may be that,
under the influence of the high electric fields the gold electrodes tended to slowly
migrate through the polymer until a short circuit was formed.
The polymers used in these experiments are considered to have been
predominantiy amorphous. Within an amorphous system the chains are randomly
oriented, and hence when applying a sinusoidal voltage the electtic field produced
within the positive portion of the voltage biasing cycle has the same effect as the
negative portion. The frequency of the EA response of such a system wiU therefore
be at twice the frequency of the applied field. This was verified by the absence of
any signal at the fundamental (applied) frequency (f). For this reason the lock-in
was set to monitor the signals at 2f. Since the voltage source was sinusoidal (sin cot)
and the EA response is quadratic with applied field, the instantaneous change in
transmission coefficient for an induced bleach is proportional to
Fo^sin^(cor) = j^Fo^[l-cos(2o)r)] eqn. 5.1
99
The lock-in reference was set to twice the fundamental, as mentioned above,
and knowing
-cos(2co/) = s i n ( 2 a ) f - ^ ) eqn. 5.2
meant that the dynamical component of the the lock-in had a phase change of -^/4
relative to the lock-in reference. Similarly, an induced increase in absorption would
be expected to have a phase change of ̂ /4 relative to the reference. The phase
settings on the lock-in were performed manually, and reset for each spectrum. The
values found for the phase change for induced absorptions were between 40° and 50°
for each material relative to the applied voltage - consistent with the predicted values.
While investigating the nature of the phase relationship between applied voltage and
EA signal many inconsistencies became apparent. Upon further investigation - and
lengthy consultation with the manufacturers - it was discovered that there was a
hardware-software mismatch in the lock-in requiring the instalation of upgraded
EPROMs. The fault was apparently inherent to all 5209s and 5210s of the period, so
beware!
For each EA spectrum taken a value of time constant on the lock-in had to
be chosen so as to provide a reasonably steady reading of the ac component of the
signal. These values ranged from 0.3 s to 10 s depending on temperature, appUed
voltage, and sample. Voltage dependencies of the signal were measured manually,
using longer time constants, (usually 30 s).
A great deal of time and effort was spent on reducing electrical noise within
the system. Al l cables were shielded, with the earths connected in such a way as to
prevent earth loops. A l l electrical equipment was also earthed, mostly via the optical
100
bench, again in such away as to prevent earth loops. Sensitive equipment was
isolated from the mains using an active isolating transformer. As far as possible all
electrically noisy equipment was kept physically separated from other equipment to
prevent RF pickup. RF also caused problems when igniting the arc lamp; all other
equipment had to be swithed off and inputs disconnected to prevent electrical
damage, as was found to my cost.
The cryostat used throughout was a closed loop helium fridge, which
necessitates the pumping of helium gas to and from the cryostat to the fridge unit.
This pumping causes vibration of the cryostat, and hence of the sample, introducing
yet another source of noise to the experimental system. In an effort to reduce this
noise a special mount was constructed in which the cryostat could be firmly secured,
and the mount bolted to the optics bench.
The combination of all these noise Umiting feactures resulted in signal to
noise ratio of EA signal of the order 5.10^ - as is apparent in the EA spectrum of EB
and of the phenyl capped tetramer in chapter 6.
When performing electroabsorption spectroscopy it is the change in optical
transmission, AT, of the sample that is monitored, whereas the theories presented in
chapter 3 talk of the change in absorption coefficient, Aa. The following method
and assumptions are used to convert from one to the other. When performing these
EA measurements AT is normalised with respect to the normal transmission of the
sample, T, giving the quotient AT/T - a value that is free of any spectral functions of
the spectrometer. In considering the optical properties of the sample, the transmitted
intensity. If, may be expressed in terms of sample thickness, d, absorption coefficient,
a, and reflection coefficient, R, as
I, = I,{\-Rfe-"' eqn. 5.3
101

This expression assumes that the reflection coefficient at the front and back
surfaces of the fihn are equal, and neglects multiple reflections within the sample. The
effect of applying an external field, F, to the system may further be expressed as
dF ° eqn. 5.4
Dividing by the unperturbed intensity yields
/. T l-R eqn. 5.5
For typical values of the optical constants [5] and film thicknesses the first
term of eqn. 5.5 dominates, giving AT/T~ -dAa, thus allowing the EA results to be
discussed in terms of the change of absorption coefficient.
5.3 Measurement of Absorption Coefficients
It is evident from earlier discussions that analysis of EA data requires the
absolute absorption spectra of the materials in question. These absorption spectra
were measured using a Perkin-Elmer Lamda-19 double beam spectrometer. Samples
of different known thicknesses, on matched substrates, were placed in the path of
the two beams. The resulting spectra taken with the samples in this configuration
was due only to the thickness difference of the films.
In order to calculate the absorption coefficient spectrum from such an
absorption spectrum it was necessary to determine the thickness of the polymer
102

films. Thickness measurements were made using an Alpha Step thickness gauge - a
device that measures the movement of a finely balanced stylus as it is traversed
across the surface of a sample. To measure the thickness of a film it was therefore
necessary to score a 'trench' through the fi lm, which was done using a razor blade.
For the highly uniform films of emeraldine base only two sample thicknesses were
measured (twice for each sample), and the absorption coefficient spectrum
determined from the difference in absorption between these two samples. For a
greater degree of accuracy more films could have been analysed, but since this work
has been carried out previously for polyaniline, with consistent results, repeating the
work did not seem necessary.
The films of polysquaraine were not as uniform as the fihns of polyaniline,
and so a more involved method of determining the absorption coefficient was
employed. Four films of varying thickness were spun onto matched substrates, and
labelled S1...S4. The difference absorption spectra between all combinations of the
films were measured in the manner explained above - SI against S2, S3, S4 etc...
The thickness of each film was determined using the Alpha Step thickness gauge.
For each difference spectrum the value of the absorption at 1.4 eV was recorded,
and knowing the approximate value of the difference in thickness of the two films, a
value of the absorption coefficient at this energy could be calculated. The average
value of absorption coefficient at 1.4 eV was then used to scale the whole
absorption coefficient spectrum.
103

References
1. Havinga, E.E., W.T. Hoeve, and H. Wynberg, Polym. BuU., 1992. 49(1-2):
p. 119.
2. Havinga, E.E., W.T. Hoeve, and H. Wynberg, Synth. Met, 1993. 55(1): p.
299.
3. Honzl, J. and M . Tlustakova, J. Polym. Sci, 1968. 22C: p. 451.
4. Scully, M.S., The Characterisation of Thin Films of Polyaniline for Gas
Sensing, M.Sc. Thesis. 1994, University of Durham.
5. Worland, R.S., Electroabsorption in Conjugated Polymers, PhD. Thesis
1989, Santa Barbra: California, p. 255.
104
Chapter 6
Results and Discussion
6.1 Emeraldine Base
The EA results for the polymeric and oligomeric forms of emeraldine base
wi l l first be presented separately, followed by a section in which the results are
compared and contrasted.
6.1.1 Polymeric Emeraldine Base
6.1.1.1 Linear Absorption
The room temperature absorption coefficient spectrum of the polymeric
form of emeraldine base is shown in Fig.6.1. It is in agreement with previously
published spectra of the material [ 1 ,2 ] - showing absorption peaks at 2.0 and 3.8
eV, with a further peak evident as a shoulder at 4.5 eV. Consistent with this
previous data, the 3.8 eV absorption feature is around 1.4 times greater than that at 2
eV. As described in chapter 5, these absorption values were calculated by placing
two films of different known thickness in a double beam spectrometer, thus
allowing the resulting spectrum to be interpreted in terms of absorption per unit
thickness. Table 6.1 lists the thickness measurements for two fihns that were used to
calculate the above spectrum.
Absorption and EA spectra were initially taken at both room temperature and
at 10 K. It was found that the low temperature absorption spectra had greatly
reduced noise due to the reduced thermal activity, but had the same lineshape as the
105
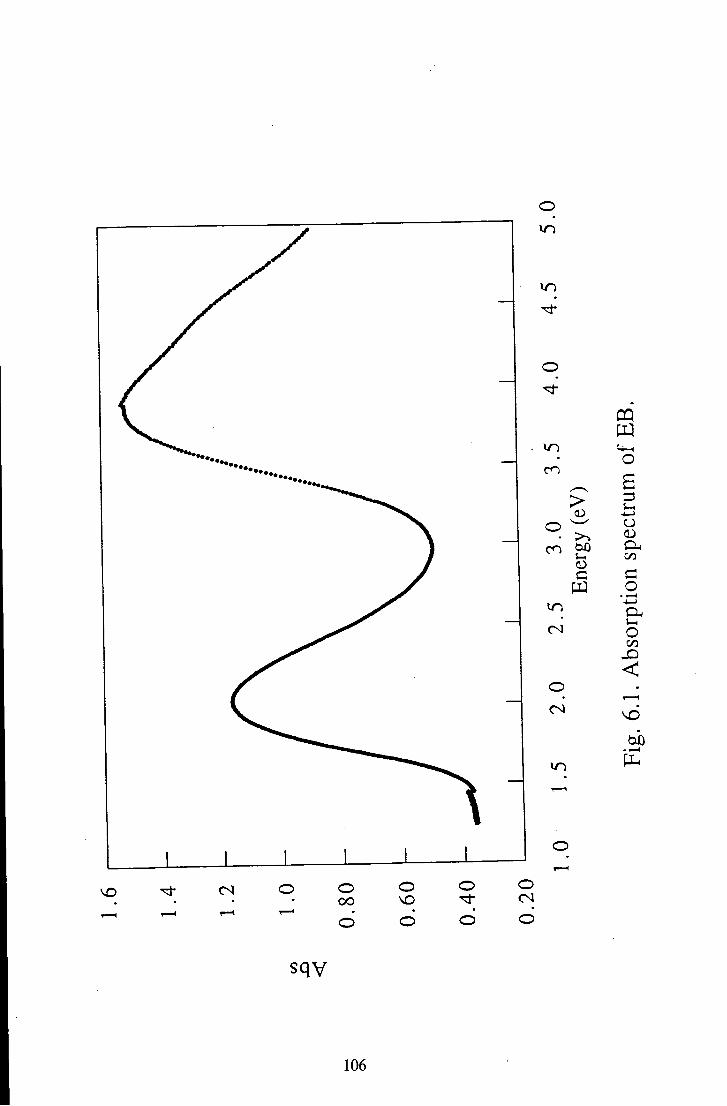
o in
o
O ^ cn too
c W
(N
O <N
CQ
o a.
. 2
O GO
o o o o <N
d d d d
sqv
106

room temperature spectra. Absorption spectra of EB have been found to shift by
approximately 0.08 eV without a change in lineshape from room temperature to 10
K, and it appeared that, within experimental error, the shift in EA peaks was of the
same order of magnitude. At these low temperatures it was found that much higher
fields could be applied to the samples before they broke down. This fact, along with
the reduced noise and the fact that the lineshape was the same as that at room
temperature, led to all the following spectra being taken at 10 K.
Sample Thickness (|im)
SI 0.25 ±0.02
0.24 ±0.02
S2 0.14 ±0.02
0.15 ±0.02
Table 6.1 Thickness of EB spun films.
6.1.1.2 Electroabsorption
Fig.6.2 shows the EA response for EB at 10 K with an applied voltage of 87
kVcm'l. The spectrum shows a positive peak at 1.58 eV, followed by a negative
peak at 1.92 eV, returning to zero at around 2.3 eV. This part of the spectrum is
associated with the 2 eV absorption. The EA spectrum then shows a peak at 3.3 eV,
followed by a negative peak at 3.8 eV and positive peak at 4.3 eV, associated with
the absorption at 3.8 eV.
The voltage dependence of the observed EA signal for 1.6 eV
photoexcitation is shown in Fig.6.3. As can be seen, the EA signal has a quadratic
107
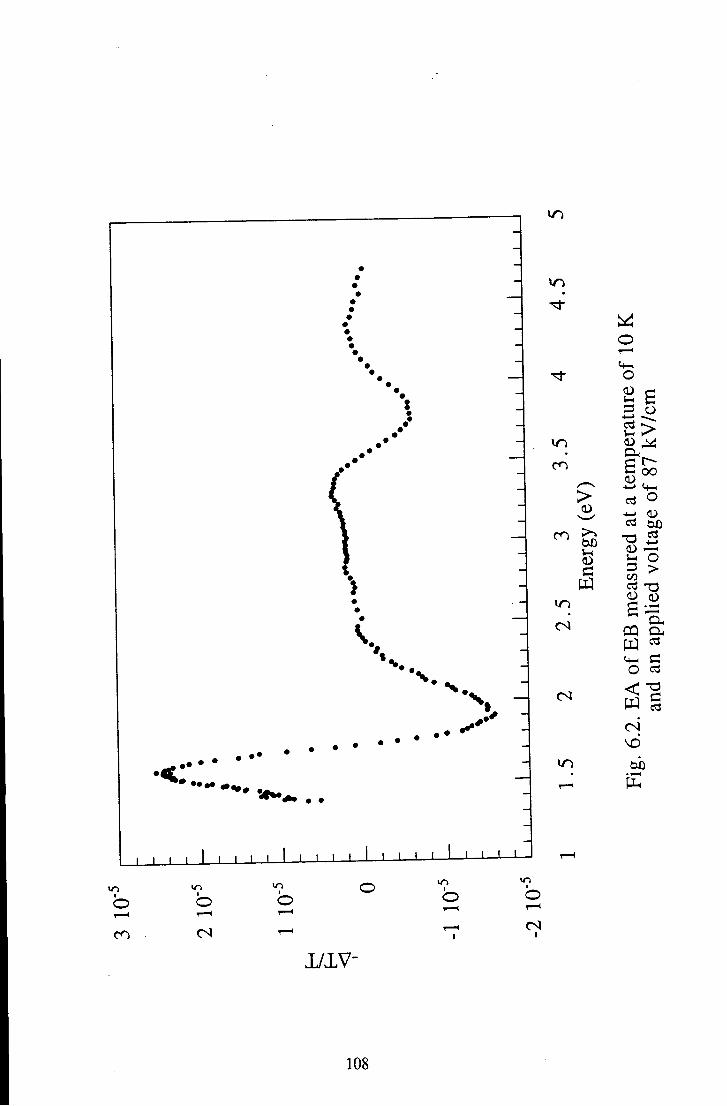
wo
WO
WO
>
-I wo (N
(N
WO
O
in o
CQ a. W =̂ ^ c o <̂
c3 <N
tin
I I I I I I I I I I I I I I I I I I I
I
o
JL/IV-
108

O
O
O a <
O
>
1/1
W .o
$3 • • . H
w o o c: T3 D O h <0
T3
c3 •i->
'o > cn
••-(
109

dependence upon applied electric field in agreement with the relevant theories
presented in chapter 3. The whole spectrum has the same dependence, and hence
varying the applied field does not change the lineshape of the EA response.
Evidence of this is shown in Fig.6.4 which shows the EA response of the low
energy peak of EB at various applied voltages.
As was explained in chapter 3, the lineshape of an EA spectrum is of
importance when discussing the type of photoexcited states produced. Information
may be gained from observing whether the EA lineshape most closely resembles the
first or the second derivative of the normal absorption spectrum, or a mixture of the
two. Figs.6.5 and 6.6 compare the EA spectrum with the first and second derivatives
of the normal absorption. The derivative lineshapes have been scaled to match the
EA lineshapes at 1.6 eV. It can be seen that the second derivative gives a good fit
over the whole spectrum - no combination of the two lineshapes appeared to give a
better fit, even when considering the responses associated with the two absorption
peaks separately. The EA spectrum closely follows the second derivative lineshape
up to 1.7 eV, where the two begin to separate and merely follow the same trend. The
feature associated with the 3.8 eV absorption matches the second derivative
lineshape, the size difference being due to the method of scaling mentioned above.
The deviation from the derivative lineshape above the main absorption feature has
been noted previously for other EA spectra of amorphous polymer films, notably for
PPA and PDES as reported by Jeglinsky and Vardeny [3] as discussed in chapter 3.
The exact reason for this type of deviation is as yet unclear. Combinations of first
and second derivative lineshapes were tried, but none gave as good a fit as that
shown in Fig.6.6.
The oscillations around 2.5 eV in the second derivative lineshape are thought
to arise from intrinsic artifacts in the Lamda-19 spectrometer, rather than any
evidence of structure in the absorption spectrum. Such oscillations were observed in
110
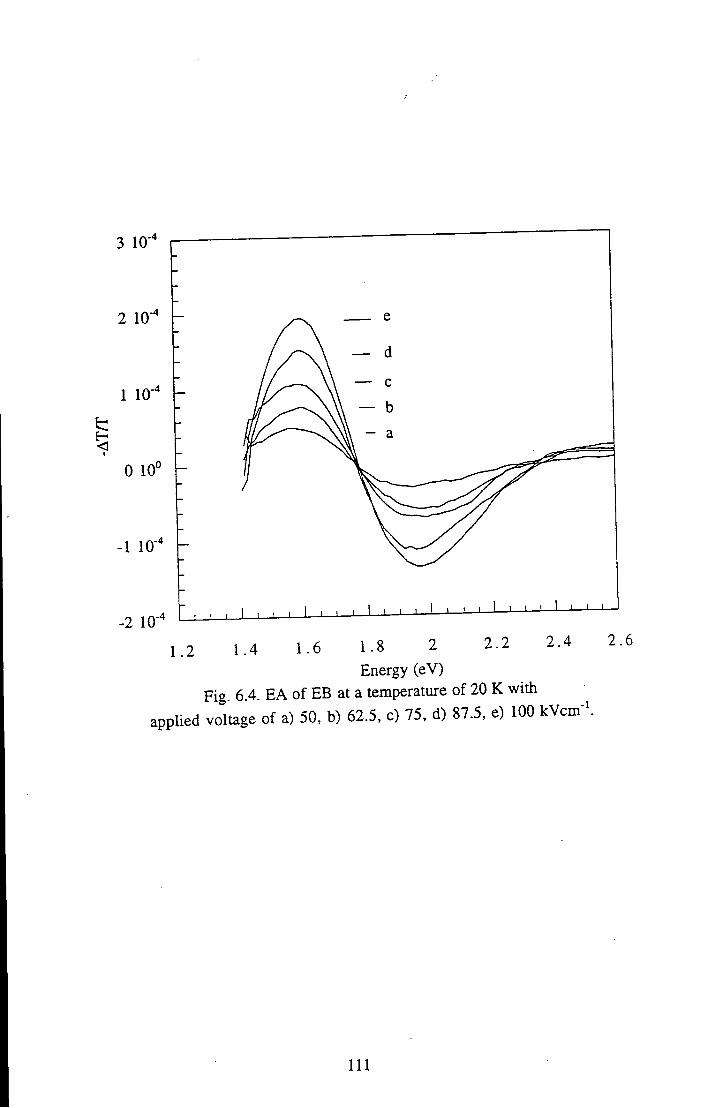
3 10-
2 10"' -
I 1 10-̂ h
0 10° -
-1 lo-'̂ -
-2 10-
1.2 2.2 2.4 2.6 1.4 1.6 1.8 2
Energy (eV) Fig 6.4. EA of EB at a temperature of 20 K with
applied voltage of a) 50, b) 62.5, c) 75, d) 87.5, e) 100 kVcm -1
111

>
X -X :
J L J L
i n
I T ) I
o o CN
in
b
cn
cn
wn
un
o • ^
o
.s
x: 4—>
o > >
'-<—>
> t>£) • ^*
ner
del
w 4—• 1/1
' — '
c/i
>
o < w
[1.
1/iv-
112

-a
X X •
X . J * xx. X x
><K X X . .
wn
I I 1 , I , . . . 1 . I I • ' • • • • I • ' ' • I ' ' I I I I I I I
cn
c o -4—>
O cn
as
C
>
> .> cn >̂
00 un
<N
un
1
o r — (
1
o </->
o 1—1
1 o r — 1
cn <N T — I
I
o I
o I
o cn 1
'-)-( o <
vd
1/lV-
113
many of the spectra taken with the spectrometer for many materials of various film
thicknesses.
As mentioned in chapter 3, EA spectroscopy involves the mixing of two
fields - the applied electric field and the optical field. The predicted ratio of the EA
signal for the fields being parallel and perpendicular is proposed to have a value
ranging from 3:1 to 1:3 [4]. Using a calcite crystal polariser positioned in the optical
path after the monochromator, the polarisation of the EA signal of polymeric
emeraldine base was measured, yielding the result of EA(parallel/perpendicular) =
2.3 - consistent with the predicted values.
6.1.1.3 Discussion
According to the theory of Sebastian and Weiser [5] a fit of second
differential of normal absorption with the EA lineshape implies that the
photoproduced states posses a permanent dipole moment. Of the two photoexcited
states suggested by Kim et al. [6, 7] and Duke [8], only the n-Ti* suggestion of Kim
seems compatible with a second derivative lineshape as this involves the direct
photoproduction of a permanent dipole, whereas the exciton suggested by Duke is
symmetric and hence has no permanent dipole. It must be remembered, however,
that the exciton proposed by Duke is idealised - die exciton being formed on a
perfect polymer unit in a uniform potential. As has been pointed out in chapters 2
and 3, a real polymer system can be far from ideal due to the presence of disorder.
Disorder may result in the occurrance of non-uniform electric fields within the
system as well as causing conformations very different from those predicted for the
ideal polymer chain. In these conditions it is possible that the ideal exciton proposed
by Duke ends up asymmetric, and hence possessing a permanent dipole. This would
114

mean that the second order lineshape of the EA spectrum may be considered
compatible with both proposed 2eV photoexcitations.
Using the method presented in chapter 3 (eqn. 3.5), and assuming the
photoexcitation involves complete transferal of one electron (q=l), a rough estimate
of the spatial extent of the photoexcited states can be made. For the 2 eV excitation
this results in an electron-hole separation distance, r, of around 0.4 nm. Using this
interpretation of this result impUes that the 2 eV excited state is spatialy extended
over a distance greater than just one ring.
This result must be treated with caution. It depends mostly upon the model
used to interpret the results, and the assumption that the photoexcitation involves the
complete transferal of one electron. It should also be noted that the proposed
structure of the EB molecule has a herring bone arrangement, and that this structure
brings neighbouring rings closer together than if the molecule were in a linear
configuration. The use of this model therefore implies that the excited state is the
charge transfer exciton suggested by Duke, rather than the n-n* transition suggested
by Kim.
The EA signal associated with the 3.8 eV absorption also has a second
derivative lineshape, again implying the formation of an excited state with a
permanent dipole moment. This seems inconsistent with the proposed theory
presented in chapter 4 of a TZ-K* transition on a benzenoid ring. Even so, calculating
the spatial extent of the excited state, assuming the transferal of one electron (as for
2 eV excitation), yields a value of 0.25 nm, which is consistent with the
photoproduction of an excited state contained within one ring unit. It may be, then,
that the 3.8 eV absorption results in the production of some form of intraring
exciton.
If, in fact, the 3.8 eV absorption produces a state with no charge transfer
characteristics, an alternative process - such as lifetime broadening, or a transferal of
115

oscillator strength leading to broadening and suppression of the absorption peak -
could also explain the second derivative lineshape of the the EA spectrum in this
energy range.
During the experimentation undertaken on EB photoconductivity studies of
EB were also performed in an attempt to spectrally resolve any photoconductive
response. The results were consistent with those previously reported by other groups
(see section 4.1.2.3) in being so small as to be indistinguishable from heating
effects. This 'negative' result is, however, worth mentioning in relation to the EA
data reported here. The lack of change in conductivity of the material upon
photoexcitation of excited states implies that the excited species are either neutral or
deeply trapped. For 2 eV excitation this is consistent with the idea of the formation
of a trapped exciton. The absence of a photoconductive response for 3.8 eV
excitation would be consistent with the formation of an intra-ring exciton.
6.1.2 Oligomeric Emeraldine Base
6.1.2.1 Linear Absorption
Sample Thickness (̂ .m)
SI 0.32 ± 0.02
0.35 ± 0.02
S2 0.19 ±0.02
0.20 ± 0.02
Table 6.2 Thickness of OEB spun films.
116
The room temperature absorption spectrum of the oligomeric emeraldine
base (OEB) is shown on Fig.6.7 showing absorption peaks at 2.1 and 4.0 eV. Table
6.2 lists the thickness measurements for two films of the oligomer used in
determining the absorption coefficient values of the absorption spectrum.
6.1.2.2 Electroabsorption
The EA spectrum of OEB recorded at 10 K under an applied field of 44
kVcm"! is shown in Fig.6.8. The comparison of the lineshapes with the derivatives
of the normal absorption are shown in Fig.6.9 and 6.10. It can be seen that the
second derivative again gives the best fit to the EA data. As for FEB the derivative
lineshape was scaled to match the EA data at 1.6 eV, resulting in the smaller
response of the 4 eV photoexcitation being mismatched in size. The EA spectrum
can be seen to follow the derivative lineshape up to 1.95 eV, after which the two
merely follow the same trend.
The dependence of the EA signal on applied field for OEB, recorded at lOK
and a photoexcitation energy of 1.6 eV, is shown in Fig.6.11. Once again the
dependence is quadratic, in agreement with the theories presented in chapter 3.
6.1.2.3 Discussion
Assuming once again that the photoexcitations produce CT states, then the
calculations of spatial extent of the states gives the results 0.4 nm for the 2 eV
absorption, and 0.25 nm for die 4 eV absorption.
There is an interesting feature in this spectrum at 1.35 eV. This feature was
reproducible between samples, and was dependent upon applied voltage. The exact
117
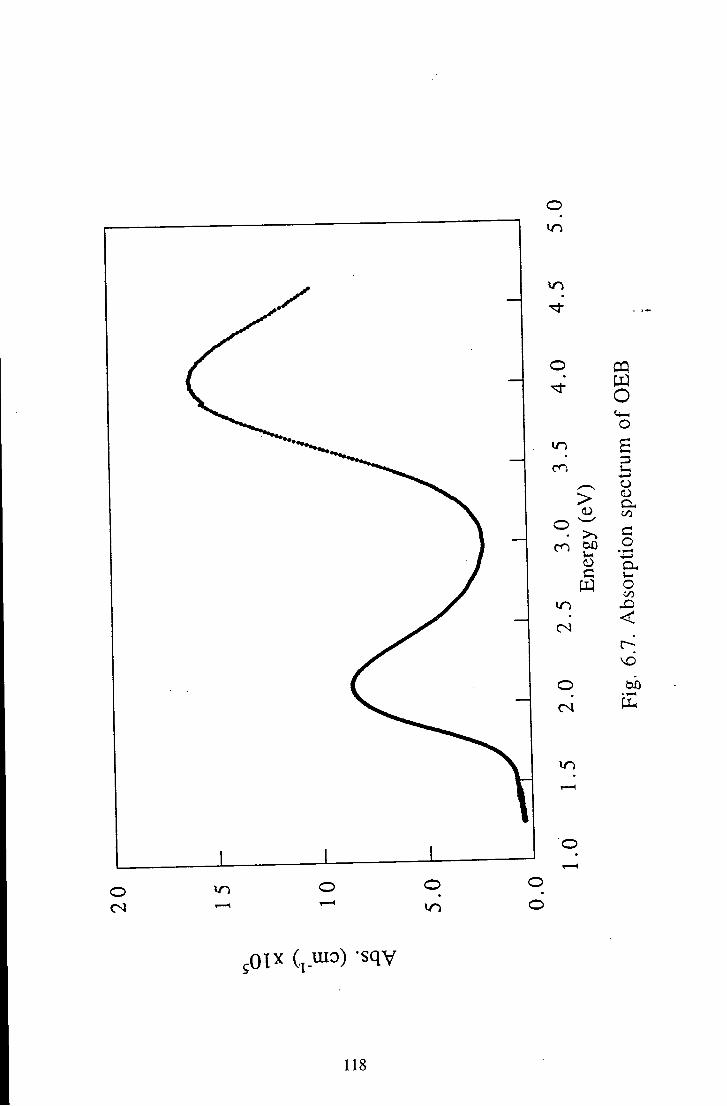
cn bO
o
3 o o-C o a. O 00
<
bb
-01^ C i - ^ ^ ) 'sqv
118

f
I I I I I 1 I • ' ' ' I ' I I ' I I I I
- 4
b T—<
I
o 1
o
cn
cn
<N
> bX)
(N
I
O cn
I
o
2 S ^ >
O i
w oo \d bb
119
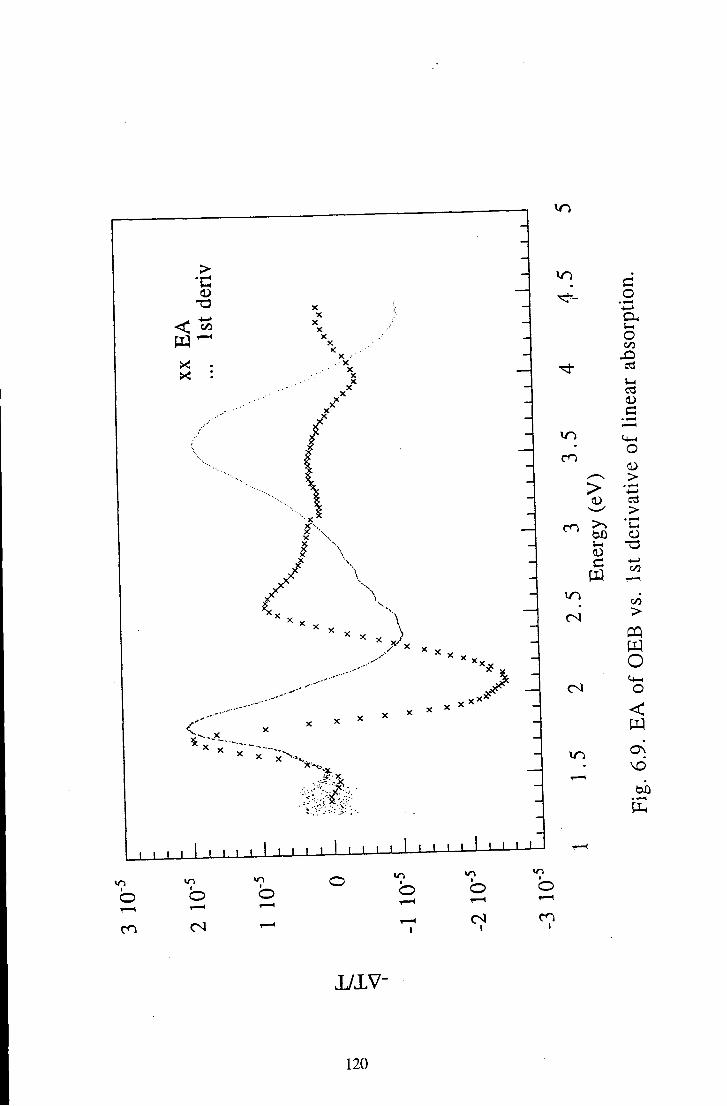
> • a
^ 4—' •< 00
w X :
mi •I I . .L 1 1 ) 1 I 1 I . 1 1 1 1 I I I I I ' ' ' ' '
wn d o
" S 4
0
c t4-H 0
cn ID ID >
— > cn bO 0)
En 4—>
(/3
00 >
CQ W
0
< OS
\d bO
v-1 I
o cn
I
O I
o I
o I
o <N
I
I
o cn
I
1/xv-
120

>
X :
\ > -X X . . -
I I I I I I I I I I I ' I ' I I ' I I . 1 1 1 1
vt
d d d ' — <
CO
I
o d 1—1
O
CO
wo
wo
wo
>
C W
wo
CM
-] wo
o & o
o
>
^3 t3 (N
> PQ § "4-1
o < d
v d
1/lV-
121

o o
in d
9 d
in
I
in o in o CO
in o in
>
1 03
g
'a
0 0
<
0) o CS c: 0)
'o >
(§TS VH) «T
122
dependence was not assertainable due to the error present on such small signals.
This feature will be discussed further in the next section.
6.1.3 Comparison of Polymeric and Oligomeric Emeraldine Base
The first point to note in the comparison of the optical properties of EB and
OEB is the shift of absorption peaks in linear absorption spectra; the peaks for OEB
are ~0.15 eV higher in energy than those of PEB - as can be seen in Figs.6.1 and
6.7. The difference in relative bights of the absorption feactures at 1 eV and 4 eV is
also of interest. For EB the ratio is about 1.4, whereas for OEB the ratio is around 2,
implying that there are a greater ratio of benzenoid rings to quinoid rings in EB than
in OEB. This is consistent with the proposed structures of the two materials - one
quarter the rings in EB are quinoidal, compared to only one ring of the five in OEB.
The EA spectra are expanded in terms of Aa and are overlaid in Fig.6.12 for
ease of comparison. The lineshape of the two spectra are very similar, though the
shift seen in the absorption spectra is evident here also - as would be expected.
The fact that the spectra are so similar and that the estimated spatial extent of
the excited states coincide, implies that the electronic structure of the chromophores
within the two materials are essentially the same. This reinforces the belief that EB
is indeed semi-conjugated, and diat the theoretical modelling of EB by OEB is a
good method.
The absorption and EA spectra of both EB and OEB reveal no vibronic
structure, having broad featureless peaks. This type of broad absorption profile is
often observed in conjugated polymers and is usually attributed to the distribution of
conjugation lengths, and hence of excitation energies, caused by disorder - as
mentioned in chapter 2. This cannot be the case for either EB or OEB. EB is serai-
conjugated in short conjugated segments, and this negates the possibility of large
123
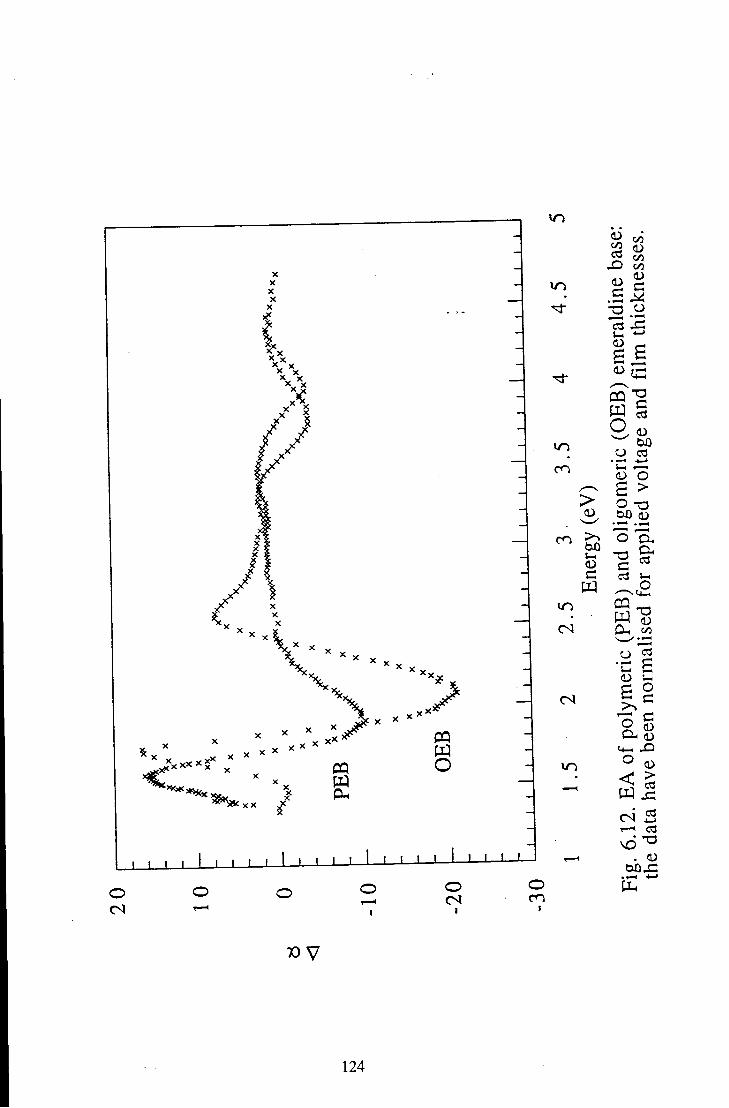
• X . ^ v X x X
I I I I I I I I I ' I I I I I I I I I 1
in
in
in CO
CO
>
in (N
in
O o o CO
S ^
S § £ ^ O c«
0 o a > O t 3
S
'C £
1 =
^ 1 <N C3
•i—>
box:
124

broadening effects due to changes in conjugation length. OEB also has a broad,
featureless absorption peak at 2 eV; variations of conjugation length obviously
cannot be predominant in such a short chain oligomer. This implies that there must
be some alternative broadening process occuring.
Assuming the photoexcited species produced upon 2 eV photoexcitation is
the self-trapped CT exciton suggested by Duke [8], then the broadening of the
absorption peak may be related to the separation of the electron and the hole and the
exact values of ring torsion angles before excitation. These parameters are also
affected by disorder, but the resulting effect is not associated with variations in
conjugation length.
The energy of the exciton state suggested by Duke is dependent upon the
charge separation involved, and upon the initial degree of delocalisation of the n-
electrons across the three ring unit. The degree of electron delocalisation depends
upon the torsion angle between the rings; if the rings are nearly planar dien there is a
high degree of delocalisation, and less energy will be required to excite the electron
to the quinoid ring from the benzenoid rings. It is after the photoexcitation process
has occurred that the quinoid is predicted to rotate away from the plane thus
decreasing the TC-electron overlap and trapping the exciton. The presence of disorder
within the system may result in a range of torsion angles occurring in the ground
state within the three ring conjugated system, and hence in turn result in a spread of
excitation energies required to produce the exciton. By the same argument, disorder
will also result in a spread in the values of the trapping energies of the excitons after
photoexcitation, though due to the nature of the experiment this is not observed in
EA investigations.
Another factor that may govern the broadening of the absorption peaks is the
exact location of the hole in relation to the electron, as it is of great importance to
the final energy of the exciton. The predictions of the probable location of the hole
125
shown in Fig.4.6 is once again for the case of an ideal system. In addition to the
possible ring rotation effects mentioned above, disorder effects such as chain
terminations, kinks, and cross linkages will radically effect the local environment of
the excitation. The schematics of the conjugated three ring unit presented in Fig.4.2
are an example of the way in which conformational variations may affect the
separation distances of the possible electron and hole sites, and at the same time
displays the occurrance of varying ring torsion angles. Any resulting spread in
effective separation distances of the electron and the hole will result in a spread in
the Coulomb energies, and hence broaden the associated absorption feature. This
same argument has been used to explain the large broadening of absorption features
in such materials as CT glasses and solutions [10].
These effects are not dependent upon the system being fully conjugated, and
are hence valid for emeraldine base, both in the polymeric and oligomeric forms. It
is possible that such mechanisms may lead to the broadening of the absorption peak
to such an extent as to obscure any vibronic structure that may otherwise have been
apparent in the 2 eV absorption and EA peak of either material.
There are also some obvious differences between the EA spectra: the trough
at 2 eV for OEB is somewhat larger than that for EB, and there is a definite peak
evident at 2.5 eV that does not appear for EB. The reason for these differences is, as
yet, unclear. One possibility, however, is that the peak at 2.5 eV is due to some
energy level that is present in both materials but that does not exhibit the same shift
in energy as the other states in going from oligomer to polymer. If this were the
case, then an overlap of this peak with the neighbouring trough in the EA signal of
the polymer would result in both features being reduced in magnitude. If these
features were then separated - i.e. the trough moved to a lower energy, as in the case
of the oligomer - the size of the trough and the peak would increase, as is observed.
126
The EA feature observed at 1.35 eV for OEB is not evident in the EA
spectrum of EB. If the feamre does exist in EB, it has not been observed only
because the feature would occur below the energy range of the experiment.
Assuming the same shift as for all the other peaks would place such a feature in
PEB at around 1.2 eV.
In this low energy area of the spectrum the second derivative of normal
absorption shows merely noise. This is due to the fact that the absorption measured
at this point is as small as the error on the spectrometer, and so taking a second
derivative of such a signal results the scatter observed in Fig.6.10. Close
examination of the absorption spectrum could reveal no feature at this energy, nor
has any such feature been reported previously.
This feature could be evidence of a transfer of ocsillator strength, induced by
the applied field, to a normally one-photon forbidden state located at 1.35 eV. This
suggestion is very tentative; it would require more experimental data, such as the
verification that the dependence of signal upon applied field is quadratic and higher
resolution absorption spectra, to be confident of such an assignation. It may also be
possible that such a feature would be evident in two-photon absorption
spectroscopy. EA spectra extending below 1.2 eV for PEB would be necessary to
ascertain i f a similar feature were present for this material also.
It is interesting to note that recent EA investigations have indicated the
existence of such a feature in P-carotene which has also assigned to a normally one-
photon forbidden state (2Ag) becoming weakly allowed in the presence of an
applied field due to the transferal of oscillator strength [11]. The authors have been
more confident in this assignation due to the fact that they have been able to
characterise the feature to a greater degree - including observing the quadratic
dependence of the EA signal on applied field.
127

6.2 Polysquaraine
6.2.1 Linear Absorption
The spectrum of the linear absorption coefficient of polysquaraine is shown
in Fig.6.13. It is consistent with the previously reported absorption spectrum of the
material [12, 13], indicating an optical band gap of -1.3 eV. Vibronic structure with
a peak separation of -150 meV are visible on the higher energy side of the
absorption peak, more readily observed in the second derivative of the absorption
spectrum shown in Fig.6.16. The thickness of these films was less uniform than
those of polyaniline, and so it was decided to take a greater number of
measurements of difference spectra, and carry out a slightly more
Sample Thickness (nm)
SI 0.05 ± 0.03
S2 0.15 ±0.03
S3 0.30 ± 0.03
S4 0.45 ± 0.03
Table 6.3 Thickness of polysquaraine spun films.
involved averaging process. Table 6.3 lists the thickness measurements of various
films. Table 6.4 then lists the absorption per unit thickness taken at 1.4 eV obtained
from the difference spectra of various combinations of these films. The absorption
value of 3.4.10^ cm was used to scale the absorption coefficient spectrum of
Fig.6.13.
128

CO
o
vn
>
o W
o < o o i o o i o o > n o
C/3
« ^
3
cr
'o O
3 •*-> O
C O
O 0 0
<
CO
(̂ .uio) sqv X 0̂ I
129
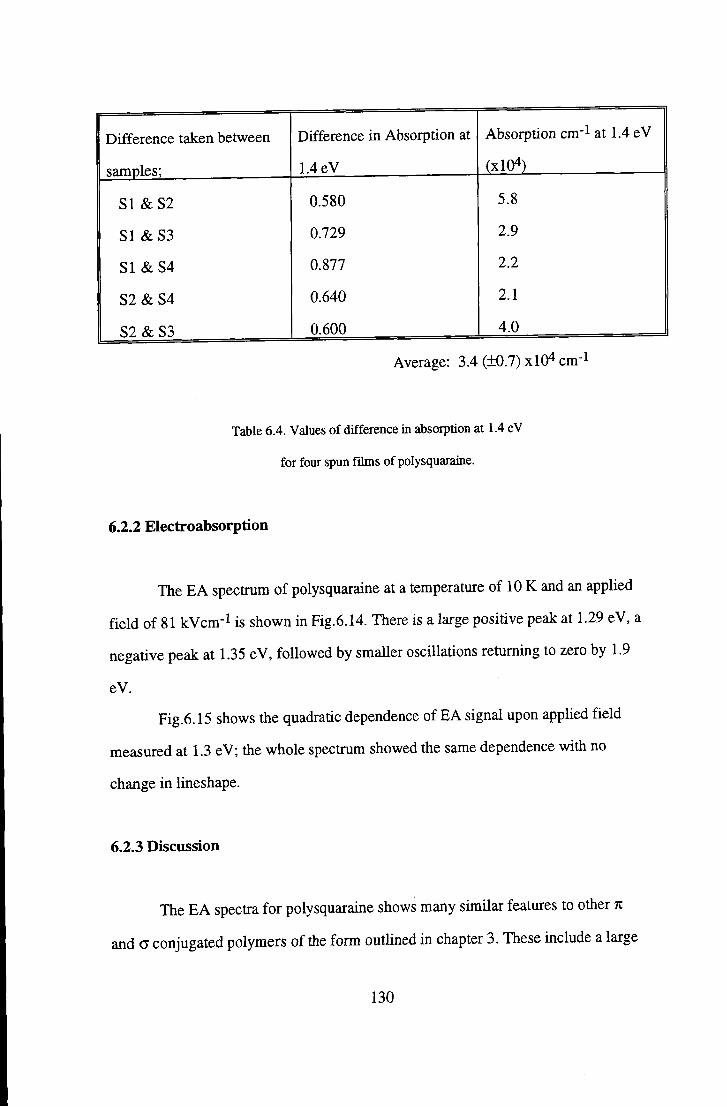
Difference taken between
samples;
Difference in Absorption at
1.4 eV
Absorption cm'̂ at 1.4 eV
(xlO*)
SI &S2 0.580 5.8
SI &S3 0.729 2.9
SI &S4 0.877 2.2
S2&S4 0.640 2.1
S2&S3 0.600 4.0
Average: 3.4 (±0.7) xlO^ cm-l
Table 6.4. Values of difference in absorption at 1.4 eV
for four spun films of polysquaraine.
6.2.2 Electroabsorption
The EA spectrum of polysquaraine at a temperature of 10 K and an applied
field of 81 kVcra"^ is shown in Fig. 6.14. There is a large positive peak at 1.29 eV, a
negative peak at 1.35 eV, followed by smaller oscillations returning to zero by 1.9
eV.
Fig.6.15 shows the quadratic dependence of EA signal upon applied field
measured at 1.3 eV; the whole spectrum showed the same dependence with no
change in lineshape.
6.2.3 Discussion
The EA spectra for polysquaraine shows many similar features to other n
and a conjugated polymers of the form outlined in chapter 3. These include a large
130

<N
<N
O (N
3 a
r-H Of) r3
toJO c c3
on <
•<3-I
o CO
O O O o O
•>3-I
o O
I
x/xv-
131

-A o
d
-i o
>
C3
S <
o
d
o >
.1—1
oo O
(iBuSis VH) ui
132
oscillation in Aa at or near the absorption band edge, and secondary oscillations that
eventually decay to negligible values at higher energies. This leads to a discussion
of the EA results of polysquaraine in the manner of Kawabe [14, 15], and Jeglinski
[3, 16]- with the energy band strucmre of the form depicted in Fig.6.16. Only the
singlet states will be considered, as there is no data concerning the triplet manifold
of states.
This model assumes the system to be best described as a series of short
chains of conjugated polymer, separated by topological defects caused by disorder -
as described in chapter 3. The first one-photon allowed optical transition is to a IBy
exciton with the 'conduction' band lying at higher energies, and various Ag states -
not normally one-photon optically allowed - lying in between. The exact ordering of
these states is indeterminate, for example whether the 2Ag state lies above or below
the IBy exciton state, especially considering the unusual band curvature predicted
for the ground state of this particular polymer. Despite this curvatvu-e, it is thought
that the energy level scheme of the form shown in Fig.6.16 with the associated
model for the origin of the EA signal as desribed in chapter 3 should be appUcable
in the discussion of the EA signal of polysquaraine.
The EA spectrum is compared with first and second derivatives of the
absorption spectrum in Figs.6.17 and 6.18 and a combination of the two in Fig.6.19.
The combination of the first and second derivatives (in a ratio 2:3 respectively) is
observed to give the best fit. The combination of the derivatives and the EA data
correspond closely up to 1.33 eV, encompassing the large peak at 1.3 eV. In the
framework of the afore mentioned model this peak corresponds to the Stark shift of
the IBy exciton. At higher energies the curves have the same general shape - though
the oscillatory structures due to electron-phonon interactions have been shifted. The
reason for this shift is as yet unclear - though, as mentioned in chapter 3, the
presence of such a shift has been noted for other materials. Despite this shift the
133
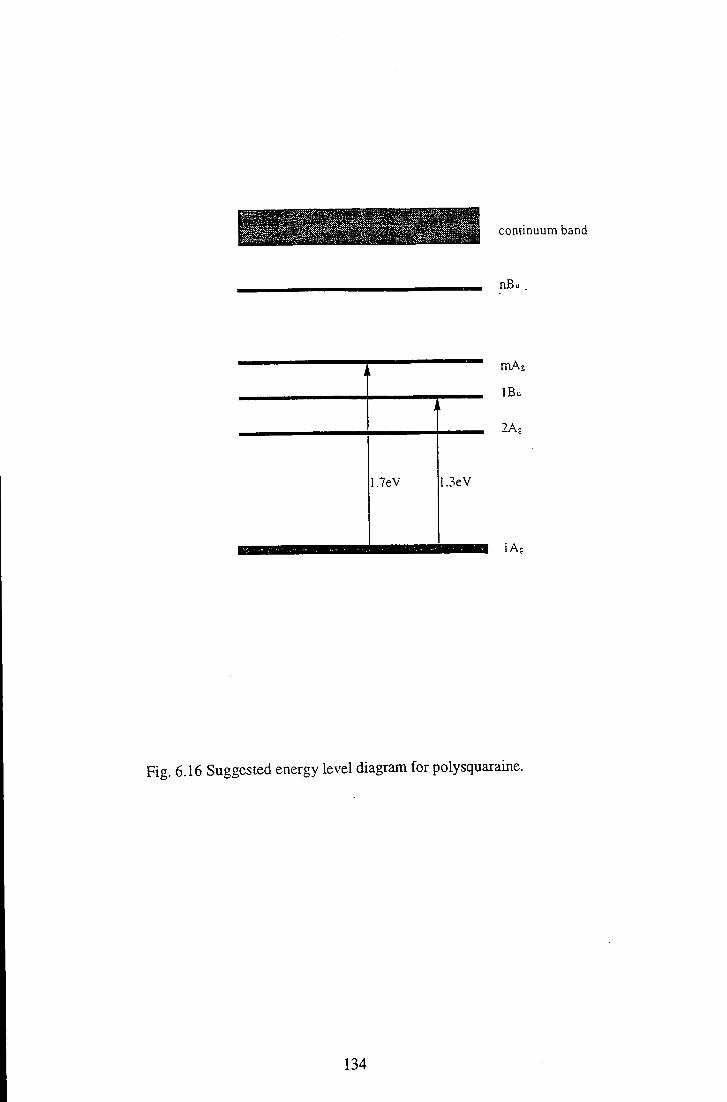
cont inuum band
nBu
i
I.7eV 1.3eV
mAg
IBu
Fig. 6.16 Suggested energy level diagram for polysquaraine.
134

<N
> •c
X • X :
* . X .
<N
OO
> bi)
c
c .2 •4—J U( O oo
o >
>
- i — I 0 0
0 0
> GO
<
bh
I o T — (
oo
• I I
o 1—1
J 1_JL J—S—L I I 1 I I I
o I
o o O o I
o I
1/iv-
135

(N (N
OO
bO
o
o
C3
O
> t3 >
-o (N
0 0 O H
<
oo
bb
1
o T - H
1
O -a-
t
O b T 1
o O 1 o 1—1
b 1 o r — (
oo VO o (N 1 1
1/iv-
136
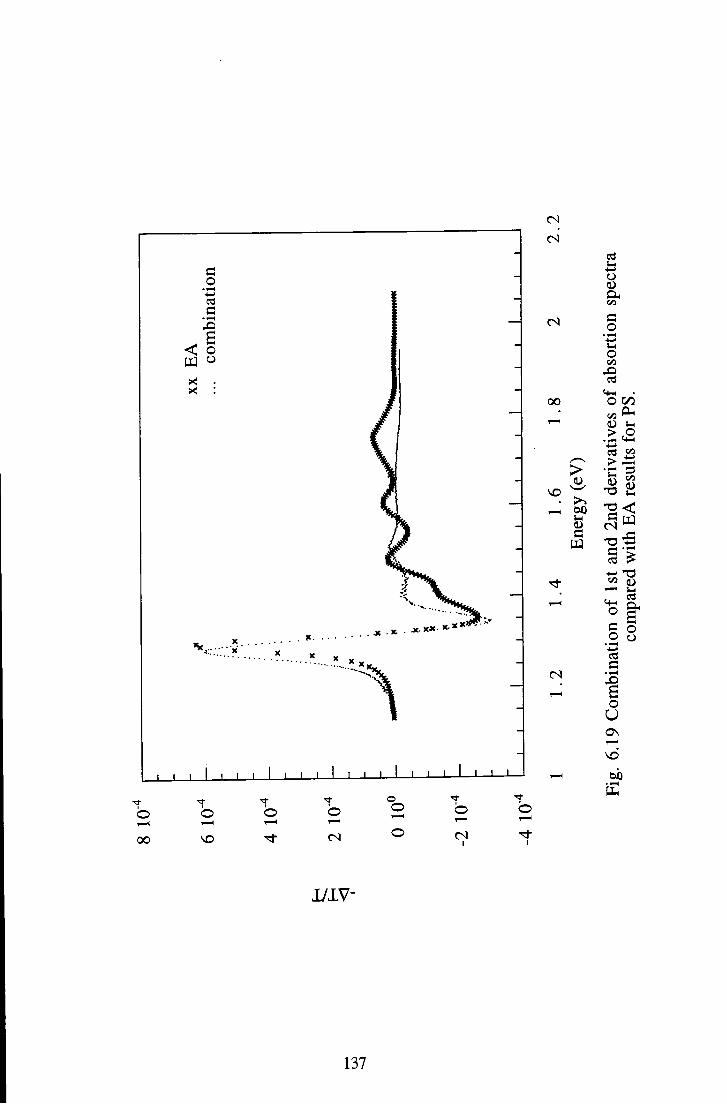
c o •(-> cd a
J < o m ^ X . X :
. X , . x x*- x.xxw^
C^
oo
C<1
cd i3 o (U OH c« C
o o 00
O C/5 a i
cd ^ ^ - ^ ^ «5
.2 " cd C
I o
U
J I L J L J I L _ l — I — \ — I — I — 1 — I — L .
b b b b o ^ q b
b 00 C<l
lyiv-
137

vibronics are consistently separated by -130 raeV - apart from the broad signal
centered at 1.75 eV which does not correspond to any vibronic structure visible in
the derivative of the normal absorption spectrum. As was mentioned in chapter 3,
this type of feature has been observed previously for other amorphous polymers
where it was assigned to a transfer of oscillator strength to a normally one photon
forbidden mAg state that becomes weakly allowed in the presence of a symmetry
breaking external field. Considering the similarity of the EA response of
polysquaraine with those considered by Jeglinski et al. [3], it would seem reasonable
to make the same assignation for the 1.75 eV feacture in polysquaraine, and is
marked as such on the energy level diagram in Fig.6.16.
Included in chapter 3 was the description of the method of subtracting the
EA spectrum from the lineshape of the first derivative of absorption to reveal any
deviation of the experimental results from the theoretical prediction. This method
allowed the identification of transitions to normally one photon forbidden states.
This procedure was employed for the EA spectrum of polysquaraine, but the results
showed no meaningful structure. The reason for this probably arises from the main
assumption of the method, pointed out in chapter 3, that the features in the EA
spectrum must transfer no oscillator strength to or from any energy levels outside
the range of the spectrum measurement: there must be conservation of oscillator
strength within the spectral range. It has been observed that polysquaraine has many
absorption feactures in the UV, above the range of our experimental investigations.
It is possible that the application of an external field causes some degree of
transferal of oscillator strength from the features investigated in these experiments
with those outside the experimental range, thus invalidating the above procedure.
Using the expression
138

and the data at 1.3 eV for the EA of the IBy exciton an approximate value of the
Stark shift (Ae) may be calculated, though it will be an underestimate due to the
neglect of higher order terms in applied field. This gives the result of a Stark shift of
~1 meV, which is comparable with that measured for PDES and /rom-PA [16],
though large in comparison with PDAs . The discrepancy is not well understood,
though it has been suggested [16] that it may be due to stronger exciton dipole
moment resulting from either stronger internal fields, or the degree of localisation in
amorphous polymers.
During the writing of this thesis there have been reports concerning EA
investigations of a squaraine monomer [17]. The absorption profile of the material
has the same form as the polysquaraine reported here, though shifted to higher
energies, as for OEB and EB mentioned previously. The EA response of the
material also appears similar to that for PS at energies near those of the onset of
absorption, though the responses do differ at higher energies. These differences
include a smaller trough above the band edge in the monomer, and the apparent
abscence of the peak at higher energies of the form usually ascribed to an mAg state.
These differences may be ascribed to a difference in effective conjugation length
widi increased chain length, and/or realted to the differences in sidechains attached
to the backbone of the two materials.
6.2.4 Summary
These results imply that polysquaraine is a fully conjugated polymer whose
EA response may be satisfactorily explained within the generic model of disorder
139
induced short conjugated segments. The main EA peak at the band edge is proposed
to be due to the Stark shift of a IBy exciton. An EA feacture at 1.75 eV has been
assigned to an mAg state becoming weakly allowed in the presence of an external
field. There is no evidence in the experimental data to place the 2Ag level below the
IBy. It is suggested that the schematic of Fig.6.16 may be used to describe the
energy level structure of the polymer.
6.3 Comparison of the Interpretation of the Results of Emeraldine Base and
Polysquaraine.
Both EB and polysquaraine have been described as A-B type polymers, as
has been discussed in section 4.2 of the 'review of materials'. Emeraldine base may
be considered as a regular alternation of [Be-Am-Be-Am-Be] and [Im-Qu-Im] units,
where Be represents a benzenoid ring, Qu a quinoid ring. Am an amine group and
Im an imine group. EB is proposed to be semi-conjugated, with the conjugation only
extending over the [Im-Qu-Im] unit. Polysquaraine, however, is proposed to be fully
conjugated over its regular array of donor acceptor units.
Despite this similarity of alternating chemical 'building blocks', the
difference in the degree of conjugation has meant that the models used to interpret
the data are very different. As mentioned at the end of chapter 3 the choice of model
is governed, to some degree, by prior knowledge of the nature of the material. The
semi-conjugated nature of EB, and the belief that the 2 eV photoexcitation involves
some degree of charge transfer, led to the model of Sebastian and Weiser being
employed to interpret the data. The fully conjugated nature of polysquaraine, and
the fact that the EA spectrum of the material showed many of the generic feactures
of other 7t-conjugated materials, led to the results being interpreted as being due to
mixing of molecular energy levels due to the application of an external field.
140
References
1. Scully, M.S., The Characterisation of Thin Films of Poly aniline for Gas
Sensing, M.Sc. Thesis. 1994, University of Durham.
2. Monkman, A.P. and P.N. Adams, Synth. Met, 1991. 40: p. 87.
3. Jeglinski, S.A., Z.V. Vardeny, Y. Ding, and T. Barton, Mol. Cryst. Liq.
Cryst., 1994. 256: p. 87.
4. Hagler, T., Cem. Phys. Lett., 1994. 218: p. 195.
5. Sebastian, L., G. Weiser, and H. Bassler, Chem. Phys, 1981. 61: p. 125.
6. Kim, Y.H., S.D. PhiUips, M.J. Nowak, D. Spiegel, CM. Foster, G. Yu, J.C.
Chiang, and A.J. Heeger, Synth. Met., 1989. 29: p. E291.
7. Kim, Y.H., C. Foster, J. Chiang, and A.J. Heeger, Synth. Met., 1989. 29: p.
E285.
8. Duke, C.B., E.M. Conwel, and A. Paton, Chem. Phys. Lett, 1986.131(1-2):
p. 82.
9. PhiUips, S.D., G. Yu, C. Y, and A.J. Heeger, Phys. Rev. B, 1989. 39(15): p.
10702.
10. Haarer, D. and M.R. Philpott, Excitons and Polarons in Organic Weak
Charge Transfer Crystals., in Spectroscopy and Excitation Dynamics of
Condensed Molecular Systems., V.M. Agranovich and R.M.
Hochstrasser, Editors. 1983, North-Holland Publishing Company.
11. Rohlfing, F., S.J. Martin, D.D.C. Bradley, A. Eberhardt, K. MuUen, J.
Comil, and J.L. Bredas, To be published in Synthetic Metals.
12. Havinga, E.E., W.T. Hoeve, and H. Wynberg, Synth. Met, 1993. 55(1): p.
299.
141

13. Havinga, E.E., W.T. Hoeve, and H. Wynberg, Polyra. Bull., 1992. 49(1-2):
p. 119.
14. Kawabe, Y., F. Jarka, N. Peygambarian, D. Guo, S. Mazuradar, S.N. Dixit,
and F. Kayzar, 1991. 44(12): p. 6530.
15. Kawabe, Y., F. Jarka, N. Peyghambrarian, D. Guo, S. Mazumdar, S.N.
Dixit, and F. Kajzar, Synth. Met, 1992. 49-50: p. 517.
16. Jeglinski, S. and Z.V. Vardeny, Synth. Met, 1992. 49-50: p. 509.
17. Poga, C, Brown, T. M., Kuzyk, M. G. and C. W. Dirk, J. Opt. Am. B.,
1994.24: p. 531
142
Chapter 7
Summary
This thesis has reported optical absorption and electroabsorption
measurements of three materials: polymeric and oligomeric emeraldine base, and
polysquaraine.
To enable the measurements of the electroabsorption response of the
materials a purpose built spectrometer was designed and constructed. Due to the
small size of the effect a high resolution system was required, and to this end lock-in
techniques were used, and the sample kept at low temperatures. The use of these
techniques enabled detection of changes in absorption coefficient with a resolution of
around 5x10" .̂
The absorption coefficient spectra, necessary for the interpretation of the
electroabsorption data, have been measured for each material and are in agreement
with previously reported results.
The electroabsorption results for polymeric and oligomeric emeraldine base
have been presented and are seen to closely resemble each other - both in magnitude
and lineshape. This indicates that the photoexcitation processes occurring in the two
materials have the same origin, and hence that the modelling of the polymer on the
oligomer is a valid extrapolation.
A feature has been observed at 1.35 eV in the electroabsorption spectrum of
the oligomeric eraeraldine base. This feature is tentatively assigned to a transfer of
oscillator strength to a normally one photon forbidden transition due to the
application of an external field. This feature has not been observed in the polymeric
emeraldine base, though if it were to occur, extrapolation of other absorption and
143
electroabsorption features would place the feature at 1.2 eV - below the spectral
range of the apparatus.
Previous theoretical and experimental investagations of emeraldine base
have suggested that the 2 eV photoexcitation produces an excited state that possess
some degree of charge transfer characteristics. Taking this into account the
electroabsorption spectra have been interpreted in the context of the relevant model,
and an approximate value of the charge separation distance of the excited state
calculated. For the 2 eV excited state this yields a separation distance of -0.4 nm.
This implies that the 2 eV photoexcitation results in the formation of an excited state
that is spatialy extended over a distance greater than just one ring repeat unit.
Though the results cannot conclusively be used to differentiate between the
competing theories, they do imply that the photoexcitation is that of the charge
transfer exciton suggested by Duke.
Using the same model for the 4 eV transition gives a charge separation
distance of -0.25 nm, which would imply the formation of an intra-ring exciton. It
may be, however, that this may be the wrong method of interpreting the data, with
the possibility of another perturbation mechanism, such as line broadening or
transferal of oscillator strength, dominating.
The electroabsorption data for polysquaraine have also been presented.
Polysquaraine is proposed to be a fuUy conjugated polymer, and as such the results
have been interpreted in the framework of a different model. The electroabsorption
spectrum shows many generic feactures of spectra of other conjugated polymers,
such as a large peak at the absorption edge, followed by a trough, returning to zero
with smaller oscillations on the high energy side of the peak. This has led to the
spectrum being interpreted in a similar manner to that of other such polymers. An
energy level diagram of the material has been proposed, which includes the
144
possibility of a normally one photon transition occurring at 1.75 eV. It is suggested
that this transition becomes allowed due to the mixing of energy levels due to the
application of an external field, resulting in a transfer of oscillator strength to this
normally forbidden transition.
145
Related Documents