MSc Program Environmental Technology & International Affairs A Master’s Thesis submitted for the degree of “Master of Science” supervised by Electricity Generation from Palm Oil Biomass Residues Incineration: Feasibility study with feedstock from governmental plantation sites in Sumatra Utara, Indonesia Ao.Univ.Prof. Dr. Hans Puxbaum Jennifer Elisa MacDonald 1327921 Vienna, August 9, 2015 Die approbierte Originalversion dieser Diplom-/ Masterarbeit ist in der Hauptbibliothek der Tech- nischen Universität Wien aufgestellt und zugänglich. http://www.ub.tuwien.ac.at The approved original version of this diploma or master thesis is available at the main library of the Vienna University of Technology. http://www.ub.tuwien.ac.at/eng

Welcome message from author
This document is posted to help you gain knowledge. Please leave a comment to let me know what you think about it! Share it to your friends and learn new things together.
Transcript
MSc Program Environmental Technology & International Affairs
A Master’s Thesis submitted for the degree of “Master of Science”
supervised by
Electricity Generation from Palm Oil Biomass Residues
Incineration: Feasibility study with feedstock from governmental plantation sites in Sumatra Utara, Indonesia
Ao.Univ.Prof. Dr. Hans Puxbaum
Jennifer Elisa MacDonald
1327921
Vienna, August 9, 2015
Die approbierte Originalversion dieser Diplom-/ Masterarbeit ist in der Hauptbibliothek der Tech-nischen Universität Wien aufgestellt und zugänglich.
http://www.ub.tuwien.ac.at
The approved original version of this diploma or master thesis is available at the main library of the Vienna University of Technology.
http://www.ub.tuwien.ac.at/eng

Affidavit I, Jennifer Elisa MacDonald, hereby declare
1. that I am the sole author of the present Master’s Thesis, "Electricity Generation from Palm Oil Biomass Residues Incineration: Feasibility study with feedstock from governmental plantation sites in Sumatra Utara, Indonesia ", 53 pages, bound, and that I have not used any source or tool other than those referenced or any other illicit aid or tool, and
2. that I have not prior to this date submitted this Master’s Thesis as an examination paper in any form in Austria or abroad.
Vienna, 09.08.2015
Signature

! i
Abstract !This thesis investigates the feasibility of communal electricity generation from feedstock originating from government owned plantation sites throughout Sumatra Utara. This region was selected due to the high concentration of palm oil plantations in the area, currently occupying of 15% of total land territory in the region. The city of Medan, an urban area with 2.1 Mio inhabitants, and capital of Sumatra, Utara, has relatively high grid connectivity and is therefore an ideal site for a palm oil biomass residue plant. The calculations done show that with the amount of feedstock from palm oil biomass residues of the government owned plantations in Sumatra, Utara, available it would be possible to power about five plants of 60 MW thermal power respectively of 21 MW generated electricity each. Thus, electricity of 105 MW, or during a year about 840 GWh might be produced. There are however limitations originating from the peculiarities of the fuel properties which impose difficulties for the operation of larger plants: • The humidity of the fuel mix of palm fiber and palm kernel shell is highly variable
which requires a management of the humidity level by seasoning or torrefaction. • The palm oil biomass residues exhibit a relatively high nitrogen content, which may
create high emissions of NOx. The operation of a staged fluidized bed combustor might reduce the NOx emission. If the NOx emissions still remain too high, then de-NOx systems involving ammonia injection will be necessary.
• The palm oil biomass residues exhibit a relatively high ash content, with high concentrations of Na, K, Ca and Si. The resulting ash upon combustion exhibits a high alkalinity and a low melting point promoting bed agglomeration and liquid slagging, making the boiler more difficult to operate. For fuel with low melting ash fluidized bed combustion is likewise the recommended technique.
• The high ash content requires increased efforts for limiting the emissions of fine particles. In order to meet fine particles emission standards for biomass power stations of the EU or US, in addition to cyclones either electrofilter or bag house filters will be required.
• However, the alkalinity of the fly ash creates absorption sites for SO2, thereby reducing the emissions to a concentration below emissions standards.
• The ash from a 60 MWth power plant operated with POBR is in the order of 700 kg/h (17 t/day), requiring silo transports back to the plantation, or to a suitable dump site, where the ash gets deposited and processed in a solidified form. Handling has to be taken with care due to the alkaline (caustic) properties of the ash.
• Due to the many not completely resolved technical issues of POBR utilization for electricity generation a pilot plant of small size is recommended.
• For a sustainable utilization of the POBR for power generation stack gas emission standards are to be defined.

! ii
Table of Contents Abstract ............................................................................................................................ i
Table of Contents ............................................................................................................ ii
List of abbreviations ...................................................................................................... iii
Acknowledgements ........................................................................................................ iv
1. Introduction ................................................................................................................. 1
2. Palm Oil Products as an Energy Source ................................................................... 5
2.1 Indonesia’s Energy Mix .................................................................................................... 5 2.2 Palm Oil production .......................................................................................................... 9
2.2.1 Palm oil tree planting ................................................................................................... 9 2.2.2. How is CPO extracted? ............................................................................................. 11
2.2.3. What are the Biomass products formed in CPO and CPKO production? What is
done with these products? ..................................................................................................... 13 2.3 Current technologies in use ............................................................................................. 17 2.4 Chemical composition of biomass feedstock ................................................................. 21
2.4.1 Chemical composition of biomass substances and associated problems ................... 21 2.4.2 Preventative pollutant measures ................................................................................. 25
3. Model ......................................................................................................................... 28
3.1 Considerations for model feasibility .............................................................................. 28 3.2 Calculation of biomass feed stock availability .............................................................. 32 3.3 POM Electrical need and feedstock sufficiency of 60 MWth plant .............................. 35 3.4 Emissions considerations ................................................................................................. 38
3.4.1 SO2 and NOx emissions .............................................................................................. 40 3.4.2 Fly Ash emissions ...................................................................................................... 42
4. Conclusions ................................................................................................................ 43
Bibliography .................................................................................................................. 49
List of tables .................................................................................................................. 52
List of figures ................................................................................................................. 53

iii
List of abbreviations ASEAN - Association of Southeast Asian Nations BIGCC - Biomass integrated gasification combined cycle BPP - Biomass power plant BPS - Bandan Pusat Statistik CHP - Combined heat and power CO - Carbon monoxide CO2 - Carbon dioxide CPKO - Crude palm kernel oil CPO - Crude palm oil EBTKE - New and Renewable Energy and Energy Conservation EFB - Empty fruit bunches EU - European Union FBC - Fluidized bed combustion FFB - Fresh fruit bunches FS - Fiber-shell G20 - Group of Twenty GDP - Gross Domestic Product GHG - Greenhouse Gas GWh - Gigawatt hour h - Hour H2O - Water HC - Hydrocarbons K - Kelvin Kg - Kilogram kPa - Kilopascal kW - Kilowatt kWh - Kilowatt hour LCA - Life cycle assessment LHV - Lower heat value m - Meter
Mboe – Thousand barrels oil equivalent MJ - Mega joule MW - Megawatt MWel - Megawatt electric MWth - Megawatt thermal N - Nitrogen NCV - Net calorific value NGOs - Non-Governmental Organizations NOx - Nitrogen oxides PAH - Polycyclic aromatic hydrocarbons PF - Palm fiber PKC - Palm kernel cake PKS - Palm kernel shell PLN - Perusahaan Listrik Negara PM - Particulate matter (2.5 or 10) POBR - Palm oil biomass residues POM - Palm oil mill POME - Palm oil mill effluent PTPN - PT Perkebunan RE - Renewable energy RET - Renewable energy technology RSPO - Roundtable on Sustainable Palm Oil SC - Sludge cake SCR - Selective Catalytic Reduction System SOx - Sulfur oxides VOC - Volatile organic compounds µg - Microgram µm - Micrometer!

iv
Acknowledgements I would like to thank my parents, Drs. Daniel and Maria MacDonald, for providing me
with the love, support, and encouragement throughout my studies.
A big thanks to Professor Puxbaum who has been tremendous help, encouraging me to
apply for the ETIA travel grant and has helped me every step of the way with my thesis.
He has not only provided me the guidance and critical thinking that has allowed me
deeply engage with a technical topic but has also provided good lessons on Austrian
culture, history, and life.
I would like to thank the faculty and staff at the TU CEC and the Travel Grant
Committee for providing me with the opportunity to travel to Yogyakarta, Indonesia to
further explore my research topic.
I express my gratitude to the Gadjah Mada University especially those at the Public
Administration Studies department for providing me with the resources to further
research my topic, especially: Professor Pramusinto who allowed me to engage with
various faculty, staff, and students at the university, and Ms. Pradhikna Yunik, MA, for
making my life in Indonesia easier and helped me translate during site visits.
Additionally I thank Professor Taryono from the Agricultural Sciences Department who
inspired me to study renewable energy resources from biomass byproducts, provided
me with a trove of information, and introduced me faculty and staff at Instiper.
A big thanks to Instiper, Yogyakarta, especially Dr. Wahyu for enabling me to attend
classes, observe the research garden, and provide me with information on transport
within a palm oil mill.
I lastly thank my friends who have provided me with the support that I needed
throughout this journey, as well as Marie-Isabell Lohmann for the formatting help and
the delicious eggs benedict.

1
1. Introduction
Indonesia is currently the fourth most populated country with 240 million people,
spread across 17,000 different islands and ranks 13th globally for primary energy use at
893 one thousand barrels oil equivalents (Mboe) (Hasan et al., 2012). Indonesia is the
only Association of Southeast Asian Nations (ASEAN) member who is part of the
Group of Twenty (G20) and currently has the highest gross domestic product (GDP) in
the ASEAN region. Most energy sources are located outside of Java, particularly in
Sumatra, but the demand of energy is concentrated on the island of Java (Hasan et al.,
2012). The concentration and development of infrastructure remains the highest in Java
in comparison to other islands. Indonesia’s rapid growth rate cumulates into rapid
depletion in oil and natural gas reserves. Following the economic recession in 1998,
Indonesian energy consumption increased with a growth rate of 7% annually (Hasan et
al., 2012). While fossil fuel reserves in Indonesia are limited (e.g. oil, gas, and coal) but
the dependency on this type of fuel is still high. Additionally, much of the extracted raw
material resources are exported to neighboring countries. One solution is to focus on the
development in renewable energy technologies (RET). An important Renewable energy
Technology (RET) could potentially be biomass residues that are by-products from
palm oil plantations.
Palm oil trees (Elaesis guineesis) are originally West African palm trees introduced to
the South East Asian region in the 19th century. The palm oil industry in Indonesia,
developed in the early 1920’s under Dutch colonials, expanded rapidly between 1960-
2000 in Asia that was coupled with the rapid increase in demand for the palm oil
products. Palm oil is well known for its versatility and adaptability as food and cleaning
product including oils, soaps, chocolate and other foodstuffs (Mahlia et al., 2001).
Currently, the two largest producers of palm oil are Malaysia and Indonesia, accounting
for approximately 85% of the world’s palm oil production (Abdullah and Sulaiman
2013). As the global demand for food oil grows, so does the palm oil industry.
Indonesia has moved to a more agrarian based culture in order to shift its economic
downturn after the 1997 Asian Economic Crisis. Many palm oil plantations have been
developed in ideal conditions located on the islands of Sumatra, Kalimantan and
Sulawesi in which the misty environment and favorable soil conditions enable this

2
agricultural product to thrive so well (Mahlia et al., 2001). In 2006, Indonesia overtook
the Malaysian palm oil industry as the world’s largest producer of crude palm oil (CPO)
and crude palm kernel oil (CPKO) products. According to Indonesian government
statistics, the palm oil crop consists of 10,586,500 ha worth of plantation area. This is
nearly triple the area of the second largest planted agricultural goods, coconut at
3,787,300 ha, and triple rubber production currently at 3,555,800 ha (BPS 2013).
Between 2012 and 2013, there was an expansion of 453,200 ha difference in palm oil
plantation area from 2012 levels of 10,133,300 ha (BPS 2013). The palm oil industry is
a rapidly expanding industry and Indonesia currently produces 21.6 million tons of
palm oil annually. Palm oil exports are still in raw form, which makes it a low value-
added industry, the products of which are produced at a low cost and high volume
(Hasan et al., 2012). Palm oil products increase in value as the product moves from
extraction of the raw materials to the final product. According to the World Bank, as of
June 2015, the cost of oil palm per ton is at 607 USD in raw form (World Bank, 2015).
Oil palm is the highest yielding oil crop yielding approximately a net of 4-5 tons of
oil/ha/year (Sumathi et al., 2008). Today, approximately 90% of palm oil is currently
used as food related products while the other 10% is used in soap and skin care products
(Mahlia et al., 2001). Recently, an increasing use has been reported as a source of for
biofuels, ideally from waste palm oil or oil residues (Mekhilef et al., 2011)
Due to this rapidly expanding industry, measures have been taken in order to improve
the overall sustainability of the industry. The sustainability of the palm oil industry is
regulated by the establishment of Roundtable on Sustainable Palm Oil (RSPO).
According to RSPO Principles and Criteria, RSPO sets the standards and defines the
production of palm oil crops as legal, economically viable, environmentally appropriate,
and socially beneficial operations (Shuit et al., 2009). The Roundtable for Sustainable
Palm Oil (RSPO) was established in recent years with support from a variety of
stakeholders ranging from palm oil producers, processors, traders to non-governmental
organizations (NGOs), and manufacturers (Abdullah and Sulaiman, 2013). This group
is responsible to develop goals for a sustainable palm oil industry and production. These
goals include a commitment to transparency, compliance with all (international, local,
national, and ratified) regulations, adoption of sustainable cultivation practices,
conservation of resources, biodiversity, and local community development (Abdullah
and Sulaiman, 2013).

3
While there is much controversy surrounding the palm oil industry, namely negative
publicity of its land use practices, deforestation, disruption of ecosystems, corruption
and transboundary haze pollution, the industry is well established and will continue to
operate on developed land. Due to the establishment of the RSPO, it is within the
interest of palm oil industries to continue sustainable development of its industry and
mitigate effects of their agricultural practices. While it is important to focus on many of
the above listed issues associated with the palm oil industry, it is also important to
maximize utility and sustainability of this already-existing industry in order to grow and
sustain a potential renewable energy resource. A major focus should be drawn to
electricity generation through controlled biomass incineration. This type of electricity
generation is a pre-existing phenomenon that has mainly been limited to power many
palm oil mills (POMs). Fibers and shells from the processing are mixed in an optimized
ratio and utilized as alternative fuel for electricity generation within factories. Shell and
fibers produced from palm oil extraction can supply considerably more steam and
electricity than is internally required, thereby giving palm oil plantations the potential
opportunity to export their electricity to surrounding settlements and cities (Lim et al.,
2014).
The focus of this thesis is on the feasibility of electricity generation and supply by
estimating the amount of feedstock and production of electricity in a hypothetical
biomass plant located in the region of Sumatra Utara, the capitol of this area being
Medan, Indonesia. The thesis will model potential energy supply from palm oil biomass
residues from given palm oil plantation sites, which are relatively close to an urban
area. Selection of this region is ideal in such a study since the city has a large electrical
demand, a population of 2.1 million inhabitants, and in close proximity to large palm oil
plantation sites. Utilizing shell and fiber can generate more than enough energy to meet
the demand of the palm oil mill (Mahlia et al., 2001). Even though the feedstock of this
biomass plant greatly surpasses its overall capacity, a pilot plant would be able to test
the feasibility of an electrical plant utilizing this type of substance. Various studies
conducted have shown that the chemical composition of these substances make the
plant operation more complex, requiring close monitoring of plant incineration
activities. While the benefits of CO2 reduction using electricity via biomass residues is
4
clear, it is important to also account other potential pollutants, such as particulate matter
from the ash content and the nitrogen content of the fiber-shell feed mix.
A summary of Indonesia’s current energy mix will be discussed and legislation that
encourages the development of more renewable energy technologies. This will be
followed by an introduction to palm oil production methods and technologies that are
currently available and typically utilized in the region’s palm oil mills (POMs). The
ideal substances used for biomass incineration will then be discussed followed by their
chemical composition, properties, and shortcomings during incineration. Mitigation
efforts will be discussed by an account of filtration systems and pollution control
options available to reduce pollutants in the off-gas. Finally a calculation estimate of a
60 megawatt (MW) plant, taking into account the amount of feedstock available from
government owned palm oil plantations, will be employed to estimate whether or not a
60 MW plant could be feasible for the region. A final emission assessment based on the
chemical composition of the byproducts will be related to EU emissions standards
specifically which areas would need to be optimized to satisfy such standards and safely
operate the plant and protect human health and life (“sustainable operation”).
!

5
2. Palm Oil Products as an Energy Source
2.1 Indonesia’s Energy Mix !Due to an expanding demand for energy, Indonesia has become a net energy importer.
In 1962, Indonesia became a member of OPEC but later resigned in 2008 after
becoming a net importer of oil in 2004. Indonesian oil reserves are estimated at 4.3
billion barrels with an additional 3.7 billion potential barrels, which have not yet been
extracted nor explored. This makes up for approximately 0.3% of global oil demand
(Hasan et al., 2012). Recently production has decreased sharply due to lack of
investment for exploration and development. This is offset by the fact that Indonesia has
the largest natural gas reserves in the Asia-Pacific region, 11th in the world consisting of
approximately 107 trillion cubic feet (Hasan et al., 2012). Most of the gas supply;
however, is exported to neighboring countries. Despite these vast reserves, the shift
towards domestic use is hindered by poor natural gas transmission and network
distribution throughout the island. Coal is and remains the cheapest and most abundant
fossil fuel in Indonesia. Indonesia produced 232 million tons of coal in 2009, about
232% more than in 2000. Ninety-five percent of coal is extracted from surface mining
operation (Hasan et al., 2012). Similar to its natural gas reserves, a majority of the
mined coal is exported to other countries (e.g. Japan, Taiwan, China, India, South
Korea, Hong Kong, Malaysia, Thailand, and the Philippines).
Oil, gas and coal contribute to 82% of electrical energy generation as new energy
sources have not been optimized due to high production cost and the government’s
previous subsidy policy on fossil energy (ACE, 2013). The use of crude oil decreased
from 45% in 1990 to 39% in 2009 but at the same time, coal use has increased from 4%
in 1990 to 18% in 2009 (Hasan et al., 2012). When looking at Indonesia’s overall
energy mix (non-electrical), 76% come from non-renewable energies while the
remaining 24% is renewable energy. Biomass is a strong source at 20%. However,
when accounting for electricity generation, 82% comes from conventional fossil fuels,
coal being the main fuel. Renewable energies play a minor role and only contribute 18%
of the share of electricity generation, mostly hydropower and geothermal energies
(ACE, 2013). Indonesia has a large untapped source of hydropower energy and
geothermal energy due to the country’s proximity to the equator. The country has been
exploring these two energy sources as viable alternative to fossil fuels . Biomass, which

6
fulfills primary energy demand from renewables, play no significant role for electricity
generation. The use of biomass is utilized primarily for household consumption in rural
areas (e.g. cooking and heat) (ACE, 2013).
Efficient utilization of renewable energies can be the best alternative to reduce energy
poverty in rural areas. Within developing countries, energy poverty exacerbates overall
quality of life thereby worsening the effects of overall poverty. In Indonesia, the high
cost for electrical grid extension through difficult terrain (e.g. thick jungle areas), may
make such projects economically unfeasible (Borhanazad et al., 2013). By 2011,
Indonesia had 71% grid connectivity and has a goal by 2025 to reach 95% grid
connectivity (ACE, 2013). Indonesia certainly has the capacity to utilize solar and
biomass energy, but these resources are overall, massively under utilized. Photovoltaic
systems, for example, can have a high potential due to (Indonesia’s) equatorial location
(Borhanazad et al., 2013). Common barriers to renewable energy (RE) development for
electricity generation are: high cost of transmission, low electricity demand, low
consumption, and dependence on donors. Issues of RE development fall into one of
three categories: economic, legal and regulatory, financial and institutional issues.
Today, after many legislative changes, various advantages of off-grid renewable
energies are being taken into consideration (Borhanazad et al., 2013). The cost of RE
technology for rural electricity supply is currently simply too costly for the Indonesian
government to afford. Additional developmental subsidies from developmental funds
would be required to further develop RET in the region.
The Indonesian government is cognizant of the potential for RE mix and have taken
positive steps in that direction. Indonesia’s 2007 Energy Law lists a primary goal to
increase the country’s share of renewables to 25.9% of the total primary energy
consumption by 2025. On the supply side they have focused on energy conservation,
intensification, reducing oil dependence, increasing energy supply from non-
nonrenewable to renewable sources and electrification of rural areas (ACE, 2013).
According to the ACE (2013), the current biomass potential stands at 50 GW but its
utilization factor remains low. Recent utilization of biomass is estimated at 1600 MW or
3.25% of the existing potential (ACE, 2013). Installed capacity can be increased via the
small-distributed power programs. New regulations established by the Indonesian
government such as MEMR Regulation No. 4 encourages new energy companies to

7
begin generating electricity, provided it is renewable. Since the regulation obligates the
Indonesian government to purchase excess electricity, this offers the palm oil industries
the opportunity to sell their excess energy. Most utilization of biomass in electricity
generation is distributed power within commercial industries but not for feeding into the
national grid. Even though Indonesia has a large biomass energy generating potential
(inexpensive biomass feedstock and high electricity demand), development of biomass
energy generation has been slow. In contrast to current, sluggish biomass energy
development projects, Indonesia’s Biomass energy policy, as in accordance with
Presidential Regulation no. 5/2006 on National Energy Policy as a basis for biomass
energy development, set the targets for an optimal mix in 2025, including a 5% biomass
electrical energy threshold (ACE, 2013). The main task of EBTKE (New and
Renewable Energy and Energy Conservation) is to formulate and implement policies
and regulations regarding new and renewable energy conservation (ACE, 2013).
Therefore, as Indonesia plans to significantly increase their share of renewable energies,
it is within their best interest to focus on biomass residues.
Biomass is a natural energy source, derived from agriculture crops, residues, and forest
wastes, commodities of plantation, and animal waste. Biomass is one of the only
renewable energies that can be used to produce fuel that is in liquid, solid and gaseous
forms (Hasan et al., 2012). Biomass production in Indonesia is around 147 million tons
per year and is mostly used by rural areas and small industries to provide energy for
cooking, heat, and electricity (Hasan et al., 2012). An industrial sized power plant with
its main purpose of converting biomass products into electrical energy to power a grid
seems promising because of the large amounts of biomass produced every year. Palm
oil crops are the most dominant producers in biomass residue, with an estimated 100
million tons per year of biomass residue. In order to examine the potential of biomass
electricity capabilities in Indonesia, it is first important to analyze the local distribution
of palm oil industries vs. the availability of the PLN grid. 70% of palm oil mills are
located in Sumatra where the electrical grid stands at a connectivity of approximately
75-90% depending on the area (Conrad and Prasetyaning, 2013). Energy production
potential of sugar cane, rice paddy and palm oil residues have a potential of 43 TWH
(Terawatt hours). Utilizing fibers and shell residues from palm oil production might
contribute to nearly 66% of this electricity generation potential (Conrad and
Prasetyaning, 2013). Availability of an electrical grid is the main barrier to the full

8
bioenergy production potential in Indonesia. Were Indonesians were to utilize these
resources, the country would meet their emission reduction target in the energy and
transport sector, in accordance with the National Action Plan for Greenhouse Gas
Reduction (RAN-GRK) (Conrad and Prasetyaning, 2013). Within Indonesia alone,
greenhouse gas emission is expected to grow approximately 3-5% in annual CO2
emission due to its economic expansion and population growth (Conrad and
Prasetyaning, 2013). It is in the interest of Indonesia to increase their RE mix. Since
palm oil production is a dominant industry in Indonesia, increase utilization of the
biomass residues would be one way to promote a sustainable RE mix.
!

9
2.2 Palm Oil production
2.2.1 Palm oil tree planting
In a typical plantation there are approximately 148 oil palm trees planted per ha, in
triangular groups of three, each tree representing one of the three points of a triangle
(Lim, 2010). The distance from tree to tree is approximately 3 meters in length. This
formation tends to maximize the yield of the crop, reducing competition for nutrients
between the trees. The oil palm fruit is harvested after 3 years of initial planting,
reaching a maximum yield at the 12-13th year wherein productivity tends to decline at
the end of the 25th year. The average life expectancy of a palm oil tree is 35 years. After
approximately 35 years, the tree groups, which have declining utility, are then cut down
and the wood sold for lumber. Young trees are then replanted in large blocked areas.
What is harvested from these trees are the fresh fruit bunches found below the palm
fronts. Two of the products that are developed from these fruit bunches eventually
produce crude palm oil (CPO) and crude palm kernel oil (CPKO). CPO originates from
the pressing of the fruit and the CPKO originates from oil extraction from the inner seed
of the fruit. CPO is from the mesocarp fibers, or the yellow oily flesh of the fruit, and
CPKO is from the endosperm, the inner white flesh of the kernel seed (Figure 2-1).
Each individual reddish fruit consists of a seed, surrounded by a soft oily pulp. The oil
is extracted from the pulp of the fruit and can be then made into an edible oil. The
kernel oil, or the oil found in the seed, is mainly used in soap and skin care products
(Shuit et al., 2009). An average medium size palm oil mill processes about 30-60 tons
of FFB per hour, approximately 1,440 tons per day. One mill can produce tremendous
amounts of oil, which equates upwards of approximately 525,600 tons per year. Up to 5
tons of FFB are harvested per acre per year and the average growing area is 30,000
acres, totaling up to 50 trees/acre. Average distance from plantations to mills is about
30-50 km (Kittikun, et. al, 2000). The reddish fruit grows in large bunches that can
weigh between 10-40 kg.
One palm tree occupies 0.0068 ha of land and each tree yields about 150 kg/year of
FFB. The yield of FFB produced per palm tree for 23 years is 3.45 tons (Yusoff, 2006).
One source of biomass residue is produced by pruning of fronds. This process is carried
out in order to facilitate cutting of ripe fruit branches. The annual dry weight of fronds
is 11.6 t/ha. Total dry weight of fronds per palm from pruning is 1.8 tons within the 23

10
productive period years (Yusoff, 2006). During all extraction, most of the palm oil tree
biomass is wasted by open air burning, dumped in nearby areas, or used as fertilizer for
palm oil plantation due to much of the residues’ high nutrient content. An added waste
problem occurs with palm tree trunks. Because of the tree trunk’s high moisture content
of 70%, a freshly chopped trunk cannot be burned immediately. Typically trunks are left
for natural decomposition but this obstructs the re-plantation process. This encourages
the practice of burning tree trunks in open fields (Abdullah and Sulaiman, 2013).
Typically, the harvest of one palm tree contains on average 21% palm oil, 6-7% palm
kernel, 14-15% fiber, 6-7% shell and 23% EFB (Husain et al., 2012). The overall
breakdown from 100% FFB can be seen in Figure 2-2 below. This breakdown
determines the biomass residue energy potential per hectare of the palm oil crop.
Figure 2-1: Oil Palm fresh fruit components (Malaysian Palm Oil Council, 2012)

11
Figure 2-2: FFB components in %. Harvest averages obtained from Prasertan and Prasertan (1996).
2.2.2. How is Crude Palm Oil (CPO) extracted? !Fresh Fruit Bunches (FFB) undergo processing to obtain the palm oil. CPO processing
is both physical and mechanical. Currently there is no chemical utilization of products
in the CPO production. Self-regulated environmental management tools such as life
cycle assessment (LCAs) have been used by palm oil industries where pollution
prevention strategies have been addressed (Yusoff, 2006). Main concerns for pollution
within the industry are the by-products of production, such as empty fruit bunches
(EFBs), palm oil mill effluent (POME), sterilizer condensate, palm fiber (PF) and palm
kernel shell (PKS). One ton of fresh fruit bunches (FFB) consists of about 230-250 kg
of EFB, 130-150 kg of PF, 60-65 kg of PKS, and 160-200kg of CPO. The typical state
of EFB, without a drying process, exhibits a lower heating value (LHV) because of the
high moisture content (Sing and Aris, 2013). High noise levels, water consumption,
generation of high organic content wastewater, generation of large quantities of solids
and air pollution are major issues that typically need to be mediated. Many CPO mills
involved in self-sustaining electrical generation, are insufficient for full regulatory
FFB!
EFB!25%!
Moisture!13%!
Dry!EFB!15%!
Fruit!72%!
Pericarp!53%!
Oil!26.5%!
Fiber!12.5%!
Moisture!13.5%!
Nut!19%!
Shell!7.1%!
Kernel!8.45%!
Moisture!3.35%!

12
combustion, fly ash, and energy conservation requirements in neighboring Malaysia
(Lim, 2010). As stated previously, the annual production volume of biomass residues
exceeds the amount required for the conversion process. This surplus is discarded in
open areas or burnt, generating biomass smoke with pollutant particles and volatile
hydrocarbons. POME ponds emit methane gas estimated to be 24 times as detrimental
to climate change in compared to CO2.
Crude Palm Oil (CPO) production is as follows: (Figure 2-3)
1) Transportation: Fresh fruit bunches reach the processing plant soon after
harvesting to avoid fatty acid production by natural enzymes in the mesocarp.
They are then unloaded on a ramp and placed into containers approximately 2.5-
3.0 tons in size.
2) Sterilization: Batches of 20-30 tons of FFB capacity (approximately 7-10
containers) are exposed to steam (120-130˚C) and pressure (2.5-3.2kg/cm2) for 1
hour.
3) Stripping process: Sterilized bunches are emptied into a thresher where fruits are
separated from the bunch. A rotating divesting machine separates sterilized oil
palm fruit from the sterilized stocks. This produces the EFB consisting of 230-
250 kg/t of FFB.
4) Empty fruit bunch (EFB) incineration: EFB fall into a collector, incinerated, and
waste products used as fuel and ash for crop fertilizer.
5) Digester: separated fruits are carried on and mechanically treated and 80˚C
water is added.
6) Pressing: A screw-type press is employed and extracted oil is collected and
collected for further purification.
7) Purification: Consist of many processes including screening, settlement,
treatment of settlement tank, centrifuging, drying and cooling.
(Kittikun et al., 2000)
!

13
2.2.3. What are the Biomass products formed in CPO and CPKO production? What is done with these products?
Biomass products are derived from forestry, purpose-grown agricultural crops, trees,
organic waste, and effluent products that are of agricultural, agro-industrial, and
domestic origin. According to Figure 2-3, the varying biomass wastes from palm oil
mills include: EFB, PF, palm kernel cake (PKC), PKS, sludge cake (SC), and palm oil
mill effluent (POME) (Figure 2-3). Palm cake waste is a mixture of nuts and fiber. The
cake is then fed into a separator wherein the waste fiber and shells are transported to the
boiler and utilized as fuel. The kernels are sold to kernel oil mills. PKS are the residues
remaining from the outer layer of the nut that remain at the CPO mill site. Therefore the
biomass which can be potentially utilized from FFB processing consists of: PF, PKS,
EFB, and POME. Awareness of these waste components provides a better
understanding of current electricity generation practices of POMs. It is important to note
that biomass products can be used to generate electricity through their incineration.
Figure 2-3: Biomass residues produced from the milling process. Processing obtained from Prasertan and Prasertan (1996).
FFB#
Sterilizer(
Thresher(
Digester(
Screw(press(
Fruits'
Oil'mash'
Steam((140(°C,(50(min)(
EFB(
Water((80(–(90(°C)(
Condensate(
Decanter( Cyclone(
Nut(cracker(
Pack(for(kernel(
Oil(mill(
Solid'
Nut'
Kernel'
PPF(
PKS(Purifier(
Cake(
Liquid'oil'Effluent'
Treatment(
ponds(
Palm(oil(milling(process.(( ( ()((Process:(((( ( ()(waste(

14
A brief description of each component during the processing of Empty Fruit Bunches
follows:
Empty Fruit Bunches (EFB)
During the FFB sterilization process, the EFB results in a moisture content of 60%
(Prasertsan and Prasertsan, 1996) thus an unsuitable fuel for electricity generation.
Some POME effluent may be used as organic fertilizer. Since disposal of EFB causes a
high land-fill disposal cost, the EFB is incinerated. Resultant particulates and gas
emitted can cause air pollution in nearby communities. The burning of 1 ton EFB
produces 4 kg of ash. This ash makes for very good fertilizer. However, because of this
high moisture content of the material, it tends to emit ‘white smoke’ upon burning and
pollution. This can be mediated by the EFB undergoing a shredding and dehydration
process to reduce the moisture content below 50%. The heat value standing at
approximately 8.2 MJ/kg at 50% moisture. Empty Fruit Bunches can be used as
fertilizer to improve foliar nutrient levels and has been shown to increase yields by 8-
23% (Yusoff, 2006). Moreover, when using EFB as fertilizer, approximately 683 MJ
per palm tree is saved from the production of chemical fertilizers when using palm
residues as a replacement (Yusoff, 2006).
Palm Fiber (PF)
PFs are the fibrous interior of the palm oil fruit that has been squeezed for the
production of CPO. It is the yellow interior of the fruit that is dried out after pressing
occurs (Figure 2-1). PF has a high moisture content, ranging from 10-40% water
content. It is not as high as EFB but before incineration, PF needs to have pre-treatment
to reduce the water. When PF is removed from processing, the moisture content can be
upwards of 40%+ creating a lower heat value due to its moisture content. What has been
found is that PF, after pre-treatment, is a good combustible material. The lower heating
value without drying and a moisture content of 65% a heating value of 5MJ/kg. Drying
the PF increases the heating value to 18MJ/Kg (Yusoff 2006). When electricity is not
produced within the POM plant, only about 30% of this residue material is used
commercially. Therefore, factories consider 70% of PF a waste product (Kittikun et al.
2000). In fact, PF has a high potential as feedstock for biomass electricity production.

15
Palm Kernel Shell (PKS)
PKS are what remains of the shell once the inner nut has been removed to produce
CPKO. PKS is an energy intensive substance. The lower heating value of the dry shell
is 21 MJ/kg (Husain et al., 2003) and a lower ash content is in PKS compared to PF.
Proper mixing of PF and PKS is essential because incineration of PKS alone may lead
to incomplete burning and results in black smoke if the boiler is operated at lean flame
conditions or too low temperatures respectively (Sing et al., 2013). Similar to PF, PKS
also has a high potential to be used as feedstock for electricity generation.
Palm Oil Mill Effluent (POME)
POME is the wastewater that results from the milling process and produced during the
sterilization stage of FFB milling. There are three major sources of POME wastewater,
all of which are byproducts derived from the sterilization process, namely sterilizer
condensate (17%), decanter or separator sludge (75%) and hydrocyclone water (8%).
The POME is treated via anaerobic digestion in a series of ponds and is anaerobic due
to the sheer amount of sludge (Kittikun et al., 2000). The most common usage for this
substance, after effluent treatment is fertilizer agricultural water supply. Substances
derived from a drying process of POME wastewater can be used for animal feed.
(Prasertsan and Prasertsan, 1996)
Research is currently being conducted on POME treatment, pyrolysis of oil palm shells,
re-use of chars from oil palm waste, solid biofuel production from biowastes,
briquetting of palm PF and PKS, POME as a source of bioenergy, and ethanol
fermentation from oil palm trunk (Abdullah and Sulaiman, 2013). While the
manufacturing process of palm oil produces a large quantity of solid and liquid waste
(including: EFB, PF, PKS and POME), currently PKS and PF wastes are used as fuel
for steam production to generate electricity. These biomass residues are used to generate
electricity in palm-oil mills itself and in some cases to power local settlements
associated with POMs. EFBs also have a potential for power generation but are not
typically used due to the white smoke that it produces upon combustion (Abdullah and
Sulaiman, 2013). CPO mills achieve their energy demand, using low-pressure boilers.
The PF and PKS extracted from 60 FFB tons per hour mill within a 10,000 ha
plantation can generate enough energy to be self-sustaining and supply a surplus of
16
electricity. Almost all palm oil mills generate their own heat and power through a co-
generation system (Abdullah and Sulaiman, 2013). High-pressure steam enters through
a backpressure steam turbine to generate the electricity necessary for mill consumption.
Typically PF and PKS are mixed in a 60% PKS and 40% FB creating the optimal ratio
for solid combustible fuel. Other ratios are also used depending on the system as well as
the availability of this resource. One ton of FFB/h, produces 140 kg of fiber and 60 kg
of shell per hour. Typically 30 tons of FFB/h in one mill can produce 4200 kg of fiber/h
and 1800 kg of shell/h (Mahlia et al., 2001). These numbers would fall into the range of
what has been reported (Prasertan and Prasertan 1996) and observed (Figure 2-2).
Additional research has been done on the production of briquettes from PF and PKS as
fuel for domestic stoves. These briquettes were mixed in a 60% PKS and 40% FB ratio,
and pressed with a binder for solid fuel production from biomass residues (Sing and
Aris, 2013).
17
2.3 Current technologies in use !Analysis of an oil palm tree’s products, through a 35 year productive era, the tree
produces mostly biomass wastes. A 1998 study of 90 million tons of oil palm fruit
produced, 43-45% is waste in the form of EFB, shell, and fiber; corresponds to 40
million tons of waste biomass composed of EFB, shell, and fiber (Abdullah and
Sulaiman, 2013). This abundant waste biomass has the potential to be used for
renewable energies and value added products. The current levels of biomass is
underutilized with the potential to produce electricity, heat, and biofuels. Using oil palm
biomass as an alternative to replace in the form of bio-fuels (ethanol, methanol, bio-oil,
and bio-diesel) can replace fossil fuels. Such thermochemical processes using palm oil
tree derived biomass include: direct combustion utilizing excess air, biomass combined
heat and power (CHP), biomass co-firing, pyrolysis using no air, gasification using
partial air, biomass integrated gasification combined cycle (BIGCC), liquefaction, and
co-firing using a biomass/coal mix (Conrad and Prasetyaning, 2013). When
transitioning into biomass combustion systems, co-firing, or replacing part of fossil fuel
supplied to a power station provides renewable alternatives. This is particularly relevant
for supplementing coal-fired plants. Nevertheless, biomass typically should not exceed
10% in these co-firing systems or operational requirements will not be met (Conrad and
Prasetyaning, 2013). Due to Indonesia’s abundant coal supply, this mixing could be a
feasible and more sustainable option to utilize waste biomass to reduce both coal
consumption and the environmental impact of strip mining.
Current research has determined that the use of biomass in electrical generation
mitigates the impact of anthropogenic emissions from using fossil fuels. Comparing
CO2 emissions from electrical power plants using coal or oil to generate electricity,
average electrical production using fossil fuels produces around 1100g of CO2 per kWh
whereas sustainable grown biomass produces 16g of CO2 per kWh (Yusoff, 2006).
Approximately 15 million tons/year of useable biomass for electrical generation is
theoretically available from the palm oil industry in Indonesia. The feedstock amounts
to approximately 29,475 GWh/year, 25% of generation potential of the Indonesian
plantations (Conrad and Prasetyaning, 2013). As has been stated, the highest
combustion potential stems from fiber and shell due to their high calorific values. The
electricity potential from the palm oil industry is higher than any other agroindustry in

18
Indonesia. The power generation potential from PKS and PF (the most useable of the
two materials for a biomass on-grid plant) is equivalent to 14,748GWh/year (Conrad
and Prasetyaning, 2013).
Oil palm biomass: EFB, PF, and PKS can be used to produce steam for processing
activities and for generating electricity. Normally EFB is used for fertilizers and, while
EFB have a potential for electricity generation, it is a demanding substance to work with
due to the higher ash content after combustion, as well as its high moisture content that
results a white smoke disruptive to surrounding areas. Hence, the high moisture content
of fresh EFB, consisting of over 60% humidity, without an additional drying process,
makes the substance a poor fuel. This would explain why the shells and dryer parts of
the biomass fibers are used for boilers, a cheaper, better energy source for POMs
(Abdullah and Sulaiman, 2013). Most components, especially EFB, must be pretreated
before incineration. One example includes shredding and a process that reduces
moisture content. In Malaysia alone there are over 300 palm oil mills operating with
self-generated electricity from biomass (Shuit et al., 2009). Typically 60 tons FFB
(fresh fruit bunches) are processed per hour in a mill with normal operation at 20 hours
a day. While PKS amounts to 6%-7% of residue, only 30% of the total PKS, or 1 ton/h,
of which is dry enough for boiler fuel and 14% of PF or 8.4 ton/h. Power requirement
for a mill is 15-20 kW per ton FFB or 1020 kW for 60 tons FFB per hour mill. The size
of the generator is typically 1.2 MW (Yusoff, 2006). For each kg of palm oil produced,
electricity consumption amounts to 0.075-0.1 kWh and steam demand is 2.5 kg. Steam
to electricity is a ratio of 20 to 1 and could be met by burning 0.3-0.4 kg of waste, with
a boiler efficiency at 70% (Abdullah and Sulaiman, 2013).
Larger POMs already produce energy from renewable oil palm wastes to avoid the
additional costs of fossil fuel (Conrad and Prasetyaning, 2013). Shells and fibers can
supply a surplus of energy to meet the mill’s requirements while using low pressure in
addition to inefficient boilers (Abdullah and Sulaiman, 2013). Maximization of this
process could potentially allow these POMs to increase energy efficiency and
subsequently reduce costs. The system typically requires a combustion system (boiler
and furnace) in addition to a steam turbine and generator (Shruit et al., 2009).
According to various studies, all palm oil mills in Malaysia and Indonesia utilize a
small water tube boiler (standard D-Type boiler). These boilers can processes 30-60

19
tons FFB/h (Mahlia et al., 2001). As shown in figure 2-4, direct-fired systems require
burning of feedstock to produce steam that is then captured by turbines, spins a
generator, and eventually creates electricity. Diesel fuel is utilized as back up systems in
low peak feed-in periods, such as low yield harvesting periods in the off-season. PKS
and PF are used in the process in existing oil palm factories by direct burning or
combustion, then captured to spin an electric generator. PF and PKS contains small
quantities of oil and are therefore used as boiler fuel to generate steam for the mill
(Sumathi et al., 2008).
Figure 2-4: Diagram of powerhouse typically found in a palm oil mill (Yusoff, 2006) While increasing electrical efficiency and biomass feedstock handling, it would be no
surprise that many POMs could make a transition from generating electricity to power
themselves to powering a nearby settlement thereby feeding onto the grid and
increasing the proportion of RE used in these settlements. This option is to be
determined by distance of the mill to the medium voltage grid. Indonesia’s government-
owned electricity corporation, Perusahaan Listrik Negara (PLN), currently has a
monopoly on electricity distribution in Indonesia and is currently open for negotiations
to bear the cost of grid connection. According to the Minister of Energy and Mineral
Resources, MEMR Regulation No. 4 (2012), PT PLN has an obligation to purchase
electricity from small to medium scale renewable energy independent power producers
(IPPs) with up to 10 MW in capacity. It is also required to purchase excess electricity

20
generally produced (e.g. state electricity enterprises, private enterprises, etc.) (ACE,
2013). As mentioned earlier, this would encourage palm oil companies to begin selling
excess energy produced within the mill during processing.
Although this is a good sound approach maximize excess electricity production, POM
located in remote locations require a provision for the electrical connection.
Additionally, the size and processing capabilities of the POM’s are important and
relevant to the potential of electricity generation and export. In order to achieve export
levels, a typical POM should process a minimum of 30 tons FFB/hour in order to
generate its own electricity. This should be no problem as currently only 3-14% of
POMs have a capacity lower than 30 tons FFB/h (Conrad and Prasetyaning, 2013).
However, the smaller the size of the plant, the more waste is produced proportional to
the harvest yields of the plantations. Luckily, most Indonesian mills have a capacity on
the upper limit, 60 tons FFB/h, meaning that these POMs have the capability to produce
electricity excess utilizing biomass produced from the milling process. Electricity
generation via POMs pose as good opportunities for development because POMs, out of
necessity, had to establish localized grid connections and are experienced with biomass
combustion and cogeneration. The typical capacity of a plant without exporting
additional electricity is up to 5 MW but feeding surplus power to the electrical grid is
limited due to the remoteness of many POMs (ACE, 2013). All the same, as biomass is
burned to produce electricity via steam turbines, these turbines can have a typical size
ranging from 1 to 100 MW (Conrad and Prasetyaning, 2013). Plant efficiency of
electrical production typically ranges between 30-34% and potentially up to 40%. These
factors, of course, depend on feedstock quality, as well as the size of the power plant
(Conrad and Prasetyaning, 2013). A good solution to the remoteness of these POMs
would be to have large storage facilities that would not only facilitate the processing of
substances with higher moisture contents, such as PF and PKS, but also allowing
transport of the biomass residues to a biomass plant near an urban area with high grid
connectivity. Storage facilities could be coupled with drying capacities, thereby
increasing heating values of the feedstock available for biomass plants.
!

21
2.4 Chemical composition of biomass feedstock
2.4.1 Chemical composition of biomass substances and associated problems
The most commonly used substances for POM electricity generation are PF and PKS.
These two substances are used for steam boilers. Sole incineration of PKS is
problematic and can include dark smoke and the transference of partially carbonized
fibrous particulates from incomplete combustion. The palm oil milling process does not
utilize excess chemicals in processing. Products and by-products originate directly from
oil palm trees in which facilitates chemical analysis of the substances themselves rather
than external factors typically found in other crops (e.g. chemical fertilizer use)
(Kittikun et al., 2000). The molar balance used in the chemical analysis is related to
carbon, hydrogen, sulfur, oxygen, and nitrogen, and non-combustible ash elements. In
the combustion of palm oil wastes, the chemical composition of the substances are very
much relevant to not only the amount of energy produced through incineration but to
the behavior of the substances during combustion and to the pollutants that are formed
in the off gas and ash. The carbon, hydrogen, and oxygen content of Palm Oil Biomass
Residues (POBR) is relatively similar to firewood from spruce and beech trees, but with
considerably higher nitrogen and ash contents, as demonstrated in Table 2-1.
Table 2-1: Overall chemical analysis of PF, PKS, spruce trees, and beech trees. Chart data from from Mahlia et al. (2001), Permatasari et al. (N.D.), Harimi et al. (2005), Thai case study (Wittmayer, 2004), and Lasselsberger (2001)
What can also be observed in Table 2-1 is that PF has a higher nitrogen content than
PKS, which is most commonly found in fruit and bark. PKS, as seen in the overall
average column in Table 2-1, has a higher carbon and lower oxygen content than PF.
This data is based on water and ash free results, the sum of elements totaling to 100%.
The higher carbon and lower oxygen contents for shell than fiber is indicative of a

22
higher calorific value. The exception of this observation being the Permatisari et al.
(N.D.) data wherein PKS has a lower carbon content than PF, which appears to be quite
unusual. Table 2-2 demonstrates the various mixes of PKS and PF utilized in seven
different POMs. In plant 7 in particular, where the mix is at 50/50, PF to PKS ratio,
PKS is shown to have nearly double the calorific value of PF. This can be explained by
the high humidity in PF. The observable ash content is typically higher in fiber than in
shell that creates issues with the presence of PM2.5 and PM10 in the off gas during
incineration. Additionally, PF has a higher and quite variable moisture content that
would potentially produce white smoke and additionally reduce the potential energy
production of the substance itself.
Table 2-2: Analysis of seven POMs, the ratio of PF and PKS used in biomass mix, and their respective calorific values used for incineration – F and S individual data in kJ/kg, sum in MJ/kg (Husain et al., 2003)
While utilization of POBR in RET can lead to significant decreases in greenhouse gases
(GHGs), most notably CO2 emissions. Incomplete combustion of biomass as seen in
experiments produces dioxins and bio-accumulative chemicals (persistent organic
pollutants, POPs) (Hosseini and Mazlan, 2014). The dioxins are formed in boilers and
open burning and reduced effectively by avoiding lean, oxygen deficient combustion
conditions possible in fluidized bed combustion.

23
Another problem for POBR combustion is the high ash content of the fuel and the
chemical composition of the ash containing high levels of alkaline and earth-alkaline
elements (K, Ca) and silicon (Ninduangdee and Kuprianov, 2015). The ash content of
POBR is up to a factor of 10 higher than woody biomass from forestry (Table 2-1).
According to Hosseini and Mazlan (2014) slagging and bed agglomeration emerges in
the fluidized bed combustors when temperatures increase above 575˚C. To determine
the use of POBR in boilers, chemical characteristics must be taken into consideration
not only to determine potential energy utilization but also to undertake proper pollution
mitigating measures. Primary pollutants formed in combustion are particulate matter
(PM), nitrogen oxides (NOx), sulfur oxides (SOx), hydrocarbons (HC) and carbon
monoxide (CO). During incomplete POBR combustion at lower temperatures or under
oxygen deficient conditions, carbon monoxide, volatile organic compounds (VOC), and
polycyclic aromatic hydrocarbons (PAH) are generated. In addition, a fluctuating lower
heat value (LHV), or net calorific value (NCV) of POBR, creates problems with flame
stability and formation of these compounds (CO, VOC, and PAH). What has been done
in various experiments was that blending POBR with fossil fuels, most notably coal can
effectively reduce many of the flame stability and pollutant problems.
In addition to the emissions formed, the chemical properties of POBR off gas and ash
may also cause issues of fouling, slagging, and corrosion. The incineration of POBR
also produces residues and ash that is found on the surface of heat transfer equipment
known as slagging. This is molted or partially fused deposit on chamber walls and often
occurs when the soften ash is not cooled down to solid form. Sodium and potassium
content in POBR may decrease the melting point of ash, thus creating more ash
deposition and fouling of the boiling tube. This phenomenon is known as bed
agglomeration typically found in fluidized bed combustion (FBC). Bed agglomeration
is a major problem when burning biomass fuels with high alkali metal contents in
fluidized-bed combustion systems. When combined with sulphur, chlorine, silica and
phosphorus, low-melting compounds or mixtures are formed and are deposited on the
ash particles forming a sticky glue bonding the particles together (Ninduangdee and
Kuprianov, 2015). Therefore in biomass conversion, the agglomeration is related to a
higher potassium, chlorine, and sulfur content in fuels that enhance the potential for bed
agglomeration. Another physical process that typically occurring in the incineration of
POBR is corrosion, or metallic deterioration due to its interaction with its incineration
24
environment. Molten phase corrosion, solid phase corrosion, and gas particle corrosion
are the common issues with POBR boilers that have been frequently observed (Hosseini
and Mazlan, 2014).
The products of combustion are related to these elements and important especially in
terms of the temperature and excess air used during incineration. According to most
experimental incineration tests, what is most relevant is the operating temperature in an
incinerator. Operating flame temperature is determined under adiabatic or near-
adiabatic conditions, namely an assumption that combustion is taking place with
minimal heat loss to the surrounding environment (Harimi, 2005). There is a strong
dependence on excess air requirement and the lower heat value of the waste.
Knowledge of these incineration characteristics allows preventative measures to be
undertaken to reducing pollutants in the off-gas, as well as bed agglomeration and
corrosion of equipment.
!

25
2.4.2 Preventative pollutant measures !For the use of palm oil biomass residues for electricity generation for communal
electricity generation, a range of issues have to be considered.
• Physical issues, such as methods of storage, handling, transport, humidity content
control, and size requirements (e.g. chipping of the chunks) all play a role in the
thoroughness of combustion.
While PKS has low moisture content, PF material can contain moisture from
approximately 10-40% thereby decreasing overall energy output of the substance
and issues during incineration, emitting environmentally harmful a white smoke.
The high moisture content of POBR makes the collection and transport of this
product very expensive. If not given the right attention, the conservation process
could be deleterious to this viable biomass. Improper on-field storage results in
material loss and increase moisture of the substances cannot be controlled.
Additional concerns are the formation of spores and fungus that can spoil the
material further reducing its overall utility. Storage of POBR can increase the cost
up to 10-20% (Hosseini and Mazlan, 2014). Therefore storage facilities should be in
close proximity to biomass power plants in order to mitigate transportation costs.
The drying process can be facilitated by trapping waste heat and reduce
decomposition from spore and fungal formation. What is recommended is an initial
drying of the PF substance before mixed with PKS. It is important to remember that
energy facilities located near palm oil mills provides huge amounts of low-cost
POBR.
• Incomplete combustion may lead to emissions of soot and associated pollutants,
such including polycyclic aromatic hydrocarbons, dioxins, phenols and gaseous
indicators of incomplete combustion (e.g. CO, VOC, and aldehydes).
To ensure complete combustion, incineration systems that are recommended are
fluidized bed combustion (FBC) systems and staged combustion systems. Typically
a FBC system is dependent on a variety of operating conditions, including but not
limited to: temperature, excess air, staged air, fuel feed rate, and fuel properties. It

26
utilizes a continuous stream of air to create turbulence in a mixed bed of fuel,
generally consisting of inert materials and coarse fuel ash particles. Temperatures of
operations range between 800-900˚C. This mixture ensures complete combustion of
substances (Permatasari et al. N.D.). FBC is ideal in situations where POBR has a
high moisture content and the fuel flow is relatively high. Temperature profiles
decrease with FBC height. CO emissions are lower for staged air combustion rather
than for the non-staged air combustion (Permatasari et al. N.D.). In FBC, emission
formation as well as fluidization of ash formulates a serious issue. Increasing
secondary air decreases distributions along FBC. This effectively reduces the flame
temperature and resistance impacting the air velocity that allows particles to carry-
over. It was found that palm shell emission decreases 30% and fiber at 20% at
secondary air combustion (Permatasari et al. N.D.). Increasing air staging also
increases the combustion efficiency and effectively reduces CO emission from FBC
(Permatasari et al. N.D.).
• Physico-Chemical issues originating from the alkaline ash-constituents causing low
melting points with effects of slagging and bed agglomeration at higher combustion
temperatures. The chemical properties of POBR off gas and ash may also cause
issues of fouling and corrosion.
With respect to a controlled fuel feeding system, with careful utilization of selective
bed materials, bed agglomeration may be prevented. Typically, bed materials exhibit
time-domain changes in physical and chemical properties (Ninduangdee and
Kuprianov, 2015). Removal of slag may be done by leaching the fuel with water
thereby decreasing volatilization at temperatures higher than 575˚C. Higher calcium
and magnesium contents in biomass fuel can mitigate bed agglomeration. Additives
such as limestone bauxite, magnesium oxide, and kaolinite generate high melting
points for alkali compounds. Hosseini and Mazlan (2014) found that additionally
using ferric oxide and dolomite can also be effective in the use of alternative bed
materials. This results in an overall decrease of deposit formation. Typically after a
few hours of operation, an ash layer of potassium develops and agglomerates are
formed. A presence of low-temperature-melting of phosphorous and potassium or
silica from calcium and sand are formed (Hosseini and Mazlan, 2014). It is
recommended to implement an early agglomeration recognition system (EARS) to

27
predict these phenomena 30-60 minutes in advance; however, a boiler with a co-
combustion system can effectively eliminate the agglomeration.
• The sulfur, nitrogen, and ash content of the fuel may lead to elevated emissions of
SO2, NOx and fine particles.
When referring to NOx, HC, and CO emission mitigation, a staged FBC system is
most ideal. SO2 emissions become negligible due to the high alkalinity of POBR.
POBR burning at higher excess air resulted in lower peaks of CO and HC. A
secondary reaction creates a catalytic reduction of NOx and CO of the particles and
homogeneous reactions of NOx with light hydrocarbon radicals, resulting in a
reduction of formed NOx thereby forming relatively low NOx emission from
combustion (Ninduangdee and Kuprianov, 2015). NOx emissions exhibit opposite
effects with excess air. This relates to the role of CO and HC to NOx reduction. To
reduce NOx emissions, excess air of combustion can be controlled at a minimum
possible value, but also ensuring that CO emissions at a level above national
emission limit for pollutant. According to laboratory experiments conducted by
Ninduangdee and Kuprianov (2015), highest levels of CO and HC emissions are at
peak at 20% excess air thereafter decreasing with increased air input. When using
the materials, 60% excess air is ideal for dolomite and limestone and 40% is optimal
when using aluminum (Ninduangdee and Kuprianov, 2015). Increasing air in a
specified range, combustion-related heat loss also decreases significantly. FBC can
be operated with high efficiency with acceptable emissions of both CO and NOx
while at the same time maintaining HCs at appropriate levels (Ninduangdee and
Kuprianov, 2015). During experiments utilizing dolomite/limestone, a generation of
fine bed particles carried over from the combustor. A continuous substitution of bed
particles is required. Eventually, multi-cyclone dust collectors are necessary to trap
particulates that carry over from the combustor.
!

28
3. Electricity Generation Model Study
3.1 Considerations for model feasibility !Biomass incineration has the potential to reduce fossil carbon emissions via the use of
POBR as compared to the use of fossil fuels. This is a key to help prevent further global
warming (Shuit et al., 2009). There are three major factors that must first be taken into
consideration before considering the model calculations:
• Theoretical biomass feedstock (biomass available)
• Electricity generation potential and closeness to grid
• Technical capacity (technology used/available, feedstock type-chemical
composition)
The theoretical biomass and potential electricity generation can both be calculated
together as they do have an interlinked relationship between biomass feedstock
availability and amount of energy produced by incineration of the feedstock. Technical
capacity will have to be considered based on the chemical composition of the feedstock
and its behavior during incineration including the technologies necessary to mitigate
pollution, agglomeration, and machinery depreciation. Specialization will also have to
be considered as operations of a boiler, specifically a fluidized bed combustor, can pose
challenges due to POBRs chemical and physical consistency.
Much research has been done in Malaysia on POBR electricity generation. Just as
Indonesian palm oil plantations, Malaysia utilizes POBR for their POMs’ own
electricity production and consumption on plantations. They also calculate feasibility of
biomass usage to power nearby settlements and urban areas. In Sabah, a region of
Malaysia, which has a high concentration of palm oil plantations and other agricultural
industries, the total electricity generated using biomass waste is 3,300 GWh per year.
Only 5% of the total available POBR are used for the electricity generation. The 95%
that is not utilized is generally scattered around the palm oil plantation (Lim et al.,
2014). In Malaysia the cost of transporting biomass waste from plantations to power
plants is relatively high, indicated by Lim et al. (2014) from the Malaysian Industrial
Development Authority (2005) at RM0.20 per ton per kilometer, or 0.5 Euros.
Consequently, locations must be determined that are close enough to POMs to receive
and process biomass feedstock for usage in power facilities and keep transportation cost
to a minimum. Potential capacity of biomass power plants due to the plantations high

29
feed availability of POBR alone, is estimated at nearly 500 MW in Sabah (Lim et al.,
2014). Additionally, a grid connection is essential in determining the viability of power
plants. POBR plants must have the ability to feed the electricity produced onto an
electrical grid.
Utility maximization considerations that arise in Malaysia are certainly transferable to
the Indonesian palm oil industry. Because Indonesia is the world’s leading producer in
palm oil, its overall total level of production is greater than Malaysia implying that
POBR potentials are also at higher levels. Indonesia’s RET research and development is
emerging and new information on feasibility of POBR potential installation capacity is
gaining significance because of the country’s motivation to increase their share of RET.
Indonesia’s national energy policy, announced in October 2014, will increase RE in the
national energy mix to at least 23% by 2025 and 31% by 2050. Climate change has
adversely affected the palm oil crop growth in important agricultural regions such as
Sumatra. Agricultural yields have also been decreasing due to frequented El Niño and
La Nina events, exacerbating both drying and flooding trends in the region.
Other major research studies biomass produced from other agricultural goods such as
sugar cane, rice paddy, and other notable crops such as corn, rubber, and cassava.
According to Indonesia’s government statistics, Bandan Pusat Statistik (BPS), palm oil
(of FFB origin) consists of nearly 41% of the total agricultural commodities produced in
Indonesia, a demonstration of the sheer importance of the crop to the country as well as
its biomass potential for RET (Conrad and Prasetyaning, 2013). With this new emerging
interest in RE, Indonesia is open to new measures that would not only enable the
country to increase market competitiveness in energy production, but also use cleaner
and more sustainable technologies to mitigate the effects of GHG issues.
Since more than 70% of CPO production is located in Sumatra, a well interconnected
grid is available in the region. In general, the electrical grid is concentrated in urban
areas such as in the city of Medan, the location of Northern Sumatra (Sumatra Utara).
Hence, a pilot plant appears to be the most ideal location to begin such a POBR pilot
plant (Conrad and Prasetyaning, 2013). There are three options for the size of biomass
plants, a small plant, approximately <5 MWel generation capacity, a medium sized plant
between 5-19 MWel, and finally a large sized plant with a capacity of >20 MWel. The

30
following considerations will be performed for a larger biomass power plant (BPP) of
around a 60 thermal megawatt (MWth) capacity or about a 21 electrical megawatt
(MWel) capacity, assuming an efficiency of 35%. This would equate to a larger biomass
power plant in the EU, there is technological know-how and experience with plants of
this size, and a large amount of POBR potentially available in the Sumatra Utara region.
Assuming that the model only takes into account the use of PF and PKS materials and
not a co-firing plant, it is important to appreciate that the total feedstock may exceed the
feedstock capacity amount of the BPP, a smaller pilot plant would ensure a safer
investment that would improve on shortcomings and provide a model of operating
procedures for future larger potential plants.
Figure 3-1: Sumatera Utara region (Google Maps 2015).
Although the MW potential is significantly higher due to the large abundance of
feedstock, many developed countries have BPP to generate electricity for households
(e.g. Francescato et al., 2008). An additional potential is to export these materials to
other countries interested in POBR incineration. Indonesia may have this same capacity
to use POBR at a larger, commercial scale to produce steam for electricity generation.
As regional technological know-how develops, a heat to cooling system can be
implemented to provide cooling in the region as well. The ideal maximization of
efficiency of biomass electricity generation is typically found in a heat and power co-
generation (CHP) system. With minimal use of household and district heating in
tropical areas such as Indonesia, wherein temperatures rarely fall below 25˚C, for now

31
we will consider solely electricity generation. As such, efficiency stands at a maximum
of 30-40% utility of electricity generating potential from POBR. As POMs already
utilize the residues for their own processing, many of these plants are not only already
energy self-sufficient, but demonstrates that these POMs have the technological know-
how and experience of dealing with POBR during incineration and subsequent electrical
generation process. In order to determine how much surplus a POM produces, the
subtracted total amount of energy necessary for the POM or the plantation itself from
the total amount of electrical energy produced determines the remaining surplus energy
that could be transported onto a grid to a nearby city or settlement.
For the model itself, the amount of biomass feedstock availability will be estimated
utilizing data provided by PT Perkebunan Nusantara (PTPN IV). PTPN IV is a
government owned palm oil plantation company established at the beginning of the
Asian economic crisis as part of the state owned enterprise restructuration measures.
The selection of a community-owned palm oil plantation company facilitates the
transport of electricity onto the state-owned grid (PLN), it provides the government with
the opportunity to improve their own systems, and supports RE measures. From the
determination of this feed stock quantity, the amount of PF and PKS produced will be
determined followed by the energy potential of this substance and how much feedstock
is available vs. how much is needed for a 60 MWth power plant. The model will assume
that PF and PKS substances have been dried to operable conditions, most importantly
that there is a lower moisture content. The amount of energy needed for POM
operations will be subtracted from the total energy amount thereby providing the
amount available to feed onto the grid.

32
3.2 Calculation of biomass feed stock availability !Sumatra plays an important role in the development of oil palm industry, approximately
1,000,000 hectares (ha) worth, an area equivalent to 15.7% of the total area of the
region (CAREPI, 2009). Private plantations consist of 377,337 ha, community
plantations 367,741 ha, and government owned plantations (PTPN IV) 278,272 ha
(CAREPI, 2009). The model’s focus is based on government-owned plantations in the
region, namely the PTPN IV plantation area total, 278,272 ha will be considered for the
model. According to Hosseini and Mazlan (2014), the approximate number of mature
vs. immature trees fall into an estimated, average ratio of 85% mature to 15% immature
trees on a palm oil plantation, meaning that about 85% of the trees are ready and able to
be harvested for their FFB fruits. We determine 85% of the 278,272 ha as harvesting
potential.
278,272!ha! ∗ 0.85 = !236,531!ha There are approximately 236,531 ha of harvestable land on the PTPN IV owned
plantations.
Figure 3-2: Immature oil palm trees (MacDonald 2015).

33
From this we determine the amount of fresh fruit bunches produced per year. According
to Yusoff (2006), one tree occupies an estimated 0,0068 ha of land and each tree
produces about 150 kg of FFB per year. We can determine the amount of FFB bunches
produced by dividing the total harvestable area by the area a typical palm oil tree
occupies to obtain the approximate number of the estimated total number of trees in the
plantation, and multiply that number by the amount of FFB produced per tree per year.
236,531!ha!× !150kg/yr! FBB0.0068ha × 1!ton1000!kg ≈ 5,217,600!t!FFB/yr!
Idealistically speaking a more accurate account of the exact number of trees would be
best, however, considering that this data is not readily available to the public, we have
determined that 5,217,600 tons of FFB are produced per year on the PTPN IV
government plantations. After the processing of FFB, the amount of PF and PKS
residue waste that is typically remaining after production, as determined by Prasertan
and Prasertan (1996) and seen in Figure 2-2, is about 12.5% PF and 7.1% PKS. We
multiply the total amount of FFB potentially harvested in a year by these percentages to
note the feedstock yield from production. Two separate calculations will be done to
show the approximate mix of the two residues.
0. 125 5,217,598!t!FFB/yr ≈ 652,110!t!PF/yr
0. 071 5,217,598!t !!"!" ≈ 370,449!t!PKS/yr
Even though the amount of fiber and shell produced per year has been determined, the
processing mill potential limits the amount of feedstock produced on an hourly basis.
According to Mahlia et al. (2001), a typical medium-sized mill can process 30-60 t of
FFB per hour. Assuming that operation hours are at 7300 h/yr, (about 20 h/day
operation) the production output of one mill can be up to 220,000-440,000 t of FFB per
year. This time also accounts for the time if machinery malfunctions and requires
replacement. With this in mind, it is important to determine the amount of potential
feedstock available per hour to determine how many mills it would take to process the
FFBs available. Assuming that the mill would be at the larger end of production, the
capacity level will be assumed to be at 60 t/h. Therefore we determine this by dividing
the tons of FFB harvested per year by the processing capacity in tons per year. We can
then determine the number of mills required to process the sheer number of FFB.

34
5,217,598!t!FFB/yr!440,000!t!FFB/yr ≈ 12!mills!
To accommodate the amount of FFB produced annually, 12 mills would need to process
5,217,598 t/yr for 7300 hr/yr, or when dividing the total number of FFB by the hours
per year we estimate that approximately 715 tons of FFB per hour will be processed. Of
this 715 t/h level, about 12.5% of this overall amount is PF and 7.1% consists of PKS.
Summing up the two percentages of PF and PKS we will determine the amount of fiber-
shell (FS) feedstock which is available per hour from the amount of FFB produced in a
year. This does not account for the evaporative drying energy of PF, for this model we
assume that the substance will dry at the plantation site or at a separate facility prior to
the transport. Due to the sheer quantities of POBR, the feedstock must be stored in a
holding location, such as a warehouse with close proximity to the plant, before being
incinerated. These holding locations not only store the substances for future incineration
but can also play a role in drying the substances. According to Kittikun et al. (2000),
about 30% of the feedstock produced will be subtracted to account as fuel for the mills
and utilizing the substance as fertilizer. Other plantations may use EFB’s for fertilizers
The current study assumes that if electricity generation is not produced directly on the
POM, 70% of FS substance will be considered waste by the POM. We therefore assume
a 70% usability level.
0.125(715!t/h) ≈ 89!t!PF/h
0.071(715!t/h) ≈ !51!t!PKS/h
89!t!PF/h!+ !51!t!PKS/h = 140!t!FS/h
With a 30% use assumption, 30% subtracted from 140 t FS/h, the total feedstock
available per hour stands at around 98 t FS/h.
!

35
3.3 POM Electrical need and feedstock sufficiency of a 60 MWth plant There are further losses of POBR as POMs also require some of this biomass feedstock
to power their own facilities, mainly using the energy in FFB processing to power
machinery and to generate heat to boil the sanitizing water. According to Mahlia et al.
(2001), in a typical medium-sized mill, about 20 kWh are needed to process 1 ton of
FFB in the mill. Kittikun et al. (2000) measures the energy demand to be slightly lower
at around 17 kWh, but assuming higher levels of energy would be more sufficient to
account for losses. In order to determine exactly how much feedstock of the FS mix is
necessary, the lower heat value (LHV) of the substance must be determined, taking into
account the approximate, optimized ratio of the feedstock composition. The heating
value is defined as the amount of heat produced by complete combustion of fuel that is
typically measured as a unit of energy per unit mass or volume. In this case the LHV, or
the net calorific value (NCV), is expressed as MJ/kg. We assume that after combustion,
the moisture content present in the substance will be then in vapor form. The LHV is
determined by subtracting the water vapor from the higher heating value, which
assumes that after combustion the water present in the substance will continue existing
in a liquid phase after combustion, in other words, the energy required to vaporize the
water is presumed to not be recovered as heat. As the average POBR ratio used for
optimized incineration properties stands at approximately a 60 fiber and 40 shell ratio
within the feed. However, since this ratio is an estimated value we will assume an
average value of the various mixes, which Husain et al. (2003) has recorded as an
average net calorific value. Table 3-1 demonstrates the average heat values for 7
different POMs based on the various PF and PKS ratios utilized at different mills
(referred to Table 2-2). The net calorific value for these various mixes is determined at
14.26 MJ/kg.
!

36
Table 3-1: Averages of net calorific values, extraction rate, boiler and turbine efficiency, utilization factor for 7 different POMs (Husain et al., 2003)
First, a determination of how much feedstock, PF and PKS substance, is needed as
internal energy for operating a mill is calculated.. This is done by using the net calorific
value of a kilogram of the substance (MJ/kg), as determined by Husain et al. (2003),
converting it to kWs and dividing this by the number of seconds in an hour (3600) to
determine the amount of kWh of energy this can generate. Following this step is
determining the amount of substance needed (kg) to run the mill. For the following
calculation, we will assume the amount of feedstock required for 1 t of FFB.
Energy!of!1!kg!fuel = 14.26!MJ/kg 14.26!MJ/kg = 14.26!MWs/kg
14.260!kWs/kg/3600s/h = 3.9!kWh/kg ≈ 4kWh/kg 20kWh/ton!/(4kWh/kg) = 5kg!FS!per!1!ton!FFB
Since we have calculated the energy value in kWh of 1 kg of the FS mixture, this being
at around 4 kWh/kg, we were then able to determine we need at least 5 times the
amount of substance to generate 20 kWh of electricity. Therefore, 5 kg of PF and PKS
are needed for 20 kWh of power to process 1 t of FFB. The amount of PF and PKS that
is produced for 1 t of FFB processed in a mill is calculated by multiplying 1 ton of FFB
by the relative fractions of PF and PKS, e.g.: 1 ton of FFB yields 19.6% POBR (PF and
PKS), considering that 12.5% consists of fiber residue and 7.1% of shell residue. From
this amount, the 5 kg FS mixture amount as required by the POM can then be subtracted
from the total amount of the FS mixture produced from 1 ton of FFB to determine the
remaining feedstock for use in the BPP.
37
1!ton!FFB = 1000!kg!FFB
0. 196 ∗ 1000!kg = 196!kg!FS! 196!kg!FS− 5!kg!FS = 191!kg!FS 0.674 ∗ 191!kg!FS = 128.7!kg!FS
An estimated 191 kg of FS remains from the production of 1 ton of FFB after taking
into account the 5 kg required to run the POM, or 2.6% of the total amount of POBR
(=FS) is consumed for the processing of the palm oil products. An additional 30% is
utilized for fertilizing, thus we assume a 32.6% usage and a 67.4% availability of the
POBR can be theoretically utilized for external energy production, or about 128.7 kg
FS.
Above it was defined that 715 t FFB/h are processed in the various mills (12 mills in
total) to satisfy the amount produced in the plantation sites, with a total production of
140 t/h POBR. Accounting for 30% fertilizer use and 2.6% use for FFB processing,
means that about 94.4 t/h POBR (FS) are available for external use. This is calculated
by subtracting 32.6% of used FFB from the total 140 t/h of POBR produced. In order to
determine whether or not this excess feedstock is sufficient to power a larger BPP, an
estimation for the amount of feedstock to power a 60 MWth pilot plant needs to be
calculated in order to ensure whether or not that the amount of feedstock is sufficient to
power such a BPP. Considering the 60 MWth and then dividing this number by the net
calorific value over the amount of seconds in an hour (3600), which would to determine
the MWh/kg in the denominator, we can then determine the feedstock required in tons
per hour (t/h). We can conclude whether or not there is enough POBR feedstock to
power the BPP. 60!MW!"
14.3MJ/kg/3600s = 15.1!t/h!fuel In order to operate a 60 MWth plant the amount of biomass feedstock of POBR required
would be 15.1 t/h of fuel. Currently the POBR of PF and PKS stands at 94.4 t/h, after
subtracting the amount required by POMs to operate FFB processing and assuming
based on Kittikun et al. (2000) that 30% is the total use of feedstock for fertilization and
2,6% for self-power generation, there is a remaining of about 79,3 t/h of feedstock that
could be utilized for additional electricity generation (this is obtained by subtracting
94,4 t/h-15,1 t/h). This would be an equivalent amount to generate an additional five
were 60 MWth power plants.

38
3.4 Emissions considerations The European emission limits will be used as a basis for the analysis of a 60 MWth
biomass plant located in Indonesia. This is presuming that the technology and the know-
how originate from the European Union (EU). The BPP should be assessed via EU
standards as European emissions limits are quite stringent with respect to emissions
from biomass incineration. Therefore the assessment will be made will have a basis in
the EU emissions limits for combustion plants using biomass. These standards are legal
requirements that limit the concentrations of pollutants in the flue gas emitted into the
atmosphere from specific point sources. In the US standard the emission flow over the
course of a certain time period or related to an energy unit is defined. The standards are
established to achieve certain ambient air quality standards that would ensure the
protection of human health and the environment. If a plant above a certain size is to be
commissioned, then emission standards have to be considered and also a dispersion
model is to be operated to demonstrate, that for the plant operations ambient air quality
standards in the surrounding environment are met. The maximum limited concentration
values in the flue gas after treatment in the stack are seen in Table 3-2 (EU standards).
Considering the net calorific value of 14.3 MJ/kg of the biomass fuel for running a 60
MWth power station, the net fuel consumption is 15.1 t/h. The emission considerations
are according to the typical composition of fuel according to Table 2-1. Using this
information, typical composition of the flue gas (wet and dry) is indicated in Table 3-2.

39
Table 3-2: EU Emission limits for combustion plants using biomass (Emission limits from EU Directive 2010/75/EU)
Table 3-3: Typical maximum composition of flue gas - wet and dry of the 60 MWth power plant, based on the average composition data of Table 2.1 and a LHV of 14.26 MJ/kg – Table 3.1. Derived by flue gas emission calculations.
!

40
3.4.1 SO2 and NOx emissions The EU emission limits are for dry flue gas conditions at 6% O2. Emission limit values
shall be calculated at standard temperature and pressure (STP) involving a temperature
of 273.15 K and a pressure of 101.3 kPa. As the water content of PF is quite variable,
respective fluctuations, namely of the humidity content of the flue gas, are to be
expected.
The SO2 emission concentration of around 190 ppm, or 543 mg/m3, is the concentration
formed during the combustion process. This number is significantly higher than the
maximum threshold values for a 50-100 MWth biomass power plant, as found in EU
Directive 2010/75/EU. Since both PF and PKS are both high in alkalinity and thus a
presence of a large excess of alkaline fine particles during incineration, the SO2
becomes scavenged by the alkaline material and the actual emission concentrations are
low. Therefore, the emissions of SO2 is not expected to exceed the EU limit of
200mg/m3 (70 ppm) in the actual operation of the plant (EU, 2010).
When discussing the total emissions levels of NOx, the maximum emissions levels from
the fuel nitrogen are estimated at around 5545mg/m3. These numbers are significantly
higher than the set directive threshold amount at 250 mg/m3. The assumed calculation
for NOx is for a 100% conversion of the fuel from nitrogen to NOx. In the European
experience of biomass incineration for woody biomass, nitrogen contents are at around
0.2-0.3% levels (Francescato et al., 2008). For levels at 0.25% N, the observed
maximum emission of NOx would amount to levels of 150-250 mg/m3 (which is 10-
15% of the maximum expected level from the fuel nitrogen) at around the threshold
maximum amount of directive emissions levels. Thus for combustion of biomass with
0.2-0.3% N reduction measures are usually not required, however more recently
provisions for ammonia based reduction systems are considered (Francescato et al.,
2008). For the N content of about 1%, as observed in table 2-1, the POBR mix, a higher
than expected NOx emission level depending on the combustion technology. If a staged
FBC system is not implemented, it will be required in a pilot power station to take
provisions for an NOx reduction system. Generally speaking, in a staged combustion
process, only a small fraction of the calculated value is formed during the combustion
process. Staged combustion adds secondary air during combustion. It has two main

41
functions, it cools the flames and increases the complete combustion. Through this
process there is an overall reduction in NOx production. Therefore, if POBR incinerated
to this sum, operates under these same conditions, NOx is relatively low in FBC. In
Europe, reduction measures take in cetratin cases place by adding ammonia. However,
for the POBR combustion to meet the EU limit of 250 µg/m3 (122 ppm), reduction
systems most likely have to be applied. Currently it is not clear, whether staged
combustion systems for POBR will lead to NOx emissions meeting the EU standard.
Selective Catalytic Reduction system (SCR) is an example of a process that would work
well for POBR incineration, as the catalyst reaction takes place between a temperature
of 220-500˚C, around the temperature at which POBR is incinerated:
4 NO + 4 NH3+O2! 4 N2 + 6 H2O
6 NO2 + 8 NH3 + O2 ! 7 N2 + 12 H2O
What is shown in the reaction is the NOx reacts with the ammonia compound within the
presence of a catalyst. Two compounds that are typically formed in SCR de-NOx system
are nitrogen, N2, and water, H2O. Overall, an SCR system contains a reactor, tank for
storage, an injection system and catalyst. These additional pieces of machinery will
increase the overall cost to the POBR plant if the plant cannot meet emissions threshold
requirements solely via staged combustion. The POBR plant would require additional
substances such as limestone and dolomite and may need to utilize de-NOx equipment.
!

42
3.4.2 Fly Ash emissions According to table 2-1, the percent by weight of ash stands at 4.6% of the POBR. As
approximately 15.1 tons of POBR is incinerated per hour, about 694.6 kg ash i
produced per hour. This means that the total ash that needs to be transported via silo
transport is about 600 kg/h fly ash, and 100 kg/h of bottom ash. Fly ash would consist
of 600 kg/h. The fine fly ash, assuming levels that are at 10% would not to be retained
in the cyclones, would add up to about 59 kg/h fine fly ash. These levels are far above
the EU emission levels of 20 mg/m³, or 1,5 kg/h, the emission being about 39 times the
amount of allowed fly ash emissions. The most stringent emission concentration limit is
for fine particles as these particles are detrimental to the health of human beings. PM is
not only an irritant to eyes, nose, and mouth, but also can seep into the circulatory
system of humans via the lung alveoli. In the EU the emissions limits are at 20 mg/m3,
which require highly efficient filtration systems, e.g. baghouse filters. According to the
emissions analysis, fly ash emissions from POBR incineration far exceed the 20mg/m3
levels as they are estimated to be at approximately 7980 µg/m3 (before the cyclone). The
emissions of fine particles from biomass incineration are typically very fine (<2.5 µm).
From the European experience it is concluded that reduction systems based solely on
cyclones may not reduce the emissions below 50-100 mg/m3. It is for sure that efficient
filters are required for lowering the PM10 or PM2.5, depending on the legal situation.
In the EU this would require the emission of a plant to be below 20 mg/m3 (EU
standard, PM10) or an equivalent of 13 mg/m³ for US biomass plants. The fine particle
emission standard in US for dry flue gas is 0.03 lb/MMBtu (at 3% oxygen) for plants ≥
30 MMBtu/h, and 1 megawatt [MW] = 3.41 MMBtu (IT)/hour [MMBtu/h]
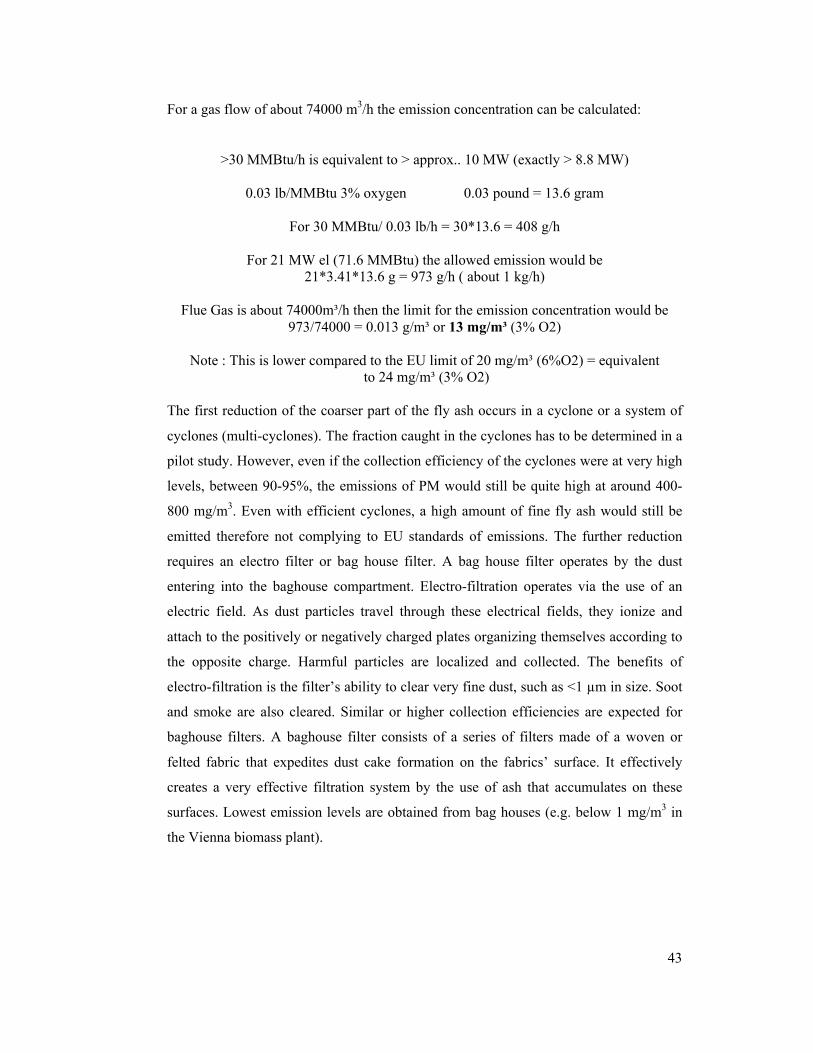
43
For a gas flow of about 74000 m3/h the emission concentration can be calculated:
>30 MMBtu/h is equivalent to > approx.. 10 MW (exactly > 8.8 MW)
0.03 lb/MMBtu 3% oxygen 0.03 pound = 13.6 gram
For 30 MMBtu/ 0.03 lb/h = 30*13.6 = 408 g/h
For 21 MW el (71.6 MMBtu) the allowed emission would be 21*3.41*13.6 g = 973 g/h ( about 1 kg/h)
Flue Gas is about 74000m³/h then the limit for the emission concentration would be
973/74000 = 0.013 g/m³ or 13 mg/m³ (3% O2)
Note : This is lower compared to the EU limit of 20 mg/m³ (6%O2) = equivalent to 24 mg/m³ (3% O2)
The first reduction of the coarser part of the fly ash occurs in a cyclone or a system of
cyclones (multi-cyclones). The fraction caught in the cyclones has to be determined in a
pilot study. However, even if the collection efficiency of the cyclones were at very high
levels, between 90-95%, the emissions of PM would still be quite high at around 400-
800 mg/m3. Even with efficient cyclones, a high amount of fine fly ash would still be
emitted therefore not complying to EU standards of emissions. The further reduction
requires an electro filter or bag house filter. A bag house filter operates by the dust
entering into the baghouse compartment. Electro-filtration operates via the use of an
electric field. As dust particles travel through these electrical fields, they ionize and
attach to the positively or negatively charged plates organizing themselves according to
the opposite charge. Harmful particles are localized and collected. The benefits of
electro-filtration is the filter’s ability to clear very fine dust, such as <1 µm in size. Soot
and smoke are also cleared. Similar or higher collection efficiencies are expected for
baghouse filters. A baghouse filter consists of a series of filters made of a woven or
felted fabric that expedites dust cake formation on the fabrics’ surface. It effectively
creates a very effective filtration system by the use of ash that accumulates on these
surfaces. Lowest emission levels are obtained from bag houses (e.g. below 1 mg/m3 in
the Vienna biomass plant).!

44
4. Conclusions Millions of tons of agricultural biomass residues are produced every year from
Indonesia’s palm oil industry. With Indonesia’s interest in renewable energies and
willingness to reduce consumption of and reliance on fossil fuels, most prominent being
oil, gas, and coal, POBR biomass can be a good, sustainable source of energy. This
energy cannot only power small local settlements, but larger urban areas as well. There
is much controversy surrounding the palm oil industry, ranging from transboundary
haze pollution to severe deforestation and subsequent biodiversity destruction. Without
slowing down worlds demands for the two oil products themselves (CPO and CPKO),
found in a large variety of products ranging from food to cleaning and skin care
products and more recently biofuels, the palm oil industry will continue to thrive in
Southeast Asia. A solution to reducing the utilization of palm oil products would be to
reduce consumption and/or find alternative substances that could effectively replace
palm oil and can be used in these products, thereby providing a satisfactory product to
the consumer. As the palm oil industry is in fact a large and growing industry, it is
advised, at the present time, to look into making the industry more sustainable which
can be beneficial to RET development in Southeast Asia.
Meanwhile, the palm oil industries, whether large industries or small shareholders,
should maximize their sustainability potential by using POBR to generate electricity,
feeding excess electricity onto the grid to create a renewable energy niche to effectively
power settlements and larger urban areas. Two commonly used POBR feedstock to
generate power and run processing activities in POMs are PF and PKS. PF is the fibrous
interior of the palm oil fruit that has been squeezed for the production of CPO. PKS is
the outer shell layer of the seed of the oil palm fruit. It is removed when extracting the
interior seed to produce CPKO. These two components, when incinerated separately,
can create a multitude of issues. Optimizing incineration of the two POBR is useful as it
creates a more stable fuel. Incinerating PF alone can create issues with flame stability as
PF has a higher and fluctuating moisture content and a lower net calorific value.
Burning PF result in a white smoke that can be harmful to the surrounding environment.
On the other hand, PKS has a very high net calorific value due to its higher carbon
content, but PKS incineration alone can create black smoke harmful to surrounding
communities and ecological life. In the mills the two products are combined in an

45
optimal ratio, of 60% fiber and 40% shell to achieve flame stability. For utilizing the
biomass residues in a communal power station a pre-treatment of the biomass residues
seems to be necessary; such as, seasoning or drying to reduce moisture.
Overall, POBR is a very underexploited potential source of energy. A majority of the
time, excess residues are either scattered around plantations to be used as fertilizer,
thrown into waste pits, or burned in open fields. Only very little of the biomass residues
are used or even needed to power POMs. If electricity for external supply is not
generated via these biomass residues, plantations would consider about 70% of these
residues waste products. Many POMs, however, do use POBR as feedstock to generate
electricity to run operations in FFB processing, showing that these processing plants
have the technical experience and know-how necessary to utilize POBR as well as
operate machinery associated with POBR incineration and electrical energy production.
Although true, very little POBR is used or needed to generate electricity within the plant
in comparison to the sheer number of POBR produced on an hourly basis in the region.
In order to process 1 ton of FFB, only approximately 20 kWh are required, this is
equivalent to 5 kg of FS. For the model, it was established that a typical mill can
process 60 tons of FFB per hour in order to satisfy the sheer number of FFB harvest in
the Sumatra Utara region. This region was selected due to the high concentration of
palm oil plantations in the region and ideal agricultural conditions for the oil palm trees.
Additionally, a connected grid is available in this region due to the location of the city
of Medan, consisting of a population of 2.1 million in total. Government-run plantation
sites were selected in order to facilitate the transferal of biomass product to electrical
generation capacity and use of State supported electrical power grids.
One government organization, PTPN IV, operating with another government-operated
organization, PLN, facilitates the process to sell and buy electricity respectively. Due to
the high amount of FFB produced in these government-run plantation sites, a total 12
mills need to operate in order to process the amount of FFB harvested on an hourly
basis. Each of these mills could generate 129 kg/h of FS out of 1 ton of FFB produced
that could be used for electricity generation. This number takes into consideration the
30% of PF and PKS residues used for fertilizer on the field as well as the additional
2.6% required in the mill to produce energy. It was determined that this amount of
feedstock is more than sufficient to power a 60 MWth power plant. The total amount of

46
feedstock required, taking into account the net calorific value as well as the output
capacity of the power plant, was about 15.1 t/h. Thus for the 94.4 t/h produced a total of
5-6 power plants of this generation capacity could be fuelled.
While this seems a very promising prospect to begin POBR powered plants in Northern
Sumatra, there are a range of additional external considerations that influence the
operation such a plant:
• Drying locations and methodologies need be considered and accounted for. Due
to the high moisture content of both PF and PKS and the large quantities of
POBR, it is necessary to pre-treat the substances before incineration.
• Transportation costs and methods also need to be considered. Wien Energie
reports that Austrian biomass plants have trucks able to support upwards of 24
tons of biomass per hour, transporting feedstock from the feedstock source to
the outskirts of Vienna. Transportation is an incurred cost for a POBR power
station in Northern Sumatra. According to PTPN IV RSPO report papers, mills
of PTPN IV range from 2-6 hours away from the city, the closest distance at 140
km away and the farthest distance at 620 km away in distance (Putra, 2010).
According to Lim et al. (2014), transportation of POBR in Malaysia costs 0.047
Euros per ton per kilometer. This means that the cost of transportation would
range between 100 Euros-440 Euros if the shipments were at 15 t FS/h.
Therefore, the remote locations of mills in Sumatra Utara would be optimized by
producing the electricity on site, then transferring the energy on to power lines
that could be constructed by the company or with government support.
In addition to external considerations, power station planning considerations need to be
accounted for:
• The power station should be located near a water supply for cooling.
• When close to city, the plant must consider more stringent emissions standards.
• To ameliorate fine particle emissions, in addition to commonly used cyclones, e-
filter or a baghouse filter is required (as for maintaining EU Emission
standards). The ash content in FS feedstock is quite high and is a major cause for
concern. Since potential fly ash emissions far exceeds thresholds established by
the EU, it would be necessary to have filtration technologies to mitigate the
amount of ash that would be produced by POBR incineration.

47
• Due to the high content of ash in POBR, the transport and disposal of collected
ash needs to be considered.
• The potential ash problems during incineration (fouling, slagging, bed
agglomeration) must be ameliorated during operation.
• There are relatively high NOx emissions (de-NOx possibly required). Emissions
originating from this type of feedstock are a matter of concern especially with
respect to NOx and ash emissions. Nitrogen concentrations in FS feedstock are
far higher than that of some trees such as beech and spruce trees that have
similar chemical compositions as FS feedstock. While incinerating beech and
spruce trees just meet the NOx standard as set in EU Directive 2010/75/EU,
estimated NOx emissions from FS would be higher. If staged FBC combustion
does not mediate this emission issue, then de-NOx mitigating technologies
would have to be implemented and applied onto the BPP to avoid high
concentration of NOx. Nevertheless some research has found that a staged
combustion while applying materials such as dolomite and limestone actually
reduces the NOx emissions to acceptable levels. A pilot plant such as this 60
MWth plant would have to determine the amount of NOx produced after placing
mitigating technologies. Operators would then need to see if these measures are
sufficient or if more measures are in fact necessary to continue plant operational
activities.
• There is no problem with SO2 emissions due to alkaline fly ash.
Overall, this type of renewable technology, specifically utilizing POBR, and the
feasibility of running a 60 MWth, in the region seems feasible based solely on the sheer
amount of feedstock that is available. This abundant amount of feedstock ensures
powering of not just one plant but up to an additional 5-6 power plants in the region.
The aforementioned emission considerations need to be taken into account. While
utilizing these biomass technologies can help mitigate CO2 emission levels, these other
types of emission sources from POBR feedstock, most notably NOx and ash, need to be
seriously considered. Simply incinerating these biomass residues without any emission
mediation technologies may negate the positive CO2 mediation effects of incinerating
biomass feedstock. Further planning and exploration into the costs of implementing and
constructing such a plant needs to be accomplished. Drying and storage facilities are

48
major obstacles to implementation because of the large amount of feedstock that is
produced per hour. As such, the equipment needed to establish such a plant will be quite
costly because of the additional filtration and drying measures necessary. Once these
considerations are accounted for, energy generation from POBR seems to be a very
promising prospect that promotes sustainable practices and provides a new niche for
RET in Northern Sumatra.
!
49
Bibliography Abdullah, N. and Sulaiman, F. (2013): The Oil Palm Wastes in Malaysia The Oil Palm Wastes in Malaysia. In: Matovic, M. (Ed.) Biomass Now-Sustainable Growth and Use. InTech, Rijeka, pp. 75-100. ACE (2013): ASEAN Renewables, Country Profile: Indonesia. ASEAN Center for Energy, Jakarta, http://aseanrenewables.info/wp-content/uploads/2013/07/IN-Indonesia_Rev06.pdf (accessed July 5, 2015) Bakar, B., Tahir, P., Karimi, A., Bakar, E., Uyup, M., Choo, A. (2013): Evaluations of some physical properties for oil palm as alternative biomass resources, Wood Material Science & Engineering, Taylor & Francis, London, pp. 119-128. Begum, S., Kumaran, P., Jayakumar, M. (2013): Use of Oil Palm Waste as a Renewable Energy Source and Its Impact on Reduction of Air Pollution in the Context of Malaysia. IOP Conference Series: Earth and Environmental Science (EES), 16. Borhanazad, H., Mekhilef, S., Saidur R., Boroumandjazi G. (2013): Potential application of renewable energy for rural electrification in Malaysia, Renewable Energy 59, 210-219. BPS (2013): Plantation Area by Province and Crops, Indonesia (000 Ha), 2013. http://www.bps.go.id/linkTabelStatis/view/id/1671 CAREPI-Team Sumatera Utara. (2009): Regional Energy Outlook: Sumatera Utara Province Year 2005-2025. https://ec.europa.eu/energy/intelligent/projects/sites/iee-projects/files/projects/documents/carepi_energy_outlook_north_sumatra.pdf-accessed: 05 May 2015. Conrad L., Prasetyaning, I. (2013): Promotion of least cost renewables in Indonesia: overview of the waste-to-energy potential for grid-connected electricity generation (solid biomass and biogas) in Indonesia. Renewable Energy Program Indonesia/ASEAN, Directorate General for New and Renewable Energy and Energy Conservation, Jakarta, Indonesia. EU (2010): Directive 2010/75/EU of the European Parliament and of the Council of 24 November 2010 on industrial emissions (integrated pollution prevention and control). Brussels, Belgium. Francescato V., Antonini E., Bergomi L.Z. et al. (2008) Wood Fuels Handbook. http://www.aebiom.org/IMG/pdf/WOOD_FUELS_HANDBOOK_BTC_EN.pdf (Accessed July 5, 2015) Hansen U., Nygaard I. (2014): Sustainable Energy Transitions in Emerging Economies: The formation of a palm oil biomass waste-to-energy niche in Malaysia 1990-2011, Energy Policy 66, 666-676.

50
Harimi M., Ahmad M.M.H., Sapuan S.M., Idris A. (2005): Numerical analysis of emission component from incineration of palm oil wastes. Biomass and Bioenergy 28, 339-345. Hasan M.H., Mahlia T.M.I., Nur H. (2012): A review on energy scenario and sustainable energy in Indonesia. Renewable and Sustainable Energy Reviews 16, 2316-2328. Hosseini S., Mazlan A. (2014): Utilization of palm solid residue as a source of renewable and sustainable energy in Malaysia. Renewable and Sustainable Energy Reviews 40, 621-632. Husain Z., Zainal Z.A., Abdullah M.Z. (2003): Analysis of biomass-residue-based cogeneration system in palm oil mills. Biomass and Bioenergy 24, 117-124. Husain Z., Zianac Z., Abdullah Z. (2002): Briquetting of palm fibre and shell from the processing of palm nuts to palm oil. Biomass and Bioenergy 22, 505-509. Kittikun A., Prasertsan P., Srisuwan G., Krause A. (2000): Environmental Management for Palm Oil Mill. Internet Conference on Material Flow Analysis of Integrated Bio-Systems, March-October 2000. http://www.globetree.org/jackyfoo/ic-mfa/kittikun/index.html (accessed July 5, 2015) Lasselsberger L. (2001) Basics of Combustion Techniques and Technical Implementation. Combustion Technology. Script, Published by BLT Wieselburg, http://www.josephinum.at/fileadmin/content/BLT/Puplikationen/0758_00.pdf (accessed May 25, 2015) Lim Meng Hon J. (2010): A Case Study on Palm Empty Fruit Bunch as Energy Feedstock. SEGi Review 3 (2), 3-15. http://onlinereview.segi.edu.my/pdf/vol3-no2-art1.pdf (accessed July 10, 2015) Lim Y., Koh S., Morris S. (2014): “Methodology for optimizing geographical distribution and capacities of biomass power plants in Sabah, East Malaysia,” International Journal of Energy Sector Management, 8 (1), 100 – 120. Mahlia T.M.I., Abdulmuin M.Z., Alamsayah T.M.I., Mukhlishien D. (2001): An alternative energy source from palm wastes industry for Malaysia and Indonesia. Energy Conversion and Management 42, 2109-2118. Malaysian Industrial Development Authority (2005): The Cost of Doing Business in Malaysia, Malaysian Industrial Development Authority, Kuala Lumpur.
Malaysian Palm Oil Council (2012): FAQs. http://www.mpoc.org.my/FAQs.aspx (accessed June 10, 2015) Mekhilef S., Siga S., and Saidur R. (2011) A review on palm oil biodiesel as a source of renewable fuel. Renewable and Sustainable Energy Reviews 15 (4) 1937-1949.

51
Nasrin A.B., Ma A.N., Choo Y.M., Mohamad S., Rohaya M.H., Azali A., Zainal Z. (2008): Oil Palm Biomass as Potential Substitution Raw Materials for Commercial Biomass Briquettes Production. American Journal of Applied Sciences 5(3), 179-183. Ninduangdee P., Kuprianov V. (2015): Combustion of an oil palm residue with elevated potassium content in a fluidized-bed combustor using alternative bed materials for preventing bed agglomeration. Bioresource Technology 182, 272-281. Permatasari R., Hui K.K., Ja’afar M.N.M. (N.D.) Combustion Characteristics of Palm Wastes in Fluidized Bed Combustion. International Conference on Environment and Electrical Engineering. http://eeeic.eu/proc/papers/82.pdf (accessed April 28,2015) Piotrowska P., Zevenhoven M., Hupa M., Giuntoli J., & de Jong W. (2013). Residues from the production of biofuels for transportation: Characterization and ash sintering tendency. Fuel Processing Technology 105, 37-45. Prasertsan S., Prasertsan P. (1996): Biomass Residues from Palm Oil Mills in Thailand: An Overview on Quantity and Potential Usage. Biomass and Bioenergy 11 (5), 387-395. Putra H. (2010): RSPO Certification Assessment Public Summary Report. file:///Volumes/FAA%20LA%20LA/RSPO%20Report%20PTPN%20IV.pdf (accessed August 5, 2015). Shuit S.H., Tan K.T., Lee K.T., Kamaruddin A.H. (2009): Oil palm biomass as a sustainable energy source: A Malaysian case study. Energy 34, 1225-1235. Sing C., Aris M. (2013): A Study of Biomass Fuel Briquettes from Oil Palm Mill Residues. Asian Journal of Scientific Research 6 (3), 537-545. Sumathi S., Chai S.P., Mohamed A.R. (2008): Utilization of oil palm as a source of renewable energy in Malaysia. Renewable and Sustainable Energy Reviews 12, 2404-2421. Wittmaier M. (2004): A Thermal Processing Plant in Thailand: A Case Study of Oil Palm Residues. http://www.biware.hs-bremen.de/Download/Workshop/technicall%20eng%20pdf/13.%20KMUTT_case%20study%20Biomass%20combustion%20Thailand_palm%20oil%20residues.pdf (accessed April 28, 2015) World Bank (2014): GEM Commodities Databank. Published by World Bank Group. Washington, D.C., USA. http://data.worldbank.org/data-catalog/commodity-price-data (accessed July 5, 2015) Yusoff S. (2006): Renewable energy from palm oil-innovation on effective utilization of waste. Journal of Cleaner Production 14, 87-93.
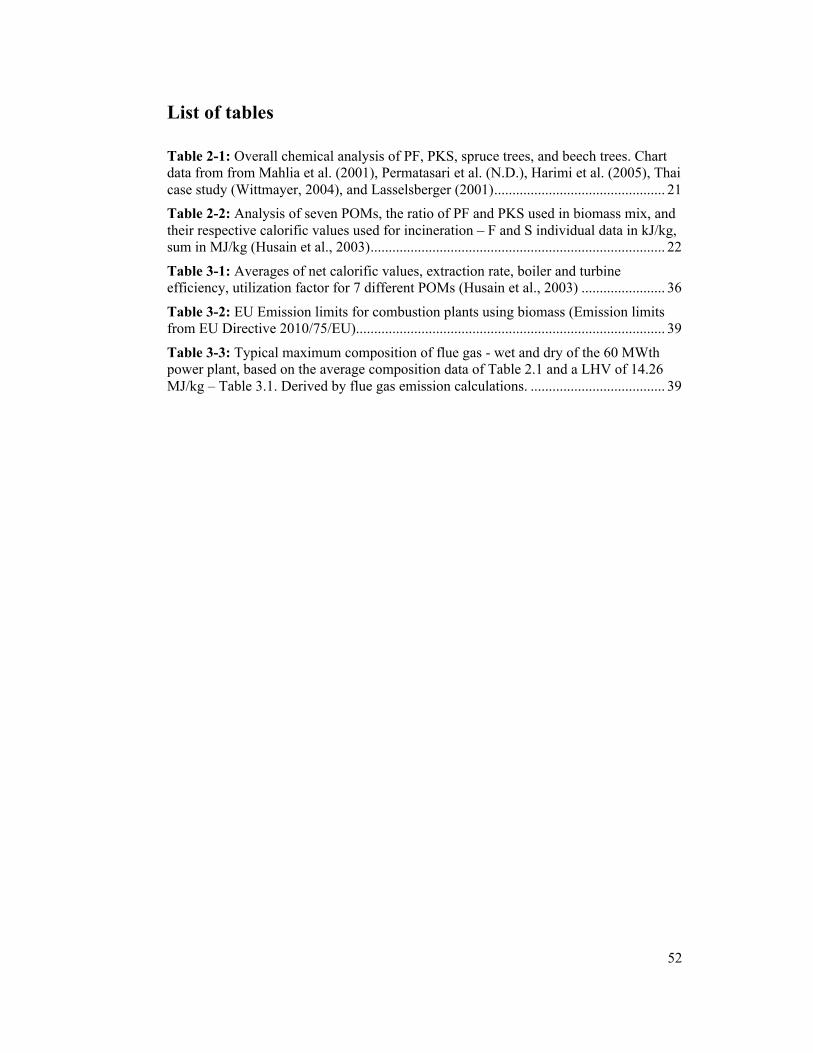
52
List of tables !Table 2-1: Overall chemical analysis of PF, PKS, spruce trees, and beech trees. Chart data from from Mahlia et al. (2001), Permatasari et al. (N.D.), Harimi et al. (2005), Thai case study (Wittmayer, 2004), and Lasselsberger (2001) ............................................... 21!Table 2-2: Analysis of seven POMs, the ratio of PF and PKS used in biomass mix, and their respective calorific values used for incineration – F and S individual data in kJ/kg, sum in MJ/kg (Husain et al., 2003) ................................................................................. 22!Table 3-1: Averages of net calorific values, extraction rate, boiler and turbine efficiency, utilization factor for 7 different POMs (Husain et al., 2003) ....................... 36!Table 3-2: EU Emission limits for combustion plants using biomass (Emission limits from EU Directive 2010/75/EU) ..................................................................................... 39!Table 3-3: Typical maximum composition of flue gas - wet and dry of the 60 MWth power plant, based on the average composition data of Table 2.1 and a LHV of 14.26 MJ/kg – Table 3.1. Derived by flue gas emission calculations. ..................................... 39!

53
List of figures !Figure 2-1: Oil Palm fresh fruit components (Malaysian Palm Oil Council, 2012) ...... 10!Figure 2-2: FFB components in %. Harvest averages obtained from Prasertan and Prasertan (1996). ............................................................................................................. 11!Figure 2-3: Biomass residues produced from the milling process. Processing obtained from Prasertan and Prasertan (1996). ............................................................................. 13!Figure 2-4: Diagram of powerhouse typically found in a palm oil mill (Yusoff, 2006) 19!Figure 3-1: Sumatera Utara region (Google Maps 2015). ............................................. 30!Figure 3-2: Immature oil palm trees (MacDonald 2015). .............................................. 32!!!!! !
Related Documents