Turk J Engin Environ Sci 25 (2001) , 345 – 354. c T ¨ UB ˙ ITAK Electrical Spectroscopy of Kaolin and Bentonite Slurries Abidin KAYA Department of Civil Engineering, Dokuz Eyl¨ ul University, Buca-Tınaztepe Campus, 35160-Tınaztepe, ˙ Izmir - TURKEY Received 24.12.1999 Abstract The electrical conductivity and dielectric permittivity of clay-water systems were used to characterize the physicochemical state of kaolin and bentonite-water systems. The dielectric permittivity and electrical conductivity of kaolin and bentonite were determined at various water contents and NaCl concentrations as a function of frequency, ranging from 0.1 kHz to 13 MHz. The results indicate that kaolin and bentonite have similar dielectric behavior. An increase in the frequency produces a decrease in the dielectric permittivity of the soil-pore water mixture. As the ion concentration increases, the dielectric permittivity of the mixture increases at low frequency (kHz) whereas it decreases at high frequency (MHz). The electrical conductivity of kaolin and bentonite increases with an increase in the ion concentration in the soil-water mixture. The electrical conductivity of a kaolin-water mixture decreases with an increase in the solid concentration. In contrast, the electrical conductivity of a bentonite-water mixture increases with a decrease in the solid concentration. This indicates the importance of the surface conductivity of a bentonite-water mixture. Furthermore, the results of this study indicate that dielectric permittivity and electrical conductivity might be used to characterize the electrokinetic behavior of soil minerals to determine the physiochemical changes in clay soil-water systems, such as subsurface contaminations. Key Words: bentonite, contamination, dielectric permittivity, electrical conductivity, kaolin, slurry Kaolen ve Bentonit Bulama¸ clarının Elektrik Spektroskopileri ¨ Ozet Dielektrik ge¸ cirgenli˘ gi ve elektrik iletkenli˘gi kil minerallerinin elektrokinetik ¨ozelliklerini belirlemek i¸cin kullanılabilir. Bu anlamda, kaolen ve bentonit minerallerinin dielektrik ge¸cirgenli˘ gi ve elektrik iletkenl˘gi, farklı NaCl i¸ ceri˘ ginde ve mineral/su oranında 0.1 kHz- 13 MHz frekans aralı˘ gındasaptandı. Sonu¸clar g¨ osterdi ki, genelde, kaolen ve bentonit benzer dielektrik ge¸ cirgenlik ¨ ozelli˘gig¨ osteriyor: ¨ ol¸ c¨ um yapılanfrekans arttık¸ca mineral-su karı¸ sımının dielektrik ge¸cirgenli˘ gi azalıyor. ˙ Iyon konsatrasyonu arttık¸ca, mineral-su karı¸ sımının dielektrikge¸cirgenli˘gid¨ u¸ s¨ uk frekanslarda (kHz) artıyor, y¨ uksek frekanslarda azalıyor (MHz). Sistemdeki iyon konsantrasyonu arttık¸ca hem kaolenin hem de bentonitin elektrik iletkenli˘gi artmaktadır. Kaolen/su oranı arttık¸caelektrik iletkenli˘giazalmakta fakat bentonit/su oranı arttık¸ca elektrikiletkenli˘giartmaktadır. Bu olay bentonit/su karı¸ sımında y¨ uzeysel iletkenli˘gin oldu˘ gunu ˘ g¨ ostermektedir. Bu¸calı¸ smanın sonu¸ cları g¨ osteriyorki dielektrik ge¸ cirgenli˘ gi ve elektrik iletkenli˘gi ¨ol¸ c¨ ulerek kil minerallerinin elektrokinetik davranı¸ sı belirlenebilir. Yine benzer ¸ sekilde yeraltı kirlenmesinin olu¸ sup olu¸ smadı˘gı veya uygulanan yer altıtemizleme y¨onteminin etkin olup olmadı˘gı benzer ¸ sekilde tespit edilebilir. AnahtarS¨ozc¨ ukler: Kaolen, bentonit, dielektrik ge¸ cirgenlik, elektrik iletkenlik, yer altı kirlenmesi 345

Welcome message from author
This document is posted to help you gain knowledge. Please leave a comment to let me know what you think about it! Share it to your friends and learn new things together.
Transcript
Turk J Engin Environ Sci25 (2001) , 345 – 354.c© TUBITAK
Electrical Spectroscopy of Kaolin and Bentonite Slurries
Abidin KAYADepartment of Civil Engineering, Dokuz Eylul University,
Buca-Tınaztepe Campus, 35160-Tınaztepe, Izmir - TURKEY
Received 24.12.1999
Abstract
The electrical conductivity and dielectric permittivity of clay-water systems were used to characterizethe physicochemical state of kaolin and bentonite-water systems. The dielectric permittivity and electricalconductivity of kaolin and bentonite were determined at various water contents and NaCl concentrations asa function of frequency, ranging from 0.1 kHz to 13 MHz. The results indicate that kaolin and bentonite havesimilar dielectric behavior. An increase in the frequency produces a decrease in the dielectric permittivityof the soil-pore water mixture. As the ion concentration increases, the dielectric permittivity of the mixtureincreases at low frequency (kHz) whereas it decreases at high frequency (MHz). The electrical conductivityof kaolin and bentonite increases with an increase in the ion concentration in the soil-water mixture. Theelectrical conductivity of a kaolin-water mixture decreases with an increase in the solid concentration. Incontrast, the electrical conductivity of a bentonite-water mixture increases with a decrease in the solidconcentration. This indicates the importance of the surface conductivity of a bentonite-water mixture.Furthermore, the results of this study indicate that dielectric permittivity and electrical conductivity mightbe used to characterize the electrokinetic behavior of soil minerals to determine the physiochemical changesin clay soil-water systems, such as subsurface contaminations.
Key Words: bentonite, contamination, dielectric permittivity, electrical conductivity, kaolin, slurry
Kaolen ve Bentonit Bulamaclarının Elektrik Spektroskopileri
Ozet
Dielektrik gecirgenligi ve elektrik iletkenligi kil minerallerinin elektrokinetik ozelliklerini belirlemek icinkullanılabilir. Bu anlamda, kaolen ve bentonit minerallerinin dielektrik gecirgenligi ve elektrik iletkenlgi,farklı NaCl iceriginde ve mineral/su oranında 0.1 kHz- 13 MHz frekans aralıgında saptandı. Sonuclar gosterdiki, genelde, kaolen ve bentonit benzer dielektrik gecirgenlik ozelligi gosteriyor: olcum yapılan frekans arttıkcamineral-su karısımının dielektrik gecirgenligi azalıyor. Iyon konsatrasyonu arttıkca, mineral-su karısımınındielektrik gecirgenligi dusuk frekanslarda (kHz) artıyor, yuksek frekanslarda azalıyor (MHz). Sistemdekiiyon konsantrasyonu arttıkca hem kaolenin hem de bentonitin elektrik iletkenligi artmaktadır. Kaolen/suoranı arttıkca elektrik iletkenligi azalmakta fakat bentonit/su oranı arttıkca elektrik iletkenligi artmaktadır.Bu olay bentonit/su karısımında yuzeysel iletkenligin oldugunu gostermektedir. Bu calısmanın sonuclarıgosteriyorki dielektrik gecirgenligi ve elektrik iletkenligi olculerek kil minerallerinin elektrokinetik davranısıbelirlenebilir. Yine benzer sekilde yeraltı kirlenmesinin olusup olusmadıgı veya uygulanan yer altı temizlemeyonteminin etkin olup olmadıgı benzer sekilde tespit edilebilir.
Anahtar Sozcukler: Kaolen, bentonit, dielektrik gecirgenlik, elektrik iletkenlik, yer altı kirlenmesi
345
KAYA
Introduction
Subsurface contamination of soil and water is aworldwide problem. The development of effectiveclean-up programs requires characterization of con-taminants in a rapid, non-destructive, and economicway. However, characterization is difficult becausethe clay-water and contaminant interaction is com-plex, and there is no simple technique for under-standing it. The electrokinetic properties of clay maybe a relatively simple and direct means of determin-ing contamination and to understand clay-water andcontaminant interaction.
Electrical spectroscopy offers advantages forstudying the electrokinetic properties of clay-richsoils, such as dielectric permittivity and electricalconductivity, over a wide range of frequencies. Theseproperties provide information on temporal pro-cesses in the Stern and diffuse double layer associatedwith the particles (Arulanandan and Michell, 1968;Myers and Saville, 1989). In addition, information isobtained on soil fabrics, such as whether the soil isdisturbed or compacted (Shang et al., 1999), and onchanges in physicochemical state (Kaya and Fang,1997; Klein and Santamarina, 1996). Where waterand soil particles come into contact, H2O moleculesinteract with clay surfaces and produce a diffuse dou-ble layer. The electrochemical diffuse double layerand surface conductance can significantly affect theelectrical behavior of heterogenous media dependingon the degree of surface interaction. Low-frequencyelectrical spectroscopy may be used to study the be-havior of the particle surface and its double layer,because polarization and relaxation processes typi-cally affect response at frequencies below 100 kHz(Barchini and Saville, 1995; Klein and Santamarina,1996; Kaya and Fang, 1997). In this study, the ef-fect of the interaction of H2O molecules and ions withclay particles on dielectric permittivity and electricalconductivity were investigated within the frequencyrange of 0.1kHz 13 MHz.
Electrical Properties of Soils
The electrical conductivity, dielectric permittiv-ity, and magnetic susceptibility of the constituentminerals mainly control the electrical properties ofsoils. The dielectric permittivity of a material is ameasure of its ability to store a charge (electrical en-ergy) for an applied field strength. The dielectricpermittivity is a complex number composed of realand imaginary parts. The real part results from the
polarization of material, whereas the imaginary partis related to ohmic and polarization losses. There areseveral mechanisms for polarization, including elec-tronic and ionic resistance, orientation polarization,double layer polarization and interfacial Maxwell-Wagner relaxation (Chelkowski, 1980).
Dielectric permittivity, ε, is a function of fre-quency. Relative dielectric permittivity is the ratio ofthe complex dielectric permittivity, ε, to the dielec-tric permittivity of free space, ε0. Complex dielectricpermittivity, ε∗, can be expressed as
ε∗(ω) = ε′(ω) − iε′′(ω) (1)
where ε′ = the real part of the dielectric permittivity,ε′′ = the imaginary part of the dielectric permittiv-ity, ω = angular frequency; and i =
√−1.
The dielectric permittivity of dry soil particles,independent of mineral type, is ≈ 4, whereas thatof water ≈ 80 (20◦C) in the MHz frequency range(Arulanandan, 1991). Many researchers have dis-cussed the relationship between the water contentand dielectric permittivity of soil-water systems todescribe mathematical models for soil-water-air sys-tems (Topp et al., 1980; Kaya and Fang 1997; andSaarenketo, 1998). However, nearly all models failto predict the water content owing to surface inter-actions at the particle-water interface. Because thesurface interactions between soil particles and H2Omolecules depend on the mineralogical compositionof the soil particle, it is difficult to define the dielec-tric permittivity and electrical conductivity of wetsoil particles.
Materials and Test Methods
The kaolin sample was obtained from Geor-gia Kaolin CompanyR, Georgia, and the bentonitesample was obtained from a drilling company inBethlehem, PA. The physicochemical properties ofthese materials are given in Table 1. The capaci-tance and electrical conductivity measurements wereperformed using a 4192A LF Impedance Analyzer(Hewlett Packard). The capacitor was capable of de-termining capacitance measurements in a frequencyrange of 0.1 kHz to 13 MHz. One reason for thesemeasurements within the wide frequency range wasto determine the behavior of the dielectric value andelectrical conductivity, thus identifying the generalbehavior of both materials. In addition, the mostappropriate frequency for a reliable measurement ofcontaminate variations in soil-pore water mixtures
346
KAYA
can be determined.
Table 1. The physicochemical properties of soils used inthe study
Soil Type Kaolin BentoniteSpecific Gravity, aGs 2.55 2.60Color Light tan Light creamLiquid limita 42 440Plastic Index 13 370Main Cation Sodium SodiumCEC (meq/100g) 24 87pH 6.3±1.2 8.5± 1
(10% solid) (5% solid)Surface Area (m2g−1) 13.00 27.7Particle Diameter (µ m) 0.087 0.19
a Standard ASTM procedure
The clay samples were treated initially with am-monium acetate and then with distilled dionized(DDI) water until the electrical conductivity of thesupernatant became constant. Water solutions werethen prepared at various NaCl concentrations. Then,clay-water mixtures were prepared with various wa-ter contents. Before conducting measurements, theprepared clay-water mixtures were kept at constanttemperature for ≈ 12 h to achieve both moisture andionic equilibrium. Then, clay-water mixtures wereplaced in a U-shaped Plexiglas cell. The Plexiglascell had dimensions of 2 x 4 cm, and the separationbetween the plates was 2 cm. The conductive areasof the cell were covered by silver plates to eliminateimpurities. All measurements were taken within ≈3 min to prevent the effects of overheating by theapplied current.
The dielectric permittivity of the mixtures wascalculated using the capacitance measurements. Thecapacitance, C, of a material between two plates isgiven as
C =εε0A
d(2)
where ε = the dielectric permittivity of the medium,ε0 = the permittivity of the vacuum (8.85x 10⁻¹² CN−1), A = the area of the plates, and d = distancebetween plates. By knowing the geometric configu-ration (A and d), and measuring the capacitance, C,the dielectric permittivity of the soil-water mixturewas determined.
Repeated measurements of the dielectric constantof DDI water and soil were taken to test the reliabil-ity of the impedance analyzer. It was observed that
the dielectric constant of DDI at 20 ◦C was alwaysbetween 78-80, the of dry soil was around 4-5, andthat of air was 1.
Results and Discussions
Dielectric permittivity
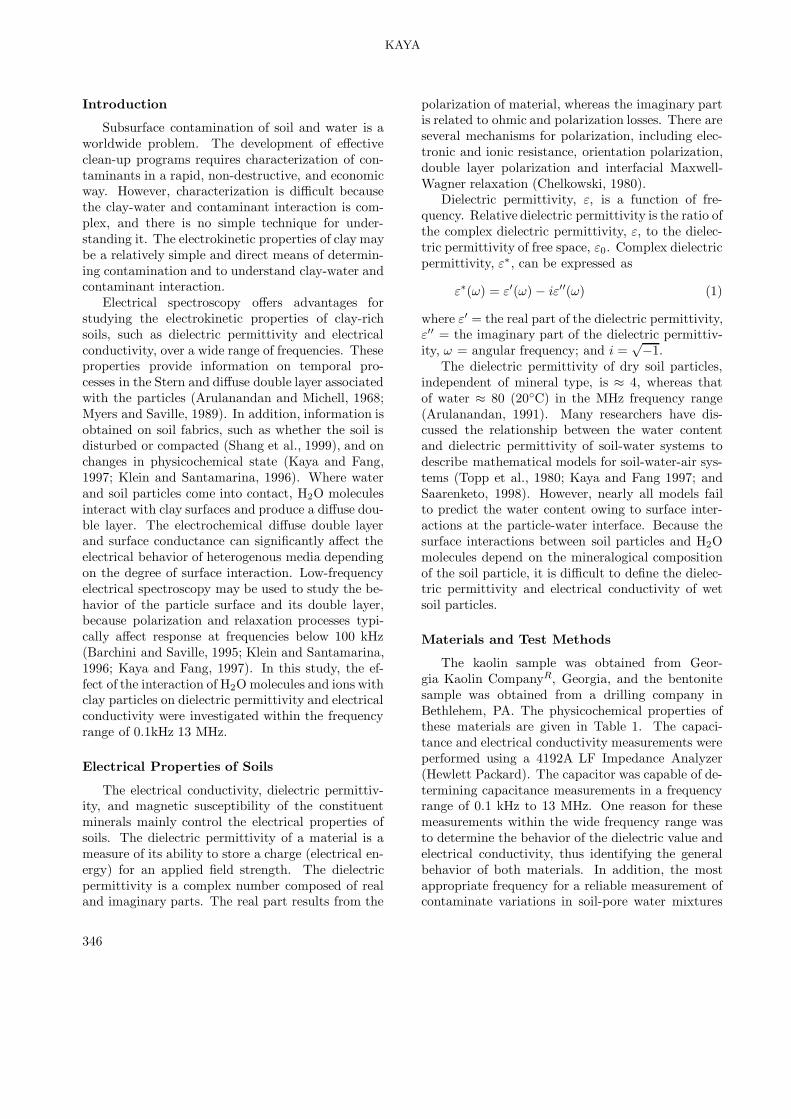
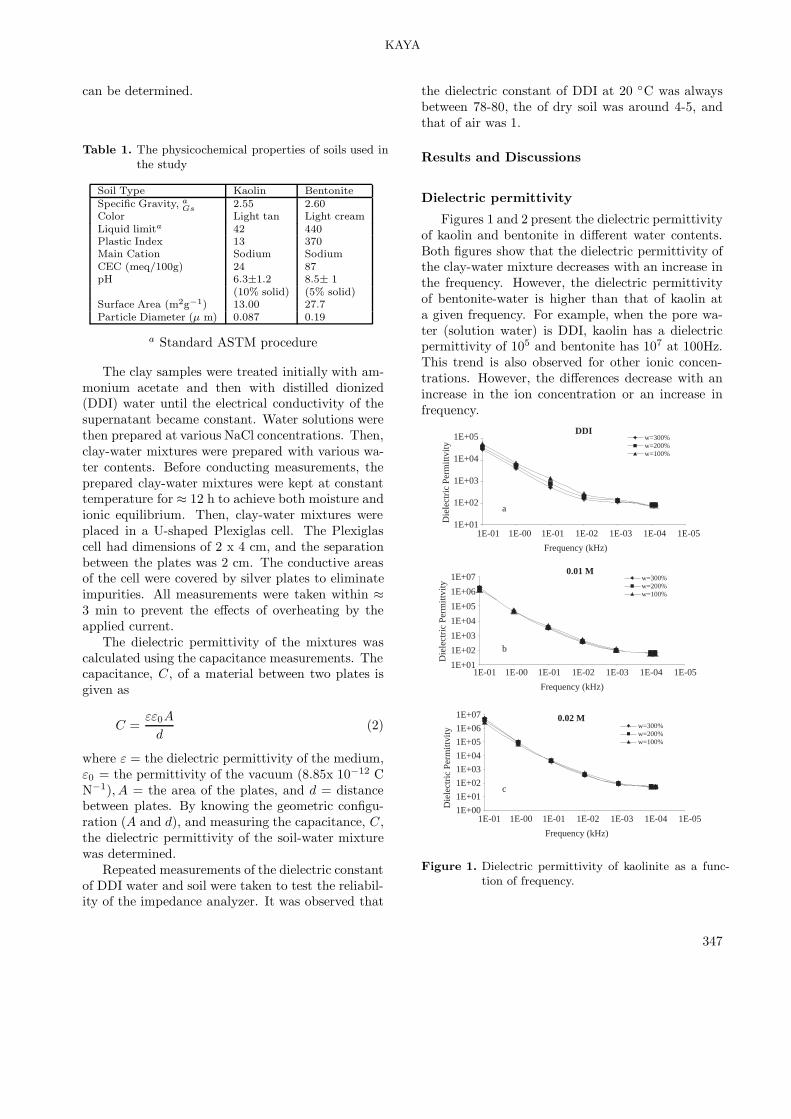
Figures 1 and 2 present the dielectric permittivityof kaolin and bentonite in different water contents.Both figures show that the dielectric permittivity ofthe clay-water mixture decreases with an increase inthe frequency. However, the dielectric permittivityof bentonite-water is higher than that of kaolin ata given frequency. For example, when the pore wa-ter (solution water) is DDI, kaolin has a dielectricpermittivity of 105 and bentonite has 107 at 100Hz.This trend is also observed for other ionic concen-trations. However, the differences decrease with anincrease in the ion concentration or an increase infrequency.
0.02 Mw=300%w=200%w=100%
Die
lect
ric P
erm
ittvi
ty
1E+07
1E+06
1E+05
1E+04
1E+03
1E+02
1E+01
1E+001E-01 1E-00 1E-01 1E-02 1E-03 1E-04 1E-05
Frequency (kHz)
0.01 Mw=300%w=200%w=100%
Die
lect
ric P
erm
ittvi
ty 1E+07
1E+06
1E+05
1E+04
1E+03
1E+02
1E+011E-01 1E-00 1E-01 1E-02 1E-03 1E-04 1E-05
Frequency (kHz)
DDIw=300%w=200%w=100%
Die
lect
ric P
erm
ittvi
ty1E+05
1E+04
1E+03
1E+02
1E+011E-01 1E-00 1E-01 1E-02 1E-03 1E-04 1E-05
Frequency (kHz)
a
b
c
Figure 1. Dielectric permittivity of kaolinite as a func-tion of frequency.
347
KAYA
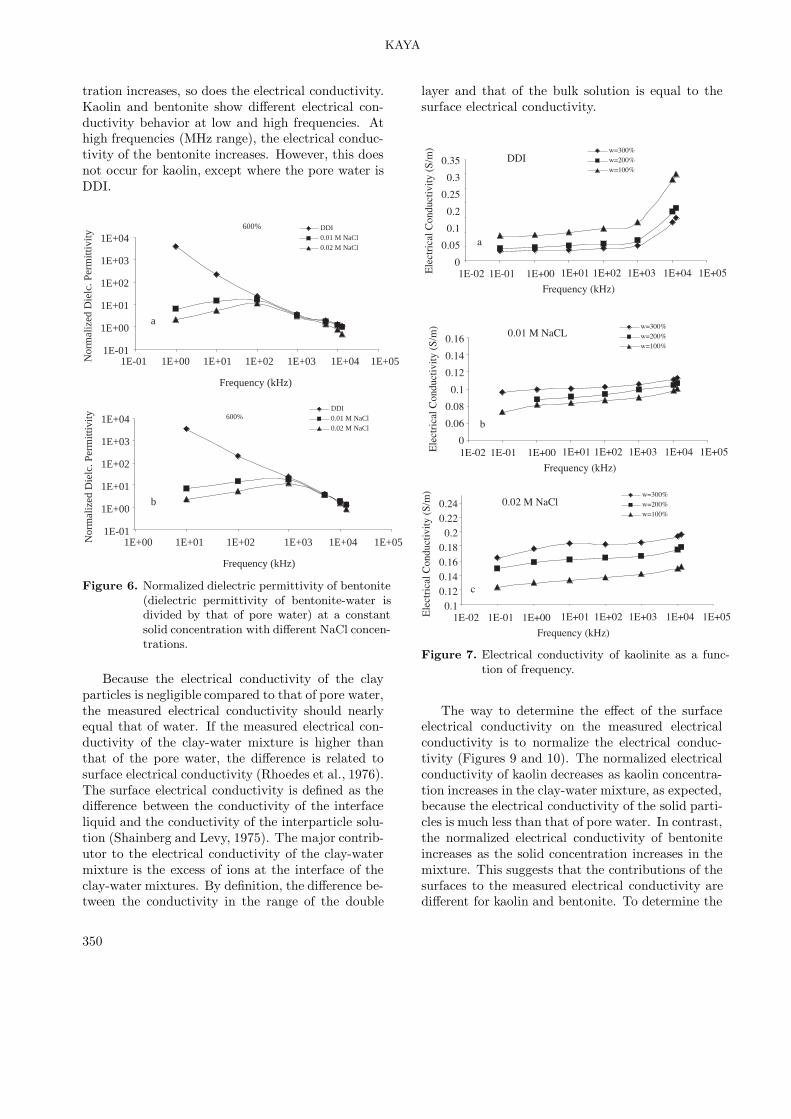
Figure 2. Dielectric permittivity of bentonite as a func-tion of frequency.
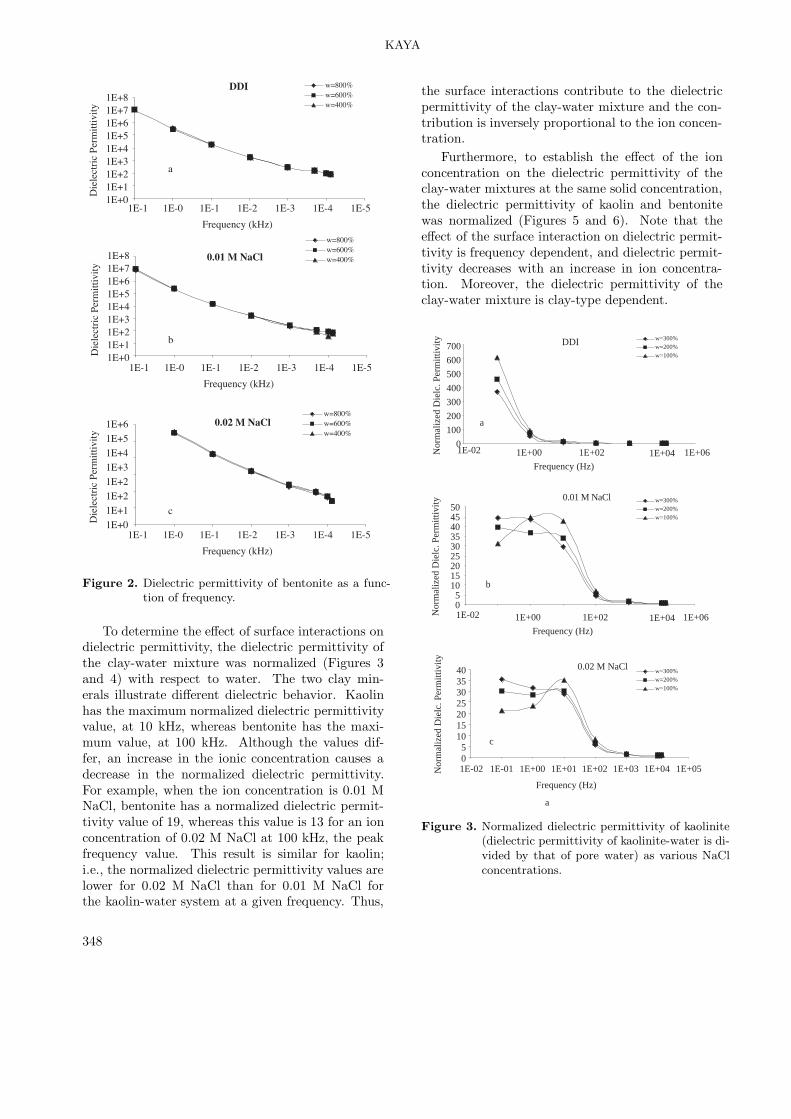
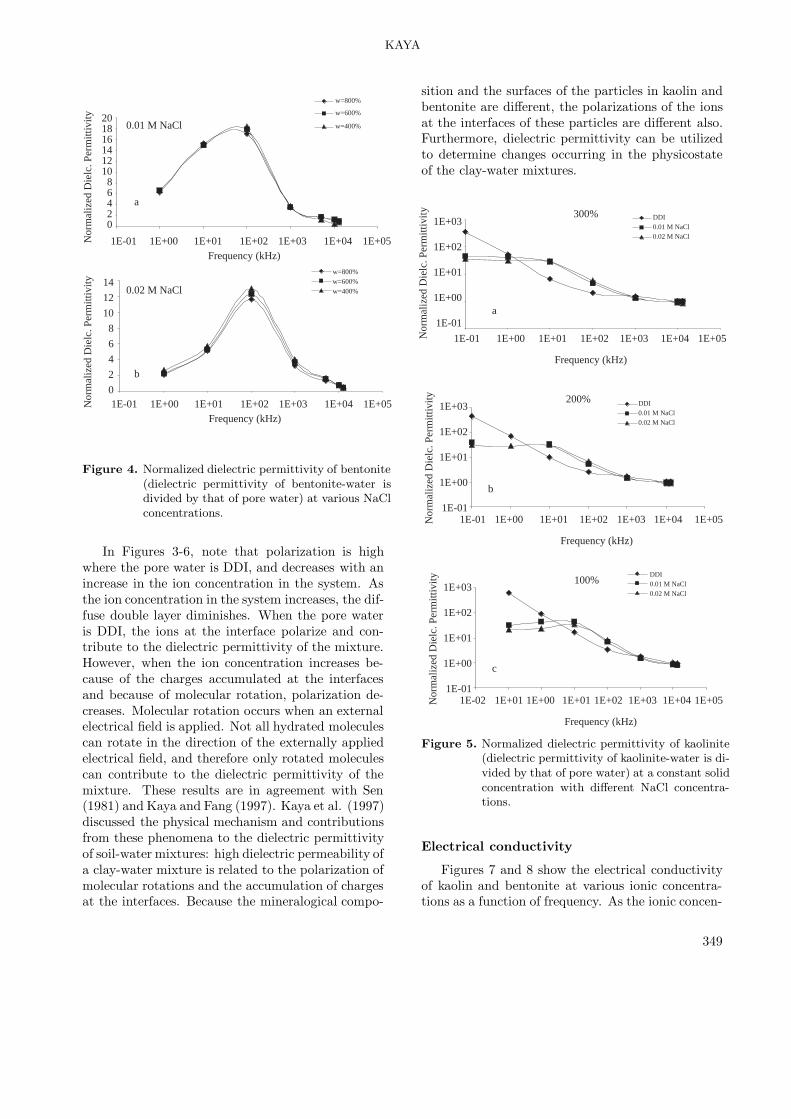
To determine the effect of surface interactions ondielectric permittivity, the dielectric permittivity ofthe clay-water mixture was normalized (Figures 3and 4) with respect to water. The two clay min-erals illustrate different dielectric behavior. Kaolinhas the maximum normalized dielectric permittivityvalue, at 10 kHz, whereas bentonite has the maxi-mum value, at 100 kHz. Although the values dif-fer, an increase in the ionic concentration causes adecrease in the normalized dielectric permittivity.For example, when the ion concentration is 0.01 MNaCl, bentonite has a normalized dielectric permit-tivity value of 19, whereas this value is 13 for an ionconcentration of 0.02 M NaCl at 100 kHz, the peakfrequency value. This result is similar for kaolin;i.e., the normalized dielectric permittivity values arelower for 0.02 M NaCl than for 0.01 M NaCl forthe kaolin-water system at a given frequency. Thus,
the surface interactions contribute to the dielectricpermittivity of the clay-water mixture and the con-tribution is inversely proportional to the ion concen-tration.
Furthermore, to establish the effect of the ionconcentration on the dielectric permittivity of theclay-water mixtures at the same solid concentration,the dielectric permittivity of kaolin and bentonitewas normalized (Figures 5 and 6). Note that theeffect of the surface interaction on dielectric permit-tivity is frequency dependent, and dielectric permit-tivity decreases with an increase in ion concentra-tion. Moreover, the dielectric permittivity of theclay-water mixture is clay-type dependent.
0.02 M NaClw=300%w=200%w=100%
4035302520151050
Nor
mal
ized
Die
lc. P
erm
ittiv
ity
1E-02 1E-01 1E+00 1E+01 1E+03
Frequency (Hz)
1E+051E+041E+02
0.01 M NaCl w=300%w=200%w=100%
Nor
mal
ized
Die
lc. P
erm
ittiv
ity
504540353025201510501E-02 1E+00 1E+02 1E+04 1E+06
Frequency (Hz)
DDI w=300%w=200%w=100%
Nor
mal
ized
Die
lc. P
erm
ittiv
ity
700
600
500
400
300
200
100
01E-02 1E+00 1E+02 1E+04 1E+06
Frequency (Hz)
a
b
c
a
Figure 3. Normalized dielectric permittivity of kaolinite(dielectric permittivity of kaolinite-water is di-vided by that of pore water) as various NaClconcentrations.
348
KAYA
Nor
mal
ized
Die
lc. P
erm
ittiv
ity
1E-01 1E+00 1E+02 1E+04 1E+05Frequency (kHz)
w=800%
w=600%
w=400%
w=800%w=600%w=400%
20181614121086420
14
12
10
8
6
4
2
0
1E+01 1E+03
1E-01 1E+00 1E+02 1E+04 1E+05Frequency (kHz)
1E+01 1E+03
a
b
Nor
mal
ized
Die
lc. P
erm
ittiv
ity
0.01 M NaCl
0.02 M NaCl
Figure 4. Normalized dielectric permittivity of bentonite(dielectric permittivity of bentonite-water isdivided by that of pore water) at various NaClconcentrations.
In Figures 3-6, note that polarization is highwhere the pore water is DDI, and decreases with anincrease in the ion concentration in the system. Asthe ion concentration in the system increases, the dif-fuse double layer diminishes. When the pore wateris DDI, the ions at the interface polarize and con-tribute to the dielectric permittivity of the mixture.However, when the ion concentration increases be-cause of the charges accumulated at the interfacesand because of molecular rotation, polarization de-creases. Molecular rotation occurs when an externalelectrical field is applied. Not all hydrated moleculescan rotate in the direction of the externally appliedelectrical field, and therefore only rotated moleculescan contribute to the dielectric permittivity of themixture. These results are in agreement with Sen(1981) and Kaya and Fang (1997). Kaya et al. (1997)discussed the physical mechanism and contributionsfrom these phenomena to the dielectric permittivityof soil-water mixtures: high dielectric permeability ofa clay-water mixture is related to the polarization ofmolecular rotations and the accumulation of chargesat the interfaces. Because the mineralogical compo-
sition and the surfaces of the particles in kaolin andbentonite are different, the polarizations of the ionsat the interfaces of these particles are different also.Furthermore, dielectric permittivity can be utilizedto determine changes occurring in the physicostateof the clay-water mixtures.
300% DDI0.01 M NaCl0.02 M NaCl
Nor
mal
ized
Die
lc. P
erm
ittiv
ity
1E-01 1E+01 1E+03 1E+05
Frequency (kHz)
1E+03
1E+02
1E+01
1E+00
1E-01
1E+00 1E+02 1E+04
200% DDI0.01 M NaCl0.02 M NaCl
Nor
mal
ized
Die
lc. P
erm
ittiv
ity
1E-01 1E+00 1E+03 1E+05
Frequency (kHz)
1E+03
1E+02
1E+01
1E+00
1E-011E+01 1E+02 1E+04
100%DDI0.01 M NaCl0.02 M NaCl
Nor
mal
ized
Die
lc. P
erm
ittiv
ity
1E-02 1E+01 1E+01 1E+03 1E+05
Frequency (kHz)
1E+03
1E+02
1E+01
1E+00
1E-011E+00 1E+02 1E+04
a
b
c
Figure 5. Normalized dielectric permittivity of kaolinite(dielectric permittivity of kaolinite-water is di-vided by that of pore water) at a constant solidconcentration with different NaCl concentra-tions.
Electrical conductivity
Figures 7 and 8 show the electrical conductivityof kaolin and bentonite at various ionic concentra-tions as a function of frequency. As the ionic concen-
349
KAYA
tration increases, so does the electrical conductivity.Kaolin and bentonite show different electrical con-ductivity behavior at low and high frequencies. Athigh frequencies (MHz range), the electrical conduc-tivity of the bentonite increases. However, this doesnot occur for kaolin, except where the pore water isDDI.
Nor
mal
ized
Die
lc. P
erm
ittiv
ity
1E+01 1E+03 1E+05
Frequency (kHz)
1E+04
1E+03
1E+02
1E+01
1E+00
1E-011E+00 1E+02 1E+04
600% DDI0.01 M NaCl0.02 M NaCl
1E-01
600%DDI0.01 M NaCl0.02 M NaCl
Nor
mal
ized
Die
lc. P
erm
ittiv
ity
1E+02 1E+03 1E+05
Frequency (kHz)
1E+04
1E+03
1E+02
1E+01
1E+00
1E-011E+01 1E+041E+00
a
b
Figure 6. Normalized dielectric permittivity of bentonite(dielectric permittivity of bentonite-water isdivided by that of pore water) at a constantsolid concentration with different NaCl concen-trations.
Because the electrical conductivity of the clayparticles is negligible compared to that of pore water,the measured electrical conductivity should nearlyequal that of water. If the measured electrical con-ductivity of the clay-water mixture is higher thanthat of the pore water, the difference is related tosurface electrical conductivity (Rhoedes et al., 1976).The surface electrical conductivity is defined as thedifference between the conductivity of the interfaceliquid and the conductivity of the interparticle solu-tion (Shainberg and Levy, 1975). The major contrib-utor to the electrical conductivity of the clay-watermixture is the excess of ions at the interface of theclay-water mixtures. By definition, the difference be-tween the conductivity in the range of the double
layer and that of the bulk solution is equal to thesurface electrical conductivity.
Figure 7. Electrical conductivity of kaolinite as a func-tion of frequency.
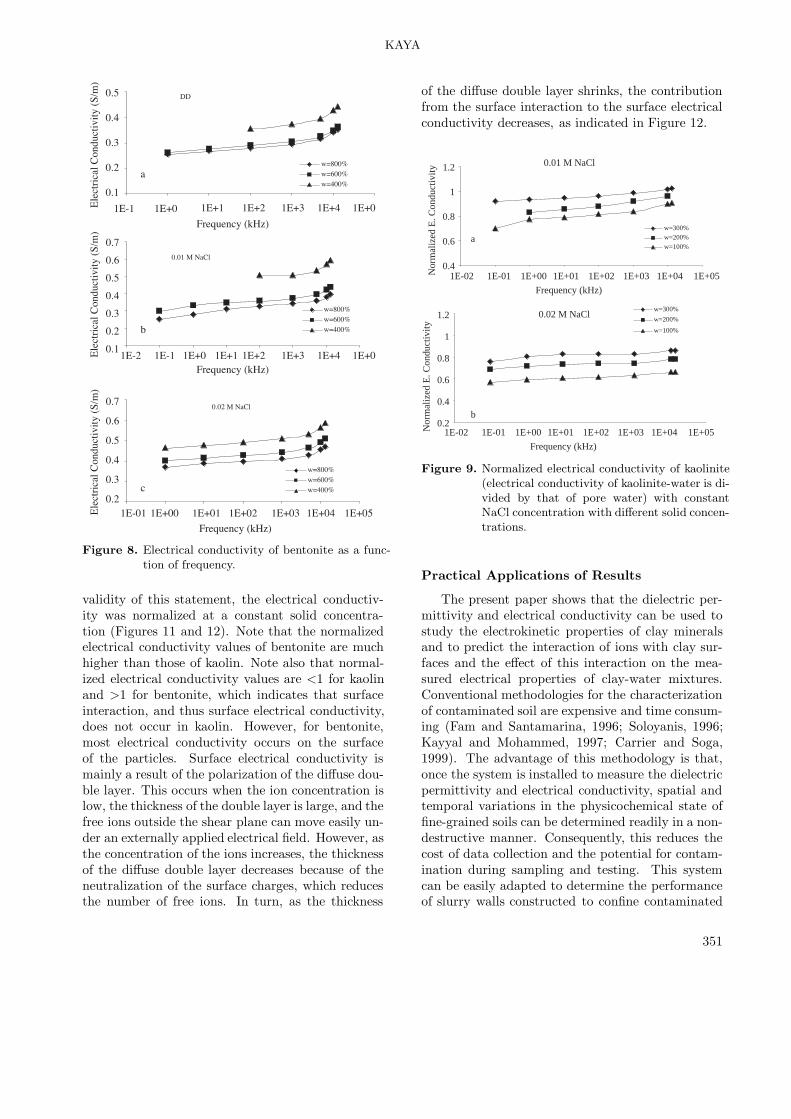
The way to determine the effect of the surfaceelectrical conductivity on the measured electricalconductivity is to normalize the electrical conduc-tivity (Figures 9 and 10). The normalized electricalconductivity of kaolin decreases as kaolin concentra-tion increases in the clay-water mixture, as expected,because the electrical conductivity of the solid parti-cles is much less than that of pore water. In contrast,the normalized electrical conductivity of bentoniteincreases as the solid concentration increases in themixture. This suggests that the contributions of thesurfaces to the measured electrical conductivity aredifferent for kaolin and bentonite. To determine the
350
KAYA
Figure 8. Electrical conductivity of bentonite as a func-tion of frequency.
validity of this statement, the electrical conductiv-ity was normalized at a constant solid concentra-tion (Figures 11 and 12). Note that the normalizedelectrical conductivity values of bentonite are muchhigher than those of kaolin. Note also that normal-ized electrical conductivity values are <1 for kaolinand >1 for bentonite, which indicates that surfaceinteraction, and thus surface electrical conductivity,does not occur in kaolin. However, for bentonite,most electrical conductivity occurs on the surfaceof the particles. Surface electrical conductivity ismainly a result of the polarization of the diffuse dou-ble layer. This occurs when the ion concentration islow, the thickness of the double layer is large, and thefree ions outside the shear plane can move easily un-der an externally applied electrical field. However, asthe concentration of the ions increases, the thicknessof the diffuse double layer decreases because of theneutralization of the surface charges, which reducesthe number of free ions. In turn, as the thickness
of the diffuse double layer shrinks, the contributionfrom the surface interaction to the surface electricalconductivity decreases, as indicated in Figure 12.
0.01 M NaCl
w=300%w=200%w=100%
Nor
mal
ized
E. C
ondu
ctiv
ity
Frequency (kHz)
1.2
1
0.8
0.6
0.41E-02 1E-01 1E+00 1E+01 1E+02 1E+03 1E+04 1E+05
a
b
0.02 M NaClw=300%
w=200%
w=100%
Nor
mal
ized
E. C
ondu
ctiv
ity
Frequency (kHz)
1.2
1
0.8
0.6
0.4
0.21E-02 1E-01 1E+00 1E+01 1E+02 1E+03 1E+04 1E+05
Figure 9. Normalized electrical conductivity of kaolinite(electrical conductivity of kaolinite-water is di-vided by that of pore water) with constantNaCl concentration with different solid concen-trations.
Practical Applications of Results
The present paper shows that the dielectric per-mittivity and electrical conductivity can be used tostudy the electrokinetic properties of clay mineralsand to predict the interaction of ions with clay sur-faces and the effect of this interaction on the mea-sured electrical properties of clay-water mixtures.Conventional methodologies for the characterizationof contaminated soil are expensive and time consum-ing (Fam and Santamarina, 1996; Soloyanis, 1996;Kayyal and Mohammed, 1997; Carrier and Soga,1999). The advantage of this methodology is that,once the system is installed to measure the dielectricpermittivity and electrical conductivity, spatial andtemporal variations in the physicochemical state offine-grained soils can be determined readily in a non-destructive manner. Consequently, this reduces thecost of data collection and the potential for contam-ination during sampling and testing. This systemcan be easily adapted to determine the performanceof slurry walls constructed to confine contaminated
351
KAYA
sites. Both sides of the slurry wall will have dif-ferent dielectric permittivity and electrical conduc-tivity as related to contaminant migration. Fur-thermore, both the dielectric permittivity and theelectrical conductivity of pore fluids upstream anddownstream can be measured, and the contamina-tion source can be identified without elaborate test-ing procedures. Another potential application of thistechnique is in the assessment of growth of contami-nant concentrations in the aqueous phase within spe-cific locations in relatively intact barriers.
1E+05
0.01 M NaCl
Nor
mal
ized
E. C
ondu
ctiv
ity
Frequency (kHz)
6
5
4
3
2
11E-01 1E+01 1E+02 1E+03 1E+04
w=800%w=600%w=400%
0.02 M NaClw=800%w=600%w=400%
1E+00
1E+05
Nor
mal
ized
E. C
ondu
ctiv
ity
Frequency (kHz)
2.8
2.6
2.4
2.2
2
1.8
1.6
1.41E-01 1E+01 1E+02 1E+03 1E+041E+00
a
b
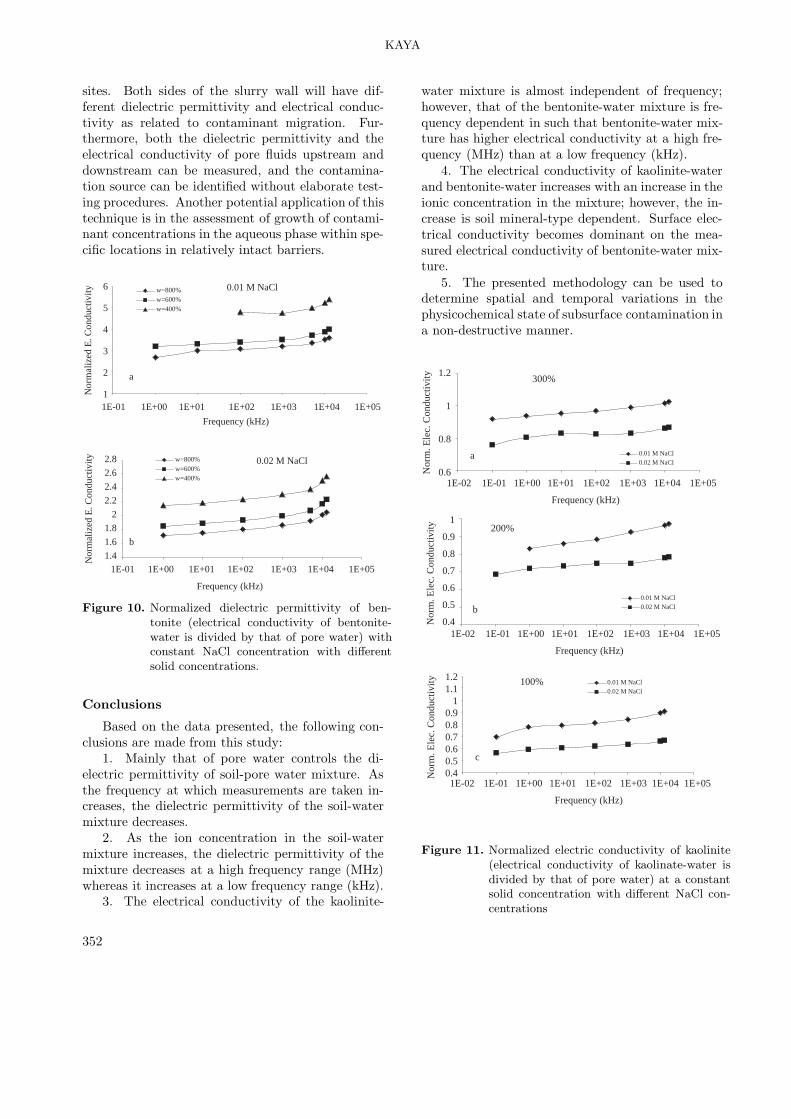
Figure 10. Normalized dielectric permittivity of ben-tonite (electrical conductivity of bentonite-water is divided by that of pore water) withconstant NaCl concentration with differentsolid concentrations.
Conclusions
Based on the data presented, the following con-clusions are made from this study:
1. Mainly that of pore water controls the di-electric permittivity of soil-pore water mixture. Asthe frequency at which measurements are taken in-creases, the dielectric permittivity of the soil-watermixture decreases.
2. As the ion concentration in the soil-watermixture increases, the dielectric permittivity of themixture decreases at a high frequency range (MHz)whereas it increases at a low frequency range (kHz).
3. The electrical conductivity of the kaolinite-
water mixture is almost independent of frequency;however, that of the bentonite-water mixture is fre-quency dependent in such that bentonite-water mix-ture has higher electrical conductivity at a high fre-quency (MHz) than at a low frequency (kHz).
4. The electrical conductivity of kaolinite-waterand bentonite-water increases with an increase in theionic concentration in the mixture; however, the in-crease is soil mineral-type dependent. Surface elec-trical conductivity becomes dominant on the mea-sured electrical conductivity of bentonite-water mix-ture.
5. The presented methodology can be used todetermine spatial and temporal variations in thephysicochemical state of subsurface contamination ina non-destructive manner.
100% 0.01 M NaCl0.02 M NaCl
1.21.1
10.90.80.70.60.50.4
1E+05
Frequency (kHz)
1E-02 1E+01 1E+02 1E+03 1E+041E-01 1E+00
Nor
m. E
lec.
Con
duct
ivity
1E+05
Nor
m. E
lec.
Con
duct
ivity
Frequency (kHz)
1.2
1
0.8
0.61E-02 1E+01 1E+02 1E+03 1E+041E-01
300%
0.01 M NaCl0.02 M NaCl
1E+00
200%
0.01 M NaCl0.02 M NaCl
1E+05
Nor
m. E
lec.
Con
duct
ivity
Frequency (kHz)
1
0.9
0.8
0.7
0.6
0.5
0.41E-02 1E+01 1E+02 1E+03 1E+041E-01 1E+00
a
b
c
Figure 11. Normalized electric conductivity of kaolinite(electrical conductivity of kaolinate-water isdivided by that of pore water) at a constantsolid concentration with different NaCl con-centrations
352
KAYA
600 %
0.01 M NaCl0.02 M NaCl
1E+05
Nor
m. E
lect
. Con
duct
ivity
Frequency (kHz)
4
3
2
1
01E+01 1E+02 1E+03 1E+041E-01 1E+00
b
1E+05
Nor
m. E
lect
. Con
duct
ivity
Frequency (kHz)
4
3
2
1
01E+01 1E+02 1E+03 1E+041E-01 1E+00
800%
0.01 M NaCl0.02 M NaCl
a
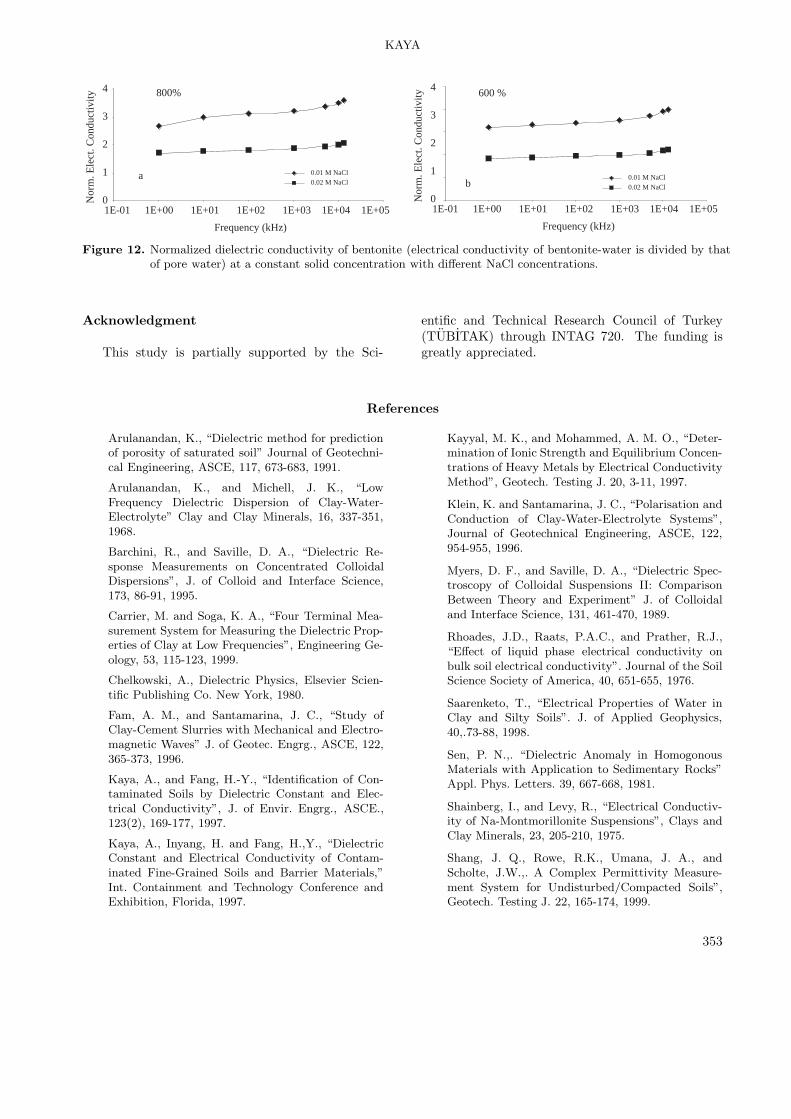
Figure 12. Normalized dielectric conductivity of bentonite (electrical conductivity of bentonite-water is divided by thatof pore water) at a constant solid concentration with different NaCl concentrations.
Acknowledgment
This study is partially supported by the Sci-
entific and Technical Research Council of Turkey(TUBITAK) through INTAG 720. The funding isgreatly appreciated.
References
Arulanandan, K., “Dielectric method for predictionof porosity of saturated soil” Journal of Geotechni-cal Engineering, ASCE, 117, 673-683, 1991.
Arulanandan, K., and Michell, J. K., “LowFrequency Dielectric Dispersion of Clay-Water-Electrolyte” Clay and Clay Minerals, 16, 337-351,1968.
Barchini, R., and Saville, D. A., “Dielectric Re-sponse Measurements on Concentrated ColloidalDispersions”, J. of Colloid and Interface Science,173, 86-91, 1995.
Carrier, M. and Soga, K. A., “Four Terminal Mea-surement System for Measuring the Dielectric Prop-erties of Clay at Low Frequencies”, Engineering Ge-ology, 53, 115-123, 1999.
Chelkowski, A., Dielectric Physics, Elsevier Scien-tific Publishing Co. New York, 1980.
Fam, A. M., and Santamarina, J. C., “Study ofClay-Cement Slurries with Mechanical and Electro-magnetic Waves” J. of Geotec. Engrg., ASCE, 122,365-373, 1996.
Kaya, A., and Fang, H.-Y., “Identification of Con-taminated Soils by Dielectric Constant and Elec-trical Conductivity”, J. of Envir. Engrg., ASCE.,123(2), 169-177, 1997.
Kaya, A., Inyang, H. and Fang, H.,Y., “DielectricConstant and Electrical Conductivity of Contam-inated Fine-Grained Soils and Barrier Materials,”Int. Containment and Technology Conference andExhibition, Florida, 1997.
Kayyal, M. K., and Mohammed, A. M. O., “Deter-mination of Ionic Strength and Equilibrium Concen-trations of Heavy Metals by Electrical ConductivityMethod”, Geotech. Testing J. 20, 3-11, 1997.
Klein, K. and Santamarina, J. C., “Polarisation andConduction of Clay-Water-Electrolyte Systems”,Journal of Geotechnical Engineering, ASCE, 122,954-955, 1996.
Myers, D. F., and Saville, D. A., “Dielectric Spec-troscopy of Colloidal Suspensions II: ComparisonBetween Theory and Experiment” J. of Colloidaland Interface Science, 131, 461-470, 1989.
Rhoades, J.D., Raats, P.A.C., and Prather, R.J.,“Effect of liquid phase electrical conductivity onbulk soil electrical conductivity”. Journal of the SoilScience Society of America, 40, 651-655, 1976.
Saarenketo, T., “Electrical Properties of Water inClay and Silty Soils”. J. of Applied Geophysics,40,.73-88, 1998.
Sen, P. N.,. “Dielectric Anomaly in HomogonousMaterials with Application to Sedimentary Rocks”Appl. Phys. Letters. 39, 667-668, 1981.
Shainberg, I., and Levy, R., “Electrical Conductiv-ity of Na-Montmorillonite Suspensions”, Clays andClay Minerals, 23, 205-210, 1975.
Shang, J. Q., Rowe, R.K., Umana, J. A., andScholte, J.W.,. A Complex Permittivity Measure-ment System for Undisturbed/Compacted Soils”,Geotech. Testing J. 22, 165-174, 1999.
353
KAYA
Soloyanis, S. C., “A Common Sense Sampling Strat-egy to Expedite Hazardous Waste Site Clean up”,Sampling Environmental Media”, ASTM SPT 1282,J. H. Morgan, Ed., 1996.
Thevenayagam, S., “Environmental Soil Charac-terisation Using Electric Dispersion”, Proc. ASCE
Spec. Conf. of the Geoenvironment 2000, ASCE,New York, N. Y., 137-150, 1993.
Topp, G. C., Davis, J. L., Annan, A. P., “Elec-tromagnetic Determination of Soil Water Content:Measurements in Coaxial Transmission Lines” Wa-ter Resources Res., 16, 574-582, 1980.
354
Related Documents