Electrical Resistivity Imaging A Presentation by Mats Lagmanson Advanced Geosciences, Inc. San Antonio, October 24, 2005 Copyright 2005 © by Advanced Geosciences. All rights reserved. This publication, or parts thereof, may not be reproduced in any form without written permission of Advanced Geosciences, Inc.

Welcome message from author
This document is posted to help you gain knowledge. Please leave a comment to let me know what you think about it! Share it to your friends and learn new things together.
Transcript

Electrical Resistivity Imaging
A Presentationby
Mats LagmansonAdvanced Geosciences, Inc.
San Antonio, October 24, 2005
Copyright 2005 © by Advanced Geosciences. All rights reserved. This publication, or parts thereof, may not be reproduced in any form without written permission of Advanced Geosciences, Inc.

Geophysical Electrical Resistivity Surveying
• An electric current is injected into the ground through two electrodes
• The resulting potential is measured between two other electrodes
• Injected current and resulting voltage (potential) is measuredand “apparent resistivity” is calculated.
Apparent resistivity can be seen as a weighted average of thedifferent resistivities under the four electrodes. If the ground is homogeneous the apparent resistivity equals the true resistivity

Apparent resistivityApparent resistivity is a weighted average of the resistivitiesunder the four electrodes. If the ground is homogenous, the apparent resistivity equals the true resistivity
Our EarthImager software is used to invert the apparent resistivitydata to “true” resistivity.

Resistivity Imaging
• The goal is to create an image of the ground in terms of electrical resistivity.
• Because of the large amounts of data needed, the survey is performed by an automatic system.
• Our SuperSting R1 or R8 instruments are specially designed for automatic resistivity imaging surveys.
• The field data is inverted from apparent resistivity to “true”resistivity by the EarthImager software.

Multi-electrode System
Multi-electrode system is a system where a large number of electrodes are attached to the instrument.

Single vs. Multi-channel System
• Single channel instrumentSuperSting R1
• 8-channel instrumentSuperSting R8
A multi-channel instrument is much faster in the field than a single channel instrument. However the final result will be thesame.

Software from AGI
EarthImager 2D
EarthImager 3D

8
Typical Ranges of Resistivity for Some Materials
Rock/material type Resistivity range (Ωm)
Igneous 100 - 1000000Limestone 100 - 10000Sandstone 100 - 1000Sand and gravel 600 - 10000Clay 10 - 100Unconsolidated wet clay 20Soil 1 - 10Fresh water 3 - 100Drill mud, hydraul-EZ 4.5 Sea water 0.2 - 1Copper (native) 0.0000002

Some properties which affect the resistivity of soil and rock
• Porosity, shape of pores, size of pores and connection of pores
• Moisture (water) content• Dissolved electrolytes• Temperature of pore water (resistivity decreases
with increasing temperature)• Conductivity of minerals

Types of Electrical Resistivity & IP Surveys
2D Resistivity Imaging.
• 3D Resistivity Imaging.
• Bore hole to bore hole survey (ERT).
• Resistivity monitoring (time lapse surveys).
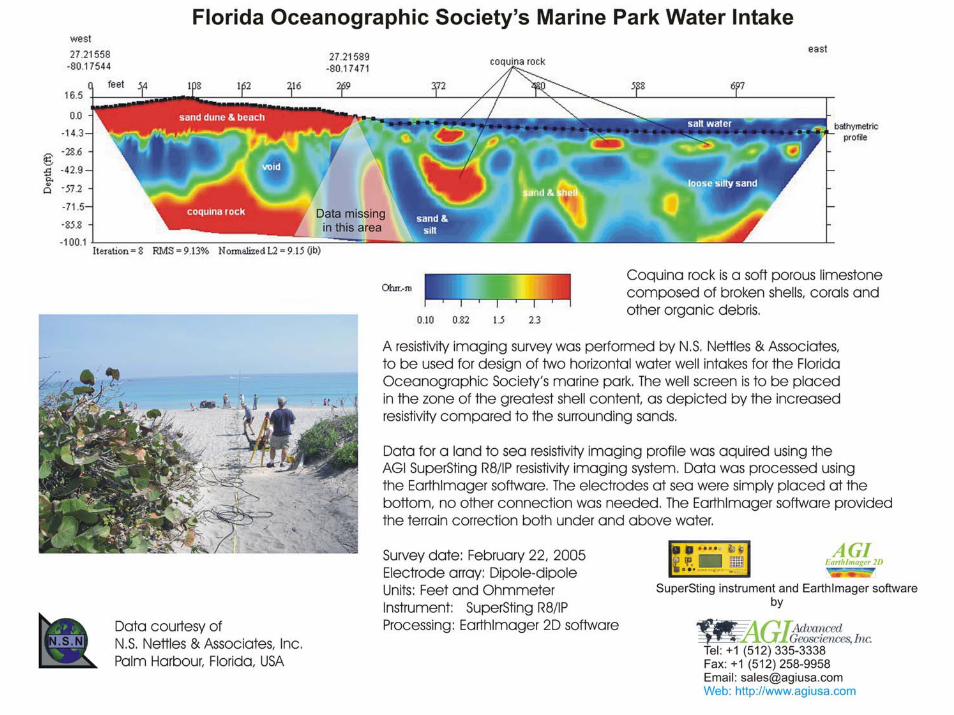
• Aquatic surveys in marine or fresh water environment.
• EarthImager 2D


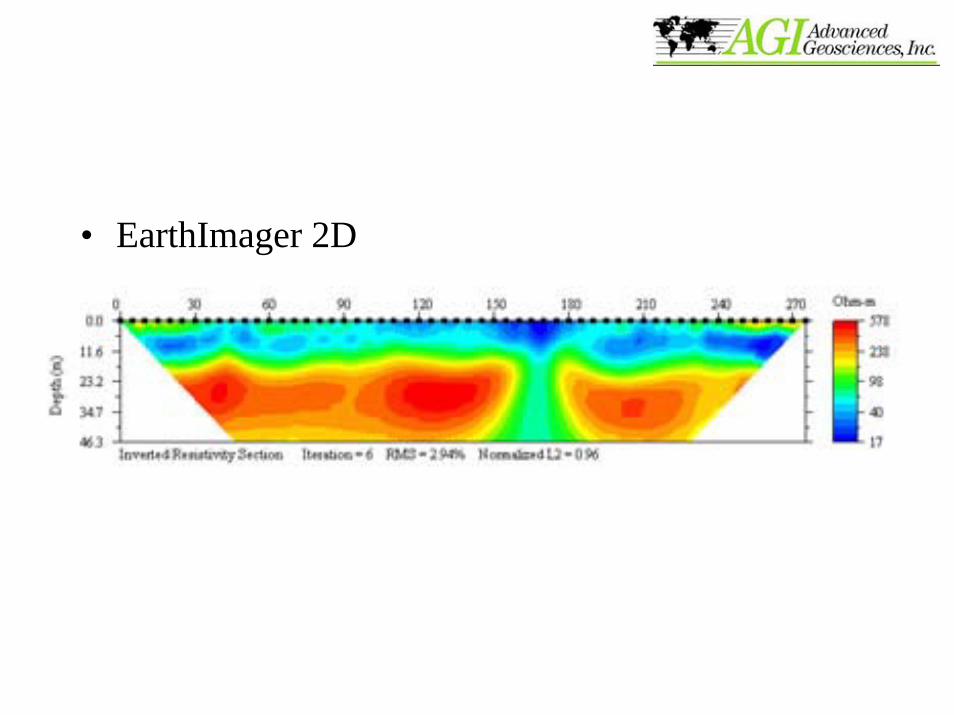
Resistivity survey at the Amistad Dam
One of more than 15 concrete plugged holes, where water leaked out of the dam.
The Amistad dam was leaking under the embankment in the karstic limestone.
The survey was performed along the embankment on the bottom of the almost dry dam


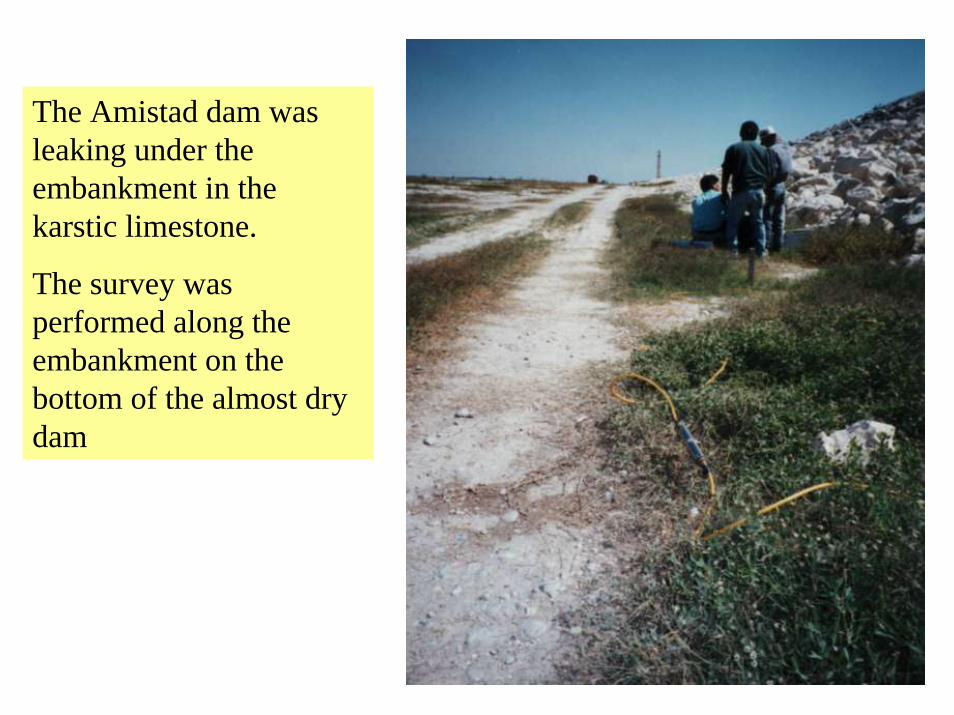
• EarthImager 3D
By removing all resistivities below 2700 Ohmmeter, the approximate extent of the gypsum body could be displayed and the volume calculated.
Processing with EarthImager 3D


Landfill Survey using the Sting/Swift automatic resistivity system, courtesy of SAIC, Middletown Pennsylvania


Layer A Sand
Layer BSandy clay
Layer C Silty clay
Courtesy ofOklahoma State University
© 200312700 Volente Rd Building A, Austin, TX 78726Tel: +1 (512) 335-3338Fax: +1 (512) 258-9958E-mail: [email protected]: http://www.agiusa.com
Direct Push Electrical Resistivity Tomography (ERT)to Delineate an LNAPL Plume
Study Site: Enid, OklahomaObjective: To define the geological controls on the distribution and location of LNAPL
(hydrocarbon) in Enid, OK using electrical resistivity tomography (ERT) with the aid of sedimentological analysis
Conclusions: Data shows that there is a structural dome in the subsurface at the top of layer A along the western side of the site. This structural high corresponds with the LNAPL. LNAPL is normally thought to be a single plume; however, it was found in 1 to 2 meter amorphous ‘blobs’ shown on geoelectrical cross-sections. An overlay of a sedimentological cross-section labeled west to east is shown on top of one geoelectrical cross-section passing through the area of the dome. Drilling in the areas shown to have LNAPL ‘blobs’ revealed that there was indeed LNAPL at that location. ERT with the aid of sedimentological analysis delineated the LNAPL ‘blobs.’
Instrument: SuperSting R8 with borehole cablesDate: August, 2002
Gley
Supporting data from directpush borehole logging system.
Picture shows the study site andgas station where LNAPL escaped.
HydrocarbonHydrocarbon


Resistivity Monitoring

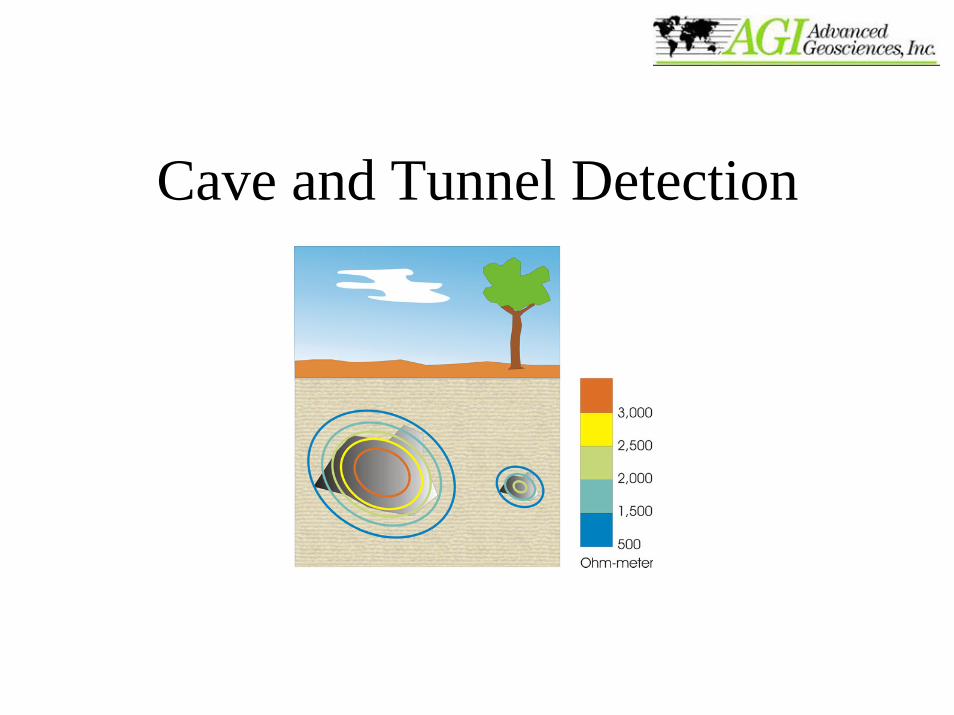
Cave and Tunnel Detection

Cave 1 is a previously known cave. The Sting Cave (Cave 2) was detected during a demonstration survey over Cave 1

Cave detectionA previously unknown cave, the Sting Cave, was detected with the Sting/Swift system

Engineering Geology
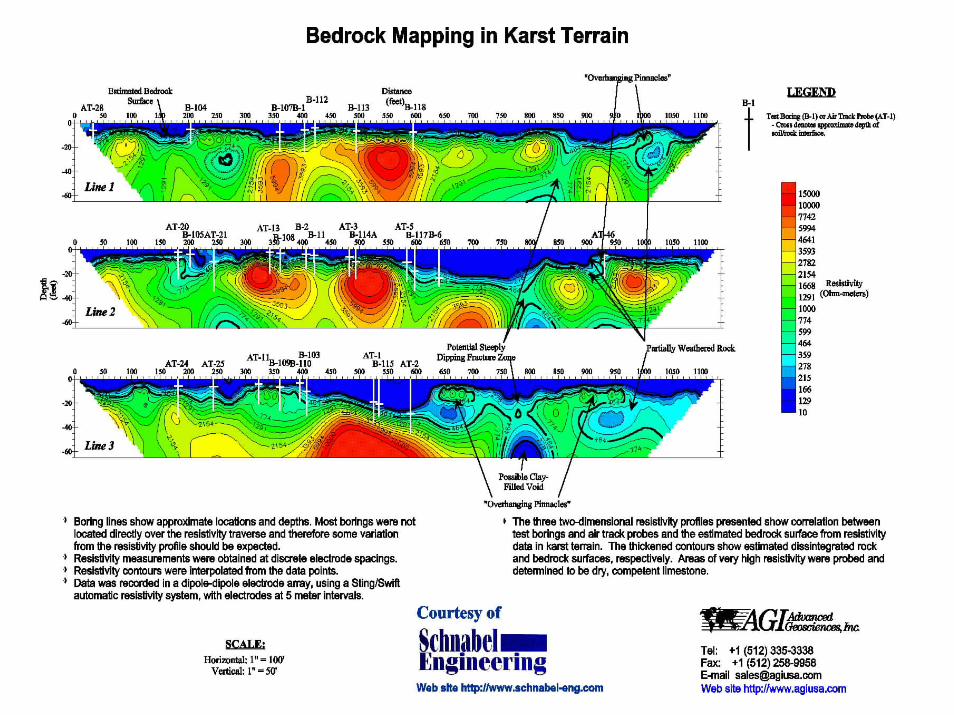
• Mapping Bedrock
• Fracture detection


Aquatic Resistivity Imaging• Towing an electrode
streamer behind a boat
• Electrodes placed on the bottom


Electrical Resistivity Tomography


Instrument prices
Number of electrodes
SuperSting R1/IPSingle channel
SuperSting R8/IP8-channel
28 electrodes $22,484.00 $30,184.00 56 electrodes $30,328.00 $38,228.00 84 electrodes $38,292.00 $46,692.00 112 electrodes $49,296.00 $58,156.00
Prices includes: Instrument, electrode cables, stakes and utility program. EarthImager software is extra. EarthImager 2D is $2,800EarthImager 3D is $3,400EarthImager 2D & 3D combo (both programs on one dongle) is $4,000

If you would like to get more information on the electrical resistivity imaging technique or our SuperSting, automatic Resistivity & IP imaging instrument you can contact me at:
Mats LagmansonAdvanced Geosciences, Inc.
12700 Volente Rd., Bldg. AAustin, Texas 78726
Phone +1 512 335-3338 ext. 111Fax +1 512 258-9958
E-mail [email protected] site http://www.agiusa.com
Related Documents