Electrical Properties of Sandstones of the Morrison Formation GEOLOGICAL SURVEY BULLETIN 1052-J This report concerns work done on behalf of the U.S. -Atomic Energy Commission and is published with the permission of the Commission

Welcome message from author
This document is posted to help you gain knowledge. Please leave a comment to let me know what you think about it! Share it to your friends and learn new things together.
Transcript

Electrical Properties of Sandstones of the Morrison Formation
GEOLOGICAL SURVEY BULLETIN 1052-J
This report concerns work done on behalf of the U.S. -Atomic Energy Commission and is published with the permission of the Commission

Electrical Properties of Sandstones of the Morrison FormationBy GEORGE V. KELLER
EXPERIMENTAL AND THEORETICAL GEOPHYSICS
GEOLOGICAL SURVEY BULLETIN 1052-J
This report concerns work done on behalf of the U.S. Atomic Energy Commission and is published with the permission of the Commission
"JNITED STATES GOVERNMENT PRINTING OFFICE, WASHINGTON j 1959

UNITED STATES DEPARTMENT OF THE INTERIOR
FRED A. SEATON, Secretary
GEOLOGICAL SURVEY
Thomas B. Nolan, Director
For sale by the Superintendent of Documents, U.S. Government Printing Office Washington 25, D.C. - Price 55 cents (paper coyer)
CONTENTS
Page Abstract__________________________________ 307Introduction _____________________________________ 307Electric logging._______________________________________ 308
Equipment and techniques___________________________________ 310Results_____________________________________ 311
Laboratory measurements.____________________________________ 315Nature of rock resistivity.________________________________ 315Resistivity measurements on cores_________________________ 318Spontaneous-potential measurements_______________________ 328
Correlation of laboratory and field data______________________________ 335Quantitative interpretation of logs_________________________________ 340Use of electric logging in exploration_._______________________________ 341References cited_______________________________..__________________ 343
ILLUSTRATIONS
[All plates to pocket]
PLATE 12. Electric, radioactivity, and core logs.13. Correlation of laboratory measurements.
PageFIGUHE 95. Index map of Colorado Plateau__________________________ 309
96. Cumulative frequency curve of resistivity_______________ 31297. Map of Spud Patch area.__________________.___ 31498. Idealized diagram of a single pore structure______________ 31699. Device used in measuring resistivity._____________________ 319
100. Formation factor as function of porosity_________________ 322101. Resistivity index as function of water saturation.__________ 325102. Variations of formation factor__________________________ 327103. Device used in measuring diffusion potentials._____________ 331104. Ion concentration in double layer_______________________ 332105. Sources of potential variations_____-__-___-______--______ 333106. Calculated relationship between spontaneous potential and
connate-water salinity__________________ __________ 334107. Inch-to inch variation of porosity._____________________ 338108. Empirical relationship between porosity, resistivity, and
spontaneous potential_______________________________ 339
TABLES
PageTABLE 1. Quality of logging water__________________________________ 310
2. Apparent salinities associated with clay conductance.-..______ 3283. Results of the quantitative interpretations of electric logs. _ _ __ 341
m

EXPERIMENTAL AND THEORETICAL GEOPHYSICS
ELECTRICAL PROPERTIES OF SANDSTONES OF THE MORRISON FORMATION
By GEORGE V. KELLER
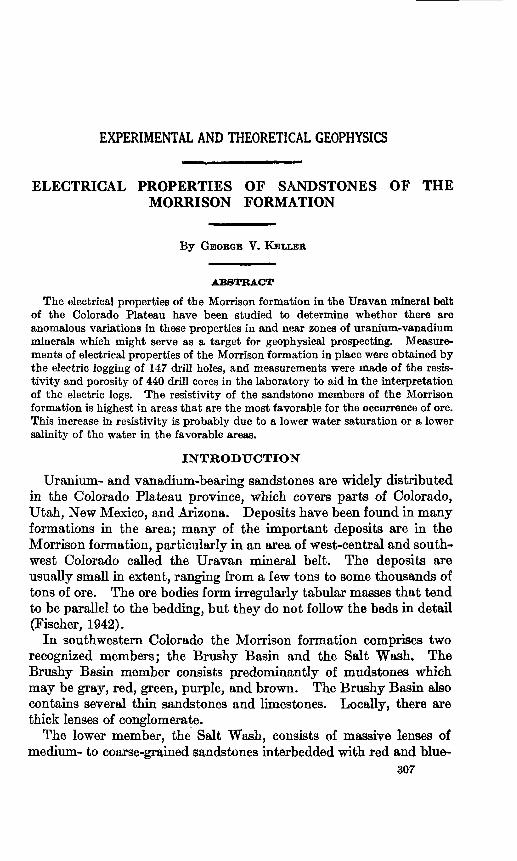
ABSTRACT
The electrical properties of the Morrison formation in the Uravan mineral belt of the Colorado Plateau have been studied to determine whether there are anomalous variations in these properties in and near zones of uranium-vanadium minerals which might serve as a target for geophysical prospecting. Measure ments of electrical properties of the Morrison formation in place were obtained by the electric logging of 147 drill holes, and measurements were made of the resis tivity and porosity of 440 drill cores in the laboratory to aid in the interpretation of the electric logs. The resistivity of the sandstone members of the Morrison formation is highest in areas that are the most favorable for the occurrence of ore. This increase in resistivity is probably due to a lower water saturation or a lower salinity of the water in the favorable areas.
INTRODUCTION
Uranium- and vanadium-bearing sandstones are widely distributed in the Colorado Plateau province, which covers parts of Colorado, Utah, New Mexico, and Arizona. Deposits have been found in many formations in the area; many of the important deposits are in the Morrison formation, particularly in an area of west-central and south west Colorado called the Uravan mineral belt. The deposits are usually small in extent, ranging from a few tons to some thousands of tons of ore. The ore bodies form irregularly tabular masses that tend to be parallel to the bedding, but they do not follow the beds in detail (Fischer, 1942).
In southwestern Colorado the Morrison formation comprises two recognized members; the Brushy Basin and the Salt Wash. The Brushy Basin member consists predominantly of mudstones which may be gray, red, green, purple, and brown. The Brushy Basin also contains several thin sandstones and limestones. Locally, there are thick lenses of conglomerate.
The lower member, the Salt Wash, consists of massive lenses of medium- to coarse-grained sandstones interbedded with red and blue-
307

308 EXPERIMENTAL AND THEORETICAL GEOPHYSICS
gray mudstones. Much of the ore is in sandstones hi the upper part of the Salt Wash member but commonly it is found in the lower parts of the individual sandstone lenses. The Salt Wash is not sharply separated from the Brushy Basin, particularly where there are sand stone lenses in the lower part of the Brushy Basin.
In general, the localization of the ore seems to be related to certain geologic features that can serve as guides to the presence of ore. Such guides are the tendency of the ore to occur in the thicker central parts of sandstone lenses, the association of ore with medium-grained pale-yellow to light-brown sandstone, the association of ore with the thicker parts of mudstone that have been altered from red to gray or gray green, and the association of ore with an abundance of carbona ceous material.
In hopes of delineating favorable areas and locating ore more rapidly and at less expense, various geophysical exploration methods were tested on the Colorado Plateau, beginning in 1949. Electrical- resistivity surveys were tried in several areas, and in several known ore deposits, higher resistivities were noted over the ore zones. How ever, the exact interpretation of these surveys proved difficult, particularly when the ore-bearing member was at a depth of several hundred feet.
In order to determine the possibilities and limitations of surface resistivity surveys, a program of measurements of the electrical prop erties of the Morrison formation was undertaken. The program con sisted of two parts: the measurement of the resistivity of the Morrison formation in place and the measurement of resistivity and associated properties of drill cores with restored water saturations.
Both field and laboratory studies described in this report were made as part of a program carried on by the Geological Survey on behalf of the Division of Raw Materials of the Atomic Energy Commission.
ELECTRIC LOGGING
Measurements in place, consisting of electrical well logs, were made in 147 drill holes (fig. 95) in four areas where surface resistivity surveys had been made previously to determine whether there are any pro nounced differences in the electrical properties of the Morrison forma tion in these areas. In the Spud Patch area of San Miguel County, Colo., 103 measurements were made, so that it was possible to deter mine the areal variation of electrical properties. A smaller number of drill holes, 23 in all, were logged in the Gramlich group of claims at La Sal Creek, Montrose County, Colo. A few holes were also logged at Long Park in Montrose County, Colo., and at Yellow Cat, Grand County, Utah.

ELECTRICAL PROPERTIES OF SANDSTONES 309
Monticello
EXPLANATION
Areas In which electric logt were liken in 1952
r20 UIL£S
FIGURE 95. Index map of the Colorado Plateau showing areas discussed in this report.
The electric logs taken on the Colorado Plateau were of three types: natural-potential measurements, resistivity measurements with a normal electrode arrangement, and resistance measurements with a single-point electrode arrangement. Natural-potential logs are made by recording the voltage between a moving electrode in the drill hole and a reference electrode, usually placed on the ground surface near the drill hole. In the work reported here, resistivity logs with
310 EXPERIMENTAL AND THEORETICAL GEOPHYSICS
radii of investigation of 4, 8, and 24 inches were taken in each drill hole; single-point resistance logs were made to provide sufficient data to determine rock resistivity. By comparing the apparent resistivities measured with these several electrode arrangements, it is possible to estimate the true resistivity more accurately than can be done with a single measurement.
EQUIPMENT AND TECHNIQUES
The electric logging unit used for this work consisted of a three- conductor cable and an electric hoist to raise the electrode sonde through the drill hole. The current to the electrodes was provided by dry batteries, regulated with a servomechanical regulator, and commutated at a frequency of 21 cycles per second. The voltage between pick-up electrodes was rectified with a set of commutator rings coupled mechanically to the current commutator, as in the Gish-Rooney system. This rectified current was recorded on one channel of a modified servomechanical recorder, calibrated in ohm- meters.
The spontaneous potential, present as a d-c voltage between the pickup electrodes, was separated from the 21-cycle resistivity-logging current by means of a blocking condenser and recorded simultaneously on the other channel of the recorder, which was calibrated in millivolts.
The chart drive of the recorder was controlled by a selsyn motor coupled to a selsyn generator on a calibrated sheave over the drill hole. The logging cable passed over this sheave as it was lowered or raised in the drill hole, so that the paper in the recorder was driven forwards or backwards through the recorder. Paper drive ratios of 1 inch to 20, 50, and 100 feet of electrode movement were used.
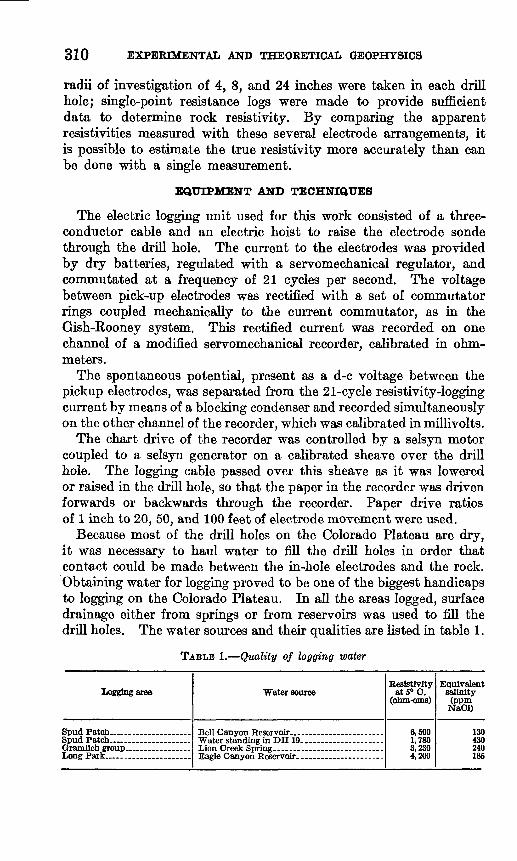
Because most of the drill holes on the Colorado Plateau are dry, it was necessary to haul water to fill the drill holes in order that contact could be made between the in-hole electrodes and the rock. Obtaining water for logging proved to be one of the biggest handicaps to logging on the Colorado Plateau. In all the areas logged, surface drainage either from springs or from reservoirs was used to fill the drill holes. The water sources and then- qualities are listed hi table 1.
TABLE 1. Quality of logging water
Logging area Water sourceResistivity
at5°C. (ohm-cms)
6,5001,7803,2304,200
Equivalent salinity
(ppm NaCl)
130430240185

ELECTRICAL PROPERTIES OF SANDSTONES 311
RESULTS
Analysis of the electric logs showed that the resistivity of the several members of the Morrison formation in the drill holes that were logged ranged from a low of 8 ohm-meters to a maximum of 2,000 ohm-meters. The resistivity of the mudstone members ranged from 8 ohm-meters to 35 ohm-meters, and the average resistivity did not change greatly from drill hole to drill hole.
The average resistivity of the sandstone members of the Morrison formation within any one drill hole showed a greater variation, rang ing from 130 ohm-meters to 430 ohm-meters. Moreover, the resis tivity of the sandstone within any one drill hole showed wide varia tions about the average.
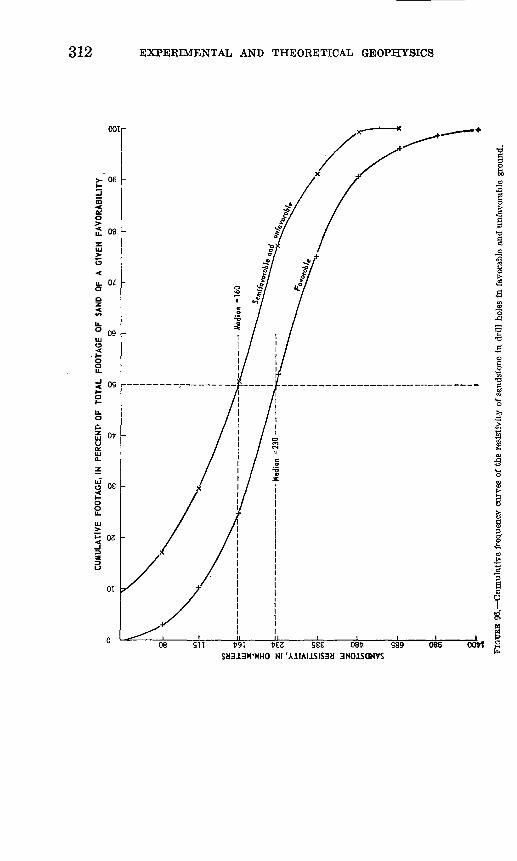
An apparent correlation was noted between resistivity of the sand stone and favorability for occurrence of ore as determined by geologic guides. This apparent correlation was studied in more detail by a statistical analysis of the resistivity logs of 35 drill holes in which the complete section of the ore-bearing member had been logged. Of these 35 drill holes, 20 had been classed as favorable with respect to geologic guides, and 15 were considered to be semifavorable or unfavorable. The logs were studied by taking resistivity intervals of progressively larger size; 56 to 80 ohm-meters, 80 to 115 ohm-meters, and so on up to the interval 1,400 to 2,000 ohm-meters. The number of feet of sandstone in each of these classes in each group of drill holes was then measured. These data are presented on a cumulative frequency graph in figure 96. The shape of the curves indicates that the number of feet of sandstone of a given resistivity is a statistically normal varia ble when the resistivity is considered logarithmically. The curve for favorable sandstones is significantly different from the curve for semi- favorable and unfavorable sandstones; the median of the curve of resistivity in favorable sandstones is 50 percent higher than that in the less favorable sandstones.
In addition to the generally higher resistivities found in the drill holes in more favorable ground, especially high resistivities were found in drill holes through mineralized ground at approximately the depth of mineralized area. Plate 12 shows the electric logs, the core logs, and the radioactivity logs of seven typical drill holes through mineralized ground.
With one exception, a thin layer of high resistivity is found near the depth of the radioactivity anomaly. This exception is drill hole SP 210 (pi. 12.4), in which there is a small increase in resistivity at the depth of the mineralized ground. In other holes, (pi. 12(7, F), the high-resistivity layer is the most striking feature of the log. In the remaining examples the resistivity of the ore zone is one of the highest recorded on the log but is not so large as to be outstanding.
496731* 59 2
312 EXPERIMENTAL AND THEORETICAL GEOPHYSICS
08 9TT see oet sssSM313W-WHO Nl 'A1IAI1SIS3H 3N01SQNVS
086 OOlrl 2

ELECTRICAL PROPERTIES OF SANDSTONES 313
The resistivity anomaly occurs in the upper part of the radio activity anomaly or is offset up the hole by 1 or 2 feet. This offset indicates that the anomaly is not directly associated with mineralized ground but may be caused by some other factor. The combination of high resistivity and high natural-potential deflection shown by the logs in plate 9 indicates that the anomalous layer has a low saturation of water of high salinity. This relation in turn implies that the layer has been subject to an extreme amount of evaporation, as if it had high permeability. The mineralized layer seems to be covered by a desaturated caprock that gives rise to a resistivity anomaly.
One of the geologic guides to ore is the association of ore with the thicker Salt Wash sandstone. Because of this association and the observation that the resistivity of the sandstones in drill holes through mineralized ground is generally higher than the resistivity in drill holes in unfavorable ground, it was reasoned that a combined measure of sandstone thickness and resistivity would be a sensitive index to the favorability of a drill hole. To check this, the area under the 8-inch normal-resistivity logs was planimetered for the drill holes in which logs were obtained for 60 percent or more of the ore-bearing sandstone. None of the sandstones in the overlying Brushy Basin were included in these measurements. When a log did not cover the entire thickness of ore-bearing sandstones, it was assumed that the average resistivity in the unlogged section was the same as in the logged section, and the resistivity integral was extrapolated to include the unlogged section of the sandstone.
The 8-inch normal curve was used in these studies, as no correction is necessary for the influence of mud resistivity and hole diameter. In all holes the mud resistivity was 65 ohm-meters, within an accuracy of 20 percent. The diameter of each hole was 3 inches. Corrections for these conditions are less than 10 percent for all resistivities less than 2,500 ohm-meters and for beds thicker than 3 feet according to Schlumberger departure curves. Corrections may be made for thinner beds, but such corrections usually are no more accurate than the original data.
These measurements were made for 58 drill holes of the Spud Patch area; the resulting integral ranged from 3,800 to 29,600 ohm- meter-feet. A contour map (fig. 97) of these data shows six pro nounced features, three highs and three lows. The highs include all but one of the drill holes through mineralized ground and many of the drill holes through favorable ground. One drill hole through mineral ized ground occurs in a low, but this drill hole was classed as un favorable according to geologic guides. The low areas include all the drill holes in unfavorable ground and a majority of the drill holes in semifavorable ground.

Dril
l ho
le
Dril
l ho
le c
lass
ed a
s se
mifa
vora
ble
o D
rill
hole
cla
ssed
as
unfa
vora
ble
a
at jr
Drill
hole
s w
hich
sho
w h
igh
valu
es o
n ra
dia
tion l
og
z=to
pO
f san
dv»
z=C
onto
ur o
f/ /
>(z
)dz
J
z= z(=
botto
m o
f sa
nd
Con
tour
in
terv
al
2.5
ohm
- Kilo
me
ter-
fee
t
2000 F
EE
T
FIG
URE
97
. I

ELECTRICAL PROPERTIES OF SANDSTONES 315
LABORATORY MEASUREMENTS
To interpret the logs quantitatively in terms of texture and compo sition it is necessary to have detailed information on the properties of the rock, such as can be obtained by the physical analysis of cores. Usually this additional information is obtained from resistivity measurements on cores taken from a typical drill hole. These measurements are designed to determine how rock resistivity depends upon the rock texture and the composition of the contained water. The results are then extrapolated to drill holes from which no cores have been studied.
NATURE OF ROCK RESISTIVITY
The electrical conductivity of sedimentary rocks such as those which comprise the Morrison formation is readily shown to be a consequence of the presence of small amounts of water in the rock. If a sedimentary rock is dried completely, it is an insulator. However, if even a small amount of water is present, a rock exhibits an ap preciable capacity to conduct electric currents. Because the conduc tion is ionic, rather than electronic as in metals, the nature of the conductivity of the rock and water combination is more complex than if the conduction were metallic.
Current conduction in sedimentary rocks can be understood by considering what happens in a small portion of the pore structure. Clastic detrital rocks, such as the sandstones and mudstones which constitute the Morrison formation, consist of a network of void spaces separating the solid grains. These void spaces, or porosity, can be classified into two general types of pores. Most of the void spaces are relatively large, for the most part equidimensional pores that make up the storage capacity of the rock. The remainder are small elongated channels that connect the larger voids. These channels are only a small part of the total porosity, but they are the primary factor in controlling current conduction because of their small cross-sectional area. To aid in visualizing this, the concept of the ideal porelet (fig. 98) is useful. The porelet consists of a spherical body, or storage chamber, with small tabular extensions that connect with other porelets. Clay particles are shown lining this porelet, particularly in the small connecting pores, where the clays tend to occur. A porous isotropic rock can be thought of as consisting of a large number of these porelets, randomly oriented and connected to each other in a geometrically complicated manner.
If such a rock were fully saturated with a brine solution, the resist ance presented to an electrical current would depend on the length of the connecting pores, their cross-sectional area, the average angle that

316 EXPERIMENTAL AND THEORETICAL GEOPHYSICS
Water Exchange positionse
Anions Clay particles
FIOUKE 98. Idealized diagram of a single pore structure, or porelet, showing the features which control theresistivity of a rock.
the porelets make with the overall direction of current flow, and the total number of porelets per unit area.
In the study of the resistivity of porous materials, it has become customary to use a quantity designated by the term "formation factor," which is the resistivity of the bulk material, such as the rock, divided by the resistivity of the conductive material in it, such as the brine. In simple ohmic conduction, the formation factor would be a constant for a given rock, and would represent the ge ometric distribution of the porelets as described above. The forma tion factor would decrease as the volume of conductive material, or number of porelets, increased. Similarly, as the degree of consolida tion of the rock increased and the size of the connecting tubes was reduced by the deposition of cement, the formation factor should increase. The relationship between electrical resistivity and porosity has been determined empirically as:
F=c<t>" (1) where
F is the formation factor as defined above, <f> is the porosity,
and
c and * are constants determined by the various dimensions of the porelets.
This equation implies that the resistivity of the brine within the pores is known or can be measured. Generally it is assumed that the conductivity of the brine in the pores is due solely to the presence of ionized salts and is the same as the conductivity of a similar brine outside the rock. This is not always true. If a rock contains any surface-active material, such as clay, there may be a reaction between the water and the rock that tends to increase the conductivity of the rock. This effect is known as double-layer conductivity, because it is

ELECTRICAL PROPERTIES OF SANDSTONES 317
related to the presence of a Helmholtz double layer of charge on the surfaces of the clay particles (Winsauer, and McCardell, 1952).
Many different phenomena can occur when water comes in contact with these clays in the rock. Many clays, such as montmorillonite and illite, are colloidal electrolytes. These clays have a number of cations in their crystal structure that are free to leave the clay particle and go into a state resembling ionic solution. The number of these cations and the ease with which they may leave the clay particle depend on the type of clay, the type of ion that is in the exchange position, and the nature of the brine in contact with the clay. The exchangeable cations that leave the clay add to the capacity of the water to conduct current, but the mobility of these ions may not be the same as in true ionization because of the presence of the charged clay particle or micelle.
More complex reactions may occur also. Over certain ranges in salinity of the external solution, the plates of the clay particle become separated as water molecules are attracted between them by the unsatisfied electrical charges of the exchange positions. Under these conditions the clay will swell to many tunes its original size, the viscosity of the clay-water mixture will be increased, and the cross section available for current conduction will be reduced.
As the salinity of the water in the pores is increased, the relative effect of the ions added by cation exchange becomes small. As a result, resistivity measurements made with a high-salinity brine saturating the rock generally approach the constant formation factor expectable if the clay were not present.
In nature the pore space in most rocks is only partly filled with water. As a result, the rock has a higher resistivity than if it were completely saturated. In studying the effect of saturation on re sistivity, it is common practice to use a quantity called designated by the term "resistivity index." This index is the resistivity of a rock partly saturated by water divided by the resistivity of the same rock fully saturated with a brine of the same composition.
As the water saturation of a rock is reduced, water is first removed from the centers of large voids (fig. 98), because the water is held in the smaller pores by capillary tension. The removal of water from these larger pores increases the distance that the current has to flow through the pore and decreases the cross-sectional area available for current conduction. Ideally the process continues until all the water is removed from the pores with the exception of a uniform coating over the pore walls. If there is further reduction hi water content, the water film in a pore becomes discontinuous; and the remaining water in that pore is unavailable for current conduction. The result is a rapid increase in resistivity as the water content is reduced beneath

318 EXPERIMENTAL AND THEORETICAL GEOPHYSICS
the critical saturation. It has been found (Keller, 1953) that the relationship between resistivity and saturation generally takes the form:
where7 is the resistivity index defined above,Sw is the water saturation, expressed as a fraction of the total pore space,n\ is the saturation exponent at high-water saturation,n2 is the saturation exponent at low-water saturations,S*>e is a critical water saturation separating high- and low-water saturations,
anda is a constant that enters the equation at low-water saturations.
As this discussion indicates, in order to specify the resistivity of a rock from measurable quantities, it is necessary to know the influence of the water saturation, porosity, and clay content individually on resistivity. To determine this influence, a series of measurements was made on cores from six Spud Patch drill holes. Three groups of resistivity data and one group of natural-potential data were obtained.
RESISTIVITY MEASUREMENTS ON CORES
To study the relation between resistivity and porosity, a group of 346 cores was selected. These cores were taken at intervals of 1 to 2 feet through the sandstone members penetrated in the 6 drill holes. The cores as they came from the coring bit were l%e inches in diameter and a few inches to several feet long. The cores at the selected depths were faced with a diamond cut-off wheel to a length of 1 inch. The flat faces of these cores were then coated with a conductive silver paint such as is used in printed electronic circuits.
The cores were saturated with tap water and permitted to soak in tap water for 2 weeks; the water was changed daily to remove any salt remaining from the original water saturation. At the end of the soaking period the electrical resistance between the silver-coated faces of the cores was measured by placing the core in a clamp con sisting of two lead-plated brass plates in contact with the ends of a core (fig. 99). The resistance between these brass plates and through the core was measured with a Wheatstone bridge circuit. A 20-cycle- per-second current was caused to flow through the bridge and regulated so that a constant 5 milliamperes of current flowed through the core. The null position of the Wheatstone bridge was detected with an oscilloscope.
After the resistances had been measured, the cores were dried for 6 hours at 105° C. The dried cores were then weighed and placed in a vacuum dessicator. The pressure was reduced to a few millimeters of mercury for a period of 2 to 4 hours.

ELECTRICAL PROPERTIES OF SANDSTONES 319
Screw clamp
Swivel joint
Brass plate, lead*coated
Sandstone core with silver-coat ed faces
Brass plate,- lead-coated
Core clampOscilloscope
Milliammeter B
FIOUBE 99. Device used in measuring resistivity of cores.
When the air had been removed from the cores, a deaerated salt solution containing a known amount of sodium chloride in solution was introduced into the dessicator. The cores were covered with this salt solution and subjected to atmospheric pressure, forcing the salt solution into the pore spaces of the cores. The cores were reweighed, and the resistance between silvered faces was measured as before. The volumes of the cores were determined by weighing them while they were suspended in a salt solution of the same composition as the one with which they were saturated.
4967*1-

320 EXPERIMENTAL AND THEORETICAL GEOPHYSICS
The resistivity of the salt solution, which contained 30,000 ppm? sodium chloride, was determined from tables and checked with a calibrated dip cell.
The volume of the salt solution in the cores was calculated_from thefollowing equation:
, W2-W1 W2 -W3
where
(3)
0W is the fraction of tiie total volume of the core occupied by brine, Wi is the weight of the dry core,Wz is the weight of the core saturated with salt solution, and Wz is the weight of the core suspended in salt solution.
The quantity <£ is the effective porosity to water, which would be- only slightly smaller than the total porosity because of the method by which the cores were saturated.
The resistivity of the cores was readily determined from:
where
r is the radius of the core,I is the length of a core,RI is the resistance of a core saturated with tap water, andRa is the resistance of a core saturated with salt solution.
Resistivity at very high brine salinities should be approximated by this formula because the conductivity of the core saturated with tap water is considered to be in parallel with the conductivity of the brine when the core is saturated with salt solution, and the error caused by the action of clay and the presence of an unknown amount of salt from the original connate water is approximately corrected. Inas much as this correction does not exceed 10 percent, the assumption that the two conductances are parallel is accurate within 1 percent.
The formation factor was determined for each core by dividing resistivity of the rock by the resistivity of the salt solution used to- saturate the cores.
Because of the large number of measurements, it was possible to- determine an empirical relation between formation factor and porosity by a statistical method. The data were grouped into 11 classes or ranges of porosity: 14.01 percent to 15.00 percent, 15.01 percent to 16.00 percent, and so on. Then it was assumed that the logarithms of the formation factors in each group were normally distributed about some mean. This mean of the logarithm of formation factor

ELECTRICAL PROPERTIES OF SANDSTONES 321
was calculated for each of the 11 intervals, and a standard deviation was calculated for each group by the formula:
S(logF-logF)2N
whereVP is the standard deviation of log F,N is the number of cores in any one porosity class,
tiand» log F is the average value of log F.
The standard deviation of the mean value of the logarithm of the- formation factor was also computed from the equation:
where o^ is the standard deviation of the average value of log F. In figure 100 the mean values of the formation factor have been plotted as a function of the mean values of the porosities in each, class. The table from which this graph was plotted is given below. The 95-percent confidence limits of the means are indicated by the length of the bar through each point, and the 95-percent confidence limits of the individual datum points are indicated by the dashed lines.
Number of cores
44...-.-.... .. 29-. 39... ........... . .......44- 37..... .................34.........................
Average porosity (percent)
21.719.518.417.516.515.5
Average formation
factor
16.820.700 (S
26.129 931.6
Number of cores
16 34 25oooo
Average porosity (percent)
14.313.111.07.22.6
Average formation
factor
39.840.860.1
101.0296.0
The equation of the form of equation 1 that best fits these data between porosities of 14 percent and 23 percent is:
The data for lower porosities are probably unreliable because of the difficulty of obtaining uniform saturation in cores with low porosity and poor permeability.
A smaller group of cores, 45 in all, was selected for study of resistivity as a function of water saturation. These cores were prepared in the- same manner as those used in the study of formation factor. The cores were leached in tap water, weighed, dried, and saturated with a salt solution containing 7,500 ppm sodium chloride. The porosity-

322 EXPERIMENTAL AND THEORETICAL GEOPHYSICS
§8S
/
i p o o c i P * ift 9
'
| t a«* c (
o! j1
:
x
P 8 8 2«
95-percent confidence limits of means of formation 'factors
+
95-percent confidence limits of individual values of formation
factor
/
/
/
<,f
/^
;
X
r/
» eo r- <o «
l>
f
f
J/i
I//<
g 8 8 g 8 ' 8 § 8 8 g » « r- «
//X
* 1* 0
/
/
/
s
r
/
/
s'
'
X
^
2 5 10 20 80 100 200 500 700
'FORMATION FACTOR*
FIOXTBE 100, Formation factor as function of porosity.
0 IO * 10 CM
Nl 01 3AllD3dd3

ELECTRICAL PROPERTIES OF SANDSTONES 323
and formation factor of these fully saturated cores were determined as before.
In order to reduce the water content of the cores to partial satura tions, groups of these cores were permitted to dry slowly in air. As evaporation progressed, the weights and resistances of the cores were measured at intervals of approximately 30 iniriutes. The resistivity was then calculated as in the previous expedients. The instantaneous water saturation of a core was determined from the equation:
where8W is the water saturation expressed as a fraction of its maximum value, Wi is the instantaneous weight of a core during evaporation, s is the weight of sodium chloride in a core,
andWi and Wt are the weights of the dry core and core saturated with salt
solution.
The amount of salt in a core is constant, so that as the water evapo rates from the core, the salinity of the remaining water increases. Thus, the resistivity of the water decreases as the saturation decreases. In order to calculate the resistivity index, it is necessary to determine the instantaneous resistivity of the saturating water from tables. Then the resistivity index can be computed from the equation:
7=^--^ (9)Pwi PlOO
wherepi is the instantaneous value of the core resistivity at the water saturation Sn, pwi is the instantaneous value of water resistivity at the saturation 8W, pw is the water resistivity before evaporation,
andPIOO is the resistivity of the core at 100-percent water saturation.
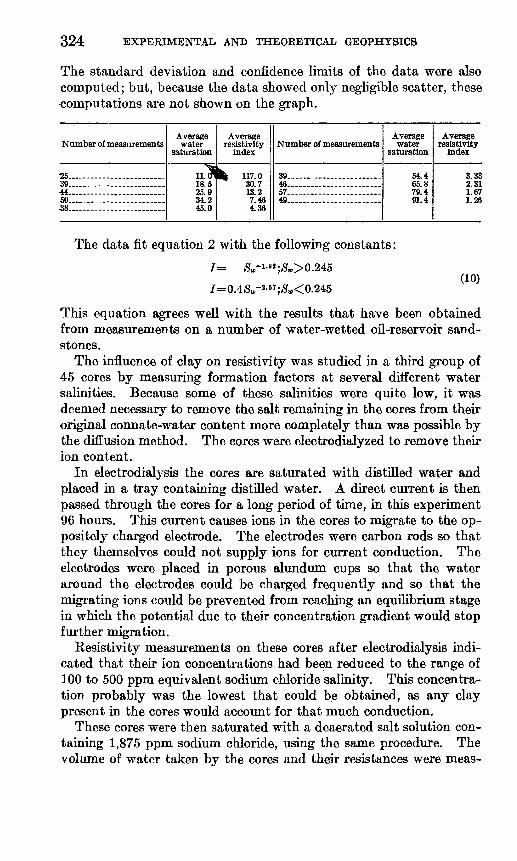
A total of 387 measurements of / and Sw were made on 45 cores. The results of these measurements are summarized graphically in the table below and in figure 101. These data were treated statistically in the same manner as the data on formation factors. The data were divided into groups according to class intervals of water satura tion. It was then assumed that in each class the values of the loga rithm of resistivity index are distributed normally about some mean value. The mean values were calculated and are shown in figure 101.
324 EXPERIMENTAL AND THEORETICAL GEOPHYSICS
The standard deviation and confidence limits of the data were also computed; but, because the data showed only negligible scatter, these computations are not shown on the graph.
Number of measurements
25 39 44 . ._ 50 38
Average water
saturation
H ii.<n18.525.93d. 9
45.0
Average resistivity
index
Ifc 117.030.713.27 4ft
4.36
Number of measurements
39 46 57 49
Average water
saturation
54.465.879.491.4
Average resistivity
index
3.332.311.671.26
The data fit equation 2 with the following constants:
/=(10)
This equation agrees well with the results that have been obtained from measurements on a number of water-wetted oil-reservoir sand stones.
The influence of clay on resistivity was studied in a third group of 45 cores by measuring formation factors at several different water salinities. Because some of these salinities were quite low, it was deemed necessary to remove the salt remaining in the cores from their original connate-water content more completely than was possible by the diffusion method. The cores were electrodialyzed to remove then* ion content.
In electrodialysis the cores are saturated with distilled water and placed in a tray containing distilled water. A direct current is then passed through the cores for a long period of time, in this experiment 96 hours. This current causes ions in the cores to migrate to the op positely charged electrode. The electrodes were carbon rods so that they themselves could not supply ions for current conduction. The electrodes were placed in porous alundum cups so that the water around the electrodes could be charged frequently and so that the migrating ions could be prevented from reaching an equilibrium stage in which the potential due to their concentration gradient would stop further migration.
Resistivity measurements on these cores after electrodialysis indi cated that their ion concentrations had been reduced to the range of 100 to 500 ppm equivalent sodium chloride salinity. This concentra tion probably was the lowest that could be obtained, as any clay present in the cores would account for that much conduction.
These cores were then saturated with a deaerated salt solution con taining 1,875 ppm sodium chloride, using the same procedure. The volume of water taken by the cores and their resistances were meas-

ELECTRICAL PROPERTIES OF SANDSTONES 325
7
if> 3
3; a
NI 'NOi'ivanivs

326 EXPERIMENTAL AND THEORETICAL GEOPHYSICS
ured. Following this, the cores were dried and saturated a second time with a salt solution of 1,875 ppm sodium chloride. The cores were saturated for only a short period, about 30 minutes, so that the salt remaining in a core from the first saturation would not have a chance to diffuse into the external salt solution. In this way, the second salt solution when it entered the cores would take up the salt from the first saturation into solution, and result in a solution contain ing 3,750 ppm sodium chloride. This process was repeated to obtain saturations of 7,500, 15,000, 30,000, 60,000 and 120,000 ppm sodium chloride. Each time the cores were weighed both dry and saturated^ and the resistances measured.
Eesistivities were calculated from the resistance measurements, and these were used to determine apparent values of the formation factor corresponding to each water salinity. It was found that as the salinity of the saturating water increased, the formation factor increased to a maximum and then decreased slightly at very high salinities.
The data were treated statistically as before by dividing the cores into two groups: those with high porosities and those with low. The percentages that the formation factor at a given salinity deviated from the formation factor of the same core at the highest salinity was. calculated by the formula:
Percent deviation: (11)
where F0 is the formation factor of a core saturated with a brine of 120,000 ppm sodium chloride, and F is the formation factor at any other salinity. It was then assumed that these deviations were normally distributed about some average value for each water salinity and for each porosity group. The average values were computed, as well as the 92-percent confidence limits of these averages; the results of the measurements and computations are shown in the table below and in figure 102. The deviations for the low-porosity cores are higher than those for the high-porosity cores, as expected. The negative deviations shown in figure 102 are unexpected, but they possibly arise from an increase in the viscosity of the brine-clay mixture in the cores over that range of salinity, or possibility from progressive errors in the water salinities during the repeated saturations.
Brine resistivity (ohm-cm)
6.7 _ ......11.4 -. ......20.0 ..38.0 .-
Mean (l-£o)of!2 cores in group 1
0.000-.006-.044-.050
Mean (l-£)of33
cores in group 2
0.000-.018-.030
Brine resistivity (ohm-cm)
ftn n158.0 _285.0
Mean(«-*)«»cores in group 1
-0. 193-.321
.545
Mean04,) °f33cores in group 2
-0.065-.024
.424

ELECTRICAL PROPERTIES OF SANDSTONES 327
^ Nl \
./<o /
8.5 ?s2 * xl
<N it O^i-L
« ogl2-S**" Itt
o SU *
per mea
o 5
(j-l)OOl

328 EXPERIMENTAL AND THEORETICAL GEOPHYSICS
It is evident that the data do not precisely fit the concept of the clay (or double-layer) conductivity electrically in parallel with the brine conductivity. The apparent salinity added to the brine in the core was calculated for several salinities and the results are given in table 2.
TABLE 2. Apparent salinities associated with clay conductance
Salinity of the saturating brine (ppm)
1,875... 3,750.. 7,600.. ...15,000.. 30,000...-..-
Equivalent salinity of clay (ppm)
Group 1 (low porosity)
3,700 2,800 2,500 2,000
-1,000
Group 2 (high porosity)
1,900 1,300
500 -300 -200
SPONTANEOUS-POTENTIAL MEASUREMENTS
The measurement of the natural potentials existing in a fluid-filled drill hole was first described by the Schlumbergers and Doll (1934). They attributed the differences in potential that could be measured between adjacent sand and shale beds in a drill hole to a combination of diffusion and electrokinetic potentials. The diffusion potential was said to arise from a difference in ion concentrations between the fluid in the drill hole and the fluid in the rock and to obey Nernst's equation:
emf=Klog (12)
whereK is a constant dependent on ion mobilities,pm is the resistivity of the water in the drill hole, andpw is the resistivity of the water contained in the rock around the drill hole.
The electrokinetic potential was attributed to the flow of the electrolyte from the drill hole past the solid surfaces of the sand grains as water is forced from the drill hole into the rock around it. This flow would give rise to an electrokinetic potential given by the equation (Wyllie, 1951):
emf=fcP» (13)
where P is the pressure differential between the drill hole and the rock, and k and y are constants dependent on the nature of the moving fluid and the properties of the solid surface along which the fluid is moving.
Unfortunately, even when this streaming potential can be taken into account, the remaining potential is usually too large to be explained by the Nernst equation. Only recently has a satisfactory explanation been given for the mechanism involved in the generation

ELECTRICAL PROPERTIES OF SANDSTONES 329
of the diffusion potential in clay-bearing rocks. McCardell, Winsauer, and Williams (1953) have studied the diffusion potential arising when there is a concentration gradient in the presence of a distributed surface charge, or when there is a gradient in the distributed charge itself.
In an idealized pore the clay particles lining the pore have a negative charge represented by the small circles in figure 98 in the clay lattice positions vacated by cations during dissociation. This nega tive charge on the clay particle attracts an equal number of positive ions in the surrounding solution. As a result, when there is an equilibrium distribution of charge, there are more cations than anions in solution in the vicinity of the clay. If there is a large amount of clay, then the brine throughout the pore will be richer in cations than in anions by a number equal to the charge of the clay.
Where such a clay-bearing rock is in contact with an external solution, there is a difference of cation concentration between the brine in the rock and the external brine. This gives rise to a phase- boundary potential, the magnitude of which is given by the equation (McCardell, Winsauer, and Williams, 1953):
wherek is Boltzman's constant, T is the absolute temperature,E is the ionic charge (one for sodium chloride),no is the ion concentration in equilibrium with the clay charge, andn is the ion concentration in the free solution at some distance from the clay*
In addition to this phase-boundary potential that exists when the anion concentration is the same in the internal and external solutions, there is a diffusion potential when there is an actual difference in salinity of the internal and external solutions. This potential is given by an equation similar- to that of Nernst (McCardell, Winsauer, and Williams, 1953):
kT ui 1*9, =- c W -TM2 Ml »A (15)
wherejui is the cation mobility,jua is the anion mobility,nB is the concentration of the concentrated electrolyte, andnA is the concentration of the dilute electrolyte.
In practice, the quantity no will be large for shales or muds tones, in which all the pores are clay lined, and small for sandstones with little or no clay. As a result, the phase and diffusion potentials will differ

330 EXPERIMENTAL AND THEORETICAL GEOPHYSICS
between sandstones and mudstones. This difference in potential will cause current to flow along the drill hole, and the ohmic drop in potential due to this current flow is recorded as a deflection on the spontaneous potential log as the inhole electrode passes a sandstone- mudstone contact.
Under ideal logging conditions the spontaneous-potential deflection between sandstones and mudstones should be a function of only three variables: the salinity of the water in the drill hole, the salinity of the connate water, and the equivalent salinity immobilized by the clay. The salinity of the water hi the drill hole is a readily measurable quantity; so the spontaneous-potential log can be used to calculate the connate water salinity when n0 is known or can be estimated.
With this possibility in mind, the potentials across cores in contact with brines of two different salinities were measured. The cores used in these measurements were prepared in the same manner as those used in the resistivity experiments, and the porosities and formation factors were determined. The cores were then saturated with a solu tion contaning 60,000 ppm sodium chloride.
These cores were coated with paraffin to prevent evaporation of their water content during the experiments. Two small holes in the coating on opposite sides of the cores permitted access of the external brine solutions. To make a measurement, a core was placed hi the clamp (fig. 103), from which tubes extended to two brine reservoirs containing lead-lead chloride electrodes so that the brines could be brought in contact with opposite sides of the core. A solution with a salinity of 60,000 ppm was placed in one reservoir, and a solution with a salinity of 600 ppm was placed in the other. The potential between the two lead-lead chloride electrodes was amplified with a d-c amplifier that had an input resistance of 10 megohms. The out put of this amplifier was registered on a d-c voltmeter, and the re cording system was calibrated at frequent intervals with a known voltage.
The potential developed in the cell was observed for a period of 30 minutes to 2 hours so that an equilibrium value might be determined. It was observed that the potential had a nonzero value as the brines were first brought in contact with a core, and that within a few seconds the potential reached a maximum; the saline solution was negative with respect to the dilute solution. Following this, the potential changed sign and approached a positive value asymptotically over a period of approximately 1 hour. For very porous cores the potential approached a positive maximum and then decreased, probably because of a change hi the salinity of the brines in the reservoirs by rapid diffusion.

ELECTRICAL PROPERTIES OF SANDSTONES 331
Tank containing 600 ppm sodium ctilotiJe
Binding post
Uod electrode ceatej with lead cfllorife
Drain plug
FIGURE 103. Measurement of diffusion potentials of cores. A, Device used in measuring. B, Circuitcomponents.
In order to eliminate the effects of electrode polarization at the two lead electrodes, the potential across an alundum membrane was measured. The difference between this potential and the theoretical potential for the experimental conditions was subtracted from each of the other measurements.
The asymptotic value of potential was then used to calculate ap parent values of the immobilized double-layer concentration according to equations 14 and 15. The results of these measurements and com putations are presented in figure 104 in which UQ has been plotted as a function of porosity.
These data show that n^ varies from 40 to 56,000 ppm for the cores studied, all sandstone specimens. There is no pronounced relation between HQ and porosity, except at low porosities. At porosities greater than 10 percent an average value for nQ is 1,500 ppm. These values of n^ were then used to determine the relation between the deflection recorded on the spontaneous-potential logs taken in the Spud Patch area and the connate-water salinity.
In spontaneous-potential logging, a single electrode is raised through the drill hole, and its potential is measured with respect to a reference

7 10_ 01 O
ro <j\
H2
o20 tr. ,UJ IQ- r
POROS O
EXPERIMENTAL AND THEORETICAL GEOPHYSICS
100 1000 10.000______100,00030
25
20
15
10
10 100 1000 10,000 IOO,OOO /70=ION CONCENTRATION IMMOBILIZED IN DOUBLE-LAYER,
IN PARTS PER MILLION
FIGURE 104. Ion concentration immobilized in double layer as a function of porosity.
electrode at the surface. In interpretation, the deflection of this curve between a sandstone at depth A and a mudstone at depth B is measured. This deflection is equivalent to the voltage that would be measured between a pair of electrodes at A and B, The voltage is caused by the current flowing through the three media: the water in the drill hole, the sandstone, and the mudstone. The current arises from three phase-boundary potentials and two diffusion potentials if it is assumed that there is no diffusion between the sandstone and
^the mudstone. A current tube, idealized to a considerable extent, is shown in figure 105 to indicate where each of five potentials exists. The sum of the five is given by:
SP= (16)
where Ed and Ep are the diffusion and phase potentials respectively between the pairs of media represented by the numerical prescripts. In terms of ion concentrations, these potentials would be:
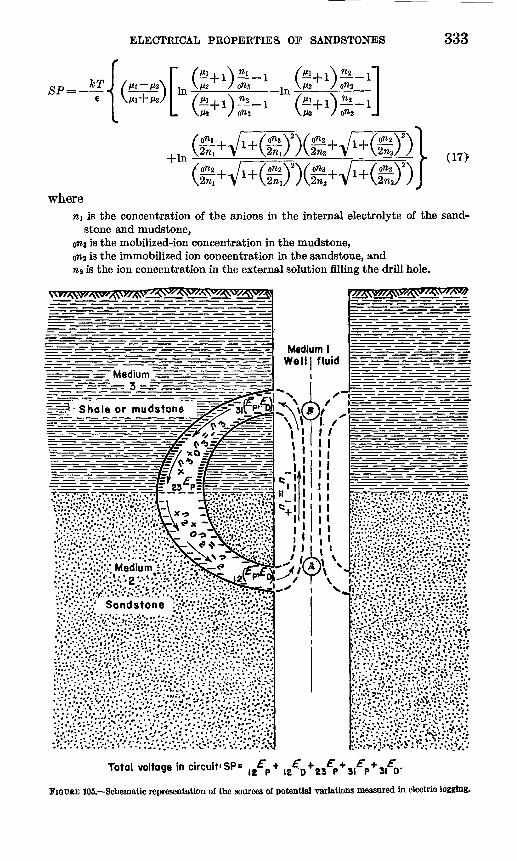
ELECTKICAL PROPERTIES OP SANDSTONES 333
A*2 M2 0«2
(17)
whereni is the concentration of the anions in the internal electrolyte of the sand
stone and mudstone,ona is the mobilized-ion concentration in the mudstone, o»2 is the immobilized ion concentration in the sandstone, and HZ is the ion concentration in the external solution filling the drill hole.
:=-=? Shale or mudstone
Total voltage in circuit«SP= ,/p + l
FIQUSE 105. Schematic representation of the sources of potential variations measured in electric logging.

334 EXPERIMENTAL AND THEORETICAL GEOPHYSICS
I_L
O §o s
O 00
8 !(S> a
-s!O ^ £ Q ^ |
^ 1o _JgO < i
Z § g o 3(~\ UJ « "3
o X % "C£) y g
oo o oOQ O OQ.Q. Q. Q.o ° o o3:8 ^ «
Q. Q.o ocvj
IO o<M
oS o
o *
IV NOmiW B3d SlHVd Nl
<lN31VAin03 IQDN 'A1INHVS d31VM-31VNNOO

ELECTRICAL PROPERTIES OF SANDSTONES 335
This equation was evaluated for the two extreme ranges of con ditions to be expected for the logging conditions at Spud Patch:1. Salinity of the water in the drill hole, n\, was assumed to be approxi
mately 150 ppm, close to the salinity determined by resistivity measurements on a sample of water from Bell Canyon Reservoir.
2. The immobilized concentration in the sandstone, On2, was assumed to be between the limits zero and 1,500 ppm.
3. The immobilized concentration in the mudstone, On3, was assumed to be between the limits 150,000 and 75,000 ppm.
4. A range in connate-water salinity from 1,000 to 240,000 ppm wasconsidered.
The spontaneous-potential deflections that would be recorded for this range in conditions are included as the shaded area in figure 106. On the basis of present information, the best estimate of the relation between spontaneous potential and connate-water salinity may be that given by the dashed line on this graph. This line was drawn on the assumption that the largest recorded spontaneous potentials would probably be associated with the most porous sandstones, which had undergone the most evaporation and in which the salinity of the con nate water would be high and the amount of clay low.
CORRELATION OF LABORATORY AND FIELD DATA
The measurements on the cores were made to provide a basis for the quantitative interpretation of electric logs in terms of porosity and water content. If we assume that the constants in the empirical equations obtained in these experiments are generally valid and that the effect of clay on resistivity and spontaneous potential can be ignored or estimated, then there remain three unknown variable quantities: porosity, water saturation, and water salinity. Only two measurements are available hi the field data for the determination of these three factors, so that the problem would seem to be indeter minate.
One hope of determining these quantities from the field data lies in the possibility of finding a natural relationship between them that is, to find that they are not independent variables. It is possible that the sandstone members of the Morrison formation were at one time saturated with a connate water of uniform salinity. It is likely that the Morrison formation has been dehydrated to some extent in the areas in which these studies were carried out, because it is close to the surface and frequently crops out on mesa runs. The present values of water saturation, resistivity, and natural potential of the sandstone should be interrelated.

336 EXPEKIMENTAL AND THEORETICAL GEOPHYSICS
The resistivity of the sandstone around a drill hole at the time of electric logging is:
pr=0.62pu, r^2 - 10<Sfw-1 - 92 (18)
where
pW)> is the resistivity of the connate water at the time of logging, Sw is the water saturation, and<t> is the porosity, restricted to the limits 14 percent to 25 percent and with
Sw greater than 25 percent.
If the present connate water is a remnant of an original connate water of resistivity pwt that has evaporated without the removal or addition of salt, then the present water resistivity is a function of the present water saturation and the original water resistivity:
(19)
This relationship is valid for a temperature of 20°C and is accurate within 5 percent over the range from 100 to 100,000 ppm.
By using this relationship, one unknown quantity can be eliminated from equation 18, and
This can be written as:
In addition, the resistivity of the connate water is related to the spontaneous potential by equation 17, which can be expressed simply
(22)Pv> r/
where pm is the resistivity of the water in the drill hole and K varies from 35 for low porosities to 70 for high porosities and salinities and represents the influence of the various factors involved in equation 17. By combining equation 21 with equation 22, the following is obtained:
log constant-log pr<^-'°=1.02 +log P« (23)
Thus, the equation for the resistivity of the sandstone members of the Morrison formation has been reduced to a form in which there are only two quantities not measurable in normal logging routine: the porosity and the spontaneous-potential coefficient K. However, the coefficient K can be predicted within reasonable limits, as indi-
ELECTRICAL PROPERTIES OF SANDSTONES 337
cated by figure 106. This means that porosity is determinable from electric-log data if the initial assumptions of a constant water salinity and consequent evaporation are correct.
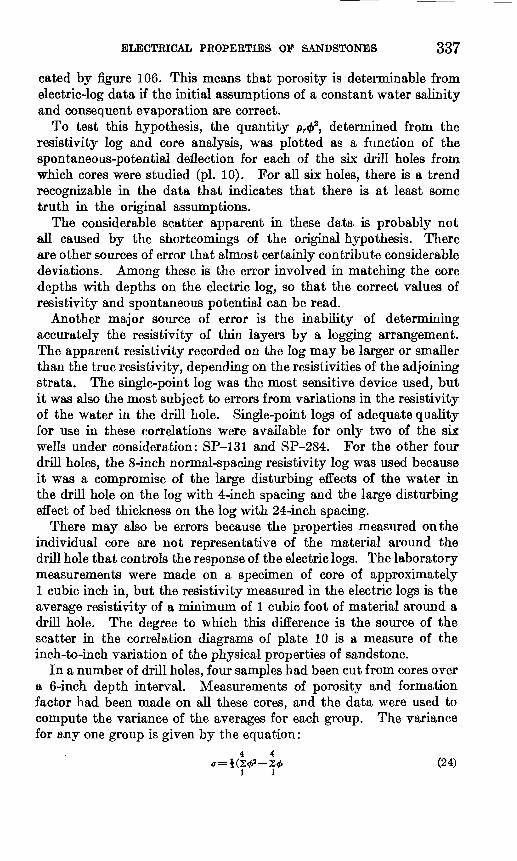
To test this hypothesis, the quantity pr<f>2, determined from the resistivity log and core analysis, was plotted as a function of the spontaneous-potential deflection for each of the six drill holes from which cores were studied (pi. 10). For all six holes, there is a trend recognizable in the data that indicates that there is at least some truth in the original assumptions.
The considerable scatter apparent in these data is probably not all caused by the shortcomings of the original hypothesis. There are other sources of error that almost certainly contribute considerable deviations. Among these is the error involved in matching the core depths with depths on the electric log, so that the correct values of resistivity and spontaneous potential can be read.
Another major source of error is the inability of determining accurately the resistivity of thin layers by a logging arrangement. The apparent resistivity recorded on the log may be larger or smaller than the true resistivity, depending on the resistivities of the adjoining strata. The single-point log was the most sensitive device used, but it was also the most subject to errors from variations in the resistivity of the water in the drill hole. Single-point logs of adequate quality for use in these correlations were available for only two of the six wells under consideration: SP-131 and SP-284. For the other four drill holes, the 8-inch normal-spacing resistivity log was used because it was a compromise of the large disturbing effects of the water in the drill hole on the log with 4-inch spacing and the large disturbing effect of bed thickness on the log with 24-inch spacing.
There may also be errors because the properties measured on the individual core are not representative of the material around the drill hole that controls the response of the electric logs. The laboratory measurements were made on a specimen of core of approximately 1 cubic inch in, but the resistivity measured in the electric logs is the average resistivity of a minimum of 1 cubic foot of material around a drill hole. The degree to which this difference is the source of the scatter in the correlation diagrams of plate 10 is a measure of the inch-to-inch variation of the physical properties of sandstone.
In a number of drill holes, four samples had been cut from cores over a 6-inch depth interval. Measurements of porosity and formation factor had been made on all these cores, and the data were used to compute the variance of the averages for each group. The variance for any one group is given by the equation:
4 4(24)
1 1

338 EXPERIMENTAL AND THEORETICAL GEOPHYSICS
where 0 is the variance or square of the standard deviation. The value computed from this equation is not the variance of the actual data, but a best estimate of the variance of the population from which the data are a subsample. Forty-one values of this best estimate of variance were computed; the highest values were those for the groups of cores of low average porosity. The results of these computations are shown in figure 107 in which the standard deviation
2 ro il
20 30STANDARD DEVIATION -v 1M AVERAGE POROSITY
FIGXJBE 107. Summary of data on the inch-to-inch variations of porosity in sandstone cores.
is expressed as a percentage of the average porosity. This graph shows for a given porosity how closely a single value of porosity measured on a core represents the average porosity of the bed from which it came. It is obvious that the limits of error are quite wide.
Because of the magnitude of these different sources of error, it is likely that the correlations indicated in plate 10 are considerably better than the scatter of the data would lead one to believe. In order to find the relationship indicated by these correlations, it is

ELECTRICAL PROPERTIES OP SANDSTONES 339
necessary to use the same statistical approach used earlier on the core data.
The absolute range of the variables plotted in plate 10 varies considerably from dill hole to drill hole, so that the data from the several drill holes cannot be compared directly. In order to normalize the data from all the drill holes to the same scale, the variables SP and p<j>2 were expressed as percentages of their maximum values in each drill hole.
The data were grouped in classes according to the value of the quantity (p<£2/maxp<£2), and it was assumed that for each class the values of SP/Maximum SP are normally distributed about a mean. The average was computed, and the standard deviation of the values of SP/Maximum SP for each class of p02/maxp<£2 determined. The 65 percent confidence limits were calculated for both individual values of the data and for the mean values of SP/Maximum SP. The results are shown in figure 108 in which the horizontal scale is logarithmic and the vertical scale is doubly iterated logarithmically.
The data are also presented in tabular form on figure 108, and the standard deviation of the average porosity corresponding to each plotted mean is listed. This standard deviation indicates the mini mum part of the scatter of the data that can be attributed to non- representative values of porosity.
Average values of the spontoneousypotentiol (unction with 65;percent confidence limits
65-percent confidence limits on Individual values of spontaneousTpotenf ial {unction.
FIQTJEE 108. Empirical relationship between porosity, electric-log resistivity and spontaneous-potentialdeflection.
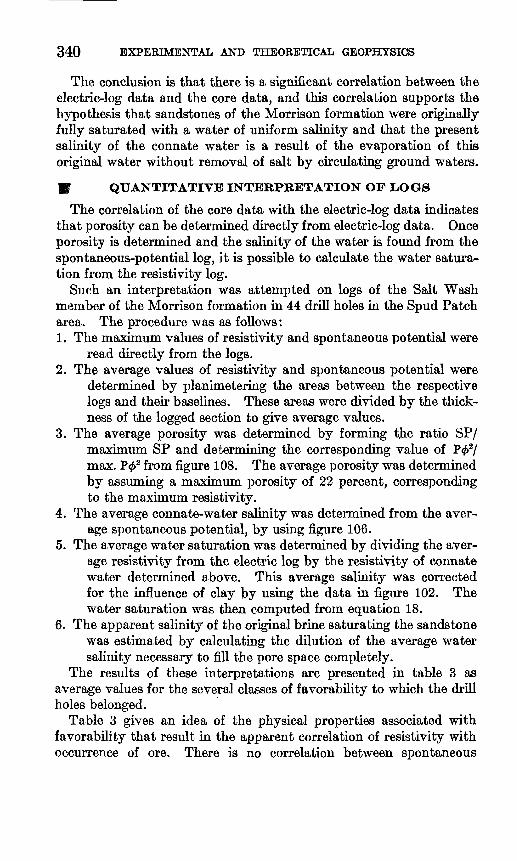
340 EXPERIMENTAL AND THEORETICAL GEOPHYSICS
The conclusion is that there is a significant correlation between the electric-log data and the core data, and this correlation supports the hypothesis that sandstones of the Morrison formation were originally fully saturated with a water of uniform salinity and that the present salinity of the connate water is a result of the evaporation of this original water without removal of salt by circulating ground waters.
m QUANTITATIVE INTERPRETATION OF LOGS
The correlation of the core data with the electric-log data indicates that porosity can be determined directly from electric-log data. Once porosity is determined and the salinity of the water is found from the spontaneous-potential log, it is possible to calculate the water satura tion from the resistivity log.
Such an interpretation was attempted on logs of the Salt Wash member of the Morrison formation in 44 drill holes in the Spud Patch area. The procedure was as follows:1. The maximum values of resistivity and spontaneous potential were
read directly from the logs.2. The average values of resistivity and spontaneous potential were
determined by planimetering the areas between the respective logs and their baselines. These areas were divided by the thick ness of the logged section to give average values.
3. The average porosity was determined by forming the ratio SP/ maximum SP and determining the corresponding value of P<£2/ max. P<£2 from figure 108. The average porosity was determined by assuming a maximum porosity of 22 percent, corresponding to the maximum resistivity.
4. The average connate-water salinity was determined from the aver age spontaneous potential, by using figure 106.
5. The average water saturation was determined by dividing the aver age resistivity from the electric log by the resistivity of connate water determined above. This average salinity was corrected for the influence of clay by using the data in figure 102. The water saturation was then computed from equation 18.
6. The apparent salinity of the original brine saturating the sandstone was estimated by calculating the dilution of the average water salinity necessary to fill the pore space completely.
The results of these interpretations are presented in table 3 as average values for the several classes of favorability to which the drill holes belonged.
Table 3 gives an idea of the physical properties associated with favorability that result in the apparent correlation of resistivity with occurrence of ore. There is no correlation between spontaneous

ELECTRICAL PROPERTIES OF SANDSTONES 341
potential and favorability for ore occurrence. Large- and small- amplitude spontaneous potential curves are obtained in drill holes in both favorable and unfavorable ground, and the spontaneous-potential measurements are the same for favorable and unfavorable holes, as shown in table 3.
The salinities that were calculated from these spontaneous-potential measurements are in terms of sodium chloride as the ionized salt. It is likely that the salinity is due to some other salt, such as calcium bicarbonate. If this is so, the equivalent sodium chloride salinity is not the same as the actual salinity in a different salt. If that salt is calcium bicarbonate, then the equivalent sodium chloride salinity is about one-half the actual salinity.
TABLE 3. Results of the quantitative interpretion of electric logs
Favorability class
Maximum SP average for drill holes of each class _____ mv._
Average SP (mv) average for drill holes of each class... .mv Corresponding water salinity (ppm) ____ . __ __ ppm Maximum resistivity (ohm-m), average for drill holes for each class
ohm-m Average resistivity (ohm-m), average for drill holes of eaeh class
ohm-m _
Average water saturation (percent) _____________ percent- Minimum water-saturation average for drill holes of each class
percent- Original water salinity before evaporation.. _________ ppm.. Product of sandstone thickness and average resistivity ohm-m-ft
Favor able
2466.4 640038.9 3050
423
230 19.1
43
21 1310
16400
Semi- favorable
1228.6 210016.7 1300
385
20318.2
57
32 740
13300
Unfavor able
864.4 610036.2 2730
338
180 18.1
53
32 1450 7710
The calculated average porosities seem to vary with favorability, as evidenced by the decrease in prosity for the less favorable drill holes. The saturations, however, show a more pronounced variation from drill holes in favorable ground to those in unfavorable ground. Saturation seems to be the property which causes the correlation of resistivity with favorability: that is, the saturation seems to be reduced most in the drill holes that are most favorable for the occurrence of ore.
When the salinities are calculated on the assumption that the connate water is diluted to 100 percent of the pore space in all but three of the drill holes, they fall in the range 650 to 1,800 ppm equiv alent sodium chloride. The three exceptions, which fall far out of this range, are between 3,500 and 6,500 ppm.
USE OF ELECTRIC LOGGING IN EXPLORATIONtStudies of the magnitude and extent of electrical anomalies that
may be associated with occurrence of ore on the Colorado Plateau have shown that there is an increase in the average sandstone resis-
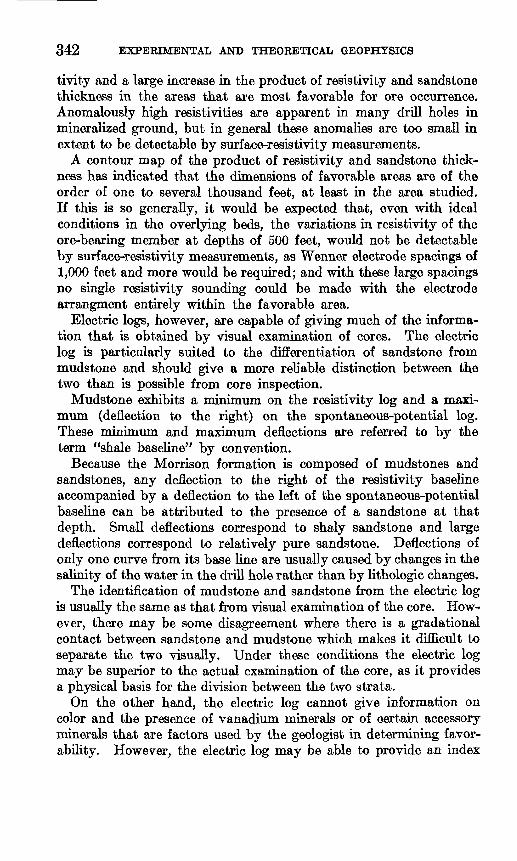
342 EXPERIMENTAL AND THEORETICAL GEOPHYSICS
tivity and a large increase in the product of resistivity and sandstone thickness in the areas that are most favorable for ore occurrence. Anomalously high resistivities are apparent in many drill holes in mineralized ground, but in general these anomalies are too small in extent to be detectable by surface-resistivity measurements.
A contour map of the product of resistivity and sandstone thick ness has indicated that the dimensions of favorable areas are of the order of one to several thousand feet, at least in the area studied. If this is so generally, it would be expected that, even with ideal conditions in the overlying beds, the variations in resistivity of the ore-bearing member at depths of 500 feet, would not be detectable by surface-resistivity measurements, as Wenner electrode spacings of 1,000 feet and more would be required; and with these large spacings no single resistivity sounding could be made with the electrode arrangment entirely within the favorable area.
Electric logs, however, are capable of giving much of the informa tion that is obtained by visual examination of cores. The electric log is particularly suited to the differentiation of sandstone from mudstone and should give a more reliable distinction between the two than is possible from core inspection.
Mudstone exhibits a minunum on the resistivity log and a maxi mum (deflection to the right) on the spontaneous-potential log. These minimum and maximum deflections are referred to by the term "shale baseline" by convention.
Because the Morrison formation is composed of mudstones and sandstones, any deflection to the right of the resistivity baseline accompanied by a deflection to the left of the spontaneous-potential baseline can be attributed to the presence of a sandstone at that depth. Small deflections correspond to shaly sandstone and large deflections correspond to relatively pure sandstone. Deflections of only one curve from its base line are usually caused by changes in the salinity of the water in the drill hole rather than by lithologic changes.
The identification of mudstone and sandstone from the electric log is usually the same as that from visual examination of the core. How ever, there may be some disagreement where there is a gradational contact between sandstone and mudstone which makes it difficult to separate the two visually. Under these conditions the electric log may be superior to the actual examination of the core, as it provides a physical basis for the division between the two strata.
On the other hand, the electric log cannot give information on color and the presence of vanadium minerals or of certain accessory minerals that are factors used by the geologist in determining favor- ability. However, the electric log may be able to provide an index
ELECTRICAL PROPERTIES OF SANDSTONES 343
of favorability which is comparable in reliability determined by geologic guides to ore.
The advantage of electric logging is that when combined with radioactivity logging it will give most of the information necessary in the exploration for ore at a lower cost than coring and examination of cores. In addition to reduced drilling costs, the time required to interpret a group of electric logs in the office would be much less than the time required to examine core at a group of drill holes, with resulting economy.
The utility of the electric log is not limited to the determination of information now obtained from cores; it is also capable of giving additional information, such as porosity and water saturation, which may be of value in the future. If production from the deeper Morri- son deposits should become practical, it would be necessary to know porosities and water saturation for proper production practice. It has been found in oil-field practice that the determination of such properties from the electric log is more reliable than core analysis, as electric-log data give an average value representative of the rock in place. Core analysis is subject to the errors caused by the inch-to- inch variation in physical properties described in this report.
In the petroleum industry the electric log has become an indis- pensible tool for the determination of the textural properties of the rock in place in a drill hole. There is reason to believe that the elec tric log may be valuable in the evaluation of the strata penetrated by exploratory drilling here also.
The electric logs can be used not only to identify different litho- logic units but to correlate such units between neighboring drill holes. Correlation of very small sandstone units is possible where drill holes are on a 50-foot spacing. Correlation between more widely spaced drill holes must necessarily be less detailed.
REFERENCES CITED
Fischer, R. P., 1942, Vanadium deposits of Colorado and Utah, a preliminaryreport: U.S. Geol. Survey Bull. 936-P, p. 363-394.
Keller, G. V., 1953, The role of wettability in the electrical resistivity of sands:Oil and Gas Jour., v. 51, no. 35, p. 62-65.
McCardell, W. M., Winsauer, W. O., and Williams, M., 1953, Origin of the elec tric potential observed in wells: Am. Inst. Min. Met. Eng. Trans., v. 198,p. 41-51.
Schlumberger, C., Schlumberger, M., and Doll, H. G., 1934, A new contributionto subsurface studies by means of electrical measurements in drill holes:Am. Inst. Min. Met. Eng. Trans., v. 110, p. 273-289.
Wen-, D. B., 1952, Geologic guides to prospecting for carnotite deposits on theColorado Plateau: U.S. Geol. Survey Bull. 988-B, p. 15-27.
344 EXPERIMENTAL AND THEORETICAL GEOPHYSICS
Winsauer, W. O., and McCardell, W. M., Ionic double layer conductivity in reservoir rock: Am. Inst. Min. Met. Eng.; paper presented at the Los Angeles meeting, Petr. Branch, October 1952.
Winsauer, W. O., Shearin, H. M., Masson, P. H., and Williams, M., 1952, Re sistivity of brine saturated sands in relation to pore geometry: Am. Assoc. Petroleum Geologists Bull., v. 36, p. 253-277,
Wyllie, M. R. J., 1951, An investigation of the electrokinetic component of the self potential curve: Am. Inst. Min. Met. Eng. Trans., v. 192, p. 1-18.
O

Experimental and Theoretical Geophysics
GEOLOGICAL SURVEY BULLETIN 1052
This volume was printed as separate chapters A-J
UNITED STATES GOVERNMENT PRINTING OFFICE, WASHINGTON \ 1959

UNITED STATES DEPARTMENT OF THE INTERIOR
FRED A. SEATON, Secretary
GEOLOGICAL SURVEY
Thomas B. Nolan, Director

CONTENTS
[Letters In parentheses designate the separately published chapters]Paw
(A) Scattered gamma rays from thick uranium sources, by A. Y; Sakakura. 1(B) Three-dimensional heat conduction in permafrost beneath heated
buildings, by Arthur H. Lachenbruch.____ _ _____ 51(C) Infrared luminescence of minerals, by David F. Barnes___ 71(D) Magnetic-doublet theory in the analysis of total-intensity anomalies,
by Roland G. Henderson and Isidore Zietz _ __ 159(E) Physical behavior and geologic control of radon in mountain streams,
by Alien S. Rogers..________________________ 187(F) Scintillation counters for geologic use, by W. W. Vaughn, V. C.
Rhoden, E. E. Wilson, and Henry Faul_______________. 213(G) A comparison among caliper-log, gamma-ray log, and other diamond-
drill-hole data, by C. M. Bunker and H. C. Hamontre__ ______ 241(H) Dielectric constant and electrical resistivity of natural-state cores,
by G. V. Keller and P. H. Licastro_______________-_._ 257(I) Equation of continuity in geology with application to the transport
of radioactive gas, by A. Y. Sakakura, Carolyn Lindberg, and Henry Faul_________________________ 287
(J) Electrical properties of sandstones of the Morrison formation, byGeorge V. Keller____________---_-----_ __--_ -- . 307
(HI)


Related Documents