Al-Rafidain Engineering Journal (AREJ) Vol.26, No.2, March 2022, pp.99-109 Al-Rafidain Engineering Journal (AREJ) Vol.26, No.2, March 2022, pp.99-109 Electrical Power System Harmonics Elimination Using ETAP Safa Ahmed Younis Omar Muwafaq Al-Yousif [email protected] [email protected] Electrical Engineering Department, Collage of Engineering, University of Mosul Received: 10/1/2022 Accepted: 5/2/2022 ABSTRACT Because of the fast advancement in the creation of power electronics equipment such as automatic Machines, adjustable speed drives, personal computers and other non-linear loads which are the main sources of harmonics. Due to the presence of these nonlinear loads, it is necessary to reduce the level of harmonics created in the power networks. Hence, harmonic analysis of distribution networks is important. The analysis of power systems is an important part of power system engineering. Any electrical utility company's principal goal is to provide the best quality of power. The power system harmonics is one of the major reasons of poor power quality. Harmonics and harmonic analysis must be investigated in filters in order to minimize harmonic current and voltage. This paper aims to build a simulation model of nine bus ring system to evaluate characteristics of harmonics in different cases of study using Electrical Transient and Analysis Program (ETAP). Using ETAP harmonic distortion is analyzed and mitigation techniques are used represented by single tuned filters which should be installed for worst case and the best-case condition. And the simulation results of ETAP shows that some of THDv,i% results are within the limit value as per IEEE 519 -1992 standard. Keywords: ETAP; Non - Linear Loads; Single Tuned Filter; THD%; IEEE 519 -1992. This is an open access article under the CC BY 4.0 license (http://creativecommons.org/licenses/by/4.0/). https://rengj.mosuljournals.com ============================================================================= 1. INTRODUCTION Ideally, an electrical supply should always show a perfectly sinusoidal voltage signal. However, utilities frequently find it difficult to maintain such desirable conditions for a variety of reasons. Waveform distortion, also known as harmonic distortion, is a word used to describe the deviation of voltage and current waveforms from sinusoidal [1]. Harmonics are periodic wave components with frequencies that are integer multiples of the fundamental power network frequency and may be represented using the Fourier series. Harmonics are typically produced as a by-product of power electronics-based loads. Non-linear loads or devices, such as personal computers, static power converters, uninterruptible power supplies, variable speed drives, cycloconverters, arc furnaces, fluorescent lights, saturated transformers, and so on, produce harmonics by consuming current in rapid short pulses rather than smooth sinusoidally. When harmonics are produced it is necessary to reduce it for better performance of the system [2][3][4]. For a signal whose fundamental frequency is f, the 2nd harmonic has a frequency 2f; the third harmonic has frequency of 3f, and so on. Signals that occur at frequencies of 2f, 4f, 6f, etc. are called even harmonics, as shown in fig. 1a; and at frequencies 3f, 5f, 7f etc. are called odd harmonics, As shown in fig. 1b.

Welcome message from author
This document is posted to help you gain knowledge. Please leave a comment to let me know what you think about it! Share it to your friends and learn new things together.
Transcript
Al-Rafidain Engineering Journal (AREJ) Vol.26, No.2, March 2022, pp.99-109
Al-Rafidain Engineering Journal (AREJ) Vol.26, No.2, March 2022, pp.99-109
Electrical Power System Harmonics Elimination Using ETAP
Safa Ahmed Younis Omar Muwafaq Al-Yousif
[email protected] [email protected]
Electrical Engineering Department, Collage of Engineering, University of Mosul
Received: 10/1/2022 Accepted: 5/2/2022
ABSTRACT Because of the fast advancement in the creation of power electronics equipment such as automatic Machines,
adjustable speed drives, personal computers and other non-linear loads which are the main sources of harmonics. Due to
the presence of these nonlinear loads, it is necessary to reduce the level of harmonics created in the power networks. Hence,
harmonic analysis of distribution networks is important. The analysis of power systems is an important part of power system
engineering. Any electrical utility company's principal goal is to provide the best quality of power. The power system
harmonics is one of the major reasons of poor power quality. Harmonics and harmonic analysis must be investigated in
filters in order to minimize harmonic current and voltage. This paper aims to build a simulation model of nine bus ring
system to evaluate characteristics of harmonics in different cases of study using Electrical Transient and Analysis Program
(ETAP). Using ETAP harmonic distortion is analyzed and mitigation techniques are used represented by single tuned filters
which should be installed for worst case and the best-case condition. And the simulation results of ETAP shows that some
of THDv,i% results are within the limit value as per IEEE 519 -1992 standard.
Keywords:
ETAP; Non - Linear Loads; Single Tuned Filter; THD%; IEEE 519 -1992.
This is an open access article under the CC BY 4.0 license (http://creativecommons.org/licenses/by/4.0/).
https://rengj.mosuljournals.com
=============================================================================
1. INTRODUCTION
Ideally, an electrical supply should always
show a perfectly sinusoidal voltage signal. However,
utilities frequently find it difficult to maintain such
desirable conditions for a variety of reasons.
Waveform distortion, also known as harmonic
distortion, is a word used to describe the deviation of
voltage and current waveforms from sinusoidal [1].
Harmonics are periodic wave components with
frequencies that are integer multiples of the
fundamental power network frequency and may be
represented using the Fourier series. Harmonics are
typically produced as a by-product of power
electronics-based loads. Non-linear loads or devices,
such as personal computers, static power converters,
uninterruptible power supplies, variable speed drives,
cycloconverters, arc furnaces, fluorescent lights,
saturated transformers, and so on, produce harmonics
by consuming current in rapid short pulses rather than
smooth sinusoidally. When harmonics are produced it
is necessary to reduce it for better performance of the
system [2][3][4]. For a signal whose fundamental
frequency is f, the 2nd harmonic has a frequency 2f;
the third harmonic has frequency of 3f, and so on.
Signals that occur at frequencies of 2f, 4f, 6f, etc. are
called even harmonics, as shown in fig. 1a; and at
frequencies 3f, 5f, 7f etc. are called odd harmonics,
As shown in fig. 1b.
100 Safa Ahmed Younis: Electrical Power System Harmonics Analysis Using…….
Al-Rafidain Engineering Journal (AREJ) Vol.26, No.2, March 2022, pp.99-109
Fig. 1a Even harmonics. Fig. 1b Odd harmonics.
ETAP is a program that assists electrical
engineers in the process of planning, modeling,
operating, and optimizing power systems. Load flow
analysis, short-circuit analysis, harmonic analysis,
transient stability analysis, and other analyses can be
performed on the designed project. By load flow
analysis we can study the harmonics analysis. First of
all we study the load flow analysis at the fundamental
frequency. We may analyze the power factor at
different buses in the electrical power system using
load flow analysis, and then check the harmonics
analysis and order of harmonic spectrum using
harmonics analysis.[2][5]
The THD (Total Harmonic Distortion) value is
the most important metric for harmonic analysis and
measurement. The IEEE 519-2014 Standard is used as
a standard for the detection of harmonic issues in the
process industry.[7]
Much of the study has focused on the loads that
create harmonics, how to construct a filter to remove
harmonics, and so on. One of the most popular
methods for removing harmonics is to use filters.
Others used variable speed drives in the industrial
power supply to remove harmonic current.[2][10]
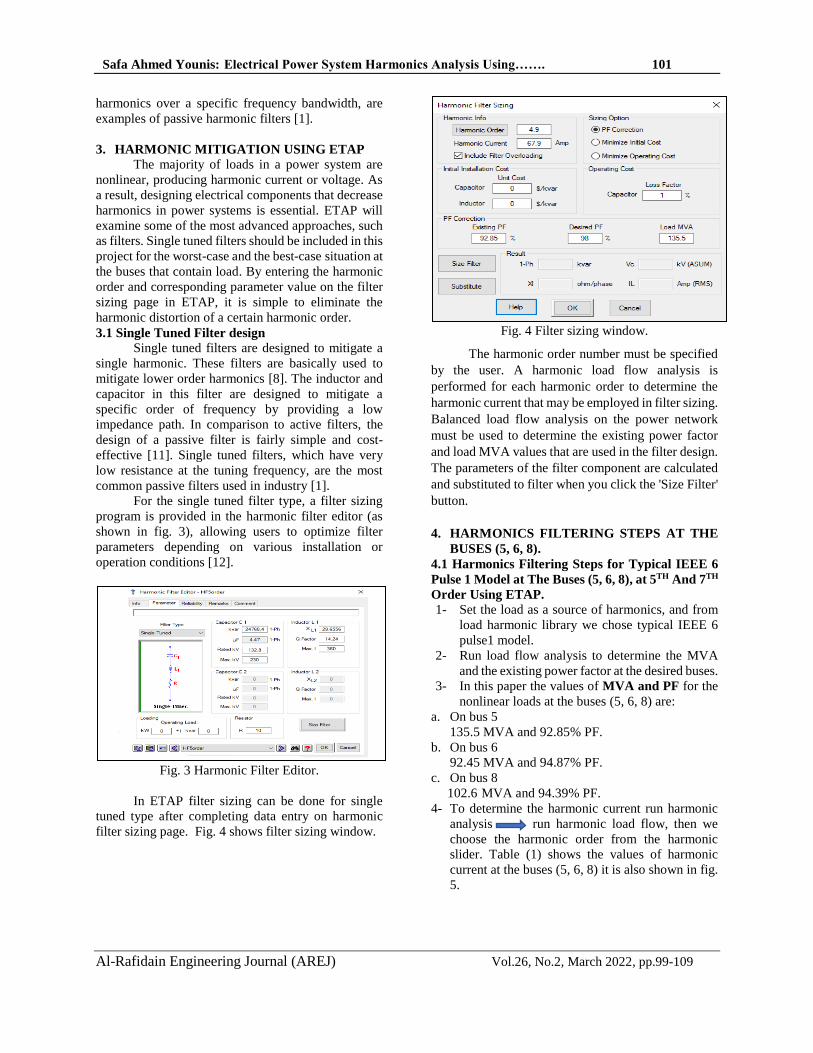
In this paper, ETAP is being used to model a 9-
bus 50Hz power network as shown in Fig. 2, perform
harmonic mitigation and design a single tuned filter to
mitigate the harmonics. The most common passive
filters used in industrial are single tuned filters which
creates low impedance path for the tuned frequency so
that particular harmonic current will be diverted, thus,
single tuned filters were used for the worst-case and
the best-case scenario.
To examine the influence of harmonic current
on the system, a general load was modeled as a
harmonic source, and then a harmonic load flow
analysis was done. Several sorts of harmonic
manufacturers and models are included in the load
harmonics library. The most appropriate type of
harmonic model was chosen based on the THD
indices. In this paper, load was modelled as a source
of harmonics. From load harmonic library typical
IEEE 6 pulse 1 model was identified as the worst
typical IEEE model and IEEE 12 pulse 2 was
identified as one of the best typical IEEE model
because it has low THDv,i% values. Filter were designed and placed on the buses
that contain load which in this paper are bus (5, 6, 8) to mitigate the harmonics on these buses and to reduce
the THDv,i% values for the 9-bus system. The ETAP
simulation results reveal that some harmonic voltage
and current are well within the limit value as per IEEE
519-1992 standard.
In addition to this introduction, this paper
contains four other sections. Section 2 presents the
harmonics filter. Harmonic mitigation using ETAP is
explained in section 3. Harmonics filtering steps for
typical IEEE 6pulse 1 model at the buses (5, 6, 8), at
5th and 7th order using ETAP are included in section
4. Section 5 includes ISh/IL calculations.
Fig. 2 Nine-bus system diagram.
2. HARMONICS FILTER
Equipment early failure and degradation, poor
power factor, and resonance are all consequences of
harmonics on a power system. Transformers, motors,
cables, load interrupters, and power factor
improvement capacitor banks are among the
equipment impacted by harmonics. There are a variety
of ways to minimize harmonics in a system, one of
which is to use harmonic filters. Harmonics are
reduced by creating a tuned filter for the most
prevalent harmonic order.[7][8]
There are a variety of ways for reducing system
harmonics, one of which is the use of filters. Filters are
classified as passive, active, or hybrid. Passive filters
are those that are made up entirely of passive
components such as capacitors, inductors, and the like,
and hence do not require any external power. These
are the cheapest filters available, and they provide a
low impedance path for undesirable harmonics.[8]
We used filters for:
1. Improve power factor.
2. Eliminate/ Reduce harmonics in voltage &
current waveforms.
3. Combinations of the above [9].
One of the most prevalent approaches for
reducing harmonic distortion in industries is to use
passive filtering techniques that use single-tuned or
band-pass filters. Single-tuned components that
provide a low impedance path for harmonic currents at
a certain frequency, or band-pass devices that filter
Safa Ahmed Younis: Electrical Power System Harmonics Analysis Using……. 101
Al-Rafidain Engineering Journal (AREJ) Vol.26, No.2, March 2022, pp.99-109
harmonics over a specific frequency bandwidth, are
examples of passive harmonic filters [1].
3. HARMONIC MITIGATION USING ETAP
The majority of loads in a power system are
nonlinear, producing harmonic current or voltage. As
a result, designing electrical components that decrease
harmonics in power systems is essential. ETAP will
examine some of the most advanced approaches, such
as filters. Single tuned filters should be included in this
project for the worst-case and the best-case situation at
the buses that contain load. By entering the harmonic
order and corresponding parameter value on the filter
sizing page in ETAP, it is simple to eliminate the
harmonic distortion of a certain harmonic order.
3.1 Single Tuned Filter design
Single tuned filters are designed to mitigate a
single harmonic. These filters are basically used to
mitigate lower order harmonics [8]. The inductor and
capacitor in this filter are designed to mitigate a
specific order of frequency by providing a low
impedance path. In comparison to active filters, the
design of a passive filter is fairly simple and cost-
effective [11]. Single tuned filters, which have very
low resistance at the tuning frequency, are the most
common passive filters used in industry [1]. For the single tuned filter type, a filter sizing
program is provided in the harmonic filter editor (as
shown in fig. 3), allowing users to optimize filter
parameters depending on various installation or
operation conditions [12].
Fig. 3 Harmonic Filter Editor.
In ETAP filter sizing can be done for single
tuned type after completing data entry on harmonic
filter sizing page. Fig. 4 shows filter sizing window.
Fig. 4 Filter sizing window.
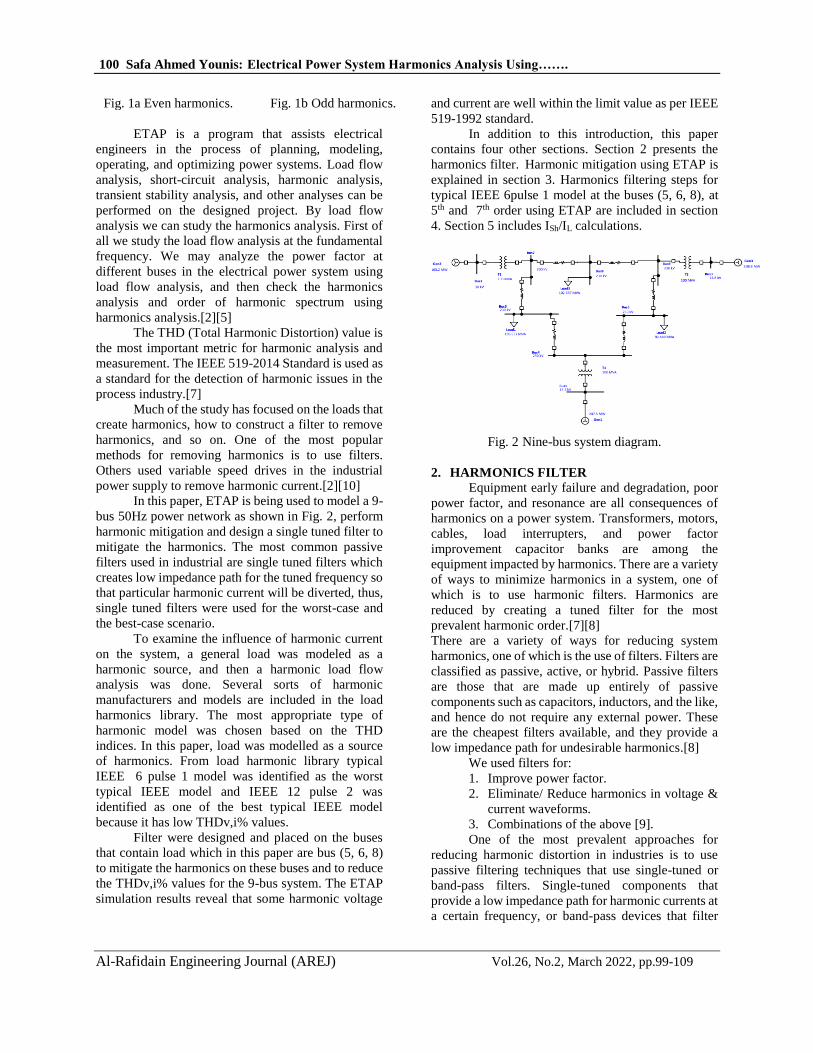
The harmonic order number must be specified
by the user. A harmonic load flow analysis is
performed for each harmonic order to determine the
harmonic current that may be employed in filter sizing.
Balanced load flow analysis on the power network
must be used to determine the existing power factor
and load MVA values that are used in the filter design.
The parameters of the filter component are calculated
and substituted to filter when you click the 'Size Filter'
button.
4. HARMONICS FILTERING STEPS AT THE
BUSES (5, 6, 8).
4.1 Harmonics Filtering Steps for Typical IEEE 6
Pulse 1 Model at The Buses (5, 6, 8), at 5TH And 7TH
Order Using ETAP.
1- Set the load as a source of harmonics, and from
load harmonic library we chose typical IEEE 6
pulse1 model.
2- Run load flow analysis to determine the MVA
and the existing power factor at the desired buses.
3- In this paper the values of MVA and PF for the
nonlinear loads at the buses (5, 6, 8) are:
a. On bus 5
135.5 MVA and 92.85% PF.
b. On bus 6
92.45 MVA and 94.87% PF.
c. On bus 8
102.6 MVA and 94.39% PF.
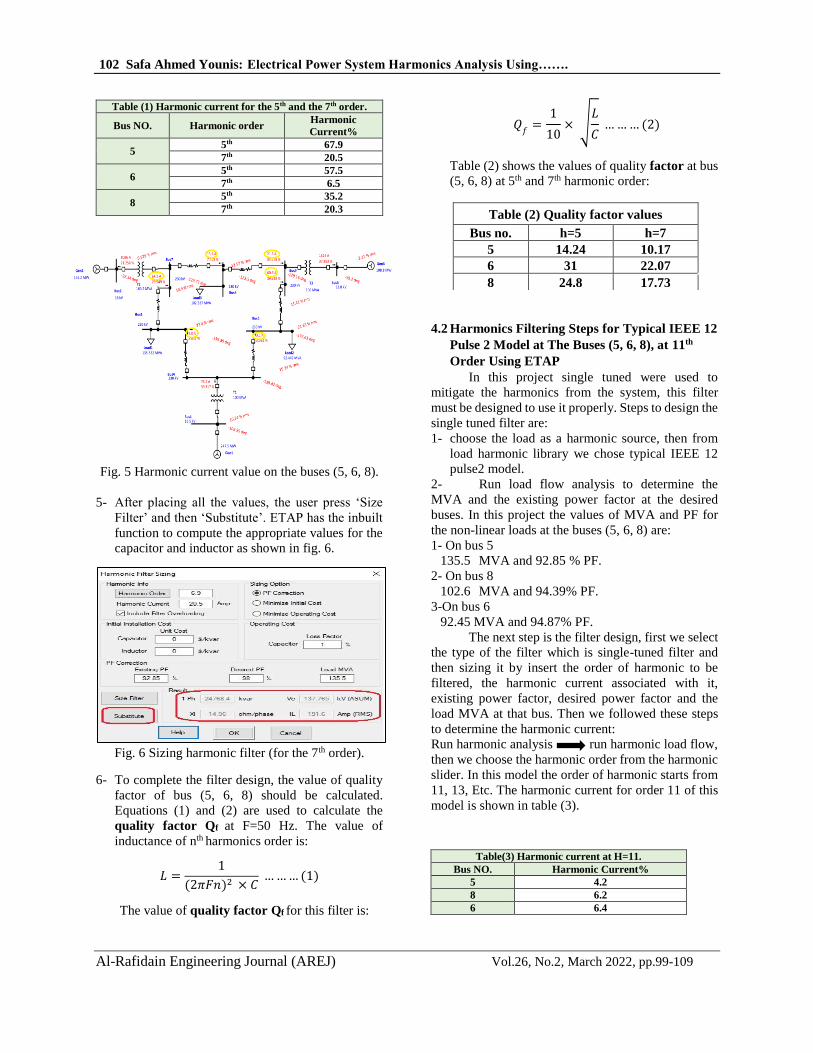
4- To determine the harmonic current run harmonic
analysis run harmonic load flow, then we
choose the harmonic order from the harmonic
slider. Table (1) shows the values of harmonic
current at the buses (5, 6, 8) it is also shown in fig.
5.
102 Safa Ahmed Younis: Electrical Power System Harmonics Analysis Using…….
Al-Rafidain Engineering Journal (AREJ) Vol.26, No.2, March 2022, pp.99-109
Fig. 5 Harmonic current value on the buses (5, 6, 8).
5- After placing all the values, the user press ‘Size
Filter’ and then ‘Substitute’. ETAP has the inbuilt
function to compute the appropriate values for the
capacitor and inductor as shown in fig. 6.
Fig. 6 Sizing harmonic filter (for the 7th order).
6- To complete the filter design, the value of quality
factor of bus (5, 6, 8) should be calculated.
Equations (1) and (2) are used to calculate the
quality factor Qf at F=50 Hz. The value of
inductance of nth harmonics order is:
𝐿 =1
(2𝜋𝐹𝑛)2 × 𝐶 … … … (1)
The value of quality factor Qf for this filter is:
𝑄𝑓
=1
10× √
𝐿
𝐶 … … … (2)
Table (2) shows the values of quality factor at bus
(5, 6, 8) at 5th and 7th harmonic order:
4.2 Harmonics Filtering Steps for Typical IEEE 12
Pulse 2 Model at The Buses (5, 6, 8), at 11th
Order Using ETAP
In this project single tuned were used to
mitigate the harmonics from the system, this filter
must be designed to use it properly. Steps to design the
single tuned filter are:
1- choose the load as a harmonic source, then from
load harmonic library we chose typical IEEE 12
pulse2 model. 2- Run load flow analysis to determine the
MVA and the existing power factor at the desired
buses. In this project the values of MVA and PF for
the non-linear loads at the buses (5, 6, 8) are:
1- On bus 5
135.5 MVA and 92.85 % PF.
2- On bus 8
102.6 MVA and 94.39% PF.
3-On bus 6
92.45 MVA and 94.87% PF.
The next step is the filter design, first we select
the type of the filter which is single-tuned filter and
then sizing it by insert the order of harmonic to be
filtered, the harmonic current associated with it,
existing power factor, desired power factor and the
load MVA at that bus. Then we followed these steps
to determine the harmonic current:
Run harmonic analysis run harmonic load flow,
then we choose the harmonic order from the harmonic
slider. In this model the order of harmonic starts from
11, 13, Etc. The harmonic current for order 11 of this
model is shown in table (3).
Table(3) Harmonic current at H=11.
Bus NO. Harmonic Current%
5 4.2
8 6.2
6 6.4
Table (1) Harmonic current for the 5th and the 7th order.
Bus NO. Harmonic order Harmonic
Current%
5 5th 67.9
7th 20.5
6 5th 57.5
7th 6.5
8 5th 35.2
7th 20.3 Table (2) Quality factor values
Bus no. h=5 h=7
5 14.24 10.17
6 31 22.07
8 24.8 17.73
Safa Ahmed Younis: Electrical Power System Harmonics Analysis Using……. 103
Al-Rafidain Engineering Journal (AREJ) Vol.26, No.2, March 2022, pp.99-109
The last step in the filter design is to find quality factor
Qf . Table (4) shows the value of Qf of the at bus (5, 6,
8) for 12 pulse 2 model.
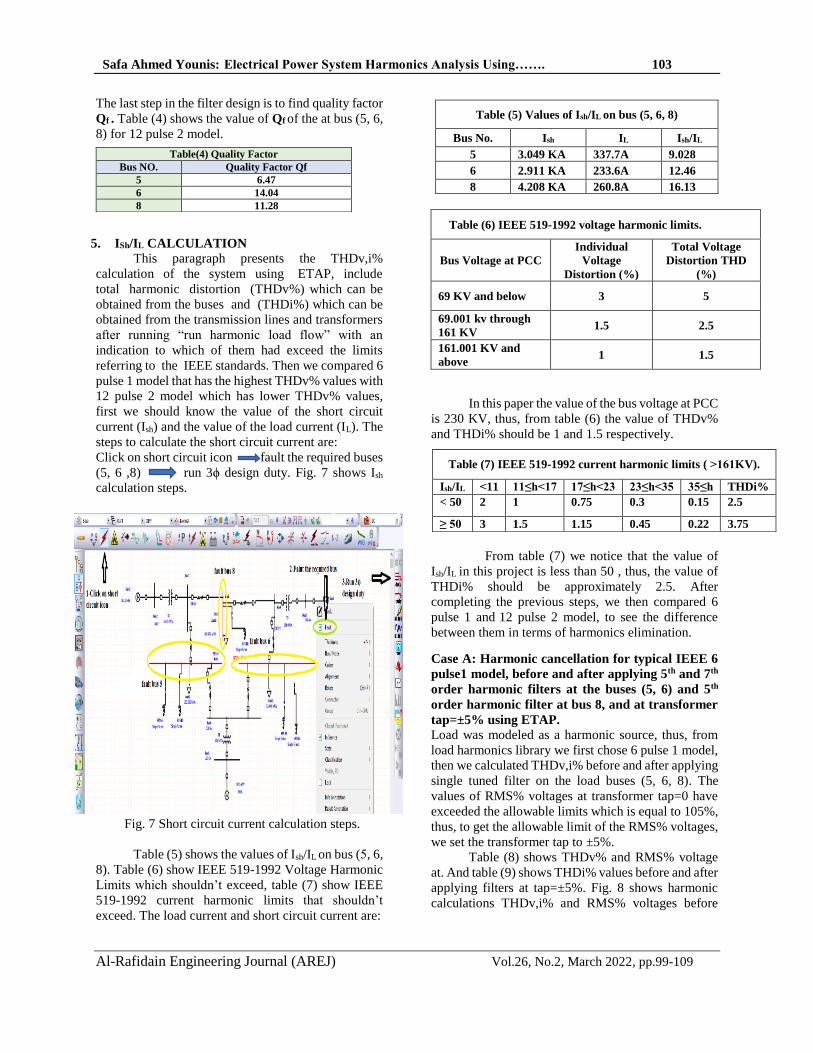
5. ISh/IL CALCULATION This paragraph presents the THDv,i%
calculation of the system using ETAP, include
total harmonic distortion (THDv%) which can be
obtained from the buses and (THDi%) which can be
obtained from the transmission lines and transformers
after running “run harmonic load flow” with an
indication to which of them had exceed the limits
referring to the IEEE standards. Then we compared 6
pulse 1 model that has the highest THDv% values with
12 pulse 2 model which has lower THDv% values,
first we should know the value of the short circuit
current (Ish) and the value of the load current (IL). The
steps to calculate the short circuit current are:
Click on short circuit icon fault the required buses
(5, 6 ,8) run 3ϕ design duty. Fig. 7 shows Ish
calculation steps.
Fig. 7 Short circuit current calculation steps.
Table (5) shows the values of Ish/IL on bus (5, 6,
8). Table (6) show IEEE 519-1992 Voltage Harmonic
Limits which shouldn’t exceed, table (7) show IEEE
519-1992 current harmonic limits that shouldn’t
exceed. The load current and short circuit current are:
Table (6) IEEE 519-1992 voltage harmonic limits.
Bus Voltage at PCC
Individual
Voltage
Distortion (%)
Total Voltage
Distortion THD
(%)
69 KV and below 3 5
69.001 kv through
161 KV 1.5 2.5
161.001 KV and
above 1 1.5
In this paper the value of the bus voltage at PCC
is 230 KV, thus, from table (6) the value of THDv%
and THDi% should be 1 and 1.5 respectively.
From table (7) we notice that the value of
Ish/IL in this project is less than 50 , thus, the value of
THDi% should be approximately 2.5. After
completing the previous steps, we then compared 6
pulse 1 and 12 pulse 2 model, to see the difference
between them in terms of harmonics elimination.
Case A: Harmonic cancellation for typical IEEE 6
pulse1 model, before and after applying 5th and 7th
order harmonic filters at the buses (5, 6) and 5th
order harmonic filter at bus 8, and at transformer
tap=±5% using ETAP.
Load was modeled as a harmonic source, thus, from
load harmonics library we first chose 6 pulse 1 model,
then we calculated THDv,i% before and after applying
single tuned filter on the load buses (5, 6, 8). The
values of RMS% voltages at transformer tap=0 have
exceeded the allowable limits which is equal to 105%,
thus, to get the allowable limit of the RMS% voltages,
we set the transformer tap to ±5%.
Table (8) shows THDv% and RMS% voltage
at. And table (9) shows THDi% values before and after
applying filters at tap=±5%. Fig. 8 shows harmonic
calculations THDv,i% and RMS% voltages before
Table(4) Quality Factor
Bus NO. Quality Factor Qf
5 6.47
6 14.04
8 11.28
Table (5) Values of Ish/IL on bus (5, 6, 8)
Bus No. Ish IL Ish/IL
5 3.049 KA 337.7A 9.028
6 2.911 KA 233.6A 12.46
8 4.208 KA 260.8A 16.13
Table (7) IEEE 519-1992 current harmonic limits ( 161< KV).
Ish/IL >11 11≤h<17 17≤h<23 23≤h<35 35≤h THDi%
< 50 2 1 0.75 0.3 0.15 2.5
≥ 50 3 1.5 1.15 0.45 0.22 3.75
104 Safa Ahmed Younis: Electrical Power System Harmonics Analysis Using…….
Al-Rafidain Engineering Journal (AREJ) Vol.26, No.2, March 2022, pp.99-109
applying filters for 6 pulse 1 model, and fig.9 shows
harmonic analysis
plots for buses, transformers and transmission lines for
typical IEEE 6 pulse 1 model before inserting filters.
All this at transformer tap=±5%.
From table (8) notice that the 6th switch case
has the lowest THDv % values but it didn’t reach the
IEEE 519-1992 harmonic limits and the RMS%
voltages of this switch case have exceeded the
maximum RMS% voltages limit for the system which
is equal to 105%.
Table (8) THDv% and RMS% voltage values at Tap =±5% for h=5th&7th.
Model
Type Switch Case Bus1 Bus2 Bus3 Bus4 Bus5 Bus6 Bus7 Bus8 Bus9
Typical
IEEE
6Pulse1
1) All Open THD% 13.45 0.54 2.48 25.77 27.33 24.89 12.23 13.78 13.86
RMS% 104.9 103 102.5 94.99 92.55 93.44 93.02 92.35 93.85
2)S5 Closed THD% 12.91 0.54 2.68 24.14 20.96 25.81 12.14 15.05 14.87
RMS% 104.9 103 102.5 96.91 96.86 95.38 94.41 93.6 94.64
3)S5 and S6
Closed
THD% 12.77 0.53 2.64 23.63 21.41 21.95 12.81 15.95 14.56
RMS% 104.8 103 102.5 97.87 97.78 97.31 94.81 94.18 95.24
4)S5, S6 and
S8 Closed
THD% 10.45 0.471 2.25 19.45 11.67 20.42 10.43 13.81 12.26
RMS% 104.6 102.5 102.5 97.28 96.54 97.53 95.64 96.51 95.87
5)S5, S6, S8 and S5.1
Closed
THD% 10.44 0.522 2.37 18.48 10.49 19.85 11.48 14.26 2.37
RMS% 104.6 108.9 107.6 101.2 105.4 102 102.2 102.5 107.6
6)S5, S6, S8, S5.1 S6.1
Closed
THD% 9.79 0.529 2.28 16.81 10.45 13.07 11.69 14.24 12.44
RMS% 104.5 115.4 114.7 104.1 109.7 107.2 108 108.5 107.2
Table (9) THDi% Values at Tap = ±5% for h=5th&7th.
Model Type
Switch Case Line1 Line2 Line3 Line4 Line5 Line6 Transformer1 Transformer2 Transformer3
Typical IEEE
6Pulse 1
1) All Open 28.57 53.41 28.1 35.29 51.62 18.27 76.07 18.07 33.77
2)S5 Closed 65.8 49.01 20.5 37.19 53.69 17.04 84.92 17.2 35.89
3)S5 and S6
Closed 55.86 82.37 20.9 29.69 62.49 16.97 56.19 17.78 33.33
4)S5, S6 and
S8 Closed 71.38 90.7 15.18 28.15 35.46 18.16 30.77 11.11 25.7
5)S5, S6, S8
and S5.1
Closed 23.88 53.46 17.2 34.75 25.62 22 11.66 12.86 28.12
6)S5, S6, S8,
S5.1, S6.1
Closed 15.32 21.17 21.63 31.66 33.08 22.19 14.3 14.3 27.36
Safa Ahmed Younis: Electrical Power System Harmonics Analysis Using……. 105
Al-Rafidain Engineering Journal (AREJ) Vol.26, No.2, March 2022, pp.99-109
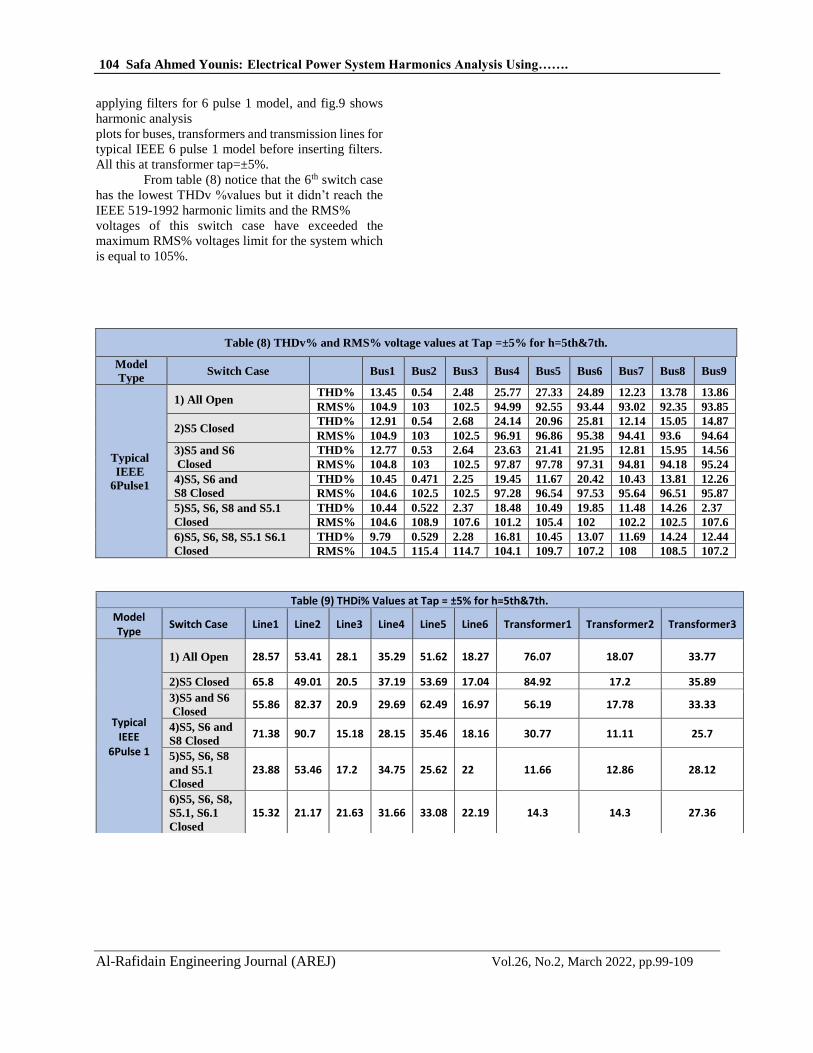
Fig. 8 Harmonic calculation (THDv,i) and RMS%
voltages before applying filters at transformer
tap=±5%.
Fig. 9 Harmonic analysis plots for buses,
transformers and transmission lines for typical IEEE
6 pulse 1 model before inserting filter at tap=±5%.
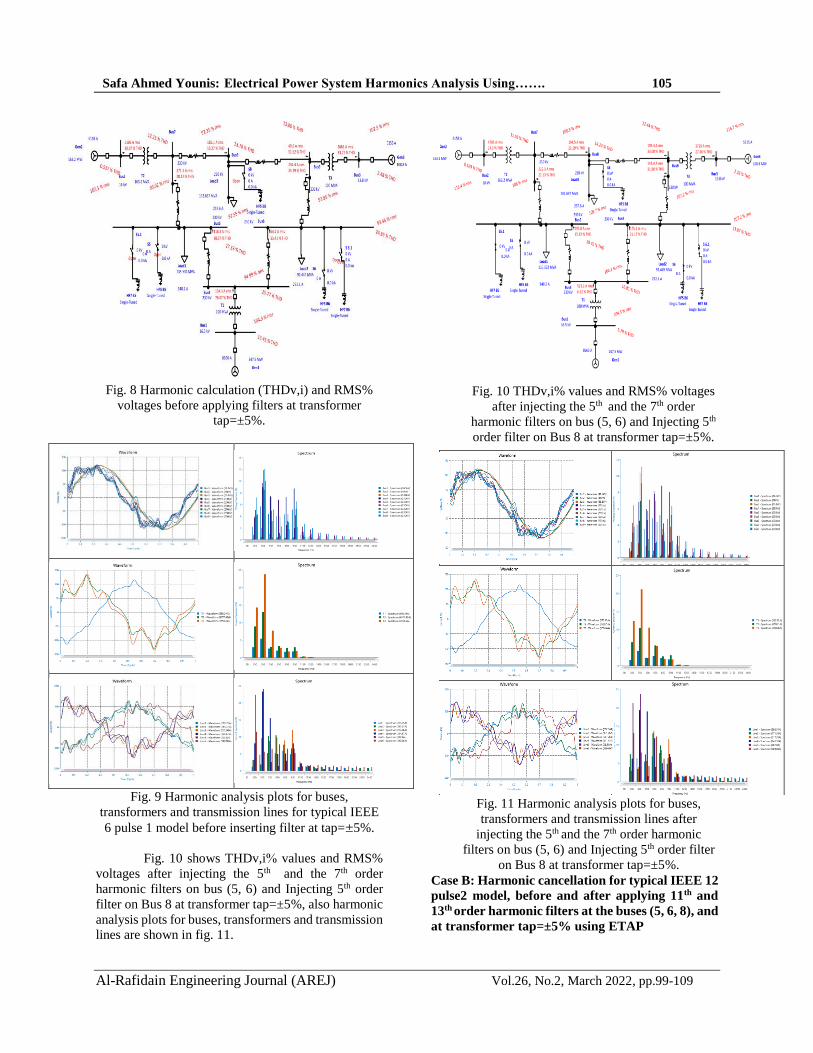
Fig. 10 shows THDv,i% values and RMS%
voltages after injecting the 5th and the 7th order
harmonic filters on bus (5, 6) and Injecting 5th order
filter on Bus 8 at transformer tap=±5%, also harmonic
analysis plots for buses, transformers and transmission
lines are shown in fig. 11.
Fig. 10 THDv,i% values and RMS% voltages
after injecting the 5th and the 7th order
harmonic filters on bus (5, 6) and Injecting 5th
order filter on Bus 8 at transformer tap=±5%.
Fig. 11 Harmonic analysis plots for buses,
transformers and transmission lines after
injecting the 5th and the 7th order harmonic
filters on bus (5, 6) and Injecting 5th order filter
on Bus 8 at transformer tap=±5%.
Case B: Harmonic cancellation for typical IEEE 12
pulse2 model, before and after applying 11th and
13th order harmonic filters at the buses (5, 6, 8), and
at transformer tap=±5% using ETAP
106 Safa Ahmed Younis: Electrical Power System Harmonics Analysis Using…….
Al-Rafidain Engineering Journal (AREJ) Vol.26, No.2, March 2022, pp.99-109
As we mentioned earlier, we set the
transformer tap to 5% in order to get the allowable
limit of the RMS% voltages which is equal to 105%.
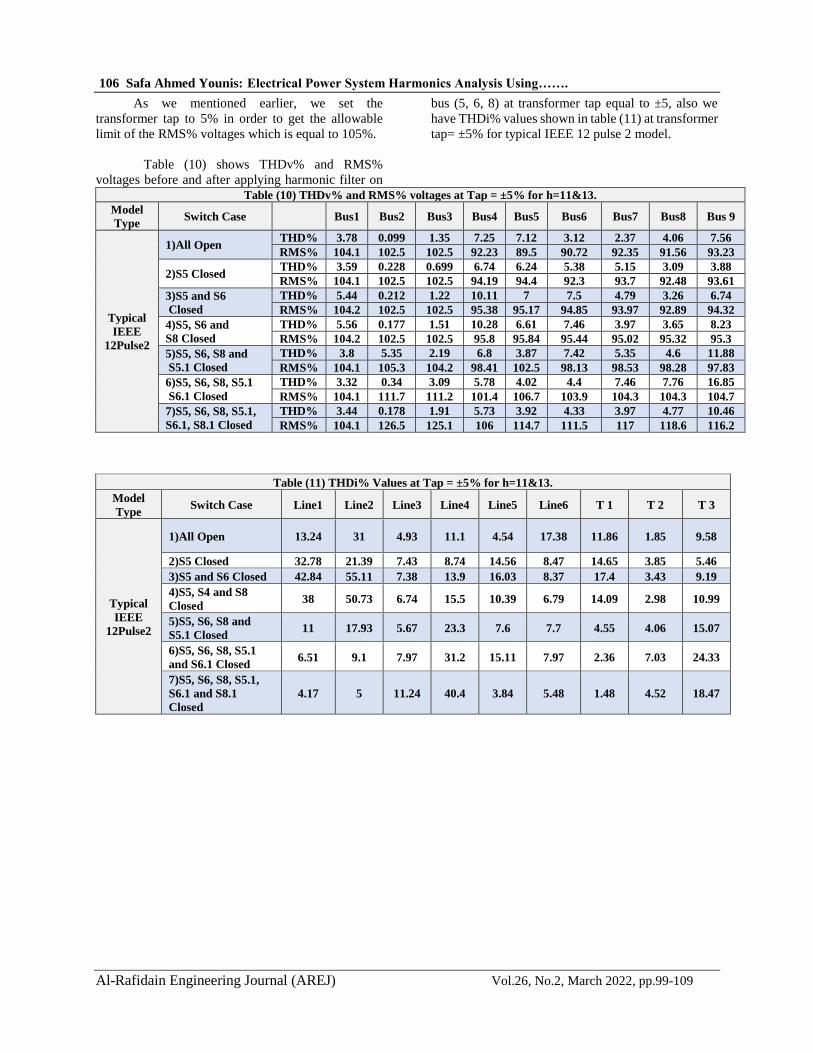
Table (10) shows THDv% and RMS%
voltages before and after applying harmonic filter on
bus (5, 6, 8) at transformer tap equal to ±5, also we
have THDi% values shown in table (11) at transformer
tap= ±5% for typical IEEE 12 pulse 2 model.
Table (10) THDv% and RMS% voltages at Tap = ±5% for h=11&13.
Model
Type Switch Case Bus1 Bus2 Bus3 Bus4 Bus5 Bus6 Bus7 Bus8 Bus 9
Typical
IEEE
12Pulse2
1)All Open THD% 3.78 0.099 1.35 7.25 7.12 3.12 2.37 4.06 7.56
RMS% 104.1 102.5 102.5 92.23 89.5 90.72 92.35 91.56 93.23
2)S5 Closed THD% 3.59 0.228 0.699 6.74 6.24 5.38 5.15 3.09 3.88
RMS% 104.1 102.5 102.5 94.19 94.4 92.3 93.7 92.48 93.61
3)S5 and S6
Closed
THD% 5.44 0.212 1.22 10.11 7 7.5 4.79 3.26 6.74
RMS% 104.2 102.5 102.5 95.38 95.17 94.85 93.97 92.89 94.32
4)S5, S6 and
S8 Closed
THD% 5.56 0.177 1.51 10.28 6.61 7.46 3.97 3.65 8.23
RMS% 104.2 102.5 102.5 95.8 95.84 95.44 95.02 95.32 95.3
5)S5, S6, S8 and
S5.1 Closed
THD% 3.8 5.35 2.19 6.8 3.87 7.42 5.35 4.6 11.88
RMS% 104.1 105.3 104.2 98.41 102.5 98.13 98.53 98.28 97.83
6)S5, S6, S8, S5.1
S6.1 Closed
THD% 3.32 0.34 3.09 5.78 4.02 4.4 7.46 7.76 16.85
RMS% 104.1 111.7 111.2 101.4 106.7 103.9 104.3 104.3 104.7
7)S5, S6, S8, S5.1,
S6.1, S8.1 Closed
THD% 3.44 0.178 1.91 5.73 3.92 4.33 3.97 4.77 10.46
RMS% 104.1 126.5 125.1 106 114.7 111.5 117 118.6 116.2
Table (11) THDi% Values at Tap = ±5% for h=11&13.
Model
Type Switch Case Line1 Line2 Line3 Line4 Line5 Line6 T 1 T 2 T 3
Typical
IEEE
12Pulse2
1)All Open 13.24 31 4.93 11.1 4.54 17.38 11.86 1.85 9.58
2)S5 Closed 32.78 21.39 7.43 8.74 14.56 8.47 14.65 3.85 5.46
3)S5 and S6 Closed 42.84 55.11 7.38 13.9 16.03 8.37 17.4 3.43 9.19
4)S5, S4 and S8
Closed 38 50.73 6.74 15.5 10.39 6.79 14.09 2.98 10.99
5)S5, S6, S8 and
S5.1 Closed 11 17.93 5.67 23.3 7.6 7.7 4.55 4.06 15.07
6)S5, S6, S8, S5.1
and S6.1 Closed 6.51 9.1 7.97 31.2 15.11 7.97 2.36 7.03 24.33
7)S5, S6, S8, S5.1,
S6.1 and S8.1
Closed
4.17 5 11.24 40.4 3.84 5.48 1.48 4.52 18.47
Safa Ahmed Younis: Electrical Power System Harmonics Analysis Using……. 107
Al-Rafidain Engineering Journal (AREJ) Vol.26, No.2, March 2022, pp.99-109
From table (10) we notice that form switch
case 1 to switch case 5 the RMS% voltages stayed
within the limits which is 105% and after changing the
transformer tap to ±5%. The switch case 7 has the
lowest THDv % but the RMS% voltages exceed the
limits. These results were calculated as a final step to
inject the harmonic filter, because if we inject more
filters, the RMS% voltages will exceed the allowable
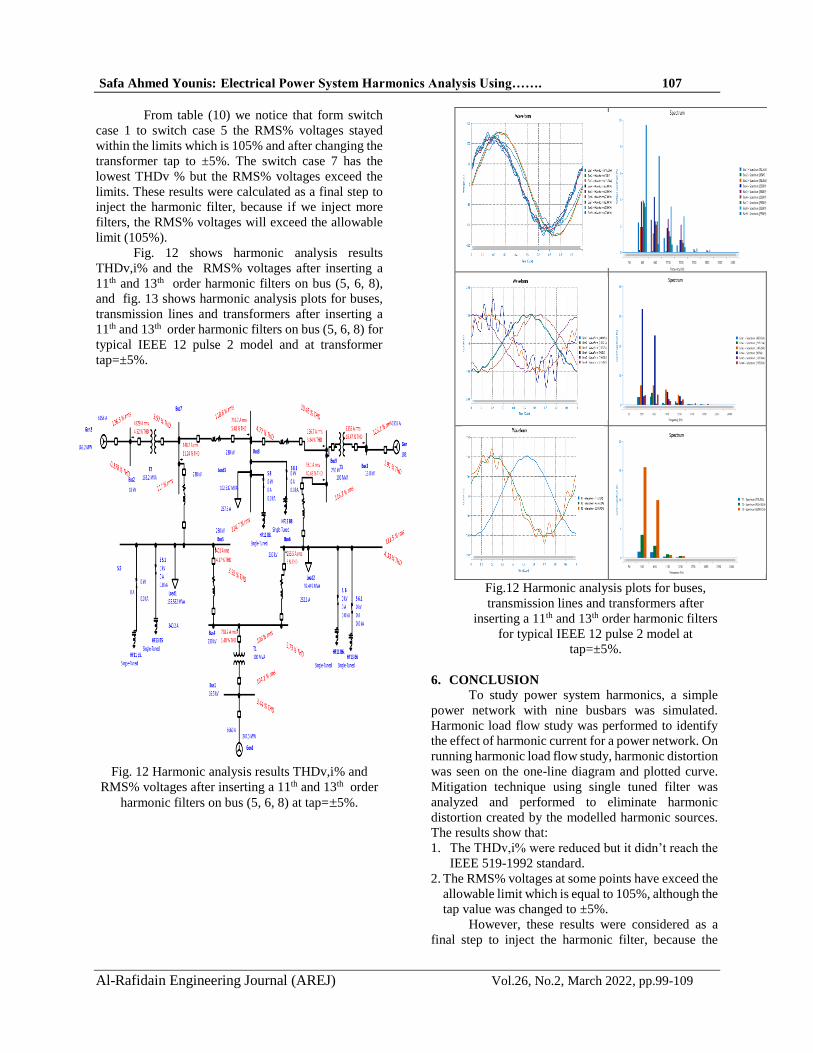
limit (105%). Fig. 12 shows harmonic analysis results
THDv,i% and the RMS% voltages after inserting a
11th and 13th order harmonic filters on bus (5, 6, 8),
and fig. 13 shows harmonic analysis plots for buses,
transmission lines and transformers after inserting a
11th and 13th order harmonic filters on bus (5, 6, 8) for
typical IEEE 12 pulse 2 model and at transformer
tap=±5%.
Fig. 12 Harmonic analysis results THDv,i% and
RMS% voltages after inserting a 11th and 13th order
harmonic filters on bus (5, 6, 8) at tap=±5%.
Fig.12 Harmonic analysis plots for buses,
transmission lines and transformers after
inserting a 11th and 13th order harmonic filters
for typical IEEE 12 pulse 2 model at
tap=±5%.
6. CONCLUSION To study power system harmonics, a simple
power network with nine busbars was simulated.
Harmonic load flow study was performed to identify
the effect of harmonic current for a power network. On
running harmonic load flow study, harmonic distortion
was seen on the one-line diagram and plotted curve.
Mitigation technique using single tuned filter was
analyzed and performed to eliminate harmonic
distortion created by the modelled harmonic sources.
The results show that:
1. The THDv,i% were reduced but it didn’t reach the
IEEE 519-1992 standard.
2. The RMS% voltages at some points have exceed the
allowable limit which is equal to 105%, although the
tap value was changed to ±5%.
However, these results were considered as a
final step to inject the harmonic filter, because the
108 Safa Ahmed Younis: Electrical Power System Harmonics Analysis Using…….
Al-Rafidain Engineering Journal (AREJ) Vol.26, No.2, March 2022, pp.99-109
more filters we inject, the higher RMS% voltages we
got. if we inject more filters, the RMS% voltages value
will increase. The ETAP load flow analysis result was
compared with the result of the load flow analysis in
MATLAB, and comparison shows that the ETAP load
flow analysis results were more accurate than
MATLAB results.
REFERENCES
[1] C. Francisco D. La Rosa, “Harmonics and power
system”, Distribution Control Systems, Taylor &
Francis Group, LLC, 2006.
[2] Z. Hameed, M. Rafay Khan Sial, A. Yousaf, M.
Usman Hashmi," Harmonics in Electrical Power
Systems and how to remove them by using filters
in ETAP", Faculty of Engineering and Technology
Superior University Pakistan, 2016.
[3] H. Abu-Rub, M. Malinowski, K. Al-Haddad,
“Power electronics for renewable energy system,
transportation and industrial applications”, First
Edition, John Wiley & Sons Ltd, The Atrium,
Southern Gate, Chichester, West Sussex, PO19
8SQ, United Kingdom, 2014.
[4] L. G. Mahiwal and J. G. Jamnani, "Analysis and
Mitigation of Harmonics for Standard IEEE 13
Bus Test System Using ETAP, "2019 International
Conference on Computing, Power and
Communication Technologies (GUCON), 2019.
[5] ETAP 4 user guide, Operation Technology, Inc,
2002.
[6] S. V. Rode and S. A. Ladhake, "A new method for
harmonic elimination”, 2011 Annual IEEE India
Conference, Hyderabad, 2011.
[7] M. T. Riaz, M. M. Afzal, S. M. Aaqib and H. Ali,
"Analysis and Evaluating the Effect of Harmonic
Distortion Levels in Industry”, 2021 4th
International Conference on Energy Conservation
and Efficiency (ICECE), 2021.
[8] J. Aswal and Y. Pal, "Passive and active filter for
harmonic mitigation in a 3-phase, 3-wire system,
" 2018 2nd International Conference on Inventive
Systems and Control (ICISC), 2018.
[9] N. Azim Bhuiyan, “Power System Harmonic
Analysis using ETAP”, School of Engineering &
Design Electronic & Computer Engineering MSc
Sustainable Electrical Power Brunel University,
2017.
[10] P. M. Anderson, A A Fouad, “Power System
Control and Stability”, Piscataway, N.J.: IEEE
Press: Wiley-Interscience, 2003.
[11] S. Parthasarathy, L. J. Sindhujah and V.
Rajasekaran, "Harmonic mitigation in a rectifier
system using hybrid power filter”, 2012
International Conference on Computing,
Electronics and Electrical Technologies
(ICCEET), 2012.
[12] ETAP 4 user guide, Operation Technology, Inc,
2001.
Safa Ahmed Younis: Electrical Power System Harmonics Analysis Using……. 109
Al-Rafidain Engineering Journal (AREJ) Vol.26, No.2, March 2022, pp.99-109
ETAPازالة توافقيات نظام طاقة كهربائية بأستخدام
عمر موفق اليوسف صفاء أحمد يونس
[email protected] [email protected]
قسم الهندسة الكهربائية -كلية الهندسة -جامعة الموصل
الملخص
قة مثل اآلالت األوتوماتيكية ومحركات السرعة القابلة للتعديل وأجهزة الكمبيوتر الشخصية بسبب التقدم السريع في إنشاء معدات إلكترونيات الطاوافقيات التواألحمال غير الخطية األخرى التي تعد المصادر الرئيسية للتوافقيات. نظًرا لوجود هذه األحمال غير الخطية ، من الضروري تقليل مستوى
ثم ، فإن التحليل التوافقي لشبكات التوزيع مهم. يعد تحليل أنظمة الطاقة جزًءا مهًما من هندسة أنظمة الطاقة. الهدف التي تم إنشاؤها في شبكات الطاقة. ومنفحص بالرئيسي ألي شركة خدمات كهربائية هو توفير أفضل جودة للطاقة. تعد توافقيات نظام الطاقة أحد األسباب الرئيسية لضعف جودة الطاقة. يج
ية مليلها ومن ثم اختيار المرشح المناسب لتقليل توافقيات الجهد والتيار. يهدف هذا البحث إلى بناء نموذج محاكاة مكون من تسعة قضبان عموالتوافقيات وتحلدراسة (، والذي يعتبر من أفضل األدوات ETAPلتقييم خصائص التوافقيات في حاالت الدراسة المختلفة باستخدام برنامج التحليل الكهربائي العابر )
ويتم استخدام تقنيات التخفيف المتمثلة بمرشحات احادية الرنين والتي يجب ETAPالتوافقيات في نظام الطاقة ، وبالتالي ، يتم تحليل التشوه التوافقي في .IEEE 519-1992عيار تقع ضمن القيمة الحدية فيما يتعلق بم i% THDv,أن بعض قيم ETAPتركيبها في أسوأ وأفضل حالة. وتظهر نتائج محاكاة
الكلمات الدالة:ETAP أالحمال الغير خطية، مرشح احادي الرنين، معيار ،THD%, IEEE 519 -1992 .عامل التشوه الكلي
Related Documents