T r e n d s o f Y o u r B u s i n e s s E x c l u s i v e l y d i s t r i b u t e d b y India, Q4 2010 Electric Power Generation, Transmission and Distribution Please address all comments and enquiries to: [email protected] ISIEmergingMarketsPDF us-mckinsey1 from 115.249.53.242 on 2011-08-29 13:41:30 EDT. DownloadPDF. Downloaded by us-mckinsey1 from 115.249.53.242 at 2011-08-29 13:41:30 EDT. ISI Emerging Markets. Unauthorized Distribution Prohibited.

Welcome message from author
This document is posted to help you gain knowledge. Please leave a comment to let me know what you think about it! Share it to your friends and learn new things together.
Transcript
T r e n d s o f Y o u r B u s i n e s s
E x c l u s i v e l y d i s t r i b u t e d b y
India, Q4 2010
Electric Power Generation, Transmission and Distribution
Please address all comments and enquiries to: [email protected]
ISIEmergingMarketsPDF us-mckinsey1 from 115.249.53.242 on 2011-08-29 13:41:30 EDT. DownloadPDF.
Downloaded by us-mckinsey1 from 115.249.53.242 at 2011-08-29 13:41:30 EDT. ISI Emerging Markets. Unauthorized Distribution Prohibited.
-2-
E lec tric P ower Generation, T ransmiss ion and Dis tribution
! This report has been compiled to the best of the authors’ knowledge, using information originating from verifiedsources. The authors of the report take no responsibility for the consequences of any decisions and actions taken as aresult of the use of this report. This report refers to the Indian economy.
Contents Page1. Macroeconomic Scenario - 4
2. Analysis of Investment Attractiveness - 5
- Attractiveness Indicators - 5
- Driving Forces of Attractiveness - 5
- Risk-Profitability Maps - 7
3. Analysis of Revenue - 9
- Long-term Trend. Business Cycle. Correlation - 9
- Seasonality in Revenues. Seasonal Adjusted Revenues - 10
4. Concentration in the Sector - 11
5. Analysis of Financial Ratios - 12
- Distributions of Financials in the sector - 12
- General Indicators - 13
- Profitability Ratios - 18
- Liquidity Ratios - 21
- Financial Cycles - 22
- Financial Leverage Ratios - 23
- Production Factors - 25
- Investment Outlays - 27
- Costs - 29
- Structure of Fixed Assets - 33
- Structure of Current Assets - 34
- Structure of Current Liabilities - 35
- Main Leverages - 36
- DuPont’s Pyramid - 37
6. Companies from the Sector - 38
- Top Players - market shares - 38
- Top Players from the Sector - 39
- Listed Companies from the Sector - 40
- Mergers and Acquisitions - 41
7. Key Concepts - 42
- Definitions of Indices - 42
- Definitions of Selected Concepts - 44
ISIEmergingMarketsPDF us-mckinsey1 from 115.249.53.242 on 2011-08-29 13:41:30 EDT. DownloadPDF.
Downloaded by us-mckinsey1 from 115.249.53.242 at 2011-08-29 13:41:30 EDT. ISI Emerging Markets. Unauthorized Distribution Prohibited.
-3-
E lec tric P ower Generation, T ransmiss ion and Dis tribution
Analysed sector:
Class Electric Power Generation, Transmission and Distribution
The following sub-classes are included in the class:
Hydroelectric Power Generation Electric Power Transmission, Control, and Distribution Nuclear Electric Power Generation Fossil Fuel Electric Power Generation Other Electric Power Generation
Only the sub-classes marked by an arrow are covered by EconTrends reports.
EconTrends for India is the unique tool for analyzing various Indian industries. It contains description ofmacroeconomic environment, analysis of investment attractiveness, detailed analysis of revenue as well as in-depthanalysis of a wide scope of financial ratios. The report covers not the full sector but only its major part, since it is buildon the bottom-up aggregated financial data on listed companies from the Accord Fintech database reporting onquarterly basis. Quarterly financial data from Income Statement are adjusted to assert their consistency with yearlyaudited figures.
Profitability of a given industry is evaluated on the basis of average forecasted dynamics of EBITDA in two followingquarters. Every industry has a granted profitability mark that ranges from 1 up to 5, which reflects its profitabilityversus other industries. Higher mark indicates higher profitability. Risk of an industry in turn is measured by thestandard deviation of forecasted Profitability Index. Every industry has also an assigned risk mark that ranges from 1up to 5, which reflects its risk versus other industries. Higher mark means here lower risk. Each industry is at the endcharacterized by the following two parameters – its profitability and risk. They are used for evaluation of the short term investment attractiveness, that reflects preferences of investors seeking to maximize their rates of return and tominimize the risk they face.
The final Short-Term Investment Attractiveness Ranking of an analyzed industry explains its relative attractivenesscomparing to other sectors. The lower a position within the ranking the higher is attractiveness of an industry. Changesin this position replicate either changes in profitability or in risk. Additionally like in the case of profitability and riskmeasurement the final attractiveness is graded from 1 to 5, where the highest grade means the highest attractiveness.Lower grade means worse “investment-weather conditions”, so either lower profitability or higher risk. The Short-TermInvestment Attractiveness Ranking is presented according to the structure of the North American IndustryClassification System (NAICS). However the used system of industry classification is not fully compatible with theNational Classification of Activities in India due to Indian statistics - specific factors.
The Short-Term Investment Attractiveness Ranking developed for India under the EconTrends ® methodology is basedon the so called Profitability Index, that shows forecasted dynamics of EBITDA. It serves as a proxy for dynamics ofdirty cash flows in enterprises from a given industry. Fundamental components of the Profitability Index like net salesand EBITDA margin, are forecasted using econometric models. The behavior over time of all these categories isillustrated using appropriate pictograms in the “Map of Forces”.
ISIEmergingMarketsPDF us-mckinsey1 from 115.249.53.242 on 2011-08-29 13:41:30 EDT. DownloadPDF.
Downloaded by us-mckinsey1 from 115.249.53.242 at 2011-08-29 13:41:30 EDT. ISI Emerging Markets. Unauthorized Distribution Prohibited.
-4-
E lec tric P ower Generation, T ransmiss ion and Dis tribution
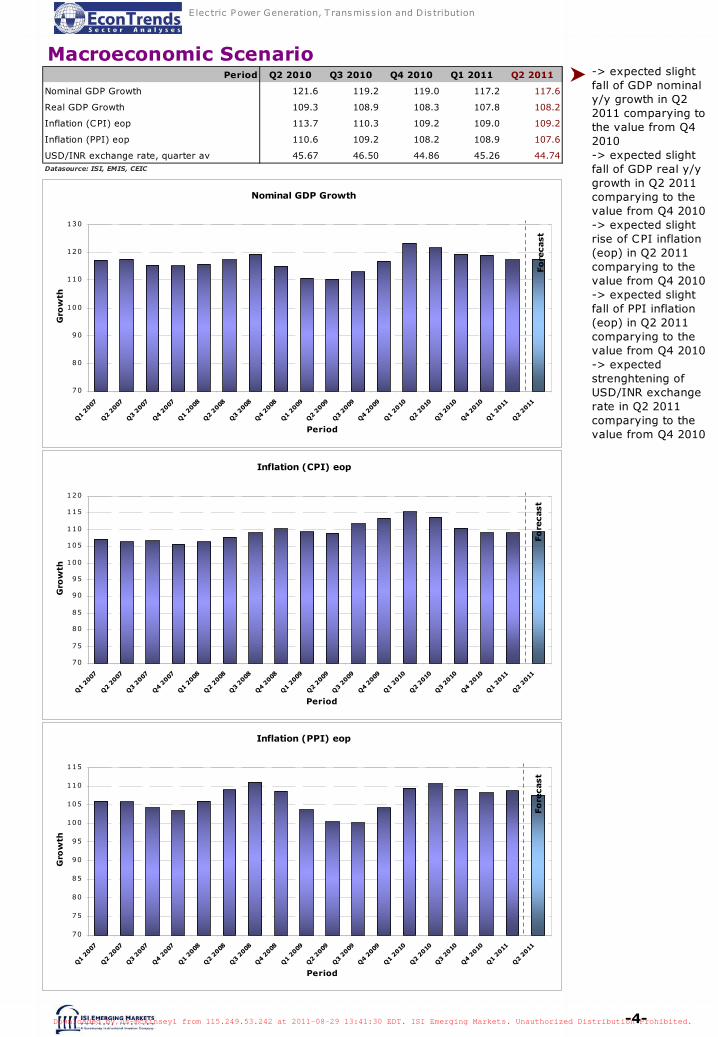
-> expected slight fall of GDP nominal y/y growth in Q2 2011 comparying to the value from Q4 2010-> expected slight fall of GDP real y/y growth in Q2 2011 comparying to the value from Q4 2010-> expected slight rise of CPI inflation (eop) in Q2 2011 comparying to the value from Q4 2010-> expected slight fall of PPI inflation (eop) in Q2 2011 comparying to the value from Q4 2010-> expected strenghtening of USD/INR exchange rate in Q2 2011 comparying to the value from Q4 2010
Macroeconomic Scenario
Nominal GDP Growth
70
80
90
100
110
120
130
Q1 2
007
Q2 2
007
Q3 2
007
Q4 2
007
Q1 2
008
Q2 2
008
Q3 2
008
Q4 2
008
Q1 2
009
Q2 2
009
Q3 2
009
Q4 2
009
Q1 2
010
Q2 2
010
Q3 2
010
Q4 2
010
Q1 2
011
Q2 2
011
Period
Gro
wth
Fo
recast
Period Q2 2010 Q3 2010 Q4 2010 Q1 2011 Q2 2011
Nominal GDP Growth 121.6 119.2 119.0 117.2 117.6
Real GDP Growth 109.3 108.9 108.3 107.8 108.2
Inflation (CPI) eop 113.7 110.3 109.2 109.0 109.2
Inflation (PPI) eop 110.6 109.2 108.2 108.9 107.6
USD/INR exchange rate, quarter av 45.67 46.50 44.86 45.26 44.74Datasource: ISI, EMIS, CEIC
Inflation (CPI) eop
70
75
80
85
90
95
100
105
110
115
120
Q1 2
007
Q2 2
007
Q3 2
007
Q4 2
007
Q1 2
008
Q2 2
008
Q3 2
008
Q4 2
008
Q1 2
009
Q2 2
009
Q3 2
009
Q4 2
009
Q1 2
010
Q2 2
010
Q3 2
010
Q4 2
010
Q1 2
011
Q2 2
011
Period
Gro
wth
Fo
recast
Inflation (PPI) eop
70
75
80
85
90
95
100
105
110
115
Q1 2
007
Q2 2
007
Q3 2
007
Q4 2
007
Q1 2
008
Q2 2
008
Q3 2
008
Q4 2
008
Q1 2
009
Q2 2
009
Q3 2
009
Q4 2
009
Q1 2
010
Q2 2
010
Q3 2
010
Q4 2
010
Q1 2
011
Q2 2
011
Period
Gro
wth
Fo
recast
ISIEmergingMarketsPDF us-mckinsey1 from 115.249.53.242 on 2011-08-29 13:41:30 EDT. DownloadPDF.
Downloaded by us-mckinsey1 from 115.249.53.242 at 2011-08-29 13:41:30 EDT. ISI Emerging Markets. Unauthorized Distribution Prohibited.
-5-
E lec tric P ower Generation, T ransmiss ion and Dis tribution
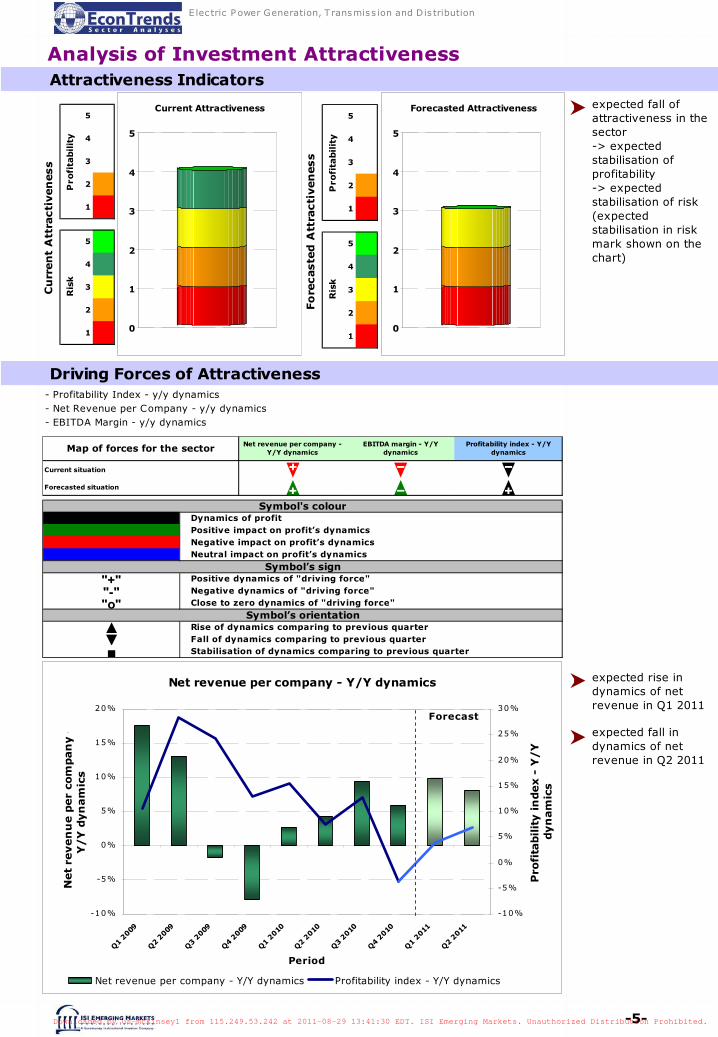
expected fall of attractiveness in the sector-> expected stabilisation of profitability-> expected stabilisation of risk (expected stabilisation in risk mark shown on the chart)
5 0
4 0
3 0
2 1
1 1
5 1
4 1
3 1
2 1
1 1
Cu
rren
t A
ttra
cti
ven
ess
Pro
fita
bilit
yR
isk
0
1
2
3
4
5
Current Attractiveness5 0
4 0
3 0
2 1
1 1
5 1
4 1
3 1
2 1
1 1
Fo
recaste
d A
ttra
cti
ven
ess
Pro
fita
bilit
yR
isk
0
1
2
3
4
5
Forecasted Attractiveness
Driving Forces of Attractiveness - Profitability Index - y/y dynamics- Net Revenue per Company - y/y dynamics - EBITDA Margin - y/y dynamics
Current situation b a aForecasted situation e d e
Map of forces for the sector Net revenue per company - Y/Y dynamics
EBITDA margin - Y/Y dynamics
Profitability index - Y/Y dynamics
"+""-""o"
▲▼■
Symbol's colour Dynamics of profit Positive impact on profit’s dynamics Negative impact on profit’s dynamics Neutral impact on profit’s dynamics
Symbol’s sign
Fall of dynamics comparing to previous quarter Stabilisation of dynamics comparing to previous quarter
Symbol’s orientation Rise of dynamics comparing to previous quarter
Positive dynamics of "driving force" Negative dynamics of "driving force" Close to zero dynamics of "driving force"
expected rise in dynamics of net revenue in Q1 2011
expected fall in dynamics of net revenue in Q2 2011
Analysis of Investment Attractiveness Attractiveness Indicators
Net revenue per company - Y/Y dynamics
-10%
-5%
0%
5%
10%
15%
20%
Q1 2
009
Q2 2
009
Q3 2
009
Q4 2
009
Q1 2
010
Q2 2
010
Q3 2
010
Q4 2
010
Q1 2
011
Q2 2
011
Period
Net
reven
ue p
er
com
pan
y -
Y/Y
dyn
am
ics
-10%
-5%
0%
5%
10%
15%
20%
25%
30%
Pro
fita
bilit
y in
dex -
Y/Y
dyn
am
ics
Net revenue per company - Y/Y dynamics Profitability index - Y/Y dynamics
Forecast
ISIEmergingMarketsPDF us-mckinsey1 from 115.249.53.242 on 2011-08-29 13:41:30 EDT. DownloadPDF.
Downloaded by us-mckinsey1 from 115.249.53.242 at 2011-08-29 13:41:30 EDT. ISI Emerging Markets. Unauthorized Distribution Prohibited.
-6-
E lec tric P ower Generation, T ransmiss ion and Dis tribution
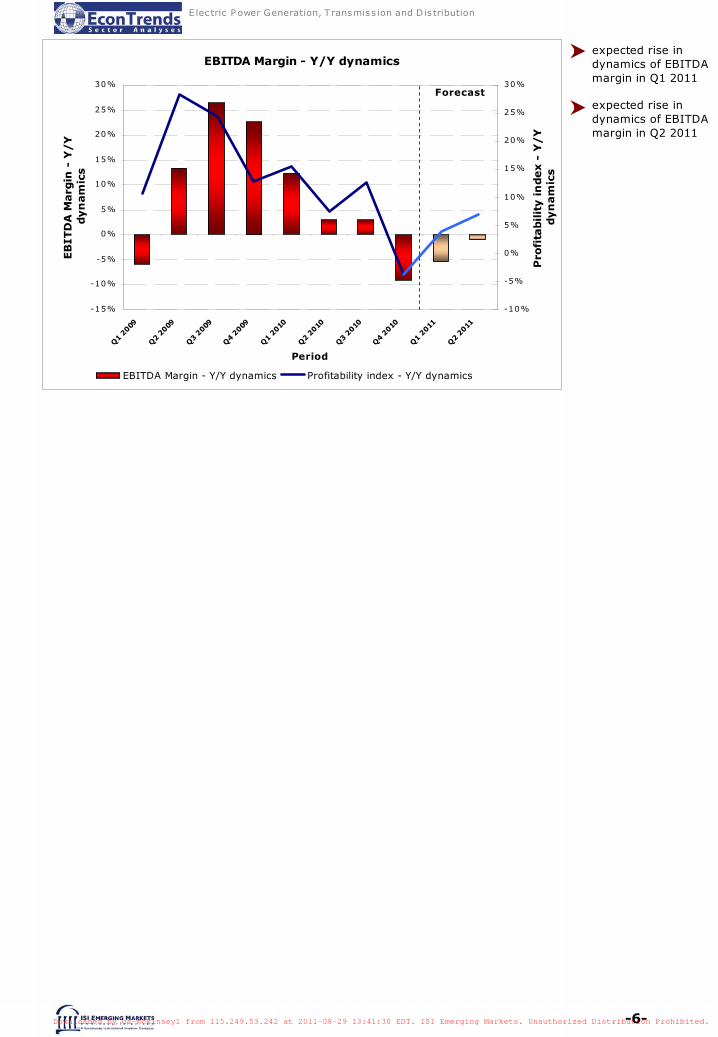
expected rise in dynamics of EBITDA margin in Q1 2011
expected rise in dynamics of EBITDA margin in Q2 2011
EBITDA Margin - Y/Y dynamics
-15%
-10%
-5%
0%
5%
10%
15%
20%
25%
30%
Q1 2
009
Q2 2
009
Q3 2
009
Q4 2
009
Q1 2
010
Q2 2
010
Q3 2
010
Q4 2
010
Q1 2
011
Q2 2
011
Period
EB
ITD
A M
arg
in -
Y/Y
dyn
am
ics
-10%
-5%
0%
5%
10%
15%
20%
25%
30%
Pro
fita
bilit
y in
dex -
Y/Y
dyn
am
ics
EBITDA Margin - Y/Y dynamics Profitability index - Y/Y dynamics
Forecast
ISIEmergingMarketsPDF us-mckinsey1 from 115.249.53.242 on 2011-08-29 13:41:30 EDT. DownloadPDF.
Downloaded by us-mckinsey1 from 115.249.53.242 at 2011-08-29 13:41:30 EDT. ISI Emerging Markets. Unauthorized Distribution Prohibited.

-7-
E lec tric P ower Generation, T ransmiss ion and Dis tribution
Risk-Profitability Maps
Risk - Profitability Map (current situation)
-0.6
-0.4
-0.2
0.0
0.2
0.4
0.6
0.8
1.0
0.0 0.2 0.4 0.6 0.8 1.0 1.2
Risk
Pro
fita
bil
ity
All sectorsMost efficient sectorssub-classes belonging to selected groupSelected sector (C lass): Electric Power Generation, Transmission and DistributionInvestors' utility function
Risk - Profitability Map (current situation)Zoom
0.00
0.02
0.04
0.06
0.08
0.10
0.12
0.00 0.02 0.04 0.06 0.08 0.10 0.12 0.14
Risk
Pro
fita
bil
ity
All sectorsMost efficient sectorssub-classes belonging to selected groupSelected sector (Class): Electric Power Generation, Transmission and DistributionInvestors' utility function
risk - profitability map (current situation)
ISIEmergingMarketsPDF us-mckinsey1 from 115.249.53.242 on 2011-08-29 13:41:30 EDT. DownloadPDF.
Downloaded by us-mckinsey1 from 115.249.53.242 at 2011-08-29 13:41:30 EDT. ISI Emerging Markets. Unauthorized Distribution Prohibited.
-8-
E lec tric P ower Generation, T ransmiss ion and Dis tribution
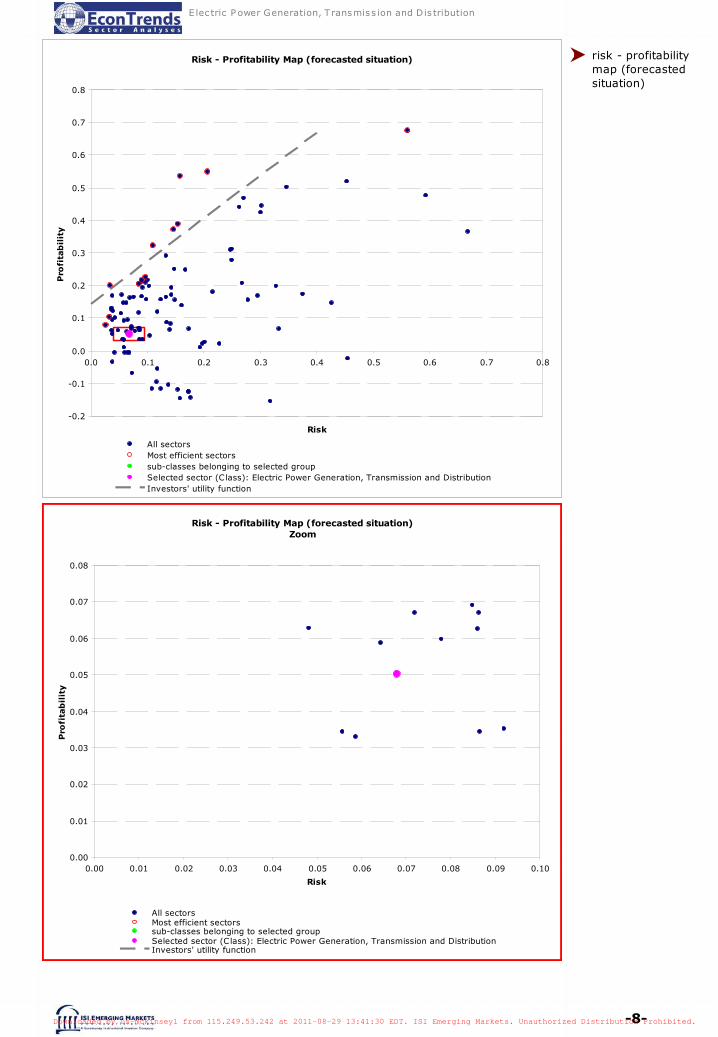
risk - profitability map (forecasted situation)
Risk - Profitability Map (forecasted situation)
-0.2
-0.1
0.0
0.1
0.2
0.3
0.4
0.5
0.6
0.7
0.8
0.0 0.1 0.2 0.3 0.4 0.5 0.6 0.7 0.8
Risk
Pro
fita
bil
ity
All sectorsMost efficient sectorssub-classes belonging to selected groupSelected sector (C lass): Electric Power Generation, Transmission and DistributionInvestors' utility function
Risk - Profitability Map (forecasted situation)Zoom
0.00
0.01
0.02
0.03
0.04
0.05
0.06
0.07
0.08
0.00 0.01 0.02 0.03 0.04 0.05 0.06 0.07 0.08 0.09 0.10
Risk
Pro
fita
bil
ity
All sectorsMost efficient sectorssub-classes belonging to selected groupSelected sector (Class): Electric Power Generation, Transmission and DistributionInvestors' utility function
ISIEmergingMarketsPDF us-mckinsey1 from 115.249.53.242 on 2011-08-29 13:41:30 EDT. DownloadPDF.
Downloaded by us-mckinsey1 from 115.249.53.242 at 2011-08-29 13:41:30 EDT. ISI Emerging Markets. Unauthorized Distribution Prohibited.
-9-
E lec tric P ower Generation, T ransmiss ion and Dis tribution
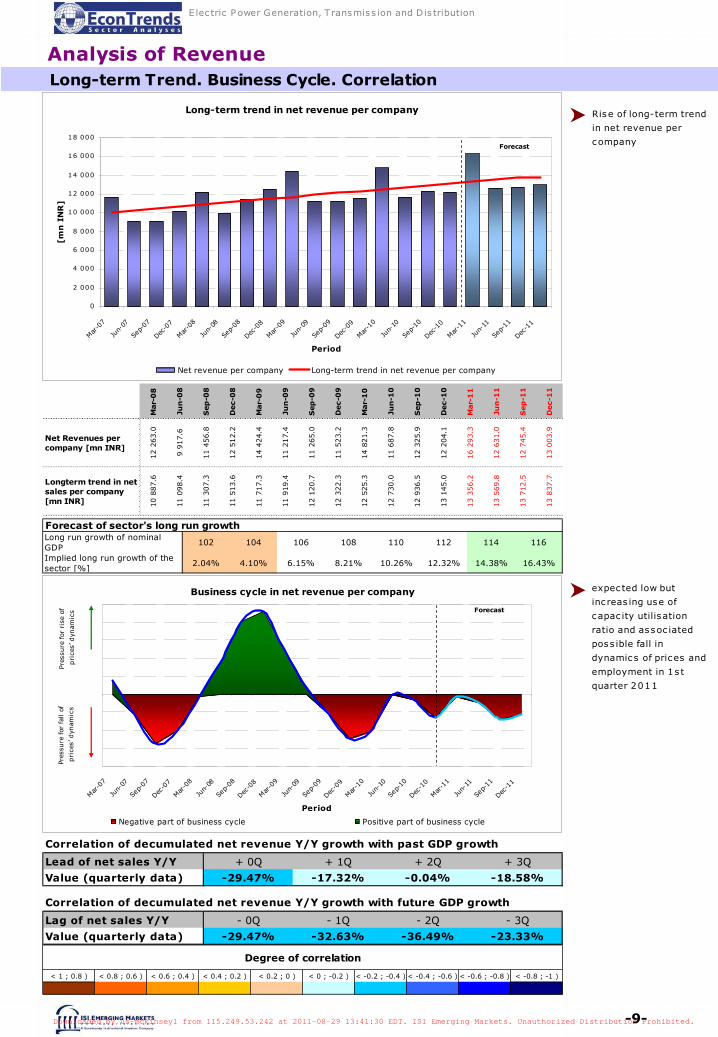
Analysis of Revenue Long-term Trend. Business Cycle. Correlation
Long-term trend in net revenue per company
0
2 000
4 000
6 000
8 000
10 000
12 000
14 000
16 000
18 000
Mar
-07
Jun-
07
Sep-
07
Dec-0
7
Mar-0
8
Jun-
08
Sep-08
Dec-0
8
Mar
-09
Jun-
09
Sep-
09
Dec-0
9
Mar
-10
Jun-
10
Sep-
10
Dec-1
0
Mar
-11
Jun-
11
Sep-
11
Dec-1
1
Period
[mn
IN
R]
Net revenue per company Long-term trend in net revenue per company
ForecastM
ar-
08
Jun
-08
Sep
-08
Dec-0
8
Mar-
09
Jun
-09
Sep
-09
Dec-0
9
Mar-
10
Jun
-10
Sep
-10
Dec-1
0
Mar-
11
Jun
-11
Sep
-11
Dec-1
1
Net Revenues per company [mn INR]
12 2
63.0
9 9
17.6
11 4
56.8
12 5
12.2
14 4
24.4
11 2
17.4
11 2
65.0
11 5
23.2
14 8
21.3
11 6
87.8
12 3
25.9
12 2
04.1
16 2
93.3
12 6
31.0
12 7
45.4
13 0
03.9
Longterm trend in net sales per company [mn INR] 1
0 8
87.6
11 0
98.4
11 3
07.3
11 5
13.6
11 7
17.3
11 9
19.4
12 1
20.7
12 3
22.3
12 5
25.3
12 7
30.0
12 9
36.5
13 1
45.0
13 3
56.2
13 5
69.8
13 7
12.5
13 8
37.7
Long run growth of nominal GDP
102 104 106 108 110 112 114 116
Implied long run growth of the sector [%]
2.04% 4.10% 6.15% 8.21% 10.26% 12.32% 14.38% 16.43%
Forecast of sector's long run growth
Rise of long-term trend
in net revenue per
company
expec ted low but
inc reas ing use of
capac ity utilisation
ratio and assoc iated
poss ible fall in
dynamics of prices and
employment in 1s t
quarter 2011
Business cycle in net revenue per company
Mar
-07
Jun-
07
Sep-07
Dec-0
7
Mar
-08
Jun-
08
Sep-
08
Dec-0
8
Mar
-09
Jun-
09
Sep-
09
Dec-0
9
Mar-1
0
Jun-
10
Sep-10
Dec-1
0
Mar
-11
Jun-
11
Sep-
11
Dec-1
1
Period
Negative part of business cycle Positive part of business cycle
Pres
sure
for
ris
e of
pri
ces’
dyn
amic
s
Pres
sure
for
fal
l of
pri
ces’
dyn
amic
s
Forecast
Lead of net sales Y/Y + 0Q + 1Q + 2Q + 3Q
Value (quarterly data) -29.47% -17.32% -0.04% -18.58%
Lag of net sales Y/Y - 0Q - 1Q - 2Q - 3Q
Value (quarterly data) -29.47% -32.63% -36.49% -23.33%
Correlation of decumulated net revenue Y/Y growth with past GDP growth
Correlation of decumulated net revenue Y/Y growth with future GDP growth
< 1 ; 0.8 ) < 0.8 ; 0.6 ) < 0.6 ; 0.4 ) < 0.4 ; 0.2 ) < 0.2 ; 0 ) < 0 ; -0.2 ) < -0.2 ; -0.4 ) < -0.4 ; -0.6 ) < -0.6 ; -0.8 ) < -0.8 ; -1 )
Degree of correlation
ISIEmergingMarketsPDF us-mckinsey1 from 115.249.53.242 on 2011-08-29 13:41:30 EDT. DownloadPDF.
Downloaded by us-mckinsey1 from 115.249.53.242 at 2011-08-29 13:41:30 EDT. ISI Emerging Markets. Unauthorized Distribution Prohibited.
-10-
E lec tric P ower Generation, T ransmiss ion and Dis tribution
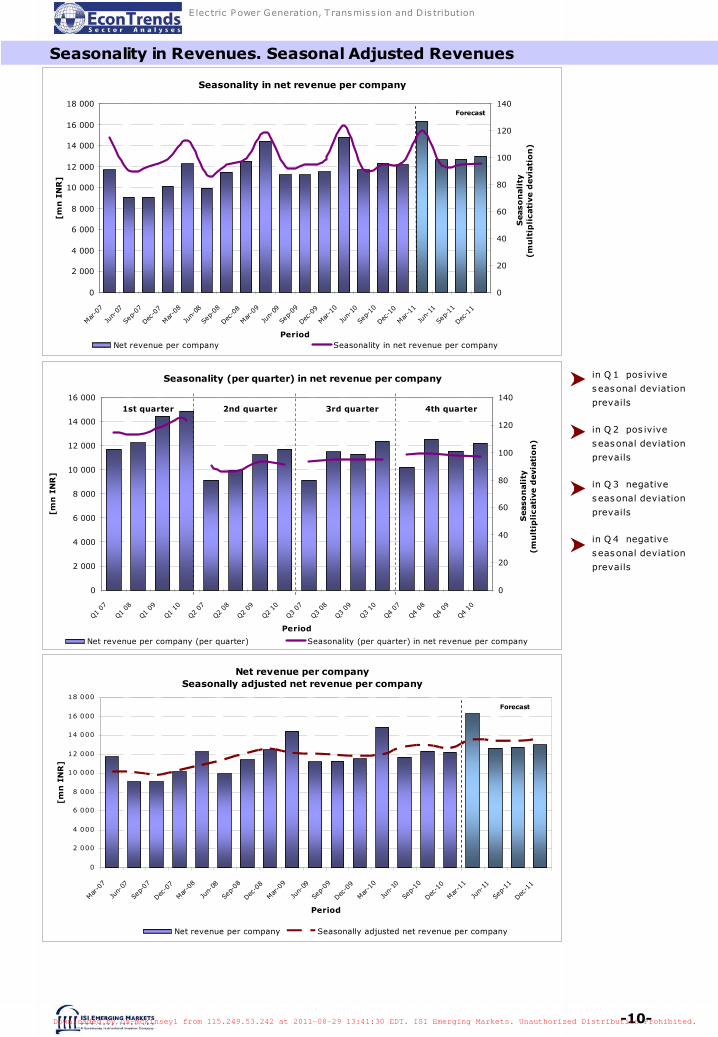
Seasonality in Revenues. Seasonal Adjusted Revenues
in Q 1 pos ivive
seasonal deviation
prevails
in Q 2 pos ivive
seasonal deviation
prevails
in Q 3 negative
seasonal deviation
prevails
in Q 4 negative
seasonal deviation
prevails
Seasonality in net revenue per company
0
2 000
4 000
6 000
8 000
10 000
12 000
14 000
16 000
18 000
Mar
-07
Jun-
07
Sep-
07
Dec-0
7
Mar-0
8
Jun-
08
Sep-
08
Dec-0
8
Mar
-09
Jun-
09
Sep-09
Dec-0
9
Mar-1
0
Jun-
10
Sep-
10
Dec-1
0
Mar
-11
Jun-
11
Sep-11
Dec-1
1
Period
[mn
IN
R]
0
20
40
60
80
100
120
140
Seaso
nali
ty(m
ult
ipli
cati
ve d
evia
tio
n)
Net revenue per company Seasonality in net revenue per company
Forecast
Seasonality (per quarter) in net revenue per company
0
2 000
4 000
6 000
8 000
10 000
12 000
14 000
16 000
Q1 07
Q1 08
Q1 09
Q1 10
Q2 07
Q2 08
Q2 09
Q2 10
Q3 07
Q3 08
Q3 09
Q3 10
Q4 07
Q4 08
Q4 09
Q4 10
Period
[mn
IN
R]
0
20
40
60
80
100
120
140
Seaso
nali
ty(m
ult
ipli
cati
ve d
evia
tio
n)
Net revenue per company (per quarter) Seasonality (per quarter) in net revenue per company
1st quarter 2nd quarter 3rd quarter 4th quarter
Net revenue per company Seasonally adjusted net revenue per company
0
2 000
4 000
6 000
8 000
10 000
12 000
14 000
16 000
18 000
Mar
-07
Jun-
07
Sep-
07
Dec-0
7
Mar
-08
Jun-
08
Sep-08
Dec-0
8
Mar
-09
Jun-
09
Sep-
09
Dec-0
9
Mar
-10
Jun-
10
Sep-
10
Dec-1
0
Mar
-11
Jun-
11
Sep-11
Dec-1
1
Period
[mn
IN
R]
Net revenue per company Seasonally adjusted net revenue per company
Forecast
ISIEmergingMarketsPDF us-mckinsey1 from 115.249.53.242 on 2011-08-29 13:41:30 EDT. DownloadPDF.
Downloaded by us-mckinsey1 from 115.249.53.242 at 2011-08-29 13:41:30 EDT. ISI Emerging Markets. Unauthorized Distribution Prohibited.
-11-
E lec tric P ower Generation, T ransmiss ion and Dis tribution
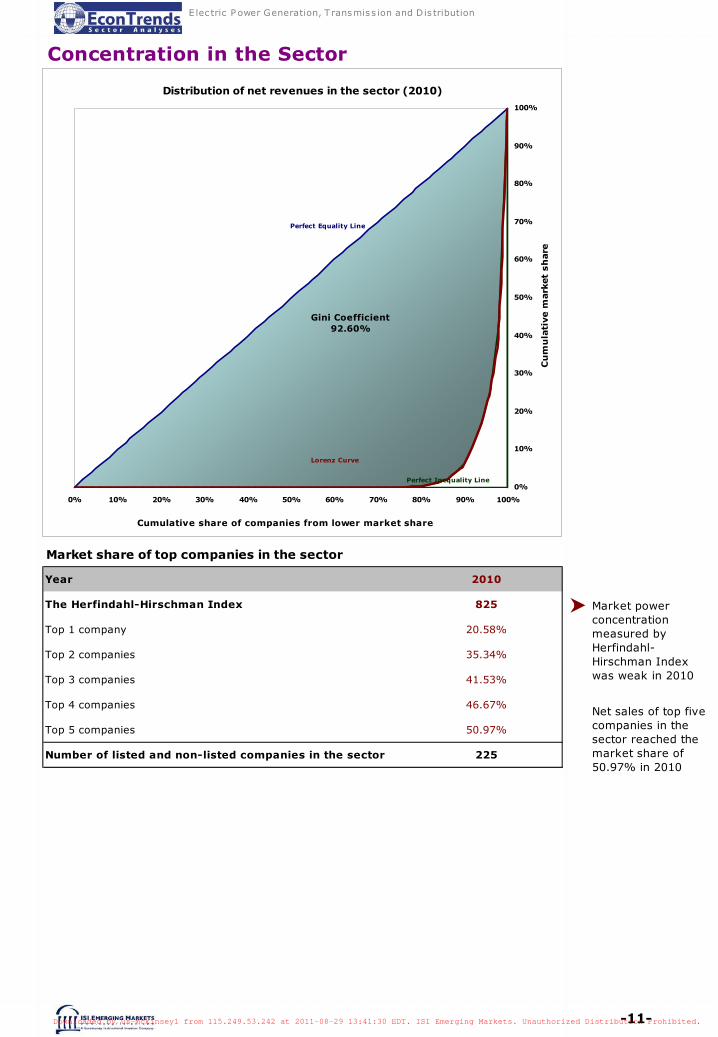
Market power concentration measured by Herfindahl-Hirschman Index was weak in 2010
Net sales of top five companies in the sector reached the market share of 50.97% in 2010
Market share of top companies in the sector
Year 2010
The Herfindahl-Hirschman Index 825
Top 1 company 20.58%
Top 2 companies 35.34%
Top 3 companies 41.53%
Top 4 companies 46.67%
Top 5 companies 50.97%
Number of listed and non-listed companies in the sector 225
Concentration in the Sector
Distribution of net revenues in the sector (2010)
0% 10% 20% 30% 40% 50% 60% 70% 80% 90% 100%
Cumulative share of companies from lower market share
Cu
mu
lati
ve m
ark
et
sh
are
0%
10%
20%
30%
40%
50%
60%
70%
80%
90%
100%
Gini Coefficient92.60%
Lorenz Curve
Perfect Inequality Line
Perfect Equality Line
ISIEmergingMarketsPDF us-mckinsey1 from 115.249.53.242 on 2011-08-29 13:41:30 EDT. DownloadPDF.
Downloaded by us-mckinsey1 from 115.249.53.242 at 2011-08-29 13:41:30 EDT. ISI Emerging Markets. Unauthorized Distribution Prohibited.
-12-
E lec tric P ower Generation, T ransmiss ion and Dis tribution
Source: ISI , EM IS, C EIC
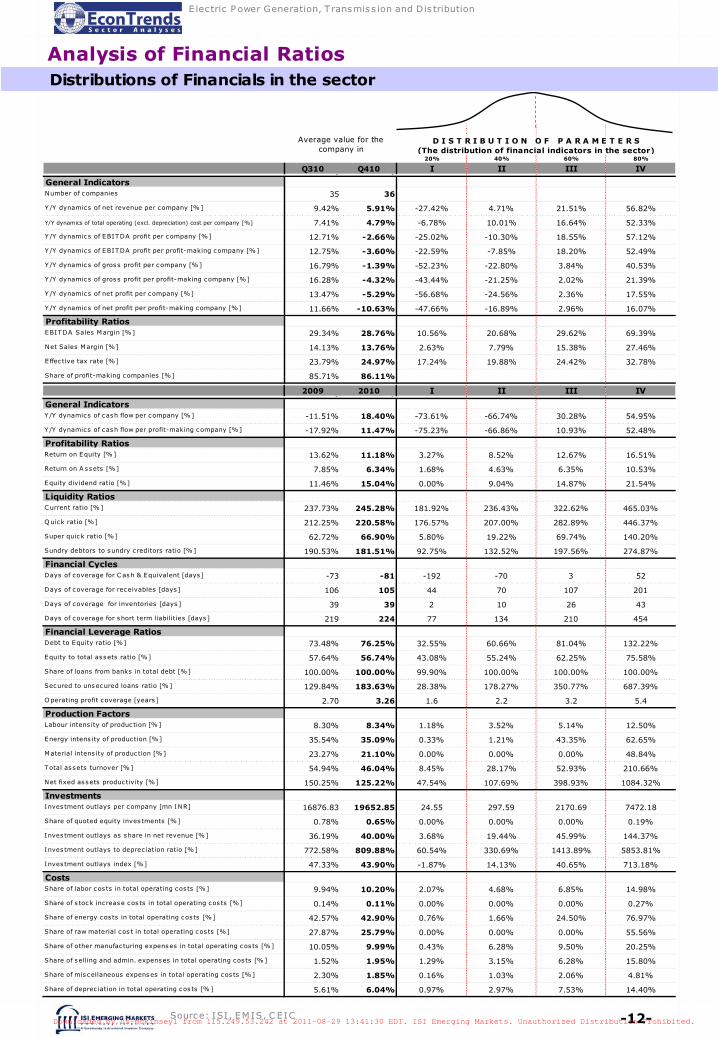
Analysis of Financial Ratios Distributions of Financials in the sector
20% 40% 60% 80%
Q310 Q410 I II III IV0 0General IndicatorsNumber of companies 35 36
Y /Y dynamics of net revenue per company [%] 9.42% 5.91% -27.42% 4.71% 21.51% 56.82%
Y/Y dynamics of total operating (excl. depreciation) cost per company [%] 7.41% 4.79% -6.78% 10.01% 16.64% 52.33%
Y/Y dynamics of EBITDA profit per company [%] 12.71% -2.66% -25.02% -10.30% 18.55% 57.12%
Y/Y dynamics of EBITDA profit per profit-making company [%] 12.75% -3.60% -22.59% -7.85% 18.20% 52.49%
Y/Y dynamics of gross profit per company [%] 16.79% -1.39% -52.23% -22.80% 3.84% 40.53%
Y/Y dynamics of gross profit per profit-making company [%] 16.28% -4.32% -43.44% -21.25% 2.02% 21.39%
Y/Y dynamics of net profit per company [%] 13.47% -5.29% -56.68% -24.56% 2.36% 17.55%
Y/Y dynamics of net profit per profit-making company [%] 11.66% -10.63% -47.66% -16.89% 2.96% 16.07%
Profitability RatiosEBITDA Sales Margin [%] 29.34% 28.76% 10.56% 20.68% 29.62% 69.39%
Net Sales Margin [%] 14.13% 13.76% 2.63% 7.79% 15.38% 27.46%
Effec tive tax rate [%] 23.79% 24.97% 17.24% 19.88% 24.42% 32.78%
Share of profit-making companies [%] 85.71% 86.11%
D I S T R I B U T I O N O F P A R A M E T E R S(The distribution of financial indicators in the sector)
Average value for the company in
2009 2010 I II III IV0 0General IndicatorsY /Y dynamics of cash flow per company [%] -11.51% 18.40% -73.61% -66.74% 30.28% 54.95%
Y/Y dynamics of cash flow per profit-making company [%] -17.92% 11.47% -75.23% -66.86% 10.93% 52.48%
Profitability RatiosReturn on Equity [%] 13.62% 11.18% 3.27% 8.52% 12.67% 16.51%
Return on A ssets [%] 7.85% 6.34% 1.68% 4.63% 6.35% 10.53%
Equity dividend ratio [%] 11.46% 15.04% 0.00% 9.04% 14.87% 21.54%
Liquidity RatiosC urrent ratio [%] 237.73% 245.28% 181.92% 236.43% 322.62% 465.03%
Q uick ratio [%] 212.25% 220.58% 176.57% 207.00% 282.89% 446.37%
Super quick ratio [%] 62.72% 66.90% 5.80% 19.22% 69.74% 140.20%
Sundry debtors to sundry c reditors ratio [%] 190.53% 181.51% 92.75% 132.52% 197.56% 274.87%
Financial CyclesDays of coverage for C ash & Equivalent [days] -73 -81 -192 -70 3 52
Days of coverage for receivables [days] 106 105 44 70 107 201
Days of coverage for inventories [days ] 39 39 2 10 26 43
Days of coverage for short term liabilities [days] 219 224 77 134 210 454
Financial Leverage RatiosDebt to Equity ratio [%] 73.48% 76.25% 32.55% 60.66% 81.04% 132.22%
Equity to total assets ratio [%] 57.64% 56.74% 43.08% 55.24% 62.25% 75.58%
Share of loans from banks in total debt [%] 100.00% 100.00% 99.90% 100.00% 100.00% 100.00%
Secured to unsecured loans ratio [%] 129.84% 183.63% 28.38% 178.27% 350.77% 687.39%
O perating profit coverage [years] 2.70 3.26 1.6 2.2 3.2 5.4
Production FactorsLabour intens ity of produc tion [%] 8.30% 8.34% 1.18% 3.52% 5.14% 12.50%
Energy intens ity of production [%] 35.54% 35.09% 0.33% 1.21% 43.35% 62.65%
Material intens ity of produc tion [%] 23.27% 21.10% 0.00% 0.00% 0.00% 48.84%
Total as sets turnover [%] 54.94% 46.04% 8.45% 28.17% 52.93% 210.66%
Net fixed assets produc tivity [%] 150.25% 125.22% 47.54% 107.69% 398.93% 1084.32%
InvestmentsInves tment outlays per company [mn INR] 16876.83 19652.85 24.55 297.59 2170.69 7472.18
Share of quoted equity inves tments [%] 0.78% 0.65% 0.00% 0.00% 0.00% 0.19%
Investment outlays as share in net revenue [%] 36.19% 40.00% 3.68% 19.44% 45.99% 144.37%
Investment outlays to deprec iation ratio [%] 772.58% 809.88% 60.54% 330.69% 1413.89% 5853.81%
Investment outlays index [%] 47.33% 43.90% -1.87% 14.13% 40.65% 713.18%
CostsShare of labor cos ts in total operating cos ts [%] 9.94% 10.20% 2.07% 4.68% 6.85% 14.98%
Share of s tock inc rease cos ts in total operating cos ts [%] 0.14% 0.11% 0.00% 0.00% 0.00% 0.27%
Share of energy cos ts in total operating cos ts [%] 42.57% 42.90% 0.76% 1.66% 24.50% 76.97%
Share of raw material cos t in total operating cos ts [%] 27.87% 25.79% 0.00% 0.00% 0.00% 55.56%
Share of other manufac turing expenses in total operating cos ts [%] 10.05% 9.99% 0.43% 6.28% 9.50% 20.25%
Share of selling and admin. expenses in total operating cos ts [%] 1.52% 1.95% 1.29% 3.15% 6.28% 15.80%
Share of mis cellaneous expenses in total operating cos ts [%] 2.30% 1.85% 0.16% 1.03% 2.06% 4.81%
Share of deprec iation in total operating cos ts [%] 5.61% 6.04% 0.97% 2.97% 7.53% 14.40%
ISIEmergingMarketsPDF us-mckinsey1 from 115.249.53.242 on 2011-08-29 13:41:30 EDT. DownloadPDF.
Downloaded by us-mckinsey1 from 115.249.53.242 at 2011-08-29 13:41:30 EDT. ISI Emerging Markets. Unauthorized Distribution Prohibited.
-13-
E lec tric P ower Generation, T ransmiss ion and Dis tribution
Source: ISI , EM IS, C EIC
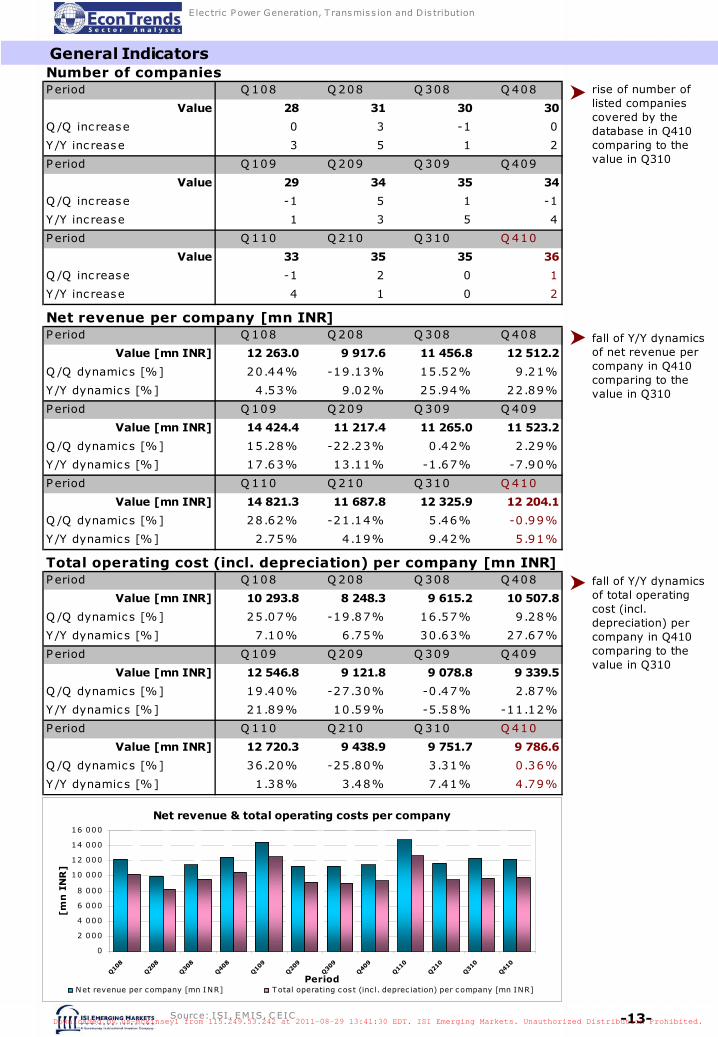
Number of companiesPeriod Q 108 Q 208 Q 308 Q 408
Value 28 31 30 30
Q /Q inc rease 0 3 -1 0
Y/Y inc rease 3 5 1 2
Period Q 109 Q 209 Q 309 Q 409
Value 29 34 35 34
Q /Q inc rease -1 5 1 -1
Y /Y inc rease 1 3 5 4
Period Q 110 Q 210 Q 310 Q 410
Value 33 35 35 36
Q /Q inc rease -1 2 0 1
Y/Y inc rease 4 1 0 2
Net revenue per company [mn INR]Period Q 108 Q 208 Q 308 Q 408
Value [mn INR] 12 263.0 9 917.6 11 456.8 12 512.2
Q /Q dynamics [%] 20.44% -19.13% 15.52% 9.21%
Y/Y dynamics [%] 4.53% 9.02% 25.94% 22.89%
Period Q 109 Q 209 Q 309 Q 409
Value [mn INR] 14 424.4 11 217.4 11 265.0 11 523.2
Q /Q dynamics [%] 15.28% -22.23% 0.42% 2.29%
Y/Y dynamics [%] 17.63% 13.11% -1.67% -7.90%
Period Q 110 Q 210 Q 310 Q 410
Value [mn INR] 14 821.3 11 687.8 12 325.9 12 204.1
Q /Q dynamics [%] 28.62% -21.14% 5.46% -0.99%
Y/Y dynamics [%] 2.75% 4.19% 9.42% 5.91%
Period Q 108 Q 208 Q 308 Q 408
Value [mn INR] 10 293.8 8 248.3 9 615.2 10 507.8
Q /Q dynamics [%] 25.07% -19.87% 16.57% 9.28%
Y/Y dynamics [%] 7.10% 6.75% 30.63% 27.67%
Period Q 109 Q 209 Q 309 Q 409
Value [mn INR] 12 546.8 9 121.8 9 078.8 9 339.5
Q /Q dynamics [%] 19.40% -27.30% -0.47% 2.87%
Y/Y dynamics [%] 21.89% 10.59% -5.58% -11.12%
Period Q 110 Q 210 Q 310 Q 410
Value [mn INR] 12 720.3 9 438.9 9 751.7 9 786.6
Q /Q dynamics [%] 36.20% -25.80% 3.31% 0.36%
Y/Y dynamics [%] 1.38% 3.48% 7.41% 4.79%
Total operating cost (incl. depreciation) per company [mn INR]
Net revenue & total operating costs per company
0
2 000
4 000
6 000
8 000
10 000
12 000
14 000
16 000
Q10
8
Q20
8
Q30
8
Q40
8
Q10
9
Q20
9
Q30
9
Q40
9
Q11
0
Q21
0
Q31
0
Q41
0
Period
[mn
IN
R]
Net revenue per company [mn INR] Total operating cos t (inc l. deprec iation) per company [mn INR]
General Indicators
rise of number of listed companies covered by the database in Q410 comparing to the value in Q310
fall of Y/Y dynamics of net revenue per company in Q410 comparing to the value in Q310
fall of Y/Y dynamics of total operating cost (incl. depreciation) per company in Q410 comparing to the value in Q310
ISIEmergingMarketsPDF us-mckinsey1 from 115.249.53.242 on 2011-08-29 13:41:30 EDT. DownloadPDF.
Downloaded by us-mckinsey1 from 115.249.53.242 at 2011-08-29 13:41:30 EDT. ISI Emerging Markets. Unauthorized Distribution Prohibited.

-14-
E lec tric P ower Generation, T ransmiss ion and Dis tribution
Source: ISI , EM IS, C EIC
EBITDA profit per company [mn INR]Period Q 108 Q 208 Q 308 Q 408
Value [mn INR] 3 158.1 2 606.7 2 933.9 3 281.1
Q /Q dynamics [%] 2.27% -17.46% 12.55% 11.83%
Y/Y dynamics [%] -3 .79% 9.93% 2.95% 6.25%
Period Q 109 Q 209 Q 309 Q 409
Value [mn INR] 3 642.4 3 127.9 3 350.9 3 647.4
Q /Q dynamics [%] 11.01% -14.13% 7.13% 8.85%
Y/Y dynamics [%] 15.33% 19.99% 14.21% 11.16%
Period Q 110 Q 210 Q 310 Q 410
Value [mn INR] 3 994.1 3 357.9 3 776.8 3 550.3
Q /Q dynamics [%] 9.51% -15.93% 12.48% -6.00%
Y/Y dynamics [%] 9.66% 7.35% 12.71% -2.66%
EBITDA profit per company [mn INR]
0
500
1 000
1 500
2 000
2 500
3 000
3 500
4 000
4 500
Q108
Q208
Q308
Q408
Q109
Q209
Q309
Q409
Q110
Q210
Q310
Q410
Period
[mn
IN
R]
-5%
0%
5%
10%
15%
20%
25%
Y/Y
dynam
ics
of
EB
ITD
A
pro
fit
per
com
pany (
all
com
panie
s) [
%]
EBITDA profit per company [mn INR] Y /Y dynamics of EBITDA profit per company (all companies) [%]
P eriod Q 108 Q 208 Q 308 Q 408
Value [mn INR] 3 689.7 2 886.0 3 143.6 3 786.8
Q /Q dynamics [%] 15.22% -21.78% 8.93% 20.46%
Y/Y dynamics [%] 7.91% 17.03% 10.31% 18.25%
Period Q 109 Q 209 Q 309 Q 409
Value [mn INR] 4 086.4 3 702.3 3 909.5 4 277.2
Q /Q dynamics [%] 7.91% -9.40% 5.60% 9.40%
Y/Y dynamics [%] 10.75% 28.28% 24.36% 12.95%
Period Q 110 Q 210 Q 310 Q 410
Value [mn INR] 4 718.7 3 976.3 4 408.1 4 123.3
Q /Q dynamics [%] 10.32% -15.73% 10.86% -6.46%
Y/Y dynamics [%] 15.47% 7.40% 12.75% -3.60%
EBITDA profit per profit-making company [mn INR]
EBITDA profit per profit-making company [mn INR]
0
500
1 000
1 500
2 000
2 500
3 000
3 500
4 000
4 500
5 000
Q108
Q208
Q308
Q408
Q109
Q209
Q309
Q409
Q110
Q210
Q310
Q410
Period
[mn
IN
R]
-10%
-5%
0%
5%
10%
15%
20%
25%
30%
Y/Y
dynam
ics
of
EB
ITD
A
pro
fit
per
com
pany (
pro
fit-
makin
g c
om
panie
s) [
%]
EBITDA profit per profit-making company [mn INR]Y /Y dynamics of EBITDA profit per company (profit-making companies ) [%]
fall of Y/Y dynamics of EBITDA profit per company in Q410 comparing to the value in Q310
fall of Y/Y dynamics of EBITDA profit per profit-making company in Q410 comparing to the value in Q310
ISIEmergingMarketsPDF us-mckinsey1 from 115.249.53.242 on 2011-08-29 13:41:30 EDT. DownloadPDF.
Downloaded by us-mckinsey1 from 115.249.53.242 at 2011-08-29 13:41:30 EDT. ISI Emerging Markets. Unauthorized Distribution Prohibited.
-15-
E lec tric P ower Generation, T ransmiss ion and Dis tribution
Source: ISI , EM IS, C EIC
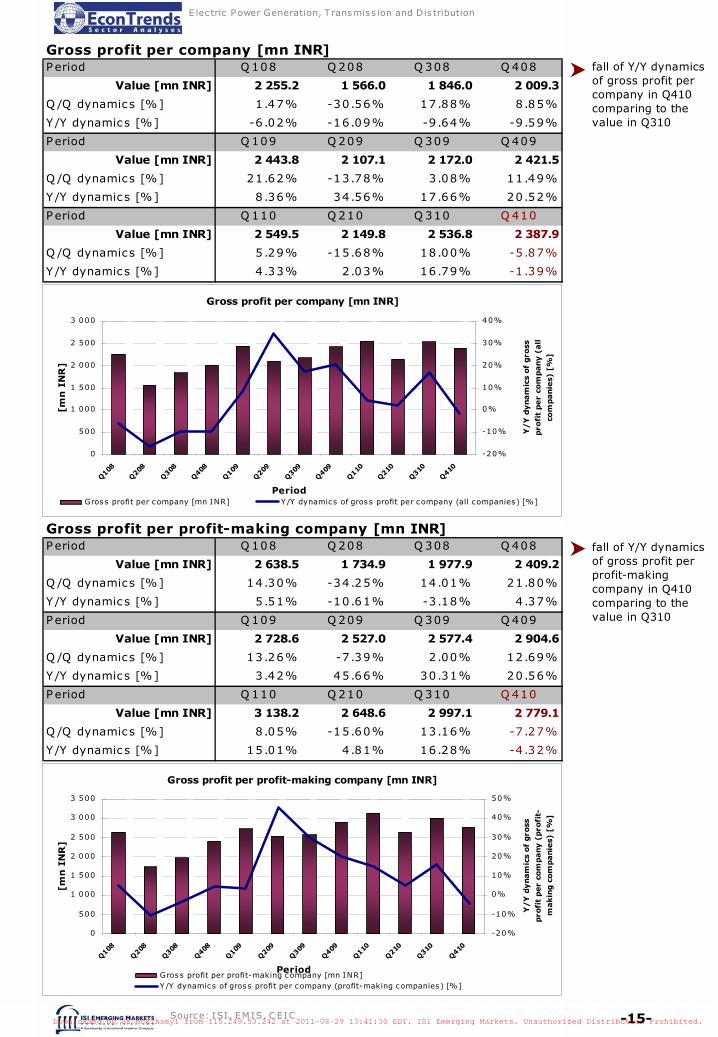
Gross profit per company [mn INR]Period Q 108 Q 208 Q 308 Q 408
Value [mn INR] 2 255.2 1 566.0 1 846.0 2 009.3
Q /Q dynamics [%] 1.47% -30.56% 17.88% 8.85%
Y/Y dynamics [%] -6 .02% -16.09% -9.64% -9.59%
Period Q 109 Q 209 Q 309 Q 409
Value [mn INR] 2 443.8 2 107.1 2 172.0 2 421.5
Q /Q dynamics [%] 21.62% -13.78% 3.08% 11.49%
Y/Y dynamics [%] 8.36% 34.56% 17.66% 20.52%
Period Q 110 Q 210 Q 310 Q 410
Value [mn INR] 2 549.5 2 149.8 2 536.8 2 387.9
Q /Q dynamics [%] 5.29% -15.68% 18.00% -5.87%
Y/Y dynamics [%] 4.33% 2.03% 16.79% -1.39%
Gross profit per profit-making company [mn INR]Period Q 108 Q 208 Q 308 Q 408
Value [mn INR] 2 638.5 1 734.9 1 977.9 2 409.2
Q /Q dynamics [%] 14.30% -34.25% 14.01% 21.80%
Y/Y dynamics [%] 5.51% -10.61% -3.18% 4.37%
Period Q 109 Q 209 Q 309 Q 409
Value [mn INR] 2 728.6 2 527.0 2 577.4 2 904.6
Q /Q dynamics [%] 13.26% -7.39% 2.00% 12.69%
Y/Y dynamics [%] 3.42% 45.66% 30.31% 20.56%
Period Q 110 Q 210 Q 310 Q 410
Value [mn INR] 3 138.2 2 648.6 2 997.1 2 779.1
Q /Q dynamics [%] 8.05% -15.60% 13.16% -7.27%
Y/Y dynamics [%] 15.01% 4.81% 16.28% -4.32%
Gross profit per company [mn INR]
0
500
1 000
1 500
2 000
2 500
3 000
Q108
Q208
Q308
Q408
Q109
Q209
Q309
Q409
Q110
Q210
Q310
Q410
Period
[mn
IN
R]
-20%
-10%
0%
10%
20%
30%
40%
Y/Y
dynam
ics
of
gro
ss
pro
fit
per
com
pany (
all
com
panie
s) [
%]
Gross profit per company [mn INR] Y /Y dynamics of gross profit per company (all companies ) [%]
Gross profit per profit-making company [mn INR]
0
500
1 000
1 500
2 000
2 500
3 000
3 500
Q108
Q208
Q308
Q408
Q109
Q209
Q309
Q409
Q110
Q210
Q310
Q410
Period
[mn
IN
R]
-20%
-10%
0%
10%
20%
30%
40%
50%
Y/Y
dynam
ics
of
gro
ss
pro
fit
per
com
pany (
pro
fit-
makin
g c
om
panie
s) [
%]
Gross profit per profit-making company [mn INR]Y /Y dynamics of gross profit per company (profit-making companies) [%]
fall of Y/Y dynamics of gross profit per company in Q410 comparing to the value in Q310
fall of Y/Y dynamics of gross profit per profit-making company in Q410 comparing to the value in Q310
ISIEmergingMarketsPDF us-mckinsey1 from 115.249.53.242 on 2011-08-29 13:41:30 EDT. DownloadPDF.
Downloaded by us-mckinsey1 from 115.249.53.242 at 2011-08-29 13:41:30 EDT. ISI Emerging Markets. Unauthorized Distribution Prohibited.
-16-
E lec tric P ower Generation, T ransmiss ion and Dis tribution
Source: ISI , EM IS, C EIC
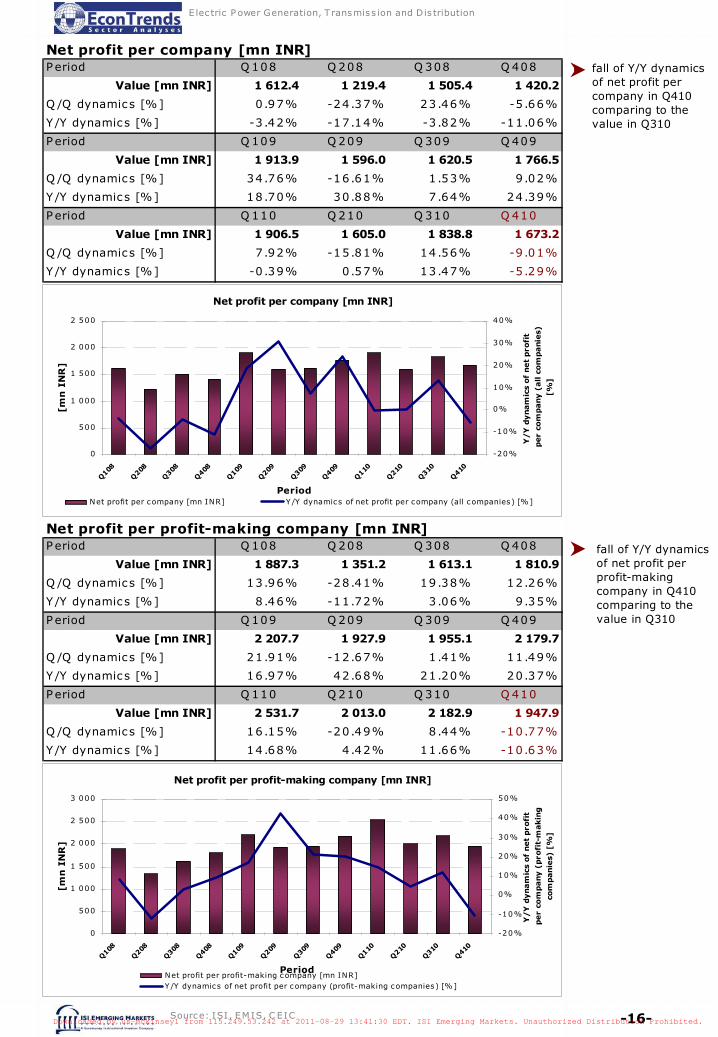
Net profit per company [mn INR]Period Q 108 Q 208 Q 308 Q 408
Value [mn INR] 1 612.4 1 219.4 1 505.4 1 420.2
Q /Q dynamics [%] 0.97% -24.37% 23.46% -5.66%
Y/Y dynamics [%] -3 .42% -17.14% -3.82% -11.06%
Period Q 109 Q 209 Q 309 Q 409
Value [mn INR] 1 913.9 1 596.0 1 620.5 1 766.5
Q /Q dynamics [%] 34.76% -16.61% 1.53% 9.02%
Y/Y dynamics [%] 18.70% 30.88% 7.64% 24.39%
Period Q 110 Q 210 Q 310 Q 410
Value [mn INR] 1 906.5 1 605.0 1 838.8 1 673.2
Q /Q dynamics [%] 7.92% -15.81% 14.56% -9.01%
Y/Y dynamics [%] -0 .39% 0.57% 13.47% -5.29%
Net profit per company [mn INR]
0
500
1 000
1 500
2 000
2 500
Q108
Q208
Q308
Q408
Q109
Q209
Q309
Q409
Q110
Q210
Q310
Q410
Period
[mn
IN
R]
-20%
-10%
0%
10%
20%
30%
40%
Y/Y
dynam
ics
of
net
pro
fit
per
com
pany (
all c
om
panie
s)
[%]
Net profit per company [mn INR] Y /Y dynamics of net profit per company (all companies) [%]
Net profit per profit-making company [mn INR]Period Q 108 Q 208 Q 308 Q 408
Value [mn INR] 1 887.3 1 351.2 1 613.1 1 810.9
Q /Q dynamics [%] 13.96% -28.41% 19.38% 12.26%
Y/Y dynamics [%] 8.46% -11.72% 3.06% 9.35%
Period Q 109 Q 209 Q 309 Q 409
Value [mn INR] 2 207.7 1 927.9 1 955.1 2 179.7
Q /Q dynamics [%] 21.91% -12.67% 1.41% 11.49%
Y/Y dynamics [%] 16.97% 42.68% 21.20% 20.37%
Period Q 110 Q 210 Q 310 Q 410
Value [mn INR] 2 531.7 2 013.0 2 182.9 1 947.9
Q /Q dynamics [%] 16.15% -20.49% 8.44% -10.77%
Y/Y dynamics [%] 14.68% 4.42% 11.66% -10.63%
Net profit per profit-making company [mn INR]
0
500
1 000
1 500
2 000
2 500
3 000
Q108
Q208
Q308
Q408
Q109
Q209
Q309
Q409
Q110
Q210
Q310
Q410
Period
[mn
IN
R]
-20%
-10%
0%
10%
20%
30%
40%
50%
Y/Y
dynam
ics
of
net
pro
fit
per
com
pany (
pro
fit-
makin
g
com
panie
s) [
%]
Net profit per profit-making company [mn INR]Y /Y dynamics of net profit per company (profit-making companies) [%]
fall of Y/Y dynamics of net profit per company in Q410 comparing to the value in Q310
fall of Y/Y dynamics of net profit per profit-making company in Q410 comparing to the value in Q310
ISIEmergingMarketsPDF us-mckinsey1 from 115.249.53.242 on 2011-08-29 13:41:30 EDT. DownloadPDF.
Downloaded by us-mckinsey1 from 115.249.53.242 at 2011-08-29 13:41:30 EDT. ISI Emerging Markets. Unauthorized Distribution Prohibited.
-17-
E lec tric P ower Generation, T ransmiss ion and Dis tribution
Source: ISI , EM IS, C EIC
Cash flow per company [mn INR]
-1 000
-500
0
500
1 000
1 500
2 000
2007
2008
2009
2010
Period
[mn
IN
R]
-50%
0%
50%
100%
150%
200%
250%
300%
350%
400%
450%
Y/
Y d
yn
am
ics o
f cash
flo
w
per
co
mp
an
y [
%]
C ash flow per company [mn INR] Y /Y dynamics of cash flow per company [%]
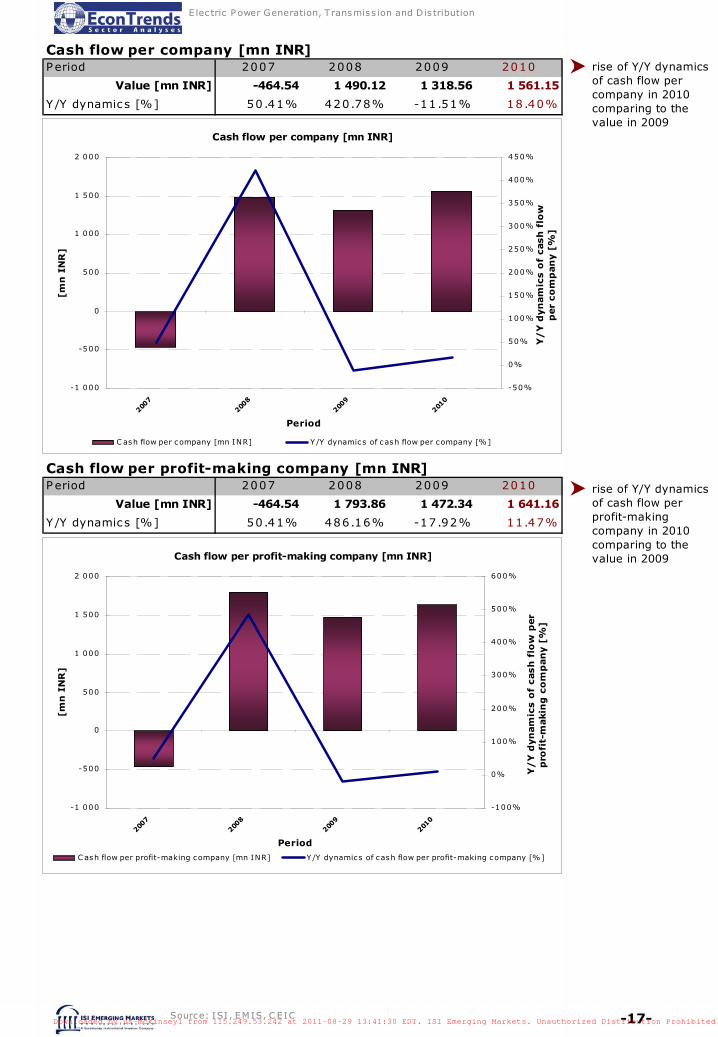
rise of Y/Y dynamics of cash flow per company in 2010 comparing to the value in 2009
Cash flow per company [mn INR]Period 2007 2008 2009 2010
Value [mn INR] -464.54 1 490.12 1 318.56 1 561.15
Y/Y dynamics [%] 50.41% 420.78% -11.51% 18.40%
Cash flow per profit-making company [mn INR]
-1 000
-500
0
500
1 000
1 500
2 000
2007
2008
2009
2010
Period
[mn
IN
R]
-100%
0%
100%
200%
300%
400%
500%
600%
Y/
Y d
yn
am
ics o
f cash
flo
w p
er
pro
fit-
makin
g c
om
pan
y [
%]
C ash flow per profit-making company [mn INR] Y /Y dynamics of cash flow per profit-making company [%]
rise of Y/Y dynamics of cash flow per profit-making company in 2010 comparing to the value in 2009
Cash flow per profit-making company [mn INR]Period 2007 2008 2009 2010
Value [mn INR] -464.54 1 793.86 1 472.34 1 641.16
Y/Y dynamics [%] 50.41% 486.16% -17.92% 11.47%
ISIEmergingMarketsPDF us-mckinsey1 from 115.249.53.242 on 2011-08-29 13:41:30 EDT. DownloadPDF.
Downloaded by us-mckinsey1 from 115.249.53.242 at 2011-08-29 13:41:30 EDT. ISI Emerging Markets. Unauthorized Distribution Prohibited.
-18-
E lec tric P ower Generation, T ransmiss ion and Dis tribution
Source: ISI , EM IS, C EIC
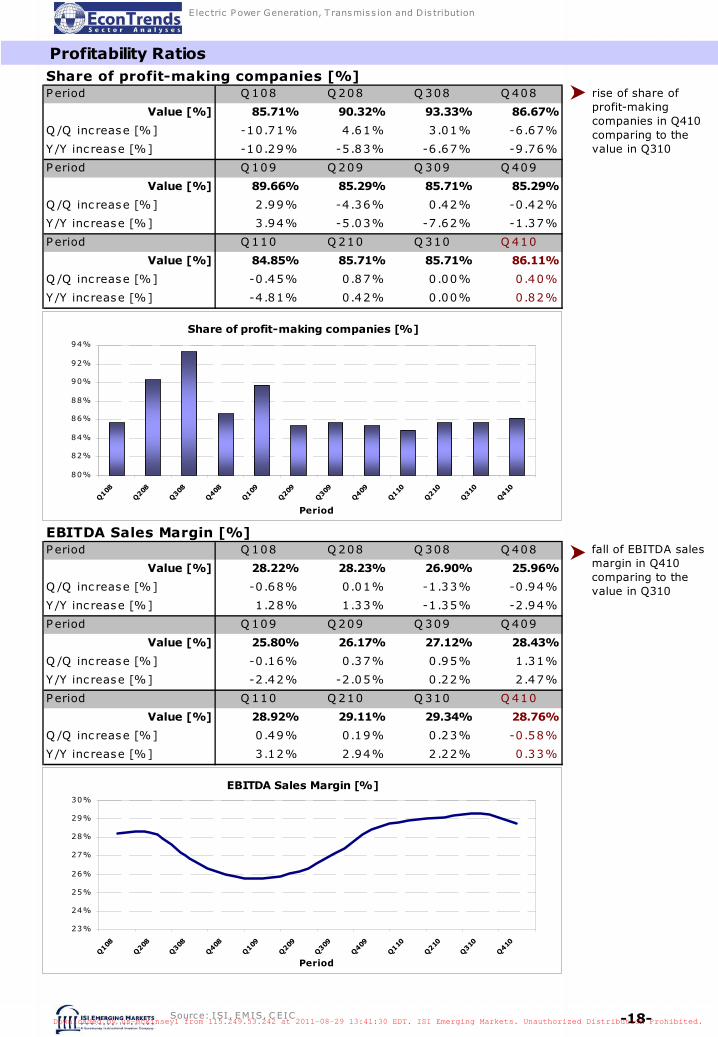
Profitability Ratios Share of profit-making companies [%]Period Q 108 Q 208 Q 308 Q 408
Value [%] 85.71% 90.32% 93.33% 86.67%
Q /Q inc rease [%] -10 .71% 4.61% 3.01% -6.67%
Y/Y inc rease [%] -10 .29% -5.83% -6.67% -9.76%
Period Q 109 Q 209 Q 309 Q 409
Value [%] 89.66% 85.29% 85.71% 85.29%
Q /Q inc rease [%] 2.99% -4.36% 0.42% -0.42%
Y/Y inc rease [%] 3.94% -5.03% -7.62% -1.37%
Period Q 110 Q 210 Q 310 Q 410
Value [%] 84.85% 85.71% 85.71% 86.11%
Q /Q inc rease [%] -0 .45% 0.87% 0.00% 0.40%
Y/Y inc rease [%] -4 .81% 0.42% 0.00% 0.82%
Share of profit-making companies [%]
80%
82%
84%
86%
88%
90%
92%
94%
Q108
Q208
Q308
Q408
Q109
Q209
Q309
Q409
Q110
Q210
Q310
Q410
Period
EBITDA Sales Margin [%]Period Q 108 Q 208 Q 308 Q 408
Value [%] 28.22% 28.23% 26.90% 25.96%
Q /Q inc rease [%] -0 .68% 0.01% -1.33% -0.94%
Y/Y inc rease [%] 1.28% 1.33% -1.35% -2.94%
Period Q 109 Q 209 Q 309 Q 409
Value [%] 25.80% 26.17% 27.12% 28.43%
Q /Q inc rease [%] -0 .16% 0.37% 0.95% 1.31%
Y/Y inc rease [%] -2 .42% -2.05% 0.22% 2.47%
Period Q 110 Q 210 Q 310 Q 410
Value [%] 28.92% 29.11% 29.34% 28.76%
Q /Q inc rease [%] 0.49% 0.19% 0.23% -0.58%
Y/Y inc rease [%] 3.12% 2.94% 2.22% 0.33%
EBITDA Sales Margin [%]
23%
24%
25%
26%
27%
28%
29%
30%
Q108
Q208
Q308
Q408
Q109
Q209
Q309
Q409
Q110
Q210
Q310
Q410
Period
rise of share of profit-making companies in Q410 comparing to the value in Q310
fall of EBITDA sales margin in Q410 comparing to the value in Q310
ISIEmergingMarketsPDF us-mckinsey1 from 115.249.53.242 on 2011-08-29 13:41:30 EDT. DownloadPDF.
Downloaded by us-mckinsey1 from 115.249.53.242 at 2011-08-29 13:41:30 EDT. ISI Emerging Markets. Unauthorized Distribution Prohibited.

-19-
E lec tric P ower Generation, T ransmiss ion and Dis tribution
Source: ISI , EM IS, C EIC
Net Sales Margin [%]Period Q 108 Q 208 Q 308 Q 408
Value [%] 15.37% 14.46% 13.54% 12.48%
Q /Q inc rease [%] -0 .35% -0.91% -0.92% -1.07%
Y/Y inc rease [%] 0.63% -0.62% -2.34% -3.24%
Period Q 109 Q 209 Q 309 Q 409
Value [%] 12.54% 12.97% 13.26% 14.24%
Q /Q inc rease [%] 0.07% 0.43% 0.28% 0.99%
Y/Y inc rease [%] -2 .83% -1.49% -0.29% 1.77%
Period Q 110 Q 210 Q 310 Q 410
Value [%] 14.11% 13.99% 14.13% 13.76%
Q /Q inc rease [%] -0 .13% -0.12% 0.14% -0.37%
Y/Y inc rease [%] 1.57% 1.02% 0.88% -0.48%
Net Sales Margin [%]
0%
2%
4%
6%
8%
10%
12%
14%
16%
18%
Q108
Q208
Q308
Q408
Q109
Q209
Q309
Q409
Q110
Q210
Q310
Q410
Period
Effective tax rate [%]Period Q 108 Q 208 Q 308 Q 408
Value [%] 25.66% 25.96% 24.85% 23.95%
Q /Q inc rease [%] -0 .51% 0.30% -1.11% -0.90%
Y/Y inc rease [%] 3.44% 2.38% 0.59% -2.22%
Period Q 109 Q 209 Q 309 Q 409
Value [%] 21.10% 21.60% 22.85% 22.98%
Q /Q inc rease [%] -2 .85% 0.50% 1.25% 0.12%
Y/Y inc rease [%] -4 .56% -4.36% -2.00% -0.97%
Period Q 110 Q 210 Q 310 Q 410
Value [%] 22.90% 22.98% 23.79% 24.97%
Q /Q inc rease [%] -0 .08% 0.08% 0.82% 1.18%
Y/Y inc rease [%] 1.80% 1.37% 0.94% 1.99%
Effective tax rate [%]
0%
5%
10%
15%
20%
25%
30%
Q108
Q208
Q308
Q408
Q109
Q209
Q309
Q409
Q110
Q210
Q310
Q410
Period
rise of effective tax rate in Q410 comparing to the value in Q310
fall of net sales margin in Q410 comparing to the value in Q310
ISIEmergingMarketsPDF us-mckinsey1 from 115.249.53.242 on 2011-08-29 13:41:30 EDT. DownloadPDF.
Downloaded by us-mckinsey1 from 115.249.53.242 at 2011-08-29 13:41:30 EDT. ISI Emerging Markets. Unauthorized Distribution Prohibited.

-20-
E lec tric P ower Generation, T ransmiss ion and Dis tribution
Source: ISI , EM IS, C EIC
Return on Assets [%]Period 2007 2008 2009 2010
Value [%] 13.16% 8.27% 7.85% 6.34%
Y/Y inc rease [%] 0.63% -4.89% -0.42% -1.51%
Equity dividend ratio [%]Period 2007 2008 2009 2010
Value [%] 11.75% 11.75% 11.46% 15.04%
Y/Y inc rease [%] 1.56% 0.00% -0.29% 3.59%
fall of return on assets in 2010 comparing to the value in 2009
rise of equity dividend ratio in 2010 comparing to the value in 2009
Return on Assets [%]
0%
2%
4%
6%
8%
10%
12%
14%
2007
2008
2009
2010
Period
Equity dividend ratio [%]
0%
2%
4%
6%
8%
10%
12%
14%
16%
2007
2008
2009
2010
Period
Return on Equity [%]Period 2007 2008 2009 2010
Value [%] 17.40% 12.99% 13.62% 11.18%
Y/Y inc rease [%] -0 .48% -4.41% 0.62% -2.44%
fall of return on equity in 2010 comparing to the value in 2009
Return on Equity [%]
0%
2%
4%
6%
8%
10%
12%
14%
16%
18%
20%
2007
2008
2009
2010
Period
ISIEmergingMarketsPDF us-mckinsey1 from 115.249.53.242 on 2011-08-29 13:41:30 EDT. DownloadPDF.
Downloaded by us-mckinsey1 from 115.249.53.242 at 2011-08-29 13:41:30 EDT. ISI Emerging Markets. Unauthorized Distribution Prohibited.
-21-
E lec tric P ower Generation, T ransmiss ion and Dis tribution
Source: ISI , EM IS, C EIC
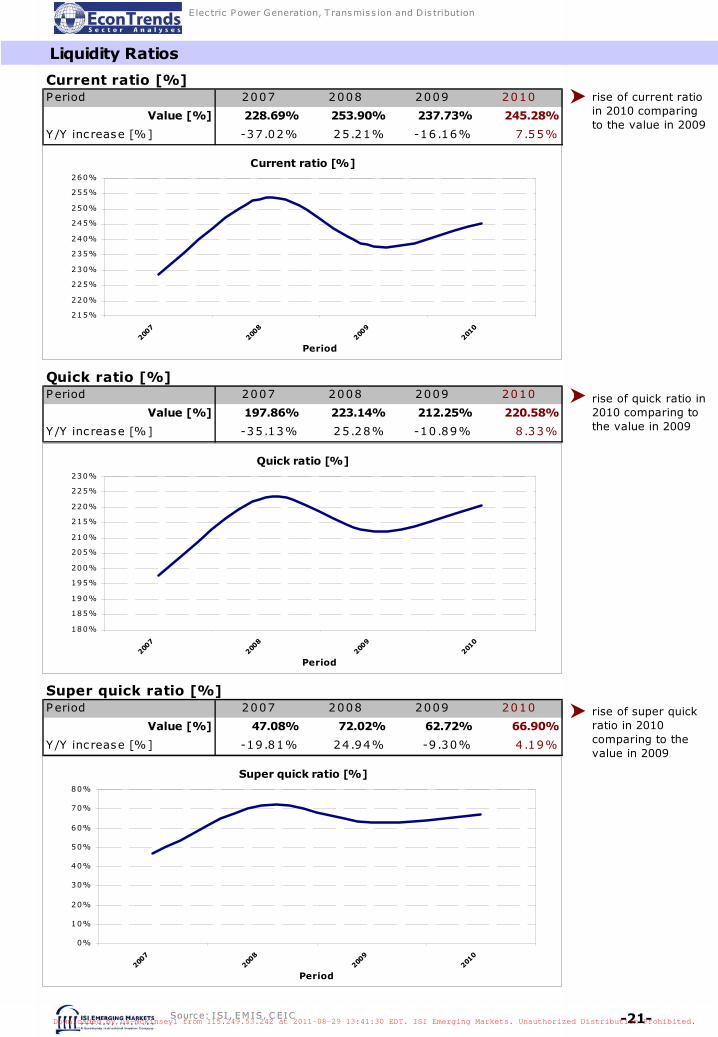
Liquidity Ratios
Current ratio [%]Period 2007 2008 2009 2010
Value [%] 228.69% 253.90% 237.73% 245.28%
Y/Y inc rease [%] -37 .02% 25.21% -16.16% 7.55%
Current ratio [%]
215%
220%
225%
230%
235%
240%
245%
250%
255%
260%
2007
2008
2009
2010
Period
Quick ratio [%]Period 2007 2008 2009 2010
Value [%] 197.86% 223.14% 212.25% 220.58%
Y/Y inc rease [%] -35 .13% 25.28% -10.89% 8.33%
Quick ratio [%]
180%
185%
190%
195%
200%
205%
210%
215%
220%
225%
230%
2007
2008
2009
2010
Period
Super quick ratio [%]Period 2007 2008 2009 2010
Value [%] 47.08% 72.02% 62.72% 66.90%
Y/Y inc rease [%] -19 .81% 24.94% -9.30% 4.19%
Super quick ratio [%]
0%
10%
20%
30%
40%
50%
60%
70%
80%
2007
2008
2009
2010
Period
rise of current ratio in 2010 comparing to the value in 2009
rise of quick ratio in 2010 comparing to the value in 2009
rise of super quick ratio in 2010 comparing to the value in 2009
ISIEmergingMarketsPDF us-mckinsey1 from 115.249.53.242 on 2011-08-29 13:41:30 EDT. DownloadPDF.
Downloaded by us-mckinsey1 from 115.249.53.242 at 2011-08-29 13:41:30 EDT. ISI Emerging Markets. Unauthorized Distribution Prohibited.
-22-
E lec tric P ower Generation, T ransmiss ion and Dis tribution
Source: ISI , EM IS, C EIC
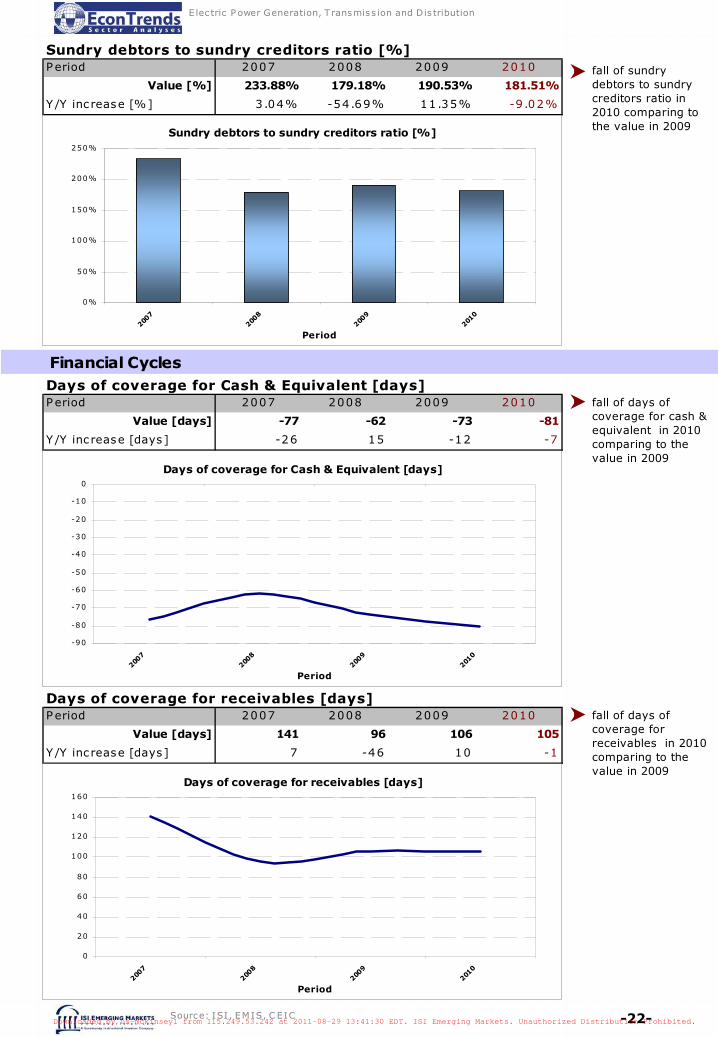
Sundry debtors to sundry creditors ratio [%]Period 2007 2008 2009 2010
Value [%] 233.88% 179.18% 190.53% 181.51%
Y/Y inc rease [%] 3.04% -54.69% 11.35% -9.02%
Sundry debtors to sundry creditors ratio [%]
0%
50%
100%
150%
200%
250%
2007
2008
2009
2010
Period
Financial Cycles
fall of sundry debtors to sundry creditors ratio in 2010 comparing to the value in 2009
Days of coverage for Cash & Equivalent [days]Period 2007 2008 2009 2010
Value [days] -77 -62 -73 -81
Y/Y inc rease [days] -26 15 -12 -7
Days of coverage for Cash & Equivalent [days]
-90
-80
-70
-60
-50
-40
-30
-20
-10
0
2007
2008
2009
2010
Period
Days of coverage for receivables [days]Period 2007 2008 2009 2010
Value [days] 141 96 106 105
Y/Y inc rease [days] 7 -46 10 -1
Days of coverage for receivables [days]
0
20
40
60
80
100
120
140
160
2007
2008
2009
2010
Period
fall of days of coverage for cash & equivalent in 2010 comparing to the value in 2009
fall of days of coverage for receivables in 2010 comparing to the value in 2009
ISIEmergingMarketsPDF us-mckinsey1 from 115.249.53.242 on 2011-08-29 13:41:30 EDT. DownloadPDF.
Downloaded by us-mckinsey1 from 115.249.53.242 at 2011-08-29 13:41:30 EDT. ISI Emerging Markets. Unauthorized Distribution Prohibited.
-23-
E lec tric P ower Generation, T ransmiss ion and Dis tribution
Source: ISI , EM IS, C EIC
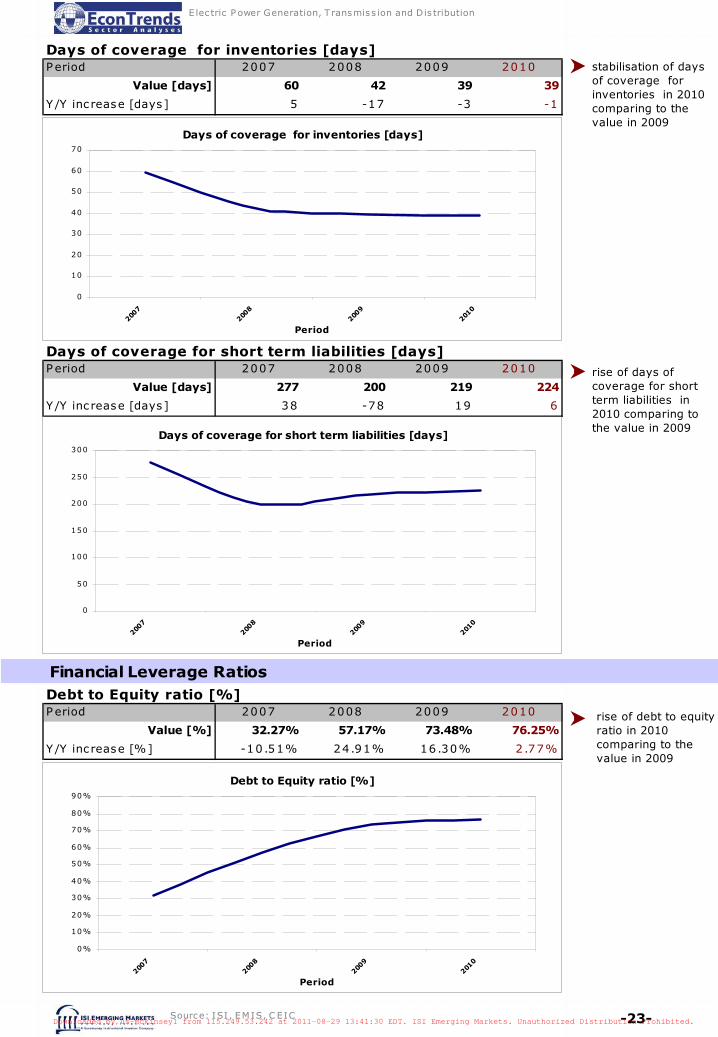
Days of coverage for inventories [days]Period 2007 2008 2009 2010
Value [days] 60 42 39 39
Y/Y inc rease [days] 5 -17 -3 -1
Days of coverage for inventories [days]
0
10
20
30
40
50
60
70
2007
2008
2009
2010
Period
Days of coverage for short term liabilities [days]Period 2007 2008 2009 2010
Value [days] 277 200 219 224
Y/Y inc rease [days] 38 -78 19 6
Days of coverage for short term liabilities [days]
0
50
100
150
200
250
300
2007
2008
2009
2010
Period
stabilisation of days of coverage for inventories in 2010 comparing to the value in 2009
rise of days of coverage for short term liabilities in 2010 comparing to the value in 2009
Financial Leverage Ratios
rise of debt to equity ratio in 2010 comparing to the value in 2009
Debt to Equity ratio [%]Period 2007 2008 2009 2010
Value [%] 32.27% 57.17% 73.48% 76.25%
Y/Y inc rease [%] -10 .51% 24.91% 16.30% 2.77%
Debt to Equity ratio [%]
0%
10%
20%
30%
40%
50%
60%
70%
80%
90%
2007
2008
2009
2010
Period
ISIEmergingMarketsPDF us-mckinsey1 from 115.249.53.242 on 2011-08-29 13:41:30 EDT. DownloadPDF.
Downloaded by us-mckinsey1 from 115.249.53.242 at 2011-08-29 13:41:30 EDT. ISI Emerging Markets. Unauthorized Distribution Prohibited.
-24-
E lec tric P ower Generation, T ransmiss ion and Dis tribution
Source: ISI , EM IS, C EIC
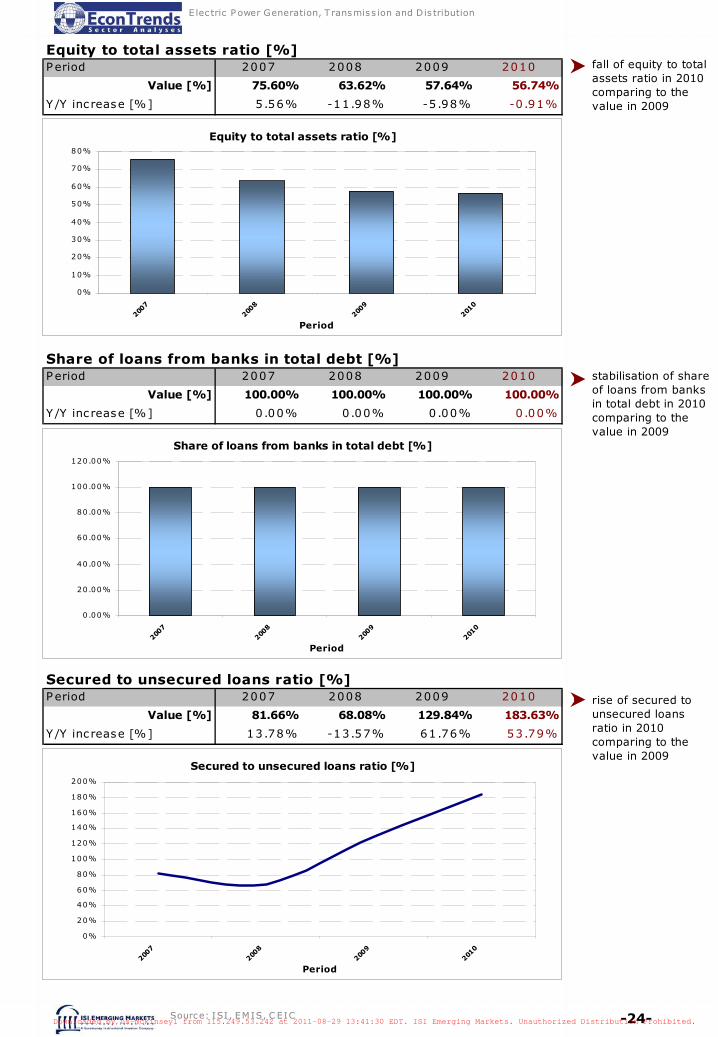
Equity to total assets ratio [%]Period 2007 2008 2009 2010
Value [%] 75.60% 63.62% 57.64% 56.74%
Y/Y inc rease [%] 5.56% -11.98% -5.98% -0.91%
Share of loans from banks in total debt [%]Period 2007 2008 2009 2010
Value [%] 100.00% 100.00% 100.00% 100.00%
Y/Y inc rease [%] 0.00% 0.00% 0.00% 0.00%
Secured to unsecured loans ratio [%]Period 2007 2008 2009 2010
Value [%] 81.66% 68.08% 129.84% 183.63%
Y/Y inc rease [%] 13.78% -13.57% 61.76% 53.79%
Equity to total assets ratio [%]
0%
10%
20%
30%
40%
50%
60%
70%
80%
2007
2008
2009
2010
Period
Share of loans from banks in total debt [%]
0 .00%
20.00%
40.00%
60.00%
80.00%
100.00%
120.00%
2007
2008
2009
2010
Period
Secured to unsecured loans ratio [%]
0%
20%
40%
60%
80%
100%
120%
140%
160%
180%
200%
2007
2008
2009
2010
Period
fall of equity to total assets ratio in 2010 comparing to the value in 2009
stabilisation of share of loans from banks in total debt in 2010 comparing to the value in 2009
rise of secured to unsecured loans ratio in 2010 comparing to the value in 2009
ISIEmergingMarketsPDF us-mckinsey1 from 115.249.53.242 on 2011-08-29 13:41:30 EDT. DownloadPDF.
Downloaded by us-mckinsey1 from 115.249.53.242 at 2011-08-29 13:41:30 EDT. ISI Emerging Markets. Unauthorized Distribution Prohibited.
-25-
E lec tric P ower Generation, T ransmiss ion and Dis tribution
Source: ISI , EM IS, C EIC
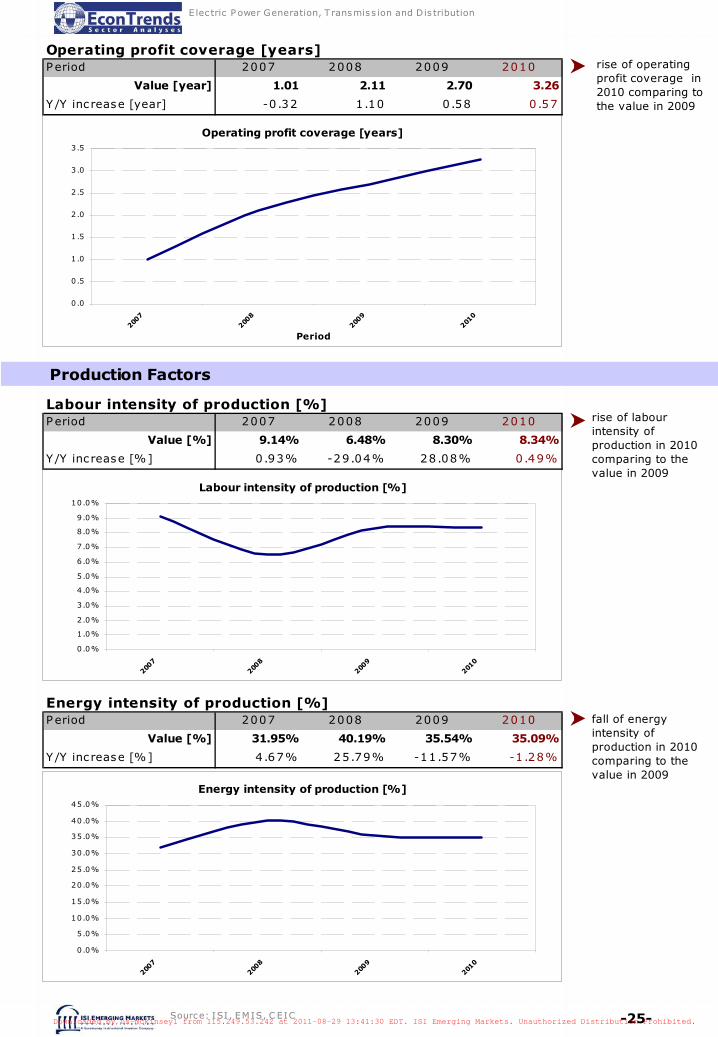
rise of operating profit coverage in 2010 comparing to the value in 2009
Operating profit coverage [years]
0.0
0.5
1.0
1.5
2.0
2.5
3.0
3.5
2007
2008
2009
2010
Period
Operating profit coverage [years]Period 2007 2008 2009 2010
Value [year] 1.01 2.11 2.70 3.26
Y/Y inc rease [year] -0 .32 1.10 0.58 0.57
Production Factors
Labour intensity of production [%]
0.0%
1.0%
2.0%
3.0%
4.0%
5.0%
6.0%
7.0%
8.0%
9.0%
10.0%
2007
2008
2009
2010
Energy intensity of production [%]
0.0%
5.0%
10.0%
15.0%
20.0%
25.0%
30.0%
35.0%
40.0%
45.0%
2007
2008
2009
2010
Labour intensity of production [%]Period 2007 2008 2009 2010
Value [%] 9.14% 6.48% 8.30% 8.34%
Y/Y inc rease [%] 0.93% -29.04% 28.08% 0.49%
Energy intensity of production [%]Period 2007 2008 2009 2010
Value [%] 31.95% 40.19% 35.54% 35.09%
Y/Y inc rease [%] 4.67% 25.79% -11.57% -1.28%
rise of labour intensity of production in 2010 comparing to the value in 2009
fall of energy intensity of production in 2010 comparing to the value in 2009
ISIEmergingMarketsPDF us-mckinsey1 from 115.249.53.242 on 2011-08-29 13:41:30 EDT. DownloadPDF.
Downloaded by us-mckinsey1 from 115.249.53.242 at 2011-08-29 13:41:30 EDT. ISI Emerging Markets. Unauthorized Distribution Prohibited.
-26-
E lec tric P ower Generation, T ransmiss ion and Dis tribution
Source: ISI , EM IS, C EIC
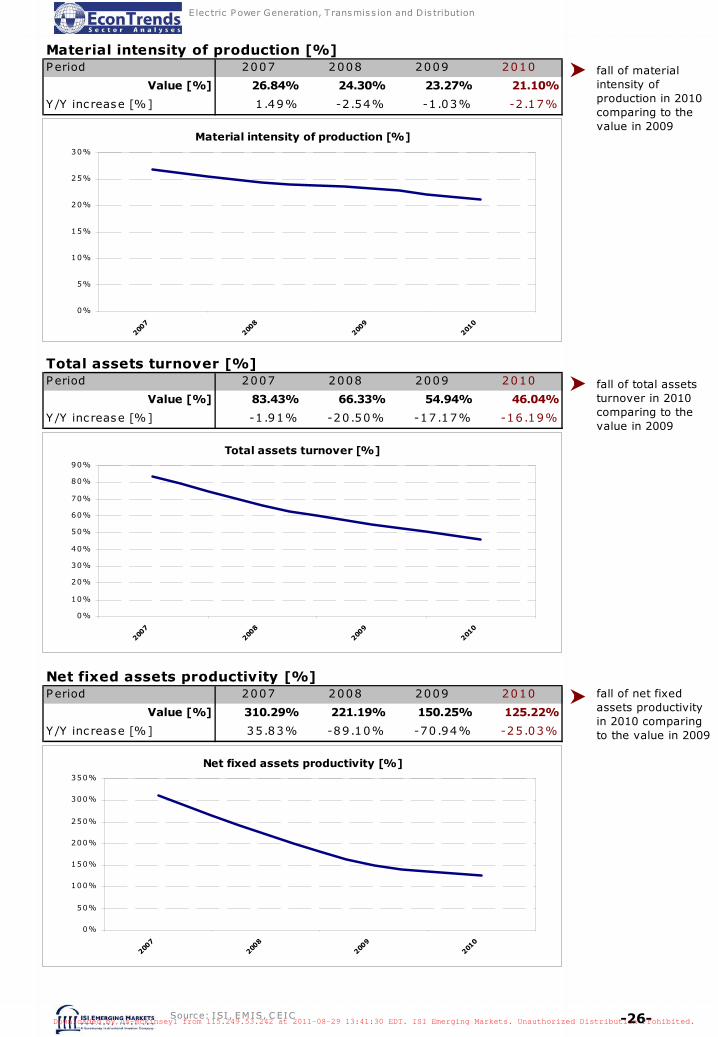
fall of material intensity of production in 2010 comparing to the value in 2009
fall of total assets turnover in 2010 comparing to the value in 2009
fall of net fixed assets productivity in 2010 comparing to the value in 2009
Material intensity of production [%]Period 2007 2008 2009 2010
Value [%] 26.84% 24.30% 23.27% 21.10%
Y/Y inc rease [%] 1.49% -2.54% -1.03% -2.17%
Material intensity of production [%]
0%
5%
10%
15%
20%
25%
30%
2007
2008
2009
2010
Total assets turnover [%]Period 2007 2008 2009 2010
Value [%] 83.43% 66.33% 54.94% 46.04%
Y/Y inc rease [%] -1 .91% -20.50% -17.17% -16.19%
Net fixed assets productivity [%]Period 2007 2008 2009 2010
Value [%] 310.29% 221.19% 150.25% 125.22%
Y/Y inc rease [%] 35.83% -89.10% -70.94% -25.03%
Total assets turnover [%]
0%
10%
20%
30%
40%
50%
60%
70%
80%
90%
2007
2008
2009
2010
Net fixed assets productivity [%]
0%
50%
100%
150%
200%
250%
300%
350%
2007
2008
2009
2010
ISIEmergingMarketsPDF us-mckinsey1 from 115.249.53.242 on 2011-08-29 13:41:30 EDT. DownloadPDF.
Downloaded by us-mckinsey1 from 115.249.53.242 at 2011-08-29 13:41:30 EDT. ISI Emerging Markets. Unauthorized Distribution Prohibited.
-27-
E lec tric P ower Generation, T ransmiss ion and Dis tribution
Source: ISI , EM IS, C EIC
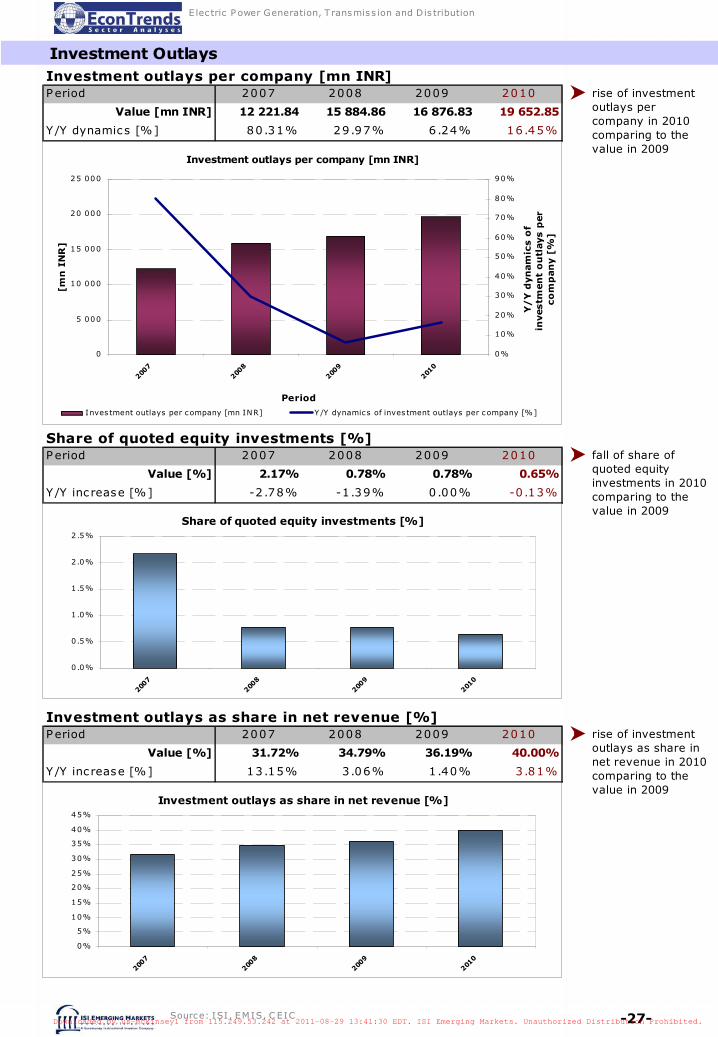
Investment OutlaysInvestment outlays per company [mn INR]Period 2007 2008 2009 2010
Value [mn INR] 12 221.84 15 884.86 16 876.83 19 652.85
Y/Y dynamics [%] 80.31% 29.97% 6.24% 16.45%
Share of quoted equity investments [%]Period 2007 2008 2009 2010
Value [%] 2.17% 0.78% 0.78% 0.65%
Y/Y inc rease [%] -2 .78% -1.39% 0.00% -0.13%
Investment outlays as share in net revenue [%]Period 2007 2008 2009 2010
Value [%] 31.72% 34.79% 36.19% 40.00%
Y/Y inc rease [%] 13.15% 3.06% 1.40% 3.81%
rise of investment outlays per company in 2010 comparing to the value in 2009
fall of share of quoted equity investments in 2010 comparing to the value in 2009
rise of investment outlays as share in net revenue in 2010 comparing to the value in 2009
Investment outlays per company [mn INR]
0
5 000
10 000
15 000
20 000
25 000
2007
2008
2009
2010
Period
[mn
IN
R]
0%
10%
20%
30%
40%
50%
60%
70%
80%
90%
Y/
Y d
yn
am
ics o
f in
vestm
en
t o
utl
ays p
er
co
mp
an
y [
%]
Inves tment outlays per company [mn INR] Y /Y dynamics of inves tment outlays per company [%]
Share of quoted equity investments [%]
0.0%
0.5%
1.0%
1.5%
2.0%
2.5%
2007
2008
2009
2010
Investment outlays as share in net revenue [%]
0%
5%
10%
15%
20%
25%
30%
35%
40%
45%
2007
2008
2009
2010
ISIEmergingMarketsPDF us-mckinsey1 from 115.249.53.242 on 2011-08-29 13:41:30 EDT. DownloadPDF.
Downloaded by us-mckinsey1 from 115.249.53.242 at 2011-08-29 13:41:30 EDT. ISI Emerging Markets. Unauthorized Distribution Prohibited.
-28-
E lec tric P ower Generation, T ransmiss ion and Dis tribution
Source: ISI , EM IS, C EIC
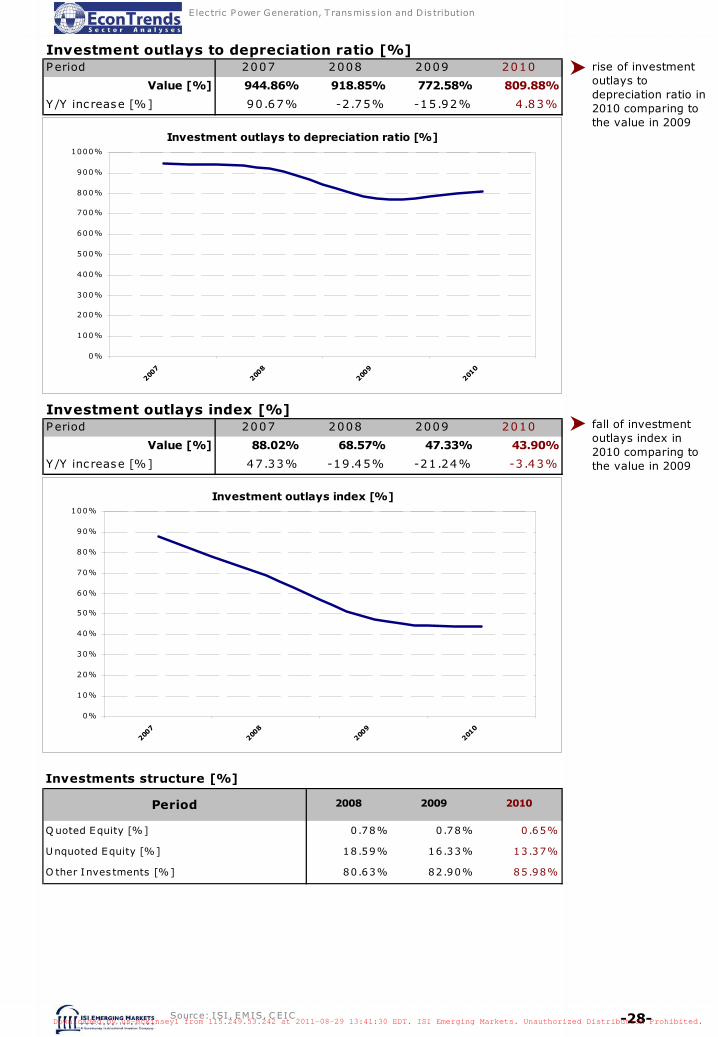
rise of investment outlays to depreciation ratio in 2010 comparing to the value in 2009
fall of investment outlays index in 2010 comparing to the value in 2009
Investment outlays to depreciation ratio [%]Period 2007 2008 2009 2010
Value [%] 944.86% 918.85% 772.58% 809.88%
Y/Y inc rease [%] 90.67% -2.75% -15.92% 4.83%
Investment outlays index [%]Period 2007 2008 2009 2010
Value [%] 88.02% 68.57% 47.33% 43.90%
Y/Y inc rease [%] 47.33% -19.45% -21.24% -3.43%
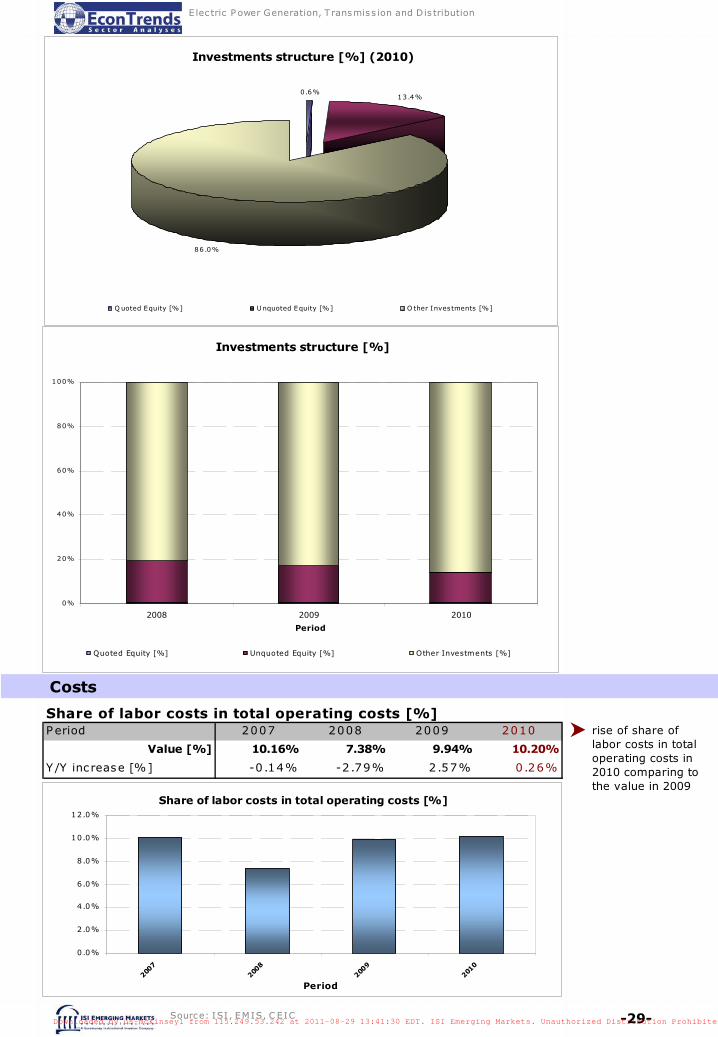
Investments structure [%]
Q uoted Equity [%] 0.78% 0.78% 0.65%
Unquoted Equity [%] 18.59% 16.33% 13.37%
O ther Inves tments [%] 80.63% 82.90% 85.98%
Period 2008 2009 2010
Investment outlays to depreciation ratio [%]
0%
100%
200%
300%
400%
500%
600%
700%
800%
900%
1000%
2007
2008
2009
2010
Investment outlays index [%]
0%
10%
20%
30%
40%
50%
60%
70%
80%
90%
100%
2007
2008
2009
2010
ISIEmergingMarketsPDF us-mckinsey1 from 115.249.53.242 on 2011-08-29 13:41:30 EDT. DownloadPDF.
Downloaded by us-mckinsey1 from 115.249.53.242 at 2011-08-29 13:41:30 EDT. ISI Emerging Markets. Unauthorized Distribution Prohibited.
-29-
E lec tric P ower Generation, T ransmiss ion and Dis tribution
Source: ISI , EM IS, C EIC
Investments structure [%]
0%
20%
40%
60%
80%
100%
2008 2009 2010
Period
Quoted Equity [%] Unquoted Equity [%] Other Investments [%]
Costs
Share of labor costs in total operating costs [%]Period 2007 2008 2009 2010
Value [%] 10.16% 7.38% 9.94% 10.20%
Y/Y inc rease [%] -0 .14% -2.79% 2.57% 0.26%
Share of labor costs in total operating costs [%]
0.0%
2.0%
4.0%
6.0%
8.0%
10.0%
12.0%
2007
2008
2009
2010
Period
rise of share of labor costs in total operating costs in 2010 comparing to the value in 2009
Investments structure [%] (2010)
0.6%13.4%
86.0%
Q uoted Equity [%] Unquoted Equity [%] O ther Investments [%]
ISIEmergingMarketsPDF us-mckinsey1 from 115.249.53.242 on 2011-08-29 13:41:30 EDT. DownloadPDF.
Downloaded by us-mckinsey1 from 115.249.53.242 at 2011-08-29 13:41:30 EDT. ISI Emerging Markets. Unauthorized Distribution Prohibited.
-30-
E lec tric P ower Generation, T ransmiss ion and Dis tribution
Source: ISI , EM IS, C EIC
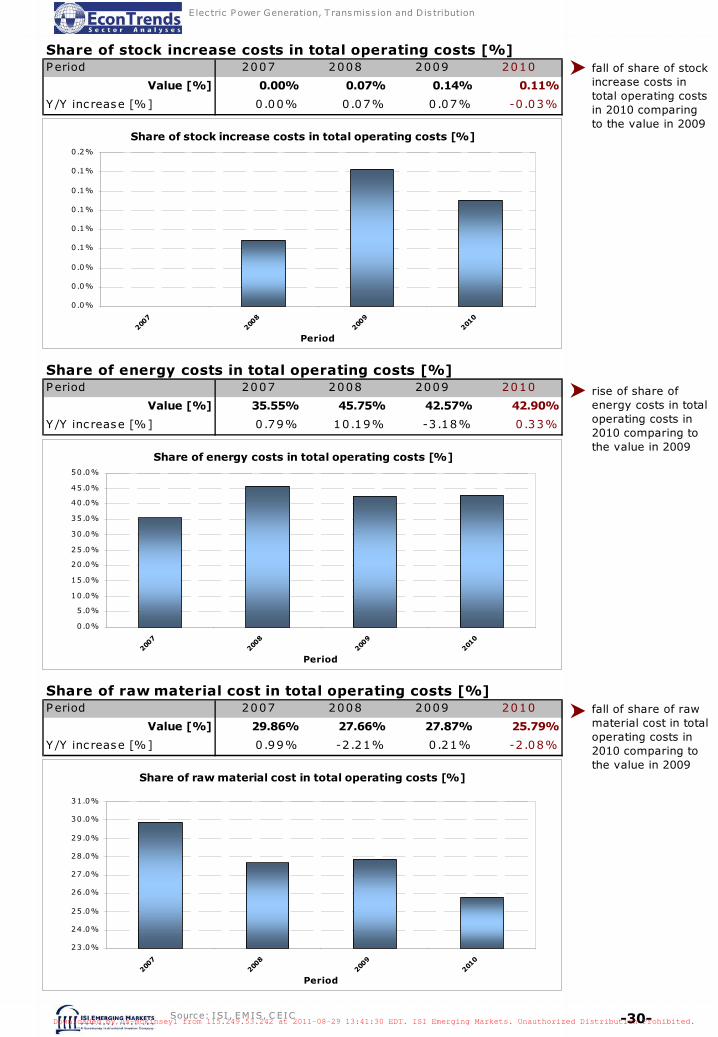
fall of share of stock increase costs in total operating costs in 2010 comparing to the value in 2009
rise of share of energy costs in total operating costs in 2010 comparing to the value in 2009
fall of share of raw material cost in total operating costs in 2010 comparing to the value in 2009
Period 2007 2008 2009 2010
Value [%] 0.00% 0.07% 0.14% 0.11%
Y/Y inc rease [%] 0.00% 0.07% 0.07% -0.03%
Share of stock increase costs in total operating costs [%]
Share of stock increase costs in total operating costs [%]
0.0%
0.0%
0.0%
0.1%
0.1%
0.1%
0.1%
0.1%
0.2%
2007
2008
2009
2010
Period
Period 2007 2008 2009 2010
Value [%] 35.55% 45.75% 42.57% 42.90%
Y/Y inc rease [%] 0.79% 10.19% -3.18% 0.33%
Share of energy costs in total operating costs [%]
Share of energy costs in total operating costs [%]
0 .0%
5.0%
10.0%
15.0%
20.0%
25.0%
30.0%
35.0%
40.0%
45.0%
50.0%
2007
2008
2009
2010
Period
Period 2007 2008 2009 2010
Value [%] 29.86% 27.66% 27.87% 25.79%
Y/Y inc rease [%] 0.99% -2.21% 0.21% -2.08%
Share of raw material cost in total operating costs [%]
Share of raw material cost in total operating costs [%]
23.0%
24.0%
25.0%
26.0%
27.0%
28.0%
29.0%
30.0%
31.0%
2007
2008
2009
2010
Period
ISIEmergingMarketsPDF us-mckinsey1 from 115.249.53.242 on 2011-08-29 13:41:30 EDT. DownloadPDF.
Downloaded by us-mckinsey1 from 115.249.53.242 at 2011-08-29 13:41:30 EDT. ISI Emerging Markets. Unauthorized Distribution Prohibited.
-31-
E lec tric P ower Generation, T ransmiss ion and Dis tribution
Source: ISI , EM IS, C EIC
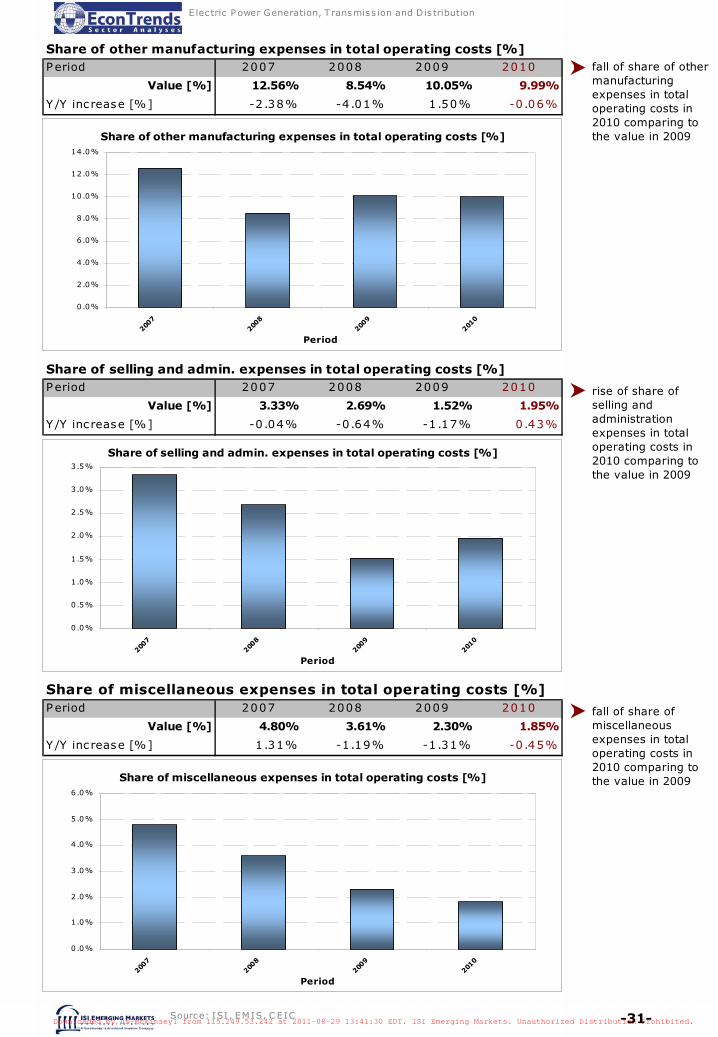
fall of share of other manufacturing expenses in total operating costs in 2010 comparing to the value in 2009
rise of share of selling and administration expenses in total operating costs in 2010 comparing to the value in 2009
fall of share of miscellaneous expenses in total operating costs in 2010 comparing to the value in 2009
Period 2007 2008 2009 2010
Value [%] 12.56% 8.54% 10.05% 9.99%
Y/Y inc rease [%] -2 .38% -4.01% 1.50% -0.06%
Share of other manufacturing expenses in total operating costs [%]
Period 2007 2008 2009 2010
Value [%] 3.33% 2.69% 1.52% 1.95%
Y/Y inc rease [%] -0 .04% -0.64% -1.17% 0.43%
Share of selling and admin. expenses in total operating costs [%]
Period 2007 2008 2009 2010
Value [%] 4.80% 3.61% 2.30% 1.85%
Y/Y inc rease [%] 1.31% -1.19% -1.31% -0.45%
Share of miscellaneous expenses in total operating costs [%]
Share of other manufacturing expenses in total operating costs [%]
0.0%
2.0%
4.0%
6.0%
8.0%
10.0%
12.0%
14.0%
2007
2008
2009
2010
Period
Share of selling and admin. expenses in total operating costs [%]
0.0%
0.5%
1.0%
1.5%
2.0%
2.5%
3.0%
3.5%
2007
2008
2009
2010
Period
Share of miscellaneous expenses in total operating costs [%]
0.0%
1.0%
2.0%
3.0%
4.0%
5.0%
6.0%
2007
2008
2009
2010
Period
ISIEmergingMarketsPDF us-mckinsey1 from 115.249.53.242 on 2011-08-29 13:41:30 EDT. DownloadPDF.
Downloaded by us-mckinsey1 from 115.249.53.242 at 2011-08-29 13:41:30 EDT. ISI Emerging Markets. Unauthorized Distribution Prohibited.
-32-
E lec tric P ower Generation, T ransmiss ion and Dis tribution
Source: ISI , EM IS, C EIC
Share of depreciation in total operating costs [%]
0.0%
1.0%
2.0%
3.0%
4.0%
5.0%
6.0%
7.0%
2007
2008
2009
2010
Period
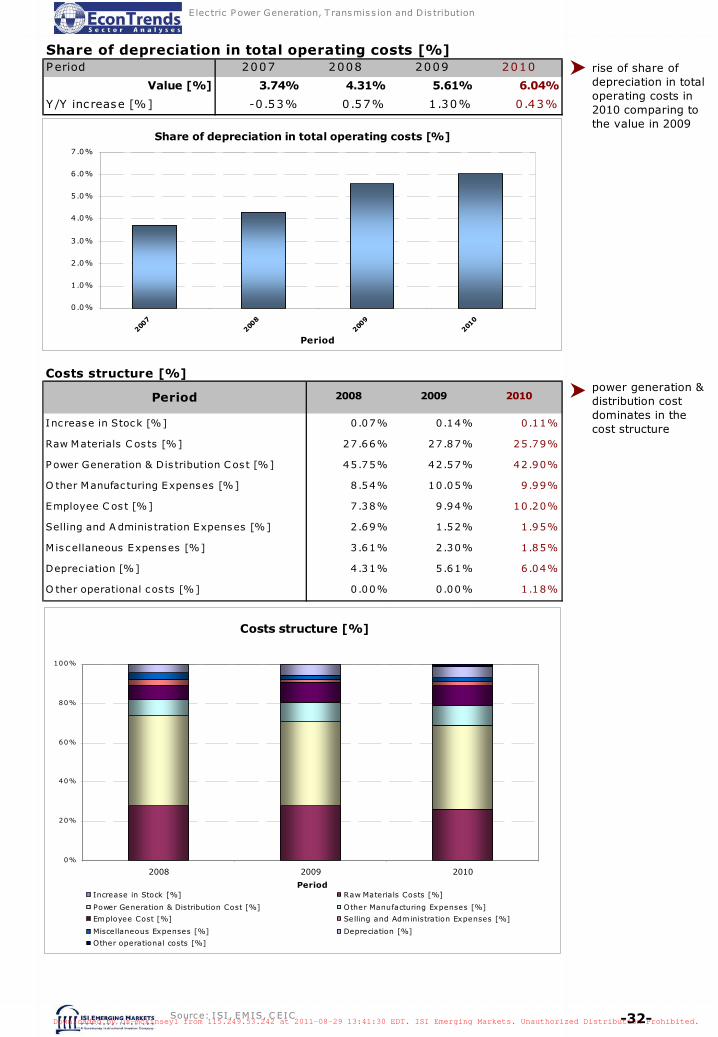
Period 2007 2008 2009 2010
Value [%] 3.74% 4.31% 5.61% 6.04%
Y/Y inc rease [%] -0 .53% 0.57% 1.30% 0.43%
Share of depreciation in total operating costs [%]rise of share of depreciation in total operating costs in 2010 comparing to the value in 2009
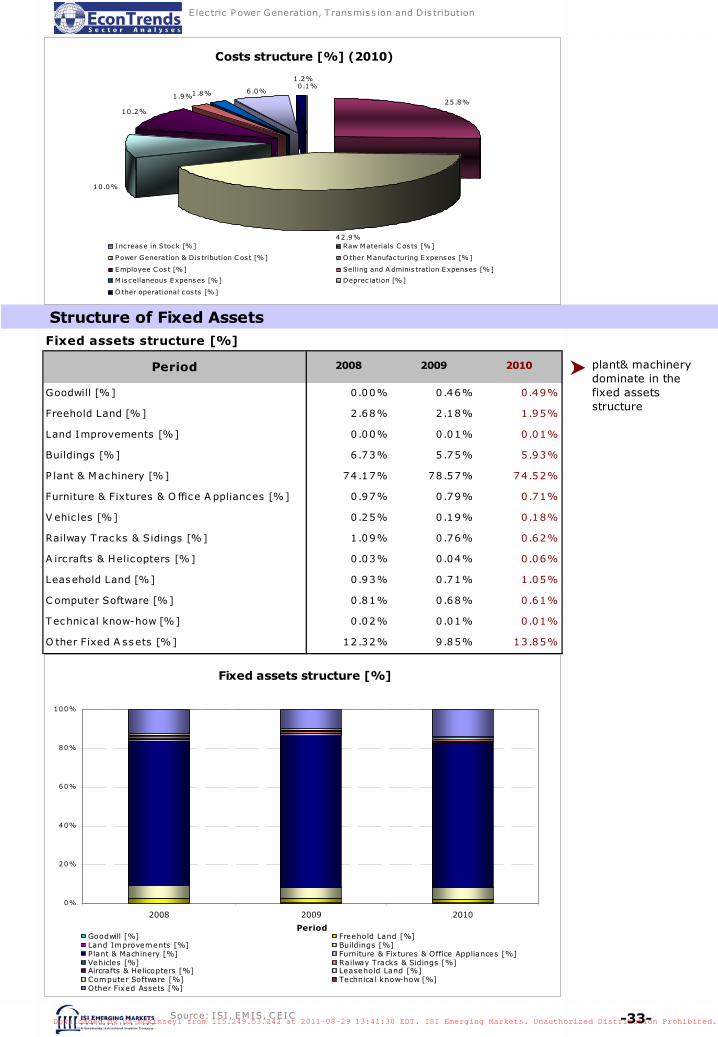
Costs structure [%]
Inc rease in Stock [%] 0.07% 0.14% 0.11%
Raw Materials C os ts [%] 27.66% 27.87% 25.79%
P ower Generation & Dis tribution C os t [%] 45.75% 42.57% 42.90%
O ther Manufac turing Expenses [%] 8.54% 10.05% 9.99%
Employee C os t [%] 7.38% 9.94% 10.20%
Selling and A dminis tration Expenses [%] 2.69% 1.52% 1.95%
Miscellaneous Expenses [%] 3.61% 2.30% 1.85%
Deprec iation [%] 4.31% 5.61% 6.04%
O ther operational cos ts [%] 0.00% 0.00% 1.18%
Period 2008 2009 2010
Costs structure [%]
0%
20%
40%
60%
80%
100%
2008 2009 2010
PeriodIncrease in Stock [%] Raw Materials Costs [%]
Power Generation & Distribution Cost [%] Other Manufacturing Expenses [%]
Employee Cost [%] Selling and Administration Expenses [%]
Miscellaneous Expenses [%] Depreciation [%]
Other operational costs [%]
power generation & distribution cost dominates in the cost structure
ISIEmergingMarketsPDF us-mckinsey1 from 115.249.53.242 on 2011-08-29 13:41:30 EDT. DownloadPDF.
Downloaded by us-mckinsey1 from 115.249.53.242 at 2011-08-29 13:41:30 EDT. ISI Emerging Markets. Unauthorized Distribution Prohibited.
-33-
E lec tric P ower Generation, T ransmiss ion and Dis tribution
Structure of Fixed Assets
Costs structure [%] (2010)
0 .1%
25.8%
10.0%
10.2%
1.9%1.8%
1.2%
6.0%
42.9%Increase in Stock [%] Raw Materials C os ts [%]
Power Generation & Dis tribution C os t [%] O ther Manufac turing Expenses [%]
Employee C os t [%] Selling and A dminis tration Expenses [%]
M iscellaneous Expenses [%] Deprec iation [%]
O ther operational cos ts [%]
Fixed assets structure [%]
Goodwill [%] 0.00% 0.46% 0.49%
Freehold Land [%] 2.68% 2.18% 1.95%
Land Improvements [%] 0.00% 0.01% 0.01%
Buildings [%] 6.73% 5.75% 5.93%
P lant & Machinery [%] 74.17% 78.57% 74.52%
Furniture & Fixtures & O ffice A ppliances [%] 0.97% 0.79% 0.71%
V ehic les [%] 0.25% 0.19% 0.18%
Railway T racks & Sidings [%] 1.09% 0.76% 0.62%
A irc rafts & Helicopters [%] 0.03% 0.04% 0.06%
Leasehold Land [%] 0.93% 0.71% 1.05%
C omputer Software [%] 0.81% 0.68% 0.61%
Technical know-how [%] 0.02% 0.01% 0.01%
O ther Fixed A ssets [%] 12.32% 9.85% 13.85%
Period 2008 2009 2010
Fixed assets structure [%]
0%
20%
40%
60%
80%
100%
2008 2009 2010
PeriodGoodwill [%] Freehold Land [%]Land Improvements [%] Buildings [%]Plant & Machinery [%] Furniture & Fixtures & Office Appliances [%]Vehicles [%] Railway Tracks & Sidings [%]Aircrafts & Helicopters [%] Leasehold Land [%]Computer Software [%] Technical know-how [%]Other Fixed Assets [%]
plant& machinery dominate in the fixed assets structure
Source: ISI , EM IS, C EIC
ISIEmergingMarketsPDF us-mckinsey1 from 115.249.53.242 on 2011-08-29 13:41:30 EDT. DownloadPDF.
Downloaded by us-mckinsey1 from 115.249.53.242 at 2011-08-29 13:41:30 EDT. ISI Emerging Markets. Unauthorized Distribution Prohibited.
-34-
E lec tric P ower Generation, T ransmiss ion and Dis tribution
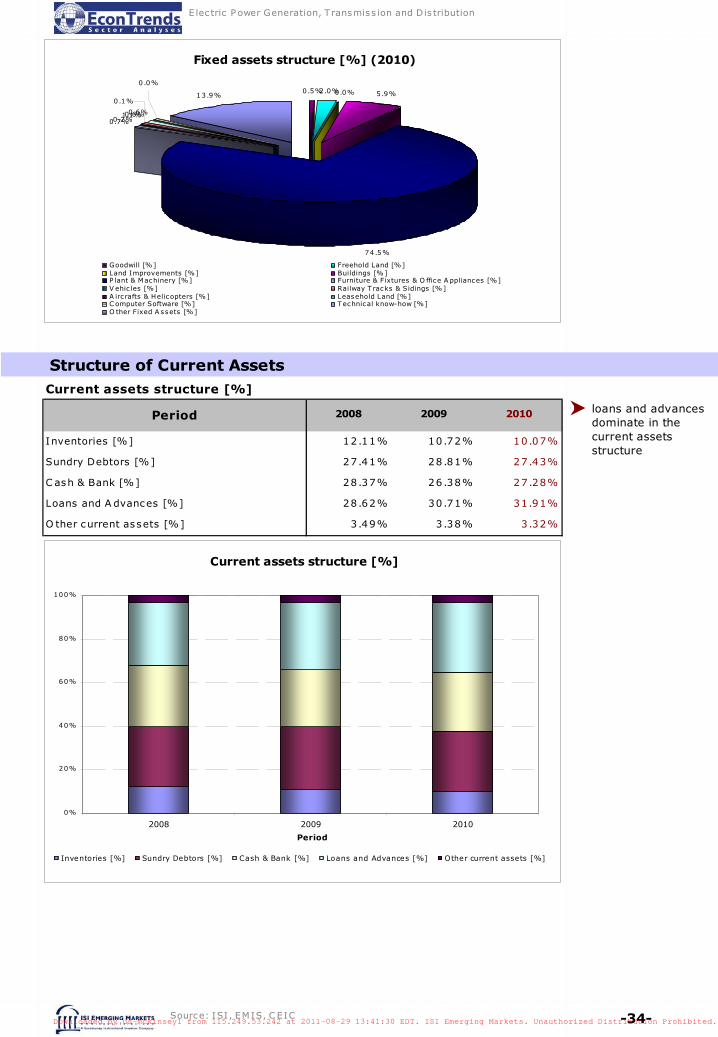
Fixed assets structure [%] (2010)
0.5%2.0% 5.9%
74.5%
0.7%0.2%1.1%0.6%
13.9%
0.0%0.0%
0.6%
0.1%
Goodwill [%] Freehold Land [%]Land Improvements [%] Buildings [%]P lant & Machinery [%] Furniture & Fixtures & O ffice A ppliances [%]V ehic les [%] Railway T racks & Sidings [%]A irc rafts & Helicopters [%] Leasehold Land [%]C omputer Software [%] Technical know-how [%]O ther Fixed A ssets [%]
Structure of Current AssetsCurrent assets structure [%]
Inventories [%] 12.11% 10.72% 10.07%
Sundry Debtors [%] 27.41% 28.81% 27.43%
C ash & Bank [%] 28.37% 26.38% 27.28%
Loans and A dvances [%] 28.62% 30.71% 31.91%
O ther current assets [%] 3.49% 3.38% 3.32%
Period 2008 2009 2010 loans and advances dominate in the current assets structure
Current assets structure [%]
0%
20%
40%
60%
80%
100%
2008 2009 2010
Period
Inventories [%] Sundry Debtors [%] Cash & Bank [%] Loans and Advances [%] Other current assets [%]
Source: ISI , EM IS, C EIC
ISIEmergingMarketsPDF us-mckinsey1 from 115.249.53.242 on 2011-08-29 13:41:30 EDT. DownloadPDF.
Downloaded by us-mckinsey1 from 115.249.53.242 at 2011-08-29 13:41:30 EDT. ISI Emerging Markets. Unauthorized Distribution Prohibited.

-35-
E lec tric P ower Generation, T ransmiss ion and Dis tribution
Current assets structure [%] (2010)
10.1%
27.4%
31.9%
3.3%
27.3%
Inventories [%] Sundry Debtors [%] C ash & Bank [%] Loans and A dvances [%] O ther current assets [%]
Structure of Current Liabilities
Short-term liabilities structure [%]
Sundry C reditors [%] 26.71% 25.40% 25.80%
Unc laimed Dividend [%] 0.04% 0.05% 0.05%
Interes t A cc rued But Not Due [%] 0.80% 1.30% 1.44%
P rovis ions [%] 31.22% 29.35% 30.38%
O ther Short-term Liabilities [%] 41.24% 43.91% 42.33%
Period 2008 2009 2010 other short-term liabilities dominate in the short-term liabilities structure
Short-term liabilities structure [%]
0%
20%
40%
60%
80%
100%
2008 2009 2010
Period
Sundry Creditors [%] Unclaimed Dividend [%] Interest Accrued But Not Due [%]
Provisions [%] Other Short-term Liabilities [%]
Source: ISI , EM IS, C EIC
ISIEmergingMarketsPDF us-mckinsey1 from 115.249.53.242 on 2011-08-29 13:41:30 EDT. DownloadPDF.
Downloaded by us-mckinsey1 from 115.249.53.242 at 2011-08-29 13:41:30 EDT. ISI Emerging Markets. Unauthorized Distribution Prohibited.
-36-
E lec tric P ower Generation, T ransmiss ion and Dis tribution
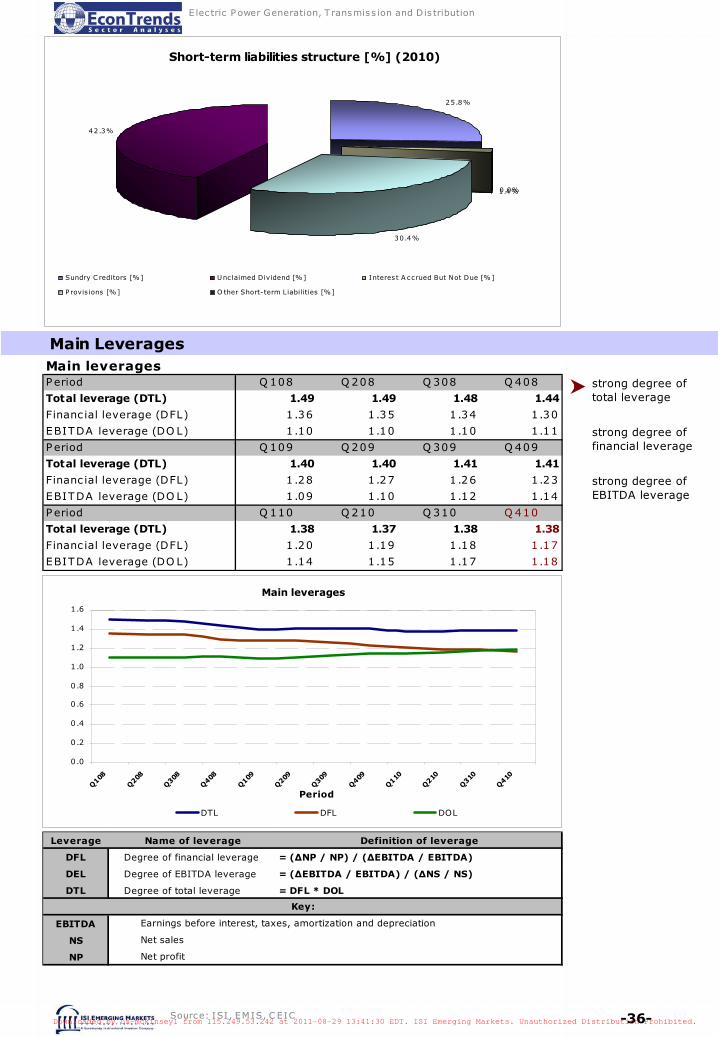
Short-term liabilities structure [%] (2010)
25.8%
0.0%
30.4%
42.3%
1.4%
Sundry C reditors [%] Unc laimed Dividend [%] Interes t A ccrued But Not Due [%]
P rovis ions [%] O ther Short-term Liabilities [%]
Source: ISI , EM IS, C EIC
Main LeveragesMain leveragesPeriod Q 108 Q 208 Q 308 Q 408
Total leverage (DTL) 1.49 1.49 1.48 1.44
Financ ial leverage (DFL) 1 .36 1.35 1 .34 1.30
EBITDA leverage (DO L) 1 .10 1.10 1 .10 1.11
Period Q 109 Q 209 Q 309 Q 409
Total leverage (DTL) 1.40 1.40 1.41 1.41
Financ ial leverage (DFL) 1 .28 1.27 1 .26 1.23
EBITDA leverage (DO L) 1 .09 1.10 1 .12 1.14
Period Q 110 Q 210 Q 310 Q 410
Total leverage (DTL) 1.38 1.37 1.38 1.38
Financ ial leverage (DFL) 1 .20 1.19 1 .18 1.17
EBITDA leverage (DO L) 1 .14 1.15 1 .17 1.18
Main leverages
0.0
0.2
0.4
0.6
0.8
1.0
1.2
1.4
1.6
Q108
Q208
Q308
Q408
Q109
Q209
Q309
Q409
Q110
Q210
Q310
Q410
Period
DTL DFL DOL
Leverage Name of leverage Definition of leverage
DFL Degree of financial leverage = (ΔNP / NP) / (ΔEBITDA / EBITDA)
DEL Degree of EBITDA leverage = (ΔEBITDA / EBITDA) / (ΔNS / NS)
DTL Degree of total leverage = DFL * DOL
EBITDA
NS
NP Net profit
Key:
Earnings before interest, taxes, amortization and depreciation
Net sales
strong degree of total leverage
strong degree of financial leverage
strong degree of EBITDA leverage
ISIEmergingMarketsPDF us-mckinsey1 from 115.249.53.242 on 2011-08-29 13:41:30 EDT. DownloadPDF.
Downloaded by us-mckinsey1 from 115.249.53.242 at 2011-08-29 13:41:30 EDT. ISI Emerging Markets. Unauthorized Distribution Prohibited.

-37
-
Ele
ctri
c Po
wer
Gen
erat
ion, Tra
nsm
issi
on a
nd D
istr
ibuti
on
Du
Po
nt’
s P
yra
mid
Equit
y
per
com
apny
2010
60 5
52
2009
48 9
37
2008
43 8
01
2007
34 9
10
Levera
ge
2010
1.7
6
Ass
ets
per
com
pany
2010
106 7
21
2009
1.7
3
2009
84 8
93
2008
1.5
7
2008
68 8
43
RO
E
2010
11.2
%
2007
1.3
2
TA
T
2010
0.4
6
2007
46 1
74
2009
13.6
%
2009
0.5
5
2008
13.0
%
2008
0.6
6
2007
17.4
%
RO
A
2010
6.3
%
2007
0.8
3
Net
revenue
per
com
pany
2010
49 1
37
2009
7.8
%
2009
46 6
40
2008
8.3
%
2008
45 6
63
2007
13.2
%
RO
S
2010
13.8
%
2007
38 5
25
2009
14.3
%
2008
12.5
%
2007
15.8
%
Net
pro
fit
per
com
pany
2010
6 7
69
2009
6 6
63
2008
5 6
91
2007
6 0
75
(*)
Net
pro
fit
per
com
pan
y or
net
rev
enue
per
com
pan
y fr
om a
giv
en y
ear
(**)
Val
ue
of a
sset
s per
com
pan
y or
equit
y per
com
pan
y fr
om t
he
end o
f ye
ar
Equit
y per
com
pan
y (*
*)
[mn I
NR]
leve
rage
= A
sset
s per
com
pan
y /
Equit
y per
com
pan
y
Ass
ets
per
com
pan
y (*
*)
[mn I
NR]
Ret
urn
on n
et s
ales
RO
S =
Net
pro
fit
per
com
pan
y /
Net
rev
enue
per
com
pan
y
Net
pro
fit
per
com
pan
y (*
)
[mn I
NR]
Ret
urn
on e
quit
y
RO
E =
RO
A *
lev
erag
e
Ass
ets
turn
over
TAT =
Net
rev
enue
per
com
pan
y /
Ass
ets
per
com
pan
y
Ret
urn
on a
sset
s
RO
A =
RO
S *
TAT
Net
rev
enue
per
com
pan
y (*
)
[mn I
NR]
*
*
//
/ISIEmergingMarketsPDF us-mckinsey1 from 115.249.53.242 on 2011-08-29 13:41:30 EDT. DownloadPDF.
Downloaded by us-mckinsey1 from 115.249.53.242 at 2011-08-29 13:41:30 EDT. ISI Emerging Markets. Unauthorized Distribution Prohibited.
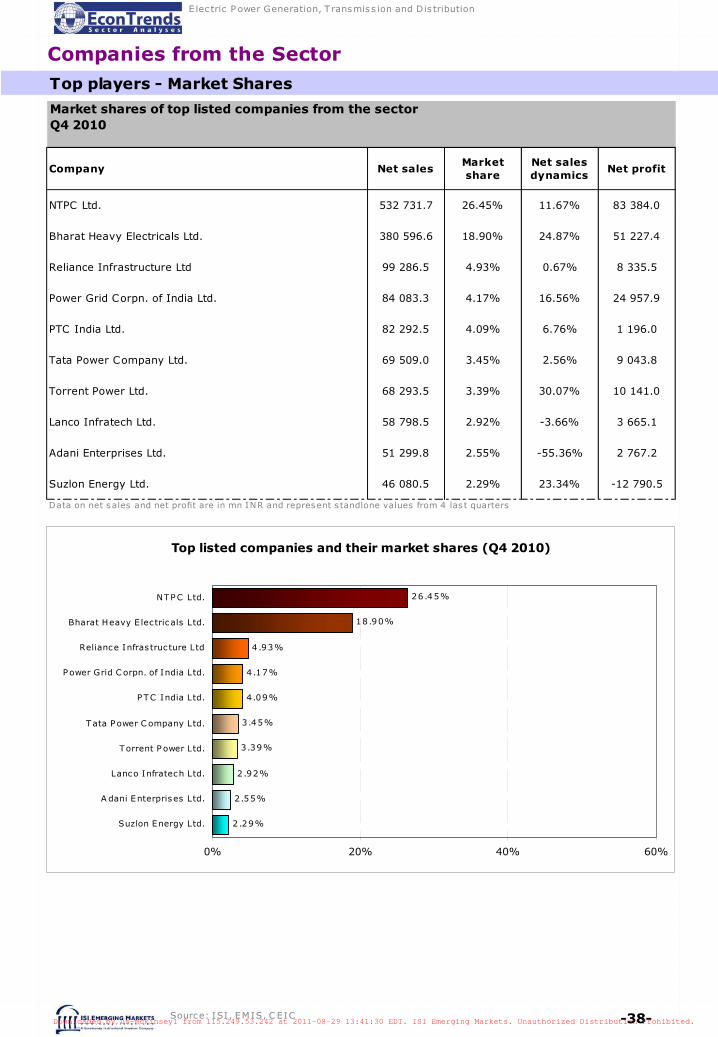
-38-
E lec tric P ower Generation, T ransmiss ion and Dis tribution
Source: ISI , EM IS, C EIC
Top players - Market Shares
Companies from the Sector
Company Net salesMarket share
Net sales dynamics
Net profit
NTPC Ltd. 532 731.7 26.45% 11.67% 83 384.0
Bharat Heavy Electricals Ltd. 380 596.6 18.90% 24.87% 51 227.4
Reliance Infrastructure Ltd 99 286.5 4.93% 0.67% 8 335.5
Power Grid Corpn. of India Ltd. 84 083.3 4.17% 16.56% 24 957.9
PTC India Ltd. 82 292.5 4.09% 6.76% 1 196.0
Tata Power Company Ltd. 69 509.0 3.45% 2.56% 9 043.8
Torrent Power Ltd. 68 293.5 3.39% 30.07% 10 141.0
Lanco Infratech Ltd. 58 798.5 2.92% -3.66% 3 665.1
Adani Enterprises Ltd. 51 299.8 2.55% -55.36% 2 767.2
Suzlon Energy Ltd. 46 080.5 2.29% 23.34% -12 790.5
Data on net sales and net profit are in mn INR and represent s tandlone values from 4 las t quarters
Market shares of top listed companies from the sectorQ4 2010
Top listed companies and their market shares (Q4 2010)
2 .29%
2.55%
2.92%
3.39%
3.45%
4.09%
4.17%
4.93%
18.90%
26.45%
0% 20% 40% 60%
Suzlon Energy Ltd.
A dani Enterprises Ltd.
Lanco Infratech Ltd.
Torrent P ower Ltd.
Tata P ower C ompany Ltd.
P TC India Ltd.
P ower Grid C orpn. of India Ltd.
Reliance Infras truc ture Ltd
Bharat Heavy E lec tricals Ltd.
NTPC Ltd.
0 500 1000 1500 2000
ISIEmergingMarketsPDF us-mckinsey1 from 115.249.53.242 on 2011-08-29 13:41:30 EDT. DownloadPDF.
Downloaded by us-mckinsey1 from 115.249.53.242 at 2011-08-29 13:41:30 EDT. ISI Emerging Markets. Unauthorized Distribution Prohibited.
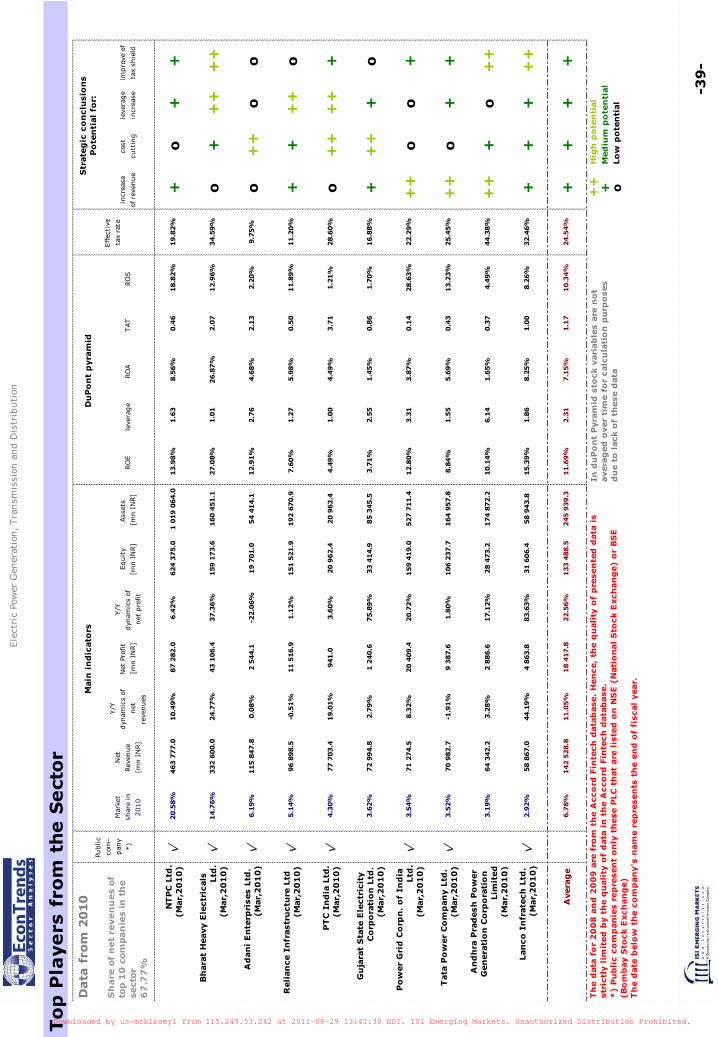
-39
-
Ele
ctri
c Po
wer
Gen
erat
ion, Tra
nsm
issi
on a
nd D
istr
ibuti
on
To
p P
laye
rs f
rom
th
e S
ect
or
impro
ve o
f
tax
shie
ld
+ ++ o o + o + + ++
++ +
leve
rage
incr
ease
+ ++ o ++
++ + o + o + +
cost
cutt
ing
o + ++ + ++
++ o o + + +
incr
ease
of r
even
ue
+ o o + o + ++
++
++ + + ++ + o
19.8
2%
34.5
9%
9.7
5%
11.2
0%
28.6
0%
16.8
8%
22.2
9%
25.4
5%
44.3
8%
32.4
6%
24.5
4%
RO
S
18.8
2%
12.9
6%
2.2
0%
11.8
9%
1.2
1%
1.7
0%
28.6
3%
13.2
3%
4.4
9%
8.2
6%
10.3
4%
TAT
0.4
6
2.0
7
2.1
3
0.5
0
3.7
1
0.8
6
0.1
4
0.4
3
0.3
7
1.0
0
1.1
7
RO
A
8.5
6%
26.8
7%
4.6
8%
5.9
8%
4.4
9%
1.4
5%
3.8
7%
5.6
9%
1.6
5%
8.2
5%
7.1
5%
leve
rage
1.6
3
1.0
1
2.7
6
1.2
7
1.0
0
2.5
5
3.3
1
1.5
5
6.1
4
1.8
6
2.3
1
RO
E
13.9
8%
27.0
8%
12.9
1%
7.6
0%
4.4
9%
3.7
1%
12.8
0%
8.8
4%
10.1
4%
15.3
9%
11.6
9%
Ass
ets
[mn I
NR]
1 0
19 0
64.0
160 4
51.1
54 4
14.1
192 6
70.9
20 9
62.4
85 3
45.5
527 7
11.4
164 9
57.8
174 8
72.2
58 9
43.8
245 9
39.3
Equit
y
[mn I
NR]
624 3
75.0
159 1
73.6
19 7
01.0
151 5
21.9
20 9
62.4
33 4
14.9
159 4
19.0
106 2
37.7
28 4
73.2
31 6
06.4
133 4
88.5
Y/Y
dyn
amic
s of
net
pro
fit
6.4
2%
37.3
6%
-22.0
6%
1.1
2%
3.6
0%
75.8
9%
20.7
2%
1.8
0%
17.1
2%
83.6
3%
22.5
6%
Net
Pro
fit
[mn I
NR]
87 2
82.0
43 1
06.4
2 5
44.1
11 5
16.9
941.0
1 2
40.6
20 4
09.4
9 3
87.6
2 8
86.6
4 8
63.8
18 4
17.8
Y/Y
dyn
amic
s of
net
reve
nues
10.4
9%
24.7
7%
0.0
8%
-0.5
1%
19.0
1%
2.7
9%
8.3
2%
-1.9
1%
3.2
8%
44.1
9%
11.0
5%
Net
Rev
enue
[mn I
NR]
463 7
77.0
332 6
00.0
115 8
47.8
96 8
98.5
77 7
03.4
72 9
94.8
71 2
74.5
70 9
82.7
64 3
42.2
58 8
67.0
142 5
28.8
Mar
ket
shar
e in
2010
20.5
8%
14.7
6%
6.1
9%
5.1
4%
4.3
0%
3.6
2%
3.5
4%
3.5
2%
3.1
9%
2.9
2%
6.7
8%
v v v v v v v v
Da
ta f
rom
20
10
Sh
are
of
net
reven
ues
of
top 1
0 c
om
pan
ies
in t
he
sect
or
67
.77
%
NT
PC
Ltd
.(M
ar,
20
10
)
Bh
ara
t H
eavy E
lectr
icals
Ltd
.(M
ar,
20
10
)
Ad
an
i E
nte
rpri
ses L
td.
(Mar,
20
10
)
Reli
an
ce I
nfr
astr
uctu
re L
td(M
ar,
20
10
)
PT
C I
nd
ia L
td.
(Mar,
20
10
)
Gu
jara
t S
tate
Ele
ctr
icit
y
Co
rpo
rati
on
Ltd
.(M
ar,
20
10
)
Po
wer
Gri
d C
orp
n.
of
Ind
ia
Ltd
.(M
ar,
20
10
)
Tata
Po
wer
Co
mp
an
y L
td.
(Mar,
20
10
)
An
dh
ra P
rad
esh
Po
wer
Gen
era
tio
n C
orp
ora
tio
n
Lim
ited
(Mar,
20
10
)
Lan
co
In
frate
ch
Ltd
.(M
ar,
20
10
)
Avera
ge
Main
in
dic
ato
rsPu
blic
com
-
pan
y
*)
Str
ate
gic
co
nclu
sio
ns
Po
ten
tial
for:
Effec
tive
tax
rate
Du
Po
nt
pyra
mid
Th
e d
ata
fo
r 2
00
8 a
nd
20
09
are
fro
m t
he A
cco
rd F
inte
ch
data
base.
Hen
ce,
the q
uali
ty o
f p
resen
ted
data
is
str
ictl
y l
imit
ed
by t
he q
uali
ty o
f d
ata
in
th
e A
cco
rd F
inte
ch
data
base.
*)
Pu
bli
c c
om
pan
ies r
ep
resen
t o
nly
th
ese P
LC
th
at
are
lis
ted
on
NS
E (
Nati
on
al
Sto
ck E
xch
an
ge)
or
BS
E
(Bo
mb
ay S
tock E
xch
an
ge)
Th
e d
ate
belo
w t
he c
om
pan
y's
nam
e r
ep
resen
ts t
he e
nd
of
fiscal
year.
Hig
h p
ote
nti
al
Med
ium
po
ten
tial
Lo
w p
ote
nti
al
In d
uP
on
t P
yra
mid
sto
ck v
ari
ab
les a
re n
ot
avera
ged
over
tim
e f
or
calc
ula
tio
n p
urp
oses
du
e t
o l
ack o
f th
ese d
ata
ISIEmergingMarketsPDF us-mckinsey1 from 115.249.53.242 on 2011-08-29 13:41:30 EDT. DownloadPDF.
Downloaded by us-mckinsey1 from 115.249.53.242 at 2011-08-29 13:41:30 EDT. ISI Emerging Markets. Unauthorized Distribution Prohibited.
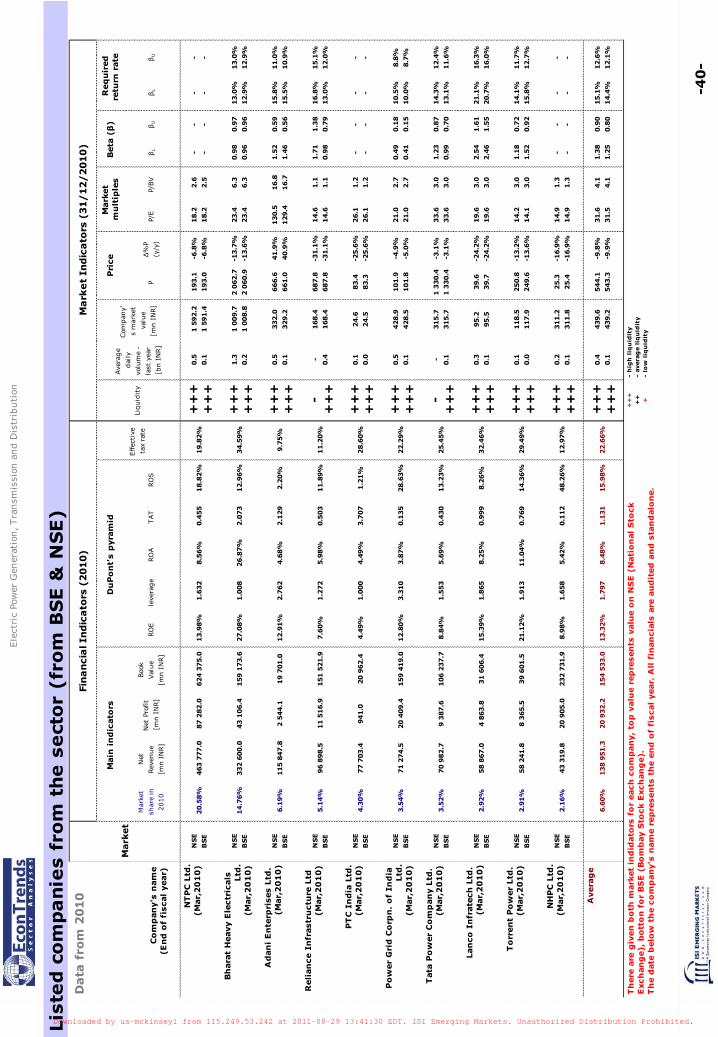
-40
-
Ele
ctri
c Po
wer
Gen
erat
ion, Tra
nsm
issi
on a
nd D
istr
ibuti
on
Lis
ted
co
mp
an
ies f
rom
th
e s
ect
or
(fro
m B
SE
& N
SE
)
βU - -
13.0
%
12.9
%
11.0
%
10.9
%
15.1
%
12.0
%
- -
8.8
%
8.7
%
12.4
%
11.6
%
16.3
%
16.0
%
11.7
%
12.7
%
- -
12.6
%
12.1
%
βL - -
13.0
%
12.9
%
15.8
%
15.5
%
16.8
%
13.0
%
- -
10.5
%
10.0
%
14.3
%
13.1
%
21.1
%
20.7
%
14.1
%
15.8
%
- -
15.1
%
14.4
%
βU - -
0.9
7
0.9
6
0.5
9
0.5
6
1.3
8
0.7
9
- -
0.1
8
0.1
5
0.8
7
0.7
0
1.6
1
1.5
5
0.7
2
0.9
2
- -
0.9
0
0.8
0
βL - -
0.9
8
0.9
6
1.5
2
1.4
6
1.7
1
0.9
8
- -
0.4
9
0.4
1
1.2
3
0.9
9
2.5
4
2.4
6
1.1
8
1.5
2
- -
1.3
8
1.2
5
P/BV
2.6
2.5
6.3
6.3
16.8
16.7
1.1
1.1
1.2
1.2
2.7
2.7
3.0
3.0
3.0
3.0
3.0
3.0
1.3
1.3
4.1
4.1
P/E
18.2
18.2
23.4
23.4
130.5
129.4
14.6
14.6
26.1
26.1
21.0
21.0
33.6
33.6
19.6
19.6
14.2
14.1
14.9
14.9
31.6
31.5
Δ%
P
(y/y
)
-6.8
%
-6.8
%
-13.7
%
-13.6
%
41.9
%
40.9
%
-31.1
%
-31.1
%
-25.6
%
-25.6
%
-4.9
%
-5.0
%
-3.1
%
-3.1
%
-24.2
%
-24.2
%
-13.2
%
-13.6
%
-16.9
%
-16.9
%
-9.8
%
-9.9
%
P
193.1
193.0
2 0
62.7
2 0
60.9
666.6
661.0
687.8
687.8
83.4
83.3
101.9
101.8
1 3
30.4
1 3
30.4
39.6
39.7
250.8
249.6
25.3
25.4
544.1
543.3
1 5
92.2
1 5
91.4
1 0
09.7
1 0
08.8
332.0
329.2
168.4
168.4
24.6
24.5
428.9
428.5
315.7
315.7
95.2
95.5
118.5
117.9
311.2
311.8
439.6
439.2
0.5
0.1
1.3
0.2
0.5
0.1 -
0.4
0.1
0.0
0.5
0.1 -
0.1
0.3
0.1
0.1
0.0
0.2
0.1
0.4
0.1
++
++
++
++
++
++
++
++
++
-+
++
++
++
++
++
++
++
-+
++
++
++
++
++
++
++
++
++
++
++
++
++
++
++
+ +
19.8
2%
34.5
9%
9.7
5%
11.2
0%
28.6
0%
22.2
9%
25.4
5%
32.4
6%
29.4
9%
12.9
7%
22.6
6%
RO
S
18.8
2%
12.9
6%
2.2
0%
11.8
9%
1.2
1%
28.6
3%
13.2
3%
8.2
6%
14.3
6%
48.2
6%
15.9
8%
TAT
0.4
55
2.0
73
2.1
29
0.5
03
3.7
07
0.1
35
0.4
30
0.9
99
0.7
69
0.1
12
1.1
31
RO
A
8.5
6%
26.8
7%
4.6
8%
5.9
8%
4.4
9%
3.8
7%
5.6
9%
8.2
5%
11.0
4%
5.4
2%
8.4
8%
leve
rage
1.6
32
1.0
08
2.7
62
1.2
72
1.0
00
3.3
10
1.5
53
1.8
65
1.9
13
1.6
58
1.7
97
RO
E
13.9
8%
27.0
8%
12.9
1%
7.6
0%
4.4
9%
12.8
0%
8.8
4%
15.3
9%
21.1
2%
8.9
8%
13.3
2%
Boo
k
Val
ue
[mn I
NR]
624 3
75.0
159 1
73.6
19 7
01.0
151 5
21.9
20 9
62.4
159 4
19.0
106 2
37.7
31 6
06.4
39 6
01.5
232 7
31.9
154 5
33.0
Net
Pro
fit
[mn I
NR]
87 2
82.0
43 1
06.4
2 5
44.1
11 5
16.9
941.0
20 4
09.4
9 3
87.6
4 8
63.8
8 3
65.5
20 9
05.0
20 9
32.2
Net
Rev
enue
[mn I
NR]
463 7
77.0
332 6
00.0
115 8
47.8
96 8
98.5
77 7
03.4
71 2
74.5
70 9
82.7
58 8
67.0
58 2
41.8
43 3
19.8
138 9
51.3
Mar
ket
shar
e in
2010
20.5
8%
14.7
6%
6.1
9%
5.1
4%
4.3
0%
3.5
4%
3.5
2%
2.9
2%
2.9
1%
2.1
6%
6.6
0%
NSE
BSE
NSE
BSE
NSE
BSE
NSE
BSE
NSE
BSE
NSE
BSE
NSE
BSE
NSE
BSE
NSE
BSE
NSE
BSE
Da
ta f
rom
20
10
Co
mp
an
y's
nam
e(E
nd
of
fiscal
year)
NT
PC
Ltd
.(M
ar,
20
10
)
Bh
ara
t H
eavy E
lectr
icals
Ltd
.(M
ar,
20
10
)
Ad
an
i E
nte
rpri
ses L
td.
(Mar,
20
10
)
Reli
an
ce I
nfr
astr
uctu
re L
td(M
ar,
20
10
)
PT
C I
nd
ia L
td.
(Mar,
20
10
)
Po
wer
Gri
d C
orp
n.
of
Ind
ia
Ltd
.(M
ar,
20
10
)
Tata
Po
wer
Co
mp
an
y L
td.
(Mar,
20
10
)
Lan
co
In
frate
ch
Ltd
.(M
ar,
20
10
)
To
rren
t P
ow
er
Ltd
.(M
ar,
20
10
)
NH
PC
Ltd
.(M
ar,
20
10
)
Avera
ge
Ave
rage
dai
ly
volu
me
-
last
yea
r
[bn I
NR]
Liquid
ity
Main
in
dic
ato
rs
Th
ere
are
giv
en
bo
th m
ark
et
ind
idato
rs f
or
each
co
mp
an
y,
top
valu
e r
ep
resen
ts v
alu
e o
n N
SE
(N
ati
on
al
Sto
ck
Exch
an
ge),
bo
tto
n f
or
BS
E (
Bo
mb
ay S
tock E
xch
an
ge).
Th
e d
ate
belo
w t
he c
om
pan
y's
nam
e r
ep
resen
ts t
he e
nd
of
fiscal
year.
All
fin
an
cia
ls a
re a
ud
ited
an
d s
tan
dalo
ne.
- h
igh
liq
uid
ity
- avera
ge l
iqu
idit
y-
low
liq
uid
ity
Mark
et
Fin
an
cia
l In
dic
ato
rs (
20
10
)
Effec
tive
tax
rate
Du
Po
nt'
s p
yra
mid
Ma
rke
t In
dic
ato
rs (
31
/1
2/
20
10
)
Req
uir
ed
re
turn
rate
Mark
et
mu
ltip
les
Beta
(β
)
Com
pan
y'
s m
arke
t
valu
e
[mn I
NR]
Pri
ce
ISIEmergingMarketsPDF us-mckinsey1 from 115.249.53.242 on 2011-08-29 13:41:30 EDT. DownloadPDF.
Downloaded by us-mckinsey1 from 115.249.53.242 at 2011-08-29 13:41:30 EDT. ISI Emerging Markets. Unauthorized Distribution Prohibited.

-41
-
Ele
ctri
c Po
wer
Gen
erat
ion, Tra
nsm
issi
on a
nd D
istr
ibuti
on
Me
rge
rs a
nd
Acq
uis
itio
ns
Takin
g o
ver
co
mp
an
y
Inte
rnational Fi
nance
C
orp
ora
tion
Arg
onaut
Ventu
res
LLC
, B
ess
em
er
Ventu
res,
New
Silk
R
oute
Advis
ors
National Therm
al
Pow
er
Corp
ora
tion
(NTPC
)
Ess
ar
Energ
y P
lc
Gre
enko G
roup
India
Pow
er
Corp
Ltd
(I
PC
L)
Tech
no E
lect
ric
&
Engg.
Com
pany L
td.
Gre
en I
nfr
a L
td
Chlo
ride G
roup
Lum
inous
Pow
er
Tech
nolo
gie
s
Taken
over
co
mp
an
y
Tech
no E
lect
ric
&
Engin
eeri
ng C
o.
Ltd
Kir
an E
nerg
y S
ola
r Pow
er
Pvt
Ltd
Katw
a p
ow
er
pro
ject
Navabhara
t Pow
er
Pvt
Ltd (
NPPL)
(S
PV
)
LVS
Pow
er
Ltd
Dis
herg
arh
Pow
er
Supply
Co (
DPS
C)
Super
Win
d P
roje
ct
from
Suzl
on G
reen
Pow
er
BP E
nerg
y I
ndia
Pvt
Ltd
DB
Pow
er
Ele
ctro
nic
s (P
) Lt
d
Tri
tronic
s (I
ndia
) Pvt.
Lt
d
An
no
un
cem
en
t d
ate
(Sta
tus o
f a d
eal)
Jan-3
1,2
011
(com
ple
ted)
Jan-2
7,2
011
(com
ple
ted)
Dec-
08,2
010
(announce
d)
Jul-
06,2
010
(announce
d)
Apr-
08,2
010
(com
ple
ted)
Nov-2
1,2
009
(com
ple
ted)
Sep-1
7,2
009
(com
ple
ted)
Sep-1
1,2
009
(com
ple
ted)
Jul-
30,2
009
(com
ple
ted)
Jul-
14,2
009
(com
ple
ted)
Bu
yer'
s N
am
e
Ess
ar
Energ
y P
lc
3i G
roup,
Tem
ase
k
Hold
ings
Pte
Ltd
Bhoru
ka P
ow
er
Corp
ora
tion L
imited
India
n A
lum
iniu
m
Com
pany
Gre
en I
nfr
a L
td
Genera
l Ele
ctri
c C
om
pany
Riv
er
Valle
y H
ydro
V
entu
res
Hin
dust
an P
etr
ole
um
C
orp
ora
tion L
td
Chlo
ride G
roup
Pro
lec,
S.A
. de C
.V.
Sell
er'
s N
am
e
Mala
xm
i Energ
y
Ventu
res,
Nava B
hara
t V
entu
res
Ltd.
BP A
ltern
ative E
nerg
y
Inte
rnational Lt
d
Targ
et
Co
mp
an
y
Navabhara
t Pow
er
Pvt
Ltd (
NPPL)
(S
PV
)
Adani Pow
er
Ltd
SLS
Pow
er
Indust
ries
Suvas
Hold
ings
BP E
nerg
y I
ndia
Pvt
Ltd
Indo T
ech
Tra
nsf
orm
ers
Am
ritj
al V
entu
re
GA
IL I
ndia
Ltd
DB
Pow
er
Ele
ctro
nic
s (P
) Lt
d
Indo T
ech
Tra
nsf
orm
ers
An
no
un
cem
en
t d
ate
Jul-
06,2
010
Sep-1
7,2
008
Jul-
04,2
007
Feb-0
4,2
004
Sep-1
1,2
009
Dec-
04,2
008
Feb-1
9,2
009
Jun-0
9,2
006
Jul-
30,2
009
May-1
9,2
009
Valu
e o
f a d
eal
[mn
US
D]
(Sta
tus o
f a d
eal)
2 0
00.0
0(a
nnounce
d)
388.3
9(a
nnounce
d)
343.5
5(c
om
ple
ted)
331.5
0(c
om
ple
ted)
96.1
5(c
om
ple
ted)
80.9
6(a
nnounce
d)
60.1
4(a
nnounce
d)
56.6
2(c
om
ple
ted)
52.7
3(c
om
ple
ted)
48.5
3(c
om
ple
ted)
The s
tatu
s of
pre
sente
d d
eals
may c
hange o
r so
me o
f deals
may d
rop o
ut
from
the s
ubse
quent
report
s (e
.g.
due t
o c
ance
lations
of
them
)
La
st
me
rge
rs
The last
merg
ers
refe
r to
the t
ransa
ctio
ns
aff
ect
ing a
naly
sed s
ect
or.
The d
ata
sourc
e is
ISI
Dealw
atc
h
Th
e la
rge
st
bu
y/
se
ll o
ffe
rs
The larg
est
buy/s
ell
off
ers
refe
r to
the t
ransa
ctio
ns
aff
ect
ing a
naly
sed s
ect
or.
The d
ata
sourc
e is
ISI
Dealw
atc
h
ISIEmergingMarketsPDF us-mckinsey1 from 115.249.53.242 on 2011-08-29 13:41:30 EDT. DownloadPDF.
Downloaded by us-mckinsey1 from 115.249.53.242 at 2011-08-29 13:41:30 EDT. ISI Emerging Markets. Unauthorized Distribution Prohibited.
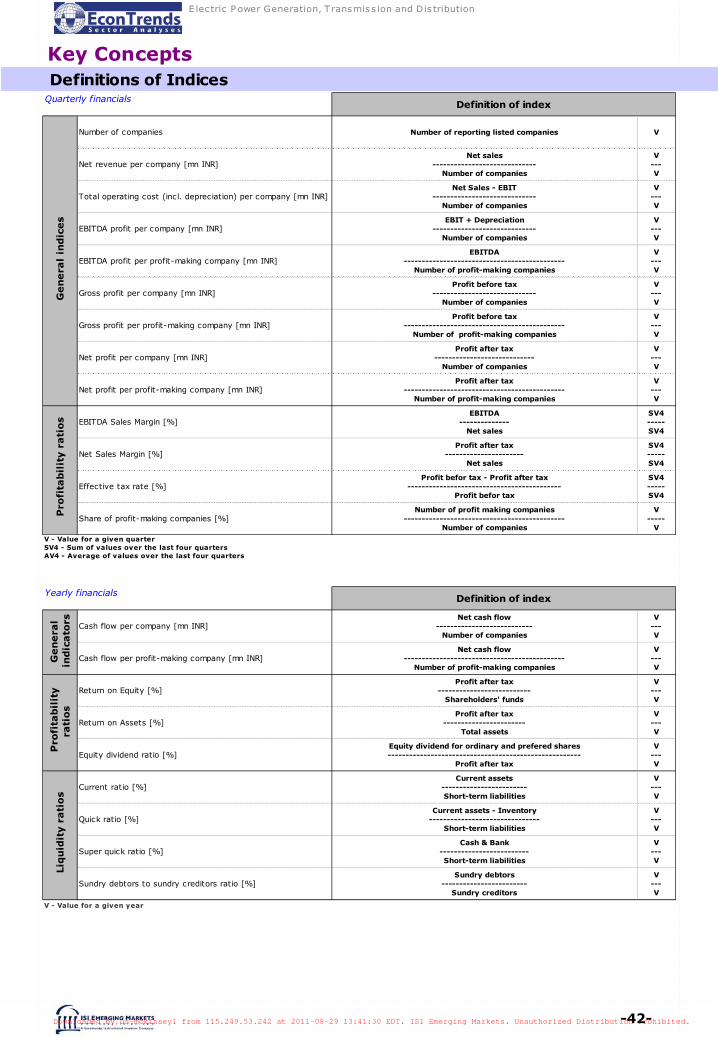
-42-
E lec tric P ower Generation, T ransmiss ion and Dis tribution
Key Concepts Definitions of Indices
Number of companies Number of reporting listed companies V
Net revenue per company [mn INR]Net sales
-----------------------------Number of companies
V---V
Total operating cost (incl. depreciation) per company [mn INR]Net Sales - EBIT
-----------------------------Number of companies
V---V
EBITDA profit per company [mn INR]EBIT + Depreciation
-----------------------------Number of companies
V---V
EBITDA profit per profit-making company [mn INR]EBITDA
---------------------------------------------Number of profit-making companies
V---V
Gross profit per company [mn INR]Profit before tax
-----------------------------Number of companies
V---V
Gross profit per profit-making company [mn INR]Profit before tax
---------------------------------------------Number of profit-making companies
V---V
Net profit per company [mn INR]Profit after tax
----------------------------Number of companies
V---V
Net profit per profit-making company [mn INR]Profit after tax
---------------------------------------------Number of profit-making companies
V---V
EBITDA Sales Margin [%]EBITDA
--------------Net sales
SV4-----SV4
Net Sales Margin [%]Profit after tax
----------------------Net sales
SV4-----SV4
Effective tax rate [%]Profit befor tax - Profit after tax
-------------------------------------------Profit befor tax
SV4-----SV4
Share of profit-making companies [%]Number of profit making companies
---------------------------------------------Number of companies
V-----
V
V - Value for a given quarterSV4 - Sum of values over the last four quartersAV4 - Average of values over the last four quarters
Definition of index
Ge
ne
ral
ind
ice
sP
rofi
tab
ilit
y r
ati
os
Quarterly financials
Yearly financials
Cash flow per company [mn INR]Net cash flow
---------------------------Number of companies
V---V
Cash flow per profit-making company [mn INR]Net cash flow
---------------------------------------------Number of profit-making companies
V---V
Return on Equity [%]Profit after tax
--------------------------Shareholders' funds
V---V
Return on Assets [%]Profit after tax
-----------------------Total assets
V---V
Equity dividend ratio [%]Equity dividend for ordinary and prefered shares------------------------------------------------------
Profit after tax
V---V
Current ratio [%]Current assets
------------------------Short-term liabilities
V---V
Quick ratio [%]Current assets - Inventory
-------------------------------Short-term liabilities
V---V
Super quick ratio [%]Cash & Bank
-------------------------Short-term liabilities
V---V
Sundry debtors to sundry creditors ratio [%]Sundry debtors
------------------------Sundry creditors
V---V
Definition of index
Ge
ne
ral
ind
ica
tors
Pro
fita
bil
ity
rati
os
Liq
uid
ity r
ati
os
V - Value for a given year
ISIEmergingMarketsPDF us-mckinsey1 from 115.249.53.242 on 2011-08-29 13:41:30 EDT. DownloadPDF.
Downloaded by us-mckinsey1 from 115.249.53.242 at 2011-08-29 13:41:30 EDT. ISI Emerging Markets. Unauthorized Distribution Prohibited.
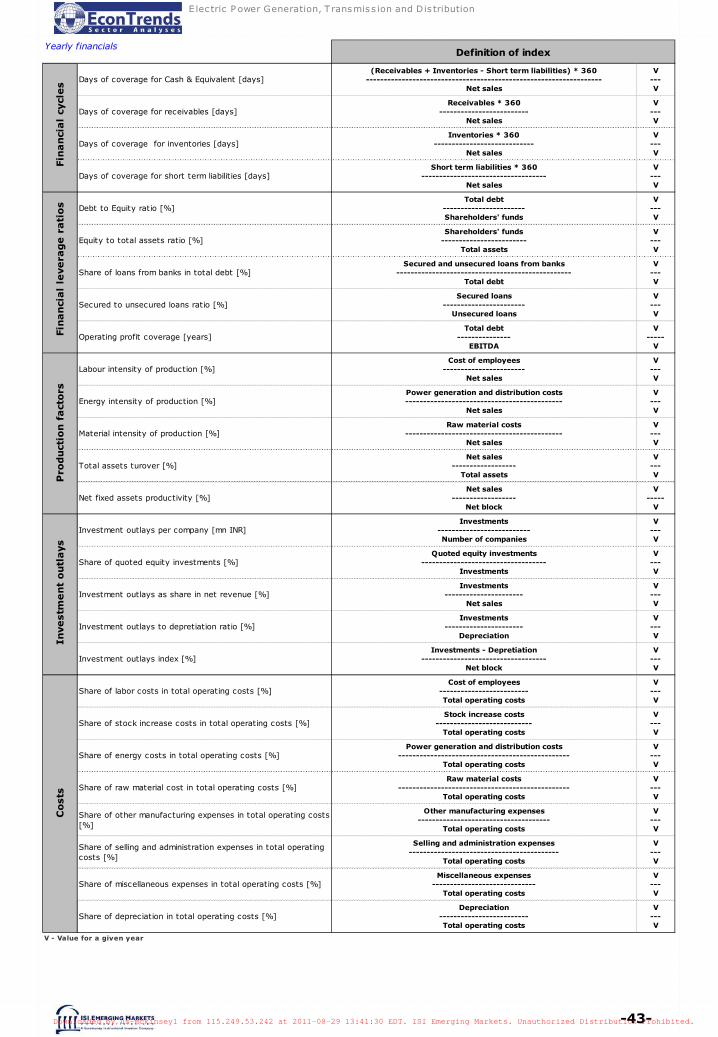
-43-
E lec tric P ower Generation, T ransmiss ion and Dis tribution
Yearly financials
Days of coverage for Cash & Equivalent [days](Receivables + Inventories - Short term liabilities) * 360
------------------------------------------------------------------Net sales
V---V
Days of coverage for receivables [days]Receivables * 360
-------------------------Net sales
V---V
Days of coverage for inventories [days]Inventories * 360
----------------------------Net sales
V---V
Days of coverage for short term liabilities [days]Short term liabilities * 360
-----------------------------------Net sales
V---V
Debt to Equity ratio [%]Total debt
-----------------------Shareholders' funds
V---V
Equity to total assets ratio [%]Shareholders' funds
------------------------Total assets
V---V
Share of loans from banks in total debt [%]Secured and unsecured loans from banks
-------------------------------------------------Total debt
V---V
Secured to unsecured loans ratio [%]Secured loans
-----------------------Unsecured loans
V---V
Operating profit coverage [years]Total debt
---------------EBITDA
V-----
V
Labour intensity of production [%]Cost of employees
-----------------------Net sales
V---V
Energy intensity of production [%]Power generation and distribution costs--------------------------------------------
Net sales
V---V
Material intensity of production [%]Raw material costs
--------------------------------------------Net sales
V---V
Total assets turover [%]Net sales
------------------Total assets
V---V
Net fixed assets productivity [%]Net sales
------------------Net block
V-----
V
Investment outlays per company [mn INR]Investments
--------------------------Number of companies
V---V
Share of quoted equity investments [%]Quoted equity investments
-----------------------------------Investments
V---V
Investment outlays as share in net revenue [%]Investments
----------------------Net sales
V---V
Investment outlays to depretiation ratio [%]Investments
----------------------Depreciation
V---V
Investment outlays index [%]Investments - Depretiation
-----------------------------------Net block
V---V
Share of labor costs in total operating costs [%]Cost of employees
-------------------------Total operating costs
V---V
Share of stock increase costs in total operating costs [%]Stock increase costs
---------------------------Total operating costs
V---V
Share of energy costs in total operating costs [%]Power generation and distribution costs
------------------------------------------------Total operating costs
V---V
Share of raw material cost in total operating costs [%]Raw material costs
------------------------------------------------Total operating costs
V---V
Share of other manufacturing expenses in total operating costs [%]
Other manufacturing expenses-------------------------------------
Total operating costs
V---V
Share of selling and administration expenses in total operating costs [%]
Selling and administration expenses------------------------------------------
Total operating costs
V---V
Share of miscellaneous expenses in total operating costs [%]Miscellaneous expenses
-----------------------------Total operating costs
V---V
Share of depreciation in total operating costs [%]Depreciation
-------------------------Total operating costs
V---V
Fin
an
cia
l le
ve
rag
e r
ati
os
Pro
du
ctio
n f
act
ors
V - Value for a given year
Inve
stm
en
t o
utl
ays
Co
sts
Fin
an
cia
l cy
cle
sDefinition of index
ISIEmergingMarketsPDF us-mckinsey1 from 115.249.53.242 on 2011-08-29 13:41:30 EDT. DownloadPDF.
Downloaded by us-mckinsey1 from 115.249.53.242 at 2011-08-29 13:41:30 EDT. ISI Emerging Markets. Unauthorized Distribution Prohibited.

-44-
E lec tric P ower Generation, T ransmiss ion and Dis tribution
Definitions of Selected Concepts
EconTrends for India are based to large extent on the structure of the North American IndustryClassification System (NAICS). Analyses made for respective industry divisions, groups, classes andsub-classes are consistent with this classification. However the used system of industry classificationis not fully compatible with the National Industrial Classification in India due to Indian statistics -specific factors. Moreover the reports are based on the bottom-up aggregation of individual companies financial data from the Accord Fintech database, which provides the financials not for all, but for allmajor companies from the non-financial sector. The measurement units in several observations in thedatabase have been adjusted to ensure appropriate consistency and accuracy of the data. Quarterlyfinancial data from Income Statement are adjusted to assert their consistency with yearly auditedfigures. Hence the report covers not the full sector but only its major part. It is worth emphasizingthat the aggregated financials from a given year/quarter apply to companies whose fiscal year/quarterended in that year/quarter. Aggregated financials are calculated only for listed companies reported on
Forecasting models used in EconTrends have a hierarchical structure. The first layer consists ofmodels that transmit behavior of macroeconomic variables like nominal GDP growth, increases in pricesto the behaviors of financial parameters like net sales per company and EBITDA margin in all analyzedeconomic divisions. EBITDA margin should be understood as earnings before interest, taxes,amortisation and depreciation. The next and last layer of models translates the behavior of the aboveparameters in economic divisions into the groups within them. The econometric models that are usedin respective layers have a linear structure and belong to a well known group of ADL (AutoregressiveDistributed Lags) models. The long term relation between GDP growth and growth of sales in a givensector (called implied long term growth) is also developed on the ground of these models.
quarterly basis to assert maximum consistency between quarterly and yearly figures.
Seasonal adjustment is an econometric procedure consisting of elimination of seasonal deviations thatimpair the effectiveness of econometric modeling. This statistical procedure is based on appropriate,specialized econometric tools (the Tramo/Seats method). The software applied performs seasonaladjustment according to the Indian calendar (e.g. public and religious holidays, etc.), to set off theimpact of differences in the number of working days in particular quarters. Forecasts of financialparameters in the given sectors are derived based on forecasts of deseasonalised trend. The accuracy of the seasonal adjustment procedure is additionally supported by verification of key statistical tests,inclusion of incidental factors and drastic leaps in production volume, as well as testing the model.
Seasonal deviations are obtained by using the Tramo/Seats econometric procedure. A seasonaldeviation shows the average deviation of the value of revenue at a given quarter from the long termtrend. Seasonal variation informs us about an additional changeability associated with a particularseason of the year, which is a result of temporarily increased or decreased revenue. Skilfulassessment of seasonal deviation may be one of the advantages of a firm, which will be able to assess the level of revenue in a given quarter, that in turn will result in better production planning. However,a bad assessment of seasonal changes may be a source of additional risk. The graph of seasonaldeviation for the period shows deviation from the long term trend in a given quarter (quarterly valuesare arranged chronologically in years i.e. January '98, '99 etc.), which allows for precise forecasting ofdeviation in the analyzed quarter. In the above materials we can see two methods of presentingseasonality. The first is the additive one, when the revenues are decomposed as a sum of long termtrend and nominal value seasonal deviations. The second way of presenting seasonality is the multipli-cative one, where seasonal deviations are calculated as the percentage deviations from the long termtrend (in that case a deviation of 103 means a deviation of 3% from the value of the trend, and e.g.98 a deviation of -2%).
Seasonal adjustment
Seasonal deviations
Forecasting models
ISIEmergingMarketsPDF us-mckinsey1 from 115.249.53.242 on 2011-08-29 13:41:30 EDT. DownloadPDF.
Downloaded by us-mckinsey1 from 115.249.53.242 at 2011-08-29 13:41:30 EDT. ISI Emerging Markets. Unauthorized Distribution Prohibited.
-45-
E lec tric P ower Generation, T ransmiss ion and Dis tribution
Forecasts presented in EconTrends for India relate to a period of two quarters ahead in relation tothe end of the time period for which statistical data are available.
Risk-profitability maps show the location of sectors depending on the value of profitability and riskthey achieve. Sectors singled out by being encircled by a red ring are most useful –„efficient” forinvestors, due to the relatively highest return at the lowest variability of profit (relatively high value ofthe Sharp’s index). On the basis of the coordinate values of „efficient” sectors, the preferences ofinvestors on the market are shown by a grey dotted line visible on the graphs – this is a level line ofthe linear function of utility for investors (Investors Utility Function). The level line shows preferencesof the majority of investors with regard to achieved profitability at a given risk. Sectors, which areplaced above the linear function of usefulness are preferred by investors due to the possibility ofachieving a high profitability, at a particular level of risk. Sectors lying below the level line are not asattractive for investors, due to the relatively high variability in profit as against their profitability.
The forces map shows decompositions of the profitability index into particular driving forces. The ideaof the strengths map is to show the effect of particular variables on the dynamics of profit both incurrent and forecasted situation.
coefficient is a measure of statistical dispersion in the market shares defined as the field between thediagonal and the Lorentz curve. It is defined as a ratio with values between 0 and 1. A low Ginicoefficient indicates more equal market shares, while a high Gini coefficient indicates more unequaldistribution. 0 corresponds to perfect equality (all companies having exactly the same market share)and 1 corresponds to perfect inequality (where one monopolist has all the market share, whileeveryone else has zero share in the market). It is worth noting that concentrations measurespresented above may be of limited use if the dataset for an analyzed sector consists of a only fewcompanies. Concentration measures are calculated for listed and non-listed companies reporting onyearly basis.
Y/Y Increase (Q/Q Increase), Y/Y Dynamics (Q/Q dynamics). Increases are calculated as absolutedifferences with respect to the preceding year (Y/Y) or preceding quarter (Q/Q). Dynamics arecalculated as relative [%] differences with respect to the preceding year (Y/Y) or preceding quarter(Q/Q).
Several concentration measures are used to examine the degree of the market power concentrationwithin the analyzed sectors. The Herfindahl-Hirschman Index (known as HHI), is a measure of the sizeof firms in relationship to the industry and an indicator of the amount of competition among them. It isdefined as the sum of the squares of the market shares of each individual firm: ie the average marketshare, weighted by market share. As such, it can range from 0 to 10,000 moving from a very largeamount of very small firms to a single monopolistic producer. Decreases in the Herfindahl indexgenerally indicate a loss of market power and an increase in competition, whereas increases imply theopposite. The Lorenz curve in turn, is a graph showing the proportion of the distribution assumed bythe bottom % market share values. It is used to represent market shares distribution, where it showsfor the bottom x% of companies in the sector, what percentage y% of the market share they have.The percentage of companies is plotted on the x-axis, the percentage of market share on the y-axis.It is considered it to be a measure of inequality of the market shares within the given sector. The Gini
Risk-profitability maps
The forces map
Concentration measures
Y/Y Increase (Q/Q Increase), Y/Y Dynamics (Q/Q dynamics)
Forecasts
The Lorenz curve in turn, is a graph showing the proportion of the distribution assumed by the bottom% market share values. It is used to represent market shares distribution, where it shows for thebottom x% of companies in the sector, what percentage y% of the market share they have. Thepercentage of companies is plotted on the x-axis, the percentage of market share on the y-axis. It isconsidered it to be a measure of inequality of the market shares within the given sector.
The Gini coefficient is a measure of statistical dispersion in the market shares defined as the fieldbetween the diagonal and the Lorentz curve. It is defined as a ratio with values between 0 and 1. Alow Gini coefficient indicates more equal market shares, while a high Gini coefficient indicates moreunequal distribution. 0 corresponds to perfect equality (all companies having exactly the same marketshare) and 1 corresponds to perfect inequality (where one monopolist has all the market share, whileeveryone else has zero share in the market).
It is worth noting that concentrations measures presented above may be of limited use if the datasetfor an analyzed sector consists of a only few companies.
Several concentration measures are used to examine the degree of the market power concentrationwithin the analyzed sectors.
The Herfindahl-Hirschman Index (known as HHI) is a measure of the size of firms in relationship to theindustry and an indicator of the amount of competition among them. It is defined as the sum of thesquares of the market shares of each individual firm: ie the average market share, weighted by marketshare. As such, it can range from 0 to 10,000 moving from a very large amount of very small firms to asingle monopolistic producer. Decreases in the Herfindahl index generally indicate a loss of marketpower and an increase in competition, whereas increases imply the opposite.
Herfindahl-Hirschman Index
Lorenz Curve
Gini coefficient
ISIEmergingMarketsPDF us-mckinsey1 from 115.249.53.242 on 2011-08-29 13:41:30 EDT. DownloadPDF.
Downloaded by us-mckinsey1 from 115.249.53.242 at 2011-08-29 13:41:30 EDT. ISI Emerging Markets. Unauthorized Distribution Prohibited.
-46-
E lec tric P ower Generation, T ransmiss ion and Dis tribution
Liquidity (of public company) - ranked accordingly to the averaged daily shares' turnover from the lastyear
Betas and Required Rates of Return - are calculated for listed companies under CAPM model.
- rate of return from investments in shares of an analysed company,
- Leveraged Beta,
- Unleveraged Beta,
- Required Rate of Return, where:
- effective tax rate.
- required (by investors) rate of return from investments in the shares of an analysed company; i.e. the expected rate of return when the market stays in equilibrium under CAPM assumptions,
- expected rate of return of the stock market index (BSESN, NSEI),
- risk-free rate of return (Yield of 364-days Treasury Bills)
- debt to equity ratio,
DuPont Pyramid is a very useful tool to decompose Return on Equity (ROA) into various ratios like:Return on Assets (ROA), Return on Sales (ROS) and Total Assets Turnover (TAT). It enables easydrawing of conclusions about the efficiency of an analyzed company in various areas of its activity.
The long-term trend indicates so-called potential level of production for a given sector i.e. a level atwhich there is no significant tension for a rise/fall in price dynamics and employment within the sector.
The business cycle shows fluctuations of business activity for a given sector around a long-term trendrepresenting the potential level of production for the sector. Positive values of the business cycleindicate a possibility of price dynamics’ increase pressure, increase of employment or rebound ininvestments, since the capacity utilization ratio remains currently high. Negative values of thebusiness cycle indicate a possibility of price dynamics’ decrease pressure, decrease of employment ordeterioration in investment activity, since the capacity utilization ratio remains relatively weak.
- rate of return of a stock market index (BSESN, NSEI),
Distributions of Financials present critical values of the distributions of various financials in theanalyzed sector. The presented critical values represent quartiles of the empirical distribution i.e. theyare calculated for 20%, 40%, 60% and 80% of the total population of companies from the givensector in a given year. These distributions make possible easy comparison of an analyzed company toother companies in the sector, looking at it from various financial angles.
Market multipliers (P/E, P/BV) - are widely used for the valuation purposes. Price to Earnings (P/E) iscalculated by dividing closury company's capitalisation in the quarter after analysed quarter by theearnings (net profits) from the last audited year. For the calculation of Price to Book Value (P/BV) theending year book value is taken.
( )( )M
MiL RVar
RRCov ,=β
( )ED
LU
τ
ββ
−+=
11
iRiRΕ
MR
MRΕ
fR
ED
τ
( )fMfi RRRR −Ε+=Ε β
The long-term trend
Distributions of Financials
DuPont Pyramid
Market multiples (P/E, P/BV)
Betas and Required Rates of Return
Liquidity
The business cycle
ISIEmergingMarketsPDF us-mckinsey1 from 115.249.53.242 on 2011-08-29 13:41:30 EDT. DownloadPDF.
Downloaded by us-mckinsey1 from 115.249.53.242 at 2011-08-29 13:41:30 EDT. ISI Emerging Markets. Unauthorized Distribution Prohibited.
Related Documents