General rights Copyright and moral rights for the publications made accessible in the public portal are retained by the authors and/or other copyright owners and it is a condition of accessing publications that users recognise and abide by the legal requirements associated with these rights. Users may download and print one copy of any publication from the public portal for the purpose of private study or research. You may not further distribute the material or use it for any profit-making activity or commercial gain You may freely distribute the URL identifying the publication in the public portal If you believe that this document breaches copyright please contact us providing details, and we will remove access to the work immediately and investigate your claim. Downloaded from orbit.dtu.dk on: Mar 14, 2022 Electric performance of fastened hybrid busbars: An experimental and numerical study Sampaio, Rui FV; Pragana, João PM; Bragança, Ivo MF; Silva, Carlos MA; Nielsen, Chris V; Martins, Paulo AF Published in: Proceedings of the Institution of Mechanical Engineers, Part L: Journal of Materials: Design and Applications Link to article, DOI: 10.1177/14644207211043009 Publication date: 2022 Document Version Peer reviewed version Link back to DTU Orbit Citation (APA): Sampaio, R. FV., Pragana, J. PM., Bragança, I. MF., Silva, C. MA., Nielsen, C. V., & Martins, P. AF. (Accepted/In press). Electric performance of fastened hybrid busbars: An experimental and numerical study. Proceedings of the Institution of Mechanical Engineers, Part L: Journal of Materials: Design and Applications. https://doi.org/10.1177/14644207211043009

Welcome message from author
This document is posted to help you gain knowledge. Please leave a comment to let me know what you think about it! Share it to your friends and learn new things together.
Transcript

General rights Copyright and moral rights for the publications made accessible in the public portal are retained by the authors and/or other copyright owners and it is a condition of accessing publications that users recognise and abide by the legal requirements associated with these rights.
Users may download and print one copy of any publication from the public portal for the purpose of private study or research.
You may not further distribute the material or use it for any profit-making activity or commercial gain
You may freely distribute the URL identifying the publication in the public portal If you believe that this document breaches copyright please contact us providing details, and we will remove access to the work immediately and investigate your claim.
Downloaded from orbit.dtu.dk on: Mar 14, 2022
Electric performance of fastened hybrid busbars: An experimental and numerical study
Sampaio, Rui FV; Pragana, João PM; Bragança, Ivo MF; Silva, Carlos MA; Nielsen, Chris V; Martins,Paulo AF
Published in:Proceedings of the Institution of Mechanical Engineers, Part L: Journal of Materials: Design and Applications
Link to article, DOI:10.1177/14644207211043009
Publication date:2022
Document VersionPeer reviewed version
Link back to DTU Orbit
Citation (APA):Sampaio, R. FV., Pragana, J. PM., Bragança, I. MF., Silva, C. MA., Nielsen, C. V., & Martins, P. AF.(Accepted/In press). Electric performance of fastened hybrid busbars: An experimental and numerical study.Proceedings of the Institution of Mechanical Engineers, Part L: Journal of Materials: Design and Applications.https://doi.org/10.1177/14644207211043009

1
Electricperformanceoffastenedhybridbusbars:
anexperimentalandnumericalstudy
RuiFVSampaioa,JoãoPMPraganaa,IvoMFBragançab,CarlosMASilvaa,ChrisV.Nielsenc,PauloAFMartinsa
aIDMEC,InstitutoSuperiorTécnico,UniversidadedeLisboa,Portugal
bCIMOSM,InstitutoSuperiordeEngenhariadeLisboa,InstitutoPolitécnicodeLisboa,PortugalcDepartmentofMechanicalEngineering,TechnicalUniversityofDenmark
ABSTRACT
This paper is focused on fastened hybrid busbars made from copper and aluminium with
the purpose of analysing the influence of the steel bolts, of their tightening torque and of the
surface condition of the sheets on the electric current flow and electric resistance of the
joints. The methodology combines experimentation with unit cells that are representative
of the joints and electro-mechanical numerical simulation using a finite element computer
program developed by the authors. Results are a step forward in understanding the
combined influence of bolts, contact pressure and surface roughness on the electric
performance of fastened hybrid busbars. Design guidelines for dimensioning the cross
sections of the copper and aluminium sheets and for effectively distributing bolts across the
contacting surfaces are also provided.
Keywords: Hybrid busbars, Fastening, Electric resistance, Experimentation, Finite element
method
2
1. INTRODUCTION
The distribution of electric power in vehicles and industrial installations is carried out by
wires, cables, and busbars. Busbars are usually preferred in low-voltage systems (up to
1 kV) operating under high electric currents because they are easy to install and maintain
and because they are advantageous in terms of safety, cost, and space limitations.
Busbars are preferentially made of copper due to its high electric conductivity and low
coefficient of linear thermal expansion. However, due to the fact that copper is a heavy and
expensive material, there is a growing interest in combining the electrical advantages of
copper with the lightweight and economic advantages of aluminium by means of hybrid
(copper-aluminium) busbars, in which the thinner and costlier parts are made of copper
and only used in specific key locations.
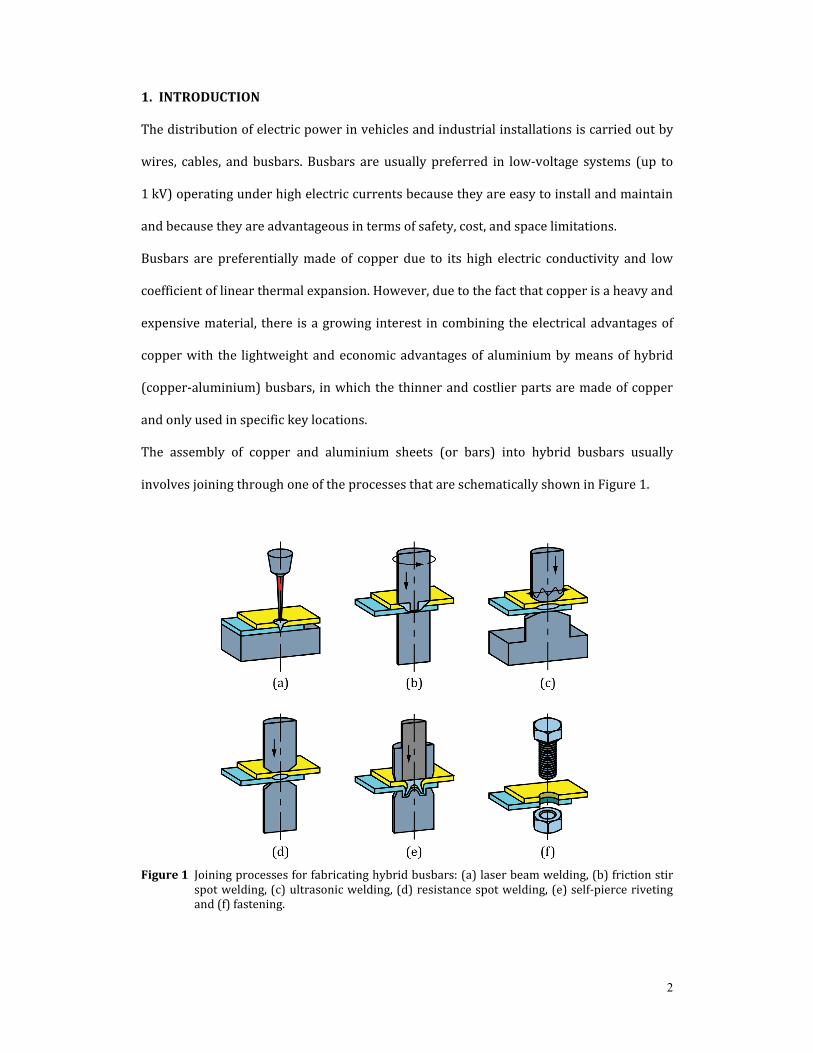
The assembly of copper and aluminium sheets (or bars) into hybrid busbars usually
involves joining through one of the processes that are schematically shown in Figure 1.
Figure1 Joining processes for fabricating hybrid busbars: (a) laser beam welding, (b) friction stir spot welding, (c) ultrasonic welding, (d) resistance spot welding, (e) self-pierce riveting and (f) fastening.
3
Laser beam welding (Figure 1a) concentrates the energy of light beams on very small
surface areas to minimize the heat-affected zones, where distortions and changes in the
metallurgical structure and mechanical strength of the materials are likely to occur. The
process is used for connecting cell terminals to busbars and for joining busbars [1] but its
utilization in hybrid busbars is challenging due to the low absorptivity of copper in the
typical wavelength working ranges of industrial lasers, the differences in the physical and
thermal properties (e.g. melting temperature and thermal conductivity) of copper and
aluminium and the limited solubility of copper and aluminium (leading to the formation of
hard and brittle intermetallic compounds) [2].
Friction stir spot welding (Figure 1b) uses a rotating, threaded pin tool with a convex
shaped shoulder to generate heat by friction and create a solid bond between the two sheets
by plastic deformation. However, its utilization in hybrid busbars is difficult because the
overall quality and performance of the copper-aluminium joints is very sensitive to process
parameters, to differences in material mixing and to the final distribution of intermetallic
compounds [3].
Ultrasonic welding (Figure 1c) [4] combines pressure and localized high-frequency
vibration to generate enough plastic deformation and friction to deform asperities, break-
up oxides and create a metallurgical bond by direct exposure and intimate true metallic
contact between the clean (virgin) surfaces of the copper and aluminium sheets. The
process is used for joining cell terminals to busbar connectors in pouch-cells and has
applications in several electric vehicles such as the Nissan Leaf, the Chevrolet Volt, the
Chevrolet Spark, and the Chevrolet Bolt [5]. However, the ultrasonic process may create
some plastic deformation on the upper surface of the hybrid busbars due to differences in
the mechanical strength of the copper and aluminium sheets.
Resistance spot-welding (Figure 1d) utilizes electric current to locally heat and melt the
sheets and produce a joint. The process is mainly used for connecting battery cell terminals
to busbars [6] and its application to hybrid busbars is only feasible for thin connections due
4
to the high energy input that is needed to compensate the high thermal conductivities of
copper and aluminium.
Self-pierce riveting (Figure 1e) is a joining by forming process that makes use of a semi-
tubular rivet to produce a prevailing form-fit mechanical interlocking between the copper
and aluminium sheets. The process is carried out at room temperature and avoids the
metallurgical problems that are inherent to other previously mentioned processes such as
laser beam welding, friction stir spot welding, and resistance welding. However, its
application to hybrid busbars is limited by the total sheet thickness of the joints (usually
between 1.5 and 4 mm) and by the necessity of placing the thinner or softer sheet on the
rivet side [7].
Resort to clinching as an alternative joining by forming process to assemble hybrid busbars
avoids the use of semi-tubular rivets made from less electric conductive materials and
benefits from the cleansing effect of the surfaces due to relative movement of the joining
partners during assembly [8]. However, its use is also limited to small sheet thicknesses.
Fastening (Figure 1f) is the most widespread technology to assemble busbars because the
resulting joints are easy to assemble and disassemble during installation, maintenance, and
removal at the end of service life. The main disadvantages of fastening are the non-uniform
contact pressures, the condition of the surfaces and the unintentional self-loosening, which
cause distortion of the electric current flow [9, 10]. The influence of chemical reactions,
contaminant films and temperature on clamping force reduction during long-term service
life of busbars must also be taken into consideration when designing fastened joints [11].
Still, several electric vehicles such as the Nissan Leaf and the Toyota Prius make use of
fastened joints.
This paper is focused on fastened hybrid busbars made from copper and aluminium with
the purpose of analysing the influence of their main components and process parameters
on the electric current flow and electric resistance of the joints. The methodology combines
experimentation in unit cells that are representative of fastened hybrid busbars joints and
5
numerical simulation using the electro-mechanical capabilities of an in-house finite element
computer program developed by the authors. The presentation provides a new level of
understanding on the influence of the bolts, tightening torque, contact pressure and sheet
surface condition on the electric resistance of fastened hybrid busbars and quantifies how
far their performance is from that of an ideal hybrid busbar with perfect contact and no
contaminant and oxide film on the copper-aluminium interface. Design guidelines are given
for dimensioning the cross sections of the copper and aluminium sheets and for effectively
distributing the bolts across the contact sheet surfaces.
2. METHODSANDPROCEDURES
2.1 Mechanicalandelectricalcharacterizationofmaterials
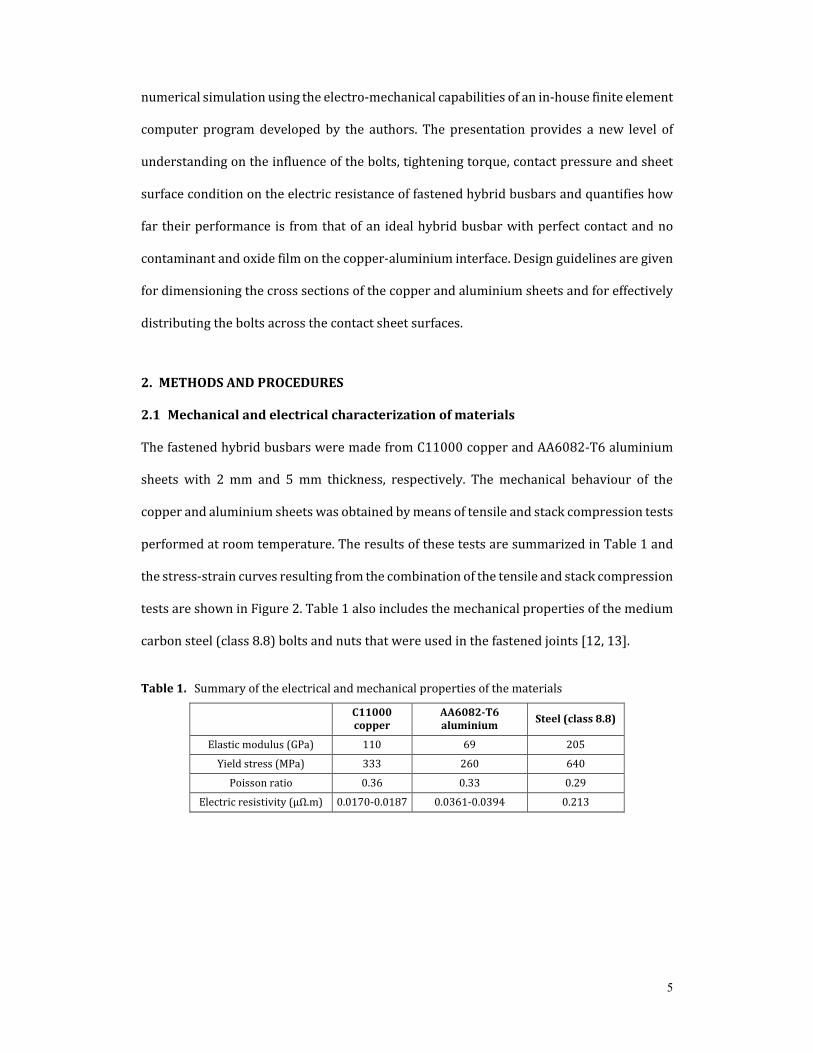
The fastened hybrid busbars were made from C11000 copper and AA6082-T6 aluminium
sheets with 2 mm and 5 mm thickness, respectively. The mechanical behaviour of the
copper and aluminium sheets was obtained by means of tensile and stack compression tests
performed at room temperature. The results of these tests are summarized in Table 1 and
the stress-strain curves resulting from the combination of the tensile and stack compression
tests are shown in Figure 2. Table 1 also includes the mechanical properties of the medium
carbon steel (class 8.8) bolts and nuts that were used in the fastened joints [12, 13].
Table1. Summary of the electrical and mechanical properties of the materials
C11000copper
AA6082‐T6aluminium Steel(class8.8)
Elastic modulus (GPa) 110 69 205
Yield stress (MPa) 333 260 640
Poisson ratio 0.36 0.33 0.29
Electric resistivity (μΩ.m) 0.0170-0.0187 0.0361-0.0394 0.213
6
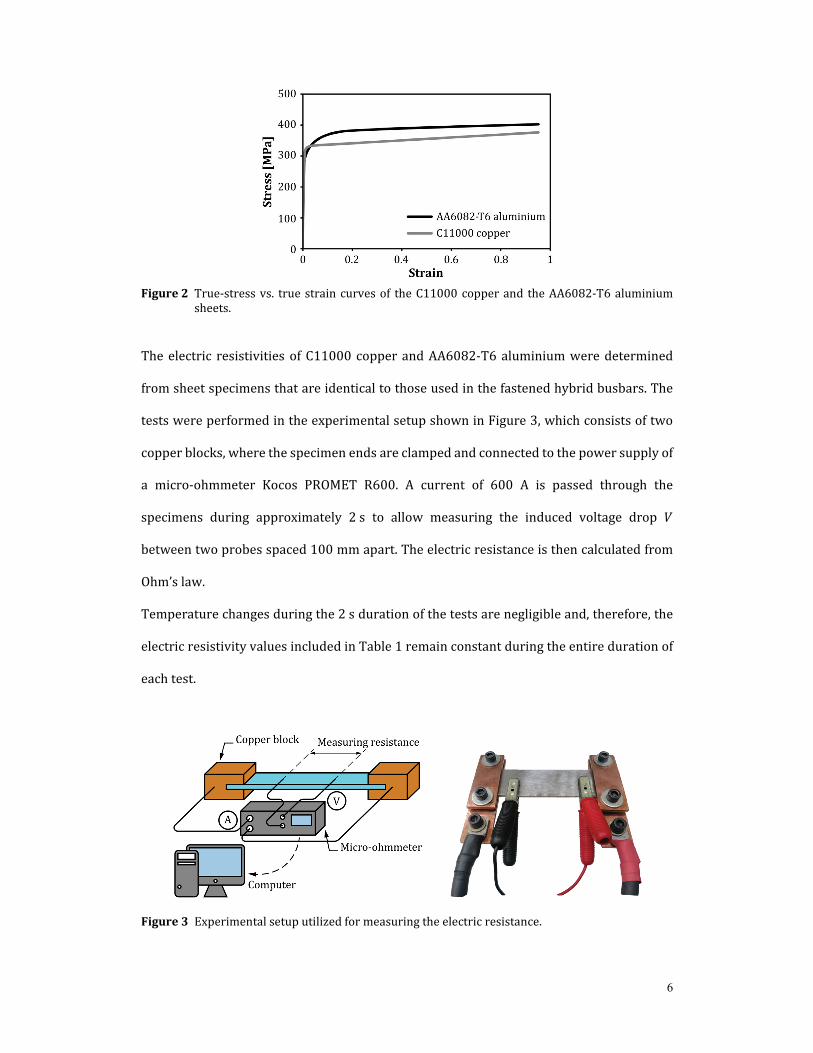
Figure2 True-stress vs. true strain curves of the C11000 copper and the AA6082-T6 aluminium sheets.
The electric resistivities of C11000 copper and AA6082-T6 aluminium were determined
from sheet specimens that are identical to those used in the fastened hybrid busbars. The
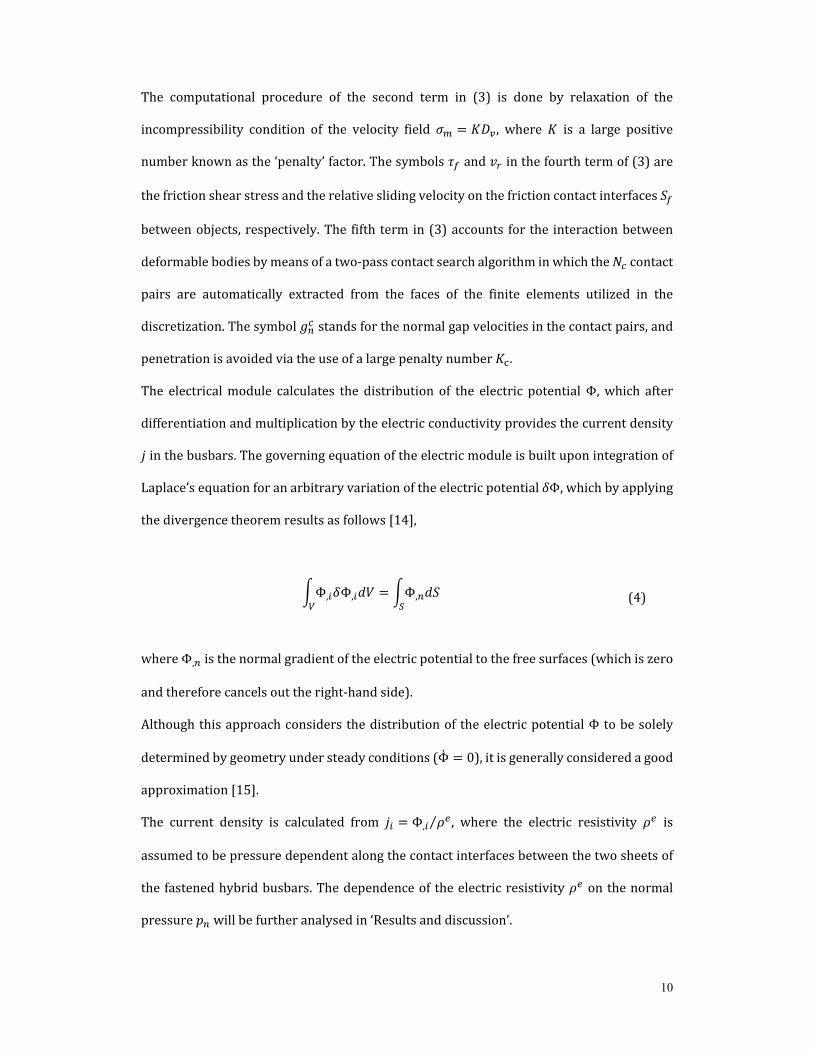
tests were performed in the experimental setup shown in Figure 3, which consists of two
copper blocks, where the specimen ends are clamped and connected to the power supply of
a micro-ohmmeter Kocos PROMET R600. A current of 600 A is passed through the
specimens during approximately 2 s to allow measuring the induced voltage drop 𝑉
between two probes spaced 100 mm apart. The electric resistance is then calculated from
Ohm’s law.
Temperature changes during the 2 s duration of the tests are negligible and, therefore, the
electric resistivity values included in Table 1 remain constant during the entire duration of
each test.
Figure3 Experimental setup utilized for measuring the electric resistance.

7
2.2 Designandtestingoffastenedhybridbusbars
The tests were performed in unit cells that are representative of the fastened hybrid busbar
joints. The unit cells consisted of two partial overlapped sheets made from C11000 copper
and AA6082-T6 aluminium and one M8 hexagonal socket head bolt-nut pair made from
medium carbon steel (class 8.8).
The design of the unit cells required the thicknesses of the copper and aluminium sheets to
account for the differences in the electric resistivity 𝜌 of the two materials (Table 1). This
is favourable to keep a uniform potential gradient along the hybrid busbar. To achieve this,
the authors considered the electric conductance 𝐺 of a sheet to be proportional to its cross-
sectional area 𝐴 and inverse proportional to its electric resistivity 𝜌 and length 𝑙, and
obtained the following relation between the cross-sectional area ratio and the electric
resistivity ratio of the two sheets,
𝐺𝐴𝜌 𝑙
→ 𝐴𝐴𝑙𝐴𝐶𝑢
𝜌𝐴𝑙𝑒
𝜌𝐶𝑢𝑒 2.3 (1)
The result obtained in (1) corresponds to the highest values calculated from the
experimentally measured electric resistivity values that are included in Table 1.
Under these circumstances and considering that the unit cells were designed with a
constant width of 𝑤=50 mm, it follows that the utilization of C11000 copper and AA6082-
T6 aluminium commercial sheets with 2 and 5 mm thickness will satisfy (from a practical
point of view) the cross-sectional area ratio given by (1).
The unit cells were assembled by drilling through holes of 8.4 mm diameter in the copper
and aluminium sheets to allow the utilization of the M8 hexagonal socket head bolts. Before
clamping the two sheets together by applying a tightening torque 𝑇 on the bolt, the surfaces
of the sheets were prepared by mechanical grinding with emery paper (Figure 4).

8
Figure4 Schematic representation of the procedure utilized for assembling the unit cells of the fastened hybrid busbars with a photograph of a test specimen.
The electric resistance of the unit cells was determined in the experimental setup that had
been previously used to determine the electric resistivities of the copper and aluminium
sheets (Figure 3). A similar procedure based on a 600 A current passing through the
specimens during approximately 2 s was utilized for measuring the voltage drop 𝑉 and
calculate the electric resistance.
Table 2 summarizes the experimental testing plan and its subdivision into two groups as a
function of the sheet surface conditions and tightening torques applied on the bolts. The
first group consists of unit cells in which the sheets were subjected to different surface
preparations ranging from the as supplied condition to grinding with emery paper of
different grit sizes. A constant tightening torque of 20 Nm was applied in the bolts.
The second group was carried out in unit cells subjected to tightening torques varying from
1 Nm (near loosening condition) to 30 Nm. All the sheets were ground with emery paper of
80 grit size. At least 10-unit cell samples were examined for each testing condition.
The results obtained from additional unit cells fabricated by friction stir spot welding of
sheets ground with emery paper of 80 grit size are included in the presentation for
reference purposes.
Table2. Summary of the fabrication and testing conditions of the fastened hybrid busbars
Torque𝑇 (Nm) Surfacepreparation(emerypapergritsize)
Group1 20 40, 60, 80, 220, 400, 800, 1200, As supplied
Group2 1, 2, 3, 4, 5, 10, 15, 20, 25, 30 80

9
2.3 Numericalmodellingoffastenedhybridbusbars
The finite element computer program i-form was utilized to simulate the electro-
mechanical behaviour of the unit cells of the fastened hybrid busbars. The program was
developed by the authors [14] and is based in a staggered coupling between the mechanical
and electric modules in which the electric current density and electric resistivity are
calculated.
The mechanical module of i-form allows modelling the tightening torque imposed on the
bolts and obtaining a prediction on the overall deformation of the unit cells and distribution
of the major field variables such as the strains and stresses. The distribution of pressure in
the contact areas between the two sheets is also determined due to its relevance for the
calculations to be performed in the electric module.
The mechanical module is built upon the finite element flow formulation, which is based on
the following weak variational form of the quasi-static equilibrium equations [15],
𝜎 𝛿𝐷 𝑑𝑉 𝑡 𝛿𝑣 𝑑𝑆 0 (2)
In the above equation 𝜎 is the Cauchy stress tensor, 𝐷 is the rate of deformation tensor,
𝑡 denotes the tractions applied on the boundary 𝑆 , and 𝛿𝑣 is an arbitrary variation in the
velocity because the flow formulation is written in terms of velocities.
Decomposition of the Cauchy stress tensor 𝜎 into a deviatoric tensor 𝜎′ related to shape
changes and a hydrostatic tensor 𝜎 𝜎 3⁄ related to volume changes, and inclusion of
contact and friction between objects, allow rewriting (2) as follows,
𝜎 ′ 𝛿𝐷 𝑑𝑉 𝜎 𝛿𝐷 𝑑𝑉 𝑡 𝛿𝑣 𝑑𝑆 𝜏 𝛿𝑣| |
𝑑𝑆 𝐾 𝑔 𝛿𝑔 0 (3)
where the symbol 𝐷 𝛿 𝐷 is the volumetric rate of deformation.
10
The computational procedure of the second term in (3) is done by relaxation of the
incompressibility condition of the velocity field 𝜎 𝐾𝐷 , where 𝐾 is a large positive
number known as the ‘penalty’ factor. The symbols 𝜏 and 𝑣 in the fourth term of (3) are
the friction shear stress and the relative sliding velocity on the friction contact interfaces 𝑆
between objects, respectively. The fifth term in (3) accounts for the interaction between
deformable bodies by means of a two-pass contact search algorithm in which the 𝑁 contact
pairs are automatically extracted from the faces of the finite elements utilized in the
discretization. The symbol 𝑔 stands for the normal gap velocities in the contact pairs, and
penetration is avoided via the use of a large penalty number 𝐾 .
The electrical module calculates the distribution of the electric potential Φ, which after
differentiation and multiplication by the electric conductivity provides the current density
𝑗 in the busbars. The governing equation of the electric module is built upon integration of
Laplace’s equation for an arbitrary variation of the electric potential 𝛿Φ, which by applying
the divergence theorem results as follows [14],
Φ, 𝛿Φ, 𝑑𝑉 Φ, 𝑑𝑆 (4)
where Φ, is the normal gradient of the electric potential to the free surfaces (which is zero
and therefore cancels out the right-hand side).
Although this approach considers the distribution of the electric potential Φ to be solely
determined by geometry under steady conditions (Φ 0), it is generally considered a good
approximation [15].
The current density is calculated from 𝑗 Φ, 𝜌⁄ , where the electric resistivity 𝜌 is
assumed to be pressure dependent along the contact interfaces between the two sheets of
the fastened hybrid busbars. The dependence of the electric resistivity 𝜌 on the normal
pressure 𝑝 will be further analysed in ‘Results and discussion’.
11
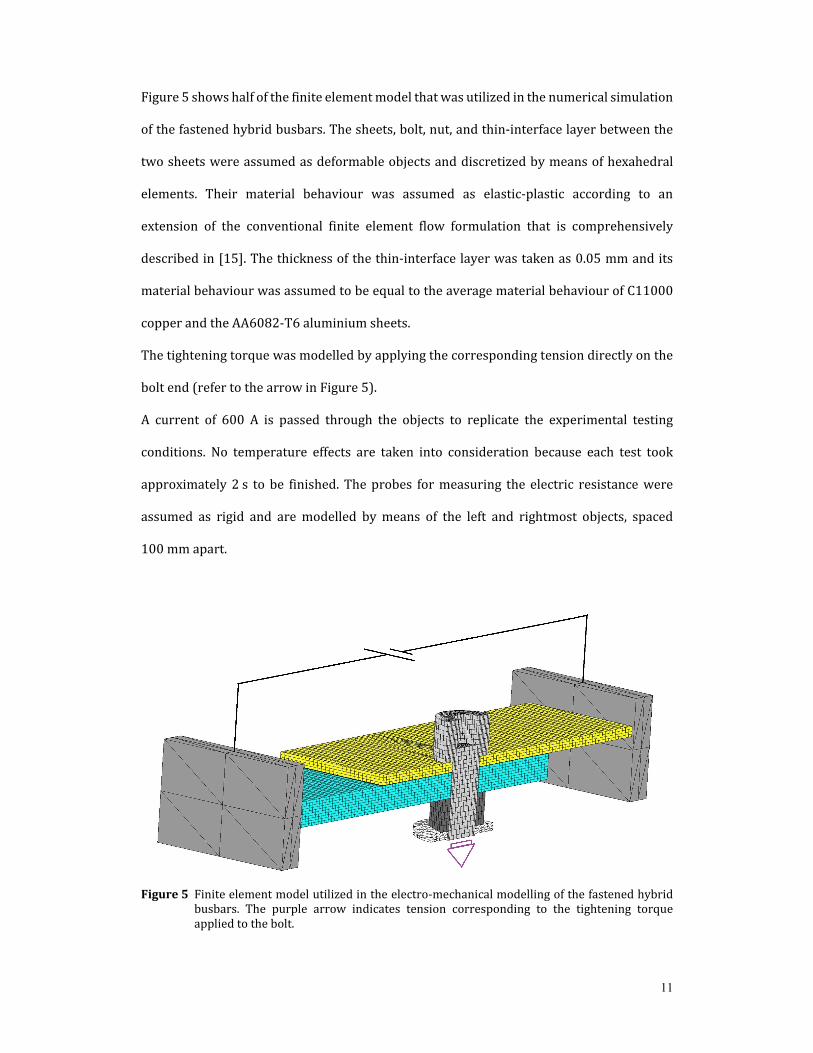
Figure 5 shows half of the finite element model that was utilized in the numerical simulation
of the fastened hybrid busbars. The sheets, bolt, nut, and thin-interface layer between the
two sheets were assumed as deformable objects and discretized by means of hexahedral
elements. Their material behaviour was assumed as elastic-plastic according to an
extension of the conventional finite element flow formulation that is comprehensively
described in [15]. The thickness of the thin-interface layer was taken as 0.05 mm and its
material behaviour was assumed to be equal to the average material behaviour of C11000
copper and the AA6082-T6 aluminium sheets.
The tightening torque was modelled by applying the corresponding tension directly on the
bolt end (refer to the arrow in Figure 5).
A current of 600 A is passed through the objects to replicate the experimental testing
conditions. No temperature effects are taken into consideration because each test took
approximately 2 s to be finished. The probes for measuring the electric resistance were
assumed as rigid and are modelled by means of the left and rightmost objects, spaced
100 mm apart.
Figure5 Finite element model utilized in the electro-mechanical modelling of the fastened hybrid
busbars. The purple arrow indicates tension corresponding to the tightening torque applied to the bolt.
12
3. RESULTSANDDISCUSSION
3.1 Surfacecondition
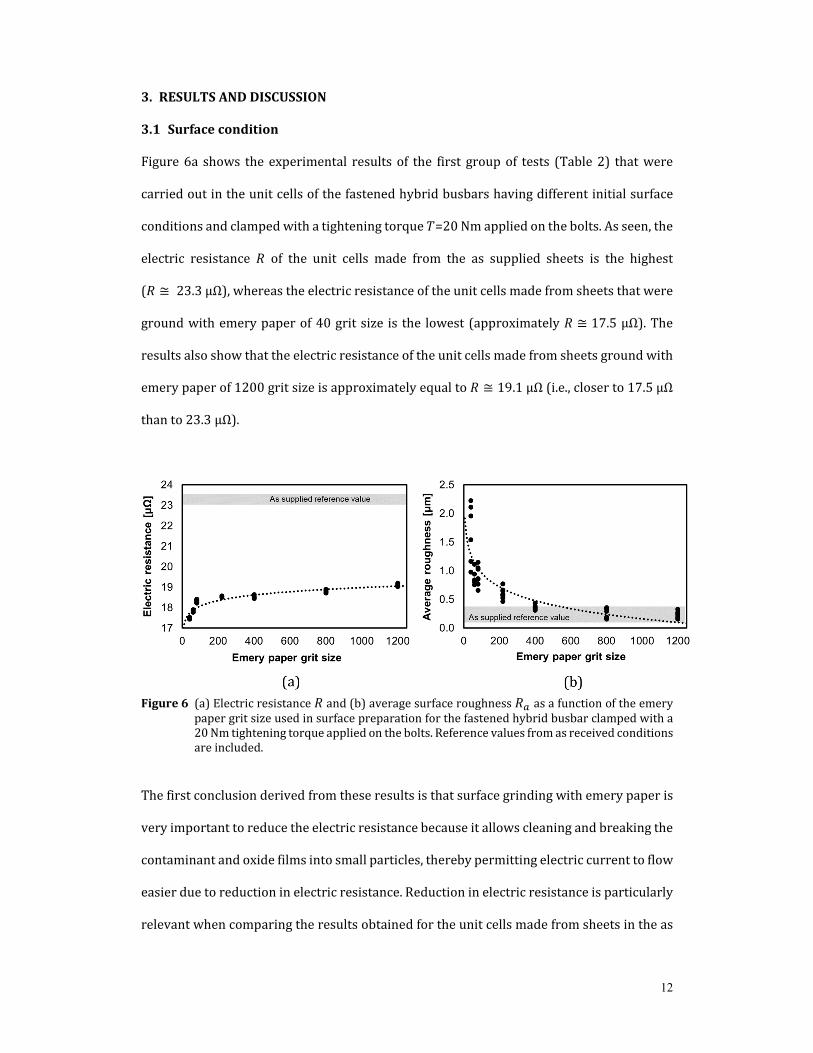
Figure 6a shows the experimental results of the first group of tests (Table 2) that were
carried out in the unit cells of the fastened hybrid busbars having different initial surface
conditions and clamped with a tightening torque 𝑇=20 Nm applied on the bolts. As seen, the
electric resistance 𝑅 of the unit cells made from the as supplied sheets is the highest
(𝑅 ≅ 23.3 μΩ), whereas the electric resistance of the unit cells made from sheets that were
ground with emery paper of 40 grit size is the lowest (approximately 𝑅 ≅ 17.5 μΩ). The
results also show that the electric resistance of the unit cells made from sheets ground with
emery paper of 1200 grit size is approximately equal to 𝑅 ≅ 19.1 μΩ (i.e., closer to 17.5 μΩ
than to 23.3 μΩ).
Figure6 (a) Electric resistance 𝑅 and (b) average surface roughness 𝑅 as a function of the emery
paper grit size used in surface preparation for the fastened hybrid busbar clamped with a 20 Nm tightening torque applied on the bolts. Reference values from as received conditions are included.
The first conclusion derived from these results is that surface grinding with emery paper is
very important to reduce the electric resistance because it allows cleaning and breaking the
contaminant and oxide films into small particles, thereby permitting electric current to flow
easier due to reduction in electric resistance. Reduction in electric resistance is particularly
relevant when comparing the results obtained for the unit cells made from sheets in the as
13
supplied condition (𝑅 23.3 μΩ) against those obtained from sheets that were ground with
emery paper of different grit sizes (17.5 𝑅 19.1 μΩ).
Figure 6b shows the average surface roughness 𝑅 of the initial sheet surfaces after different
emery paper grinding conditions. As expected, the lowest average surface roughness
𝑅 0.19 μm is obtained for the as supplied sheets while the highest 𝑅 1.27 μm was
obtained for the sheets whose surfaces were prepared with emery paper of 40 grit size so
that grinding marks (asperities) and directions are clearly visible.
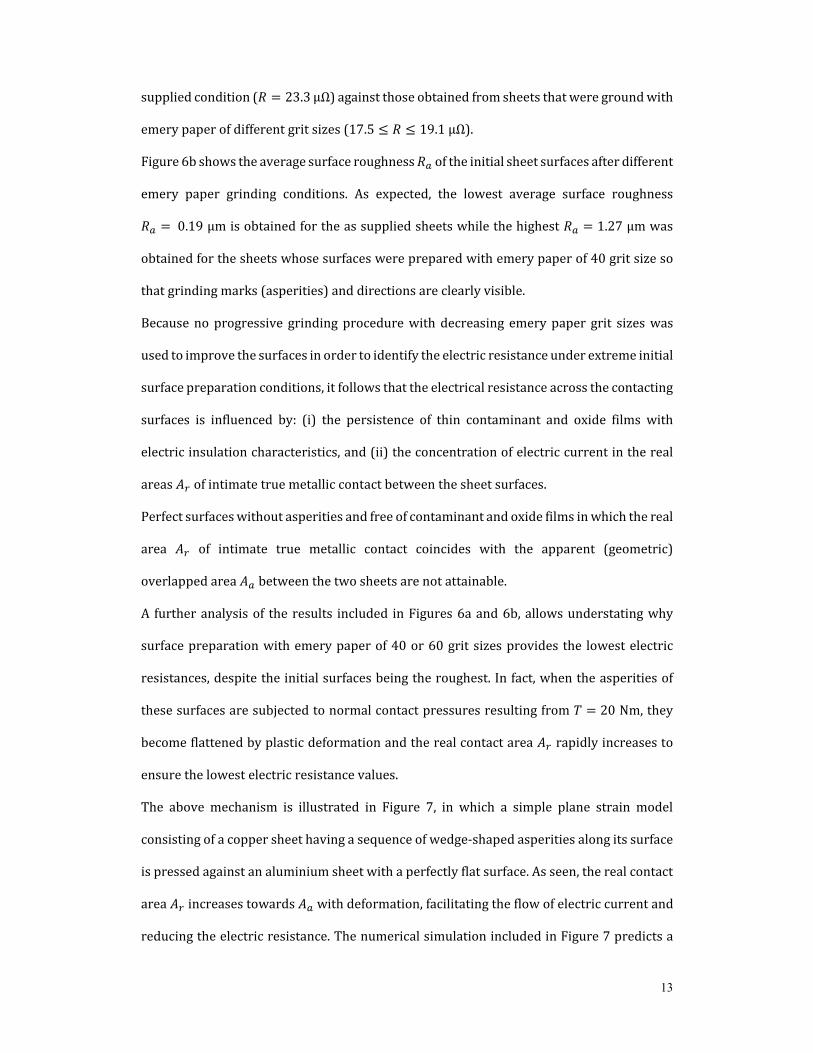
Because no progressive grinding procedure with decreasing emery paper grit sizes was
used to improve the surfaces in order to identify the electric resistance under extreme initial
surface preparation conditions, it follows that the electrical resistance across the contacting
surfaces is influenced by: (i) the persistence of thin contaminant and oxide films with
electric insulation characteristics, and (ii) the concentration of electric current in the real
areas 𝐴 of intimate true metallic contact between the sheet surfaces.
Perfect surfaces without asperities and free of contaminant and oxide films in which the real
area 𝐴 of intimate true metallic contact coincides with the apparent (geometric)
overlapped area 𝐴 between the two sheets are not attainable.
A further analysis of the results included in Figures 6a and 6b, allows understating why
surface preparation with emery paper of 40 or 60 grit sizes provides the lowest electric
resistances, despite the initial surfaces being the roughest. In fact, when the asperities of
these surfaces are subjected to normal contact pressures resulting from 𝑇 20 Nm, they
become flattened by plastic deformation and the real contact area 𝐴 rapidly increases to
ensure the lowest electric resistance values.
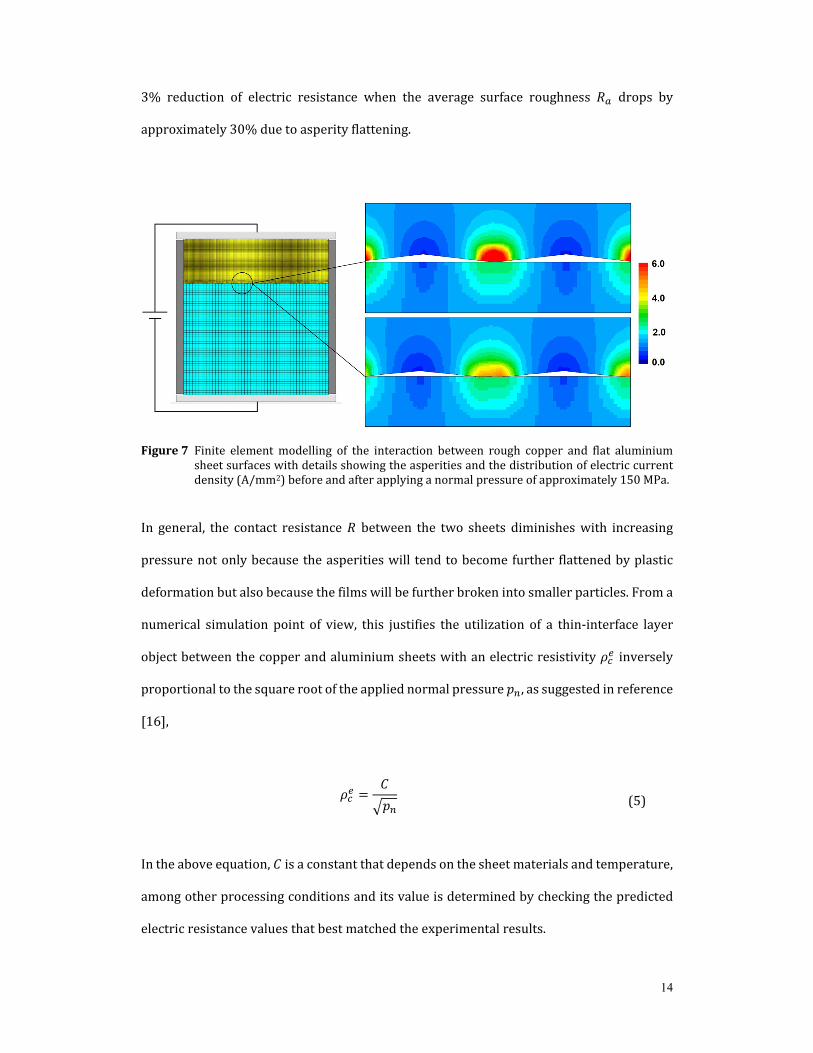
The above mechanism is illustrated in Figure 7, in which a simple plane strain model
consisting of a copper sheet having a sequence of wedge-shaped asperities along its surface
is pressed against an aluminium sheet with a perfectly flat surface. As seen, the real contact
area 𝐴 increases towards 𝐴 with deformation, facilitating the flow of electric current and
reducing the electric resistance. The numerical simulation included in Figure 7 predicts a
14
3% reduction of electric resistance when the average surface roughness 𝑅 drops by
approximately 30% due to asperity flattening.
Figure7 Finite element modelling of the interaction between rough copper and flat aluminium sheet surfaces with details showing the asperities and the distribution of electric current density (A/mm2) before and after applying a normal pressure of approximately 150 MPa.
In general, the contact resistance 𝑅 between the two sheets diminishes with increasing
pressure not only because the asperities will tend to become further flattened by plastic
deformation but also because the films will be further broken into smaller particles. From a
numerical simulation point of view, this justifies the utilization of a thin-interface layer
object between the copper and aluminium sheets with an electric resistivity 𝜌 inversely
proportional to the square root of the applied normal pressure 𝑝 , as suggested in reference
[16],
𝜌𝐶
𝑝 (5)
In the above equation, 𝐶 is a constant that depends on the sheet materials and temperature,
among other processing conditions and its value is determined by checking the predicted
electric resistance values that best matched the experimental results.
15
This model of electric resistivity dependence of normal pressure with a value of
𝐶 275 μΩ.m was utilized in the finite element analysis that will be presented in the
following section of the paper.
3.2 Torque
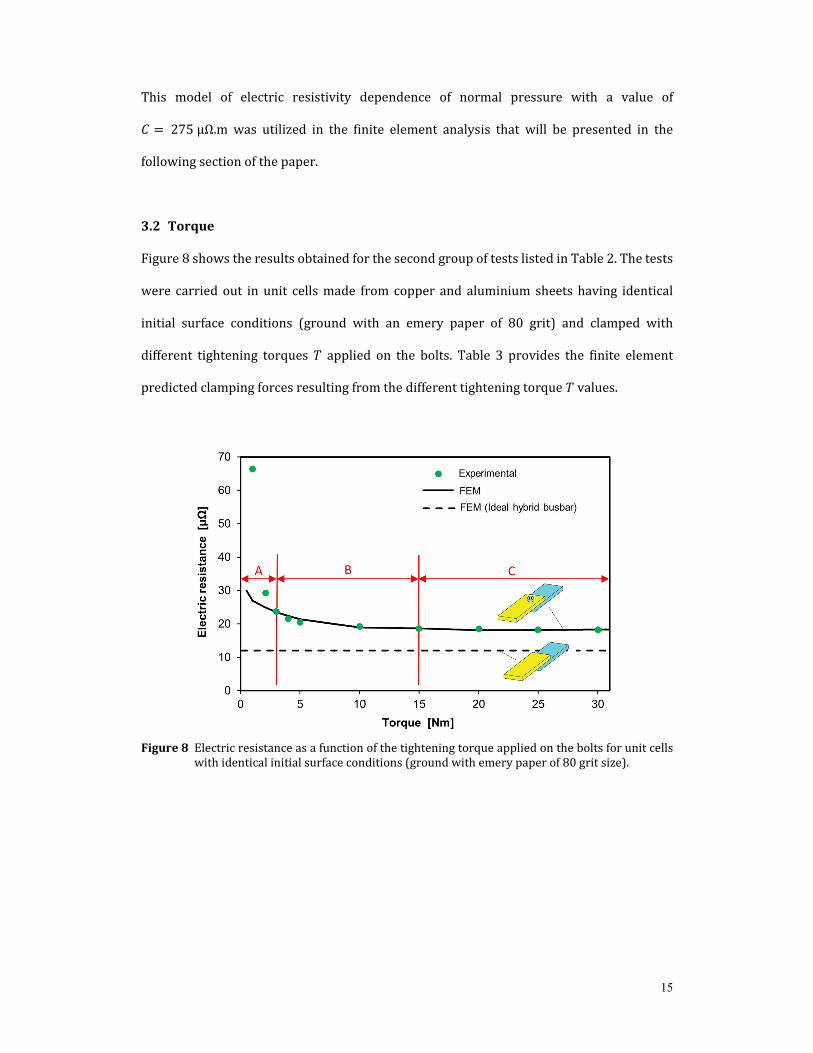
Figure 8 shows the results obtained for the second group of tests listed in Table 2. The tests
were carried out in unit cells made from copper and aluminium sheets having identical
initial surface conditions (ground with an emery paper of 80 grit) and clamped with
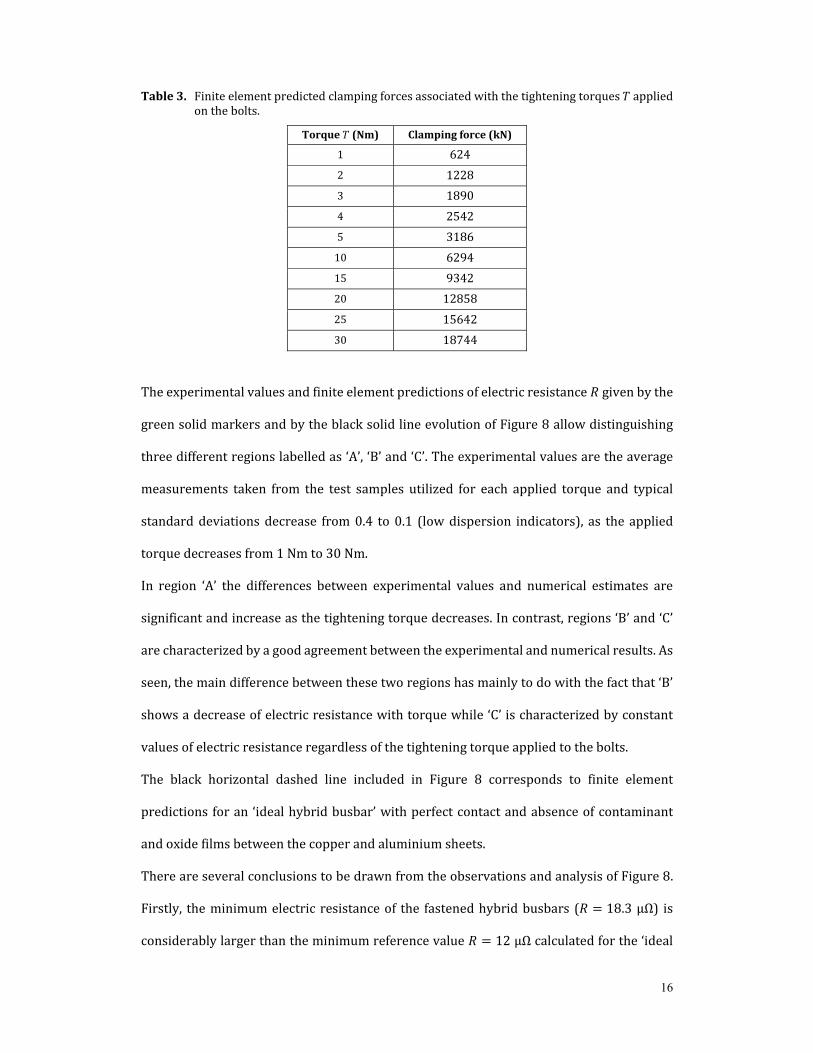
different tightening torques 𝑇 applied on the bolts. Table 3 provides the finite element
predicted clamping forces resulting from the different tightening torque 𝑇 values.
Figure8 Electric resistance as a function of the tightening torque applied on the bolts for unit cells
with identical initial surface conditions (ground with emery paper of 80 grit size).
16
Table3. Finite element predicted clamping forces associated with the tightening torques 𝑇 applied on the bolts.
Torque𝑇 (Nm) Clampingforce(kN)
1 624
2 1228
3 1890
4 2542
5 3186
10 6294
15 9342
20 12858
25 15642
30 18744
The experimental values and finite element predictions of electric resistance 𝑅 given by the
green solid markers and by the black solid line evolution of Figure 8 allow distinguishing
three different regions labelled as ‘A’, ‘B’ and ‘C’. The experimental values are the average
measurements taken from the test samples utilized for each applied torque and typical
standard deviations decrease from 0.4 to 0.1 (low dispersion indicators), as the applied
torque decreases from 1 Nm to 30 Nm.
In region ‘A’ the differences between experimental values and numerical estimates are
significant and increase as the tightening torque decreases. In contrast, regions ‘B’ and ‘C’
are characterized by a good agreement between the experimental and numerical results. As
seen, the main difference between these two regions has mainly to do with the fact that ‘B’
shows a decrease of electric resistance with torque while ‘C’ is characterized by constant
values of electric resistance regardless of the tightening torque applied to the bolts.
The black horizontal dashed line included in Figure 8 corresponds to finite element
predictions for an ‘ideal hybrid busbar’ with perfect contact and absence of contaminant
and oxide films between the copper and aluminium sheets.
There are several conclusions to be drawn from the observations and analysis of Figure 8.
Firstly, the minimum electric resistance of the fastened hybrid busbars (𝑅 18.3 μΩ) is
considerably larger than the minimum reference value 𝑅 12 μΩ calculated for the ‘ideal
17
hybrid busbar’. Consequently, the ∆𝑅 6.3 μΩ difference between the fastened and the
ideal hybrid busbars suggests that there is room to use and/or develop new joining
processes that are electrically more efficient than fastening.
Secondly, it must be remembered that the finite element model utilized by the authors
(Section 2.3) accounts for the radial clearance between the bolt and the through holes
drilled in both sheets but assumes perfect contact and complete absence of films across the
bolt head-copper sheet and the nut-aluminium sheet contact interfaces. Under these
circumstances, the transition from region ‘A’ to ‘B’ in Figure 8 (refer to the solid line
evolutions) must correspond to a tightening torque (𝑇 ≅ 3 Nm) above which the asperities
are sufficiently flattened out and the films are broken enough across the bolt head-copper
sheet and the nut-aluminium sheet contact surfaces.
Tightening torques 𝑇 3 Nm are greatly influenced by the asperities and surface films
existing on the above-mentioned contact surfaces and, therefore, justify the differences
between the experimental values and the finite element predictions. Moreover, when the
tightening torques are small and the films across the contact layer between the two sheets
are mostly intact (providing electric insulation), the passage of current is mainly done
through the bolt head-copper and the nut-aluminium contact surfaces (i.e. using the bolt-
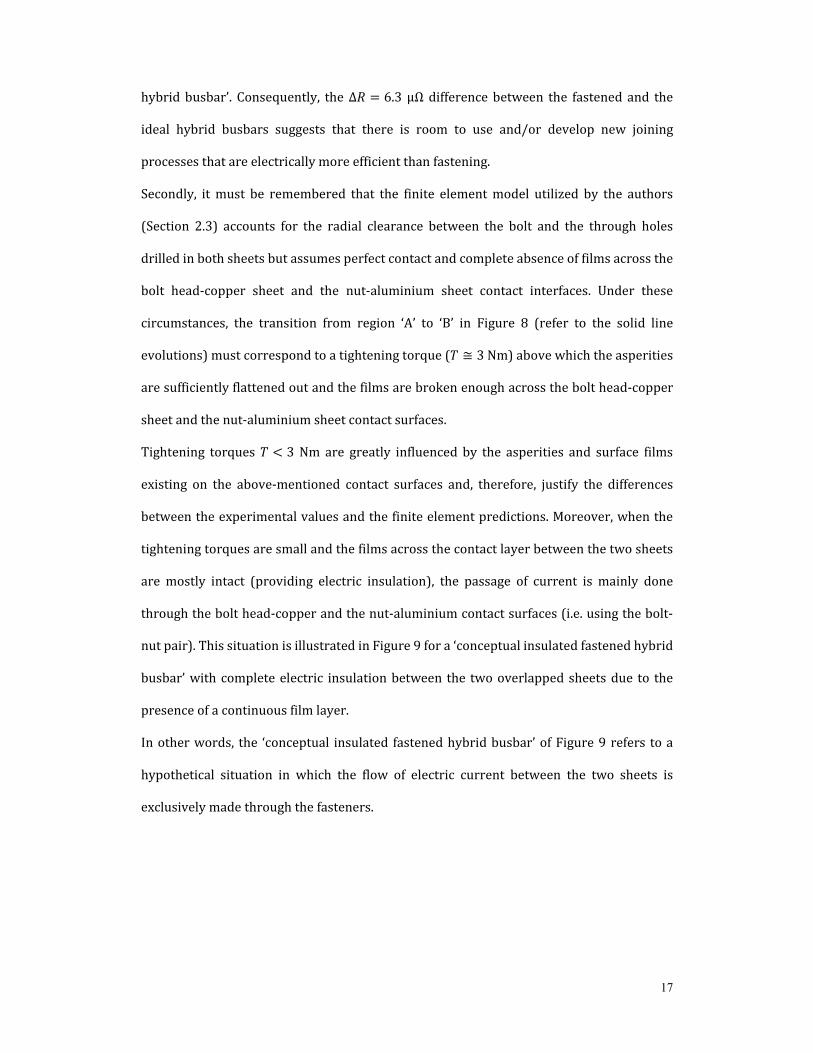
nut pair). This situation is illustrated in Figure 9 for a ‘conceptual insulated fastened hybrid
busbar’ with complete electric insulation between the two overlapped sheets due to the
presence of a continuous film layer.
In other words, the ‘conceptual insulated fastened hybrid busbar’ of Figure 9 refers to a
hypothetical situation in which the flow of electric current between the two sheets is
exclusively made through the fasteners.
18
Figure9 Finite element predicted distribution of electric current density in the ‘conceptual
insulated fastened hybrid busbar’. Note: the black solid line indicates the flow of electric current across the bolt and nut.
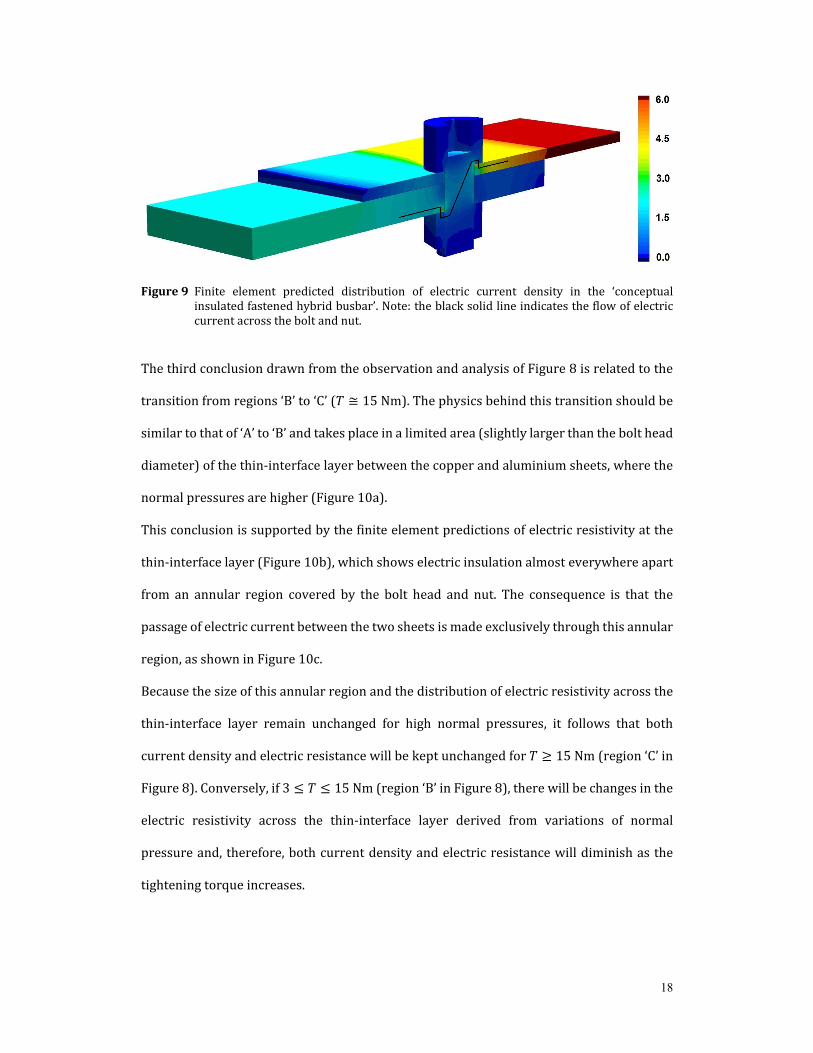
The third conclusion drawn from the observation and analysis of Figure 8 is related to the
transition from regions ‘B’ to ‘C’ (𝑇 ≅ 15 Nm). The physics behind this transition should be
similar to that of ‘A’ to ‘B’ and takes place in a limited area (slightly larger than the bolt head
diameter) of the thin-interface layer between the copper and aluminium sheets, where the
normal pressures are higher (Figure 10a).
This conclusion is supported by the finite element predictions of electric resistivity at the
thin-interface layer (Figure 10b), which shows electric insulation almost everywhere apart
from an annular region covered by the bolt head and nut. The consequence is that the
passage of electric current between the two sheets is made exclusively through this annular
region, as shown in Figure 10c.
Because the size of this annular region and the distribution of electric resistivity across the
thin-interface layer remain unchanged for high normal pressures, it follows that both
current density and electric resistance will be kept unchanged for 𝑇 15 Nm (region ‘C’ in
Figure 8). Conversely, if 3 𝑇 15 Nm (region ‘B’ in Figure 8), there will be changes in the
electric resistivity across the thin-interface layer derived from variations of normal
pressure and, therefore, both current density and electric resistance will diminish as the
tightening torque increases.
19
Figure10 Finite element analysis of the fastened hybrid busbars (𝑇 25 Nm) showing: (a) the
distribution of the vertical stress component (MPa), (b) the distribution of electric resistivity (μΩm) at the thin-interface layer and (c) the distribution of electric current density (A/mm2).
The increase in the number of fasteners (bolt-nut pairs) per overlapped area will increase
the number of annular regions across the thin-interface layer and, therefore, will help
decreasing the overall electric resistance towards the performance of the ‘ideal hybrid
busbar’. Design rules for distributing fasteners across the overlapped sheet surfaces must
ensure they are separated apart to prevent superposition between the above-mentioned
annular regions.
20
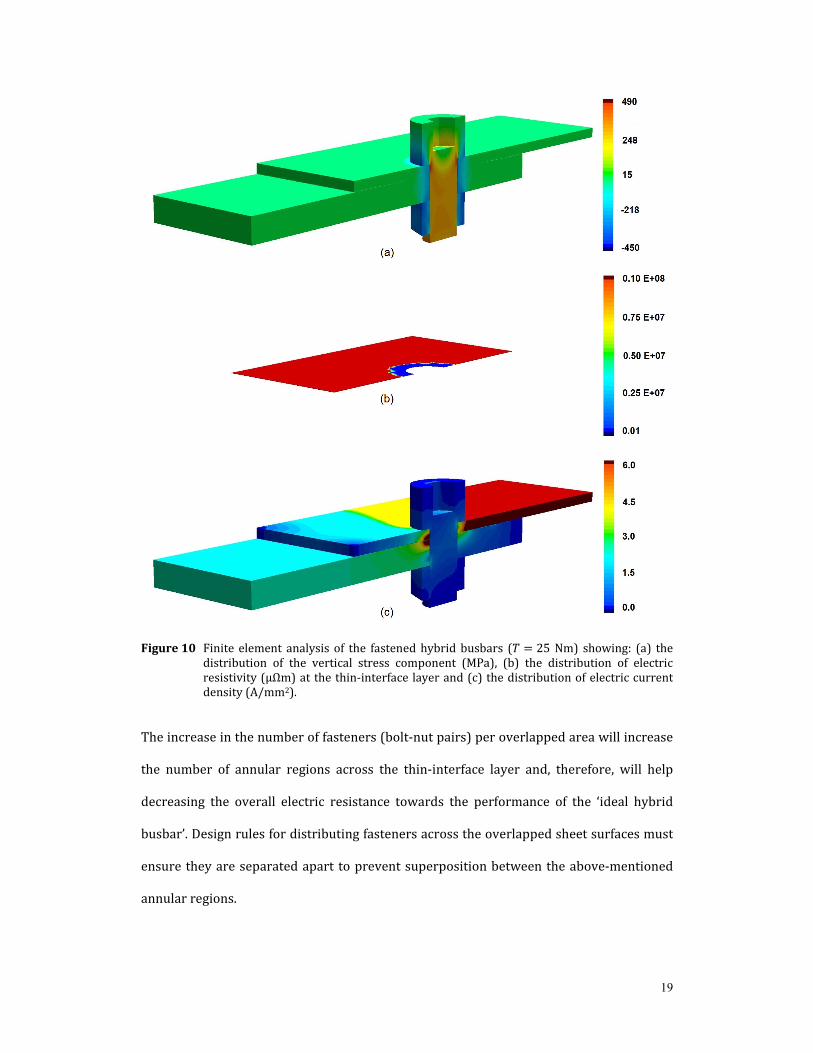
Figure 11 shows three different fastened hybrid busbars with one, two and four bolt-nut
pairs in conjunction with information on the experimentally measured values of electric
resistance. As seen, there is a decrease from 𝑅 18.3 μΩ to 𝑅 16.4 μΩ or 𝑅 14.7 μΩ
when the number of fasteners increases from one to two or four, respectively. However, this
gain in electric performance comes with the price of increasing the weight by 9.5% or 27.4%
when using two or four bolt-nut pairs.
Figure11 Fastened hybrid busbars with (a) one, (b) two and (c) four fasteners (bolt-nut pairs).
Finally, by combining all the results shown in Figures 9 to 11, it can be concluded that in
case of real fastened hybrid busbars, the electric resistivity of the bolt-nut pairs is not very
important because the electric current mainly flows through the annular regions of the thin-
interface layers between the two sheets.
3.4 Frictionstirspotwelding
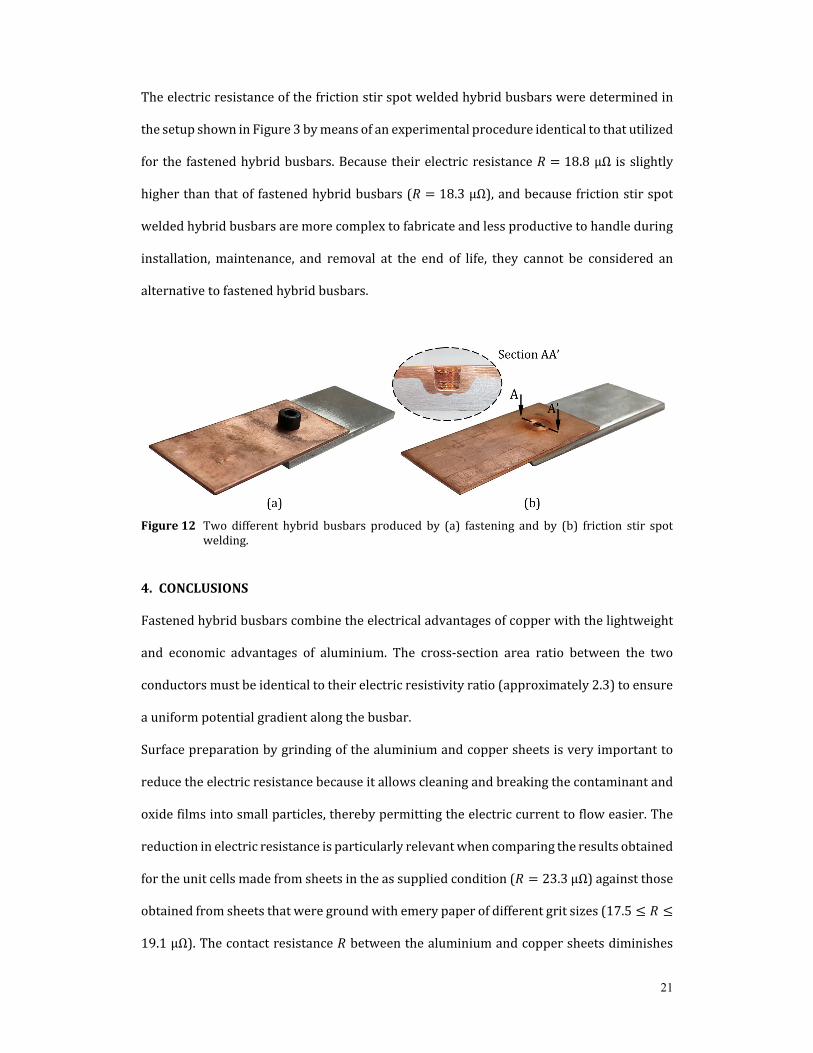
Figure 12 shows a unit cell of a fastened hybrid busbar next to another that was fabricated
by friction stir spot welding (FSSW). The friction stir spot welded hybrid busbars were
fabricated in an ESAB Legio FSW3U machine using a tool with a shoulder diameter of 16 mm
and a taper cylindrical pin with 5 mm of diameter, subjected to a rotational tool speed of
600 rpm, a plunge speed of 6 mm/min and a dwell time of 30 s.
21
The electric resistance of the friction stir spot welded hybrid busbars were determined in
the setup shown in Figure 3 by means of an experimental procedure identical to that utilized
for the fastened hybrid busbars. Because their electric resistance 𝑅 18.8 μΩ is slightly
higher than that of fastened hybrid busbars (𝑅 18.3 μΩ), and because friction stir spot
welded hybrid busbars are more complex to fabricate and less productive to handle during
installation, maintenance, and removal at the end of life, they cannot be considered an
alternative to fastened hybrid busbars.
Figure12 Two different hybrid busbars produced by (a) fastening and by (b) friction stir spot
welding.
4. CONCLUSIONS
Fastened hybrid busbars combine the electrical advantages of copper with the lightweight
and economic advantages of aluminium. The cross-section area ratio between the two
conductors must be identical to their electric resistivity ratio (approximately 2.3) to ensure
a uniform potential gradient along the busbar.
Surface preparation by grinding of the aluminium and copper sheets is very important to
reduce the electric resistance because it allows cleaning and breaking the contaminant and
oxide films into small particles, thereby permitting the electric current to flow easier. The
reduction in electric resistance is particularly relevant when comparing the results obtained
for the unit cells made from sheets in the as supplied condition (𝑅 23.3 μΩ) against those
obtained from sheets that were ground with emery paper of different grit sizes (17.5 𝑅
19.1 μΩ). The contact resistance 𝑅 between the aluminium and copper sheets diminishes
22
with increasing pressure not only because their surface asperities will tend to become
further flattened by plastic deformation but also because the contaminant and oxide films
will be further broken into smaller particles. This explains the reason why the smallest
electric resistances are obtained for tightening torques applied to the bolts greater than
15 Nm. In contrast, very small torques typical of loosening joints may lead to very high
values of electric resistance.
The utilization of more fasteners per overlapped area increases the number of annular
regions across the thin-interface layer through which current flows and, therefore, leads to
a decrease in the overall electric resistance towards that of an ideal hybrid busbar with
perfect contact between the two overlapped sheets. The disadvantage of using more
fasteners is the increase in weight and in the number of protrusions above and below the
sheet surfaces.
ACKNOWLEDGEMENTS
The authors would like to acknowledge the support provided by Fundação para a Ciência e
a Tecnologia of Portugal and IDMEC under LAETA- UIDB/50022/2020 and PTDC/EME-
EME/0949/2020.
REFERENCES
1. Katayama S (2013) Introduction: fundamentals of laser welding. In: (Ed. Katayama S)
Handbook of laser welding technologies. Woodhead Publishing, Cambridge.
2. Auwal, ST, Ramesh, S, Yusof, F, Manladan SM (2018) A review on laser beam welding of
copper alloys. International Journal of Advanced Manufacturing Technology 96: 475–
490 (doi: 10.1007/s00170-017-1566-5)
3. Mubiayia MP, Akinlabia ET, Makhathab ME (2018) Current state of friction stir spot
welding between aluminium and copper. Materials Today: Proceedings 5: 18633–
18640 (doi: 10.1016/j.matpr.2018.06.208)

23
4. Matheny MP, Graff KF (2015) Ultrasonic welding of metals. In: Power ultrasonics:
applications of high-intensity ultrasound, Woodhead Publishing Limited, Cambridge,
259-293 (doi: 10.1016/b978-1-178242-028-6.00011-9)
5. Das A, Li D, Williams D, Greenwood D (2018) Joining technologies for automotive
battery manufacturing, World Electric Vehicle Journal 9: 22
(doi:10.3390/wevj9020022)
6. Brand MJ, Philipp AS, Michael FZ, and Andreas J (2015) Welding techniques for battery
cells and resulting electrical contact resistances, Journal of Energy Storage 1: 7-14. (doi:
10.1016/j.est.2015.04.001).
7. Alves LM, Afonso RM, Pereira PT, Martins PAF (2021) Double-sided self-pierce riveting
of dissimilar materials, International Journal of Advanced Manufacturing Technology
(doi: 10.1007/s00170-021-07426-3)
8. Füssel U, Kalich J (2016) Joining by Forming – Solutions for Multi Material Design, 9th
International Conference on Advances in Resistance Welding, Florida, USA.
9. Harris FW (1913) Eletrical contact resistance. The Electric Journal 10: 637-644.
10. Tzeneva R, Slavtchev Y, Mladenov V (2007) New connection design of high power
bolted busbar connections. Proceedings of the 11th WSEAS International Conference
on Circuits, Greece 228-233.
11. Schlegel S (2011) Langzeitverhalten von Schraubenverbindungen mit Stromschienen
aus Reinkupfer in der Elektroenergietechnik unter besonderer Berücksichtigung der
Temperatur. PhD Dissertation, Technische Universität Dresden, Germany.
12. ISO 898-1:2013 (2013) Mechanical properties of fasteners made of carbon steel and
alloy steel - Part 1: Bolts, screws and studs with specified property classes - Coarse
thread and fine pitch thread.
13. ISO 898-2:2012 (2012) Mechanical properties of fasteners made of carbon steel and
alloy steel - Part 2: Nuts with specified property classes - Coarse thread and fine pitch
thread.
24
14. Nielsen CV, Zhang W, Alves LM, Bay N, Martins PAF (2013) Coupled finite element flow
formulation In: Modelling of thermo-electro-mechanical manufacturing processes with
applications in metal forming and resistance welding, Springer-Verlag, London, (doi:
10.1007/978-1-4471-4643-8_3)
15. Nielsen CV, Martins PAF (2021) Finite element flow formulation In: Metal forming:
formability, simulation and tool design, Academic Press, London. (doi: 10.1016/B978-
0-323-85255-5.00008-X)
16. Studer FJ (1939) Contact resistance in spot welding, Welding Journal 18: 374-380.
Related Documents


