Electric earthquake precursors: from laboratory results to field observations Filippos Vallianatos a, * , Dimos Triantis b , Andreas Tzanis c , Cimon Anastasiadis b , Ilias Stavrakas b a Technological Educational Institute of Crete, Department of Natural Resources and Environment, 3 Romanou Street, Chania, Crete Island 73133, Greece b Technological Educational Institution of Athens, Department of Electronics, Athens, Greece c Department of Geophysics and Geothermy, University of Athens, Athens, Greece Received 6 July 2003; received in revised form 9 December 2003; accepted 16 December 2003 Abstract The generation of transient electric potential prior to rupture has been demonstrated in a number of laboratory experiments involving both dry and wet rock specimens. Several different electrification effects are responsible for these observations, however, piezoelectricity cannot explain why quartz-free rocks can also generate precursory phenomena and electrokinetic phenomena are normally very weak to produce macro- and megascopic scale effects. Electrification is observed in dry, non-piezoelectric rocks meaning that additional, solid state mechanisms should be responsible. Herein we focus on a promising effect that is ubiquitous during brittle rock failure: the motion of charged edge dislocations (MCD) during crack opening and propagation (microfracturing). We report a series of laboratory experiments on dry marble samples and discuss their possible relationship to field observations of purported electric earthquake precursors (EEP). The experiments confirm the generation of pressure-stimulated currents (PSC) as expected by the MCD model. The PSC was linearly related to the stress rate, so long as the stressed material deformed elastically. Deviation from linearity arose when the applied stress drove the specimen into the plastic deformation range; this effect has been attributed to the dependence of the PSC on the stress rate and, ultimately, to the inverse of the changing (decreasing) Young’s modulus. The emitted current appears very intense and non-linear just prior to failure, where massive crack propagation implies massive MCD processes. Repeated cycles of deformation are associated with progressively weaker current emission, indicating the strong dependence of electrification on the residual damage. Overall, the results are consistent with, and render support to the concept of electrification by MCD/microfracturing. Other mechanisms cannot be excluded of course but are rather considered to accompany and supplement the drastic MCD process. The experiments cannot determine whether these process can scale up to earthquake-size volumes but they certainly do not contest the possibility. If so, the origin of the EEP would be massive crack formation and propagation, which in the case of earthquakes is expected to be a short-lived process at the terminal phase of the cycle. Observable macroscopic ULF field would be generated by the superposition of fields generated by multiple simultaneous individual cracks and would evolve in correspondence with the crack propagation process. It is possible to model the evolution of large crack ensembles and assess the expected time functions of transient EEP events: the result is a family of asymmetric-bell shaped time functions that may appear isolated or in groups. The model has been successfully applied to the analysis of real field obser- vations. Ó 2004 Elsevier Ltd. All rights reserved. 1. Introduction Transient electric effects in the lithosphere, purport- edly associated with seismogenetic processes, have been reported and studied for a long time. For instance, comprehensive reviews can be found in Park et al. (1993); Johnston (1997) and Tzanis and Vallianatos (2001), while much additional information exists in the collections edited by Hayakawa and Fujinawa (1994), Hayakawa (1999) and Hayakawa and Molchanov (2002). The field observations instigated research into these effects. The generation of transient electric poten- tial/current during the loading cycle prior to, and con- currently with rupture, has been demonstrated in a number of laboratory experiments involving both dry * Corresponding author. E-mail address: [email protected] (F. Vallianatos). 1474-7065/$ - see front matter Ó 2004 Elsevier Ltd. All rights reserved. doi:10.1016/j.pce.2003.12.003 Physics and Chemistry of the Earth 29 (2004) 339–351 www.elsevier.com/locate/pce

Welcome message from author
This document is posted to help you gain knowledge. Please leave a comment to let me know what you think about it! Share it to your friends and learn new things together.
Transcript
Physics and Chemistry of the Earth 29 (2004) 339–351
www.elsevier.com/locate/pce
Electric earthquake precursors: from laboratory resultsto field observations
Filippos Vallianatos a,*, Dimos Triantis b, Andreas Tzanis c, Cimon Anastasiadis b,Ilias Stavrakas b
a Technological Educational Institute of Crete, Department of Natural Resources and Environment, 3 Romanou Street, Chania,
Crete Island 73133, Greeceb Technological Educational Institution of Athens, Department of Electronics, Athens, Greece
c Department of Geophysics and Geothermy, University of Athens, Athens, Greece
Received 6 July 2003; received in revised form 9 December 2003; accepted 16 December 2003
Abstract
The generation of transient electric potential prior to rupture has been demonstrated in a number of laboratory experiments
involving both dry and wet rock specimens. Several different electrification effects are responsible for these observations, however,
piezoelectricity cannot explain why quartz-free rocks can also generate precursory phenomena and electrokinetic phenomena are
normally very weak to produce macro- and megascopic scale effects. Electrification is observed in dry, non-piezoelectric rocks
meaning that additional, solid state mechanisms should be responsible. Herein we focus on a promising effect that is ubiquitous
during brittle rock failure: the motion of charged edge dislocations (MCD) during crack opening and propagation (microfracturing).
We report a series of laboratory experiments on dry marble samples and discuss their possible relationship to field observations of
purported electric earthquake precursors (EEP). The experiments confirm the generation of pressure-stimulated currents (PSC) as
expected by the MCD model. The PSC was linearly related to the stress rate, so long as the stressed material deformed elastically.
Deviation from linearity arose when the applied stress drove the specimen into the plastic deformation range; this effect has been
attributed to the dependence of the PSC on the stress rate and, ultimately, to the inverse of the changing (decreasing) Young’s
modulus. The emitted current appears very intense and non-linear just prior to failure, where massive crack propagation implies
massive MCD processes. Repeated cycles of deformation are associated with progressively weaker current emission, indicating the
strong dependence of electrification on the residual damage. Overall, the results are consistent with, and render support to the
concept of electrification by MCD/microfracturing. Other mechanisms cannot be excluded of course but are rather considered to
accompany and supplement the drastic MCD process. The experiments cannot determine whether these process can scale up to
earthquake-size volumes but they certainly do not contest the possibility. If so, the origin of the EEP would be massive crack
formation and propagation, which in the case of earthquakes is expected to be a short-lived process at the terminal phase of the
cycle. Observable macroscopic ULF field would be generated by the superposition of fields generated by multiple simultaneous
individual cracks and would evolve in correspondence with the crack propagation process. It is possible to model the evolution of
large crack ensembles and assess the expected time functions of transient EEP events: the result is a family of asymmetric-bell shaped
time functions that may appear isolated or in groups. The model has been successfully applied to the analysis of real field obser-
vations.
� 2004 Elsevier Ltd. All rights reserved.
1. Introduction
Transient electric effects in the lithosphere, purport-
edly associated with seismogenetic processes, have been
reported and studied for a long time. For instance,comprehensive reviews can be found in Park et al.
*Corresponding author.
E-mail address: [email protected] (F. Vallianatos).
1474-7065/$ - see front matter � 2004 Elsevier Ltd. All rights reserved.
doi:10.1016/j.pce.2003.12.003
(1993); Johnston (1997) and Tzanis and Vallianatos
(2001), while much additional information exists in the
collections edited by Hayakawa and Fujinawa (1994),
Hayakawa (1999) and Hayakawa and Molchanov
(2002). The field observations instigated research intothese effects. The generation of transient electric poten-
tial/current during the loading cycle prior to, and con-
currently with rupture, has been demonstrated in a
number of laboratory experiments involving both dry

340 F. Vallianatos et al. / Physics and Chemistry of the Earth 29 (2004) 339–351
and wet rock specimens. Electrification by microfrac-
turing, i.e. the appearance of spontaneous charge pro-
duction and transient electric and electromagnetic
emission associated with the opening of microcracks,
has been discussed by several authors, who also pro-
vided quantitative estimates of charge production and
currents associated with microfracturing. For instance,Warwick et al. (1982), have measured current spikes
from individual microcracks of the order of 10�3 A,
associated with crack opening times of the order of 10�6
s, thus providing a net charge density of 10�3 C/m2. A
similar value of 10�2 C/m2 is reported by Ogawa et al.
(1985), while Enomoto and Hashimoto (1990) measured
a charge production of 10�9 C for cracks with surface of
the order 10�6 m2, thus yielding a charge density of 10�3
C/m2. Other experimenters, (e.g. Fiffolt et al., 1993;
Chen et al., 1994; Enomoto et al., 1994; Hadjicontis and
Mavromatou, 1994, 1996; Yoshida et al., 1994; Yoshida
et al., 1997), observed simultaneous acoustic and E-EM
signals, confirming that electrification effects arise dur-
ing microfracturing. On an even larger scale, Tomizawa
et al. (1994) observed direct ELF/VLF emission from
underground explosions.Although laboratory results are generally affirmative,
there are two cardinal and inter-related problems hin-
dering the compilation of viable, self-consistent theories
of electrical earthquake precursor (EEP) generation and
propagation. First, there is incomplete understanding of
how laboratory results may scale up to the enormous,
heterogeneous rock volumes involved in the preparation
of large earthquakes. Second, the efficiency of the dif-ferent electrification mechanisms is as yet unspecified
and if more than one mechanisms are operative, their
(constructive or destructive) interaction is poorly
understood, as also is their individual contribution to
the total effect. Hitherto theoretical attempts to address
such questions were, usually, generically associated with
some particular mechanism and produced different
source geometries and propagation/decay laws (e.g.Gokhberg et al., 1985; Dobrovolsky et al., 1989; Va-
rotsos et al., 1993; Slifkin, 1993; Bernard and Le Mou€el,1996; Vallianatos and Tzanis, 1999a; Tzanis and Valli-
anatos, 2002).
Electrokinetic effects (EKE), i.e. electrification due to
the flow of water driven through permeable rock by
crustal strain or gravity, have amply been demonstrated
by laboratory experiments (e.g. Morgan et al., 1989, andreferences therein; Jouniaux and Pozzi, 1995a,b, 1997
and references therein). In fact, conditions suitable for
EKE are very plausible, at least in the near-surface parts
of seismogenic zones, and quite consistent with the wet
models of the earthquake preparation process (for in-
stance, the dilatancy-diffusion model of Scholz et al.,
1973). In consequence, the EKE is a frequently quoted
mechanism (e.g. Mizutani et al., 1976; Dobrovolskyet al., 1989; Bernard, 1992; Fenoglio et al., 1995; Ber-
nard and Le Mou€el, 1996; other references therein). In a
recent paper, Yoshida et al. (1998) suggested the EKE as
the prime source of electric potential changes during
microfracturing of saturated sandstone samples.
Unfortunately, EK fields are weak and might be unde-
tectable at long distances, partly because of natural
limitations to the magnitude of the electrokinetic cou-pling coefficient contrasts and pressure differences
necessary to drive strong currents. Laboratory mea-
surements suggest that naturally occurring contrasts
may be quite small, while conductive pore fluids may
inhibit the coefficient and its increase as a function of
permeability (Morgan et al., 1989; Jouniaux and Pozzi,
1995a). Considering also that the average stress drop of
crustal earthquakes is 3 MPa, stress heterogeneities nearactive faults should seldom generate large-scale pressure
differentials, sufficient to drive current with effects ob-
servable faraway from the source (e.g. see Tzanis et al.,
2000). In the immediate vicinity of the fault zone,
however, precursory signals may be caused by acceler-
ating evolution of dilatancy, resulting in (forced) water
flow into the dilatant region (e.g. experiments by Chen
et al., 1994; Yoshida et al., 1998; Gensane et al., 1999;also theoretical models by Fenoglio et al., 1995; Patella
et al., 1997). Still, it is rather difficult to obtain model
potential differences higher than 30 mV above the source
and almost impossible to get observable effects at dis-
tances of a few tens of km.
Piezoelectricity has been considered since the very
early times of earthquake prediction research (e.g. Nit-
san, 1977; Warwick et al., 1982; Yoshida et al., 1994,1997). An objection to the feasibility of piezoelectric
mechanisms is the possible self-cancellation of a mac-
roscopic effect due to the expected random orientation
of quartz crystals, unless a large proportion of them is
aligned (e.g. Tuck et al., 1977). Nonetheless, experi-
ments demonstrate the generation of macroscopic sig-
nals associated with microfracturing, (e.g. Enomoto et
al., 1994; Yoshida et al., 1997 in simulated faults; Sas-aoka et al., 1998), suggesting that piezoelectric signals
may come from source regions of high stress rate,
where the stress distribution takes the same value and
geometry.
It is equally, if not more important, that E-EME was
observed in completely quartz-free rocks (e.g. Fiffolt
et al., 1993; Enomoto et al., 1994; Hadjicontis and
Mavromatou, 1994, 1996; Freund and Borucki, 1999),while Vallianatos and Tzanis (1998, 1999a) showed that
the stress sensitivity coefficient F ¼ E= _r, which deter-
mines the dependence of the transient electric field E on
the applied stress rate, is comparable in both quartz-
bearing and quartz-free rocks. Thus, additional electri-
fication mechanisms have been considered, such as
contact or separation electrification (Ogawa et al.,
1985), the motion of charged dislocations (MCD) in theelastic (e.g. Slifkin, 1993; Hadjicontis and Mavromatou,
F. Vallianatos et al. / Physics and Chemistry of the Earth 29 (2004) 339–351 341
1994, 1996) and non-elastic domains (e.g. Ernst et al.,
1993; Vallianatos and Tzanis, 1998, 1999a; Tzanis and
Vallianatos, 2002), activation of positive hole type dor-
mant charge carriers in quartz-free rocks (Freund and
Borucki, 1999; Freund, 2000) and the electrification of
trapped or flowing gases (Enomoto, 1996; Scudiero et
al., 1998). Yet another mechanism that may result fromlarge scale microfracturing involves current excitation
due to the forced motion of conductive earth material in
the geomagnetic field, by crack-emitted acoustic waves
(Surkov, 1999).
What makes the MCD mechanism particularly
attractive is the fact that it always occurs in association
with brittle failure, since stress concentration and crack
opening take place when, after some critical stressthreshold, edge dislocations multiply, migrate and pile
up against an obstacle. Dislocations may occur in dif-
ferent mechanical ‘flavours’ which would move in
opposite directions under stress. Thus, although the
dislocation density may be as high as 1014 m�2 for
heavily deformed materials and both flavours carry
comparable charges, any net electric polarization of one
sign must result from the net excess of charged dis-locations with a particular mechanical flavour. Such an
excess can easily be the result of previous cycles of non-
elastic deformation followed by healing. In the ther-
modynamic conditions of the schizosphere this process
will result in an elongated electric dipole, oriented in the
slip plane and perpendicular to the moving dislocation
lines. Because the opening and propagation of cracks
results in non-elastic deformation, the transient electricvariation should be related to the non-stationary accu-
mulation of deformation in the neighbourhood of the
moving dislocations. It should also be expected that
when ionic crystals and rocks undergo such drastic
changes, more than one electrification mechanisms may
be operative. It appears reasonable to suggest that
moving dislocations, acting as stress concentrators, may
guide and focus additional effects.Charge production and current generation during
crack opening is a short-lived effect. For dry rock
conditions––resistivities q of the order 106–104––and
common dielectric permittivities ed, any charge and
electromagnetic fluctuations with source dimension
l � 10�4–10�1 m (typical cracks) will disappear after a
time te � edq � 10�5–10�7 s (if no external sources are
applied). This is comparable to the duration of crackopening (10�4–10�7 s). Charge production inside the
crack is quickly destroyed by redistribution of the dis-
placement currents and the current appears only while
the crack propagates (for details see Tzanis and Valli-
anatos, 2002). If any long-lasting such signal is to be
observed, it will have to be generated by the superpo-
sition of the signals from all the simultaneously propa-
gating cracks and will evolve in time just like crackpropagation. Accordingly, the electric field measured at
a point on the surface of the Earth located at distance rfrom the source and at time tj, may be qualitatively
expressed as
Eðr; tjÞ � csX_nðtjÞi¼1
½qiðJMCD þ JOÞiGðr; riÞ uðtjÞ�
� u tjliti
� ��ð1Þ
where _nðtjÞ is the number of active cracks at time tj, csis a sensitivity coefficient at the location of the receiver
r and Gðr; riÞ describes the propagation and attenua-
tion of the dipole field generated by MCD (JMCD) and
other (JO) effects due to a crack opening at point ri;
uðtjÞ is the Heaviside step function; li, the crack
propagation length and ti, the opening velocity, so that
the right-hand factor in the sum allows the ith crack to
contribute only while it is opening. A determinativefactor in this model is the magnitude of the function_nðtjÞ, which must be large enough to form a macro-
scopic field. The dependence on resistivity is also a
cardinal factor. As pointed out by Tzanis and Valli-
anatos (2001, 2002) resistivities of the order of 100 Xm
will cause charge redistribution to occur at nanosecond
scale time constants, which is orders of magnitude
faster than crack opening times and does not allow fora macroscopic field to build up, unless the number of
cracks increases by a forbiddingly excessive factor. The
result is consistent with the majority of laboratory
experiments observing precursory electric signals in dry
(i.e. resistive) rock samples and indicates that strong
precursory fields due to solid state mechanisms are
anticipated from resistive rock blocks. More work is
needed in order to observe how wet rocks behaveduring microfracturing and only a few such experi-
ments exist (Chen et al., 1994; Yoshida et al., 1998).
We also note that due to charge generation a com-
panion magnetic field is also expected and has been
subject to intensive research (see the review of Tzanis
and Vallianatos, 2001, and references therein). Further
theoretical and experimental analysis of the magnetic
component is given in Tzanis et al. (2000); Vallianatosand Tzanis (1999b, 2003) and references therein.
To summarize, the MCD/microfracturing electrifica-
tion mechanism should be observable in non-piezoelec-
tric rocks and should heavily depend on the mechanical
conditions of the deforming material (damage accumu-
lation, stress and strain rates) and its electrical properties.
Given the right conditions, it could give rise to a mac-
roscopic electric field by the superposition of the fieldsemitted by many simultaneously propagating cracks.
These properties are testable in the laboratory and in-
spired the series of experiments reported herein. Because
several generic theories of transient EEP production
during the microfracturing of crustal rocks have been
contrived and proposed (e.g.Molchanov andHayakawa,
1998; Tzanis et al., 2000; Tzanis and Vallianatos, 2002),
342 F. Vallianatos et al. / Physics and Chemistry of the Earth 29 (2004) 339–351
ultimate objective of the experiments was to investigate
whether the development of such models is worth pur-
suing, or should be abandoned for contradicting the
almost unequivocal eventualities of carefully designed
experiments. A positive outcome would at least imply
that it is not unrealistic to extrapolate the effect to the
scale of seismogenic volumes in order to explain someclasses of purported EEP observations.
The rock samples were subjected to uniaxial com-
pression at both variable and constant stress rates;
measurements were made at all stages of the deforma-
tion process (elastic, non-elastic–plastic regions and up
to failure. As prelude, we note that the emitted current
(I) depends on the stress rate (dr=dt) and inversely on
the decreasing Young’s modulus, in consistency with theMCD model.
2. The MCD electrification mechanism: an overview
The MCD model has been qualitatively described by
Slifkin (1993) and further developed by Vallianatos and
Tzanis (1998, 1999a) and Tzanis and Vallianatos (2002);only essential information will be given here. In a crys-
talline structure, dislocations may form by the excess or
absence of a half-plane of atoms. The edge of this half-
plane comprises a dislocation line, around which the
physical fields related with it are concentrated. In an
ionic structure there will be an excess or absence of a line
of ions along the dislocation line, with consequence that
the dislocation be charged. In thermal equilibrium, dis-location lines are surrounded by the Debye–Hueckel
charge cloud and will be electrically neutral (Whitworth,
1975). In dynamic processes when dislocations move
faster than the Debye–Hueckel cloud can follow, neu-
trality can no longer be maintained. Let Kþ be the
density of edge dislocations with the mechanical flavour
required to accommodate uniaxial compression (or
tension) and K� the density of dislocation of the oppo-site type. The motion of charged dislocations produces a
transverse polarization:
P ¼ ðKþ � K�Þ � ql �dxffiffiffi2
p ¼ dK � ql �dxffiffiffi2
p ð2Þ
where ql is the charge per unit length on the dislocation
(of the order 10�11 Cb/m). If screw dislocations are ig-
nored, the plastic contribution to the strain, when these
dislocations of Burger’s vector b move through a dis-
tance dv, is:
e ¼ ðKþ � K�Þ � b � dx2
ð3Þ
The rate of change in polarization is by definition
equivalent to the electric current density. On using Eqs.
(2) and (3) one can easily show that
J ¼ oPot
) J ¼ffiffiffi2
p
b� qlb� dedt
ð4Þ
where b ¼ ðKþ þ K�Þ=ðKþ � K�Þ. Eq. (4) shows that the
observed transient electric variation is related to thenon-stationary accumulation of deformation. Notably,
b usually assumes values between 1 and 1.5 in alkali
halides (Whitworth, 1975). Assuming the highest value
for rocks, i.e. lower excess dislocation density, and
oe=ot � 10�4 s�1, approximately equal to co-seismic
deformation rates, we obtain J � �10�6 A/m2 which is
comparable to the values quoted from the experiments.
The purpose of the experiments was to investigatewhether a pressure stimulated current (PSC), i.e. one
produced by uniaxial compression of a rock sample,
would behave as predicted by the MCD model.
According to Eq. (4), the PSC is expected to be pro-
portional to the strain rate dedt. When the samples deforms
elastically,
r ¼ Y0 � e ð5Þwhere Y0 is the Young’s modulus of the undamaged
material and is constant in the elastic range. Conse-
quently, it should be J / drdt . Moreover, if dr
dt is constantno transient PSC effect should be observed. When the
stress exceeds the elastic limit, microcracks (damage)
begin to form; further increase of the stress causes the
microcracks to multiply and propagate and the material
to deform non-elastically. In this case, the strain e is
greater than that expected by Eq. (5). Accordingly, the
PSC amplitude is expected to increase when the stress
rate (e.g. Turcotte et al., 2003),
r ¼ Yeff � e ð6Þwhere Yeff is the effective Young’s modulus, which is no
longer constant. With increasing stress and damage, the
Young’s modulus gets progressively smaller. Accord-
ingly, the PSC amplitude is expected to decrease when
the stress rate drdt remains constant.
3. Laboratory results
In our experiments PSC were detected in Dionysos
marbles collected from Mt. Penteli, Attica. The Diony-
sos marble, which has been typically used since theancient times for the construction of artefacts and
monuments, is mainly composed of calcite (98%) and
other minerals depending on the variety of the marble,
such as muscovite, sericite and chlorite (Kleftakis et al.,
2000). Its content in quartz is very low, about 0.2%. Its
density is 2.7 g/cm3 and its porosity is approximately
0.4%. Calcite crystals are polygonic, sometimes exhib-
iting twinning and mainly of equal size and their texturemay be characterized as quasi-homoblastic. The rock is
white with a few thin parallel ash-green colored veins
F. Vallianatos et al. / Physics and Chemistry of the Earth 29 (2004) 339–351 343
containing silver-shaded areas due to the existence of
chlorite and muscovite. Matrix rocks were intentionally
selected to be single-grained.
The experimental apparatus and technique have been
duly described in previous work (Stavrakas et al., 2003)
and only essential information will be given here. The
experiment has been conducted in a Faraday shield toprevent electric noise from affecting the recorded sig-
nals. The noise-protected system comprised a uniaxial
hydraulic load machine (Enerpac-RC106) that applied
compressional stress to the sample, which was placed on
a stainless steel base. The marble sample was placed
between two thin Teflon plates, in the direction of stress,
in order to provide electrical isolation. The values of the
externally applied compressional stress were recordedusing a manometer. A pair of electrodes was attached to
the marble sample, using conductive paste. It has to be
noted that the electrodes were attached in a direction
perpendicular to the axis of the applied stress. The
measuring system consisted of a sensitive programmable
electrometer (Keithley 617) capable of resolving currents
as low as 0.1 fA, and as high as 20 mA in 11 ranges.
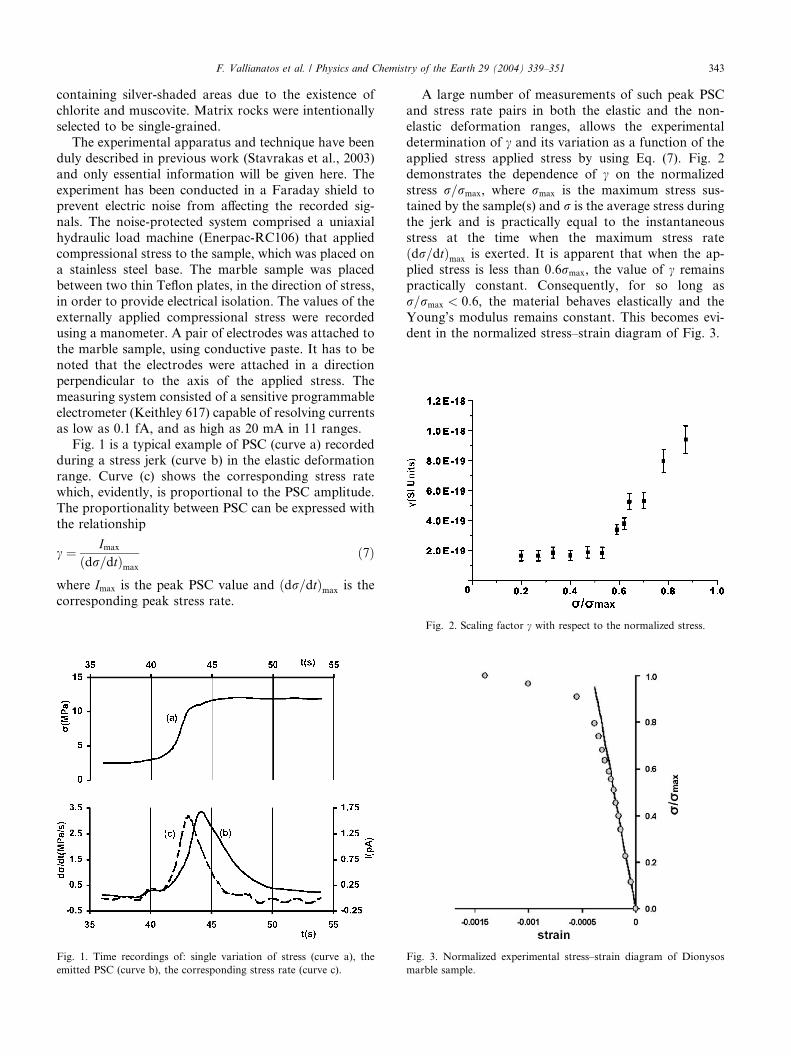
Fig. 1 is a typical example of PSC (curve a) recordedduring a stress jerk (curve b) in the elastic deformation
range. Curve (c) shows the corresponding stress rate
which, evidently, is proportional to the PSC amplitude.
The proportionality between PSC can be expressed with
the relationship
c ¼ Imax
ðdr=dtÞmax
ð7Þ
where Imax is the peak PSC value and ðdr=dtÞmax is the
corresponding peak stress rate.
Fig. 1. Time recordings of: single variation of stress (curve a), the
emitted PSC (curve b), the corresponding stress rate (curve c).
A large number of measurements of such peak PSC
and stress rate pairs in both the elastic and the non-
elastic deformation ranges, allows the experimental
determination of c and its variation as a function of the
applied stress applied stress by using Eq. (7). Fig. 2
demonstrates the dependence of c on the normalized
stress r=rmax, where rmax is the maximum stress sus-tained by the sample(s) and r is the average stress during
the jerk and is practically equal to the instantaneous
stress at the time when the maximum stress rate
ðdr=dtÞmax is exerted. It is apparent that when the ap-
plied stress is less than 0:6rmax, the value of c remains
practically constant. Consequently, for so long as
r=rmax < 0:6, the material behaves elastically and the
Young’s modulus remains constant. This becomes evi-dent in the normalized stress–strain diagram of Fig. 3.
Fig. 2. Scaling factor c with respect to the normalized stress.
Fig. 3. Normalized experimental stress–strain diagram of Dionysos
marble sample.
344 F. Vallianatos et al. / Physics and Chemistry of the Earth 29 (2004) 339–351
When r ¼ 0:6rmax the material gradually enters the
plastic deformation range where the Young’s modulus is
continuously decreasing with increasing stress. Thus,
combining Eqs. (4) and (6) it is easy to see that
J / 1
Yeff
� drdt
ð8Þ
and from Eqs. (7) and (8) it is evident that
c / 1
Yeff
consistent with the experimental results.From a microphysics point of view we note that in the
plastic deformation range, structural changes are intro-
duced into the samples depending on the stress state.
According to Hallbauer et al. (1973), when the sample is
stressed uniaxially in the early plastic stage, tensile mi-
crocracks begin to form. These are the dominant form
of all heterogeneities that determine the process of fail-
ure (Lei et al., 2000): eventually, the increasing numberof tensile microcracks tensile cracks at the lateral edges
of shear cracks will reach a minimum critical distance
with respect to each other and will begin to fuse; the
array will be broken through by meso- and macro-scale
cracks parallel to the shear plane, forming a shear pro-
cess zone as the first stage in forming a rupture.
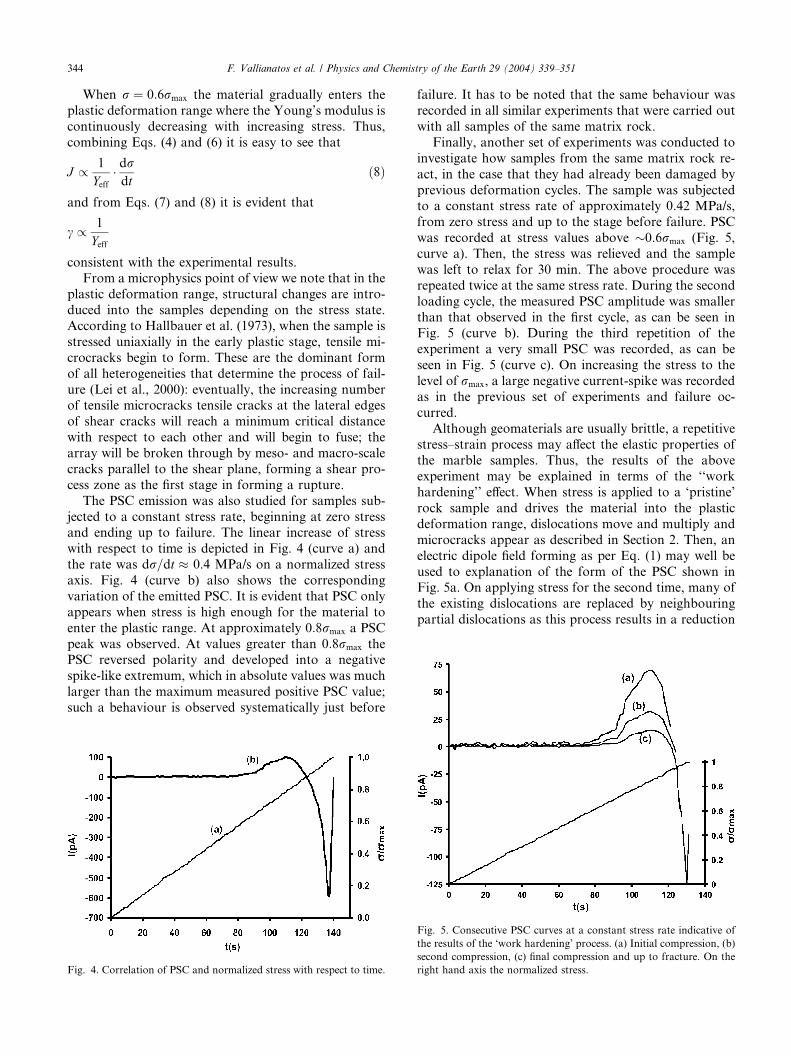
The PSC emission was also studied for samples sub-
jected to a constant stress rate, beginning at zero stressand ending up to failure. The linear increase of stress
with respect to time is depicted in Fig. 4 (curve a) and
the rate was dr=dt � 0.4 MPa/s on a normalized stress
axis. Fig. 4 (curve b) also shows the corresponding
variation of the emitted PSC. It is evident that PSC only
appears when stress is high enough for the material to
enter the plastic range. At approximately 0:8rmax a PSC
peak was observed. At values greater than 0:8rmax thePSC reversed polarity and developed into a negative
spike-like extremum, which in absolute values was much
larger than the maximum measured positive PSC value;
such a behaviour is observed systematically just before
Fig. 4. Correlation of PSC and normalized stress with respect to time.
failure. It has to be noted that the same behaviour was
recorded in all similar experiments that were carried out
with all samples of the same matrix rock.
Finally, another set of experiments was conducted to
investigate how samples from the same matrix rock re-
act, in the case that they had already been damaged by
previous deformation cycles. The sample was subjectedto a constant stress rate of approximately 0.42 MPa/s,
from zero stress and up to the stage before failure. PSC
was recorded at stress values above 0.6rmax (Fig. 5,
curve a). Then, the stress was relieved and the sample
was left to relax for 30 min. The above procedure was
repeated twice at the same stress rate. During the second
loading cycle, the measured PSC amplitude was smaller
than that observed in the first cycle, as can be seen inFig. 5 (curve b). During the third repetition of the
experiment a very small PSC was recorded, as can be
seen in Fig. 5 (curve c). On increasing the stress to the
level of rmax, a large negative current-spike was recorded
as in the previous set of experiments and failure oc-
curred.
Although geomaterials are usually brittle, a repetitive
stress–strain process may affect the elastic properties ofthe marble samples. Thus, the results of the above
experiment may be explained in terms of the ‘‘work
hardening’’ effect. When stress is applied to a ‘pristine’
rock sample and drives the material into the plastic
deformation range, dislocations move and multiply and
microcracks appear as described in Section 2. Then, an
electric dipole field forming as per Eq. (1) may well be
used to explanation of the form of the PSC shown inFig. 5a. On applying stress for the second time, many of
the existing dislocations are replaced by neighbouring
partial dislocations as this process results in a reduction
Fig. 5. Consecutive PSC curves at a constant stress rate indicative of
the results of the ‘work hardening’ process. (a) Initial compression, (b)
second compression, (c) final compression and up to fracture. On the
right hand axis the normalized stress.
F. Vallianatos et al. / Physics and Chemistry of the Earth 29 (2004) 339–351 345
of the elastic energy of the sample (Feltham, 1966) This
process does not necessarily result in an increase of the
number of dipoles, thus, less charge is released to par-
ticipate in the PSC and consequently a smaller current is
generated, as also shown in Fig. 5b. Apparently, the
sequence of stress-induced dislocations is physically
limited only by the volume of the sample but the re-leased charge being part of the total charge of the
sample is a decreasing function of the number of stress–
application repetitions. Fig. 5c appears to support this
assertion.
4. From the laboratory to the earthquake scale: expected
source time functions and signal waveforms
The reported experiments have amply demonstrated
that in dry rocks, microfracturing may produce macro-
scopic electric transients with intensity dependent on the
mechanical state of the deforming material. The results
are consistent with the predictions of the MCD/micro-
fracturing model, with particular reference to the ter-
minal stage of the process and prior to failure, when thematerial deforms plastically and non-linearly due to
excessive accumulation of damage. A problem not an-
swered (in fact not answerable by such experiments), is
of whether these effects can scale up to the megascopic
level of Earth (crustal) processes and generate ob-
servable EEP. On the other hand, it is very important
to note that such a possibility is not contested by the
experiments: if scaling up is possible, EEP signals arefeasible, as shown by Tzanis and Vallianatos (2002). In
this case, it should be possible to predict the form of this
particular class of EEP phenomena (e.g. Tzanis et al.,
2000; Tzanis and Vallianatos, 2002). Only essential ele-
ments of this theory will be presented here.
Brittle failure begins at the microscopic scale and
cascades to the macroscopic by co-operative crack
growth and coalescence in such a way, that fracturing atone scale (or level of the crack hierarchy) is part of
damage accumulation at a larger scale. Once micro-
fracturing begins, the number of propagating cracks
(and the electric field) is first expected to rise sharply,
but as the sustainable crack density is approached and
stress/strain levels drop below a threshold value, it will
decelerate and decline to zero when no more cracks can
be produced. The duration of this process is unknown,but conceivably, it may require any time up to a few
hours, depending on the size, mechanical and thermal
state of the deforming volume.
The macroscopic behaviour of a large number of
interacting cracks is, by nature, a problem of statistical
mechanics and since cracks are organized in ensembles
of distributed, interacting elements, it is appropriate to
adopt a kinetic approach. A complete and comprehen-sive treatment of this problem has been given by
Czechowski (1991, 1995), who expands on assumptions
similar to those of Boltzman’s. The theory amounts to
the kinetic equation
of ðx; l; tÞot
þ o½tpf ðx; l; tÞ�ol
¼ 1
2
Z l
0
f ðx; l1; tÞf ðx; l� l1; tÞstpdl1
� f ðx; l; tÞZ 1
0
f ðx; l1; tÞstpdl1 þ NðlÞ ð9Þ
where f ðx; l; tÞ is a size distribution function of cracks
such that f ðx; l; tÞ DxDl is the number of cracks which
exist at time t within a volume element Dx around a
point x and have sizes within Dl around size l, and
where p and t are respectively the probability and
velocity with which cracks may propagate. The LHS ofEq. (9) expresses the changes in the number of cracks as
resulting from the interactions described by the RHS.
Specifically, the first term in the RHS is the total number
of ‘gains’, i.e. the number of binary interactions whereby
cracks with (smaller) sizes l1 < l collide and merge with
cracks l < l1 to produce cracks with sizes l, where
s ¼ sðl; l1; �rÞ is the cross-section of collisions, �r is an
average stress field and where the factor 1/2 preventsfrom counting an interaction twice. The second term in
the RHS is the number of ‘losses’, i.e. the number of
binary interactions whereby cracks of any size l1 form-
ing a beam with flux density dI ¼ tpf ðx; l; tÞdl1 collide
with crack l and consume it. NðlÞ is the nucleation term.
The kinetic equation describes how cracks propagate
and join each other with probability depending on the
total cross-section of collisions between cracks. Thequantities s, t, and p may be functions of the size of
cracks, stress field and properties of the rock. We are
particularly interested in an analysis discretizing Eq. (9)
in the size-space of cracks, according to
niðtÞ ¼Z Li
Li�1
f ðl; tÞdl;
so that the total number of cracks is divided into mpopulations ni, i ¼ 1; 2; . . . , m with respect to their size.
Successive integrations of (9) over the intervals
ð0; L1�; ð0; L2�; . . . ; ðLM ;1Þ, subject to the constraints
0 ¼ L0 < L1 < � � � < LM�1 < LM ¼ 1 and Li � Li�1 ¼ 1
for i ¼ 1; 2; . . . ;M , produce a set of M coupled ordinary
differential equations that describe the balance of gains
and losses of any given group of cracks by mergence andby propagation. For instance, M ¼ 3 yields
_n1 ¼ �ð1� 0:5k1Þn21 � n1n2 � n1n3 þ n1
_n2 ¼ 0:5ðk2 � k1Þn21 � ð1� 0:5k2Þn2
2 � ð1� k2Þn1n2
� n2n3 þ n2
_n3 ¼ 0:5ð1� k2Þðn21 þ 2n1n2 þ n3
2Þ � 0:5n23 þ n3
ð10Þ
346 F. Vallianatos et al. / Physics and Chemistry of the Earth 29 (2004) 339–351
where _ni ¼ ðsitipi1Þ�1 � ðdni=dtÞ, ninj denotes the fusion of
cracks ni with cracks nj and ni ¼ piðpi1siÞ�1 � ½f ðLi�1; tÞ�f ðLi; tÞ� is the propagation term. The factors kj determine
the span of interactions between any two crack popula-
tions, with (1� kj) representing the extent of losses due
to healing. For a decreasing f ðlÞ, 0 < kj < 1=2, with
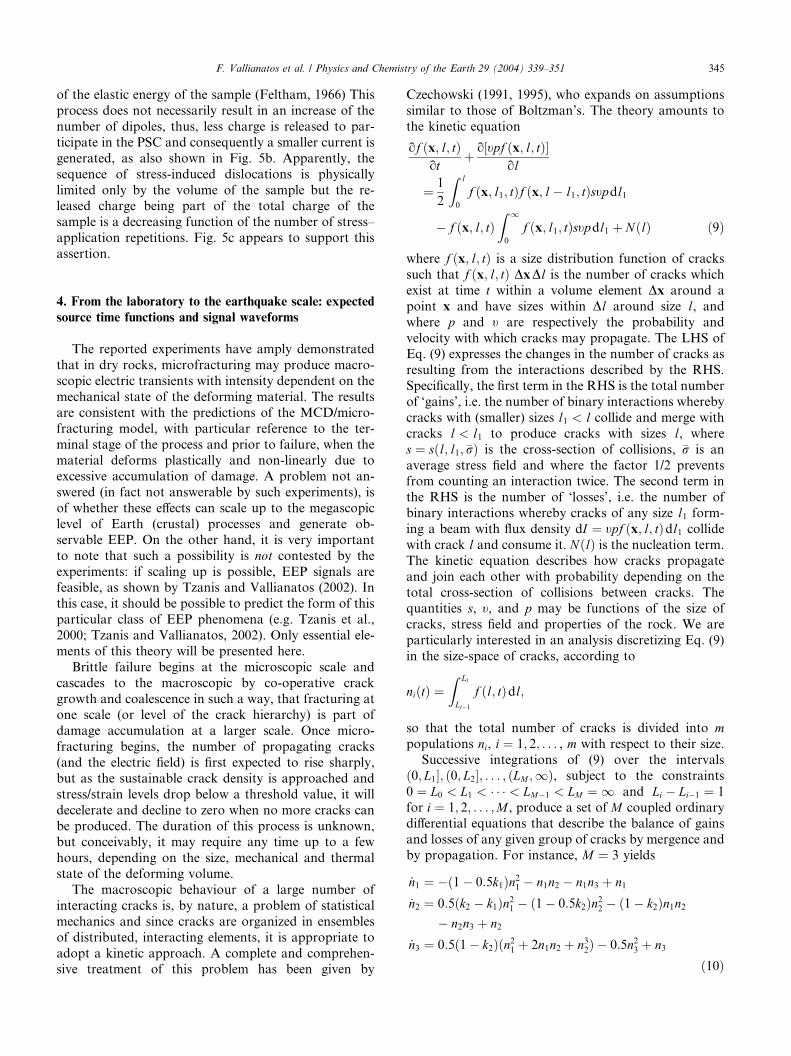
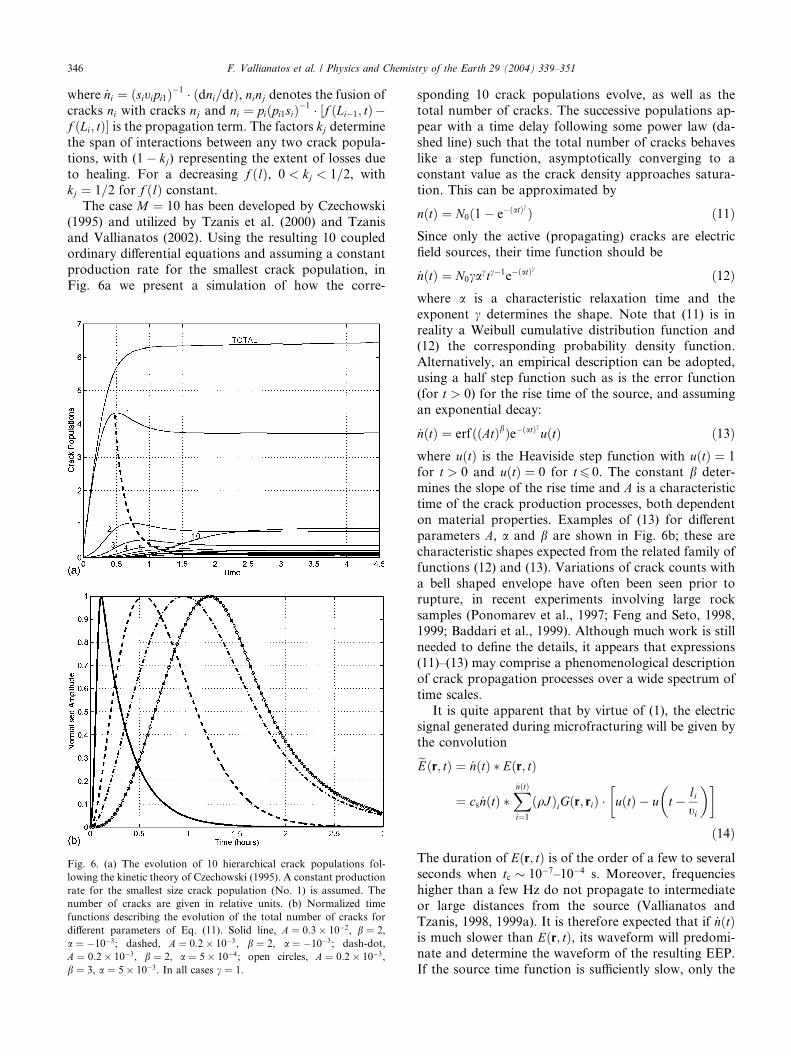
kj ¼ 1=2 for f ðlÞ constant.The case M ¼ 10 has been developed by Czechowski
(1995) and utilized by Tzanis et al. (2000) and Tzanis
and Vallianatos (2002). Using the resulting 10 coupled
ordinary differential equations and assuming a constant
production rate for the smallest crack population, in
Fig. 6a we present a simulation of how the corre-
Fig. 6. (a) The evolution of 10 hierarchical crack populations fol-
lowing the kinetic theory of Czechowski (1995). A constant production
rate for the smallest size crack population (No. 1) is assumed. The
number of cracks are given in relative units. (b) Normalized time
functions describing the evolution of the total number of cracks for
different parameters of Eq. (11). Solid line, A ¼ 0:3� 10�2, b ¼ 2,
a ¼ �10�3; dashed, A ¼ 0:2� 10�3, b ¼ 2, a ¼ �10�3; dash-dot,
A ¼ 0:2� 10�3, b ¼ 2, a ¼ 5� 10�4; open circles, A ¼ 0:2� 10�3,
b ¼ 3, a ¼ 5� 10�3. In all cases c ¼ 1.
sponding 10 crack populations evolve, as well as the
total number of cracks. The successive populations ap-
pear with a time delay following some power law (da-
shed line) such that the total number of cracks behaves
like a step function, asymptotically converging to a
constant value as the crack density approaches satura-
tion. This can be approximated by
nðtÞ ¼ N0ð1� e�ðatÞcÞ ð11ÞSince only the active (propagating) cracks are electric
field sources, their time function should be
_nðtÞ ¼ N0cactc�1e�ðatÞc ð12Þ
where a is a characteristic relaxation time and the
exponent c determines the shape. Note that (11) is in
reality a Weibull cumulative distribution function and(12) the corresponding probability density function.
Alternatively, an empirical description can be adopted,
using a half step function such as is the error function
(for t > 0) for the rise time of the source, and assuming
an exponential decay:
_nðtÞ ¼ erfððAtÞbÞe�ðatÞcuðtÞ ð13Þwhere uðtÞ is the Heaviside step function with uðtÞ ¼ 1for t > 0 and uðtÞ ¼ 0 for t6 0. The constant b deter-
mines the slope of the rise time and A is a characteristic
time of the crack production processes, both dependent
on material properties. Examples of (13) for different
parameters A, a and b are shown in Fig. 6b; these are
characteristic shapes expected from the related family of
functions (12) and (13). Variations of crack counts with
a bell shaped envelope have often been seen prior torupture, in recent experiments involving large rock
samples (Ponomarev et al., 1997; Feng and Seto, 1998,
1999; Baddari et al., 1999). Although much work is still
needed to define the details, it appears that expressions
(11)–(13) may comprise a phenomenological description
of crack propagation processes over a wide spectrum of
time scales.
It is quite apparent that by virtue of (1), the electricsignal generated during microfracturing will be given by
the convolution
eEðr; tÞ ¼ _nðtÞ � Eðr; tÞ
¼ cs _nðtÞ �X_nðtÞi¼1
ðqJÞiGðr; riÞ � uðtÞ�
� u t�
� liti
��ð14Þ
The duration of Eðr; tÞ is of the order of a few to several
seconds when tc 10�7–10�4 s. Moreover, frequencies
higher than a few Hz do not propagate to intermediate
or large distances from the source (Vallianatos and
Tzanis, 1998, 1999a). It is therefore expected that if _nðtÞis much slower than Eðr; tÞ, its waveform will predomi-
nate and determine the waveform of the resulting EEP.
If the source time function is sufficiently slow, only the

Fig. 8. The upper panel shows the digitized signal recorded on 14:00
GMT of 15 January 1983 at Pyrgos, Greece (PIR), and reported by
Varotsos and Alexopoulos (1984) as a precursor to the 17 January
1983 Kefallinia earthquake (D � 130 km). The lower panel shows the
transient signal after removing the background. Hour 0 in the time axis
corresponds to 13:00 GMT.
F. Vallianatos et al. / Physics and Chemistry of the Earth 29 (2004) 339–351 347
long periods of the resultant field eEðr; tÞ are allowed to
propagate.
4.1. Two examples from the January 1983, M7 Kefallinia
earthquake sequence (Ionian Sea)
One of the largest events to have occurred in the Io-nian Sea region in the 20th century, this earthquake
occurred offshore to the SW of Kefallinia island, Greece,
on 12:41 GMT of 17 January 1983, at the coordinates
38.09� N, 20.19� E and a focal depth of 9 km (see Baker
et al., 1997, for a review). Varotsos and Lazaridou
(1991) claim to have recorded an electrical precursor to
this earthquake at their PIR station, approximately 130
km SE of the epicentre, which they illustrate in Fig. 7 oftheir paper (see Fig. 7). We have reproduced a digital
version of the longer periods of the signal by scanning
their Fig. 7, enhancing the image and digitising it on a
high resolution monitor. The digitized raw signal com-
prises a transient beginning on approximately 14:00 of
15 January 1983 and lasting for 1.5–2 hours, superim-
posed on a non-linear variation of the background (Fig.
8). On removing the background, we obtain a verystrong E–W component (25 mV over 50 m), but very
weak N–S (Fig. 8 bottom). The E–W waveform has an
asymmetric bell shape, with faster rise time and a slower
exponential type decay; for most of its duration, it
stands clearly above noise, the peak amplitude of which
is approximately 20% of the peak signal amplitude. The
later times of the signal, however, are obscured, and
there is no real way of telling the exact duration of thedecay phase. The long period E–W components can be
easily fitted with functions of the form (12) and (13).
Recall that both functions are phenomenological
descriptions of the signal shape only, since we cannot as
yet estimate the amplitude. Therefore, we may only at-
tempt to fit the signal and the model normalized with
respect to their maximum values. In Fig. 9 we present
Fig. 7. The stars show the epicentres of the 17-1-83 M7 Kefallinia, the
19-1-83 M5.6 Kefallinia and the 18-11-1992 M5.9 Galaxidi events. PIR
is the location where the ‘precursory’ signals from the Kefallinia events
were detected; PAT is the observation location for the Galaxidi event.
Fig. 9. A model of the normalized long period E–W component of the
15-1-83 signal (Fig. 10) in the time domain (top) and frequency domain
(bottom).
a model based on Eq. (13), with c ¼ 1 (fixed),
A � 5:3� 10�4 s�1, b � 2:1 and a � 9:9� 10�4 s�1
(2p=a � 6300 s is approximately the duration of the
model and 1=a is a characteristic relaxation time).
A large M ¼ 5:6 aftershock of this event occurred on
00:02 GMT of 19 January 1983, at 38.11� N and 20.25�E (Fig. 7). Varotsos and Lazaridou (1991) again claim to
have recorded a precursor at PIR, which they illustratein Fig. 8 of their paper. This signal was also reproduced
digitally. The EW component is shown in Fig. 10a and b
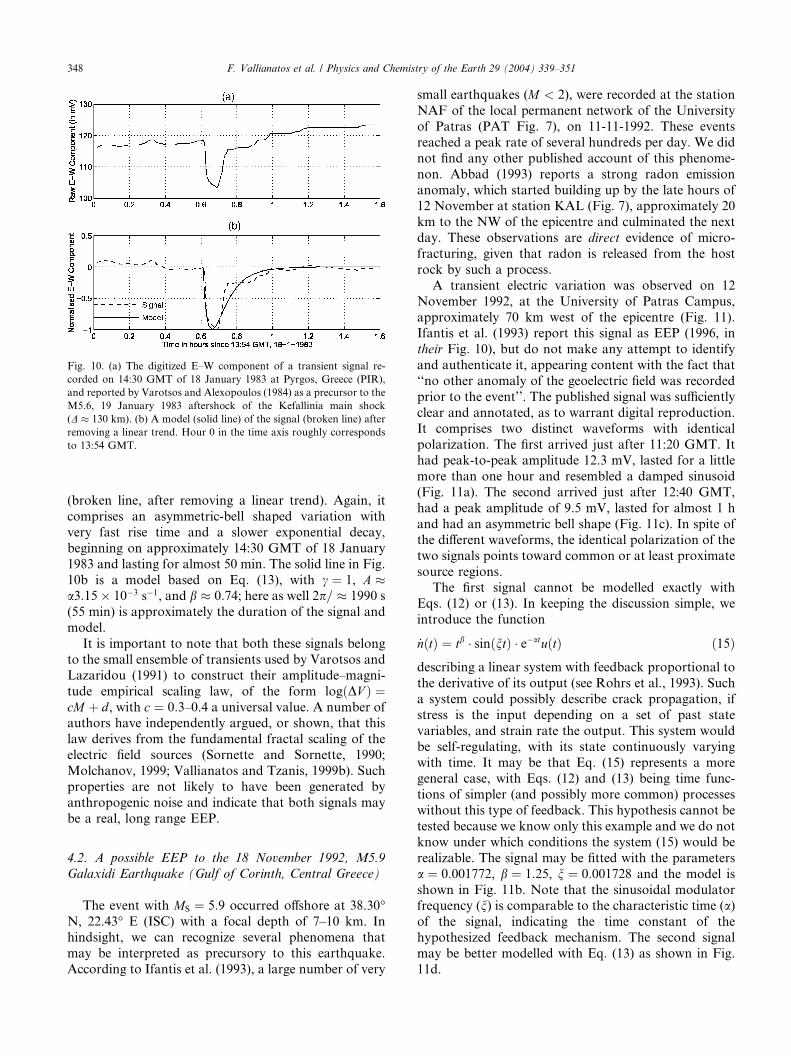
Fig. 10. (a) The digitized E–W component of a transient signal re-
corded on 14:30 GMT of 18 January 1983 at Pyrgos, Greece (PIR),
and reported by Varotsos and Alexopoulos (1984) as a precursor to the
M5.6, 19 January 1983 aftershock of the Kefallinia main shock
(D � 130 km). (b) A model (solid line) of the signal (broken line) after
removing a linear trend. Hour 0 in the time axis roughly corresponds
to 13:54 GMT.
348 F. Vallianatos et al. / Physics and Chemistry of the Earth 29 (2004) 339–351
(broken line, after removing a linear trend). Again, it
comprises an asymmetric-bell shaped variation with
very fast rise time and a slower exponential decay,
beginning on approximately 14:30 GMT of 18 January
1983 and lasting for almost 50 min. The solid line in Fig.
10b is a model based on Eq. (13), with c ¼ 1, A �a3:15� 10�3 s�1, and b � 0:74; here as well 2p= � 1990 s
(55 min) is approximately the duration of the signal and
model.
It is important to note that both these signals belong
to the small ensemble of transients used by Varotsos and
Lazaridou (1991) to construct their amplitude–magni-
tude empirical scaling law, of the form logðDV Þ ¼cM þ d, with c ¼ 0:3–0.4 a universal value. A number ofauthors have independently argued, or shown, that this
law derives from the fundamental fractal scaling of the
electric field sources (Sornette and Sornette, 1990;
Molchanov, 1999; Vallianatos and Tzanis, 1999b). Such
properties are not likely to have been generated by
anthropogenic noise and indicate that both signals may
be a real, long range EEP.
4.2. A possible EEP to the 18 November 1992, M5.9
Galaxidi Earthquake (Gulf of Corinth, Central Greece)
The event with MS ¼ 5:9 occurred offshore at 38.30�N, 22.43� E (ISC) with a focal depth of 7–10 km. In
hindsight, we can recognize several phenomena that
may be interpreted as precursory to this earthquake.
According to Ifantis et al. (1993), a large number of very
small earthquakes (M < 2), were recorded at the station
NAF of the local permanent network of the University
of Patras (PAT Fig. 7), on 11-11-1992. These events
reached a peak rate of several hundreds per day. We did
not find any other published account of this phenome-
non. Abbad (1993) reports a strong radon emission
anomaly, which started building up by the late hours of12 November at station KAL (Fig. 7), approximately 20
km to the NW of the epicentre and culminated the next
day. These observations are direct evidence of micro-
fracturing, given that radon is released from the host
rock by such a process.
A transient electric variation was observed on 12
November 1992, at the University of Patras Campus,
approximately 70 km west of the epicentre (Fig. 11).Ifantis et al. (1993) report this signal as EEP (1996, in
their Fig. 10), but do not make any attempt to identify
and authenticate it, appearing content with the fact that
‘‘no other anomaly of the geoelectric field was recorded
prior to the event’’. The published signal was sufficiently
clear and annotated, as to warrant digital reproduction.
It comprises two distinct waveforms with identical
polarization. The first arrived just after 11:20 GMT. Ithad peak-to-peak amplitude 12.3 mV, lasted for a little
more than one hour and resembled a damped sinusoid
(Fig. 11a). The second arrived just after 12:40 GMT,
had a peak amplitude of 9.5 mV, lasted for almost 1 h
and had an asymmetric bell shape (Fig. 11c). In spite of
the different waveforms, the identical polarization of the
two signals points toward common or at least proximate
source regions.The first signal cannot be modelled exactly with
Eqs. (12) or (13). In keeping the discussion simple, we
introduce the function
_nðtÞ ¼ tb � sinðntÞ � e�atuðtÞ ð15Þdescribing a linear system with feedback proportional to
the derivative of its output (see Rohrs et al., 1993). Such
a system could possibly describe crack propagation, if
stress is the input depending on a set of past state
variables, and strain rate the output. This system would
be self-regulating, with its state continuously varying
with time. It may be that Eq. (15) represents a moregeneral case, with Eqs. (12) and (13) being time func-
tions of simpler (and possibly more common) processes
without this type of feedback. This hypothesis cannot be
tested because we know only this example and we do not
know under which conditions the system (15) would be
realizable. The signal may be fitted with the parameters
a ¼ 0:001772, b ¼ 1:25, n ¼ 0:001728 and the model is
shown in Fig. 11b. Note that the sinusoidal modulatorfrequency (n) is comparable to the characteristic time (a)of the signal, indicating the time constant of the
hypothesized feedback mechanism. The second signal
may be better modelled with Eq. (13) as shown in Fig.
11d.
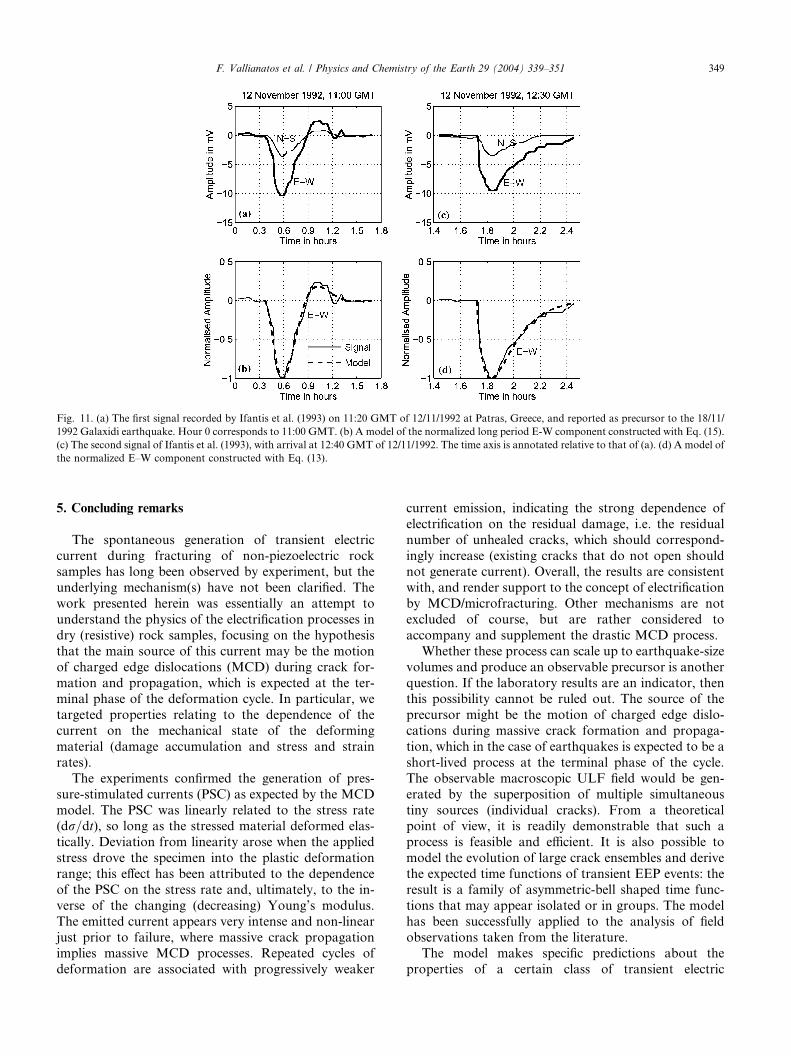
Fig. 11. (a) The first signal recorded by Ifantis et al. (1993) on 11:20 GMT of 12/11/1992 at Patras, Greece, and reported as precursor to the 18/11/
1992 Galaxidi earthquake. Hour 0 corresponds to 11:00 GMT. (b) A model of the normalized long period E-W component constructed with Eq. (15).
(c) The second signal of Ifantis et al. (1993), with arrival at 12:40 GMT of 12/11/1992. The time axis is annotated relative to that of (a). (d) A model of
the normalized E–W component constructed with Eq. (13).
F. Vallianatos et al. / Physics and Chemistry of the Earth 29 (2004) 339–351 349
5. Concluding remarks
The spontaneous generation of transient electric
current during fracturing of non-piezoelectric rocksamples has long been observed by experiment, but the
underlying mechanism(s) have not been clarified. The
work presented herein was essentially an attempt to
understand the physics of the electrification processes in
dry (resistive) rock samples, focusing on the hypothesis
that the main source of this current may be the motion
of charged edge dislocations (MCD) during crack for-
mation and propagation, which is expected at the ter-minal phase of the deformation cycle. In particular, we
targeted properties relating to the dependence of the
current on the mechanical state of the deforming
material (damage accumulation and stress and strain
rates).
The experiments confirmed the generation of pres-
sure-stimulated currents (PSC) as expected by the MCD
model. The PSC was linearly related to the stress rate(dr=dt), so long as the stressed material deformed elas-
tically. Deviation from linearity arose when the applied
stress drove the specimen into the plastic deformation
range; this effect has been attributed to the dependence
of the PSC on the stress rate and, ultimately, to the in-
verse of the changing (decreasing) Young’s modulus.
The emitted current appears very intense and non-linear
just prior to failure, where massive crack propagationimplies massive MCD processes. Repeated cycles of
deformation are associated with progressively weaker
current emission, indicating the strong dependence of
electrification on the residual damage, i.e. the residual
number of unhealed cracks, which should correspond-
ingly increase (existing cracks that do not open shouldnot generate current). Overall, the results are consistent
with, and render support to the concept of electrification
by MCD/microfracturing. Other mechanisms are not
excluded of course, but are rather considered to
accompany and supplement the drastic MCD process.
Whether these process can scale up to earthquake-size
volumes and produce an observable precursor is another
question. If the laboratory results are an indicator, thenthis possibility cannot be ruled out. The source of the
precursor might be the motion of charged edge dislo-
cations during massive crack formation and propaga-
tion, which in the case of earthquakes is expected to be a
short-lived process at the terminal phase of the cycle.
The observable macroscopic ULF field would be gen-
erated by the superposition of multiple simultaneous
tiny sources (individual cracks). From a theoreticalpoint of view, it is readily demonstrable that such a
process is feasible and efficient. It is also possible to
model the evolution of large crack ensembles and derive
the expected time functions of transient EEP events: the
result is a family of asymmetric-bell shaped time func-
tions that may appear isolated or in groups. The model
has been successfully applied to the analysis of field
observations taken from the literature.The model makes specific predictions about the
properties of a certain class of transient electric
350 F. Vallianatos et al. / Physics and Chemistry of the Earth 29 (2004) 339–351
precursors, but while it is plausible and testable, it is still
far from being complete and verified. It is clear that a
great deal of work is needed before one can claim a
working theory of the earthquake preparation process,
but it is also apparent that observed signals can indeed
be interpreted in terms of real and testable physics and
their associated generic theories of the source.
References
Abbad, S., 1993. Etude des variations de l’activite volumique radon en
fonction des parametres meteorologiques et geologiques. Doctoral
Dissertation, University of Paris VII (in French).
Baddari, K., Sobolev, G.A., Frolov, A., Ponomarev, A., 1999. An
integrated study of physical precursors of failure in relation to
earthquake prediction, using large scale rock blocks. Anna. Geof.
42, 771–787.
Baker, C., Hatzfeld, D., Lyon-Caen, H., Papadimitriou, E., Rigo, A.,
1997. Earthquake mechanisms of the Adriatic sea and western
Greece: implications for the oceanic subduction–continental colli-
sion transition. Geophys. J. Int. 131, 559–594.
Bernard, P., 1992. Plausibility of long distance electrotelluric precur-
sors to earthquakes. J. Geophys. Res. 97, 17531–17546.
Bernard, P., Le Mou€el, J.L., 1996. On electrotelluric signals. In:
Lighthill, J. (Ed.), A Critical Review of VAN. World Scientific,
Singapore, pp. 118–152.
Czechowski, Z., 1991. A kinetic model of crack fusion. Geophys. J. Int.
104, 419–422.
Czechowski, Z., 1995. Dynamics of fracturing and cracks. In:
Teisseyre, R. (Ed.), Theory of Earthquake Premonitory and
Fracture Processes. Polish Scientific Publishers, pp. 447–469.
Chen, D.-Y., Zhang, D.-H., Sun, Z.-J., 1994. ULF electric-potential
changes prior to the fracture in rock samples. In: Hayakawa, M.,
Fujinawa, Y. (Eds.), Electromagnetic Phenomena Related to
Earthquake Prediction. Terra Scientific Publishing Co., pp. 323–
329.
Dobrovolsky, I.P., Gershenzon, N.I., Gokhberg, M.B., 1989. Theory
of electrokinetic effects occurring at the final stage in the prepa-
ration of a tectonic earthquake. Phys. Earth Planet. Inter. 57, 144–
156.
Enomoto, Y., 1996. Notes on generation and propagation of seismic
transient electric signals. In: Lighthill, Sir J. (Ed.), A Critical
Review of VAN. World Scientific, Singapore, pp. 324–331.
Enomoto, J., Hashimoto, H., 1990. Emission of charged particles from
indentation fracture of rocks. Nature 346, 641–643.
Enomoto, Y., Shimamoto, T., Tsutsumi, A., Hashimoto, H., 1994.
Transient electric signals prior to rock fracturing: potential use as
an immediate earthquake precursor. In: Hayakawa, M., Fujinawa,
Y. (Eds.), Electromagnetic Phenomena Related to Earthquake
Prediction. Terra Scientific Publishing Co., Tokyo, pp. 253–259.
Ernst, T., Jankowski, J., Rozluski, C., Teisseyre, R., 1993. Analysis of
the electromagnetic field recorded in the Friuli seismic zone, NE
Italy. Tectonophysics 224 (1), 141–148.
Feltham, P., 1966. Deformation and Strength of Materials. Butter-
worths.
Feng, X.-T., Seto, M., 1998. Neural network dynamic modelling of
rock microfracturing sequences under triaxial compressive stress
conditions. Tectonophysics 292, 293–309.
Feng, X.-T., Seto, M., 1999. Fractal structure of the time distribution
of microfracturing in rocks. Geophys. J. Int. 136, 275–285.
Fenoglio, M.A., Johnston, M.J.S., Byerlee, J., 1995. Magnetic and
electric fields associated with changes in high pore pressure in fault
zones––Application to the Loma Prietta ULF emissions. J.
Geophys. Res. 100 (B7), 12951–12958.
Fiffolt, D.A., Petrenko, V.F., Schulson, E.M., 1993. Preliminary study
of electromagnetic emissions from cracks in ice. Philos. Mag. B 67,
289–299.
Freund, F., 2000. Time-resolved study of charge generation and
propagation in igneous rocks. J. Geophys. Res. B 105, 11001–11019.
Freund, F., Borucki, J.G., 1999. Charge carrier generation and charge
cloud propagation following 100 m/sec impacts on igneous rocks.
In: Hayakawa, M. (Ed.), Atmospheric and Ionospheric Electro-
magnetic Phenomena Associated with Earthquakes. Terra Scien-
tific Publishing Co., Tokyo, pp. 839–857.
Gensane, O., Konyukov, B., Le Mou€el, J.-L., Morat, P., 1999. SP
coseismic signals observed on an electrodes array in an under-
ground qarry. Geophys. Res. Lett. 26 (23), 3529–3532.
Gokhberg, M.B., Gufeld, I.L., Gershenzon, N.I., Pilipenko, V.A.,
1985. Electromagnetic effects during rupture of the Earth’s crust,
Izvestiya. Earth Phys. 21 (1), 52–63.
Hadjicontis, V., Mavromatou, C., 1994. Transient electric signals prior
to rock failure under uniaxial compression. Geophys. Res. Lett. 21,
1687–1690.
Hadjicontis, V., Mavromatou, C., 1996. Laboratory investigation of
electric signals preceding earthquakes. In: Lighthill, J. (Ed.), A
Critical Review of VAN. World Scientific, Singapore, pp. 105–117.
Hallbauer, D.K., Wagner, H., Cook, N.G.W., 1973. Some observa-
tions concerning the microscopic and mechanical behaviour of
quartzite specimens in stiff, triaxial compression tests. Int. J. Rock
Mech. Min. Sci. Geomech. Abstr. 10, 713–726.
Hayakawa, M. (Ed.), 1999. Atmospheric and Ionospheric Electro-
magnetic Phenomena Associated with Earthquakes. Terra Scien-
tific Publishing Co., Tokyo.
Hayakawa, M., Molchanov, O. (Eds.), 2002. Seismoelectromagnetics
(Lithosphere–Atmosphere–Ionosphere Coupling). Terra Scientific
Publishing Co., Tokyo, p. 2002.
Hayakawa, M., Fujinawa, Y. (Eds.), 1994. Electromagnetic Phenom-
ena Related to Earthquake Prediction. Terra Scientific Publishing
Co., Tokyo.
Ifantis, A., Tselentis, G.-A., Varotsos, P., Thanasoulas, C., 1993. Long
term variations of the Earth’s electric field preceding two earth-
quakes in Greece. Acta Geophys. Polonica, XLI 4, 337–350.
Johnston, M.J.S., 1997. Review of electrical and magnetic fields
accompanying seismic and volcanic activity. Surv. Geophys. 18,
441–475.
Jouniaux, L., Pozzi, J.-P., 1995a. Permeability dependence of stream-
ing potential in rocks for various fluid conductivities. Geophys.
Res. Lett. 22 (4), 485–488.
Jouniaux, L., Pozzi, J.-P., 1995b. Streaming potential and permeability
of saturated sandstones under triaxial stress: Consequences for
electrotelluric anomalies prior to earthquakes. J. Geophys. Res.
100 (B6), 10197–10209.
Jouniaux, L., Pozzi, J.-P., 1997. Laboratory measurements of anom-
alous 0.1–0.5 Hz streaming potential under geochemical changes:
Implications for electrotelluric precursors to earthquakes. J.
Geophys. Res. 102 (B7), 15335–15343.
Kleftakis, S., Agioutantis, Z., Stiakakis, C., 2000. Numerical Simula-
tion of the uniaxial compression test including the specimen-platen
interaction. Computational methods for shell and spatial struc-
tures, IASS-IACM.
Lei, X.L., Kusunose, K., Nishizawa, O., Cho, A., Satoh, T., 2000. On
the spatiotemporal distribution of acoustic emissions in two
granitic rocks under triaxial compression: the role of pre-existing
cracks. Geophys. Res. Lett. 27, 1997–2000.
Mizutani, H., Ishido, T., Yokokura, T., Ohnishi, S., 1976. Electroki-
netic phenomena associated with earthquakes. Geophys. Res. Lett.
3, 365–368.
Molchanov, O.V., 1999. Fracturing as underlying mechanism of
seismo-electric signals. In: Hayakawa, M. (Ed.), Atmospheric and
Ionospheric Electromagnetic Phenomena Associated with Earth-
quakes. Terra Scientific Publishing Co., Tokyo, pp. 349–356.
F. Vallianatos et al. / Physics and Chemistry of the Earth 29 (2004) 339–351 351
Molchanov, O.V., Hayakawa, M., 1998. On the generation mechanism
of ULF seismogenic electromagnetic emissions. Phys. Earth Planet.
Int. 105, 201–210.
Morgan, F.D., Williams, E.R., Madden, T.R., 1989. Streaming
potential properties of Westerly granite with applications. J.
Geophys. Res. 94, 12449–12461.
Nitsan, U., 1977. Electromagnetic emission accompanying fracture of
quartz-bearing rocks. Geophys. Res. Lett. 4, 333–337.
Ogawa, T., Oike, K., Miura, T., 1985. Electromagnetic radiation from
rocks. J. Geophys. Res. 90, 6245–6249.
Park, S.K., Johnston, M.J.S., Madden, T.R., Morgan, F.D., Moris-
son, H.F., 1993. Electromagnetic precursors to earthquakes in the
ULF band: A review of observations and mechanisms. Rev.
Geophys. 31 (2), 117–132.
Patella, D., Tramacere, A., Di Maio, R., 1997. Modelling earth current
precursors in earthquake prediction. Anna. Geof. XL (2), 495–517.
Ponomarev, A.V., Zavyalov, A.D., Smirnov, V.B., Lockner, D.A.,
1997. Physical modelling of the formation and evolution of
seismically active fault zones. Tectonophysics 277, 57–81.
Rohrs, C.E., Melsa, J.L., Schultz, D.G., 1993. Linear Control Systems.
McGraw-Hill, New York.
Sasaoka, H., Yamanaka, C., Ikeya, M., 1998. Measurements of electric
potential variation by piezoelectricity in granite. Geophys. Res.
Lett. 25 (12), 2225–2228.
Scholz, C.H., Sykes, L.R., Aggarwal, Y.P., 1973. Earthquake predic-
tion: A physical basis. Science 181, 803–809.
Scudiero, L., Dickinson, J.T., Enomoto, Y., 1998. The electrification
of flowing gases by mechanical abrasion of mineral surface. Phys.
Chem. Minerals 25, 566–573.
Slifkin, L., 1993. Seismic electric signals from displacement of charged
dislocations. Tectonophysics 224, 149–152.
Sornette, A., Sornette, D., 1990. Earthquake rupture as a critical point:
consequences for telluric precursors. Tectonophysics 179, 327–334.
Stavrakas, I., Anastasiadis, C., Triantis, D., Vallianatos, F., 2003.
Piezo stimulated currents in marble samples: precursory and
concurrent-with-failure signals. Natural Hazards Earth Syst. Sci,
3, 243–247.
Surkov, V., 1999. ULF electromagnetic perturbations resulting from
the fracture and dilatancy in the earthquake preparation zone. In:
Hayakawa, M. (Ed.), Atmospheric and Ionospheric Electromag-
netic Phenomena Associated with Earthquakes. Terra Scientific
Publishing Co., Tokyo, pp. 371–382.
Tomizawa, I., Hayakawa, M., Yoshino, T., Ohta, K., Okada, T.,
Sakai, H., 1994. Observation of ELF/VLF electromagnetic varia-
tions associated with a seismic experimental explosion. In: Haya-
kawa, M., Fujinawa, Y. (Eds.), Electromagnetic Phenomena
Related to Earthquake Prediction. Terra Scientific Publishing
Co., Tokyo, pp. 337–347.
Tuck, B.T., Stacey, F.D., Starkey, J., 1977. A search for the
piezoelectric effect in quartz-bearing rock. Tectonophysics 39, 7–11.
Tzanis, A., Vallianatos, F., 2001. A critical review of electric
earthquake precursors. Anna. Geof. 44 (2), 429–460.
Tzanis, A., Vallianatos, F., 2002. A physical model of electrical
earthquake precursors due to crack propagation and the motion of
charged edge dislocations. In: Hayakawa, M., Molchanov, O.A.
(Eds.), Seismo Electromagnetics: Lithosphere–Atmosphere–Iono-
sphere Coupling. TERRAPUB, Tokyo, pp. 117–130.
Tzanis, A., Vallianatos, F., Gruszow, S., 2000. Identification and
discrimination of transient electrical earthquake precursors: fact,
fiction and some possibilities. Phys. Earth Planet Int. 121, 223–248.
Turcotte, D.L., Newman, W.I., Shcherbakov, R., 2003. Micro and
macroscopic models of rock fracture. Geophys. J. Int. 152, 718–
728.
Vallianatos, F., Tzanis, A., 1998. Electric current generation associated
with the deformation rate of a solid: preseismic and coseismic
signals. Phys. Chem. Earth 23, 933–938.
Vallianatos, F., Tzanis, A., 1999a. A model for the generation of
precursory electric and magnetic fields associated with the defor-
mation rate of the earthquake focus. In: Hayakawa, M. (Ed.),
Atmospheric and Ionospheric Electromagnetic Phenomena Asso-
ciated with Earthquakes. Terra Scientific Publishing Co., Tokyo,
pp. 287–305.
Vallianatos, F., Tzanis, A., 1999b. On possible scaling laws between
electric earthquake precursors (EEP) and earthquake magnitude.
Geophys. Res. Lett. 26 (13), 2013–2016.
Vallianatos, F., Tzanis, A., 2003. On the nature, scaling and spectral
properties of pre-seismic ULF signals. Natural Hazards Earth
Syst. Sci. 3, 237–242.
Varotsos, P., Alexopoulos, K., 1984. Physical properties of the
variations of the electric field of the Earth preceding earthquakes,
I. Tectonophysics 110, 73–98.
Varotsos, P., Lazaridou, M., 1991. Latest aspects of earthquake
prediction in Greece, based on seismic electric signals. Tectono-
physics 188, 321–347.
Varotsos, P., Alexopoulos, K., Lazaridou, M., 1993. Latest aspects on
earthquake prediction in Greece based on seismic electric signals II.
Tectonophysics 224, 1–37.
Warwick, J.W., Stoker, C., Meyer, T.R., 1982. Radio emission
associated with rock fracture: possible application to the great
Chilean earthquake of May 22, 1960. J. Geophys. Res. 87, 2851–
2859.
Whitworth, R.W., 1975. Charged dislocations in ionic crystals. Adv.
Phys. 24, 203–304.
Yoshida, S., Manjgaladze, P., Zilpimiani, D., Ohnaka, M., Nakatani,
M., 1994. Electromagnetic emissions associated with frictional
sliding of rock. In: Hayakawa, M., Fujinawa, Y. (Eds.), Electro-
magnetic Phenomena Related to Earthquake Prediction. Terra
Scientific Publishing Co., Tokyo, pp. 307–322.
Yoshida, S., Uyeshima, M., Nakatani, M., 1997. Electric potential
changes associated with a slip failure of granite: Preseismic and
coseismic signals. J. Geophys. Res. 102, 14883–14897.
Yoshida, S., Oswald, C.C., Sammonds, P.R., 1998. Electric potential
changes prior to shear fracture in dry and saturated rocks.
Geophys. Res. Lett. 25 (10), 1557–1580.
Related Documents