Electric Double Layer at Metal Oxide Surfaces: Static Properties of the Cassiterite-Water Interface Lukas Vlcek,* ,† Zhan Zhang, ‡ Mike L. Machesky, § Paul Fenter, ‡ Jorgen Rosenqvist, | David J. Wesolowski, | Larry M. Anovitz, | Milan Predota, ⊥ and Peter T. Cummings †,# Department of Chemical Engineering, Vanderbilt UniVersity, NashVille, Tennessee 37235-1604, Argonne National Laboratory, Argonne, Illinois 60439, Illinois State Water SurVey, Champaign, Illinois 61820, Chemical Sciences DiVision, Oak Ridge National Laboratory, Oak Ridge, Tennessee 37831-6110, Department of Medical Physics and Biophysics, UniVersity of South Bohemia, JiroVcoVa 24, Ceske BudejoVice 37004, Czech Republic, and Center for Nanophase Material Sciences, Oak Ridge National Laboratory, Oak Ridge, Tennessee 37831-6494 ReceiVed NoVember 12, 2006. In Final Form: January 23, 2007 The structure of water at the (110) surface of cassiterite (R-SnO 2 ) at ambient conditions was studied by means of molecular dynamics simulations and X-ray crystal truncation rod experiments and interpreted with the help of the revised MUSIC model of surface protonation. The interactions of the metal oxide in the simulations were described by a recently developed classical force field based on the SPC/E model of water. Two extreme cases of completely hydroxylated and nonhydroxylated surfaces were considered along with a mixed surface with 50% dissociation. To study the dependence of the surface properties on pH, neutral and negatively charged variants of the surfaces were constructed. Axial and lateral density distributions of water for different types of surfaces were compared to each other and to experimental axial density distributions found by X-ray experiments. Although significant differences were found between the structures of the studied interfaces, the axial distances between Sn and O atoms are very similar and therefore could not be clearly distinguished by the diffraction technique. The explanation of structures observed in the density distributions was provided by a detailed analysis of hydrogen bonding in the interfacial region. It revealed qualitatively different hydrating patterns formed at neutral hydroxylated and nonhydroxylated surfaces and suggested a preference for the dissociative adsorption of water. At negatively charged surfaces, however, the situation can be reversed by the electric field stabilizing a hydrogen bond network similar to that found at the neutral nonhydroxylated surface. Comparison with previously studied rutile (R-TiO 2 ) surfaces provided insight into the differences between the hydration of these two metal oxides, and an important role was ascribed to their different lattice parameters. A link to macroscopic properties was provided by the revised MUSIC surface protonation model. Explicit use of the Sn-O bond lengths based on ab initio calculations and H-bond configurations as inputs led to the prediction of a pH of zero net-proton induced surface charge (pH pzc ) that agrees very well with those determined experimentally (about 4.4 at 298 K). 1. Introduction Metal oxides in contact with aqueous electrolytes are one of the most common heterogeneous systems and play a key role in many geological and biological processes and a range of industrial applications. The properties of the interface are determined mainly by specific surface chemistry, which distinguishes them from simpler systems such as those involving metals or ionic salts. 1,2 The main factor contributing to the complexity, and also to applications such as heterogeneous catalysis, 3 is the presence of various active sites. These include oxygen atoms that can take part in proton uptake and release or in the formation of complexes with other ions. As a result, the properties of the interfacial region, known as the electric double layer (EDL), strongly differ from the aqueous and solid bulk phases and profoundly influence the stability of colloids, crystal nucleation, corrosion, and many other related phenomena. A theoretical description of the EDL requires models that consider both long-range electrostatic effects and the specific nature of the surface groups themselves. Before detailed information on the structure of the interface began to become available, surface protonation processes were typically described with generic 2pK models, which assume that protonation and deprotonation occur on a single type of site, and with the protonation constants determined from empirically fitting titration data. 2,4 In the last few decades, new experimental and compu- tational techniques facilitated the development of theoretical models that are based on a more realistic description of the interface and permit a priori predictions of protonation constants. 5,6 Most successful among these approaches is the revised multisite complexation (MUSIC) model that is able to rationalize the protonation behavior of a variety of metal oxide and hydroxide surfaces, 7,8 including behavior as a function of temperature. 9 * Corresponding author. E-mail: [email protected]. † Vanderbilt University. ‡ Argonne National Laboratory. § Illinois State Water Survey. | Chemical Sciences Division, Oak Ridge National Laboratory. ⊥ University of South Bohemia. # Center for Nanophase Material Sciences, Oak Ridge National Laboratory. (1) Stumm, W. Chemistry of the Solid-Water Interface; Wiley: New York, 1992. (2) Hunter, R. J. Foundations of Colloid Science; Clarendon Press: Oxford, 1991. (3) Somorjai, G. A. Introduction to Surface Chemistry and Catalysis; Wiley: New York, 1994. (4) Schindler, P. W.; Stumm, W. Aquatic Surface Chemistry: Chemical Processes at the Particle-Water Interface; Wiley: New York, 1987. (5) Sverjensky, D. A.; Sahai, N. Geochim. Cosmochim. Acta 1996, 60, 3373. (6) Felmy, A. R.; Rustad, J. R. Geochim. Cosmochim. Acta 1998, 62, 25. (7) Hiemstra, T.; van Riemsdijk, W. H.; Bolt, G. H. J. Colloid Interface Sci. 1989, 133, 91. (8) Hiemstra, T.; Venema, P.; van Riemsdijk, W. H. J. Colloid Interface Sci. 1996, 184, 68. (9) Machesky, M. L.; Wesolowski, D. J.; Palmer, D. A.; Ridley, M. K. J. Colloid Interface Sci. 2001, 239, 314-327. 4925 Langmuir 2007, 23, 4925-4937 10.1021/la063306d CCC: $37.00 © 2007 American Chemical Society Published on Web 03/24/2007

Welcome message from author
This document is posted to help you gain knowledge. Please leave a comment to let me know what you think about it! Share it to your friends and learn new things together.
Transcript
Electric Double Layer at Metal Oxide Surfaces: Static Properties ofthe Cassiterite-Water Interface
Lukas Vlcek,*,† Zhan Zhang,‡ Mike L. Machesky,§ Paul Fenter,‡ Jorgen Rosenqvist,|David J. Wesolowski,| Larry M. Anovitz,| Milan Predota,⊥ and Peter T. Cummings†,#
Department of Chemical Engineering, Vanderbilt UniVersity, NashVille, Tennessee 37235-1604, ArgonneNational Laboratory, Argonne, Illinois 60439, Illinois State Water SurVey, Champaign, Illinois 61820,Chemical Sciences DiVision, Oak Ridge National Laboratory, Oak Ridge, Tennessee 37831-6110,Department of Medical Physics and Biophysics, UniVersity of South Bohemia, JiroVcoVa 24, Ceske
BudejoVice 37004, Czech Republic, and Center for Nanophase Material Sciences, Oak Ridge NationalLaboratory, Oak Ridge, Tennessee 37831-6494
ReceiVed NoVember 12, 2006. In Final Form: January 23, 2007
The structure of water at the (110) surface of cassiterite (R-SnO2) at ambient conditions was studied by means ofmolecular dynamics simulations and X-ray crystal truncation rod experiments and interpreted with the help of therevised MUSIC model of surface protonation. The interactions of the metal oxide in the simulations were describedby a recently developed classical force field based on the SPC/E model of water. Two extreme cases of completelyhydroxylated and nonhydroxylated surfaces were considered along with a mixed surface with 50% dissociation. Tostudy the dependence of the surface properties on pH, neutral and negatively charged variants of the surfaces wereconstructed. Axial and lateral density distributions of water for different types of surfaces were compared to each otherand to experimental axial density distributions found by X-ray experiments. Although significant differences werefound between the structures of the studied interfaces, the axial distances between Sn and O atoms are very similarand therefore could not be clearly distinguished by the diffraction technique. The explanation of structures observedin the density distributions was provided by a detailed analysis of hydrogen bonding in the interfacial region. It revealedqualitatively different hydrating patterns formed at neutral hydroxylated and nonhydroxylated surfaces and suggesteda preference for the dissociative adsorption of water. At negatively charged surfaces, however, the situation can bereversed by the electric field stabilizing a hydrogen bond network similar to that found at the neutral nonhydroxylatedsurface. Comparison with previously studied rutile (R-TiO2) surfaces provided insight into the differences betweenthe hydration of these two metal oxides, and an important role was ascribed to their different lattice parameters. Alink to macroscopic properties was provided by the revised MUSIC surface protonation model. Explicit use of theSn-O bond lengths based on ab initio calculations and H-bond configurations as inputs led to the prediction of a pHof zero net-proton induced surface charge (pHpzc) that agrees very well with those determined experimentally (about4.4 at 298 K).
1. Introduction
Metal oxides in contact with aqueous electrolytes are one ofthe most common heterogeneous systems and play a key role inmanygeological and biological processes and a range of industrialapplications. Theproperties of the interface are determinedmainlyby specific surface chemistry, which distinguishes them fromsimpler systems such as those involving metals or ionic salts.1,2The main factor contributing to the complexity, and also toapplications such as heterogeneous catalysis,3 is the presence ofvarious active sites. These include oxygen atoms that can takepart in proton uptake and release or in the formation of complexeswith other ions.As a result, the properties of the interfacial region,known as the electric double layer (EDL), strongly differ fromthe aqueous and solid bulk phases and profoundly influence the
stability of colloids, crystal nucleation, corrosion, andmany otherrelated phenomena.A theoretical description of the EDL requires models that
consider both long-range electrostatic effects and the specificnature of the surface groups themselves. Before detailedinformation on the structure of the interface began to becomeavailable, surface protonation processeswere typically describedwith generic 2pK models, which assume that protonation anddeprotonation occur on a single type of site, and with theprotonation constants determined fromempirically fitting titrationdata.2,4 In the last few decades, new experimental and compu-tational techniques facilitated the development of theoreticalmodels that are based on a more realistic description of theinterface andpermit a priori predictionsof protonation constants.5,6Most successful among these approaches is the revised multisitecomplexation (MUSIC) model that is able to rationalize theprotonation behavior of a variety of metal oxide and hydroxidesurfaces,7,8 including behavior as a function of temperature.9
* Corresponding author. E-mail: [email protected].† Vanderbilt University.‡ Argonne National Laboratory.§ Illinois State Water Survey.| Chemical Sciences Division, Oak Ridge National Laboratory.⊥ University of South Bohemia.# Center forNanophaseMaterial Sciences,OakRidgeNationalLaboratory.(1) Stumm, W. Chemistry of the Solid-Water Interface; Wiley: New York,
1992.(2) Hunter, R. J. Foundations of Colloid Science; Clarendon Press: Oxford,
1991.(3) Somorjai, G. A. Introduction to Surface Chemistry and Catalysis; Wiley:
New York, 1994.
(4) Schindler, P. W.; Stumm, W. Aquatic Surface Chemistry: ChemicalProcesses at the Particle-Water Interface; Wiley: New York, 1987.(5) Sverjensky, D. A.; Sahai, N. Geochim. Cosmochim. Acta 1996, 60, 3373.(6) Felmy, A. R.; Rustad, J. R. Geochim. Cosmochim. Acta 1998, 62, 25.(7) Hiemstra, T.; van Riemsdijk, W. H.; Bolt, G. H. J. Colloid Interface Sci.
1989, 133, 91.(8) Hiemstra, T.; Venema, P.; van Riemsdijk, W. H. J. Colloid Interface Sci.
1996, 184, 68.(9) Machesky, M. L.; Wesolowski, D. J.; Palmer, D. A.; Ridley, M. K. J.
Colloid Interface Sci. 2001, 239, 314-327.
4925Langmuir 2007, 23, 4925-4937
10.1021/la063306d CCC: $37.00 © 2007 American Chemical SocietyPublished on Web 03/24/2007
Thismodel explicitly considers the various protolyzable oxygenspresent on surfaces and, using the idea of local chargecancellation,10 predicts partial charges of these and, ultimately,protonation constants. To obtain a complete picture of theinterface, a suitable model of the electric double layer must alsobe utilized. Usually a variant of the Stern model is used, whichincludes one or more layers of specifically adsorbed ions and aGouy-Chapman diffuse layer. The combined electrostatic andchemical model is termed a surface complexationmodel (SCM).However, SCMs remain largely ambiguous because titration datacan be fit with a variety of these models, each giving plausiblevalues of various fitting parameters.11,12At present, no single experimental method is able to provide
all of the information needed for an unambiguous description ofthe interface. Therefore, in an effort to obtain a clearer pictureof the interfacial region, results from various experimental andcomputational methods should be combined: (i) macroscopictitrationmeasurements of surface protonation and ion adsorption,whichprovide constraints for theoretical predictions and computermodeling, (ii) X-ray scattering measurements, which providestructural information on the layering ofwater and ion adsorptionand serve as a test for proposed molecular models, (iii) ab initiocalculations, which reveal details of particle interactions andfacilitate the development of classical force fields, and (iv)molecular dynamics simulations, which are needed to obtainmolecular-scale informationon the structure of theEDLextendingover many surface atoms and deep into solution.We have recently applied this combined approach to the study
of the rutile-aqueous solution interface.13,14 The first task of thesimulation part of this effort was to choose a suitable potentialmodel. Ideally, a fully atomistic force field enabling surfaceacid-base reactions and water dissociation should be used.Although dissociablemodels of water have been constructed15,16and applied to study surface protonation,17 they do not providea very good description of thermodynamic properties.Moreover,no dissociativewater-ion potential was available for the systemsstudied.Consequently, a compromise approachwas chosen.Usingab initio calculations, a force field based on the rigid andnonpolarizable SPC/E model of water was developed,18 anddissociation of the interfacial water was mimicked by explicitlybinding the products of dissociation to the surface. Agreementof the simulation predictions of ion adsorption and layering ofinterfacial water on the rutile (110) surface with X-ray experi-ments19 have demonstrated the validity of this approach.
Cassiterite is the focus of our present studies because it isisostructural with rutile and yet differs in several importantrespects. The point of zero charge (pHpzc) of rutile is about 5.4at 298 K whereas it is about 4.4 for cassiterite,20 which meansthat the latter is negatively charged over a larger pH range.Cassiterite also has a much lower dielectric constant than rutile(9 vs 121),21 and according to some thermodynamic consider-ations, permittivity should control whether ions are adsorbed asinner- or outer-sphere complexes.22 Ab initio studies of wateradsorption on the dominant (110) surface predict that whereasadsorption is predominantly associative on rutile (i.e., stays asa molecular water) the cassiterite surface induces increaseddissociative adsorption, which is explained by its larger latticeparameters and higher electronegativity of Sn atoms.23-25 Inboth cases, however, mixed adsorption is possible. Waterdissociation on cassiterite has also been studied by thermaldesorption spectroscopy and ultraviolet photoemission spec-troscopy to investigate the effect of surface defects.26 These resultssuggested that some water molecules are dissociated but thatassociative adsorptionprevails.Thermogravimetricmeasurementsof rutile and cassiterite nanoparticles27 demonstrate that cassiteriteretains at least the first layer of adsorbed water to significantlyhigher temperatures (300-350 °C) than does rutile, which losesthis layer of water gradually over the range of 150-300 °C. Thisis indicative of stronger surface chemical bonds between themetal oxide and hydroxyls created by the dissociation of first-layer water molecules on the cassiterite surface.The objective of the present research is the study of the (110)
surface of cassiterite (R-SnO2) in aqueous environments, and asin the case of rutile, the main focus of the experimental studiesis the adsorption of cations on neutral and negative surfaces. Oursimulations are a first step in these efforts and should providean atomistically detailed description that will aid this overalleffort. In the construction of the surfaces, we are guided by datafrom published potentiometric titrations20 and ab initio calcula-tions.21,28In this article, we investigate the structure of water at various
types of cassiterite surfaces that differ in their charge and degreeof hydroxylation.We adopt the approach utilized in our previoussimulations of rutile13,14 and use a recently developed classicalforce field for cassiterite and its interactions with SPC/Ewater.21First, we describe theMDpotentialmodel and simulation details,and then the experimental background of the X-ray crystal
(10) Pauling, L. J. Am. Chem. Soc. 1929, 51, 1010.(11) Westall, J. C.; Hohl, H. AdV. Colloid Interface Sci. 1980, 12, 265.(12) Ridley,M.K.;Machesky,M. L.;Wesolowski, D. J.; Palmer, D.Geochim.
Cosmochim. Acta 2004, 68, 239.(13) Predota,M.;Bandura,A.V.;Cummings, P. T.;Kubicki, J.D.;Wesolowski,
D. J.; Chialvo, A. A.; Machesky, M. L. J. Phys. Chem. B 2004, 108, 12049-12060.(14) Predota, M.; Zhang, Z.; Fenter, P.; Wesolowski, D. J.; Cummings, P. T.
J. Phys. Chem. B 2004, 108, 12061.(15) Halley, J. W.; Rustad, J. R.; Rahmann, A. J. Chem. Phys. 1993, 98, 4110.(16) Corrales, L. R. J. Chem. Phys. 1999, 110, 9071.(17) Rustad, J. R.; Felmy, A. R. Geochim. Cosmochim. Acta 2005, 69, 1405.(18) Bandura, A. V.; Kubicki, J. D. J. Phys. Chem. B 2003, 107, 11072.(19) Zhang, Z.; Fenter, P.; Cheng, L.; Sturchio, N. C.; Bedzyk, M. J.; Predota,
M.; Bandura, A.; Kubicki, J. D.; Lvov, S. N.; Cummings, P. T.; Chialvo, A. A.;Ridley, M. K.; Benezeth, P.; Anovitz, L.; Palmer, D. A.; Machesky, M. L.;Wesolowski, D. J. Langmuir 2004, 20, 4954.
(20) Kosmulski, M. Chemical Properties of Material Surfaces; MarcelDekker: New York, 1987.(21) Bandura, A. V.; Sofo, J.; Kubicki, J. D. J. Phys. Chem. B 2006, 110, 8386.(22) Sverjensky, D. A. Nature 1993, 364, 776.(23) Goniakowski, J.; Gillan, M. J. Surf. Sci. 1996, 350, 145.(24) Lindan, P. J. D. Chem. Phys. Lett. 2000, 328, 325.(25) Batzill, M.; Diebold, U. Prog. Surf. Sci. 2005, 79, 47.(26) Gercher, V. A.; Cox, D. F. Surf. Sci. 1995, 322, 177.(27) Mamontov, E.; Vlcek, L.; Wesolowski, D. J.; Cummings, P. T.; Wang,
W.; Anovitz, L. M.; Rosenqvist, J.; Brown, C. M.; Sakai, V. G. J. Phys. Chem.C 2007, 111, 4328.(28) Bandura, A. V.; Sofo, J.; Kubicki, J. D. To be submitted for publication.
Table 1. Atomic Charges and Lennard-Jones Parameters forSPC/E Water29 and Ions30
atom qi [e] !ii [Å] !ii [kJ/mol]O -0.8476 3.166 0.65H 0.4238 0.0 0.0Sr2+ 2.0 3.324 0.418Cl- -1.0 4.401 0.418
Table 2. Force Field Parameters for SnO2 and Its Interactionswith Water
Buckingham: eq 3 Bij [kJ/mol] Fij [Å] Cij [kJ/(mol Å6)]Sn-Sn 90 547 100 0.205 608Sn-O 10 364 150 0.169 1544O-O 465 467 0.273 4699
Lennard-Jones: eq 1 !ij [Å] !ij [kJ/mol]Sn-Ow 2.674 0.2067O-Ow 2.814 0.4213(H)O-Ow 3.093 0.1783
4926 Langmuir, Vol. 23, No. 9, 2007 Vlcek et al.
truncation rodmeasurements is introduced. The predicted densitydistributions of water from MD simulations of various types ofsurface forms are compared to each other and to the results fromthe X-ray reflectivity experiments. More information on thestructure of the first hydration layers is obtained from theorientation ofwatermolecules and a detailed analysis of hydrogenbonding. Electrostatic properties of the EDL are described anddiscussed using the calculated charge distribution, electric field,and potentials.Where possible, the results are compared to thoseobtained for rutile. Finally, the simulation results are used asinputs into the revised MUSIC surface protonation model toderive a theoretical prediction of the protonation constants ofindividual surface groups as well as the corresponding pHpzcvalue. The predictions are then related to experimental resultsfrom potentiometric titrations.
2. Models and Methods2.1. Force Field. The choice of the potential model was a
compromise between a description as realistic as possible andthe practical feasibility of the simulations. To obtain informationabout the structure of the double layer including regions fartherfrom the interface, where the properties approach those of bulkphases and to capture larger structures at the interface, severalthousand particles are needed in both the liquid and solid phases.At present, ab initio calculations cannot be performed on systemsof this size; therefore, classical force fields must be used.The SPC/E model29 was chosen because of its ability to
reproduce the phase envelope of bulk water accurately, as wellas the liquidwater structure, diffusivity, and dielectric propertiesover a wide range of temperatures and densities. The wholeforce field was then adapted to conform to this choice. Ion-water interactions were represented by a proven set of potentialsoptimized for SPC/E water.30 All interactions in the liquid phasecan be cast in the same functional form
where rij is the distance between sites i and j, !ij and !ij areLennard - Jones parameters for i-j interaction, and qi is thecharge of site i. The parameters for the i-i interaction of waterand ions used in this article are listed in Table 1. The crossparameterswere derived from the Lorentz-Berthelot combiningrules,
The force field for bulk cassiterite, surface groups, and theirinteractions with SPC/E water was developed on the basis ofDFT calculations. Details of this procedure and testing of theforce field are given in ref 21. Non-Coulombic interactionsbetween cassiterite atoms were fitted with the Buckinghampotential
Interactions with water were fitted with the Lennard-Jonespotential, which is the first term of eq 1. When compared to theSPC/E-rutile potential, the non-Coulombic interactions for
cassiterite are stronger. This fact also had to be reflected in themodified potentials for ion-cassiterite interactions to preventan artificial imbalance between the attraction of water and ionsto the surface. Because no ab initio data were available for thisinteraction, Lorentz-Berthelot combining rules were applied toSPC/E-ion and SPC/E-cassiterite interactions to derive pa-rameters appropriate for ion-cassiterite interactions. The pa-rameters of solid-solid and solid-liquid interactions are listedin Table 2. Because this particular study deals only with thestructure ofwater, the actual formof the ion-cassiterite potentialis not very important because ions serve only to counterbalancethe surface charge.To make the simulations faster and allow them to span longer
time intervals, the force field described in ref 21 has been adapted.We followed the same approach as in ref 13 and fixed all solid-phase atoms in space except those of the protolyzable surfaceoxygens. Bulk cassiterite geometry was set according toexperimental data fromX-ray spectroscopy, and the positions ofatoms in the relaxed surface layers were taken from the DFTcalculations.28 The immobilization of atoms substantially reducescomputational requirements and, as was verified in ref 13, doesnot lead to any noticeable artifacts compared to a fully flexiblemodel. Charges obtained from the DFT calculations are listedin Table 3, and the parameters of the fixed geometry of bulkcassiterite along with the relaxation of (110) surface layers aregiven in Table 4. In these Tables and the following text, thesubscripts define the structural positions of atoms at the (110)surface. The vacuum termination of this surface consists of 5-fold-
(29) Berendsen, H. J. C.; Grigera, J. R.; Straatsma, T. P. J. Phys. Chem. 1987,91, 6269.(30) Lee, S. H.; Rasaiah, J. C. J. Phys. Chem. 1996, 100, 1420-1425.
Table 3. Charges of the SnO2 Surface Atoms Obtained fromVASP Calculationsa
atom N0 Nn H0 HnSn(bulk) 2.050O(bulk) -1.025Snb 2.020 1.994 2.020 2.002Snt 2.020 1.994 2.020 2.002Os -1.035 -1.035 -1.035 -1.035Os -1.010 -1.037 -0.940 -0.974Ob (B) -0.960 -0.987 na -0.978Ob (HB) na na -0.983 -1.000Hb (HB) na na 0.476 0.458Ot (T) na -0.972 -0.945 -0.963Ht (T) na 0.396 0.422 0.404a N and H denote nonhydroxylated and hydroxylated surfaces and
subscripts 0 and n denote zero and negative surface charge. The chargesat the neutral mixed surface are the same as those at correspondingatoms ofN0 andH0.Charges at negative surfaceswere assigned accordingto the procedure based on scaling atom charges in small tin clusters.28na denotes that a value is not applicable.
Table 4. Relaxation of the SnO2 (110) Surface Based on AbInitio Calculationsa
atom N0 Nn H0 Hn M0
Snb 0.10 0.10 -0.04 0.00 0.03Snt -0.06 -0.06 0.03 0.03 -0.01Os 0.05 0.05 -0.02 0.00 0.03Ob (B) 1.31 (1.34) 1.39 na 1.29 1.31 (1.29)Ob (HB) na na 1.34 (1.33) 1.44 1.47 (1.36)Ot (T) na 2.10 2.08 (2.08) 2.11 2.08 (2.11)Ot (W1) 2.18 (2.06) 2.20 na na 2.20 (2.13)
a The relaxation is given as axial distanceswith respect to the unrelaxedSn-Osurface plane in angstroms.Numbers for flexible atoms are averageaxial distances in MD simulations. Axial distances for surface oxygensin MD generally differ from the actual ab initio values, which are, forneutral surfaces, shown in parentheses. “M0” denotes the neutral mixedsurface, and the meaning of the remaining symbols is the same as inTable 3.
uij(rij) ) 4!ij[(!ijrij)12- (!ijrij)
6] + qiqj4"!0rij
(1)
!ij ) !!ii!jj !ij )!ii + !jj2 (2)
uij(rij) ) Bij exp(- rijFij) - Cij
rij6 (3)
Electric Double Layer at Metal Oxide Surfaces Langmuir, Vol. 23, No. 9, 2007 4927
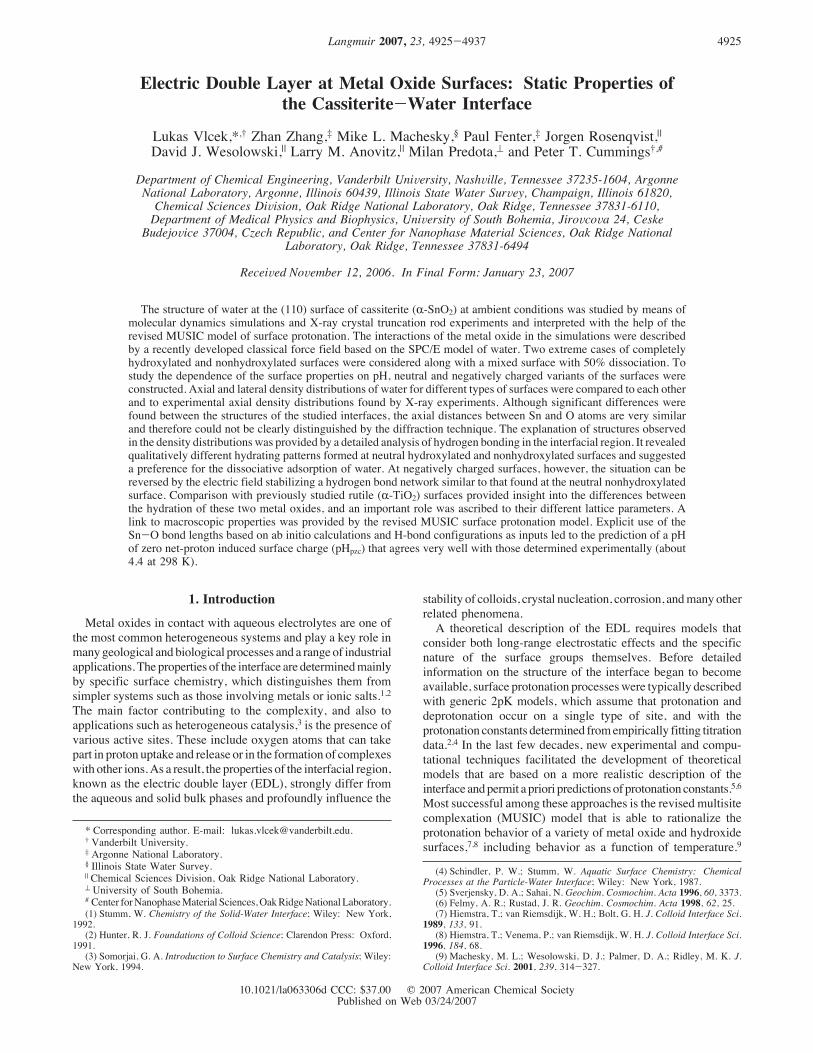
coordinated “terminal” tin atoms (Snt), coplanar 3-fold-coordinated oxygen (Os), and 6-fold-coordinated “bridging” tinatoms (Snb). The 6-fold tin atoms are bonded to 2-fold-coordinatebridging oxygens (Ob), which protrude above the surface plane.When this surface is in contactwith air orwater, awatermoleculeimmediately chemisorbs atop each Snt, designated the terminaloxygen (Ot) site. If the water molecule at this site dissociates toa hydroxyl group, then the proton bonded to the Ot atom isdesignated Ht, and the one bonded to Ob is designated Hb. Notethat Ot may be the oxygen of a bonded hydroxyl group or achemisorbed water molecule associated with the Snt site. Tofacilitate the discussion that follows, in addition to the individualatom designations, we adopt the following abbreviations of thesurface structures and atomgroups: T- terminal hydroxyl group,B - unprotonated bridging oxygen, BH - bridging hydroxylgroup, and W1 - molecular (associated) water chemisorbed toSnt atoms. For an illustration of the terminology, see Figure 1.As has already been mentioned, if a water model capable of
dissociation were to be used, then surface structures and chargewould develop naturally via adsorption of hydroxyls and protonsfrom dissociated water molecules, depending on the pH of thesolution. Because SPC/E water cannot dissociate and we wantto study the influence of pH, the hydroxyl groups and protonshave to be added to themetal oxide surface by creating permanentbonds. Guidance in the construction of surfaces with a givencharge and corresponding to a certain pH was obtained fromtitrations20 and complimentary ab initio calculations.21
From titrations, we know that the pHpzc of powdered formsof cassiterite is about 4.4.20 Supposing that this value isapproximately the same for the investigated (110) surface (as istrue for rutile31), we can match the neutral surface with this pHvalue. Also, we can find an appropriate surface charge for theneutral pH of water or aqueous solution. Because titration or anyother single available experimental technique does not provideunequivocal information on the degree of dissociation of surfacewater molecules, this information was derived from ab initiocalculations. It was found that the most stable surface config-uration is the onewith all watermolecules dissociated, butmixedassociative and dissociative hydration is also possible.21,23-25,28To take into account both extreme possibilities of water
dissociation, we constructed two types of neutral surfaces: onewith all water molecules dissociated, here termed hydroxylated(H), and one with no dissociation, called nonhydroxylated (N).In the latter type of surface, only SPC/E molecules are found inthe first hydration layer. Both surfaces are depicted in Figure 1.In addition, we constructed a neutral mixed surface (M) with50% dissociation, whichwas used primarily for H-bond analysisand as input into the MUSIC model calculations. The atoms ofthe nonhydroxylated surface are all fixed, whereas the remainingsurfaces contain two types of flexible groups: terminal hydroxylsbonded to Snt atoms and bridging hydroxyls bonded to two Snbatoms. These groups were kept flexible because, as was verifiedin preliminary simulations, they can form various stableconfigurations depending on their hydrogen bondingwithwater.The distance between pairs of chemically bonded atoms (Sn, O,and H) was fixed at equilibrium values obtained from ab initiocalculations, and the angle H-O-Sn was allowed to bendaccording to the harmonic potential
with the force constant kij and equilibrium angle #0 given inTable 5. Unlike other similar potentials, nonbonded interactions(i.e.,Coulombic repulsion) betweenHandSnatomswere retained.To study solutions at neutral pH and the adsorption of cations,
negatively charged surfaces were constructed. One of them wasderived from the hydroxylated surface by removing the protonfrom some of the bridging hydroxyl groups, which are knownto be more acidic than bare terminal oxygens. The other formwas derived from the nonhydroxylated surface by replacing somewater molecules chemisorbed to Snt atoms with negativelycharged terminal hydroxyl groups. The surface relaxation andbond lengths in surface hydroxyls were found to change uponcharging; the appropriate values are given in Tables 4 and 5.
(31) Fitts, J. P.; Machesky, M. L.; Wesolowski, D. J.; Shang, X.; Kubicki, J.D.; Flynn, G. W.; Heinz, T. F.; Eisenthal, K. B. Chem. Phys. Lett 2005, 411,399-403.
Figure 1. Structure of the neutral nonhydroxylated (top) andhydroxylated (bottom) (110) cassiterite surfaces. Tin atoms areyellow, oxygens are red, and hydrogens are white. Labels denotingdifferent atom types correspond to the notation adopted in the text.Symbols in capital letters (B, W1, BH, and T) denote surface atomgroups shown directly below.
Table 5. Bond Lengths, l, and Angle Bending PotentialParameters (Equation 4) for Surface Groups of Neutral and
Charged Surfaces
bondl [Å]
(neutral)l [Å]
(mixed and charged)Sn-Ot 2.06 2.10Ot-Ht 0.99 0.99Sn-Ob(BH) 2.11 2.15Ob-Hb 1.01 1.01Sn-Ob(B) 2.00 2.05Sn-O(bulk) 2.057 2.057angle kij [kJ/(mol‚rad2)] #0 [deg]Sn-O-H 127.3 86.9
uij )kij2 (# - #0)
2 (4)
4928 Langmuir, Vol. 23, No. 9, 2007 Vlcek et al.
Because each hydrogen lost to deprotonation carries away awhole positive charge but hydrogens bonded in hydroxyl groupscarry only a partial charge, the difference must be compensatedfor by other surface atoms. In ref 13, the problem was solvedby evenly distributing the remaining charge among selectedsurface atoms. We utilized a similar approach, and the resultingcharges are listed in Table 3.The total surface charge for a normal pH range and a given
concentration of salt was determined from titrations. It was foundthat charge development on cassiterite is lower than on rutilewith respect to their respective pHpzc values. However, becausewe were interested mainly in the local structural phenomena,such as the structure of water and ion complexes, which are notvery sensitive to the total charge, we retained the same chargeper surface structural unit as in the study of rutile surfaces.13 Inthe case of cassiterite, the resulting surface charge was -0.187C/m2 andwas compensated for by oppositely chargedSr2+ cationsin the solution so that the whole system remained neutral. Therequired number of protonswas removed frombridging oxygensof the hydroxylated surface, or the same number of terminalhydroxyl groups was added to the nonhydroxylated surface sothat the resulting negative siteswere arranged in a regular patternwith minimal Coulombic repulsion.2.2. SimulationDetails.To study cassiterite surfaces, we used
molecular dynamics simulations in the NVT ensemble withtemperature set to 298K. The system consisted of two cassiteriteplateswith a liquid phase between them.The solidwas constructedfrom a basic unit of size 6.372 " 6.699 " 6.699 Å3 replicatedsix times in the x and y directions (parallel to the surface) andtwo times in the z direction. The distance between the solidplates was set to values slightly greater than 40 Å so that thedensity of water in the middle of the simulation box was equalto that of bulk liquid SPC/E water at 298 K. The liquid phasecontained 2048 water molecules that could be replaced by ionsor dissociated surface hydroxyls, depending on the systemcomposition. For charged systems, the total negative surfacecharge in the simulation box was equal to 36e and wascompensated for by the equivalent positive charge of Sr2+ cationsin the solution, which were chosen for compatibility with theprevious study of rutile13 and the availability of experimentalX-ray data for this heavy ion.Long-range Coulombic forces were computed using the 3D
Ewald summation with a 2D correction (EW3DC).32 A vacuumgap, required by the method, between the outer sides of thecassiterite plates was about 1.5 times the distance between thesurfaces, resulting in the size of the simulation box in the zdirection of about 150 Å. The real space cutoff distance rcut wasset to 12.66 Å, the number of reciprocal vectors kmax was 5, andparameter R was 3.09/rcut.A fourth-order predictor corrector method and quaternion
formalismwas used to integrate equations ofmotion in the liquidphase. As in ref 13, themotion of surface oxygens and hydroxylswith constrained chemical bondswas computedusing theSHAKEalgorithm.33 All atoms at and below the surface layer of the solidphase (including the Snt, Snb, and Os atoms) were fixed in theirab initio configurations.18,21 The temperature of the liquid phasewas held constant by the Nose-Hoover thermostat,34 and thesurface groups were thermostated through their interaction withthe liquid. The systemwas equilibrated for more than 1.0 ns, andproduction runs typically covered 1 to 2 ns with a time step of1.0 or 1.2 fs.
2.3. X-rayReflectivityMeasurements.X-ray reflectivity hasbeen successfully applied to understand the oxide-water interfacewith sub-angstrom structural resolution.19,35-39 A detaileddescription of the method can be found in ref 38. In this study,the SnO2 (110) surface specular reflectivity is measured as afunction of momentum transfer, Q ) 4" sin #/$, where # is theincident angle of the X-ray beam with respect to the surfaceplane and $ is the X-ray wavelength. The interfacial structureis obtained with nonlinear %2 fitting by optimizing the calculatedreflectivity with respect to the measured data.Cassiterite single crystals, typically in the form of hollow
prisms with the (110) crystal surface predominantly developedand with the prism faces typically measuring 1 " 5 and 2 " 10mm2, were synthesized using the technique described in ref 40.Multiple samples were measured to separate out the effect ofextrinsic factors such as the surface roughness and solutionthickness. Three measurements are shown here and are referredto as samples A, B, and C. All of the samples were first cleanedin deionized water (DIW), alcohol, dilute nitric acid, DIW, andhydrogen peroxide in such order in an ultrasonic bath. SamplesA and B were then polished, hydrothermally treated in DIWovernight at 220 °C, and rinsed several times with DIW. SampleC was hydrothermally treated without polishing.SampleAwasmeasured at beamlineXOR-12IDD (Advanced
Photon Source (APS), Argonne National Laboratory (ANL))with aCyberStar point detector. Samples B andCweremeasuredat beamlines XOR-11IDD andXOR-12BMB, respectively, witha CCD area detector.41 All measurements were carried out atroom temperature (25 °C). A sample was mounted in the cell inDIW, as described previously.42 During the measurements, thesample cell was sealed so that a macroscopic thickness (>2 µm)of DIW was present above the sample surface. The pH of theDIW inside of the sample cell, which had been fully equilibratedwith air, should be around 5.5 (i.e., saturated with dissolvedCO2). X-ray photon energies of 17.5, 16, and 16.5 keV wereused for samples A, B, and C, respectively. In each case, thesamplewasmountedwith its long axis oriented along the incidentbeam direction. The cassiterite samples sometimes had ameasurable “miscut” (i.e., a difference in the orientation of thephysical surface plane with respect to the crystallographic (110)plane) due to details of the growth process. This miscut anglewas found to be different for each sample, corresponding to 0.6,0.0, and 0.9° for samples A, B, and C, respectively. For samplesA and C, the maximum miscut directions are 60 and 10° awayfrom the incident beam direction, respectively.Themeasured reflectivities were normalizedwith the incident
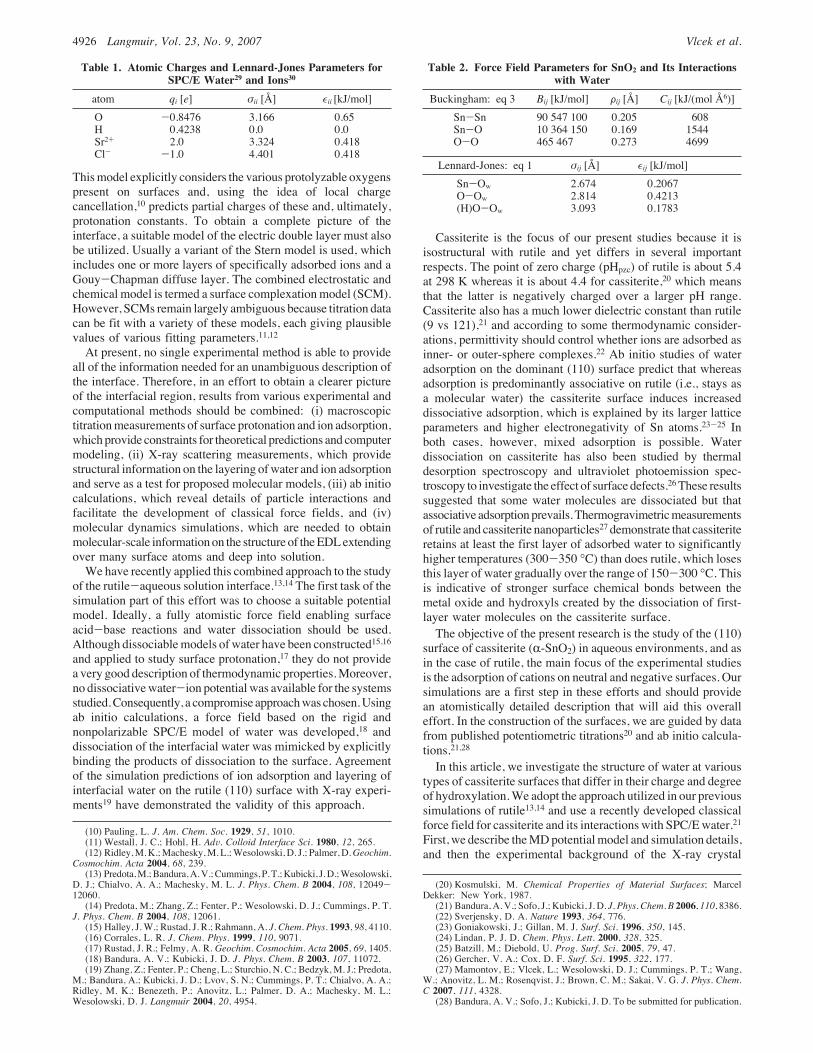
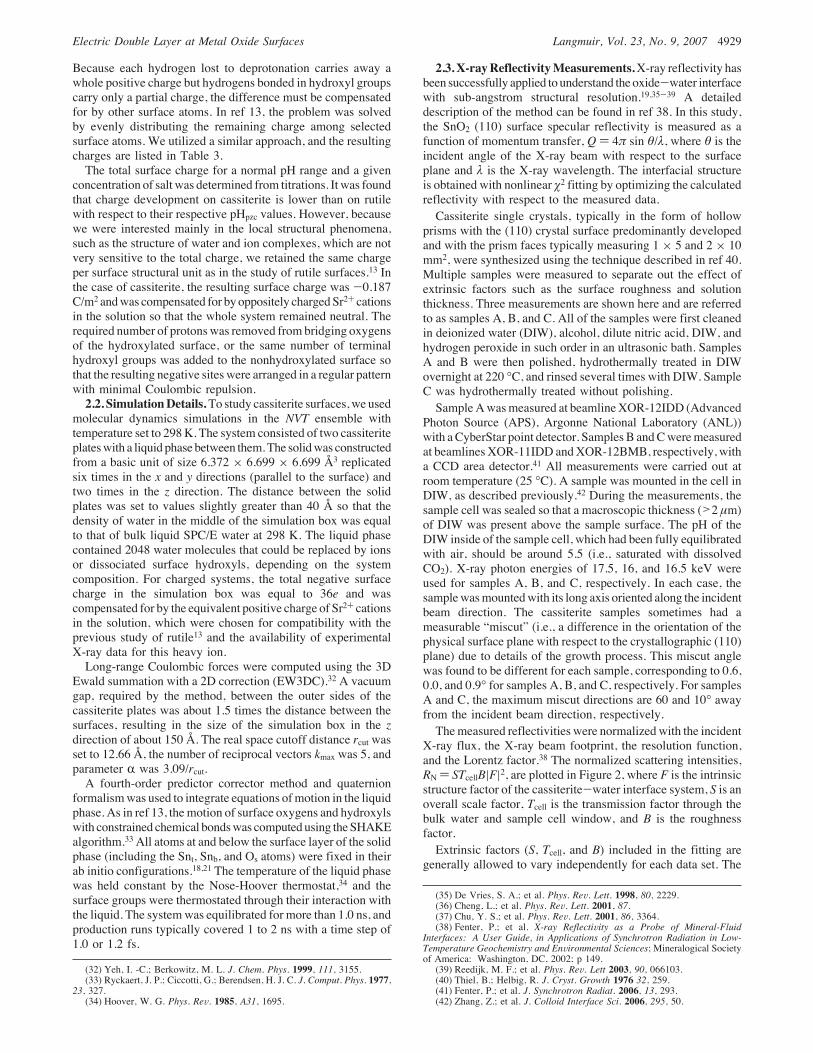
X-ray flux, the X-ray beam footprint, the resolution function,and the Lorentz factor.38 The normalized scattering intensities,RN) STcellB|F|2, are plotted in Figure 2, where F is the intrinsicstructure factor of the cassiterite-water interface system, S is anoverall scale factor, Tcell is the transmission factor through thebulk water and sample cell window, and B is the roughnessfactor.Extrinsic factors (S, Tcell, and B) included in the fitting are
generally allowed to vary independently for each data set. The
(32) Yeh, I. -C.; Berkowitz, M. L. J. Chem. Phys. 1999, 111, 3155.(33) Ryckaert, J. P.; Ciccotti, G.; Berendsen, H. J. C. J. Comput. Phys. 1977,
23, 327.(34) Hoover, W. G. Phys. ReV. 1985, A31, 1695.
(35) De Vries, S. A.; et al. Phys. ReV. Lett. 1998, 80, 2229.(36) Cheng, L.; et al. Phys. ReV. Lett. 2001, 87.(37) Chu, Y. S.; et al. Phys. ReV. Lett. 2001, 86, 3364.(38) Fenter, P.; et al. X-ray ReflectiVity as a Probe of Mineral-Fluid
Interfaces: A User Guide, in Applications of Synchrotron Radiation in Low-Temperature Geochemistry and EnVironmental Sciences; Mineralogical Societyof America: Washington, DC, 2002; p 149.(39) Reedijk, M. F.; et al. Phys. ReV. Lett 2003, 90, 066103.(40) Thiel, B.; Helbig, R. J. Cryst. Growth 1976 32, 259.(41) Fenter, P.; et al. J. Synchrotron Radiat. 2006, 13, 293.(42) Zhang, Z.; et al. J. Colloid Interface Sci. 2006, 295, 50.
Electric Double Layer at Metal Oxide Surfaces Langmuir, Vol. 23, No. 9, 2007 4929
roughness factor is in the form of two independent partialcassiterite layers on top of the bulk crystal, with each layer oneunit cell high and occupancy factors of S1occ for the top layerand S2occ for the bottom one. Only two partial layers are includedin the model instead of the more widely used & factor,43 wherea series of partial layers are present, because the former givesa better quality of fit. The fit is less sensitive to the transmissionfactor, or the bulk water thickness; therefore, a single thicknessis applied to all three data sets in the fitting to reduce the numberof parameters.In the structure model, a single intrinsic interfacial structure
is used for all three data sets. The starting model for the fit isbased on the best-fit rutile (110)-water interfacial structuredescribed previously44 given the similarity of the cassiterite andrutile crystal structures. The model allows the relaxation of thetop layer of Sn atoms and the O atoms at the bridging (Ob) andterminal (Ot) sites. The oxygen atom at the Ot site could be eitheran adsorbed water molecule or a hydroxyl group because amonolayer of protons is essentially invisible to the X-ray beam.One more adsorbed layer of water molecules (AW2) above theOt sites is also included. Structureless bulk water, modeled withan error function profile whose position is a fitting parameter,is included in the model because a more detailed layered bulkwater structure does not improve the quality of fit.38 The Ossurface atom is fixed at its bulk lattice position because its effecton the reflectivity is negligible in the presence of much heavierSn atoms at the same height. Equal occupancy is assumed forthe occupancy factors of Snt andSnb because they are not uniquelydetermined by the specular reflection alone. However, fitting theoccupancy factors for Ot and Ob always yields large error bars(#0.5) without a significant impact on the fitting quality (%2).Therefore, we believe that it is physically plausible to link theoccupancy factors of Ot and Ob to those of the underlying Sntand Snb sites (i.e., a single occupancy factor is used in the fit forall four sites). The Debye-Waller factors are not fitted becausethey are not well confined by the CTR data. The bulk values ofthe cassiterite crystal are used for the bulk atoms,45 0.1 Å is usedfor the Ot and Ob atoms, and 0.2 Å is used for the adsorbed watermolecules. The total number of fitting parameters is 16, with 8of them describing the structure intrinsic to the cassiterite-DIWinterface and the other 8 describing the extrinsic factors. Exceptfor the three overall scale factors, which are not related to theinterfacial structure at all, all of the fitting parameters are listedin Table 7.
3. Results and Discussion
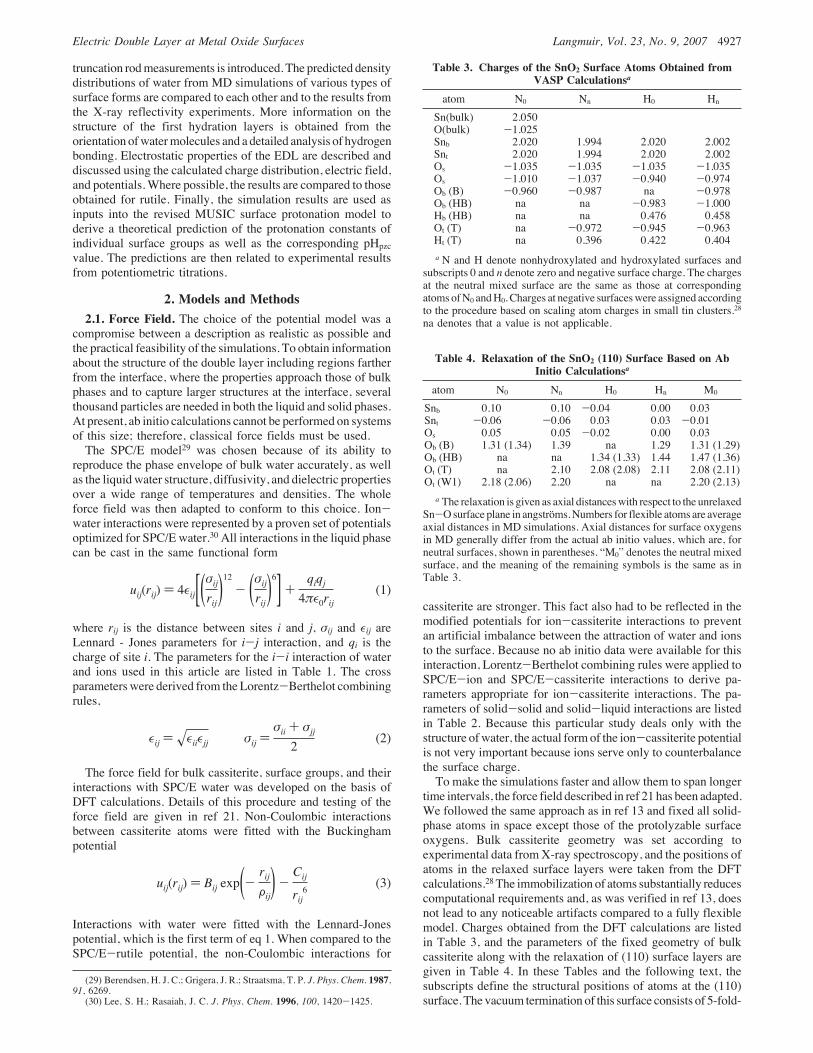
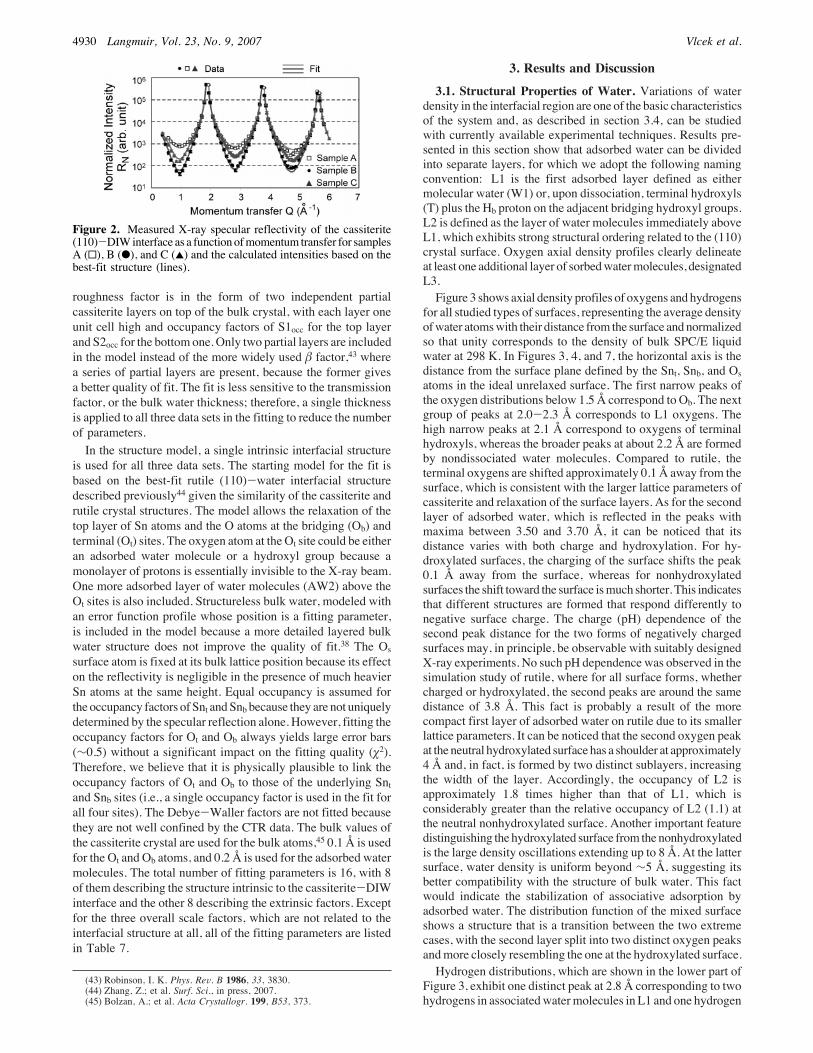
3.1. Structural Properties of Water. Variations of waterdensity in the interfacial region are one of the basic characteristicsof the system and, as described in section 3.4, can be studiedwith currently available experimental techniques. Results pre-sented in this section show that adsorbed water can be dividedinto separate layers, for which we adopt the following namingconvention: L1 is the first adsorbed layer defined as eithermolecular water (W1) or, upon dissociation, terminal hydroxyls(T) plus the Hb proton on the adjacent bridging hydroxyl groups.L2 is defined as the layer of water molecules immediately aboveL1, which exhibits strong structural ordering related to the (110)crystal surface. Oxygen axial density profiles clearly delineateat least one additional layer of sorbedwatermolecules, designatedL3.Figure 3 shows axial density profiles of oxygens and hydrogens
for all studied types of surfaces, representing the average densityofwater atomswith their distance from the surface andnormalizedso that unity corresponds to the density of bulk SPC/E liquidwater at 298 K. In Figures 3, 4, and 7, the horizontal axis is thedistance from the surface plane defined by the Snt, Snb, and Osatoms in the ideal unrelaxed surface. The first narrow peaks ofthe oxygen distributions below 1.5 Å correspond to Ob. The nextgroup of peaks at 2.0-2.3 Å corresponds to L1 oxygens. Thehigh narrow peaks at 2.1 Å correspond to oxygens of terminalhydroxyls, whereas the broader peaks at about 2.2 Å are formedby nondissociated water molecules. Compared to rutile, theterminal oxygens are shifted approximately 0.1 Å away from thesurface, which is consistent with the larger lattice parameters ofcassiterite and relaxation of the surface layers. As for the secondlayer of adsorbed water, which is reflected in the peaks withmaxima between 3.50 and 3.70 Å, it can be noticed that itsdistance varies with both charge and hydroxylation. For hy-droxylated surfaces, the charging of the surface shifts the peak0.1 Å away from the surface, whereas for nonhydroxylatedsurfaces the shift toward the surface ismuch shorter. This indicatesthat different structures are formed that respond differently tonegative surface charge. The charge (pH) dependence of thesecond peak distance for the two forms of negatively chargedsurfaces may, in principle, be observable with suitably designedX-ray experiments. No such pH dependence was observed in thesimulation study of rutile, where for all surface forms, whethercharged or hydroxylated, the second peaks are around the samedistance of 3.8 Å. This fact is probably a result of the morecompact first layer of adsorbed water on rutile due to its smallerlattice parameters. It can be noticed that the second oxygen peakat the neutral hydroxylated surface has a shoulder at approximately4 Å and, in fact, is formed by two distinct sublayers, increasingthe width of the layer. Accordingly, the occupancy of L2 isapproximately 1.8 times higher than that of L1, which isconsiderably greater than the relative occupancy of L2 (1.1) atthe neutral nonhydroxylated surface. Another important featuredistinguishing the hydroxylated surface from the nonhydroxylatedis the large density oscillations extending up to 8 Å. At the lattersurface, water density is uniform beyond #5 Å, suggesting itsbetter compatibility with the structure of bulk water. This factwould indicate the stabilization of associative adsorption byadsorbed water. The distribution function of the mixed surfaceshows a structure that is a transition between the two extremecases, with the second layer split into two distinct oxygen peaksandmore closely resembling the one at the hydroxylated surface.Hydrogen distributions, which are shown in the lower part of
Figure 3, exhibit one distinct peak at 2.8 Å corresponding to twohydrogens in associatedwatermolecules in L1 and one hydrogen
(43) Robinson, I. K. Phys. ReV. B 1986, 33, 3830.(44) Zhang, Z.; et al. Surf. Sci., in press, 2007.(45) Bolzan, A.; et al. Acta Crystallogr. 199, B53, 373.
Figure 2. Measured X-ray specular reflectivity of the cassiterite(110)-DIWinterface as a function ofmomentum transfer for samplesA (0), B (b), and C (2) and the calculated intensities based on thebest-fit structure (lines).
4930 Langmuir, Vol. 23, No. 9, 2007 Vlcek et al.
from L2. At hydroxylated surfaces, the distribution is split intoseveral peaks, with hydroxyl hydrogens forming those below2.8 Å. The peak at 2.1 Å is composed of contributions from bothbridging and terminal hydrogens, implying that a large portionof the terminal O-H bonds are oriented parallel to the surface,whereas bridging O-H bonds are directed toward the solution.The effect of negative charge is seen in the increased numberof hydrogens at smaller distances.More information about the relative positions of hydrogens
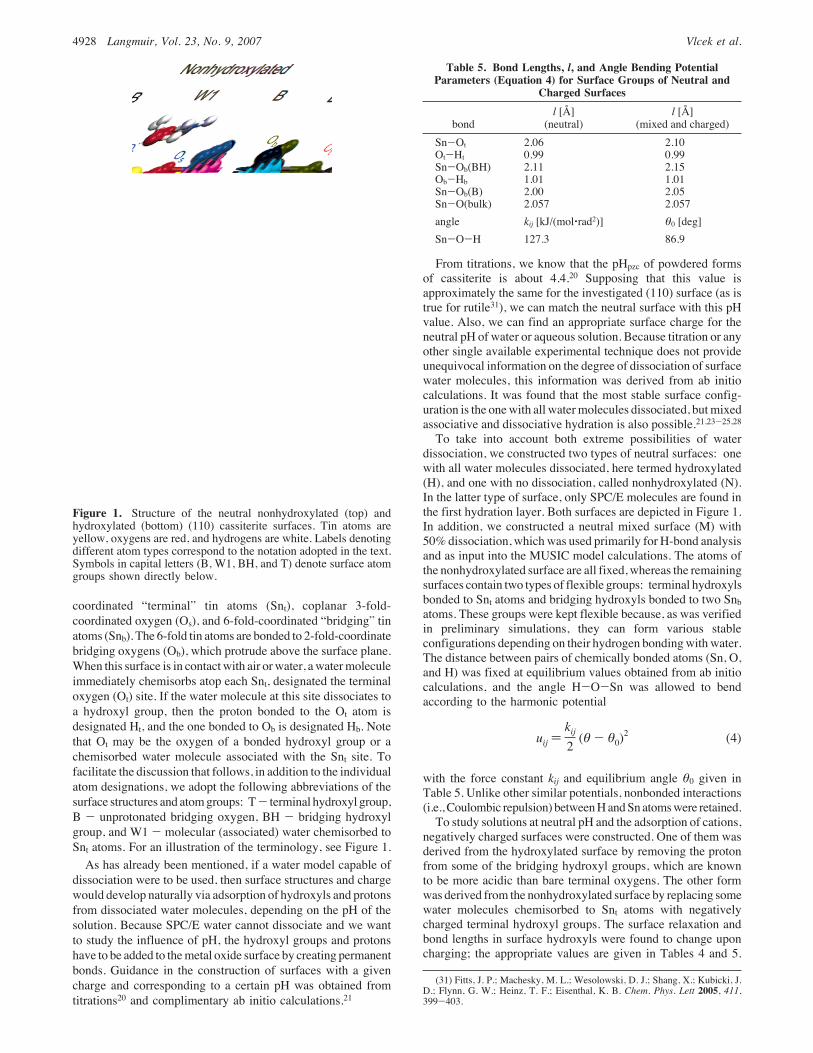
and oxygens at different surfaces can be extracted from theanalysis of the averaged orientation of the water dipole moment,µ, shown in Figure 4. Although these profiles do not providecomplete information on the orientational arrangement ofindividual molecules,46 they are a good indicator of changes in
the electric double layer caused by surface charge. It can beobserved that at the neutral nonhydroxylated surface the meanorientation of dipoles in the first layer is away from the surface(cos # > 0). Then in the second layer, the direction is towardthe surface (cos#>0), and so on.At the charged nonhydroxylatedsurface, the behavior remains almost the same, but the averageorientation is slightly shifted toward the surface. Much largerchanges are found for water at hydroxylated surfaces. Here, atthe neutral surface, the average dipole orientation in the first part
(46) Jedlovszky, P.; Vincze, A.; Horvai, G. Phys. Chem. Chem. Phys. 2004,6, 1874.
Table 6. Hydrogen Bond Analysis for Neutral Surfacesa
x - y NHB(Hx) NHB(Ox) NHB(Oy) NHB(Hy)lHB(Hx)[Å]
lHB(Hy)[Å] x - y NHB(Hx) NHB(Ox) NHB(Oy) NHB(Hy)
lHB(Hx)[Å]
lHB(Hy)[Å]
NonhydroxylatedB -W1 0.0 0.10 0.0 0.10 2.06 W1 - L3 0.36 0.01 0.16 0.00 1.97 2.19B - L2 0.0 1.24 0.0 0.99 1.65 L2 - L2 0.37 0.37 0.37 0.37 1.96 1.96W1 -W1 0.09 0.09 0.09 0.09 2.09 2.09 L2 - L3 0.44 0.77 0.24 0.42 1.94 1.91W1 - L2 1.08 0.03 0.87 0.02 1.90 2.09
HydroxylatedBH - T 0.30 0.06 0.30 0.06 2.21 2.27 T - L2 0.55 1.31 0.31 0.74 1.87 1.74BH - L2 0.72 0.07 0.53 0.05 1.79 1.97 L2 - L2 0.31 0.31 0.31 0.31 1.99 1.99T - T 0.28 0.28 0.28 0.28 2.01 2.01 L2 - L3 0.70 0.58 0.40 0.33 1.90 1.91
MixedB - T 0.0 0.07 0.0 0.07 2.34 T -W1 0.09 0.29 0.09 0.29 2.13 1.91B -W1 0.0 0.01 0.0 0.01 1.92 T - L2 0.69 1.16 0.20 0.34 1.87 1.73B - L2 0.0 1.29 0.0 0.38 1.64 W1 - L2 1.39 0.01 0.41 0.0 1.86 2.15BH - T 0.43 0.06 0.43 0.06 2.05 2.18 L2 - L2 0.50 0.50 0.50 0.50 1.92 1.92BH -W1 0.12 0.01 0.12 0.01 2.19 2.02 L2 - L3 0.56 0.58 0.37 0.39 1.91 1.90BH - L2 0.49 0.21 0.14 0.06 1.82 1.91
a The first column defines which of the surface species are bonded, the symbolNHB(Hx) denotes the number of hydrogen bonds formed by hydrogen,H, of a group or molecule x with a complementary site of a group or molecule y, and lHB(Hx) denotes the average length of a bond between atomgroups x and y, originating on the hydrogen of x. Other symbols are formed analogously.
Table 7. Best-Fit Structure at the Cassiterite (110)-DIWInterface
Extrinsic FactorsS2occa S1occa BW-Te
sample A 0.14(3) 0 48(20)sample B 0.47(2) 0.08(1) 48(20)sample C 0.30(2) 0 48(20)
Intrinsic FactorsZ0b !Zb Zb Occb
Snbc 0 0.05(3) 0.05(3) 0.98(4)Sntc 0 -0.13(3) -0.13(3) 0.98(4)Obc 1.30 0.00(15) 1.30(15) 0.98(4)Otc 2.05 0.20(10) 2.25(10) 0.98(4)AW2d 3.62(15) 2.30(60)BW-Pe 4.20(30)a S1occ andS2occ are the partial occupancy factors of the surface topmost
layer and second layer, respectively. b Z0, !, and Z are the ideal heightand observed displacement and surface atom heights with respect to theunrelaxed Sn-O surface plane, in angstroms. Occ is the occupationfactor for each atom. c The occupation factors for Ob, Ot, Snt, and Snbare set to be equal in the fitting. d AW2 is the adsorbed water moleculeabove the Ob and Ot sites (corresponding to L2). e BW-P and BW-T arethe structureless bulkwater starting position (in angstroms) and thickness(inmicrometers, including both thewater and plasticwindow).Numbersin parentheses indicate the derived parameter uncertainty in the lastdigits. Those without the uncertainties are fixed at the values given.
Figure 3. Axial density profiles of water oxygens (top) andhydrogens (bottom). The functions are normalized so that the densityof bulk water is equal to 1.
Electric Double Layer at Metal Oxide Surfaces Langmuir, Vol. 23, No. 9, 2007 4931

of L2 water molecules is toward the solution, whereas in themore distant part of this layer (at 4.0 Å) the orientation is towardthe surface. This trend is disturbed and partially reversed uponcharging, with the reorientation of a substantial portion of waterdipoles toward the negatively charged surface. This reorientationis consistent with the effect of the electric field due to the surfacecharge, but it can be seen that the difference betweenhydroxylatedand nonhydroxylated surfaces remains large, indicating thepervasive influence of hydrogen bonding. This aspect is discussedin the following subsection.Another dimension of the analysis of interfacial water is added
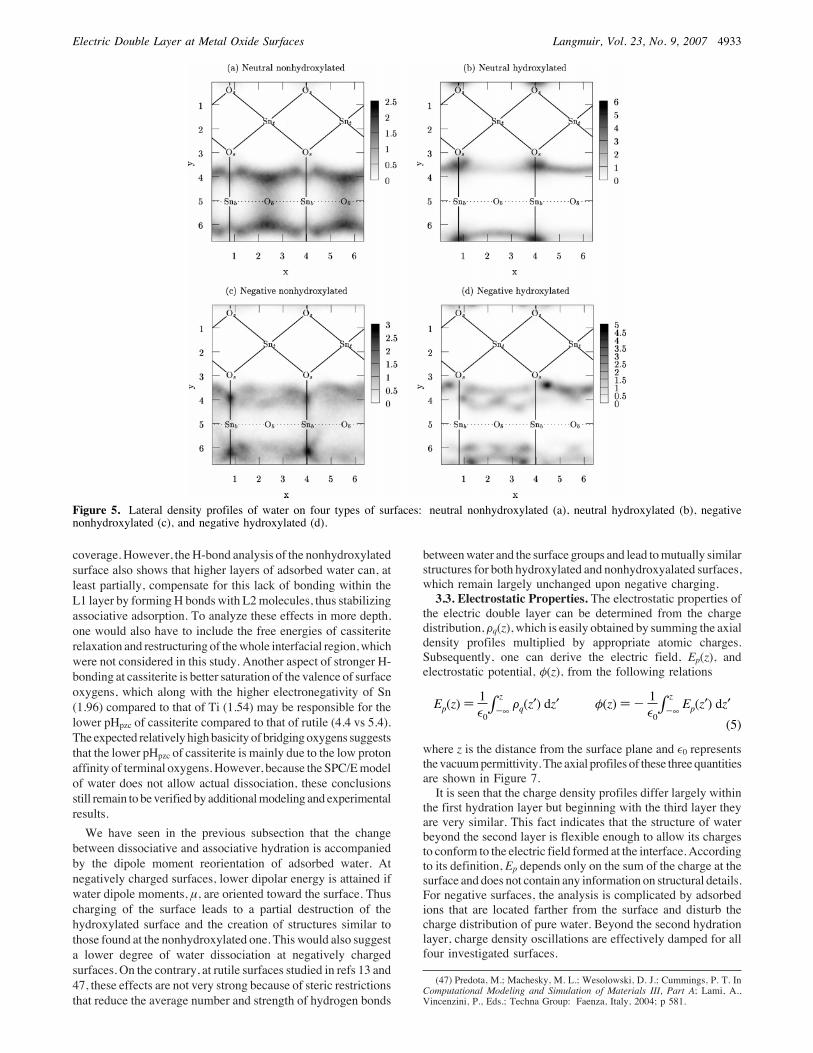
by lateral density distributions, which are shown in Figure 5.Only L2 is presented because L1 site distributions are allqualitatively the same: Ot always located directly above Snt, andthe lateral positions of Ob do not change siginificantly on thehydroxylated versus nonhydroxylated surfaces. It is seen that atboth nonhydroxylated surfaces water molecules are located nearbridging oxygens. This structure is very similar to what has beenfound for rutile,13 but here the oxygens are less localized, whichcan be explained by larger cassiterite lattice parameters. A moreinteresting situation is found at hydroxylated surfaces. For zerosurface charge, water oxygens are highly localized at positionsapproximately above surface oxygens, Os, between the rows ofterminal and bridging hydroxyls. In this configuration, wateroxygens of the first part of L2 layer can approach the surfacemore closely, as is also apparent in the plot of the oxygen axialdensity distribution in Figure 3. The more distant molecules ofthe L2 layer occupy places between Ob and Ot. Such behaviorand high degree of localization are not observed on hydroxylatedrutile surfaces,13 where the second-layer oxygens are prefer-rentially localized around bridging oxygens in a similar way asfor the nonhydroxylated surface, with only a small fraction lyingabove Os. Again, the difference can be explained by smallerlattice parameters of rutile with not enough space between therows of surface hydroxyls where the second-layer moleculeswould otherwise fit. The situation for hydroxylated cassiteriteis dramatically changed upon charging. The lateral density plotshows that most of the L2 oxygens no longer occupy the samepositions fromwhich theywere expelled byCoulombic repulsion.Instead, they can be found in positions near bridging oxygens,someofwhich are no longer protonated. Thewater configurationsat negative surfaces are thus more similar to each other thanthose formed on surfaces with zero charge. This finding isconsistent with the axial density distributions.
3.2.HydrogenBonding.The formation of different hydratingpatterns, as observed in the density distributions, can be relatedto hydrogenbondingbetweenwatermolecules and surface groups.For the purpose of this study,we define a hydrogen bond betweentwo oxygen atoms (of a water molecule or a surface group) tobe established if the distance between these oxygens is shorterthan 3.5 Å and the angle contained by the line connecting theoxygens and an intramolecular oxygen-hydrogen bond in oneof these atom groups is less than 30°. Compared to moresophisticateddefinitions developedprimarily forwater, this simplealternative can easily accommodate bonds formed by speciesother than water such as bridging and terminal hydroxyls.Moreover, it takes into account changes in the bond strength andvalence when a H-bond is bent, a situation that is very commonin the interfacial region. A proper description of the H-bondvalence is important for input into the MUSIC model (section3.5). According to this definition, an SPC/E water molecule inthe bulk at 298 K forms 3.6 H bonds with an average length of1.9 Å.The results of hydrogenbonding analysis for all neutral surfaces
are listed in Table 6. The bonds are divided according to pairsof atoms that they connect, distinguishing different surface groupsand water layers. In the following text, we discuss only the mainfeatures of hydrogen bonding, which are illustrated in Figure 6showing typical configurations in L1 and L2. It follows fromTable 6 that the main force forming the structure of water atnonhydroxylated surfaces is the H-bond between bridging (B)oxygen and a hydrogen of a second-layer water molecule (L2),with a length of only 1.64 Å. The oxygen atom of the same L2molecule also forms a weaker bond with a hydrogen of a first-layer water molecule (W1). The arrangement where the otherhydrogen atomofW1 is almost parallel to the surface also explainsthe dipole moment orientation of L2 molecules as presented inFigure 4.At the neutral hydroxylated surface, L2watermoleculesform two more balanced bonds with BH and T surface groups,eachwithin 1.74-1.79Å in length,with the dipole vector orientedaway from the surface.A comparison of the two presented typicalstructures suggests that the dissociation of W1 water molecules(i.e., the transfer of a proton from a water molecule at the Ot siteto the Ob site) is mediated by water molecules in L2 and isaccompanied by the reorientation of L2 dipole moments. Theanalysis also suggests that the short bond between L2 and B ofthe nonhydroxylated surface is a sign of the higher proton affinityof Ob oxygens relative to that of terminal hydroxyl groups andtherefore is an indication of the preference for dissociativeadsorption of water in L1. The mechanism of dissociationsuggested by this H-bond analysis and actually observed in abinitio simulations28 begins by the protonation of a bridgingoxygenand the formation of a OH- ion from an L2 molecule and isfollowed by the dissociation of anL1watermolecule (W1) givingrise to a terminal hydroxyl (T) and regenerating awatermoleculein L2. The analysis of the mixed surface in Table 6 shows thatthe resultingH-bond pattern is amixture of the hydroxylated andnonhydroxylated structures with strong bonds between L2 andB oxygens as well as between L2 and T, with similar averagenumbers of bonds between corresponding surface groups.Because of the larger lattice parameters of cassiterite compared
to those of rutile, interfacial water has more opportunities forhydrogen bonding, and the bonds can be stronger. This alsomeans a stronger influence of adsorbedwater on the association-dissociation equilibria. It was shown in ab inito studies28 thatlarger lattice parameters lead to a limited formation of H-bondsbetweenmolecularwater in theL1 layer and therefore a decreasedstability of purely associative adsorption of water at monolayer
Figure 4. Axial distributions of cos # for a water dipole momentvector and the surface normal (pointing toward the solution).
4932 Langmuir, Vol. 23, No. 9, 2007 Vlcek et al.
coverage. However, theH-bond analysis of the nonhydroxylatedsurface also shows that higher layers of adsorbed water can, atleast partially, compensate for this lack of bonding within theL1 layer by formingH bonds with L2molecules, thus stabilizingassociative adsorption. To analyze these effects in more depth,one would also have to include the free energies of cassiteriterelaxation and restructuring of thewhole interfacial region,whichwere not considered in this study. Another aspect of stronger H-bonding at cassiterite is better saturation of the valence of surfaceoxygens, which along with the higher electronegativity of Sn(1.96) compared to that of Ti (1.54) may be responsible for thelower pHpzc of cassiterite compared to that of rutile (4.4 vs 5.4).The expected relatively highbasicity of bridgingoxygens suggeststhat the lower pHpzc of cassiterite is mainly due to the low protonaffinity of terminal oxygens.However, because the SPC/Emodelof water does not allow actual dissociation, these conclusionsstill remain to beverified by additionalmodeling and experimentalresults.We have seen in the previous subsection that the change
between dissociative and associative hydration is accompaniedby the dipole moment reorientation of adsorbed water. Atnegatively charged surfaces, lower dipolar energy is attained ifwater dipole moments, µ, are oriented toward the surface. Thuscharging of the surface leads to a partial destruction of thehydroxylated surface and the creation of structures similar tothose found at the nonhydroxylated one. This would also suggesta lower degree of water dissociation at negatively chargedsurfaces. On the contrary, at rutile surfaces studied in refs 13 and47, these effects are not very strong because of steric restrictionsthat reduce the average number and strength of hydrogen bonds
betweenwater and the surface groups and lead tomutually similarstructures for both hydroxylated and nonhydroxyalated surfaces,which remain largely unchanged upon negative charging.3.3. Electrostatic Properties. The electrostatic properties of
the electric double layer can be determined from the chargedistribution, Fq(z), which is easily obtained by summing the axialdensity profiles multiplied by appropriate atomic charges.Subsequently, one can derive the electric field, Ep(z), andelectrostatic potential, "(z), from the following relations
where z is the distance from the surface plane and !0 representsthevacuumpermittivity.The axial profiles of these threequantitiesare shown in Figure 7.It is seen that the charge density profiles differ largely within
the first hydration layer but beginning with the third layer theyare very similar. This fact indicates that the structure of waterbeyond the second layer is flexible enough to allow its chargesto conform to the electric field formed at the interface. Accordingto its definition, Ep depends only on the sum of the charge at thesurface and does not contain any information on structural details.For negative surfaces, the analysis is complicated by adsorbedions that are located farther from the surface and disturb thecharge distribution of pure water. Beyond the second hydrationlayer, charge density oscillations are effectively damped for allfour investigated surfaces.
(47) Predota, M.; Machesky, M. L.; Wesolowski, D. J.; Cummings, P. T. InComputational Modeling and Simulation of Materials III, Part A; Lami, A.,Vincenzini, P., Eds.; Techna Group: Faenza, Italy, 2004; p 581.
Figure 5. Lateral density profiles of water on four types of surfaces: neutral nonhydroxylated (a), neutral hydroxylated (b), negativenonhydroxylated (c), and negative hydroxylated (d).
Ep(z) )1!0$-∞
zFq(z′) dz′ "(z) ) - 1
!0$-∞
zEp(z′) dz′
(5)
Electric Double Layer at Metal Oxide Surfaces Langmuir, Vol. 23, No. 9, 2007 4933
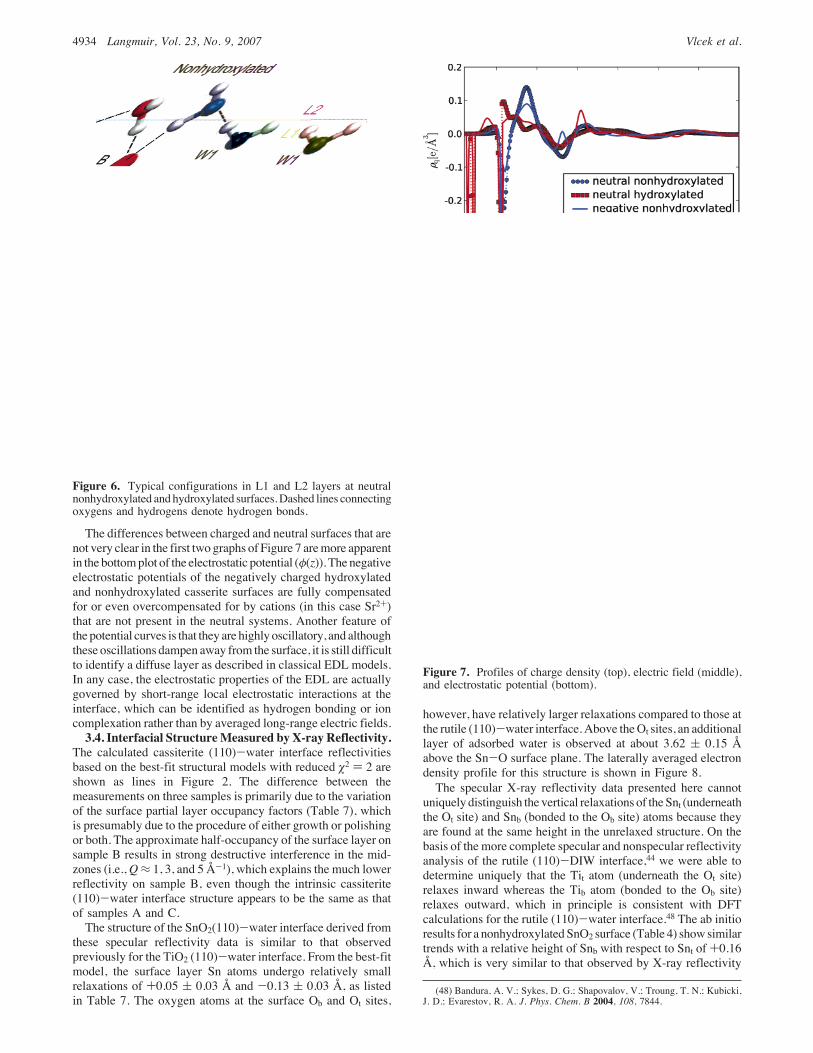
The differences between charged and neutral surfaces that arenot very clear in the first two graphs of Figure 7 aremore apparentin the bottomplot of the electrostatic potential ("(z)). The negativeelectrostatic potentials of the negatively charged hydroxylatedand nonhydroxylated casserite surfaces are fully compensatedfor or even overcompensated for by cations (in this case Sr2+)that are not present in the neutral systems. Another feature ofthe potential curves is that they are highly oscillatory, and althoughthese oscillations dampen away from the surface, it is still difficultto identify a diffuse layer as described in classical EDL models.In any case, the electrostatic properties of the EDL are actuallygoverned by short-range local electrostatic interactions at theinterface, which can be identified as hydrogen bonding or ioncomplexation rather than by averaged long-range electric fields.3.4. Interfacial StructureMeasured by X-ray Reflectivity.
The calculated cassiterite (110)-water interface reflectivitiesbased on the best-fit structural models with reduced %2 ) 2 areshown as lines in Figure 2. The difference between themeasurements on three samples is primarily due to the variationof the surface partial layer occupancy factors (Table 7), whichis presumably due to the procedure of either growth or polishingor both. The approximate half-occupancy of the surface layer onsample B results in strong destructive interference in the mid-zones (i.e.,Q% 1, 3, and 5 Å-1), which explains the much lowerreflectivity on sample B, even though the intrinsic cassiterite(110)-water interface structure appears to be the same as thatof samples A and C.The structure of the SnO2(110)-water interface derived from
these specular reflectivity data is similar to that observedpreviously for the TiO2 (110)-water interface. From the best-fitmodel, the surface layer Sn atoms undergo relatively smallrelaxations of +0.05 ( 0.03 Å and -0.13 ( 0.03 Å, as listedin Table 7. The oxygen atoms at the surface Ob and Ot sites,
however, have relatively larger relaxations compared to those atthe rutile (110)-water interface.Above theOt sites, an additionallayer of adsorbed water is observed at about 3.62 ( 0.15 Åabove the Sn-O surface plane. The laterally averaged electrondensity profile for this structure is shown in Figure 8.The specular X-ray reflectivity data presented here cannot
uniquely distinguish the vertical relaxations of theSnt (underneaththe Ot site) and Snb (bonded to the Ob site) atoms because theyare found at the same height in the unrelaxed structure. On thebasis of the more complete specular and nonspecular reflectivityanalysis of the rutile (110)-DIW interface,44 we were able todetermine uniquely that the Tit atom (underneath the Ot site)relaxes inward whereas the Tib atom (bonded to the Ob site)relaxes outward, which in principle is consistent with DFTcalculations for the rutile (110)-water interface.48 The ab initioresults for a nonhydroxylatedSnO2 surface (Table 4) show similartrends with a relative height of Snb with respect to Snt of +0.16Å, which is very similar to that observed by X-ray reflectivity
(48) Bandura, A. V.; Sykes, D. G.; Shapovalov, V.; Troung, T. N.; Kubicki,J. D.; Evarestov, R. A. J. Phys. Chem. B 2004, 108, 7844.
Figure 6. Typical configurations in L1 and L2 layers at neutralnonhydroxylated andhydroxylated surfaces.Dashed lines connectingoxygens and hydrogens denote hydrogen bonds.
Figure 7. Profiles of charge density (top), electric field (middle),and electrostatic potential (bottom).
4934 Langmuir, Vol. 23, No. 9, 2007 Vlcek et al.

(+0.18 Å assuming that Snt relaxes inward, case A) even thoughthe absolute atom positions in the ab initio and X-ray resultsdiffer slightly. However, if the Snt and Snb atoms were to relaxin the opposite directions (case B), then Snb would be lower thanSnt by -0.18 Å. This agrees in direction with the ab initiocalculation for a hydroxylated surface, which predicted aseparation of -0.07 Å although this displacement magnitude isnot aswellmatched as in caseA. This analysis appears to suggestthat the same trends found at the rutile (110)-water interfaceare present at the cassiterite (110)-DIW surface (i.e., thenonhydroxylated adsorption of water is preferred).Comparing the Sn-O axial distances found in ab initio
calculations of neutral surfaces and used in the presented MDsimulations (Table 4)with those fromX-raymeasurements (Table7) leads to discrepancies. In case A, the experimental Snb-Obheight difference is 1.25Å,which is in agreementwith the resultsfrom MD simulations and ab initio calculations, for which weget 1.21 and 1.24 Å, respectively. However, the experimentalSnt-Ot distance of 2.38Å is too large compared to theMD resultof 2.24 Å and, in particular, to the ab initio value of 2.12 Å. Incase B, the experimental Snb-Ob height difference is 1.43 Å,which compares well (within experimental error) with the MDand ab initio results of 1.38 and 1.37 Å, respectively. Theexperimental Snt-Ot distance of 2.20 Å seems to be too largewith respect to the MD and ab initio value of 2.05 Å. We cansee that the measured axial distances are generally larger thanthose from theoretical calculations. The explanation of thisdiscrepancy could lie in the charging of the surface because theDIW used in the diffraction experiment had a pH of about 5.6,which is greater than the cassiterite pHpzc of 4.4. For negativelycharged surfaces, the considered bond lengths are always longer(Tables 4 and 5). Also, the high relative occupancy of L2 (2.3),given in Table 7, is more consistent with the occupancy of L2at hydroxylated surfaces (1.8).Although the MD results differ quantitatively with both
interpretations of theX-ray results, caseB appears to be a slightlybetter qualitative match, especially if L2 occupancy and the abinitio bond lengths are used for comparison. Consequently,whereas the currentX-ray reflectivity data provide clear evidencethat the overall termination is similar to that found previouslyfor the rutile (110) surface, these data are not able to distinguishclearly the state of hydroxylation of the adsorbed water. A futurestudy including both specular and nonspecular measured surfacetruncation rods should be able to resolve this ambiguity.3.5. MUSIC Model Surface Protonation Description.
According to the revised MUSIC model of Hiemstra et al.,8surface protonation constants (at 25 °C) are estimated from theempirical relationship
where A is a constant (the slope) obtained from a regression oflog KH values of homogeneous aqueous metal ion hydrolysisreactions versus the “undersaturation of charge” on the respectiveoxygen ligands, V is the valence of oxygen (-2), and ∑ exp[(r0- ri)/0.37] is the sum (over i ) 1, 2, or 3 for single, double, ortriple coordination, respectively, of oxygen with coordinatedmetal ions in the truncated crystal structure) of the bond valencevalues for the metal-oxygen bonds of interest. These bondvalence values are estimated using the relevant metal-oxygenbond lengths (ri), a reference bond length (r0) that we calculatefrom the bulk crystal structure, and an empirical constant (0.37)as detailed in ref 50. The remaining terms account for hydrogenbonding to protolyzable oxygens (Ob or Ot), where mj is thenumber of donatinghydrogenbonds to associatedwatermolecules(which requires that a H atom is present in the surface complex),nk is the number of accepting H bonds from adsorbed watermolecules, and sjD and skA are the assumed valence contributionsof donating and accepting H bonds, respectively. By applyingthe A value obtained from a set of aqueous protonation reactions(19.8), Hiemstra et al.8 predicted the proton binding constantsfor a large number of metal oxides at 25 °C. Machesky et al.9derived a temperature-dependent A parameter in eq 6 with avalue of 21.70 at 25 °C, extending this analysis to highertemperatures using a self-consistent set of homogeneous aqueousmetal ion hydrolysis reactions, the temperature dependence ofwhich is reasonably well known to 300 °C.MUSIC model outputs include both the partial charges of
protolyzable surface oxygens and their protonation constants,from which it is then possible to calculate the pHpzc of a surface.These estimated pHpzc values can then be compared to thosedetermined experimentally. Typically, bulk crystal bond lengthsand bulk water H-bonding configurations have been used toderiveMUSICmodel estimates of surface protonation constantsand corresponding pHpzc values. In practice, however, thedistribution of crystal planes and/or Me-O and H-bond lengthsmust usually bemodified from ideal values in order that predictedpHpzc values best match those determined experimentally. Infact, eq 6 is modified from the original MUSIC model equation8in that the donating (sjD) and accepting (skA)H-bond bond valencecontributions do not necessarily sum to 1 (the formal valence ofa H atom) for a particular protolyzable oxygen, thereby allowingfor the possibility that protolyzable oxygenH-bond configurationscan be different than those for bulk water.For the (110) surface of rutile, recent ab initio and MD
simulation results have been used to determine actual surfaceTi-O bond lengths and associated water H-bonding configura-tions.19,47 With only very slight adjustments to the ab initio-derived Ti-O bond lengths (<0.02 Å and within the error of thesimulations) and taking into account H-bonding configurationsobtained from MD simulations, MUSIC model-predicted pHpzcvalues match those observed experimentally at 25 °C for bothsingle-crystal (110) rutile surfaces (4.8 ( 0.2)31 and powderedrutile specimens dominated by the (110) surface (5.40 ( 0.2).8Using the MD results presented here, which are based on
previous ab initio-derived Sn-Obond lengths,21 we can estimate
(49) Fenter, P.; Sturchio, N. C. Prog. Surf. Sci. 2004, 77, 171.(50) Brown, I. D. The Chemical Bond in Inorganic Chemistry: The Bond
Valence Model; Oxford University Press: Oxford, U.K., 2002.
Figure 8. Laterally averaged electron density profiles at thecassiterite (110)-DIW interface derived fromX-ray reflectivity data(Figure 2). The profile is broadened to include the effect of finitespatial resolution as determinedby theQ range (#6Å-1), as describedpreviously.49
log KH ) -A(V +∑iexp(r0 - ri
0.37 ) +∑jmjsjD +∑
knkskA) (6)
Electric Double Layer at Metal Oxide Surfaces Langmuir, Vol. 23, No. 9, 2007 4935

surface protonation constants and the associated pHpzc value forthe SnO2 (110) surface. The starting surface configuration forthese calculations consists of terminal Sn-OH and bridged Sn-O-Sn groups because these groups are capable of taking up anadditional proton in the pH range accessible in water (0 to 14).In essence, this configuration is a hybrid of the hydroxylated(Sn-OH and Sn-OH-Sn) and nonhydroxylated (Snt and Sn-O-Sn) end members and is termed the “mixed” surface for thisstudy. Relevant Sn-O and H-bond lengths are given in Tables5 and 6, respectively. For the bridged group (e.g., Sn-O-Sn),the Sn-O bond length derived from force-field and ab initiocalculations21 ranges from 2.00 to 2.05 Å, depending on thedetails of the calculation procedure, and the correspondingterminal group (e.g., Sn-OH) bond length is between 2.05 and2.10 Å. These ranges overlap the corresponding bulk crystalvalues (Table 5), indicating that surface relaxation is relativelyminor in the presence of water. The predominant H-bondconfiguration for the Sn-O-Sn group is a single accepting Hbond between the oxygen of this group and a hydrogen of asecond-layer water molecule (B-L2 in the nonhydroxylated andmixed portion of Table 6). The length of this hydrogen bond is1.64 Å, which is considerably shorter than an accepting O-Hbond in bulk water (about 1.90 Å). As a consequence, the bondvalence of this hydrogen bond is about 0.35,50 rather than 0.2as for bulkwater. The predominant acceptingH-bond interactionfor the terminal Sn-OH group (T-L2, in the hydroxylated andmixed portion of Table 6) is between the oxygen of this groupand ahydrogenof second-layerwatermolecules. The total numberof these accepting H-bonds is about 1.2, which indicates thatmore than one L2 water molecule (on average) is H-bonded tothe terminal Sn-OHgroup. The average length of theseH-bondsis also shorter than those in bulkwater (1.73Å), and this acceptingH-bond valence was approximated to be 0.3. There are alsomoreminorH-bond contributions fromL1watermolecules (0.3,1.9 Å in length) and from H atoms attached to the bridgingoxygens (0.43, 2.05 Å in length). Combining these threeH-bonding contributions results in a total accepting H-bondcontribution for the terminal Sn-OH group of about 0.46 (1.2" 0.3 + 0.3 " 0.2 + 0.43 " 0.1) and this value was used forthe MUSIC model calculations presented below.Input of this information into the MUSIC model (eq 6) leads
to the protonation scheme depicted in Figure 9. In this instance,the Sn-O bond lengths were set to 2.085 and 2.052 Å for theterminal and bridged groups, respectively, so that the predicted
pHpzc for the SnO2 (110) surface would be precisely 4.4 at 25°C because that is the pHpzc value exhibited by the particularSnO2 powders thatwe are employing in our studies. These Sn-Obond lengths are within 0.02 Å of those obtained from ab initiocalculations for the mixed surface (Table 5). Moreover, a pHpzcvalue of 4.4 is within the uncertainty of mean (4.5) and median(4.4) values reported for SnO2 in the literature,20 whereas thepHpzc value predicted using bulk Sn-O bond lengths (as wellas theH-bond configuration presented above) is 3.88, even thoughthese bulk bond lengths are within 0.05 Å of those used for theoptimized scheme depicted in Figure 9. On one hand, thisillustrates that MUSIC model-predicted surface protonationconstants and corresponding pHpzc values are exceedinglysensitive to small changes in bond lengths. On the other hand,explicit consideration of the surface oxygen and H-bondconfigurations actually givesMUSICmodel pHpzc estimates thatare in much better agreement with those determined experi-mentally, aswe have previously demonstrated for the rutile (110)surface.19,47 Ultimately, improvements to empirical MUSICmodel-type approacheswill benefit from the continued applicationof ab initio and MD methods to derive the actual bondingconfigurations present at solid-liquid interfaces.
4. Conclusions
Molecular dynamics simulations with a recently developedforce field were used to study a cassiterite-water interface atambient conditions, and the data were compared to the resultsof X-ray crystal truncation rod studies in which axial distancesbetween the surface and adsorbed water layers were measured.To investigate the effect of pH conditions and the degree ofwater dissociation, different variants of surfaceswere constructed.The analysis of water density profiles has shown substantial
differences between the way hydroxylated and nonhydroxylatedsurfaces are hydrated at both zero and negative surface charge.Because the axial distances of the L1 and L2 oxygens for thevarious surfaces modeled are all very similar to the distancesfrom the surface indicated by the X-ray CTR approach, it wasnot possible to determine unequivocally which type of L1adsorption is preferred. However, the CTR results are mostconsistent with the negatively charged surface configurations, inagreement with the DIW used in those experiments having a pHof about 5.6, which is above the pHpzc of cassiterite (about 4.4).Lateral density profiles revealed that while on nonhydroxylatedsurfaces L2 water molecules occupy locations around bridgingoxygens, at the neutral hydroxylated surface they are locatedbetween two bridging and two terminal hydroxyls, thus allowingthem to approach the surfacemore closely. Upon charging of thehydroxylated surface, L2 water molecules are expelled fromtheir positions and driven to locations similar to those onnonhydroxylated surfaces. The different methods of hydrationare also demonstrated by the opposite orientation of dipoles inthe second layer, which underlies their different response to theelectric field inducedby surface charge and suggests a stabilizationof the associative adsorption at negatively charged surfaces. Adetailed analysis of hydrogen bonding revealed the basic forcesbehind the structural and electrostatic differences between thestudied surfaces. It was found that at nonhydroxylated surfaceswater molecules of the second hydration layer form two stronglyasymmetric hydrogen bonds with a bridging oxygen and a watermolecule of the first layer, indicating the tendency of protontransfer from the first-layerwatermolecule to the bridgingoxygen.Such a behavior would imply a higher basicity of unprotonatedbridging oxygens compared to that of terminal hydroxyl groupsand, as a result, a tendency for dissociative adsorption at neutral
Figure 9. MUSIC model description of the SnO2 (110) surface.The table shows estimated pHpzc values for a range of ab initio-derived bond lengths, for the optimized bond lengths of theprotonation scheme depicted, and for bulk SnO2.
4936 Langmuir, Vol. 23, No. 9, 2007 Vlcek et al.
surfaces in agreement with previous ab initio studies. However,the H-bond analysis and oxygen density profiles also suggest arelatively higher stability of associatively adsorbed water at thecassiterite-bulk water interface compared to the stability ofmonolayer adsorption. The results were briefly compared topreviously studied rutile at which associative adsorption ispreferred and smaller lattice parameters prevent the formationof structures found at hydroxylated cassiterite.Actual hydrogen bond configurations and Sn-Obond lengths
were also used as inputs into the revisedMUSICmodel of surfaceprotonation. It was found that only slight adjustments to theseconfigurations and bond lengths were required in order for thepredicted pHpzc value to match that determined experimentally(4.4).
Acknowledgment. This research was supported by theDivision of Chemical Sciences, Geoscience and Biosciences,Office of Basic Energy Sciences, U.S. Department of Energy
(contract no. DE-AC05-00OR22727), Oak Ridge NationalLaboratory, managed and operated by UT-Battelle, LLC. L.V.and P.T.C. acknowledge that the reported research used, in part,resources of theNational EnergyResearch Scientific ComputingCenter, which is supported by the Office of Science of the U.S.Department of Energy (contract no.DE-AC02-05CH11231), andthe Computing Center for Research and Education at VanderbiltUniversity. The X-ray reflectivity data were measured atbeamlines 12-ID-D, 11-ID-D, and12-BMat theAdvancedPhotonSource (APS) at Argonne National Laboratory. Use of theAdvanced Photon Sourcewas supported by theU.S. Departmentof Energy, Office of Science, Office of Basic Energy Sciences(contract no. DE-AC02-06CH11357). We thank Lynn Boatnerand his research associates at ORNL for help with the synthesisof cassiterite single crystals.
LA063306D
Electric Double Layer at Metal Oxide Surfaces Langmuir, Vol. 23, No. 9, 2007 4937
Related Documents