EKG EKG is mainly denoted by 5 important waves (P, Q, R, S, & T waves) P wave represents atrial depolarization. QRS wave represents ventricular depolarization. T wave represents ventricular repolarization. The Q wave is negative deflection that follows the P wave, and sometimes the Q wave is not seen and possible sometimes is pathological. R wave is the positive deflection that follows the Q wave. The S wave is the negative deflection that flows the R wave. The T wave is last and not usually seen on EKGs. EKG Intervals

Welcome message from author
This document is posted to help you gain knowledge. Please leave a comment to let me know what you think about it! Share it to your friends and learn new things together.
Transcript

EKG
EKG is mainly denoted by 5 important waves (P, Q, R, S, & T waves)P wave represents atrial depolarization.QRS wave represents ventricular depolarization.T wave represents ventricular repolarization.
The Q wave is negative deflection that follows the P wave, and sometimes the Q wave is not seen and possible sometimes is pathological. R wave is the positive deflection that follows the Q wave. The S wave is the negative deflection that flows the R wave. The T wave is last and not usually seen on EKGs.
EKG Intervals
mm/mV 1 square = 0.04 sec/0.1mV
Intervals are important and change in certain disease states. PR interval is the distance between the beginning of P and Q wave and
can change in certain kinds of heart blocks. RR interval is the distance between R waves and can change in brady and
tachycardia.

ST segment is the linear interval between the end S wave and beginning of T wave.
ST interval is the distance between the end S wave and the end T wave. QT interval is the distance between the beginning of Q wave and the end
of T wave. QRS interval is the distance between the beginning of Q wave and the
end of S wave.
The “big” P wave represent Right Atrial Enlargement because large P wave represent enlarged atria.
Left Atrial Enlargement is represented by M shape or notched shaped P waves shown in Lead II
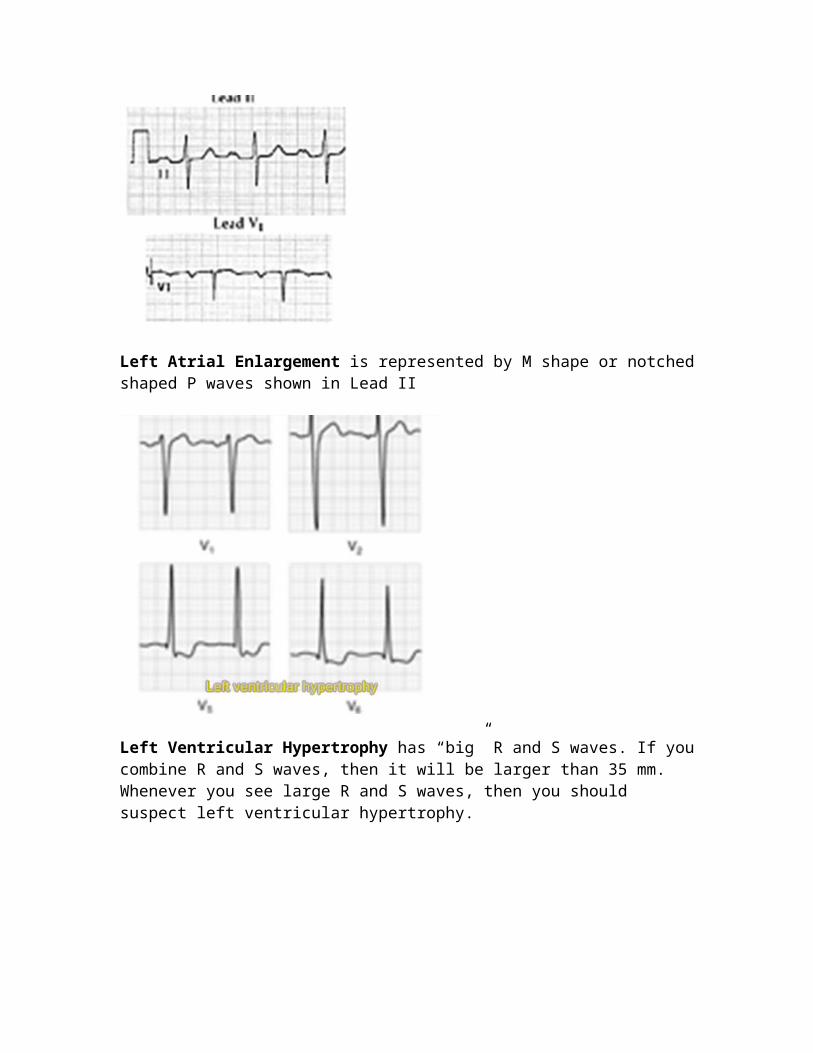
Left Ventricular Hypertrophy has “big” R and S waves. If you combine R and S waves, then it will be larger than 35 mm. Whenever you see large R and S waves, then you should suspect left ventricular hypertrophy.
ST elevation is shown in lead II and III and AVF, which characteristic in Acute Inferior Myocardial Infarction (MI). And depression in V2, V3, and V4 which is reciprocal.
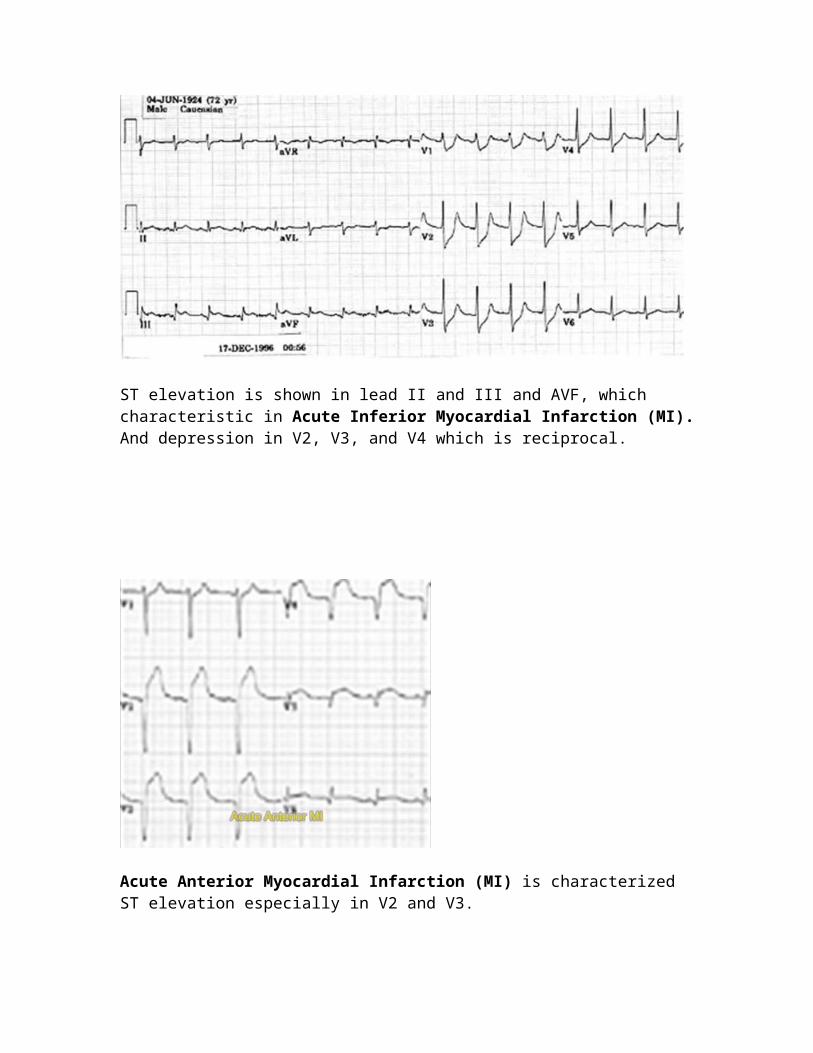
Acute Anterior Myocardial Infarction (MI) is characterized ST elevation especially in V2 and V3.
Acute Anterolateral MI is characterized by lateral ST elevation shown in V4, V5, and V6 leads.
Abnormalities in Electrolyte Disturbances
15 second EKG (the 5 rules to interpret any rhythm)
1. Are there or can you identify any P waves? 2. Are there any QRS complexes?3. Measure PR intervals (which the beginning of P wave and Q wave?4. What is the rate?5. What is the rhythm? Is it regular or irregular?
If the P waves are depolarizing then the blood goes from the atria to the ventricles. The ventricles will then swell and next contract.
The PR interval is the beginning of P wave to the beginning of the QRS wave. It represents the time between contraction of atrium and the contraction of the QRS. Therefore, PR interval shows if there is a breakdown or block between

conduction systems SA node and AV node. The interval should be nice and closely consistent with one another. Normal should be < 4-5 boxes. One small box represents 0.04 seconds. Widened PR interval is greater than 4-5 boxes. Therefore, the atrium is becoming farther apart from QRS and not contracting in a sync amount time
The rate refers to how fast QRS are contracting or number of beats per minute. Count the number of QRS in 6 second strip and multiple by 10.