EJO www.ejo.oxfordjournals.org European Journal of Orthodontics Volume 32 | Number 2 | April 2010 ISSN 0141-5387 (print) ISSN 1460-2210 (online) European Journal of Orthodontics Volume 32 | Number 2 | April 2010

EJO Volume 32, Number 2, April 2010
Oct 24, 2015
European Journal of Orthodontics
Welcome message from author
This document is posted to help you gain knowledge. Please leave a comment to let me know what you think about it! Share it to your friends and learn new things together.
Transcript
EJOwww.ejo.oxfordjournals.org
European Journal of
OrthodonticsVolume 32 | Number 2 | April 2010
ox
fo
rd
GLASS FIBRE REINFORCED VERSUS MULTISTRANDED BONDED ORTHODONTIC RETAINERS: A 2 YEAR PROSPECTIVE MULTI-CENTRE STUDY
MICHEL P. E. TACKEN, JAN COSYN, PETER DE WILDE, JOHAN AERTS, ELKE GOVAERTS AND BART VANDE VANNET 117
NO INFLUENCE OF ALIMENTARY ZINC ON THE HEALING OF CALVARIAL DEFECTS FILLED WITH OSTEOPROMOTIVE SUBSTANCES IN RATS
LEIGH JONES, JESPER SKOVHUS THOMSEN, JETTE BARLACH, LIS MOSEKILDE AND BIRTE MELSEN 124
LOW-ENERGY LASER IRRADIATION FACILITATES THE VELOCITY OF TOOTH MOVEMENT AND THE EXPRESSIONS OF MATRIX METALLOPROTEINASE-9, CATHEPSIN K, AND ALPHA(V) BETA(3) INTEGRIN IN RATS
MASARU YAMAGUCHI, MASAMI HAYASHI, SHOUJI FUJITA, TAKAMASA YOSHIDA, TADAHIKO UTSUNOMIYA, HIROTSUGU YAMAMOTO AND KAZUTAKA KASAI 131
ORTHODONTICS AND FOETAL PATHOLOGY: A PERSONAL VIEW ON CRANIOFACIAL PATTERNING
INGER KJÆR 140
BRIDGING OF THE SELLA TURCICA IN SKELETAL CLASS III SUBJECTS PHILIPP MEYER-MARCOTTY, TOBIAS REUTHER AND ANGELIKA STELLZIG-EISENHAUER 148
EFFECTS OF FORCE MAGNITUDE ON TOOTH MOVEMENT: AN EXPERIMENTAL STUDY IN RABBITS
NIHAT KILIÇ, HÜSAMETTIN OKTAY AND MUSTAFA ERSÖZ 154
A COMPARATIVE ASSESSMENT OF THE FORCES AND MOMENTS GENERATED WITH VARIOUS MAXILLARY INCISOR INTRUSION BIOMECHANICS
IOSIF SIFAKAKIS, NIKOLAOS PANDIS, MARGARITA MAKOU, THEODORE ELIADES AND CHRISTOPH BOURAUEL 159
HAWLEY RETAINERS FULL- OR PART-TIME? A RANDOMIZED CLINICAL TRIAL M. SHAWESH, B. BHATTI, T. USMANI AND N. MANDALL 165
A RANDOMIZED CLINICAL TRIAL TO COMPARE THE GOSHGARIAN AND NANCE PALATAL ARCH
N. STIVAROS, C. LOWE, N. DANDY, B. DOHERTY AND N. A. MANDALL 171
ASYMMETRY OF THE CRANIOFACIAL SKELETON IN THE PARENTS OF CHILDREN WITH A CLEFT LIP, WITH OR WITHOUT A CLEFT PALATE, OR AN ISOLATED CLEFT PALATE
G. T. MCINTYRE AND P. A. MOSSEY 177
ACCEPTABILITY OF ADOLESCENTS ’ OCCLUSION IN FINNISH MUNICIPAL HEALTH CENTRES WITH DIFFERING TIMING OF ORTHODONTIC TREATMENT
ILPO PIETILÄ, TERTTU PIETILÄ, ANNA-LIISA SVEDSTRÖM-ORISTO, JUHA VARRELA AND PENTTI ALANEN 186
DIAGNOSTIC AGREEMENT IN THE ASSESSMENT OF ORTHODONTIC TREATMENT NEED USING THE DENTAL AESTHETIC INDEX AND THE INDEX OF ORTHODONTIC TREATMENT NEED
DAVID MANZANERA, JOSÉ MARÍA MONTIEL-COMPANY, JOSÉ MANUEL ALMERICH-SILLA AND JOSÉ LUIS GANDÍA 193
Continued on inside back cover
ISSN 0141-5387 (print)ISSN 1460-2210 (online)Contents
European Journal of O
rthodonticsV
olume 32 | N
umber 2 | A
pril 2010
LONGITUDINAL PROFILE CHANGES IN AN ANATOLIAN TURKISH POPULATION NIHAL HAMAMCI, SEHER GÜNDÜZ ARSLAN AND SEMRA S AHIN 199
DENTAL ANOMALIES IN INDIVIDUALS WITH CLEFT LIP AND/OR PALATE M. OKAN AKCAM, SEHRAZAT EVIRGEN, OZGE USLU AND UFUK TOYGAR MEMIKO G LU 207
EVALUATION OF SHEAR BOND STRENGTH OF METALLIC AND CERAMIC BRACKETS BONDED TO ENAMEL PREPARED WITH SELF-ETCHING PRIMER
TANCAN UYSAL, AYCA USTDAL AND GOKMEN KURT 214
A NOVEL BRACKET BASE DESIGN: BIOMECHANICAL STABILITY G. MERONE, R. VALLETTA, R. DE SANTIS, L. AMBROSIO AND R. MARTINA 219
THE EFFECT OF AIR ABRASION PREPARATION ON THE SHEAR BOND STRENGTH OF AN ORTHODONTIC BRACKET BONDED TO ENAMEL
RICHARD M. HALPERN AND TANYA ROULEAU 224
LETTERS TO THE EDITOR 228
BOOK REVIEWS 230
Continued from outside back coverEuropean Journal of OrthodonticsPublished by the European Orthodontic Society
ScopeThe European Journal of Orthodontics publishes (in English) research or clinical papers of interest to all orthodontists. Although the primary intention is to provide a forum for orthodontists in Europe, the journal welcomes papers from all parts of the world.
Editor Associate EditorsProfessor Fraser McDonald Doctor Susan Cunnningham Doctor Theodore Eliades Doctor Ama Johal
Editorial BoardDoctor Tiziano Baccetti Professor Stavros Kiliaridis Professor Pertti PirttiniemiDoctor Pongsri Brudvik Professor Inger Kjær Professor Sabine Ruf Professor Carine E. Carels Doctor Agneta Linder-Aronson Karsten Doctor Vaska Vandevska-RadunovicProfessor Marie-Pierryle Filleul Professor Timo Peltomäki Doctor Frank WeilandProfessor Haluk I
.seri Professor Neil Pender
European Orthodontic SocietyOfficers of the SocietyPresident 2009/2010: Hon. Editor: Hon. Treasurer:Dr Maja Ovsenik Professor Fraser McDonald Professor Andrej ZentnerPresident elect: Professor Nejat Erverdi
SubscriptionsA subscription to the European Journal of Orthodontics comprises 6 issues. Prices include postage by surface mail, or for subscribers in the USA and Canada by airfreight, or in India, Japan, Australia and New Zealand, by Air Speeded Post. Airmail rates are available on request.
Annual Subscription Rate (Volume 32, 6 issues, 2010) Institutional PersonalPrint edition and site-wide online access: £352.00/$704.00/¤528.00 Print edition and individual online access: £249.00/$498.00/¤374.00Print edition only: £322.00/$644.00/¤483.00 Please note: US$ rate applies to US & Canada, Euros applies to Europe,Site-wide online access only: £284.00/$568.00/¤427.00 UK£ applies to UK and Rest of World
There may by other subscription rates available, for a complete listing please visit www.ejo.oxfordjournals.org/subscriptions/. Full prepayment, in the correct currency, is required for all orders. Orders are regarded as firm and payments are not refundable. Subscriptions are accepted and entered on a complete volume basis. Claims cannot be considered more than FOUR months after publication or date of order, whichever is later. All subscriptions in Canada are subject to GST. Subscriptions in the EU may be subject to European VAT. If registered, please supply details to avoid unnecessary charges. For subscriptions that include online versions, a proportion of the subscription price may be subject to UK VAT. Personal rate subscriptions are only available if payment is made by personal cheque or credit card and delivery is to a private address. The current year and two previous years’ issues are available from Oxford University Press. Previous volumes can be obtained from the Periodicals Service Company, 11 Main Street, Germantown, NY 12526, USA. Email: [email protected]. Tel: +1 (518) 537 4700. Fax: +1 (518) 537 5899. For further information, please contact: Journals Customer Service Department, Oxford University Press, Great Clarendon Street, Oxford OX2 6DP, UK. Email: [email protected]. Tel (and answerphone outside normal working hours): +44 (0)1865 353907. Fax: + 44 (0)1865 353485. In the US, please contact: Journals Customer Service Department, Oxford University Press, 2001 Evans Road, Cary, NC 27513, USA. Email: [email protected]. Tel (and answerphone outside normal working hours): 800 852 7323 (toll-free in USA/Canada). Fax: 919 677 1714. In Japan, please contact: Journals Customer Services, Oxford University Press, Tokyo 4-5-10-8F Shiba, Minato-ku, Tokyo 108-8386 Japan. Email: [email protected]. Tel: (03) 3813 1461. Fax: (03) 3818 1522. Methods of payment. (i) Cheque (payable to Oxofrd University Press, to Oxford University Press, Cashiers Office, Great Clarendon Street, Oxford OX2 6DP, UK) in GB£ Sterling (drawn on a UK bank), US$ Dollars (drawn on a US bank), or EU¤ Euros. (ii) Bank transfer to Barclays Bank Plc, Oxford Group Office, Oxford (bank sort code 20-65-18) (UK), overseas only Swift code BARC GB 22 (GB£ Sterling to account no. 70299332, IBAN GB89BARC20651870299332; US$ Dollars to account no. 66014600, IBAN GB27BARC20651866014600; EU¤ Euros to account no. 7892365, IBAN GB16BARC20651878923655). (iii) Credit card (Mastercard, Visa, Switch of American Express). European Journal of Orthodontics is published bimonthly in February, April, June, August, October and December by Oxford University Press, Oxford, UK. Annual subscription price is £352.00/$704.00/¤528.00. European Journal of Orthodontics is distributed by Mercury International, 365 Blair Road, Avenel, NJ 07001, USA. Periodicals postage paid at Rahway, NJ and at additional entry points. US Postmaster: send address changes to European Journal of Orthodontics (ISSN 0141-5387), c/o Mercury International, 365 Blair Road, Avenel, NJ 07001, USA.
PermissionsFor information on how to request permissions to reproduce articles/information from this journal, please visit www.oxfordjournals.org/permissions.
AdvertisingAdvertising, inserts and artwork enquiries should be addressed to Advertising and Special Sales, Oxford Journals, Oxford University Press, Great Clarendon Street, Oxford OX2 6DP, UK. Tel: +44 (0)1865 354767; Fax +44 (0)1865 353774; E-mail: [email protected]
Oxford Journals Environmental and Ethical PoliciesOxford Journals is committed to working with the global community to bring the highest quality research to the widest possible audience. Oxford Journals will protect the environment by implementing environmentally friendly policies and practices wherever possible. Please see http://www.oxfordjournals.org/ethicalpolicies.html for further information on Oxford Journals’ environmental and ethical policies.
© European Orthodontic Society 2010
All rights reserved; no part of this publication may be reproduced, stored in a retrieval system, or transmitted in any form or by any means, electronic, mechanical, photocopying, recording, or otherwise without prior written permission of the Publishers, or a licence permitting restricted copying issued in the UK by the Copyright Licensing Agency Ltd, 90 Tottenham Court Road, London W1P 9HE, or in the USA by the Copyright Clearance Center, 222 Rosewood Drive, Danvers, MA 01923. For those in the USA or Canada not registered with CCC, articles can be obtained by fax in 48 hours by calling: WISE for Medicine™ 1-800-667-WISE.
Typeset by TNQ Books and Journals Pvt. Ltd., Chennai, India. Printed by Bell and Bain Ltd., Glasgow, UK.

EJOwww.ejo.oxfordjournals.org
European Journal of
OrthodonticsVolume 32 | Number 2 | April 2010
ox
fo
rd
GLASS FIBRE REINFORCED VERSUS MULTISTRANDED BONDED ORTHODONTIC RETAINERS: A 2 YEAR PROSPECTIVE MULTI-CENTRE STUDY
MICHEL P. E. TACKEN, JAN COSYN, PETER DE WILDE, JOHAN AERTS, ELKE GOVAERTS AND BART VANDE VANNET 117
NO INFLUENCE OF ALIMENTARY ZINC ON THE HEALING OF CALVARIAL DEFECTS FILLED WITH OSTEOPROMOTIVE SUBSTANCES IN RATS
LEIGH JONES, JESPER SKOVHUS THOMSEN, JETTE BARLACH, LIS MOSEKILDE AND BIRTE MELSEN 124
LOW-ENERGY LASER IRRADIATION FACILITATES THE VELOCITY OF TOOTH MOVEMENT AND THE EXPRESSIONS OF MATRIX METALLOPROTEINASE-9, CATHEPSIN K, AND ALPHA(V) BETA(3) INTEGRIN IN RATS
MASARU YAMAGUCHI, MASAMI HAYASHI, SHOUJI FUJITA, TAKAMASA YOSHIDA, TADAHIKO UTSUNOMIYA, HIROTSUGU YAMAMOTO AND KAZUTAKA KASAI 131
ORTHODONTICS AND FOETAL PATHOLOGY: A PERSONAL VIEW ON CRANIOFACIAL PATTERNING
INGER KJÆR 140
BRIDGING OF THE SELLA TURCICA IN SKELETAL CLASS III SUBJECTS PHILIPP MEYER-MARCOTTY, TOBIAS REUTHER AND ANGELIKA STELLZIG-EISENHAUER 148
EFFECTS OF FORCE MAGNITUDE ON TOOTH MOVEMENT: AN EXPERIMENTAL STUDY IN RABBITS
NIHAT KILIÇ, HÜSAMETTIN OKTAY AND MUSTAFA ERSÖZ 154
A COMPARATIVE ASSESSMENT OF THE FORCES AND MOMENTS GENERATED WITH VARIOUS MAXILLARY INCISOR INTRUSION BIOMECHANICS
IOSIF SIFAKAKIS, NIKOLAOS PANDIS, MARGARITA MAKOU, THEODORE ELIADES AND CHRISTOPH BOURAUEL 159
HAWLEY RETAINERS FULL- OR PART-TIME? A RANDOMIZED CLINICAL TRIAL M. SHAWESH, B. BHATTI, T. USMANI AND N. MANDALL 165
A RANDOMIZED CLINICAL TRIAL TO COMPARE THE GOSHGARIAN AND NANCE PALATAL ARCH
N. STIVAROS, C. LOWE, N. DANDY, B. DOHERTY AND N. A. MANDALL 171
ASYMMETRY OF THE CRANIOFACIAL SKELETON IN THE PARENTS OF CHILDREN WITH A CLEFT LIP, WITH OR WITHOUT A CLEFT PALATE, OR AN ISOLATED CLEFT PALATE
G. T. MCINTYRE AND P. A. MOSSEY 177
ACCEPTABILITY OF ADOLESCENTS ’ OCCLUSION IN FINNISH MUNICIPAL HEALTH CENTRES WITH DIFFERING TIMING OF ORTHODONTIC TREATMENT
ILPO PIETILÄ, TERTTU PIETILÄ, ANNA-LIISA SVEDSTRÖM-ORISTO, JUHA VARRELA AND PENTTI ALANEN 186
DIAGNOSTIC AGREEMENT IN THE ASSESSMENT OF ORTHODONTIC TREATMENT NEED USING THE DENTAL AESTHETIC INDEX AND THE INDEX OF ORTHODONTIC TREATMENT NEED
DAVID MANZANERA, JOSÉ MARÍA MONTIEL-COMPANY, JOSÉ MANUEL ALMERICH-SILLA AND JOSÉ LUIS GANDÍA 193
Continued on inside back cover
ISSN 0141-5387 (print)ISSN 1460-2210 (online)Contents
European Journal of O
rthodonticsV
olume 32 | N
umber 2 | A
pril 2010

LONGITUDINAL PROFILE CHANGES IN AN ANATOLIAN TURKISH POPULATION NIHAL HAMAMCI, SEHER GÜNDÜZ ARSLAN AND SEMRA S AHIN 199
DENTAL ANOMALIES IN INDIVIDUALS WITH CLEFT LIP AND/OR PALATE M. OKAN AKCAM, SEHRAZAT EVIRGEN, OZGE USLU AND UFUK TOYGAR MEMIKO G LU 207
EVALUATION OF SHEAR BOND STRENGTH OF METALLIC AND CERAMIC BRACKETS BONDED TO ENAMEL PREPARED WITH SELF-ETCHING PRIMER
TANCAN UYSAL, AYCA USTDAL AND GOKMEN KURT 214
A NOVEL BRACKET BASE DESIGN: BIOMECHANICAL STABILITY G. MERONE, R. VALLETTA, R. DE SANTIS, L. AMBROSIO AND R. MARTINA 219
THE EFFECT OF AIR ABRASION PREPARATION ON THE SHEAR BOND STRENGTH OF AN ORTHODONTIC BRACKET BONDED TO ENAMEL
RICHARD M. HALPERN AND TANYA ROULEAU 224
LETTERS TO THE EDITOR 228
BOOK REVIEWS 230
Continued from outside back coverEuropean Journal of OrthodonticsPublished by the European Orthodontic Society
ScopeThe European Journal of Orthodontics publishes (in English) research or clinical papers of interest to all orthodontists. Although the primary intention is to provide a forum for orthodontists in Europe, the journal welcomes papers from all parts of the world.
Editor Associate EditorsProfessor Fraser McDonald Doctor Susan Cunnningham Doctor Theodore Eliades Doctor Ama Johal
Editorial BoardDoctor Tiziano Baccetti Professor Stavros Kiliaridis Professor Pertti PirttiniemiDoctor Pongsri Brudvik Professor Inger Kjær Professor Sabine Ruf Professor Carine E. Carels Doctor Agneta Linder-Aronson Karsten Doctor Vaska Vandevska-RadunovicProfessor Marie-Pierryle Filleul Professor Timo Peltomäki Doctor Frank WeilandProfessor Haluk I
.seri Professor Neil Pender
European Orthodontic SocietyOfficers of the SocietyPresident 2009/2010: Hon. Editor: Hon. Treasurer:Dr Maja Ovsenik Professor Fraser McDonald Professor Andrej ZentnerPresident elect: Professor Nejat Erverdi
SubscriptionsA subscription to the European Journal of Orthodontics comprises 6 issues. Prices include postage by surface mail, or for subscribers in the USA and Canada by airfreight, or in India, Japan, Australia and New Zealand, by Air Speeded Post. Airmail rates are available on request.
Annual Subscription Rate (Volume 32, 6 issues, 2010) Institutional PersonalPrint edition and site-wide online access: £352.00/$704.00/¤528.00 Print edition and individual online access: £249.00/$498.00/¤374.00Print edition only: £322.00/$644.00/¤483.00 Please note: US$ rate applies to US & Canada, Euros applies to Europe,Site-wide online access only: £284.00/$568.00/¤427.00 UK£ applies to UK and Rest of World
There may by other subscription rates available, for a complete listing please visit www.ejo.oxfordjournals.org/subscriptions/. Full prepayment, in the correct currency, is required for all orders. Orders are regarded as firm and payments are not refundable. Subscriptions are accepted and entered on a complete volume basis. Claims cannot be considered more than FOUR months after publication or date of order, whichever is later. All subscriptions in Canada are subject to GST. Subscriptions in the EU may be subject to European VAT. If registered, please supply details to avoid unnecessary charges. For subscriptions that include online versions, a proportion of the subscription price may be subject to UK VAT. Personal rate subscriptions are only available if payment is made by personal cheque or credit card and delivery is to a private address. The current year and two previous years’ issues are available from Oxford University Press. Previous volumes can be obtained from the Periodicals Service Company, 11 Main Street, Germantown, NY 12526, USA. Email: [email protected]. Tel: +1 (518) 537 4700. Fax: +1 (518) 537 5899. For further information, please contact: Journals Customer Service Department, Oxford University Press, Great Clarendon Street, Oxford OX2 6DP, UK. Email: [email protected]. Tel (and answerphone outside normal working hours): +44 (0)1865 353907. Fax: + 44 (0)1865 353485. In the US, please contact: Journals Customer Service Department, Oxford University Press, 2001 Evans Road, Cary, NC 27513, USA. Email: [email protected]. Tel (and answerphone outside normal working hours): 800 852 7323 (toll-free in USA/Canada). Fax: 919 677 1714. In Japan, please contact: Journals Customer Services, Oxford University Press, Tokyo 4-5-10-8F Shiba, Minato-ku, Tokyo 108-8386 Japan. Email: [email protected]. Tel: (03) 3813 1461. Fax: (03) 3818 1522. Methods of payment. (i) Cheque (payable to Oxofrd University Press, to Oxford University Press, Cashiers Office, Great Clarendon Street, Oxford OX2 6DP, UK) in GB£ Sterling (drawn on a UK bank), US$ Dollars (drawn on a US bank), or EU¤ Euros. (ii) Bank transfer to Barclays Bank Plc, Oxford Group Office, Oxford (bank sort code 20-65-18) (UK), overseas only Swift code BARC GB 22 (GB£ Sterling to account no. 70299332, IBAN GB89BARC20651870299332; US$ Dollars to account no. 66014600, IBAN GB27BARC20651866014600; EU¤ Euros to account no. 7892365, IBAN GB16BARC20651878923655). (iii) Credit card (Mastercard, Visa, Switch of American Express). European Journal of Orthodontics is published bimonthly in February, April, June, August, October and December by Oxford University Press, Oxford, UK. Annual subscription price is £352.00/$704.00/¤528.00. European Journal of Orthodontics is distributed by Mercury International, 365 Blair Road, Avenel, NJ 07001, USA. Periodicals postage paid at Rahway, NJ and at additional entry points. US Postmaster: send address changes to European Journal of Orthodontics (ISSN 0141-5387), c/o Mercury International, 365 Blair Road, Avenel, NJ 07001, USA.
PermissionsFor information on how to request permissions to reproduce articles/information from this journal, please visit www.oxfordjournals.org/permissions.
AdvertisingAdvertising, inserts and artwork enquiries should be addressed to Advertising and Special Sales, Oxford Journals, Oxford University Press, Great Clarendon Street, Oxford OX2 6DP, UK. Tel: +44 (0)1865 354767; Fax +44 (0)1865 353774; E-mail: [email protected]
Oxford Journals Environmental and Ethical PoliciesOxford Journals is committed to working with the global community to bring the highest quality research to the widest possible audience. Oxford Journals will protect the environment by implementing environmentally friendly policies and practices wherever possible. Please see http://www.oxfordjournals.org/ethicalpolicies.html for further information on Oxford Journals’ environmental and ethical policies.
© European Orthodontic Society 2010
All rights reserved; no part of this publication may be reproduced, stored in a retrieval system, or transmitted in any form or by any means, electronic, mechanical, photocopying, recording, or otherwise without prior written permission of the Publishers, or a licence permitting restricted copying issued in the UK by the Copyright Licensing Agency Ltd, 90 Tottenham Court Road, London W1P 9HE, or in the USA by the Copyright Clearance Center, 222 Rosewood Drive, Danvers, MA 01923. For those in the USA or Canada not registered with CCC, articles can be obtained by fax in 48 hours by calling: WISE for Medicine™ 1-800-667-WISE.
Typeset by TNQ Books and Journals Pvt. Ltd., Chennai, India. Printed by Bell and Bain Ltd., Glasgow, UK.
European Journal of Orthodontics 32 (2010) 117–123 © The Author 2009. Published by Oxford University Press on behalf of the European Orthodontic Society.doi:10.1093/ejo/cjp100 All rights reserved. For permissions, please email: [email protected] Access Publication 16 October 2009
Introduction
Orthodontic treatment results are potentially unstable and, therefore, often require retention in the anterior segment of the upper and lower jaw. Contemporary retaining strategies basically include removable and fixed retainers. As the former depend on patient compliance, fixed retainers are usually preferred. Zachrisson (1983) introduced the multistranded bonded lingual retainer. Apart from variations in wire types, diameters, and bonding procedures, this type of retainer has become the gold standard (Bearn, 1995). Multistranded bonded lingual retainers show success rates of between 60 and 95 per cent in the long-term, with most failures in the maxilla during the first year of function (Dahl and Zachrisson, 1991; Andrén et al., 1998). Studies have indicated acceptable compatibility of metal-bonded retainers with periodontal health (Årtun, 1984; Årtun et al., 1987, 1997; Heier et al., 1997; Booth et al., 2008). Limitations, however, include aesthetics and the fact that they cannot be used in patients with a nickel allergy. Therefore, alternatives have been developed such as polyethylene ribbon-reinforced retainers and glass fibre reinforced (GFR) retainers. Case reports have been published
Glass fibre reinforced versus multistranded bonded orthodontic
retainers: a 2 year prospective multi-centre study
Michel P. E. Tacken*, Jan Cosyn**,***, Peter De Wilde*, Johan Aerts*, Elke Govaerts* and Bart Vande Vannet*Departments of *Orthodontics and **Periodontology, Dental Medicine, Free University of Brussels (VUB), and ***Department of Periodontology and Oral Implantology, School of Dental Medicine, University of Ghent, Belgium
SUMMARY The objective of this study was to compare glass fibre reinforced (GFR) with multistranded bonded orthodontic retainers in terms of success rate and periodontal implications.
A 2 year parallel study was conducted of 184 patients scheduled to receive bonded retainers in the upper and lower anterior segments. In three centres, the patients (mean age 14 years; 90 males and 94 females) were sequentially assigned to receive GFR retainers containing 500 unidirectional glass fibres (GFR500), 1000 unidirectional glass fibres (GFR1000), or multistranded retainers (gold standard). Retainer failures and periodontal conditions were monitored every 6 months. In a control group of 90 subjects without retainers, periodontal conditions were examined (negative control). Of the 274 recruited patients, 15 dropped out during the 2 year study period. Kaplan–Meier plots were drawn to assess survival of the different retainers. The Mantel–Cox log-rank test was used to identify significant differences in survival functions among the groups. Repeated measures analysis of variance and appropriate post hoc tests were adopted to evaluate periodontal conditions over time.
GFR retainers showed unacceptably high failure rates in comparison with multistranded retainers (51 versus 12 per cent). The most significant periodontal conditions were found in patients with GFR retainers with no significant differences between the GFR500 and the GFR1000 group for any parameter at any time point. Subjects without retainers showed significantly lower levels of gingival inflammation and plaque accumulation when compared with patients in any retainer group.
Multistranded retainers should remain the gold standard for orthodontic retention, although periodontal complications are common. The use of GFR retainers should be discouraged in daily practice.
on the latter (Geserick et al., 2004; Brauchli et al., 2006); however, no large-scale long-term study has been undertaken documenting the success rate and periodontal implications.
The objective of this study was to compare GFR with multistranded bonded orthodontic retainers in terms of success rate and periodontal implications.
Subjects and methods
The study protocol was approved by the Ethics Committee of the University Hospital of Brussels (UZ Brussels).
Experimental design
One hundred and eighty-four adolescents (mean age 14 years; 90 males and 94 females) who were scheduled to receive bonded lingual retainers (from lateral incisor to lateral incisor in the upper jaw and from canine to canine in the lower jaw) were enrolled for a parallel study. All patients had been orthodontically treated with fixed appliances in one of three private practices.

M. P. E. TACkEn ET AL.118
Table 1 Demographic details and oral hygiene habits prior to the start of the study of the four groups.
Group Patients Males Females Age, Mean (SD) Daily use of an electric brush (%) Use of interdental aids ≥1 × /week (%)
GFR500 45 23 22 14.8 (1.3) 38 76GFR1000 48 23 25 14.6 (2.7) 30 65MR 91 44 47 15.0 (1.3) 35 70Control 90 45 45 14.1 (1.1) 31 67
Glass fibre reinforced bonded orthodontic retainers containing 500 unidirectional fibres (GFR500), 1000 unidirectional fibres (GFR1000), multistranded bonded orthodontic retainers (MR), and the control group (control).
The inclusion criteria were good general health, correct dental alignment, a Class I relationship with an overbite/overjet between 1 and 3 mm, and the need for permanent orthodontic retention in the upper and lower anterior segments. The exclusion criteria were periodontal disease, advanced dental abrasion/attrition/erosion, and bruxism.
After having obtained written informed consent, the patients were sequentially assigned to either a GFR500 retainer group (n = 45), a GFR1000 retainer group (n = 48), or a multistranded wire group (n = 91). Thus, in the first patient GFR500 retainers were placed, in the second GFR1000 retainers, in the third and the fourth multistrand retainers, and so on. This type of randomization ensured comparable frequency distributions of the groups among the centres. In all centres, at least 61 patients were enrolled. In addition, 90 un-treated subjects were recruited at a high school and examined by one clinician (MPET) at the end of the study.
The subjects in this control group were enrolled on the basis of the same selection criteria as the treated patients except for the need for permanent retention. All subjects (n = 274) completed a questionnaire on daily home care prior to the start of the study. Table 1 shows the demographic details and data on oral hygiene habits. All groups were compatible in terms of gender, age, and pre-study oral hygiene habits.
Bonding procedures
All retainers were bonded by three experienced clinicians (BVV, PDW, JA) at the different centres using a standardized protocol. For all types, the same etch gel (35 per cent phosphoric acid; Ortho Organizers ®, San Marcos, California, USA), bonding system (Excite®, Vivadent, Schaan, Liechtenstein), and flowable composite (Tetric flow ®, Vivadent) were used (Elaut et al., 2002). Retainers in the lower jaw were positioned half way up the lingual crown surface of the teeth avoiding contact with papillae; retainers in the upper jaw were placed more apically avoiding occlusal interference.
Patients allocated to the GFR500 group received retainers containing 500 unidirectional glass fibres (EverStick®Ortho 500, Stick Tech Ltd, Turku, Finland), which had been specifically manufactured for this study, while those in the GFR1000 group received commercially available retainers containing 1000 unidirectional glass fibres (EverStick®Ortho
1000, Stick Tech Ltd). The rationale for including two GFR retainer groups was related to the hypothesis that a thinner retainer would result in less plaque accumulation and therefore superior periodontal conditions.
All fibres were cut to the appropriate length, which had been measured on plaster casts using dental floss. Wedges were then placed interdentally to avoid interproximal contamination and ensure good access for subsequent cleaning. Lingual tooth surfaces were cleaned, sandblasted (Al2O3 50 m), and etched for 30 seconds. The teeth were air-dried and isolated using saliva ejectors and cotton rolls. The bonding agent was applied on all teeth, light cured with a light emitting diode (Ortholux; 3M Unitek, Monrovia, California, USA) for 5 seconds per tooth, followed by the application of the flowable composite. Light curing was carried out for each tooth for 10 seconds after the retainer had been correctly adjusted. The use of a wide instrument (Stickstepper®, Stick Tech Ltd) prevented premature curing at neighbouring teeth. The procedure was repeated tooth by tooth followed by the application of a thin layer of flowable composite covering the glass fibres (Figure 1).
In the multistranded retainer group, the subjects had six stranded 0.0215 inch coaxial wire (Ortho Organizers®) used for retention, which had been constructed on plaster casts. Tooth conditioning, isolation, and application/curing of the bonding agent was carried out in the same way as described for the GFR retainers. Subsequently, the coaxial wire was placed on to the teeth using a putty holder and flowable composite was used to attach the wire to the upper lateral incisors or lower canines. After removal of the holder, the same procedure was repeated for the other teeth (Figure 2).
Each bonding procedure was completed by giving oral hygiene instructions with emphasis on interdental cleaning using dental floss (Superfloss®, Oral-B Laboratories, Diegem, Belgium).
Examination criteria
The following clinical parameters were recorded by the same calibrated clinician (MPET) at the 6, 12, 18, and 24 month follow-up:
1. Success rate. A retainer was considered successful when it remained intact over the 2 year study period. When failure

119 BONDED ORTHODONTIC RETAINERS
2. Modified gingival index (MGI) (Lobene et al., 1986). Gingival inflammation was measured at three sites per tooth (mesial, central, and distal) and scored as follows: absence of inflammation (0), part of gingival unit mild inflammation (1), complete gingival unit mild inflammation (2), moderate inflammation (3), and severe inflammation (4).
3. Bleeding on Probing (BOP) (Cosyn and Verelst, 2006). Gingival bleeding tendency was measured at three sites per tooth (mesial, central, and distal) using a manual probe (CP 15 UNC, Hu-Friedy®, Chicago, Illinois, USA). The bleeding score was registered after 15 seconds: no bleeding (0), point-bleeding (1), and abundant bleeding (2).
4. Plaque index (PI) (Quigley and Hein, 1962). Plaque levels were measured at three sites per tooth (mesial, central, and distal) following plaque disclosure using red Rondell Disclosing Pellets (Svenska®, Stockholm, Sweden). The scores ranged from 0 to 5: no plaque (0), spots of plaque at the cervical margin (1), thin continuous band of plaque at the cervical margin (2), gingival third of tooth surface covered with plaque (3), two-thirds of tooth surface covered with plaque (4), more than two-thirds of tooth surface covered with plaque (5).
At each assessment, oral hygiene instruction was reinforced and plaque/calculus was mechanically removed. Finally, all teeth were polished (nupro® Fine, Ash, Denstply, York, Uk). These procedures were performed by the same clinician in all patients (MPET).
Calibration session
To optimize the reliability of the results, the investigator who carried out the clinical assessments was calibrated prior to the start of the study. Fifteen patients with bonded lingual retainers were enrolled for this purpose. Duplicate measurements of 180 anterior teeth (n = 540) for the MGI and PI were collected over a time interval of 2 hours.
Statistical analysis
kaplan–Meier survival analysis was performed to monitor retainer failures over time. The Mantel–Cox log-rank test was used to identify significant differences in survival functions among the groups. Retainers in the maxilla were separately analysed from those in the mandible. The Mantel–Cox log-rank test was also adopted to determine centre-related differences in survival functions for the different types of retainers. Significant differences in the proportion of broken or detached retainer failures among the groups were analysed using Fisher’s exact test.
For all periodontal parameters, the mean values and standard deviations were calculated per subject and per visit. Since ordinal-scaled variables become interval scaled as such, and because the data conformed to a normal distribution
Figure 1 Glass fibre reinforced bonded orthodontic retainer in the upper (a) and lower (b) jaw.
Figure 2 Multistranded bonded orthodontic retainer in the upper (a) and lower (b) jaw.
occurred, the time from initial bonding until failure (time to event) was recorded. For each failure, a distinction was made between detached and broken retainers.
M. P. E. TACkEn ET AL.120
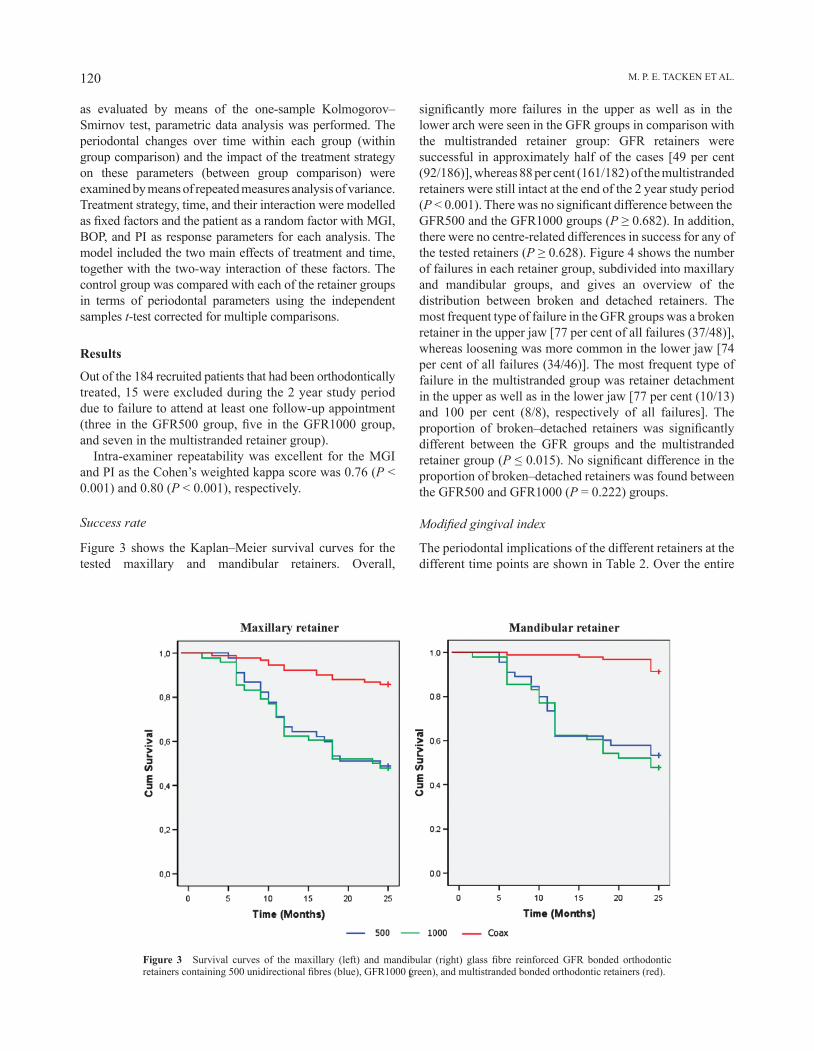
Figure 3 Survival curves of the maxillary (left) and mandibular (right) glass fibre reinforced GFR bonded orthodontic retainers containing 500 unidirectional fibres (blue), GFR1000 (green), and multistranded bonded orthodontic retainers (red).
as evaluated by means of the one-sample kolmogorov–Smirnov test, parametric data analysis was performed. The periodontal changes over time within each group (within group comparison) and the impact of the treatment strategy on these parameters (between group comparison) were examined by means of repeated measures analysis of variance. Treatment strategy, time, and their interaction were modelled as fixed factors and the patient as a random factor with MGI, BOP, and PI as response parameters for each analysis. The model included the two main effects of treatment and time, together with the two-way interaction of these factors. The control group was compared with each of the retainer groups in terms of periodontal parameters using the independent samples t-test corrected for multiple comparisons.
Results
Out of the 184 recruited patients that had been orthodontically treated, 15 were excluded during the 2 year study period due to failure to attend at least one follow-up appointment (three in the GFR500 group, five in the GFR1000 group, and seven in the multistranded retainer group).
Intra-examiner repeatability was excellent for the MGI and PI as the Cohen’s weighted kappa score was 0.76 (P < 0.001) and 0.80 (P < 0.001), respectively.
Success rate
Figure 3 shows the kaplan–Meier survival curves for the tested maxillary and mandibular retainers. Overall,
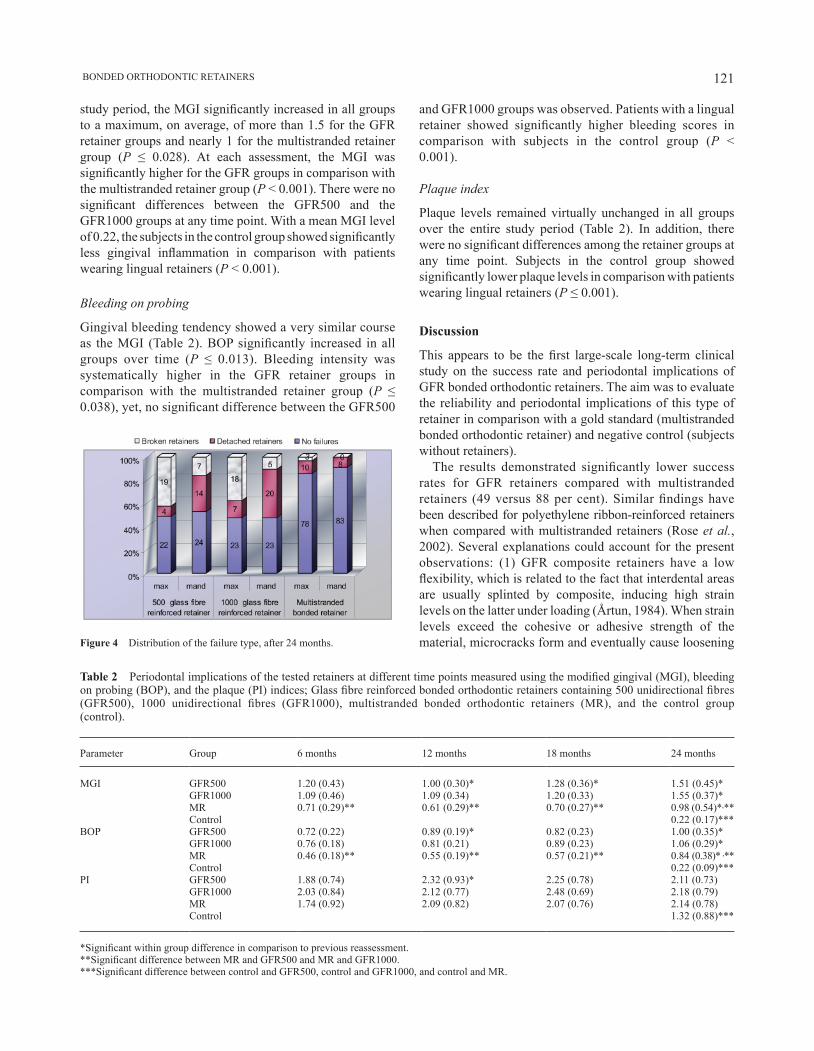
significantly more failures in the upper as well as in the lower arch were seen in the GFR groups in comparison with the multistranded retainer group: GFR retainers were successful in approximately half of the cases [49 per cent (92/186)], whereas 88 per cent (161/182) of the multistranded retainers were still intact at the end of the 2 year study period (P < 0.001). There was no significant difference between the GFR500 and the GFR1000 groups (P ≥ 0.682). In addition, there were no centre-related differences in success for any of the tested retainers (P ≥ 0.628). Figure 4 shows the number of failures in each retainer group, subdivided into maxillary and mandibular groups, and gives an overview of the distribution between broken and detached retainers. The most frequent type of failure in the GFR groups was a broken retainer in the upper jaw [77 per cent of all failures (37/48)], whereas loosening was more common in the lower jaw [74 per cent of all failures (34/46)]. The most frequent type of failure in the multistranded group was retainer detachment in the upper as well as in the lower jaw [77 per cent (10/13) and 100 per cent (8/8), respectively of all failures]. The proportion of broken–detached retainers was significantly different between the GFR groups and the multistranded retainer group (P ≤ 0.015). No significant difference in the proportion of broken–detached retainers was found between the GFR500 and GFR1000 (P = 0.222) groups.
Modified gingival index
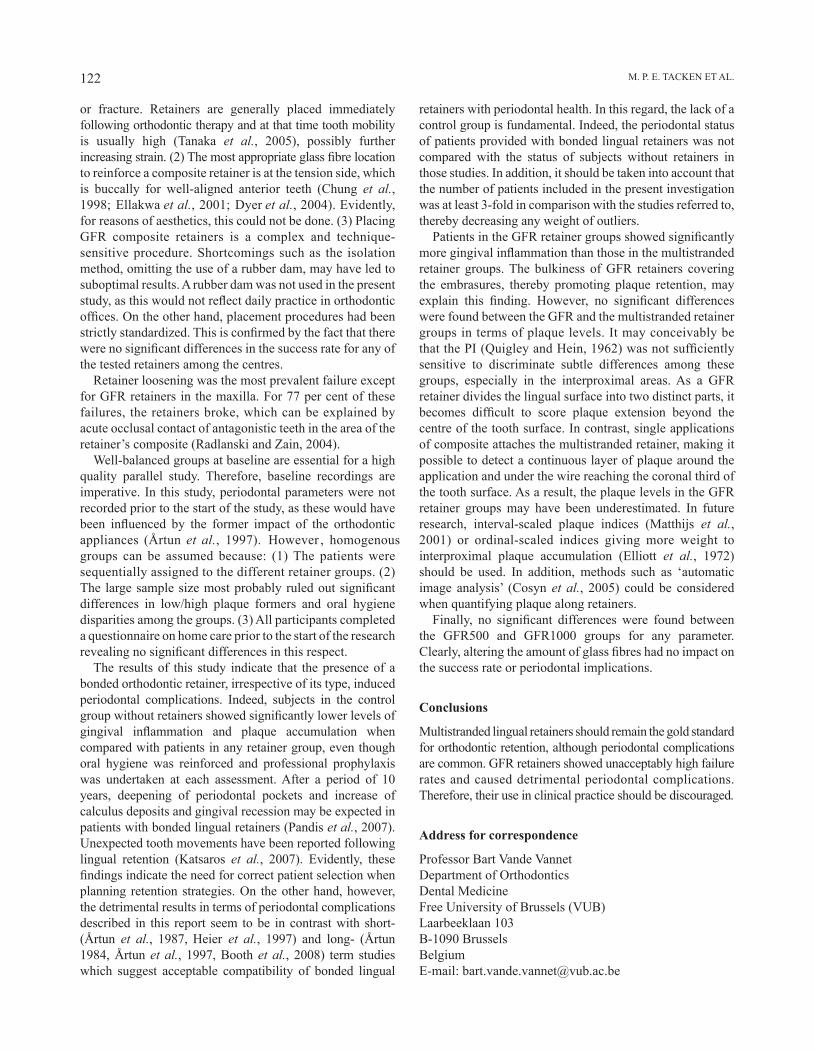
The periodontal implications of the different retainers at the different time points are shown in Table 2. Over the entire
121 BONDED ORTHODONTIC RETAINERS
study period, the MGI significantly increased in all groups to a maximum, on average, of more than 1.5 for the GFR retainer groups and nearly 1 for the multistranded retainer group (P ≤ 0.028). At each assessment, the MGI was significantly higher for the GFR groups in comparison with the multistranded retainer group (P < 0.001). There were no significant differences between the GFR500 and the GFR1000 groups at any time point. With a mean MGI level of 0.22, the subjects in the control group showed significantly less gingival inflammation in comparison with patients wearing lingual retainers (P < 0.001).
Bleeding on probing
Gingival bleeding tendency showed a very similar course as the MGI (Table 2). BOP significantly increased in all groups over time (P ≤ 0.013). Bleeding intensity was systematically higher in the GFR retainer groups in comparison with the multistranded retainer group (P ≤ 0.038), yet, no significant difference between the GFR500
Figure 4 Distribution of the failure type, after 24 months.
Table 2 Periodontal implications of the tested retainers at different time points measured using the modified gingival (MGI), bleeding on probing (BOP), and the plaque (PI) indices; Glass fibre reinforced bonded orthodontic retainers containing 500 unidirectional fibres (GFR500), 1000 unidirectional fibres (GFR1000), multistranded bonded orthodontic retainers (MR), and the control group (control).
Parameter Group 6 months 12 months 18 months 24 months
MGI GFR500 1.20 (0.43) 1.00 (0.30)* 1.28 (0.36)* 1.51 (0.45)*GFR1000 1.09 (0.46) 1.09 (0.34) 1.20 (0.33) 1.55 (0.37)*MR 0.71 (0.29)** 0.61 (0.29)** 0.70 (0.27)** 0.98 (0.54)*,**Control 0.22 (0.17)***
BOP GFR500 0.72 (0.22) 0.89 (0.19)* 0.82 (0.23) 1.00 (0.35)*GFR1000 0.76 (0.18) 0.81 (0.21) 0.89 (0.23) 1.06 (0.29)*MR 0.46 (0.18)** 0.55 (0.19)** 0.57 (0.21)** 0.84 (0.38)* ,**Control 0.22 (0.09)***
PI GFR500 1.88 (0.74) 2.32 (0.93)* 2.25 (0.78) 2.11 (0.73)GFR1000 2.03 (0.84) 2.12 (0.77) 2.48 (0.69) 2.18 (0.79)MR 1.74 (0.92) 2.09 (0.82) 2.07 (0.76) 2.14 (0.78)Control 1.32 (0.88)***
*Significant within group difference in comparison to previous reassessment.**Significant difference between MR and GFR500 and MR and GFR1000.***Significant difference between control and GFR500, control and GFR1000, and control and MR.
and GFR1000 groups was observed. Patients with a lingual retainer showed significantly higher bleeding scores in comparison with subjects in the control group (P < 0.001).
Plaque index
Plaque levels remained virtually unchanged in all groups over the entire study period (Table 2). In addition, there were no significant differences among the retainer groups at any time point. Subjects in the control group showed significantly lower plaque levels in comparison with patients wearing lingual retainers (P ≤ 0.001).
Discussion
This appears to be the first large-scale long-term clinical study on the success rate and periodontal implications of GFR bonded orthodontic retainers. The aim was to evaluate the reliability and periodontal implications of this type of retainer in comparison with a gold standard (multistranded bonded orthodontic retainer) and negative control (subjects without retainers).
The results demonstrated significantly lower success rates for GFR retainers compared with multistranded retainers (49 versus 88 per cent). Similar findings have been described for polyethylene ribbon-reinforced retainers when compared with multistranded retainers (Rose et al., 2002). Several explanations could account for the present observations: (1) GFR composite retainers have a low flexibility, which is related to the fact that interdental areas are usually splinted by composite, inducing high strain levels on the latter under loading (Årtun, 1984). When strain levels exceed the cohesive or adhesive strength of the material, microcracks form and eventually cause loosening
M. P. E. TACkEn ET AL.122
or fracture. Retainers are generally placed immediately following orthodontic therapy and at that time tooth mobility is usually high (Tanaka et al., 2005), possibly further increasing strain. (2) The most appropriate glass fibre location to reinforce a composite retainer is at the tension side, which is buccally for well-aligned anterior teeth (Chung et al., 1998; Ellakwa et al., 2001; Dyer et al., 2004). Evidently, for reasons of aesthetics, this could not be done. (3) Placing GFR composite retainers is a complex and technique-sensitive procedure. Shortcomings such as the isolation method, omitting the use of a rubber dam, may have led to suboptimal results. A rubber dam was not used in the present study, as this would not reflect daily practice in orthodontic offices. On the other hand, placement procedures had been strictly standardized. This is confirmed by the fact that there were no significant differences in the success rate for any of the tested retainers among the centres.
Retainer loosening was the most prevalent failure except for GFR retainers in the maxilla. For 77 per cent of these failures, the retainers broke, which can be explained by acute occlusal contact of antagonistic teeth in the area of the retainer’s composite (Radlanski and Zain, 2004).
Well-balanced groups at baseline are essential for a high quality parallel study. Therefore, baseline recordings are imperative. In this study, periodontal parameters were not recorded prior to the start of the study, as these would have been influenced by the former impact of the orthodontic appliances (Årtun et al., 1997). However , homogenous groups can be assumed because: (1) The patients were sequentially assigned to the different retainer groups. (2) The large sample size most probably ruled out significant differences in low/high plaque formers and oral hygiene disparities among the groups. (3) All participants completed a questionnaire on home care prior to the start of the research revealing no significant differences in this respect.
The results of this study indicate that the presence of a bonded orthodontic retainer, irrespective of its type, induced periodontal complications. Indeed, subjects in the control group without retainers showed significantly lower levels of gingival inflammation and plaque accumulation when compared with patients in any retainer group, even though oral hygiene was reinforced and professional prophylaxis was undertaken at each assessment. After a period of 10 years, deepening of periodontal pockets and increase of calculus deposits and gingival recession may be expected in patients with bonded lingual retainers (Pandis et al., 2007). Unexpected tooth movements have been reported following lingual retention (katsaros et al., 2007). Evidently, these findings indicate the need for correct patient selection when planning retention strategies. On the other hand, however, the detrimental results in terms of periodontal complications described in this report seem to be in contrast with short- (Årtun et al., 1987, Heier et al., 1997) and long- (Årtun 1984, Årtun et al., 1997, Booth et al., 2008) term studies which suggest acceptable compatibility of bonded lingual
retainers with periodontal health. In this regard, the lack of a control group is fundamental. Indeed, the periodontal status of patients provided with bonded lingual retainers was not compared with the status of subjects without retainers in those studies. In addition, it should be taken into account that the number of patients included in the present investigation was at least 3-fold in comparison with the studies referred to, thereby decreasing any weight of outliers.
Patients in the GFR retainer groups showed significantly more gingival inflammation than those in the multistranded retainer groups. The bulkiness of GFR retainers covering the embrasures, thereby promoting plaque retention, may explain this finding. However, no significant differences were found between the GFR and the multistranded retainer groups in terms of plaque levels. It may conceivably be that the PI (Quigley and Hein, 1962) was not sufficiently sensitive to discriminate subtle differences among these groups, especially in the interproximal areas. As a GFR retainer divides the lingual surface into two distinct parts, it becomes difficult to score plaque extension beyond the centre of the tooth surface. In contrast, single applications of composite attaches the multistranded retainer, making it possible to detect a continuous layer of plaque around the application and under the wire reaching the coronal third of the tooth surface. As a result, the plaque levels in the GFR retainer groups may have been underestimated. In future research, interval-scaled plaque indices (Matthijs et al., 2001) or ordinal-scaled indices giving more weight to interproximal plaque accumulation (Elliott et al., 1972) should be used. In addition, methods such as ‘automatic image analysis’ (Cosyn et al., 2005) could be considered when quantifying plaque along retainers.
Finally, no significant differences were found between the GFR500 and GFR1000 groups for any parameter. Clearly, altering the amount of glass fibres had no impact on the success rate or periodontal implications.
Conclusions
Multistranded lingual retainers should remain the gold standard for orthodontic retention, although periodontal complications are common. GFR retainers showed unacceptably high failure rates and caused detrimental periodontal complications. Therefore, their use in clinical practice should be discouraged.
Address for correspondence
Professor Bart Vande VannetDepartment of OrthodonticsDental MedicineFree University of Brussels (VUB)Laarbeeklaan 103B-1090 BrusselsBelgiumE-mail: [email protected]
123 BONDED ORTHODONTIC RETAINERS
Acknowledgement
The authors wish to thank Tiina Varrela and Eija Säilynoja of Stich Tech Ltd. For their support in providing materials. Gratitude also goes to Professor L. Kaufman and K.H.M JacobTacken for their statistical expertise.
ReferencesAndrén A, Asplund J, Azarmidohkt E, Svensson R, Varde P, Mohlin B
1998 A clinical evaluation of long term retention with bonded retainers made from multi-strand wires. Swedish Dental Journal 22: 123–131
Årtun J 1984 Caries and periodontal reactions associated with long-term use of different types of bonded lingual retainers. American Journal of Orthodontics 86: 112–118
Årtun J, Spadafora A T, Shapiro P A 1997 A 3-year follow-up study of various types of orthodontic canine-to-canine retainers. European Journal of Orthodontics 19: 501–509
Årtun J, Spadafora A T, Shapiro P A, McNeill R W, Chapko M K 1987 Hygiene status associated with different types of bonded, orthodontic canine-to-canine retainers. A clinical trial. Journal of Clinical Periodontology 14: 89–94
Bearn D R 1995 Bonded orthodontic retainers: a review. American Journal of Orthodontics and Dentofacial Orthopedics 108: 207–213
Booth F A, Edelman J M, Proffit W R 2008 Twenty year follow-up of patients with permanently bonded mandibular canine-to-canine retainers. American Journal of Orthodontics and Dentofacial Orthopedics 133: 70–76
Brauchli L M, Wiedmer C, Wichelhaus A 2006 A light-focusing tool for bonding fibre-reinforced composite retainers. Journal of Clinical Orthodontics 40: 359–360
Chung K, Lin T, Wang F 1998 Flexural strength of a provisional resin material with fibre addition. Journal of Oral Rehabilitation 25: 214–217
Cosyn J, Verelst K 2006 An efficacy and safety analysis of a chlorhexidine chewing gum in young orthodontic patients. Journal of Clinical Periodontology 33: 894–899
Cosyn J et al. 2005 Short-term anti-plaque effect of two chlorhexidine varnishes. Journal of Clinical Periodontology 32: 899–904
Dahl E H, Zachrisson B U 1991 Long-term experience with direct-bonded lingual retainers. Journal of Clinical Orthodontics 25: 619–630
Dyer S R, Lassila L V, Jokinen M, Vallittu P K 2004 Effect of fibre position and orientation on fracture load of fibre-reinforced composite. Dental Materials 20: 947–955
Elaut J, Asscherickx K, Vande Vannet B, Wehrbein H 2002 Flowable composites for bonding lingual retainers. Journal of Clinical Orthodontics 36: 597–598
Ellakwa A E, Shortall A C, Shehata M K, Marquis P M 2001 The influence of fibre placement and position on the efficiency of reinforcement of fibre reinforced composite bridgework. Journal of Oral Rehabilitation 28: 785–791
Elliott J R, Bowers G M, Clemmer B A, Rovelstad G H 1972 A comparison of selected oral hygiene devices in dental plaque removal. Journal of Periodontology 43: 217–220
Geserick M, Ball J, Wichelhaus J 2004 Bonding fiber-reinforced lingual retainers with color-reactivating flowable composites. Journal of Clinical Orthodontics 38: 560–562
Heier E E, De Smit A A, Wijgaerts I A, Adriaens P A 1997 Periodontal implications of bonded versus removable retainers. American Journal of Orthodontics and Dentofacial Orthopedics 112: 607–616
katsaros C, Livas C, Renkema A M 2007 Unexpected complications of bonded mandibular lingual retainers. American Journal of Orthodontics and Dentofacial Orthopedics 132: 838–841
Lobene R R, Weatherford T, Ross N M, Lamm R A, Menaker L 1986 A modified gingival index for use in clinical trials. Clinical Preventive Dentistry 8: 3–6
Matthijs S, Sabzevar M M, Adriaens P A 2001 Intra-examiner reproducibility of 4 dental plaque indices. Journal of Clinical Periodontology 28: 250–254
Pandis n, Vlahopoulos k, Madianos P, Eliades T 2007 Long-term periodontal status of patients with mandibular lingual fixed retention. European Journal of Orthodontics 29: 471–476
Quigley G A, Hein J W 1962 Comparative cleansing efficiency of manual and power brushing. Journal of the American Dental Association 65: 26–29
Radlanski R J, Zain N D 2004 Stability of the bonded lingual wire retainer. A study of the initial bond strength. Journal of Orofacial Orthopedics 65: 321–335
Rose E, Frucht S, Jonas I E 2002 Clinical comparison of a multistranded wire and a direct-bonded polyethylene ribbon-reinforced resin composite used for lingual retention. Quintessence International 33: 579–583
Tanaka E et al. 2005 Longitudinal measurements of tooth mobility during orthodontic treatment using a periotest. Angle Orthodontist 75: 101–105
Zachrisson B U 1983 The bonded lingual retainer and multiple spacing of anterior teeth. Journal of Clinical Orthodontics 17: 838–844
European Journal of Orthodontics 32 (2010) 124–130 © The Author 2010. Published by Oxford University Press on behalf of the European Orthodontic Society.doi:10.1093/ejo/cjp076 All rights reserved. For permissions, please email: [email protected] Access Publication 11 January 2010
Introduction
An increasing number of surgical interventions involving the craniofacial skeleton are being performed. However, repair and reconstruction of bone, especially when the defects to be repaired surpass a certain size, presents a significant problem. Tissue engineering is essential for healing of large bone defects, for example secondary to clefts, tumours, and trauma. Intraorally autogenous bone grafts from the mandible, or, if insufficient, from the iliac crest have been the preferred method for enhancing closure of major defects, although not without complication such as donor site morbidity (Perry, 1999). For these reasons, research has continued to be directed towards the development of biomaterials that provide osteoinductive and osteoconductive qualities. Other methods for resolving bone defects are allografts, demineralized bone matrix (DBM), hydroxyapatite, bone morphogenetic proteins, and several related growth factors (Giannoudis et al., 2005).
Independent of the interest in grafting materials, the influence of trace elements on the healing of bone has attracted increasing attention (Dollwet and Sorenson, 1988; Benderdour et al., 1998; Barceloux, 1999). Among those, zinc has attracted the most interest, as it has been shown to influence both growth and healing of experimental bone
No influence of alimentary zinc on the healing of calvarial
defects filled with osteopromotive substances in rats
Leigh Jones*, Jesper Skovhus Thomsen**, Jette Barlach*, Lis Mosekilde** and Birte Melsen*Departments of *Orthodontics and **Connective Tissue Biology, University of Aarhus, Denmark
SUMMARY Zinc has been demonstrated to play an important role in bone metabolism and is required for normal growth. However, no studies have investigated the influence of zinc on calvarial bone healing in aged or adult rats. The aim of the study was to evaluate whether alimentary zinc supplementation and depletion affect bone healing of calvarial defects implanted with osteopromotive substances in adult rats. Two 5 mm full thickness critical size bone defects were trephined in the central part of each parietal bone of 60 six-month-old male Wistar rats. The bone defects were filled with demineralized bone matrix (DBM), autogenous bone chips, or were left as unfilled controls. The rats were divided into three groups of 20 rats each and received a semi-synthetic diet containing 20, 60, or 120 mg zinc/kg. After 4 months, the biomechanical integrity of the healing defects was evaluated by a punch out test and the healed defects were examined with histomorphometry. Statistical analysis of the data was carried out by two-way analysis of variance and Wilcoxon’s non-parametric signed rank test.
Biomechanical testing revealed that the maximum load was significantly higher in DBM-filled defects than in those filled with autogenous bone, and that the defects filled with autogenous bone were stronger than the unfilled controls. The biomechanical findings indicated that the alimentary zinc content did not influence the healing of calvarial defects. No significant difference in maximum load could be established between the three diet groups for any of the filling materials, whereas the highest zinc supplement resulted in an increase in the relative extension on mineralizing surfaces in the control group. Thus, healing of adult rat calvarial defects is not influenced by alimentary zinc supplementation or depletion. Defects filled with DBM were significantly stronger and exhibited significantly more new bone formation than defects filled with autogenous bone or unfilled controls.
defects in animals (Calhoun et al., 1970; Chesters, 1978; Ovesen et al., 2001). These studies on the influence of zinc on bone have focused on growth and healing of experimentally produced defects of endochondral bone (Cha and Rojhani, 1997). On the other hand, the influence of zinc on the healing of intramembranous bone has not been investigated. Craniofacial surgery is mainly performed on intramembranous bone and a direct extrapolation of the findings from endochondral bone cannot be made, as both the growth process and the mineralization differ between endochondral and intramembranous bone.
Therefore, the aim of the study was to investigate whether alimentary zinc supplementation would lead to enhanced healing of critical size intramembranous bone defects filled with either DBM or autogenous bone in a mature rat model.
Materials and methods
The handling and care of the animals was approved by the Danish Animal Experiment Inspectorate.
Animals and diets
Sixty 6-month-old male Wistar rats (Møllegaard, Lille Skensved, Denmark) were randomly allocated to three

125 ZINC AND OSTEOPROMOTION
equal groups. The animals were housed in pairs in metal-free cages in rooms with a controlled temperature (21 ± 2°C) and a 12 hour light/dark cycle. The animals were given free access to distilled water and to a semi-synthetic diet (Altromin, Brogaarden, Gentofte, Denmark) with different amounts of zinc added. Diet 1 (n = 20) contained 20 mg zinc/kg, diet 2 (n = 20) 60 mg zinc/kg, and diet 3 (n = 20) 120 mg zinc/kg. Earlier studies have established that a normal zinc diet contains approximately 40–60 mg zinc/kg (Swenerton and Hurley, 1968; Ovesen et al., 2001, 2004). Consequently, a diet containing 120 mg zinc/kg was considered to be above normal, a diet containing 60 mg zinc/kg as normal, and a diet containing 20 mg zinc/kg as subnormal in zinc content.
Anaesthesia and surgical procedures
Critical size calvarial defects were created bilaterally as previously described (Bosch et al., 1995; Jones et al., 2007). In brief; the rats were anaesthetized with a combination of etorphine–acepromazine 1.25 ml/kg (Immobilon, Pharmacia A/S, Hillerød, Denmark) and atropine 0.11 mg/kg administered subcutaneously. The dorsal part of the cranium was shaved and aseptically prepared for surgery through an incision approximately 15 mm long in the skull to expose the temporal bone on both sides of the sagittal suture.
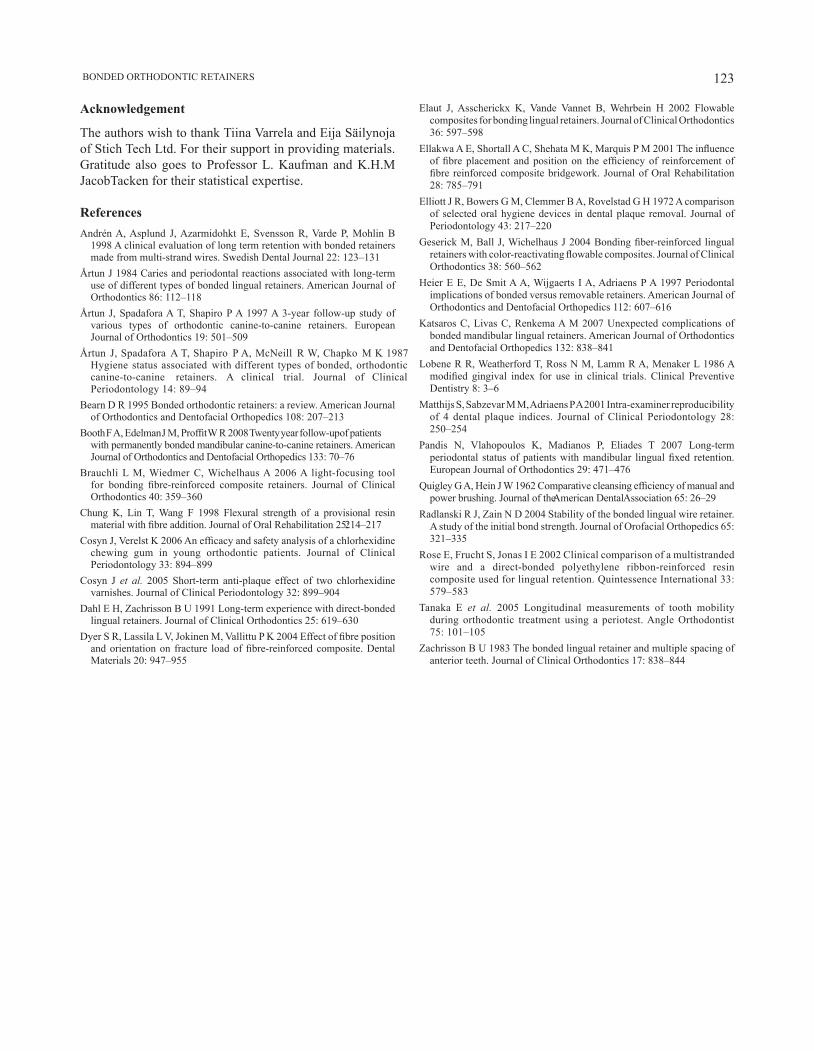
Two full thickness bone defects, 5 mm in diameter, were drilled using a trephine (No. 227–811 001, Messinger, Düsseldorf, Germany) in the centre of the parietal bone under constant irrigation with sterile physiologic saline in order to prevent overheating of the bone margins (Figure 1). During the surgical procedure, care was taken not to damage the dura mater or to puncture the superior sagittal sinus.
Figure 1 Photograph of an adult rat cranium showing two full thickness bone defects, 5 mm in diameter, trephined in the centre of the parietal bone, and amalgam markers. The right defect is filled with demineralized bone matrix and the left unfilled as a control.
From each diet group, seven animals were assigned to have their calvarial defects filled with DBM, seven with autogenous bone, while the remaining six had their defects left unfilled. The DBM was prepared in-house from intramembranous bone obtained from two additional rats (Nidoli et al., 1999). The trephined bone segments were crushed into small chips and used as autogenous intramembranous bone filler in the defects. The bone chips were packed as densely into the defect as their irregular shape would allow without changing the calvarial gross morphology, similar to the method currently used in orthognathic surgery. The periosteum and muscles were then sutured back in place, using catgut 4.0 (Ethicon, Norderstedt, Germany), and the scalp was sutured with silk 4.0 (Ethicon). After drilling the control defect, the wound was closed in a similar way. To observe wound healing, a clinical evaluation was performed daily for the first three post-operative days and thereafter, on a weekly basis in order to assess healing, any development of infection, and the general condition of the animals.
All animals were injected intraperitoneally with 15 mg/kg tetracycline (Sigma-Aldrich, St Louis, Missouri, USA) 7 days before sacrifice and with 20 mg/kg of calcein (Sigma-Aldrich) 2 days before sacrifice (Allain et al., 1995).
The animals were killed with an overdose of carbon dioxide, 4 months after surgery. Following sacrifice, the heads were detached and the calvarial skin was dissected to facilitate the removal of the defect sites with surrounding bone, soft tissues, and brain. The two parietal bones were separated along the sagittal suture with a parallel-precision saw (Exakt, Apparatebau, Norderstedt, Germany). The specimens were trimmed, leaving 2–3 mm of intact bone around the defect. The right parietal specimen was wrapped in saline soaked gauze and stored at −20°C until subsequent biomechanical testing, whereas the left parietal specimen was fixed in 70 per cent ethanol and prepared for histological evaluation.
Biomechanical testing
On the day of mechanical testing, the bone specimens were slowly thawed to room temperature. The mechanical strength of the healed defects was determined with a modified punch out test in a material testing machine (Alwetron TCT5, Lorentzen and Wettre, Stockholm, Sweden) as previously described in detail (Jones et al., 2007). In brief, the specimens were carefully positioned in a custom-made aluminium jig, which was then transferred to the materials testing machine. The load was applied with a 4 mm diameter steel piston at the centre of the defect at a constant deflection speed of 2 mm/minute. During mechanical testing, load-deflection values were recorded and stored using the computer software supplied with the testing machine. The ultimate load Fmax (the highest point on the load-deflection curve) was considered as the strength of the healed defect.
L. JONES ET AL.126
Preparation of histological sections
The left calvarial bone specimens were embedded, undecalcified, in methyl methacrylate. Sections, 7 mm thick, were cut parasagittally through the centre of the healed defect using a hard tissue microtome (Polycut E, Leica Instruments GmbH, Nussloch, Germany). First six sections were obtained, then 15 sections were discarded, and then another set of six serial sections were cut. The first four sections of each set of six sections were stained with Masson Goldner trichrome, whereas the last two sections of each set of the six sections were left unstained for fluorochrome-based analysis.
Histomorphometry
Digital images of the sections were obtained using an Olympus, BH2 light microscope (Olympus, Tokyo, Japan) equipped with a ColorView I digital camera (Olympus) and an integrated 10 × 10 line grid in the eyepiece. The microscope was also equipped with polarized light in order to allow newly formed woven bone to be distinguished from old lamellar bone.
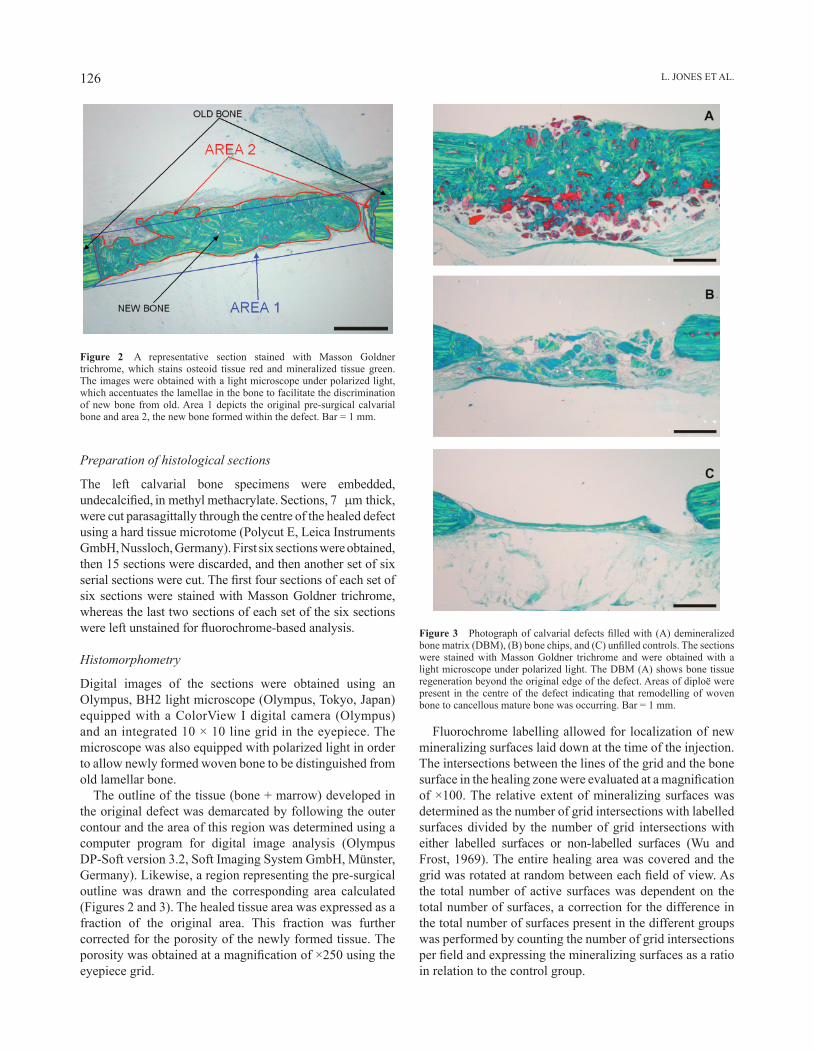
The outline of the tissue (bone + marrow) developed in the original defect was demarcated by following the outer contour and the area of this region was determined using a computer program for digital image analysis (Olympus DP-Soft version 3.2, Soft Imaging System GmbH, Münster, Germany). Likewise, a region representing the pre-surgical outline was drawn and the corresponding area calculated (Figures 2 and 3). The healed tissue area was expressed as a fraction of the original area. This fraction was further corrected for the porosity of the newly formed tissue. The porosity was obtained at a magnification of ×250 using the eyepiece grid.
Figure 2 A representative section stained with Masson Goldner trichrome, which stains osteoid tissue red and mineralized tissue green. The images were obtained with a light microscope under polarized light, which accentuates the lamellae in the bone to facilitate the discrimination of new bone from old. Area 1 depicts the original pre-surgical calvarial bone and area 2, the new bone formed within the defect. Bar = 1 mm.
Fluorochrome labelling allowed for localization of new mineralizing surfaces laid down at the time of the injection. The intersections between the lines of the grid and the bone surface in the healing zone were evaluated at a magnification of ×100. The relative extent of mineralizing surfaces was determined as the number of grid intersections with labelled surfaces divided by the number of grid intersections with either labelled surfaces or non-labelled surfaces (Wu and Frost, 1969). The entire healing area was covered and the grid was rotated at random between each field of view. As the total number of active surfaces was dependent on the total number of surfaces, a correction for the difference in the total number of surfaces present in the different groups was performed by counting the number of grid intersections per field and expressing the mineralizing surfaces as a ratio in relation to the control group.
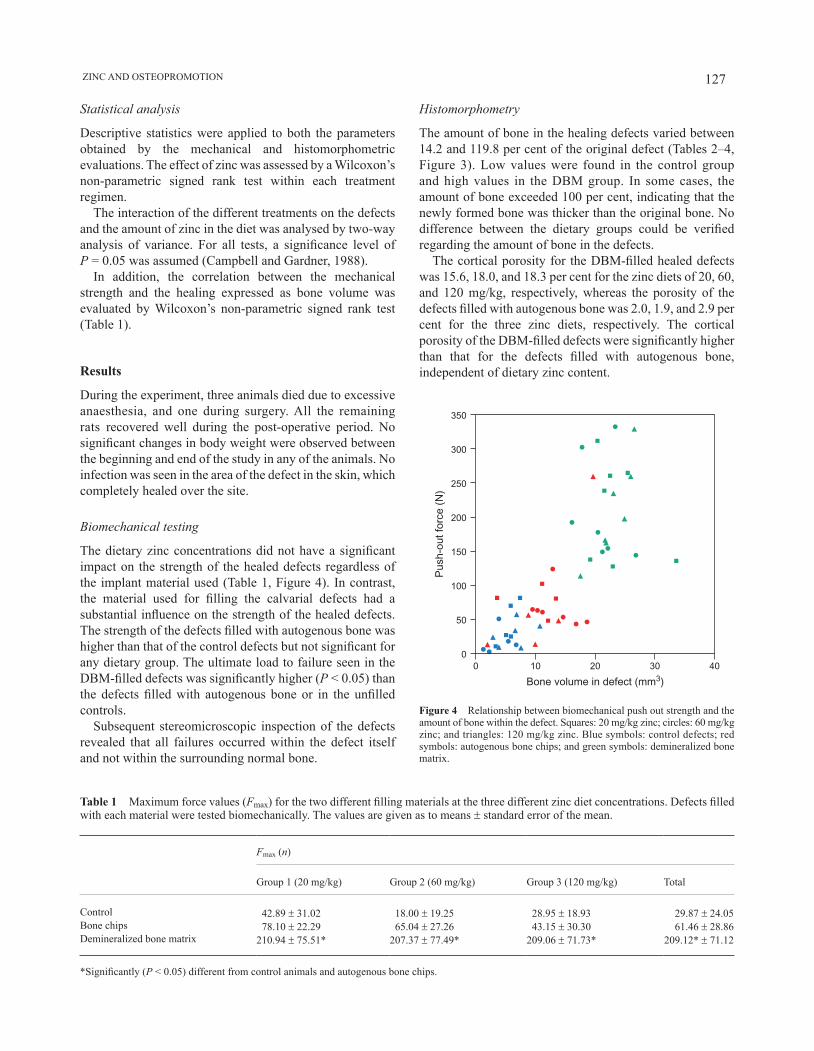
Figure 3 Photograph of calvarial defects filled with (A) demineralized bone matrix (DBM), (B) bone chips, and (C) unfilled controls. The sections were stained with Masson Goldner trichrome and were obtained with a light microscope under polarized light. The DBM (A) shows bone tissue regeneration beyond the original edge of the defect. Areas of diploë were present in the centre of the defect indicating that remodelling of woven bone to cancellous mature bone was occurring. Bar = 1 mm.
127 ZINC AND OSTEOPROMOTION
0 10 20 30 40
Bone volume in defect (mm3)
0
50
100
150
200
250
300
350
Pus
h-ou
t for
ce (
N)
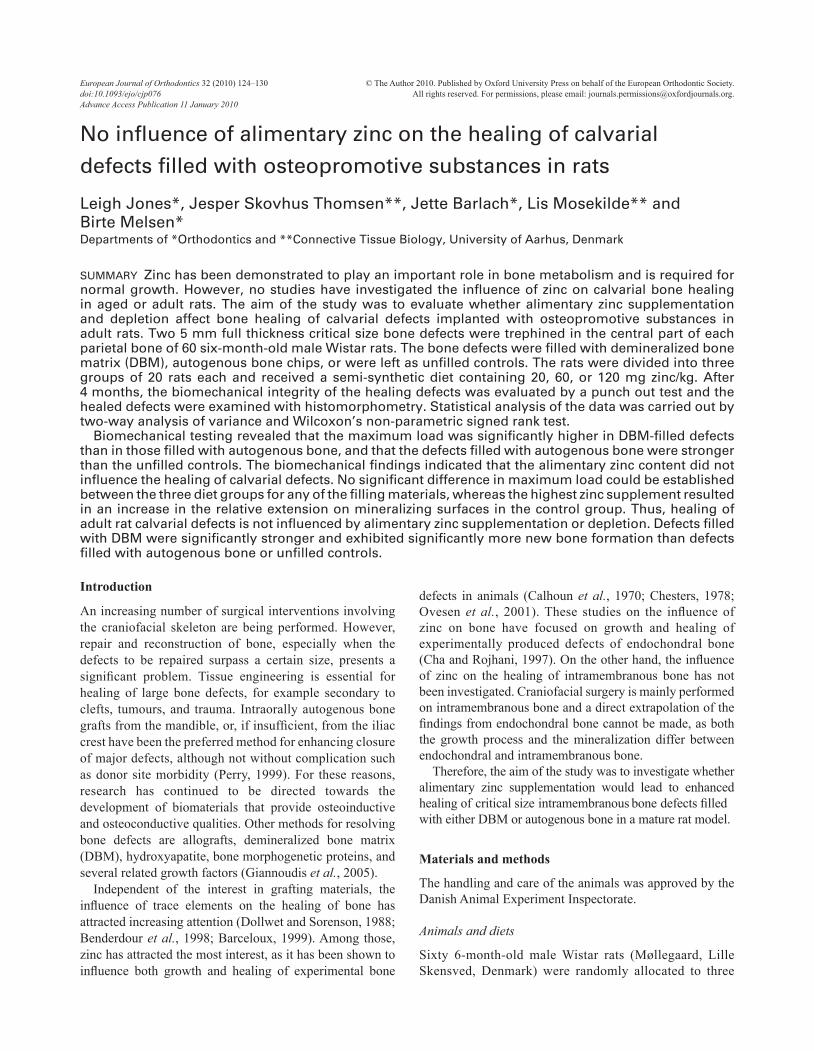
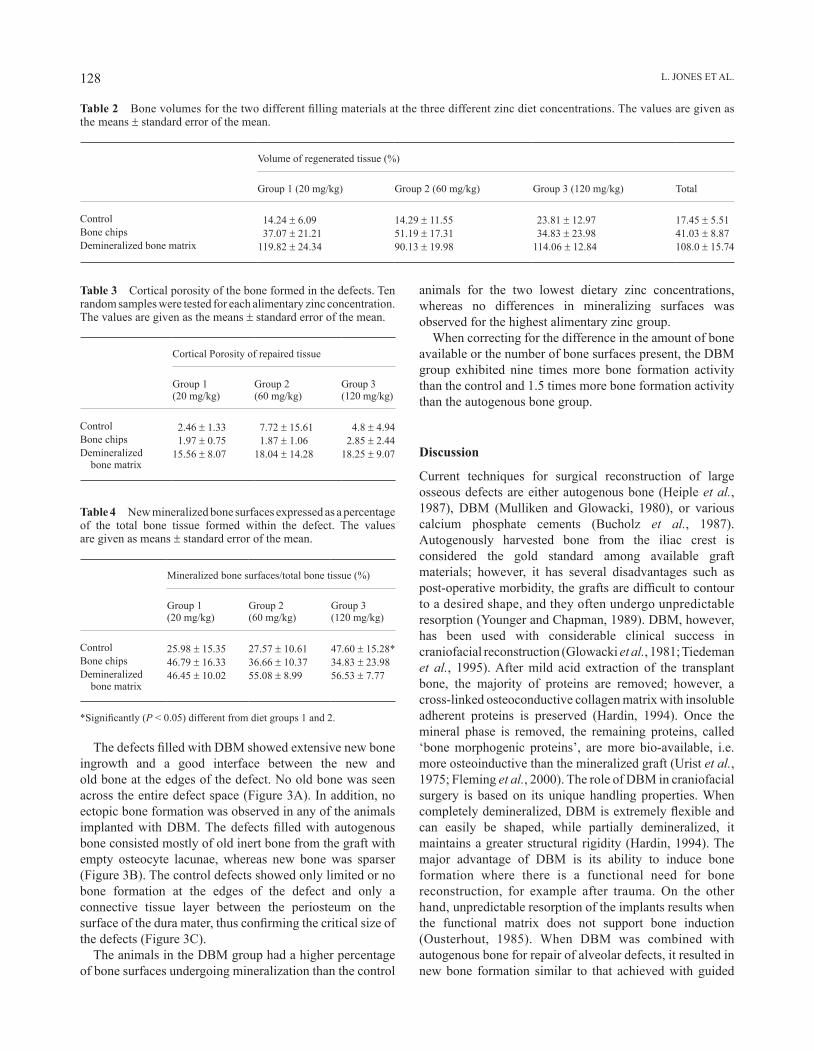
Figure 4 Relationship between biomechanical push out strength and the amount of bone within the defect. Squares: 20 mg/kg zinc; circles: 60 mg/kg zinc; and triangles: 120 mg/kg zinc. Blue symbols: control defects; red symbols: autogenous bone chips; and green symbols: demineralized bone matrix.
Statistical analysis
Descriptive statistics were applied to both the parameters obtained by the mechanical and histomorphometric evaluations. The effect of zinc was assessed by a Wilcoxon’s non-parametric signed rank test within each treatment regimen.
The interaction of the different treatments on the defects and the amount of zinc in the diet was analysed by two-way analysis of variance. For all tests, a significance level of P = 0.05 was assumed (Campbell and Gardner, 1988).
In addition, the correlation between the mechanical strength and the healing expressed as bone volume was evaluated by Wilcoxon’s non-parametric signed rank test (Table 1).
Results
During the experiment, three animals died due to excessive anaesthesia, and one during surgery. All the remaining rats recovered well during the post-operative period. No significant changes in body weight were observed between the beginning and end of the study in any of the animals. No infection was seen in the area of the defect in the skin, which completely healed over the site.
Biomechanical testing
The dietary zinc concentrations did not have a significant impact on the strength of the healed defects regardless of the implant material used (Table 1, Figure 4). In contrast, the material used for filling the calvarial defects had a substantial influence on the strength of the healed defects. The strength of the defects filled with autogenous bone was higher than that of the control defects but not significant for any dietary group. The ultimate load to failure seen in the DBM-filled defects was significantly higher (P < 0.05) than the defects filled with autogenous bone or in the unfilled controls.
Subsequent stereomicroscopic inspection of the defects revealed that all failures occurred within the defect itself and not within the surrounding normal bone.
Table 1 Maximum force values (Fmax) for the two different filling materials at the three different zinc diet concentrations. Defects filled with each material were tested biomechanically. The values are given as to means ± standard error of the mean.
Fmax (n)
Group 1 (20 mg/kg) Group 2 (60 mg/kg) Group 3 (120 mg/kg) Total
Control 42.89 ± 31.02 18.00 ± 19.25 28.95 ± 18.93 29.87 ± 24.05Bone chips 78.10 ± 22.29 65.04 ± 27.26 43.15 ± 30.30 61.46 ± 28.86Demineralized bone matrix 210.94 ± 75.51* 207.37 ± 77.49* 209.06 ± 71.73* 209.12* ± 71.12
*Significantly (P < 0.05) different from control animals and autogenous bone chips.
Histomorphometry
The amount of bone in the healing defects varied between 14.2 and 119.8 per cent of the original defect (Tables 2–4, Figure 3). Low values were found in the control group and high values in the DBM group. In some cases, the amount of bone exceeded 100 per cent, indicating that the newly formed bone was thicker than the original bone. No difference between the dietary groups could be verified regarding the amount of bone in the defects.
The cortical porosity for the DBM-filled healed defects was 15.6, 18.0, and 18.3 per cent for the zinc diets of 20, 60, and 120 mg/kg, respectively, whereas the porosity of the defects filled with autogenous bone was 2.0, 1.9, and 2.9 per cent for the three zinc diets, respectively. The cortical porosity of the DBM-filled defects were significantly higher than that for the defects filled with autogenous bone, independent of dietary zinc content.
L. JONES ET AL.128
The defects filled with DBM showed extensive new bone ingrowth and a good interface between the new and old bone at the edges of the defect. No old bone was seen across the entire defect space (Figure 3A). In addition, no ectopic bone formation was observed in any of the animals implanted with DBM. The defects filled with autogenous bone consisted mostly of old inert bone from the graft with empty osteocyte lacunae, whereas new bone was sparser (Figure 3B). The control defects showed only limited or no bone formation at the edges of the defect and only a connective tissue layer between the periosteum on the surface of the dura mater, thus confirming the critical size of the defects (Figure 3C).
The animals in the DBM group had a higher percentage of bone surfaces undergoing mineralization than the control
Table 2 Bone volumes for the two different filling materials at the three different zinc diet concentrations. The values are given as the means ± standard error of the mean.
Volume of regenerated tissue (%)
Group 1 (20 mg/kg) Group 2 (60 mg/kg) Group 3 (120 mg/kg) Total
Control 14.24 ± 6.09 14.29 ± 11.55 23.81 ± 12.97 17.45 ± 5.51Bone chips 37.07 ± 21.21 51.19 ± 17.31 34.83 ± 23.98 41.03 ± 8.87Demineralized bone matrix 119.82 ± 24.34 90.13 ± 19.98 114.06 ± 12.84 108.0 ± 15.74
animals for the two lowest dietary zinc concentrations, whereas no differences in mineralizing surfaces was observed for the highest alimentary zinc group.
When correcting for the difference in the amount of bone available or the number of bone surfaces present, the DBM group exhibited nine times more bone formation activity than the control and 1.5 times more bone formation activity than the autogenous bone group.
Discussion
Current techniques for surgical reconstruction of large osseous defects are either autogenous bone (Heiple et al., 1987), DBM (Mulliken and Glowacki, 1980), or various calcium phosphate cements (Bucholz et al., 1987). Autogenously harvested bone from the iliac crest is considered the gold standard among available graft materials; however, it has several disadvantages such as post-operative morbidity, the grafts are difficult to contour to a desired shape, and they often undergo unpredictable resorption (Younger and Chapman, 1989). DBM, however, has been used with considerable clinical success in craniofacial reconstruction (Glowacki et al., 1981; Tiedeman et al., 1995). After mild acid extraction of the transplant bone, the majority of proteins are removed; however, a cross-linked osteoconductive collagen matrix with insoluble adherent proteins is preserved (Hardin, 1994). Once the mineral phase is removed, the remaining proteins, called ‘bone morphogenic proteins’, are more bio-available, i.e. more osteoinductive than the mineralized graft (Urist et al., 1975; Fleming et al., 2000). The role of DBM in craniofacial surgery is based on its unique handling properties. When completely demineralized, DBM is extremely flexible and can easily be shaped, while partially demineralized, it maintains a greater structural rigidity (Hardin, 1994). The major advantage of DBM is its ability to induce bone formation where there is a functional need for bone reconstruction, for example after trauma. On the other hand, unpredictable resorption of the implants results when the functional matrix does not support bone induction (Ousterhout, 1985). When DBM was combined with autogenous bone for repair of alveolar defects, it resulted in new bone formation similar to that achieved with guided
Table 3 Cortical porosity of the bone formed in the defects. Ten random samples were tested for each alimentary zinc concentration. The values are given as the means ± standard error of the mean.
Cortical Porosity of repaired tissue
Group 1 (20 mg/kg)
Group 2 (60 mg/kg)
Group 3 (120 mg/kg)
Control 2.46 ± 1.33 7.72 ± 15.61 4.8 ± 4.94Bone chips 1.97 ± 0.75 1.87 ± 1.06 2.85 ± 2.44Demineralized bone matrix
15.56 ± 8.07 18.04 ± 14.28 18.25 ± 9.07
Table 4 New mineralized bone surfaces expressed as a percentage of the total bone tissue formed within the defect. The values are given as means ± standard error of the mean.
Mineralized bone surfaces/total bone tissue (%)
Group 1 (20 mg/kg)
Group 2 (60 mg/kg)
Group 3 (120 mg/kg)
Control 25.98 ± 15.35 27.57 ± 10.61 47.60 ± 15.28*Bone chips 46.79 ± 16.33 36.66 ± 10.37 34.83 ± 23.98Demineralized bone matrix
46.45 ± 10.02 55.08 ± 8.99 56.53 ± 7.77
*Significantly (P < 0.05) different from diet groups 1 and 2.

129 ZINC AND OSTEOPROMOTION
tissue regeneration (Levine et al., 1992). The role of calcium phosphate ceramics in reconstructive orthopaedics is primarily osteoconduction, serving as a scaffold for the osteoprogenitor cells and a reservoir of hydroxyapatite necessary for the formation of new bone (Bucholz et al., 1987). The clinical drawbacks related to the use of ceramic implants are that they are brittle and have poor tensile strength (Bucholz et al., 1987).
Apart from the transplant material itself, the healing process might be enhanced by the addition of trace elements such as manganese, iron, copper, and zinc, which are bound to proteins forming metalloproteins. Many of the metals in metalloproteins are part of enzyme systems that have important structural and storage functions (Fraga et al., 2005). Zinc is involved in the activity of approximately 100 enzymes and its deficiency in humans is common in underdeveloped countries and mainly associated with malnutrition affecting the immune system, wound healing, and impaired DNA synthesis.
The importance and necessity of zinc for tissue engineering after injury has been known for some time (Milachowski et al., 1980); however, the exact mechanism by which it affects osteogenesis is still unknown. Zinc has been found to increase bone mineralization both in vivo (Yamaguchi et al., 1987) and in vitro (Chen et al., 1999; Ovesen et al., 2001). In contrast, only very limited information is available on the effect of zinc on bone healing and that has mainly been limited to growing animals (Ovesen et al., 2001).
The decision to combine a nutritional factor such as zinc with known graft materials, autogenous bone, and DBM in the present study was made in order to observe whether zinc ions would cause a stimulation of healing in critical size defects in intramembranous created bone. However, the positive effect of DBM found by Jones et al. (2007) was not further enhanced by increased dietary zinc. The findings were thus not what could be anticipated from earlier research (Ovesen et al., 2001). That study suggested that increased levels of zinc ions could result in increased bone strength in growing rats. Those authors also verified that zinc had a stimulatory effect on bone growth. The possible role of zinc in bone healing was suggested by a significant lowering of zinc concentration in the tibia of rats following fracture (Milachowski et al., 1980). However, while no stimulation of the healing process was observed in the present study, the results confirmed that the biomechanical strength of the DBM-filled defects was significantly greater than the defects filled with autogenous bone or control defects (Jones et al., 2007).
The lack of a tissue engineering effect from zinc supplementation could be ascribed to the type of bone tested. All previous reports of positive impact of zinc ions on bone growth and healing have referred to bone of endochondral origin, where matrix vesicles are involved in the induction of calcification (Ovesen et al., 2001). In contrast, healing of bone of intramembranous origin seems not to be dependent on the levels of zinc ions.
The dose of zinc used in the present study was 20 mg zinc/kg in the zinc deficient animals, 60 mg zinc/kg in the controls, and 120 mg zinc/kg in the supplemented diet, in parallel with the study of Ovesen et al. (2001). However, the recommendations regarding dosage of zinc supplement is controversial. Swenerton and Hurley (1968) reported requirements of 100 ppm as a satisfactory level of zinc, while Williams and Mills (1970) stated that 5–13 ppm was sufficient. Based on a review of the scientific literature, the dietary zinc requirements for weaning and adult rats is 12 mg zinc/kg and 25 mg zinc/kg for lactating rats. Therefore, the highest zinc dosage used in the present study was more than adequate for being considered as a zinc supplementary diet. Moreover, even if the zinc dosages selected were slightly higher than those used by Ovesen et al. (2001), the two lowest are still well within the dose response range shown in that research. Consequently, the dosages used in the present study cover a large range and it is unlikely that selecting different alimentary zinc dosages would have changed the outcome.
The lower amount of bone formed in the defects filled with autogenous bone when compared with that seen in the DBM grafted sites indicates a slower graft incorporation in the autogenous bone-filled defects as also found by Burchardt (1983). An attempt was made to assess the mineralization rate by means of intravital staining injected 7 and 2 days before sacrifice. However, it was not possible to distinguish the two fluorochrome labels from each other in the autogenous bone-filled defects as they appeared as one broad line. This indicates a slower formation of bone on the surface of the autogenous bone chips than that seen in the DBM-treated animals.
Although a direct positive effect from zinc supplementation on bone strength was not observed in the present study, a zinc supplemented diet may still be indirectly beneficial to skeletal health. Clinical studies on increased zinc loss in middle-aged men via urinary excretion have been shown to be associated with developing osteoporosis (Atik, 1983) leading to an increased risk of bone fractures (Elmståhl et al., 1998).
Conclusion
Alimentary supplementation with zinc does not substantially enhance healing of calvarial defects in adult rats. The exact role that zinc ions play in bone metabolism and tissue engineering is still not fully known.
Address for correspondence
Leigh Jones2/357 Military RoadMosmanNSW 2088AustraliaE-mail: [email protected]

L. JONES ET AL.130
ReferencesAllain T J, Thomas M R, McGregor A M, Salisbury J R 1995
A histomorphometric study of bone changes in thyroid dysfunction in rats. Bone 16: 505–509
Atik O S 1983 Zinc and senile osteoporosis. Journal of the American Geriatrics Society 31: 790–791
Barceloux D G 1999 Zinc. Journal of Toxicology. Clinical Toxicology 37: 279–292
Benderdour M, Bui-Van T, Dicko A, Belleville F 1998 In vivo and in vitro effects of boron and boronated compounds. Journal of Trace Elements in Medicine and Biology 12: 2–7
Bosch C, Melsen B, Vargervik K 1995 Guided bone regeneration in calvarial bone defects using polytetrafluoroethylene membranes. The Cleft Palate-Craniofacial Journal 32: 311–317
Bucholz R W, Carlton A, Holmes R E 1987 Hydroxyapatite and tricalcium phosphate bone graft substitutes. Orthopedic Clinics of North America 18: 323–334
Burchardt H 1983 The biology of bone graft repair. Clinical Orthopaedics and Related Research 174: 28–42
Calhoun N R, Campbell Jr S, Smith Jr J C 1970 Accumulation of labeled zinc, strontium, and calcium in bone injuries. Journal of Dental Research 49: 1083–1085
Campbell M J, Gardner M J 1988 Calculating confidence intervals for some non-parametric analyses. British Medical Journal (Clinical Research Edition) 296: 1454–1456
Cha M C, Rojhani A 1997 Zinc deficiency inhibits the direct growth effect of growth hormone on the tibia of hypophysectomized rats. Biological Trace Element Research 59: 99–111
Chen D, Waite L C, Pierce Jr W M 1999 In-vitro effects of zinc on markers of bone formation. Biological Trace Element Research 68: 225–234
Chesters J K 1978 Biochemical functions of zinc in animals. World Review of Nutrition and Dietetics 32: 135–164
Dollwet H H, Sorenson J R 1988 Roles of copper in bone maintenance and healing. Biological Trace Element Research 18: 39–48
Elmståhl S, Gullberg B, Janzon L, Johnell O, Elmståhl B 1998 Increased incidence of fractures in middle-aged and elderly men with low intakes of phosphorus and zinc. Osteoporosis International 8: 333–340
Fleming Jr J E, Cornell C N, Muschler G F 2000 Bone cells and matrices in orthopedic tissue engineering. Orthopedic Clinics of North America 31: 357–374
Fraga C G, Oteiza P I, Keen C L 2005 Trace elements and human health. Molecular Aspects of Medicine 26: 233–234
Giannoudis P V, Dinopoulos H, Tsiridis E 2005 Bone substitutes: an update. Injury 36: (Supplement 3) S20–S27
Glowacki J, Kaban L B, Murray J E, Folkman J, Mulliken J B 1981 Application of the biological principle of induced osteogenesis for craniofacial defects. Lancet 1: 959–962
Hardin C K 1994 Banked bone. Otolaryngologic Clinics of North America 27: 911–925
Heiple K G, Goldberg V M, Powell A E, Bos G D, Zika J M 1987 Biology of cancellous bone grafts. Orthopedic Clinics of North America 18: 179–185
Jones L, Thomsen J S, Mosekilde L, Bosch C, Melsen B 2007 Biomechanical evaluation of rat skull defects, 1, 3, and 6 months after implantation with osteopromotive substances. Journal of Cranio-Maxillofacial Surgery 35: 350–357
Levine S S, Prewett A B, Coo S D 1992 The use of a new form of allograft bone in implantation or osseointegrated dental implants—a preliminary report. Journal of Oral Implantology 18: 366–371
Milachowski K, Moschinski D, Jaeschock R, Kaschner A 1980 The influence of zinc on bone healing in rats. Archives of Orthopaedic and Trauma Surgery 96: 17–21
Mulliken J B, Glowacki J 1980 Induced osteogenesis for repair and construction in the craniofacial region. Plastic and Reconstructive Surgery 65: 553–560
Nidoli M C, Nielsen F F, Melsen B 1999 Endochondral vs. intramembranous demineralized bone matrices as implants for osseous defects. Journal of Craniofacial Surgery 10: 177–185
Ousterhout D K 1985 Clinical experience in cranial and facial reconstruction with demineralized bone. Annals of Plastic Surgery 15: 367–373
Ovesen J, Danscher G, Thomsen J S, Mosekilde L, Møller-Madsen B 2004 Autometallographic tracing of zinc ions in growing bone. Journal of Musculoskeletal and Neuronal Interactions 4: 428–435
Ovesen J, Møller-Madsen B, Thomsen J S, Danscher G, Mosekilde L 2001 The positive effects of zinc on skeletal strength in growing rats. Bone 29: 565–570
Perry C R 1999 Bone repair techniques, bone graft, and bone graft substitutes. Clinical Orthopaedics and Related Research 360: 71–86
Swenerton H, Hurley L S 1968 Severe zinc deficiency in male and female rats. Journal of Nutrition 95: 8–18
Tiedeman J J, Garvin K L, Kile T A, Connolly J F 1995 The role of a composite, demineralized bone matrix and bone marrow in the treatment of osseous defects. Orthopedics 18: 1153–1158
Urist M R, Mikulski A, Boyd S D 1975 A chemosterilized antigen-extracted autodigested alloimplant for bone banks. Archives of Surgery 110: 416–428
Williams R B, Mills C F 1970 The experimental production of zinc deficiency in the rat. British Journal of Nutrition 24: 989–1003
Wu K, Frost H M 1969 Bone formation in osteoporosis. Appositional rate measured by tetracycline labeling. Archive of Pathology 88: 508–510
Yamaguchi M, Oishi H, Suketa Y 1987 Stimulatory effect of zinc on bone formation in tissue culture. Biochemical Pharmacology 36: 4007–4012
Younger E M, Chapman M W 1989 Morbidity at bone graft donor sites. Journal of Orthopaedic Trauma 3: 192–195
European Journal of Orthodontics 32 (2010) 131–139 © The Author 2010. Published by Oxford University Press on behalf of the European Orthodontic Society.doi:10.1093/ejo/cjp078 All rights reserved. For permissions, please email: [email protected] Access Publication 16 February 2010
Introduction
Recently, various biostimulatory effects of low-energy laser irradiation have been reported, including wound healing (Fung et al., 2003; Maiya et al., 2005), fibroblast proliferation (Yu et al., 2003), collagen synthesis (Reddy et al., 1998; Poon et al., 2005), and nerve regeneration (Mohammed et al., 2007). In particular, the acceleration of bone regeneration by laser treatment has been the focus of recent studies (Merli et al., 2005; Pinheiro and Gerbi, 2006).
In orthodontics, low-energy laser irradiation can be utilized for several different treatments, such as the reduction of post-adjustment pain (Lim et al., 1995). The stimulatory effects of low-energy laser irradiation on bone regeneration in the median palatal suture area during rapid maxillary expansion in rats have been noted (Saito and Shimizu, 1997). Further, Ozawa et al. (1998) demonstrated that laser irradiation stimulates cellular proliferation and differentiation of osteoblast lineage nodule-forming cells, especially in committed precursors, resulting in an increase in the number of differentiated osteoblastic cells as well as in bone formation.
Low-energy laser irradiation facilitates the velocity of tooth
movement and the expressions of matrix metalloproteinase-9,
cathepsin K, and alpha(v) beta(3) integrin in rats
Masaru Yamaguchi*, Masami Hayashi*, Shouji Fujita*, Takamasa Yoshida*, Tadahiko Utsunomiya**, Hirotsugu Yamamoto** and Kazutaka Kasai*Departments of *Orthodontics and **Oral Pathology, Nihon University School of Dentistry at Matsudo, Chiba, Japan
SUMMARY It has previously been reported that low-energy laser irradiation stimulated the velocity of tooth movement via the receptor activator of nuclear factor kappa B (RANK)/RANK ligand and the macrophage colony-stimulating factor/its receptor (c-Fms) systems. Matrix metalloproteinase (MMP)-9, cathepsin K, and alpha(v) beta(3) [a(v)b3] integrin are essential for osteoclastogenesis; therefore, the present study was designed to examine the effects of low-energy laser irradiation on the expression of MMP-9, cathepsin K, and a(v)b3 integrin during experimental tooth movement.
Fifty male, 6-week-old Wistar strain rats were used in the experiment. A total force of 10g was applied to the rat molars to induce tooth movement. A Ga-Al-As diode laser was used to irradiate the area around the moving tooth and, after 7 days, the amount of tooth movement was measured. To determine the amount of tooth movement, plaster models of the maxillae were made using a silicone impression material before (day 0) and after tooth movement (days 1, 2, 3, 4, and 7). The models were scanned using a contact-type three-dimensional (3-D) measurement apparatus. Immunohistochemical staining for MMP-9, cathepsin K, and integrin subunits of a(v)b3 was performed. Intergroup comparisons of the average values were conducted with a Mann–Whitney U-test for tooth movement and the number of tartrate-resistant acid phosphatase (TRAP), MMP-9, cathepsin K, and integrin subunits of a(v)b3-positive cells.
In the laser-irradiated group, the amount of tooth movement was significantly greater than that in the non-irradiated group at the end of the experiment (P < 0.05). Cells positively stained with TRAP, MMP-9, cathepsin K, and integrin subunits of a(v)b3 were found to be significantly increased in the irradiated group on days 2–7 compared with those in the non-irradiated group (P < 0.05).
These findings suggest that low-energy laser irradiation facilitates the velocity of tooth movement and MMP-9, cathepsin K, and integrin subunits of a(v)b3 expression in rats.
Kawasaki and Shimizu (2000) reported that low-energy laser irradiation stimulated the amount of tooth movement and formation of osteoclasts on the pressure side during experimental tooth movement in vivo. Fujita et al. (2008) and Yamaguchi et al. (2007) demonstrated that low-energy laser irradiation stimulated the velocity of tooth movement via the receptor activator of nuclear factor kappa B (RANK)/RANK ligand (RANKL) and the macrophage colony-stimulating factor (M-CSF)/its receptor (c-Fms) expressions.
Osteoclasts are specialized members of the monocyte/macrophage family that differentiate from haematopoietic precursors (Roodman, 1996). The expression of tartrate-resistant acid phosphatase (TRAP) is a characteristic of the macrophage/osteoclast lineage and is often used as a lineage marker (Roodman et al., 1985). Activity of osteoclasts in vitro is measured by excavation of pits in bone or dentine slices, and this is the feature that undoubtedly identifies mature active osteoclasts (Chambers et al., 1984). Among matrix metalloproteinases (MMPs), MMP-9 is known as
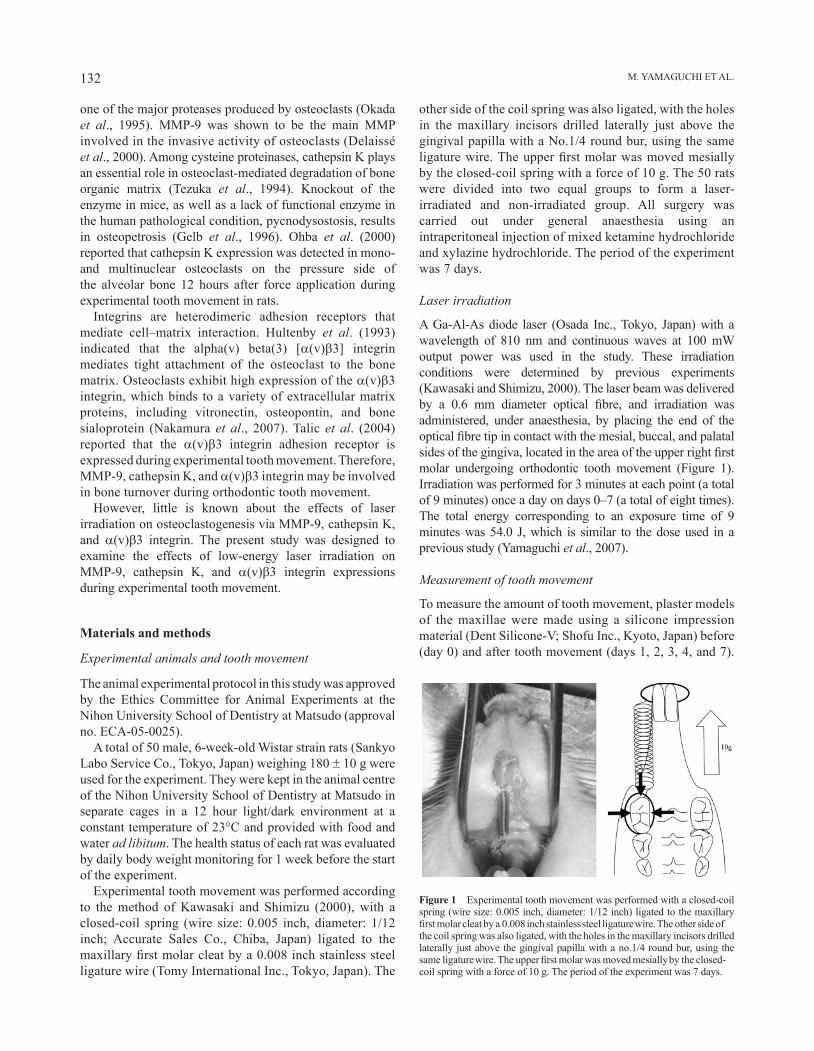
M. YAMAGUChI ET AL.132
Figure 1 Experimental tooth movement was performed with a closed-coil spring (wire size: 0.005 inch, diameter: 1/12 inch) ligated to the maxillary first molar cleat by a 0.008 inch stainless steel ligature wire. The other side of the coil spring was also ligated, with the holes in the maxillary incisors drilled laterally just above the gingival papilla with a no.1/4 round bur, using the same ligature wire. The upper first molar was moved mesially by the closed-coil spring with a force of 10 g. The period of the experiment was 7 days.
one of the major proteases produced by osteoclasts (Okada et al., 1995). MMP-9 was shown to be the main MMP involved in the invasive activity of osteoclasts (Delaissé et al., 2000). Among cysteine proteinases, cathepsin K plays an essential role in osteoclast-mediated degradation of bone organic matrix (Tezuka et al., 1994). Knockout of the enzyme in mice, as well as a lack of functional enzyme in the human pathological condition, pycnodysostosis, results in osteopetrosis (Gelb et al., 1996). Ohba et al. (2000) reported that cathepsin K expression was detected in mono- and multinuclear osteoclasts on the pressure side of the alveolar bone 12 hours after force application during experimental tooth movement in rats.
Integrins are heterodimeric adhesion receptors that mediate cell–matrix interaction. hultenby et al. (1993) indicated that the alpha(v) beta(3) [a(v)b3] integrin mediates tight attachment of the osteoclast to the bone matrix. Osteoclasts exhibit high expression of the a(v)b3 integrin, which binds to a variety of extracellular matrix proteins, including vitronectin, osteopontin, and bone sialoprotein (Nakamura et al., 2007). Talic et al. (2004) reported that the a(v)b3 integrin adhesion receptor is expressed during experimental tooth movement. Therefore, MMP-9, cathepsin K, and a(v)b3 integrin may be involved in bone turnover during orthodontic tooth movement.
however, little is known about the effects of laser irradiation on osteoclastogenesis via MMP-9, cathepsin K, and a(v)b3 integrin. The present study was designed to examine the effects of low-energy laser irradiation on MMP-9, cathepsin K, and a(v)b3 integrin expressions during experimental tooth movement.
Materials and methods
Experimental animals and tooth movement
The animal experimental protocol in this study was approved by the Ethics Committee for Animal Experiments at the Nihon University School of Dentistry at Matsudo (approval no. ECA-05-0025).
A total of 50 male, 6-week-old Wistar strain rats (Sankyo Labo Service Co., Tokyo, Japan) weighing 180 ± 10 g were used for the experiment. They were kept in the animal centre of the Nihon University School of Dentistry at Matsudo in separate cages in a 12 hour light/dark environment at a constant temperature of 23°C and provided with food and water ad libitum. The health status of each rat was evaluated by daily body weight monitoring for 1 week before the start of the experiment.
Experimental tooth movement was performed according to the method of Kawasaki and Shimizu (2000), with a closed-coil spring (wire size: 0.005 inch, diameter: 1/12 inch; Accurate Sales Co., Chiba, Japan) ligated to the maxillary first molar cleat by a 0.008 inch stainless steel ligature wire (Tomy International Inc., Tokyo, Japan). The
other side of the coil spring was also ligated, with the holes in the maxillary incisors drilled laterally just above the gingival papilla with a No.1/4 round bur, using the same ligature wire. The upper first molar was moved mesially by the closed-coil spring with a force of 10 g. The 50 rats were divided into two equal groups to form a laser-irradiated and non-irradiated group. All surgery was carried out under general anaesthesia using an intraperitoneal injection of mixed ketamine hydrochloride and xylazine hydrochloride. The period of the experiment was 7 days.
Laser irradiation
A Ga-Al-As diode laser (Osada Inc., Tokyo, Japan) with a wavelength of 810 nm and continuous waves at 100 mW output power was used in the study. These irradiation conditions were determined by previous experiments (Kawasaki and Shimizu, 2000). The laser beam was delivered by a 0.6 mm diameter optical fibre, and irradiation was administered, under anaesthesia, by placing the end of the optical fibre tip in contact with the mesial, buccal, and palatal sides of the gingiva, located in the area of the upper right first molar undergoing orthodontic tooth movement (Figure 1). Irradiation was performed for 3 minutes at each point (a total of 9 minutes) once a day on days 0–7 (a total of eight times). The total energy corresponding to an exposure time of 9 minutes was 54.0 J, which is similar to the dose used in a previous study (Yamaguchi et al., 2007).
Measurement of tooth movement
To measure the amount of tooth movement, plaster models of the maxillae were made using a silicone impression material (Dent Silicone-V; Shofu Inc., Kyoto, Japan) before (day 0) and after tooth movement (days 1, 2, 3, 4, and 7).
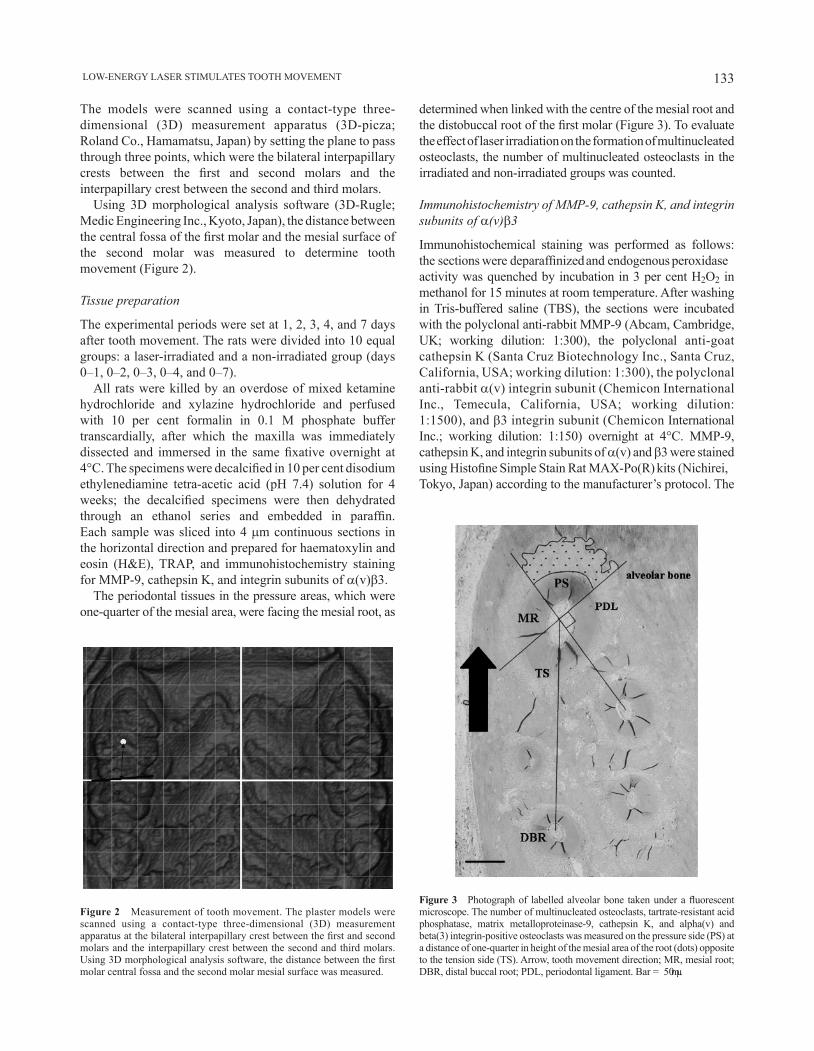
133 LOW-ENERGY LASER STIMULATES TOOTh MOVEMENT
Figure 2 Measurement of tooth movement. The plaster models were scanned using a contact-type three-dimensional (3D) measurement apparatus at the bilateral interpapillary crest between the first and second molars and the interpapillary crest between the second and third molars. Using 3D morphological analysis software, the distance between the first molar central fossa and the second molar mesial surface was measured.
The models were scanned using a contact-type three-dimensional (3D) measurement apparatus (3D-picza; Roland Co., hamamatsu, Japan) by setting the plane to pass through three points, which were the bilateral interpapillary crests between the first and second molars and the interpapillary crest between the second and third molars.
Using 3D morphological analysis software (3D-Rugle; Medic Engineering Inc., Kyoto, Japan), the distance between the central fossa of the first molar and the mesial surface of the second molar was measured to determine tooth movement (Figure 2).
Tissue preparation
The experimental periods were set at 1, 2, 3, 4, and 7 days after tooth movement. The rats were divided into 10 equal groups: a laser-irradiated and a non-irradiated group (days 0–1, 0–2, 0–3, 0–4, and 0–7).
All rats were killed by an overdose of mixed ketamine hydrochloride and xylazine hydrochloride and perfused with 10 per cent formalin in 0.1 M phosphate buffer transcardially, after which the maxilla was immediately dissected and immersed in the same fixative overnight at 4°C. The specimens were decalcified in 10 per cent disodium ethylenediamine tetra-acetic acid (ph 7.4) solution for 4 weeks; the decalcified specimens were then dehydrated through an ethanol series and embedded in paraffin. Each sample was sliced into 4 mm continuous sections in the horizontal direction and prepared for haematoxylin and eosin (h&E), TRAP, and immunohistochemistry staining for MMP-9, cathepsin K, and integrin subunits of a(v)b3.
The periodontal tissues in the pressure areas, which were one-quarter of the mesial area, were facing the mesial root, as
determined when linked with the centre of the mesial root and the distobuccal root of the first molar (Figure 3). To evaluate the effect of laser irradiation on the formation of multinucleated osteoclasts, the number of multinucleated osteoclasts in the irradiated and non-irradiated groups was counted.
Immunohistochemistry of MMP-9, cathepsin K, and integrin subunits of a(v)b3
Immunohistochemical staining was performed as follows: the sections were deparaffinized and endogenous peroxidase activity was quenched by incubation in 3 per cent h2O2 in methanol for 15 minutes at room temperature. After washing in Tris-buffered saline (TBS), the sections were incubated with the polyclonal anti-rabbit MMP-9 (Abcam, Cambridge, UK; working dilution: 1:300), the polyclonal anti-goat cathepsin K (Santa Cruz Biotechnology Inc., Santa Cruz, California, USA; working dilution: 1:300), the polyclonal anti-rabbit a(v) integrin subunit (Chemicon International Inc., Temecula, California, USA; working dilution: 1:1500), and b3 integrin subunit (Chemicon International Inc.; working dilution: 1:150) overnight at 4°C. MMP-9, cathepsin K, and integrin subunits of a(v) and b3 were stained using Histofine Simple Stain Rat MAX-Po(R) kits (Nichirei, Tokyo, Japan) according to the manufacturer’s protocol. The
Figure 3 Photograph of labelled alveolar bone taken under a fluorescent microscope. The number of multinucleated osteoclasts, tartrate-resistant acid phosphatase, matrix metalloproteinase-9, cathepsin K, and alpha(v) and beta(3) integrin-positive osteoclasts was measured on the pressure side (PS) at a distance of one-quarter in height of the mesial area of the root (dots) opposite to the tension side (TS). Arrow, tooth movement direction; MR, mesial root; DBR, distal buccal root; PDL, periodontal ligament. Bar = 50 μm.

M. YAMAGUChI ET AL.134
Figure 6 Effects of laser irradiation on tartrate-resistant acid phosphatase (TRAP)-positive osteoclasts after tooth movement as shown by immunohistochemistry (original magnification ×400). Day 1: resorption lacunae with a few TRAP-positive multinucleated osteoclasts were observed on the surfaces of the alveolar bone and root (a and b). TRAP immunoreactivity (arrows) was observed in osteoclasts on the alveolar bone surface in the laser-irradiated group (d and f) on days 3 and 7, as well as on days 3 and 7 in the non-irradiated group (c and e). AB, alveolar bone; PDL, periodontal ligament; C, cementum. Bar = 50 mm.
Figure 5 Light microscopy images of the effects of laser irradiation on multinucleated osteoclasts after tooth movement [haematoxylin and eosin, original magnification ×400]. Day 1: resorption lacunae with a few multinucleated osteoclasts (arrows) were observed on the surface of the alveolar bone and root in the non-irradiated and irradiated groups (a and b). Day 3: many resorption lacunae with multinucleated osteoclasts appeared on the alveolar bone surface. The number of multinucleated osteoclasts in the irradiated group was more than that in the non-irradiated group (c and d). Day 7: on the surface of the alveolar bone, bone resorption lacunae with multinucleated osteoclasts were increased in comparison with those on day 3 in both groups (e and f). AB, alveolar bone; PDL, periodontal ligament; C, cementum. Bar = 50 mm.
Figure 4 Effect of laser irradiation on tooth movement. Values are mean ± standard deviation of five rats. The amount of tooth movement was significantly greater in the irradiated group on days 3, 4, and 7 compared with that in the non-irradiated group. *P < 0.05.
sections were rinsed with TBS and final colour reactions were performed using the substrate reagent 3,3′-diaminobenzidine tetra-hydrochloride and aminoethyl carbazole. They were then counterstained with h&E. As
immunohistochemical controls, some sections were incubated in the same way and then further incubated with either non-immune rabbit immunoglobulin G or 0.01 M phosphate-buffered saline alone instead of the primary antibody.
To evaluate the effect of laser irradiation on the expressions of TRAP, MMP-9, cathepsin K, and integrin subunits of a(v) and b3, the number of positive cells in the irradiated and non-irradiated groups was counted.
Statistical analysis
Intergroup comparisons of the average values were conducted for tooth movement and the number of TRAP, MMP-9, cathepsin K, and integrin subunits of a(v)b3-positive cells with a Mann–Whitney U-test. A P value of less than 0.05 was considered significant.
Results
Tooth movement during the experimental period
The body weight of the rats in both groups decreased transiently on day 1 and then recovered. No significant
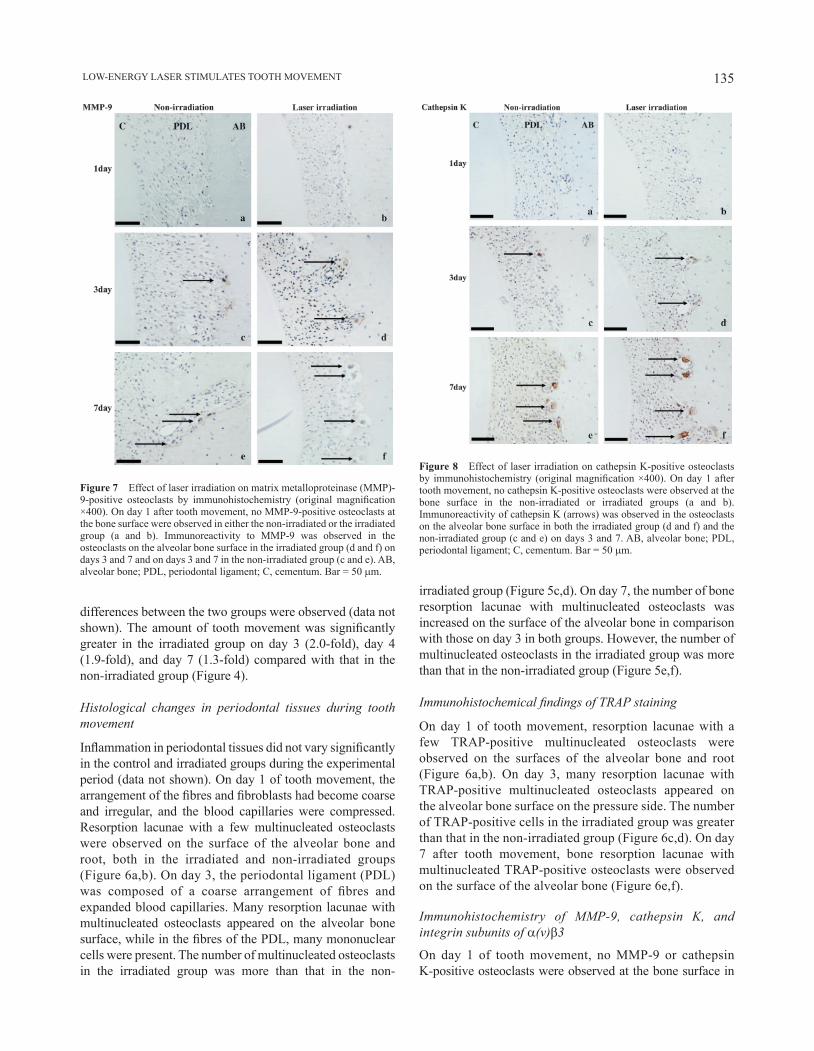
135 LOW-ENERGY LASER STIMULATES TOOTh MOVEMENT
differences between the two groups were observed (data not shown). The amount of tooth movement was significantly greater in the irradiated group on day 3 (2.0-fold), day 4 (1.9-fold), and day 7 (1.3-fold) compared with that in the non-irradiated group (Figure 4).
Histological changes in periodontal tissues during tooth movement
Inflammation in periodontal tissues did not vary significantly in the control and irradiated groups during the experimental period (data not shown). On day 1 of tooth movement, the arrangement of the fibres and fibroblasts had become coarse and irregular, and the blood capillaries were compressed. Resorption lacunae with a few multinucleated osteoclasts were observed on the surface of the alveolar bone and root, both in the irradiated and non-irradiated groups (Figure 6a,b). On day 3, the periodontal ligament (PDL) was composed of a coarse arrangement of fibres and expanded blood capillaries. Many resorption lacunae with multinucleated osteoclasts appeared on the alveolar bone surface, while in the fibres of the PDL, many mononuclear cells were present. The number of multinucleated osteoclasts in the irradiated group was more than that in the non-
irradiated group (Figure 5c,d). On day 7, the number of bone resorption lacunae with multinucleated osteoclasts was increased on the surface of the alveolar bone in comparison with those on day 3 in both groups. however, the number of multinucleated osteoclasts in the irradiated group was more than that in the non-irradiated group (Figure 5e,f).
Immunohistochemical findings of TRAP staining
On day 1 of tooth movement, resorption lacunae with a few TRAP-positive multinucleated osteoclasts were observed on the surfaces of the alveolar bone and root (Figure 6a,b). On day 3, many resorption lacunae with TRAP-positive multinucleated osteoclasts appeared on the alveolar bone surface on the pressure side. The number of TRAP-positive cells in the irradiated group was greater than that in the non-irradiated group (Figure 6c,d). On day 7 after tooth movement, bone resorption lacunae with multinucleated TRAP-positive osteoclasts were observed on the surface of the alveolar bone (Figure 6e,f).
Immunohistochemistry of MMP-9, cathepsin K, and integrin subunits of a(v)b3
On day 1 of tooth movement, no MMP-9 or cathepsin K-positive osteoclasts were observed at the bone surface in
Figure 7 Effect of laser irradiation on matrix metalloproteinase (MMP)-9-positive osteoclasts by immunohistochemistry (original magnification ×400). On day 1 after tooth movement, no MMP-9-positive osteoclasts at the bone surface were observed in either the non-irradiated or the irradiated group (a and b). Immunoreactivity to MMP-9 was observed in the osteoclasts on the alveolar bone surface in the irradiated group (d and f) on days 3 and 7 and on days 3 and 7 in the non-irradiated group (c and e). AB, alveolar bone; PDL, periodontal ligament; C, cementum. Bar = 50 mm.
Figure 8 Effect of laser irradiation on cathepsin K-positive osteoclasts by immunohistochemistry (original magnification ×400). On day 1 after tooth movement, no cathepsin K-positive osteoclasts were observed at the bone surface in the non-irradiated or irradiated groups (a and b). Immunoreactivity of cathepsin K (arrows) was observed in the osteoclasts on the alveolar bone surface in both the irradiated group (d and f) and the non-irradiated group (c and e) on days 3 and 7. AB, alveolar bone; PDL, periodontal ligament; C, cementum. Bar = 50 mm.

M. YAMAGUChI ET AL.136
either the irradiated or the non-irradiated group (Figures 7a,b and 8a,b), but a few subunits of a(v)b3-positive osteoclasts were found in the non-irradiated group (Figures 9a and 10a). On day 2, a few MMP-9 and cathepsin K-positive osteoclasts were observed in the irradiated group. On day 3, the immunoreactivity to MMP-9, cathepsin K, and subunits of a(v)b3 of the osteoclasts increased in the irradiated group. MMP-9, cathepsin K, and subunits of a(v)b3-positive osteoclasts were also observed in the non-irradiated group (Figures 8c; 9c,e; 10c,e; and 11). A large number of MMP-9, cathepsin K, and subunits of a(v)b3-positive osteoclasts were observed on day 4 in both groups and the immunoreactivity to MMP-9, cathepsin K, and subunits of a(v)b3 of the osteoclasts increased. On day 7, immunoreactivity to MMP-9, cathepsin K, and integrin subunits of a(v)b3 was observed in the osteoclasts on the alveolar bone surface in both groups (Figures 7e,f; 8e,f; 9e,f; and 10e,f).
Quantitative evaluation of multinucleated osteoclasts, TRAP, MMP-9, cathepsin K, and integrin subunits of a(v)b3
Quantitative evaluation showed that the number of multinucleated osteoclasts and TRAP-positive cells was
significantly increased in the irradiated group on day 2 (multinucleated osteoclasts: 2.1-fold and TRAP: 2.0-fold), day 3 (multinucleated osteoclasts: 1.6-fold and TRAP: 2.0-fold), and day 7 (multinucleated osteoclasts: 1.6-fold and TRAP: 1.2-fold) compared with that in the non-irradiated group (Figure 11a, b).
The number of MMP-9, cathepsin K, and a(v)b3 integrin-positive cells was found to be significantly increased in the irradiated group on day 2 [MMP-9: 4.0-fold, cathepsin K: 2.7-fold, a(v) integrin: 1.9-fold, and b3 integrin: 2.0-fold], day 3 [MMP-9: 2.3-fold, cathepsin K: 1.8-fold, a(v) integrin: 1.8-fold, and b3 integrin: 2.0-fold], and day 7 [MMP-9: 1.8-fold, cathepsin K: 1.6-fold, a(v) integrin: 1.4-fold, and b3 integrin: 1.4-fold] compared with that in the non-irradiated group (Figure 11).
DiscussionIn the present study, the amount of tooth movement was significantly greater in the irradiated group on day 3 (2.0-fold) and day 4 (1.9-fold) compared with that in the non-irradiated group (Figure 4). Furthermore, the number
Figure 10 Effect of laser irradiation on beta(3) (b3)-positive osteoclasts by immunohistochemistry (original magnification ×400). On day 1 after tooth movement, a few subunits of b3-positive osteoclasts were observed in the non-irradiated group (a and b). Immunoreactivity of b3 (arrows) was observed in the osteoclasts on the alveolar bone surface in the irradiated group (d and f) and the non-irradiated group (c and e) on days 3 and 7. AB, alveolar bone; PDL, periodontal ligament; C, cementum. Bar = 50 mm.
Figure 9 Effect of laser irradiation on alpha(v) [a(v)]-positive osteoclasts after tooth movement by immunohistochemistry (original magnification ×400). Day 1: a few subunits of a(v)-positive osteoclasts were observed in the non-irradiated group (a and b). Immunoreactivity of a(v) (arrows) was observed in the osteoclasts on the alveolar bone surface in the irradiated group (d and f) on days 3 and 7 and in the non-irradiated group (c and e) on days 3 and 7. AB, alveolar bone; PDL, periodontal ligament; C, cementum. Bar = 50 mm.
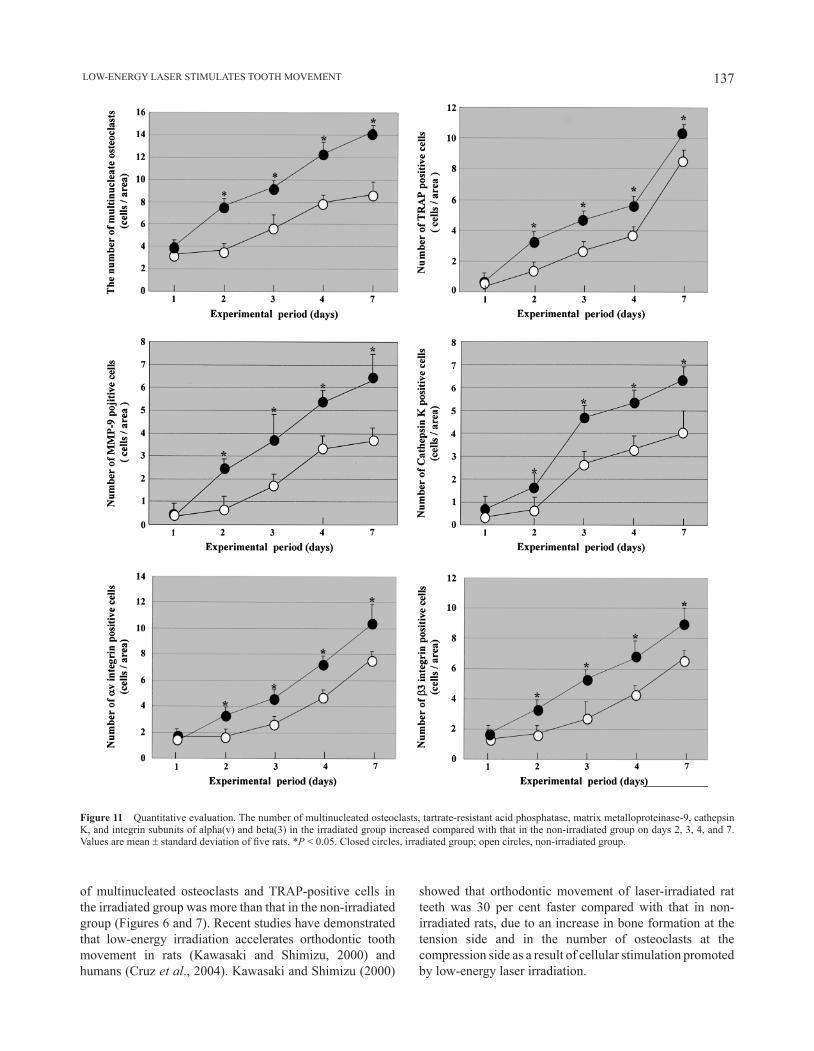
137 LOW-ENERGY LASER STIMULATES TOOTh MOVEMENT
of multinucleated osteoclasts and TRAP-positive cells in the irradiated group was more than that in the non-irradiated group (Figures 6 and 7). Recent studies have demonstrated that low-energy irradiation accelerates orthodontic tooth movement in rats (Kawasaki and Shimizu, 2000) and humans (Cruz et al., 2004). Kawasaki and Shimizu (2000)
showed that orthodontic movement of laser-irradiated rat teeth was 30 per cent faster compared with that in non-irradiated rats, due to an increase in bone formation at the tension side and in the number of osteoclasts at the compression side as a result of cellular stimulation promoted by low-energy laser irradiation.
Figure 11 Quantitative evaluation. The number of multinucleated osteoclasts, tartrate-resistant acid phosphatase, matrix metalloproteinase-9, cathepsin K, and integrin subunits of alpha(v) and beta(3) in the irradiated group increased compared with that in the non-irradiated group on days 2, 3, 4, and 7. Values are mean ± standard deviation of five rats. *P < 0.05. Closed circles, irradiated group; open circles, non-irradiated group.

M. YAMAGUChI ET AL.138
The effects of low-energy laser irradiation on MMP-9, cathepsin K, and a(v)b3 integrin expressions in vivo in the present study (Figures 7-11) show that laser irradiation increased the expression of these positive cells at the compression side on days 2–7 (1.4- to 4.0-fold). This histological phenomenon, similar to that found by Fujita et al. (2008) and Yamaguchi et al. (2007), demonstrates that low-energy laser irradiation stimulates the expressions of RANK/RANKL (1.3- to 1.5-fold) and M-CSF/c-Fms (1.2- to 1.7-fold) compared with that in the non-irradiated group at the compression side during orthodontic tooth movement. These findings are in agreement with the results of those studies.
It has recently been demonstrated that MMP-9 and cathepsin K expressions are induced in osteoclasts by RANKL (Oshiro et al., 2001; Wittrant et al., 2003). Furthermore, c-Fms and a(v)b3 integrins collaborate during osteoclast differentiation (Faccio et al., 2003). Previous studies have demonstrated that MMP-9, cathepsin K, and a(v)b3 integrin involve osteoclast differentiation (hultenby et al., 1993; Faccio et al., 2003; Nakamura et al., 2007), and these factors are expressed on osteoclasts during orthodontic tooth movement (Ohba et al., 2000; Talic et al., 2004). Furthermore, Aihara et al. (2006) and Fujita et al. (2008) reported that low-energy laser irradiation facilitates differentiation and activation of osteoclasts via RANK and c-Fms gene expressions in vitro. Therefore, the acceleration of orthodontic tooth movement by low-energy laser irradiation may be affected not only by RANK/RANKL and M-CSF/c-Fms systems but also by MMP-9, cathepsin K, and a(v)b3 integrin. Further studies are necessary to confirm the effects of laser irradiation on gene expressions of MMP-9, cathepsin K, and a(v)b3 integrin in osteoclasts in vitro.
Regarding the tension side during orthodontic tooth movement, Ozawa et al. (1998) reported that laser irradiation in the early stages of osteoblast-like cells isolated from foetal rat calvariae significantly stimulated cellular proliferation, alkaline phosphatase activity, and osteocalcin gene expression. They also found that laser irradiation in the early stages of culture significantly stimulated the proliferation of osteoblasts, resulting in the development of a greater number (1.7-fold) and larger area (3.4-fold) of bone nodules in the culture dish on day 21. These results suggest that laser irradiation may stimulate proliferation and differentiation, resulting in an increase in the number of differentiated osteoblastic cells and an increase in bone formation. Furthermore, Barushka et al. (1995) reported that low-energy laser (he–Ne) irradiation after injury affected the population of osteoblasts and osteoclasts at the injured site. On the basis of the findings of the present study, it is possible that low-energy laser irradiation may accelerate the process of bone remodelling by stimulating osteoblast and osteoclast differentiation during orthodontic tooth movement.
Conclusions
Low-energy laser irradiation facilitates the velocity of tooth movement and MMP-9, cathepsin K, and integrin subunits of a(v)b3 expressions in rats.
Address for correspondence
Masaru YamaguchiDepartment of OrthodonticsNihon University School of Dentistry at Matsudo2-870-1 Sakaecho-NishiMatsudoChiba 271-8587JapanE-mail: [email protected]
Funding
Grant-in-Aid for Scientific Research from the Japan Society for the Promotion of Science (C:18592252, C:19592367) and Nihon University Individual Research Grant for 2006 (to M.Y.; 06-091).
ReferencesAihara N, Yamaguchi M, Kasai K 2006 Low-energy irradiation stimulates
formation of osteoclast-like cells via RANK expression in vitro. Lasers in Medical Science 21: 24–33
Barushka O, Yaakobi T, Oron U 1995 Effect of low-energy laser (he-Ne) irradiation on the process of bone repair in the rat tibia. Bone 16: 47–55
Chambers T J, Revell P A, Fuller K, Athanasou N A 1984 Resorption of bone by isolated rabbit osteoclasts. Journal of Cell Science 66: 383–399
Cruz D R, Kohara E K, Ribeiro M S, Wetter N U 2004 Effects of low-intensity laser therapy on the orthodontic movement velocity of human teeth: a preliminary study. Lasers in Surgery and Medicine 35: 117–120
Delaissé J-M et al. 2000 Proteinases in bone resorption: obvious and less obvious roles. Clinica Chimica Acta 291: 223–234
Faccio R, Takeshita S, Zallone A, Ross F P, Teitelbaum S L 2003 c-Fms and the alphavbeta3 integrin collaborate during osteoclast differentiation. Journal of Clinical Investigation 111: 749–758
Fujita S, Yamaguchi M, Utsunomiya T, Yamamoto h, Kasai K 2008 Low-energy laser irradiation stimulates the tooth movement velocity via expression of RANK and RANKL. Orthodontics & Craniofacial Research 11: 143–155
Fung D T, Ng G Y, Leung M C, Tay D K 2003 Effects of a therapeutic laser on the ultrastructural morphology of repairing medial collateral ligament in a rat model. Lasers in Surgery and Medicine 32: 286–293
Gelb B D, Shi G P, Chapman h A, Desnick R J 1996 Pycnodysostosis, a lysosomal disease caused by cathepsin K deficiency. Science 273: 1236–1238
hultenby K, Reinholt F P, heinegård D 1993 Distribution of integrin subunits on rat metaphyseal osteoclasts and osteoblasts. European Journal of Cell Biology 62: 86–93
Kawasaki K, Shimizu N 2000 Effects of low-energy laser irradiation on bone remodeling during experimental tooth movement in rats. Lasers in Surgery and Medicine 26: 282–291
Lim H M, Lew K K, Tay D K 1995 A clinical investigation of the efficacy of low level laser therapy in reducing orthodontic postadjustment pain. American Journal of Orthodontics and Dentofacial Orthopedics 108: 614–622
139 LOW-ENERGY LASER STIMULATES TOOTh MOVEMENT
Maiya G A, Kumar P, Rao L 2005 Effect of low intensity helium-neon (he-Ne) laser irradiation on diabetic wound healing dynamics. Photomedicine and Laser Surgery 23: 187–190
Merli L A, Santos M T, Genovese W J, Faloppa F 2005 Effect of low-intensity laser irradiation on the process of bone repair. Photomedicine and Laser Surgery 23: 212–215
Mohammed I F, Al-Mustawfi N, Kaka L N 2007 Promotion of regenerative processes in injured peripheral nerve induced by low-level laser therapy. Photomedicine and Laser Surgery 25: 107–111
Nakamura I, Duong le T, Rodan S B, Rodan G A 2007 Involvement of alpha(v)beta3 integrins in osteoclast function. Journal of Bone and Mineral Metabolism 25: 337–344
Ohba Y, Ohba T, Terai K, Moriyama K 2000 Expression of cathepsin K mRNA during experimental tooth movement in rat as revealed by in situ hybridization. Archives of Oral Biology 45: 63–69
Okada Y et al. 1995 Localization of matrix metalloproteinase 9 (92-kilodalton gelatinase/type IV collagenase = gelatinase B) in osteoclasts: implications for bone resorption. Laboratory Investigation 72: 311–322
Oshiro T, Shibasaki Y, Martin T J, Sasaki T 2001 Immunolocalization of vacuolar-type h+-ATPase, cathepsin K, matrix metalloproteinase-9, and receptor activator of NFkappaB ligand in odontoclasts during physiological root resorption of human deciduous teeth. Anatomical Record 264: 305–311
Ozawa Y, Shimizu N, Kariya G, Abiko Y 1998 Low-energy laser irradiation stimulates bone nodule formation at early stages of cell culture in rat calvarial cells. Bone 22: 347–354
Pinheiro A L, Gerbi M E 2006 Photoengineering of bone repair processes. Photomedicine and Laser Surgery 24: 169–178
Poon V K, Huang L, Burd A 2005 Biostimulation of dermal fibroblast by sublethal Q-switched Nd:YAG 532 nm laser: collagen remodeling and pigmentation. Journal of Photochemistry and Photobiology B 81: 1–8
Reddy G K, Stehno-Bittel L, Enwemeka C S 1998 Laser photostimulation of collagen production in healing rabbit Achilles tendons. Lasers in Surgery and Medicine 22: 281–287
Roodman G D 1996 Advances in bone biology: the osteoclast. Endocrine Reviews 17: 308–332
Roodman G D, Ibbotson K J, MacDonald B R, Kuehl T J, Mundy G R 1985 1,25-Dihydroxyvitamin D3 causes formation of multinucleated cells with several osteoclast characteristics in cultures of primate marrow. Proceedings of the National Academy of Sciences of the United States of America 82: 8213–8217
Saito S, Shimizu N 1997 Stimulatory effects of low-power laser irradiation on bone regeneration in midpalatal suture during expansion in the rat. American Journal of Orthodontics and Dentofacial Orthopedics 111: 525–532
Talic N, Evans C A, Daniel J C, George A, Zaki A M 2004 Immunohistochemical localization of alphavbeta3 integrin receptor during experimental tooth movement. American Journal of Orthodontics and Dentofacial Orthopedics 125: 178–184
Tezuka K et al. 1994 Molecular cloning of a possible cysteine proteinase predominantly expressed in osteoclasts. Journal of Biological Chemistry 269: 1106–1109
Wittrant Y, Theoleyre S, Couillaud S, Dunstan C, heymann D, Rédini F 2003 Regulation of osteoclast protease expression by RANKL. Biochemical and Biophysical Research Communications 310: 774–778
Yamaguchi M et al. 2007 Low-energy laser irradiation stimulates the tooth movement velocity via expression of M-CSF and c-fms. Orthodontic Waves 66: 139–148
Yu h S, Wu C S, Yu C L, Kao Y h, Chiou M h 2003 helium-neon laser irradiation stimulates migration and proliferation in melanocytes and induces repigmentation in segmental-type vitiligo. Journal of Investigative Dermatology 120: 56–64

European Journal of Orthodontics 32 (2010) 140–147 © The Author 2009. Published by Oxford University Press on behalf of the European Orthodontic Society.doi:10.1093/ejo/cjp059 All rights reserved. For permissions, please email: [email protected] Access Publication 27 July 2009
Introduction
Foetal pathology
Pathology is the field in medicine dealing with structural and functional changes in tissues and organs which cause or are caused by disease (Taylor, 1988). Foetal pathology is encountered in the foetus aborted either deliberately or spontaneously during the first trimesters of pregnancy (Keeling, 1994). Foetal pathology differs from general pathology in many ways; by focussing on the developmental disorders not compatible with life. The severity of foetal pathological conditions is more extreme than those seen after birth. Though less interest has traditionally been devoted to analysing these rare conditions, some pioneering researchers have been aware of the importance of diagnostics and systematization in the field of foetal pathology. New methods of prenatal diagnosis, particularly ultrasound, amniocentesis, and maternal serum alphafetoprotein estimation mean that many more severely malformed foetuses are identified and accordingly the need for exact prenatal diagnostics has significantly increased. Currently, the main textbooks in foetal pathology are Buyse (1990), Keeling (1993, 1994), Gilbert-Barness (1997), Gilbert-Barness and Debich-Spicer (2004), and Schumacher et al. (2004).
Even though the discipline of foetal pathology gained more focus during the 1990s, particularly cranial analysis of aborted foetuses is still random and unsystematic. Diagnosing cranial malformations requires a detailed insight into normal embryological development of each cranial bone component. Furthermore, easy and rapid methods for routine cranial autopsy are urgently needed.
Procedures for prenatal cranial analysis, based on faxitron radiography after procedures which were verified by serial sectioning and histological analysis of cranial components, were published by Kjær and Græm (1990) and shortly followed by research on abnormally developed foetal crania
Orthodontics and foetal pathology: a personal view on
craniofacial patterning
Inger KjærDepartment of Orthodontics, School of Dentistry, University of Copenhagen, Denmark
SUMMARY This article summarizes the essentials of studies on the craniofacial skeleton performed over 17 years. It presents data from research into foetal pathology resulting in new views on craniofacial patterning and/or fields for further discussion.
The fields described cover all areas seen on profile, frontal, and panoramic radiographs. The fields are the theca, frontonasal, maxillary, palatine, and mandibular together with the cerebellar field and cervical spine. Regional fields in the dentition are described according to the pattern of peripheral nerve innervation. Studies on severely malformed foetuses show that the malformation can occur solely within a single field or in several fields. This is the background for these personal views on craniofacial patterning. These new views may assist in the diagnosis and interpretation of malformations in the cranium and dentition.
(Kjær et al., 1991). In the following years, a total of 42 studies were published dealing with the patterning of severe cranial malformations observed during foetal autopsy of specimens with known and unknown genotypes. This article presents the essentials of a selection of those studies.
Orthodontics
In orthodontic diagnostics, craniofacial analysis of profile and frontal radiographs is currently based on advanced cephalometric methods. Diagnosis of the dentition and the supporting alveolar bone is based on analyses of panoramic radiographs. There are differences between the goals and possibilities of cranial analyses of children and adults and those performed before birth. When radiographically comparing orthodontics with foetal pathology, it is obvious that orthodontic studies are longitudinal aimed at predicting future growth and morphology for treatment planning, while those in foetal pathology are cross-sectional radiographic or histological studies intended for patho-anatomical diagnostics with a pathogenetic view to previous developmental stages.
The hypothesis initiating this research was that while a malformation in the cranium and dentition can affect all cranial tissue, it can also be limited to a specific region, which secondarily involves the rest of cranial development either by deformation or disruption. This distinction between malformation, deformation, and disruption has been defined by Spranger et al. (1982) and is generally used in foetal autopsy.
The present article clarifies some important developmental fields diagnosed in foetal pathology in the areas covered by the radiographs analysed daily in an orthodontic clinic. In order to elucidate how these fields can be defined, it is necessary to briefly outline the normal development of the face and cranium.

141 CRANIOFACIAL PATTERNING
Normal embryonic development
On the 28th gestational day, the germ disc closes and forms a neural tube by induction from the notochord. At the cranial end of this neural tube, edges are formed around the so-called, cranial neuropore. These edges are formed by neuroectoderm at the inner aspect and surface ectoderm at the outer aspect. From different areas on these edges, cells migrate anteriorly and form the cranium, face, and dentition. This cell migration was first described by Le Douarin and Teillet (1974). Since then, a number of experimental studies proving this cell migration have been performed. The migrating cells are called the neural crest cells. These cells migrate from different parts of the neural crest to different parts of the cranium and dentition with a well-defined sequence. During migration, the cells move the ectoderm of the face forward like an inflating balloon. The neural crest cells gradually fill up the area anterior to the neural tube. From this first tissue accumulation of neural crest cells, the jawbones and the teeth develop (Figure 1). The neural crest cells have the potency to form nerves, muscle, vessels, cartilage, and bone. For a review of the development of the cranium and dentition, see Kjær (1998a) and Kjær et al. (1999b). It is important to differentiate between the various parts or fields of the cranium and those of the dentition because different parts develop from different or similar areas on the neural crest. Thus, the different parts supposedly have different genetic backgrounds.
Results and discussion
The locations of the six main fields registered in foetal pathology (Figure 2) are as follows:
Figure 1 Schematic illustration of the midaxial contours and bones in a human foetus, gestational age 16 weeks. The bones are marked in yellow. The notochord is the red line surrounded by the vertebral corpora and the basilar part of the occipital bone. The purple lines exemplify pathways of different neural crest cells towards the jaws.
• Cerebellar and cervical spine (notochordal field) • Theca (not shown) (induced from notochord and/or
from neural crest cells) • Frontonasal (antero-neural crest field) • Maxillary (antero-median neural crest field) • Palatine (postero-median neural crest field) • Mandibular (posterior neural crest field).
The borders between these embryonic fields have been determined by analysing the extent of malformations in severely malformed foetuses which is exemplified below. Some malformations occur solely within a field and some in more than one field.
Pathological cranial development fields before birth
Cerebellar and cervical spine. The cerebellar and cervical spine field (Figure 2) has been examined in foetuses with anencephaly (Kjær et al., 1994a; Lomholt et al., 2004), amniotic band sequence (Keeling and Kjær, 1994), cranial encephalocele and myelomeningocele (Kjær et al., 1996a), and Down syndrome (Lomholt et al., 2003). It is characteristic that the cerebellar field is limited anteriorly by the structures originally formed from the notochord. These are the vertebral bodies, the basilar part of the occipital bone, and the post-sphenoid bone (Figure 2). Posteriorly, the cerebellar and cervical spine field are limited by the notochordally induced para-axial components, the cartilaginous part of the occipital bone, and the vertebral arches (Figure 2). The field is shaped like a funnel in which the main part of the brain stem, cerebellum, and cranial part of the spinal cord are located.
The different fields in the spine, i.e. cervical, thoracic lumbar, and coxygeal, have been studied in a series of foetuses with well-known genetic deviations such as trisomy 18 (Kjær et al., 1996b), trisomy 21 (Keeling et al., 1997), trisomy 13 (Kjær et al., 1997a), and triploidy (Nolting et al., 2002). Also spine malformations in several foetuses with unknown genotypes have been published. These studies showed that the malformations in different genetic disorders are more or less located in and limited to genotypically specific segments of the spine. For example, the osseous spine deviations in trisomy 21 are predominantly located in the cervical column and in trisomy 18 predominantly in the thoracic part of the column. Each genotype also has specific types of osseous malformations in the basilar part of the occipital bone and in the spine (Kjær et al., 1994a, 1996b; Kjær, 1998a).
Theca. The theca field is in the anterior aspect located above the region of the anterior cranial fossa and in the posterior aspect above the cerebellar field. The borderline between the cerebellar and the theca fields is clearly visible in anencephaly where the hemispheres have not been formed resulting in absence of the theca field (Figure 3). Figure 4 shows a histological section of the foetus shown schematically in Figure 3 illustrating that only the upper part of the frontal bone (not visible) belongs to the theca
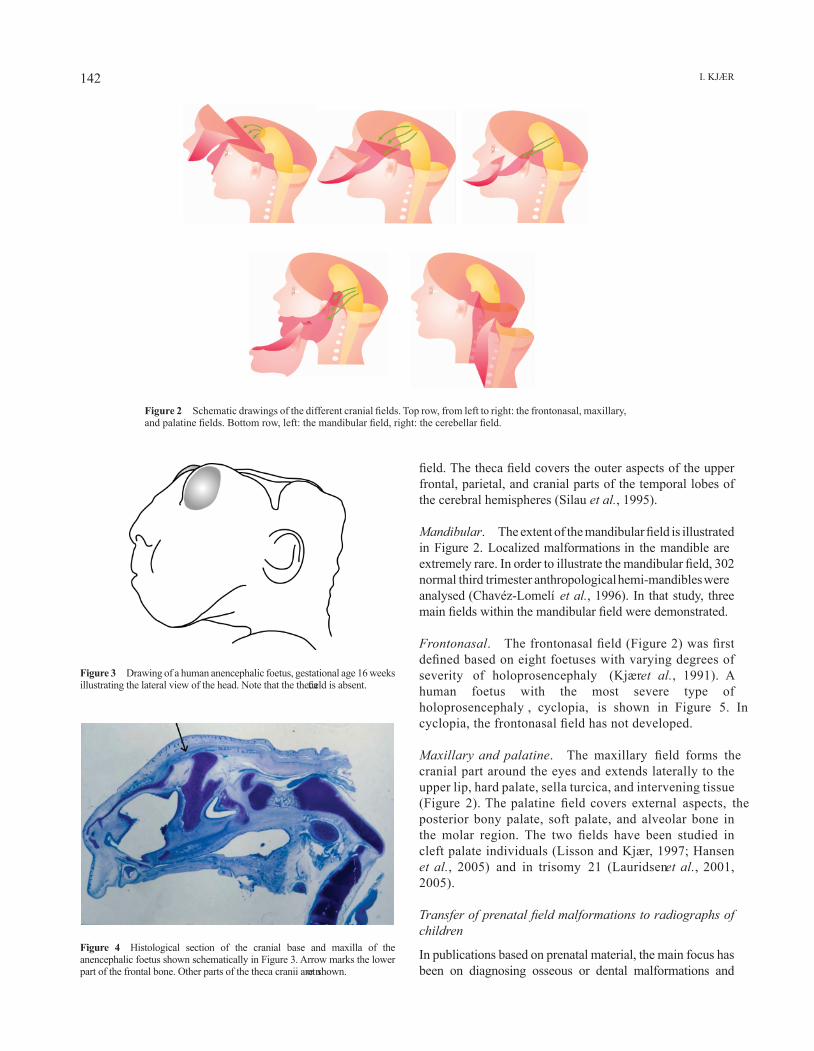
I. KjæR142
Figure 2 Schematic drawings of the different cranial fields. Top row, from left to right: the frontonasal, maxillary, and palatine fields. Bottom row, left: the mandibular field, right: the cerebellar field.
Figure 3 Drawing of a human anencephalic foetus, gestational age 16 weeks illustrating the lateral view of the head. Note that the theca field is absent.
Figure 4 Histological section of the cranial base and maxilla of the anencephalic foetus shown schematically in Figure 3. Arrow marks the lower part of the frontal bone. Other parts of the theca cranii are not shown.
field. The theca field covers the outer aspects of the upper frontal, parietal, and cranial parts of the temporal lobes of the cerebral hemispheres (Silau et al., 1995).
Mandibular. The extent of the mandibular field is illustrated in Figure 2. Localized malformations in the mandible are extremely rare. In order to illustrate the mandibular field, 302 normal third trimester anthropological hemi-mandibles were analysed (Chavéz-Lomelí et al., 1996). In that study, three main fields within the mandibular field were demonstrated.
Frontonasal. The frontonasal field (Figure 2) was first defined based on eight foetuses with varying degrees of severity of holoprosencephaly (Kjær et al., 1991). A human foetus with the most severe type of holoprosencephaly , cyclopia, is shown in Figure 5. In cyclopia, the frontonasal field has not developed.
Maxillary and palatine. The maxillary field forms the cranial part around the eyes and extends laterally to the upper lip, hard palate, sella turcica, and intervening tissue (Figure 2). The palatine field covers external aspects, the posterior bony palate, soft palate, and alveolar bone in the molar region. The two fields have been studied in cleft palate individuals (Lisson and Kjær, 1997; Hansen et al., 2005) and in trisomy 21 (Lauridsen et al., 2001, 2005).
Transfer of prenatal field malformations to radiographs of children
In publications based on prenatal material, the main focus has been on diagnosing osseous or dental malformations and
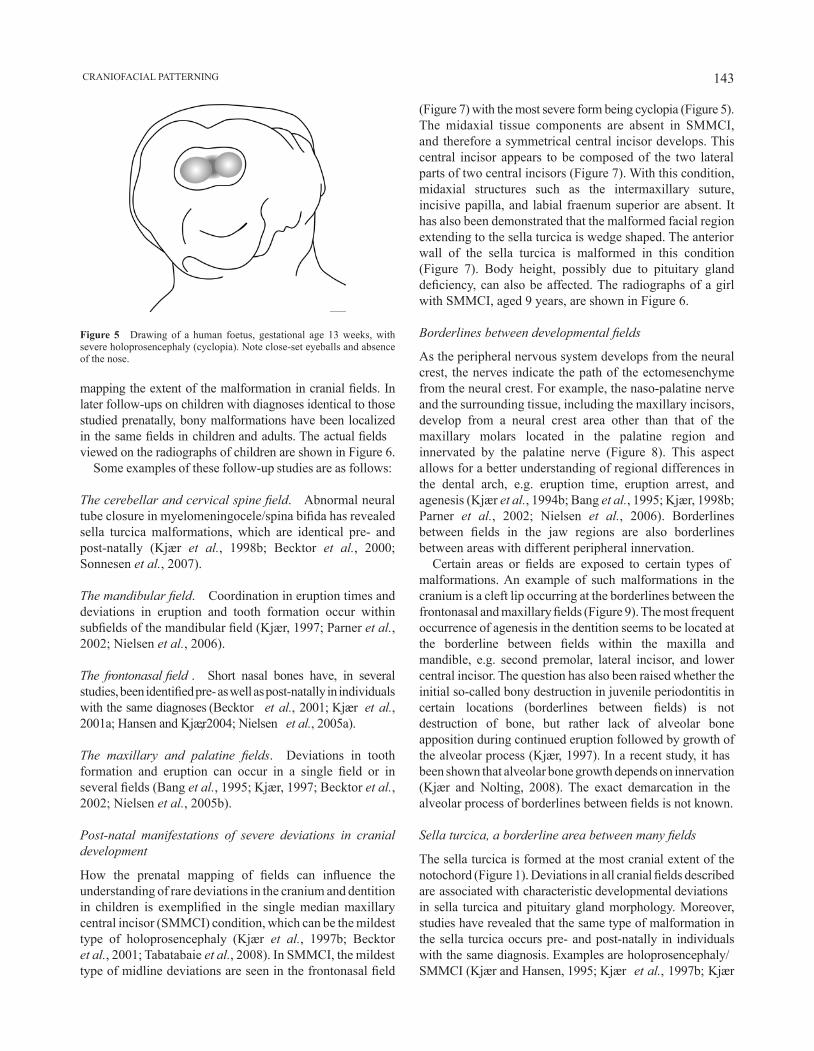
143 CRANIOFACIAL PATTERNING
mapping the extent of the malformation in cranial fields. In later follow-ups on children with diagnoses identical to those studied prenatally, bony malformations have been localized in the same fields in children and adults. The actual fields viewed on the radiographs of children are shown in Figure 6.
Some examples of these follow-up studies are as follows:
The cerebellar and cervical spine field. Abnormal neural tube closure in myelomeningocele/spina bifida has revealed sella turcica malformations, which are identical pre- and post-natally (Kjær et al., 1998b; Becktor et al., 2000; Sonnesen et al., 2007).
The mandibular field. Coordination in eruption times and deviations in eruption and tooth formation occur within subfields of the mandibular field (Kjær, 1997; Parner et al., 2002; Nielsen et al., 2006).
The frontonasal field . Short nasal bones have, in several studies, been identified pre- as well as post-natally in individuals with the same diagnoses (Becktor et al., 2001; Kjær et al., 2001a; Hansen and Kjær, 2004; Nielsen et al., 2005a).
The maxillary and palatine fields. Deviations in tooth formation and eruption can occur in a single field or in several fields (Bang et al., 1995; Kjær, 1997; Becktor et al., 2002; Nielsen et al., 2005b).
Post-natal manifestations of severe deviations in cranial development
How the prenatal mapping of fields can influence the understanding of rare deviations in the cranium and dentition in children is exemplified in the single median maxillary central incisor (SMMCI) condition, which can be the mildest type of holoprosencephaly (Kjær et al., 1997b; Becktor et al., 2001; Tabatabaie et al., 2008). In SMMCI, the mildest type of midline deviations are seen in the frontonasal field
Figure 5 Drawing of a human foetus, gestational age 13 weeks, with severe holoprosencephaly (cyclopia). Note close-set eyeballs and absence of the nose.
(Figure 7) with the most severe form being cyclopia (Figure 5). The midaxial tissue components are absent in SMMCI, and therefore a symmetrical central incisor develops. This central incisor appears to be composed of the two lateral parts of two central incisors (Figure 7). With this condition, midaxial structures such as the intermaxillary suture, incisive papilla, and labial fraenum superior are absent. It has also been demonstrated that the malformed facial region extending to the sella turcica is wedge shaped. The anterior wall of the sella turcica is malformed in this condition (Figure 7). Body height, possibly due to pituitary gland deficiency, can also be affected. The radiographs of a girl with SMMCI, aged 9 years, are shown in Figure 6.
Borderlines between developmental fields
As the peripheral nervous system develops from the neural crest, the nerves indicate the path of the ectomesenchyme from the neural crest. For example, the naso-palatine nerve and the surrounding tissue, including the maxillary incisors, develop from a neural crest area other than that of the maxillary molars located in the palatine region and innervated by the palatine nerve (Figure 8). This aspect allows for a better understanding of regional differences in the dental arch, e.g. eruption time, eruption arrest, and agenesis (Kjær et al., 1994b; Bang et al., 1995; Kjær, 1998b; Parner et al., 2002; Nielsen et al., 2006). Borderlines between fields in the jaw regions are also borderlines between areas with different peripheral innervation.
Certain areas or fields are exposed to certain types of malformations. An example of such malformations in the cranium is a cleft lip occurring at the borderlines between the frontonasal and maxillary fields (Figure 9). The most frequent occurrence of agenesis in the dentition seems to be located at the borderline between fields within the maxilla and mandible, e.g. second premolar, lateral incisor, and lower central incisor. The question has also been raised whether the initial so-called bony destruction in juvenile periodontitis in certain locations (borderlines between fields) is not destruction of bone, but rather lack of alveolar bone apposition during continued eruption followed by growth of the alveolar process (Kjær, 1997). In a recent study, it has been shown that alveolar bone growth depends on innervation (Kjær and Nolting, 2008). The exact demarcation in the alveolar process of borderlines between fields is not known.
Sella turcica, a borderline area between many fields
The sella turcica is formed at the most cranial extent of the notochord (Figure 1). Deviations in all cranial fields described are associated with characteristic developmental deviations in sella turcica and pituitary gland morphology. Moreover, studies have revealed that the same type of malformation in the sella turcica occurs pre- and post-natally in individuals with the same diagnosis. Examples are holoprosencephaly/SMMCI (Kjær and Hansen, 1995; Kjær et al., 1997b; Kjær

I. KjæR144
Figure 6 Profile (a), frontal (b), and panoramic (c) radiographs of a girl aged 9 years with a single median maxillary central incisor. Different developmental fields are marked on the radiographs. Green: cerebellar and cervical spine. Purple: theca. Light and dark blue: mandibular. Yellow: frontonasal. Red: maxillary. Orange: palatine. Note that sella turcica is a borderline region between many fields.
Figure 7 Left: intra-oral photograph of a patient with a single median maxillary central incisor (SMMCI). Note the symmetrical SMMCI and absence of superior labial fraenum. Right: drawings of abnormal sella turcica contours in 10 children with SMMCI (Kjær et al., 2001a; published with permission of Oxford University Press).
and Hansen, 2000); cleft lip and palate (Mølsted et al., 1993, 1995; Kjær et al., 1997c; Nielsen et al., 2005b); Down syndrome and trisomy 21 (Kjær et al., 1998a; Russell and
Kjær, 1999); spina bifida/myelomingocele (Kjær et al., 1996a, 1998b, 1999a); and fragile X syndrome (Hjalgrim et al., 2000; Kjær et al., 2001b).
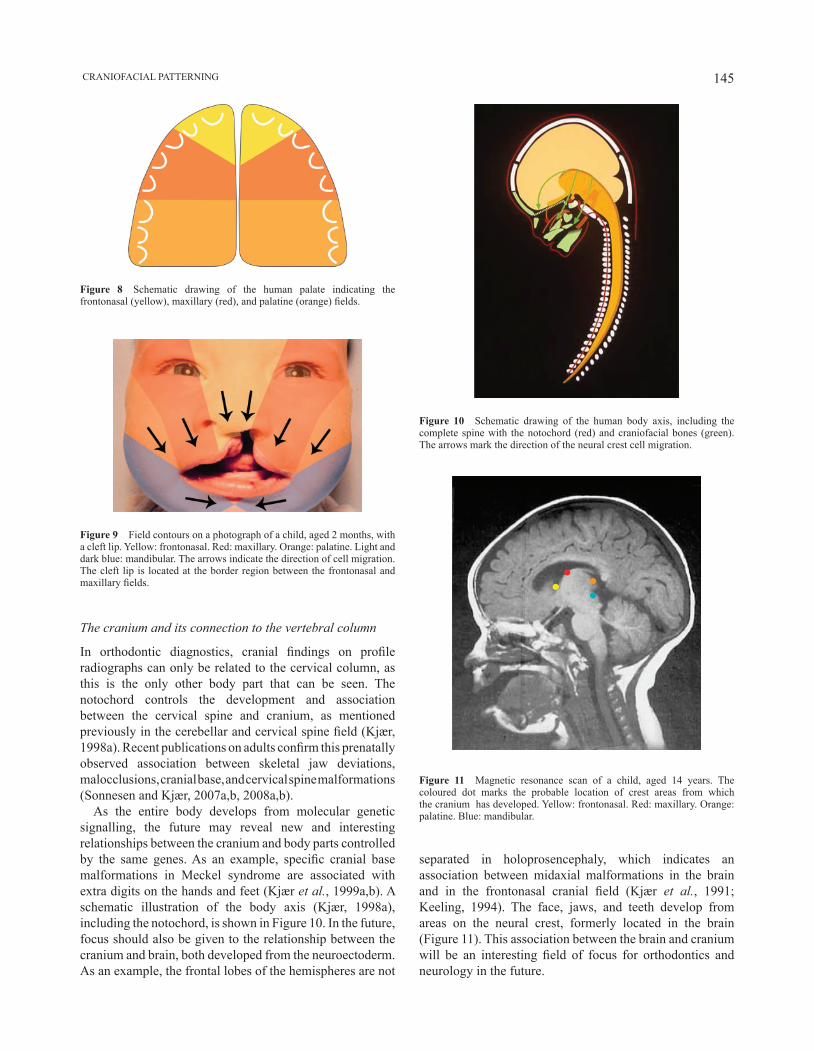
145 CRANIOFACIAL PATTERNING
Figure 8 Schematic drawing of the human palate indicating the frontonasal (yellow), maxillary (red), and palatine (orange) fields.
Figure 9 Field contours on a photograph of a child, aged 2 months, with a cleft lip. Yellow: frontonasal. Red: maxillary. Orange: palatine. Light and dark blue: mandibular. The arrows indicate the direction of cell migration. The cleft lip is located at the border region between the frontonasal and maxillary fields.
Figure 10 Schematic drawing of the human body axis, including the complete spine with the notochord (red) and craniofacial bones (green). The arrows mark the direction of the neural crest cell migration.
Figure 11 Magnetic resonance scan of a child, aged 14 years. The coloured dot marks the probable location of crest areas from which the cranium has developed. Yellow: frontonasal. Red: maxillary. Orange: palatine. Blue: mandibular.
separated in holoprosencephaly, which indicates an association between midaxial malformations in the brain and in the frontonasal cranial field (Kjær et al., 1991; Keeling, 1994). The face, jaws, and teeth develop from areas on the neural crest, formerly located in the brain (Figure 11). This association between the brain and cranium will be an interesting field of focus for orthodontics and neurology in the future.
The cranium and its connection to the vertebral column
In orthodontic diagnostics, cranial findings on profile radiographs can only be related to the cervical column, as this is the only other body part that can be seen. The notochord controls the development and association between the cervical spine and cranium, as mentioned previously in the cerebellar and cervical spine field (Kjær, 1998a). Recent publications on adults confirm this prenatally observed association between skeletal jaw deviations, malocclusions, cranial base, and cervical spine malformations (Sonnesen and Kjær, 2007a,b, 2008a,b).
As the entire body develops from molecular genetic signalling, the future may reveal new and interesting relationships between the cranium and body parts controlled by the same genes. As an example, specific cranial base malformations in Meckel syndrome are associated with extra digits on the hands and feet (Kjær et al., 1999a,b). A schematic illustration of the body axis (Kjær, 1998a), including the notochord, is shown in Figure 10. In the future, focus should also be given to the relationship between the cranium and brain, both developed from the neuroectoderm. As an example, the frontal lobes of the hemispheres are not
I. KjæR146
specialist clinics and doctors at different hospitals in Denmark; and Linguistic officer, Maria Kvetny.
ReferencesBang E, Kjær I, Christensen L R 1995 Etiologic aspects and orthodontic
treatment of unilateral localised arrested tooth development combined with hearing loss. American journal of Orthodontics and Dentofacial Orthopedics 108: 154–161
Becktor j P, Einersen S, Kjær I 2000 A sella turcica bridge in subjects with severe craniofacial deviations. European Journal of Orthodontics 22: 69–74
Becktor K B, Sverrild L, Pallisgaard C, Burhøj j, Kjær I 2001 Eruption of the central incisor, the intermaxillary suture, and maxillary growth in patients with a single median maxillary central incisor, SMMCI. Acta Odontologica Scandinavica 59: 361–366
Becktor K B, Reibel j, Vedel B, Kjær I 2002 Segmental odontomaxillary dysplasia: clinical, radiological and histological aspects of four cases. Oral Diseases 8: 106–110
Buyse M L (ed.) 1990 Birth defects encyclopedia. Center for Birth Defects Information Services, Inc., Dover
Chavéz-Lomelí M E, Mansilla Lory j, Pompa j A, Kjær I 1996 The human mandibular canal arises from three separate canals innervating different tooth groups. journal of Dental Research 75: 1540–1544
Gilbert-Barness E (ed.) 1997 Potter’s pathology of the fetus and infant. Mosby, St Louis
Gilbert-Barness E, Debich-Spicer D 2004 Embryo and fetal pathology. Cambridge University Press, Cambridge
Hansen L, Kjær I 2004 A premaxilla with a supernumerary tooth indicating a developmental region with a variety of dental abnormalities: a report of nine cases. Acta Odontologica Scandinavica 62: 30–36
Hansen L, Skovgaard L T, Nolting D, Hansen B F, Kjær I 2005 Human prenatal nasal bone lengths: normal standards and length values in fetuses with cleft lip and cleft palate. Cleft Palate–Craniofacial journal 42: 165–170
Hjalgrim H, Hansen B F, Brøndum-Nielsen K, Nolting D, Kjær I 2000 Aspects of skeletal development in fragile X syndrome fetuses. American journal of Medical Genetics 95: 123–129
Keeling J W (ed.) 1993 Fetal and neonatal pathology. 2nd edn.Springer-Verlag, London.
Keeling j W 1994 Fetal pathology. Churchill Livingstone, Hong KongKeeling j W, Kjær I 1994 Diagnostic distinction between anencephaly and
amnion rupture sequence based on skeletal analysis. journal of Medical Genetics 31: 823–829
Keeling j W, Hansen B F, Kjær I 1997 Pattern of malformations in the axial skeleton in human trisomy 21 fetuses. American journal of Medical Genetics 68: 466–471
Kjær I 1997 Can the location of tooth agenesis and the location of initial bone loss seen in juvenile periodontitis be explained by neural developmental fields in the jaws? Acta Odontologica Scandinavica 55: 70–72
Kjær I 1998a Neuro-osteology. Critical Reviews in Oral Biology and Medicine 9: 224–244
Kjær I 1998b Prenatal traces of aberrant neurofacial growth. Acta Odontologica Scandinavica 56: 326–330
Kjær I, Græm N 1990 Simple autopsy method for analysis of complex fetal cranial malformations. Pediatric Pathology 10: 717–727
Kjær I, Hansen B F 1995 Human fetal pituitary gland in holoprosencephaly and anencephaly. journal of Craniofacial and Genetic Developmental Biology 15: 222–229
Kjær I, Hansen B F 2000 The prenatal pituitary gland—hidden and forgotten. Pediatric Neurology 22: 155–156
Kjær I, Nolting D 2008 Immunohistochemical PGP 9.5 positivity in human osteoblasts may indicate that compensatory and dysplastic craniofacial growth are under control by peripheral nerves. Orthodontics and Craniofacial Research 11: 196–200
Conclusion
Prenatal autopsies of severely malformed crania have revealed that a single area or field in the cranium can be affected by malformations or that several fields can be malformed. Prenatal tissue is useful for complete mapping of malformations because histological examinations are possible. This allows for a pathogenetic insight and improved understanding of postnatal development.
The exact borderlines between fields and the exact genetic background for field malformations are not known. Both aspects are currently discussed in the literature. For visualization of prenatal pathology, the fields affected by malformation are superimposed on the radiographs used in orthodontic practice for diagnostics. It has been shown in the present article, by several examples, how prenatal findings are similar to postnatal observations. Accordingly, postnatal diagnostics and knowledge on pathogenesis are supported and strengthened by findings in prenatal pathology.
How the prenatal fields and cranial patterning can contribute further to orthodontic diagnostics and treatment planning may be a matter of future debate and future research.
Address for correspondence
Inger KjærDepartment of OrthodonticsSchool of DentistryFaculty of Health SciencesUniversity of Copenhagen20 Nørre AlleDK-2200 Copenhagen NDenmarkE-mail: [email protected]
Funding
Danish Medical Research Council (12-7371, 12-8871, 12-9662, 12-9762, 12-0405, 12-0885, 12-5030, 12-2153, 12-1530, 9401187, 9601764); Marie and Knud Øster-jørgensen’s Foundation; Danish Dental Association (FUT-CALCIN Foundation); Vanføre Foundation; Association for People with Delayed Development; Ville Heise Foundation; Vera and Carl johan Michaelsen Foundation; Dentists New National Association (TNL); Århus University Research Foundation (1-7928249501); Wilhelm johansen Centre for Functional Genome Research, established by the National Danish Research Foundation; Dannin Foundation; IMK Almene Foundation.
Acknowledgement
Sincere thanks are extended to foetal pathologists, Birgit Fischer Hansen and jean Keeling; Medical laboratory technologist, Dorrit Nolting; colleagues in Danish orthodontic

147 CRANIOFACIAL PATTERNING
Kjær I, Keeling j W, Græm N 1991 The midline craniofacial skeleton in holoprosencephalic fetuses. journal of Medical Genetics 28: 846–855
Kjær I, Keeling j W, Græm N 1994a Cranial base and vertebral column in human anencephalic fetuses. journal of Craniofacial Genetics and Developmental Biology 14: 235–244
Kjær I, Kocsis G, Nodal M, Christensen L R 1994b Aetiological aspects of mandibular tooth agenesis—focusing on the role of nerve, oral mucosa, and supporting tissues. European Journal of Orthodontics 16: 371–375
Kjær I, Hansen B F, Keeling j W 1996a Axial skeleton and pituitary gland in human fetuses with spina bifida and cranial encephalocele. Pediatric Pathology 16: 909–926
Kjær I, Keeling j W, Hansen B F 1996b Pattern of malformations in the axial skeleton in human trisomy 18 fetuses. American journal of Medical Genetics 65: 332–336
Kjær I, Keeling j W, Hansen B F 1997a Pattern of malformations in the axial skeleton in human trisomy 13 fetuses. American journal of Medical Genetics 70: 421–426
Kjær I, Keeling j, Russell B, Daugaard-jensen j, Hansen B F 1997b Palate structure in human holoprosencephaly correlates with the facial malformation and demonstrates a new palatal developmental field. American journal of Medical Genetics 73: 387–392
Kjær I et al. 1997c A new craniofacial disorder involving hypertelorism and malformations of external nose, palate and pituitary gland. Journal of Craniofacial and Genetic Developmental Biology 17: 23–34
Kjær I, Keeling j W, Reintoft I, Nolting D, Hansen B F 1998a Pituitary gland and sella turcica in human trisomy 21 fetuses related to axial skeletal development. American journal of Medical Genetics 80: 494–500
Kjær I, Wagner A, Madsen P, Blichfeldt S, Rasmussen K, Russell B 1998b The sella turcica in children with lumbosacral myelomeningocele. European Journal of Orthodontics 20: 443–448
Kjær I, Hansen B F, Reintoft I, Keeling j W 1999a Pituitary gland and axial skeleton malformations in human fetuses with spina bifida. European Pediatric Surgery 9: 354–358
Kjær I, Keeling j W, Hansen B F 1999b The prenatal human cranium. Normal and pathologic development. Munksgaard, Copenhagen
Kjær I, Becktor K B, Lisson j, Gormsen C, Russell B G 2001a Face, palate and craniofacial morphology in patients with a solitary median maxillary central incisor. European Journal of Orthodontics 23: 63–73
Kjær I, Hjalgrim H, Russell B G 2001b Cranial and hand skeleton in fragile X. American journal of Medical Genetics 100: 156–161
Kjær K W, Hansen B F, Keeling j W, Kjær I 1999a Skeletal malformations in fetuses with Meckel syndrome. American journal of Medical Genetics 84: 469–475
Kjær K W, Hansen B F, Keeling j W, Nolting D, Kjær I 1999b Malformation of cranial base structures and pituitary gland in prenatal Meckel syndrome. Acta Pathologica, Microbiologica, et Immunologica Scandinavica 107: 937–944
Lauridsen H, Hansen B F, Reintoft I, Keeling j W, Kjær I 2001 Histological investigation of the palatine bone in prenatal Trisomy 21. Cleft Palate– Craniofacial journal 38: 492–497
Lauridsen H, Hansen B F, Reintoft I, Keeling j W, Skovgaard L T, Kjær I 2005 Short hard palate in prenatal trisomy 21. Orthodontics and Craniofacial Research 8: 91–95
Le Douarin N M, Teillet M-A 1974 Experimental analysis of the migration and differentiation of neuroblasts of the autonomic nervous system and of neuroectodermal mesenchymal derivatives, using a biological cell marking technique. Developmental Biology 41: 162–184
Lisson j A, Kjær I 1997 Location of alveolar clefts relative to the incisive fissure. Cleft Palate–Craniofacial journal 34: 292–296
Lomholt j F, Keeling j W, Hansen B F, Ono T, Stoltze K, Kjær I 2003 The prenatal development of the human cerebellar field in Down’s syndrome. Orthodontics and Craniofacial Research 6: 220–226
Lomholt j F, Hansen B F, Keeling j W, Reintoft I, Kjær I 2004 Subclassification of anencephalic human fetuses according to morphology of the posterior cranial fossa. Pediatric and Developmental Pathology 7: 601–606
Mølsted K, Kjær I, Dahl E 1993 Spheno-occipital synchondrosis in three-month-old children with clefts of the lip and palate: a radiographic study. Cleft Palate–Craniofacial journal 30: 569–573
Mølsted K, Kjær I, Dahl E 1995 Cranial base in newborns with complete cleft lip and palate: radiographic study. Cleft Palate–Craniofacial journal 32: 199–205
Nielsen B W, Mølsted K, Kjær I 2005a Maxillary and sella turcica morophology in newborns with cleft lip and palate. Cleft Palate–Craniofacial journal 42: 610–617
Nielsen B W, Mølsted K, Skovgaard L T, Kjær I 2005b Cross-sectional study of the length of the nasal bone in cleft lip and cleft palate. Cleft Palate–Craniofacial journal 42: 417–422
Nielsen S H, Becktor K B, Kjær I 2006 Primary retention of first permanent mandibular molars in 29 subjects. European Journal of Orthodontics 28: 529–534
Nolting D, Hansen B F, Keeling j W, Kjær I 2002 Histological examinations of bone and cartilage in the axial skeleton of human triploidy fetuses. Acta Pathologica, Microbiologica, et Immunologica Scandinavica 110: 186–192
Parner E T, Heidmann j M, Kjær I, Væth M, Poulsen S 2002 Biological interpretation of the correlation of emergence times of permanent teeth. journal of Dental Research 81: 451–454
Russell B G, Kjær I 1999 Postnatal structure of the sella turcica in Down syndrome. American journal of Medical Genetics 87: 183–188
Schumacher R, Seaver L H, Spranger j 2004 Fetal radiology. A diagnostic atlas. Springer-Verlag, Berlin
Silau A M, Hansen B F, Kjær I 1995 Normal prenatal development of the human parietal bone and interparietal suture. journal of Craniofacial Genetics and Developmental Biology 15: 81–86
Sonnesen L, Kjær I 2007a Cervical vertebral body fusions in patients with skeletal deep bite. European journal of Orthodontics 29: 464–470
Sonnesen L, Kjær I 2007b Cervical column morphology in patients with skeletal Class III malocclusion and mandibular overjet. American Journal of Orthodontics and Dentofacial Orthopedics 132: 427.e7–427.e12
Sonnesen L, Kjær I 2008a Cervical column morphology in patients with skeletal open bite. Orthodontics and Craniofacial Research 11: 17–23
Sonnesen L, Kjær I 2008b Anomalies of the cervical vertebrae in patients with skeletal Class II malocclusion and horizontal maxillary overjet. American Journal of Orthodontics and Dentofacial Orthopedics 133: 188.e.15–e.20
Sonnesen L, Pedersen C E, Kjær I 2007 Cervical column morphology related to head posture, cranial base angle and condylar malformation. European Journal of Orthodontics 29: 398–403
Spranger J et al. 1982 Errors of morphogenesis: concepts and terms. Recommendations of an International Working Group. journal of Pediatrics 100: 160–165
Tabatabaie F, Sonnesen L, Kjær I 2008 The neurocranial and craniofacial morphology in children with solitary median maxillary central incisor (SMMCI). Orthodontics and Craniofacial Research 11: 96–104
Taylor E 1988 (ed). Dorland’s illustrated medical dictionary, 27th edn. W.B. Saunders Company, Philadelphia

European Journal of Orthodontics 32 (2010) 148–153 © The Author 2009. Published by Oxford University Press on behalf of the European Orthodontic Society.doi:10.1093/ejo/cjp081 All rights reserved. For permissions, please email: [email protected] Access Publication 13 September 2009
Introduction
The sella turcica is an important structure in radiographic analysis of the neurocranial and craniofacial complex. In orthodontics, the sella turcica is a significant anatomical structure because the sella point, one of the most commonly used landmarks in cephalometrics, is located at the centre of the sella turcica.
The sella turcica is situated on the intracranial surface of the body of the sphenoid bone. The anterior border of the sella turcica is represented by the tuberculum sellae and the posterior border by the dorsum sellae. The pituitary gland is surrounded by the sella turcica, whereas two anterior and two posterior clinoid processes project over the pituitary fossa. The anterior clinoid processes are formed by the medial and anterior prolongations of the lesser wing of the sphenoid bone, and the posterior clinoid processes by the endings of the dorsum sellae. During embryological development, the sella turcica area is a key point for the migration of the neural crest cells to the frontonasal and maxillary developmental fields (Kjær et al., 1999).
The anatomy of the sella turcica has been described as variable (Teal, 1977). Anatomically, that author subdivided the sella turcica into three segments, consisting of an anterior wall, a floor, and a posterior wall. Morphologically, three basic types—oval, round, and flat—have been classified, the oval and round types being the most common (Figure 1).
One study, using cephalometric radiographs, has described abnormally large or, less commonly, small sella turcicas (Alkofide, 2001). The radiological diagnosis of an enlarged sella turcica has been found to be associated with adenomas, mucocele, meningioma, primary hypothyroidism, prolactinoma, gigantism, acromegaly, empty sella syndrome
Bridging of the sella turcica in skeletal Class III subjects
Philipp Meyer-Marcotty*, Tobias Reuther** and Angelika Stellzig-Eisenhauer*Departments of *Orthodontics, and **Maxillo-Facial-Surgery and Plastic Surgery, Dental Clinic of the Medical Faculty, University of Würzburg, Germany
SUMMARY Several investigations have analysed the frequency of sella turcica anomalies in patients with severe craniofacial deviations. Until now, there have been no studies concerning the prevalence of sella turcica bridging in homogenous groups of patients. Therefore, the aims of this controlled study were to analyse the prevalence of sella turcica bridging and measure the size of the sella turcica in two well-defined groups of Caucasian individuals.
In a multicentre retrospective study, 400 pre-treatment lateral cephalograms of adult patients (over 17 years of age) with a skeletal Class III (n = 250, 132 females and 118 males) or a skeletal Class I (n = 150, 94 females and 56 males) malocclusion were analysed. The morphology, length, depth, and diameter of the sella turcica were investigated. For statistical analysis, chi-square and t-tests were used.
Skeletal Class III patients presented a significantly higher rate of sella turcica bridging, 16.8 per cent (P = 0.031), in comparison with skeletal Class I patients, whose rate was 9.4 per cent. No differences between females and males were detected for the length, depth, and diameter of the sella turcica. Bridging of the sella turcica could be seen radiographically in skeletal Class III subjects.
(non-functioning pituitary glands), and Nelson syndrome (Camp, 1923; Taveras and Wood, 1964; McLachlan et al., 1970; Pribram and du Boulay, 1971; Friedland and Meazzini, 1996). Moreover, tumours such as craniopharyngioma and intrasellar aneurysm can be responsible for an enlargement of the sella turcica with bony destruction and invasion into the surrounding structures (Younghusband et al., 1952). In contrast, an abnormally small sella turcica seems to be rare and found in primary hypopituitarism and Sheehan’s syndrome (Pribram and du Boulay, 1971).
Additionally, bridging of the sella turcica, that is, the fusion of the anterior and posterior clinoid processes, is a further anatomical abnormality, which has been reported to occur in distinctive syndromes or skeletal and dental malformations (Childers and Wright, 1986; Koshino et al., 1989; Leonardi et al., 2006; Meyer-Marcotty et al., 2008).
In a ‘normal’ population, the prevalence of a sella turcica bridge has been reported with a frequency of 1.75 to 6 per cent in anatomical and radiographic studies (Busch, 1951; Müller, 1952; Platzer, 1957). Platzer (1957) found a 5.9 per cent occurrence rate of bony sella turcica bridging by directly inspecting autopsy tissue from 220 individuals. That author assumed an association between bridging of the sella turcica and the course of the internal carotid artery.
The occurrence of a sella turcica bridge has been described as a radiographic feature in basal cell carcinoma (Gorlin–Goltz) syndrome, Rieger syndrome, and other disorders and syndromes (McLachlan et al., 1970; Gorlin et al., 1976; Koshino et al., 1989; Meyer-Marcotty et al., 2008). However, altered sella turcica morphology or bridging of the sella turcica seems to be related to a symptom of a syndrome. Meyer-Marcotty et al. (2008) found an
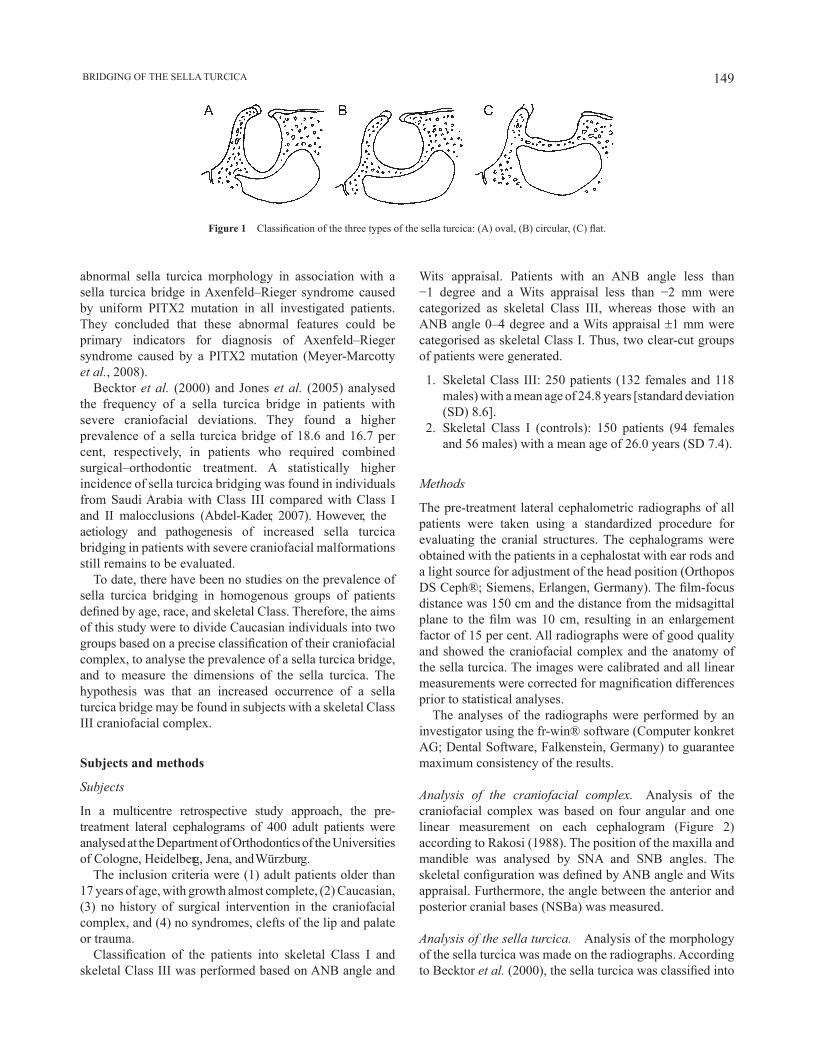
149 BRIDGING OF THE SELLA TURCICA
abnormal sella turcica morphology in association with a sella turcica bridge in Axenfeld–Rieger syndrome caused by uniform PITX2 mutation in all investigated patients. They concluded that these abnormal features could be primary indicators for diagnosis of Axenfeld–Rieger syndrome caused by a PITX2 mutation (Meyer-Marcotty et al., 2008).
Becktor et al. (2000) and Jones et al. (2005) analysed the frequency of a sella turcica bridge in patients with severe craniofacial deviations. They found a higher prevalence of a sella turcica bridge of 18.6 and 16.7 per cent, respectively, in patients who required combined surgical–orthodontic treatment. A statistically higher incidence of sella turcica bridging was found in individuals from Saudi Arabia with Class III compared with Class I and II malocclusions (Abdel-Kader, 2007). However, the aetiology and pathogenesis of increased sella turcica bridging in patients with severe craniofacial malformations still remains to be evaluated.
To date, there have been no studies on the prevalence of sella turcica bridging in homogenous groups of patients defined by age, race, and skeletal Class. Therefore, the aims of this study were to divide Caucasian individuals into two groups based on a precise classification of their craniofacial complex, to analyse the prevalence of a sella turcica bridge, and to measure the dimensions of the sella turcica. The hypothesis was that an increased occurrence of a sella turcica bridge may be found in subjects with a skeletal Class III craniofacial complex.
Subjects and methods
Subjects
In a multicentre retrospective study approach, the pre-treatment lateral cephalograms of 400 adult patients were analysed at the Department of Orthodontics of the Universities of Cologne, Heidelberg, Jena, and Würzburg.
The inclusion criteria were (1) adult patients older than 17 years of age, with growth almost complete, (2) Caucasian, (3) no history of surgical intervention in the craniofacial complex, and (4) no syndromes, clefts of the lip and palate or trauma.
Classification of the patients into skeletal Class I and skeletal Class III was performed based on ANB angle and
Wits appraisal. Patients with an ANB angle less than −1 degree and a Wits appraisal less than −2 mm were categorized as skeletal Class III, whereas those with an ANB angle 0–4 degree and a Wits appraisal ±1 mm were categorised as skeletal Class I. Thus, two clear-cut groups of patients were generated.
1. Skeletal Class III: 250 patients (132 females and 118 males) with a mean age of 24.8 years [standard deviation (SD) 8.6].
2. Skeletal Class I (controls): 150 patients (94 females and 56 males) with a mean age of 26.0 years (SD 7.4).
Methods
The pre-treatment lateral cephalometric radiographs of all patients were taken using a standardized procedure for evaluating the cranial structures. The cephalograms were obtained with the patients in a cephalostat with ear rods and a light source for adjustment of the head position (Orthopos DS Ceph®; Siemens, Erlangen, Germany). The film-focus distance was 150 cm and the distance from the midsagittal plane to the film was 10 cm, resulting in an enlargement factor of 15 per cent. All radiographs were of good quality and showed the craniofacial complex and the anatomy of the sella turcica. The images were calibrated and all linear measurements were corrected for magnification differences prior to statistical analyses.
The analyses of the radiographs were performed by an investigator using the fr-win® software (Computer konkret AG; Dental Software, Falkenstein, Germany) to guarantee maximum consistency of the results.
Analysis of the craniofacial complex. Analysis of the craniofacial complex was based on four angular and one linear measurement on each cephalogram (Figure 2) according to Rakosi (1988). The position of the maxilla and mandible was analysed by SNA and SNB angles. The skeletal configuration was defined by ANB angle and Wits appraisal. Furthermore, the angle between the anterior and posterior cranial bases (NSBa) was measured.
Analysis of the sella turcica. Analysis of the morphology of the sella turcica was made on the radiographs. According to Becktor et al. (2000), the sella turcica was classified into
Figure 1 Classification of the three types of the sella turcica: (A) oval, (B) circular, (C) flat.
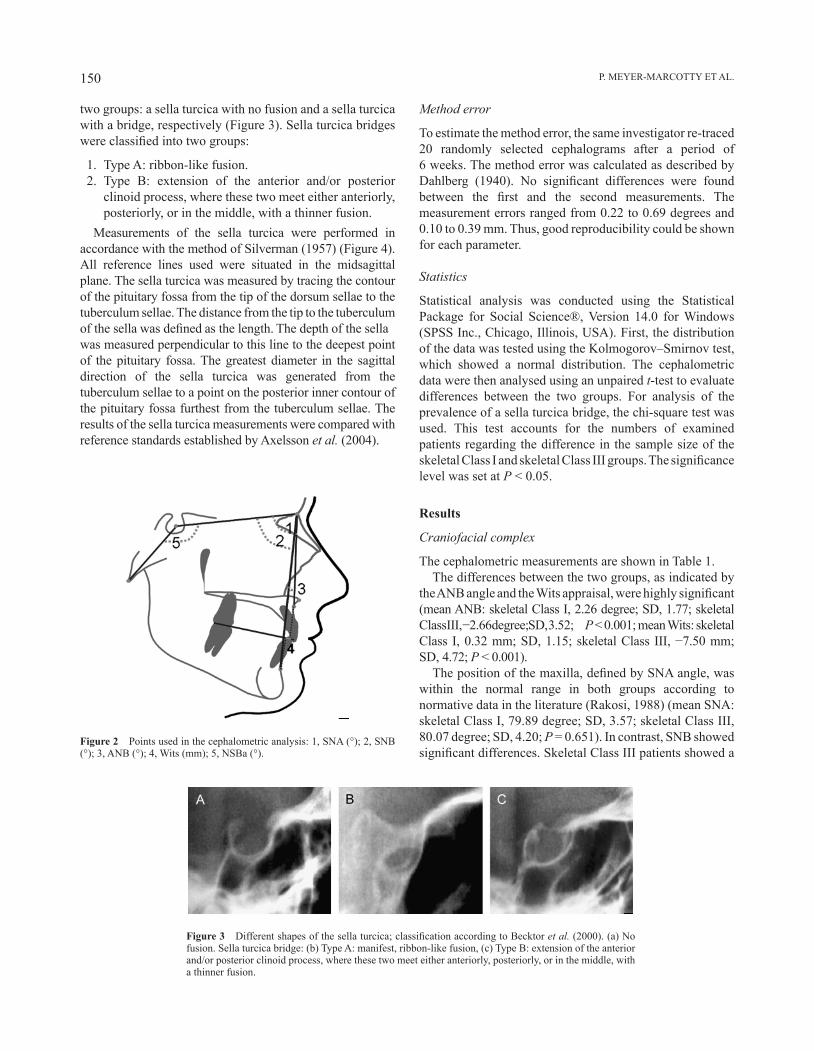
P. MEyER-MARCOTTy ET AL.150
two groups: a sella turcica with no fusion and a sella turcica with a bridge, respectively (Figure 3). Sella turcica bridges were classified into two groups:
1. Type A: ribbon-like fusion. 2. Type B: extension of the anterior and/or posterior
clinoid process, where these two meet either anteriorly, posteriorly, or in the middle, with a thinner fusion.
Measurements of the sella turcica were performed in accordance with the method of Silverman (1957) (Figure 4). All reference lines used were situated in the midsagittal plane. The sella turcica was measured by tracing the contour of the pituitary fossa from the tip of the dorsum sellae to the tuberculum sellae. The distance from the tip to the tuberculum of the sella was defined as the length. The depth of the sella was measured perpendicular to this line to the deepest point of the pituitary fossa. The greatest diameter in the sagittal direction of the sella turcica was generated from the tuberculum sellae to a point on the posterior inner contour of the pituitary fossa furthest from the tuberculum sellae. The results of the sella turcica measurements were compared with reference standards established by Axelsson et al. (2004).
Figure 2 Points used in the cephalometric analysis: 1, SNA (°); 2, SNB (°); 3, ANB (°); 4, Wits (mm); 5, NSBa (°).
Figure 3 Different shapes of the sella turcica; classification according to Becktor et al. (2000). (a) No fusion. Sella turcica bridge: (b) Type A: manifest, ribbon-like fusion, (c) Type B: extension of the anterior and/or posterior clinoid process, where these two meet either anteriorly, posteriorly, or in the middle, with a thinner fusion.
Method error
To estimate the method error, the same investigator re-traced 20 randomly selected cephalograms after a period of 6 weeks. The method error was calculated as described by Dahlberg (1940). No significant differences were found between the first and the second measurements. The measurement errors ranged from 0.22 to 0.69 degrees and 0.10 to 0.39 mm. Thus, good reproducibility could be shown for each parameter.
Statistics
Statistical analysis was conducted using the Statistical Package for Social Science®, Version 14.0 for Windows (SPSS Inc., Chicago, Illinois, USA). First, the distribution of the data was tested using the Kolmogorov–Smirnov test, which showed a normal distribution. The cephalometric data were then analysed using an unpaired t-test to evaluate differences between the two groups. For analysis of the prevalence of a sella turcica bridge, the chi-square test was used. This test accounts for the numbers of examined patients regarding the difference in the sample size of the skeletal Class I and skeletal Class III groups. The significance level was set at P < 0.05.
Results
Craniofacial complex
The cephalometric measurements are shown in Table 1.The differences between the two groups, as indicated by
the ANB angle and the Wits appraisal, were highly significant (mean ANB: skeletal Class I, 2.26 degree; SD, 1.77; skeletal Class III, −2.66 degree; SD, 3.52; P < 0.001; mean Wits: skeletal Class I, 0.32 mm; SD, 1.15; skeletal Class III, −7.50 mm; SD, 4.72; P < 0.001).
The position of the maxilla, defined by SNA angle, was within the normal range in both groups according to normative data in the literature (Rakosi, 1988) (mean SNA: skeletal Class I, 79.89 degree; SD, 3.57; skeletal Class III, 80.07 degree; SD, 4.20; P = 0.651). In contrast, SNB showed significant differences. Skeletal Class III patients showed a

151 BRIDGING OF THE SELLA TURCICA
Table 2 Shape of the sella turcica of the patients according to their skeletal class (Becktor et al., 2000); t-test.
Shape of the sella turcica bridge
Skeletal Class I (n = 150)
Skeletal Class III (n = 250)
P value
Type A Fusion 0.7% (1) 0.4% (1)Type B Extension of the clinoid processes
8.7% (13) 16.4% (41)
Percentage 9.4% (14) 16.8% (42) 0.031*
n.s., not significant. *P < 0.05.
Table 3 Dimensions of the sella turcica (mm) of the patients according to their skeletal class (Silverman, 1957); t-test.
Skeletal Class I (n = 150)
Skeletal Class III (n = 250)
P value
Mean (SD) Mean (SD)
Length (mm) 10.89 (1.62) 11.19 (1.65) 0.079 n.s.Depth (mm) 8.16 (1.15) 8.39 (1.30) 0.079 n.s.Diameter (mm) 12.99 (1.55) 13.05 (1.63) 0.864 n.s.
n.s., not significant.
Table 1 Cephalometric analysis of the craniofacial complex of the patients according to skeletal Class; t-test.
Variables Skeletal Class I (n = 150)
Skeletal Class III (n = 250)
P value
Mean (SD) Mean (SD)
SNA (°) 79.89 (3.57) 80.07 (4.20) 0.651 n.s.SNB (°) 77.62 (3.41) 82.73 (4.77) <0.001***ANB (°) 2.26 (1.77) −2.66 (3.52) <0.001***Wits (mm) 0.32 (1.15) −7.50 (4.72) <0.001***NSBa (°) 130.23 (4.10) 128.94 (5.28) 0.007**
n.s., not significant; **P < 0.01; ***P < 0.001.
patients, the frequency of an extension of the clinoid processes was increased in 16.4 per cent (n = 41) of the subjects.
Dimensions of the sella turcica
Linear measurements of the sella turcica are presented in Table 3.
No significant differences could be found between the skeletal Class I and the Class III patients concerning the length, depth, and diameter of the sella turcica.
A comparison of the measurements of females and males revealed no significant differences in terms of length, depth, and diameter of the sella turcica (Table 4).
Both patient groups presented greater sella turcica linear dimensions of length, depth, and diameter than those found in the normative data of sella turcica dimensions in adults (Axelsson et al., 2004).
Discussion
In this retrospective study, the shape of the sella turcica was analysed on pre-treatment standardized lateral cephalometric radiographs in two clear-cut groups of Caucasian subjects. The purpose of this study was to examine the prevalence of a sella turcica bridge in adult patients with skeletal Class I and Class III anomalies. Furthermore, the dimensions of the
Figure 4 Reference lines of the sella turcica according to Silverman (1957): (a) length of the sella, (b) depth of the sella, (c) greatest diameter of the sella.
more prognathic mandible than skeletal Class I patients (mean SNB: skeletal Class I, 77.62 degree; SD, 3.41; skeletal Class III, 82.73 degree; SD, 4.77; P < 0.001). Thus, the cephalometric data confirmed that the mandible was responsible for skeletal classification.
Additionally, the inclination of the base of the skull was slightly more pronounced in the skeletal Class III group than in the skeletal Class I group (mean NSBa: skeletal Class I, 130.23 degree; SD, 4.10; skeletal Class III, 128.94 degree; SD, 5.28; P = 0.007).
Shape of the sella turcica
Anomalies of the sella turcica were found in both groups (Table 2).
In 0.7 per cent (n = 1) of skeletal Class I patients, a manifest ribbon-like fusion of the sella turcica was detectable, while in 8.7 per cent (n = 13), extensions of the clinoid processes were evident. The overall rate of a sella turcica abnormality was thus 9.4 per cent.
Skeletal Class III patients showed a significantly higher rate of sella turcica anomalies, 16.8 per cent (P = 0.031). In 0.4 per cent (n = 1), a manifest ribbon-like fusion of the sella turcica was found. In contrast to skeletal Class I
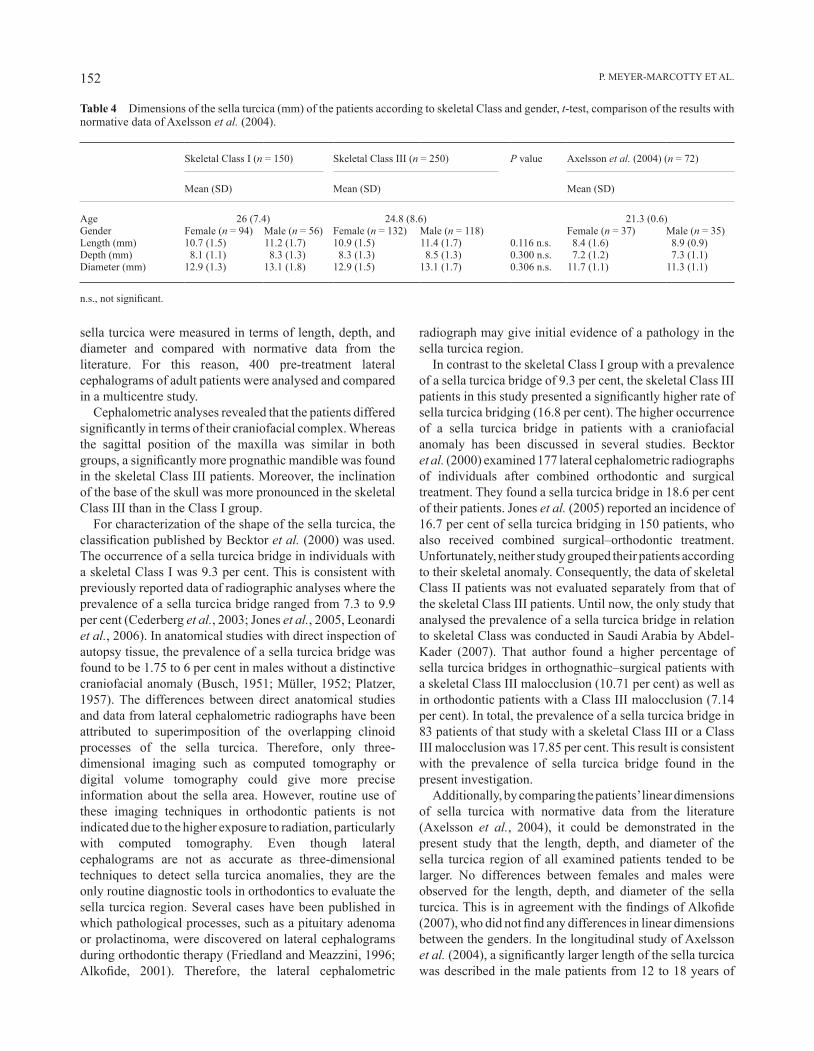
P. MEyER-MARCOTTy ET AL.152
sella turcica were measured in terms of length, depth, and diameter and compared with normative data from the literature. For this reason, 400 pre-treatment lateral cephalograms of adult patients were analysed and compared in a multicentre study.
Cephalometric analyses revealed that the patients differed significantly in terms of their craniofacial complex. Whereas the sagittal position of the maxilla was similar in both groups, a significantly more prognathic mandible was found in the skeletal Class III patients. Moreover, the inclination of the base of the skull was more pronounced in the skeletal Class III than in the Class I group.
For characterization of the shape of the sella turcica, the classification published by Becktor et al. (2000) was used. The occurrence of a sella turcica bridge in individuals with a skeletal Class I was 9.3 per cent. This is consistent with previously reported data of radiographic analyses where the prevalence of a sella turcica bridge ranged from 7.3 to 9.9 per cent (Cederberg et al., 2003; Jones et al., 2005, Leonardi et al., 2006). In anatomical studies with direct inspection of autopsy tissue, the prevalence of a sella turcica bridge was found to be 1.75 to 6 per cent in males without a distinctive craniofacial anomaly (Busch, 1951; Müller, 1952; Platzer, 1957). The differences between direct anatomical studies and data from lateral cephalometric radiographs have been attributed to superimposition of the overlapping clinoid processes of the sella turcica. Therefore, only three-dimensional imaging such as computed tomography or digital volume tomography could give more precise information about the sella area. However, routine use of these imaging techniques in orthodontic patients is not indicated due to the higher exposure to radiation, particularly with computed tomography. Even though lateral cephalograms are not as accurate as three-dimensional techniques to detect sella turcica anomalies, they are the only routine diagnostic tools in orthodontics to evaluate the sella turcica region. Several cases have been published in which pathological processes, such as a pituitary adenoma or prolactinoma, were discovered on lateral cephalograms during orthodontic therapy (Friedland and Meazzini, 1996; Alkofide, 2001). Therefore, the lateral cephalometric
radiograph may give initial evidence of a pathology in the sella turcica region.
In contrast to the skeletal Class I group with a prevalence of a sella turcica bridge of 9.3 per cent, the skeletal Class III patients in this study presented a significantly higher rate of sella turcica bridging (16.8 per cent). The higher occurrence of a sella turcica bridge in patients with a craniofacial anomaly has been discussed in several studies. Becktor et al. (2000) examined 177 lateral cephalometric radiographs of individuals after combined orthodontic and surgical treatment. They found a sella turcica bridge in 18.6 per cent of their patients. Jones et al. (2005) reported an incidence of 16.7 per cent of sella turcica bridging in 150 patients, who also received combined surgical–orthodontic treatment. Unfortunately, neither study grouped their patients according to their skeletal anomaly. Consequently, the data of skeletal Class II patients was not evaluated separately from that of the skeletal Class III patients. Until now, the only study that analysed the prevalence of a sella turcica bridge in relation to skeletal Class was conducted in Saudi Arabia by Abdel-Kader (2007). That author found a higher percentage of sella turcica bridges in orthognathic–surgical patients with a skeletal Class III malocclusion (10.71 per cent) as well as in orthodontic patients with a Class III malocclusion (7.14 per cent). In total, the prevalence of a sella turcica bridge in 83 patients of that study with a skeletal Class III or a Class III malocclusion was 17.85 per cent. This result is consistent with the prevalence of sella turcica bridge found in the present investigation.
Additionally, by comparing the patients’ linear dimensions of sella turcica with normative data from the literature (Axelsson et al., 2004), it could be demonstrated in the present study that the length, depth, and diameter of the sella turcica region of all examined patients tended to be larger. No differences between females and males were observed for the length, depth, and diameter of the sella turcica. This is in agreement with the findings of Alkofide (2007), who did not find any differences in linear dimensions between the genders. In the longitudinal study of Axelsson et al. (2004), a significantly larger length of the sella turcica was described in the male patients from 12 to 18 years of
Table 4 Dimensions of the sella turcica (mm) of the patients according to skeletal Class and gender, t-test, comparison of the results with normative data of Axelsson et al. (2004).
Skeletal Class I (n = 150) Skeletal Class III (n = 250) P value Axelsson et al. (2004) (n = 72)
Mean (SD) Mean (SD) Mean (SD)
Age 26 (7.4) 24.8 (8.6) 21.3 (0.6)Gender Female (n = 94) Male (n = 56) Female (n = 132) Male (n = 118) Female (n = 37) Male (n = 35)Length (mm) 10.7 (1.5) 11.2 (1.7) 10.9 (1.5) 11.4 (1.7) 0.116 n.s. 8.4 (1.6) 8.9 (0.9)Depth (mm) 8.1 (1.1) 8.3 (1.3) 8.3 (1.3) 8.5 (1.3) 0.300 n.s. 7.2 (1.2) 7.3 (1.1)Diameter (mm) 12.9 (1.3) 13.1 (1.8) 12.9 (1.5) 13.1 (1.7) 0.306 n.s. 11.7 (1.1) 11.3 (1.1)
n.s., not significant.
153 BRIDGING OF THE SELLA TURCICA
age, but in the adult group with a mean age of 21 years, no significant difference was found between the genders. Therefore, it can be assumed that there is no difference in sella turcica size between the genders.
Conclusion
The results of this study show that the prevalence of a sella turcica bridge is significantly greater in patients with a skeletal Class III malocclusion, thus confirming the hypothesis. No differences between females and males were found for the length, depth, and diameter of the sella turcica. Bridging of the sella turcica could be seen radiographically in skeletal Class III malocclusion subjects.
Address for correspondence
Dr Philipp Meyer-MarcottyDepartment of OrthodonticsDental Clinic of the Medical FacultyUniversity of WürzburgPleicherwall 2D-97070 WürzburgGermanyE-mail: [email protected]
ReferencesAbdel-Kader H M 2007 Sella turcica bridges in orthodontic and
orthognathic surgery patients. A retrospective cephalometric study. Australian Orthodontic Journal 23: 30–35
Alkofide E A 2001 Pituitary adenoma: a cephalometric finding. American Journal of Orthodontics and Dentofacial Orthopedics 120: 559–562
Alkofide E A 2007 The shape and size of the sella turcica in skeletal Class I, Class II, and Class III Saudi subjects. European Journal of Orthodontics 29: 457–463
Axelsson S, Storhaug K, Kjær I 2004 Post-natal size and morphology of the sella turcica. Longitudinal cephalometric standards for Norwegians between 6 and 21 years of age. European Journal of Orthodontics 26: 597–600
Becktor J P, Einersen S, Kjær I 2000 A sella turcica bridge in subjects with severe craniofacial deviations. European Journal of Orthodontics 22: 69–74
Busch W 1951 Die Morphologie der Sella turcica und ihre Beziehung zur Hypophyse. Virchows Archiv 320: 437–458
Camp J D 1923 The normal and pathologic anatomy of the sella turcica as revealed at necropsy. Radiology 1: 65–73
Cederberg R A, Benson B W, Nunn M, English J D 2003 Calcification of the interclinoid and petroclinoid ligaments of sella turcica: a radiographic study of the prevalence. Orthodontics & Craniofacial Research 6: 227–232
Childers N K, Wright J T 1986 Dental and craniofacial anomalies of Axenfeld- Rieger syndrome. Journal of Oral Pathology 15: 534–539
Dahlberg G 1940 Statistical methods for medical and biological students. Interscience Publications, New York
Friedland B, Meazzini C 1996 Incidental finding of an enlarged sella turcica on a lateral cephalogram. American Journal of Orthodontics and Dentofacial Orthopedics 110: 508–512
Gorlin R J, Pinborg J J, Cohen M M 1976 Syndromes of the head and neck, 2nd edn. McGraw-Hill, New york, pp. 649–651
Jones R M, Faqir A, Millett D T, Moos K F, McHugh S 2005 Bridging and dimensions of sella turcica in subjects treated by surgical-orthodontic means or orthodontics only. The Angle Orthodontist 75: 714–718
Kjær I, Keeling J W, Fischer-Hansen B 1999 The prenatal human cranium—normal and pathologic development. Munksgard, Copenhagen
Koshino T, Konno T, Ohzeki T 1989 Bone and joint manifestations of Rieger’s syndrome: a report of a family. Journal of Pediatric Orthopedics 9: 224–230
Leonardi R, Barbato E, Vichi M, Caltabiano M 2006 A sella turcica bridge in subjects with dental anomalies. European Journal of Orthodontics 28: 580–585
McLachlan M S, Wright A D, Doyle F H 1970 Plain film and tomographic assessment of the pituitary fossa in 140 acromegalic patients. British Journal of Radiology 43: 360–369
Meyer-Marcotty P, Weisschuh N, Dressler P, Hartmann J, Stellzig-Eisenhauer A 2008 Morphology of the sella turcica in Axenfeld-Rieger syndrome with PITX2 mutation. Journal of Oral Pathology & Medicine 37: 504–510
Müller F 1952 Die Bedeutung der Sellabrücke für das Auge. Klinische Monatsblätter für Augenheilkunde 120: 298–302
Platzer W 1957 Zur Anatomie der Sellabrücke und ihrer Beziehung zur A. carotis interna. Fortschritte auf dem Gebiet der Roentgenstrahlen und der Nuklearmedizin 87: 613–616
Pribram H W, du Boulay G H 1971 Sella turcica. In: Newton T H, Potts G P (eds). Radiology of skull and brain. vol. 1: The C.V. Mosby Company, St Louis, pp. 357–390
Rakosi T 1988 Atlas und Anleitung zur praktischen Fernröntgenanalyse. Hanser, München, Germany
Silverman F N 1957 Roentgen standards for size of the pituitary fossa from infancy through adolescence. American Journal of Roentgenology 78: 451–460
Taveras J M, Wood E H 1964 Diagnostic neuroradiology. Williams and Wilkins Co., Baltimore
Teal J S 1977 Radiology of the adult sella turcica. Bulletin of the Los Angeles Neurological Society 42: 111–174
younghusband O Z, Horrax G, Hurxthal L M 1952 Chromophobe pituitary tumors. Journal of Clinical Endocrinology and Metabolism 12: 611–616

European Journal of Orthodontics 32 (2010) 154–158 © The Author 2009. Published by Oxford University Press on behalf of the European Orthodontic Society.doi:10.1093/ejo/cjp083 All rights reserved. For permissions, please email: [email protected] Access Publication 9 September 2009
Introduction
Changes in the stress/strain distribution in the periodontium after the application of orthodontic forces trigger remodelling processes. Orthodontic forces create compression of the periodontal ligament (PDL) fibres and reduce the PDL space in the pressure area. At the tension site, PDL fibres are stretched depending on the magnitude of strain, and orthodontic force results in widening of the periodontal membrane (Thilander et al., 2000). As a result of remodelling of the PDL and the alveolar bone, tooth movement takes place (Henneman et al., 2008).
The magnitude of orthodontic force has received significant attention without considering its importance in relation to other characteristics of the force system and surface area of the PDL over which it is dissipated. Conflicting results have been reported in the literature regarding the relationship between the magnitude of force and the amount of tooth movement. Some authors suggest that application of heavy forces produces more tooth movement than light forces (Mitchell et al., 1973; Storey, 1973; Andreasen and Zwanziger, 1980), while Fortin (1971) claimed that the application of light forces resulted in more tooth movement than heavy forces. There is also another group of authors who consider that there is no association between force magnitude and the amount of tooth movement (Pilon et al., 1996; Owman-Moll et al., 1996a; Kyomen and Tanne, 1997; Melsen, 1999).
Different animals such as rats, rabbits, cats, and dogs have been used in experimental studies related to tooth movement (Kuitert et al., 1988; van de Velde et al., 1988; van Leeuwen et al., 1999; Ren et al., 2003b; von Böhl et al., 2004; Seifi et al., 2007; Deguchi et al., 2008).
Effects of force magnitude on tooth movement: an experimental
study in rabbits
Nihat Kılıç, Hüsamettin Oktay and Mustafa ErsözDepartment of Orthodontics, Faculty of Dentistry, Atatürk University, Erzurum, Turkey
SUMMARY The aim of the present study was to investigate the effects of two different force levels on the amount of total and daily tooth movement in rabbits and to determine whether any increase in tooth movement is equal to the increase in force. Forces of approximately 20 (group I) and 60 (group II) g (19.6 and 58.8 cN) were applied to the upper central incisors of 25 young adult (14 weeks of age) New Zealand female rabbits. The distance between the incisors was measured daily from the mid-levels of the crowns using a digital calliper for 20 days. Analysis of variance and Bonferroni multiple range test were used for statistical analyses.
The distance between the teeth in group II was significantly greater than that in group I during the first 3 days. Between days 4 and 14, no significant difference was observed. During the last 6 days, except for day 19, tooth movement in group II again increased, resulting in the distance between the teeth being greater in group II. The mean total opening was 3.98 ± 0.59 mm in group I and 4.82 ± 0.82 mm in group II, and the mean difference was approximately 0.8 mm.
The results of this study show that there was a close relationship between tooth movement and force magnitude. However, higher forces did not produce force-equal tooth movements.
In a recent literature review on force magnitude, Ren et al. (2003a) suggested that new studies are necessary in order to determine the relationship between force magnitude and subsequent tooth movement. In addition, no experimental study comparing daily tooth movement produced by different forces was found in the literature. Thus, the purpose of this study was to investigate the effects of two different force levels on the amount of total and daily tooth movement in rabbits and to determine the relationship between the magnitude of orthodontic force and subsequent tooth movement.
Materials and methods
The study protocol was approved by the Ethical Committee Board of the School of Dentistry, Atatürk University (Protocol Number is 2006/13).
Twenty-five young, healthy female New Zealand rabbits (mean age 14 weeks) were used. The rabbits were randomly divided into two experimental groups with 12 rabbits in group I and 13 rabbits in group II. The rabbits were individually housed in smooth-walled Macrolan cages and fed ad libitum with commercial pellets and water from thick-walled glass dishes. The mean weight of the animals was 2.19 ± 0.53 kg in group I and 2.32 ± 0.37 kg in group II at the beginning of the experiment.
The animals in each group were anaesthetized at the first session by an intramuscular injection of ketamine (37.5 mg/kg) and xylazine (5 mg/kg). A small notch was made with a bur on the labial surface of the upper first incisors at 1.5–2 mm above the gingival margin and then the notches were drilled in a vestibulo-palatal direction by means of a bur. Cooling was achieved with a syringe filled with physiologic saline.
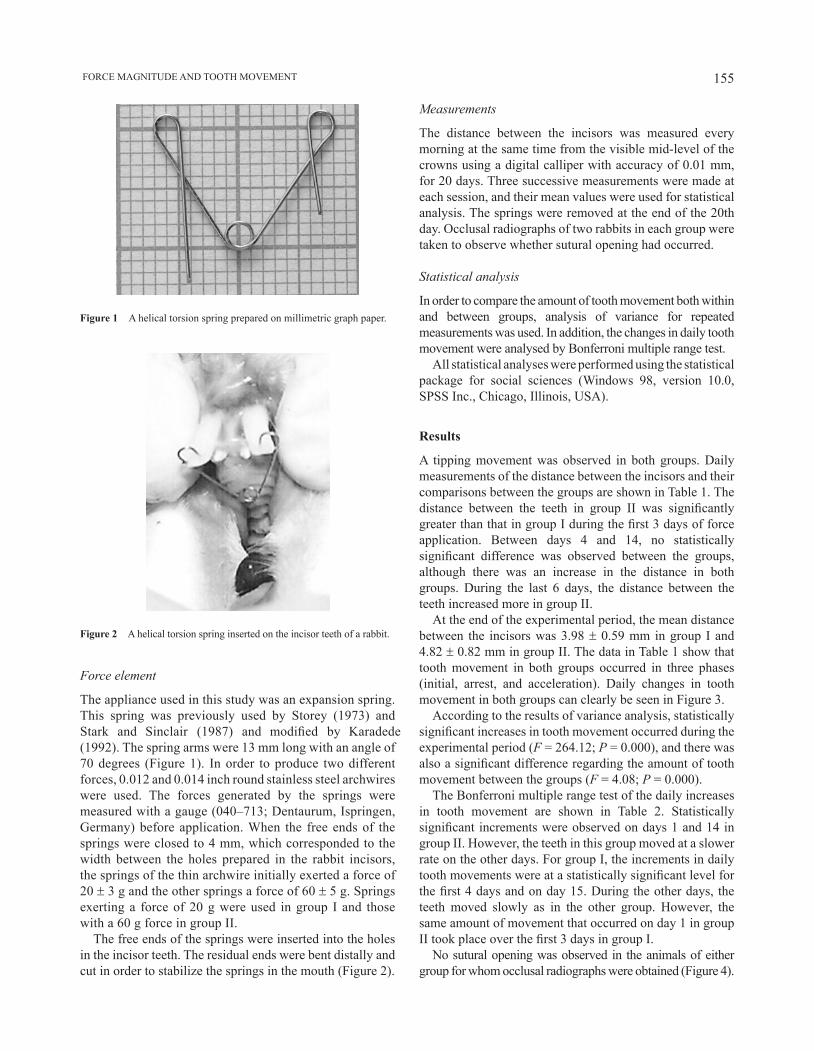
155 FORCE MAGNITUDE AND TOOTH MOVEMENT
Figure 2 A helical torsion spring inserted on the incisor teeth of a rabbit.
Force element
The appliance used in this study was an expansion spring. This spring was previously used by Storey (1973) and Stark and Sinclair (1987) and modified by Karadede (1992). The spring arms were 13 mm long with an angle of 70 degrees (Figure 1). In order to produce two different forces, 0.012 and 0.014 inch round stainless steel archwires were used. The forces generated by the springs were measured with a gauge (040–713; Dentaurum, Ispringen, Germany) before application. When the free ends of the springs were closed to 4 mm, which corresponded to the width between the holes prepared in the rabbit incisors, the springs of the thin archwire initially exerted a force of 20 ± 3 g and the other springs a force of 60 ± 5 g. Springs exerting a force of 20 g were used in group I and those with a 60 g force in group II.
The free ends of the springs were inserted into the holes in the incisor teeth. The residual ends were bent distally and cut in order to stabilize the springs in the mouth (Figure 2).
Figure 1 A helical torsion spring prepared on millimetric graph paper.
Measurements
The distance between the incisors was measured every morning at the same time from the visible mid-level of the crowns using a digital calliper with accuracy of 0.01 mm, for 20 days. Three successive measurements were made at each session, and their mean values were used for statistical analysis. The springs were removed at the end of the 20th day. Occlusal radiographs of two rabbits in each group were taken to observe whether sutural opening had occurred.
Statistical analysis
In order to compare the amount of tooth movement both within and between groups, analysis of variance for repeated measurements was used. In addition, the changes in daily tooth movement were analysed by Bonferroni multiple range test.
All statistical analyses were performed using the statistical package for social sciences (Windows 98, version 10.0, SPSS Inc., Chicago, Illinois, USA).
Results
A tipping movement was observed in both groups. Daily measurements of the distance between the incisors and their comparisons between the groups are shown in Table 1. The distance between the teeth in group II was significantly greater than that in group I during the first 3 days of force application. Between days 4 and 14, no statistically significant difference was observed between the groups, although there was an increase in the distance in both groups. During the last 6 days, the distance between the teeth increased more in group II.
At the end of the experimental period, the mean distance between the incisors was 3.98 ± 0.59 mm in group I and 4.82 ± 0.82 mm in group II. The data in Table 1 show that tooth movement in both groups occurred in three phases (initial, arrest, and acceleration). Daily changes in tooth movement in both groups can clearly be seen in Figure 3.
According to the results of variance analysis, statistically significant increases in tooth movement occurred during the experimental period (F = 264.12; P = 0.000), and there was also a significant difference regarding the amount of tooth movement between the groups (F = 4.08; P = 0.000).
The Bonferroni multiple range test of the daily increases in tooth movement are shown in Table 2. Statistically significant increments were observed on days 1 and 14 in group II. However, the teeth in this group moved at a slower rate on the other days. For group I, the increments in daily tooth movements were at a statistically significant level for the first 4 days and on day 15. During the other days, the teeth moved slowly as in the other group. However, the same amount of movement that occurred on day 1 in group II took place over the first 3 days in group I.
No sutural opening was observed in the animals of either group for whom occlusal radiographs were obtained (Figure 4).
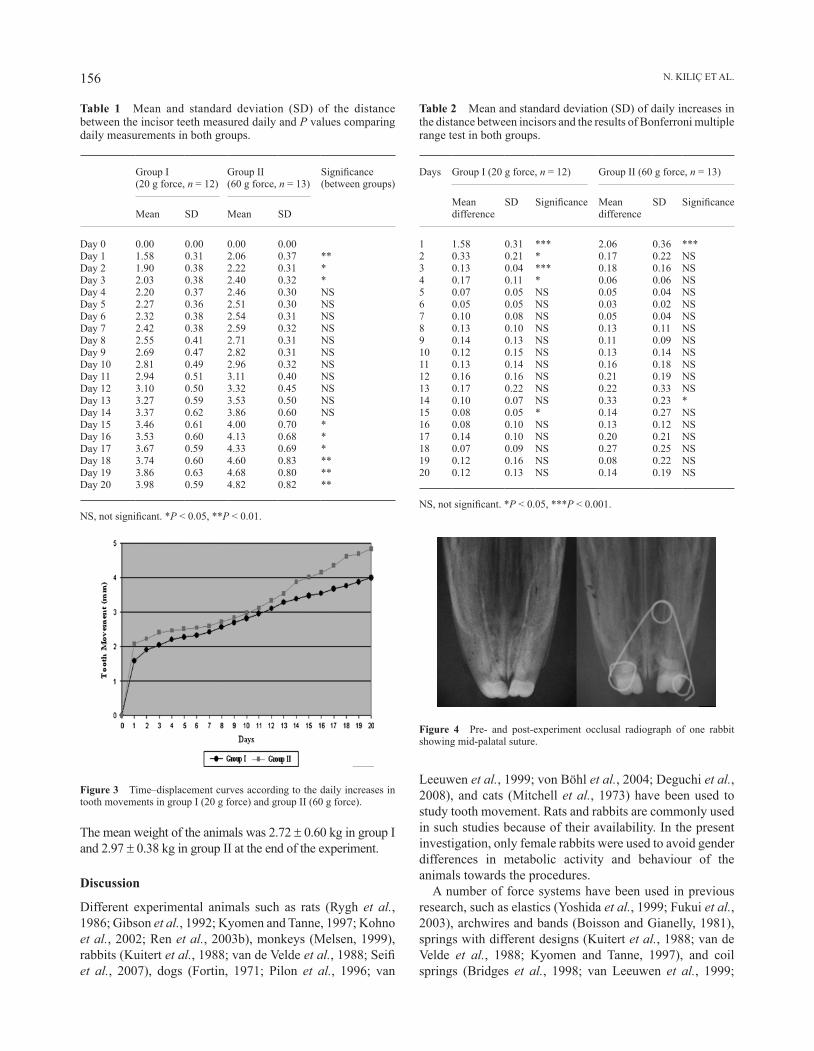
N. KILIç ET AL.156
The mean weight of the animals was 2.72 ± 0.60 kg in group I and 2.97 ± 0.38 kg in group II at the end of the experiment.
Discussion
Different experimental animals such as rats (Rygh et al., 1986; Gibson et al., 1992; Kyomen and Tanne, 1997; Kohno et al., 2002; Ren et al., 2003b), monkeys (Melsen, 1999), rabbits (Kuitert et al., 1988; van de Velde et al., 1988; Seifi et al., 2007), dogs (Fortin, 1971; Pilon et al., 1996; van
Leeuwen et al., 1999; von Böhl et al., 2004; Deguchi et al., 2008), and cats (Mitchell et al., 1973) have been used to study tooth movement. Rats and rabbits are commonly used in such studies because of their availability. In the present investigation, only female rabbits were used to avoid gender differences in metabolic activity and behaviour of the animals towards the procedures.
A number of force systems have been used in previous research, such as elastics (Yoshida et al., 1999; Fukui et al., 2003), archwires and bands (Boisson and Gianelly, 1981), springs with different designs (Kuitert et al., 1988; van de Velde et al., 1988; Kyomen and Tanne, 1997), and coil springs (Bridges et al., 1998; van Leeuwen et al., 1999;
Table 1 Mean and standard deviation (SD) of the distance between the incisor teeth measured daily and P values comparing daily measurements in both groups.
Group I (20 g force, n = 12)
Group II (60 g force, n = 13)
Significance (between groups)
Mean SD Mean SD
Day 0 0.00 0.00 0.00 0.00Day 1 1.58 0.31 2.06 0.37 **Day 2 1.90 0.38 2.22 0.31 *Day 3 2.03 0.38 2.40 0.32 *Day 4 2.20 0.37 2.46 0.30 NSDay 5 2.27 0.36 2.51 0.30 NSDay 6 2.32 0.38 2.54 0.31 NSDay 7 2.42 0.38 2.59 0.32 NSDay 8 2.55 0.41 2.71 0.31 NSDay 9 2.69 0.47 2.82 0.31 NSDay 10 2.81 0.49 2.96 0.32 NSDay 11 2.94 0.51 3.11 0.40 NSDay 12 3.10 0.50 3.32 0.45 NSDay 13 3.27 0.59 3.53 0.50 NSDay 14 3.37 0.62 3.86 0.60 NSDay 15 3.46 0.61 4.00 0.70 *Day 16 3.53 0.60 4.13 0.68 *Day 17 3.67 0.59 4.33 0.69 *Day 18 3.74 0.60 4.60 0.83 **Day 19 3.86 0.63 4.68 0.80 **Day 20 3.98 0.59 4.82 0.82 **
NS, not significant. *P < 0.05, **P < 0.01.
Figure 3 Time–displacement curves according to the daily increases in tooth movements in group І (20 g force) and group ІІ (60 g force).
Table 2 Mean and standard deviation (SD) of daily increases in the distance between incisors and the results of Bonferroni multiple range test in both groups.
Days Group I (20 g force, n = 12) Group II (60 g force, n = 13)
Mean difference
SD Significance Mean difference
SD Significance
1 1.58 0.31 *** 2.06 0.36 ***2 0.33 0.21 * 0.17 0.22 NS3 0.13 0.04 *** 0.18 0.16 NS4 0.17 0.11 * 0.06 0.06 NS5 0.07 0.05 NS 0.05 0.04 NS6 0.05 0.05 NS 0.03 0.02 NS7 0.10 0.08 NS 0.05 0.04 NS8 0.13 0.10 NS 0.13 0.11 NS9 0.14 0.13 NS 0.11 0.09 NS10 0.12 0.15 NS 0.13 0.14 NS11 0.13 0.14 NS 0.16 0.18 NS12 0.16 0.16 NS 0.21 0.19 NS13 0.17 0.22 NS 0.22 0.33 NS14 0.10 0.07 NS 0.33 0.23 *15 0.08 0.05 * 0.14 0.27 NS16 0.08 0.10 NS 0.13 0.12 NS17 0.14 0.10 NS 0.20 0.21 NS18 0.07 0.09 NS 0.27 0.25 NS19 0.12 0.16 NS 0.08 0.22 NS20 0.12 0.13 NS 0.14 0.19 NS
NS, not significant. *P < 0.05, ***P < 0.001.
Figure 4 Pre- and post-experiment occlusal radiograph of one rabbit showing mid-palatal suture.
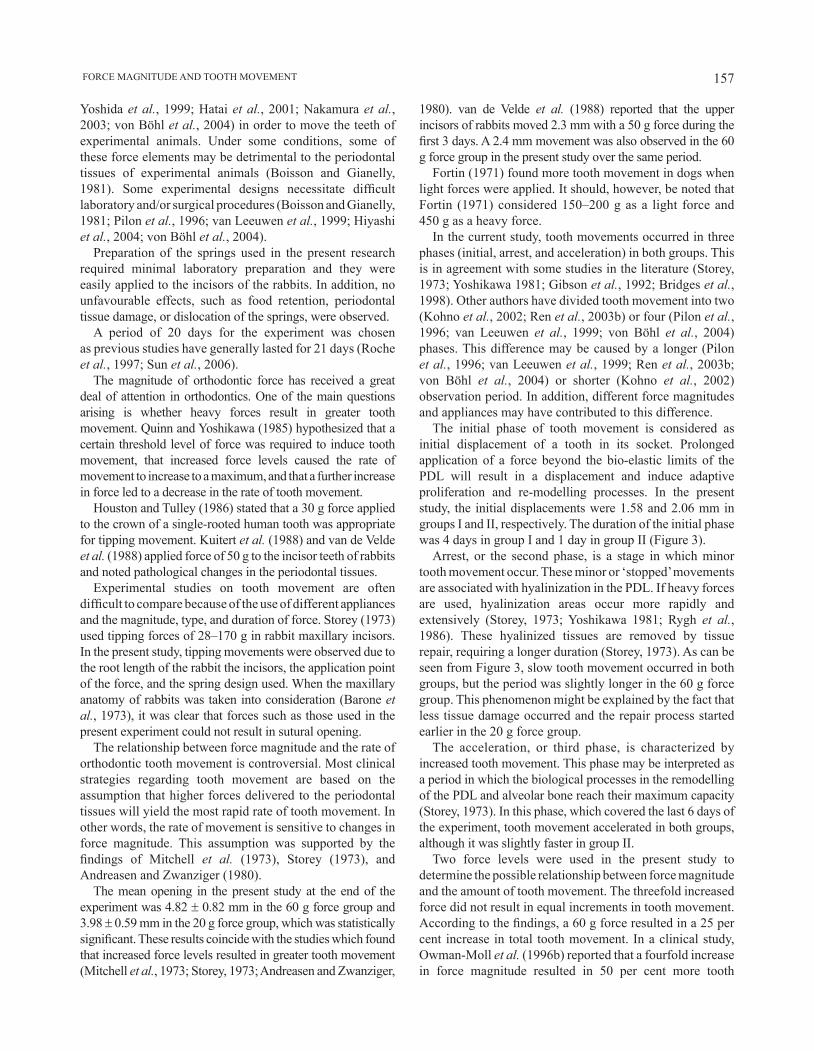
157 FORCE MAGNITUDE AND TOOTH MOVEMENT
Yoshida et al., 1999; Hatai et al., 2001; Nakamura et al., 2003; von Böhl et al., 2004) in order to move the teeth of experimental animals. Under some conditions, some of these force elements may be detrimental to the periodontal tissues of experimental animals (Boisson and Gianelly, 1981). Some experimental designs necessitate difficult laboratory and/or surgical procedures (Boisson and Gianelly, 1981; Pilon et al., 1996; van Leeuwen et al., 1999; Hiyashi et al., 2004; von Böhl et al., 2004).
Preparation of the springs used in the present research required minimal laboratory preparation and they were easily applied to the incisors of the rabbits. In addition, no unfavourable effects, such as food retention, periodontal tissue damage, or dislocation of the springs, were observed.
A period of 20 days for the experiment was chosen as previous studies have generally lasted for 21 days (Roche et al., 1997; Sun et al., 2006).
The magnitude of orthodontic force has received a great deal of attention in orthodontics. One of the main questions arising is whether heavy forces result in greater tooth movement. Quinn and Yoshikawa (1985) hypothesized that a certain threshold level of force was required to induce tooth movement, that increased force levels caused the rate of movement to increase to a maximum, and that a further increase in force led to a decrease in the rate of tooth movement.
Houston and Tulley (1986) stated that a 30 g force applied to the crown of a single-rooted human tooth was appropriate for tipping movement. Kuitert et al. (1988) and van de Velde et al. (1988) applied force of 50 g to the incisor teeth of rabbits and noted pathological changes in the periodontal tissues.
Experimental studies on tooth movement are often difficult to compare because of the use of different appliances and the magnitude, type, and duration of force. Storey (1973) used tipping forces of 28–170 g in rabbit maxillary incisors. In the present study, tipping movements were observed due to the root length of the rabbit the incisors, the application point of the force, and the spring design used. When the maxillary anatomy of rabbits was taken into consideration (Barone et al., 1973), it was clear that forces such as those used in the present experiment could not result in sutural opening.
The relationship between force magnitude and the rate of orthodontic tooth movement is controversial. Most clinical strategies regarding tooth movement are based on the assumption that higher forces delivered to the periodontal tissues will yield the most rapid rate of tooth movement. In other words, the rate of movement is sensitive to changes in force magnitude. This assumption was supported by the findings of Mitchell et al. (1973), Storey (1973), and Andreasen and Zwanziger (1980).
The mean opening in the present study at the end of the experiment was 4.82 ± 0.82 mm in the 60 g force group and 3.98 ± 0.59 mm in the 20 g force group, which was statistically significant. These results coincide with the studies which found that increased force levels resulted in greater tooth movement (Mitchell et al., 1973; Storey, 1973; Andreasen and Zwanziger,
1980). van de Velde et al. (1988) reported that the upper incisors of rabbits moved 2.3 mm with a 50 g force during the first 3 days. A 2.4 mm movement was also observed in the 60 g force group in the present study over the same period.
Fortin (1971) found more tooth movement in dogs when light forces were applied. It should, however, be noted that Fortin (1971) considered 150–200 g as a light force and 450 g as a heavy force.
In the current study, tooth movements occurred in three phases (initial, arrest, and acceleration) in both groups. This is in agreement with some studies in the literature (Storey, 1973; Yoshikawa 1981; Gibson et al., 1992; Bridges et al., 1998). Other authors have divided tooth movement into two (Kohno et al., 2002; Ren et al., 2003b) or four (Pilon et al., 1996; van Leeuwen et al., 1999; von Böhl et al., 2004) phases. This difference may be caused by a longer (Pilon et al., 1996; van Leeuwen et al., 1999; Ren et al., 2003b; von Böhl et al., 2004) or shorter (Kohno et al., 2002) observation period. In addition, different force magnitudes and appliances may have contributed to this difference.
The initial phase of tooth movement is considered as initial displacement of a tooth in its socket. Prolonged application of a force beyond the bio-elastic limits of the PDL will result in a displacement and induce adaptive proliferation and re-modelling processes. In the present study, the initial displacements were 1.58 and 2.06 mm in groups I and II, respectively. The duration of the initial phase was 4 days in group I and 1 day in group II (Figure 3).
Arrest, or the second phase, is a stage in which minor tooth movement occur. These minor or ‘stopped’ movements are associated with hyalinization in the PDL. If heavy forces are used, hyalinization areas occur more rapidly and extensively (Storey, 1973; Yoshikawa 1981; Rygh et al., 1986). These hyalinized tissues are removed by tissue repair, requiring a longer duration (Storey, 1973). As can be seen from Figure 3, slow tooth movement occurred in both groups, but the period was slightly longer in the 60 g force group. This phenomenon might be explained by the fact that less tissue damage occurred and the repair process started earlier in the 20 g force group.
The acceleration, or third phase, is characterized by increased tooth movement. This phase may be interpreted as a period in which the biological processes in the remodelling of the PDL and alveolar bone reach their maximum capacity (Storey, 1973). In this phase, which covered the last 6 days of the experiment, tooth movement accelerated in both groups, although it was slightly faster in group II.
Two force levels were used in the present study to determine the possible relationship between force magnitude and the amount of tooth movement. The threefold increased force did not result in equal increments in tooth movement. According to the findings, a 60 g force resulted in a 25 per cent increase in total tooth movement. In a clinical study, Owman-Moll et al. (1996b) reported that a fourfold increase in force magnitude resulted in 50 per cent more tooth
N. KILIç ET AL.158
movement. In another study, however, Owman-Moll et al. (1996a) applied forces of 50 and 100 cN, which resulted in tooth movements of 4.3 and 4.5 mm, respectively.
Conclusion
The findings of the present study show that the amount of tooth movement is related to force magnitude, but the increments in total tooth movement are not equal to the increases in force magnitude.
Address for correspondence
Dr Nihat Kiliç Atatürk Üniversitesi Diş Hekimliği Fakültesi Ortodonti Anabilim Dalı 25240-Erzurum Turkey E-mail: [email protected]
ReferencesAndreasen G F, Zwanziger D 1980 A clinical evaluation of the differential
force concept as applied to the edgewise bracket. American Journal of Orthodontics 78: 25–40
Barone R, Pavaux C, Blin P C, Cuq P 1973 Atlas d’anatomie du lapin. Masson & Cleéditeur, Paris, pp. 7–11
Boisson M, Gianelly A A 1981 Collagen synthesis in rat gingiva during tooth movement. American Journal of Orthodontics 80: 289–299
Bridges T, King G, Mohammed A 1998 The effect of age on tooth movement and mineral density in the alveolar tissues of the rat. American Journal of Orthodontics and Dentofacial Orthopedics 93: 245–250
Deguchi T, Takano-Yamamoto T, Yabuuchi T, Ando R, Roberts W E, Garetto L P 2008 Histomorphometric evaluation of alveolar bone turnover between the maxilla and the mandible during experimental tooth movement in dogs. American Journal of Orthodontics and Dentofacial Orthopedics 133: 889–897
Fortin J M 1971 Translation of premolars in the dog by controlling the moment-to-force ratio on the crown. American Journal of Orthodontics 59: 541–551
Fukui T, Yamene A, Komatsu K, Chiba M 2003 Restoration of mechanical strength and morphological features of the periodontal ligament following orthodontic retention in the rat mandibular first molar. European Journal of Orthodontics 25: 167–174
Gibson J M, King G J, Keeling S D 1992 Long-term orthodontic tooth movement response to short-term force in the rat. Angle Orthodontist 62: 211–215
Hatai T et al. 2001 Apoptosis of periodontal ligament cells induced by mechanical stress during tooth movement. Oral Diseases 7: 287–290
Henneman S, Von den Hoff J W, Maltha J C 2008 Mechanobiology of tooth movement. European Journal of Orthodontics 30: 299–306
Hiyashi H, Konoo T, Yamaguchi K 2004 Intermittent 8-hour activation in orthodontic molar movement. American Journal of Orthodontics and Dentofacial Orthopedics 125: 302–309
Houston W J B, Tulley W J 1986 A textbook of orthodontics. IOP Publishing Ltd, Bristol, pp. 194–202
Karadede I 1992 Düşük doz aspirinin deneysel ortodontik diş hareketleri üzerine olan etkisinin sıçanlarda incelenmesi. Thesis, Dicle University, Diyarbakır, Turkey
Kohno T, Matsumoto Y, Kanno Z, Warita H, Soma K 2002 Experimental tooth movement under light orthodontic forces. Rates of tooth movement and changes of the periodontium. Journal of Orthodontics 29: 126–129
Kuitert R B, van de Velde J P, Hoeksma J B, Prahl-Andersen B 1988 Tissue changes in the rabbit periodontal ligament during orthodontic tooth movement. Acta Morphologica Neerlando-Scandinavica 26: 191–206
Kyomen S, Tanne K 1997 Influences of aging changes in proliferative rate of PDL cells during experimental tooth movement in rats. Angle Orthodontist 67: 67–72
Melsen B 1999 Biological reaction of alveolar bone to orthodontic tooth movement. Angle Orthodontist 69: 151–158
Mitchell D L, Boone R M, Ferguson J H 1973 Correation of tooth movement with variable forces in the cat. Angle Orthodontist 43: 154–161
Nakamura Y et al. 2003 Calcification of degenerating tissues in the periodontal ligament during tooth movement. Journal of Periodontal Research 38: 343–350
Owman-Moll P, Kurol J, Lundgren D 1996a Effects of a doubled orthodontic force magnitude on tooth movement and root resorptions. An inter-individual study in adolescents. European Journal of Orthodontics 18: 141–150
Owman-Moll P, Kurol J, Lundgren D 1996b The effects of a four-fold increased orthodontic force magnitude on tooth movement and root resorptions. An intra-individual study in adolescents. European Journal of Orthodontics 18: 287–294
Pilon J J G M, Kuijpers-Jagtman A M, Maltha J C 1996 Magnitude of orthodontic forces and rate of bodily tooth movement. An experimental study. American Journal of Orthodontics and Dentofacial Orthopedics 110: 16–23
Quinn R S, Yoshikawa D K 1985 A reassessment of force magnitude in orthodontics. American Journal of Orthodontics 88: 252–260
Ren Y, Maltha J C, Kuijpers-Jagtman A M 2003a Optimum force magnitude for orthodontic tooth movement: a systematic literature review. Angle Orthodontist 73: 86–92
Ren Y, Maltha J C, Van’t Hof M A, Kuijpers-Jagtman A M 2003b Age effect on orthodontic tooth movement in rats. Journal of Dental Research 82: 38–42
Roche J J, Cisneros G J, Acs G 1997 The effect of acetaminophen on tooth movement in rabbits. Angle Orthodontist 67: 231–236
Rygh P, Bowling K, Hovlandsdal L, Williams S 1986 Activation of the vascular system: a main mediator of periodontal fiber remodeling in orthodontic tooth movement. American Journal of Orthodontics 89: 453–468
Seifi M, Shafeei H A, Daneshdoost S, Mir M 2007 Effects of two types of low-level laser wave lengths (850 and 630 nm) on the orthodontic tooth movements in rabbits. Lasers in Medical Science 22: 261–264
Stark T M, Sinclair P M 1987 Effect of pulsed electromagnetic fields on orthodontic tooth movement. American Journal of Orthodontics and Dentofacial Orthopedics 91: 91–104
Storey E 1973 The nature of tooth movement. American Journal of Orthodontics 63: 292–314
Sun X H, Wang R, Zhang X Y 2006 Effects of He-Ne laser irradiation on the expression of transforming growth factor beta1 during experimental tooth movement in rabbits. Shanghai Kou Qiang Yi Xue 15: 52–57
Thilander B, Rygh P, Reitan K 2000 Tissue reactions in orthodontics. In: Graber T M (ed). Orthodontics: current principles and techniques. C V Mosby, St Louis, pp. 117–156
van de Velde J P, Kuitert R B, van Ginkel F C, Prahl-Andersen B 1988 Histologic reactions in gingival and alveolar tissues during tooth movement in rabbits. European Journal of Orthodontics 10: 296–308
van Leeuwen E J, Maltha J C, Kuijpers-Jagman A M 1999 Tooth movement with light continuous and discontinuous forces in beagle dogs. European Journal of Oral Science 107: 468–474
von Böhl M, Maltha J, von den Hoff H V, Kuijpers-Jagtman A M 2004 Changes in the periodontal ligament after experimental tooth movement using high and low continuous forces in beagle dogs. Angle Orthodontist 74: 16–25
Yoshida Y, Sasaki T, Yokoya K, Hiraide T, Shibasaki Y 1999 Cellular roles in relapse processes of experimentally-moved rat molars. Journal of Electron Microscopy (Tokyo) 48: 147–157
Yoshikawa D K 1981 Biomechanical principles of tooth movement. Dental Clinics of North America 25: 19–26
European Journal of Orthodontics 32 (2010) 159–164 © The Author 2009. Published by Oxford University Press on behalf of the European Orthodontic Society.doi:10.1093/ejo/cjp089 All rights reserved. For permissions, please email: [email protected] Access Publication 4 October 2009
Introduction
Orthodontic intrusion of the anterior dentition is indicated for the management of a deep overbite, especially in subjects where bite opening with eruption of posterior teeth is contraindicated. The functional evaluation of the upper gingival line in relation to the upper lip indicates whether the maxillary or mandibular anterior teeth should be intruded (Zachrisson, 1998; Sarver, 2001).
Two major orthodontic intrusion techniques for the maxillary anterior dentition have been developed: the segmented arch (Burstone, 1962, 1966, 1977) and the bioprogressive (Ricketts, 1976; Ricketts et al., 1979). Both use intrusion arches with anchorage on posterior teeth but with different wire composition, shape, and point of force application. Additionally, the introduction of reverse curve of Spee NiTi archwires allowed for an alternative method of incisor intrusion.
Currently, a few clinical trials have evaluated variables such as side-effects (Otto et al., 1980; McFadden et al., 1989; Costopoulos and Nanda, 1996; van Steenbergen et al., 2004, 2006), force magnitude (Goerigk et al., 1992; van Steenbergen et al., 2005a), and application point of the intrusive force (van Steenbergen et al., 2005b) for the
bioprogressive or the segmented arch techniques. A limited number of studies have also compared the segmented (Weiland et al., 1996) or Ricketts (Dake and Sinclair, 1989) technique with a continuous archwire technique, whereas one study focused on incisor intrusion in patients with marginal bone loss using both techniques (Melsen et al., 1989). Nonetheless, there is a lack of evidence on the quantitative assessment of forces and moments of intrusion systems, especially the effect of reverse curve NiTi archwires on the anterior segment of the maxillary dental arch.
The aim of this study was to comparatively evaluate the intrusive forces and torquing moments generated during anterior maxillary intrusion between the various intrusion techniques.
Materials and methods
Experimental apparatus and configuration
The orthodontic measurement and simulation system (OMSS) was used for the ex vivo evaluation of the different intrusion mechanics (Bourauel et al., 1992). The OMSS is based on the principle of the two-tooth model and allows
A comparative assessment of the forces and moments generated
with various maxillary incisor intrusion biomechanics
Iosif Sifakakis*, Nikolaos Pandis**, Margarita Makou*, Theodore Eliades*** and Christoph Bourauel***Department of Orthodontics, School of Dentistry, University of Athens, Greece, **Department of Oral Technology, School of Dentistry, University of Bonn, Germany and ***Department of Orthodontics, School of Dentistry, Aristotle University of Thessaloniki, Greece
SUMMARY The aim of this study was to comparatively evaluate the intrusive forces and buccolingual torquing moments generated during anterior maxillary intrusion using different maxillary incisor intrusion mechanics. Five wire specimens were used for each of the following intrusive arches: blue Elgiloy utility arch 0.016 × 0.016 inch, TMA utility arch 0.017 × 0.025 inch, Burstone TMA intrusion arch 0.017 × 0.025 inch, and reverse curve of Spee NiTi 0.016 × 0.022 inch. The wires were inserted on bracketed dental arches constructed on maxillary Frasaco models, segmented mesially to the maxillary canines. Simulated intrusion from 0.0 to 3 mm was performed using the orthodontic measurement and simulation system (OMSS), and forces and moments were recorded in the sagittal plane at 0.1 mm vertical displacement increments. All measurements were repeated five times for each specimen and values recorded at 1.5 mm for all wires were used for statistical evaluations. The results were analysed with one-way analysis of variance with forces and moments serving as the dependent variables and wire type as the independent variable. Post hoc multiple comparisons were performed using the Tukey test (0.05 error rate).
Comparison of the two major intrusion techniques for the maxillary anterior teeth, segmented and bioprogressive, revealed that the Burstone TMA 0.017 × 0.025 inch intrusion arch exerted the lowest force on the incisors (0.99 N), followed by the TMA utility 0.017 × 0.025 inch (1.33 N) and the blue Elgiloy 0.016 × 0.016 inch utility (1.43 N). The highest force was recorded for the reverse curve of Spee NiTi and exceeded the value of 9 N. The lowest buccolingual moments were recorded with the Burstone intrusion arch (2.47 Nmm), whereas the highest was registered for the utility arch constructed with a 0.017 × 0.025 inch TMA wire (7.31 Nmm).

I. SIFAkAkIS ET Al.160
the measurement of all forces and moments acting on two regions simultaneously. For this purpose, the OMSS has two stepping motor-driven positioning tables equipped with force/moment transducers, monitored by a personal computer that controls the measurements. Measurements are recorded of the forces–moments generated by an orthodontic appliance, when the positioning tables are moved along a specified path (Drescher et al., 1991).
An acrylic Frasaco model was constructed for the maxillary jaw, with an ideal, levelled, and aligned, dental arch. The first and second molars on the model were bonded with 0.018 inch slot tubes with 0 degrees angulation/torque/distal offset and 0.018 inch slot brackets were placed on the rest of the teeth (Forestadent, Pforzheim, Germany). Each model was split into two segments after bracket placement: the anterior segment, which included the four incisors and the posterior segment, which included the teeth from the canine to the first molar. An appropriate adaptor was fixed on each of these model segments in order to make them mountable on the positioning tables of the OMSS (Figure 1). A straight 0.018 × 0.025 inch stainless steel archwire was subsequently ligated to the two segments and they were both mounted on the positioning tables of the OMSS. An adjustment of the system was conducted with the straightwire in place, so that all forces–moments generated were nullified in this configuration.
In the absolute measurement mode, the dental arch was initially levelled. During the measurement procedure for the utility and the Burstone intrusion arches, the anterior segment was gradually extruded up to 3 mm and afterwards intruded to its initial position. The forces/moments generated in the anterior segment were measured three dimensionally
in 0.1 mm steps. During the measurement cycle for the reverse NiTi arches, the extrusion path of the anterior positioning table was reduced to 1.5 mm in order to avoid bracket failure due to the high magnitudes of forces and moments generated with 3 mm activation.
Materials
The following intrusion arches were evaluated with the absolute measurement system, as regards the forces–moments generated in the anterior maxillary segment:
1. Utility arch 0.016 × 0.016 inch Blue Elgiloy® [Rocky Mountain Orthodontics (RMO), Denver, Colorado, USA)].
2. A utility arch constructed with a 0.017 × 0.025 inch TMA® (Ormco, Glendora, California, USA).
3. Burstone intrusion arch constructed with 0.017 × 0.025 inch TMA® (Ormco), ligated distal to the lateral incisors, and gingivally of the anterior sectional wire.
4. Reverse curve of Spee NiTi 0.016 × 0 .022 inch (Nitinol SE, RMO).
Five utility and five Burstone intrusion arches were fabricated by the first author for each of the above-mentioned combinations. Additionally, five prefabricated reverse curve NiTi archwires were used on the maxillary arch. Each of the wire specimens was used five times; during the measurements of the NiTi wires, the temperature in the OMSS chamber was kept constant at 36.6°C.
The segmented intrusion arches were constructed according to the specifications given by Burstone (1977). The 3 mm helix of the intrusion arch was wound and placed mesial to the molar tube. The diameter of the helix was measured with a digital calliper (Mitutoyo, Japan), and a 45 degree molar tip-back was incorporated in to the wire, whereas the intrusion arch was ligated gingivally to the anterior segmented arch. The posterior segment consisted of both molars and premolars on each side, which were stabilized with a sectional passive 0.018 × 0.025 inch stainless steel wire. An anterior, passive sectional arch from the same wire was fabricated for stabil-ization of the incisors. A palatal–lingual arch was not deemed necessary since the posterior segments of the model were united. The utility arches were fabricated with a 45 degree molar tip-back, as described by Ricketts (1976) and Ricketts et al. (1979), without, for simplicity, any molar rotation or buccal root torque incorporated in the wire. During the experimental intrusion, the helix of the Burstone archwires was ligated to the tube and the utility/NiTi archwires were cinched back. The length of the buccal bridge of the utility arches, calculated as the distance between the anterior and posterior vertical steps, was 28 mm and the distance between the proximal surfaces of the canine and lateral incisor brackets was 4 mm.
For the objectives of this study, which targeted pure intrusive and buccolingual torque components of the
Figure 1 The acrylic Frasaco model mounted on the positioning tables of the orthodontic measurement and simulation system.

161 A COMPARATIVE ASSESSMENT OF THE FORCES AND MOMENTS
intrusion configurations, only intrusive forces (Fx) and moments (My; anterior buccolingual torque) were used for the final evaluations of simulated intrusion. The remaining force (Fy, Fz) and moment (Mx, Mz) components are greatly affected by factors such as correct adjustment of the anterior segment relative to the posterior segment, degree of symmetry between the two sides, proper archwire insertion, ligation, and activation. Since all the aforementioned factors introduce unnecessary variability and confound the results, which are of real interest during anterior maxillary intrusion, the components Fy, Fz, Mx, Mz were adjusted to zero and therefore not included in the analyses. For the utility and Burstone configurations, intrusion was performed from 0.0 to 3.0 mm whereas for the NiTi reverse curve archwire, the intrusion was confined from 0.0 to 1.5 mm. For consistency and comparability, data analysis for all intrusion configurations was performed using the values at 1.5 mm.
Statistical analysis
The data were statistically analysed by means of one-way analysis of variance (ANOVA). Forces and moments were the dependent variables and wire type the independent variable. Post hoc multiple comparisons were performed using the Tukey test (0.05 error rate). Statistical analysis was undertaken with the Statistical Package for Social Sciences (version 15.0 SPSS Inc., Chicago, Illinois, USA).
Results
Wire type was a significant predictor for the forces and moments generated by the various wires as indicated by ANOVA (Tables 1 and 2). The utility and the Burstone maxillary archwires recorded mean intrusive forces in the range of 1–1.4 N, whereas the reverse curve NiTi delivered mean force in excess of 9 N, all at 1.5 mm intrusion.
Table 1 Analysis of variance of intrusion force versus wire type.
Intrusion force (N) Sum of squares
df Mean square
F Significance
Between groups 1219.853 3 406.618 22220.445 0.000Within groups 1.757 96 0.018Total 1221.609 99
Table 2 Analysis of variance of moments (torque) versus wire type.
Moments (Nmm) Sum of squares
df Mean square
F Significance
Between groups 314.937 3 104.979 73.369 0.000Within groups 137.360 96 1.431Total 452.296 99
0
1
2
3
4
5
6
7
8
9
10
1.5 1.3 1.1 0.9 0.7 0.5 0.3 0.1
Displacement (mm)
Forc
e (N
)
Utility Elgiloy 0.016x0.16
Utility TMA 0.017x0.025
Burstone TMA 0.017x0.025
Niti ReverseCurve0.016x0.022
Figure 2 Intrusion force (Fx) per wire type and displacement for a range of 1.5 mm (0.0–1.5 mm) at 0.1 mm increments.
Figure 2 depicts the range of intrusion forces (Fx) per wire type and vertical displacement from 0.0 to 1.5 mm (0.1 mm increments). The force levels recorded for the 0.016 × 0.022 inch reverse curve NiTi were approximately six times greater than those produced by the other configurations at the 1.5 mm level (Table 3).
Moment (My) ranking for the wire groups showed a notable difference compared with that of the intrusion force (Table 4 and Figure 3). The highest mean was found for the 0.017 × 0.025 inch TMA utility (7.3 Nmm) and the lowest for the Burstone TMA intrusion system (2.4 Nmm). The 0.016 × 0.016 Elgiloy and the reverse curve NiTi exhibited similar magnitudes, in the order of 6 Nmm.
Table 3 Intrusion force results of the systems included in the study.
Wire type Intrusion force (N)
Mean Standard deviation
Tukey grouping*
Burstone TMA 0.017 × 0.025 0.99 0.11 AReverse curve NiTi 0.016 × 0.022 9.31 0.27 BUtility Blue Elgiloy 0.016 × 0.016 1.43 0.07 CUtility TMA 0.017 × 0.025 1.33 0.12 D
*Means with the same letter are not significantly different at the 0.05 level.

I. SIFAkAkIS ET Al.162
Table 4 Intrusion moment results for the systems included in the study.
Wire type Moments (Nmm)
Mean Standard deviation
Tukey grouping*
Burstone TMA 0.017 × 0.025 2.47 1.44 AReverse curve NiTi 0.016 × 0.022 5.69 1.05 BUtility Blue Elgiloy 0.016 × 0.016 5.92 0.96 BUtility TMA 0.017 × 0.025 7.31 1.28 C
*Means with the same letter are not significantly different at the 0.05 level.
0
1
2
3
4
5
6
7
8
1.5 1.
3 1.1
0.9
0.7 0.
5 0.3
0.1
Displacement(mm)
Mo
men
t (N
mm
)
Utility Elgiloy 0.016x0.16 Utility TMA 0.017x0.025
Burstone TMA 0.017x0.025 Niti Reverse Curve0.016x0.022
Figure 3 Buccolingual moments (My) per wire type and displacement for a range of 1.5 mm (0.0–1.5 mm) at 0.1 mm increments.
the present experimental simulation of maxillary incisor intrusion, the non-heat-treated 0.016 × 0.016 inch Blue Elgiloy utility arch exerted higher intrusive forces than the 0.017 × 0.025 TMA utility and the 0.017 × 0.025 TMA Burstone intrusion arch.
The E of the β–Ti wires is around 40 per cent of that of stainless steel but still twice that of NiTi (kapila and Sachdeva, 1989). These wires deliver approximately half the amount of force compared with that of stainless steel (Burstone and Goldberg, 1980) or Co–Cr wires (kapila and Sachdeva, 1989) of comparable cross-sections and equal amounts of activation. The increase in stiffness accompanying an increase in cross-section from 0.016 × 0.016 inch to 0.017 × 0.025 inch of the same composition is about 86 per cent (Thurow, 1982). For a rectangular supported beam, the situation is more complex. Its dimension in the direction of bending is the primary determinant of its properties and the increase in beam size affects strength in a cubic function. Additionally, if the ends are tightly anchored, i.e. are not allowed to slide freely, the beam presents higher stiffness (Proffit and Fields, 2000). In this experiment, the utility Blue Elgiloy 0.016 × 0.016 exerted 8 per cent more intrusive force relative to the utility TMA 0.017 ×0.025, which, in turn, produced 34 per cent more force than the Burstone TMA 0.017 × 0.025 intrusion arch. The latter showed the lowest intrusive forces from the configurations tested due to the presence of a 3 mm helix which increased wire length, and because it was not tightly anchored to the anterior segment.
The intrusive forces recorded for the reverse curve 0.016 × 0.022 inch NiTi were the highest of all arches tested. This is a continuous arch and the force magnitude is primarily determined by factors such as the size of and the distance between the canine and lateral incisor brackets (Halazonetis, 1998). In the simulation employed in this study, with only 1.5 mm supraeruption of the incisors, the force that this continuous arch exerted on the anterior segment was 9.3 N. It has been suggested that some light rectangular wires with low moduli of elasticity could be used even during the early stages of treatment (Burstone, 1981; kapila and Sachdeva, 1989) but although the initial magnitude of this force is expected to decrease rapidly during tooth movement, the use of a continuous reverse curve rectangular Nitinol arch in an unlevelled dental arch should be avoided.
The magnitude of the intrusive force applied on the four upper incisors was initially suggested to be around 1 N (Burstone, 1977); the 0.017 × 0.025 TMA intrusion arch exerted forces within this range. On the other hand, Ricketts et al. (1979) proposed a magnitude of 1.25–1.6 N, and the utility arches that were measured were in that range. With respect to the lower incisors, both Burstone (1977) and Ricketts et al. (1979) agreed that the force should be approximately half the amount used for the upper incisors. Nevertheless, a recent clinical study demonstrated that 0.4 N of force could intrude the four maxillary incisors at the same
Discussion
The use of Elgiloy wire possesses two potential advantages over stainless steel wire: it is produced in four tempers with different degrees of hardening, whereas the Blue Elgiloy presents the best formability and the lowest yield strength from the four tempers (kusy et al., 2001) and after initial wire shaping, heat treatment increases the yield point and the strength of the Co–Cr wire and the softest temper becomes equivalent to regular stainless steel (kapila and Sachdeva, 1989; Johnson, 2003). The moduli of elasticity (E), however, of Blue Elgiloy and stainless steel are similar, as well as their force delivery (kusy and Greenberg, 1981; kusy, 1983) and perhaps this might be the reason for the lack of attractiveness of Co–Cr wires (kusy et al., 2001). In

163 A COMPARATIVE ASSESSMENT OF THE FORCES AND MOMENTS
rate as those of double the magnitude (Van Steenbergen et al., 2005a).
Regarding the buccolingual moments, the lowest values were recorded for the Burstone intrusion arch, a statically determined force system. This wire was not ligated into the slots but the location of the point of force application in relation to the centre of resistance of the anterior segment can alter the axial inclination of that segment (Van Steenbergen et al., 2005b). Between the utility archwires, the lowest values were recorded for the Blue Elgiloy. The torsional play of 0.016 × 0.016 Blue Elgiloy wire in a 0.018 slot is 27 degrees. It follows that a 35–48 degree twist should be applied in order to obtain 20 Nmm of torsional moment (Meling and Odegaard, 1998). Generally, and if the wire material/manufacturer remain the same, the increase of the cross-section from 0.016 × 0.016 to 0.017 × 0.025 reduces the slack by two-thirds (Meling et al., 1997). TMA presented lower torsional stiffness values in comparison with Blue Elgiloy and the 0.017 × 0.025 TMA utility arch produced about 24 per cent higher torquing moments than the 0.016 × 0.016 Blue Elgiloy utility arch.
In the present experiment, the reverse curve Nitinol wire could not be directly compared with the other wire types since this was the only continuous archwire. At the initial levelled situation, the geometry between canine and lateral incisor brackets resembled the Class VI type but during supraeruption of the incisor segment, it changed to a Class I geometry since these two teeth had no angulation but were at a different occlusogingival level (Burstone and koenig, 1974; Halazonetis, 1998). Clinically, the moments created by this configuration are expected to tip the teeth rapidly, thus changing the whole system in a way that is difficult to predict. The unpredictable nature of this force system is perhaps the main contraindication to the use of these wires.
A limitation of this research, as well as of most ex vivo investigations, relates to the difficulties in extrapolating clinical relevance. The OMSS is based on the principle of the two-tooth model and closely resembles the clinical situation where initial tooth mobility, occlusal interferences, etc. may be adjusted for; however, the OMSS may not account for factors such as intraoral ageing and the influence of saliva. Furthermore, it has not yet been possible to predict the centre of resistance of the four incisors, and the intrusion of these teeth should be carefully monitored in order to avoid side-effects.
Conclusions
The intrusive forces exerted by continuous reverse curve NiTi wires on incisors exceeded 9 N and thus are beyond biologically safe limits. Therefore, the use of such archwires in a 1.5 mm vertical discrepancy of a dental arch is not indicated. Comparison of the two major intrusion techniques for the anterior teeth, i.e. the segmented and bioprogressive techniques, revealed that the Burstone TMA 0.017 × 0.025
intrusion arch exerted the lowest force on the incisors (0.99 N), followed by the utility TMA 0.017 × 0.025 and the utility with Blue Elgiloy 0.016 × 0.016 the highest (1.43 N).
The lowest moments in the sagittal plane were recorded with the Burstone intrusion arch, whereas the highest was registered for the utility arch constructed with a 0.017 × 0.025 TMA wire.
Address for correspondence
Theodore Eliades57 Agnoston HiroonNea Ionia 14231GreeceE-mail: [email protected]
ReferencesBourauel C, Drescher D, Thier M 1992 An experimental apparatus for the
simulation of three-dimensional movements in orthodontics. Journal of Biomedical Engineering 14: 371–378
Burstone C J 1962 Rationale of the segmented arch. American Journal of Orthodontics 48: 805–822
Burstone C J 1966 The mechanics of the segmented arch techniques. The Angle Orthodontist 36: 99–120
Burstone C J 1977 Deep overbite correction by intrusion. American Journal of Orthodontics 72: 1–22
Burstone C J 1981 Variable-modulus orthodontics. American Journal of Orthodontics 80: 1–16
Burstone C J, Goldberg A J 1980 Beta titanium: a new orthodontic alloy. American Journal of Orthodontics 77: 121–132
Burstone C J, koenig H A 1974 Force systems from an ideal arch. American Journal of Orthodontics 65: 270–289
Costopoulos G, Nanda R 1996 An evaluation of root resorption incident to orthodontic intrusion. American Journal of Orthodontics and Dentofacial Orthopedics 109: 543–548
Dake M l, Sinclair P M 1989 A comparison of the Ricketts and Tweed-type arch leveling techniques. American Journal of Orthodontics and Dentofacial Orthopedics 95: 72–78
Drescher D, Bourauel C, Thier M 1991 Application of the orthodontic measurement and simulation system (OMSS) in orthodontics. European Journal of Orthodontics 13: 169–178
Goerigk B, Diedrich P, Wehrbein H 1992 Intrusion of the anterior teeth with the segmented-arch technique of Burstone—a clinical study. Fortschritte der kieferorthopädie 53: 16–25
Halazonetis D J 1998 Ideal arch force systems: a center-of-resistance perspective. American Journal of Orthodontics and Dentofacial Orthopedics 114: 256–264
Johnson E 2003 Relative stiffness of beta titanium archwires. The Angle Orthodontist 73: 259–269
kapila S, Sachdeva R 1989 Mechanical properties and clinical applications of orthodontic wires. American Journal of Orthodontics and Dentofacial Orthopedics 96: 100–109
kusy R P 1983 On the use of nomograms to determine the elastic property ratios of orthodontic arch wires. American Journal of Orthodontics 83: 374–381
kusy R P, Greenberg A R 1981 Effects of composition and cross section on the elastic properties of orthodontic wires. The Angle Orthodontist 51: 325–341
kusy R P, Mims l, Whitley J Q 2001 Mechanical characteristics of various tempers of as-received cobalt-chromium archwires. American Journal of Orthodontics and Dentofacial Orthopedics 119: 274–291
I. SIFAkAkIS ET Al.164
McFadden W M, Engström C, Engström H, Anholm J M 1989 A study of the relationship between incisor intrusion and root shortening. American Journal of Orthodontics and Dentofacial Orthopedics 96: 390–396
Meling T R, Odegaard J 1998 The effect of cross-sectional dimensional variations of square and rectangular chrome-cobalt archwires on torsion. The Angle Orthodontist 68: 239–248
Meling T R, Odegaard J, Meling E O 1997 On mechanical properties of square and rectangular stainless steel wires tested in torsion. American Journal of Orthodontics and Dentofacial Orthopedics 111: 310–320
Melsen B, Agerbaek N, Markenstam G 1989 Intrusion of incisors in adult patients with marginal bone loss. American Journal of Orthodontics and Dentofacial Orthopedics 96: 232–241
Otto R l, Anholm J M, Engel G A 1980 A comparative analysis of intrusion of incisor teeth achieved in adults and children according to facial type. American Journal of Orthodontics 77: 437–446
Proffit W R, Fields H W 2000 Contemporary orthodontics, 3rd edn. Mosby, St louis
Ricketts R M 1976 Bioprogressive therapy as an answer to orthodontic needs. Part II. American Journal of Orthodontics 70: 359–397
Ricketts R M, Bench R W, Gugino C F, Hilgers J J, Schulhof R J 1979 Bioprogressive therapy. Rocky Mountain Orthodontics, Denver
Sarver D M 2001 The importance of incisor positioning in the esthetic smile: the smile arc. American Journal of Orthodontics and Dentofacial Orthopedics 120: 98–111
Thurow R C 1982 Edgewise orthodontics, 4th edn. Mosby, St louisvan Steenbergen E, Burstone C J, Prahl-Andersen B, Aartman I H 2004 The
role of a high pull headgear in counteracting side effects from intrusion of the maxillary anterior segment. The Angle Orthodontist 74: 480–486
van Steenbergen E, Burstone C J, Prahl-Andersen B, Aartman I H 2005a The influence of force magnitude on intrusion of the maxillary segment. The Angle Orthodontist 75: 723–729
van Steenbergen E, Burstone C J, Prahl-Andersen B, Aartman I H 2005b The relation between the point of force application and flaring of the anterior segment. The Angle Orthodontist 75: 730–735
van Steenbergen E, Burstone C J, Prahl-Andersen B, Aartman I H 2006 Influence of buccal segment size on prevention of side effects from incisor intrusion. American Journal of Orthodontics and Dentofacial Orthopedics 129: 658–665
Weiland F J, Bantleon H P, Droschl H 1996 Evaluation of continuous arch and segmented arch leveling techniques in adult patients—a clinical study. American Journal of Orthodontics and Dentofacial Orthopedics 110: 647–652
Zachrisson B U 1998 Esthetic factors involved in anterior tooth display and the smile: vertical dimension. Journal of Clinical Orthodontics 32: 432–445

European Journal of Orthodontics 32 (2010) 165–170 © The Author 2009. Published by Oxford University Press on behalf of the European Orthodontic Society.doi:10.1093/ejo/cjp082 All rights reserved. For permissions, please email: [email protected] Access Publication 1 October 2009
Introduction
The aim of this randomized clinical trial was to determine whether there is any difference between two orthodontic retention regimens: whether night-only wear of an upper and lower Hawley retainer for 1 year is as effective as 6 months full-time wear followed by 6 months night-only wear.
Most orthodontic clinicians will carry out supervised retention for at least 1 year after active treatment has ceased. The scientific rationale for this is that Reitan (1959, 1967) suggested that the gingival fibre network typically took 4–6 months to remodel and periodontal fibres took at least 262 days to re-organize, thus necessitating a means of maintaining teeth in their new post-treatment position. Use of retainers, theoretically, prevents the tendency of teeth to return to their pre-treatment positions not only from the influence of periodontal and gingival fibres but also from occlusal and soft tissue forces and continued dentofacial growth.
Southard et al. (1992) investigated the potential role of periodontal transseptal fibres, which were thought to be the prime force in exerting compression between mandibular contact points. They showed, using a digital tension transducer to record the interproximal force, that elastic supracrestal fibres continued to exert significant forces between mandibular contact points, possibly contributing to post-treatment changes in tooth position.
There is a wide variation in the retention regimen used by orthodontists, varying from immediate night-only wear of retainers to a period of 3–6 months full-time wear followed by night-only wear.
There are limited prospective studies that investigate this question and the problem of lack of scientific evidence
Hawley retainers full- or part-time? A randomized clinical trial
M. Shawesh*, B. Bhatti**, T. Usmani** and N. Mandall**School of Dentistry, University of Manchester and **Heaton Mersey Specialist Orthodontic Practice, Manchester, UK
SUMMARY The aim of this trial was to compare two different orthodontic retention regimens: is night-only wear of upper and lower Hawley retainers for 1 year as effective as 6 months full-time followed by 6 months night-only wear? Sixty-seven consecutive patients attending for orthodontic debond were randomly allocated to wear upper and lower Hawley retainers either for 1 year night-only (group 1) or for 6 months full-time followed by 6 months night-only (group 2). In group 1, 41.2 per cent were males and 58.8 per cent were females and their mean age was 15.6 years [standard deviation (SD) 1.6 years]. In group 2, 24.2 per cent were males and 75.8 per cent were females and their mean age was 15.8 years (SD 1.2 years). Study models were taken at the start (T0) and end (T1) of treatment and 1 year post-debond (T2). Digital callipers were used to measure upper and lower labial segment irregularity using Little’s index and upper and lower labial segment crowding. To evaluate differences between groups 1 and 2 t-tests were used.
There were no statistically significant differences between the two retention regimens at T2 for labial segment irregularity or crowding (P > 0.05). Since both retention regimens were equally effective during the 1 year retention period, it would seem clinically acceptable to ask patients to wear their retainers at night only.
has been highlighted in a systematic review (Littlewood et al., 2006). However, Destang and Kerr (2003) investigated maxillary retention in two parallel groups to determine whether a longer retention period would decrease the relapse potential and increase stability. Twenty patients were allocated to a 6 month retention regimen using an upper Hawley retainer for 3 months full-time and 3 months night-only. The second group of 18 patients followed a 1 year retention regimen, with the same retainer, wearing it for 6 months full time followed by 6 months night-only. They found that the second group who experienced an overall retention regimen for 1 year showed less post-retention irregularity relapse of the maxillary anterior teeth compared with the group who had only worn a retainer for 6 months. They concluded that retention for 1 year, rather than 6 months, was clinically more beneficial.
There are numerous studies of possible variables that may influence orthodontic retention and relapse; these include: continued post-treatment facial growth and development (Björk and Skieller, 1972; Lopez-Gavito et al., 1985; Little et al., 1990; Wieslander, 1993), proclination of the lower labial segment and expansion of the intercanine width during orthodontic treatment (Mills, 1968; Little et al., 1981; Felton, 1987), arch length deficiency (Richardson, 1996), tooth fibre discrepancy and a triangular shape of the lower incisors (Peck and Peck, 1972), and the mesial drift theory (Richardson, 1979) and the third molar theory. However, several published studies suggest that the latter plays a very minor role in long-term changes to the dental arch (Richardson, 1989; Ades et al., 1990; Harradine et al., 1998).

M. SHAWeSH eT AL.166
It is still unclear whether it may be clinically acceptable for patients to wear their retainers for 1 year at night only or whether it is necessary for an initial period of full-time wear followed by night-only wear. This question, therefore, formed the focus of this study.
The null hypothesis tested was that there is no difference in the effectiveness of upper and lower Hawley retainers whether worn night-time only for 1 year or 6 months full-time followed by 6 months night-only in terms of the incisor irregularity index (Little, 1975) and incisor crowding.
Subjects and methods
Sample size calculation
The sample size for each group was calculated as n = 23, based on an alpha significance level of 0.05 and a beta of 0.1. This gave a power of 90 per cent to detect a clinically significant difference (if one existed) of 2 mm in labial segment alignment between group 1 (1 year night-only) and group 2 (6 months full-time followed by 6 months night-only), assuming that the common standard deviation is 2 mm using a two-group t-test with a 0.05, two-sided significance level. This gave a total sample size of 46 patients required for the study.
The sample was obtained from patients attending for orthodontic debond appointments at one specialist practice in Heaton Mersey, Manchester, United Kingdom. The patients were consecutively approached to take part in the study and the patient and parent signed a consent form. The study protocol had previously been approved by the Central Manchester Research ethics Committee (reference: 03/07/2307).
The inclusion criteria were 10–16 years of age, labial segment crowding or tooth contact point displacement at the start of orthodontic treatment, clinically acceptable labial segment alignment at the end of active treatment, and good oral hygiene.
The exclusion criteria were lack of consent, severe rotations or midline diastema suggesting the need for a bonded retainer, and patients with a restorative need in the labial segment, e.g. implant, bridges, or missing teeth.
Randomization
The subjects were randomly allocated to one of the two retention regimen groups using a restricted randomization technique, in blocks of 12, to ensure that equal numbers were allocated to each group. The allocation was decided by throwing an unweighted die where throws of 1, 2, or 3 = group 1 and 4, 5, or 6 = group 2. From this random list, the retention regimen was recorded alongside a patient identification number; the random allocation was sealed in numbered opaque envelopes and held in a central place. Thus, neither the clinician nor the patient knew their group allocation prior to consenting to the study.
Outcome measures
The outcome measures assessed were the upper and lower labial segment irregularity index (Little, 1975) and upper and lower labial segment crowding.
Appliance design and management
Upper Hawley retainer. Adams’ cribs were placed on both upper first permanent molars and a long labial bow was taped and soldered to, and extended from, the bridges of these cribs. The anterior part of the labial bow was covered in acrylic to engage the embrasures between the incisors. The base plate was manufactured with acrylic that contacted the palatal surface of all teeth around the entire arch.
Lower Hawley retainer. Adams’ cribs were placed on both lower first permanent molars. The labial bow was constructed to extend from the lower permanent canine to the canine and the labial aspect of the bow was covered in acrylic that engaged the embrasures between the incisors. The base plate was manufactured with acrylic that contacted the lingual surface of the teeth all the way round the arch.
All retainers, for all patients, were fitted 3 days post-debond and standardized instructions were given on appliance care.
Patient records. Study models were obtained at the following time intervals: T0, commencement of orthodontic treatment; T1, end of active orthodontic treatment (debond); and T2, end of the 1 year retention period. The patients were registered in this retention study at debond; therefore, T0 study models had previously been taken and were retrieved from the model store for measurements to be made.
Measurement methods. One author (MS), calibrated in the use of the digital dial callipers [Absolute Digimatic, Mitutoyo (Wednesbury, UK), Ltd.; www.jlindustrial.co.uk], measured the study models to an accuracy of 0.1 mm. To calculate incisor irregularity, the sum of the distances between the anatomic contact points from the mesial of the left canine to the mesial of the right canine in each labial segment was measured as described by Little (1975). These distances were summed to obtain a total irregularity index for the upper and lower labial segments.
Incisor crowding was calculated by measuring the difference between the sum, in millimetres, of the canine-to-canine tooth widths and the space in the labial segment from canine to canine. The available space in the labial segment was measured by dividing the labial segment into two straight-line segments, extending from the distal contact point to the canine on each side to the midpoint between the central incisors.
Method error
Systematic error. Although neither the operator nor the patient could be blinded to group allocation, the study model assessor (MS) was blind to the retention regimen used. Each
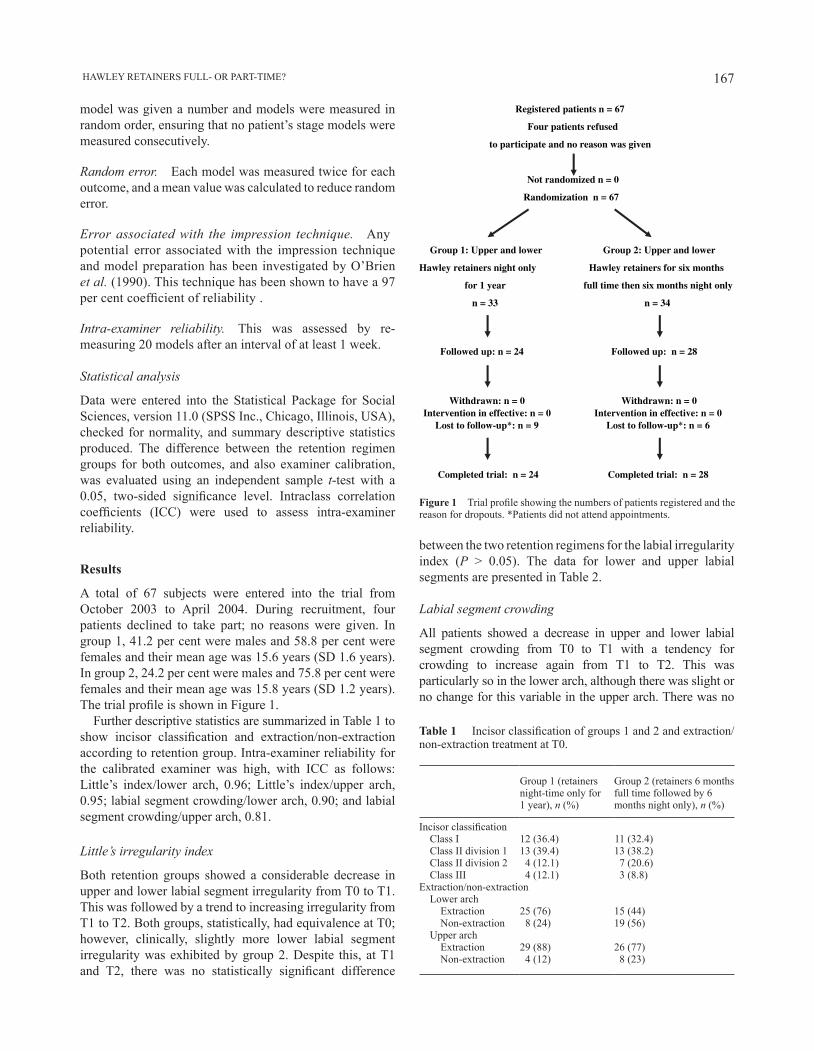
167 HAWLeY ReTAINeRS FULL- OR PART-TIMe?
between the two retention regimens for the labial irregularity index (P > 0.05). The data for lower and upper labial segments are presented in Table 2.
Labial segment crowding
All patients showed a decrease in upper and lower labial segment crowding from T0 to T1 with a tendency for crowding to increase again from T1 to T2. This was particularly so in the lower arch, although there was slight or no change for this variable in the upper arch. There was no
model was given a number and models were measured in random order, ensuring that no patient’s stage models were measured consecutively.
Random error. Each model was measured twice for each outcome, and a mean value was calculated to reduce random error.
Error associated with the impression technique. Any potential error associated with the impression technique and model preparation has been investigated by O’Brien et al. (1990). This technique has been shown to have a 97 per cent coefficient of reliability .
Intra-examiner reliability. This was assessed by re-measuring 20 models after an interval of at least 1 week.
Statistical analysis
Data were entered into the Statistical Package for Social Sciences, version 11.0 (SPSS Inc., Chicago, Illinois, USA), checked for normality, and summary descriptive statistics produced. The difference between the retention regimen groups for both outcomes, and also examiner calibration, was evaluated using an independent sample t-test with a 0.05, two-sided significance level. Intraclass correlation coefficients (ICC) were used to assess intra-examiner reliability.
Results
A total of 67 subjects were entered into the trial from October 2003 to April 2004. During recruitment, four patients declined to take part; no reasons were given. In group 1, 41.2 per cent were males and 58.8 per cent were females and their mean age was 15.6 years (SD 1.6 years). In group 2, 24.2 per cent were males and 75.8 per cent were females and their mean age was 15.8 years (SD 1.2 years). The trial profile is shown in Figure 1.
Further descriptive statistics are summarized in Table 1 to show incisor classification and extraction/non-extraction according to retention group. Intra-examiner reliability for the calibrated examiner was high, with ICC as follows: Little’s index/lower arch, 0.96; Little’s index/upper arch, 0.95; labial segment crowding/lower arch, 0.90; and labial segment crowding/upper arch, 0.81.
Little’s irregularity index
Both retention groups showed a considerable decrease in upper and lower labial segment irregularity from T0 to T1. This was followed by a trend to increasing irregularity from T1 to T2. Both groups, statistically, had equivalence at T0; however, clinically, slightly more lower labial segment irregularity was exhibited by group 2. Despite this, at T1 and T2, there was no statistically significant difference
Registered patients n = 67
Four patients refused
to participate and no reason was given
Not randomized n = 0
Randomization n = 67
Group 1: Upper and lower Group 2: Upper and lower
Hawley retainers night only Hawley retainers for six months
for 1 year full time then six months night only
n = 33 n = 34
Followed up: n = 24 Followed up: n = 28
Withdrawn: n = 0 Withdrawn: n = 0 Intervention in effective: n = 0 Intervention in effective: n = 0
Lost to follow-up*: n = 6 Lost to follow-up*: n = 9
Completed trial: n = 24 Completed trial: n = 28
Figure 1 Trial profile showing the numbers of patients registered and the reason for dropouts. *Patients did not attend appointments.
Table 1 Incisor classification of groups 1 and 2 and extraction/ non-extraction treatment at T0.
Group 1 (retainers night-time only for 1 year), n (%)
Group 2 (retainers 6 months full time followed by 6 months night only), n (%)
Incisor classification Class I 12 (36.4) 11 (32.4) Class II division 1 13 (39.4) 13 (38.2) Class II division 2 4 (12.1) 7 (20.6) Class III 4 (12.1) 3 (8.8)Extraction/non-extraction Lower arch Extraction 25 (76) 15 (44) Non-extraction 8 (24) 19 (56) Upper arch Extraction 29 (88) 26 (77) Non-extraction 4 (12) 8 (23)
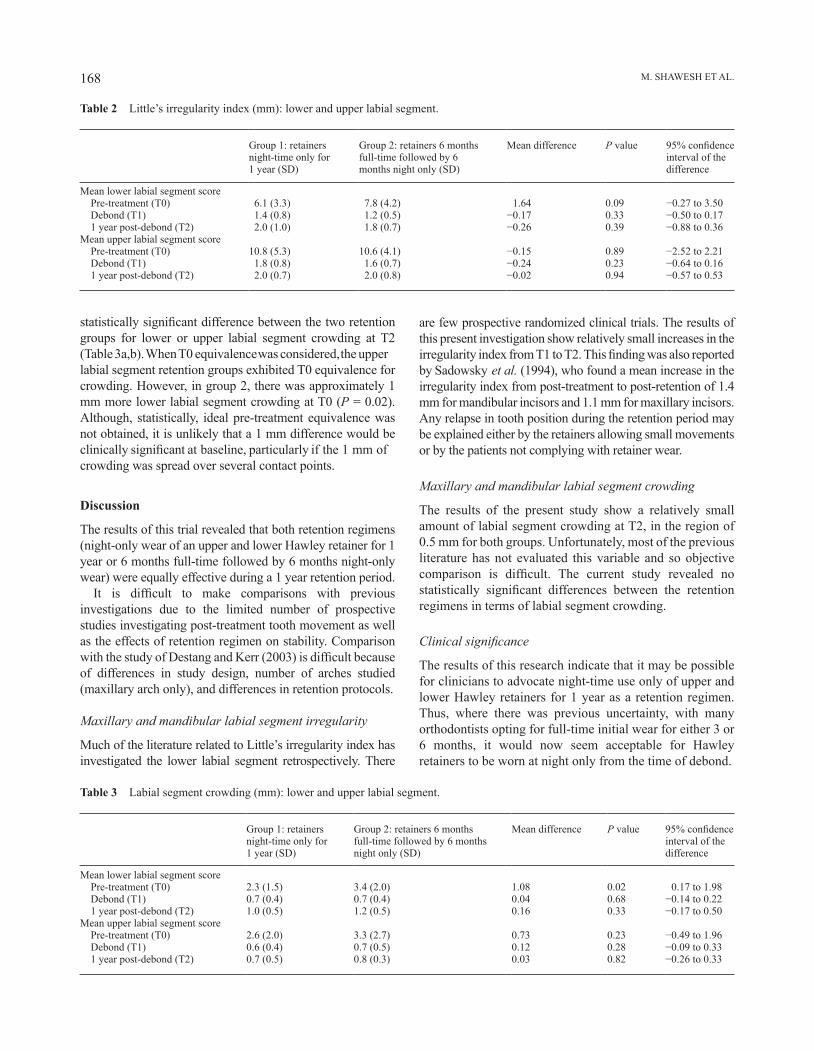
M. SHAWeSH eT AL.168
Table 3 Labial segment crowding (mm): lower and upper labial segment.
Group 1: retainers night-time only for 1 year (SD)
Group 2: retainers 6 months full-time followed by 6 months night only (SD)
Mean difference P value 95% confidence interval of the difference
Mean lower labial segment score Pre-treatment (T0) 2.3 (1.5) 3.4 (2.0) 1.08 0.02 0.17 to 1.98 Debond (T1) 0.7 (0.4) 0.7 (0.4) 0.04 0.68 −0.14 to 0.22 1 year post-debond (T2) 1.0 (0.5) 1.2 (0.5) 0.16 0.33 −0.17 to 0.50Mean upper labial segment score Pre-treatment (T0) 2.6 (2.0) 3.3 (2.7) 0.73 0.23 −0.49 to 1.96 Debond (T1) 0.6 (0.4) 0.7 (0.5) 0.12 0.28 −0.09 to 0.33 1 year post-debond (T2) 0.7 (0.5) 0.8 (0.3) 0.03 0.82 −0.26 to 0.33
statistically significant difference between the two retention groups for lower or upper labial segment crowding at T2 (Table 3a,b). When T0 equivalence was considered, the upper labial segment retention groups exhibited T0 equivalence for crowding. However, in group 2, there was approximately 1 mm more lower labial segment crowding at T0 (P = 0.02). Although, statistically, ideal pre-treatment equivalence was not obtained, it is unlikely that a 1 mm difference would be clinically significant at baseline, particularly if the 1 mm of crowding was spread over several contact points.
Discussion
The results of this trial revealed that both retention regimens (night-only wear of an upper and lower Hawley retainer for 1 year or 6 months full-time followed by 6 months night-only wear) were equally effective during a 1 year retention period.
It is difficult to make comparisons with previous investigations due to the limited number of prospective studies investigating post-treatment tooth movement as well as the effects of retention regimen on stability. Comparison with the study of Destang and Kerr (2003) is difficult because of differences in study design, number of arches studied (maxillary arch only), and differences in retention protocols.
Maxillary and mandibular labial segment irregularity
Much of the literature related to Little’s irregularity index has investigated the lower labial segment retrospectively. There
Table 2 Little’s irregularity index (mm): lower and upper labial segment.
Group 1: retainers night-time only for 1 year (SD)
Group 2: retainers 6 months full-time followed by 6 months night only (SD)
Mean difference P value 95% confidence interval of the difference
Mean lower labial segment score Pre-treatment (T0) 6.1 (3.3) 7.8 (4.2) 1.64 0.09 −0.27 to 3.50 Debond (T1) 1.4 (0.8) 1.2 (0.5) −0.17 0.33 −0.50 to 0.17 1 year post-debond (T2) 2.0 (1.0) 1.8 (0.7) −0.26 0.39 −0.88 to 0.36Mean upper labial segment score Pre-treatment (T0) 10.8 (5.3) 10.6 (4.1) −0.15 0.89 −2.52 to 2.21 Debond (T1) 1.8 (0.8) 1.6 (0.7) −0.24 0.23 −0.64 to 0.16 1 year post-debond (T2) 2.0 (0.7) 2.0 (0.8) −0.02 0.94 −0.57 to 0.53
are few prospective randomized clinical trials. The results of this present investigation show relatively small increases in the irregularity index from T1 to T2. This finding was also reported by Sadowsky et al. (1994), who found a mean increase in the irregularity index from post-treatment to post-retention of 1.4 mm for mandibular incisors and 1.1 mm for maxillary incisors. Any relapse in tooth position during the retention period may be explained either by the retainers allowing small movements or by the patients not complying with retainer wear.
Maxillary and mandibular labial segment crowding
The results of the present study show a relatively small amount of labial segment crowding at T2, in the region of 0.5 mm for both groups. Unfortunately, most of the previous literature has not evaluated this variable and so objective comparison is difficult. The current study revealed no statistically significant differences between the retention regimens in terms of labial segment crowding.
Clinical significance
The results of this research indicate that it may be possible for clinicians to advocate night-time use only of upper and lower Hawley retainers for 1 year as a retention regimen. Thus, where there was previous uncertainty, with many orthodontists opting for full-time initial wear for either 3 or 6 months, it would now seem acceptable for Hawley retainers to be worn at night only from the time of debond.
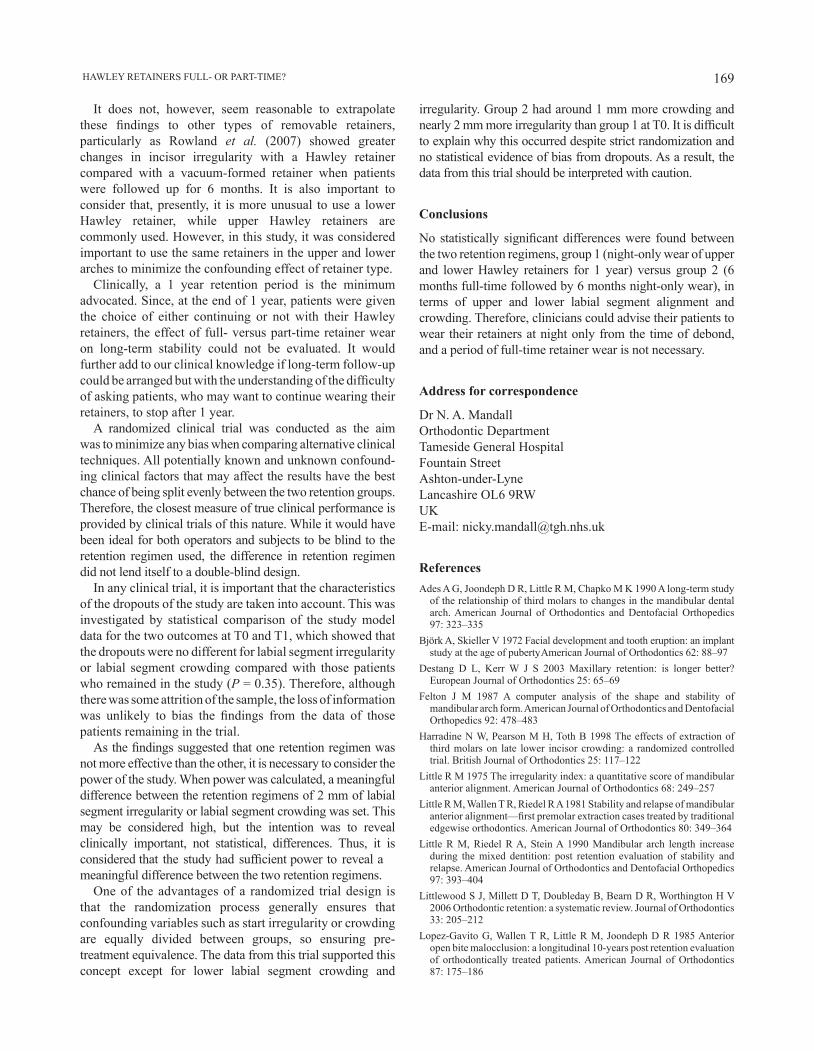
169 HAWLeY ReTAINeRS FULL- OR PART-TIMe?
It does not, however, seem reasonable to extrapolate these findings to other types of removable retainers, particularly as Rowland et al. (2007) showed greater changes in incisor irregularity with a Hawley retainer compared with a vacuum-formed retainer when patients were followed up for 6 months. It is also important to consider that, presently, it is more unusual to use a lower Hawley retainer, while upper Hawley retainers are commonly used. However, in this study, it was considered important to use the same retainers in the upper and lower arches to minimize the confounding effect of retainer type.
Clinically, a 1 year retention period is the minimum advocated. Since, at the end of 1 year, patients were given the choice of either continuing or not with their Hawley retainers, the effect of full- versus part-time retainer wear on long-term stability could not be evaluated. It would further add to our clinical knowledge if long-term follow-up could be arranged but with the understanding of the difficulty of asking patients, who may want to continue wearing their retainers, to stop after 1 year.
A randomized clinical trial was conducted as the aim was to minimize any bias when comparing alternative clinical techniques. All potentially known and unknown confound-ing clinical factors that may affect the results have the best chance of being split evenly between the two retention groups. Therefore, the closest measure of true clinical performance is provided by clinical trials of this nature. While it would have been ideal for both operators and subjects to be blind to the retention regimen used, the difference in retention regimen did not lend itself to a double-blind design.
In any clinical trial, it is important that the characteristics of the dropouts of the study are taken into account. This was investigated by statistical comparison of the study model data for the two outcomes at T0 and T1, which showed that the dropouts were no different for labial segment irregularity or labial segment crowding compared with those patients who remained in the study (P = 0.35). Therefore, although there was some attrition of the sample, the loss of information was unlikely to bias the findings from the data of those patients remaining in the trial.
As the findings suggested that one retention regimen was not more effective than the other, it is necessary to consider the power of the study. When power was calculated, a meaningful difference between the retention regimens of 2 mm of labial segment irregularity or labial segment crowding was set. This may be considered high, but the intention was to reveal clinically important, not statistical, differences. Thus, it is considered that the study had sufficient power to reveal a meaningful difference between the two retention regimens.
One of the advantages of a randomized trial design is that the randomization process generally ensures that confounding variables such as start irregularity or crowding are equally divided between groups, so ensuring pre-treatment equivalence. The data from this trial supported this concept except for lower labial segment crowding and
irregularity. Group 2 had around 1 mm more crowding and nearly 2 mm more irregularity than group 1 at T0. It is difficult to explain why this occurred despite strict randomization and no statistical evidence of bias from dropouts. As a result, the data from this trial should be interpreted with caution.
Conclusions
No statistically significant differences were found between the two retention regimens, group 1 (night-only wear of upper and lower Hawley retainers for 1 year) versus group 2 (6 months full-time followed by 6 months night-only wear), in terms of upper and lower labial segment alignment and crowding. Therefore, clinicians could advise their patients to wear their retainers at night only from the time of debond, and a period of full-time retainer wear is not necessary.
Address for correspondence
Dr N. A. MandallOrthodontic DepartmentTameside General HospitalFountain StreetAshton-under-LyneLancashire OL6 9RWUKe-mail: [email protected]
ReferencesAdes A G, Joondeph D R, Little R M, Chapko M K 1990 A long-term study
of the relationship of third molars to changes in the mandibular dental arch. American Journal of Orthodontics and Dentofacial Orthopedics 97: 323–335
Björk A, Skieller V 1972 Facial development and tooth eruption: an implant study at the age of puberty. American Journal of Orthodontics 62: 88–97
Destang D L, Kerr W J S 2003 Maxillary retention: is longer better? european Journal of Orthodontics 25: 65–69
Felton J M 1987 A computer analysis of the shape and stability of mandibular arch form. American Journal of Orthodontics and Dentofacial Orthopedics 92: 478–483
Harradine N W, Pearson M H, Toth B 1998 The effects of extraction of third molars on late lower incisor crowding: a randomized controlled trial. British Journal of Orthodontics 25: 117–122
Little R M 1975 The irregularity index: a quantitative score of mandibular anterior alignment. American Journal of Orthodontics 68: 249–257
Little R M, Wallen T R, Riedel R A 1981 Stability and relapse of mandibular anterior alignment—first premolar extraction cases treated by traditional edgewise orthodontics. American Journal of Orthodontics 80: 349–364
Little R M, Riedel R A, Stein A 1990 Mandibular arch length increase during the mixed dentition: post retention evaluation of stability and relapse. American Journal of Orthodontics and Dentofacial Orthopedics 97: 393–404
Littlewood S J, Millett D T, Doubleday B, Bearn D R, Worthington H V 2006 Orthodontic retention: a systematic review. Journal of Orthodontics 33: 205–212
Lopez-Gavito G, Wallen T R, Little R M, Joondeph D R 1985 Anterior open bite malocclusion: a longitudinal 10-years post retention evaluation of orthodontically treated patients. American Journal of Orthodontics 87: 175–186

M. SHAWeSH eT AL.170
Mills J R e 1968 The stability of the lower labial segment. Dental Practitioner 18: 293–305
O’Brien K, Lewis D, Shaw W, Combe e 1990 A clinical trial of aligning archwires. european Journal of Orthodontics 12: 380–384
Peck H, Peck S 1972 Crown dimensions and mandibular incisor alignment. American Journal of Orthodontics 62: 384–401
Reitan K 1959 Tissue rearrangement during retention of orthodontically rotated teeth. Angle Orthodontist 29: 105–113
Reitan K 1967 Clinical and histologic observation on tooth movement during and after orthodontic treatment. American Journal of Orthodontics 53: 721–790
Richardson M e 1979 Late lower arch crowding: facial growth or forward drift. european Journal of Orthodontics 1: 219–225
Richardson M e 1989 The role of third molar in the cause of late lower arch crowding: a review. American Journal of Orthodontics and Dentofacial Orthopedics 95: 79–83
Richardson M e 1996 Late lower arch crowding in the relation to direction of eruption. european Journal of Orthodontics 18: 341–347
Rowland H et al. 2007 The effectiveness of Hawley and vacuum-formed retainers: a single-center randomized controlled trial. American Journal of Orthodontics and Dentofacial Orthopedics 132: 730–737
Sadowsky C, Schneider B J, BeGole e A, Tahir e 1994 Long term stability after orthodontic treatment: non-extraction with prolonged retention. American Journal of Orthodontics and Dentofacial Orthopedics 195: 243–249
Southard T, Southard K A, Tolley E A 1992 Periodontal force: a potential cause of relapse. American Journal of Orthodontics and Dentofacial Orthopedics 101: 221–227
Wieslander L 1993 Long-term effect of treatment with the headgear -Herbst appliance in the early mixed dentition: stability or relapse? American Journal of Orthodontics and Dentofacial Orthopedics 104: 319–323
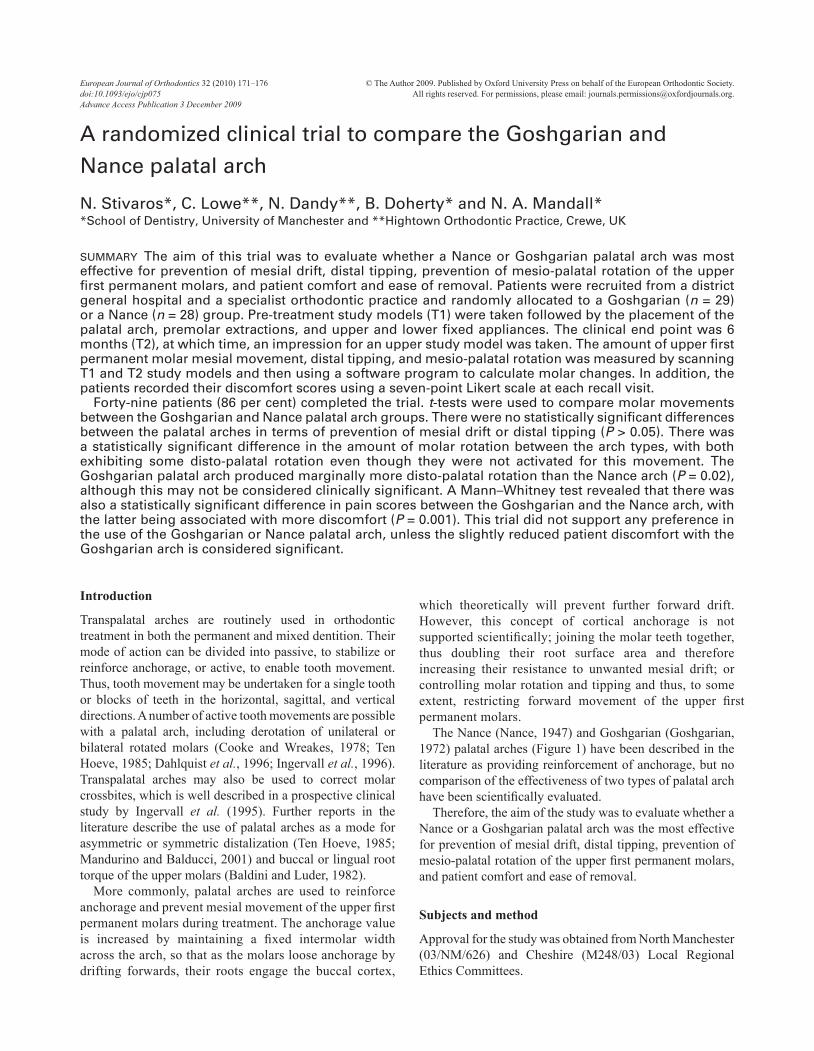
European Journal of Orthodontics 32 (2010) 171–176 © The Author 2009. Published by Oxford University Press on behalf of the European Orthodontic Society.doi:10.1093/ejo/cjp075 All rights reserved. For permissions, please email: [email protected] Access Publication 3 December 2009
Introduction
Transpalatal arches are routinely used in orthodontic treatment in both the permanent and mixed dentition. Their mode of action can be divided into passive, to stabilize or reinforce anchorage, or active, to enable tooth movement. Thus, tooth movement may be undertaken for a single tooth or blocks of teeth in the horizontal, sagittal, and vertical directions. A number of active tooth movements are possible with a palatal arch, including derotation of unilateral or bilateral rotated molars (Cooke and Wreakes, 1978; Ten Hoeve, 1985; Dahlquist et al., 1996; Ingervall et al., 1996). Transpalatal arches may also be used to correct molar crossbites, which is well described in a prospective clinical study by Ingervall et al. (1995). Further reports in the literature describe the use of palatal arches as a mode for asymmetric or symmetric distalization (Ten Hoeve, 1985; Mandurino and Balducci, 2001) and buccal or lingual root torque of the upper molars (Baldini and Luder, 1982).
More commonly, palatal arches are used to reinforce anchorage and prevent mesial movement of the upper first permanent molars during treatment. The anchorage value is increased by maintaining a fixed intermolar width across the arch, so that as the molars loose anchorage by drifting forwards, their roots engage the buccal cortex,
A randomized clinical trial to compare the Goshgarian and
Nance palatal arch
N. Stivaros*, C. Lowe**, N. Dandy**, B. Doherty* and N. A. Mandall**School of Dentistry, University of Manchester and **Hightown Orthodontic Practice, Crewe, UK
SUMMARY The aim of this trial was to evaluate whether a Nance or Goshgarian palatal arch was most effective for prevention of mesial drift, distal tipping, prevention of mesio-palatal rotation of the upper first permanent molars, and patient comfort and ease of removal. Patients were recruited from a district general hospital and a specialist orthodontic practice and randomly allocated to a Goshgarian (n = 29) or a Nance (n = 28) group. Pre-treatment study models (T1) were taken followed by the placement of the palatal arch, premolar extractions, and upper and lower fixed appliances. The clinical end point was 6 months (T2), at which time, an impression for an upper study model was taken. The amount of upper first permanent molar mesial movement, distal tipping, and mesio-palatal rotation was measured by scanning T1 and T2 study models and then using a software program to calculate molar changes. In addition, the patients recorded their discomfort scores using a seven-point Likert scale at each recall visit.
Forty-nine patients (86 per cent) completed the trial. t-tests were used to compare molar movements between the Goshgarian and Nance palatal arch groups. There were no statistically significant differences between the palatal arches in terms of prevention of mesial drift or distal tipping (P > 0.05). There was a statistically significant difference in the amount of molar rotation between the arch types, with both exhibiting some disto-palatal rotation even though they were not activated for this movement. The Goshgarian palatal arch produced marginally more disto-palatal rotation than the Nance arch (P = 0.02), although this may not be considered clinically significant. A Mann–Whitney test revealed that there was also a statistically significant difference in pain scores between the Goshgarian and the Nance arch, with the latter being associated with more discomfort (P = 0.001). This trial did not support any preference in the use of the Goshgarian or Nance palatal arch, unless the slightly reduced patient discomfort with the Goshgarian arch is considered significant.
which theoretically will prevent further forward drift. However, this concept of cortical anchorage is not supported scientifically; joining the molar teeth together, thus doubling their root surface area and therefore increasing their resistance to unwanted mesial drift; or controlling molar rotation and tipping and thus, to some extent, restricting forward movement of the upper first permanent molars.
The Nance (Nance, 1947) and Goshgarian (Goshgarian, 1972) palatal arches (Figure 1) have been described in the literature as providing reinforcement of anchorage, but no comparison of the effectiveness of two types of palatal arch have been scientifically evaluated.
Therefore, the aim of the study was to evaluate whether a Nance or a Goshgarian palatal arch was the most effective for prevention of mesial drift, distal tipping, prevention of mesio-palatal rotation of the upper first permanent molars, and patient comfort and ease of removal.
Subjects and method
Approval for the study was obtained from North Manchester (03/NM/626) and Cheshire (M248/03) Local Regional Ethics Committees.

N. STIvAROS ET AL.172
Sample size calculation
Since there was no comparative literature to suggest an expected difference between the Nance and Goshgarian palatal arches for loss of anchorage, a clinically significant difference of 2 mm of mesial movement between groups was used. A sample size in each group of n = 23, with a 0.050 two-sided significance level, will have a 90 per cent power to detect a difference of 2 mm of mesial movement of the upper first permanent molars between the Nance and the Goshgarian palatal arch groups, assuming a common standard deviation of 2 mm. Thus, a total of 46 patients needed to be recruited.
The sample was obtained by approaching consecutive patients, who fulfilled the inclusion criteria, attending for fixed orthodontic treatment at Tameside General Hospital, Ashton-under-Lyne, Lancashire, UK and a specialist orthodontic practice in Crewe, Cheshire, UK. The treatment was conducted by one orthodontic consultant (NAM), one specialist practitioner in orthodontics (CL), and one orthodontic postgraduate (NS).
Figure 1 The Nance (a) and Goshgarian (b) palatal arches.
Inclusion criteria
1. Patients aged 10-17 years at the start of treatment. 2. Upper premolar extractions. 3. Patient just about to commence orthodontic treatment. 4. Upper and/or lower preadjusted edgewise appliance
(McLaughlin, Bennett, Trevisi/MBT prescription) and stainless steel brackets.
5. Patient and parent informed and written consent.
Exclusion criteria
1. Requiring upper first permanent molar extractions. 2. Correction of a crossbite with expansion of the upper arch. 3. Non-extraction upper arch treatment. 4. Cases that required extra oral anchorage reinforcement
or distal movement of the upper first permanent molars. 5. Patients requiring orthognathic surgery. 6. Lack of consent.
Randomization was carried out using random number tables, where even numbers were assigned to the Nance palatal arch group and odd numbers to the Goshgarian palatal arch group. A restricted randomization method was used in blocks of 10 to ensure that equal numbers of patients were allocated to each treatment group. The treatment allocation was concealed in an opaque envelope and labelled with the study identification number. When the patient consented to the trial, the envelope was opened to reveal the treatment allocation. During the trial, the operator could not be blind to treatment allocation; however, the examiner who measured the study models (NS) did not know whether a Nance or a Goshgarian palatal arch had been used.
The type of malocclusion was recorded using the Incisor Classification of the British Standards Institution (1983). A standardized procedure was then used for every patient and the palatal arches fitted immediately prior to the upper arch extractions and fixed appliance placement. Both palatal arches were constructed using 0.9 mm stainless steel and were soldered to the molar bands. In the case of the Goshgarian palatal arch, the loop faced distally and was constructed so that it was 2–3 mm away from the palatal mucosa. The Nance palatal arch was designed with a large acrylic button extended to cover the steepest and deepest depth of the anterior palatal vault. Both palatal arches were cemented with chemical cure glass ionomer cement (Intact; Orthocare, Bradford, West Yorkshire, UK). The aim was not to activate the palatal arch to derotate the molars since the effectiveness of the prevention of mesio-palatal rotation was being investigated. In two subjects (one in each group) where the upper first molars were considerably mesio-palatally rotated at the start of treatment, a derotation activation was placed bilaterally in the palatal arch and these patients were excluded from the analysis.
173 A CLINICAL COMPARISON OF TWO PALATAL ARCHES
The remaining fixed appliance was then fitted using MBT prescription with an archwire sequence of 0.016 inch nickel titanium (Ni-Ti), 0.018 × 0.025 inch Ni-Ti and 0.019 × 0.025 inch stainless steel. During the levelling and aligning phase of treatment, which comprised a 6 month observation period, no mechanics were used that may have brought the upper first permanent molars more mesially than would be assumed by loss of anchorage alone. In addition, no canine lacebacks were placed. The palatal arch was removed at the clinical end point of 6 months (T2). The patients were then sent away for 1 week and told to brush their palate. This was to ensure that the palatal mucosa in the Nance palatal arch group was not swollen or hyperplastic when the impression was taken, as this would have enabled the observer to determine that the patient had worn the Nance palatal arch. One week after removal of the palatal arch, an end point upper alginate impression was taken and either new upper first molar bands were cemented or the palatal arch was re-cemented if it was deemed clinically necessary.
Outcome measures
The following outcome measures were assessed in relation to the position of the upper first permanent molars: mesial movement, distal tipping, prevention of mesio-palatal rotation, patient discomfort, ease of removal of the palatal arch, and whether or not local anaesthesia was required for removal.
Mesial movement, distal tipping, and prevention of mesio-palatal rotation were assessed by comparing the difference in the position of the upper first permanent molars on the T1 and T2 study models. The models were scanned with an updated version of the Konica Minolta vivid 700 three-dimensional (3D) laser scanner (www.konicaminolta.com). The laser digitizer is placed on a moveable turntable and a point of laser light is shone on the surface of the object to be scanned. The reflected beam is then intercepted by a sensor, which converts it into 3D co-ordinates; this is known as triangulation. The computer software program, Rapid Form 2004 (Konica), was then used to create the 3D model and calculate the tooth movements of interest using the palatal rugae as reference points. Figure 2 shows the measurements taken on one set of start (T1) study models.
Patient discomfort was measured on a seven-point Likert scale, at each visit, where a score of 1 indicated no pain and a score of 7 severe pain. A mean score was calculated. Ease of removal of each palatal arch was recorded as whether the palatal arch embedded or impinged on the palatal mucosa (yes/no) and whether local anaesthesia was required for its removal (yes/no).
Method error
Systematic error was reduced by the examiner being blind to the treatment group when the model measurements were carried out. The examiner was also blind as to whether the models were obtained at T1 or T2. All models were measured
in a random order so the patients’ T1 and T2 models were not measured consecutively. Random error was reduced by measuring all study models twice and calculating a mean.
Examiner calibration and reliability
The examiner was trained in the use of the laser scanner and calibration was carried out using four plaster calibration cubes with different known heights and widths that had been verified by the Engineering Department, University of Manchester, UK as the gold standard. Intra-examiner reliability of the measurements was assessed by re-measuring 20 study models after an interval of at least 1 week.
Statistical analysis
The data were checked for normality and simple summary statistics produced. t-tests were used to compare the palatal arch groups in terms of upper first permanent molar mesial movement, distal tipping, and prevention of mesio-palatal rotation. Left and right molar movements were averaged for analysis. A Mann–Whitney test was used to compare pain scores between the two palatal arch groups and chi-square statistics to compare the groups in terms of ease of removal of the palatal arch and whether or not local anaesthesia was required. Examiner calibration and reliability was assessed using intraclass correlation coefficients (ICC). Pearson correlation coefficients for examiner calibration were 1.00 for height measurements and 0.99 for width measurements. Intra-examiner reliability for all tooth movement measurements was high, with an ICC of 0.98 or above.
Results
The trial profile is shown in Table 1. Of the 57 patients initially registered, the final sample size for data analysis was 49. Six patients (four females and two males) were not included in the data analysis since they were lost to follow-up. Two further patients needed disto-palatal activation of their palatal arches so were excluded from the analysis. The mean age for the Goshgarian palatal arch group was 14 years 6 months and that of the Nance group 14 years 3 months. There was no statistically significant difference between the groups for age (P = 0.54), thus exhibiting pre-treatment equivalence for this variable. In addition, there was no statistically significant difference in gender between the two palatal arch groups (P = 0.035) or initial malocclusion (P = 0.29).
Upper first permanent molar mesial movement, distal tipping, and prevention of mesio-palatal rotation
Table 2 shows that there was no statistically significant difference between the Goshgarian and Nance palatal arch in

N. STIvAROS ET AL.174
Figure 2 Upper first permanent molar mesial movement (a and b), tipping (c), and rotation (e and d).
terms of prevention of mesial movement or distal tipping (P > 0.05). The average mesial movement for both groups was in the order of 0.5–1 mm over the 6 month period. Overall, there was, in fact, mesial tipping for both groups and this was in the order of 2–3 degrees, with wide standard deviations.
In contrast, there was a statistically significant difference in the prevention of mesio-palatal rotation between the palatal arch groups. The Goshgarian palatal arch group exhibited a small amount of disto-palatal rotation of around 4.5 degrees compared with the Nance at just over 2 degrees (P = 0.017).

175 A CLINICAL COMPARISON OF TWO PALATAL ARCHES
Table 1 Trial profile.
Registered patients n = 57
Not randomized n = 0 Randomization n = 57
Goshgarian palatal arch Nance palatal arch Intervention n = 29 Intervention n = 28 Followed-up n = 24 Followed-up n = 25 Withdrawn n = 1* Withdrawn n = 1* Intervention ineffective n = 0 Intervention ineffective n = 0 Lost to follow-up n = 4 Lost to follow-up n = 2 Completed trial n = 24 Completed trial n = 25
*Withdrawn from analysis because palatal arch activated for derotation.
Table 2 Comparison of Nance and Goshgarian palatal arches for upper first permanent molar mesial movement, tipping, and rotation.
Tooth movement Palatal arch Mean (SD) SE mean t value P value 95% Confidence interval
Mesial movement (mm) Goshgarian 0.98 (1.02) 0.20 0.68 0.50 −0.44 to 0.90Nance 0.72 (1.33) 0.26
Rotation * (°) Goshgarian 4.43 (3.74) 0.75 2.50 0.02 0.44 to 4.19Nance 2.11 (2.68) 0.55
Tipping * (°) Goshgarian −2.09 (4.29) 1.07 0.37 0.72 −3.07 to 4.41Nance −2.75 (6.04) 1.46
*+ve value indicates disto-palatal rotation or distal tipping; −ve value indicates mesio-palatal rotation or mesial tipping.
This was surprising as the palatal arches were not activated for disto-palatal rotation but there was still a tendency for this movement to occur between 2–4 degrees in both groups.
Patient discomfort scores and ease of removal of the palatal arches
There was a statistically significant difference in discomfort scores between the two groups, with the Nance palatal arch reported to be more uncomfortable (median Likert score = 2) compared with the Goshgarian (median Likert score = 1; P = 0.001). No gagging problems were reported with either palatal arch design. Two Nance palatal arches, but no Goshgarian palatal arches, were embedded in the mucosa (chi-square 2.002, 1 degree of freedom, P value = 0.16). No local anaesthesia was required to remove any of the palatal arches.
Assessment of potential bias through patients who dropped out of the study was carried out by comparing the malocclusion, gender, and age between the patients staying in and those dropping out of the study. There was no statistically significant difference between the patients remaining in the study and those who did not (P > 0.05), so there should be no bias as a result of losing eight patients from the sample.
Discussion
This trial did not find a clinically significant difference between the Nance and Goshgarian palatal arches in terms
of prevention of mesial drift, distal tipping, or prevention of mesio-palatal rotation of the upper first permanent molars. However, there was a difference between the two groups in terms of increased discomfort experienced by the patients wearing the Nance palatal arch.
The results of this study revealed that the amount and type of tooth movement from the two appliances was small. When the average molar movement between the right and left sides was measured for each palatal arch type, the Goshgarian palatal arch allowed the molars to mesialize slightly more than the Nance (0.94 versus 0.72 mm) over a 6 month period. These values were very small and indeed there was no statistically or clinically significant difference between the arch types in preventing anchorage loss. It is difficult to make comparison with previous literature because of the lack of randomized clinical trials. Although not directly related to the appliances used in this trial, Rebellato et al. (1997) conducted a prospective clinical trial investigating whether a lower lingual arch was effective at preventing mesial migration of the lower first permanent molars. Their results showed that the molars mesialized in the treatment group by 0.29 mm, which was marginally less than the findings in the present study. However, caution must be exercised when making comparisons between studies: firstly the investigation by Rebellato et al. (1997) had no fixed appliance in situ and secondly they were investigating mandibular molar movement, which tends to be slower than its maxillary counterpart.
This trial demonstrated that in some patients the molars rotated mesio-palatally during treatment but the overall average was for the molar to derotate disto-palatally (4.4 degrees with the Goshgarian and 2.1 degrees with the Nance). The difference was statistically significant; however, it is doubtful whether a difference of only 2.3 degrees between groups is clinically significant. In addition, it is difficult to explain why any disto-palatal rotation occurred in either group, as the palatal arches were not activated to straighten the molars. It is possible that the 0.019 × 0.025 inch stainless steel working archwire, in conjunction with the appliance prescription, caused a mean disto-palatal molar rotation, despite a rigid soldered palatal arch being in place.

N. STIvAROS ET AL.176
Although the findings demonstrated that in some patients the molars tipped distally, this was in a minority of cases and the overall tendency was for the molars to tip mesially (2.09 degrees with the Goshgarian and 2.75 degrees with the Nance). The difference between the groups was not statistically significant and thus one appliance was no better than the other for preventing mesial tipping. It was perhaps surprising that more distal tipping was not observed in the Goshgarian group as Chiba et al. (2003) suggested that tongue pressure on a distally directed U loop would tip the molars distally. It is probable that the design in this study to minimize patient discomfort, meant that the position of the U loop was too near the palate for tongue pressure to have had a significant tipping effect.
The clinical end point of 6 months was used to avoid any delay in treatment since some patients were ready for space closure mechanics. It would have been clinically useful to continue measuring anchorage loss during space closure. However, this was not carried out because some patients required no further anchorage reinforcement and the palatal arch needed to be removed to allow mesial movement of the upper buccal segments.
When the possibility of the palatal arch embedding in the oral mucosa was considered, again there were no statistically significant differences between the palatal arch types. This is not in agreement with the general clinical observation that Nance palatal arches tend to embed into the palatal mucosa because of the proximity of the palatal acrylic to the palate. However, the two arches that did embed were of the Nance design but local anaesthesia was not needed for their removal. It may be that the absence of acrylic embedding into the palatal mucosa was because the surface area of the acrylic was large, or that no significant space closure mechanics were used during the 6 month observation period.
Clinical significance
Generally, no differences were observed between the clinical behaviour of the Goshgarian and Nance palatal arches. Although some statistically significant differences were found between the groups, examination of the mean values did not suggest a clinically meaningful difference. Thus, when a clinician is choosing which palatal arch to use, both designs are effective in only allowing around 1 mm of mesial movement of the upper first permanent molars over a 6 month period.
Consideration was given to whether to include a group with no palatal arch. However, there was a possibility that a group with low anchorage requirement, and no need for a palatal arch, may have been inherently different compared with patients requiring one. Therefore, a group with no palatal arch could have had different start characteristics and not be comparable with the other groups at baseline. For this reason, it was decided to compare two types of palatal arch and not attempt to introduce a control group.
Conclusions
There was no statistical or clinical advantage in the use of either the Goshgarian or Nance palatal arch in terms of prevention of mesial molar movement or distal molar tipping during the first 6 months of orthodontic treatment. Differences in prevention of mesio-palatal rotation are unlikely to be clinically significant. The trial does not support the use of one palatal arch or another, unless the slightly reduced patient discomfort for the Goshgarian arch is considered clinically significant.
Address for correspondence
Dr N A MandallOrthodontic DepartmentTameside General HospitalFountain StreetAshton-under-LyneLancashire OL6 9RWUKE-mail: [email protected]
ReferencesBaldini G, Luder H 1982 Influence of arch shape on the transverse
effects of transpalatal arches of the Goshgarian type during application of buccal root torque. American Journal of Orthodontics 81: 202–208
British Standards Institution 1983 British Standard Incisor Classification. Glossary of dental terms BS4492. British Standard Institute, London
Chiba Y, Motoyoshi M, Namura S 2003 Tongue pressure on loop transpalatal arch during deglutition. American Journal of Orthodontics and Dentofacial Orthopedics 123: 29–34
Cooke M S, Wreakes G 1978 Molar derotation with a modified palatal arch: an improved technique. British Journal of Orthodontics 5: 201–203
Dahlquist A, Gebauer U, Ingervall B 1996 The effect of a transpalatal arch for the correction of first molar rotation. European Journal of Orthodontics 18: 257–267
Goshgarian R A 1972 Orthodontic palatal arch wires. United States Government Patent Office. Alexandria, Virginia (Patent number 3792529)
Ingervall B, Göllner P, Gebauer U, Fröhlich K 1995 A clinical investigation of the correction of unilateral first molar crossbite with a transpalatal arch. American Journal of Orthodontics and Dentofacial Orthopedics 107: 418–425
Ingervall B, Hönigl K D, Bantleon H P 1996 Moments and forces delivered by transpalatal arches for symmetrical first molar rotation. European Journal of Orthodontics 18: 131–139
Mandurino M, Balducci L 2001 Asymmetric distalisation with a TMA transpalatal arch. Journal of Clinical Orthodontics 35: 174–178
Nance H N 1947 The limitations of orthodontic treatment 1: mixed dentition diagnosis and treatment. American Journal of Orthodontics and Oral Surgery 33: 177–223
Rebellato J, Lindauer S J, Rubenstein L K, Isaacson R J, Davidovitch M, vroom K 1997 Lower arch perimeter preservation using the lingual arch. American Journal of Orthodontics and Dentofacial Orthopedics 112: 208–217
Ten Hoeve A 1985 Palatal bar and lip bumper in non-extraction treatment. Journal of Clinical Orthodontics 4: 272–291
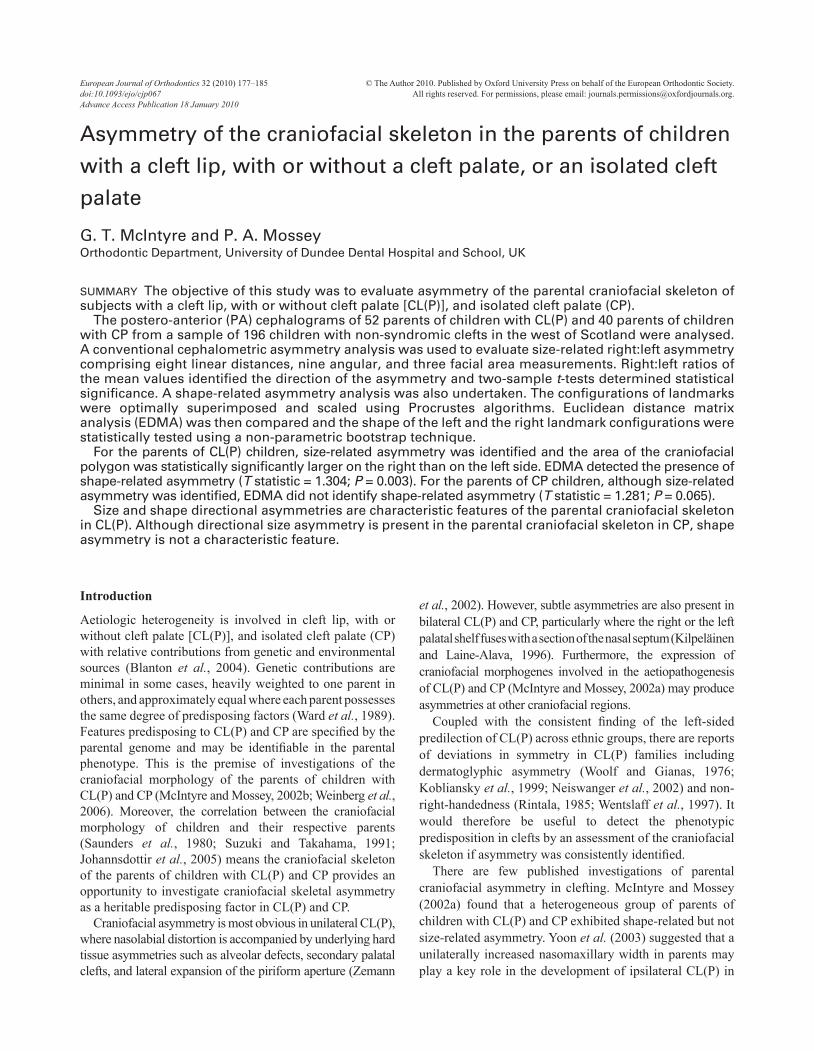
European Journal of Orthodontics 32 (2010) 177–185 © The Author 2010. Published by Oxford University Press on behalf of the European Orthodontic Society.doi:10.1093/ejo/cjp067 All rights reserved. For permissions, please email: [email protected] Access Publication 18 January 2010
Introduction
Aetiologic heterogeneity is involved in cleft lip, with or without cleft palate [CL(P)], and isolated cleft palate (CP) with relative contributions from genetic and environmental sources (Blanton et al., 2004). Genetic contributions are minimal in some cases, heavily weighted to one parent in others, and approximately equal where each parent possesses the same degree of predisposing factors (Ward et al., 1989). Features predisposing to CL(P) and CP are specified by the parental genome and may be identifiable in the parental phenotype. This is the premise of investigations of the craniofacial morphology of the parents of children with CL(P) and CP (McIntyre and Mossey, 2002b; Weinberg et al., 2006). Moreover, the correlation between the craniofacial morphology of children and their respective parents (Saunders et al., 1980; Suzuki and Takahama, 1991; Johannsdottir et al., 2005) means the craniofacial skeleton of the parents of children with CL(P) and CP provides an opportunity to investigate craniofacial skeletal asymmetry as a heritable predisposing factor in CL(P) and CP.
Craniofacial asymmetry is most obvious in unilateral CL(P), where nasolabial distortion is accompanied by underlying hard tissue asymmetries such as alveolar defects, secondary palatal clefts, and lateral expansion of the piriform aperture (Zemann
Asymmetry of the craniofacial skeleton in the parents of children
with a cleft lip, with or without a cleft palate, or an isolated cleft
palate
G. T. McIntyre and P. A. MosseyOrthodontic Department, University of Dundee Dental Hospital and School, UK
et al., 2002). However, subtle asymmetries are also present in bilateral CL(P) and CP, particularly where the right or the left palatal shelf fuses with a section of the nasal septum (Kilpeläinen and Laine-Alava, 1996). Furthermore, the expression of craniofacial morphogenes involved in the aetiopathogenesis of CL(P) and CP (McIntyre and Mossey, 2002a) may produce asymmetries at other craniofacial regions.
Coupled with the consistent finding of the left-sided predilection of CL(P) across ethnic groups, there are reports of deviations in symmetry in CL(P) families including dermatoglyphic asymmetry (Woolf and Gianas, 1976; Kobliansky et al., 1999; Neiswanger et al., 2002) and non-right-handedness (Rintala, 1985; Wentslaff et al., 1997). It would therefore be useful to detect the phenotypic predisposition in clefts by an assessment of the craniofacial skeleton if asymmetry was consistently identified.
There are few published investigations of parental craniofacial asymmetry in clefting. McIntyre and Mossey (2002a) found that a heterogeneous group of parents of children with CL(P) and CP exhibited shape-related but not size-related asymmetry. Yoon et al. (2003) suggested that a unilaterally increased nasomaxillary width in parents may play a key role in the development of ipsilateral CL(P) in
SUMMARY The objective of this study was to evaluate asymmetry of the parental craniofacial skeleton of subjects with a cleft lip, with or without cleft palate [CL(P)], and isolated cleft palate (CP).
The postero-anterior (PA) cephalograms of 52 parents of children with CL(P) and 40 parents of children with CP from a sample of 196 children with non-syndromic clefts in the west of Scotland were analysed. A conventional cephalometric asymmetry analysis was used to evaluate size-related right:left asymmetry comprising eight linear distances, nine angular, and three facial area measurements. Right:left ratios of the mean values identified the direction of the asymmetry and two-sample t-tests determined statistical significance. A shape-related asymmetry analysis was also undertaken. The configurations of landmarks were optimally superimposed and scaled using Procrustes algorithms. Euclidean distance matrix analysis (EDMA) was then compared and the shape of the left and the right landmark configurations were statistically tested using a non-parametric bootstrap technique.
For the parents of CL(P) children, size-related asymmetry was identified and the area of the craniofacial polygon was statistically significantly larger on the right than on the left side. EDMA detected the presence of shape-related asymmetry (T statistic = 1.304; P = 0.003). For the parents of CP children, although size-related asymmetry was identified, EDMA did not identify shape-related asymmetry (T statistic = 1.281; P = 0.065).
Size and shape directional asymmetries are characteristic features of the parental craniofacial skeleton in CL(P). Although directional size asymmetry is present in the parental craniofacial skeleton in CP, shape asymmetry is not a characteristic feature.
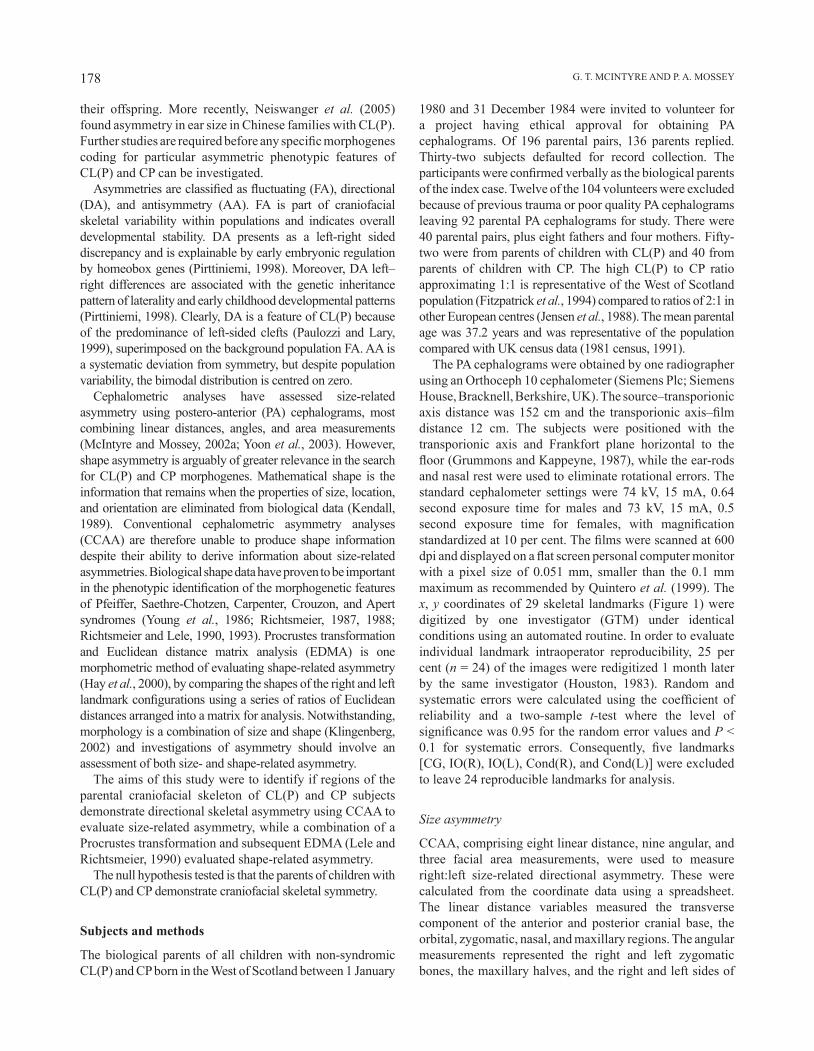
G. T. MCINTYRE AND P. A. MOSSEY178
their offspring. More recently, Neiswanger et al. (2005) found asymmetry in ear size in Chinese families with CL(P). Further studies are required before any specific morphogenes coding for particular asymmetric phenotypic features of CL(P) and CP can be investigated.
Asymmetries are classified as fluctuating (FA), directional (DA), and antisymmetry (AA). FA is part of craniofacial skeletal variability within populations and indicates overall developmental stability. DA presents as a left-right sided discrepancy and is explainable by early embryonic regulation by homeobox genes (Pirttiniemi, 1998). Moreover, DA left–right differences are associated with the genetic inheritance pattern of laterality and early childhood developmental patt erns (Pirttiniemi, 1998). Clearly, DA is a feature of CL(P) because of the predominance of left-sided clefts (Paulozzi and Lary, 1999), superimposed on the background population FA. AA is a systematic deviation from symmetry, but despite population variability, the bimodal distribution is centred on zero.
Cephalometric analyses have assessed size-related asymmetry using postero-anterior (PA) cephalo grams, most combining linear distances, angles, and area measurements (McIntyre and Mossey, 2002a; Yoon et al., 2003). However, shape asymmetry is arguably of greater relevance in the search for CL(P) and CP morphogenes. Mathematical shape is the information that remains when the properties of size, location, and orientation are eliminated from biological data (Kendall, 1989). Conventional cephalometric asymmetry analyses (CCAA) are therefore unable to produce shape information despite their ability to derive information about size-related asymmetries. Biological shape data have proven to be important in the phenotypic identification of the morphogenetic features of Pfeiffer, Saethre-Chotzen, Carpenter, Crouzon, and Apert syndromes (Young et al., 1986; Richtsmeier, 1987, 1988; Richtsmeier and Lele, 1990, 1993). Procrustes transformation and Euclidean distance matrix analysis (EDMA) is one morphometric method of evaluating shape-related asymmetry (Hay et al., 2000), by comparing the shapes of the right and left landmark configurations using a series of ratios of Euclidean distances arranged into a matrix for analysis. Notwithstanding, morphology is a combination of size and shape (Klingenberg, 2002) and investigations of asymmetry should involve an assessment of both size- and shape-related asymmetry.
The aims of this study were to identify if regions of the parental craniofacial skeleton of CL(P) and CP subjects demonstrate directional skeletal asymmetry using CCAA to evaluate size-related asymmetry, while a combination of a Procrustes transformation and subsequent EDMA (Lele and Richtsmeier, 1990) evaluated shape-related asymmetry.
The null hypothesis tested is that the parents of children with CL(P) and CP demonstrate craniofacial skeletal symmetry.
Subjects and methods
The biological parents of all children with non-syndromic CL(P) and CP born in the West of Scotland between 1 January
1980 and 31 December 1984 were invited to volunteer for a project having ethical approval for obtaining PA cephalograms. Of 196 parental pairs, 136 parents replied. Thirty-two subjects defaulted for record collection. The participants were confirmed verbally as the biological parents of the index case. Twelve of the 104 volunteers were excluded because of previous trauma or poor quality PA cephalograms leaving 92 parental PA cephalograms for study. There were 40 parental pairs, plus eight fathers and four mothers. Fifty-two were from parents of children with CL(P) and 40 from parents of children with CP. The high CL(P) to CP ratio approximating 1:1 is representative of the West of Scotland population (Fitzpatrick et al., 1994) compared to ratios of 2:1 in other European centres (Jensen et al., 1988). The mean parental age was 37.2 years and was representative of the population compared with UK census data (1981 census, 1991).
The PA cephalograms were obtained by one radiographer using an Orthoceph 10 cephalometer (Siemens Plc; Siemens House, Bracknell, Berkshire, UK). The source–transporionic axis distance was 152 cm and the transporionic axis–film distance 12 cm. The subjects were positioned with the transporionic axis and Frankfort plane horizontal to the floor (Grummons and Kappeyne, 1987), while the ear-rods and nasal rest were used to eliminate rotational errors. The standard cephalometer settings were 74 kV, 15 mA, 0.64 second exposure time for males and 73 kV, 15 mA, 0.5 second exposure time for females, with magnification standardized at 10 per cent. The films were scanned at 600 dpi and displayed on a flat screen personal computer monitor with a pixel size of 0.051 mm, smaller than the 0.1 mm maximum as recommended by Quintero et al. (1999). The x, y coordinates of 29 skeletal landmarks (Figure 1) were digitized by one investigator (GTM) under identical conditions using an automated routine. In order to evaluate individual landmark intraoperator reproducibility, 25 per cent (n = 24) of the images were redigitized 1 month later by the same investigator (Houston, 1983). Random and systematic errors were calculated using the coefficient of reliability and a two-sample t-test where the level of significance was 0.95 for the random error values and P < 0.1 for systematic errors. Consequently, five landmarks [CG, IO(R), IO(L), Cond(R), and Cond(L)] were excluded to leave 24 reproducible landmarks for analysis.
Size asymmetry
CCAA, comprising eight linear distance, nine angular, and three facial area measurements, were used to measure right:left size-related directional asymmetry. These were calculated from the coordinate data using a spreadsheet. The linear distance variables measured the transverse component of the anterior and posterior cranial base, the orbital, zygomatic, nasal, and maxillary regions. The angular measurements represented the right and left zygomatic bones, the maxillary halves, and the right and left sides of
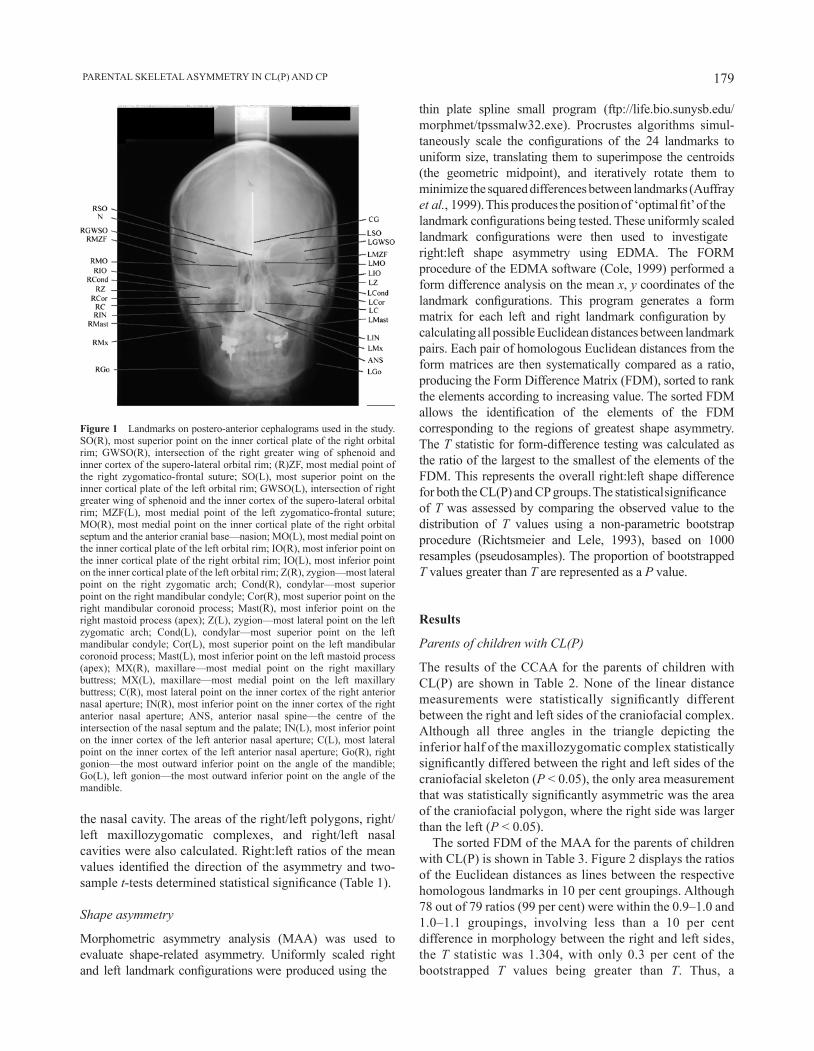
179 PARENTAL SKELETAL ASYMMETRY IN CL(P) AND CP
Figure 1 Landmarks on postero-anterior cephalograms used in the study. SO(R), most superior point on the inner cortical plate of the right orbital rim; GWSO(R), intersection of the right greater wing of sphenoid and inner cortex of the supero-lateral orbital rim; (R)ZF, most medial point of the right zygomatico-frontal suture; SO(L), most superior point on the inner cortical plate of the left orbital rim; GWSO(L), intersection of right greater wing of sphenoid and the inner cortex of the supero-lateral orbital rim; MZF(L), most medial point of the left zygomatico-frontal suture; MO(R), most medial point on the inner cortical plate of the right orbital septum and the anterior cranial base—nasion; MO(L), most medial point on the inner cortical plate of the left orbital rim; IO(R), most inferior point on the inner cortical plate of the right orbital rim; IO(L), most inferior point on the inner cortical plate of the left orbital rim; Z(R), zygion—most lateral point on the right zygomatic arch; Cond(R), condylar—most superior point on the right mandibular condyle; Cor(R), most superior point on the right mandibular coronoid process; Mast(R), most inferior point on the right mastoid process (apex); Z(L), zygion—most lateral point on the left zygomatic arch; Cond(L), condylar—most superior point on the left mandibular condyle; Cor(L), most superior point on the left mandibular coronoid process; Mast(L), most inferior point on the left mastoid process (apex); MX(R), maxillare—most medial point on the right maxillary buttress; MX(L), maxillare—most medial point on the left maxillary buttress; C(R), most lateral point on the inner cortex of the right anterior nasal aperture; IN(R), most inferior point on the inner cortex of the right anterior nasal aperture; ANS, anterior nasal spine—the centre of the intersection of the nasal septum and the palate; IN(L), most inferior point on the inner cortex of the left anterior nasal aperture; C(L), most lateral point on the inner cortex of the left anterior nasal aperture; Go(R), right gonion—the most outward inferior point on the angle of the mandible; Go(L), left gonion—the most outward inferior point on the angle of the mandible.
the nasal cavity. The areas of the right/left polygons, right/left maxillozygomatic complexes, and right/left nasal cavities were also calculated. Right:left ratios of the mean values identified the direction of the asymmetry and two-sample t-tests determined statistical significance (Table 1).
Shape asymmetry
Morphometric asymmetry analysis (MAA) was used to evaluate shape-related asymmetry. Uniformly scaled right and left landmark configurations were produced using the
thin plate spline small program (ftp://life.bio.sunysb.edu/ morphmet/tpssmalw32.exe). Procrustes algorithms simul-taneously scale the configurations of the 24 landmarks to uniform size, translating them to superimpose the centroids (the geometric midpoint), and iteratively rotate them to minimize the squared differences between landmarks (Auffray et al., 1999). This produces the position of ‘optimal fit’ of the landmark configurations being tested. These uniformly scaled landmark configurations were then used to investigate right:left shape asymmetry using EDMA. The FORM procedure of the EDMA software (Cole, 1999) performed a form difference analysis on the mean x, y coordinates of the landmark configurations. This program generates a form matrix for each left and right landmark configuration by calculating all possible Euclidean distances between landmark pairs. Each pair of homologous Euclidean distances from the form matrices are then systematically compared as a ratio, producing the Form Difference Matrix (FDM), sorted to rank the elements according to increasing value. The sorted FDM allows the identification of the elements of the FDM corresponding to the regions of greatest shape asymmetry. The T statistic for form-difference testing was calculated as the ratio of the largest to the smallest of the elements of the FDM. This represents the overall right:left shape difference for both the CL(P) and CP groups. The statistical significance of T was assessed by comparing the observed value to the distribution of T values using a non-parametric bootstrap procedure (Richtsmeier and Lele, 1993), based on 1000 resamples (pseudosamples). The proportion of boot strapped T values greater than T are represented as a P value.
Results
Parents of children with CL(P)
The results of the CCAA for the parents of children with CL(P) are shown in Table 2. None of the linear distance measurements were statistically significantly different between the right and left sides of the craniofacial complex. Although all three angles in the triangle depicting the inferior half of the maxillozygomatic complex statistically significantly differed between the right and left sides of the craniofacial skeleton (P < 0.05), the only area measurement that was statistically significantly asymmetric was the area of the craniofacial polygon, where the right side was larger than the left (P < 0.05).
The sorted FDM of the MAA for the parents of children with CL(P) is shown in Table 3. Figure 2 displays the ratios of the Euclidean distances as lines between the respective homologous landmarks in 10 per cent groupings. Although 78 out of 79 ratios (99 per cent) were within the 0.9–1.0 and 1.0–1.1 groupings, involving less than a 10 per cent difference in morphology between the right and left sides, the T statistic was 1.304, with only 0.3 per cent of the bootstrapped T values being greater than T. Thus, a

G. T. MCINTYRE AND P. A. MOSSEY180
Table 2 Conventional cephalometric asymmetry analysis [means, standard deviations, right (R)/left (L) ratios, and two-sample t -test results] of parents of children with cleft lip with or without cleft palate.
Variable Right (mm) Left (mm) Ratio (R:L) P value
GSWO–N 56.8 (2.1) 57.2 (2.3) 0.992 0.342MO–N 16.2 (2.0) 16.1 (2.0) 1.01 0.648Z–N 87.2 (4.2) 88.0 (4.8) 0.99 0.351Z–ANS 87.7 (4.7) 88.8 (5.4) 0.988 0.311MAST–ANS 70.1 (4.2) 71.6 (4.1) 0.979 0.088MX–ANS 36.5 (2.2) 37.5 (2.5) 0.973 0.039C–ANS 20.9 (2.1) 21.4 (2.3) 0.974 0.261IN–ANS 10.3 (1.6) 11.2 (2.0) 0.922 0.025Variable Right (°) Left (°) Ratio (R:L) P valueMaxilla + zygoma ANS–MZF–Z 83.1(9.6) 83.8 (10.7) 0.991 0.733 ANS–Z–MZF 71.5 (6.8) 70.4 (7.6) 1.015 0.442 MZF–ANS–Z 25.3 (4.4) 25.7 (4.4) 0.984 0.634 ANS–Z–MX 26.9 (2.4) 18.6 (2.8) 1.446 ** ANS–MX–Z 105.2 (5.6) 130.4 (8.1) 0.806 ** Z–ANS–MX 47.8 (4.8) 30.9 (6) 1.546 **Nasal cavity N–C–ANS 97.2 (6.1) 95.5 (6.5) 1.017 0.161 N–ANS–C 62.2 (5.1) 63.3 (5.1) 0.982 0.254 C–N–ANS 20.5 (2.7) 21.1 (3) 0.971 0.298Variable Right (mm2) Left (mm2) Ratio (R:L) P valuePolygon area 5697 (523) 4864 (376) 1.171 ***Maxilla + zygoma area 2443 (623) 2519 (276) 0.969 0.153Nasal cavity area 557 (79) 576 (86) 0.967 0.24
**P ≤ 0.01; ***P ≤ 0.001.
Table 1 Variables selected for conventional cephalometric asymmetry analysis.
Region described Right Left
Linear distances Anterior cranial base GWSO(R)–N N–GWSO(L)Inner orbital width MO(R)–N N–MO(L)Facial width Z(R)–N N–Z(L)Facial width Z(R)–ANS ANS–Z(L)Mastoid width MAST(R)–ANS ANS–MAST(L)Maxillary width MX(R)–ANS ANS–MX(L)Nasal width C(R)–ANS ANS–C(L)Width of nasal floor IN(R)–ANS ANS–IN(L)
Angles Maxillozygomatic complex ANS–MZF(R)–Z(R) ANS–MZF(L)–Z(L)Maxillozygomatic complex ANS–Z(R)–MZF(R) ANS–Z(L)–MZF(L)Maxillozygomatic complex MZF(R)–ANS–Z(R) MZF(L)–ANS–Z(L)Maxillozygomatic complex ANS–Z(R)–MX(R) ANS–Z(L)–MX(L)Maxillozygomatic complex ANS–MX(R)–Z(R) ANS–MX(L)–Z(L)Maxillozygomatic complex Z(R)–ANS–MX(R) Z(L)–ANS–MX(L)Nasal cavity N–C(R)–ANS N–C(L)–ANSNasal cavity N–ANS–C(R) N–ANS–C(L)Nasal cavity C(R)–N–ANS C(L)–N–ANS
Areas Right/left polygon SO(R)–N–ANS + SO(R)–GWSO(R)–ANS + GWSO(R)–MZF(R)–ANS + MZF(R)–Z(R)– ANS + Z(R)–MX(R)–ANS
SO(L)–N–ANS + SO(L)–GWSO(L)–ANS + GWSO(L)–MZF(L)–ANS + MZF(L)–Z(L)– ANS + Z(L)–MX(L)–ANS
Right/left maxilla + zygoma ANS–MZF(R)–Z(R) + ANS–Z(R)–MX(R) ANS–MZF(L)–Z(L) + ANS–Z(L)–MX(L)Right/left nasal cavity N–C(R)–ANS N–C(L)–ANS
statistically significant morphological difference existed between the right and left sides of the craniofacial complex in the parents of children with CL(P), P = 0.003). There were no ratios below 0.9 or greater than 1.2. The median ratio was 1.001, between MX and C.
Parents of children with CP
The results of CCAA for the parents of CP subjects are shown in Table 4. All three angles in the triangle depicting the inferior half of the maxillozygomatic complex statisti cally significantly differed on the right and left sides (P < 0.05), while the

181 PARENTAL SKELETAL ASYMMETRY IN CL(P) AND CP
Table 3 Asymmetry of parents of children with a cleft lip, with or without cleft palate. Euclidean distance matrix analysis sorted to rank the elements according to increasing value.
Euclidean distance Ratio Euclidean distance Ratio
COR–MAST 0.901 MZF–MX 1.001IN–ANS 0.933 MZF–GO 1.001MZF–MAST 0.972 COR–C 1.002Z–MAST 0.972 COR–IN 1.002MZF–Z 0.976 SO–C 1.002SO–MO 0.977 MO–MX 1.002MX–ANS 0.978 MZF–C 1.002C–ANS 0.979 Z–IN 1.003COR–MX 0.980 MO–C 1.003ANS–GO 0.981 GWSO–ANS 1.003MO–MAST 0.984 N–IN 1.004COR–GO 0.984 Z–MX 1.005MAST–ANS 0.985 N–ANS 1.005SO–N 0.986 SO–IN 1.005N–MAST 0.986 SO–MX 1.006MAST–C 0.988 SO–GO 1.006GWSO–MAST 0.989 GWSO–Z 1.006IN–GO 0.989 MZF–IN 1.006SO–MAST 0.990 MO–ANS 1.007COR–ANS 0.991 MZF–MO 1.007GWSO–MO 0.993 SO–Z 1.007MAST–IN 0.993 GWSO–C 1.007MX–GO 0.994 MZF–N 1.008MO–Z 0.994 MO–IN 1.009Z–ANS 0.994 GWSO–GO 1.010C–GO 0.995 MO–N 1.010N–Z 0.996 GWSO–MX 1.010MX–IN 0.997 GWSO–IN 1.010MAST–MX 0.997 Z–GO 1.013N–GO 0.997 N–COR 1.017N–C 0.998 SO–GWSO 1.020GWSO–N 0.998 MO–COR 1.024N–MX 0.999 C–IN 1.026MO–GO 1.000 MZF–COR 1.034Z–COR 1.000 SO–COR 1.039Z–C 1.000 MAST–GO 1.050MZF–ANS 1.000 GWSO–COR 1.052SO–ANS 1.000 SO–MZF 1.058MX–C 1.001 GWSO–MZF 1.175
T statistic (maximum/minimum): 1.304 (P = 0.003).Median ratio in bold.
Figure 2 Aysemmetry in the parents of children with cleft lip (palate): Euclidean distance matrix analysis ratios. The smaller ratios are depicted on the right side of the craniofacial complex and the larger ratios on the left.
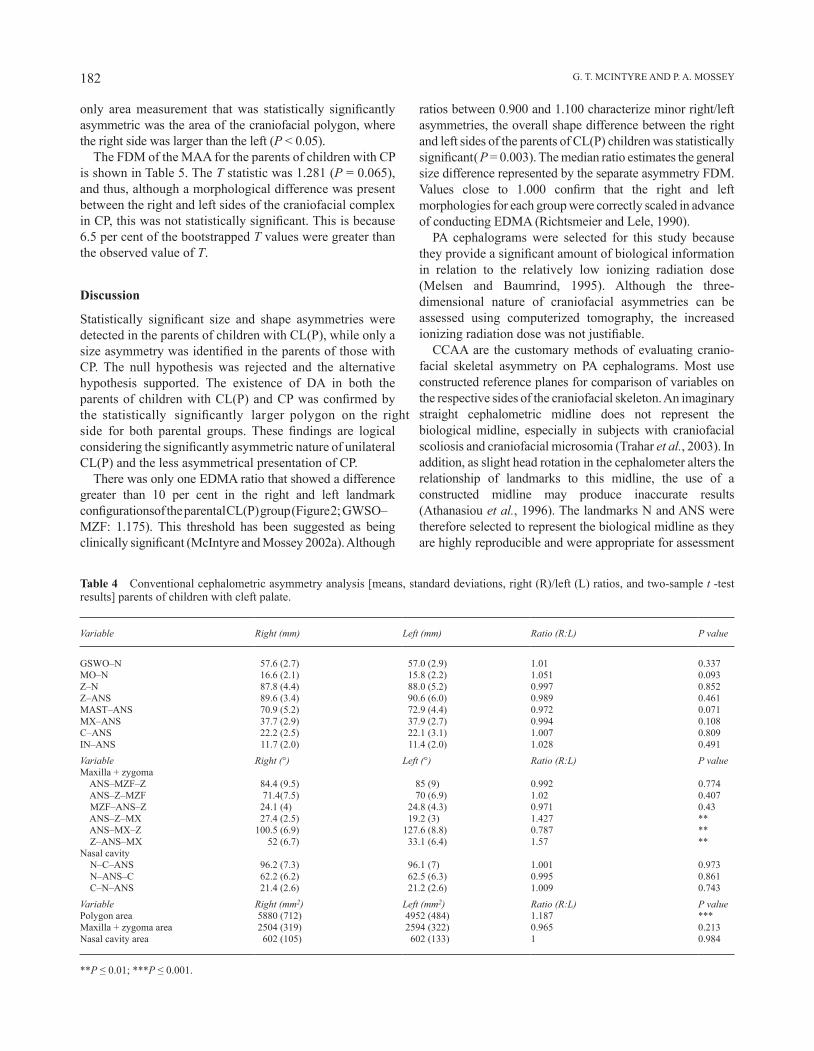
G. T. MCINTYRE AND P. A. MOSSEY182
Table 4 Conventional cephalometric asymmetry analysis [means, standard deviations, right (R)/left (L) ratios, and two-sample t -test results] parents of children with cleft palate.
Variable Right (mm) Left (mm) Ratio (R:L) P value
GSWO–N 57.6 (2.7) 57.0 (2.9) 1.01 0.337MO–N 16.6 (2.1) 15.8 (2.2) 1.051 0.093Z–N 87.8 (4.4) 88.0 (5.2) 0.997 0.852Z–ANS 89.6 (3.4) 90.6 (6.0) 0.989 0.461MAST–ANS 70.9 (5.2) 72.9 (4.4) 0.972 0.071MX–ANS 37.7 (2.9) 37.9 (2.7) 0.994 0.108C–ANS 22.2 (2.5) 22.1 (3.1) 1.007 0.809IN–ANS 11.7 (2.0) 11.4 (2.0) 1.028 0.491Variable Right (°) Left (°) Ratio (R:L) P valueMaxilla + zygoma ANS–MZF–Z 84.4 (9.5) 85 (9) 0.992 0.774 ANS–Z–MZF 71.4(7.5) 70 (6.9) 1.02 0.407 MZF–ANS–Z 24.1 (4) 24.8 (4.3) 0.971 0.43 ANS–Z–MX 27.4 (2.5) 19.2 (3) 1.427 ** ANS–MX–Z 100.5 (6.9) 127.6 (8.8) 0.787 ** Z–ANS–MX 52 (6.7) 33.1 (6.4) 1.57 **Nasal cavity N–C–ANS 96.2 (7.3) 96.1 (7) 1.001 0.973 N–ANS–C 62.2 (6.2) 62.5 (6.3) 0.995 0.861 C–N–ANS 21.4 (2.6) 21.2 (2.6) 1.009 0.743Variable Right (mm2) Left (mm2) Ratio (R:L) P valuePolygon area 5880 (712) 4952 (484) 1.187 ***Maxilla + zygoma area 2504 (319) 2594 (322) 0.965 0.213Nasal cavity area 602 (105) 602 (133) 1 0.984
**P ≤ 0.01; ***P ≤ 0.001.
only area measurement that was statistically significantly asymmetric was the area of the craniofacial polygon, where the right side was larger than the left (P < 0.05).
The FDM of the MAA for the parents of children with CP is shown in Table 5. The T statistic was 1.281 (P = 0.065), and thus, although a morphological difference was present between the right and left sides of the craniofacial complex in CP, this was not statistically significant. This is because 6.5 per cent of the bootstrapped T values were greater than the observed value of T.
Discussion
Statistically significant size and shape asymmetries were detected in the parents of children with CL(P), while only a size asymmetry was identified in the parents of those with CP. The null hypothesis was rejected and the alternative hypothesis supported. The existence of DA in both the parents of children with CL(P) and CP was confirmed by the statistically significantly larger polygon on the right side for both parental groups. These findings are logical considering the significantly asymmetric nature of unilateral CL(P) and the less asymmetrical presentation of CP.
There was only one EDMA ratio that showed a difference greater than 10 per cent in the right and left landmark configurations of the parental CL(P) group (Figure 2; GWSO–MZF: 1.175). This threshold has been suggested as being clinically significant (McIntyre and Mossey 2002a). Although
ratios between 0.900 and 1.100 characterize minor right/left asymmetries, the overall shape difference between the right and left sides of the parents of CL(P) children was statistically significant (P = 0.003). The median ratio estimates the general size difference represented by the separate asymmetry FDM. Values close to 1.000 confirm that the right and left morphologies for each group were correctly scaled in advance of conducting EDMA (Richtsmeier and Lele, 1990).
PA cephalograms were selected for this study because they provide a significant amount of biological information in relation to the relatively low ionizing radiation dose (Melsen and Baumrind, 1995). Although the three-dimensional nature of craniofacial asymmetries can be assessed using computerized tomography, the increased ionizing radiation dose was not justifiable.
CCAA are the customary methods of evaluating cranio-facial skeletal asymmetry on PA cephalograms. Most use constructed reference planes for comparison of variables on the respective sides of the craniofacial skeleton. An imaginary straight cephalometric midline does not represent the biological midline, especially in subjects with craniofacial scoliosis and craniofacial microsomia (Trahar et al., 2003). In addition, as slight head rotation in the cephalometer alters the relationship of landmarks to this midline, the use of a constructed midline may produce inaccurate results (Athanasiou et al., 1996). The landmarks N and ANS were therefore selected to represent the biological midline as they are highly reproducible and were appropriate for assessment
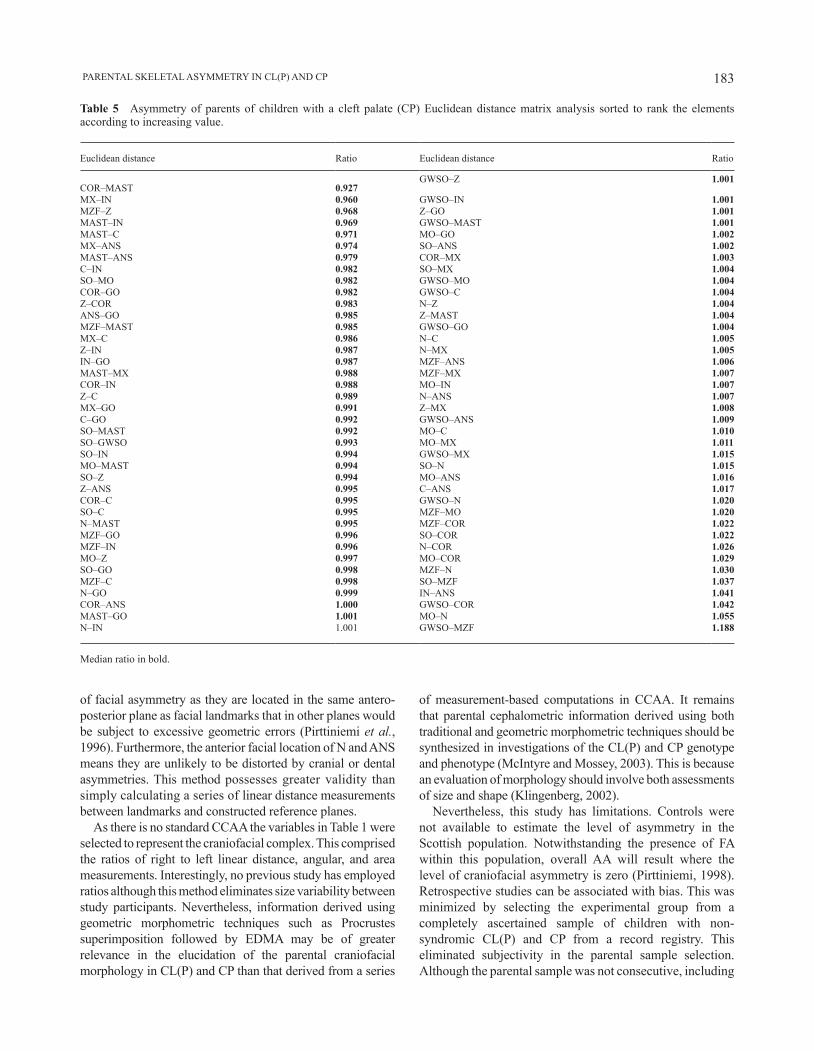
183 PARENTAL SKELETAL ASYMMETRY IN CL(P) AND CP
Table 5 Asymmetry of parents of children with a cleft palate (CP) Euclidean distance matrix analysis sorted to rank the elements according to increasing value.
Euclidean distance Ratio Euclidean distance Ratio
COR–MAST 0.927GWSO–Z 1.001
MX–IN 0.960 GWSO–IN 1.001MZF–Z 0.968 Z–GO 1.001MAST–IN 0.969 GWSO–MAST 1.001MAST–C 0.971 MO–GO 1.002MX–ANS 0.974 SO–ANS 1.002MAST–ANS 0.979 COR–MX 1.003C–IN 0.982 SO–MX 1.004SO–MO 0.982 GWSO–MO 1.004COR–GO 0.982 GWSO–C 1.004Z–COR 0.983 N–Z 1.004ANS–GO 0.985 Z–MAST 1.004MZF–MAST 0.985 GWSO–GO 1.004MX–C 0.986 N–C 1.005Z–IN 0.987 N–MX 1.005IN–GO 0.987 MZF–ANS 1.006MAST–MX 0.988 MZF–MX 1.007COR–IN 0.988 MO–IN 1.007Z–C 0.989 N–ANS 1.007MX–GO 0.991 Z–MX 1.008C–GO 0.992 GWSO–ANS 1.009SO–MAST 0.992 MO–C 1.010SO–GWSO 0.993 MO–MX 1.011SO–IN 0.994 GWSO–MX 1.015MO–MAST 0.994 SO–N 1.015SO–Z 0.994 MO–ANS 1.016Z–ANS 0.995 C–ANS 1.017COR–C 0.995 GWSO–N 1.020SO–C 0.995 MZF–MO 1.020N–MAST 0.995 MZF–COR 1.022MZF–GO 0.996 SO–COR 1.022MZF–IN 0.996 N–COR 1.026MO–Z 0.997 MO–COR 1.029SO–GO 0.998 MZF–N 1.030MZF–C 0.998 SO–MZF 1.037N–GO 0.999 IN–ANS 1.041COR–ANS 1.000 GWSO–COR 1.042MAST–GO 1.001 MO–N 1.055N–IN 1.001 GWSO–MZF 1.188
Median ratio in bold.
of facial asymmetry as they are located in the same antero-posterior plane as facial landmarks that in other planes would be subject to excessive geometric errors (Pirttiniemi et al., 1996). Furthermore, the anterior facial location of N and ANS means they are unlikely to be distorted by cranial or dental asymmetries. This method possesses greater validity than simply calculating a series of linear distance measurements between landmarks and constructed reference planes.
As there is no standard CCAA the variables in Table 1 were selected to represent the craniofacial complex. This comprised the ratios of right to left linear distance, angular, and area measurements. Interestingly, no previous study has employed ratios although this method eliminates size variability between study participants. Nevertheless, information derived using geometric morphometric techniques such as Procrustes superimposition followed by EDMA may be of greater relevance in the elucidation of the parental craniofacial morphology in CL(P) and CP than that derived from a series
of measurement-based computations in CCAA. It remains that parental cephalometric information derived using both traditional and geometric morphometric techniques should be synthesized in investigations of the CL(P) and CP genotype and phenotype (McIntyre and Mossey, 2003). This is because an evaluation of morphology should involve both assessments of size and shape (Klingenberg, 2002).
Nevertheless, this study has limitations. Controls were not available to estimate the level of asymmetry in the Scottish population. Notwithstanding the presence of FA within this population, overall AA will result where the level of craniofacial asymmetry is zero (Pirttiniemi, 1998). Retrospective studies can be associated with bias. This was minimized by selecting the experimental group from a completely ascertained sample of children with non-syndromic CL(P) and CP from a record registry. This eliminated subjectivity in the parental sample selection. Although the parental sample was not consecutive, including
G. T. MCINTYRE AND P. A. MOSSEY184
Funding
A European Orthodontic Society research grant.
ReferencesAthanasiou A E, Hack B, Enemark H, Sindet-Pedersen S 1996 Transverse
dentofacial structure of young men who have undergone surgical correction of unilateral cleft lip and palate: a posteroanterior cephalometric study. International Journal of Adult Orthodontics and Orthognathic Surgery 11: 19–28
Auffray J-C, Debat V, Alibert P 1999 Shape asymmetry and developmental stability. In: Chaplain M A, Singh G D, McLachlan J C (eds). On growth and form. Spatio-temporal pattern formation in biology. Wiley, Chichester, pp. 309–324
Blanco R et al. 2001 Evidence of a sex-dependent association between the MSX1 locus and nonsyndromic cleft lip with or without cleft palate in the Chilean population. Human Biology 73: 81–89
Blanton S H, Bertin T, Serna M E, Stal S, Mulliken J B, Hecht J T 2004 Association of chromosomal regions 3p21.2, 10p13, and 16p13.3 with nonsyndromic cleft lip and palate. American Journal of Medical Genetics Part A 125: 23–27
Cole T M 1999 WinEDMA: software for Euclidean Distance Matrix analysis. Kansas City School of Medicine, University of Missouri, Kansas (http://faith.med.jhmi.edu/) (24 January 2009, date last accessed)
both biological parents of consecutive births, the ratio of CL(P) to CP was similar to published data for the Scottish population (Fitzpatrick et al., 1994). Epidemiologically, the parental group represented West of Scotland parents of children with CL(P) and CP. However, the CL(P) group were parents of children with both unilateral and bilateral CL(P), and the association between the parental craniofacial skeletal asymmetry and the laterality of the unilateral CL(P) defect in their children was not investigated.
The parents of children with unilateral and bilateral CL and CLP were grouped together. Mossey et al. (1998) found distinctive differences between CP and both the CL and CLP groups, but there were no differences between the latter two groups in this lateral cephalometric study of parents of children with clefts. As a result, it was deemed appropriate to keep the CL and CLP parents in one combined group. Although a more recent Norwegian study (Harville et al., 2005) asks this question about CL and CLP differences, this is a single centre study and there is still no consistent rationale to separate CL and CLP on a genetic basis. Replication of the Norwegian findings is awaited before incorporating this into future research strategies. Similarly, there is as yet no evidence to genetically distinguish between unilateral and bilateral clefts and it was therefore legitimate to group these together.
The relevance of the findings of this study to the search for morphoregulatory clefting genes is twofold. Firstly, the parental craniofacial skeleton demonstrating directional asymmetry may confer a direct genetic susceptibility to CL(P) and CP by patterning aberrant embryonic craniofacial morphologies via early embryonic regulation by homeobox genes (Pirttiniemi, 1998) and predisposing the embryo to either CL(P) or CP. This may produce asymmetric discrepancies between the size of the embryonic facial processes and the craniofacial complex preventing contact and/or subsequent fusion of the facial processes during primary and secondary palatal development. This is accordance with the findings of Yoon et al. (2003). Indeed, homeotic genes such as morphoregulatory genes (controlling craniofacial morphogenesis; Slavkin, 2000) specify the geometry of orofacial form, and these could be of significance in the development of CL(P) and CP, by patterning aberrations in embryonic craniofacial morphology. Mounting evidence suggests that variants at the TGFb and MSX1 loci may be important in the genetic contribution to orofacial clefting (Blanco et al., 2001; Mitchell et al., 2001), while other candidate genes are also under investigation (Vieira et al., 2005). MSX1 has been implicated in the aetiopatho-gen esis of both CL(P) and CP (Lewanda and Jabs, 1994), while TGFb3 has also been implicated in CL(P). Could it be that the parental craniofacial shape in CL(P) and CP is principally specified by a variant forms of MSX1, MSX2, JAG2, SKI, FOXE1, GLI2, JAG2, LHX8, MSX1, MSX2, SATB2, SKI, SPRY2, and TBX10, predisposing towards morphometric susceptibility in their offspring, with TGFb3 (produced in the palatal mesenchyme; Kaartinen et al., 1995;
Ferguson, 2000), for example, being one local factor affecting primary palatogenesis or secondary palatal shelf fusion?
The finding of asymmetries relatively distant to the oronasal region suggests that overall craniofacial skeletal asymmetry in the non-cleft parental group is evidence of a CL(P) and CP microform. Logically, sufficient phenotypic and genotypic data will be required before CL(P) and CP morphogenes can be confirmed. Coupled with this, advances in high throughput genotyping make it possible to test panels of genes in an effort to establish their significance to parental craniofacial genotype and aetiopathogenesis of orofacial clefting (Park et al., 2006). Further studies evaluating asymmetry in non-cleft individuals and individuals with CL(P) and CP using morphometric techniques are required, particularly to confirm if directional asymmetry is a feature of CL(P) and CP.
Conclusions
Size-related directional asymmetries were present in the parents of children with both CL(P) and CP. Shape-related asymmetry was present in the craniofacial skeleton of the parents of children with CL(P) but not in the parents of children with CP.
Address for correspondence
Grant T. McIntyre Orthodontic Department University of Dundee Dental Hospital and School 2 Park Place Dundee DD1 4HR UK E-mail: [email protected]

185 PARENTAL SKELETAL ASYMMETRY IN CL(P) AND CP
Ferguson M W 2000 A hole in the head. Nature Genetics 24: 330–331Fitzpatrick D R, Raine P A, Boorman J G 1994 Facial clefts in the west of
Scotland 1980-84: epidemiology and genetic diagnoses. Journal of Medical Genetics 31: 126–129
Grummons D C, Kappeyne M A 1987 A frontal asymmetry analysis. Journal of Clinical Orthodontics 21: 448–465
Harville E W, Wilcox A J, Lie R T, Vindenes H, Abyholm F 2005 Cleft lip and palate versus cleft lip only: are they distinct defects? American Journal of Epidemiology 162: 448–453
Hay A D, Ayoub A F, Moos K F, Singh G D 2000 Euclidean distance matrix analysis of surgical changes in prepubertal craniofacial microsomia patients treated with an inverted L osteotomy. Cleft Palate-Craniofacial Journal 37: 497–502
Houston W J B 1983 The analysis of errors in orthodontic measurements. American Journal of Orthodontics 83: 382–390
Jensen B L, Kreiborg S, Dahl E, Fogh-Andersen P 1988 Cleft lip and palate in Denmark 1976-1981. Epidemiology, variability and early somatic development. Cleft Palate Journal 25: 258–269
Johannsdottir B, Thorarinsson F, Thordarson A, Magnusson T E 2005 Heritability of craniofacial characteristics between parents and offspring estimated from lateral cephalograms. American Journal of Orthodontics and Dentofacial Orthopedics 127: 200–207
Kaartinen V et al. 1995 Abnormal lung development and cleft palate in mice lacking TGF-beta 3 indicates defects of epithelial-mesenchymal interaction. Nature Genetics 11: 415–421
Kendall D G 1989 A survey of the statistical theory of shape. Statistical Science 4: 87–120
Kilpeläinen P V, Laine-Alava M T 1996 Palatal asymmetry in cleft palate subjects. Cleft Palate-Craniofacial Journal 33: 483–488
Klingenberg C P 2002 Morphometrics and the role of the phenotype in studies of the evolution of developmental mechanisms. Gene 287: 3–10
Kobliansky E, Bejerano M, Yakovenko K, Bat-Miriam Katznelson M 1999 Relationship between genetic anomalies of different levels and deviations in dermatoglyphic traits. Part 6: dermatoglyphics peculiarities of males and females with cleft lip (with or without cleft plate) and cleft palate-family study. Collegium Antropologicum 23: 1–51
Lele S, Richtsmeier J T 1990 Statistical models in morphometrics: are they realistic? Systematic Zoology 39: 60–69
Lewanda A F, Jabs E W 1994 Genetics of craniofacial disorders. Current Opinion in Pediatrics 6: 690–697
McIntyre G T, Mossey P A 2002a Asymmetry of the parental craniofacial skeleton in orofacial clefting. Journal of Orthodontics 29: 299–305
McIntyre G T, Mossey P A 2002b The craniofacial morphology of the parents of children with orofacial clefting: a systematic review of cephalometric studies. Journal of Orthodontics 29: 23–29
McIntyre G T, Mossey P A 2003 Size and shape measurement in contem porary cephalometrics. European Journal of Orthodontics 25: 231–242
Melsen B, Baumrind S 1995 Clinical research applications of cephalometry. In: Athanasiou A E (ed). Orthodontic cephalometry. Mosby-Wolfe, London, pp. 181–202
Mitchell L E, Murray J C, O’Brien S, Christensen K 2001 Evaluation of two putative susceptibility loci for oral clefts in the Danish population. American Journal of Epidemiology 153: 1007–1015
Mossey P A, McColl J, O’Hara M 1998 Cephalometric features in the parents of children with orofacial clefting. British Journal of Oral and Maxillofacial Surgery 36: 202–212
Neiswanger K et al. 2002 Cleft lip with or without cleft palate and dermatoglyphic asymmetry: evaluation of a Chinese population. Orthodontics and Craniofacial Research 5: 140–146
Neiswanger K, Cooper M E, Liu Y, Hu D-N, Melnick M, Marazita M L 2005 Bilateral asymmetry in Chinese families with cleft lip with or without cleft palate. Cleft Palate-Craniofacial Journal 42: 192–196
Park J W et al. 2006 High throughput SNP and expression of candidate genes for non-syndromic oral clefts. Journal of Medical Genetics 43: 598–608
Paulozzi L J, Lary J M 1999 Laterality patterns in infants with external birth defects. Teratology 60: 265–271
Pirttiniemi P 1998 Normal and increased functional asymmetries in the craniofacial area. Acta Odontologica Scandinavica 56: 342–345
Pirttiniemi P, Miettinen J, Kantomaa T 1996 Combined effects of errors in frontal-view asymmetry diagnosis. European Journal of Orthodontics 18: 629–636
Quintero J C, Trosien A, Hatcher D, Kapila S 1999 Craniofacial imaging in orthodontics: historical perspective, current status, and future developments. The Angle Orthodontist 69: 491–506
Richtsmeier J T 1987 Comparative study of normal, Crouzon, and Apert craniofacial morphology using finite element scaling analysis. American Journal of Physical Anthropology 74: 473–493
Richtsmeier J T 1988 Craniofacial growth in Apert syndrome as measured by finite-element scaling analysis. Acta Anatomica 133: 50–56
Richtsmeier J T, Lele S 1990 Analysis of craniofacial growth in Crouzon syndrome using landmark data. Journal of Craniofacial Genetics and Developmental Biology 10: 39–62
Richtsmeier J T, Lele S 1993 A coordinate-free approach to the analysis of growth patterns: models and theoretical considerations. Biological reviews of the Cambridge Philosophical Society 68: 381–411
Rintala A E 1985 Relationship between side of the cleft and handedness of the patient. Cleft Palate Journal 22: 34–37
Saunders S R, Popovich F, Thompson G W 1980 A family study of craniofacial dimensions in the Burlington Growth Centre sample. American Journal of Orthodontics 78: 394–403
Slavkin H 2000 Toward understanding the molecular basis of craniofacial growth and development. American Journal of Orthodontics and Dentofacial Orthopedics 117: 538–539
Suzuki A, Takahama Y 1991 Parental data used to predict growth of craniofacial form. American Journal of Orthodontics and Dentofacial Orthopedics 99: 107–121
The 1981 census on CD-Rom 1991 Chadwyck-Healey, OxfordTrahar M, Sheffield R, Kawamoto H, Lee H F, Ting K 2003 Cephalometric
evaluation of the craniofacial complex in patients treated with an intraoral distraction osteogenesis device: a preliminary report. American Journal of Orthodontics and Dentofacial Orthopedics 124: 639–650
Vieira A R et al. 2005 Medical sequencing of candidate genes for nonsyndromic cleft lip and palate. PLoS Genetics 1: e64
Ward R E, Bixler D, Raywood E R 1989 A study of cephalometric features in cleft lip–cleft palate families. I: phenotypic heterogeneity and genetic predisposition in parents of sporadic cases. Cleft Palate Journal 26: 318–325
Weinberg S M, Maher B S, Marazita M L 2006 Parental craniofacial morp-hology in cleft lip with or without cleft palate as determined by cephalometry: a meta-analysis. Orthodontics and Craniofacial Research 9: 18–30
Wentslaff K A et al. 1997 Association between non-right handedness and cleft lip with or without cleft palate in a Chinese population. Journal of Craniofacial Genetics and Developmental Biology 17: 141–147
Woolf C M, Gianas A D 1976 Congenital cleft lip and fluctuating detmatoglyphic asymmetry. American Journal of Human Genetics 28: 400–403
Yoon Y J et al. 2003 Association of nasomaxillary asymmetry in children with unilateral cleft lip and palate and their parents. Cleft Palate-Craniofacial Journal 40: 493–497
Young S C, Kolar J C, Farkas L G, Munro I R 1986 Acrocephalosyndactyly: comparison of morphometric measurements in Pfeiffer, Saethre-Chotzen, Carpenter and Apert syndrome. Deutsche Zeitschrift für Mund- Kiefer- und Gesichts-Chirurgie 10: 436–443
Zemann W, Santler G, Karcher H 2002 Analysis of midface asymmetry in patients with cleft lip, alveolus and palate at the age of 3 months using 3D-COSMOS measuring system. Journal of Cranio-maxillo-facial Surgery 30: 148–152
European Journal of Orthodontics 32 (2010) 186–192 © The Author 2009. Published by Oxford University Press on behalf of the European Orthodontic Society.doi:10.1093/ejo/cjp085 All rights reserved. For permissions, please email: [email protected] Access Publication 15 September 2009
Introduction
In publicly funded orthodontic care, the evaluation of treatment outcome should include two principal questions: are resources directed to the children most in need of treatment and do all treated children benefit from their treatment? Consequently, it is necessary to investigate at a population level and evaluate whole age cohorts, including children with and without a treatment history (Fernandes et al., 1999). In publicly funded care, resources are generally scarce and the competition for resources requires identification of the children who will benefit most from treatment (Cadman et al., 2002).
The indices and procedures developed for the assessment of treatment outcome, such as the Peer Assessment Rating Index and the grading system of the American Board of Orthodontics, always require documentation in the form of dental casts and/or radiographs (Richmond et al., 1992; Casko et al., 1998). However, when evaluating untreated individuals, these documents are seldom available. The Occlusal Morphology and Function Index (OMFI) developed to measure the acceptability of occlusion is based entirely on direct clinical assessment (Svedström-Oristo et al., 2002, 2003). Therefore, it is suitable for the assessment of all age groups.
Despite a great deal of debate, controversies about the timing of treatment persist (Jang et al., 2005). Most recent studies comparing early versus late treatment regard treatment as early if it is started in the late mixed dentition (Keeling
Acceptability of adolescents’ occlusion in Finnish municipal
health centres with differing timing of orthodontic treatment
Ilpo Pietilä*, Terttu Pietilä*, Anna-Liisa Svedström-Oristo**, Juha Varrela** and Pentti Alanen****Oral Health Services, Health Centre of Pori and **Department of Oral Development and Orthodontics and ***Department of Public Health Dentistry, Institute of Dentistry, University of Turku, Finland
SUMMARY The objective of the study was to compare the acceptability of occlusion among orthodontically treated and untreated adolescents in eight Finnish municipal health centres applying different timing of treatment. A random sample of 16- and 18-year olds (n = 2325) living in these municipalities was invited for a clinical examination, and 1109 adolescents participated. Two calibrated orthodontists blindly examined the participants for the acceptability of occlusion with the Occlusal Morphology and Function Index. The history of orthodontic treatment was elicited by questionnaire. The impact of the history and timing of treatment on the acceptability of occlusion was analysed with logistic regression analysis.
The history of orthodontic treatment decreased the odds for acceptability of morphology [odds ratio (OR) = 0.719, 95 per cent confidence limit (CL), P = 0.016] and acceptability of function (OR = 0.724, 95 per cent CL, P = 0.018). The early timing of treatment increased the odds for acceptability of morphology (OR = 1.370, 95 per cent CL, P = 0.042) and of function (OR = 1.420, 95 per cent CL, P = 0.023). No substantial differences were observed in the acceptability of occlusion between the early and late timing health centres. However, the proportion of subjects with acceptable occlusion was slightly higher in the early than in the late timing group. These findings suggest that when examining the effect of timing on treatment outcome, factors other than acceptability of occlusion should be concomitantly evaluated. Consequently, in this context, the duration and cost of treatment need to be investigated.
et al., 1998; Tulloch et al., 2004). In Finland, orthodontic treatment undertaken in the primary or early mixed dentition is regarded as early treatment (Pietilä et al., 2008). In a recent study from a Finnish health centre with systematically organized early treatment, early intervention was regularly carried out when a crossbite, increased overjet, deep overbite with palatal contact, and severe crowding were diagnosed (Kerosuo et al., 2008). Intervention in the early mixed dentition is recommended by other authors, for example, in the case of posterior crossbite with a Class III relationship (Kennedy and Osepchook, 2005; Ngan, 2005).
In orthodontics, the decision to treat a malocclusion is based on an elective choice, and there is an apparent inconsistency in professionals’ views on the benefits and feasibility of orthodontic treatment (Shaw and Turbill, 2007). In addition, the methods used in the assessment of treatment need to guide the selection of patients on a practical level. Most of the internationally used indices are designed for the assessments of occlusion in the late mixed dentition (Brook and Shaw, 1989; Espeland et al., 1992). Early intervention makes the selection of patients more demanding because the decision must be based on the prognosis of occlusion. In Finland, governmental authorities have recommended a standardized 10-grade scale for the assessment of treatment need, and this scale is used by 50 per cent of health centres (Heikinheimo, 1989; Pietilä et al., 1997). According to the
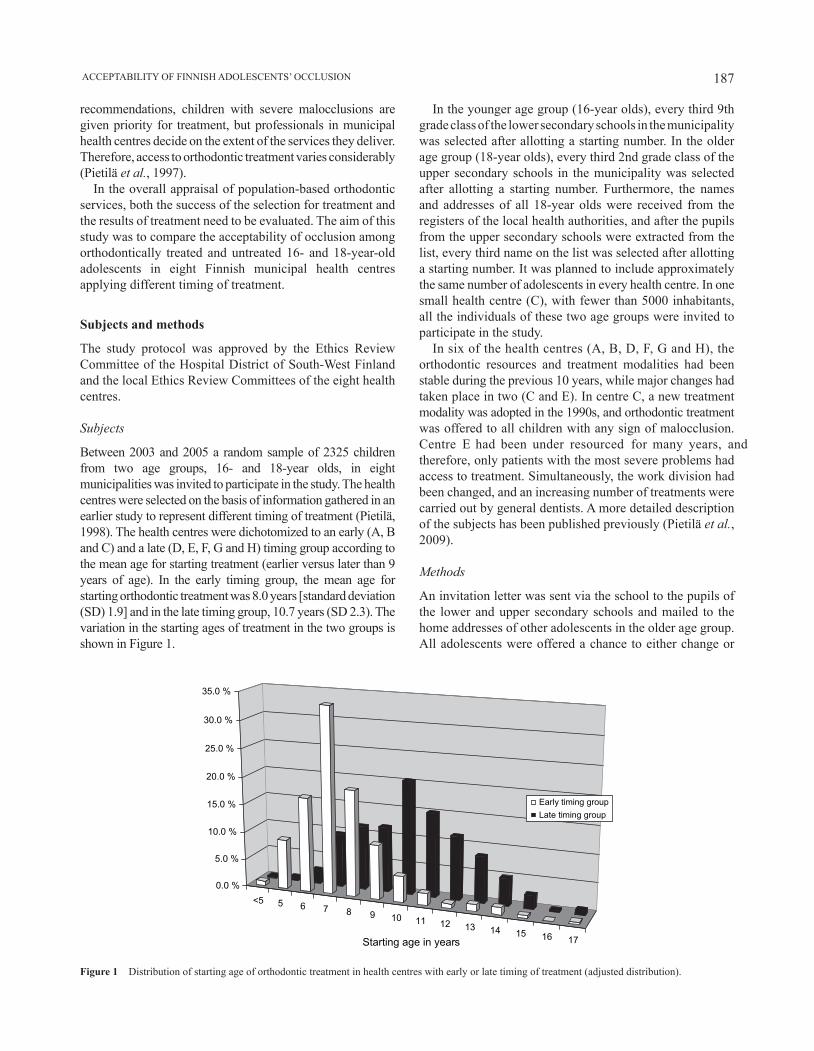
187 ACCEPTABILITY OF FINNISH ADOLESCENTS’ OCCLUSION
recommendations, children with severe malocclusions are given priority for treatment, but professionals in municipal health centres decide on the extent of the services they deliver. Therefore, access to orthodontic treatment varies considerably (Pietilä et al., 1997).
In the overall appraisal of population-based orthodontic services, both the success of the selection for treatment and the results of treatment need to be evaluated. The aim of this study was to compare the acceptability of occlusion among orthodontically treated and untreated 16- and 18-year-old adolescents in eight Finnish municipal health centres applying different timing of treatment.
Subjects and methods
The study protocol was approved by the Ethics Review Committee of the Hospital District of South-West Finland and the local Ethics Review Committees of the eight health centres.
Subjects
Between 2003 and 2005 a random sample of 2325 children from two age groups, 16- and 18-year olds, in eight municipalities was invited to participate in the study. The health centres were selected on the basis of information gathered in an earlier study to represent different timing of treatment (Pietilä, 1998). The health centres were dichotomized to an early (A, B and C) and a late (D, E, F, G and H) timing group according to the mean age for starting treatment (earlier versus later than 9 years of age). In the early timing group, the mean age for starting orthodontic treatment was 8.0 years [standard deviation (SD) 1.9] and in the late timing group, 10.7 years (SD 2.3). The variation in the starting ages of treatment in the two groups is shown in Figure 1.
In the younger age group (16-year olds), every third 9th grade class of the lower secondary schools in the municipality was selected after allotting a starting number. In the older age group (18-year olds), every third 2nd grade class of the upper secondary schools in the municipality was selected after allotting a starting number. Furthermore, the names and addresses of all 18-year olds were received from the registers of the local health authorities, and after the pupils from the upper secondary schools were extracted from the list, every third name on the list was selected after allotting a starting number. It was planned to include approximately the same number of adolescents in every health centre. In one small health centre (C), with fewer than 5000 inhabitants, all the individuals of these two age groups were invited to participate in the study.
In six of the health centres (A, B, D, F, G and H), the orthodontic resources and treatment modalities had been stable during the previous 10 years, while major changes had taken place in two (C and E). In centre C, a new treatment modality was adopted in the 1990s, and orthodontic treatment was offered to all children with any sign of malocclusion. Centre E had been under resourced for many years, and therefore, only patients with the most severe problems had access to treatment. Simultaneously, the work division had been changed, and an increasing number of treatments were carried out by general dentists. A more detailed description of the subjects has been published previously (Pietilä et al., 2009).
Methods
An invitation letter was sent via the school to the pupils of the lower and upper secondary schools and mailed to the home addresses of other adolescents in the older age group. All adolescents were offered a chance to either change or
<5 5 6 7 8 9 10 11 12 13 14 15 16 17
0.0 %
5.0 %
10.0 %
15.0 %
20.0 %
25.0 %
30.0 %
35.0 %
Starting age in years
Early timing groupLate timing group
Figure 1 Distribution of starting age of orthodontic treatment in health centres with early or late timing of treatment (adjusted distribution).
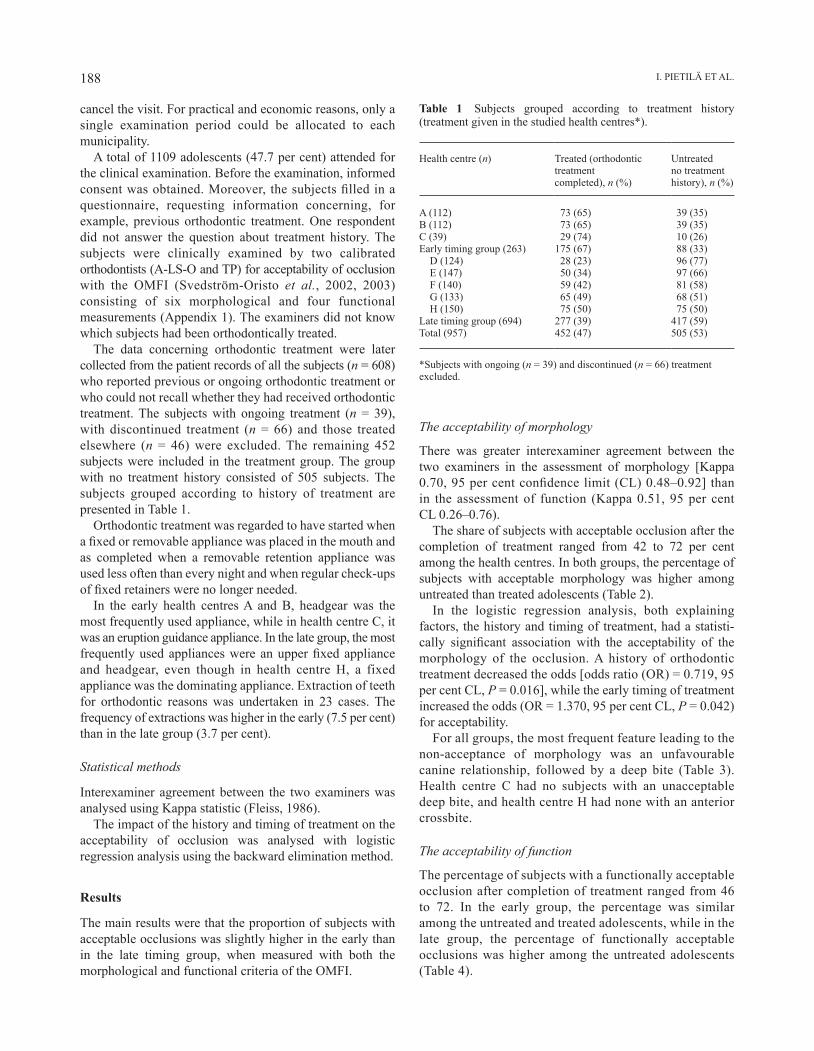
I. PIETILä ET AL.188
The acceptability of morphology
There was greater interexaminer agreement between the two examiners in the assessment of morphology [Kappa 0.70, 95 per cent confidence limit (CL) 0.48–0.92] than in the assessment of function (Kappa 0.51, 95 per cent CL 0.26–0.76).
The share of subjects with acceptable occlusion after the completion of treatment ranged from 42 to 72 per cent among the health centres. In both groups, the percentage of subjects with acceptable morphology was higher among untreated than treated adolescents (Table 2).
In the logistic regression analysis, both explaining factors, the history and timing of treatment, had a statisti-cally significant association with the acceptability of the morphology of the occlusion. A history of orthodontic treatment decreased the odds [odds ratio (OR) = 0.719, 95 per cent CL, P = 0.016], while the early timing of treatment increased the odds (OR = 1.370, 95 per cent CL, P = 0.042) for acceptability.
For all groups, the most frequent feature leading to the non-acceptance of morphology was an unfavourable canine relationship, followed by a deep bite (Table 3). Health centre C had no subjects with an unacceptable deep bite, and health centre H had none with an anterior crossbite.
The acceptability of function
The percentage of subjects with a functionally acceptable occlusion after completion of treatment ranged from 46 to 72. In the early group, the percentage was similar among the untreated and treated adolescents, while in the late group, the percentage of functionally acceptable occlusions was higher among the untreated adolescents (Table 4).
cancel the visit. For practical and economic reasons, only a single examination period could be allocated to each municipality.
A total of 1109 adolescents (47.7 per cent) attended for the clinical examination. Before the examination, informed consent was obtained. Moreover, the subjects filled in a questionnaire, requesting information concerning, for example, previous orthodontic treatment. One respondent did not answer the question about treatment history. The subjects were clinically examined by two calibrated orthodontists (A-LS-O and TP) for acceptability of occlusion with the OMFI (Svedström-Oristo et al., 2002, 2003) consisting of six morphological and four functional measurements (Appendix 1). The examiners did not know which subjects had been orthodontically treated.
The data concerning orthodontic treatment were later collected from the patient records of all the subjects (n = 608) who reported previous or ongoing orthodontic treatment or who could not recall whether they had received orthodontic treatment. The subjects with ongoing treatment (n = 39), with discontinued treatment (n = 66) and those treated elsewhere (n = 46) were excluded. The remaining 452 subjects were included in the treatment group. The group with no treatment history consisted of 505 subjects. The subjects grouped according to history of treatment are presented in Table 1.
Orthodontic treatment was regarded to have started when a fixed or removable appliance was placed in the mouth and as completed when a removable retention appliance was used less often than every night and when regular check-ups of fixed retainers were no longer needed.
In the early health centres A and B, headgear was the most frequently used appliance, while in health centre C, it was an eruption guidance appliance. In the late group, the most frequently used appliances were an upper fixed appliance and headgear, even though in health centre H, a fixed appliance was the dominating appliance. Extraction of teeth for orthodontic reasons was undertaken in 23 cases. The frequency of extractions was higher in the early (7.5 per cent) than in the late group (3.7 per cent).
Statistical methods
Interexaminer agreement between the two examiners was analysed using Kappa statistic (Fleiss, 1986).
The impact of the history and timing of treatment on the acceptability of occlusion was analysed with logistic regression analysis using the backward elimination method.
Results
The main results were that the proportion of subjects with acceptable occlusions was slightly higher in the early than in the late timing group, when measured with both the morphological and functional criteria of the OMFI.
Table 1 Subjects grouped according to treatment history (treatment given in the studied health centres*).
Health centre (n) Treated (orthodontic treatment completed), n (%)
Untreated no treatment history), n (%)
A (112) 73 (65) 39 (35)B (112) 73 (65) 39 (35)C (39) 29 (74) 10 (26)Early timing group (263) 175 (67) 88 (33) D (124) 28 (23) 96 (77) E (147) 50 (34) 97 (66) F (140) 59 (42) 81 (58) G (133) 65 (49) 68 (51) H (150) 75 (50) 75 (50)Late timing group (694) 277 (39) 417 (59)Total (957) 452 (47) 505 (53)
*Subjects with ongoing (n = 39) and discontinued (n = 66) treatment excluded.

189 ACCEPTABILITY OF FINNISH ADOLESCENTS’ OCCLUSION
Table 4 Percentage of subjects with acceptable function as measured using the Occlusal Morphology and Function Index.
Health centre (n) Treated (%) Untreated (%)
Early timing group A (112) 62 69 B (112) 58 59 C (39) 72 70 Early timing group (263) 62 65Late timing group D (124) 46 64 E (147) 47 63 F (140) 58 56 G (133) 68 59 H (150) 35 59 Late timing group (694) 51 60Total (957) 55 61
Table 5 Functional features causing non-acceptance of occlusion as measured using the Occlusal Morphology and Function Index.
Functional features Early timing group, n = 263
Late timing group, n = 694
Treated (%)
Untreated (%)
Treated (%)
Untreated (%)
Protrusive contacts 31 26 37 28Guided lateral excursion, right 11 11 21 12Guided lateral excursion, left 10 6 14 12Discrepancy between centric relation and intercuspal position
3 7 7 5
Table 3 Morphological features causing non-acceptance of occlusion as measured using the Occlusal Morphology and Function Index.
Morphological features Early timing group, n = 263
Late timing group, n = 694
Treated (%)
Untreated (%)
Treated (%)
Untreated (%)
Canine relationship, right 15 15 18 17Canine relationship, left 15 9 15 16Overbite 11 14 12 14Crossbite, anterior 7 1 5 4Open bite 5 3 5 2Scissor bite 4 1 3 1Overjet 2 0 2 4Crossbite, lateral 3 2 1 1Coincidence of the facial midline and the midline of the upper dental arch > 3 mm
0 0 0 0
Table 2 Proportion of subjects with acceptable morphology as measured using the Occlusal Morphology and Function Index.
Health centre (n) Treated (%) Untreated (%)
Early timing group A (112) 59 72 B (112) 56 72 C (39) 72 80 Early timing group (263) 60 73Late timing group D (124) 57 67 E (147) 42 47 F (140) 66 65 G (133) 57 68 H (150) 53 63 Late timing group (694) 55 63Total (957) 57 63
In the logistic regression analysis, both explaining factors, the history and timing of treatment, had a statistically significant association with the acceptability of the function of occlusion. The history of orthodontic treatment decreased the odds (OR = 0.724, 95 per cent CL, P = 0.018), while the early timing of treatment increased the odds (OR = 1.420, 95 per cent CL, P = 0.023) of acceptability.
In both groups, protrusion was the most frequent feature leading to non-acceptance of function, followed by disturbances in guided lateral occlusion (Table 5). Health centre C had no subjects with a discrepancy between centric relation and intercuspal position.
Discussion
In this study, the early timing of orthodontic treatment seemed to slightly increase the odds for higher acceptability of morphological and functional features of occlusion.
However, in both the early and the late group, there was a considerable variation in acceptability.
In the present study, whole age cohorts were investigated, because in publicly funded dental care, all aspects of orthodontic service delivery should be concomitantly assessed. This viewpoint is not often used in the appraisal of orthodontic services, and therefore, it is difficult to make comparisons with earlier investigations. In addition, comparison with studies from other countries is problematic, because in Finland, early treatment is usually started at the age of 5–8 years (Väkiparta et al., 2005), i.e. earlier than in several previous studies evaluating early treatment (Tulloch et al., 2004; Hsieh et al., 2005; Dolce et al., 2007). In fact, the starting age of the subjects in those studies (8–13 years) is similar to that of the later timing group in the present study.
Svedström-Oristo et al. (2003) found acceptable morphology more frequently among untreated than treated adolescents. The present study corroborates their findings with one exception (health centre F), where both groups had a similar percentage of acceptability. Early timing seemed to increase the odds for acceptability, and the rate of acceptable morphology was higher in early than in the late timing health centres. The most frequent features causing
I. PIETILä ET AL.190
unacceptability, poor canine relationship and large overbite, were identical with the findings of Svedström-Oristo et al. (2003). In the present study, the early timing of treatment increased the odds for acceptability of the function of occlusion. Furthermore, acceptable function was more often found among untreated than treated subjects in both timing groups and in nearly all health centres. A corresponding tendency among treated and untreated adolescents has been reported earlier by Svedström-Oristo et al. (2003). In both studies, protrusive contacts were the most common features causing non-acceptance.
The better acceptability of occlusion in the untreated group may appear confusing. However, treatment can be regarded as beneficial, when those adolescents who from the beginning had a severe malocclusion moved closer to the untreated adolescents with an acceptable occlusion. Conflicting findings have been reported by Birkeland et al. (2000), who found a better occlusion among treated than untreated individuals in Norway.
One explanation for the findings might be the high levels of delivery of orthodontic treatment in general and especially in early timing health centres. Presumably, only occlusions with a favourable prognosis were left untreated, which indicates that the selection for treatment was successful, while most untreated individuals had an acceptable occlusion. In support of these findings, in Norway, the lowest percentage of adolescents with a residual treatment need among untreated individuals was found in a region with the highest treatment rate (Espeland and Stenvik, 1999).
The wide variation in orthodontic appliances complicated the appraisal of whether the use of different appliances influences the acceptability of occlusion. The early timing health centres used one appliance more than others, but a large variety of appliances were used in the late timing health centres. In this study population, the frequency of treatment with an upper fixed appliance varied from 34 to 76 per cent in the late group compared with 15 to 30 per cent in the early group (Pietilä et al., 2009). Headgear is the predominant appliance used in early treatment in Finland (Pietilä et al., 1997), and this was also found in this study. The use of headgear as an early orthopaedic appliance has been described in Finnish studies (Kirjavainen et al., 2000; Pirttiniemi et al., 2005). Furthermore, the wide use of headgear even in the late timing health centres indicates that the appliance was also used as an anchoring device.
In Norway, the children treated with fixed appliances had a better treatment outcome than those treated with removable appliances (Birkeland et al., 2000). However, in the current study, health centre C, where the removable eruption guidance appliance was most commonly used, had the highest rates of acceptability. Favourable treatment results have also been reported in an earlier Finnish study concerning the use of the eruption guidance appliance (Keski-Nisula et al., 2008).
The findings of an earlier study showed that there were several differences in the features of orthodontic services
provided by these eight health centres (Pietilä et al., 2009). In the early group, treatments were mainly carried out by general dentists applying simpler treatment methods. In the late group, specialists were more closely involved in the treatment. In general, the provider effect has a strong influence on treatment practices (Fox et al., 1997), and this may partly mask the impact of timing of treatment. Overall, the variation in the provider’s expertise complicates the assessment. Practitioners with an orthodontic qualification seem to prefer to start treatment with fixed appliances (Turbill et al., 1999).
Conclusions
With regard to the early versus late timing of treatment, only minor differences were found in the acceptability of occlusion. However, the early timing of treatment slightly increased the OR for both the morphological and functional acceptability of occlusion. Furthermore, the findings suggest that the effect of timing on treatment outcome needs to be considered in connection with other aspects of treatment, e.g. the duration and cost of treatment.
Address for correspondence
Ilpo PietiläOral Health ServicesHealth Centre of PoriP. O. Box 33FIN-28601 PoriFinlandE-mail: [email protected]
Funding
Academy of Finland.
Acknowledgements
We thank the adolescents and the oral health personnel involved in the examinations in the eight health centres for their cooperation in the study.
ReferencesBirkeland K, Boe O A, Wisth P J 2000 Relationship between occlusion and
satisfaction with dental appearance in orthodontically treated and untreated groups. A longitudinal study. European Journal of Orthodontics 22: 509–518
Brook P H, Shaw W C 1989 The development of an index of orthodontic treatment priority. European Journal of Orthodontics 11: 309–320
Cadman K C, Glover K E, Heo G, Warren S, Major P W 2002 Orthodontic treatment outcome in a First Nation population in Alberta, Canada: a comparative study. American Journal of Orthodontics and Dentofacial Orthopedics 121: 396–402
Casko J S et al. 1998 Objective grading system for dental casts and panoramic radiographs. American Board of Orthodontics. American Journal of Orthodontics and Dentofacial Orthopedics 114: 589–599
191 ACCEPTABILITY OF FINNISH ADOLESCENTS’ OCCLUSION
Dolce G, McGorray S P, Brazeau L, King G J, Wheeler T T 2007 Timing of Class II treatment: skeletal changes comparing 1-phase and 2-phase treatment. American Journal of Orthodontics and Dentofacial Orthopedics 132: 481–489
Espeland L, Stenvik A 1999 Residual need in orthodontically untreated 16–20-year-olds from areas with different treatment rates. European Journal of Orthodontics 21: 523–531
Espeland L, Ivarsson K, Stenvik A 1992 A new Norwegian index of orthodontic treatment need related to orthodontic concern among 11-year-olds and their parents. Community Dentistry and Oral Epidemiology 20: 274–279
Fernandes L M, Espeland L, Stenvik A 1999 The provision and outcome of orthodontic services in a Norwegian community: a longitudinal study. Community Dentistry and Oral Epidemiology 27: 228–234
Fleiss J L 1986 The design and analysis of clinical experiments. John Wiley and Sons, New York
Fox N A, Richmond S, Wright J L, Daniels C l997 Factors affecting the outcome of orthodontic treatment within the General Dental Service. British Journal of Orthodontics 24: 217–221
Heikinheimo K 1989 Need of orthodontic treatment and prevalence of craniomandibular dysfunction in Finnish children. Thesis. University of Turku
Hsieh T J, Pinskaya Y, Roberts W E 2005 Assessment of orthodontic treatment outcomes: early versus late treatment. Angle Orthodontist 75: 158–166
Jang J C, Fields H W, Vig K W L, Beck F M 2005 Controversies in the timing of orthodontic treatment. Seminars in Orthodontics 11: 112–118
Keeling S D et al. 1998 Anteroposterior skeletal and dental changes following early Class II treatment with bionators and headgear: results from a randomized controlled trial. American Journal of Orthodontics and Dentofacial Orthopedics 113: 40–50
Kennedy D B, Osepchook M 2005 Unilateral posterior crossbite with mandibular shift: a review. Journal of the Canadian Dental Association 71: 569–573
Kerosuo H, Väkiparta M, Nyström M, Heikinheimo K 2008 The seven-year outcome of an early orthodontic treatment strategy. Journal of Dental Research 87: 584–588
Keski-Nisula K, Hernesniemi R, Heiskanen M, Keski-Nisula L, Varrela J 2008 Orthodontic intervention in the early mixed dentition: a prospective, controlled study on the effects of the eruption guidance appliance. American Journal of Orthodontics and Dentofacial Orthopedics 133: 254–260
Kirjavainen M, Kirjavainen T, Hurmerinta K, Haavikko K 2000 Orthopedic cervical headgear with an expanded inner bow in Class II correction. Angle Orthodontist 70: 317–325
Ngan P 2005 Early timely treatment of Class III malocclusion. Seminars in Orthodontics 11: 140–145
Pietilä T 1998 Orthodontic treatment in Finnish health centres. Thesis. University of Turku
Pietilä I, Pietilä T, Pirttiniemi P, Varrela J, Alanen P 2008 Orthodontists’ views on indications for and timing of orthodontic treatment in Finnish public oral health care. European Journal of Orthodontics 30: 46–51
Pietilä I, Pietilä T, Svedström-Oristo A-L, Varrela J, Alanen P 2009 Orthodontic treatment practices in Finnish municipal health centres with differing timing of treatment. European Journal of Orthodontics 31: 287–293
Pietilä T, Pietilä I, Widström E, Varrela J, Alanen P 1997 Extent and provision of orthodontic services for children and adolescents in Finland. Community Dentistry and Oral Epidemiology 25: 150–155
Pirttiniemi P et al. 2005 The effects of early headgear treatment on dental arches and craniofacial morphology: an 8 year report of a randomized study. European Journal of Orthodontics 27: 429–436
Richmond S, Shaw W C, Roberts C T, Andrews M 1992 The PAR Index (Peer Assessment Rating): methods to determine outcome of orthodontic treatment in terms of improvement and standards. European Journal of Orthodontics 14: 180–187
Shaw W C, Turbill E A 2007 Public health aspects of oral diseases and disorders—dentofacial irregularities. In: Pine C, Harris R (eds). Community oral health Quintessence Publishing Co. Ltd, Berlin, pp. 227–237.
Svedström-Oristo A-L, Helenius H, Pietilä T, Pietilä I, Alanen P, Varrela J 2002 Reproducibility of characteristics assessing the occlusion of young adults. Angle Orthodontist 72: 310–315
Svedström-Oristo A-L, Pietilä T, Pietilä I, Alanen P, Varrela J 2003 Occlusal status in orthodontically treated and untreated adolescents. Acta Odontologica Scandinavica 61: 123–128
Tulloch J F C, Proffit W R, Phillips C 2004 Outcomes in a 2-phase randomized clinical trial of early Class II treatment. American Journal of Orthodontics and Dentofacial Orthopedics 125: 657–667
Turbill E A, Richmond S, Wright J L 1999 A closer look at General Dental Service orthodontics in England and Wales. II: What determines appliance selection? British Dental Journal 187: 271–274
Väkiparta M K, Kerosuo H M, Nyström M E, Heikinheimo K A 2005 Orthodontic treatment need from eight to 12 years of age in an early treatment oriented public health care system: a prospective study. Angle Orthodontist 75: 344–349

I. PIETILä ET AL.192
Appendix 1. Morphological and functional criteria in the OMFI.
Cut-off for acceptability Conventions
Morphological criteria Coincidence of the facial midline and the midline of the upper dental arch
Maximum 3 mm deviation accepted
Overjet 0–5 mm accepted Measured from the most labial central incisor Overbite Occusal contact incisal to the gingival third of the
palatal surface of upper incisors accepted. Open bite only accepted in laterals
Canine relationship right/left Normal ± 2 mm accepted. Post-normal relationship accepted in the case of missing upper incisors
Crossbite, anterior Not accepted Crossbite, lateral Not accepted in canines. Accepted in one tooth
pair/side without inference or slide between centric relation and intercuspal position
Scissor bite Not acceptedFunctional criteria Discrepancy between centric relation and intercuspal position
Max 2 mm accepted sagittally and vertically. No slide accepted laterally
Measured from pencil markings on one pair of premolars and incisors
Guided lateral excursions Accepted: canine protection/group contact including canine/contacts in incisors, premolars and molars
Guided lateral gliding until upper and lower canines at the same transverse level
Non-working side contacts Accepted without disclusion of working side contacts Protrusive contacts Anterior guidance accepted
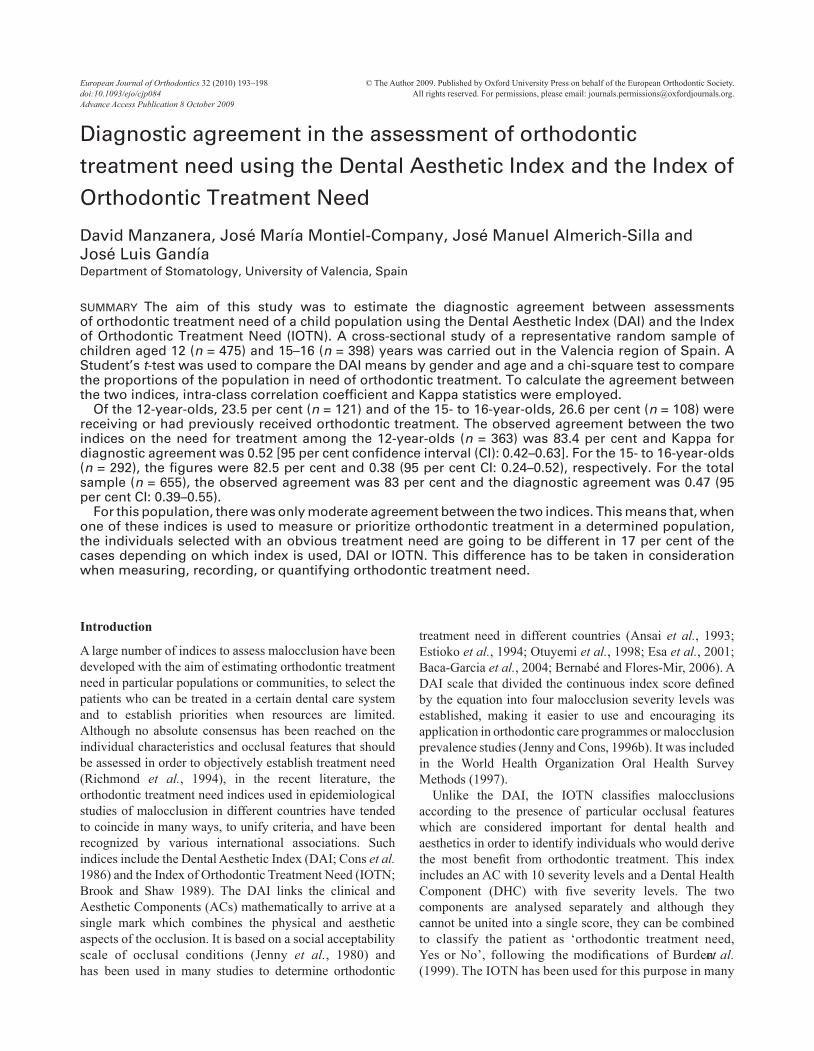
European Journal of Orthodontics 32 (2010) 193–198 © The Author 2009. Published by Oxford University Press on behalf of the European Orthodontic Society.doi:10.1093/ejo/cjp084 All rights reserved. For permissions, please email: [email protected] Access Publication 8 October 2009
Introduction
A large number of indices to assess malocclusion have been developed with the aim of estimating orthodontic treatment need in particular populations or communities, to select the patients who can be treated in a certain dental care system and to establish priorities when resources are limited. Although no absolute consensus has been reached on the individual characteristics and occlusal features that should be assessed in order to objectively establish treatment need (Richmond et al., 1994), in the recent literature, the orthodontic treatment need indices used in epidemiological studies of malocclusion in different countries have tended to coincide in many ways, to unify criteria, and have been recognized by various international associations. Such indices include the Dental Aesthetic Index (DAI; Cons et al. 1986) and the Index of Orthodontic Treatment Need (IOTN; Brook and Shaw 1989). The DAI links the clinical and Aesthetic Components (ACs) mathematically to arrive at a single mark which combines the physical and aesthetic aspects of the occlusion. It is based on a social acceptability scale of occlusal conditions (Jenny et al., 1980) and has been used in many studies to determine orthodontic
Diagnostic agreement in the assessment of orthodontic
treatment need using the Dental Aesthetic Index and the Index of
Orthodontic Treatment Need
David Manzanera, José María Montiel-Company, José Manuel Almerich-Silla and José Luis GandíaDepartment of Stomatology, University of Valencia, Spain
SUMMARY The aim of this study was to estimate the diagnostic agreement between assessments of orthodontic treatment need of a child population using the Dental Aesthetic Index (DAI) and the Index of Orthodontic Treatment Need (IOTN). A cross-sectional study of a representative random sample of children aged 12 (n = 475) and 15–16 (n = 398) years was carried out in the Valencia region of Spain. A Student’s t-test was used to compare the DAI means by gender and age and a chi-square test to compare the proportions of the population in need of orthodontic treatment. To calculate the agreement between the two indices, intra-class correlation coefficient and Kappa statistics were employed.
Of the 12-year-olds, 23.5 per cent (n = 121) and of the 15- to 16-year-olds, 26.6 per cent (n = 108) were receiving or had previously received orthodontic treatment. The observed agreement between the two indices on the need for treatment among the 12-year-olds (n = 363) was 83.4 per cent and Kappa for diagnostic agreement was 0.52 [95 per cent confidence interval (CI): 0.42–0.63]. For the 15- to 16-year-olds (n = 292), the figures were 82.5 per cent and 0.38 (95 per cent CI: 0.24–0.52), respectively. For the total sample (n = 655), the observed agreement was 83 per cent and the diagnostic agreement was 0.47 (95 per cent CI: 0.39–0.55).
For this population, there was only moderate agreement between the two indices. This means that, when one of these indices is used to measure or prioritize orthodontic treatment in a determined population, the individuals selected with an obvious treatment need are going to be different in 17 per cent of the cases depending on which index is used, DAI or IOTN. This difference has to be taken in consideration when measuring, recording, or quantifying orthodontic treatment need.
treatment need in different countries (Ansai et al., 1993; Estioko et al., 1994; Otuyemi et al., 1998; Esa et al., 2001; Baca-Garcia et al., 2004; Bernabé and Flores-Mir, 2006). A DAI scale that divided the continuous index score defined by the equation into four malocclusion severity levels was established, making it easier to use and encouraging its application in orthodontic care programmes or malocclusion prevalence studies (Jenny and Cons, 1996b). It was included in the World Health Organization Oral Health Survey Methods (1997).
Unlike the DAI, the IOTN classifies malocclusions according to the presence of particular occlusal features which are considered important for dental health and aesthetics in order to identify individuals who would derive the most benefit from orthodontic treatment. This index includes an AC with 10 severity levels and a Dental Health Component (DHC) with five severity levels. The two components are analysed separately and although they cannot be united into a single score, they can be combined to classify the patient as ‘orthodontic treatment need, Yes or No’, following the modifications of Burden et al. (1999). The IOTN has been used for this purpose in many
D. MANzANERA ET Al.194
epidemiological studies (Burden and Holmes, 1994; Hamdan, 2001; Manzanera et al., 2004; Mugonzibwa et al., 2004; Chestnutt et al., 2006; Souames et al., 2006). Other indices, such as the Handicapping labio-lingual Deviations Index (Beglin et al. 2001) used in the United States and, more recently, the Index of Complexity, Outcome, and Need (Daniels and Richmond 2000), have been validated and proposed as useful tools to objectively measure orthodontic treatment need, but the DAI and IOTN are, at present, the most widely used.
Jenny and Cons (1996a) compared the DAI and IOTN in a descriptive way, providing some historical perspective regarding their development, reliability, and validity as well as similarities and differences. Freer and Freer (1999) analysed the disagreements between the two methods on 100 study models of 11- to 13-year-old students. Beglin et al. (2001) compared the indices with a panel of orthodontists and found that they appear to be valid measures of treatment need. The findings of Hlongwa et al. (2004) indicate that the two indices could be used consistently to identify orthodontic treatment need in different ethnic groups. In the majority of studies, both indices (DAI and IOTN) have been used together to assess the same broad representative sample and for comparison of the results (Abdullah and Rock, 2001).
The objective of this study was to calculate the diagnostic agreement between DAI and IOTN assessments of orthodontic treatment need in a representative random sample child population where the information was obtained directly in the course of an epidemiological survey.
Subjects and methods
Ethical approval and consent
The study was approved by the ethical committee of the University of Valencia. The examinations were conducted with permission from the education authorities and head teachers, and with informed consent of the pupils’ parents.
Study group
Stratified random sampling within clusters was conducted in a population comprising all first and fourth year secondary school children in the Valencia region. Thirty-nine schools were selected and between 20 and 30 pupils were examined in each.
The study was conducted on a representative random sample of 12 (n = 475) and 15 to 16 (n = 398) year old children in the Valencia region of Spain that had been analysed previously (Almerich-Silla and Montiel-Company, 2006; Manzanera et al., 2009). Children who were undergoing or had previously received orthodontic treatment were excluded; this represented 23.5 per cent (n = 112) of the initial sample of 12-year-olds and 26.6
per cent (n = 108) of the 15- to 16-year-olds. The application of this exclusion criterion led to a final sample size of 363 under 12-year-old (175 boys and 188 girls) and 292 under 15- to 16-year-old (131 boys and 161 girls) schoolchildren.
Clinical examination
The epidemiological study was carried out by six dental graduates who were divided into three examination teams, assigning them the function of examiner or recorder depending on their calibration. Prior to the examinations, sessions were conducted to explain the diagnostic criteria and to train the graduates in the use of the DAI and IOTN. The examiners were then calibrated, firstly with 20 plaster models of different malocclusions, and then under real examination conditions with 20 schoolchildren of the ages to be surveyed. To ensure the reliability of the measurements, orthodontic treatment need diagnosis calibration was carried out during the weeks prior to commencement of the study. The three dentists with the highest agreement with one of the authors (DM, a specialist in orthodontics with expertise in the field was considered as the gold standard), assessed using Kappa statistics, were appointed as examiners. Kappa values with the gold-standard examiner were 0.98, 0.88, and 0.86 for the three examiners. To ensure the reproducibility of the measurements, 50 children were re-evaluated (10 per cent of the sample) after 1 month. Kappa values were over 0.80 for the three examiners.
Intraoral examinations were conducted to register all the necessary malocclusion features to obtain the DAI and the IOTN (overjet, overbite, anterior and posterior crossbite, open bite, displacement of the teeth, diastemas, impeded eruption, hypodontia, clefts of the lip and/or palate, and molar relationship), as well as personal details (name, age, and gender).
The DAI results were classified on the four-grade scale proposed by Jenny and Cons (1996b) and individuals placed in levels 3 and 4 were considered to require treatment.
The DHC of the IOTN was determined in a five-grade scale and the IOTN AC on a three-grade scale. In determining the IOTN, the criteria established by Burden and Pine (1999) were employed, considering those who met the requirements specified in the modified IOTN (IOTN DHC ≥4 and/or IOTN AC ≥8) to be individuals with a definite need for treatment. The two indices DAI and modified IOTN were dichotomized into ‘yes’ or ‘no’ categories of orthodontic treatment need.
Statistical analysis
Statistical analysis was undertaken using the Statistical Package for Social Sciences version 12.0® (SPSS Inc., Chicago, Illinois, USA). The data were entered into a Microsoft Access 2003® database. A Student’s t-test was used to compare the DAI means by gender and age and a

195DIAGNOSTIC AGREEMENT BETWEEN DAI AND IOTN
chi-square test to compare the proportions of the population in need of orthodontic treatment. Differences greater than P < 0.05 were considered statistically significant.
The agreement between DAI (expressed on a four-grade scale), IOTN DHC (on a five-grade scale), and IOTN AC (on a three-grade scale) was calculated using intraclass correlation coefficients (ICCs)
Observed percentage agreement and unweighted Kappa statistics were used to analyse the agreement between the DAI and modified IOTN dichotomized into yes or no categories of orthodontic treatment need. The agreement was defined using the scale of Landis and Koch (1977).
Results
Orthodontic treatment need according to the DAI
The mean DAI in the 12-year-old group was 26.1 with a standard deviation (SD) of 5.9, and in the 15- to 16-year-olds, it was 25.2 (SD 6.0). The difference between the mean DAI of the two age groups was not statistically significant ( P > 0.05). No significant differences by gender were observed in the 12-year-old group; in the 15- to 16-year-olds, the mean DAI was significantly higher in boys than in girls ( P < 0.05), although this difference was not significant when DAI scores were classified into category levels. Table 1 shows the percentage of children placed in each of the treatment need
levels after classifying each individual’s DAI score. Considering grades 3 and 4 as indicating a clear need for orthodontic treatment, the percentage of the population in need of treatment would be 21.2 per cent [95 per cent confidence interval (CI): 17.1–25.7] at 12 years of age and 16.1 per cent (95 per cent CI: 12.1–20.8) at 15–16 years of age.
Orthodontic treatment need according to the IOTN
Table 2 shows the different IOTN DHC levels. If grades 4 and 5 are considered as representing a definite need for treatment, 21.8 per cent (95 per cent CI: 17.6–26.4) of the 12-year olds and 17.1 per cent (95 per cent CI: 12.9–21.9) of the 15- to 16-year olds required treatment. No significant differences in treatment need proportions by age or gender were found (P > 0.05).
According to the IOTN AC, the treatment need was 4.4 per cent (95 per cent CI: 2.5–7.1) in the 12-year olds and 2.4 per cent (95 per cent CI: 0.9–4.9) in the 15- to 16-year olds (Table 3). No significant differences in the treatment need proportions by age or gender were found (P > 0.05). Considering the modified IOTN (IOTN DHC grades 4–5 and/or IOTN AC grades 8–10), the treatment need was 23.5 per cent (95 per cent CI: 19.2–28.1) at 12 years of age and 18.5 per cent (95 per cent CI: 14.2–23.4) at 15–16 years of age. The differences by age and gender were not significant (P > 0.05).
Table 1 Distribution of Dental Aesthetic Index (DAI) scores and orthodontic treatment need in the examined subjects.
DAI 12-year-olds (n = 363) 15- to 16-year-olds (n = 292)
% (95% CI) % (95% CI)
≤25 (grade 1) Normal or minor malocclusion; no treatment or slight need 52.1 (46.7–57.3) 57.2 (51.2–62.9)26–30 (grade 2) Definite malocclusion; treatment elective 26.7 (22.2–31.5) 26.7 (21.7–32.0)31–35 (grade 3) Severe malocclusion; treatment highly desirable 13.2 (9.9–17.1) 9.6 (6.4–13.5)≥36 (grade 4) Very severe (handicapping) malocclusion; treatment mandatory 8 (5.4–11.2) 6.5 (3.9–9.9)
Table 2 Distribution of the Index of Orthodontic Treatment Need (IOTN) Dental Health Component (DHC) levels of orthodontic treatment need in the examined subjects.
IOTN (DHC) 12-year-olds (n = 363) 15- to 16-year-olds (n = 292)
% (95% CI) % (95% CI)
Grade 1. Normal or minor malocclusion. No need. 15.4 (11.8–19.6) No need; 78.2 (73.6–82.4)
17.1 (12.9–21.9) No need; 82.9 (78.1–87.0)Grade 2. Minor malocclusion. little need. 31.1 (26.4–36.2) 46.3 (40.4–52.1)
Grade 3. Moderate malocclusion. Borderline need. 31.7 (26.9–36.7) 19.5 (15.1–24.5)Grade 4. Severe malocclusion. Needs treatment. 16.0 (12.4–20.1) Definite need;
21.8 (17.6–26.4)15.4 (11.4–20.1) Definite need;
17.1 (12.9–21.9)Grade 5. Very severe malocclusion. Needs treatment. 5.8 (3.6–8.7) 1.7 (1.3–2.2)
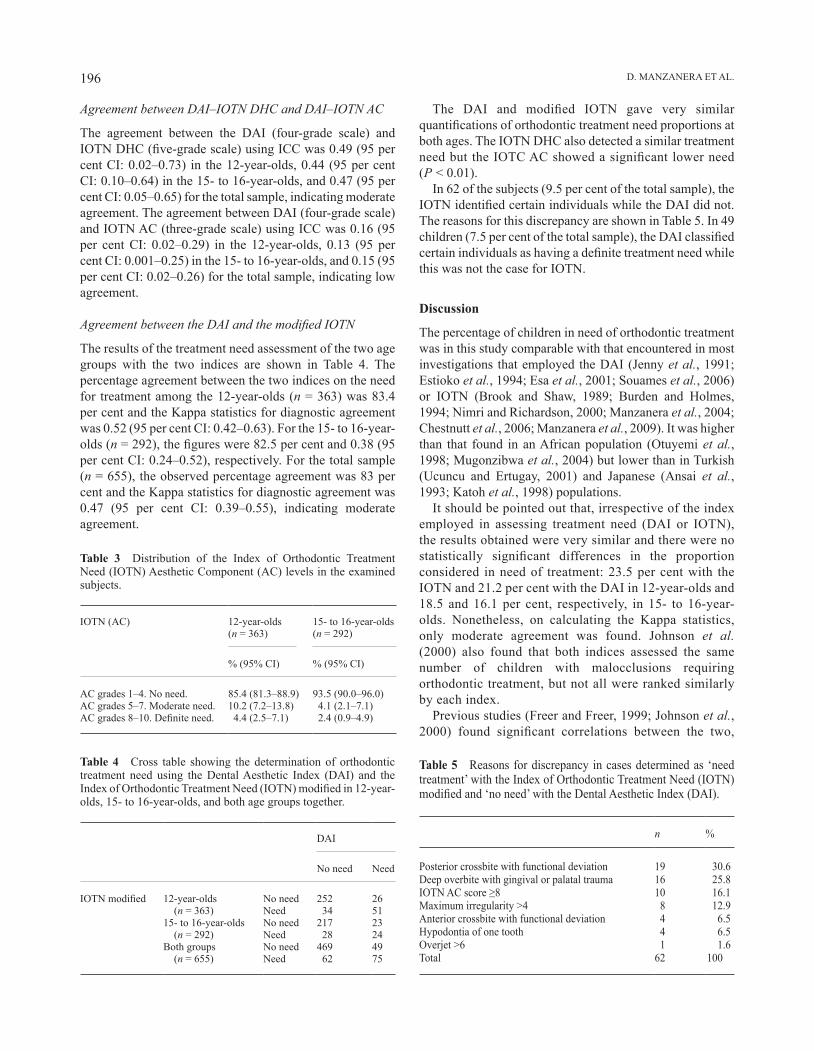
D. MANzANERA ET Al.196
Agreement between DAI–IOTN DHC and DAI–IOTN AC
The agreement between the DAI (four-grade scale) and IOTN DHC (five-grade scale) using ICC was 0.49 (95 per cent CI: 0.02–0.73) in the 12-year-olds, 0.44 (95 per cent CI: 0.10–0.64) in the 15- to 16-year-olds, and 0.47 (95 per cent CI: 0.05–0.65) for the total sample, indicating moderate agreement. The agreement between DAI (four-grade scale) and IOTN AC (three-grade scale) using ICC was 0.16 (95 per cent CI: 0.02–0.29) in the 12-year-olds, 0.13 (95 per cent CI: 0.001–0.25) in the 15- to 16-year-olds, and 0.15 (95 per cent CI: 0.02–0.26) for the total sample, indicating low agreement.
Agreement between the DAI and the modified IOTN
The results of the treatment need assessment of the two age groups with the two indices are shown in Table 4. The percentage agreement between the two indices on the need for treatment among the 12-year-olds (n = 363) was 83.4 per cent and the Kappa statistics for diagnostic agreement was 0.52 (95 per cent CI: 0.42–0.63). For the 15- to 16-year-olds (n = 292), the figures were 82.5 per cent and 0.38 (95 per cent CI: 0.24–0.52), respectively. For the total sample (n = 655), the observed percentage agreement was 83 per cent and the Kappa statistics for diagnostic agreement was 0.47 (95 per cent CI: 0.39–0.55), indicating moderate agreement.
Table 5 Reasons for discrepancy in cases determined as ‘need treatment’ with the Index of Orthodontic Treatment Need (IOTN) modified and ‘no need’ with the Dental Aesthetic Index (DAI).
n %
Posterior crossbite with functional deviation 19 30.6Deep overbite with gingival or palatal trauma 16 25.8IOTN AC score ≥8 10 16.1Maximum irregularity >4 8 12.9Anterior crossbite with functional deviation 4 6.5Hypodontia of one tooth 4 6.5Overjet >6 1 1.6Total 62 100
Table 3 Distribution of the Index of Orthodontic Treatment Need (IOTN) Aesthetic Component (AC) levels in the examined subjects.
IOTN (AC) 12-year-olds (n = 363)
15- to 16-year-olds (n = 292)
% (95% CI) % (95% CI)
AC grades 1–4. No need. 85.4 (81.3–88.9) 93.5 (90.0–96.0)AC grades 5–7. Moderate need. 10.2 (7.2–13.8) 4.1 (2.1–7.1)AC grades 8–10. Definite need. 4.4 (2.5–7.1) 2.4 (0.9–4.9)
Table 4 Cross table showing the determination of orthodontic treatment need using the Dental Aesthetic Index (DAI) and the Index of Orthodontic Treatment Need (IOTN) modified in 12-year-olds, 15- to 16-year-olds, and both age groups together.
DAI
No need Need
IOTN modified 12-year-olds (n = 363)
No need 252 26Need 34 51
15- to 16-year-olds (n = 292)
No need 217 23Need 28 24
Both groups (n = 655)
No need 469 49Need 62 75
The DAI and modified IOTN gave very similar quantifications of orthodontic treatment need proportions at both ages. The IOTN DHC also detected a similar treatment need but the IOTC AC showed a significant lower need (P < 0.01).
In 62 of the subjects (9.5 per cent of the total sample), the IOTN identified certain individuals while the DAI did not. The reasons for this discrepancy are shown in Table 5. In 49 children (7.5 per cent of the total sample), the DAI classified certain individuals as having a definite treatment need while this was not the case for IOTN.
Discussion
The percentage of children in need of orthodontic treatment was in this study comparable with that encountered in most investigations that employed the DAI (Jenny et al., 1991; Estioko et al., 1994; Esa et al., 2001; Souames et al., 2006) or IOTN (Brook and Shaw, 1989; Burden and Holmes, 1994; Nimri and Richardson, 2000; Manzanera et al., 2004; Chestnutt et al., 2006; Manzanera et al., 2009). It was higher than that found in an African population (Otuyemi et al., 1998; Mugonzibwa et al., 2004) but lower than in Turkish (Ucuncu and Ertugay, 2001) and Japanese (Ansai et al., 1993; Katoh et al., 1998) populations.
It should be pointed out that, irrespective of the index employed in assessing treatment need (DAI or IOTN), the results obtained were very similar and there were no statistically significant differences in the proportion considered in need of treatment: 23.5 per cent with the IOTN and 21.2 per cent with the DAI in 12-year-olds and 18.5 and 16.1 per cent, respectively, in 15- to 16-year-olds. Nonetheless, on calculating the Kappa statistics, only moderate agreement was found. Johnson et al. (2000) also found that both indices assessed the same number of children with malocclusions requiring orthodontic treatment, but not all were ranked similarly by each index.
Previous studies (Freer and Freer, 1999; Johnson et al., 2000) found significant correlations between the two,
197DIAGNOSTIC AGREEMENT BETWEEN DAI AND IOTN
although they did not use kappa statistics as the agreement measure. It would appear logical to presume that the two indices will differ in certain cases, as there are evident differences in how they work and how they score certain occlusal features (Beglin et al., 2001). This fact needs to be analysed, as it cannot be concluded that the same percentage of the population in need of treatment would be detected whichever index is used, which is of epidemiological importance, since if it were known that the results were not going to vary, the most appropriate index for future studies could be chosen on the basis of different considerations; no less important, however, is the fact that if these indices are used for administrative purposes and the aim is to prioritize the available resources in an orthodontic service or institution, the index used (DAI or IOTN) entails evident differences as regards which patients are selected by one or the other. In 17 per cent of cases, bearing in mind that the percentage disagreement between the two indices in the present study, the selection would not be identical; this means that the same individual may or may not be selected for treatment depending on which index is used, circumstance that may be problematic and undesirable.
The findings of this study coincide with those of Jenny and Cons (1996a). DAI and IOTN are different in nature, designed and drawn up using methods that are not comparable, so although they try to measure the same condition (orthodontic treatment need), they do not do it in the same way and, obviously, there are cases in which they differ.
The IOTN is divided into two components which are designed to assess different malocclusion parameters and are never unified. In the IOTN DHC, the basis for the treatment need grades, founded on an extensive review of the literature on this subject, is that certain occlusal features are potentially detrimental to the dental health of the individual. For this reason, it takes into account certain conditions and aspects of the dentition which, while often not aesthetically detrimental, could be dentally or functionally negative (anterior or posterior crossbite with functional deviation, impacted teeth, increased overbite, etc.). The difference is clear on examining the main reasons why the IOTN selected certain individuals and the DAI did not: in most cases, it was because of the existence of a posterior or anterior crossbite with functional malocclusion, deep overbite with signs of indentation or trauma in the vestibular or palatal mucosa, an IOTN AC score greater than 7, or maximum irregularity greater than 4 mm.
The DAI is based on dental aesthetics, and its constituent features do not include functional considerations or potential risks to the dentition. It was developed by asking approx-imately 2000 adolescents and adults to rate the aesthetics of 200 photographs of occlusal configurations, representing the entire spectrum of possible malocclusions, then selecting
those which were considered the least acceptable by the study population. For this reason, unlike the IOTN, the DAI does not take into account possible occlusal findings that could be functionally detrimental to the individual but are not aesthetically significant. Additionally, the scoring system of the IOTN AC is based on the response of the individual concerned, i.e. on how the malocclusion is self-perceived, through comparison with one of the IOTN AC photographs, which are arranged from the most to the least attractive. These reasons may go a long way towards explaining why the IOTN selects certain individuals that the DAI did not.
In addition to the above reasons, a further consideration should be taken into account when analysing the differences between the IOTN and the DAI: the latter is a cumulative index, the former is not. This has consequences for the final results, as the IOTN will not select an individual with various occlusal anomalies that do not reach grade 4 or 5 of the IOTN DHC since none of these conditions is of a severity that classifies that individual as definitely needing treatment. From this point of view, the IOTN is an ‘all or nothing’ index. The DAI, on the other hand, takes 10 occlusal situations into account, weights them according to their relative contribution to the aesthetic impairment caused by the malocclusion, then sums them to arrive at a final score. As each of the situations can contribute to a small degree to the final score, it is not possible to determine exactly which specific occlusal finding causes the discrepancy between the IOTN and the DAI because it is always due to a sum of different factors. For this reason, in those cases (when the DAI selected patients that the IOTN did not), no ordered classification of the causes of the diverging criteria was made. To attempt to explain them, an assessment was made of the occlusal parameters that are taken into account and score higher in the DAI but not in the IOTN, such as midline diastema and maxillary and mandibular spacing. Of these subjects, 71.1 per cent scored 3 in the IOTN DHC, making them borderline treatment need cases; 35.6 per cent presented a midline diastema, which adds points in the DAI but is not taken into account in the IOTN; additionally, in 57.8 per cent of these cases, the same individual presented maxillary and mandibular irregularity (but not exceeding 4 mm) and an overjet greater than 3 mm (but below 7 mm), so their DAI scores increased but they did not reach IOTN DHC grade 4 and were therefore not selected by the IOTN.
The differences found in the determination of orthodontic treatment need depending on which particular index (DAI or IOTN) is used to reinforce the point stated by some authors (Tsakos et al., 2006, Klages et al., 2006) that normative measures should be used in combination with quality-of-life questionnaires to cover the malocclusion dimension of oral health.

D. MANzANERA ET Al.198
Conclusions
There is only moderate agreement between the DAI and the IOTN. This means that, although the proportion of individuals in need of treatment detected by both indices is very similar, there are differences in the assessment of need for the same individuals depending on which index is used. This difference has to be taken in consideration when measuring, recording, or quantifying orthodontic treatment need.
Address for correspondence
Dr José Manuel Almerich-SillaDepartament d’EstomatologiaClínica OdontològicaUniversitat de ValènciaC/Gascó Oliag No. 146010-ValenciaSpainE-mail: [email protected]
ReferencesAbdullah M S, Rock W P 2001 Assessment of orthodontic treatment need
in 5112 Malaysian children using the IOTN and the DAI. Community Dental Health 18: 242–248
Almerich-Silla J M, Montiel-Company J M 2006 Oral health survey of the child population in the Valencia region of Spain. Medicina Oral Patología Oral Cirugía Bucal 11: 369–381
Ansai T et al. 1993 Prevalence of malocclusion in high school students in Japan according to the Dental Aesthetic Index. Community Dentistry and Oral Epidemiology 21: 303–305
Baca-Garcia A, Bravo M, Baca P, Baca A, Junco P 2004 Malocclusions and orthodontic treatment needs in a group of Spanish adolescents using the Dental Aesthetic Index. International Dental Journal 54: 138–142
Beglin F M, Firestone A R, Vig K W, Beck F M, Kuthy R A, Wade D 2001 A comparison of the reliability and validity of 3 occlusal indices of orthodontic treatment need. American Journal of Orthodontics and Dentofacial Orthopedics 120: 240–246
Bernabé D, Flores-Mir C 2006 Orthodontic treatment need in Peruvian young adults evaluated through Dental Aesthetic Index. The Angle Orthodontist 76: 417–421
Brook P H, Shaw W C 1989 The development of an index of orthodontic treatment priority. European Journal of Orthodontics 11: 309–320
Burden D J, Holmes A 1994 The need for orthodontic treatment in the child population of the United Kingdom. European Journal of Orthodontics 16: 395–399
Burden D J, Pine C M, Burnside G 1999 Modified IOTN: an orthodontic treatment need index for use in oral health surveys. Community Dentistry and Oral Epidemiology 27: 413–418
Chestnutt I G, Burden D J, Steele J G, Pitts N B, Nuttall N M, Morris A J 2006 The orthodontic condition of children in the United Kingdom. British Dental Journal 200: 609–612
Cons N C, Jenny J, Kohout F J 1986 DAI: the Dental Aesthetic Index. College of Dentistry. University of Iowa, Iowa City
Daniels C, Richmond S 2000 The development of the index of complexity, outcome and need (ICON). Journal of Orthodontics 27: 149–162
Esa R, Razak l A, Allister J H 2001 Epidemiology of malocclusion and orthodontic treatment need of 12-13-year-old Malaysian schoolchildren. Community Dental Health 18: 31–36
Estioko l J, Wright F A C, Morgan M V 1994 Orthodontic treatment need of secondary schoolchildren in Heidelberg, Victoria: an epidemiologic study using the Dental Aesthetic Index. Community Dental Health 11: 147–151
Freer E, Freer T J 1999 Variations in treatment need using four screening methods. Australian Orthodontic Journal 15: 214–218
Hamdan A M 2001 Orthodontic treatment need in Jordanian school children. Community Dental Health 18: 177–180
Hlongwa P, Beane R A, Seedat A K, Owen C P 2004 Orthodontic treatment needs: comparison of two indices. Journal of the South African Dental Association 59: 421–424
Jenny J, Cons N C 1996a Comparing and contrasting two orthodontic indices: the Index of Orthodontic Treatment Need and the Dental Aesthetic Index. American Journal of Orthodontics and Dentofacial Orthopedics 110: 410–416
Jenny J, Cons N C 1996b Establishing malocclusion severity levels on the Dental Aesthetic Index (DAI) scale. Australian Dental Journal 41: 43–46
Jenny J, Cons N C, Kohout F J, Frazier P J 1980 Test of a method to determine socially acceptable occlusal conditions. Community Dentistry and Oral Epidemiology 8: 424–433
Jenny J, Cons N C, Kohout F J, Jakobsen J 1991 Differences in need for orthodontic treatment between native Americans and the general population based on DAI scores. Journal of Public Health 51: 234–238
Johnson M, Harkness M, Crowther P, Herbison P 2000 A comparison of two methods of assessing orthodontic treatment need in the mixed dentition: DAI and IOTN. Australian Orthodontic Journal 16: 82–87
Katoh Y, Ansai T, Takehar T 1998 A comparison of DAI scores and characteristics of occlusal traits in three ethnic groups of Asian origin. International Dental Journal 48: 405–411
Klages U, Claus N, Wehrbein H, zentner A 2006 Development of a questionnaire for assessment of the psychosocial impact of dental aesthetics in young adults. European Journal of Orthodontics 28: 103–111
landis J R, Koch G G 1977 The measurement of observer agreement for categorical data. Biometrics 33: 159–174
Manzanera D, Montiel-Company J M, Almerich-Silla J M, Gandía J l 2009 Orthodontic treatment need in Spanish schoolchildren: an epidemiological study using the Index of Orthodontic Treatment Need. European Journal of Orthodontics 31: 180–183
Manzanera D, Ortiz l A, Gandía J l, Cibrián R, Adobes-Martin M 2004 Índice de Necesidad de tratamiento Ortodóncico (IOTN) en escolares de 10 a 12 años. Revista Española de Ortodoncia 34: 209–217
Mugonzibwa E A, Kuijpers-Jagtman A M, Van’t Hof M A, Kikwilu E N 2004 Need for orthodontic treatment among Tanzanian children. East African Medical Journal 81: 10–15
Nimri K, Richardson A 2000 Interceptive orthodontics in the real world of community dentistry. International Journal of Paediatric Dentistry 10: 99–108
Otuyemi O D et al. 1998 Perceptions of dental aesthetics in the United States and Nigeria. Community Dentistry and Oral Epidemiology 26: 418–420
Richmond S, O’Brien K D, Roberts C, Andrews M 1994 Dentists’ variation in the determination of orthodontic treatment need. British Journal of Orthodontics 21: 65–68
Souames M, Bassigny F, zenati N, Roirdan P J, Boy-lefevre M l 2006 Orthodontic treatment need in French schoolchildren: an epidemiological study using the Index of Orthodontic Treatment Need. European Journal of Orthodontics 28: 605–609
Tsakos G, Gherunpong S, Sheiham A 2006 Can oral health-related quality of life measures substitute for normative needs assessment in 11 to 12-year-old children? Journal of Public Health Dentistry 66: 263–268
Ucuncu N, Ertugay E 2001 The use of the Index of Orthodontic Treatment Need (IOTN) in a school population and referred population. Journal of Orthodontics 28: 45–52
World Health Organization 1997 Oral health surveys: basic methods. WHO, Geneva
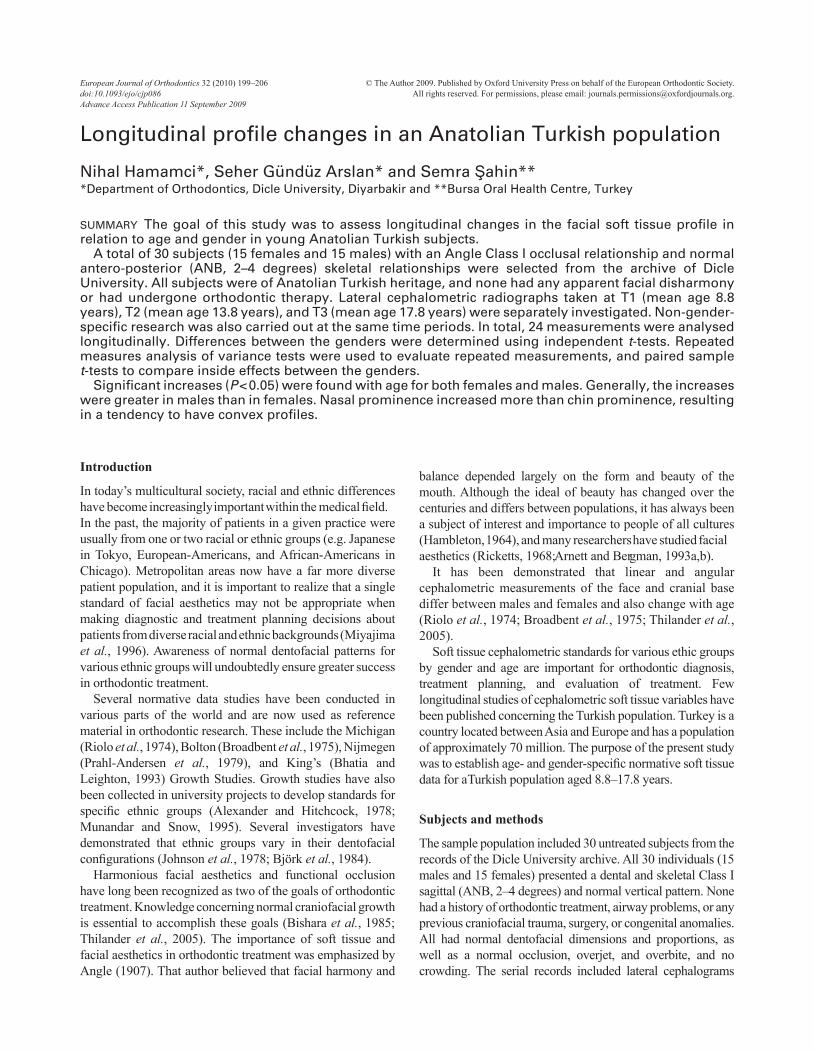
European Journal of Orthodontics 32 (2010) 199–206 © The Author 2009. Published by Oxford University Press on behalf of the European Orthodontic Society.doi:10.1093/ejo/cjp086 All rights reserved. For permissions, please email: [email protected] Access Publication 11 September 2009
Introduction
In today’s multicultural society, racial and ethnic differences have become increasingly important within the medical field. In the past, the majority of patients in a given practice were usually from one or two racial or ethnic groups (e.g. Japanese in Tokyo, European-Americans, and African-Americans in Chicago). Metropolitan areas now have a far more diverse patient population, and it is important to realize that a single standard of facial aesthetics may not be appropriate when making diagnostic and treatment planning decisions about patients from diverse racial and ethnic backgrounds (Miyajima et al., 1996). Awareness of normal dentofacial patterns for various ethnic groups will undoubtedly ensure greater success in orthodontic treatment.
Several normative data studies have been conducted in various parts of the world and are now used as reference material in orthodontic research. These include the Michigan (Riolo et al., 1974), Bolton (Broadbent et al., 1975), Nijmegen (Prahl-Andersen et al., 1979), and King’s (Bhatia and Leighton, 1993) Growth Studies. Growth studies have also been collected in university projects to develop standards for specific ethnic groups (Alexander and Hitchcock, 1978; Munandar and Snow, 1995). Several investigators have demonstrated that ethnic groups vary in their dentofacial configurations (Johnson et al., 1978; Björk et al., 1984).
Harmonious facial aesthetics and functional occlusion have long been recognized as two of the goals of orthodontic treatment. Knowledge concerning normal craniofacial growth is essential to accomplish these goals (Bishara et al., 1985; Thilander et al., 2005). The importance of soft tissue and facial aesthetics in orthodontic treatment was emphasized by Angle (1907). That author believed that facial harmony and
Longitudinal profile changes in an Anatolian Turkish population
Nihal Hamamci*, Seher Gündüz Arslan* and Semra Sahin***Department of Orthodontics, Dicle University, Diyarbakir and **Bursa Oral Health Centre, Turkey
SUMMARY The goal of this study was to assess longitudinal changes in the facial soft tissue profile in relation to age and gender in young Anatolian Turkish subjects.
A total of 30 subjects (15 females and 15 males) with an Angle Class I occlusal relationship and normal antero-posterior (ANB, 2–4 degrees) skeletal relationships were selected from the archive of Dicle University. All subjects were of Anatolian Turkish heritage, and none had any apparent facial disharmony or had undergone orthodontic therapy. Lateral cephalometric radiographs taken at T1 (mean age 8.8 years), T2 (mean age 13.8 years), and T3 (mean age 17.8 years) were separately investigated. Non-gender-specific research was also carried out at the same time periods. In total, 24 measurements were analysed longitudinally. Differences between the genders were determined using independent t-tests. Repeated measures analysis of variance tests were used to evaluate repeated measurements, and paired sample t-tests to compare inside effects between the genders.
Significant increases (P < 0.05) were found with age for both females and males. Generally, the increases were greater in males than in females. Nasal prominence increased more than chin prominence, resulting in a tendency to have convex profiles.
balance depended largely on the form and beauty of the mouth. Although the ideal of beauty has changed over the centuries and differs between populations, it has always been a subject of interest and importance to people of all cultures (Hambleton, 1964), and many researchers have studied facial aesthetics (Ricketts, 1968; Arnett and Bergman, 1993a,b).
It has been demonstrated that linear and angular cephalometric measurements of the face and cranial base differ between males and females and also change with age (Riolo et al., 1974; Broadbent et al., 1975; Thilander et al., 2005).
Soft tissue cephalometric standards for various ethic groups by gender and age are important for orthodontic diagnosis, treatment planning, and evaluation of treatment. Few longitudinal studies of cephalometric soft tissue variables have been published concerning the Turkish population. Turkey is a country located between Asia and Europe and has a population of approximately 70 million. The purpose of the present study was to establish age- and gender-specific normative soft tissue data for a Turkish population aged 8.8–17.8 years.
Subjects and methods
The sample population included 30 untreated subjects from the records of the Dicle University archive. All 30 individuals (15 males and 15 females) presented a dental and skeletal Class I sagittal (ANB, 2–4 degrees) and normal vertical pattern. None had a history of orthodontic treatment, airway problems, or any previous craniofacial trauma, surgery, or congenital anomalies. All had normal dentofacial dimensions and proportions, as well as a normal occlusion, overjet, and overbite, and no crowding. The serial records included lateral cephalograms

N. HAmAmci eT Al.200
and clinical recordings taken at the chronological ages of 8.8 (T1), 13.8 (T2), and 17.8 (T3). Table 1 presents the mean ages for females, males, and the total group.
The lateral cephalometric radiograph of each subject was taken with an Asahi Cephalometer (CX 90X, Asahi Roentgen, Kyoto, Japan) at the Dental Radiology Clinic of Dicle University School of Dentistry. All subjects were positioned in the cephalostat with the sagittal plane at right angle to the path of the X-rays, the Frankfort plane parallel to the horizontal, the teeth in centric occlusion, and the lips lightly closed (Erbay et al., 2002).
A single author (NH) traced all the radiographs by hand on 0.003 matte acetate sheets. SNA, SNB, and ANB angles for all subjects were measured to confirm an Angle class i malocclusion. Seventeen linear and four angular measurements were also determined to assess soft tissue growth.
The individuals in the study were classified by gender at each time period and then combined. Linear and angular soft tissue measurements were conducted according to the points and lines shown in Figures 1 and 2. Figures 3 and 4 demonstrate the linear measurements, and Figure 5 the angular measurements. Gender differences and time-related changes over different periods were statistically assessed.
Statistical analysis
Differences between genders were determined using an independent t-test. A repeated measures analysis of variance was used to evaluate repeated measurements and a paired sample t-test to compare between-group effects. Normal distributions were evaluated using the Kolmogorov–Smirnov test, and homogeneity with Levene’s test (Windows, release 15.0 SPSS, Chicago, Illinois, USA).
Error of the method
One month after the first measurement, the lateral cephalometric radiographs of 15 patients were randomly selected and re-measured by the same examiner. The casual error was calculated according to the formula (S2 = Sd2/2n) (Dahlberg, 1940), where S2 is the error of variance and d is the difference between the two determinations of the same variable. Systematic error was evaluated with dependent t-tests, with the level of significance set at P < 0.05.
Results
The results of the systematic and casual errors are presented in Table 2. No systematic errors were detected, and the casual errors were within acceptable levels.
Differences between groups were tested using an independent t-test. The results indicated statistically significant differences in ANS/me, ST nasion/subnasale, subnasale/stomion, SD/UL, LT/LL, and nasolabial angle measurements at T1; N/me, ANS/me, subnasale/stomion, and li/ll measurements at T2; and ANB, N/me, ANS/me,
Table 1 Age range and standard deviations (SDs) of subjects at the mean ages of 8.8 (T1), 13.8 (T2), and 17.8 (T3) years.
Gender T1 (X ± SD) T2 (X ± SD) T3 (X ± SD)
Male 8.61 ± 0.68 13.63 ± 0.54 17.63 ± 0.53Female 9.11 ± 0.84 14.11 ± 0.71 18.13 ± 0.74Total 8.80 ± 0.76 13.80 ± 0.62 17.81 ± 0.63
Figure 1 Hard and soft tissue landmarks used in cephalometric analysis. 1, sella (S); 2, nasion (N); 3, soft tissue (ST) nasion; 4, pronasale; 5, subnasale (SlS); 6, upper lip (Ul); 7, stomion; 8, lower lip (ll); 9, Pgs (soft tissue pogonion); 10, soft tissue (ST) menton; 11, porion; 12, menton (me); 13, pogonion (Pg); 14, point B; 15, upper central incisor (Ui); 16, lower central incisor (li); 17, SD (the contact point of maxillary bone with the upper central incisor); 18, point A; 19, anterior nasal spine (ANS); 20, orbitale; 21, rhinion (the anterior tip at the end of the suture of the nasal bones).
ST nasion/subnasale, subnasale/stomion, stomion/ST Me, ANS/SLS, SD/UL, LI/LL, and nasal bone/SN measurements at T3 (Table 3).
Comparison of female subjects between T1 and T2 revealed statistically significant decreases in nasal dorsum/FH and nasolabial angle measurements and statistically significant increases in all measurements except ANB angle (Table 4). During the same time period, males demonstrated statistically significant decreases in ANB angle and nasal dorsum/FH measurements and statistically significant increases in all measurements except columella FH and nasolabial angle measurements (Table 5). In the total group, ANB angle, nasolabial dorsum/FH and nasolabial angle decreased significantly, whereas all other measurements increased significantly (Table 6).
Comparison of female subjects between T2 and T3 revealed statistically significant decreases in nasal dorsum/FH measurements and statistically significant increases in all parameters except for ANB and nasolabial angles (Table 4). During the same time period, males demonstrated

201 PROFile cHANGeS iN AN ANATOliAN TURKiSH POPUlATiON
Figure 2 Cephalometric planes used in study. 1, SN: plane passing through sella and nasion; 2, NA: plane passing through nasion and point A; 3, NB: plane passing through nasion and point B; 4, Frankfort horizontal: plane passing through porion and orbitale; 5, nasal tip: line passing through pronasale perpendicular with the Frankfort horizontal plane; 6, columella.
statistically significant decreases in ANB angle and nasal dorsum/FH measurements and statistically significant increases in all parameters except for nasolabial angle. In the total group, ANB angle and nasal dorsum/FH decreased significantly, whereas all other parameters increased statistically except nasolabial angle (Table 6).
Comparison of female subjects between T1 and T3 revealed statistically significant decreases in ANB angle, nasolabial dorsum/FH, and nasolabial angle and statistically significant
Figure 3 Antero-posterior linear measurements. 1, ST nasion/nasal tip; 2, nasion/nasal tip; 3, rhinion/nasal tip; 4, subnasale/nasal tip; 5, upper lip/nasal tip; 6, stomion/nasal tip; 7, ANS/SlS; 8, SD/Ul; 9, li/ll; 10, Pg/Pgs; 11, Pg/nasal tip.
Figure 4 Vertical linear measurement. 1, N/me; 2, N/ANS; 3, ANS/me; 4, ST nasion/subnasale; 5, subnasale/stomion; 6, stomion/ST me.
Figure 5 Angular measurements. 1, nasal bone/SN; 2, nasal dorsum/FH; 3, columella/FH; 4, nasolabial angle.
increases in all other parameters (Table 4). During the same time period, males demonstrated statistically significant decreases in ANB angle and nasal dorsum/FH and statistically significant increases in all other parameters except columella/FH and nasolabial angle (Table 5). in the total group, ANB angle, nasal dorsum/FH, and nasolabial angle decreased significantly, whereas all other parameters increased significantly (Table 6).
Discussion
Orthodontists need to understand how soft tissues change during growth (Prahl-Andersen et al., 1995). Predicted facial aesthetics can only be achieved if the amount and direction of growth can be correctly estimated (Nanda et al., 1990).
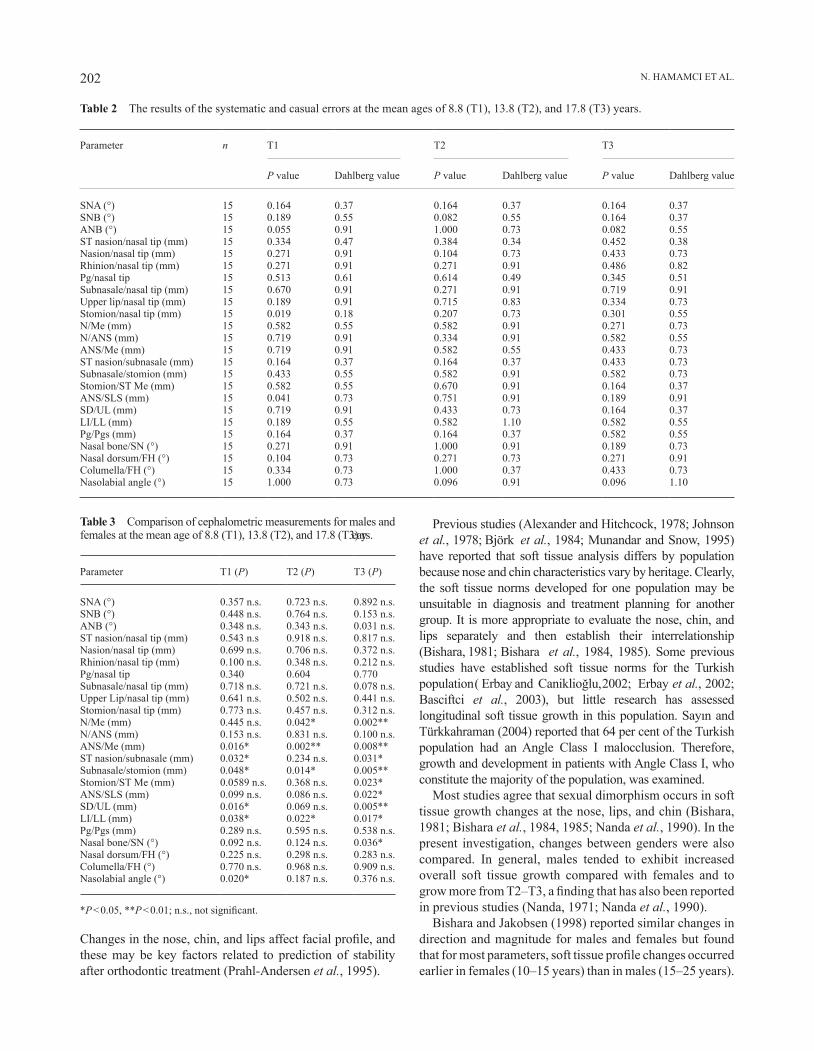
N. HAmAmci eT Al.202
changes in the nose, chin, and lips affect facial profile, and these may be key factors related to prediction of stability after orthodontic treatment (Prahl-Andersen et al., 1995).
Table 2 The results of the systematic and casual errors at the mean ages of 8.8 (T1), 13.8 (T2), and 17.8 (T3) years.
Parameter n T1 T2 T3
P value Dahlberg value P value Dahlberg value P value Dahlberg value
SNA (°) 15 0.164 0.37 0.164 0.37 0.164 0.37SNB (°) 15 0.189 0.55 0.082 0.55 0.164 0.37ANB (°) 15 0.055 0.91 1.000 0.73 0.082 0.55ST nasion/nasal tip (mm) 15 0.334 0.47 0.384 0.34 0.452 0.38Nasion/nasal tip (mm) 15 0.271 0.91 0.104 0.73 0.433 0.73Rhinion/nasal tip (mm) 15 0.271 0.91 0.271 0.91 0.486 0.82Pg/nasal tip 15 0.513 0.61 0.614 0.49 0.345 0.51Subnasale/nasal tip (mm) 15 0.670 0.91 0.271 0.91 0.719 0.91Upper lip/nasal tip (mm) 15 0.189 0.91 0.715 0.83 0.334 0.73Stomion/nasal tip (mm) 15 0.019 0.18 0.207 0.73 0.301 0.55N/Me (mm) 15 0.582 0.55 0.582 0.91 0.271 0.73N/ANS (mm) 15 0.719 0.91 0.334 0.91 0.582 0.55ANS/Me (mm) 15 0.719 0.91 0.582 0.55 0.433 0.73ST nasion/subnasale (mm) 15 0.164 0.37 0.164 0.37 0.433 0.73Subnasale/stomion (mm) 15 0.433 0.55 0.582 0.91 0.582 0.73Stomion/ST Me (mm) 15 0.582 0.55 0.670 0.91 0.164 0.37ANS/SLS (mm) 15 0.041 0.73 0.751 0.91 0.189 0.91SD/UL (mm) 15 0.719 0.91 0.433 0.73 0.164 0.37LI/LL (mm) 15 0.189 0.55 0.582 1.10 0.582 0.55Pg/Pgs (mm) 15 0.164 0.37 0.164 0.37 0.582 0.55Nasal bone/SN (°) 15 0.271 0.91 1.000 0.91 0.189 0.73Nasal dorsum/FH (°) 15 0.104 0.73 0.271 0.73 0.271 0.91columella/FH (°) 15 0.334 0.73 1.000 0.37 0.433 0.73Nasolabial angle (°) 15 1.000 0.73 0.096 0.91 0.096 1.10
Table 3 Comparison of cephalometric measurements for males and females at the mean age of 8.8 (T1), 13.8 (T2), and 17.8 (T3) years.
Parameter T1 (P) T2 (P) T3 (P)
SNA (°) 0.357 n.s. 0.723 n.s. 0.892 n.s.SNB (°) 0.448 n.s. 0.764 n.s. 0.153 n.s.ANB (°) 0.348 n.s. 0.343 n.s. 0.031 n.s.ST nasion/nasal tip (mm) 0.543 n.s 0.918 n.s. 0.817 n.s.Nasion/nasal tip (mm) 0.699 n.s. 0.706 n.s. 0.372 n.s.Rhinion/nasal tip (mm) 0.100 n.s. 0.348 n.s. 0.212 n.s.Pg/nasal tip 0.340 0.604 0.770Subnasale/nasal tip (mm) 0.718 n.s. 0.721 n.s. 0.078 n.s.Upper Lip/nasal tip (mm) 0.641 n.s. 0.502 n.s. 0.441 n.s.Stomion/nasal tip (mm) 0.773 n.s. 0.457 n.s. 0.312 n.s.N/Me (mm) 0.445 n.s. 0.042* 0.002**N/ANS (mm) 0.153 n.s. 0.831 n.s. 0.100 n.s.ANS/Me (mm) 0.016* 0.002** 0.008**ST nasion/subnasale (mm) 0.032* 0.234 n.s. 0.031*Subnasale/stomion (mm) 0.048* 0.014* 0.005**Stomion/ST Me (mm) 0.0589 n.s. 0.368 n.s. 0.023*ANS/SLS (mm) 0.099 n.s. 0.086 n.s. 0.022*SD/UL (mm) 0.016* 0.069 n.s. 0.005**LI/LL (mm) 0.038* 0.022* 0.017*Pg/Pgs (mm) 0.289 n.s. 0.595 n.s. 0.538 n.s.Nasal bone/SN (°) 0.092 n.s. 0.124 n.s. 0.036*Nasal dorsum/FH (°) 0.225 n.s. 0.298 n.s. 0.283 n.s.columella/FH (°) 0.770 n.s. 0.968 n.s. 0.909 n.s.Nasolabial angle (°) 0.020* 0.187 n.s. 0.376 n.s.
*P < 0.05, **P < 0.01; n.s., not significant.
Previous studies (Alexander and Hitchcock, 1978; Johnson et al., 1978; Björk et al., 1984; munandar and Snow, 1995) have reported that soft tissue analysis differs by population because nose and chin characteristics vary by heritage. Clearly, the soft tissue norms developed for one population may be unsuitable in diagnosis and treatment planning for another group. It is more appropriate to evaluate the nose, chin, and lips separately and then establish their interrelationship (Bishara, 1981; Bishara et al., 1984, 1985). Some previous studies have established soft tissue norms for the Turkish population ( erbay and caniklioğlu, 2002; erbay et al., 2002; Basciftci et al., 2003), but little research has assessed longitudinal soft tissue growth in this population. Sayın and Türkkahraman (2004) reported that 64 per cent of the Turkish population had an Angle Class I malocclusion. Therefore, growth and development in patients with Angle Class I, who constitute the majority of the population, was examined.
Most studies agree that sexual dimorphism occurs in soft tissue growth changes at the nose, lips, and chin (Bishara, 1981; Bishara et al., 1984, 1985; Nanda et al., 1990). In the present investigation, changes between genders were also compared. In general, males tended to exhibit increased overall soft tissue growth compared with females and to grow more from T2–T3, a finding that has also been reported in previous studies (Nanda, 1971; Nanda et al., 1990).
Bishara and Jakobsen (1998) reported similar changes in direction and magnitude for males and females but found that for most parameters, soft tissue profile changes occurred earlier in females (10–15 years) than in males (15–25 years).

203 PROFile cHANGeS iN AN ANATOliAN TURKiSH POPUlATiON
Table 4 Mean and standard deviations (SD) of cephalometric measurements for females at the mean ages of 9.1 (T1), 14.1 (T2), and 18.1 (T3) years and comparison at these three time points.
Parameter T1 T2 T3 T1–T2 T2–T3 T1–T3
Mean SD Mean SD Mean SD P P P
SNA (°) 80.56 1.94 81.40 1.45 82.20 1.61 0.002** 0.013* 0.001***SNB (°) 76.93 1.57 78.33 1.33 79.33 1.54 0.003** 0.001*** 0.000***ANB (°) 3.70 1.04 3.06 1.19 2.86 0.99 0.066 n.s. 0.458 n.s. 0.049*ST nasion/nasal tip (mm) 20.73 2.18 25.46 1.95 28.86 3.13 0.000*** 0.000*** 0.000***Nasion/nasal tip (mm) 25.80 3.60 30.86 3.04 34.80 2.09 0.000*** 0.000*** 0.000***Rhinion/nasal tip (mm) 14.76 1.11 18.06 2.01 20.60 2.35 0.000*** 0.001*** 0.000***Pg/nasal tip 28.25 3.02 33.50 3.05 36.20 3.65 0.000*** 0.000*** 0.000***Subnasale/nasal tip (mm) 12.53 1.40 15.46 1.30 17.46 1.24 0.000*** 0.000*** 0.000***Upper lip/nasal tip (mm) 11.56 3.20 14.93 1.22 16.73 1.90 0.000*** 0.000*** 0.000***Stomion/nasal tip (mm) 17.46 1.84 20.93 2.37 22.93 2.86 0.000*** 0.000*** 0.000***N/Me (mm) 108.33 3.61 116.26 2.28 124.60 2.64 0.000*** 0.000*** 0.000***N/ANS (mm) 49.66 2.66 53.66 2.31 57.03 2.36 0.000*** 0.000*** 0.000***ANS/Me (mm) 58.66 1.87 62.60 2.32 67.56 3.11 0.000*** 0.000*** 0.000***ST nasion/subnasale (mm) 49.20 2.14 56.50 2.09 59.80 2.36 0.000*** 0.001*** 0.000***Subnasale/stomion (mm) 18.80 2.04 20.13 2.09 21.73 2.37 0.000*** 0.000*** 0.000***Stomion/ST Me (mm) 41.93 2.31 46.80 1.85 49.60 2.26 0.000*** 0.000*** 0.000***ANS/SLS (mm) 11.00 1.64 13.06 1.33 14.26 1.16 0.000*** 0.000*** 0.000***SD/UL (mm) 12.66 1.58 14.60 1.50 15.50 1.40 0.000*** 0.001*** 0.000***LI/LL (mm) 11.76 1.32 13.60 1.18 14.53 1.35 0.000*** 0.000*** 0.000***Pg/Pgs (mm) 9.66 0.81 10.66 1.04 11.66 1.49 0.000*** 0.000*** 0.000***Nasal bone/SN (°) 109.20 6.01 116.33 5.87 119.26 6.43 0.000*** 0.000*** 0.000***Nasal dorsum/FH (°) 56.40 4.76 55.00 4.17 54.20 4.31 0.033* 0.001*** 0.003**columella/FH (°) 20.53 4.35 21.60 4.73 22.53 4.82 0.002** 0.000*** 0.000***Nasolabial angle (°) 115.46 6.80 108.73 3.05 108.00 3.77 0.000*** 0.480 n.s. 0.001***
*P < 0.05, **P < 0.01, ***P < 0.001; n.s., not significant.
The present results indicated that females exhibited more changes between T1 and T2, whereas males changed more between T2 and T3. This finding suggests earlier growth completion for females than males.
many orthodontists (Ricketts, 1968; Anderson et al., 1973; Angelle, 1973) have examined the interrelationships between incisal movement and lip response during orthodontic treatment and have attempted to establish a movement ratio between these hard and soft tissue components. However, these ratios missed one element: the influence of growth on the soft tissue drape covering the anterior segment of the oral cavity. The current results demonstrate that the lips grow in length and thickness with age and that this growth differs by gender, supporting the results of mamandras (1988).
The present findings clearly show that females tend to have smaller soft tissue dimensions than males; this was demonstrated in the relative thicknesses of the soft tissue of the lips and chin. Females had thinner upper lips at T1, which enlarged as they grew, until at T2 males and females had similar upper lip thicknesses. At the final measurement at T3, upper lips of females were often thinner than those of males by 2 mm or more because upper lip thickness increased less than that of males between T2 and T3. These data tend to support the findings of Subtelny (1959), mauchamp and Sassouni (1973), and Riolo et al. (1986). Thus, with retraction of the upper incisors in 12-year-old females, little compensatory lip growth
is to be expected, whereas a less detrimental effect might occur in males if the normal 2 mm increase in upper lip thickness occurs between 13.8 and 17.8 years of age.
Lip length and thickness are important elements of the facial profile. lip position is affected by the placement and inclination of the maxillary and mandibular incisors and hence is responsive to orthodontic treatment. It is noteworthy that males have a greater average increase in upper and lower lip lengths than females (Nanda et al., 1990).
Comparison of changes in upper and lower lip lengths revealed that the lips of male subjects elongated more than those of females between 8 and 18 years of age; supporting the findings of other research (Subtelny, 1959; Vig and cohen, 1979; mamandras, 1984). Although this gender difference is interesting biologically, its clinical significance is unimportant because the lengthwise growth appears to exceed the growth of the lower anterior face height, and therefore the lip seal is not negatively affected ( mamandras, 1988).
mamandras (1988) reported significant increases in upper and lower lip thickness with age of males, compared with females over the same period. The vertical relationship between the lips and anterior teeth, particularly the maxillary incisors, is an important factor for aesthetics. However, it is lip thickness, and hence the fullness of the lower part of the facial profile, that influences treatment decisions, particularly when considering extraction of teeth and incisor retraction (mamandras, 1988).

N. HAmAmci eT Al.204
Table 5 mean and standard deviations (SDs) of cephalometric measurements for males at the mean ages of 8.6 (T1), 13.6 (T2), and 17.6 (T3) years and comparison at these three time periods.
Parameter T1 T2 T3 T1–T2 T2–T3 T1–T3
Mean SD Mean SD Mean SD P P P
SNA (°) 79.96 1.54 81.23 1.06 82.13 0.97 0.001*** 0.002** 0.000***SNB (°) 76.53 1.24 78.46 1.06 80.00 0.84 0.000*** 0.000*** 0.000***ANB (°) 3.36 0.85 2.70 0.86 2.43 0.94 0.027* 0.008** 0.000***ST nasion/nasal tip (mm) 20.16 2.81 25.56 3.18 29.16 3.86 0.000*** 0.000*** 0.000***Nasion/nasal tip (mm) 25.30 3.40 31.40 4.48 36.13 4.89 0.000*** 0.000*** 0.000***Rhinion/nasal tip (mm) 15.66 1.71 18.83 2.37 21.90 3.16 0.000*** 0.000*** 0.000***Pg/nasal tip 29.75 3.80 34.05 3.85 38.25 4.02 0.000*** 0.000*** 0.000***Subnasale/nasal tip (mm) 12.73 1.59 15.70 2.13 18.86 2.64 0.000*** 0.000*** 0.000***Upper Lip/nasal tip (mm) 11.13 1.55 14.53 1.92 17.46 3.09 0.001*** 0.000*** 0.000***Stomion/nasal tip (mm) 16.41 5.10 20.26 2.46 23.93 2.43 0.000*** 0.000*** 0.000***N/Me (mm) 109.53 4.77 119.93 6.27 130.53 6.13 0.000*** 0.000*** 0.000***N/ANS (mm) 48.30 2.43 53.40 4.18 58.73 3.05 0.000*** 0.000*** 0.000***ANS/Me (mm) 61.23 3.39 66.53 3.79 71.86 4.86 0.000*** 0.000*** 0.000***ST nasion/subnasale (mm) 51.06 2.37 57.80 3.56 62.46 3.87 0.000*** 0.000*** 0.000***Subnasale/stomion (mm) 20.26 1.83 22.13 2.09 24.13 1.92 0.001*** 0.000*** 0.000***Stomion/ST Me (mm) 42.53 3.56 47.80 3.80 51.73 2.57 0.000*** 0.000*** 0.000***ANS/SLS (mm) 11.93 1.33 13.93 1.33 15.46 1.50 0.000*** 0.000*** 0.000***SD/UL (mm) 14.13 1.55 15.66 1.58 17.33 1.83 0.000*** 0.000*** 0.000***LI/LL (mm) 12.73 1.09 14.66 1.23 16.86 1.92 0.000*** 0.000*** 0.000***Pg/Pgs (mm) 9.13 1.72 10.33 2.16 12.06 1.98 0.001*** 0.000*** 0.000***Nasal bone/SN (°) 112.33 3.49 119.06 3.17 124.06 5.45 0.000*** 0.000*** 0.000***Nasal dorsum/FH (°) 58.46 4.35 56.66 4.43 56.00 4.69 0.003** 0.027* 0.001***columella/FH (°) 21.00 4.29 21.66 4.28 22.33 4.68 0.096 n.s. 0.027* 0.051
n.s.Nasolabial angle (°) 109.80 5.73 107.20 3.14 106.93 2.60 0.066 n.s. 0.751 n.s. 0.073
n.s.
*P < 0.05, **P < 0.01, ***P < 0.001; n.s., not significant.
With regard to the lower lip, it was found that gender differences occurred mainly in the horizontal direction. Females stop growing earlier than males. Males had a more prominent lower lip than females. This cannot be explained by a greater lip thickness (less than 1 mm in boys) but is probably related to changes in the lower lip structure. The increase in lower lip thickness was mainly observed in males between T2 and T3, supporting the findings of mamandras (1988).
Zylinski et al. (1992) reported a decreased nasolabial angle in individuals between 7 and 18 years of age. Nanda et al. (1990) studied subjects aged 7–17 years and Genecov et al. (1990) individuals aged 7–18 years; both studies demonstrated that nasolabial angle decreases with age in both males and females. A greater nasolabial angle in females than in males was observed in the present study which decreased with age more in females than in males. The reason for this may be that the tip of the nose is sustained by the nasal septum and ANS. ANS is carried forward with age, and accordingly point A moves relatively distally with age (Prahl-Andersen et al., 1995).
Throughout the study period, face heights increased considerably. Males had a larger N/Me measurement than females, which particularly increased between T2 and T3. Vertical facial growth is known to be related to skeletal maturation and stomatic growth, and the present finding is
consistent with previous research (Bishara et al., 1985; love et al., 1990; Zylinski et al., 1992; Thilander et al., 2005).
lower face height increased significantly during all growth periods in both males and females. A number of researchers have reported similar findings ( mcNamara, 1984; love et al., 1990; Gebeck and merrifield, 1995; Gilliland et al., 2001).
Previous investigations (Bowker and meredith, 1959; chaconas, 1969) have identified age-related changes in the nasal profile with reference to the soft tissues or skeletal planes. The size and shape of the analysed facial soft tissue were both significantly affected by age.
erbay and caniklioğlu (2002) found that Anatolian Turks had greater nasal and chin prominence than other subjects. Başçiftçi et al. (2003) found that males had more prominent noses and greater soft tissue chin thickness than females. These findings support those of Göyenç et al. (1992), who found that Anatolian Turkish men had more prominent chins than Anatolian Turkish women. The measurements at T3 (adult subjects) in the present study support these findings.
Previous investigations (Pelton and elsasser, 1955; Subtelny, 1959) have shown that total facial convexity increases with age and can be expressed as a decreased angle. Bishara and Jakobsen (1998) found that the total facial convexity angle decreased from 5 to 45 years of age, from 148.1 to 142.3 degrees in males and from 147.1 to 140.2
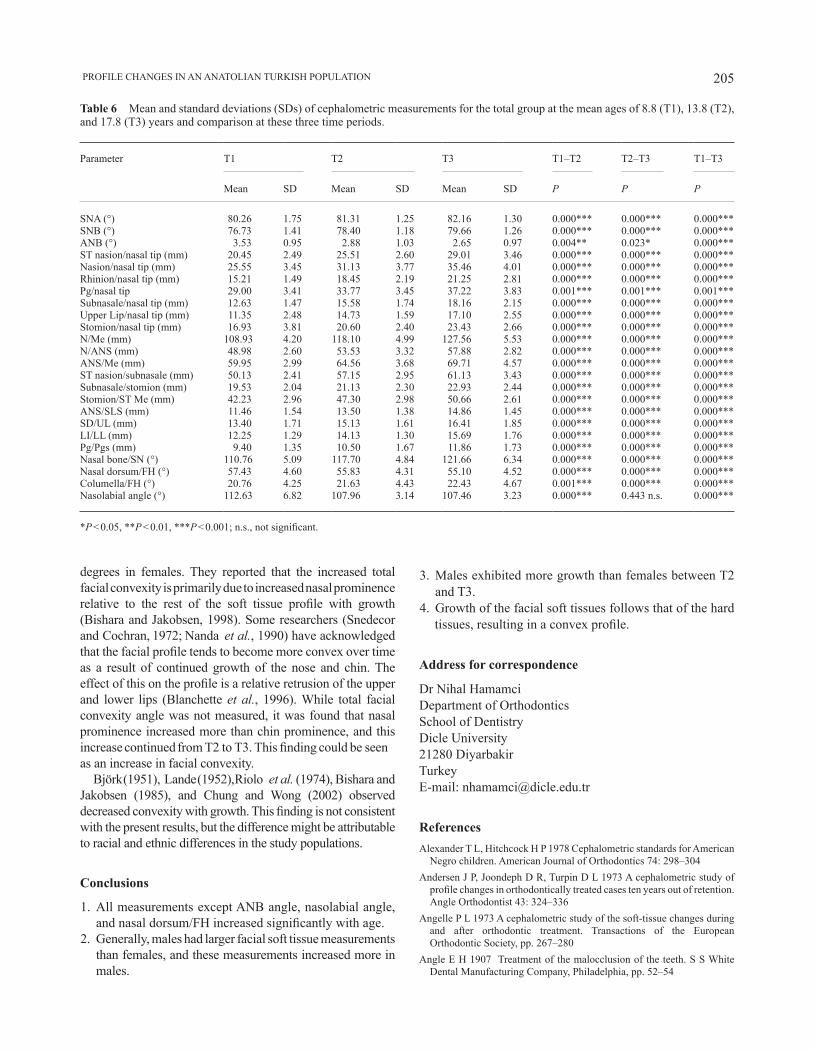
205 PROFile cHANGeS iN AN ANATOliAN TURKiSH POPUlATiON
Table 6 mean and standard deviations (SDs) of cephalometric measurements for the total group at the mean ages of 8.8 (T1), 13.8 (T2), and 17.8 (T3) years and comparison at these three time periods.
Parameter T1 T2 T3 T1–T2 T2–T3 T1–T3
Mean SD Mean SD Mean SD P P P
SNA (°) 80.26 1.75 81.31 1.25 82.16 1.30 0.000*** 0.000*** 0.000***SNB (°) 76.73 1.41 78.40 1.18 79.66 1.26 0.000*** 0.000*** 0.000***ANB (°) 3.53 0.95 2.88 1.03 2.65 0.97 0.004** 0.023* 0.000***ST nasion/nasal tip (mm) 20.45 2.49 25.51 2.60 29.01 3.46 0.000*** 0.000*** 0.000***Nasion/nasal tip (mm) 25.55 3.45 31.13 3.77 35.46 4.01 0.000*** 0.000*** 0.000***Rhinion/nasal tip (mm) 15.21 1.49 18.45 2.19 21.25 2.81 0.000*** 0.000*** 0.000***Pg/nasal tip 29.00 3.41 33.77 3.45 37.22 3.83 0.001*** 0.001*** 0.001***Subnasale/nasal tip (mm) 12.63 1.47 15.58 1.74 18.16 2.15 0.000*** 0.000*** 0.000***Upper Lip/nasal tip (mm) 11.35 2.48 14.73 1.59 17.10 2.55 0.000*** 0.000*** 0.000***Stomion/nasal tip (mm) 16.93 3.81 20.60 2.40 23.43 2.66 0.000*** 0.000*** 0.000***N/Me (mm) 108.93 4.20 118.10 4.99 127.56 5.53 0.000*** 0.000*** 0.000***N/ANS (mm) 48.98 2.60 53.53 3.32 57.88 2.82 0.000*** 0.000*** 0.000***ANS/Me (mm) 59.95 2.99 64.56 3.68 69.71 4.57 0.000*** 0.000*** 0.000***ST nasion/subnasale (mm) 50.13 2.41 57.15 2.95 61.13 3.43 0.000*** 0.000*** 0.000***Subnasale/stomion (mm) 19.53 2.04 21.13 2.30 22.93 2.44 0.000*** 0.000*** 0.000***Stomion/ST Me (mm) 42.23 2.96 47.30 2.98 50.66 2.61 0.000*** 0.000*** 0.000***ANS/SLS (mm) 11.46 1.54 13.50 1.38 14.86 1.45 0.000*** 0.000*** 0.000***SD/UL (mm) 13.40 1.71 15.13 1.61 16.41 1.85 0.000*** 0.000*** 0.000***LI/LL (mm) 12.25 1.29 14.13 1.30 15.69 1.76 0.000*** 0.000*** 0.000***Pg/Pgs (mm) 9.40 1.35 10.50 1.67 11.86 1.73 0.000*** 0.000*** 0.000***Nasal bone/SN (°) 110.76 5.09 117.70 4.84 121.66 6.34 0.000*** 0.000*** 0.000***Nasal dorsum/FH (°) 57.43 4.60 55.83 4.31 55.10 4.52 0.000*** 0.000*** 0.000***columella/FH (°) 20.76 4.25 21.63 4.43 22.43 4.67 0.001*** 0.000*** 0.000***Nasolabial angle (°) 112.63 6.82 107.96 3.14 107.46 3.23 0.000*** 0.443 n.s. 0.000***
*P < 0.05, **P < 0.01, ***P < 0.001; n.s., not significant.
degrees in females. They reported that the increased total facial convexity is primarily due to increased nasal prominence relative to the rest of the soft tissue profile with growth (Bishara and Jakobsen, 1998). Some researchers (Snedecor and cochran, 1972; Nanda et al., 1990) have acknowledged that the facial profile tends to become more convex over time as a result of continued growth of the nose and chin. The effect of this on the profile is a relative retrusion of the upper and lower lips (Blanchette et al., 1996). While total facial convexity angle was not measured, it was found that nasal prominence increased more than chin prominence, and this increase continued from T2 to T3. This finding could be seen as an increase in facial convexity.
Björk (1951), lande (1952), Riolo et al. (1974), Bishara and Jakobsen (1985), and chung and Wong (2002) observed decreased convexity with growth. This finding is not consistent with the present results, but the difference might be attributable to racial and ethnic differences in the study populations.
Conclusions
1. All measurements except ANB angle, nasolabial angle, and nasal dorsum/FH increased significantly with age.
2. Generally, males had larger facial soft tissue measurements than females, and these measurements increased more in males.
3. Males exhibited more growth than females between T2 and T3.
4. Growth of the facial soft tissues follows that of the hard tissues, resulting in a convex profile.
Address for correspondence
Dr Nihal HamamciDepartment of OrthodonticsSchool of DentistryDicle University21280 DiyarbakirTurkeyE-mail: [email protected]
ReferencesAlexander T l, Hitchcock H P 1978 cephalometric standards for American
Negro children. American Journal of Orthodontics 74: 298–304Andersen J P, Joondeph D R, Turpin D L 1973 A cephalometric study of
profile changes in orthodontically treated cases ten years out of retention. Angle Orthodontist 43: 324–336
Angelle P L 1973 A cephalometric study of the soft-tissue changes during and after orthodontic treatment. Transactions of the European Orthodontic Society, pp. 267–280
Angle e H 1907 Treatment of the malocclusion of the teeth. S S White Dental Manufacturing Company, Philadelphia, pp. 52–54
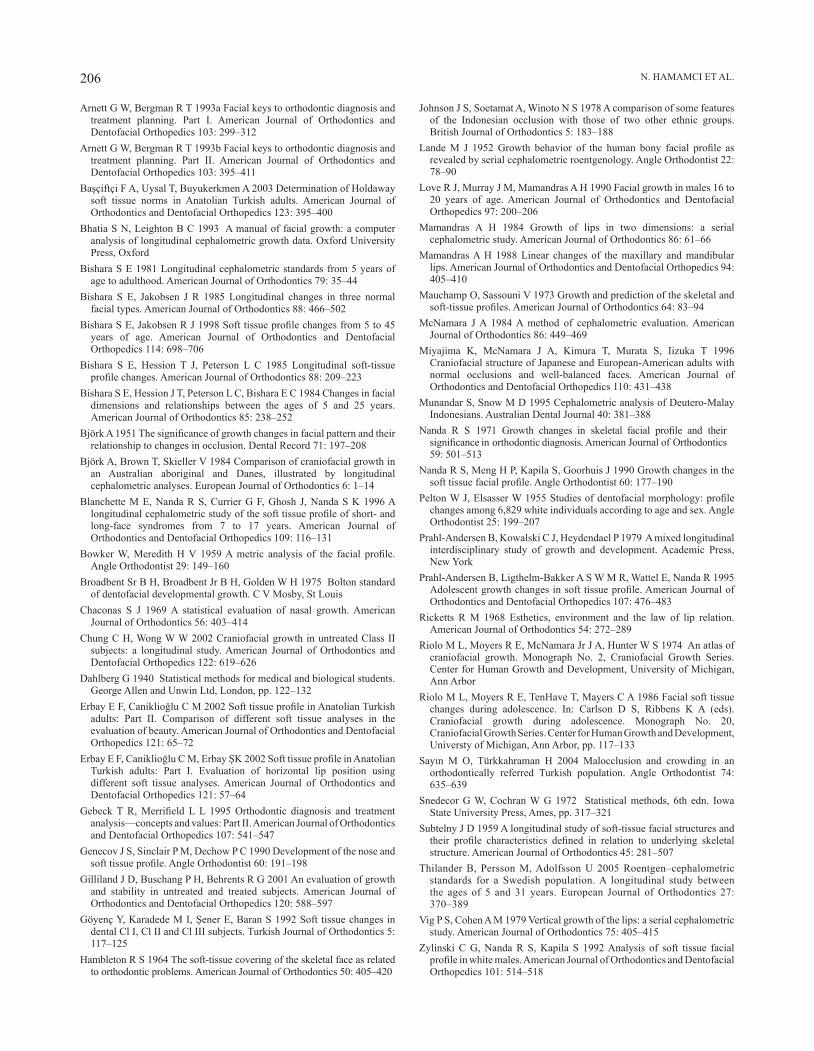
N. HAmAmci eT Al.206
Arnett G W, Bergman R T 1993a Facial keys to orthodontic diagnosis and treatment planning. Part I. American Journal of Orthodontics and Dentofacial Orthopedics 103: 299–312
Arnett G W, Bergman R T 1993b Facial keys to orthodontic diagnosis and treatment planning. Part II. American Journal of Orthodontics and Dentofacial Orthopedics 103: 395–411
Başçiftçi F A, Uysal T, Buyukerkmen A 2003 Determination of Holdaway soft tissue norms in Anatolian Turkish adults. American Journal of Orthodontics and Dentofacial Orthopedics 123: 395–400
Bhatia S N, Leighton B C 1993 A manual of facial growth: a computer analysis of longitudinal cephalometric growth data. Oxford University Press, Oxford
Bishara S e 1981 longitudinal cephalometric standards from 5 years of age to adulthood. American Journal of Orthodontics 79: 35–44
Bishara S e, Jakobsen J R 1985 longitudinal changes in three normal facial types. American Journal of Orthodontics 88: 466–502
Bishara S e, Jakobsen R J 1998 Soft tissue profile changes from 5 to 45 years of age. American Journal of Orthodontics and Dentofacial Orthopedics 114: 698–706
Bishara S e, Hession T J, Peterson l c 1985 longitudinal soft-tissue profile changes. American Journal of Orthodontics 88: 209–223
Bishara S e, Hession J T, Peterson l c, Bishara e c 1984 changes in facial dimensions and relationships between the ages of 5 and 25 years. American Journal of Orthodontics 85: 238–252
Björk A 1951 The significance of growth changes in facial pattern and their relationship to changes in occlusion. Dental Record 71: 197–208
Björk A, Brown T, Skieller V 1984 comparison of craniofacial growth in an Australian aboriginal and Danes, illustrated by longitudinal cephalometric analyses. European Journal of Orthodontics 6: 1–14
Blanchette M E, Nanda R S, Currier G F, Ghosh J, Nanda S K 1996 A longitudinal cephalometric study of the soft tissue profile of short- and long-face syndromes from 7 to 17 years. American Journal of Orthodontics and Dentofacial Orthopedics 109: 116–131
Bowker W, meredith H V 1959 A metric analysis of the facial profile. Angle Orthodontist 29: 149–160
Broadbent Sr B H, Broadbent Jr B H, Golden W H 1975 Bolton standard of dentofacial developmental growth. C V Mosby, St Louis
Chaconas S J 1969 A statistical evaluation of nasal growth. American Journal of Orthodontics 56: 403–414
chung c H, Wong W W 2002 craniofacial growth in untreated class ii subjects: a longitudinal study. American Journal of Orthodontics and Dentofacial Orthopedics 122: 619–626
Dahlberg G 1940 Statistical methods for medical and biological students. George Allen and Unwin Ltd, London, pp. 122–132
erbay e F, caniklioğlu c m 2002 Soft tissue profile in Anatolian Turkish adults: Part II. Comparison of different soft tissue analyses in the evaluation of beauty. American Journal of Orthodontics and Dentofacial Orthopedics 121: 65–72
erbay e F, caniklioğlu c m, erbay ŞK 2002 Soft tissue profile in Anatolian Turkish adults: Part I. Evaluation of horizontal lip position using different soft tissue analyses. American Journal of Orthodontics and Dentofacial Orthopedics 121: 57–64
Gebeck T R, merrifield l l 1995 Orthodontic diagnosis and treatment analysis—concepts and values: Part II. American Journal of Orthodontics and Dentofacial Orthopedics 107: 541–547
Genecov J S, Sinclair P M, Dechow P C 1990 Development of the nose and soft tissue profile. Angle Orthodontist 60: 191–198
Gilliland J D, Buschang P H, Behrents R G 2001 An evaluation of growth and stability in untreated and treated subjects. American Journal of Orthodontics and Dentofacial Orthopedics 120: 588–597
Göyenç Y, Karadede m i, Şener e, Baran S 1992 Soft tissue changes in dental Cl I, Cl II and Cl III subjects. Turkish Journal of Orthodontics 5: 117–125
Hambleton R S 1964 The soft-tissue covering of the skeletal face as related to orthodontic problems. American Journal of Orthodontics 50: 405–420
Johnson J S, Soetamat A, Winoto N S 1978 A comparison of some features of the Indonesian occlusion with those of two other ethnic groups. British Journal of Orthodontics 5: 183–188
lande m J 1952 Growth behavior of the human bony facial profile as revealed by serial cephalometric roentgenology. Angle Orthodontist 22: 78–90
love R J, murray J m, mamandras A H 1990 Facial growth in males 16 to 20 years of age. American Journal of Orthodontics and Dentofacial Orthopedics 97: 200–206
mamandras A H 1984 Growth of lips in two dimensions: a serial cephalometric study. American Journal of Orthodontics 86: 61–66
mamandras A H 1988 linear changes of the maxillary and mandibular lips. American Journal of Orthodontics and Dentofacial Orthopedics 94: 405–410
Mauchamp O, Sassouni V 1973 Growth and prediction of the skeletal and soft-tissue profiles. American Journal of Orthodontics 64: 83–94
mcNamara J A 1984 A method of cephalometric evaluation. American Journal of Orthodontics 86: 449–469
Miyajima K, McNamara J A, Kimura T, Murata S, Iizuka T 1996 Craniofacial structure of Japanese and European-American adults with normal occlusions and well-balanced faces. American Journal of Orthodontics and Dentofacial Orthopedics 110: 431–438
Munandar S, Snow M D 1995 Cephalometric analysis of Deutero-Malay indonesians. Australian Dental Journal 40: 381–388
Nanda R S 1971 Growth changes in skeletal facial profile and their significance in orthodontic diagnosis. American Journal of Orthodontics 59: 501–513
Nanda R S, meng H P, Kapila S, Goorhuis J 1990 Growth changes in the soft tissue facial profile. Angle Orthodontist 60: 177–190
Pelton W J, elsasser W 1955 Studies of dentofacial morphology: profile changes among 6,829 white individuals according to age and sex. Angle Orthodontist 25: 199–207
Prahl-Andersen B, Kowalski c J, Heydendael P 1979 A mixed longitudinal interdisciplinary study of growth and development. Academic Press, New York
Prahl-Andersen B, Ligthelm-Bakker A S W M R, Wattel E, Nanda R 1995 Adolescent growth changes in soft tissue profile. American Journal of Orthodontics and Dentofacial Orthopedics 107: 476–483
Ricketts R m 1968 esthetics, environment and the law of lip relation. American Journal of Orthodontics 54: 272–289
Riolo m l, moyers R e, mcNamara Jr J A, Hunter W S 1974 An atlas of craniofacial growth. Monograph No. 2, Craniofacial Growth Series. center for Human Growth and Development, University of michigan, Ann Arbor
Riolo m l, moyers R e, TenHave T, mayers c A 1986 Facial soft tissue changes during adolescence. In: Carlson D S, Ribbens K A (eds). Craniofacial growth during adolescence. Monograph No. 20, craniofacial Growth Series. center for Human Growth and Development, Universty of Michigan, Ann Arbor, pp. 117–133
Sayın m O, Türkkahraman H 2004 malocclusion and crowding in an orthodontically referred Turkish population. Angle Orthodontist 74: 635–639
Snedecor G W, Cochran W G 1972 Statistical methods, 6th edn. Iowa State University Press, Ames, pp. 317–321
Subtelny J D 1959 A longitudinal study of soft-tissue facial structures and their profile characteristics defined in relation to underlying skeletal structure. American Journal of Orthodontics 45: 281–507
Thilander B, Persson M, Adolfsson U 2005 Roentgen–cephalometric standards for a Swedish population. A longitudinal study between the ages of 5 and 31 years. European Journal of Orthodontics 27: 370–389
Vig P S, Cohen A M 1979 Vertical growth of the lips: a serial cephalometric study. American Journal of Orthodontics 75: 405–415
Zylinski C G, Nanda R S, Kapila S 1992 Analysis of soft tissue facial profile in white males. American Journal of Orthodontics and Dentofacial Orthopedics 101: 514–518

European Journal of Orthodontics 32 (2010) 207–213 © The Author 2010. Published by Oxford University Press on behalf of the European Orthodontic Society.doi:10.1093/ejo/cjp156 All rights reserved. For permissions, please email: [email protected].
Introduction
Dental anomalies may occur as a result of genetic and environmental factors. While abnormalities are most commonly caused by defects in specific genes, pre- and post-natal aetiological events have also been implicated in anomalies in tooth dimension, morphology, position, number, and structure (Garn et al., 1963; Sofaer, 1979; Kotsomitis et al., 1996).
When compared with the general population, subjects with a cleft lip and palate (CLP) have been found to have a higher prevalence of dental anomalies, such as variations in tooth number and position, and reduced tooth dimensions, most of which are localized in the area of the cleft defect (Haring, 1976; Ribeiro et al., 2003). Lucas et al. (2000) reported a higher prevalence of enamel discolouration in children with a CLP when compared with a control group, and attributed this defect to trauma at the time of CLP surgery. Ribeiro et al. (2002, 2003) found a high prevalence of hypodontia of the permanent cleft-side lateral incisor (49.8 per cent) as well as delayed root development in comparison with the contralateral tooth.
Most previous studies investigating dental deformities among individuals with clefts have included different types of cleft cases among their samples and have not differentiated their results according to cleft type. As a result, little information is available in the literature regarding the prevalence of various dental anomalies in different cleft groups. Since cleft formation may be the result of a combination of genetic and environmental factors and may occur at different times during gestation,
Dental anomalies in individuals with cleft lip and/or palate
M. Okan Akcam*, Sehrazat Evirgen**, Ozge Uslu* and Ufuk Toygar MemikoğluDepartments of *Orthodontics and **Oral Diagnosis and Radiology, Faculty of Dentistry, Ankara University, Turkey
SUMMARY Significant heterogeneity has previously been reported but with no consensus on the prevalence of dental anomalies in subjects with a cleft lip and palate (CLP), thus, the purpose of this study was to investigate the frequency of various dental anomalies in the upper dental arch in different cleft groups.
Diagnostic records, i.e., panoramic, occlusal and periapical films, dental casts, and intra-oral photographs, of 122 subjects (mean age: 14 ± 5 years; 67 males and 55 females) were grouped as either unilateral left cleft lip and palate (ULCLP), unilateral right cleft lip and palate (URCLP), bilateral cleft lip and palate (BCLP), or cleft palate (CP). Prevalence rates of 15 different dental anomalies were calculated for each group. Wilcoxon’s test was used to determine if there was a statistically significant difference in the number of missing teeth between the right and left sides, in each cleft group.
Overall, 96.7 per cent of patients were found to have at least one dental anomaly. The most prevalent was agenesis in the anterior region on the cleft side (70.8–97.1 per cent). There was a statistically significant difference in the prevalence of agenesis by cleft and non-cleft sides but only in the ULCLP group (P < 0.001). Significantly higher rates of impaction were observed in the anterior and premolar regions in the CLP groups (2.9–29.2 per cent), with the highest rates in the anterior region on the cleft sides.
A very high proportion of subjects were found to have at least one dental anomaly. Thus, the management of dental anomalies should be central to the treatment planning process of individuals with a cleft.
thus affecting different parts of the craniofacial and dentofacial structure, it is possible that specific patterns of deformities may be related to different cleft types (Ranta and Rintala, 1982; Trotman et al., 1993). It has therefore been suggested that epidemiological studies conducted on cleft individuals require classification by cleft type (Baek and Kim, 2007).
Because dental anomalies may be complicating factors in dental as well as orthodontic treatment, a detailed examination to determine the existence of anomalies is required before the initiation of orthodontic correction. This is especially true with regard to orthodontic treatment that involves extractions, which relies on healthy remaining teeth and roots to accommodate force application. In the light of the above, the current retrospective study aimed to investigate the prevalence of dental anomalies in a group of individuals with different types of clefting and to elucidate relevant clinical suggestions from the results.
Materials and methods
Standardized diagnostic records, i.e., panoramic, occlusal and periapical radiographs, dental casts, intra-oral photographs, and dental histories, of 122 Caucasian subjects (67 males and 55 females) with clefts were retrieved from the archives of the Orthodontic Department, Ankara University. The films were taken by the same technician using the same device (Siemens, P10E, Palomex Instrumentarium, Hyrylä, Finland) using the same standardized method. The mean age of the patients was 14 ± 5 years (range: 12–30 years). The subjects, who had
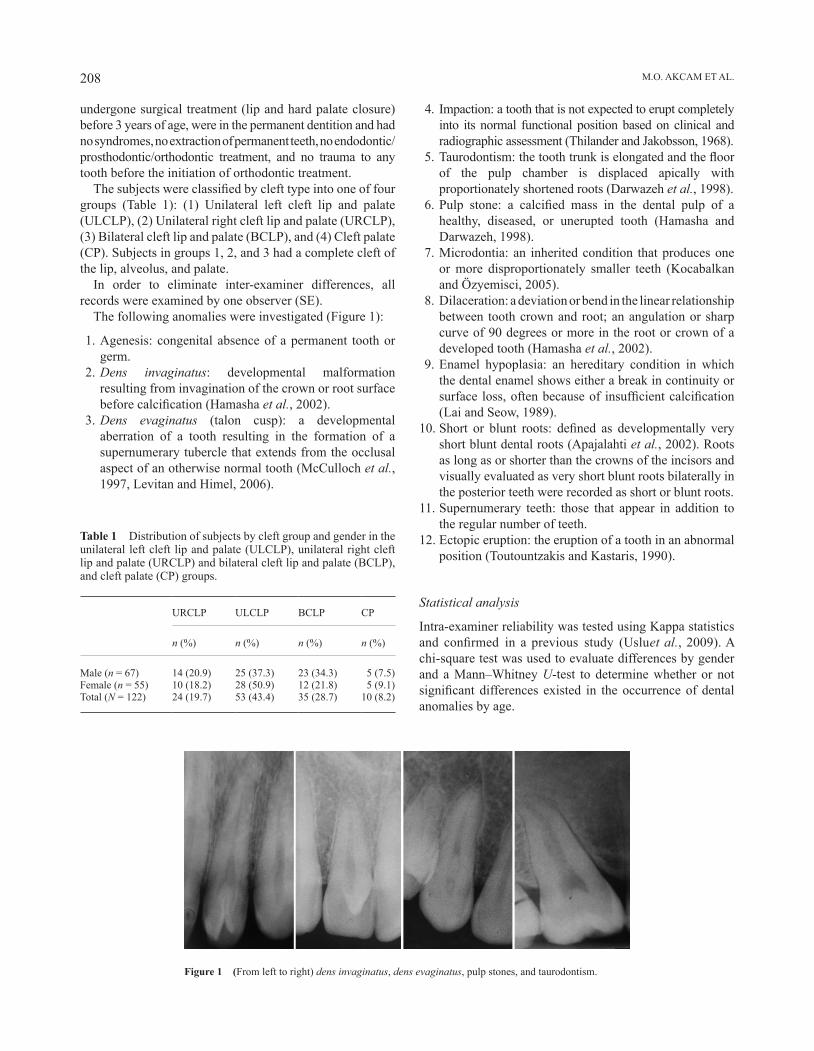
M.O. AKCAM ET AL.208
Figure 1 (From left to right) dens invaginatus, dens evaginatus, pulp stones, and taurodontism.
undergone surgical treatment (lip and hard palate closure) before 3 years of age, were in the permanent dentition and had no syndromes, no extraction of permanent teeth, no endodontic/prosthodontic/orthodontic treatment, and no trauma to any tooth before the initiation of orthodontic treatment.
The subjects were classified by cleft type into one of four groups (Table 1): (1) Unilateral left cleft lip and palate (ULCLP), (2) Unilateral right cleft lip and palate (URCLP), (3) Bilateral cleft lip and palate (BCLP), and (4) Cleft palate (CP). Subjects in groups 1, 2, and 3 had a complete cleft of the lip, alveolus, and palate.
In order to eliminate inter-examiner differences, all records were examined by one observer (SE).
The following anomalies were investigated (Figure 1):
1. Agenesis: congenital absence of a permanent tooth or germ.
2. Dens invaginatus: developmental malformation resulting from invagination of the crown or root surface before calcification (Hamasha et al., 2002).
3. Dens evaginatus (talon cusp): a developmental aberration of a tooth resulting in the formation of a supernumerary tubercle that extends from the occlusal aspect of an otherwise normal tooth (McCulloch et al., 1997, Levitan and Himel, 2006).
Table 1 Distribution of subjects by cleft group and gender in the unilateral left cleft lip and palate (ULCLP), unilateral right cleft lip and palate (URCLP) and bilateral cleft lip and palate (BCLP), and cleft palate (CP) groups.
URCLP ULCLP BCLP CP
n (%) n (%) n (%) n (%)
Male (n = 67) 14 (20.9) 25 (37.3) 23 (34.3) 5 (7.5)Female (n = 55) 10 (18.2) 28 (50.9) 12 (21.8) 5 (9.1)Total (N = 122) 24 (19.7) 53 (43.4) 35 (28.7) 10 (8.2)
4. Impaction: a tooth that is not expected to erupt completely into its normal functional position based on clinical and radiographic assessment (Thilander and Jakobsson, 1968).
5. Taurodontism: the tooth trunk is elongated and the floor of the pulp chamber is displaced apically with proportionately shortened roots (Darwazeh et al., 1998).
6. Pulp stone: a calcified mass in the dental pulp of a healthy, diseased, or unerupted tooth (Hamasha and Darwazeh, 1998).
7. Microdontia: an inherited condition that produces one or more disproportionately smaller teeth (Kocabalkan and Özyemisci, 2005).
8. Dilaceration: a deviation or bend in the linear relationship between tooth crown and root; an angulation or sharp curve of 90 degrees or more in the root or crown of a developed tooth (Hamasha et al., 2002).
9. Enamel hypoplasia: an hereditary condition in which the dental enamel shows either a break in continuity or surface loss, often because of insufficient calcification (Lai and Seow, 1989).
10. Short or blunt roots: defined as developmentally very short blunt dental roots (Apajalahti et al., 2002). Roots as long as or shorter than the crowns of the incisors and visually evaluated as very short blunt roots bilaterally in the posterior teeth were recorded as short or blunt roots.
11. Supernumerary teeth: those that appear in addition to the regular number of teeth.
12. Ectopic eruption: the eruption of a tooth in an abnormal position (Toutountzakis and Kastaris, 1990).
Statistical analysis
Intra-examiner reliability was tested using Kappa statistics and confirmed in a previous study (Uslu et al., 2009). A chi-square test was used to evaluate differences by gender and a Mann–Whitney U-test to determine whether or not significant differences existed in the occurrence of dental anomalies by age.
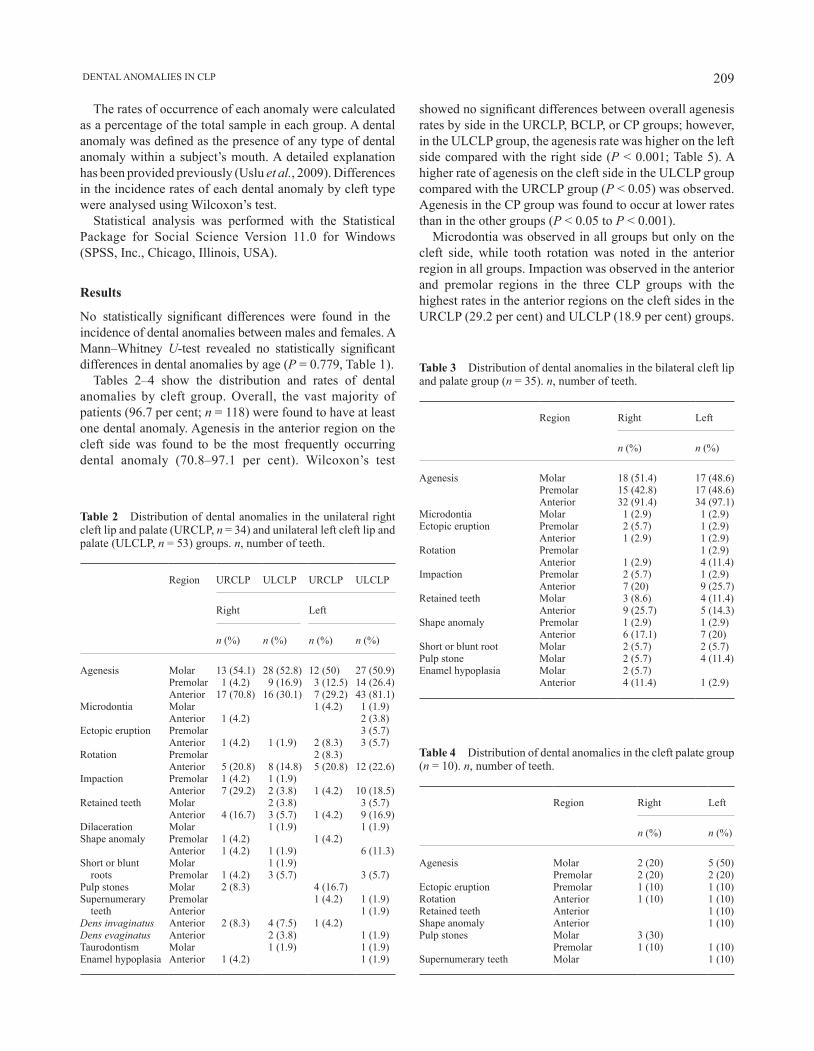
209 DENTAL ANOMALIES IN CLP
showed no significant differences between overall agenesis rates by side in the URCLP, BCLP, or CP groups; however, in the ULCLP group, the agenesis rate was higher on the left side compared with the right side (P < 0.001; Table 5). A higher rate of agenesis on the cleft side in the ULCLP group compared with the URCLP group (P < 0.05) was observed. Agenesis in the CP group was found to occur at lower rates than in the other groups (P < 0.05 to P < 0.001).
Microdontia was observed in all groups but only on the cleft side, while tooth rotation was noted in the anterior region in all groups. Impaction was observed in the anterior and premolar regions in the three CLP groups with the highest rates in the anterior regions on the cleft sides in the URCLP (29.2 per cent) and ULCLP (18.9 per cent) groups.
The rates of occurrence of each anomaly were calculated as a percentage of the total sample in each group. A dental anomaly was defined as the presence of any type of dental anomaly within a subject’s mouth. A detailed explanation has been provided previously (Uslu et al., 2009). Differences in the incidence rates of each dental anomaly by cleft type were analysed using Wilcoxon’s test.
Statistical analysis was performed with the Statistical Package for Social Science Version 11.0 for Windows (SPSS, Inc., Chicago, Illinois, USA).
Results
No statistically significant differences were found in the incidence of dental anomalies between males and females. A Mann–Whitney U-test revealed no statistically significant differences in dental anomalies by age (P = 0.779, Table 1).
Tables 2–4 show the distribution and rates of dental anomalies by cleft group. Overall, the vast majority of patients (96.7 per cent; n = 118) were found to have at least one dental anomaly. Agenesis in the anterior region on the cleft side was found to be the most frequently occurring dental anomaly (70.8–97.1 per cent). Wilcoxon’s test
Table 2 Distribution of dental anomalies in the unilateral right cleft lip and palate (URCLP, n = 34) and unilateral left cleft lip and palate (ULCLP, n = 53) groups. n, number of teeth.
Region URCLP ULCLP URCLP ULCLP
Right Left
n (%) n (%) n (%) n (%)
Agenesis Molar 13 (54.1) 28 (52.8) 12 (50) 27 (50.9)Premolar 1 (4.2) 9 (16.9) 3 (12.5) 14 (26.4)Anterior 17 (70.8) 16 (30.1) 7 (29.2) 43 (81.1)
Microdontia Molar 1 (4.2) 1 (1.9)Anterior 1 (4.2) 2 (3.8)
Ectopic eruption Premolar 3 (5.7)Anterior 1 (4.2) 1 (1.9) 2 (8.3) 3 (5.7)
Rotation Premolar 2 (8.3)Anterior 5 (20.8) 8 (14.8) 5 (20.8) 12 (22.6)
Impaction Premolar 1 (4.2) 1 (1.9)Anterior 7 (29.2) 2 (3.8) 1 (4.2) 10 (18.5)
Retained teeth Molar 2 (3.8) 3 (5.7)Anterior 4 (16.7) 3 (5.7) 1 (4.2) 9 (16.9)
Dilaceration Molar 1 (1.9) 1 (1.9)Shape anomaly Premolar 1 (4.2) 1 (4.2)
Anterior 1 (4.2) 1 (1.9) 6 (11.3)Short or blunt roots
Molar 1 (1.9)Premolar 1 (4.2) 3 (5.7) 3 (5.7)
Pulp stones Molar 2 (8.3) 4 (16.7)Supernumerary teeth
Premolar 1 (4.2) 1 (1.9)Anterior 1 (1.9)
Dens invaginatus Anterior 2 (8.3) 4 (7.5) 1 (4.2)Dens evaginatus Anterior 2 (3.8) 1 (1.9)Taurodontism Molar 1 (1.9) 1 (1.9)Enamel hypoplasia Anterior 1 (4.2) 1 (1.9)
Table 3 Distribution of dental anomalies in the bilateral cleft lip and palate group (n = 35). n, number of teeth.
Region Right Left
n (%) n (%)
Agenesis Molar 18 (51.4) 17 (48.6)Premolar 15 (42.8) 17 (48.6)Anterior 32 (91.4) 34 (97.1)
Microdontia Molar 1 (2.9) 1 (2.9)Ectopic eruption Premolar 2 (5.7) 1 (2.9)
Anterior 1 (2.9) 1 (2.9)Rotation Premolar 1 (2.9)
Anterior 1 (2.9) 4 (11.4)Impaction Premolar 2 (5.7) 1 (2.9)
Anterior 7 (20) 9 (25.7)Retained teeth Molar 3 (8.6) 4 (11.4)
Anterior 9 (25.7) 5 (14.3)Shape anomaly Premolar 1 (2.9) 1 (2.9)
Anterior 6 (17.1) 7 (20)Short or blunt root Molar 2 (5.7) 2 (5.7)Pulp stone Molar 2 (5.7) 4 (11.4)Enamel hypoplasia Molar 2 (5.7)
Anterior 4 (11.4) 1 (2.9)
Table 4 Distribution of dental anomalies in the cleft palate group (n = 10). n, number of teeth.
Region Right Left
n (%) n (%)
Agenesis Molar 2 (20) 5 (50)Premolar 2 (20) 2 (20)
Ectopic eruption Premolar 1 (10) 1 (10)Rotation Anterior 1 (10) 1 (10)Retained teeth Anterior 1 (10)Shape anomaly Anterior 1 (10)Pulp stones Molar 3 (30)
Premolar 1 (10) 1 (10)Supernumerary teeth Molar 1 (10)
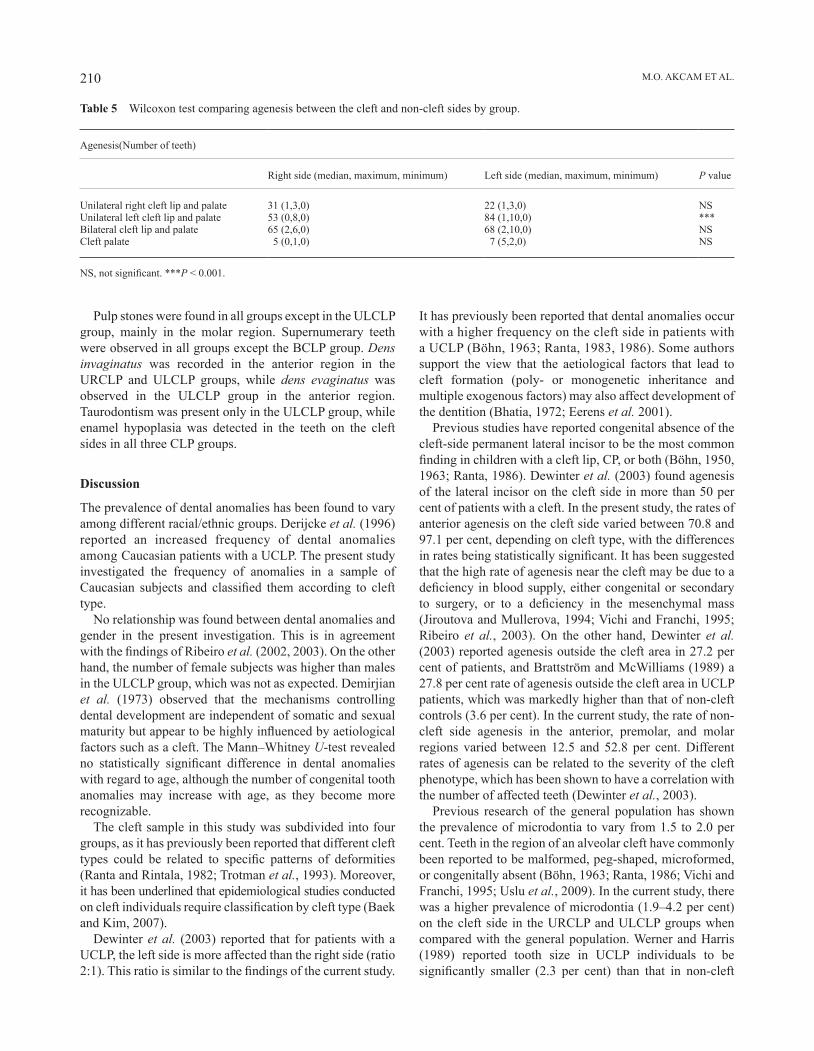
M.O. AKCAM ET AL.210
Table 5 Wilcoxon test comparing agenesis between the cleft and non-cleft sides by group.
Agenesis(Number of teeth)
Right side (median, maximum, minimum) Left side (median, maximum, minimum) P value
Unilateral right cleft lip and palate 31 (1,3,0) 22 (1,3,0) NSUnilateral left cleft lip and palate 53 (0,8,0) 84 (1,10,0) ***Bilateral cleft lip and palate 65 (2,6,0) 68 (2,10,0) NSCleft palate 5 (0,1,0) 7 (5,2,0) NS
NS, not significant. ***P < 0.001.
Pulp stones were found in all groups except in the ULCLP group, mainly in the molar region. Supernumerary teeth were observed in all groups except the BCLP group. Dens invaginatus was recorded in the anterior region in the URCLP and ULCLP groups, while dens evaginatus was observed in the ULCLP group in the anterior region. Taurodontism was present only in the ULCLP group, while enamel hypoplasia was detected in the teeth on the cleft sides in all three CLP groups.
Discussion
The prevalence of dental anomalies has been found to vary among different racial/ethnic groups. Derijcke et al. (1996) reported an increased frequency of dental anomalies among Caucasian patients with a UCLP. The present study investigated the frequency of anomalies in a sample of Caucasian subjects and classified them according to cleft type.
No relationship was found between dental anomalies and gender in the present investigation. This is in agreement with the findings of Ribeiro et al. (2002, 2003). On the other hand, the number of female subjects was higher than males in the ULCLP group, which was not as expected. Demirjian et al. (1973) observed that the mechanisms controlling dental development are independent of somatic and sexual maturity but appear to be highly influenced by aetiological factors such as a cleft. The Mann–Whitney U-test revealed no statistically significant difference in dental anomalies with regard to age, although the number of congenital tooth anomalies may increase with age, as they become more recognizable.
The cleft sample in this study was subdivided into four groups, as it has previously been reported that different cleft types could be related to specific patterns of deformities (Ranta and Rintala, 1982; Trotman et al., 1993). Moreover, it has been underlined that epidemiological studies conducted on cleft individuals require classification by cleft type (Baek and Kim, 2007).
Dewinter et al. (2003) reported that for patients with a UCLP, the left side is more affected than the right side (ratio 2:1). This ratio is similar to the findings of the current study.
It has previously been reported that dental anomalies occur with a higher frequency on the cleft side in patients with a UCLP (Böhn, 1963; Ranta, 1983, 1986). Some authors support the view that the aetiological factors that lead to cleft formation (poly- or monogenetic inheritance and multiple exogenous factors) may also affect development of the dentition (Bhatia, 1972; Eerens et al. 2001).
Previous studies have reported congenital absence of the cleft-side permanent lateral incisor to be the most common finding in children with a cleft lip, CP, or both (Böhn, 1950, 1963; Ranta, 1986). Dewinter et al. (2003) found agenesis of the lateral incisor on the cleft side in more than 50 per cent of patients with a cleft. In the present study, the rates of anterior agenesis on the cleft side varied between 70.8 and 97.1 per cent, depending on cleft type, with the differences in rates being statistically significant. It has been suggested that the high rate of agenesis near the cleft may be due to a deficiency in blood supply, either congenital or secondary to surgery, or to a deficiency in the mesenchymal mass (Jiroutova and Mullerova, 1994; Vichi and Franchi, 1995; Ribeiro et al., 2003). On the other hand, Dewinter et al. (2003) reported agenesis outside the cleft area in 27.2 per cent of patients, and Brattström and McWilliams (1989) a 27.8 per cent rate of agenesis outside the cleft area in UCLP patients, which was markedly higher than that of non-cleft controls (3.6 per cent). In the current study, the rate of non-cleft side agenesis in the anterior, premolar, and molar regions varied between 12.5 and 52.8 per cent. Different rates of agenesis can be related to the severity of the cleft phenotype, which has been shown to have a correlation with the number of affected teeth (Dewinter et al., 2003).
Previous research of the general population has shown the prevalence of microdontia to vary from 1.5 to 2.0 per cent. Teeth in the region of an alveolar cleft have commonly been reported to be malformed, peg-shaped, microformed, or congenitally absent (Böhn, 1963; Ranta, 1986; Vichi and Franchi, 1995; Uslu et al., 2009). In the current study, there was a higher prevalence of microdontia (1.9–4.2 per cent) on the cleft side in the URCLP and ULCLP groups when compared with the general population. Werner and Harris (1989) reported tooth size in UCLP individuals to be significantly smaller (2.3 per cent) than that in non-cleft
211 DENTAL ANOMALIES IN CLP
controls and commented that since CLP patients show a compromised growth potential, the dentition may be reduced in size.
Ectopic eruption has been reported to depend on systemic or local factors (Bondemark and Tsiopa, 2007) and the population average for ectopic teeth has been reported to range between 2–6 per cent for the maxillary first molars and 1.5–2 per cent for the permanent canines (Fox et al., 1995; Barberia-Leache et al., 2005). In the current study, the rate of ectopic eruption varied by cleft group from 1.9 to 10.0 per cent. In a radiographic study of 225 children (Bjerklin et al., 1993), a higher prevalence of ectopic eruption of the maxillary first permanent molar (15.4 per cent) was found in children with a cleft lip or cleft lip and alveolus. In the current study, all cleft groups showed ectopic eruption on both sides of the dental arch, while the URCLP group showed ectopic eruption only in the anterior region, and the CP group only in the premolar region.
Impacted permanent maxillary canines occur in 1–3 per cent of the general population (Peck et al., 1994). The findings of the current study showed a significantly higher rate of impaction in the anterior and premolar regions in the CLP groups (1.9–29.2 per cent), with the highest rates in the anterior region on the cleft side. It has been reported that impacted maxillary canines often present in conjunction with other genetically linked dental abnormalities (Baccetti, 1998).
The current study revealed dilaceration in the molar region only in the ULCLP group at a rate of 1.9 per cent, which is in the range found in the general population (Thongudomporn and Freer, 1998; Hamasha et al., 2002). Identifying a dilaceration is particularly important prior to root canal treatment, extraction, and orthodontic tooth movement.
Shape anomalies of teeth in patients with clefts have been reported (Ribeiro et al., 2003, Akcam et al., 2008); however, none of the studies distinguish between cleft types. In the current investigation, shape anomalies were found not only on the cleft side but also on the non-cleft side in the three CLP groups, particularly in the anterior region, with the greatest frequency observed in the BCLP group. This could indicate that the clefting not only affect the shape of the teeth on the cleft side but also on the non-cleft side.
The rates of short or blunt roots and pulp stones have been found to be in the range of those in non-cleft subjects (Hamasha et al., 2002). Dewinter et al. (2003) reported that 5 out of 75 children (6.7 per cent) with a CLP showed root resorption of one tooth at the cleft site; however, no obvious cause could be demonstrated. Patients with short or blunt roots before orthodontic treatment have been reported to experience significant root shortening during treatment (Grover and Lorton, 1985).
Hamasha and Darwazeh (1998) reported the prevalence of pulp stones in a sample of 814 dental patients to be 22 per cent. In the current study, pulp stones were present in all
groups, at rates ranging from 8.3 to 30.0 per cent. Subay et al. (2001) found no evidence of any correlation between the presence of pulp stones and the application of orthodontic force; nevertheless, it should be borne in mind that a pulp stone may complicate endodontic therapy.
Following agenesis, the presence of a supernumerary tooth in the cleft region has been stated to be the second most common dental anomaly (Ribeiro et al., 2003). Supernumerary teeth have been reported to be present in various populations at rates ranging from 0.1 to 3.8 per cent (Peck et al., 1994; Baccetti, 1998). The current study found high rates, from 1.9 to 10.0 per cent in the UCLP and CP groups. A higher rate (22.2 per cent) of supernumerary permanent teeth in the cleft area was observed in children with a unilateral cleft lip or palate, or both, and that supernumerary teeth related to a CLP result from fragmentation of the dental lamina during cleft formation (Vichi and Franchi, 1995).
The reported rates of dens invaginatus in the general population range between 2.0 and 2.95 per cent (Thongudomporn and Freer, 1998). Significantly higher rates (4.2–8.3 per cent) of dens invaginatus were found in the present study in the anterior region of the URCLP and ULCLP groups. Although dens invaginatus is not a common anomaly, it may present difficulties during endodontic treatment due to tooth anatomy (Garn et al., 1963; Thongudomporn and Freer, 1998). While invagination is not considered to be a risk factor for apical root resorption during orthodontic tooth movement, invaginated teeth have been reported to have malformed roots more often than non-invaginated teeth (Horowitz, 1966); therefore, the clinician should be aware of this dental anomaly in making decisions regarding extractions. In addition, dens invaginatus places the tooth at a higher risk of devitalization from pulpal exposure and precautions should be taken, before any orthodontic treatment is carried out.
Dens evaginatus in the anterior region of the ULCLP group in the current study was found in 1.9 per cent on the cleft side and in 3.8 per cent on the non-cleft side. In order to avoid any unexpected loss of vitality during orthodontic treatment, early diagnosis of dens evaginatus is important so that alternative treatments, such as aesthetic restoration or a full crown, with or without root canal therapy, may be considered (Mattheeuws et al., 2004).
Darwazeh et al. (1998) found a high rate of taurodontism (8.0 per cent) in non-cleft dental patients, with the maxillary second molar reported to be the most commonly affected tooth. In the current study, taurodontism was found at a lower rate (1.9 per cent) in the maxillary right and left molar regions but only in ULCLP group.
Among the different cleft groups, dilaceration, taurodontism, and dens evaginatus was found only in the ULCLP group. This supports the interpretations of Trotman et al. (1993) and Ranta and Rintala (1982) that different patterns of deformities may be related to different cleft
M.O. AKCAM ET AL.212
types. The rate of overall dental anomalies has generally been found to be higher among cleft patients in comparison with the general population, with anomalies most often located in the area of the cleft (Ribeiro et al., 2003). The varying results reported in the literature can be explained by the application of different criteria in different studies and a lack of standardization of the data. Moreover, previous studies evaluated different types of clefts jointly, whereas the present study evaluated them separately; however, a much greater sample size would be necessary to draw more precise conclusions. The literature also suggests that associations between different tooth anomalies are ‘clinically relevant’, with individuals diagnosed with one anomaly at a possible increased risk for others (Thongudomporn and Freer, 1998; Hamasha et al., 2002).
Conclusions
1. A significant proportion (96.7 per cent) of individuals with a cleft was found to have at least one dental anomaly.
2. Agenesis was the most common dental anomaly in this overall study sample.
3. The rates of dental anomalies varied among the different cleft groups.
4. The management of dental anomalies, which can easily be detected by careful inspection of routine orthodontic diagnostic records, should be taken into consideration in treatment planning of individuals with a cleft.
Address for correspondence
Ufuk Toygar Memikoğlu Department of Orthodontics Faculty of Dentistry Ankara University Besevler Ankara 06500, Turkey E-mail: [email protected]
Acknowledgements
We wish to thank Atilla Elhan of Ankara University, Faculty of Medicine, and Department of Biostatistics for the statistical procedures, Ms. Deborah Semel for the grammatical correction of the manuscript, and Hacettepe, GATA, Gazi, and Baskent Universities for the provision of material.
ReferencesAkcam M O, Toygar T U, Özer L, Özdemir B 2008 Evaluation of 3-D
tooth crown size in cleft lip and palate patients. American Journal of Orthodontics and Dentofacial Orthopedics 134: 85–92
Apajalahti S, Hölttä P, Turtola L, Pirinen S 2002 Prevalence of short-root anomaly in healthy young adults. Acta Odontologica Scandinavica 60: 56–59
Baccetti T 1998 A controlled study of associated dental anomalies. Angle Orthodontist 68: 267–274
Baek S H, Kim N Y 2007 Congenital missing permanent teeth in Korean unilateral cleft lip and alveolus and unilateral cleft lip and palate patients. Angle Orthodontist 77: 88–93
Barberia-Leache E, Suarez-Clúa M C, Saavedra-Ontiveros D 2005 Ectopic eruption of the maxillary first permanent molar: characteristics and occurrence in growing children. Angle Orthodontist 75: 610–615
Bhatia S N 1972 Genetics of cleft lip and palate. British Dental Journal 132: 95–103
Bjerklin K, Kurol J, Paulin G 1993 Ectopic eruption of the maxillary first permanent molars in children with cleft lip and/or palate. European Journal of Orthodontics 15: 535–540
Böhn A 1950 Anomalies of the lateral incisors in cases of harelip and cleft palate. Acta Odontologica Scandinavica 9: 41–59
Böhn A 1963 Dental anomalies in harelip and palate. Acta Odontologica Scandinavica 21: 1–109
Bondemark L, Tsiopa J 2007 Prevalence of ectopic eruption, impaction, retention and agenesis of the permanent second molar. Angle Orthodontist 77: 773–778
Brattström V, McWilliams J 1989 The influence of bone grafting age on dental abnormalities and alveolar bone height in patients with unilateral cleft lip and palate. European Journal of Orthodontics 11: 351–358
Darwazeh A M, Hamasha A A, Pillai K 1998 Prevalence of taurodontism in Jordanian dental patients. Dentomaxillofacial Radiology 27: 163–165
Demirjian A, Goldstein H, Tanner J M 1973 A new system of dental age assessment. Human Biology 45: 211–227
Derijcke A, Eerens A, Carels C 1996 The incidence of oral clefts: a review. British Journal of Oral and Maxillofacial Surgery 34: 488–494
Dewinter G, Quirynen M, Heidbüchel K, Verdonck A, Willems G, Carels C 2003 Dental abnormalities, bone graft quality, and periodontal conditions in patients with unilateral cleft lip and palate at different phases of orthodontic treatment. Cleft Palate-Craniofacial Journal 40: 343–350
Eerens K et al. 2001 Hypodontia and tooth formation in groups of children with cleft, siblings without cleft, and nonrelated controls. Cleft Palate-Craniofacial Journal 38: 374–378
Fox N A, Fletcher G A, Homer K 1995 Localising maxillary canines using dental panoramic tomography. British Dental Journal 179: 416–420
Garn S M, Lewis A B, Vicinus J H 1963 Third molar polymorphism and its significance to dental genetics. Journal of Dental Research 42: 1344–1363
Grover P S, Lorton L 1985 The incidence of unerupted permanent teeth and related clinical cases. Oral Surgery, Oral Medicine, Oral Pathology, Oral Radiology, and Endodontics 59: 420–425
Hamasha A A, Darwazeh A 1998 Prevalence of pulp stones in Jordanian adults. Oral Surgery, Oral Medicine, Oral Pathology, Oral Radiology, and Endodontics 86: 730–732
Hamasha A A, Al-Khateeb T, Darwazeh A 2002 Prevalence of dilaceration in Jordanian adults. International Endodontic Journal 35: 910–912
Haring F N 1976 Dental development in cleft and noncleft subjects. Angle Orthodontist 46: 47–50
Horowitz J M 1966 Aplasia and malocclusion: a survey and appraisal. American Journal of Orthodontics 52: 440–453
Jiroutova D, Mullerova Z 1994 The occurrence of hypodontia in patients with cleft lip and palate. Acta Chirurgiae Plasticae 36: 53–56
Kocabalkan E, Özyemisci N 2005 Restoration of severe hypodontia associated with microdontia by using an overdenture: a clinical report. Chinese Medical Journal 118: 350–352
213 DENTAL ANOMALIES IN CLP
Kotsomitis N, Dunne M P, Freer T J 1996 A genetic aetiology for some common dental anomalies: a pilot twin study. Australian Orthodontic Journal 14: 172–178
Lai P Y, Seow W K 1989 A controlled study of the association of various dental anomalies with hypodontia of permanent teeth. Pediatric Dentistry 11: 291–296
Levitan M E, Himel V T 2006 Dens evaginatus: literature review, pathophysiology, and comprehensive treatment regimen. Journal of Endodontics 32: 1–9
Lucas V S, Gupta R, Ololade O, Gelbier M, Roberts G J 2000 Dental health indices and caries associated microflora in children with unilateral cleft lip and palate. Cleft Palate-Craniofacial Journal 37: 447–452
Mattheeuws N, Dermaut L, Martens G 2004 Has hypodontia increased in Caucasians during the 20th century? A meta-analysis. European Journal of Orthodontics 26: 99–103
McCulloch K J, Mills C M, Greenfeld R S, Coil J M 1997 Dens evaginatus from an orthodontic perspective: report of several clinical cases and review of the literature. American Journal of Orthodontics and Dentofacial Orthopedics 112: 670–675
Peck S, Peck L, Kataja M 1994 The palatally displaced canine as a dental anomaly of genetic origin. Angle Orthodontist 64: 249–256
Ranta R 1983 Hypodontia and delayed development in the second premolars in cleft palate children. European Journal of Orthodontics 5: 145–148
Ranta R 1986 A review of tooth formation in children with cleft lip and palate. American Journal of Orthodontics and Dentofacial Orthopedics 90: 11–17
Ranta R, Rintala A 1982 Tooth anomalies associated with congenital sinuses of the lower lip and cleft lip/palate. Angle Orthodontist 52: 212–221
Ribeiro L L, Das Neves L T, Costa B, Gomide M R 2002 Dental development of permanent lateral incisor in complete unilateral cleft lip and palate. Cleft Palate-Craniofacial Journal 39: 193–196
Ribeiro L L, DasNeves L T, Costa B, Gomide M R 2003 Dental anomalies of the permanent lateral incisors and prevalence of hypodontia outside the cleft area in complete unilateral cleft lip and palate. Cleft Palate-Craniofacial Journal 40: 172–175
Sofaer J A 1979 Human tooth-size asymmetry in cleft lip with or without cleft palate. Archives of Oral Biology 24: 141–146
Subay R K, Kaya H, Tarim B, Subay A, Cox C F 2001 Response of human pulpal tissue to orthodontic extrusive applications. Journal of Endodontics 27: 508–511
Thilander B, Jakobsson S O 1968 Local factors in impaction of maxillary canines. Acta Odontologica Scandinavica 26: 145–168
Thongudomporn U, Freer T J 1998 Prevalence of dental anomalies in orthodontic patients. Australian Dental Journal 43: 395–398
Toutountzakis N, Kastaris N 1990 Ectopic eruption of the maxillary first permanent molar. Orthodontike Epitheorese 2: 117–128
Trotman C A, Collett A R, McNamara J, Cohen S R 1993 Analyses of craniofacial and dental morphology in monozygotic twins discordant for cleft lip and unilateral cleft lip and palate. Angle Orthodontist 63: 135–140
Uslu O, Akcam M O, Evirgen S, Cebeci I 2009 The prevalence of dental anomalies in different orthodontic malocclusions. American Journal of Orthodontics and Dentofacial Orthopedics 135: 328–335
Vichi M, Franchi L 1995 Abnormalities of the maxillary incisors in children with cleft lip and palate. ASDC Journal of Dentistry for Children 62: 412–441
Werner S, Harris E 1989 Odontometrics of the permanent teeth in cleft lip and palate: systemic size reduction and amplified asymmetry. Cleft Palate-Craniofacial Journal 26: 36–41

European Journal of Orthodontics 32 (2010) 214–218 © The Author 2009. Published by Oxford University Press on behalf of the European Orthodontic Society.doi:10.1093/ejo/cjp035 All rights reserved. For permissions, please email: [email protected] Access Publication 9 June 2009
Introduction
Ceramic brackets were introduced because of increasing aesthetic demands from orthodontic patients (Verstrynge et al., 2004). Since their introduction, product design and clinical performance has greatly improved and the superior aesthetics of ceramic brackets and the resistance to discolouration are well accepted. However, increased frictional resistance (Kusy and Whitley, 1990; Bednar et al., 1991), a higher risk of enamel fracture during debonding (Jeiroudi, 1991; Redd and Shivapuja, 1991), has limited their use. A third generation of ceramic brackets, Clarity, was introduced in 1997; this bracket had a metal-lined archwire slot and a vertical slot designed to help create a consistent bracket failure mode during debonding (Bishara et al., 1997). This type of bracket was thought to combine the aesthetic advantages of ceramics and the functional advantages of metallic brackets.
The acid-etch technique is commonly used in orthodontics for bonding brackets. For bonding application, phosphoric acid is recommended for composite resin adhesives and poly-acrylic acid etching for resin-modified glass ionomer cements (Sfondrini et al., 2001); however, both these etching techniques require rinsing and air drying. To simplify orthodontic bonding, self-etching primer (SEP) systems, which combine acid etching, rinsing, and priming (Romano et al., 2005) reduce the clinical steps and result in a saving in chair-side time, because the procedure requires only air drying after application. According to White (2001), SEPs are easy to manipulate and use, resulting in greater patient comfort and a decrease in chair time by 65 per cent. In recent years, a new SEP, Transbond Plus Self-Etching Primer (TPSEP), was developed especially for orthodontic
Evaluation of shear bond strength of metallic and ceramic
brackets bonded to enamel prepared with self-etching primer
Tancan Uysal, Ayca Ustdal and Gokmen KurtDepartment of Orthodontics, Faculty of Dentistry, Erciyes University, Kayseri, Turkey
SUMMARY The aim of this in vitro study was to evaluate the shear bond strength (SBS) of different metallic and ceramic bracket bonding combinations using self-etching primers (SEPs). Eighty freshly extracted human premolar teeth were randomly divided into four equal groups for bonding with ceramic or metallic brackets as follows: group 1, metallic brackets bonded with conventional acid etching; group 2, metallic brackets bonded with Transbond Plus Self-Etching primer (TPSEP); group 3, ceramic brackets bonded as per group 1; group 4, ceramic brackets bonded as per group 2. The SBS of these brackets was measured and recorded in megapascals (MPa). The adhesive remnant index (ARI) scores were determined after bracket failure. Data were analyzed with the analysis of variance, Tukey, and chi-square tests.
The bond strength of group 3 (mean: 36.7 ± 11.8 MPa) was significantly higher than group 4 (mean: 26.6 ± 8.9 MPa; P < 0.05), group 1 (mean: 25.5 ± 5.1 MPa; P < 0.01), and group 2 (mean: 22.9 ± 7.3 MPa; P < 0.001). No significant differences in debond locations were found among the groups (P > 0.05). Compared with conventional acid etching, SEPs significantly decreased the SBS of ceramic orthodontic brackets.
bonding. It includes methacrylated phosphoric acid esters, which function both as an etching agent and primer before bonding. TPSEP has been experimentally tested in several in vitro studies (Sfondrini et al., 2001; Buyukyilmaz et al., 2003; Ireland et al., 2003) and revealed promising adhesive bonding results (Buyukyilmaz et al., 2003; Ireland et al., 2003).
With metallic brackets, the critical question for the clinician is whether the bond is too weak to withstand the forces applied during orthodontic treatment. With ceramic brackets, the concern is whether the bond is too strong for safe debonding (Bishara, 2000). Because ceramic brackets do not bend during debonding, fractures of the composite or the cohesive force between the bracket and adhesive system may occur (Verstrynge et al., 2004). Debonding forces fracture the ceramic bracket or the adhesive system at the tooth/resin surface, which often creates cracks in susceptible enamel.
In a laboratory study, Bishara et al. (2001) evaluated the use of a SEP for orthodontic bracket bonding and found that SEPs produced lower but clinically acceptable shear bond strength (SBS) than the conventional acid-etching method. SEPs may be useful in reducing the bond strength of ceramic brackets, thus minimizing possible enamel fractures at debonding.
The aim of this in vitro study was to evaluate the SBS of different metallic and ceramic bracket bonding combinations using SEPs. For the purpose of this study, the null hypothesis assumed that there were statistically significant differences between (1) SBS values and (2) the site of bond failure of metallic and ceramic brackets bonded to enamel prepared using TPSEP or the conventional-etching method.

215CERAMIC BRACKETS AND SELF-ETCHING PRIMERS
Materials and methods
Local ethical committee approval for the study was granted by Erciyes University.
Eighty healthy human mandibular premolars recently extracted for orthodontic purposes were used in this research. The criteria for tooth selection included no caries or cracks, no pre-treatment with a chemical agent such as alcohol, formalin, or hydrogen peroxide, or any other form of bleaching. Their buccal surfaces were intact, and they had not been subjected to any type of treatment.
The teeth were stored in distilled water for 1 month and the water was changed weekly to avoid bacterial growth. The roots of these teeth were placed vertically in a self-cure acrylic and the crowns were exposed avoiding contact between the resin and tooth. The buccal surfaces were pumiced, washed with a spray, and dried with compressed air before enamel preparation.
To compare the materials, the samples were randomly divided into four equal groups. The brackets were then bonded according to the following protocols by the same operator (TU).
Group 1: Thirty seven per cent phosphoric acid gel (Ventura Gel Acondicionador, Madespa, Spain) was applied to the enamel for 15 seconds and the teeth were then rinsed with a water spray for 30 seconds and air dried for 20 seconds. After surface preparation, a liquid primer, Transbond XT (3M Unitek, Monrovia, California, USA), was applied to the etched surface and left uncured. Standard edgewise premolar metallic brackets (slot 0.022 inch; 3M Unitek) with a base surface area of 12 mm2 were bonded to the teeth, according to the manufacturer’s recommendations.
Group 2: TPSEP (3M Unitek) was gently rubbed onto the enamel surface for approximately 3 seconds with the disposable applicator supplied with the system. A moisture-free air source was then used to deliver a gentle burst of air to the enamel. Standard edgewise premolar metallic brackets (3M Unitek) were bonded using a standard protocol.
Group 3: This group was treated the same as group 1, except that ceramic brackets (Clarity™, metal-reinforced ceramic bracket, slot 0.022 inch, 3M Unitek) were bonded to the teeth. The average surface of the orthodontic bracket base of 14.54 mm2 was obtained from the manufacturer’s reports.
Group 4: The enamel in this group was prepared the same as group 2, except that ceramic (Clarity, 3M Unitek) brackets were bonded by the standard protocol.
All metallic and ceramic brackets were bonded to the teeth with Transbond XT light cure adhesive, according to the manufacturer’s instructions. Excess resin was removed with an explorer before polymerization. A quartz-tungsten halogen light unit (Hilux 350, Express Dental Products, Toronto, Canada) with a 10 mm diameter light tip was then used for 40 seconds to cure the specimens (20 seconds from the mesial and 20 seconds from the distal). The specimens were then stored in distilled water at 37°C for 24 hours before SBS testing.
Debonding procedure
The embedded specimens were secured in a jig attached to the base plate of a universal testing machine (Hounsfield Test Equipment, Salford, Lancashire, UK). A chisel-edge plunger was mounted in the movable crosshead of the testing machine and positioned to allow a shear force to be applied to the enamel–resin interface. A crosshead speed of 0.5 mm/minute was used, and the maximum load necessary to debond the bracket was recorded. The force required to debond the brackets was measured in Newton (N), and the SBS [1 megapascals (MPa) = 1 N/mm2] was then calculated by dividing the force values by the bracket base area.
Residual adhesive
After debonding, all teeth and brackets were evaluated at ×10 magnification using a microscope (5240, Olympus, Tokyo, Japan) by one operator (AU) who was blinded to group allocation to determine the adhesive remnant index (ARI; Årtun and Bergland, 1984; Oliver, 1988) scores. The ARI scores were used as a more comprehensive means of defining the sites of bond failure between the enamel, resin, and bracket base.
Statistical methods
All statistical analyses were performed using the Statistical Package for Social Sciences for Windows 13.0, (SPSS Inc., Chicago, Illinois, USA). The Shapiro–Wilks normality test and Levene’s variance homogeneity test were applied to the bond strength data. The data showed normal distribution, and there was homogeneity of variances between the groups. Descriptive statistics including mean, standard deviation, minimum, and maximum values were calculated for each test group. Comparisons of the mean SBS values were made with analysis of variance (ANOVA). Multiple comparisons were undertaken using Tukey honestly significant difference (HSD) test. The chi-square test was also used to determine significant differences in ARI scores among the four groups.
Results
SBS
The descriptive statistics for each group are presented in Table 1. The results of the ANOVA revealed statistically significant differences in bond strength among the four groups (F = 7.408, P < 0.001). Thus, the first null hypothesis of this study was not rejected. The Tukey HSD test showed that the bond strengths of group 3 (ceramic + acid etching, mean: 36.7 ± 11.8 MPa) were significantly greater than group 1 (metallic + acid etching, mean: 25.5 ± 5.1 MPa; P < 0.01), group 2 (metallic + TPSEP, mean: 22.9 ± 7.3 MPa; P < 0.001), and group 4 (ceramic + TPSEP, mean: 26.6 ± 8.9 MPa; P < 0.05).
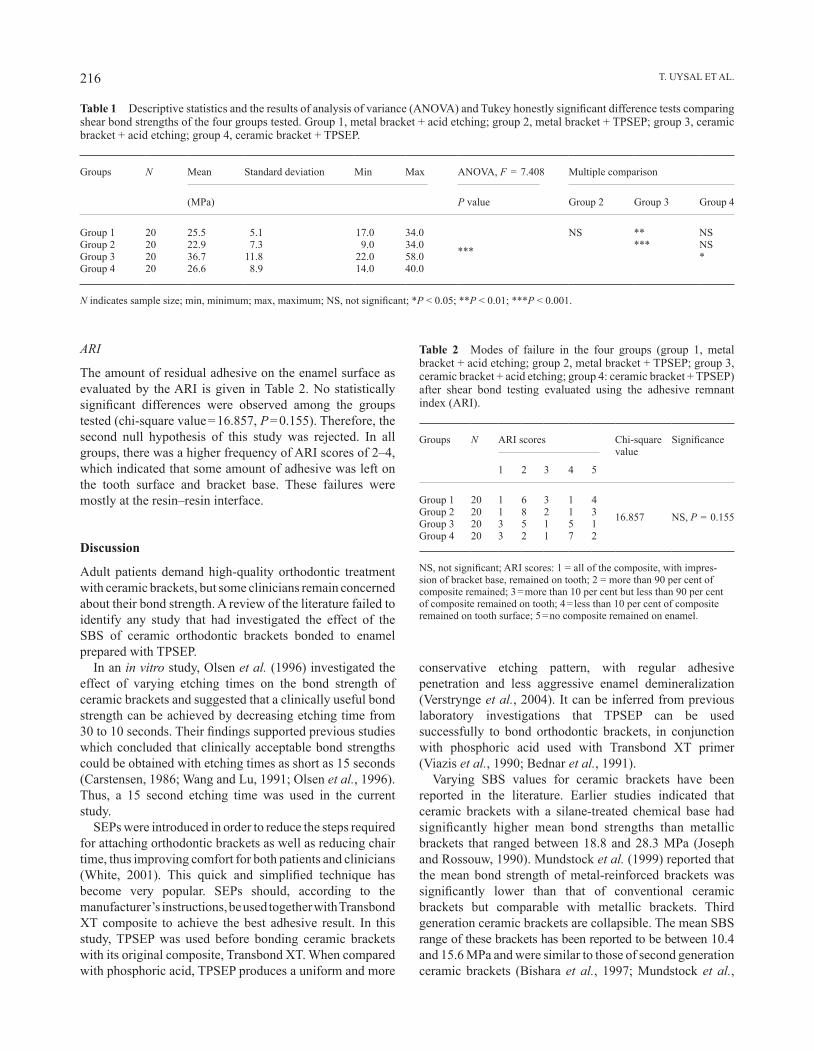
T. UySAL ET AL.216
ARI
The amount of residual adhesive on the enamel surface as evaluated by the ARI is given in Table 2. No statistically significant differences were observed among the groups tested (chi-square value = 16.857, P = 0.155). Therefore, the second null hypothesis of this study was rejected. In all groups, there was a higher frequency of ARI scores of 2–4, which indicated that some amount of adhesive was left on the tooth surface and bracket base. These failures were mostly at the resin–resin interface.
Discussion
Adult patients demand high-quality orthodontic treatment with ceramic brackets, but some clinicians remain concerned about their bond strength. A review of the literature failed to identify any study that had investigated the effect of the SBS of ceramic orthodontic brackets bonded to enamel prepared with TPSEP.
In an in vitro study, Olsen et al. (1996) investigated the effect of varying etching times on the bond strength of ceramic brackets and suggested that a clinically useful bond strength can be achieved by decreasing etching time from 30 to 10 seconds. Their findings supported previous studies which concluded that clinically acceptable bond strengths could be obtained with etching times as short as 15 seconds (Carstensen, 1986; Wang and Lu, 1991; Olsen et al., 1996). Thus, a 15 second etching time was used in the current study.
SEPs were introduced in order to reduce the steps required for attaching orthodontic brackets as well as reducing chair time, thus improving comfort for both patients and clinicians (White, 2001). This quick and simplified technique has become very popular. SEPs should, according to the manufacturer’s instructions, be used together with Transbond XT composite to achieve the best adhesive result. In this study, TPSEP was used before bonding ceramic brackets with its original composite, Transbond XT. When compared with phosphoric acid, TPSEP produces a uniform and more
conservative etching pattern, with regular adhesive penetration and less aggressive enamel demineralization (Verstrynge et al., 2004). It can be inferred from previous laboratory investigations that TPSEP can be used successfully to bond orthodontic brackets, in conjunction with phosphoric acid used with Transbond XT primer (Viazis et al., 1990; Bednar et al., 1991).
Varying SBS values for ceramic brackets have been reported in the literature. Earlier studies indicated that ceramic brackets with a silane-treated chemical base had significantly higher mean bond strengths than metallic brackets that ranged between 18.8 and 28.3 MPa (Joseph and Rossouw, 1990). Mundstock et al. (1999) reported that the mean bond strength of metal-reinforced brackets was significantly lower than that of conventional ceramic brackets but comparable with metallic brackets. Third generation ceramic brackets are collapsible. The mean SBS range of these brackets has been reported to be between 10.4 and 15.6 MPa and were similar to those of second generation ceramic brackets (Bishara et al., 1997; Mundstock et al.,
Table 1 Descriptive statistics and the results of analysis of variance (ANOVA) and Tukey honestly significant difference tests comparing shear bond strengths of the four groups tested. Group 1, metal bracket + acid etching; group 2, metal bracket + TPSEP; group 3, ceramic bracket + acid etching; group 4, ceramic bracket + TPSEP.
Groups N Mean Standard deviation Min Max ANOVA, F = 7.408 Multiple comparison
(MPa) P value Group 2 Group 3 Group 4
Group 1 20 25.5 5.1 17.0 34.0
***
NS ** NSGroup 2 20 22.9 7.3 9.0 34.0 *** NSGroup 3 20 36.7 11.8 22.0 58.0 *Group 4 20 26.6 8.9 14.0 40.0
N indicates sample size; min, minimum; max, maximum; NS, not significant; *P < 0.05; **P < 0.01; ***P < 0.001.
Table 2 Modes of failure in the four groups (group 1, metal bracket + acid etching; group 2, metal bracket + TPSEP; group 3, ceramic bracket + acid etching; group 4: ceramic bracket + TPSEP) after shear bond testing evaluated using the adhesive remnant index (ARI).
Groups N ARI scores Chi-square value
Significance
1 2 3 4 5
Group 1 20 1 6 3 1 416.857 NS, P = 0.155Group 2 20 1 8 2 1 3
Group 3 20 3 5 1 5 1Group 4 20 3 2 1 7 2
NS, not significant; ARI scores: 1 = all of the composite, with impres-sion of bracket base, remained on tooth; 2 = more than 90 per cent of composite remained; 3 = more than 10 per cent but less than 90 per cent of composite remained on tooth; 4 = less than 10 per cent of composite remained on tooth surface; 5 = no composite remained on enamel.
217CERAMIC BRACKETS AND SELF-ETCHING PRIMERS
1999). Ødegaard and Segner (1988) reported bond strengths of 23.0 ± 5.3 and 20.7 ± 5.0 MPa when debonding ceramic brackets bonded with mix and no-mix adhesives, respectively. Bishara et al. (1993) found a bond strength value of 10.9 ± 3.3 MPa. Although several authors have tried to reduce bond strengths by changing the adhesives, etchants, or etching times, no consistent methods have been found that would apply to all types of ceramic brackets (Chaconas et al., 1991).
In the present study, the SBS of orthodontic brackets bonded to enamel that had been prepared using the SEP systems or the conventional acid-etching method were evaluated and higher SBS ranges than the values reported in the literature were found. Group 3 showed values of 22.0–58.0 MPa (mean: 36.7 ± 11.8 MPa) and group 4 of 14.0–40.0 MPa (mean: 26.6 ± 8.9 MPa). Ceramic brackets bonded with the conventional acid-etching method showed the highest bond strength values than all other combinations. Although it is not clear why Transbond XT produced significantly higher bond strengths than the reported values, the type of adhesive resin may influence the clinical bond strength of an orthodontic bracket to enamel (Meguro et al., 2006).
Many studies have demonstrated that when SEPs are used, the degree of penetration by the adhesive to the etched enamel is less when compared with that of conventional acid etching. The more deeply the enamel surface is penetrated by the adhesive, the greater the penetration of the adhesive and the greater risk of damage to the enamel (yap et al., 2004). The present results support the findings of yap et al. (2004) that the use of SEPs significantly decreases SBS values when compared with conventional acid etching for bonding ceramic brackets.
Reynolds (1975) suggested that a minimum bond strength of 5.9–7.8 MPa is adequate for routine clinical use. All bond strength values of the brackets used in this study were greater than this minimum requirement and within clinically acceptable ranges. Ceramic orthodontic brackets bonded with TPSEP showed similar bond strength values as metallic brackets bonded with conventional acid etching. However, clinical conditions such as the variability of heat and humidity of the oral cavity may significantly differ from an in vitro setting.
The sites of failure within the bracket–resin–enamel complex can occur within the bracket, between the bracket and the resin, within the resin, and between the tooth surface and the resin. Bond failure at the bracket–resin interface or within the resin is more desirable than at the resin–enamel interface, because enamel fracture and cracking have been reported during bracket debonding especially with ceramic brackets (Bishara et al., 1997). Earlier reports showed that metallic brackets consistently failed at the resin–bracket base interface, whereas ceramic brackets with chemically retained bases primarily failed at the resin–enamel interface (Joseph and Rossouw, 1990). For mechanically retained brackets, the most common failure site was the bracket–
resin interface, and, on average, more than 50 per cent of the resin remained on the teeth after debonding (Forsberg and Hagberg, 1992). ARI scores in the present study were predominantly 2–4 in all groups, and the differences in ARI scores did not reach statistical significance. The mode of failure was thus at the resin–resin interface, resulting in a decrease in the risk of enamel fracture. Although higher bond strength values were obtained with TPSEP in the ceramic bracket group compared with the metallic bracket group, acceptable ARI scores were also recorded for the single-step self-etching adhesive. This is desirable because of the reduced risk of damage or fracturing of the enamel during debonding of ceramic brackets.
Conclusion
In the present study, the aim was to minimize possible enamel fracture risks at the debonding stage, by reducing bond strength values of ceramic brackets by changing the enamel-conditioning method. Bearing in mind the shortcomings of an in vitro setting, the results of this laboratory study showed:
1. The use of SEPs for conditioning enamel in the bonding of ceramic orthodontic brackets significantly decreased the SBS values compared with the conventional acid-etching method.
2. Although bonding brackets to enamel prepared with TPSEP or the conventional method did not significantly alter the site of failure, ceramic brackets bonded with SEP can be beneficial due to the bond failure location occurring generally between the resin–resin interface.
Address for correspondence
Dr Tancan Uysal Erciyes Universitesi Dis Hekimligi Fakultesi Ortodonti AD Melikgazi Kayseri 38039 TurkeyE-mail: [email protected]
Acknowledgement
The authors wish to thank 3M Unitek and Medifarm for their support with this project.
ReferencesÅrtun J, Bergland S 1984 Clinical trials with crystal growth conditioning
as an alternative to acid-etch enamel pretreatment. American Journal of Orthodontics 85: 333–340
Bednar J R, Gruendeman G W, Sandrik J L 1991 A comparative study of frictional forces between orthodontic brackets and arch wires. American Journal of Orthodontics and Dentofacial Orthopedics 100: 513–522
T. UySAL ET AL.218
Bishara S E 2000 Ceramic brackets and the need to develop national standards. American Journal of Orthodontics and Dentofacial Orthopedics 117: 595–597
Bishara S E, Fehr D E, Jacobsen J R 1993 A comparative study of the debonding strengths of different ceramic brackets, enamel conditioners, and adhesives. American Journal of Orthodontics and Dentofacial Orthopedics 104: 170–179
Bishara S E, Olsen M E, VonWald L 1997 Evaluation of debonding characteristics of a new collapsible ceramic bracket. American Journal of Orthodontics and Dentofacial Orthopedics 112: 552–559
Bishara S E, VonWald L, Laffoon J F, Warren J J 2001 Effect of a self-etch primer/adhesive on the shear bond strength of orthodontic brackets. American Journal of Orthodontics and Dentofacial Orthopedics 119: 621–624
Buyukyilmaz T, Usumez S, Karaman A I 2003 Effect of self-etching primers on bond strength—are they reliable? Angle Orthodontist 73: 64–70
Carstensen W 1986 Clinical results after direct bonding of brackets, using shorter etching times. American Journal of Orthodontics 89: 70–72
Chaconas S J, Caputo A A, Niu G S L 1991 Bond strength of ceramic brackets with various bonding systems. Angle Orthodontist 61: 35–42
Forsberg C M, Hagberg C 1992 Shear bond strength of ceramic brackets with chemical or mechanical retention. British Journal of Orthodontics 19: 183–189
Ireland A L, Knight H, Sherriff M 2003 An in vivo investigation into bond failure rates with a new self-etching system. American Journal of Orthodontics and Dentofacial Orthopedics 124: 323–326
Jeiroudi M T 1991 Enamel fracture caused by ceramic brackets. American Journal of Orthodontics and Dentofacial Orthopedics 99: 97–99
Joseph V P, Rossouw E 1990 The shear bond strengths of stainless steel and ceramic brackets used with chemically and light-activated composite resins. American Journal of Orthodontics and Dentofacial Orthopedics 97: 121–125
Kusy R P, Whitley J Q 1990 Coefficients of friction for arch wires in stainless steel and polycrystalline alumina bracket slots, I: the dry state. American Journal of Orthodontics and Dentofacial Orthopedics 98: 300–312
Meguro D, Hayakawa T, Kawasaki M, Kasai K 2006 Shear bond strength of calcium phosphate ceramic brackets to human enamel. Angle Orthodontist 76: 301–305
Mundstock K S, Sadowsky P L, Lacefield W, Bae S 1999 An in vitro evaluation of a metal reinforced orthodontic ceramic bracket. American Journal of Orthodontics and Dentofacial Orthopedics 116: 635–641
Ødegaard J, Segner D 1988 Shear bond strength of metal brackets compared with a new ceramic bracket. American Journal of Orthodontics and Dentofacial Orthopedics 94: 201–206
Oliver R G 1988 The effect of different methods of bracket removal on the amount of residual adhesive. American Journal of Orthodontics and Dentofacial Orthopedics 93: 196–200
Olsen M E, Bishara S E, Boyer D B, Jakobsen J R 1996 Effect of varying etching times on the bond strength of ceramic brackets. American Journal of Orthodontics and Dentofacial Orthopedics 109: 403–409
Redd T B, Shivapuja P K 1991 Debonding ceramic brackets: effects on enamel. Journal of Clinical Orthodontics 25: 475–481
Reynolds I R 1975 A review of direct orthodontic bonding. British Journal of Orthodontics 2: 171–178
Romano F L, Tavares S W, Nouer D F, Consani S, Borges de Araujo Magnani M B 2005 Shear bond strength of metallic orthodontic brackets bonded to enamel prepared with self-etching primer. Angle Orthodontist 75: 849–853
Sfondrini M F, Cacciafesta V, Pistorio A, Sfondrini G 2001 Effects of conventional and high-intensity light-curing on enamel shear bond strength of composite resin and resin-modified glass-ionomer. American Journal of Orthodontics and Dentofacial Orthopedics 119: 30–35
Verstrynge A, Ghesquiere A, Willems G 2004 Clinical comparison of an adhesive precoated vs. an uncoated ceramic bracket system. Orthodontics and Craniofacial Research 7: 15–20
Viazis A D, Cavanaugh G, Bevis R R 1990 Bond strength of ceramic brackets under shear stress: an in vitro report. American Journal of Orthodontics and Dentofacial Orthopedics 98: 214–221
Wang W N, Lu T C 1991 Bond strength with various etching times on young permanent teeth. American Journal of Orthodontics and Dentofacial Orthopedics 100: 72–79
White L W 2001 An expedited indirect bonding technique. Journal of Clinical Orthodontics 35: 36–41
Yap A U, Soh M S, Han T T, Siow K S 2004 Influence of curing lights and modes on cross-link density of dental composites. Operative Dentistry 29: 410–415
European Journal of Orthodontics 32 (2010) 219–223 © The Author 2009. Published by Oxford University Press on behalf of the European Orthodontic Society.doi:10.1093/ejo/cjp077 All rights reserved. For permissions, please email: [email protected] Access Publication 5 November 2009
Introduction
The evolution of multibracket therapy has resulted in a series of advantages, both to the patient and to the orthodontist. However, accidental debonding of brackets still remains a frequently encountered problem. As brackets are stressed by orthodontic forces and masticatory loads, a high bonding performance is required, but the brackets have to be easily removed at the end of treatment (Wang et al., 2004).
Adhesion to teeth, accidental debonding of brackets, and damage to the enamel surface have motivated investigation of these problems (Sorel et al., 2002) according to different variables (e.g. adhesive material, design of the base, type of pre-treatment, method of debonding, and curing technique).
Concise, which is used as an adhesive material, shows higher retention compared with light-cured adhesives (Wendl and Droschl, 2004). Torsion tests, which are used to evaluate adhesive properties, are less damaging to the enamel and more suitable for clinical debonding (Valletta et al., 2002). Surface pre-treatment is important and etching is commonly used in order to achieve a high bond strength (Abu Alhaija and Al-Wahadni, 2004).
The morphology of the base is an important variable for the retention of a bracket (Knox et al., 2000). Those authors suggested that the base design may improve penetration of the adhesive material. The size of the base is also an important factor (Wang et al., 2004).
The aim of this study was to investigate a novel retentive system consisting of concentric grooves on the base of the bracket. The rationale for this novel design was based on the physical principle of ‘hydrodynamic analogy’ (Popov, 1968; Munson et al., 2005). According to this principle, this type of base should transfer torsional stresses more
A novel bracket base design: biomechanical stability
G. Merone*, R. Valletta*, R. De Santis**, L. Ambrosio** and R. Martina**Department of Oral and Maxillo-Facial Science, University of Naples “Federico II” and **Institute of Composite and Biomedical Materials, National Research Council, Naples, Italy
SUMMARY The aim of this research was to investigate the retention of a bracket equipped with a novel base, the R-system®. The design of the bracket base is characterized by concentric grooves. The behaviour of this bracket was compared with a bracket with a conventional mesh base from the same manufacturer.
Thirty lower adult bovine incisors were selected and metallic brackets were bonded using the Concise adhesive system. Each bracket–adhesive–enamel interface was investigated according to torsion debonding. One-way analysis of variance was used for statistical evaluation. Finite element analysis was also undertaken. In order to assess if the technique was detrimental to the enamel, the mode of failure was determined using the Adhesive Remnant Index (ARI). The debonded surfaces were analysed using scanning electron microscopy (SEM) and electron dispersion spectrometry (EDS).
The R-system® provided a bond strength greater than that of the mesh-base bracket. EDS showed that the amount of calcium on the novel base was higher than that on the conventional base, which allowed transfer of torsional stress more uniformly to the substrate, resulting in higher bond values for the R-system®. On the other hand, as debonding of the R-system® occurred at the enamel–composite interface, lesions to the enamel substrate are possible.
uniformly to the substrate than a conventional mesh base. The biomechanical behaviour and any potential clinical application of this bracket were considered.
Materials and methods
Thirty central lower bovine incisors were obtained from animals sacrificed at an average age of 2 years (±2 months). These teeth have been commonly used for in vitro debond testing (Saleh and Taymour, 2003); moreover, bovine enamel is easily attainable and has a similar microstructure to human enamel (Oesterle et al., 1998).
Each of the extracted teeth (Figure 1a) was cleaned from the residual ligament and stored in a 10 per cent thymol solution at 37°C for 48 hours until mechanical testing. Further analysis by optical microscopy facilitated the identification and marking of an area with an optimally smooth and flat surface on the vestibular side of each tooth.
The samples were cleaned with pumice and sectioned with a Buehler Isomet Microtome (Buehler Ltd., Lake Bluff, Illinois, USA), equipped with a diamond saw rotating at a speed of 150 rpm and cooled by water. The section was then placed on adhesive tape and embedded into a steel cylinder (Figure 1b) filled with self-curing methyl methacrylate-based resin (Formatray; Kerr Corporation, West Collins Orange, California, USA) as shown in Figure 1c.
The brackets were bonded with Concise (3M Unitek, St Paul, Minnesota, USA), a chemically activated paste–paste composite.
The enamel surface was conditioned with orthophosphoric acid (37 per cent) for 30 seconds, then rinsed for 30 seconds, and dried with an oil-free air jet. The adhesive resin and the

G. MErOnE ET AL.220
composite paste were applied to the enamel surface and to the bracket base, respectively. A 300 g weight was then placed on the bracket for 15 seconds and excess cement was carefully removed (Figure 1d).
The brackets were bonded on the enamel specimens (Figure 1d) and divided into three groups (each consisting of 10 specimens) according to the base: concentric grooves with a thickness of 150 mm (group 1), concentric grooves with a thickness of 100 mm (group 2), and conventional mesh base (group 3; Figure 2). These brackets were produced through the metal injection moulding process (SIA Orthodontic Manufacturer rocca D’Evandro, Caserta, Italy).
To allow curing of the resin, mechanical testing was carried out 24 hours after bonding. (regan and van noort, 1989; Harris et al., 1990; Abu Alhaija and Al-Wahadni, 2004; Wang et al., 2004).
Torsion tests were undertaken using a servohydraulic dynamometer (MTS 858 Bionix, Minneapolis, Minnesota, USA) using a load cell, with a load and torque range of 2.5 kn ad 25 nm, respectively. The tests were carried out controlling for the angular position. An angular speed of 5 degrees/minute was used. Data (load, torque, and angular position) were acquired at 10 points/second.
Finite element analysis (FEA) was used to evaluate the regions where maximum stresses occurred (Katona, 1997; Knox et al., 2001).
Analysis of the fractured surfaces was performed using an optical microscope. The enamel and bracket surfaces were observed at ×50 and ×60 magnification, respectively. The magnification was set at ×290 in order to observe the bracket–adhesive interface along the grooves of the base of the bracket. This type of analysis of the enamel surfaces, the bracket bases and the enamel–adhesive interfaces, allowed detection of the regions where fractures occurred and propagated.
For each sample, the amount of composite adhering to the enamel substrate was quantified using the Adhesive remnants index (ArI; Årtun and Bergland 1984; Arici and
Figure 1 Specimen preparation: (a) selection of 30 sound teeth, undamaged by the extraction procedure; (b) steel cylinder; (c) cementing of the specimen with poly (methyl methacrylate) and bracket bonding; (d) sample storage.
Minors, 2000; Summers et al., 2004; Hirani and Sherriff, 2006), which attributes a score of 1, when all composite remains on the enamel surface and a clear imprint of the bracket is evident; 2, when more than 90 per cent of the composite is present on the enamel surface; 3, when 10–90 per cent of the composite remains on the enamel surface; 4, when less than 10 per cent of the composite remains on the enamel surface; and 5, when there is a complete transfer of the composite to the bracket base.
Statistical significance of the results was assessed using one-way analysis of variance (Cheremisinoff, 1987) through the Origin® 6.0 package (Microcal Software, northampton, Massachusetts, USA). Confidence levels of 99 and 95 per cent were set for the analysis of mechanical strength and ArI data, respectively.
All the samples were examined with scanning electron microscopy (SEM) in order to verify the presence and sites of the fractures. In addition, energy dispersive spectroscopy (EDS) was used in order to detect calcium (Ca++) on the adhesive material removed during debonding of the brackets. The EDS technique has been commonly used to investigate debonding of ceramic restorations (Whitlock et al., 1994).
Results
The maximum values of the mechanical torsional test were 519 nmm [standard deviation (SD) 144] for group 1, 225 nmm (SD 20) for group 2, and 175.71 nmm (SD 65) for group 3. The torsion data, expressed in nmm, are consistent with the literature (Gibb and Katona, 2006; Katona and Long, 2006).
Mechanically, there was a statistically significant difference between groups 2 and 3 (P < 0.01) and between groups 1 and 2 (P < 0.01). A weaker statistical difference was found between groups 1 and 3 (P < 0.05).
Optical images of the fractured surfaces of representative specimens from the three groups are shown in Figure 3. Table 1 reports the ArI scores for the three groups of brackets. Higher values were measured for group 1.
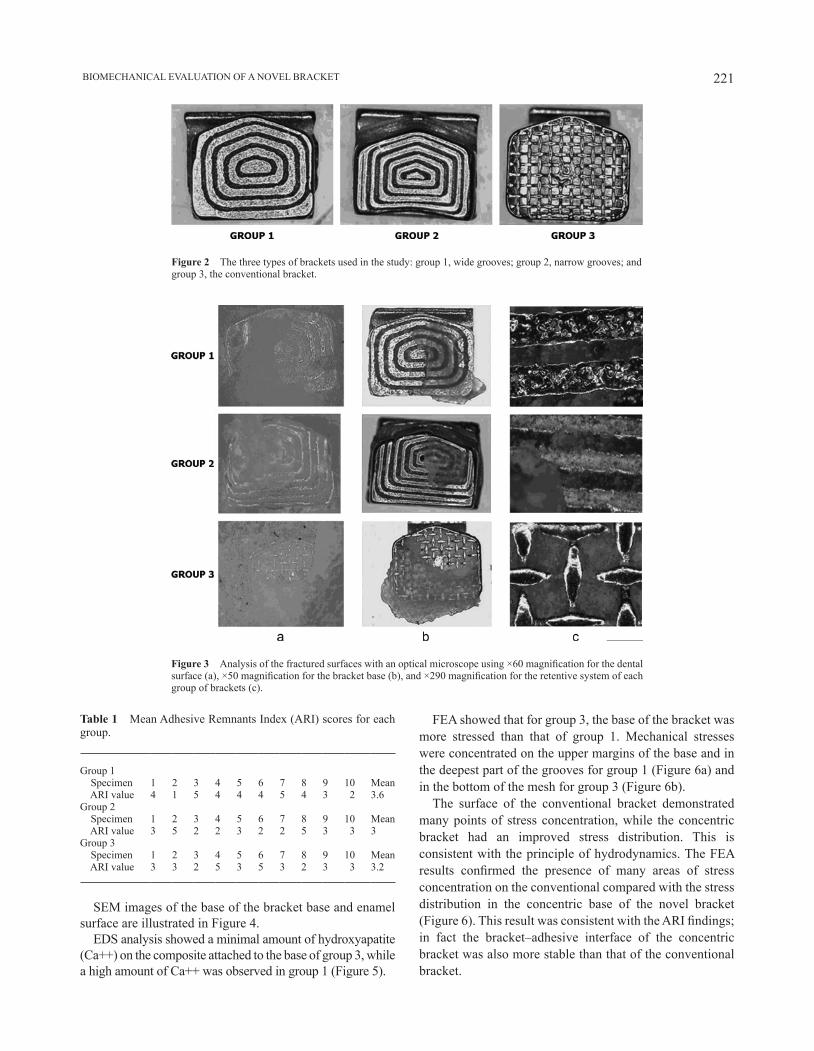
221 BIOMECHAnICAL EVALUATIOn OF A nOVEL BrACKET
Table 1 Mean Adhesive remnants Index (ArI) scores for each group.
Group 1 Specimen 1 2 3 4 5 6 7 8 9 10 Mean ArI value 4 1 5 4 4 4 5 4 3 2 3.6Group 2 Specimen 1 2 3 4 5 6 7 8 9 10 Mean ArI value 3 5 2 2 3 2 2 5 3 3 3Group 3 Specimen 1 2 3 4 5 6 7 8 9 10 Mean ArI value 3 3 2 5 3 5 3 2 3 3 3.2
Figure 2 The three types of brackets used in the study: group 1, wide grooves; group 2, narrow grooves; and group 3, the conventional bracket.
Figure 3 Analysis of the fractured surfaces with an optical microscope using ×60 magnification for the dental surface (a), ×50 magnification for the bracket base (b), and ×290 magnification for the retentive system of each group of brackets (c).
SEM images of the base of the bracket base and enamel surface are illustrated in Figure 4.
EDS analysis showed a minimal amount of hydroxyapatite (Ca++) on the composite attached to the base of group 3, while a high amount of Ca++ was observed in group 1 (Figure 5).
FEA showed that for group 3, the base of the bracket was more stressed than that of group 1. Mechanical stresses were concentrated on the upper margins of the base and in the deepest part of the grooves for group 1 (Figure 6a) and in the bottom of the mesh for group 3 (Figure 6b).
The surface of the conventional bracket demonstrated many points of stress concentration, while the concentric bracket had an improved stress distribution. This is consistent with the principle of hydrodynamics. The FEA results confirmed the presence of many areas of stress concentration on the conventional compared with the stress distribution in the concentric base of the novel bracket (Figure 6). This result was consistent with the ARI findings; in fact the bracket–adhesive interface of the concentric bracket was also more stable than that of the conventional bracket.
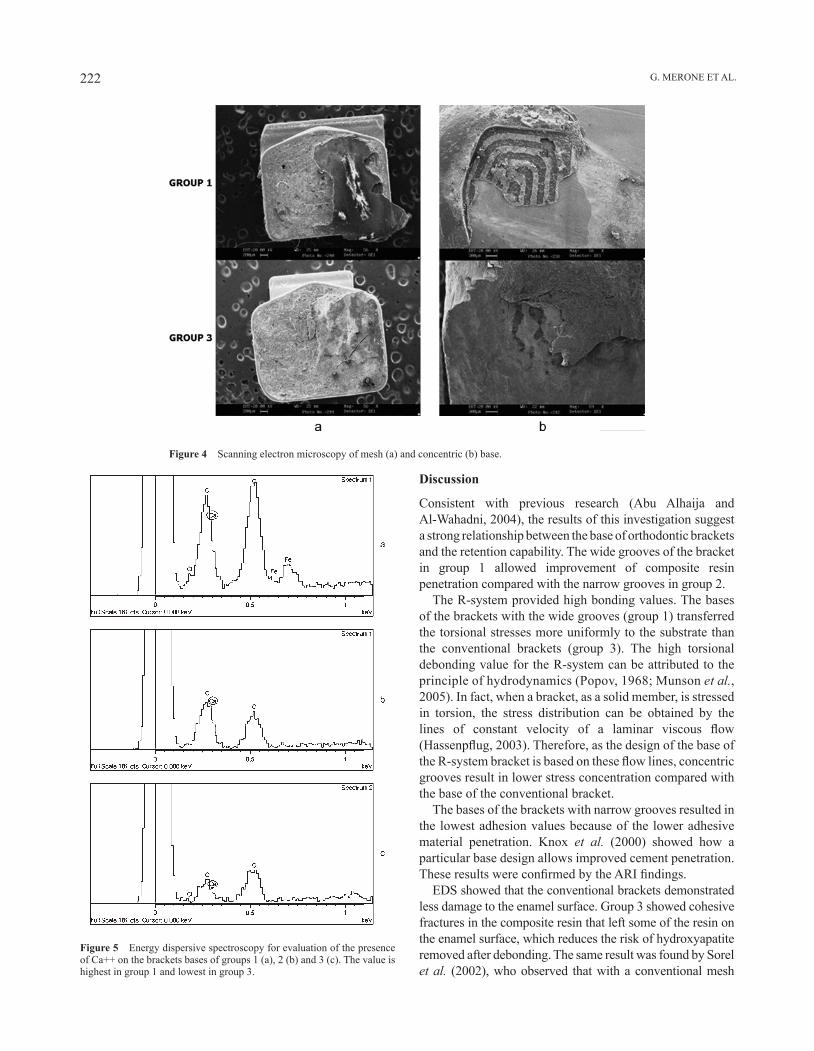
G. MErOnE ET AL.222
Figure 5 Energy dispersive spectroscopy for evaluation of the presence of Ca++ on the brackets bases of groups 1 (a), 2 (b) and 3 (c). The value is highest in group 1 and lowest in group 3.
Discussion
Consistent with previous research (Abu Alhaija and Al-Wahadni, 2004), the results of this investigation suggest a strong relationship between the base of orthodontic brackets and the retention capability. The wide grooves of the bracket in group 1 allowed improvement of composite resin penetration compared with the narrow grooves in group 2.
The r-system provided high bonding values. The bases of the brackets with the wide grooves (group 1) transferred the torsional stresses more uniformly to the substrate than the conventional brackets (group 3). The high torsional debonding value for the r-system can be attributed to the principle of hydrodynamics (Popov, 1968; Munson et al., 2005). In fact, when a bracket, as a solid member, is stressed in torsion, the stress distribution can be obtained by the lines of constant velocity of a laminar viscous flow (Hassenpflug, 2003). Therefore, as the design of the base of the R-system bracket is based on these flow lines, concentric grooves result in lower stress concentration compared with the base of the conventional bracket.
The bases of the brackets with narrow grooves resulted in the lowest adhesion values because of the lower adhesive material penetration. Knox et al. (2000) showed how a particular base design allows improved cement penetration. These results were confirmed by the ARI findings.
EDS showed that the conventional brackets demonstrated less damage to the enamel surface. Group 3 showed cohesive fractures in the composite resin that left some of the resin on the enamel surface, which reduces the risk of hydroxyapatite removed after debonding. The same result was found by Sorel et al. (2002), who observed that with a conventional mesh
Figure 4 Scanning electron microscopy of mesh (a) and concentric (b) base.

223 BIOMECHAnICAL EVALUATIOn OF A nOVEL BrACKET
base, the debond interface was located at the bracket adhesive interface and the ArI score for this type of bracket was lower. The novel base of group 1 showed fractures located between the enamel and composite resin, which increased the risk of removal of the hydroxyapatite from the enamel surface during debonding. This was due to the higher stress values that the conventional base of group 3 is capable of transferring to the material and is consistent with the FEA results.
Conclusion
The concentric grooves of the base of the r-system bracket provide higher bond strength value but lesions to the enamel substrate are possible.
Address for correspondence
Dr rosa VallettaDipartimento di Scienze Odontostomatologiche e Maxillo-FaccialiUniversità degli studi di napoli “Federico II”Via S. Pansini 580131 napoliItaly E-mail: [email protected]
Funding
CrdC of regione Campania nuove Tecnologie per le Attività Produttive (Por 3.16)
Acknowledgement
The authors would like to thank Mr rodolfo Morra for mechanical testing.
ReferencesAbu Alhaija E S J, Al-Wahadni A M S 2004 Evaluation of shear bond
strength with different enamel pre-treatments. European Journal of Orthodontics 26: 179–184
Figure 6 Finite element analysis: bracket with the mesh base (a) and concentric base (b) brackets. The mesh-base bracket shows a higher stress distribution than the novel design.
Arici S, Minors C 2000 The force levels required to mechanically debond ceramic brackets: an in vitro comparative study. European Journal of Orthodontics 22: 327–334
Årtun J, Bergland S 1984 Clinical trials with crystal conditioning as alternative to acid-etch enamel pre-treatment. American Journal of Orthodontics 85: 333–340
Cheremisinoff n P 1987 Practical statistics for engineers and scientists. Technomic Publishing Company Inc., Lancaster
Gibb A J, Katona T r 2006 A comparison of the shear-peel and third order bond strengths of orthodontic brackets with 2 etch techniques and the role of bracket asymmetry. American Journal of Orthodontics and Dentofacial Orthopedics 130: 699.e1–e7
Harris A M P, Joseph V P, rossouw P E 1990 Comparison of shear bond strengths of orthodontic resins to ceramic and metal brackets. Journal of Clinical Orthodontics 24: 725–728
Hassenpflug W C 2003 Torsion of uniform bars with polygon cross-section. Computers and Mathematics with Applications 46: 313–392
Hirani S, Sherriff M 2006 Bonding characteristics of a self-etching primer and precoated brackets: an in vitro study. European Journal of Orthodontics 22: 400–404
Katona T r 1997 A comparison of the stresses developed in tension, shear peel, and torsion strength testing of direct bonded orthodontic brackets. American Journal of Orthodontics and Dentofacial Orthopedics 112: 244–251
Katona T r, Long r W 2006 Effect of loading mode on bond strength of orthodontic bracket bonded with 2 systems. American Journal of Orthodontics and Dentofacial Orthopedics 129: 60–64
Knox J, Hubsch P, Jones M L, Middleton J 2000 The influence of bracket base design on the strength of the cement interface. British Journal of Orthodontics 27: 249–254
Knox J, Kralj B, Hubsch P, Middleton J, Jones M L 2001 An evaluation of the quality of orthodontic attachment offered by single- and double-mesh bracket bases using the finite element method of stress analysis. The Angle Orthodontist 71: 149–155
Munson B, Young D, Okiishi T 2005 Fundamentals of fluid mechanics. John Wiley & Sons Inc., new York
Oesterle L J, Shellhart W C, Belanger G K 1998 The use of bovine enamel in bonding studies. American Journal of Orthodontics and Dentofacial Orthopedics 114: 514–519
Popov E P 1968 Introduction to mechanics of solids. Prentice Hall, Englewood Cliffs, new Jersey
regan D, van noort r 1989 Bond strengths of two integral bracket-base combinations: an in vitro comparison with foil mesh. European Journal of Orthodontics 11: 144–153
Saleh F, Taymour n 2003 Validity of using bovine teeth as a substitute for human counterparts in adhesive tests. East Mediterranean Health Journal 9: 201–207
Sorel O, El Alam r, Chagneau F, Cathelineau G 2002 Comparison of bond strength between simple foil mesh and laser-structured base retention brackets. American Journal of Orthodontics and Dentofacial Orthopedics 122: 260–266
Summers A, Kao E, Gilmore J, Gunel E, ngan P 2004 Comparison of bond strength between a conventional resin adhesive and a resin-modified glass ionomer adhesive: an in vitro and in vivo study. American Journal of Orthodontics and Dentofacial Orthopedics 126: 200–206
Valletta r, Prisco D, De Santis r, Ambrosio L, Martina r, rengo S 2002 Valutazione della resistenza al distacco di bracket ortodontici con tre differenti sistemi di cementazione. Ortognatodonzia Italiana 11: 205–211
Wang W n, Li C H, Chou T H, Wang D D, Lin L H, Lin C T 2004 Bond strength of various bracket base designs. American Journal of Orthodontics and Dentofacial Orthopedics 125: 65–70
Wendl B, Droschl H 2004 A comparative in vitro study of the strength of directly bonded brackets using different curing techniques. European Journal of Orthodontics 26: 535–544
Whitlock 3rd O B, Eick J D, Ackerman Jr r J, Glaros A G, Chappell r P 1994 Shear strength of ceramic brackets bonded to porcelain. American Journal of Orthodontics and Dentofacial Orthopedics 106: 358–364
European Journal of Orthodontics 32 (2010) 224–227 © The Author 2009. Published by Oxford University Press on behalf of the European Orthodontic Society.doi:10.1093/ejo/cjp080 All rights reserved. For permissions, please email: [email protected] Access Publication 11 September 2009
Introduction
Air abrasion was first described by Black (1945) as a method of preparing cavity forms. Buonocore (1955) reported on the use of acid etching to increase adhesion to enamel. Forty years later, studies began to analyse the effects on enamel bond strength of acid etch alone versus a combination of air abrasion and acid etching (Roeder et al., 1995).
Existing research has been diverse with respect to controlling variables. Some studies concerning the bond strength of an air abraded surface did not report the distance from the air abrasion tip to the tooth surface (Brown and Barkmeier, 1996; Nikaido et al., 1996; Kanellis et al., 1997) or used a distance of less than 2 mm (van Waveren Hogervorst et al., 2000; Borsatto et al., 2002; Peruchi et al., 2002; Matos et al., 2003). The duration of abrasion treatment was often stated at over 2 seconds (Brown and Barkmeier, 1996; Nikaido et al., 1996; Kanellis et al., 1997; Olsen et al., 1997; Canay et al., 2000; Borsatto et al., 2002; Peruchi et al., 2002; Matos et al., 2003; Mujdeci and Gokay, 2004). Some investigations utilized surfaces other than the buccal (Brown and Barkmeier, 1996; Kanellis et al., 1997; Borsatto et al., 2002; Matos et al., 2003), while other studies did not describe which surface was used (Nikaido et al., 1996; Olsen et al., 1997; Peruchi et al., 2002). Two studies used bovine teeth (Nikaido et al., 1996; van Waveren Hogervorst et al., 2000), while another used human primary teeth (Peruchi et al., 2002). Several studies ground teeth down with sandpaper prior to air abrading (Nikaido et al., 1996; van Waveren Hogervorst et al., 2000; Matos et al., 2003; Mujdeci and Gokay, 2004). The angle of application
The effect of air abrasion preparation on the shear bond strength
of an orthodontic bracket bonded to enamel
Richard M. Halpern* and Tanya Rouleau***Department of Preventive Dental Science, University of Manitoba, Winnipeg, Manitoba, Canada and **Department of Oral Medicine, Carolinas Medical Center, Charlotte, North Carolina, USA
SUMMARY The purpose of this study was to determine the method of preparation of enamel which best retains a bonded orthodontic bracket against a shear force. Two hundred and twelve human lower premolars were randomly divided into four equal groups. Group 1 underwent no air abrasion, group 2 received treatment with 25 mm aluminium oxide particles, group 3 with 50 mm particles, and group 4 with 100 mm particles. All groups were treated with a self-etching primer before bonding of an orthodontic bracket. Each tooth was tested in a JJ Lloyd M30K® machine to determine the maximum shear force required to dislodge the bracket from the tooth.
A one-way analysis of variance test conducted at a 95 per cent confidence level (CL) demonstrated that there was a significant difference (P < 0.01) with respect to the four methods of preparation of the enamel surface. An unpaired t-test was then applied at a 95 per cent CL. There was no statistically significant difference between groups 1 and 2. There was, however, a statistically significant difference between groups 1 and 3 (P < 0.01), as well as between groups 1 and 4 (P < 0.01). In addition, there was significant difference found between groups 2 and 3 (P < 0.05), groups 2 and 4 (P < 0.01), and groups 3 and 4 (P < 0.05).
of the particles was often not perpendicular to the tooth surface (Canay et al., 2000; Borsatto et al., 2002; Peruchi et al., 2002; Matos et al., 2003) or not stated (Brown and Barkmeier, 1996; Nikaido et al., 1996; Kanellis et al., 1997; Olsen et al., 1997). Some investigations indicated that air pressure over 115 psi were used (Kanellis et al., 1997; Olsen et al., 1997; Mujdeci and Gokay, 2004) or did not mention what pressure was used (Brown and Barkmeier, 1996; van Waveren Hogervorst et al., 2000). Studies did not explain how they controlled for the time required until the maximum declared pressure from the air abrasion tip could be reached from the moment of depressing the application button (Brown and Barkmeier, 1996; Nikaido et al., 1996; Kanellis et al., 1997; Olsen et al., 1997; Canay et al., 2000; van Waveren Hogervorst et al., 2000; Borsatto et al., 2002; Peruchi et al., 2002; Matos et al., 2003; Mujdeci and Gokay, 2004). Many authors drew conclusions while having utilized less than 12 samples per group (Brown and Barkmeier, 1996; Nikaido et al., 1996; Borsatto et al., 2002; Peruchi et al., 2002; Matos et al., 2003). Previous research relating the advantages of combining air abrasion and bonding orthodontic brackets has yielded varied conclusions (Brown and Barkmeier, 1996; Canay et al., 2000; Borsatto et al., 2002; Matos et al., 2003).
Orthodontic brackets are frequently dislodged from the surface of the tooth due to normal occlusal forces transmitted during mastication to the brackets (Gorelick et al., 1984). To avoid excess time and expense for the patient and dentist, bonding must be reliable. The purpose of this study was to
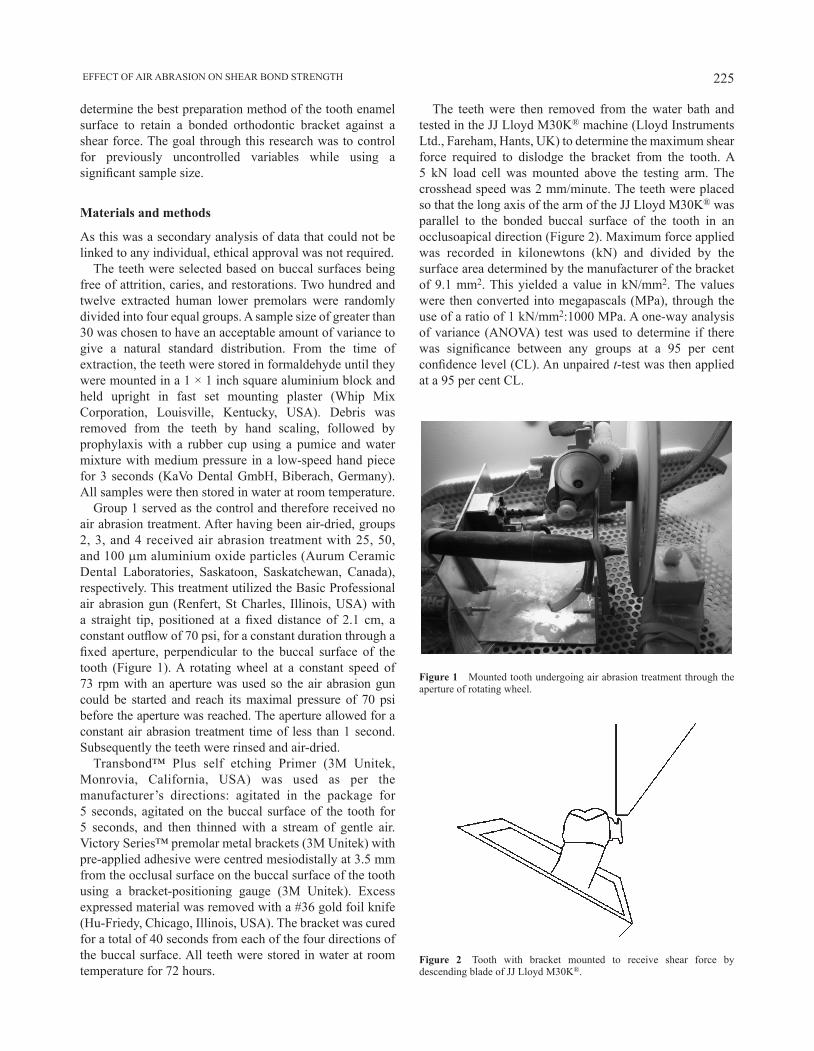
225 EFFECT OF AIR ABRASION ON SHEAR BOND STRENGTH
determine the best preparation method of the tooth enamel surface to retain a bonded orthodontic bracket against a shear force. The goal through this research was to control for previously uncontrolled variables while using a significant sample size.
Materials and methods
As this was a secondary analysis of data that could not be linked to any individual, ethical approval was not required.
The teeth were selected based on buccal surfaces being free of attrition, caries, and restorations. Two hundred and twelve extracted human lower premolars were randomly divided into four equal groups. A sample size of greater than 30 was chosen to have an acceptable amount of variance to give a natural standard distribution. From the time of extraction, the teeth were stored in formaldehyde until they were mounted in a 1 × 1 inch square aluminium block and held upright in fast set mounting plaster (Whip Mix Corporation, Louisville, Kentucky, USA). Debris was removed from the teeth by hand scaling, followed by prophylaxis with a rubber cup using a pumice and water mixture with medium pressure in a low-speed hand piece for 3 seconds (KaVo Dental GmbH, Biberach, Germany). All samples were then stored in water at room temperature.
Group 1 served as the control and therefore received no air abrasion treatment. After having been air-dried, groups 2, 3, and 4 received air abrasion treatment with 25, 50, and 100 mm aluminium oxide particles (Aurum Ceramic Dental Laboratories, Saskatoon, Saskatchewan, Canada), respectively. This treatment utilized the Basic Professional air abrasion gun (Renfert, St Charles, Illinois, USA) with a straight tip, positioned at a fixed distance of 2.1 cm, a constant outflow of 70 psi, for a constant duration through a fixed aperture, perpendicular to the buccal surface of the tooth (Figure 1). A rotating wheel at a constant speed of 73 rpm with an aperture was used so the air abrasion gun could be started and reach its maximal pressure of 70 psi before the aperture was reached. The aperture allowed for a constant air abrasion treatment time of less than 1 second. Subsequently the teeth were rinsed and air-dried.
Transbond™ Plus self etching Primer (3M Unitek, Monrovia, California, USA) was used as per the manufacturer’s directions: agitated in the package for 5 seconds, agitated on the buccal surface of the tooth for 5 seconds, and then thinned with a stream of gentle air. Victory Series™ premolar metal brackets (3M Unitek) with pre-applied adhesive were centred mesiodistally at 3.5 mm from the occlusal surface on the buccal surface of the tooth using a bracket-positioning gauge (3M Unitek). Excess expressed material was removed with a #36 gold foil knife (Hu-Friedy, Chicago, Illinois, USA). The bracket was cured for a total of 40 seconds from each of the four directions of the buccal surface. All teeth were stored in water at room temperature for 72 hours.
Figure 1 Mounted tooth undergoing air abrasion treatment through the aperture of rotating wheel.
The teeth were then removed from the water bath and tested in the JJ Lloyd M30K® machine (Lloyd Instruments Ltd., Fareham, Hants, UK) to determine the maximum shear force required to dislodge the bracket from the tooth. A 5 kN load cell was mounted above the testing arm. The crosshead speed was 2 mm/minute. The teeth were placed so that the long axis of the arm of the JJ Lloyd M30K® was parallel to the bonded buccal surface of the tooth in an occlusoapical direction (Figure 2). Maximum force applied was recorded in kilonewtons (kN) and divided by the surface area determined by the manufacturer of the bracket of 9.1 mm2. This yielded a value in kN/mm2. The values were then converted into megapascals (MPa), through the use of a ratio of 1 kN/mm2:1000 MPa. A one-way analysis of variance (ANOVA) test was used to determine if there was significance between any groups at a 95 per cent confidence level (CL). An unpaired t-test was then applied at a 95 per cent CL.
Figure 2 Tooth with bracket mounted to receive shear force by descending blade of JJ Lloyd M30K®.

R. M. HALPERN AND T. ROULEAU 226
Results
After data collection, the mean shear bond strength was calculated to be 7.244 MPa for group 1, 7.736 MPa for group 2, 8.751 MPa for group 3, and 10.24 MPa for group 4 (Figure 3).
A one-way ANOVA test conducted at a 95 per cent CL demonstrated that there was a significant difference (P < 0.01) with respect to the four methods of preparation of the enamel surface. An unpaired t-test was then applied at a 95 per cent CL. There was no statistically significant difference between groups 1 and 2. There was, however, a statistically significant difference between groups 1 and 3 (P < 0.01), as well as between groups 1 and 4 (P < 0.01). In addition, there was significant difference between groups 2 and 3 (P < 0.05), groups 2 and 4 (P < 0.01), and groups 3 and 4 (P < 0.05).
Discussion
In the current study, all four groups were etched prior to bonding as research has shown that air abrasion is not an acceptable replacement for etch prior to bonding (Olsen et al., 1997; van Waveren Hogervorst et al., 2000). When applied to enamel, air abrasion produces a rough irregular surface with increased surface area. This may improve the effectiveness of etch by increasing the wettability of the enamel (Roeder et al., 1995).
The present study found no significant bond strength difference when using 25 mm particles and not using air abrasion. This finding is consistent with studies assessing differences between 27 mm particles and not air abrasion (Roeder et al., 1995; Borsatto et al., 2002; Matos et al., 2003). However, these results vary from those of Mujdeci and Gokay (2004), who reported an increase in bond strength when using 25 mm particles in place of a control.
The improved bond strength found in this study when using 50 mm particles in place of no air abrasion was consistent with the findings of Canay et al. (2000) but not those of Roeder et al. (1995) or Brown and Barkmeier (1996), who found no significant difference
between these groups. Interestingly , Nikaido et al. (1996) found decreased bond strength when using 50 mm particles compared with no air abrasion. As previously indicated, varying results between previous studies are likely due to the many uncontrolled and unreported variables in methodology.
The increased bond strength found when using 50 mm particles in place of 25 mm particles differed from Roeder et al. (1995), who found no difference between the use of these two sized particles. This is the first study comparing 100 mm air abrasion particles on a smooth enamel surface with no air abrasion, 25 mm, and 50 mm air abrasion particles.
Air abrasion has been noted to damage the enamel surface at a level equivalent to the use of 37 per cent phosphoric acid etch applied for 30 seconds (van Waveren Hogervorst et al., 2000). Further studies should analyse the effects of various sized particles on the surface enamel while maintaining control of variables and utilizing clinically acceptable parameters.
Some clinicians have questioned the safety of air abrasion systems. In a study by Wright et al. (1999), health hazard testing was carried out by the occupational Health and Safety Resource Centre after having gathered samples using suction methods. They concluded that their findings were insufficient to prove that the air abrasion systems pose a health hazard to patients or those operating the air abraders.
In a study on the effects of air abrasion on the gingiva, Kozlovsky et al. (2005) aimed air abrasion particles at the most occlusal gingiva adjacent teeth. They observed that localized trauma to the gingiva resulted in epithelial erosive changes, which was dependent on: stand alone versus hand-piece air pressure device and duration of exposure. The authors reported a distance of 5 mm but did not mention the psi of the air abraders utilized.
Conclusion
The results of this study show that the strongest method for bonding an orthodontic bracket, listed in decreasing order, was to use 100 mm aluminium oxide air abrasion treatment, followed by 50 mm aluminium oxide air abrasion treatment, followed by 25 mm aluminium oxide air abrasion treatment, or no air abrasion treatment.
Brackets bonded to teeth for orthodontic purposes should ideally remain fixed to the teeth throughout treatment. The ideal bond strength of a bracket to the surface of a tooth has not yet been determined. This study has shown that improved retention may occur with adjunctive treatment of air abrasion. Stronger bonds are achievable but this may be attained at the expense of enamel fracturing when the bracket is eventually debonded at the end of treatment. Future research should focus on determining the ideal bond strength.
Figure 3 Mean shear bond strength following different air abrasion particle size treatment.

227 EFFECT OF AIR ABRASION ON SHEAR BOND STRENGTH
Address for correspondence
Richard M. HalpernDepartment of Preventive Dental ScienceUniversity of ManitobaD341 Dental Building, 780 BannatyneWinnipeg, ManitobaCanada R3E 0W2E-mail: [email protected]
Funding
College of Dentistry at the University of Saskatchewan.
Acknowledgements
Transbond™ Plus Self Etching Primer and Unitek Victory Series™ premolar metal brackets were donated by 3M Unitek and the aluminium oxide by Aurum Dental Laboratories.
The authors wish to thank the Department of Operative Dentistry, University of Saskatchewan, Saskatoon, Canada for its guidance, Mr Kevin Banman for his technical assistance and Dr Patrick Devey Concordia University, Montreal, Quebec, Canada for his statistical analysis.
ReferencesBlack R B 1945 Technic for nonmechanical preparation of cavities and
prophylaxis. Journal of the American Dental Association 32: 955–965Borsatto M C, Catirse A B, Palma Dibb R G, Nascimento T N, Rocha R A,
Corona S A 2002 Shear bond strength of enamel surface treated with air-abrasive system. Brazilian Dental Journal 13: 175–178
Brown J R, Barkmeier W W 1996 A comparison of six enamel treatment procedures for sealant bonding. Pediatric Dentistry 18: 29–31
Buonocore M G 1955 A simple method of increasing the adhesion of acrylic filling materials to enamel surfaces. Journal of Dental Research 34: 849–853
Canay S, Kocadereli I, Akςa E 2000 The effect of enamel air abrasion on the retention of bonded metallic orthodontic brackets. American Journal of Orthodontics and Dentofacial Orthopedics 117: 15–19
Gorelick L, Geiger A M, Gwinnett A J 1984 Implications of the failure rates of bonded brackets and eyelets: a clinical study. American Journal of Orthodontics 86: 403–406
Kanellis M J, Warren J J, Levy S M 1997 Comparison of air abrasion versus acid etch sealant techniques: six-month retention. Pediatric Dentistry 19: 258–261
Kozlovsky A, Artzi Z, Nemcovsky C E, Hirshberg A 2005 Effect of air-polishing devices on the gingiva: histologic study in the canine. Journal of Clinical Periodontology 32: 329–334
Matos A B, Tate W H, Powers J M 2003 Influence of enamel surface preparation on composite bond strength. American Journal of Dentistry 16: 37A–40A
Mujdeci A, Gokay O 2004 The effect of airborne-particle abrasion on the shear bond strength of four restorative materials to enamel and dentin. Journal of Prosthetic Dentistry 92: 245–249
Nikaido T, Kataumi M, Burrow M F, Inokoshi S, Yamada T, Takatsu T 1996 Bond strengths of resin to enamel and dentin treated with low-pressure air abrasion. Operative Dentistry 21: 218–224
Olsen M E, Bishara S E, Damon P, Jakobsen J R 1997 Comparison of shear bond strength and surface structure between conventional acid etching and air-abrasion of human enamel. American Journal of Orthodontics and Dentofacial Orthopedics 112: 502–506
Peruchi C, Santos-Pinto L, Santos-Pinto A, Barbosa e Silva E 2002 Evaluation of cutting patterns produced in primary teeth by an air-abrasion system. Quintessence International 33: 279–283
Roeder L B, Berry E A, You C, Powers J M 1995 Bond strength of composite to air-abraded enamel and dentin. Operative Dentistry 20: 186–190
van Waveren Hogervorst W L, Feilzer A J, Prahl-Andersen B 2000 The air-abrasion technique versus the conventional acid-etching technique: a quantification of surface enamel loss and a comparison of shear bond strength. American Journal of Orthodontics and Dentofacial Orthopedics 117: 20–26
Wright G Z, Hatibovic-Kofman S, Millenaar D W, Braverman I 1999 The safety and efficacy of treatment with air abrasion technology. International Journal of Paediatric Dentistry 9: 133–140

European Journal of Orthodontics 32 (2010) 228–229 © The Author 2010. Published by Oxford University Press on behalf of the European Orthodontic Society. All rights reserved. For permissions, please email: [email protected].
Sir,We write to comment on the article by Kirveskari and Jämsä (2009). Therein, the authors reported that among adult females, who considered their work physically stressful to the cervicobrachial musculature, ‘meticulous occlusal adjustment aimed at elimination of all occlusal interferences’ (p. 491) at the initiation of the investigation and during annual follow-ups decreased later demand for therapy of symptoms located in the head, face and/or cervicobrachial regions. These findings complement results from an earlier randomized controlled trial in which it was shown that regular biannual occlusal adjustment over a period of 4 years among healthy children and adolescents led to a statistically significant reduction of the incidence of symptoms and signs of temporomandibular disorders (TMD) (Kirveskari et al., 1998).
First of all, the authors need to be congratulated on their methodologically sound longitudinal studies in which participants were monitored over a period of 48 months. Based on their findings, Kirveskari and Jämsä (2009) consider ‘occlusal interferences as a structural health risk for symptoms in the head and neck region’ (p. 492). While we agree that the results indicate that the occlusion may have an influence on the neuromuscular system of individual patients, we consider the notion ‘that occlusal interferences are a health risk’ (p. 494) an over-interpretation that is likely to obfuscate a more physiological explanation. In fact, we believe that the outcome of both investigations may be construed as follows:
It is well-established in occupational physiology that repetitive, long-lasting, low-intensity muscle loading, which selectively and continuously activates small type I motor units (Cinderella hypothesis), may lead to muscle pain due to metabolic exhaustion and damage of single motor units (Zennaro et al., 2004; Visser and van Dieën, 2006; Staal et al., 2007). It is conceivable that a similar mechanism may also occur within masticatory muscles of susceptible patients during sustained motor activity, such as prolonged tooth grinding, jaw clenching or non-physiological daily tooth contacts (cf. Chen et al., 2007).
There is good evidence that based on the inherent functional heterogeneity of the masticatory muscles and their resulting differential activation behaviour (Blanksma and van Eijden, 1995; Schindler et al., 2005, 2006; Farella et al., 2009), even minimal positional changes of the mandible, as induced, for instance, by occlusal adjustment, build-up of tooth surfaces (Kirveskari and Jämsä, 2009, p. 491) or insertion of oral
splints (Schindler et al., 2000), alter the recruitment patterns within the masticatory muscles (Schindler et al., 2005, 2006). These biomechanical modifications, in turn, are likely to reduce stress concentrations in particular muscle regions and, as a consequence, unload localized painful areas (Türp and Schindler, 2003). Hence, systematic (and periodic) alterations of occlusal surfaces at specific time intervals, as carried out in the two investigations discussed here (Kirveskari et al., 1998; Kirveskari and Jämsä, 2009), may have decreased the duration and amount of stereotyped loading of motor units of susceptible subjects and, therefore, reduced the incidence of muscle pain.
The idea that any therapeutic increase or decrease of the mandibular position (of course, within a physiological range) may be useful for regional pain reduction in the temporomandibular joints and/or the masticatory muscles [and the adjacent cervicobrachial musculature (cf. Ciancaglini et al., 1999; Sipilä et al., 2002; Rantala et al., 2003)] may serve as an explanatory model not only for the reported effects after occlusal adjustment (Kirveskari et al., 1998; Kirveskari and Jämsä, 2009) but also for any other therapeutically induced alteration of the three-dimensional intermaxillary relationship. Therefore, and considering the ‘practically universal presence of interferences’, it is appreciated that Kirveskari and Jämsä (2009) judiciously eschew generalized ‘prophylactic elimination of occlusal interferences’.
Hans J. SchindlerDepartment of Prosthodontics
Dental School University of Heidelberg
Germany
Jens C. TürpDepartment of Reconstructive Dentistry and
Temporomandibular Disorders Dental School
University of Basel Switzerland
ReferencesBlanksma N G, van Eijden T M 1995 Electromyographic heterogeneity in the
human temporalis and masseter muscles during static biting, open/close excursions, and chewing. Journal of Dental Research 74: 1318–1327
Letters to the Editor
European Journal of Orthodontics 32 (2010) 228doi:10.1093/ejo/cjq001
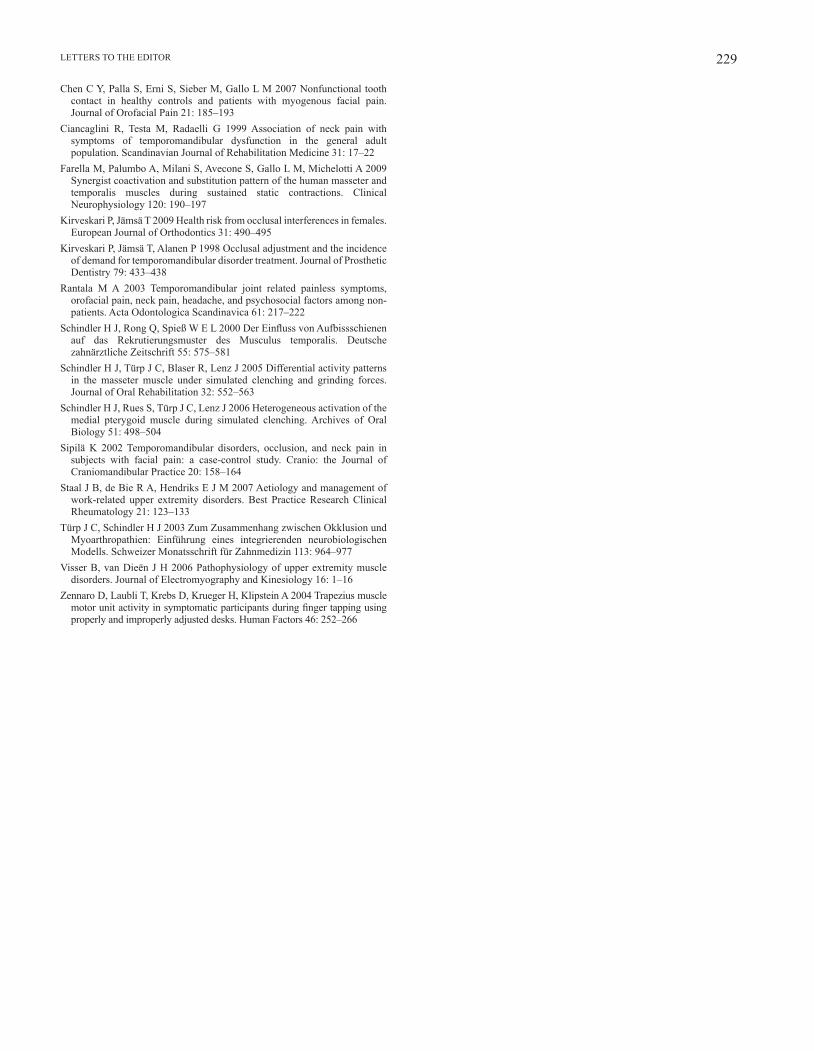
229LETTERS TO THE EDITOR
Chen C Y, Palla S, Erni S, Sieber M, Gallo L M 2007 Nonfunctional tooth contact in healthy controls and patients with myogenous facial pain. Journal of Orofacial Pain 21: 185–193
Ciancaglini R, Testa M, Radaelli G 1999 Association of neck pain with symptoms of temporomandibular dysfunction in the general adult population. Scandinavian Journal of Rehabilitation Medicine 31: 17–22
Farella M, Palumbo A, Milani S, Avecone S, Gallo L M, Michelotti A 2009 Synergist coactivation and substitution pattern of the human masseter and temporalis muscles during sustained static contractions. Clinical Neurophysiology 120: 190–197
Kirveskari P, Jämsä T 2009 Health risk from occlusal interferences in females. European Journal of Orthodontics 31: 490–495
Kirveskari P, Jämsä T, Alanen P 1998 Occlusal adjustment and the incidence of demand for temporomandibular disorder treatment. Journal of Prosthetic Dentistry 79: 433–438
Rantala M A 2003 Temporomandibular joint related painless symptoms, orofacial pain, neck pain, headache, and psychosocial factors among non-patients. Acta Odontologica Scandinavica 61: 217–222
Schindler H J, Rong Q, Spieß W E L 2000 Der Einfluss von Aufbissschienen auf das Rekrutierungsmuster des Musculus temporalis. Deutsche zahnärztliche Zeitschrift 55: 575–581
Schindler H J, Türp J C, Blaser R, Lenz J 2005 Differential activity patterns in the masseter muscle under simulated clenching and grinding forces. Journal of Oral Rehabilitation 32: 552–563
Schindler H J, Rues S, Türp J C, Lenz J 2006 Heterogeneous activation of the medial pterygoid muscle during simulated clenching. Archives of Oral Biology 51: 498–504
Sipilä K 2002 Temporomandibular disorders, occlusion, and neck pain in subjects with facial pain: a case-control study. Cranio: the Journal of Craniomandibular Practice 20: 158–164
Staal J B, de Bie R A, Hendriks E J M 2007 Aetiology and management of work-related upper extremity disorders. Best Practice Research Clinical Rheumatology 21: 123–133
Türp J C, Schindler H J 2003 Zum Zusammenhang zwischen Okklusion und Myoarthropathien: Einführung eines integrierenden neurobiologischen Modells. Schweizer Monatsschrift für Zahnmedizin 113: 964–977
Visser B, van Dieën J H 2006 Pathophysiology of upper extremity muscle disorders. Journal of Electromyography and Kinesiology 16: 1–16
Zennaro D, Laubli T, Krebs D, Krueger H, Klipstein A 2004 Trapezius muscle motor unit activity in symptomatic participants during finger tapping using properly and improperly adjusted desks. Human Factors 46: 252–266

229LETTERS TO THE EDITOR
Sir,Drs Schindler and Türp consider the term ‘health risk’ ‘an over-interpretation that is likely to obfuscate a more physiological explanation’. They suggest that any small repeated changes in mandibular position suffice to explain our results. We are pleased to share their opinion that occlusion appears to have an influence on the neuromuscular system.
The alternative explanation for our results offered by Drs Schindler and Türp is an interesting example of the problem of proving hypotheses correct. Results of studies can as a rule be explained in several ways. We agree that small changes in mandibular position can have a short-term therapeutic effect on patients suffering from muscle or temporomandibular joint pain. Work-related muscle pain was probably common in our
European Journal of Orthodontics 32 (2010) 229doi:10.1093/ejo/cjq002
material although the subjects did not demand treatment at the baseline. However, the subjects in an earlier study (Kirveskari et al., 1998) had no identifiable external risk to their muscles. Moreover, a strong correlation between the number of interferences and the presence of (mainly muscular) signs of TMD was found in cohorts of healthy children after interferences had been eliminated in a small number of them (Kirveskari et al., 1989, 1992). Lastly, the finding that artificial interferences without a change in the intercuspal position could induce symptoms of TMD in former patients (Le Bell et al., 2002) strongly suggests that interferences can be harmful.
We have repeatedly been unable to falsify the argument that occlusal interferences are a causal factor. The fact that the relative risk in subjects with was significantly greater than that in subjects without interferences suggests to us that we cannot dismiss interferences as a health risk. Before critical tests comfort us, there is reason to suspect that even the changes in occlusion unwittingly caused by dental therapy may in fact, at least in some patients, increase rather than decrease the structural risk from occlusion. However, we have not tried to assess the absolute magnitude of the risk neither in the population at large nor in patients before or after any dental therapy.
Symptoms in the head and cervicobrachial region are common. They are often managed by using symptomatic therapy with only temporary relief. In view of the discomfort and considerable cost the symptoms cause, it seems unwise to ignore interferences as long as the hypothesis of their causal role has not been falsified. The explanation suggested by Drs Schindler and Türp is scientifically sound. However, the hypothesis underlying it would need to be critically tested. A clinical trial testing their hypothesis would not be easy to carry out in practice—it would need to be designed so that the two rival hypotheses (elimination of interferences versus any change in mandibular tooth-to-tooth positions) predict a different outcome.
Pentti Kirveskari and Tapio JämsäInstitute of Dentistry University of Turku
Lemminkäisenkatu 2 FIN-20520 Turku
Finland
ReferencesKirveskari P, Alanen P, Jamsa T 1989 Association between
craniomandibular disorder and occlusal interferences. Journal of Prosthetic Dentistry 62: 66–69
Kirveskari P, Alanen P, Jamsa T 1992 Association between craniomandibular disorders and occlusal interferences in children. Journal of Prosthetic Dentistry 67: 692–696
Kirveskari P, Alanen P, Jamsa T 1998 Occlusal adjustment and the incidence of demand for temporomandibular disorder treatment. Journal of Prosthetic Dentistry 79: 433–438
Le Bell Y, Korri S, Jämsä T, Niemi P, Alanen P 2002 Effect of artificial occlusal interferences depends on previous experience of temporo-mandibular disorders. Acta Odontologica Scandinavica 60: 219–222

European Journal of Orthodontics 32 (2010) 230–231 © The Author 2010. Published by Oxford University Press on behalf of the European Orthodontic Society. All rights reserved. For permissions, please email: [email protected].
This beautifully illustrated book containing more than 492 illustrations, most of which are in colour, is a joy to read and is easily understandable to those for whom English is not their first language.
Chapters 1–4 cover the history and an overview of the subjects of chemistry of dental porcelain, casting alloy techniques for bonding to dental porcelain, and essentials of metal–ceramic substructure and design, respectively. The
Book Reviews
European Journal of Orthodontics 32 (2010) 230doi:10.1093/ejo/cjp150Advance Access Publication 10 February 2010
Introduction to metal–ceramic technology, 2nd edition (2009)Author: W. Patrick Naylor Publisher: Quintessence Publishing Co. Limited, New Malden, Surrey, UK Price: £68.00 ISBN: 978-0-86715-460-3
chapters concerning the preparation of the metal framework (5–7) performed in the dental laboratory are extremely well explained. The well-structured and well-illustrated volume of information is highly informative for junior technicians.
This book is a very valuable resource that can be recommended both to dental and prosthodontic students.
Duygu Saraç
European Journal of Orthodontics 32 (2010) 230–231 © The Author 2010. Published by Oxford University Press on behalf of the European Orthodontic Society. All rights reserved. For permissions, please email: [email protected].
This paperback, edited by Hazel Biggs, who is Professor of Medical Law at the University of Southampton, is designed to address ethical issues relevant to medical research. At 188 A5 pages, it is compact. The book is one of a series of 12 on various biomedical law and ethics topics.
The book concentrates on the place of ethics in medical research and explains the relationship between the law and ethical standards. Those involved with research ethics committees, as either reviewers or reviewed, will recognize many of the important matters addressed. There are eight chapters in total and detailed attention is given to consent, confidentiality, research on vulnerable groups, human tissue, and clinical trials. Orthodontists will be particularly interested in those sections concerning children and the issues of consent for clinical work and research.
European Journal of Orthodontics 32 (2010) 230doi:10.1093/ejo/cjp168Advance Access Publication 2 February 2010
Healthcare research ethics and law regulation, review and responsibility (2009)Editor: Hazel BiggsPublisher: Routledge-Cavendish, Taylor Francis Group, Abingdon, Oxford, UKPrice: £25.99ISBN: 978-0-415-42917-7
The writing has clarity and precision. Complicated issues are well explained. Terms are clearly defined and distinctions are drawn between terms and concepts that are often confused. The great strength of the text is that detailed reference is made to 65 cases of legal precedence and 32 United Kingdom and European Statutes that underpin the understanding and interpretation of research ethics practice. For those involved in clinical governance and good clinical practice, the book identifies not only what is to be done but also why it is important.
The book succeeds in explaining the subtle differences that exist between the law and the standards and protocols of research ethics. I would recommend this small interesting book to anyone planning to conduct medical research.
Neil Pender

231BOOK REvIEwS
The University of Bristol Dental School, Division of Child Dental Health, took the initiative for these ‘Postgraduate Notes’ in 1997 as it was felt that it would be useful to have a concise text containing facts and supporting relevant references in preparation for the MOrth examinations. Since then the text has been updated every 2–4 years.
The book divides the field of orthodontics into 14 main topics: theoretical aspects, growth, craniofacial anomalies, occlusion, malocclusion, anomalies, diagnosis, interceptive orthodontics, treatment, relapse and retention, risks, materials, research aspects, and miscellaneous issues. The format of the manual is that of short notes covering a certain topic, accompanied by key references that are arranged in an orderly manner in the right margin of the page. The key words in the left margin make it easy to find the topics. The book concludes with a question and answer section showing clinical photographs with related questions, where the reader can test their knowledge.
The book serves as an easy-reference manual for postgraduates in preparation for their examinations at the
European Journal of Orthodontics 32 (2010) 231doi:10.1093/ejo/cjp169Advance Access Publication 2 February 2010
Postgraduate notes in orthodontics, 5th edition (2009)Editor: Nikki AttackPublisher: Division of Child Dental Health, Dental School, University of Bristol, Bristol, UKPrice: UK £50; International £55ISBN: 978-0-9562712-0-4
end of the specialty programme in orthodontics. It is also a good guide for teachers as it gives a quick overview of the entire body of knowledge a postgraduate should have when finishing the programme. The drawback of this approach is that the book concentrates on facts rather than competencies.
The present paper edition does not allow the contents to be easily adapted when new scientific information is emerging. In a rapidly changing field such as bone biology, references are quickly outdated. In fact this book would be the ideal candidate for an online edition. In such a way it would be easy to keep this text updated. Knowing the authors, I am convinced that this will be the next step. Nevertheless in its present format, this manual is a helpful tool in preparation for the MOrth examinations in the UK. Besides that it could also serve as a reference guide for postgraduates and programme directors elsewhere in the world.
Anne Marie Kuijpers-Jagtman
Related Documents


