THE ASTROPHYSICAL JOURNAL, 503 : 278È296, 1998 August 10 1998. The American Astronomical Society. All rights reserved. Printed in U.S.A. ( EJECTED NEBULAE AS PROBES OF THE EVOLUTION OF MASSIVE STARS IN THE LARGE MAGELLANIC CLOUD1 LINDA J. ANTONELLA ANNA CLAUS MARK AND PAUL A. SMITH,2 NOTA,3,4 PASQUALI,3 LEITHERER,3 CLAMPIN,3 CROWTHER2 Received 1997 December 2 ; accepted 1998 March 12 ABSTRACT We present new Hubble Space Telescope (HST ) Faint Object Spectrograph (FOS) and ground-based long-slit spectroscopic observations of the nebulae around the two LMC luminous blue variables (LBVs) R127 (\HDE 269858) and R143 (\HDE 269929) and the Ofpe/WN9 star S119 (\HDE 269687). We have used the ground-based long-slit spectra to investigate the kinematics of the nebulae around R127 and R143. We Ðnd that the circumstellar environment of R127 is complex and suggestive of two discrete ejections in the mass loss history of the central star. There is an inner expanding shell, with a radius of 0.6 pc, an expansion velocity of 29 km s~1, and a dynamical age of 2 ] 104 yr. There is also material beyond the bright inner nebula that may represent an outer expanding shell with a radius of 1.9 pc and a dynamical age of 7 ] 104 yr. For R143, we Ðnd that the velocity Ðeld in the northern and southern circumstellar regions (1AÈ20A) is predominantly constant. Therefore, the nebular emission previously believed to be associated with R143 (the Ðngers) is most likely part of the 30 Doradus complex, with the exception of a small emission-line region located ^2A north of the star. This compact region displays a blueshifted motion with a di†erential velocity of ^130 km s~1 with respect to the central star. The spec- trum of this clump shows a high [N II]/Ha ratio, suggestive of nitrogen-enriched material that has been ejected from the star some 3.7 ] 103 yr ago. We have used the optical HST /FOS spectra to determine reddenings, electron temperatures and den- sities, and N and O abundances for the three nebulae. For R143 our derived abundances indicate that the region we observed to the south of the star is 30 Doradus H II gas, since it shows a typical LMC H II region N/O ratio. For R127 we Ðnd that N is enriched by a factor of 10.7 ^ 2.2, and O is depleted by a factor of 2.0 ^ 1.0, with N/O \ 0.89 ^ 0.40. For the S119 nebula we do not have a secure electron temperature, but Ðnd N/O \ 1.41È2.45, similar to the value found for R127. We compare the nebular abundances to the expected surface abundances of LBVs and discuss the likely stellar evolutionary state at the time of nebular ejection. If the atmospheres of LBVs consist of CNO-processed material, this implies that the event that formed the nebula took place before or at the very start of the LBV phase. Comparison of the observed nebular abundances with other objects shows that the abundance pattern for the R127 nebula is remarkably similar to that determined for the inner ring of SN 1987A, which is thought to be composed of red supergiant (RSG) wind material. This coincidence, together with the observed low expansion velocity, suggests that the nebula was once the CN-processed convective envelope of an RSG. We consider whether the R127 nebular parameters can be reproduced with the evolutionary models of Meynet et al., and we Ðnd that the pre-LBV mass loss has to be low enough for redward evolution such that a surface N/O D 1 is achieved while the star is a cool supergiant inside the Humphreys-Davidson limit. Our Ðndings are broadly in accord with the model of Stothers & Chin that incorporates a brief RSG phase. We also consider the possibility of a pseudo-RSG phase by discussing the suggestion that a star in a super-Eddington condition may develop a very extended outer convective envelope that may become detached. We also present a coarse analysis of the FOS stellar spectropho- tometry using the Q-method to estimate reddenings and spectral types, and we compare our results to more sophisticated methods. Subject headings : circumstellar matter È ISM : abundances È ISM : kinematics and dynamics È Magellanic clouds È stars : early-type È stars : evolution 1. INTRODUCTION Luminous blue variable stars (LBVs ; are Conti 1984) evolved massive supergiants that exhibit irregular photo- 1 Based on observations with the NASA/ESA Hubble Space Telescope, obtained at the Space Telescope Science Institute, which is operated by AURA for NASA under contract NAS5-26555, and on observations obtained at the European Southern Observatory, La Silla. 2 Department of Physics and Astronomy, University College London, Gower Street, London WC1E 6BT, UK; ljs=star.ucl.ac.uk, pac=star.ucl.ac.uk. 3 Space Telescope Science Institute, 3700 San Martin Drive, Baltimore, MD 21218 ; nota=stsci.edu, pasquali=stsci.edu, leitherer=stsci.edu, clampin=stsci.edu. 4 Affiliated with the Astrophysics Division, Space Science Department of the European Space Agency. metric and spectroscopic variations. Their properties have been reviewed in a recent proceedings & Lamers (Nota It is generally accepted that LBVs represent a brief 1997). transition phase in the evolution of an O star to a Wolf- Rayet (W-R) star. In the H-R diagram, the most luminous LBVs (e.g., g Car, AG Car) are observed to lie above and to the left of the Humphreys-Davidson (H-D) limit (L /L _ º 5.8 ; & Davidson suggesting an imme- Humphreys 1979), diate O star progenitor, while other less luminous LBVs (e.g., HR Car, HD 160529) are below this limit and prob- ably had red supergiant (RSG) precursors. Currently there are Ðve conÐrmed and Ðve candidate LBVs in the Galaxy, six conÐrmed LBVs in the LMC, and another 20 in Local Group galaxies & Davidson (Humphreys 1994). 278

Welcome message from author
This document is posted to help you gain knowledge. Please leave a comment to let me know what you think about it! Share it to your friends and learn new things together.
Transcript

THE ASTROPHYSICAL JOURNAL, 503 :278È296, 1998 August 101998. The American Astronomical Society. All rights reserved. Printed in U.S.A.(
EJECTED NEBULAE AS PROBES OF THE EVOLUTION OF MASSIVE STARS IN THE LARGEMAGELLANIC CLOUD1
LINDA J. ANTONELLA ANNA CLAUS MARK AND PAUL A.SMITH,2 NOTA,3,4 PASQUALI,3 LEITHERER,3 CLAMPIN,3 CROWTHER2Received 1997 December 2 ; accepted 1998 March 12
ABSTRACTWe present new Hubble Space Telescope (HST ) Faint Object Spectrograph (FOS) and ground-based
long-slit spectroscopic observations of the nebulae around the two LMC luminous blue variables (LBVs)R127 (\HDE 269858) and R143 (\HDE 269929) and the Ofpe/WN9 star S119 (\HDE 269687). Wehave used the ground-based long-slit spectra to investigate the kinematics of the nebulae around R127and R143. We Ðnd that the circumstellar environment of R127 is complex and suggestive of two discreteejections in the mass loss history of the central star. There is an inner expanding shell, with a radius of0.6 pc, an expansion velocity of 29 km s~1, and a dynamical age of 2] 104 yr. There is also materialbeyond the bright inner nebula that may represent an outer expanding shell with a radius of 1.9 pc anda dynamical age of 7] 104 yr. For R143, we Ðnd that the velocity Ðeld in the northern and southerncircumstellar regions (1AÈ20A) is predominantly constant. Therefore, the nebular emission previouslybelieved to be associated with R143 (the Ðngers) is most likely part of the 30 Doradus complex, with theexception of a small emission-line region located ^2A north of the star. This compact region displays ablueshifted motion with a di†erential velocity of ^130 km s~1 with respect to the central star. The spec-trum of this clump shows a high [N II]/Ha ratio, suggestive of nitrogen-enriched material that has beenejected from the star some 3.7 ] 103 yr ago.
We have used the optical HST /FOS spectra to determine reddenings, electron temperatures and den-sities, and N and O abundances for the three nebulae. For R143 our derived abundances indicate thatthe region we observed to the south of the star is 30 Doradus H II gas, since it shows a typical LMCH II region N/O ratio. For R127 we Ðnd that N is enriched by a factor of 10.7^ 2.2, and O is depletedby a factor of 2.0 ^ 1.0, with N/O \ 0.89^ 0.40. For the S119 nebula we do not have a secure electrontemperature, but Ðnd N/O \ 1.41È2.45, similar to the value found for R127. We compare the nebularabundances to the expected surface abundances of LBVs and discuss the likely stellar evolutionary stateat the time of nebular ejection. If the atmospheres of LBVs consist of CNO-processed material, thisimplies that the event that formed the nebula took place before or at the very start of the LBV phase.
Comparison of the observed nebular abundances with other objects shows that the abundance patternfor the R127 nebula is remarkably similar to that determined for the inner ring of SN 1987A, which isthought to be composed of red supergiant (RSG) wind material. This coincidence, together with theobserved low expansion velocity, suggests that the nebula was once the CN-processed convectiveenvelope of an RSG. We consider whether the R127 nebular parameters can be reproduced with theevolutionary models of Meynet et al., and we Ðnd that the pre-LBV mass loss has to be low enough forredward evolution such that a surface N/O D 1 is achieved while the star is a cool supergiant inside theHumphreys-Davidson limit. Our Ðndings are broadly in accord with the model of Stothers & Chin thatincorporates a brief RSG phase. We also consider the possibility of a pseudo-RSG phase by discussingthe suggestion that a star in a super-Eddington condition may develop a very extended outer convectiveenvelope that may become detached. We also present a coarse analysis of the FOS stellar spectropho-tometry using the Q-method to estimate reddenings and spectral types, and we compare our results tomore sophisticated methods.Subject headings : circumstellar matter È ISM: abundances È ISM: kinematics and dynamics È
Magellanic clouds È stars : early-type È stars : evolution
1. INTRODUCTION
Luminous blue variable stars (LBVs ; areConti 1984)evolved massive supergiants that exhibit irregular photo-
1 Based on observations with the NASA/ESA Hubble Space Telescope,obtained at the Space Telescope Science Institute, which is operated byAURA for NASA under contract NAS5-26555, and on observationsobtained at the European Southern Observatory, La Silla.
2 Department of Physics and Astronomy, University College London,Gower Street, London WC1E 6BT, UK; ljs=star.ucl.ac.uk,pac=star.ucl.ac.uk.
3 Space Telescope Science Institute, 3700 San Martin Drive, Baltimore,MD 21218 ; nota=stsci.edu, pasquali=stsci.edu, leitherer=stsci.edu,clampin=stsci.edu.
4 Affiliated with the Astrophysics Division, Space Science Departmentof the European Space Agency.
metric and spectroscopic variations. Their properties havebeen reviewed in a recent proceedings & Lamers(Nota
It is generally accepted that LBVs represent a brief1997).transition phase in the evolution of an O star to a Wolf-Rayet (W-R) star. In the H-R diagram, the most luminousLBVs (e.g., g Car, AG Car) are observed to lie above and tothe left of the Humphreys-Davidson (H-D) limit (L /L
_º
5.8 ; & Davidson suggesting an imme-Humphreys 1979),diate O star progenitor, while other less luminous LBVs(e.g., HR Car, HD 160529) are below this limit and prob-ably had red supergiant (RSG) precursors. Currently thereare Ðve conÐrmed and Ðve candidate LBVs in the Galaxy,six conÐrmed LBVs in the LMC, and another 20 in LocalGroup galaxies & Davidson(Humphreys 1994).
278
EVOLUTION OF MASSIVE STARS IN LMC 279
Another group of stars that lie near the H-D limit are theOfpe/WN9 stars, which are now believed to represent theminimum or quiescent state of LBVs. The Ofpe/WN9 starswere recognized as a distinct class of stars by Walborn
since their spectra show both Of characteristics and(1977)late-WN low-ionization emission features. &BohannanWalborn identiÐed 10 such stars in the LMC. The(1989)link between Ofpe/WN9 stars and LBVs was establishedwhen the prototype Ofpe/WN9 star R127 brightened andits spectrum evolved to that of a B emission-line supergiant
et al. and then to a peculiar A supergiant, spec-(Stahl 1983)troscopically similar to the LBV S Dor et al.(Wolf 1988).Quantitative analyses of Ofpe/WN9 stars (Crowther,Hillier, & Smith & Smith et al.1995 ; Crowther 1997 ; Nota
et al. show that their H/He ratios are1996c ; Pasquali 1997)almost identical to those measured in LBVs, furtherstrengthening the idea that Ofpe/WN9 stars are quiescentLBVs. In addition, et al. and &Crowther (1995) CrowtherSmith propose that the LMC Ofpe/WN9 stars(1997)should be reclassiÐed as WN9È11 stars, since their spectraform a natural extension to the WN sequence at lower exci-tation. et al. and et al. exploreNota (1996c) Pasquali (1997)the relationship between Ofpe/WN9 stars and Of and WNstars. They Ðnd that their stellar and wind propertiessuggest they are transition objects between the Of andhydrogen-deÐcient WN stars.
Of the 10 conÐrmed and candidate LBVs known in theGalaxy, all but one have circumstellar nebulae with sizestypically of 10AÈ30A & Clampin These shells(Nota 1997).are thought to be composed of stellar material ejectedduring one or more giant eruptions of the type observedfrom 1837È1860 for g Car. In the LMC, circumstellarnebulae associated with LBVs and Ofpe/WN9 stars areexpected to be just a few arcseconds across and thereforedifficult to resolve directly from the ground. Consequently,most nebulae have been detected by spectroscopic means.In total, six out of the original 10 Ofpe/WN9 stars listed by
& Walborn have nebular lines superposedBohannan (1989)on their stellar spectra, and of these three have resolvedshells & Clampin The small angular sizes of(Nota 1997).these nebulae preclude any detailed analysis because of thebrightness contrast between the central star and nebula andthe limited angular resolution of ground-based images.Instead, work has focussed on dynamical, morphological,and chemical analyses of Galactic LBV nebulae (e.g.,
& Van Drom et al. NotaHutseme� kers 1991 ; Johnson 1992 ;et al. et al. Studies of Galac-1995, 1996b, 1997 ; Smith 1997).tic LBV nebulae have also encountered fundamental prob-lems, since they tend to be faint, heavily obscured, and dustyobjects. As a consequence, it is difficult to detect the Oabundance diagnostic line [O II] j3727, and the nebularspectrum is contaminated by the dust-scattered stellar light.In addition, the uncertain distances to most Galactic LBVnebulae hampers the comparison of absolute nebularparameters.
With the advent of the Hubble Space Telescope (HST ), itis now possible to obtain optical spectroscopy of nebulaearound evolved massive stars in the LMC. Spectroscopy ofLMC nebulae o†ers the advantages that the nebulae arelightly reddened and at a known distance. In addition, theabsolute Ñux calibration and hence relative Ñuxes of thenebular emission lines are much more reliably determined.In this paper we present Faint Object Spectrograph (FOS)observations of the nebulae surrounding two LBVs (R127
and R143) and one Ofpe/WN9 star (S119). Walborn (1982)Ðrst suggested that R127 had an expanding shell since itsoptical spectrum shows velocity-doubled nebular emissionlines. successfully detected a shell associatedStahl (1987)with R127 by direct imaging and careful subtraction of thestellar point-spread function (PSF). More recently, Clampinet al. presented resolved ground-based corono-(1993)graphic images of the nebula surrounding R127 showingthat it is diamond-shaped with two bright lobes separatedby D5A. et al. Ðrst proposed that R143, aParker (1993)member of the 30 Dor association, should be classiÐed as anLBV on the basis of its photometric and spectroscopicvariability. They also noted that it was associated withnebulosity. A ground-based coronographic image of R143was presented by et al. and is discussed in moreNota (1995)detail in this paper. et al. Ðrst reported theNota (1994)detection of nebular lines associated with S119. Theyderived an expansion velocity of 25 km s~1 and presented acoronographic image that showed a circumstellar nebulawith a bipolar morphology.
The primary motivation for obtaining the HST obser-vations is to carry out abundance analyses of the nebulae. Ifthese nebulae were formed by the bulk ejection of stellarmaterial, then their abundances should reÑect the surfacecomposition of the central star at the time it erupted.Recently, Mac Low, & Langer haveGarci� a-Segura, (1996)followed the hydrodynamical evolution of the circumstellarenvironment of a 60 star as it evolves from an O star toM
_an LBV and then to a W-R star. They predict that the LBVnebula will have CNO abundances close to CNO equi-librium values with nitrogen (N) enhanced by a factor of 13and carbon (C) and oxygen (O) depleted by factors of 23and 18, respectively. In a recent abundance study of the AGCar nebula, et al. Ðnd that it is composed ofSmith (1997)mildly processed material with N enhanced by a factor of4.5. They suggest that the AG Car nebula may represent thehydrogen-rich envelope of an RSG, and thus that AG Carmay have experienced a brief RSG phase despite its highluminosity. It is therefore of interest to determine the N andO abundances for a sample of LMC nebulae, and in partic-ular for the nebula associated with R127, since this LBV isthe LMC twin of AG Car with near-identical luminositiesand H/He ratios (Crowther 1997a).
We also present ground-based medium-resolution long-slit spectroscopy of the nebulae surrounding R127 andR143 obtained at the European Southern Observatory(ESO/NTT), La Silla, Chile. For R127, we aim to investi-gate further the nebular dynamics by obtaining completespatial coverage of the nebula. For R143, we discuss indetail a coronographic image already published in etNotaal. and use it, together with the long-slit spectros-(1995)copy, to identify the true associated nebula within thecomplex 30 Dor region.
2. OBSERVATIONS AND DATA REDUCTION
2.1. HSTFOS spectra of the three LMC nebulae surrounding
R127, S119, and R143 were obtained with HST duringCycle 5 (proposal ID: 6110). The details of these obser-vations are given in A slit of size wasTable 1. 2A.0 ] 0A.25chosen, because we found from simulations that this aper-ture maximized the nebular Ñux and minimized the stellarcontamination. We used the G400H and G570H gratings to

280 SMITH ET AL. Vol. 503
record spectra over the wavelength ranges of 3235È4781 Óand 4569È6818 with spectral resolutions of 2.9 and 4.0Ó Ó,respectively.
To execute the observations, we did a four-stage peak-upon the central star, using successively the and4A.3, 1A.0, 0A.3,
apertures. We then took a stellar spectrum at0A.25 ] 2A.0the central position and at six positions (^0A.2, 0A.4, 0A.6)along the slit with the aim of using the spectra to map thepixel-to-pixel nonuniformities. We then o†set to the nebularposition as listed in Images of the three nebulaeTable 1.showing the exact slit positions are given in TheFigure 1.nebula surrounding R127 is diamond shaped with twobright lobes to the east and west of the central star
et al. We chose to position the FOS slit on(Clampin 1993).the brightest part of the eastern lobe located 2A from R127
The nebula associated with S119 is asymmetrical(Fig. 1a).with a bright lobe extending up to 4A northeast from thecentral star et al. The slit was positioned across(Nota 1994).this bright lobe R143 is situated in the 30 Dor H II(Fig. 1b).region and is associated with complex knots and Ðlaments.Close to R143 there are three curved Ðlaments or ““ Ðngers ÏÏto the north that end in bright condensations(Fig. 1c)
et al. et al. There is also structure(Parker 1993 ; Nota 1995).to the south of R143, and we placed the FOS slit across oneof the Ðlaments D20A southwest of the star, as shown inFigure 1c.
The FOS spectra were reduced using the standard pipe-line reduction software STSDAS, which is part of IRAF.Initially, we hoped to Ñat-Ðeld the nebular spectra toimprove the signal-to-noise ratio by using the spectra of thecentral star obtained at various o†sets along the slit. Onexamination of these spectra, however, we discovered thatthe data at o†sets of and had a peculiar shape]0A.6 ]0A.4and much lower Ñux levels. We believe that this e†ect mayhave been caused by the o†setting not being strictly parallelto the slit length, so that at the largest positive o†sets, thestar was mostly outside the slit area. To obtain representa-tive stellar spectra, we have taken the mean of the fourspectra recorded at o†sets of 0A and for S119 and^0A.2R143 (total exposure\ 240 s), since these data are identicalwithin the noise. For R127, we found that there were smallvariations in the spectra obtained at the o†set com-^0A.2pared to the two at the central position, and thus we haveonly used the spectra obtained at 0A (exposure time \ 120 s)to form the mean spectrum. The stellar spectra are dis-cussed in ° 5.
The nebular spectra of R127 and S119 show, as expected,some contamination from the wing of the stellar PSF. Byscaling the stellar spectrum to match the nebular contin-uum caused by the scattered light, we Ðnd that the wing ofthe PSF is 0.04% of the central Ñux for both objects, which
have a similar o†set of D2A. No correction for the R143nebular spectrum was necessary, because the slit was o†setby D20A from the central star.
2.2. T he Ground-based Observations2.2.1. T he Coronographic Images
The coronographic observations of S119 are fullydescribed in et al. In summary, high-resolutionNota (1994).images were obtained with the STScI NTT Coronographmounted on the ESO New Technology Telescope, La Silla,on 1993 February 12. The seeing conditions were excellent
and images were taken in the light of [N II](^0A.75), (jc\
6584.6 *j\ 23.8 and Ha. Although the light of S119Ó, Ó)was not occulted by a central mask, the contrast in thecircumstellar region was enhanced by pupil apodization.The coronographic observations of R127 have already beenpublished and described in detail in et al.Clampin (1993) :R127 was observed with the Johns Hopkins AdaptiveOptics Coronograph on 1991 December 27 at the DuPonttelescope at Las Campanas Observatory. High-resolutionimages were taken in the light of Ha ] [N II] (6560 Ó,*j\ 110 with a plate scale of pixel~1, in excellentÓ), 0A.095seeing conditions Coronographic observations of(0A.7).R143 were taken with the STScI NTT Coronograph(Fig. 2)mounted on the ESO New Technology Telescope, La Silla,on the night of 1993 February 10. Images were taken in thelight of Ha and the V band. R143 was occulted by a 3Awedge oriented at a position angle of 135¡.
All coronographic images have been reduced andanalyzed using the imaging processing system IRAF. Thebasic reduction consisted of bias subtraction, cosmic-rayremoval, dark subtraction, and Ñat-Ðeld normalization. Inthe reduced images of R127 and R143, the coronographicwedge was software masked by setting all the occultedpixels to zero. Additional reduction steps were performed inthe case of R127, for which it was necessary to subtract fromthe image both the central star and the visual companionlocated at ^3A in the northwestern region. We refer to
et al. for a detailed description of the pro-Clampin (1993)cedure. In the case of S119 and R143, it was not necessary tosubtract the central star. All images were Ñux calibrated byapplying the sensitivity function derived from observationsof standard stars interleaved with the scientiÐc obser-vations.
2.2.2. T he Medium-Resolution L ong-Slit Spectra
We observed R143 and S119 with the ESO NTT (LaSilla) and the high-resolution spectrograph EMMI on thenight of 1994 December 25. The observations were per-formed with EMMI grating 6 in the red low-dispersion(RILD) mode. Spectra were obtained in the wavelength
TABLE 1
JOURNAL OF HST /FOS OBSERVATIONS
OFFSET EXPOSURE TIME
DATE *a *d POSITION ANGLE G400H G570HOBJECT (UT) (arcsec) (arcsec) (deg) (minutes) (minutes)
R143 . . . . . . 1995 Dec 10 18.2 W 22.2 S 271.4 50 140R127 . . . . . . 1996 Jan 31 1.9 E 0.2 N 324.0 50 134S119 . . . . . . 1996 Sep 15 1.8 E 1.3 N 204.6 50 140
NOTE.ÈR143\ HDE 269929 ; R127\ HDE 269858\ S128 \ Sk[69¡220 \ BE 397 ;S119 \ HDE 269687 \ Sk[69¡175 \ BE 335.

No. 1, 1998 EVOLUTION OF MASSIVE STARS IN LMC 281
FIG. 1.È(a) Ha ] [N II] image of R127 obtained with the(11A.8] 11A.9)Johns Hopkins Adaptive Optics Coronograph (reproduced from Clampinet al. (b) [N II] image of S119 obtained with the STScI1993). (11A.1] 13A.3)Coronograph (reproduced from et al. (c) Ha image (54A ] 54A)Nota 1995).of R143 obtained with EMMI. The slit is indicated in the bottom right-hand corner. In each image the position of the FOS slit (1.7 ] 0.2 arcsec2)is shown; the details of the positions are given in Table 1.
range 5940È8325 with a dispersion of 1.2 pixel~1. TheÓ ÓCCD detector TK2048EB (ESO CCD 36) was used inRILD mode, yielding a plate scale of pixel~1. The0A.27complete description of the observations is provided in
We selected a slit width of to match the prevail-Table 2. 1A.5ing seeing conditions. The slit length was 330A. For R143,spectra were obtained at two di†erent locations : on the star,and with the long slit positioned at 4A west The slit(Fig. 2).was oriented north-south for these observations. Cali-bration frames were obtained to permit the correction forbias and Ñat-Ðeld variations. For S119, the slit was alsooriented along the north-south direction, and spectra weretaken on the star and at positions 3A east and 3A west.Spectrophotometric calibration was provided by obser-vations of the standard star Hiltner 600. In order to derivean accurate wavelength calibration, we obtained quasi-simultaneous comparison spectra of ThAr.
In addition, EMMI was used in imaging mode to recordtwo deep images covering a wider Ðeld of view of 4@] 4@around R143, for the purpose of studying the morphologyof the ambient H II region. The Ðlters used were centered onHa and [O III]. The EMMI image taken in the light of Hahas a plate scale of pixel~1 and is shown in0A.27 Figure 3.
We observed R127 on the night of 1996 January 27. Adi†erent EMMI conÐguration was adopted, with grating 6in REMD mode (medium dispersion) and a slit width of 1A.Long-slit spectra were obtained in the wavelength range6245È6880 with a dispersion of 0.3 pixel~1 and anÓ Óe†ective resolution of 1 For this target our objective wasÓ.to achieve complete spatial coverage of the nebula, andtherefore we positioned the slit at di†erent locations,namely on the star, at 2A north, 4A north, 2A south, and 4Asouth. The slit was oriented east-west in these observations.Then we took one more long-slit spectrum on the star, withthe long slit oriented north-south (Fig. 4).
All long-slit spectra were reduced using the packageLONGSLIT in the image processing system IRAF. First,we removed the cosmic rays from the areas of interest in allframes. Then we subtracted bias and dark current. Theresulting two-dimensional images were then Ñat-Ðelded.The background in the two-dimensional images wasmodeled by a low-order polynomial surface and removed.One-dimensional spectra were extracted in correspondence
TABLE 2
JOURNAL OF GROUND-BASED OBSERVATIONS
EMMI Long Slit
Date Grating O†set Exposure TimeObject (UT) (or Filter) (arcsec) (s)
R143 . . . . . . 1994 Dec 25 6 0 300R143 . . . . . . 1994 Dec 25 6 4 W 300S119 . . . . . . 1994 Dec 25 6 3 W 300S119 . . . . . . 1994 Dec 25 6 3 E 300R127 . . . . . . 1996 Jan 27 6, 4 0 (EW) 150R127 . . . . . . 1996 Jan 27 6, 4 0 (NS) 600R127 . . . . . . 1996 Jan 27 6, 4 2 N 200R127 . . . . . . 1996 Jan 27 6, 4 4 N 200R127 . . . . . . 1996 Jan 27 6, 4 2 S 400R127 . . . . . . 1996 Jan 27 6, 4 4 S 400
EMMI Imaging
R143 . . . . . . 1994 Dec 25 Ha 3 ] 50R143 . . . . . . 1994 Dec 25 [O III] 2 ] 50
282 SMITH ET AL. Vol. 503
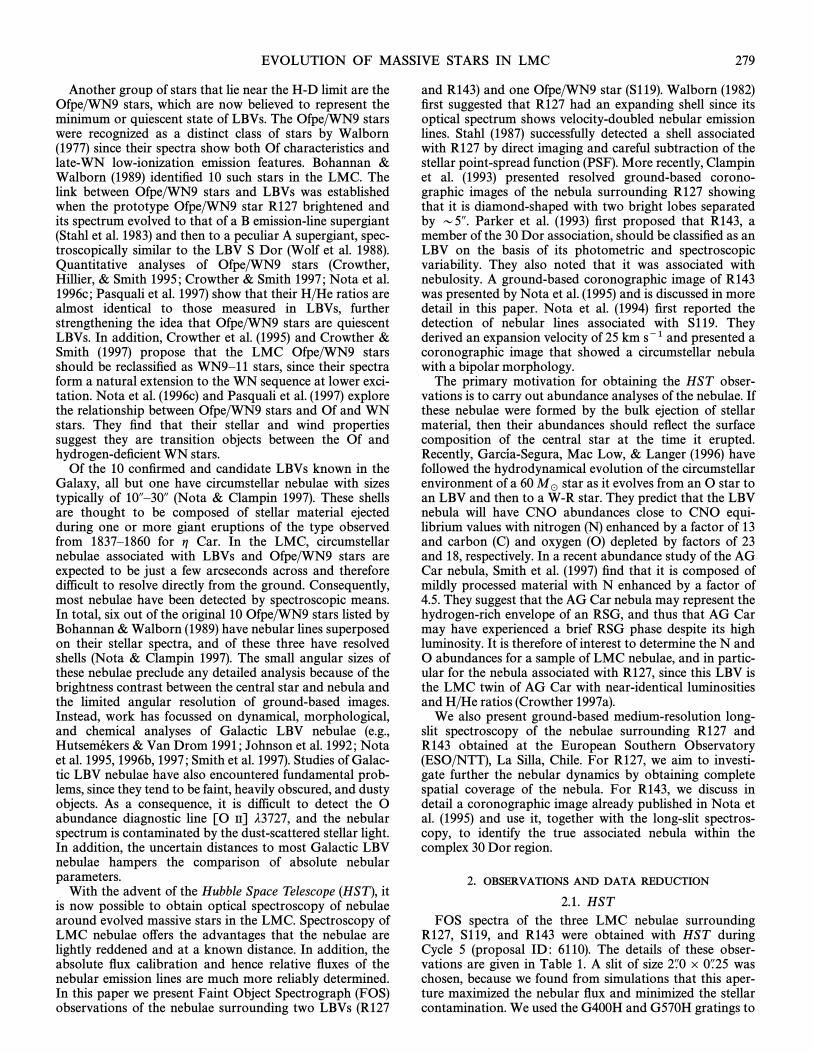
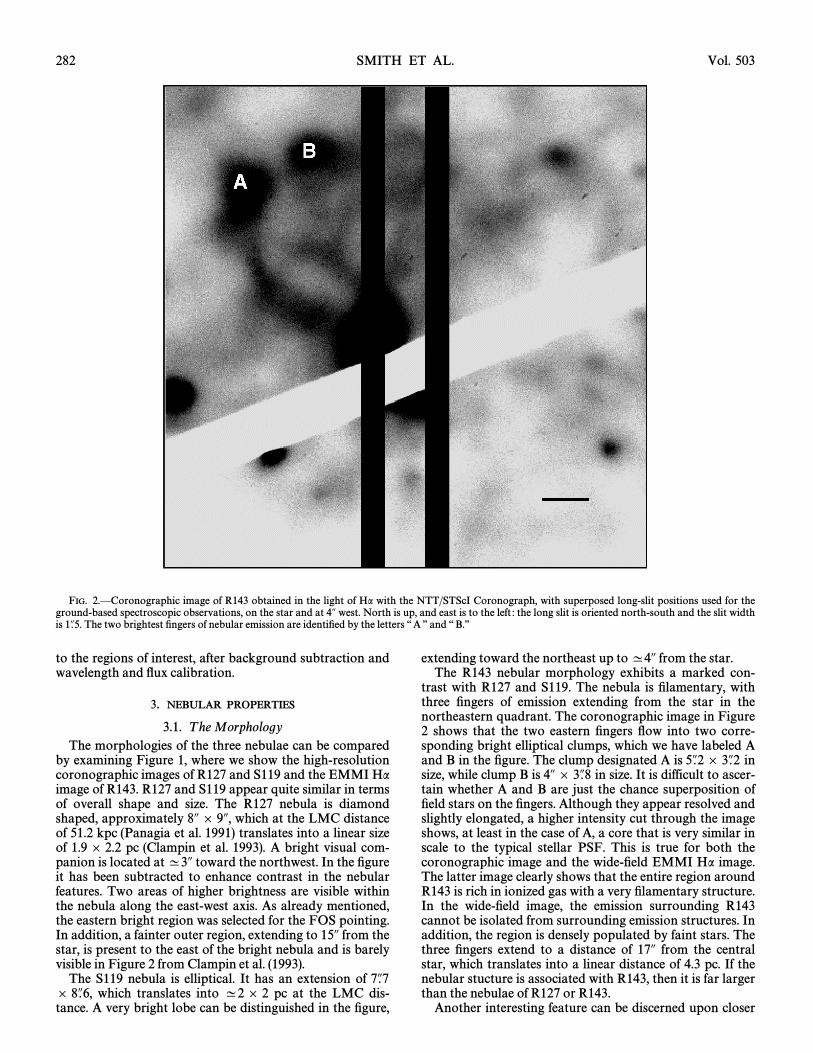
FIG. 2.ÈCoronographic image of R143 obtained in the light of Ha with the NTT/STScI Coronograph, with superposed long-slit positions used for theground-based spectroscopic observations, on the star and at 4A west. North is up, and east is to the left : the long slit is oriented north-south and the slit widthis The two brightest Ðngers of nebular emission are identiÐed by the letters ““ A ÏÏ and ““ B.ÏÏ1A.5.
to the regions of interest, after background subtraction andwavelength and Ñux calibration.
3. NEBULAR PROPERTIES
3.1. T he MorphologyThe morphologies of the three nebulae can be compared
by examining where we show the high-resolutionFigure 1,coronographic images of R127 and S119 and the EMMI Haimage of R143. R127 and S119 appear quite similar in termsof overall shape and size. The R127 nebula is diamondshaped, approximately 8A ] 9A, which at the LMC distanceof 51.2 kpc et al. translates into a linear size(Panagia 1991)of 1.9] 2.2 pc et al. A bright visual com-(Clampin 1993).panion is located at ^3A toward the northwest. In the Ðgureit has been subtracted to enhance contrast in the nebularfeatures. Two areas of higher brightness are visible withinthe nebula along the east-west axis. As already mentioned,the eastern bright region was selected for the FOS pointing.In addition, a fainter outer region, extending to 15A from thestar, is present to the east of the bright nebula and is barelyvisible in Figure 2 from et al.Clampin (1993).
The S119 nebula is elliptical. It has an extension of 7A.7which translates into ^2 ] 2 pc at the LMC dis-] 8A.6,
tance. A very bright lobe can be distinguished in the Ðgure,
extending toward the northeast up to ^4A from the star.The R143 nebular morphology exhibits a marked con-
trast with R127 and S119. The nebula is Ðlamentary, withthree Ðngers of emission extending from the star in thenortheastern quadrant. The coronographic image in Figure
shows that the two eastern Ðngers Ñow into two corre-2sponding bright elliptical clumps, which we have labeled Aand B in the Ðgure. The clump designated A is in5A.2 ] 3A.2size, while clump B is in size. It is difficult to ascer-4A ] 3A.8tain whether A and B are just the chance superposition ofÐeld stars on the Ðngers. Although they appear resolved andslightly elongated, a higher intensity cut through the imageshows, at least in the case of A, a core that is very similar inscale to the typical stellar PSF. This is true for both thecoronographic image and the wide-Ðeld EMMI Ha image.The latter image clearly shows that the entire region aroundR143 is rich in ionized gas with a very Ðlamentary structure.In the wide-Ðeld image, the emission surrounding R143cannot be isolated from surrounding emission structures. Inaddition, the region is densely populated by faint stars. Thethree Ðngers extend to a distance of 17A from the centralstar, which translates into a linear distance of 4.3 pc. If thenebular stucture is associated with R143, then it is far largerthan the nebulae of R127 or R143.
Another interesting feature can be discerned upon closer

No. 1, 1998 EVOLUTION OF MASSIVE STARS IN LMC 283
FIG. 3.ÈEMMI image of a wide Ðeld centered on R143. The image has been taken in the light of Ha ; north is up, and east is to left. The area shown is4@] 4@, and one pixel corresponds to R143 is at pixel position (1000, 800).0A.27.
inspection of both the coronographic image of R143 and ofthe EMMI image : the central star appears elongated. In thecoronographic image, most of the light from the central staris suppressed by the occulting bar ; however, the shape ofthe wings of the stellar PSF is very di†erent from the PSFsof the Ðeld stars. This is conÐrmed by the EMMI image :R143 is elongated in the north-south direction, and theextension of the elongation is corresponding to a^5A.2,linear scale of 1.3 pc. Again, it is very difficult to ascertainfrom the ground-based images whether the elongation isassociated with the star or is rather due to the chance super-position of features belonging to the underlying H II region.As we will discuss in more detail later, we have used theinformation contained in the long-slit spectra to establish ifthe elongation is e†ectively associated with the star or not.We Ðnd that while most of the emission concentrated in thenorthern and southern regions of the elongation has char-acteristics similar to the 30 Dor region, in terms of dynami-cal properties and chemical abundances, there is a smallcompact region, approximately 2A in size, located to thenorth of the star, and at an approximate distance of 1A.8(0.45 pc), that appears to be composed of nitrogen-enrichedmaterial most likely ejected from the star in an evolvedstage of its evolution. This feature is barely visible in Figure
which is an enlargement of the inner regions of R143.5,
3.2. T he KinematicsWe have used the ground-based long-slit spectra to inves-
tigate the kinematical properties of these nebulae and toreÐne the available estimates for their dynamical ages. ForS119 the resolution of the present ground-based data doesnot allow us to improve on the original Ðndings publishedby et al. and therefore, we will concentrate onlyNota (1994),on R127 and R143.
Summarizing the results for S119, et al.Nota (1994)found that the star is surrounded by a nebula that is cur-rently expanding at a velocity of 25 km s~1. With theassumption that the velocity has been constant since theejection, the S119 nebula has a dynamical age of 5] 104 yr.Although we cannot improve the radial velocity measure-ments, we can conÐrm the peculiar systemic velocity of S119derived by et al. which is very di†erent fromNota (1994),the other LMC target stars. From the current data set weÐnd that S119 has a velocity of ]118 km s~1, in agreementwith our previous Ðndings. The question is still open on thelocation of S119, which could be placed in the front part ofthe LMC.
3.2.1. R127
For R127, we have studied the dynamics in severalnebular positions : namely on the star, at 2A and 4A north

284 SMITH ET AL. Vol. 503
FIG. 4.ÈCoronographic image of R127 with superposed slit positions used in the ground-based long-slit observations, on the star, at 2A north, 4A north, 2Asouth, and 4A south. The image has been taken in the light of Ha ] [N II]. North is up, and east is to left. The slit width is 1A.
and at 2A and 4A south. The slit was oriented east-west forthese observations, as illustrated in In addition, aFigure 4.long-slit spectrum was taken with the slit oriented north-south and centered on the star. In the wavelength range6245È6880 we observe several nebular emission lines,Ó,namely [N II] jj6548, 6584 ; Ha ; [S II] jj6717, 6731. Theyare all extended and show the same overall velocity struc-ture, indicative of an expanding motion of the nebula.However, we derived the radial velocity map from the linesof Ha, [N II] j6584, and [S II] j6717. The velocities derivedfrom the three lines have been averaged to produce the mappresented in Figure 6.
For each slit position we binned the spectrum by a factorof 4 along the spatial direction (corresponding to 1A, since 1
in order to further improve the S/N in thepixel\ 0A.27)lines, and we extracted a spectrum from each bin. We thenÐtted the line proÐles in each spectrum with one or twoGaussians, depending on the FWHM of the line. For thisspectral conÐguration, we have an instrumental line proÐleof 1 FWHM, corresponding to 45 km s~1. For all theÓlines with a FWHM larger than the instrumental proÐle, weattempted a two-component Ðt. We recorded the peakwavelength and FWHM value of each ascertained com-ponent as a function of position with respect to the star. Thepeak wavelength for each line was then converted to radialvelocity, and the resulting value was corrected to the helio-centric frame of reference.
shows the radial velocity maps derived for allFigure 6the pointed positions. The heliocentric radial velocities,expressed in km s~1, are plotted here as a function of posi-
tion with respect to the star, in arcseconds, east to west. Thestellar velocity has been measured to be ]269 km s~1 fromthe stellar absorption lines Si II jj6347.1, 6371.4 We haveÓ.also measured the velocity of the underlying H II region tobe ^]280 km s~1.
The radial velocity plots indicate that a small expandingshell is present that is only seen in the two pointings cen-tered on the star, with the slit oriented east-west or north-south. In these two directions the spatial extent of thismotion is ^5A, and both the receding and approachingparts are detected, and the spatial center corresponds to thestar. In order to provide more quantitative information onthe nebular expansion, we have modeled the observedradial velocity Ðeld by assuming that our data points orig-inate from the surface of an expanding sphere of angularradius R, expanding at a velocity so thatV
r,
(Va,d [ V0)2 \ Vr2[R2[ (a [ a0)2[ (d [ d0)2]/R2 ,
where is the heliocentric radial velocity of the center ofV0the expansion A least-squares Ðt to the sample ofa0, d0.points yields : km s~1, km s~1,V0\]257 Vr\ 29 ^ 1
We have plotted in this model (openR\ 2A.5. Figure 6circles) overlaid on the observed radial velocities ( Ðlledcircles). Within the errors associated with the spectralresolution of our data, the agreement between the data andthe model is quite good.
The spectra also reveal evidence for another motionoutside of this expanding shell that is visible at all pointings,except possibly the location at 4A south. It is difficult toassess the true kinematics of this structure, given the

No. 1, 1998 EVOLUTION OF MASSIVE STARS IN LMC 285
FIG. 5.ÈEnlargement of the inner region of the coronographic image of R143. The compact region of nitrogen-enriched material is identiÐed by a cross.North is up, and east is to the left.
resolution of our spectra and its faintness compared to thebright inner shell. Assuming that it is also an expandingshell, we Ðnd that within the errors, a least-squares Ðt to thedata points (most of which are blueshifted) gives V0\ ]272km s~1, km s~1, This Ðt, of poorerV
r\ 25 ^ 2 R\ 7A.5.
quality compared to that for the inner shell, is also shown inThe size of this possible outer shell (^15A) and itsFigure 6.
location matches well the location of the nebula deÐned inthe coronographic images. Although the spatial centerscoincide, the systemic velocities of the two shells are di†er-ent.
Using the dimensions derived from the coronographicimages, it is possible to estimate the dynamical timescale ofthe R127 nebular components. The inner nebula, which hasa major axis of 0.6 pc, yields a dynamic timescale of2.1] 104 yr, adopting the inner nebulaÏs expansion velocityof 29 km s~1. The outer nebula has a major axis of 1.9 pcand yields a dynamical timescale of 7.3] 104 yr, adoptingthe nebulaÏs expansion velocity of 25 km s~1.
3.2.2. R143
We applied the same procedure to the spectra of R143,which were taken with the long slit oriented north-southand placed on the star and on the nebula at 4A west. In thewavelength range 5940È8325 we observe several nebularÓemission lines, [N II] jj6548, 6584 ; Ha ; [S II] jj6717, 6731,which are also extended. We derived the radial velocity mapfrom the line of [N II] j6584 In the Ðgure we have(Fig. 7).marked the position of the stellar radial velocity, measuredto be ]348 km s~1 from the stellar absorption lines Si II
jj6347.1, 6371.4. In the case of the R143 nebula, the overalldistribution of the nebular radial velocities is Ñat, indicatingthat the prevailing motion observed is associated with theunderlying H II region. In the region corresponding to thethree Ðngers (0AÈ20A north), we do not notice any peculiarmotion. From a dynamical point of view, there is no di†er-ence between the so-called R143 nebula and the surround-ing H II region. This Ðnding supports our overall conclusion

286 SMITH ET AL. Vol. 503
FIG. 6.ÈRadial velocity maps of R127 at di†erent nebular positions, derived from the Ha, [N II], and [S II] line proÐles. Heliocentric radial velocities areplotted as a function of position with respect to R127, in arcseconds, east to west. The observational data are represented by Ðlled circles, and the sphericalsymmetry models by crosses (inner shell) and open circles (outer shell).
FIG. 7.ÈRadial velocity maps of R143 at di†erent nebular positions,derived from the [N II] j6584 line proÐle. Heliocentric radial velocities areplotted as a function of position with respect to R143, in arcseconds, east towest.
that the three Ðngers are not associated with R143, but theyare part of the 30 Doradus region.
However, a close inspection of in the regionsFigure 7very close to the star reveals a peculiar motion isolated to avery small region of space, located at a distance smallerthan 5A from the star. This motion is especially visible in thespectrum taken on the star, with the slit oriented north-south upper panel), but is also detected in the spec-(Fig. 7,trum taken on the star and with the slit oriented east-west
lower panel). The motion appears to develop in the(Fig. 7,northern region, with a maximum di†erential velocity withrespect to the star of ^130 km s~1. It is interesting to noticethat this region coincides with the inner region of the northelongation that we have detected in the coronographicimages. As we will discuss in more detail later on this(° 4),small compact region has the chemical characteristics ofejected material, and we can isolate its motion, which isblueshifted by ^130 km s~1. Given the size of the region of^2A, its distance of and its expansion velocity, we can1A.8,speculate that the clump had possibly been ejected some3.7] 103 yr ago. This value represents a lower limit to thedynamical age, since we can only estimate a component ofits expansion velocity.
With the spatial coverage and spectral resolution of ourspectroscopic data, it is not possible at this time to provideany accurate evaluation of the shape of such a feature. Thepresence of an individual clump is a very di†erent Ðndingcompared to the distribution of ejected material usuallyobserved around LBVs, in the Galaxy and in the LMC. In

No. 1, 1998 EVOLUTION OF MASSIVE STARS IN LMC 287
all known cases, the ejected material is contained in shells,with very similar morphologies that range from spherical tobipolar and with very similar properties in terms of size andexpansion velocities. The expansion velocity of the R143clump is at the high end of the observed spectrum, but stillquite consistent with observations of other LBV nebulae(e.g., HR Carinae ; et al. The dynamical age alsoNota 1997).Ðts very well with the current LBV scenario.
Has R143 ejected a shell ? On the basis of the uncer-tainties associated with our data, we cannot exclude thepossibility that the material ejected by R143 may be distrib-uted in a shell in very close proximity to the central star,although only very high spatial resolution direct obser-vations, or spectroscopic observations with a Ðner spatialgrid, will be able to establish whether this is truly the case.
3.3. L ine Intensities and ReddeningLine Ñuxes have been measured by Ðtting Gaussian pro-
Ðles to all the emission lines present in the FOS spectra ofthe R127, S119, and R143 nebulae. The observed Ñuxes[F(j) relative to Hb \ 100] with the errors provided by theGaussian Ðtting procedure are given in The spectraTable 3.of the R127 and S119 nebulae are very similar in that theyhave strong [N II] lines, reasonably strong [O II] and [S II],and no detectable [O III]. The diagnostic line [N II]T
ej5755 is detected at the 6 p level in the R127 nebular spec-trum but is not present in the S119 nebular spectrum. In
we therefore give the 3 p upper limit to the [N II]Table 3j5755 line Ñux for S119 using the observed signal-to-noiseratio of the continuum near the wavelength of the line. Theoverall spectral appearance and low excitation of the R127and S119 nebulae are very similar to the nebulae surround-ing the Galactic LBVs AG Car et al. and HR(Smith 1997)Car et al. which have very strong [N II] lines(Nota 1997),
and no [O III]. In we show the FOS spectra of theFigure 8R127, S119, and R143 nebulae covering the Ha, [N II], and[S II] emission lines. It is evident that the spectrum of theR143 nebula is quite di†erent, having very weak [N II]j6584. In addition, strong [Ne III] and [O III] lines aredetected including the diagnostic [O III] j4363 lineT
e(Table 3).The reddening coefficient C(Hb) was determined for each
nebula using the observed ratios of Ha, Hc, and Hd to Hb.First, the emission-line ratios were corrected for the stan-dard Galactic foreground reddening of E(B[V ) \ 0.05,and then C(Hb) was determined using the LMC extinctionlaw of and the theoretical case B recombi-Howarth (1983)nation coefficients of & Storey TheHummer (1987).resulting total C(Hb) coefficients and the dereddened lineÑuxes [I(j) relative to Hb \ 100] are given in ForTable 3.the R127 nebula we Ðnd C(Hb) \ 0.23^ 0.04, orE(B[V ) \ 0.16^ 0.03. et al. deriveStahl (1983)E(B[V ) \ 0.20 for R127 assuming that it had the intrinsiccolor of an O9 supergiant at minimum. KoterDe (1993)Ðnds that this value is too large when comparing predictedand observed photometric variations and instead ÐndsE(B[V ) \ 0.12^ 0.03. The nebular reddening that wederive here is intermediate between these two publishedvalues and probably represents the most accurate value forthe reddening toward R127 because it is a direct determi-nation, with the only assumption being that the nebula andstar share the same reddening.
For the S119 nebula we Ðnd that the reddening is verylow and due entirely to the Galactic foreground reddeningof E(B[V )\ 0.05. This is in agreement with the Ðnding byNota et al. that S119 lies outside the main(1994, 1996c)body of the LMC. For the R143 nebula we determineC(Hb) \ 0.37^ 0.11, which translates to E(B[V ) \
TABLE 3
OBSERVED AND DEREDDENED LINE FLUXES FOR LMC NEBULAE
R127 S119 R143
jair ION F(j) I(j) F(j) I(j) F(j) I(j)
3727.42 . . . . . . . [O II] 23.22 ^ 1.76 27.84 ^ 2.11 15.17 ^ 0.94 16.95^ 1.05 137.32 ^ 3.58 185.82 ^ 4.853750.15 . . . . . . . H12 1.59^ 0.27 1.90 ^ 0.32 5.18 ^ 0.73 5.77^ 0.813770.63 . . . . . . . H11 1.85^ 0.24 2.20 ^ 0.29 5.68 ^ 0.49 6.32^ 0.543797.90 . . . . . . . H10 3.26^ 0.29 3.86 ^ 0.34 4.25 ^ 0.53 4.72^ 0.593835.39 . . . . . . . H9 5.02^ 0.33 5.89 ^ 0.38 6.37 ^ 0.54 7.04^ 0.593868.71 . . . . . . . [Ne III] 20.47^ 2.44 26.45 ^ 3.163889 . . . . . . . . . . . H8]He I 9.62^ 0.34 11.19 ^ 0.39 11.50 ^ 0.49 12.62^ 0.54 12.54 ^ 1.77 16.10 ^ 2.273968 . . . . . . . . . . . [Ne III]]Hv 17.18^ 2.16 21.52 ^ 2.713970.07 . . . . . . . Hv 14.20^ 0.31 16.28 ^ 0.35 13.95 ^ 0.42 15.19^ 0.544101.76 . . . . . . . Hd 23.27^ 0.25 26.08 ^ 0.28 26.97 ^ 0.53 28.97^ 0.57 22.33 ^ 2.08 26.92 ^ 2.504340.47 . . . . . . . Hc 48.41^ 0.36 52.18 ^ 0.39 47.28 ^ 1.05 49.58^ 1.10 42.12 ^ 2.20 47.58 ^ 2.494363.21 . . . . . . . [O III] 4.50^ 1.43 5.05 ^ 1.614861.33 . . . . . . . Hb 100.00^ 0.41 100.00 ^ 0.41 100.00 ^ 0.61 100.00^ 0.61 100.00 ^ 2.16 100.00 ^ 2.164958.92 . . . . . . . [O III] 139.85^ 2.21 137.04 ^ 2.165006.84 . . . . . . . [O III] 442.47^ 2.61 429.37 ^ 2.535199.08 . . . . . . . [N I] 4.27 ^ 0.16 4.09 ^ 0.165754.64 . . . . . . . [N II] 0.69 ^ 0.12 0.63 ^ 0.11 \1.04 \0.985875.67 . . . . . . . He I 0.92^ 0.26 0.83 ^ 0.23 1.98 ^ 0.32 1.84^ 0.30 13.92 ^ 1.67 11.69 ^ 1.456300.30 . . . . . . . [O I] 1.25^ 0.14 1.08 ^ 0.126548.03 . . . . . . . [N II] 62.69 ^ 1.63 53.10 ^ 1.38 75.78 ^ 1.55 67.97^ 1.396562.82 . . . . . . . Ha 347.59^ 1.65 294.10 ^ 1.39 305.71 ^ 1.89 273.97^ 1.69 399.63 ^ 5.65 306.13 ^ 4.326583.41 . . . . . . . [N II] 192.17 ^ 1.63 162.35 ^ 1.38 229.54 ^ 1.83 205.50^ 1.63 17.92 ^ 4.52 13.69 ^ 3.456716.47 . . . . . . . [S II] 18.82 ^ 0.28 15.74 ^ 0.24 9.52 ^ 0.35 8.47^ 0.31 22.47 ^ 2.96 16.89 ^ 2.236730.85 . . . . . . . [S II] 20.96 ^ 0.29 17.51 ^ 0.25 10.38 ^ 0.35 9.22^ 0.31 15.70 ^ 3.06 11.78 ^ 2.30Fobs(Hb)a . . . . . . 2.20] 10~14 5.83] 10~15 7.05] 10~16C(Hb) . . . . . . . . . 0.23^ 0.04 0.15^ 0.09 0.37^ 0.11
a In ergs s~1 cm~2 integrated over the actual slit area of 1A.71 ] 0A.21.

288 SMITH ET AL. Vol. 503
FIG. 8.ÈFOS spectra of the nebulae surrounding R127, S119, and R143from 6500È6750 covering the [N II] and [S II] doublets and Ha.Ó
0.26^ 0.07. et al. derive a much higher valueParker (1993)of E(B[V )\ 0.65 from the observed colors of R143 andassuming that it has the intrinsic colors of a normal earlysupergiant. Ðnds that E(B[V ) ranges fromParker (1992)0.3 to 0.7 for 15 stars within 25A of R143. Given that theFOS slit position is D20A from R143, the nebular reddeningthat we derive appears to be consistent with previous esti-mates for this region of 30 Doradus. In we use the stellar° 5spectra to determine color excesses for comparison with thenebular reddenings derived in this section.
3.4. Physical Parameters and AbundancesElectron densities and temperatures have beenn
eTederived from the FOS spectra of the three LMC nebulae
from the dereddened [S II] j6717/j6731 and [N II] j6583/j5755 (R127 and S119) or [O III] j5007/j4363 (R143) lineratios. The resulting values and their associated errors aregiven in Within the errors, both the R127 and S119Table 4.nebulae have the same electron densities, and interestingly,
et al. derive a similar mean value ofSmith (1997) ne\ 820
^ 170 cm~3 for the AG Car nebula. For R143 the [S II] lineratio is consistent with the low-density limit of 1.5, and thus
cm~3 was assumed for the determination ofne\ 100 T
e.
TABLE 4
PHYSICAL PARAMETERS AND ABUNDANCES (12 ] log X/H)
Parameter orAbundance R127 S119 R143
ne(cm~3) . . . . . . . . 720 ^ 90 680 ^ 170 ¹100
Te
(K) . . . . . . . . . . . . 6420 ^ 300 5600È6800 12200^ 1500
N`/H` . . . . . . . . . . 8.05^ 0.08 8.08È8.41 6.16 ^ 0.23O`/H` . . . . . . . . . . 8.10^ 0.17 7.69È8.26 7.51 ^ 0.23O``/H` . . . . . . . . 7.93^ 0.18S`/H` . . . . . . . . . . . 6.52^ 0.10 6.18È6.52 5.64^ 0.17Ne``/H` . . . . . . . 7.10^ 0.26log N`/O` . . . . . . [0.05^ 0.19 0.15È0.39 [1.35^ 0.33
N/H . . . . . . . . . . . . . . 8.05^ 0.08 8.08È8.41 6.71 ^ 0.39O/H . . . . . . . . . . . . . . 8.10^ 0.17 7.69È8.26 8.06 ^ 0.20S/H . . . . . . . . . . . . . . 6.49 :Ne/H . . . . . . . . . . . . 7.23^ 0.37
For the R127 nebula we derive an electron temperatureof 6420^ 300 K, which again is identical to that derived forthe AG Car nebula of 6350 ^ 400 K et al. In(Smith 1997).the case of S119, we are only able to derive an upper limit to
of 6800 K because of the nondetection of the [N II] j5755Teline. This upper limit is probably quite close to the actual
since we would expect it to be similar to that deduced forTe,
R127 (and AG Car), given that these nebulae have similarsizes, densities, and central-star spectral types. Again forR143, we derive a quite di†erent of 12200^ 1500 K. AsT
ediscussed in the true ejected nebula associated with° 3.3,R143 appears to be located D2A from the central star. Itseems clear, therefore, that the region that we observed 20Afrom R143 is actually 30 Dor H II gas and not materialejected from R143.
Ionic abundances for N`, O`, O``, Ne``, and S` havebeen determined from the line intensities given in byTable 3solving the equations of statistical equilibrium. Theresulting abundances are given in for the threeTable 4nebulae. The associated errors have been calculated fromthe uncertainties on the line Ñuxes, and Since the R127T
ene.
nebula is of low excitation, there are no unseen ionizationstages for N and O, and their total abundances are givendirectly by the N`/H` and O`/H` ionic abundances. Forsulfur, it is possible that some S`` is present, since S` has alower ionization potential than O`. Indeed, et al.Esteban
detect [S III] jj9069, 9532 in the WN8 ring nebula(1991)M1-67, which has no [O III] features and has very similarphysical parameters to those derived for the R127 nebula.For the higher excitation R143 nebular spectrum, we adoptthe ionization correction factors given by &KingsburghBarlow to correct for the unseen higher ionization(1994)stages of N, Ne, and S. The total S abundance is particularlyuncertain for this nebula, since most of the sulfur will be inthe form of S``. The only [S III] transition occurring in theFOS wavelength range is the auroral j6312 line, which isnot detected, and the fairly noisy spectrum does not providea useful upper limit. In we provide two values forTable 4the abundances of the S119 nebula that can be viewed asupper and lower limits. The lower limits for the abundancesfollow straightforwardly from the upper limit determinedfor of 6800 K from the nondetection of the [N II] j5755T
eline. To estimate a suitable lower limit for and thus upperTelimits to the abundances, we have assumed that the S119
nebula has the same S`/H` abundance as the R127 nebula.This then provides a lower limit on of 5600 K. WeT
e

No. 1, 1998 EVOLUTION OF MASSIVE STARS IN LMC 289
FIG. 9.ÈRatio of [N II] j6584 to Ha plotted as a function of spatialposition along the north-south long slit, from the star (position 0).
compare the derived N and O abundances for the threeLMC nebulae with LMC H II region abundances and otherLBV nebulae abundance studies in ° 6.
4. THE R143 NEBULA
Both the FOS and the ground-based observations indi-cate that the kinematical properties and the composition ofthe nebulosity near R143 are consistent with it being part ofthe 30 Doradus H II region, except for a small compactclump located at ^2A from the star, in the northern direc-tion. We have isolated the clump by investigating the ratioof [N II] j6584/Ha as a function of distance from the centralstar along the long slit At o†sets greater than 4A,(Fig. 9).[N II]/HaB0.05, in agreement with the measured FOS ratioof 0.04. At distances less than 4A, however, the [N II]/Haratio shows a sharp increase to a maximum value of 0.8 at aposition approximately north of the central star. The1A.8width of this peak at half maximum suggests that the clumphas a size of 2A. In comparison, the [N II]/Ha ratio for theR127 and S119 nebulae are 0.55 and 0.75, respectively. Asdiscussed later in the nitrogen abundance in both° 6.2,these nebulae is enhanced, and thus, the similarity stronglysuggests that the small clump detected close to R143 alsorepresents nitrogen-enhanced material that has been ejectedfrom the central star.
The presence of the clump is also indicated by a suddenvariation in density suggested by the trend of the [S II]j6717/j6731 ratio when plotted as a function of positionwith respect to the star. For distances larger than 5AÈ10A,the ratio is on average ^1.4, but suddenly drops to below 1in the region 0AÈ5A where we detect the clump. This indi-cates an increase in density from values less than 100 cm~3
in the outer regions around R143 to a value that can be ashigh as ^1000 cm~3 in the inner 5A.
We have already discussed the difficulty of ascertainingthe real shape of the clump, due to the limitations intrinsicto our data. A close examination of shows a secondFigure 9peak in the N/H ratio, symmetrical to the observed clump,in the southern region. We could interpret the presence ofsuch a secondary peak to infer that R143 is surrounded by acloud of material that is nitrogen enhanced and symmetri-cally distributed with respect to the star. However, the [S II]j6717/j6731 ratio in correspondence to the secondary peaksuggests a very low density, more consistent with theproperties of the outer circumstellar region than of theprimary peak. Therefore, we can reliably conclude that thetwo peaks are not part of the same system, with the caveatthat a more thorough investigation is needed to conÐrmsuch a conclusion.
5. FOS STELLAR SPECTROSCOPY
In this section we discuss the FOS stellar spectra of ourprogram stars. Unfortunately, the resolution of the data istoo low for the determination of an appropriate spectraltype from the spectral features, with the possible exceptionof S119. We have therefore used Johnson UBV photometry,determined from our spectrophotometry with syntheticÐlters, to estimate intrinsic properties via the reddening-freeindex We adoptQ\ (U[B) [ E
U~B/E
B~V] (B[V ).
in 30 Dor (containing R143) and 0.76 forEU~B
/EB~V
\ 0.89the Ðeld in the LMC (containing R127 and S119) from
Our results are summarized inFitzpatrick (1985). Table 5,where we give the UBV magnitudes, colors, and Q indices.To determine the reddening, we have used intrinsic colorsfor supergiants from and the listedMassey (1998), E
B~Vrepresents the mean value obtained from each color index.Since LBVs are known to show abnormal Ñux distributionsrelative to normal supergiants, we have performed addi-tional comparisons with theoretical models in each case. In
we present dereddened Ñux distributions for S119,Figure 10R127, and R143 with each star discussed below.
5.1. S119Optical spectra of S119 have recently been presented by
Nota et al. (1996) and & Smith with muchCrowther (1997)higher spectral resolution than those that we discuss here.The spectral classiÐcation of S119 is, depending on prefer-ence, either Ofpe/WN9 & Walborn or(Bohannan 1989)WN11 & Smith supported by the FOS(Crowther 1997),spectroscopy, with strong, narrow Balmer emission, manyP Cygni He I proÐles, and He II j4686 emission. The Vmagnitude and B[V color di†er slightly from previouslypublished values by 0.11 and 0.03 mag,(Isserstedt 1975)respectively. The approximate spectral type of B1 I deter-mined with the Q-method corresponds to a temperature of23 kK, which is substantially lower than more sophisticated
TABLE 5
OBSERVATIONAL RESULTS OBTAINED FROM OUR SPECTROPHOTOMETRY AND THE REDDENING-FREE Q-METHOD (SEE TEXT)
SpectralStar Epoch V U[B B[V Q (U[B)0 (B[V )0 E
B~VType
S119 . . . . . . 15 Sep 96 12.01 [0.94 [0.10 [0.86 [1.00 [0.19 0.09 WN11R127 . . . . . . 31 Jan 96 9.35 [0.66 0.23 [0.83 [0.96 [0.18 0.40 late-B?R143 . . . . . . 10 Dec 95 11.92 [0.42 0.41 [0.78 [0.89 [0.15 0.54 mid-B

290 SMITH ET AL. Vol. 503
FIG. 10.ÈFOS stellar spectroscopy of R127, S119, and R143, dered-dened according to the Q-method discussed in the text.
results obtained using spectral features kK,(Teff \ 30 ^ 2et al. & Smith This failure isPasquali 1997 ; Crowther 1997).
expected because of the unusual continuum distribution forS119 due to its dense extended atmosphere. However, theQ-method implies an interstellar reddening of E
B~V\ 0.09,
in good agreement with that derived from nebular Ñuxesand previous work. For instance, the dered-(E
B~V\ 0.05)
dened continuum distribution for S119 is well reproduced,including the absence of a Balmer jump, with the theoreticalÑux of & SmithCrowther (1997).
5.2. R127The strong stellar wind of R127 coupled with the low
resolution of our spectroscopy prevents a robust spectralclassiÐcation for this star, although Balmer emission pro-Ðles are prominent, showing broad wings due to electronscattering. The visual magnitude of V \ 9.35 mag obtainedfrom the FOS spectrophotometry is in exact agreementwith simultaneous ground-based photometry obtained bythe RASNZ Variable Star Section. HighÈspectral resolutionobservations of R127 were made at an identical visual mag-nitude during 1986 March by et al. TheyWolf (1988).observed weak He I features, with Fe II and Ti II P CygniproÐles prominent (see Wolf et al. 1988). We attributenumerous weak emission features in the FOS optical spec-
trum to blends of these proÐles. Therefore, we propose alate-B or early-A hypergiant spectral classiÐcation at thetime of our observations. However, a very strong Balmerjump would be anticipated for a late-B spectral type, sincesigniÐcant hydrogen is present in the stellar atmosphere ofR127 From this is certainly(Crowther 1997a). Figure 10,not the case. Therefore the Q-method suggests a muchearlier spectral type of B1.5, corresponding to kK,Teff D 20with an extremely high interstellar reddening of E
B~V\
0.40 predicted, in sharp conÑict with obtainedEB~V
\ 0.16from the nebular line Ñuxes. We have also attempted toreproduce the observed continuum distribution for R127using Kurucz and non-LTE extended atmosphere Ñuxessuitable for LBVs. The former, assuming LTE and a plane-parallel atmosphere, were completely unsuccessful in repro-ducing the observed continuum, while the latter supportedthe high reddening and temperature kK) of the(Teff D 19Q-method, although this analysis su†ered from the assump-tion that the mass loss properties were identical to thosepreviously derived from an analysis of a much hotter phasein its evolution Clearly, a detailed spec-(Crowther 1997a).troscopic analysis of R127 during this phase in its spectralevolution is keenly sought in order to resolve these discrep-ancies, and for the moment we favor the low reddening andlate-B spectral type.
5.3. R143The sparsity of spectroscopic observations of R143 in the
past has prevented Ðrm optical spectral classiÐcations,although et al. discussed spectral variabilityParker (1993)from a mid-F supergiant (V \ 10.6) to an early-B super-giant (V \ 12.0 mag). Since V \ 11.9 mag at the epoch ofour observations, we would be tempted to suggest a mid-Bsupergiant spectral type. Our stellar observations of R143reveal Balmer emission up to Hc, with higher members inabsorption. By comparison with LMC supergiant stan-dards we suggest an approximate B9(Fitzpatrick 1991),classiÐcation kK; since Mg II(Teff D 11 Crowther 1997b),j4481 º He I j4471 with Si II j4128 present. In contrast, theQ-method reveals a much earlier spectral type of B2.5
kK, and a reddening of(Teff D 17.5 Crowther 1997b)mag. This is substantially higher thanE
B~V\ 0.54 E
B~V\
0.26 from the nebular line Ñuxes, although lower than themag obtained by et al. from UVE
B~V\ 0.65 Parker (1993)
observations, who noted the notoriously complicatedfar-UV extinction toward 30 Doradus (Fitzpatrick 1985).As for R127, we attempted a more rigorous temperaturedetermination for R143 with Kurucz and non-LTEextended model atmospheres. Kurucz distributions failed toreproduce the observations again, although the latter metwith greater success using kK (corresponding to aTeff D 15B4 supergiant ; Since the Balmer jump isCrowther 1997b).sensitive not only to temperature but also to hydrogencontent, we assumed H/He\ 2.5 (by number), which istypical for other LBVs, including R127. A similar extinctionto that obtained from the Q-method was required, whichcompares well to the average extinction of E
B~V\ 0.50
mag (based on 15 stars) lying within 25A of R143 (Parker1992).
6. DISCUSSION
6.1. Nebular ParametersThe results presented so far on the properties of the
nebulae associated with the three Ofpe/WN9 È LBVs R127,

No. 1, 1998 EVOLUTION OF MASSIVE STARS IN LMC 291
S119, and R143, both revise and improve our currentunderstanding of these three objects. Our new results can besummarized as follows :
R143.ÈWe discover that the large-scale nebula (Ðngers)surrounding R143 is neither associated with the star, norcomposed of ejected material. We detect a smaller compactnebula, previously unknown, associated with R143 andcomposed of ejected material, in very close proximity to thecentral star. This result is conÐrmed by the additional evi-dence derived from the spectral observations, both from theground and with HST , that density and temperatures in thecircumstellar environment of R143 are typical of an H II
region and not of an ejected nebula. Instead, the smallclump of ejected material discovered north of the star1A.8possesses all the characteristics, in terms of expansion veloc-ity, dynamical age, and density, to be classiÐed as theproduct of a bona Ðde LBV outburst.
R127.ÈWe Ðnd, from kinematical considerations, thatthe nebula around R127 appears to be complex ; there is abright inner expanding shell and nebular material exteriorto this that may represent an outer expanding shell. Higherspectral and spatial resolution spectra are required toconÐrm the nature of this outer shell. Assuming that thereare in fact two separate shells, we derive dynamical time-scales of 2.1] 104 and 7.3] 104 yr for the inner and outershells, respectively. The complete spatial coverage of theR127 nebula obtained by the long-slit observations com-plements the initial detection result by Wolf, &Appenzeller,Stahl in which they determined an expansion veloc-(1987),ity of 28 km s~1 and a size of 4A (corresponding to a linearscale of 1 pc). From a comparison with the coronographicimage it is clear that Appenzeller et al. had detected(Fig. 4),in their spectra the two bright east-west lobes, which arelocated at a distance from the star of ^2A. The brighteastern lobe has been used to point the FOS for our spec-troscopic observations. In reality, the entire nebula is afactor of 2 larger : in the coronographic images obtained by
et al. the nebulaÏs faint boundaries extendClampin (1993)up to ^5A from the star. With the available data, Appen-zeller et al. derived a dynamical age for the R127 nebula of2 ] 104 yr, which is consistent with the dynamical age weobtain for the inner shell. The outer shell is approximately 3times older.It is not possible to discern whether the R127nebula is a single or double shell from the images, since atthe LMC distance, the resolution of our ground-basedimages is not sufficient. However, HST /WFPC2 images ofthe R127 nebula are being planned, and at the resolutiono†ered by HST , it will be possible to assess the existence ofthe two shells.
Multiple shells are not uncommon among LBV nebulae :high-resolution HST [N II] images of the AG Carinaenebula et al. show two nested, concentric(Nota 1996a)shells, which display di†erences in their expansion veloci-ties. Two distinct nebulae have been detected in the circum-stellar environment of P Cygni et al.(Barlow 1994 ;
et al. an inner nebula, 22A in diameter,Meaburn 1996) :probably ejected ^900 yr ago, and an outer nebula, [email protected], ^1100 yr older. More recently, a bipolar outÑow hasbeen discovered around the WNL star WR 124 et(Siriannial. which was known to host a spherical expanding1998),shell & Carsenty et al. infer that(Solf 1982). Sirianni (1998)the bipolar outÑow and the shell are products of two sub-sequent outbursts spaced by ^5000 yr.
From a theoretical point of view, multiple outbursts are
expected in LBVs : both the et al. evolution-Langer (1994)ary scenario, where enhanced mass loss keeps the star onthe blue side of the Eddington instability limit in the H-Rdiagram, and Stothers & Chin model, where thethe (1996)major mass loss occurs in a single ejection event during abrief red supergiant phase, foresee, after the main outburstthat generates the nebula, a number of subsequent out-bursts of minor intensity. At every ejection, a decreasingamount of mass would be lost. It is likely that the ejectedlayers would not thoroughly mix, and that the nebulae wepresently observe would be the accumulation of the sub-sequent outbursts.
The dynamical and physical properties of the R127 shells,in terms of size, mass, and age are quite normal andT
e, n
e,
consistent with our current knowledge of LBV nebularproperties. The expansion velocity is at the slow end of thespectrum of observed velocity, but all other parameters arequite typical. The same conclusions apply to S119, anotherquite typical LBV nebula.
In this context, the nebula associated with R143 is not a““ well-behaved ÏÏ LBV nebula : Ðrst, the morphology of theejecta is very di†erent from the bipolar or elliptical shellstypically observed, as already discussed ; second, the expan-sion velocity is the highest recorded (after g Carinae). Thesmall clump is of very recent formation : 3.7] 103 yr,similar to the nebula ejected by HR Carinae et al.(Nota
which is also characterized by a higher than average1997),expansion velocity. Although we can measure the Ha Ñuxemitted by the clump, we have not tried to derive a mass ofionized gas, since the region of the clump, being so close tothe central star, is heavily contaminated by both the intrin-sic Ha emission from R143 and the emission from theunderlying HII region. For R143, as for R127, high-resolution HST /WFPC2 images are planned, which willbetter deÐne the morphology, size, and emissivity of theclump.
6.2. Nebular AbundancesWe now compare and discuss the N and O abundances
as determined from the FOS spectra of the nebulae associ-ated with R127, S119, and R143. In we list for eachTable 6nebula the spectral type of the central star, the measured Nand O abundances (12] log X/H), the N/O ratio (bynumber), the N enrichment factor * N, and the O depletionfactor 1/* O. These factors have been calculated using themean of the LMC H II region N and O abundances given by
and & Dopita as listed inDufour (1984) Russell (1990),Table 6.
Considering the R127 nebula Ðrst, we Ðnd that N isenriched by a factor of 11, while O shows little, if any,depletion within the errors. For the S119 nebula, the abun-dances cover a wide range as a result of the uncertainty of
Nevertheless, the N enrichment and O depletion factorsTe.
are in agreement with those determined for the R127 nebulaif the lower abundances (corresponding to the upper limiton which is close to the measured of the R127 nebula)T
e, T
eare considered. The N/O ratio for the S119 nebula (which isnot very dependent on is similar to that determined forT
e)
the R127 nebula. For the R143 nebula, we see a quite di†er-ent picture, with both N and O having normal LMC abun-dances within the errors. The O abundance is also inexcellent agreement with that determined for the R127nebula. The N/O ratio given in (actually N`/O`) isTable 6a factor of 22 smaller than that determined for the R127

292 SMITH ET AL. Vol. 503
TABLE 6
COMPARISON OF ABUNDANCES
SpectralObject Type log N/H log O/H N/O * N 1/* O Reference
LMC
R127 nebula . . . . . . . . . . LBV 8.05^ 0.08 8.10 ^ 0.17 0.89 ^ 0.40 10.7 ^ 2.2 2.0 ^ 1.0 1S119 nebula . . . . . . . . . . Ofpe/WN9 8.08È8.41 7.69È8.26 1.41È2.45 11.5È24.5 1.4È5.1 1R143 nebula . . . . . . . . . . LBV 6.71^ 0.39 8.06 ^ 0.20 0.04 ^ 0.04 0.5 ^ 0.6 2.2 ^ 1.1 1Non-Type I PN . . . . . . 7.68^ 0.26 8.41 ^ 0.18 0.19 ^ 0.09 4.6 ^ 2.9 1.0 ^ 0.5 2SN 1987A ring . . . . . . . RSG? 8.08^ 0.08 7.89 ^ 0.08 1.55 ^ 0.40 11.5 ^ 2.3 3.2 ^ 0.7 3SH IIT . . . . . . . . . . . . . . . . . 7.02 8.40 0.04 1.0 1.0 4
Galaxy
AG Car nebula . . . . . . LBV 8.22^ 0.10 7.52 ^ 0.20 5.74 ^ 2.25 4.5 ^ 1.3 15.1 ^ 7.2 5g Car nebula . . . . . . . . . LBV 8.93 \7.19 [55 23 [32 6Non-Type I PN . . . . . . 8.14^ 0.20 8.69 ^ 0.15 0.28 ^ 0.17 3.7 ^ 1.8 1.0 ^ 0.4 7SH IIT . . . . . . . . . . . . . . . . . 7.57 8.70 0.07 1.0 1.0 8
REFERENCES.È(1) This paper ; (2) et al. (3) Panagia et al. (4) &Barlow 1991 ; Walton 1991 ; 1998a, 1998b ; Dufour 1984 ; RussellDopita (5) et al. (6) et al. (7) & Barlow (8) et al.1990 ; Smith 1997 ; Dufour 1997 ; Kingsburgh 1994 ; Shaver 1983.
nebula, and it is in excellent agreement with the mean H II
region value, also given in this table. These abundances forthe R143 nebula clearly show that the Ðlamentary materialobserved with FOS is unprocessed 30 Dor gas. As discussedin the real R143 nebula appears to be located just 2A° 4,north of the star. The high [N II]/Ha ratio detected in theground-based spectra of this region indicates that thisnebula almost certainly consists of ejected material.
We now compare the R127 nebular abundances withthose determined for other objects having processed stellarmaterial in the LMC and the Galaxy. First, in weTable 6,list the average N and O abundances for nonÈtype I PNs
et al. These are PNs that have(Barlow 1991 ; Walton 1991).experienced CN processing only, so they show a N enrich-ment and a normal O abundance. It is apparent that whilethe R127 nebula is more enriched in N by a factor of 2, theO abundances are similar.
The normal (within the errors) LMC O abundance mea-sured for the R127 nebula, in common with PN studies,suggests that the nebula consists of material that has notbeen involved in the ON process. The clear enhancement ofN, on the other hand, indicates that C has been convertedinto secondary nitrogen, i.e., the R127 nebula consists ofCN- and not CNO-processed material. If we compare thetotal LMC C ] N H II abundance of 7.95 ^ 0.15 to theR127 nebular N abundance of 8.05^ 0.08, then the twovalues are identical within the errors, suggesting that theCN cycle has operated to completion in the ejected materialforming the R127 nebula.
We next compare the R127 nebular abundances to thosedetermined for the inner ring of SN 1987A. et al.Fransson
Ðrst showed that N is enriched and suggested that the(1989)ring consists of RSG wind material. More recent studies
et al. Panagia et al. have(Sonneborn 1997 ; 1998a, 1998b)reÐned the CNO abundances. In we list the N andTable 6,O abundances from the study of Panagia et al. (1997, 1998)based on HST /FOS spectroscopy. It is apparent from
that both the R127 nebula and the SN 1987A ringTable 6have identical N enrichments. For O, the SN 1987A ringappears to be depleted relative to LMC H II region values,but overall, within the errors, the O abundances for theR127 nebula and SN 1987A are in reasonable agreement.The similarity in the N and O abundances of these twoobjects provides further support for the fact that the
enriched material in the R127 nebula represents CN-processed material.
Few N and O abundance analyses have so far beencarried out for the photospheres of LBVs. et al.Lennon
studied R71 in the LMC. They Ðnd a helium mass(1994)fraction Y \ 0.61 and a N/O ratio of 7 from a non-LTEmodel atmosphere analysis. They compare their C/N andN/O ratios to those for unevolved B stars and conclude that““ the surface material in R71 has undergone signiÐcantCNO processing, the small O/N ratio implying that the ONcycle has had an important inÑuence on the current com-position.ÏÏ The surface N/O ratio for R71 is therefore quitedi†erent from that determined for the R127 nebula. Venn
analyzed the LBV R40 in the SMC. The analysis was(1997)done relative to three A supergiants in the SMC. R40 wasfound to be overabundant in N by a factor of 3 and under-abundant in O by a factor of 2.5 relative to the ““ normal ÏÏsupergiants. The N/O ratio of R40 turns out to be 1.0.Although no N/O ratios are available for the atmospheresof the stars in the present study, we can infer that they mustbe very similar to those determined for R71 and R40. Modelatmosphere analyses of two LBVs and nine LMC Ofpe/WN9 stars Crowther, & Prinja et al.(Smith, 1994 ; Pasquali
& Smith show a very narrow range in1997 ; Crowther 1997)helium abundance with Y \ 0.65^ 0.05. Crowther (1997a)has analyzed the Ofpe/WN9 spectrum of R127 and ÐndsY \ 0.66. For S119, & Smith ÐndCrowther (1997)Y \ 0.73, and et al. Ðnd Y \ 0.69 and noPasquali (1997)evidence for any O features in the ultraviolet HST spec-trum. Thus, two of our sample of stars have helium abun-dances slightly higher than that determined for R71 (0.61),and they would be expected to have N/O ratios at leastcomparable to R71 and R40. It is hard to assess the intrinsicuncertainties of the surface abundances of R71 and R40,and the di†erent N/O ratio in R71 and R40 could well bethe result of systematic uncertainties. Taken at face value,N/O \ 7 in R71 would indicate the presence of CNO-processed material, whereas N/O\ 1 in R40 suggests ON-cycled gas at the stellar surface. Interestingly, the nitrogenenrichment in R40 is consistent with the expectation formassive post-RSG stars and thus R40 could(Venn 1997),well have evolved from an RSG progenitor. Does thesimilar N/O ratio in R40 and in the R127 and S119 nebulaeindicate similar progenitors for the latter stars as well ?

No. 1, 1998 EVOLUTION OF MASSIVE STARS IN LMC 293
In we also present measured N and O abun-Table 6dances for two Galactic LBV nebulae. The AG Car nebulashows a small N enrichment of a factor of 4.5 et al.(Smith
much less than that implied by the surface helium1997),mass fraction of 0.63 et al. Oxygen is depleted(Smith 1994).by a factor of 15 ^ 7, although this error may be an under-estimate because of the observational difficulties (not expe-rienced by HST ) in measuring [O II] j3727 in this highlyreddened nebula. Nevertheless, it is clear that the AG Carnebula has a low N enrichment, in accord with the Ðndingsfor the R127 nebula.
In complete contrast, however, are the abundances givenin for the g Car nebula. These have recently beenTable 6measured by et al. from HST /FOS spectros-Dufour (1997)copy of the so-called S-ridge region in the outer nebulosity.The values given in the table represent the mean of theabundances for ““ knots ÏÏ S2 and S3, which appear to rep-resent photoionized gas. It can be seen that the material hasundergone extreme CNO-processing, with N being a factorof 23 overabundant and O depleted by at least a factor of32. Intriguingly, et al. also Ðnd that twoDufour (1997)further positions in the S-ridge appear to have less extremeabundance anomalies.
In summary, we Ðnd that the R127 nebular abundancesdo not reÑect the current (inferred) surface composition ofthe star if R127 and R71 have similar surface conditions.This suggests that the nebula was ejected at an earlier epochwhen only CN-processed material was present on thesurface. Before comparing the nebular abundances with thepredictions of stellar evolutionary models, it is worth con-sidering if the observed nebular abundances are the productof the dilution of CNO equilibrium material withunprocessed swept-up gas. The O abundance argues strong-ly against this possibility, since, if dilution is operating, wewould not expect to see any N enrichment, given that thereis little if any O depletion in the R127 nebula. If, on theother hand, R40Ïs surface abundances are adopted, there isno need to postulate an earlier ejection of the nebulosities.The nebula around R127 (and S119 as well) could then beinterpreted as reÑecting the present, ON-cycled gas at thesurface. Since R40 may have passed through a red super-giant phase (although there is no proof for such a claim!),R127 and S119 may have had a cool progenitor as well. Weconclude that the nebular abundances point toward a redsupergiant progenitor in R127 and S119, regardless of theprecise ejection epoch of the nebulae.
6.3. Nebular Formation and Evolutionary ImplicationsWe now compare our observations to stellar evolution-
ary theory with the aim of determining the evolutionarypoint at which the nebulae were ejected. We will concen-trate on the R127 nebula, since we have the most informa-tion for this object. We have two main observationalparameters describing the ejection process itself : the expan-sion velocity of 29 km s~1, relating to the ejection velocity(assuming no signiÐcant deceleration), and with theobserved radius of the nebula (0.62 pc), the time elapsedsince the ejection (2.1] 104 yr). For this discussion, we haveassumed that the FOS aperture, being located at 2A fromthe central star, has detected emission originating only fromthe inner shell. The nebular abundances, reÑecting the evo-lutionary state of the stellar surface layers at the time ofejection, indicate CN-processed material with N/OB 1.Taking these parameters at face value, the low velocity in
combination with the CN-processed material is suggestiveof a cool supergiant envelope. The excellent agreement inthe abundances between the R127 nebula and the inner ringof SN 1987A also supports this.
For the comparison, we will use the evolutionary tracksof et al. for an LMC metallicity of Z\ 0.008.Meynet (1994)These incorporate mass loss rates enhanced by a factor of 2compared to the standard models of et al. toSchaller (1992)produce better agreement with observations. The assumedmass loss rates are also scaled down by a factor of 0.6 toaccount for the lower metallicity of the LMC. The resultingtracks are therefore very similar to those of et al.Schaller
with standard mass loss rates for solar metallicity. In(1992)the predicted surface N/O ratios are plottedFigure 11a
against e†ective temperature for stars with initial masses of40, 60, and 85 up to the end of the WN phase. ForM
_comparison, we show the measured N/O ratios for the R127and S119 nebulae and the expected position of LBVs andWN stars with an approximate CNO equilibrium N/Oratio of 26. For reference, in we show the corre-Figure 11bsponding H-R diagram for these three models with the twopoints corresponding to the nebular and CNO equilibriumN/O ratios marked, as well as the positions of the threestars in this study, R40, R71, and SN 1987A.
First considering the 85 case, we see that theM_observed N/O ratio occurs while the star is still on the main
sequence. The evolutionary timescale of B3 ] 105 yr fromthis point to an LBV surface composition is, however, fartoo long compared to the dynamical timescale of the R127nebula. For the 60 and 40 cases, the observed N/OM
_ratio is achieved much later in their evolution. For theformer case, it occurs while the star is evolving redwardinside the H-D limit 2 ] 104 yr before it becomes anLBV/WN star and rapidly returns to the blue. For the latter40 case, the observed N/O ratio is obtained when theM
_star is at the end of its Ðrst yellow supergiant phase andbecomes a WN star some 3.5] 105 yr later. This postÈmain-sequence evolution occurs just below the H-D limit.
The above comparisons with the tracks of et al.Meynetshow that the 60 case is the only one that pro-(1994) M
_duces both the observed N/O ratio and roughly the correctdynamical timescale for the R127 nebula. We note that inevolutionary terms, the factor of 3 di†erence in the ages ofthe inner and outer shells is negligible, i.e., the point ofejection for the older shell will also occur while the star isevolving redward. The mass loss by the star over this periodis 9 which is a factor of 3 greater than the ionized massM
_,
of the nebula, although there may be neutral materialpresent. The luminosity of R127 also agrees with this track.
The success of this track in producing good agreementwith the observed R127 nebular abundances and agedepends critically on the adopted mass loss rates. Forexample, the 60 track of et al. for solarM
_Meynet (1994)
metallicity reaches a surface N/O ratio of 1 while in theBSG phase, and so it has the same timescale problems asthe 85 track for an LMC metallicity. In their study ofM
_the AG Car nebula, et al. found the best agree-Smith (1997)ment for the solar metallicity 40 track (which does notM
_formally have an LBV but an RSG stage instead), since thestar, having a lower mass loss rate, evolved redward to aminimum K, corresponding to N/O B 1 at theTeff \ 5700surface. They therefore suggested that the AG Car nebulamay represent the H-rich envelope of an RSG. We note herethat the extent of the redward evolution for the initial

294 SMITH ET AL. Vol. 503
FIG. 11.È(a) log N/O (by number) plotted as a function of log for initial masses of 40 (solid line), 60 (dashed line), and 85 (dotted line) from theTeff M_evolutionary calculations of et al. The box to the right shows the observed log N/O ratios for the R127 and S119 nebulae, and the horizontalMeynet (1994).
line represents an N/O ratio of 26 corresponding to CNO equilibrium abundances. (b) The corresponding H-R diagram for the same initial mass models.Crosses : Evolutionary point when N/O D 1 ; Ðlled circles : N/O D 26. The positions of R127 et al. S119 & Smith(Crowther 1997a ; Stahl 1983), (Crowther
R143 et al. R71 et al. R40 et al. and SN 1987A et al. are indicated. Solid line : H-D limit of1997), (Parker 1993), (Lennon 1994), (Szeifert 1993), (Arnett 1989)& DavidsonHumphreys (1979).
masses we have considered is determined by the amount ofmass loss. For the LMC 60 track, the minimum tem-M
_perature reached is 6200 K, which is well beyond the H-Dlimit and corresponds to a yellow supergiant (YSG). Alower rate of mass loss, on the other hand, will increase theredward evolution, such that the turn-back point will corre-spond to an RSG.
In summary, we Ðnd that the composition of the R127nebula indicates that it was formed prior to the epoch ofCNO equilibrium at the stellar surface. The observed lowexpansion velocity and the fact that the nebula is composedof CN-processed material suggest that R127 may have beena cool supergiant when it ejected its outer layers. Compari-
son with the evolutionary models of et al.Meynet (1994)shows that good agreement is reached for the 60 trackM
_in terms of nebular abundances and the dynamical time-scale. The minimum temperature reached for this track cor-responds to a YSG, although this strongly depends on theamount of mass loss. Any comparison of LBV propertieswith evolutionary models requires caution. The LBV phaseis not a self-consistent model prediction, but rather anadjustable parameter that has been added to the modelsafter the LBV phase was identiÐed observationally. There-fore, it is difficult to assess the predictive power of evolu-tionary models with respect to LBV lifetimes and surfaceabundances. We note that our Ðndings agree broadly with
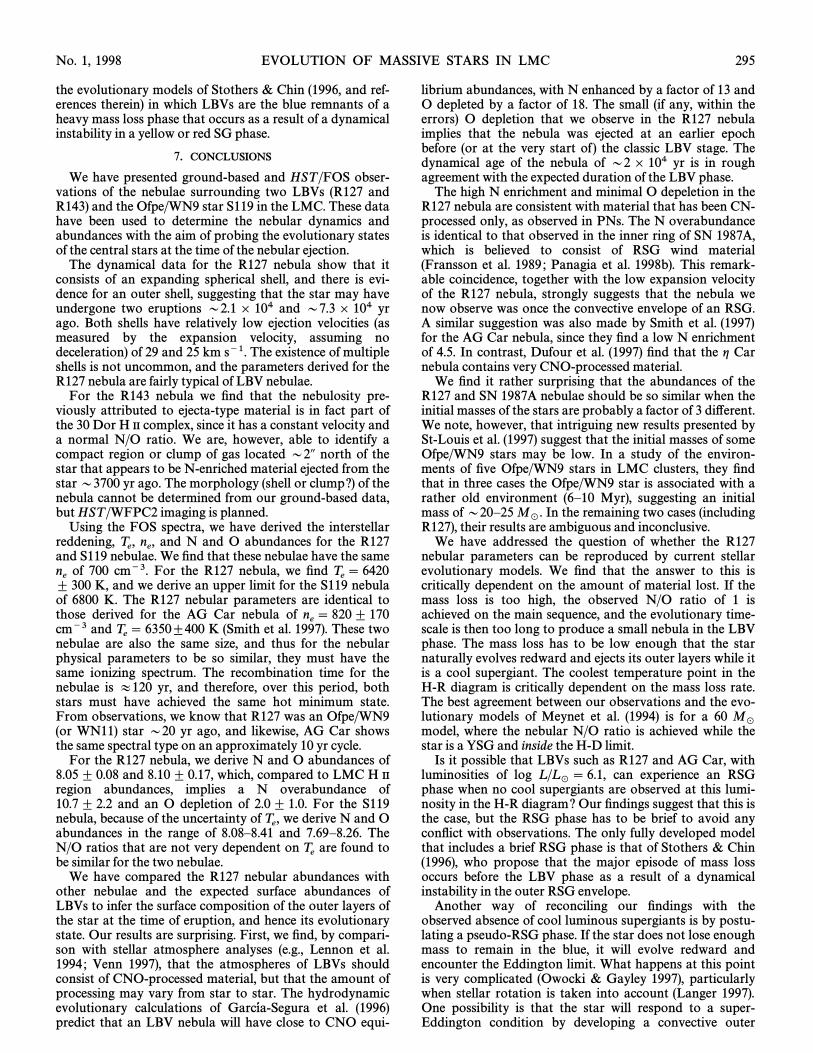
No. 1, 1998 EVOLUTION OF MASSIVE STARS IN LMC 295
the evolutionary models of & Chin and ref-Stothers (1996,erences therein) in which LBVs are the blue remnants of aheavy mass loss phase that occurs as a result of a dynamicalinstability in a yellow or red SG phase.
7. CONCLUSIONS
We have presented ground-based and HST /FOS obser-vations of the nebulae surrounding two LBVs (R127 andR143) and the Ofpe/WN9 star S119 in the LMC. These datahave been used to determine the nebular dynamics andabundances with the aim of probing the evolutionary statesof the central stars at the time of the nebular ejection.
The dynamical data for the R127 nebula show that itconsists of an expanding spherical shell, and there is evi-dence for an outer shell, suggesting that the star may haveundergone two eruptions D2.1] 104 and D7.3] 104 yrago. Both shells have relatively low ejection velocities (asmeasured by the expansion velocity, assuming nodeceleration) of 29 and 25 km s~1. The existence of multipleshells is not uncommon, and the parameters derived for theR127 nebula are fairly typical of LBV nebulae.
For the R143 nebula we Ðnd that the nebulosity pre-viously attributed to ejecta-type material is in fact part ofthe 30 Dor H II complex, since it has a constant velocity anda normal N/O ratio. We are, however, able to identify acompact region or clump of gas located D2A north of thestar that appears to be N-enriched material ejected from thestar D3700 yr ago. The morphology (shell or clump?) of thenebula cannot be determined from our ground-based data,but HST /WFPC2 imaging is planned.
Using the FOS spectra, we have derived the interstellarreddening, and N and O abundances for the R127T
e, n
e,
and S119 nebulae. We Ðnd that these nebulae have the sameof 700 cm~3. For the R127 nebula, we Ðndn
eTe\ 6420
K, and we derive an upper limit for the S119 nebula^ 300of 6800 K. The R127 nebular parameters are identical tothose derived for the AG Car nebula of n
e\ 820 ^ 170
cm~3 and K et al. These twoTe\ 6350^400 (Smith 1997).
nebulae are also the same size, and thus for the nebularphysical parameters to be so similar, they must have thesame ionizing spectrum. The recombination time for thenebulae is B120 yr, and therefore, over this period, bothstars must have achieved the same hot minimum state.From observations, we know that R127 was an Ofpe/WN9(or WN11) star D20 yr ago, and likewise, AG Car showsthe same spectral type on an approximately 10 yr cycle.
For the R127 nebula, we derive N and O abundances of8.05^ 0.08 and 8.10^ 0.17, which, compared to LMC H II
region abundances, implies a N overabundance of10.7^ 2.2 and an O depletion of 2.0 ^ 1.0. For the S119nebula, because of the uncertainty of we derive N and OT
e,
abundances in the range of 8.08È8.41 and 7.69È8.26. TheN/O ratios that are not very dependent on are found toT
ebe similar for the two nebulae.We have compared the R127 nebular abundances with
other nebulae and the expected surface abundances ofLBVs to infer the surface composition of the outer layers ofthe star at the time of eruption, and hence its evolutionarystate. Our results are surprising. First, we Ðnd, by compari-son with stellar atmosphere analyses (e.g., et al.Lennon
that the atmospheres of LBVs should1994 ; Venn 1997),consist of CNO-processed material, but that the amount ofprocessing may vary from star to star. The hydrodynamicevolutionary calculations of et al.Garci� a-Segura (1996)predict that an LBV nebula will have close to CNO equi-
librium abundances, with N enhanced by a factor of 13 andO depleted by a factor of 18. The small (if any, within theerrors) O depletion that we observe in the R127 nebulaimplies that the nebula was ejected at an earlier epochbefore (or at the very start of ) the classic LBV stage. Thedynamical age of the nebula of D2 ] 104 yr is in roughagreement with the expected duration of the LBV phase.
The high N enrichment and minimal O depeletion in theR127 nebula are consistent with material that has been CN-processed only, as observed in PNs. The N overabundanceis identical to that observed in the inner ring of SN 1987A,which is believed to consist of RSG wind material
et al. et al. This remark-(Fransson 1989 ; Panagia 1998b).able coincidence, together with the low expansion velocityof the R127 nebula, strongly suggests that the nebula wenow observe was once the convective envelope of an RSG.A similar suggestion was also made by et al.Smith (1997)for the AG Car nebula, since they Ðnd a low N enrichmentof 4.5. In contrast, et al. Ðnd that the g CarDufour (1997)nebula contains very CNO-processed material.
We Ðnd it rather surprising that the abundances of theR127 and SN 1987A nebulae should be so similar when theinitial masses of the stars are probably a factor of 3 di†erent.We note, however, that intriguing new results presented by
et al. suggest that the initial masses of someSt-Louis (1997)Ofpe/WN9 stars may be low. In a study of the environ-ments of Ðve Ofpe/WN9 stars in LMC clusters, they Ðndthat in three cases the Ofpe/WN9 star is associated with arather old environment (6È10 Myr), suggesting an initialmass of D20È25 In the remaining two cases (includingM
_.
R127), their results are ambiguous and inconclusive.We have addressed the question of whether the R127
nebular parameters can be reproduced by current stellarevolutionary models. We Ðnd that the answer to this iscritically dependent on the amount of material lost. If themass loss is too high, the observed N/O ratio of 1 isachieved on the main sequence, and the evolutionary time-scale is then too long to produce a small nebula in the LBVphase. The mass loss has to be low enough that the starnaturally evolves redward and ejects its outer layers while itis a cool supergiant. The coolest temperature point in theH-R diagram is critically dependent on the mass loss rate.The best agreement between our observations and the evo-lutionary models of et al. is for a 60Meynet (1994) M
_model, where the nebular N/O ratio is achieved while thestar is a YSG and inside the H-D limit.
Is it possible that LBVs such as R127 and AG Car, withluminosities of log can experience an RSGL /L
_\ 6.1,
phase when no cool supergiants are observed at this lumi-nosity in the H-R diagram? Our Ðndings suggest that this isthe case, but the RSG phase has to be brief to avoid anyconÑict with observations. The only fully developed modelthat includes a brief RSG phase is that of & ChinStothers
who propose that the major episode of mass loss(1996),occurs before the LBV phase as a result of a dynamicalinstability in the outer RSG envelope.
Another way of reconciling our Ðndings with theobserved absence of cool luminous supergiants is by postu-lating a pseudo-RSG phase. If the star does not lose enoughmass to remain in the blue, it will evolve redward andencounter the Eddington limit. What happens at this pointis very complicated & Gayley particularly(Owocki 1997),when stellar rotation is taken into account (Langer 1997).One possibility is that the star will respond to a super-Eddington condition by developing a convective outer

296 SMITH ET AL.
envelope (to reduce the radiative luminosity) and becomingvery bloated, such that it will have the appearance of anRSG, presumably for a brief period. The outer envelopemay then become detached as a result of a density inversion
& Gayley and the LBV underneath will be(Owocki 1997),revealed.
In summary, the observations reported in this paperprovide new insights into the LBV eruption and the insta-bility mechanism. Our key Ðnding is that the R127 nebulawas once the convective envelope of an RSG. We suggestthe following picture for the formation of LBV nebulae : Themassive pre-LBV star does not lose sufficient mass on themain sequence to prevent evolution to the red. As it evolvesto lower temperatures, it approaches the Eddington limitand goes through a pseudo-RSG/super-Eddington phasewhere the outer convective envelope becomes detached and
is gently ejected. The classic blue LBV phase then com-mences with smaller ejection episodes. If this picture isbroadly correct, then LBVs should be surrounded by RSGenvelopes, which, in most cases, will be neutral because oftheir low ionizing Ñuxes.
L. J. S. would like to thank the STScI for their warmhospitality and Ðnancial support from the Visitors Fundwhile this paper was being written. We are grateful to NinoPanagia for useful discussions and for providing us withabundances for SN 1987A in advance of publication. Thiswork was supported by HST grants G0-06110.01-94A andG0-06110.02-94A from the Space Telescope Science Insti-tute, which is operated by the Association of Universitiesfor Research in Astronomy, Inc., under NASA contractNAS5-26555.
REFERENCESI., Wolf, B., & Stahl, O. 1987, in Instabilities in LuminousAppenzeller,
Early Type Stars, ed. H. J. G. L. M. Lamers & C. W. H. de Loore(Dordrecht : Reidel), 241
W. D., Bahcall, J. N., Kirshner, R. P., & Woosley, S. E. 1989,Arnett,ARA&A, 27, 629
M. J. 1991, in IAU Symp. 148, The Magellanic Clouds, ed.Barlow,R. Haynes & D. Milne (Dordrecht : Kluwer), 291
M. J., Drew, J. E., Meaburn, J., & Massey, R. M. 1994, MNRAS,Barlow,268, L29
B., & Walborn, N. R. 1989, PASP, 101,Bohannan, 520M., Nota, A., Golimowski, D. A., Leitherer, C., & Durrance, S. T.Clampin,
1993, ApJ, 410, L35P. S. 1984, in IAU Symp. 105, Observational Tests of the StellarConti,
Evolution Theory, ed. A. Maeder & A. Renzini (Dordrecht : Kluwer), 233P. A. 1997a, in ASP Conf. Ser. 120, Luminous Blue Variables :Crowther,
Massive Stars in Transition, ed. A. Nota & H. J. G. L. M. Lamers (SanFrancisco : ASP), 51
1997b, in IAU Symp. 189, Fundamental Stellar Properties : TheÈÈÈ.Interaction between Observation and Theory, ed. T. R. Bedding et al.(Dordrecht : Kluwer), 137
P. A., Hillier, D. J., & Smith, L. J. 1995, A&A, 293,Crowther, 172P. A., & Smith, L. J. 1997, A&A, 320,Crowther, 500
Koter, A. 1993, Ph.D. thesis, Univ.de UtrechtR. J. 1984, in IAU Symp. 108, Structure and Evolution of theDufour
Magellanic Clouds, ed. S. van den Bergh & K. S. de Boer (Dordrecht :Kluwer), 353
R. J., Glover, T. W., Hester, J. J., Currie, D. G., van Orsow, D., &Dufour,Walter, D. K. 1997, in ASP Conf. Ser. 120, Luminous Blue Variables :Massive Stars in Transition, ed. A. Nota & H. J. G. L. M. Lamers (SanFrancisco : ASP), 255
C., Vi� lchez, J. M., Smith, L. J., & Manchado, A. 1991, A&A, 244,Esteban,205
E. L. 1985, ApJ, 299,Fitzpatrick, 2191991, PASP, 103,ÈÈÈ. 1123
C., Cassatella, A., Gilmozzi, R., Kirshner, R. P., Panagia, N.,Fransson,Sonneborn, G., & Wamsteker W. 1989, ApJ, 336, 429
G., Mac Low, M.-M., & Langer, N. 1996, A&A, 305,Garci� a-Segura, 229I. D. 1983, MNRAS, 203,Howarth, 301D. G., & Storey, P. J. 1987, MNRAS, 224,Hummer, 801
R. M., & Davidson, K. 1979, ApJ, 232,Humphreys, 4091994, PASP, 106,ÈÈÈ. 1025
D., & Van Drom, E. 1991, A&A, 251,Hutseme� kers, 620J. 1975, A&AS, 19,Isserstedt, 259
D. R. H., Barlow, M. J., Drew, J. E., & Brinks, E. 1992, MNRAS,Johnson,255, 261
R. L., & Barlow, M. J. 1994, MNRAS, 271,Kingsburgh, 257N. 1997, in ASP Conf. Ser. 120, Luminous Blue Variables : MassiveLanger,
Stars in Transition, ed. A. Nota & H. J. G. L. M. Lamers (San Francisco :ASP), 83
N., Hamann, W.-R., Lennon, M., Najarro, F., Pauldrach, A. W. A.,Langer,& Puls, J. 1994, A&A, 290, 819
D. J., Wobig, D., Kudritzki, R.-P., & Stahl, O. 1994, Space Sci.Lennon,Rev., 66, 207
P. 1998, Stellar Astrophysics for the Local Group : a First Step toMassey,the Universe, ed. A. Aparicio, A. Herrero, & F. Sanchez (Cambridge :Cambridge Univ. Press), in press
J., Lopez, J. A., Barlow, M. J., & Drew, J. E. 1996, MNRAS, 283,Meaburn,69
G., Maeder, A., Schaller, G., Schaerer, D., & Charbonnel, C. 1994,Meynet,A&AS, 103, 97
A., & Clampin, M. 1997, in ASP Conf. Ser. 120, Luminous BlueNota,Variables : Massive Stars in Transition, ed. A. Nota & H. J. G. L. M.Lamers (San Francisco : ASP), 303
A., Clampin, M., Garci� a-Segura, G., Leitherer, C., & Langer, N.Nota,1996a, in Science with the Hubble Space T elescope II, ed. P. Benvenuti,F. D. Macchetto, & E. J. Schreier (Baltimore : STScI-ECF), 398
A., Drissen, L., Clampin, M., Leitherer, C., Pasquali, A., Robert, C.,Nota,Paresce, F., & Robberto, M. 1994, in Circumstellar Media in the LateStages of Stellar Evolution, ed. R. E. S. Clegg, I. R. Stevens, & W. P. S.Meikle (Cambridge : Cambridge Univ. Press), 89
A., & Lamers, H. J. G. L. M. 1997, ASP Conf. Ser. 120, Lumi-Nota,nous Blue Variables : Massive Stars in Transition (San Francisco : ASP)
A., Livio, M., Clampin, M., & Schulte-Ladbeck, R. 1995, ApJ, 448,Nota,788
A., Pasquali, A., Clampin, M., Pollacco, D., Scuderi, S., & Livio, M.Nota,1996b, ApJ, 473, 946
A., Pasquali, A., Drissen, L., Leitherer, C., Robert, C., Mo†at,Nota,A. F. J., & Schmutz, W. 1996c, ApJS, 102, 383
A., Smith, L. J., Pasquali, A., Clampin, M., & Stroud, M. P. 1997,Nota,ApJ, 486, 338
S. P., & Gayley, K. G. 1997, in ASP Conf. Ser. 120,Owocki,Luminous Blue Variables : Massive Stars in Transition, ed. A. Nota &H. J. G. L. M. Lamers (San Francisco : ASP), 121
N., et al. 1998a, inPanagia, preparationN., Gilmozzi, R., Macchetto, F., Adorf, H.-M., & Kirshner, R. P.Panagia,
1991, ApJ, 380, L23N., Scuderi, S., Gilmozzi, R., & the SINS Collaboration. 1998b, inPanagia,
ASP Conf. Ser., ESO/CTIO/LCO Workshop SN 1987A: Ten YearsAfter, ed. M. Phillips & N. Suntze† (San Francisco : ASP), in press
J. Wm. 1992, Ph.D. thesis, Univ.Parker, ColoradoJ. Wm., Clayton, G. C., Winge, C., & Conti, P. S. 1993, ApJ, 409,Parker,
770A., Langer, N., Schmutz, W., Leitherer, C., Nota, A., Hubeny, I.,Pasquali,
& Mo†at, A. F. J. 1997, ApJ, 470, 340S. C., & Dopita, M. A. 1990, ApJS, 74,Russell, 93G., Schaerer, D., Meynet, G., & Maeder, A. 1992, A&AS, 96,Schaller, 269P. A., McGee, R. X., Newton, L. M., Danks, A. C., & Pottasch,Shaver,
S. R. 1983, MNRAS, 204, 53M. Nota, A., Pasquali, A., & Clampin, M. 1998, A&A, inSirianni, press
L. J., Crowther, P. A., & Prinja, R. K. 1994, A&A, 281,Smith, 833L. J., Stroud, M. P., Esteban, C., & Vi� lchez, J. M. 1997, MNRAS,Smith,
290, 265J., & Carsenty, U. 1982, A&A, 116,Solf, 54
G., Fransson, C., Lundqvist, P., Cassatella, A., Gilmozzi, R.,Sonneborn,Kirshner, R. P., Panagia, N., & Wamsteker, W. 1997, ApJ, 477, 848
O. 1987, A&A, 182,Stahl, 229O., Wolf, B., Klare, G., Cassatella, A., Krautter, J., Persi, P., &Stahl,
Ferrari-Toniolo, M. 1983, A&A, 127, 49N., Mo†at, A. F. J., Turbide, L., & Bertrand, J.-F. 1997, in ASPSt-Louis,
Conf. Ser. 131, Boulder-Munich II : Properties of Hot, Luminous Stars,ed. I. D. Howarth (San Francisco : ASP), 326
R. B., & Chin, C.-W. 1996, ApJ, 468,Stothers, 842Th., Stahl, O., Wolf, B., Zickraf, F.-J., Bouchet, P., & Klare, G.Szeifert,
1993, A&A, 280, 508K. A. 1997, in ASP Conf. Ser. 120, Luminous Blue Variables :Venn,
Massive Stars in Transition, ed. A. Nota & H. J. G. L. M. Lamers (SanFrancisco : ASP), 95
N. R. 1977, ApJ, 215,Walborn, 531982, ApJ, 256,ÈÈÈ. 452N. A., Barlow, M. J., Monk, D. J., & Clegg, R. E. S. 1991, in IAUWalton,
Symp. 148, The Magellanic Clouds, ed. R. Haynes & D. Milne(Dordrecht : Kluwer), 334
B., Stahl, O., Smolinski, J., & Cassatella, A. 1988, A&AS, 74,Wolf, 239
Related Documents


