Eindhoven University of Technology MASTER Innovation, technological specialization, and income inequality new evidence from EU countries and regions Muhammad Yorga Permana, . Award date: 2017 Disclaimer This document contains a student thesis (bachelor's or master's), as authored by a student at Eindhoven University of Technology. Student theses are made available in the TU/e repository upon obtaining the required degree. The grade received is not published on the document as presented in the repository. The required complexity or quality of research of student theses may vary by program, and the required minimum study period may vary in duration. General rights Copyright and moral rights for the publications made accessible in the public portal are retained by the authors and/or other copyright owners and it is a condition of accessing publications that users recognise and abide by the legal requirements associated with these rights. • Users may download and print one copy of any publication from the public portal for the purpose of private study or research. • You may not further distribute the material or use it for any profit-making activity or commercial gain Take down policy If you believe that this document breaches copyright please contact us providing details, and we will remove access to the work immediately and investigate your claim. Download date: 21. Aug. 2018

Welcome message from author
This document is posted to help you gain knowledge. Please leave a comment to let me know what you think about it! Share it to your friends and learn new things together.
Transcript

Eindhoven University of Technology
MASTER
Innovation, technological specialization, and income inequality
new evidence from EU countries and regions
Muhammad Yorga Permana, .
Award date:2017
DisclaimerThis document contains a student thesis (bachelor's or master's), as authored by a student at Eindhoven University of Technology. Studenttheses are made available in the TU/e repository upon obtaining the required degree. The grade received is not published on the documentas presented in the repository. The required complexity or quality of research of student theses may vary by program, and the requiredminimum study period may vary in duration.
General rightsCopyright and moral rights for the publications made accessible in the public portal are retained by the authors and/or other copyright ownersand it is a condition of accessing publications that users recognise and abide by the legal requirements associated with these rights.
• Users may download and print one copy of any publication from the public portal for the purpose of private study or research. • You may not further distribute the material or use it for any profit-making activity or commercial gain
Take down policyIf you believe that this document breaches copyright please contact us providing details, and we will remove access to the work immediatelyand investigate your claim.
Download date: 21. Aug. 2018

Eindhoven, January 2017
Master Thesis
Innovation, Technological Specialization, and Income inequality:
New evidence from EU countries and regions
by Muhammad Yorga Permana
identity number 0937688
In partial fulfilment of the requirements for the degree of
Master of Sciences
in Innovation Sciences
First Supervisor Dr. Carolina Castaldi (Faculty of Industrial Engineering and Innovation Sciences)
Second Assessor Dr. Z. Onder Nomaler (Faculty of Industrial Engineering and Innovation Sciences)

ii
Eindhoven University of Technology,
Department of Industrial Engineering and Innovation Sciences
Series Master Theses Innovation Sciences
0EM06: MSc thesis Innovation Sciences
Keywords: innovation, income inequality, technological specialization, technological diversification,
economic development, patenting, ICT, automation.

iii
Acknowledgement
All praise belongs to Allah: The Lord of the universe; the Compassionate; and the Merciful.
Have you ever been in love with something? At least, I experienced this feeling on the knowledge
during the semester I wrote this master thesis project. I remembered a couple of weeks when I
struggled with dozens of papers, books, and articles. Although it was exhausted, at the same time I
was really amazed to the way how knowledge has been accumulated over time. New discoveries were
continuously built upon previous discoveries. It made me feel as a dwarf which, as expressed by Isaac
Newton, ‘was standing on the shoulder of giant’. Realizing that I started to involve in a long
trajectory of knowledge, I began to enjoy the research process. Afterwards, my admiration on
knowledge gradually turned into love. In our relationship, sources of happiness were as simple as
finding a significant effect in a regression test; or finding a theoretical justification of my correlation
result from prior studies.
For all the entire memorable writing process, I would like to thank to a number of people whose
contributions are valuable. Firstly, my thankful is dedicated to my supervisor Carolina Castaldi for her
guidance during my master thesis project. Her abundant supports and suggestion are really valuable
for me. She even encouraged me to continue my research as a topic for PhD. Secondly, I would also
like to express my gratitude to Onder Nomaler as my second assessor. He was the one who challenged
me to improve my work in order to avoid ‘a sufficient but boring master thesis output’.
In addition, I would like to thank Prof. Floortje Alkemade and the former Bert Sadowski for their
professionalism in managing Innovation Sciences program. I feel so lucky to be part of this master
program. The whole two years of my study has widened my view of innovation: it is not only about
the introduction of a new technology. More than that, it is also regarding how the impact and its
interaction with the society. I am also indebted to Indonesian government who has provided LPDP
scholarship as my financial sponsor, which makes studying abroad become ‘a dream come true’ for
everyone.
Finally, I would like to thank my family and friends who have morally supported me to finish my
study on time. In particular, my thankful is dedicated to my parents for showing me the world and
making me become a person I am today; and to my beloved wife, Widya Norma Insani, for being the
best soul mate in love and the best companion in life, in study, and in travelling around the world.
Hopefully, this study will contribute to the economics of innovation discourse. Knowing the myth (or
fact?) that most of master theses are only read by the author themselves and their supervisors, I realize
that this master thesis is not an end for my research. Instead, this is just the beginning of my
intellectual journey. Much more efforts are needed to develop this study to make it becomes more
valuable.
Enjoy reading!
Muhammad Yorga Permana
Eindhoven, January 2017

iv
Executive Summary
In recent years, the relationship between innovation and income inequality has been widely discussed.
There is no doubt that innovation plays a key role for long term economic growth. Nevertheless, a
concern then has been raised regarding how the benefits of innovation are distributed: whether they
are distributed fairly to the entire society or only concentrated in a relatively small number of
individuals. If the latter occurred, then innovation may affect the rise of income inequality. The
concern is supported by the fact that income inequality in most advanced countries has been
increasing significantly started from the last technological revolution of digital technology in the
beginning of 1980s until now.
This study contributes to the discourse by providing an empirical evidence from panel studies at EU
country and regional levels to investigate the extent in which innovation relates to income inequality.
Besides, this study also proposes a new evidence showing that the effect of innovation on the income
inequality does not only in regard to its intensity. More than that, this study takes the effect of the
degree of concentration of innovation activities (i.e technological specialization) into account.
Concentrating innovation activities into few narrow sectors also may lead to the rise of income
inequality.
Hypotheses
The first tested hypothesis is that innovation increases income inequality. There are at least three
theoretical arguments supported this hypothesis. The most prominent theory explaining this
relationship is skill-biased technical change (SBTC). The theory proposes that innovation may not
affect all parties but rather may be ‘biased’: benefit for high-skilled workers but detriment to those
with low skilled. Thus, it leads to the wage polarization between high-skilled and low-skilled. Another
theory comes from Rosen (1981) and Brynjolfsson and McAfee (2014) who introduces the superstars
concept. According to them, innovation allows superstars to gain larger size of market and reach
larger number of people. It then leads to the increase of the share of top earners (i.e superstar) in the
society. Lastly, the rise of income inequality is caused by the monopoly rents benefited by
entrepreneurs due to their innovation activities. Since number of entrepreneur is far fewer than total
workers, the distribution of income then tends to be more unequal.
The second hypothesis is that technological specialization increases income inequality. Theoretically,
the effect of technological specialization on income inequality occurs through two channels. First of
all, concentrating innovation into few narrow sectors increases between-sector wage differences as the
more innovative sectors increase the demand for high skilled workers. Secondly, specialization also
increases income inequality within sectors particularly in those high technology sectors. It means that
although sectors with higher innovation activities could generate higher growth, the benefits are
biased. The benefit of growth is only reaped by high skilled workers while those middle and low
skilled workers tend to suffer as now demand for their skills relatively lower.

v
Empirical methods
To test the hypotheses, a series of fixed effect panel regressions are conducted. The core of this
empirical study is carried out at EU country and NUTS 1 regional level. For the country level, the
data covers the period 1998 - 2014 (17 years) while for regional level it covers the period 2004 - 2011
(8 years). The choice of EU countries and regions as the case for this empirical study is based on three
reasons. Firstly, most of the countries in EU experienced the rise of inequality in recent decades;
secondly, the dataset for supporting the research are well provided; and thirdly, there is less evidence
linking innovation, technological specialization, and inequality in European case in comparison to
those in U.S. Innovation as the independent variable for testing the first hypothesis is measured by
patenting activities. Meanwhile, technological specialization as the second independent variable is
measured by Revealed Technological Advantage (RTA) index. Several measures of income inequality
are included alternately as the dependent variables, including Gini index, shares of top income, and
the ratio of income percentile.
Results and conclusion
The results show positive and significant correlations between innovation and income inequality both
at country and regional level of EU. The most significant effect is found when using 3 years of time
lag in innovation activities as independent variable. It suggests that patent, as proxy of innovation,
needs a time lag since its priority year to affect the income distribution. By using several measures of
inequality, this study also provides further evidence regarding how innovation affects the income
distribution. Innovation does not only affect total income inequality as measured by Gini index, but
also affects top income inequality as measured the shares of top 1% and top 10% income as well as
the top-half income distribution as measured by 90:50 percentile of income ratio. Meanwhile, for the
bottom-half of income distribution, the correlation is weak.
Furthermore, this study also found the significant correlation between technological specialization and
income inequality. Countries/regions tend to have higher level of income inequality if they
concentrate innovation activities into few narrow sectors. In contrast, diversifying innovation
activities into broad sectors will help them to restrain income inequality. Similar to the innovation
intensity model, the most significant effect for the second model is notice when using 3 years of time
lag in technological specialization as independent variable. The effect of technological specialization
are also there on the top-half income distribution and top income inequality as measured by shares of
top 10% and top 1% earners. Interestingly, technological specialization effect on income inequality is
stronger when innovation intensity variable is included to the model. It suggests that innovation and
technological specialization intertwine with each other in affecting the rise of income inequality in
recent decades.
The novelty of this study is regarding the findings on the effect of innovation on several measures of
income inequality. Innovation affects not only total income inequality but also on top-half of
distribution and top income inequality in particular. It is also the first study which considers the effect
of technological specialization on income inequality. Many previous studies focus on how the
intensity of innovation activities affects income inequality. However, not any of them discuss the
impact of the degree of its specialization. This study provides only the initial evidence linking
technological specialization and income inequality.

vi
Policy implication
This study presents two important issues that might be useful to be considered for formulating
innovation policies in EU. It should be noted that EU has set several targets for achieving inclusive
growth to ensure the benefits of growth reach all parts of the society (European Commission, 2012).
Since this study provides the evidence that innovation activities are strongly correlated with income
inequality, laissez-faire innovation policies should not be continued. Otherwise, boosting the
innovation activities, as suggested by ‘Innovation Union’ initiative, only leads to the worse income
inequality. Further research has to be done in order to redirect innovation activities toward a more
inclusive outcome especially for those middle skilled and low skilled workers and for the entire
society in general.
The second finding leads to a more promising policy implication. This study suggests that
concentrating technology into few narrow sectors tend to increase inequality. Hence, while it is
impossible to limit innovation activities, this study suggests that diversifying innovation into broad
sectors would help EU countries and regions to restrain income inequality. Even further, increasing
technological diversification is not only able to create more equal society, but also to generate higher
growth. One of EU 2020 initiatives is to build a platform to assess strength and weakness of countries
innovation activities in order to help each country to build their competitive advantage. Instead of
only focusing to the strength of countries, this assessment should also consider the solution in
improving the weakness for each country. In doing so, countries tend to not only concentrate their
innovation activities on their strength sectors, but also try to diversify their activities into sectors
which have long been regarded as their weakness.

vii
Table of Contents Acknowledgement ................................................................................................................................. iii
Executive Summary ............................................................................................................................... iv
Table of Contents .................................................................................................................................. vii
List of Tables ....................................................................................................................................... viii
List of Figures ........................................................................................................................................ ix
Chapter 1 Introduction ............................................................................................................................ 1
1.1 Background ................................................................................................................................... 1
1.2 Research question ......................................................................................................................... 2
1.3 Research method ........................................................................................................................... 2
1.4 Report structure ............................................................................................................................. 4
Chapter 2 Theory and hypotheses development ..................................................................................... 5
2.1 Inequality and some related concepts ........................................................................................... 5
2.2 Innovation, technological specialization, and growth ................................................................... 9
2.2.1 Innovation leads to growth ..................................................................................................... 9
2.2.2 Technological specialization leads to growth ...................................................................... 10
2.3 Building the hypotheses .............................................................................................................. 11
2.3.1 Hypothesis 1: Innovation increases income inequality ........................................................ 11
2.3.2 Hypothesis 2: Technological specialization increases income inequality............................ 16
Chapter 3 Empirical Methods ............................................................................................................... 20
3.1 The relevance of European countries and regions case .............................................................. 20
3.2 Data description .......................................................................................................................... 21
3.2.1 Innovation as independent variable ...................................................................................... 21
3.2.2 Technological diversification as independent variable ........................................................ 23
3.2.3 Income inequality as dependent variable ............................................................................. 25
3.2.4 Control variables .................................................................................................................. 28
3.3 The model and econometric strategy .......................................................................................... 31
Chapter 4 Empirical Findings and Discussion ...................................................................................... 34
4.1 The effect of innovation .............................................................................................................. 34
4.1.1 Results of basic model at country level................................................................................ 34
4.1.2 Other robustness checks ....................................................................................................... 38
4.1.3 Innovation and top income inequality .................................................................................. 39
4.1.4 Results at regional level ....................................................................................................... 40
4.2 The effect of technological specialization .................................................................................. 41
4.3 Discussion of the empirical findings ........................................................................................... 42
4.3.1 Evaluating the first hypothesis ............................................................................................. 42
4.3.2 Comparing the result to previous empirical works .............................................................. 43
4.3.3 Innovation in ICT and automation sectors ........................................................................... 46
4.3.4 Evaluating the second hypothesis ........................................................................................ 48
4.3.5 Is there trickle-down from innovation to poverty reduction? .............................................. 51
4.3.6 Reverse causation: Is income inequality good for innovation? ............................................ 53
Chapter 5 Conclusion ............................................................................................................................ 55
5.1 Answering the research question ................................................................................................ 55
5.2 Concluding remarks and directions for future research .............................................................. 56
5.3 Policy implication for EU ........................................................................................................... 57
References ............................................................................................................................................. 59

viii
Appendix
Appendix 1 List of group observation at country and regional level ................................................ 66
Appendix 2 WIPO IPC-Technology Concordance Table ................................................................. 70
Appendix 3 Descriptive Statistics ..................................................................................................... 71
Appendix 4 Regression results .......................................................................................................... 81
List of Tables Table 1 List of variables ....................................................................................................................... 30
Table 2 A guide to choose the fit model in panel data analysis ............................................................ 32
Table 3 Findings as compared to previous studies................................................................................ 46
Table 4 List of EU countries ................................................................................................................. 66
Table 5 List of EU NUTS 1 regions ..................................................................................................... 67
Table 6 WIPO 35 technological fields based on Schmoch (2008) ....................................................... 70
Table 7 List of variables ....................................................................................................................... 71
Table 8 Summary statistics at country level 1998 - 2014 ..................................................................... 72
Table 9 Summary statistics at regional level 2004 – 2011 .................................................................... 72
Table A.1 Innovation versus income inequality at country level (basic model) ................................... 35
Table A.2 Innovation versus income inequality at country level with various time lag ....................... 36
Table A.3 Innovation versus income inequality at country level .......................................................... 37
Table A.4 R&D Expenditure versus income inequality at country level .............................................. 81
Table A.5 Innovation versus income inequality at country level with moving average ....................... 82
Table A.6 Innovation versus alternative measures of income inequality at country level .................... 83
Table A.7 Innovation versus top income inequality at country level.................................................... 84
Table A.8 Pearson correlation between measures of inequality ........................................................... 85
Table A.9 Innovation versus income inequality at regional level (basic model) .................................. 85
Table A.10 Innovation versus income inequality at regional level with various time lag and moving
average .................................................................................................................................................. 86
Table A.11 Innovation versus alternative measures of income inequality at regional level ................. 87
Table A.12 Technological diversification versus income inequality at country level (basic model) ... 88
Table A.13 Technological Diversification versus alternative measures of inequality at country level 89
Table A.14 Technological Diversification based on hierarchical IPC code at county and regional level
.............................................................................................................................................................. 90
Table A.15 Innovation versus inequality at country level with various panel model regressions ........ 91
Table A.16 ICT Patents, Hightech Patents, Biotech Patents and Energy Patents versus inequality at
country level.......................................................................................................................................... 92
Table A.17 ICT Patents versus several measures of inequality at country level .................................. 93
Table A.18 ICT Patents versus several measures of inequality at regional level ................................. 94
Table A.19 Patents based on first class IPC code (A to H) versus inequality at country level ............. 95
Table A.20 Innovation versus absolute household income at country level ......................................... 96
Table A.21 Innovation versus shares of household income at country level ........................................ 97
Table A.22 Innovation versus decile shares of household income at country level ............................. 98
Table A.23 Innovation versus poverty rate at country level ................................................................. 99

ix
List of Figures Figure 1 patenting activities versus Gini index in EU most innovative countries 1980 to 2010 .......... 20
Figure 2 Relation between patenting activities, inventions and innovations ........................................ 22
Figure 3 EPO patent applications per million inhabitant in EU Countries 2014 .................................. 23
Figure 4 Degree of technological diversification in EU countries 2014 ............................................... 24
Figure 5 Lorenz curve ........................................................................................................................... 25
Figure 6 Gini index in EU countries 2014 ............................................................................................ 26
Figure 7 Gini index in NUTS1 regions 2011 (UK, Sweden, France, Spain) ........................................ 27
Figure 8 Patent versus Gini in EU countries in 2000 and 2010 ............................................................ 44
Figure 9 Fixed effects model (LSDV) visualization for 3 countries .................................................... 45
Figure 10 Chicken-egg problem between innovation and income inequality ....................................... 54

x

1
Chapter 1 Introduction
1.1 Background Inequality has become a top issue among scholars in recent decades. It is now regarded as one of the
most crucial social problems. Not only because it hampers the economic performance (Stiglitz, 2012),
but it also has a direct impact on social instability (Wilkinson & Pickett, 2010). At the moment,
income inequality in most of developed countries is significantly higher than thirty years ago
(Atkinson, 2013). This fact is not compatible anymore with the Kuznets (1955) hypothesis which
suggests that income inequality tends to decline in rich countries in line with their economies develop
after passing the structural transition. Hence, in recent decades, many studies have been conducted to
find the explanation regarding this phenomenon.
One of the main factors considered as the determinant of income inequality is the role of innovation
and technological change. There is no doubt that innovation is the engine of long-term economic
growth [see e.g Schumpeter (1942) and Aghion-Howitt (1992)]. It was started over two hundred years
ago when technological developments, starting with the Industrial Revolution, underlay the “sudden,
sharp, and sustained jump in human progress” (Brynjolfsson & McAfee, 2014). Since then, the speed
of technological progress has never been slow. Instead, it experiences rapid growth since one
innovation commonly provides the new opportunity for various succeeding innovations.
Technological breakthroughs alternately act as the big bang, where the first industrial revolution is
followed by technological revolutions of steam engines, railways, electricity, automobile, mass
production, and ICT in sequences (Perez, 2009). Nevertheless, since the last revolution of digital
technology, a concern then has been raised regarding how the benefits of innovation are distributed:
whether they are distributed fairly or only concentrated in a relatively small number of individuals. If
the latter occurred, then innovation causes income inequality.
It seems that currently, innovations have threatened humanity with their unintended consequences. In
his recent book Rise of the Robots (2015), Martin Ford expresses his concerns about the fundamental
shift in the relationship between labor and machine. While in the past our basic assumption about
technology was that machine are tools which increase the productivity of labor, at the present time
machine themselves are turning into labor which potentially substitute human workers. Automation
waves attack a wide array of occupations: ATM swaps tellers; Google Calendar substitutes
secretaries; autonomous vehicles threaten drivers; and even in the future Artificial Intelligence
possibly replaces doctors, lawyers, and other professionals1.
This does not mean that all humanity suffer the loss in the race against innovation. On the contrary,
some parties even benefit from innovations. Firstly, the prominent theory namely ‘skill-biased
technical change’ proposes that the result of innovation may be ‘biased’: it only benefits high-skilled
workers but detriments to those with low skilled (See for instance Acemoglu (1998) and Autor, Levy
& Murnane (2003)). Another argument comes from Aghion et al (2015), revealing that innovation is
1 See for instances article from Richard Susskind and Daniel Susskind in Harvard Business Review
“Technology Will Replace Many Doctors, Lawyers, and Other Professional” (October, 2016):
https://hbr.org/2016/10/robots-will-replace-doctors-lawyers-and-other-professionals

2
benefited by entrepreneurs through monopoly rents that are enjoyed due to their innovation activities.
The last actors benefitting from innovations are a small number of superstars in various occupations
ranging from media, entertainment, corporate, and even sports. Innovation allows superstars to gain a
larger size of market and a reach larger number of people (Brynjolfsson & McAfee, 2014). As the
result of polarization between winners and losers, income inequality tends to rise along with the
increase of innovation activities.
Moreover, aside from the role of intensity of innovation activities in affecting income inequality, one
should also consider the role of diversification and specialization. The next question is: which one is
better for restraining the rise of income inequality, concentrating the innovation activities into few
narrow sectors (i.e increase technological specialization) or diversifying the activities across broad
sectors (i.e increase technological diversification)? While the relationship between innovation
intensity and inequality is widely discussed, surprisingly I find no previous literature discussing the
effect of innovation diversity to the rise (or fall) of income inequality. However, the similar pattern is
actually also there for technological specialization. Cantwell and Vertova (2004) for instance, found
the common tendency that all countries increasingly concentrate their innovation activities in the end
of 20 centuries. I assume this recent trend is also parallel with the increase of innovation intensities
and income inequality at the same time. Therefore, it is interesting to consider that technological
specialization may lead to the rise of income inequality.
1.2 Research question This study provides empirical evidence regarding how innovation and technological specialization
relate to income inequality. Referring to above-mentioned arguments, I expect to find a positive
correlation between them.
I choose to consider both country and regional level of European Union as the case of this study. EU
is relevant for this empirical study because firstly, most of the countries in EU experienced the rise of
inequality in recent decades; secondly, the dataset for supporting the research are well provided; and
thirdly, there is less evidence linking innovation, technological specialization, and inequality in
European case in comparison to those in U.S.
Thus, the study aims to address the following research questions:
1. To what extent does innovation relate to income inequality in EU countries and
regions?
2. To what extent does technological specialization relate to income inequality in
EU countries and regions?
1.3 Research method
To answer the research questions, firstly, it is important to develop strong hypotheses that are
constructed from previous literature, both theoretical and empirical studies, which are related to the
topic.
Secondly, to test the hypotheses, I use panel data statistical analysis on the combination of time series
(t) data in the period of 1998-2014 and cross-sectional (i) data covering 31 countries and 84 NUTS 1
regions within the European Union. The core functions of the models are as follows:

3
First model for answering the first research question
𝑖𝑛𝑒𝑞𝑢𝑎𝑙𝑖𝑡𝑦𝑖𝑡 = 𝑓 (𝑖𝑛𝑛𝑜𝑣𝑎𝑡𝑖𝑜𝑛𝑖𝑡−ℎ, 𝑐𝑜𝑛𝑡𝑟𝑜𝑙 𝑣𝑎𝑟𝑖𝑎𝑏𝑙𝑒𝑠𝑖𝑡 , 𝑒𝑟𝑟𝑜𝑟𝑖𝑡)
Second model for answering the second research question
𝑖𝑛𝑒𝑞𝑢𝑎𝑙𝑖𝑡𝑦𝑖𝑡 = 𝑓 (𝑖𝑛𝑛𝑜𝑣𝑎𝑡𝑖𝑜𝑛𝑖𝑡−ℎ, 𝑡𝑒𝑐ℎ𝑛𝑜𝑙𝑜𝑔𝑖𝑐𝑎𝑙 𝑠𝑝𝑒𝑐𝑖𝑎𝑙𝑖𝑧𝑎𝑡𝑖𝑜𝑛𝑖𝑡−ℎ, 𝑐𝑜𝑛𝑡𝑟𝑜𝑙 𝑣𝑎𝑟𝑖𝑎𝑏𝑙𝑒𝑠𝑖𝑡 , 𝑒𝑟𝑟𝑜𝑟𝑖𝑡 )
As the dependent variable, I distinguish between total income inequality and top income inequality.
Total income inequality is measured by the Gini index while top income inequality is measured by the
share of top 1% and top 10% richest among the country/region. It should be noted that one of the most
important reasons determining unequal distribution is because incomes are highly concentrated in a
small numbers of individuals. Hence, the consistency is checked, whether the explanatory variables
affect both total and top income inequality.
In the first model for answering RQ1, innovation as independent variable is measured by the number
of European Patent Office (EPO) patent applications per inhabitants. Patent statistics provide a fairly
reliable measure of innovation due to its “availability in great abundance” (Comanor & Scherer,
1969). Furthermore, patent statistics are unique since they provide the long historical time series
(Cantwell & Vertova, 2004) and roughly comparable between countries and regions (Lee, 2011).
In the second model for answering RQ2, I use the modification of Revealed Technological Advantage
(RTA) index which acts as the proxy of technological specialization as the independent variable. RTA
index is commonly used in previous studies related to technological specialization (see for instance
Soete (1980), Cantwell & Vertova (2004), and Savorelly & Picci (2013)) because this index allows to
control inter-sectoral and inter-countries/regions differences in the propensity to patent (Cantwell,
Gambardella, & Granstrand, 2004).
Several control variables are included in the model to consider the presence of other potential
explanatory variables associated with income inequality. Furthermore, the presence of time lag for the
independent variable is also considered in this study. Several studies found that the impact of patent
applications to the society is noticeable with a time lag of 2 to 3 years after the priority year (See for
instance Ken et al (2008) and Ernst (2001)).
Most of the data are drawn from Eurostat and PENN World Table while inequality variables at the
regional level are obtained from an inequality study from Ramos and Royuela (2014). RTA index is
calculated from the World Intellectual Property Organization (WIPO) patents statistics relying on 35
technological fields.
The next step is to find which model fit best for this panel dataset. Several models are considered
including pooled OLS regressions, Fixed Effect model, Random Effect Model, Instrumental Variable,
or Dynamic Panel Model. Several tests are done to choose the best model among them.
Thirdly, with the data at hand and after deciding the best model, a series of panel models will be
regressed. The results then are interpreted and analysed for evaluating the hypotheses. For the
validation and sensitivity analysis, several strategies are conducted including (1) substituting
independent variables with other alternative measures of innovation, (2) substituting dependent
variables with other alternative measures of inequality, (3) extending and shortening the time span of
the observations, (4) increasing and decreasing number of group observations, and (5) testing the
independent variable with various choice of time lag. In doing so, it can be checked if the models are
robust.

4
1.4 Report structure This study is organized as follows: Chapter one serves as introduction including the background,
research question, and research method. Chapter two discusses the several theoretical issues on
inequality, innovation, and technological specialization from previous literature. The hypotheses
regarding the effects of innovation and technological specialization on income inequality are also
constructed in this chapter. In Chapter three, empirical methods to test the hypotheses are discussed.
It consists of the relevance of Europe continent as case study, measurement and dataset explanations,
and econometric strategy for the model. Chapter four presents the results of empirical studies, the
interpretations, the robustness checks, and discussion of the findings. Finally, the conclusions for this
study followed by policy implication are drawn in Chapter five.

5
Chapter 2 Theory and hypotheses development
2.1 Inequality and some related concepts In understanding the basic concept about inequality, several scholars distinguish between the concept
of inequality of outcome/result and inequality of opportunity (see for instance Atkinson, 2015).
Inequality of outcome arises from a combination of differences in ‘circumstances’ and individual
‘efforts’ (Dabla-Norris, Kochhar, Suphaphiphat, Ricka, & Tsounta, 2015). Meanwhile, inequality of
opportunity attributed to the differences in individual ‘circumstances’ beyond the individual control
such as gender, ethnicity, or family background as the determinant of the economic outcome (Dabla-
Norris et al, 2015; Atkinson, 2015). Thus, inequality of opportunity as an ex ante concept might lead
to inequality of outcome as an ex post concept (UNDP, 2013; Atkinson, 2015).
Some economists emphasise the concept of inequality of opportunity and put this term into the
development discourse main focus. Introducing the philosophy of ‘development as freedom’, Amartya
Sen (1999) argues that the primary objective of development is to make sure people could pursue their
freedom to choose and to act. This also means that all people must have equal opportunity no matter
how their backgrounds are. Circumstances (e.g gender, race, or family background) must not play role
in resulting outcome anymore.
However, it does not mean that inequality of outcome is irrelevant. While it is true that equal
outcomes cannot be achieved without equal opportunities, on the other hand equal opportunities
cannot be achieved when households have unequal starting points (UNDP, 2013). Atkinson (2015)
provides three reasons why inequality of outcome is important. Firstly, difference of outcomes still
matters even if ex ante equality of opportunity exist because of the reason of morality: unlucky
persons should be helped. Secondly, Atkinson emphasises the existence of a highly unequal
distribution of prizes/reward structure in recent world that leads the inequality of outcome to become
worse. The last reason is because inequality of outcome among today’s generation is the source of the
unfair advantage received by the next generation. In other words, inequality of outcome might
become an ex ante concept for the next generation’s circumstances.
Inequality of outcome, or also well known as economic inequality, is commonly measured by income,
wealth, or consumption. It concerns variations in living standards across a whole population.
Inequality might be typically thought of as differences between individuals within a population or
between groups of people (McKay, 2002). Income inequality is the most commonly cited measure
because of its most comprehensive data (The Economist, 2014). Income inequality measures the
distribution of income across households or individuals in a population (UNDP, 2013) which consists
of income from earnings (salary, wage, and incomes for those who are self-employed) and income
from savings which are obtained from interest, dividend, or rent on property owned (Atkinson, 2015).
The second type of economic inequality is wealth inequality which refers to the total amount of assets
of an individual or household. While income is considered as an annual flow variable, wealth is a
stock variable which is the result of the accumulation of savings, return of investments, and
inheritance over years (Milanovic, 2016). For that reason, interestingly, Milanovic (2016) argues that
wealth inequality is greater than income inequality in almost every country.

6
The last one is inequality of consumption. This type of inequality to some extents provides a better
proxy of social welfare since people’s living standards depend on the amount of consumption instead
of the amount of money they obtain (The Economist, 2014). Moreover, consumption inequality can
reveal the different insight of inequality as compared to income for instance regarding how the
relative prices of goods consumed by rich and poor households (Attanasio & Pistaferri, 2016).
Nevertheless, Atkinson (2015) reminds that consumption inequality might be hard to measure. For
instance, he notices how different researchers have adopted different approaches how to include the
spending of education and medical care into consumption expenditure. Moreover, several goods (e.g
alcohol and cigarettes) are also under-reported in consumer surveys.
Why inequality matters
Indeed it is impossible to create total equality in the world. Since there must be differences in people
economic outcomes due to their efforts and luckiness, one might question why inequality really
represents a problem. Early development thinkers believe that inequality does not matter. Kuznets
(1955) for instance proposes that inequality is an acceptable consequence of the structural
transformation. As a country develops, inequality then will stop increase and start the downward slope
following an inverted U curve. However empirical evidence shows that high level of inequality
occurred in many developed countries in recent three decades opposing Kuznets hypothesis. Atkinson
(2015) suggests that the present level of inequality is excessive, while Stiglitz (2012) stresses that the
increase of inequality tends to change our economies, our democratic politics, and our societies. Here
will be provided four arguments suggesting why inequality matters.
The first argument comes from moral perspective. Inequality is a bad thing simply because it involves
a deviation from equality (Beitz, 2001) and fairness (Temkin, 2003). Inequality reflects the inability
of a society to include all groups in welfare enhancement (UNDP, 2013). When one interest group
holds too much power in a society, it might lead to the unfairness: policies will benefit them rather
than societies as a whole and their political power tend to divert revenues into the pockets of few
instead of benefiting society at large (Stiglitz, 2012). Inequality creates the unfairness of political
decision making procedures by causing some interests to be weighted more heavily than they should
be (Beitz, 2001). Additionally, in regard to human wellbeing, relative income which is determined by
income distribution is perhaps much stronger related to happiness compared to absolute income.
Classical economists have previously suggested that individuals are motivated by concerns regarding
their relative position, as what John Stuart Mill quoted that "men do not desire to be rich, but richer
than other men" (Luttmer, 2005).
Secondly, inequality is closely related to poverty (McKay, 2002). Although some scholars argue that
overcoming poverty is more important in comparison to reducing inequality (e.g. Feldstein (1999)), in
fact it is difficult to separate them. By assembling the evidence from fifteen OECD countries,
Atkinson (2015) reveals that higher poverty tends to go together with larger top shares of income.
Additionally, empirical research from Wade (2005) proposes that inequality leads to a lower
contribution of economic growth to poverty reduction while Ravallion (2005) shows that the elasticity
of poverty reduction is related to initial level of inequality in a country and to change in income
distribution. Thus, by the evidence, it could be claimed that inequality tends to impede poverty
reduction.
The third reason is because inequality weakens macroeconomic performance (Stiglitz, 2012; Alesina
and Perotti, 1994; Persson and Tabellini, 1994). Since rich individuals consume a smaller share of
their income than lower-income individuals do, total demand in the economy will be less than what

7
the economy is capable of supplying (Stiglitz, 2012). This deficiency of aggregate demand thus leads
to poor economic performance. Stiglitz (2012) also argues that inequality tends to lower public
investment in infrastructure, education, and technology. The more divided a society, the more
reluctant the wealthy are to spend money on common needs. This is in line with empirical evidence
from Deininger and Squire (1998). Using cross-sectional analysis of 44 countries, they contend that
inequality decreases education investment. In addition, Alesina and Perotti (1994) suggest that high
income inequality leads to poor economic performance through the social tensions and political
instability that increased uncertainty. Hence, it causes the lower investment rate which related to
economic performance. Meanwhile, Persson and Tabellini (1994) introduce the median voter theorem
which considers the poor median voter as the factor of poor growth. According to them, if society is
unequal and the median voter is located on the poor position, government will put in higher tax rate,
thereby economic growth will decrease.
Lastly, aside to economic and political consequences, social instability is considered as the direct
impact of inequality. Looking at the 50 richest countries in the world, Wilkinson and Pickett (2010)
claim that inequality seems to be associated with decreased levels of life expectancies and educational
performance as well as the increase level of numerous social problems such as homicides, crime rate,
underage pregnancies, and mental illness. In particular, the empirical study from Kawachi and
Kennedy (1999) posits the impact of inequality on individual’s health. They suggest that individual’s
health is not only affected by his personal income but also the distribution of income within society.
Theoretically, the effect of income inequality on health is mediated by the underinvestment in public
goods, disruption of social cohesion, and the destructive psychosocial effects of social comparisons.
In addition, Stiglitz (2012) supports the argument by revealing that high levels of criminality and
social instability were there in many unequal countries for decades.
The relation between inequality and economic growth
The relationship between the level of income and its distribution has been discussed in the economic
literature for a long period. The prominent hypothesis of Simon Kuznets (1955) initially examines the
relationship and become the basic foundation of many studies regarding inequality and growth
relationship in the following years. Kuznets proposes the existence of an inverted U-shape curve that
graphs economic level against inequality. He theorizes that inequality is driven by structural economic
transition as a result of the transition from agricultural to industrial society. Kuznets states that as a
country starts to industrialize and average income grow, at first there will be positive correlation
between income level and inequality. After reaching the peak point, the inequality will decrease
which means negatively correlated with the income. It then results an inverted U-shape curve.
Kuznets (1955) explains his hypothesis as follows. In the traditional development phase, a country
commonly starts from agriculture-based production as the major driver of its economy. In this initial
structure, both income and productivity are low. As the country begins to industrialize, productivity
rises along with the mechanization process. Thus, level of income rises. Since the economic activities
are concentrated in cities, urbanization occurs and resulting the decrease of rural population and the
increase of rural population. It leads to widening gap between the urban and the rural income.
Afterwards, industrialization continues generating more income which leads to restructuring of labor
payment. As a result, inequality decreases along with higher level of income (Kuznets, 1955).
A number of empirical studies have been conducted to verify Kuznets hypothesis. However, the
results vary: some confirm the existence of Kuznets curve while the others reject it. The confirmation
for instance comes from Ahluwalia (1976) who empirically finds the inverted U curve by using cross

8
section data consist of 60 countries and from Campano and Salvatore (1988) who re-examines
Kuznets hypothesis by looking the evidence from 143 observations in 95 countries. Meanwhile, the
opposition comes from a study by Papanek and Kyn (1986). Assembling cross-section and time series
data for 83 countries, they show that growth does not affect income distribution significantly.
Interestingly, more studies were conducted regarding the opposite direction of the inequality-to-
growth relationship instead of growth-to-inequality as originally proposed by Kuznets. The empirical
results among those studies also did not meet the consensus. Persson and Tabellini (1994) and Alesina
and Perotti (1996) confirm that inequality is harmful for economic growth whereas some other posit
that inequality-growth relationship depends on the different context. For instance, Deininger and
Squire (1998) suggest that inequality reduces income growth for the poor but not for the rich while
Barro (2000) find that higher inequality tends to impede growth in poor countries but encourage
growth in richer ones. Another finding comes from Li and Zou (2002). Their observations on 46
countries reveal that association between inequality and growth is complicated: the panel analysis
suggest that inequality positively influenced growth but the cross section analysis reveal a reverse
result. Benerjee and Duflo (2003) also doubt the validity of previous empirical studies and posit that
there is no strong ground for thinking that inequality and growth is related in a linier structure. Thus
they claim that there is no sufficient evidence whether inequality is good or bad for growth.
Those dissimilarities of empirical findings led to rising dissatisfaction with Kuznets hypothesis in
recent economic discourse. This also arose due to the increase of inequality in recent three decades
that occurred in most of developed countries. Thus it was not compatible anymore with the Kuznets
hypothesis which suggests that income inequality tend to decline in rich countries. Inequality-growth
relationship transformed into an upward sloping curve once more. Kuznets inequality is low at initial
low income levels then rises as the economic developed but eventually it falls again at high income
level started from 1980s.
Nevertheless, Galbraith (2012) argues that the increasing trend of inequality is fully consistent with
the spirit of Kuznets hypothesis. Kuznets hypothesis is built on the basis argument that inequality is
driven by the economic structure and inter-sectoral dynamics. According to Galbraith (2012), this
argument could explain why in most developed countries inequality tends to rise again after a period
of decline. If Kuznets originally revealed that inequality was increasing due to the transition from
agricultural to industrial economy, then this second upward slope of inequality trend occurred due to
the economic transition from manufacturing sector to service or finance sectors. Hence it has changed
wages and profits distribution once more. Galbraith then introduces the concept of Augmented
Kuznets curve with a second turning point at a high level of income.
The revisiting argument from Galbraith is then supported by Milanovic (2016) who proposes the
extension of Kuznets hypothesis namely Kuznets wave. Milanovic attempts to explain the alternation
between the increase and decrease in inequality by using historical data in several countries from pre-
industrial age. He distinguishes between pre and modern period by the occurrence of Industrial
Revolution, arguing that before Industrial Revolution there was no relationship between income and
inequality. Furthermore, after the IR, income and inequality entered into a relationship due to
structural change along the lines as proposed by Kuznets. As the economic developed, the inequality
began to decrease as the supply of economic labor and the demand of redistribution increased.
Milanovic names this as a ‘benign’ mechanism that softly reduces the inequality. Apart from that,
Milanovic also introduces ‘malign’ mechanism consisting wars and civil conflict as the driving force
of the decline of inequality.

9
Both forces that drove inequality down had come to an end by the 1980s. The second Kuznets curve
for developed countries began, driven by second technological revolution characterized by changes in
information technology and globalization. This revolution, like the past Industrial revolution, again
widened income disparities. However, the downward portion of second Kuznets wave will not be
expected to occur automatically by trickle down mechanism. Milanovic thus proposes several benign
strategies that must be taken by those rich countries.
Meanwhile, Piketty (2014) in his recent book Capital in the Twenty-First Century rejects the
‘optimistic prediction of Kuznets’s theory’, arguing that income inequality would not automatically
decrease in advanced phases of development. According to him, inequality of income did not decrease
in a structural sense which was based on the idea about urbanization and gradual mechanical shift
labor as described by Kuznets. Apparently it declined due to the economic shock of the Great
Depression and the military shock of World War II as exogenous events. Thus he was sceptical with
the argument that inequality will decrease automatically in the recent second wave of structural
transformation. By those reasons, he then called Kuznets hypothesis a ‘fairy tale’. Instead of reducing
inequality, Piketty argues that capitalist growth increases it.
2.2 Innovation, technological specialization, and growth
2.2.1 Innovation leads to growth
For many thousands of years, the global economy experienced a long period of stagnation in which
progress was very slow (Brynjolfsson & McAfee, 2014). However, just over two hundred years ago, a
significant and continuous increase in growth rate has started to ensue. Many theoretical and empirical
studies suggest that the large proportion of economic growth in last couple of decades is attributable
to technological improvement. Based on his historical study of technological progress, Mokyr (1992)
for instance, argue that technological change is more important than other factors such as capital
investment, trade increase, and economics of scale in determining long run of growth. Meanwhile,
Perez (2009) proposes five successive technological revolutions as major upheavals of the wealth-
creating potential of the economy over the last two centuries. According to her, each of the revolution
created a new trajectory which was then shaped by techno-economic paradigm. In each paradigm,
incremental innovations continuously improve the prior radical innovation. Both of them thus
contribute in determining the economic growth.
In the twentieth century where growth theory started to emerge, Schumpeter (1942) was the first
economist who emphasizes the role of innovation and technological change as the driving force of
economic growth. In his Capitalism, Socialism, and Democracy book (1942), Joseph Schumpeter also
firstly contended the role of entrepreneurs which associated to those who are able to innovate.
Entrepreneurs could reform and revolutionize the economic structure through the innovation which
according to him, is defined into broad type of technology possibilities. Those include the
introduction of (1) new commodity/product, (2) new method of production, (3) new source of supply,
(4) new expansion of market, or even (5) new type of organization. This ‘revolution’ of economic
structure is called ‘creative destruction’, refers to the incessant mechanism by which new innovation
destroying and replacing the old one. However, his theory regarding the role of innovation did not
attract a lot of attentions until the end of 1980s when endogenous growth models were introduced by
some scholars.
Meanwhile, in the neoclassical view, Solow (1957) growth model was the first one who put
technological change at the core of work. He assumes technology as the exogenous factor which is

10
inexplicably granted. The assumption supports the following works to calculate the contribution of
technological progress to economic growth. Technological contribution is obtained by subtracting the
rate of output (GDP) growth and the rate of input growth (labor force and capital accumulation).
Thus, the residual is labelled as total factor productivity, a proximate indicator of the technological
change impact on the growth. However, since the variable is assumed exogenous, the model is
insufficient in understanding the source of technological change. In his model, as the only endogenous
factor, capital accumulation still became the most important driver for the growth.
Endogenous growth theory arises in the late 1980s, challenging the traditional neoclassical view by
proposing the internal force influencing the technological progress. Unlike the Solow model that
treats technological progress as a black box, endogenous model attempts to elaborate how innovations
were generated intentionally. One of the most prominent endogenous models comes from Aghion and
Howitt (1992). They present a mathematical model based on Schumpeter idea of creative destruction,
as Schumpeter suggested that innovation revolutionizes the economic structure from within the
society. According to them, the growth is generated due to the incessant competition among firm’s
R&D. Research firms are motivated by the prospect of temporary monopoly rent that can be gained
when innovation is patented. Nevertheless, the rent then will be destroyed by the next innovation.
Although endogenous growth models attempt to formalize the Schumpeter view regarding innovation
as the heart of growth, criticism still comes for instance from evolutionary economists. The most
popular disapproval is related to the bounded rationality of individual decision making. Essentially,
evolutionary theory of growth also arose from the Schumpeterian view regarding the role of
innovation. The evolutionary approach emphasizes the complex mechanism of innovation as a result
of a constant interaction between variation and selection process (Verspagen, Innovation and
Economic Growth, 2005) while endogenous and neoclassical theory focus on the simplification of the
general mathematical growth model. To gain deeper understanding about this complex mechanism,
evolutionary approach also takes history into account to view how technology evolves and interacts
with the society and institutional context. Therefore, evolutionary approach proposes the importance
of the radical innovation and the following incremental innovations in a ‘technological trajectory’ as
the engine of economic growth (Perez, 2009; Verspagen, 2005).
This study does not go into further detail regarding the differences between neoclassical, endogenous,
and evolutionary model of growth. Instead, putting those together, it could be concluded that in most
of school of thoughts, innovation is widely accepted as the engine of the long term economic growth.
2.2.2 Technological specialization leads to growth
In this study I use the term of ‘technological specialization’ referring to the concentration degree of
innovation activities into particular sectors. ‘Innovation diversity’ and ‘technological diversification’
are also used interchangeably as the opposite meaning of the previous term. Furthermore, I assume
that the terms ‘industry’ and ‘sector’ have similar meaning referring to describe a group of activities
in the same segment of economy. Those are also used interchangeably. Low level of technological
specialization, similar to high level of diversification, means that a country (or region) tends to
diversify its innovation activities in broad sectors. In contrast, high level of technological
specialization (i.e low diversification) refers to condition where country (or region) concentrates its
innovation activities into few technological sectors.
The law of comparative advantage from classical economist David Riccardo suggests that country
specialization that arises from its endowment factors is beneficial in context of international trade.
Comparative advantage allows countries to produce a better quality of particular good efficiently with

11
lower cost comparing to others. Porter (1990) complements, if not called as reject, this theory by
adding the role of technological progress through the term of “competitive advantage”. According to
him, aside of their endowments, countries can create new factor advantages for themselves by
building strong industries in specific field through innovation.
Evolutionary economists like Dosi, Pavit and Soete (1990) propose an alternative view concerning the
reason why in terms of international trade countries tend to be specialized in particular sectors. Since
technological trajectory is generated from the accumulation of knowledge through historical
evolution, differences of technological capabilities and innovativeness across countries occur and thus
shaping the stable pattern of international trade. However, they also posit the possibility of countries
to diversify by creating new path of technology in new sector through the term of dynamic
capabilities. In addition, Laursen (2000) proposes that technology is important in determining some
sectors but not for the other. Innovation in technology intensive sectors, for instance, would benefit
the country as long as the lead could be kept before caught up by others. Assuming that technology is
not a free and universally available, country will gain advantage through monopoly rent until the
spillover effects to other sector or countries become significant.
Laursen (2000) moreover suggests that trade specialization and technology specialization are path
dependent, correlated, and co-evolve each other. It is reflected by his study about 19 OECD countries
for more than 20 years. According to him, the increase of patent activities in a sector offers higher
technological opportunities and affects the sector growth. Hence, through trade specialization,
technological specialization is indeed matter for overall economic growth. This is also supported by
Verspagen (1993) which explains how trade specialization, which is determined by technological
specialization, affects growth. Since total growth is driven by growth of export, if the competitiveness
of country in a sector is higher than the average, the country will be able to expand its sector market
share. Then it leads to the increase of total market share. In other words, he also posits that
specialization provides larger growth opportunities for countries.
2.3 Building the hypotheses
While there is no doubt that innovation and technological specialization are critical components of
economic growth, concern then is being raised as to how the benefits are distributed in society. The
further question is then relating to who reaps the largest reward of the growth: whether it is distributed
equally or only to a relatively small number of individuals. I argue both innovation and technological
specialization create unintended consequences for growth; that is the rise of inequality. In this section
I elaborate the proposed hypotheses based on theoretical arguments in previous studies.
2.3.1 Hypothesis 1: Innovation increases income inequality
Essentially, the discourse between technological change and income inequality had been started since
the early of nineteenth century when industrial revolution began along with the introduction of
mechanization which replacing labor jobs. The famous controversy regarding the role of machinery
came from Marx and Ricardo (Saint-Paul, 2008). Marx stressed that innovation made workers become
useless, leading to an increase in the share of capital owners. On the other hand, Ricardo and the
following neoclassical economists argued that innovation endorsed productivity in which single
worker is able to produce more output per unit of time. Thus it led to an increase in wages and living
standards.
Empirical evidence has shown that over the last two centuries there was the explosive growth of
living standards. It proved that the neoclassicists were right while Marx was wrong (Saint-Paul,
2008). Economists widely agreed that technological change and innovation would increase the labor

12
productivity, pushing up their incomes and generating economies. However, since 1980s, this
tendency has deteriorated. Although productivity and level of income still grow steadily, the wages
and income gap even widen. Not coincidentally, this was started in the period when second
technological revolution began. Therefore, the new explanation is needed to justify the role of
technological change in this phenomenon. In this section, several channels through which innovation
determines the rising inequality phenomenon in the last couple decades will be demonstrated. One
should note that those theories are not mutually exclusive. Instead, they might overlap in various
ways.
(1) Skill-biased technical change
Many scholars agreed that skill-biased technical change (SBTC) has been regarded as the major cause
of the rise in wage inequality (see Autor, Katz, and Krueger (1998), Acemoglu (1998), Acemoglu
(2002) and Violante (2008) for examples). The theory suggests that technology may not affect all
inputs but rather may be ‘biased’: benefit for some but detriment others. It is in contrast to traditional
economic model (e.g Solow Neoclassical model) where technology acts as a neutral factor assuming
that technology increases productivity for all labor (Violante, 2008).
According to the SBTC hypothesis, the introduction of new technologies increases the demand for
skilled labor relative to unskilled labor. In the last three decades, the wage of skilled labor has
increased dramatically relatively to unskilled labor. It was shown by the increase in wage differentials
by education in the relative earnings of college graduation. On the other hand workers without college
degrees were challenged with the stagnation of wages (see empirical evidence of US wage structure
and OECD country from Katz and Murphy (1992), Acemoglu (2002) and Autor (2010) for instances).
Aside from the increase in wage differentials, there was a large increase in the supply of educated
labor during the period. In US, for instance, the number of college enrolment was more than doubled
between 1960 and 1980. In the basic economy concept, greater supply leads to lower prices. However
in this case, the abundance amount of high skilled labor supply from college did not push down their
relative wages. The combination of higher wage and growing supply means that the relative demand
for high skilled labor increased even faster than supply. Here, new technologies are seen as
complementary to skills. Hence, individual whose level of education is higher will be rewarded.
One might question why new technology should complement skills, instead of replacing skilled labor
as occurred during nineteenth century. Acemoglu (1998) built a mathematical model to conclude that
new technologies are not complementary to skills by nature, but by design. In other words, inventors
tend to spend their efforts to build skill-complementary technologies due to the increase of educated
workers in order to obtain higher profit. Increase in the supply of skills induces faster upgrading of
skill-complementary technologies. Therefore, the theory of SBTC is closely related to endogenous
growth theory, suggesting that technology is not an outside force. Instead, the speed and the direction
are determined by the active role of economic players.
The extended models of SBTC then introduce by Autor, Levy, and Murnane (2003) and Acemoglu
and Autor (2011) to explain the interaction between technological change, skills, and tasks. They
found that the demand for worker fell most dramatically for routine tasks which are characterised by
middle-skilled cognitive or manual jobs. Routine tasks such as clerical work, repetitive production,
and monitoring jobs are easily codified by machines and consequently the labor input for those tasks
decline. On the contrary, the non-routine tasks cannot be replaced by machines. Instead, the non-
routine tasks workers and machines are even complemented each other. Autor, Levy, and Murnane
(2003) distinguish non-routine tasks into two major categories: (1) abstract tasks that require high

13
level of education and analytical capability and (2) manual tasks that require more physical activities.
The implication is that thus the market labor will be polarized, with the middle skilled labor which
work for routine jobs are replaced by machine while non-routine jobs at the low and high skills
distribution have held up relatively well.
In his The Rise of Creative Class, Richard Florida (2012) proposes different terms to identify the high
skill and low skill labor. He called them Creative Class and Service Class respectively. Indeed he also
realizes the empirical fact that job polarization has occurred in over the last decades. While Creative
and Service Class grew rapidly, the Working Class in the middle tend to decrease. According to him,
the growth of low-skilled Service Class indicates as a response to the demand of the Creative
Economy. As division of labor has deepened and the economy has become more specialized, the
Creative Class increasingly outsourced some functions to Service Class. In other words, he suggests
that the increase demand of the low skilled labos is the consequence of the increase demand of high
skill labor. In his study Florida also reveal the more knowledge-based economies closely related with
the increase of wage inequality, but do not related with total income inequality.
Another extension comes from Galor and Moav (2000) who introduce Ability Biased Technical
Change (ABTC) as complement to SBTC. According to them, the ‘biased’ of technological change
does not only occur between different levels of skill groups but also within skill groups which leads to
more unequal distribution of wage. It is not only education that is important for individuals but also
their ability. Thus it is also possible unequal wage premium occurs within the groups of high-educated
workers due to the variation in ability.
As suggested by Acemoglu (1998), it is difficult in general to determine which technologies are
complementary to skilled workers. Thus, technological change is often perceived as a ‘black box’. In
explaining the rising of wage inequality in last couple of decades, most of scholars believe that ICT
(leading by the introduction of microchip, personal computer, and internet) are the key determinant of
the ‘biased’. Autor, Katz, and Krueger (1998) for instance reveal that wage premium is higher in
industries with high indicator of computer usage, computer capital per worker, and the rate of
computer investment. However, aside from ICT, innovation in general also might be considered as the
determinant factor of the ‘biased’. It is for instance suggested by Michaelsen (2011) whose empirical
research uses R&D expenditure and patent data as approaches to measure innovativeness and
technological change to determine the wage inequality in UK manufacturing industry.
(2) Technological change and the rise of superstars
The rise of total income inequality in last couple decades is going along with the extensive increase of
top income shares. Atkinson, Piketty, and Saez (2011) provide the long run history of top income
inequality in twenty two countries suggesting that in most countries the significant portion of the
increases is caused by an increase in top labor income. Indeed skill-biased technical change is unable
to explain what is happening at the very top of the distribution since college educated workers grew
much larger than 1 or even 10 percent of the societies.
Here the superstars theory is introduced (see Rosen (1981), Kaplan and Rauh (2013), and
Brynjolfsson and McAfee (2014)). The theory was initially proposed by Rosen (1981), describing the
superstars phenomenon as the condition where “relatively small numbers of people earn enormous
amounts of money and dominate the activities in which they engage”. Due to the rapid technological
change at the beginning of 1980s, in particular those in ICT, gains of top performer are extended and
pull away from those in the middle. Technological change allows superstars to apply their talent on a

14
larger size of market, to reach larger number of people, and to be supported by greater pools of
resources.
The empirical evidence came from Kim and Brynjolfsson (2009). Providing panel data from over
2500 trade firms, they found that CEO compensation increases dramatically in the last few decades
due to the role of information technology. Information technology (IT) has amplified the ability of top
executive in decision making process. As a result, effective firm size grows and the average wage of
CEO will increase. The increase of top executive wages is also confirmed by Piketty (2014) who
named it by the term of “supermanager”. He claims that the rise of supermanager in both financial and
nonfinancial sectors is the primary reason for the increase of total income inequality.
Meanwhile, Kaplan and Rauh (2013) found that the top 1 percent earners in US spread in many
industries with various occupations. Those include not only CEO, but also entrepreneurs, lawyers,
professional athletes, and even those in media and entertainment. Thus, in the top level, the bias does
not occur only to the skilled-workers in computer intensive industry. More than that, technological
change allows top talents like Cristiano Ronaldo to earn much more than the average income of
current professional football players compared with the income of Diego Maradona relative to the
average players in the past, or as well as J.K. Rowling who earns greater share of the revenues than
did the famous Shakespeare. Currently, information and communication technology allows superstars
to reach larger amount of customers through variety of channels (Brynjolfsson & McAfee, 2014).
Hence, it leads to the greater unequal distribution of income.
Brynjolfsson and McAfee (2014) explain how technological change enforces superstars in various
sectors to boost their incomes while the others lagged behind. The first reason is because
digitalization makes capacity limitation become irrelevant. It allows the market leader to benefit from
the huge economies of scale and thus fulfil a larger share of market demand. Secondly, technological
improvements in telecommunication and transportation could merge many local markets into a single
global market. Therefore, small players which previously dominant in local markets then will be
eliminated. In contrast, top performers will gain more customers and thus inequality become wider.
Finally, the role of network effect can create ‘demand side economies of scale’. Network effect means
people tend to consume those what are consumed by his personal networks. It thus makes the market
share become more concentrated to the winner. Brynjolfsson and McAfee (2013) provides Facebook
phenomenon as an example of the effect: If many friends keep in touch via Facebook, we tend to
choose Facebook as our main social media portal. Hence Facebook will more attractive; subsequently
the networks lead Facebook to gain greater size of the market.
(3) Entrepreneur, Innovation rent and Schumpeterian model of top income inequality
The role of innovation as the determinant of top income inequality is also explained by the
Schumpeterian model from Aghion et al (2015) and Jones and Kim (2014). Both models emphasize
the role of innovation and entrepreneurial efforts, either those who come from incumbents or new
entrants. By building mathematical models, both Aghion et al (2015) and Jones and Kim (2014) agree
that innovation from incumbents tend to increase the top income inequality. This occurs since
innovator reaps monopolistic exponential growth which leaves others behind. Meanwhile, innovation
from new entrants result contradicting direction between them. Aghion et al (2015) posit that
innovation from new entrants also lead to the rising of top income inequality while the later stress that
those are negatively correlated.

15
Those Schumpeterian models are firstly inspired by Schumpeter’s view of growth. According to
Schumpeter (1942), the disruptive force of innovation allows the entrepreneurs to enjoy some degree
of monopoly rent that is called by Schumpeter (1942) as “the prizes offered by capitalist society to the
successful innovator”. The dynamic of market competition occurs because each firm is motivated by
the prospect of monopoly rent. However, this monopoly rent is only temporary since it then will be
destroyed by the next innovation. This role of monopoly rent thus become the root of top income
inequality discourse which then modelled by Aghion et al (2015) and Jones and Kim (2014).
Although it was clear that Schumpeter theory is emphasized the role entrepreneurial effort, one might
question regarding who those entrepreneurs are. Commonly, those refer to the individuals who run
their own firms or small businesses and are able to innovate. However, Schumpeter viewed
entrepreneur as a general term for those who are innovators. Thus innovation could come either from
small firms as outsider or from larger firms in the existing regimes. Andersen (2013) summarized
Schumpeter view regarding the role of innovators, distinguished between Schumpeter Mark I theory
and Mark II theory. Schumpeter’s early work (Mark I) argues that economic evolution is the result of
the continuous interaction between individual firms and the system of economic routine (incumbents).
Nevertheless, in the later work (Mark II), Schumpeter reveals that entrepreneurial activity could occur
in large firms. Mark II theory argues that economic evolution is a process that is driven by the
innovative oligopolistic competition between large firms (Andersen, 2012). For these reasons, there
might be different interpretation of ‘entrepreneur’ term in many following researches. Unsurprisingly
it also contrasts between Aghion et al (2015) and Jones and Kim (2014) interpretation.
Jones and Kim (2014) define an entrepreneur as a monopolist with the exclusive right to sell a
particular product in competition with other varieties. In their model, entrepreneur is defined with
broad interpretation including author, new rock band, doctor, and middle manager who invented a
new product. The broad interpretation regarding entrepreneurs implies that their income could be
generated either from wage, salary, profit, or capital gain as well. Their basic idea is that innovation
determines top income inequality through the interplay between existing entrepreneurs (i.e
incumbents) and the creative destruction from the new entrepreneurs (i.e new entrants).
Based on their Schumpeterian model, the distribution of top income could change for two reasons.
Firstly, it will increase if the entrepreneurial effort of incumbent increase. In other words, temporal
monopoly rent will be extended if incumbents expend higher effort or higher productivity to improve
their product from their existing ideas. As a result, their income will grow exponentially following the
Pareto distribution. Meanwhile, the top income share will decrease if there is an increase death rate of
innovation due to creative destruction. When there is a raising rate of the new ideas from new entrants
to replace incumbents, incumbents will lose their monopoly position and hence it leads to the decrease
of top inequality. The incumbent will drop out from the top income earners and is replaced by a new
entrepreneur who starts over at the bottom of the ladder. The faster rate of creative destruction means
the shorter time of monopoly rent will be experienced. Therefore, the income distribution will reach
its dynamic stability. Additionally, Jones and Kim (2014) also emphasize the role of globalization as
the complementing factor in determining the top income inequality. Globalization works in two ways:
on one hand it allows entrepreneur to grow more rapidly, but on the other hand it also makes domestic
markets more competitive to attract creative destruction.
While Jones and Kim (2014) associate the rising top income inequality with rising labor income
inequality, Aghion et al (2015) highlight the increase of entrepreneurial share as the main factor of the
phenomenon. In their model, all of the top income earners are assumed as entrepreneurs who directly
benefitting from innovation. Of course this is incorrect in the reality. As suggested by empirical

16
evidence from Atkinson, Piketty, and Saez (2011), wage income share indeed become the largest part
of top 1 percent income share instead of entrepreneurial income. For this reason, Aghion et al (2015)
realize the limitation of their model that entrepreneurial share is overrepresented. In practice,
innovation could benefit all stakeholders: firm owners, top managers, and inventors. Thus, innovation
affects all sources of income within the top earners including those from wages and salaries.
The basic idea of their model is regarding the important role of innovation-led growth acceleration.
According to them, the increase of top income earners is determined by the higher share of
entrepreneur due to the increase of innovation rate and R&D productivity. Income inequality
increases when some portions of the aggregate income from workers shift to entrepreneurs. As a
result, entrepreneur share of income that is concentrated only to a small numbers of people increases.
Reversely, the share of wage income in total income decreases. Those then lead to the increase of total
income inequality. Their model also proposes that innovation from both incumbent and new entrant
lead to the increase of entrepreneur share considering that in both case the entrepreneurial share tend
to grow larger than wage share.
Moreover, Aghion et al (2015) also stress the upward social mobility phenomenon as the impact of
innovation from new entrant. Upward social mobility means the entry of an individual from the
outside into the top 1 percent earners. This also means that some of wealthiest people are considered
as innovators who gain large share of income from their invention. Their wealth is not the result of
inheritance from their parent’s riches as occurred in the previous centuries. Instead, they experience
upward social mobility to enter the top 1 percent of society due to their entrepreneurial effort. This
theory seems typical with what has been suggested by Jones and Kim (2014) as the effect of creative
destruction although they do not mention explicitly the term of ‘social mobility’. However, Aghion et
al (2015) do not elaborate the reason why there is no direct effect on social mobility to the decrease of
top income inequality.
The theoretical model from Aghion et al (2015) seems more convincing since their study was then
followed by macro empirical evidence. The empirical evidence was provided by cross-state panel data
from US between 1975 and 2010. They found that the top 1 percent income share in the given state is
positively and significantly correlated with the state's degree of innovativeness as measured by patent
publications. Indeed, larger empirical study from other developed countries is needed to verify the
innovation led growth model both from Jones and Kim (2014) and Aghion et al (2015).
2.3.2 Hypothesis 2: Technological specialization increases income inequality
Surprisingly, I found no previous studies empirically or theoretically linking directly technological
specialization and income inequality. This study considers testing the empirical evidence following
the parallel pattern between the growth of specialization and income inequality in recent decades.
While the rise of inequality in advanced countries is inevitable, the similar trend is also there for
technological specialization. It is, for instance, introduced by the paper from Cantwell and Vertova
(2004) which explore the historical evolution of technological diversification in 100-year period from
1890 to 1990. The study found the fact that in the initial condition more innovative countries tend to
be technologically diversified whereas less innovative countries tend to be more specialized.
Interestingly, they found the common tendency that all countries increasingly specialize their
innovation activities in most recent period.

17
Thus, in this sub-section I elaborate several channels through which the relation between
technological specialization and income inequality is constructed. Fundamentally, I argue that the
basic theory is same as the previous discussion: they started from the role of ‘skill-biased technical
change’. It may be connected through two channels: (1) through differences in the demand for skilled
labor between sectors and (2) through differences in the wage premium across skill levels within the
particular sector. Those mechanism are not mutually exclusive, instead, they complement each other
shaping the worse gap of income distribution. The following part will further explain the relationship.
It should be noted that the relationship between technological specialization and income inequality is
bridged by the role of trade and growth that has been elaborated in previous section.
(1)Technological specialization increase inter-industry wage differentials
Many previous studies suggest ‘inter-industry wage differential’ as the vital contributor of the rise of
total income inequality. Thus, to understand how technological specialization affects total income
inequality, one has to concern the concept of ‘inter-industry wage differential’ which is referred to the
dispersion of wages across sectors. Consider two employees with the same skill and socio-economic
characteristics (e.g same in terms of experiences, degree of education, regions, etc) work in different
sectors. Hypothetically speaking, in the long run wages between them are supposed to be similar. A
basic equilibrium theory could explain why it does so. Initially, when wages between them differ,
labor in low wage sector will attempt to move to high wage sector for seeking a new opportunity. This
then increases labor supply in high wage sector along with the decrease of labor supply in low wage
sector. In equilibrium, it leads to the equalizing level of wages between both sectors.
However, the claim is not followed by empirical facts. Krueger and Summers (1988) for instance
investigate the wages differences for equally skilled workers across sectors in U.S. labor market in the
period of 1974-1984. After controlled by human capital, demographic background, and working
conditions, they found that wages dispersion across sectors is substantial and did not change
significantly over time. For instance, they found that the average wages in the petroleum industry,
which was indicated as high tech sector at that time, earned between 24 to 37 percent more than
average equally skilled labor in all sectors. One should be noted that the inter-industry wages
differences appear across level of occupations. Osburn (2000) found that even janitors as well as
managers commonly tend to receive similar wage differentials comparing to same occupation in other
sectors.
The simple explanation for this phenomenon comes from standard competitive theory. It basically still
argues that in the long run those wages will reach equilibrium. But in the short run, several factors
may determine the differences. Temporary disequilibrium for instance is caused by asymmetrical
information or due to the fact that job hunting is costly (Genre, Kohn, & Momferatou, 2011).
On the other hand, wage determination theory proposes different arguments. They rely on the main
assumption that in particular sectors firms tend to pay higher wages than those suggested by
equilibrium level due to the advantage of innovation or specialization (Genre, Kohn, & Momferatou,
2011). Osburn (2000) also supports this claim by providing empirical evidence that inter-industry
wage differentials are positively associated with capital intensity. In other words, jobs in sector with
high capital intensity, which representing high level of technology, tend to provide higher income
comparing to the equal jobs in less technological sectors.
The explanation is related to the trade and growth theories as elaborated above which act as the
connector between specialization and inequality. Since trade specialization and technology

18
specialization are co-evolve, high technological sectors tend to carry out higher exports. Higher
exports then raise the relative price of goods in the sector as equilibrium is reached with the higher
world price (Levinson, 2015). This higher relative price will stimulate demand for labor in the
production sector, benefiting those labor relative to other sectors.
Another explanation regarding why wages are higher in industries with higher rates of technological
change came from Bartel and Sicherman (1997). According to them, in sectors which use more
sophisticated capital, which also means more innovative, firms will increase their demand for workers
who can more easily learn the new technology and adaptive to change. As the consequence, this
sector will employ more skilled workers which then shifted from other sectors. However, higher
demands do not push wages downward as accordance to basic equilibrium theory. In contrast, since
the capacity of capital is positively correlated with productivity and growth, firms in more innovative
sectors are able to pay those high skilled employees much higher than in other lagged sectors. In other
words, skill premium in high technological sector is higher because the increase demand for high
skilled labor which complements the innovation activities is along with the increase of growth and
earnings.
This means that skill-biased technical change is not only about the gap between high and low skilled
workers, but also refers to the shift of labor from such low tech to high tech environment (Bartel &
Sicherman, 1997). Consequently, if countries tend to be more specialized in only few particular
sector, demands for high skilled labor will be asymmetrical and it then lead to the widening gap of
inter-industry wages differences. Reversely, if countries diversify their innovation activities into broad
sectors, differences of inter-sectoral wages would be suppressed because the skill premiums are
relatively symmetric and more equally distributed across sectors.
(2) Technological specialization increase inequality within sector
Unsurprisingly, as a country tends to be more specialized, it also widens the income gap within
sectors particularly in those where innovation activities are more concentrated. Since, trade
specialization and technology specialization are co-evolve, following the fact that trade volume and
growth differ across sectors, effects of specialization on the skill premium must be expected to vary
from one sector to another. This hypothesis is supported by the fact that the extent of job polarization
differs across industries, it is more obvious in some industries rather than others (Autor, Levy, &
Murnane, 2003). For instance, Shim and Yang (2015) found that the decrease in the employment
share of middle skilled labor with routine tasks is high in manufacturing, communication, and
business related services while the decrease is much lower in transportation and retail trade.
Shim and Yang (2015) moreover found that ‘inter-industry wage differentials’ are the key source of
the differences level of job polarization across sectors. Their finding proposes that in US labor market
structure, the progress of job polarization between 1980 and 2009 was more noticeable in sectors that
initially paid a high wage premium to workers than in sectors that did not. In other words, high
technological sectors suffer higher gap of inequality comparing to others. The explanation is because
firms in a sector with a high wage premium seek alternative ways to minimize production costs by
substituting middle skill workers who perform routine tasks with new technology. This is also
supported by the evidence that sector with a high growth rate of ICT capital, as measured of
technological changes, exhibit more significant job polarization (Michaels, Natraj, & Van Reenen,
2013), while (Levinson, 2015) suggest that trade in technology-intensive is only benefited by high
19
skilled workers by examining trade-inequality relationship in 29 OECD countries through the scope of
occupational wages.
Initially, in the first part of this section, we have discussed that technological specialization is
correlated to trade specialization. Through the increase of volume of productions and the price of
goods, particular sector will generate more money and thus supporting the total growth. In this part
the direction to which the benefits are distributed is then elaborated. Apparently, beyond its growth,
high technological sectors leave unintended consequences. Comparing among the rest, this sector
generates more obvious job polarization. The growth of the cake is only benefited by high skilled
workers while those low skilled workers have a tendency to suffer as they now face lower relative
demand for their skills (Levinson, 2015).
***
To sum up, this study will test two hypotheses that have been built in this section. Those hypotheses
are as follows:
H1: Innovation increases income inequality
H2: Technological specialization increases income inequality

20
Chapter 3 Empirical Methods
3.1 The relevance of European countries and regions case To test the hypotheses, this empirical study put European countries and regions as the unit of analysis.
Several reasons motivate me to consider Europe continent as case study. Firstly, it is chosen due to
the recent trends of innovativeness and inequality over decades in Europe which tend to follow
parallel growths. On one hand, most European countries are classified as the most innovative
countries in the world. Eight of ten most innovative countries ranked by The Global Innovation Index
2016 originate from European continent. On the other hand, at the same time, most of them are also
challenged by the rise of inequality problems over periods.
With the data of Gini index as measure of inequality provided by Toth (2013) and EPO patents
application statistics as measured of innovation provided by Eurostat, I then visualize the parallel
evolution of both variables from 1980 to 2010 in 25 of European countries. Figure 1 demonstrates the
recent trends in 4 innovation leader countries in EU according to European Innovation Scoreboard
2016, including Sweden (rank 2), Denmark (rank 3), Finland (rank 4), and Germany (rank 5). All
graphs show the similar trends between innovation and inequality. Meanwhile, only some emerging
European countries also follow the typical trends whereas the rest show no parallel patterns. Thus, this
study is conducted to investigate deeper this phenomenon.
Figure 1 patenting activities versus Gini index in EU most innovative countries 1980 to 2010

21
Secondly, there is less evidence linking innovation and inequality in European case in comparison to
those in U.S. While recent study from Aghion et al (2015) found the positive correlation between
innovation and top income inequality in U.S, the curiosity is then being raised whether the identical
conclusion is also there in Europe.
On one hand, the welfare state policies and the rigid labor market institutions in most European
countries are able to supress the wage dispersion between workers (Krugman, 1994). Consequently,
they limit the rise of inequality trends as compared to the high inequality in U.S. On the other hand,
there are different characteristics in regards of innovation activities between most of European
countries and U.S. In their famous book Variety of Capitalism, Hall and Soskice (2001) for instance
argue that U.S, which adopted liberal market economies, is more focus on radical innovation while
most of European countries (except UK and Ireland), which adopted coordinated market economies,
are more focus on incremental innovation. Additionally, the difference is also in regards of the level
of disparity of innovation where within Europe the levels is much higher comparing to U.S (Lee,
2011). Hence those arguments lead us to the premise that the relationship between innovation and
inequality in U.S and Europe is not necessarily the same.
Actually, although only few, I also found studies linking innovation and inequality in European case.
Those include a study from Lee (2011) which conducts panel analysis in region NUTS 1 level and
Antonelli & Gehringer (2013) which conduct the same analysis in country level. Nevertheless, the
results are contradictory. While study at the regional level found the positive relationship between
them, in contrast, the country level study found the negative effect of innovation to inequality. Of
course this is problematic. These findings thus motivate me to conduct both levels of analysis. With
some improvement methods, this study attempts to test the innovation-inequality relationship in both
country and regional levels and compare the results.
Thirdly, a practical reason is because the dataset for supporting European study are well provided. In
the next section, a description of the dataset will be delivered.
3.2 Data description
The core of this empirical analysis is carried out at European country and NUTS 1 regional level. For
the country level, most of the data cover the period 1998 - 2014 (17 years). However, since the data is
unbalanced, I also focus my attention on the shorter balanced dataset covers the period 2003 - 2014
(12 years). Besides EU-27 countries, the data is also available for Switzerland, Norway, Iceland, and
Turkey. Thus, for the basic model, 31 countries are included into the analysis.
Meanwhile, the dataset for regional level cover the period 2004-2011 (8 years) consisting of 84
observation groups. Essentially, there are 98 regions in Europe based on NUTS 1 classifications.
However, several regions are merged in order to adjust the data of dependent variable given from
Ramos & Royuela (2014). For each country, I merged regions within Netherlands, Finland, and
Portugal into one region which initially consists of 4, 2 and 3 NUTS 1 regions respectively. In
addition, for the same data, only 5 of 16 regions in Germany are available. List of countries and
regions included in this study is presented in Appendix 1.
3.2.1 Innovation as independent variable
As the independent variable, this study uses EPO patent application statistics as the proxy of
innovation. A patent is a document, issued by a government authority, granting exclusive right for the

22
production or use of a specific new device, apparatus, or process for a stated number of years
(Griliches, 1998). Since patent is regarded as an outcome of successful innovation process, it is
widely accepted that patent statistics can be used as a source of information in measuring innovation
and technological change. Indeed this indicator is not without drawbacks. One main problem is
because not all inventions are patentable. On the other hand, not all the inventions which are patented
are identified as innovations, successfully commercialized or economically valuable. Figure 2,
adopted from Basberg (1987), illustrates that patents only represent the small shares of inventions and
innovations.
Figure 2 Relation between patenting activities, inventions and innovations (Source: Basberg, 1987)
Despite of those drawbacks, previous researchers agree that patents provide a fairly reliable measure
of innovation. The strength of patent statistics as compared to alternative measures of innovation
activity is due to its “availability in great abundance” (Comanor & Scherer, 1969). Comanor &
Scherer (1969) moreover reject the claim that inability of patent data to reflect inventive quality is
fatal for the innovation study. According to them, since creative ability varies across individual, the
quality variability problems in patent data are not different from other measures. In other words, other
measures of innovation such as trade mark and R&D expenditure also problematic in context of
representativeness (e.g not all trademarks reflect innovation and not all R&D expenditure are
effectively generating innovation). Furthermore, patent statistics are unique since they provide the
long historical time series (Cantwell & Vertova, 2004) and roughly comparable between countries
and regions (Lee, 2011).
To deal with country size, I use patents per million of total population. The data for both countries and
regions level are provided by Eurostat. Figure 3 presents EPO patent applications per million
inhabitants across European countries in 2014.

23
Figure 3 EPO patent applications per million inhabitant in EU Countries 2014
3.2.2 Technological diversification as independent variable
This study uses ‘technological diversification’ as independent variable to test the second hypothesis
about the role of ‘technological specialization’. It should be noted that they are opposites. However, I
try to be consistent with previous literatures which use ‘technological diversification’ as measures
degree of technological diversification/specialization. So then this variable is chosen.
As the proxy of technological diversification, I use the inverse of coefficient of variation (1/CV)
Revealed Technology Advantage (RTA) index. This indicator, which is more or less similar to
Herfindahl index of concentration or entropy measurement, is widely used by previous studies
(see for instance Soete (1980), Cantwell & Vertova (2004), and Savorelly & Picci (2013)). The
strength of RTA is that it allows us to control inter-sectoral and inter-countries/regions differences in
the propensity to patent (Cantwell, Gambardella, & Granstrand, 2004).
Coefficient of variation (CV) of the RTA index across sectors for a given country is defined as the
ratio between standard deviation and mean of RTA in j sectors in country/region i.
𝐶𝑉(𝑅𝑇𝐴) =𝜎(𝑅𝑇𝐴)
𝜇(𝑅𝑇𝐴)
High value of CV indicates that the RTA distribution is highly concentrated in few specific fields of
technology which means that the degree of diversification is low. Reversely, when CV is low, the
cross-sectoral distribution of RTA is widely dispersed. It means that the innovation activity is highly
diversified across fields and not concentrated only in few activities rather than others. Since
technological diversification is inversely related to the concentration of technological specialization in
favoured sectors (Cantwell, Gambardella, & Granstrand, 2004), it could be said that CV of RTA,
which measures the concentration, is an inverse of technological diversification indicator. Thus I use
the inverse of CV RTA (i.e 1/CV) in this study, whose low value indicates the highly specialised
country/region and whose high value indicates the diversified country/region in term of their
innovation activities.
0,00
100,00
200,00
300,00
400,00
500,00
HR
RO TR BG CY SK ML
EE EL PT PL LT HU CZ ES IE SI IT UK
NO IS LU EU BE
FR NL
AT
DK
DE FI SE CH
EPO patent applications per million inhabitantin EU Countries 2014
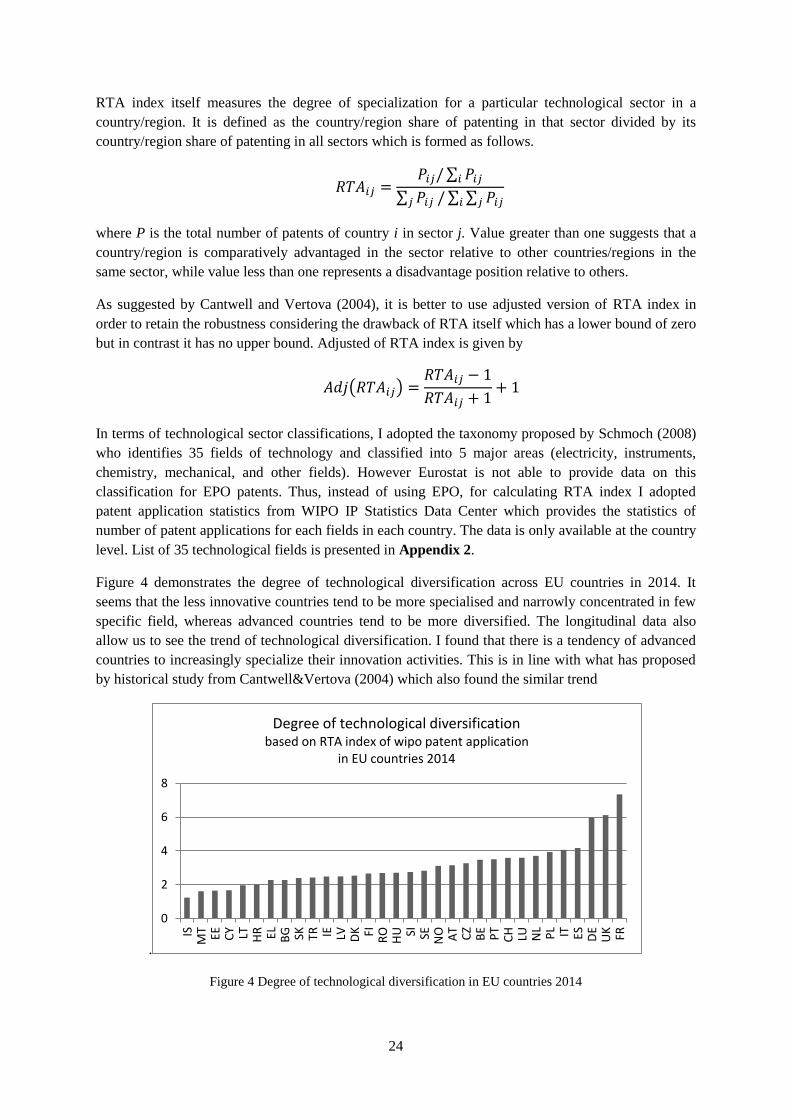
24
RTA index itself measures the degree of specialization for a particular technological sector in a
country/region. It is defined as the country/region share of patenting in that sector divided by its
country/region share of patenting in all sectors which is formed as follows.
𝑅𝑇𝐴𝑖𝑗 =𝑃𝑖𝑗/ ∑ 𝑃𝑖𝑗𝑖
∑ 𝑃𝑖𝑗𝑗 / ∑ ∑ 𝑃𝑖𝑗𝑗𝑖
where P is the total number of patents of country i in sector j. Value greater than one suggests that a
country/region is comparatively advantaged in the sector relative to other countries/regions in the
same sector, while value less than one represents a disadvantage position relative to others.
As suggested by Cantwell and Vertova (2004), it is better to use adjusted version of RTA index in
order to retain the robustness considering the drawback of RTA itself which has a lower bound of zero
but in contrast it has no upper bound. Adjusted of RTA index is given by
𝐴𝑑𝑗(𝑅𝑇𝐴𝑖𝑗) =𝑅𝑇𝐴𝑖𝑗 − 1
𝑅𝑇𝐴𝑖𝑗 + 1+ 1
In terms of technological sector classifications, I adopted the taxonomy proposed by Schmoch (2008)
who identifies 35 fields of technology and classified into 5 major areas (electricity, instruments,
chemistry, mechanical, and other fields). However Eurostat is not able to provide data on this
classification for EPO patents. Thus, instead of using EPO, for calculating RTA index I adopted
patent application statistics from WIPO IP Statistics Data Center which provides the statistics of
number of patent applications for each fields in each country. The data is only available at the country
level. List of 35 technological fields is presented in Appendix 2.
Figure 4 demonstrates the degree of technological diversification across EU countries in 2014. It
seems that the less innovative countries tend to be more specialised and narrowly concentrated in few
specific field, whereas advanced countries tend to be more diversified. The longitudinal data also
allow us to see the trend of technological diversification. I found that there is a tendency of advanced
countries to increasingly specialize their innovation activities. This is in line with what has proposed
by historical study from Cantwell&Vertova (2004) which also found the similar trend
.
Figure 4 Degree of technological diversification in EU countries 2014
0
2
4
6
8
ISM
T EE CY LT HR EL BG SK TR IE LV DK FI RO
HU SI SE NO AT
CZ
BE
PT
CH LU NL
PL IT ES DE
UK FR
Degree of technological diversificationbased on RTA index of wipo patent application
in EU countries 2014

25
For the robustness check, as an alternative measure of technological diversification, I also use entropy
index which basically captures the uncertainty of probability distribution. The limitation of this
indicator is that entropy index only controls the inter-sectoral differences. Unlike RTA indicators
which normalize the degree of innovation concentration in a country by comparing to others, entropy
index is an absolute measure which only focuses to the unit of analysis without relative comparison.
The entropy index technological diversification (TD) is calculated by
𝑇𝐷 = ∑ 𝑃𝑖 ln(1
𝑃𝑖)
𝑁
𝑖=1
Where Pi is patent proportion of technological sector i for a country/region to the total number of
patent in the country/region itself. In this case, N consists of 35 technological fields which are
identified by Schmoch (2008). The index takes value 0 of the minimum entropy suggests that
country/region only concentrates patent activities in one technological field. The index reaches the
maximum value when all technological fields have equal share of patents.
3.2.3 Income inequality as dependent variable
I use Gini coefficient as the standard measure of inequality for the basic model. It ranges from a
minimum value of zero, represents all individual income are absolutely equal, to a theoretical
maximum value of one where all individual income is zero except one person. This is calculated from
the Lorenz curve which represents the function of cumulative percentage of population to its
cumulative income as shown by the figure 5. Gini ratio is defined as the ratio between area A and the
sum of area A and B. The strong point of Gini index is due to its population symmetry (Lee, 2011). It
means that the calculation from a sample of population is generalizable to the population as a whole
(Coutler, 1989). Moreover, Gini index is directly comparable between units with different sizes of
population (Hale, 2006).
Figure 5 Lorenz curve (Source, Handaulah (2014))
Eurostat provide the data on Gini index equivalised disposable income in country level, including 31
countries in the time span of 2003 to 2014 and the extended 15 countries up to 1998. For the regional
level, Gini index is obtained from the study of Ramos and Royuela (2014) which calculates the Gini
index in 81 NUTS 1 EU region based on microdata from European Community Household Panel

26
(ECHP) covers 1993 to 2000 and European Union Survey on Income and Living Conditions (EU-
SILC) covers 2004 to 2011. Since they calculate the Gini index for both country and regional level, I
also use the data to check the robustness of country level model. The Gini indexes obtained from
Eurostat and Ramos-Royuela (2014) in country level are strongly correlated (i.e 0.93 of Pearson
correlation).
The values vary across countries and regions. In 2014 for instance, Iceland has the lowest Gini index
(0.227) and followed by Scandinavian countries such as Norway (0.235), Sweden (0.254) and Finland
(0.256). In contrast, emerging European countries tend to stand on high Gini index, for instance
Turkey (0.42), Bulgaria (0.354), Latvia (0.355) and Estonia (0.356). Figure 6 presents the Gini index
of all EU countries in 2014.
Figure 6 Gini index in EU countries 2014
Another reason why this study focuses on testing the hypotheses at two levels of observation (i.e
country and regional levels) is that several countries have high variation of inequality between their
regions. As an illustration, figure 7 demonstrates the differences of Gini index in a number of NUTS 1
regions within 4 countries. We could see that while Spain and Sweden have the low variation of
inequality across regions, in contrast, regions within United Kingdom and France have significantly
high dispersion of inequality.
0,00
5,00
10,00
15,00
20,00
25,00
30,00
35,00
40,00
45,00
50,00
IS NO SI CZ SE FI BE SK NE AT DK MTHU LU FR CH DE IE PL UK IT EL PT ES RO CY LI BG LT EE TR
Gini index at EU country level 2014

27
Figure 7 Gini index in NUTS1 regions 2011 (UK, Sweden, France, Spain)
Regions with higher level of innovativeness and prosperity such as London (UKI), East of England
(UKH), Paris (FR1) and Centre Est (FR7) for instance, have very high levels of inequality as high as
the inequality in emerging countries such as Bulgaria and Lithuania. In contrast, regions with lower
level of innovativeness and prosperity such as East Midlands (UKF) and Sud-Ouest (FR6), have low
levels of inequality and even to some extent close to the value of regions in Sweden. Therefore,
testing innovation-inequality relationship in both country and regional level will allow us to
investigate the trends in two different levels of observation: whether those are analogously or
inconsistent each other.
The second measure of inequality in this study is the ratio between income percentiles. The first
one is 90-10 ratio which shows the unequal distribution between income at the top of distribution
(more than 90th percentile) and at the bottom of the distribution (less than 10th percentile). The second
one is 90-50 ratio, measuring the income differences in top half distribution, and the last one is 50-10
ratio which represents the inequality in bottom half of distribution. The data is also provided by
Eurostat and Ramos-Royuela (2014)
Lastly, the study also focuses on the top income inequality. The data on the shared income earned by
the top 10% and top 1% of income distribution is available from Eurostat but only in country level.
One should be note that the data is a broad measure of total income which is unable to be decomposed
into various sources of income including wages, capital gains, and entrepreneurial income. In general,
the pattern of top 10% income shares variation across countries is similar to Gini index. In 2014 for
instance, the lowest shares of top 10% earners are represented by Iceland (20.0%), Norway (20.0%)
and Sweden (20.2%) respectively while emerging countries mostly are placed in the top of rank (i.e
Turkey 32.9%, Cyprus 28.8%, and Bulgaria 26.9%). Meanwhile, the distribution of top 1% shares is
slightly different. The top 1% earners in advanced countries such as Denmark and France for instance
have the highest shares as compared to other (6% and 5.7% respectively) while emerging countries
like Slovenia and Croatia have the lowest shares of top 1% income (3.4% and 3.6% respectively).
20
22
24
26
28
30
32
34
36
38U
KC
UK
DU
KE
UK
FU
KG
UK
HU
KI
UK
JU
KK
UK
LU
KM
UK
NSE
1SE
2SE
3FR
1FR
2FR
3FR
4FR
5FR
6FR
7FR
8ES
1ES
2ES
3ES
4ES
5ES
6ES
7
Gini index in NUTS1 regions 2011(UK, Sweden, France, Spain)
UK Sweden France Spain

28
3.2.4 Control variables
Several control variables are included in the model to consider the presence of other potential
explanatory variables associated with income inequality within country and region. First of all, GDP
per capita is included as the usual variable for controlling the model which is commonly used in
previous studies. As mentioned in the previous chapter, the concern about the relation between
economic development and inequality has become the focus discourse since the prominent study of
Kuznets (1955) with disagreement conclusion among scholars. Rodriguez-Pose and Tselios (2009) for
instance reveal the negative correlation between economic growth and inequality in EU. The causal
direction is not part of this study’s interest despite the disagreement whether economic growth
reduces inequality or vice versa. I use current price of GDP per capita which is adjusted by purchasing
power parities in euro currencies. The data is provided by Eurostat.
Additionally, population growth is included as control variable as it is also used by Aghion et al
(2015) and Lee (2011). Population growth is associated with inequality by affecting the density of a
country/region. Previous studies found the negative correlation between population density and
inequality. Higher density area tends to form more diverse and mobile societies which then provide
more opportunities (Sylwester, 2004). Hence it will decrease income inequality. The data is also
available from Eurostat.
I also incorporate government spending in controlling the model as a measure of government power to
reduce poverty and inequality. Of course this is a crude proxy since total government expenditure
does not always reflect the effectiveness of its efforts. However, higher government expenditure could
also mean higher investment for education, infrastructure, and basic need for empowering societies. A
study from International Monetary Fund (IMF) suggests that government redistributive spending
relative to total spending is associated with a decrease in income inequality (Dabla-Norris, Kochhar,
Suphaphiphat, Ricka, & Tsounta, 2015). Thus in this study, I expect negative correlation between
government expenditure and income inequality. For the study at country level, Penn World Tables
provides the value of government spending in percentage to GDP. Unfortunately, the data for region
study is not available.
The next control variable is trade openness which is defined as the ratio of total trade (i.e export plus
import) to GDP. Trade openness ratio may be seen as an indicator of the degree of globalisation. This
variable is important since technological change and globalization complement each other in
determining income inequality. Theoretically, globalization leads to the increase inequality in
developed countries but tend to reduce it in developing countries (Mills, 2009). Trade openness will
increase the demand for high-skill worker in developed countries where knowledge based industries
are dominant. On the other hand, capital as well as the rest of industrial activities will be relocated to
cheap-labor countries resulting the decrease of demand of unskilled workers. Hence, inequality
increases in developed countries. However as concluded by a review from Kremer and Maskin
(2003), most of empirical studies find contradictory result. Barro (2000) for instance finds relationship
between openness and inequality is positive in low income countries but negative for high income
countries. I calculate this variable from the export and import in percentage to GDP data provided by
Penn World Tables.
Educational attainment level is also considered to control the relationship between innovation and
inequality. The first reason is because level of education is able to distinguish between low skilled and
high skilled labor and thus it reflects the distribution of human capital among the population.
Secondly, as argued by Goldin and Katz, education and technological change intertwine in
determining inequality. The basic idea is that technological changes frequently increase the demand of
29
high skilled educated workers. To restrain the rise of inequality, the supply of high skilled workers
must be steady. Hence they called it as the race between education and technology. If the race is won
by education, inequality trends to decrease. Reversely, if the race is won by technology, inequality
tends to increase. I then distinguish the variables for high and low educational attainment level of
labor. Given by Eurostat, high educated workers are those adult population who reach tertiary
education level (levels 5 to 8) whereas low educated workers are those adult population whose
education level is less than secondary level of education (levels 0 to 2). Unfortunately, the data given
by Eurostat are only available from 2003 while other variables are mostly provided up to 1998.
Finally unemployment rate is incorporated to the model since the problem of inequality and
unemployment in advance countries is widely known as two sides of the same coin. Innovation and
the introduction of new technology may either supress wages of middle and low labor or chase them
out of the employment. It depends on the labor market structure of the country. Countries with more
unregulated market structure such as UK and US have successfully reduced unemployment rate along
with the significant rise of their inequality as the trade-off. In contrast, countries with more
established welfare system tend to detain wage dispersion but on the other hand have greater rate of
unemployment in comparison to the previous. The data of unemployment rate is available from
Eurostat.
To sum up, all of the variables included in the model are demonstrated in Table 1. The descriptive
statistics are also presented in Appendix 3.

30
Table 1 List of variables
Variable Names Description Source
Measure of inequality
Gini_eu Gini index of inequality in country level Eurostat
Gini_rr Gini index of inequality in regional level Ramos&Royuela (2014)
Top1_eu Share of income own by the richest 1% (on a scale of 0 to 100) Eurostat
Top10_eu Share of income own by the richest 10% (on a scale of 0 to 100) Eurostat
S9010 Ratio of income between the richest 10% and the poorest 10%
Eurostat &
Ramos&Royuela (2014) S9050 Ratio of income between the richest 10% and the median
S5010 Ratio of income between the median the poorest 10%
Measure of innovation
Patent_pop The number of patent application to the EPO per million
population
Eurostat
R&Dexp_pop R&D expenditure per million population Eurostat
HitechPatent_pop The number of patent application to the EPO per million
population for high-technology sector including computer and
automated business equipment, communication technology,
laser, microorganism and genetic engineering, and
semiconductor
Eurostat
BioPatent_pop The number of patent application to the EPO per million
population for biotechnology sector
Eurostat
EnergyPatent_pop The number of patent application to the EPO per million
population for energy and climate change related sector
Eurostat
ICTPatent_pop The number of patent application to the EPO per million
population for information and communication technology
(ICT) manufacturing and services
Eurostat
Measure of Technological diversification
Tech_div_RTA Index of technological diversification, adopted from Revealed
Technological Advantage index
Author calculation
(based on WIPO patents
application per
technological fields
obtained from WIPO IP
statistics)
Tech_div_entropy Index of technological diversification calculated by entropy
index
Control Variables
GDPpcap Real GDP per capita in Euro adjusted by Purchasing Power
Parity
Eurostat
Popgrowth Growth of total population Eurostat
Gov_Exp Ratio of fovernment expenditure divided per GDP Penn World Table
Openness Ratio of country’s total trade (export plus import) to GDP Penn World Table
Edu_high Population of working age with tertiary education degree Eurostat
Edu_low Population of working age with lower than secondary education
degree
Eurostat
Unemploy Unemployment rate Eurostat
31
3.3 The model and econometric strategy The first hypothesis for this study is that the increase of innovation intensity affects the increase of
income inequality in European countries and regions. Secondly, I am also interested in testing the
relationship between technological specialization and income inequality. Theoretically, specialization
of innovation tends to increase income inequality.
I perform a series of panel data regressions to test those hypotheses in both European countries and
regions. Panel data refers to multi-dimensional data on cross-section of countries and regions over
time periods. It is selected as the model of analysis considering its advantages which have been
proposed by Baltagi (2008). Firstly, panel studies are able to control individual heterogeneity while
time-series and cross-section studies are not. Secondly, panel also provide “more informative data,
more variability, less collinearity among the variables, more degrees of freedom and more efficiency”
(Baltagi, 2008). As a final point, panel studies are better to study the dynamics of adjustment, while
cross-sectional studies which capture only static duration of time are unable to perform a multitude of
changes.
The models are as follows:
(1) First model
𝑌𝑖𝑡 =∝ +𝛽1 𝑖𝑛𝑛𝑜𝑣𝑎𝑡𝑖𝑜𝑛𝑖(𝑡−ℎ) + 𝛽2 𝐸𝑑𝑢𝐻𝑖𝑔ℎ𝑖𝑡 + 𝛽3 𝐸𝑑𝑢𝐿𝑜𝑤𝑖𝑡 + 𝛽4 𝐺𝑜𝑣𝐸𝑥𝑝𝑖𝑡 + 𝛽5 𝑂𝑝𝑒𝑛𝑛𝑒𝑠𝑠𝑖𝑡
+ 𝛽6 𝐺𝐷𝑃𝑝𝑐𝑎𝑝𝑖𝑡 + 𝛽7 𝑃𝑜𝑝𝑔𝑟𝑜𝑤𝑡ℎ𝑖𝑡 + 𝛽8 𝑈𝑛𝑒𝑚𝑝𝑙𝑜𝑦𝑚𝑒𝑛𝑡𝑖𝑡 + 𝑣𝑖 + 𝜀𝑖𝑡
(2) Second model
𝑌𝑖𝑡 =∝ + 𝛽0 𝑇𝑒𝑐ℎ𝑛𝑜𝑙𝑜𝑔𝑦 𝑆𝑝𝑒𝑐𝑖𝑎𝑙𝑖𝑠𝑎𝑡𝑖𝑜𝑛/𝐷𝑖𝑣𝑒𝑟𝑠𝑖𝑓𝑖𝑐𝑎𝑡𝑖𝑜𝑛𝑖(𝑡−ℎ) + 𝛽1 𝑖𝑛𝑛𝑜𝑣𝑎𝑡𝑖𝑜𝑛𝑖(𝑡−ℎ)
+ 𝛽2 𝐸𝑑𝑢𝐻𝑖𝑔ℎ𝑖𝑡 + 𝛽3 𝐸𝑑𝑢𝐿𝑜𝑤𝑖𝑡 + 𝛽4 𝐺𝑜𝑣𝐸𝑥𝑝𝑖𝑡 + 𝛽5 𝑂𝑝𝑒𝑛𝑛𝑒𝑠𝑠𝑖𝑡
+ 𝛽6 𝐺𝐷𝑃𝑝𝑐𝑎𝑝𝑖𝑡 + 𝛽7 𝑃𝑜𝑝𝑔𝑟𝑜𝑤𝑡ℎ𝑖𝑡 + 𝛽8 𝑈𝑛𝑒𝑚𝑝𝑙𝑜𝑦𝑚𝑒𝑛𝑡𝑖𝑡 + 𝑣𝑖 + 𝜀𝑖𝑡
Where Y represents a series of income inequality measures including Gini index, decile ratio, and top
1% and top 10% income shares in country/region i at time t between 1998 and 2014. Innovation stays
for degree of innovation as measured by patenting activities as the first independent variable.
Technological Specialization/Diversification is the second independent variable which is measured by
the reciprocal of CV Revealed Technological Advantage (RTA) index and entropy index. Subscript h
in both independent variables represents time lag effect. EduHigh and EduLow represent the
proportion of high educated and low educated labor respectively. GovExp stands for government
expenditure as percentage to GDP and Openness is trade openness index as measure for globalisation.
∝ is constant and 𝛽𝑛 is coefficient for each variable. Finally, v and 𝜀 are unobserved country/region
specific characteristics which are time-invariant effects and idiosyncratic error terms, respectively.
Choosing fixed effect model
In running panel data regression, one should consider to choose which model fits best into the case:
either pooled OLS, Fixed Effect, or Random Effect model. Several tests then are conducted to find the
appropriate model, including F test, Breusch-Pagan Lagrange Multiplier(B-P LM) test and Hausman
test. The following table adopted from Park (2011) summarize the choice of model according to the
results of the tests.
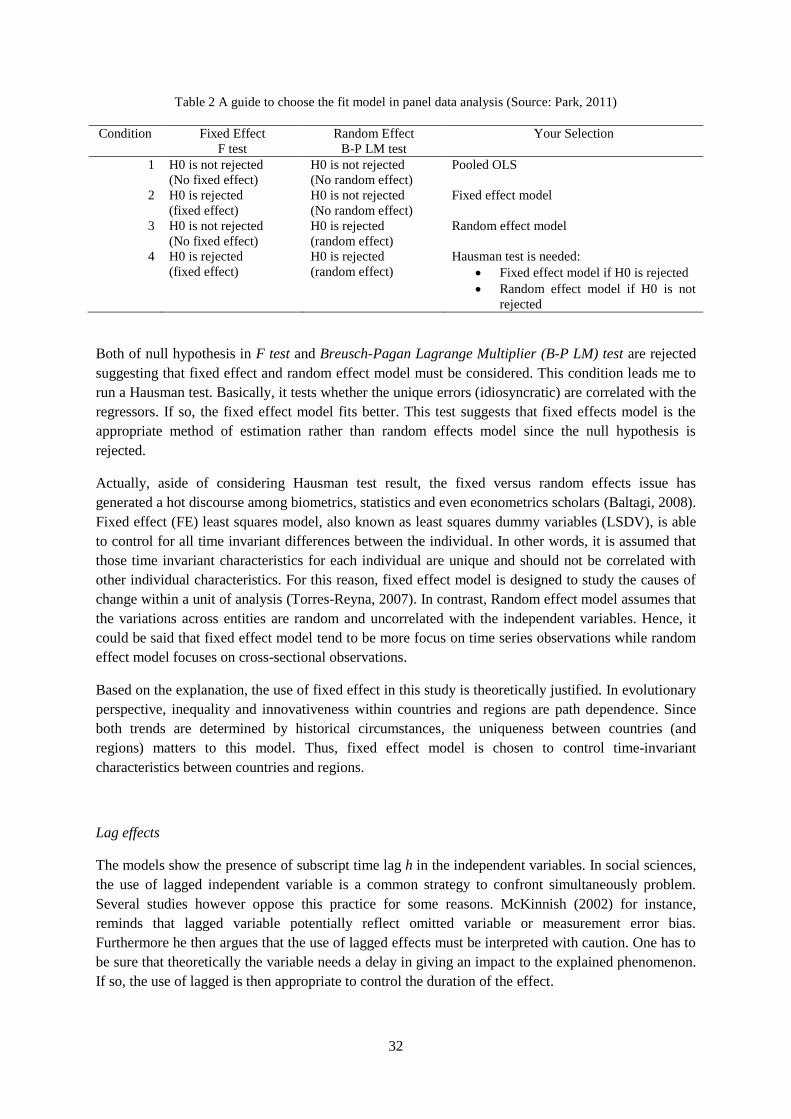
32
Table 2 A guide to choose the fit model in panel data analysis (Source: Park, 2011)
Condition Fixed Effect
F test
Random Effect
B-P LM test
Your Selection
1 H0 is not rejected
(No fixed effect)
H0 is not rejected
(No random effect)
Pooled OLS
2 H0 is rejected
(fixed effect)
H0 is not rejected
(No random effect)
Fixed effect model
3 H0 is not rejected
(No fixed effect)
H0 is rejected
(random effect)
Random effect model
4 H0 is rejected
(fixed effect)
H0 is rejected
(random effect)
Hausman test is needed:
Fixed effect model if H0 is rejected
Random effect model if H0 is not
rejected
Both of null hypothesis in F test and Breusch-Pagan Lagrange Multiplier (B-P LM) test are rejected
suggesting that fixed effect and random effect model must be considered. This condition leads me to
run a Hausman test. Basically, it tests whether the unique errors (idiosyncratic) are correlated with the
regressors. If so, the fixed effect model fits better. This test suggests that fixed effects model is the
appropriate method of estimation rather than random effects model since the null hypothesis is
rejected.
Actually, aside of considering Hausman test result, the fixed versus random effects issue has
generated a hot discourse among biometrics, statistics and even econometrics scholars (Baltagi, 2008).
Fixed effect (FE) least squares model, also known as least squares dummy variables (LSDV), is able
to control for all time invariant differences between the individual. In other words, it is assumed that
those time invariant characteristics for each individual are unique and should not be correlated with
other individual characteristics. For this reason, fixed effect model is designed to study the causes of
change within a unit of analysis (Torres-Reyna, 2007). In contrast, Random effect model assumes that
the variations across entities are random and uncorrelated with the independent variables. Hence, it
could be said that fixed effect model tend to be more focus on time series observations while random
effect model focuses on cross-sectional observations.
Based on the explanation, the use of fixed effect in this study is theoretically justified. In evolutionary
perspective, inequality and innovativeness within countries and regions are path dependence. Since
both trends are determined by historical circumstances, the uniqueness between countries (and
regions) matters to this model. Thus, fixed effect model is chosen to control time-invariant
characteristics between countries and regions.
Lag effects
The models show the presence of subscript time lag h in the independent variables. In social sciences,
the use of lagged independent variable is a common strategy to confront simultaneously problem.
Several studies however oppose this practice for some reasons. McKinnish (2002) for instance,
reminds that lagged variable potentially reflect omitted variable or measurement error bias.
Furthermore he then argues that the use of lagged effects must be interpreted with caution. One has to
be sure that theoretically the variable needs a delay in giving an impact to the explained phenomenon.
If so, the use of lagged is then appropriate to control the duration of the effect.

33
Indeed, I build a strong theoretical argument for the delay effect of patent to income inequality. Since
the alteration of income distribution is determined by the alteration of income itself, this study
considers whether the patent needs a time in giving an impact for generating money. Ken et al (2008)
propose that there is a time lag of 4 to 5 years for patent to give impact to firm profitability in U.S
pharmaceutical industry. Meanwhile, using panel analysis of Germany manufacturing industry, Ernst
(2001) find patent applications affect sales increases with a time-lag of 2 to 3 years after the priority
year. To sum up, I assume 3 years lag of independent variable for the basic model. The robustness
checks regarding the choice of time lag and the use of moving average is reported in the next chapter.

34
Chapter 4 Empirical Findings and Discussion2
4.1 The effect of innovation
4.1.1 Results of basic model at country level
Table A.1 Innovation versus income inequality at country level (basic model), Table A.2, and Table A.3
present the results of fixed effect regression at the country level for patenting activity as indicator of
innovation against Gini coefficient as dependent variables. All of them confirm that there is
significant correlation between innovation and income inequality. The relations are always positive,
suggesting that higher innovation lead to the increase of income inequality.
Table A.1 provides the basic model in which income inequality is measured by Gini coefficient from
Eurostat. The independent variable is measured by patent per million population with 3 years lag. The
model also includes several control variables consist of education attainment (edu high and edu low),
government expenditure (GovExp), trade openness (openness), unemployment rate (unemploy), GDP
per capita (gdpcap) and population growth (pop_growth). It can be seen that the effect of patents per
capita on the income distribution is always positive and significant. The effect is robust when control
variables are added.
Control variables indeed perform well. Both high educated and low educated workers level are
negatively related to the dependent variable, confirming the theory about skill-biased effect and the
race between education and technological change. In other words, boosting the average level of
education is important to restrain the increase of inequality since it keeps the supply of high skilled
labor to complement new technology remain steady. But one has to make sure that no one still left
behind and lagged in the low level of education. Otherwise the income inequality might still increase
as the proportion of high educated and low educated workers remains unbalance. Furthermore,
unemployment rate variable, although not always significantly correlated, shows the positive direction
as a sign that unemployment and inequality are closely related to each other and perhaps even the
same issue. It is going in line with what is suggested by Baker and Bernstein (2013) that period of
slack job markets has gone together along with the period of wage stagnation and the rising of income
inequality. Trade openness, although not always significantly correlated, mostly gives negative
direction to the predicted variable, means that globalization is good for European countries which
mostly advanced. Meanwhile, the significances and directions of GDP per capita, government
expenditure, as well as population growth variables are not always consistent.
To deal with the issue of reverse causation or simultaneity, I use time lag for patent per inhabitant as
explanatory variable. Moreover, the use of time lag also means that innovation effects are delayed
until they benefit by society as suggested in the prior chapter. As shown by Table A.2, the strongest
impact of innovation on income inequality is performed when considering 3-years lagged. The result
fades gradually when the lagged is increased along with the decrease of the R square. Finally the
relationship is not significant when it exceed ten-year lagged. Those characteristics of the model
indicate the temporary benefit of innovation. Patents that have been out of date are not beneficial
anymore for the society. Reversely, when the lagged is shorter (i.e 1 and 2 years), the correlation
directly become insignificant. Indeed it makes sense. It takes time for an invention to have impact to
the society. It might occur through two channels: either (1) through the increasing income of its
inventors and the firm as the patent applicants, or (2) by the diffusion mechanism in which innovation
2 Tables which are coded as table A started from table A.3 are presented in Appendix 4
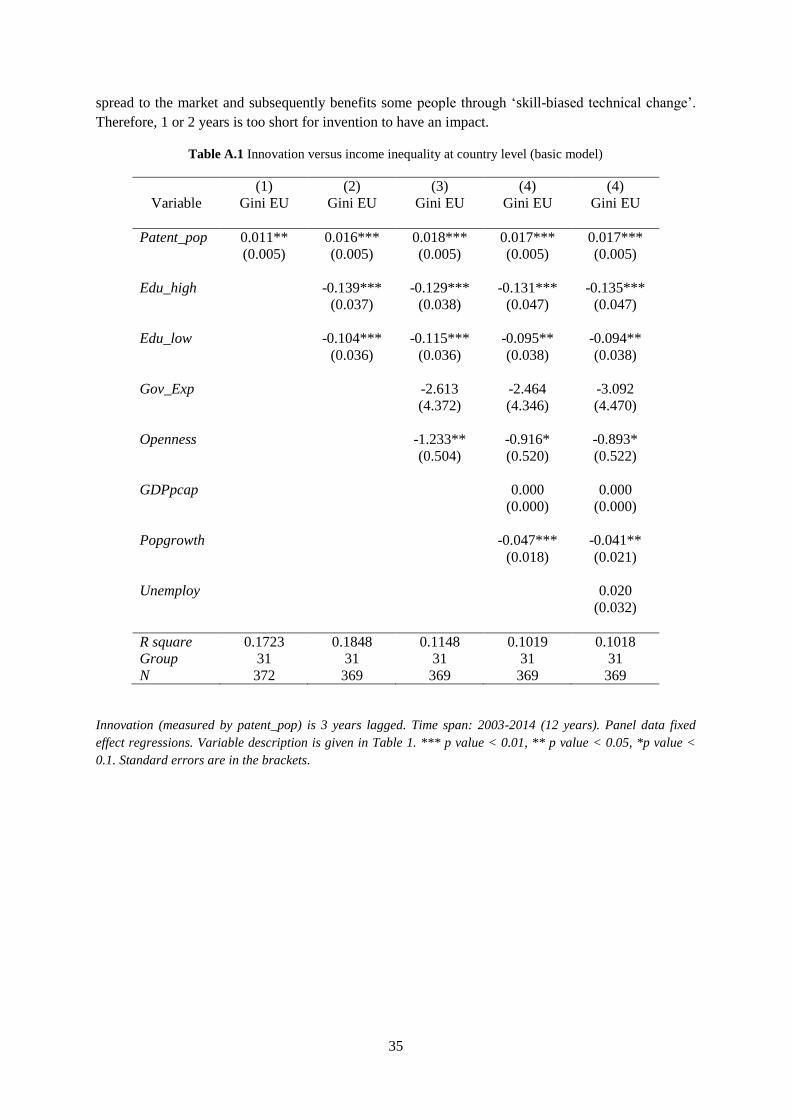
35
spread to the market and subsequently benefits some people through ‘skill-biased technical change’.
Therefore, 1 or 2 years is too short for invention to have an impact.
Table A.1 Innovation versus income inequality at country level (basic model)
Variable
(1)
Gini EU
(2)
Gini EU
(3)
Gini EU
(4)
Gini EU
(4)
Gini EU
Patent_pop 0.011** 0.016*** 0.018*** 0.017*** 0.017***
(0.005) (0.005) (0.005) (0.005) (0.005)
Edu_high -0.139*** -0.129*** -0.131*** -0.135***
(0.037) (0.038) (0.047) (0.047)
Edu_low -0.104*** -0.115*** -0.095** -0.094**
(0.036) (0.036) (0.038) (0.038)
Gov_Exp -2.613 -2.464 -3.092
(4.372) (4.346) (4.470)
Openness -1.233** -0.916* -0.893*
(0.504) (0.520) (0.522)
GDPpcap 0.000 0.000
(0.000) (0.000)
Popgrowth -0.047*** -0.041**
(0.018) (0.021)
Unemploy 0.020
(0.032)
R square 0.1723 0.1848 0.1148 0.1019 0.1018
Group 31 31 31 31 31
N 372 369 369 369 369
Innovation (measured by patent_pop) is 3 years lagged. Time span: 2003-2014 (12 years). Panel data fixed
effect regressions. Variable description is given in Table 1. *** p value < 0.01, ** p value < 0.05, *p value <
0.1. Standard errors are in the brackets.

36
Table A.2 Innovation versus income inequality at country level with various time lag
Variable
(2)
Gini EU IV Lag 2 years
(1)
Gini EU IV Lag 3 years
(3)
Gini EU IV Lag 4 years
(4)
Gini EU IV Lag 5 years
Patent_pop 0.007 0.017*** 0.017*** 0.016***
(0.005) (0.005) (0.005) (0.005)
Edu_high -0.131*** -0.135*** -0.144*** -0.132***
(0.047) (0.047) (0.047) (0.047)
Edu_low -0.082** -0.094** -0.094** -0.076**
(0.039) (0.038) (0.038) (0.038)
Gov_Exp -1.579 -3.092 -3.409 -3.258
(4.374) (4.470) (4.479) (4.491)
Openness -0.839 -0.893* -0.832* -0.761
(0.532) (0.522) (0.520) (0.521)
GDPpcap 0.000 0.000 0.000 0.000
(0.000) (0.000) (0.000) (0.000)
Popgrowth -0.044*** -0.041** -0.039** -0.040**
(0.020) (0.021) (0.020) (0.020)
Unemploy 0.021 0.020 0.023 0.022
(0.033) (0.032) (0.032) (0.032)
R square 0.0424 0.1018 0.1011 0.0766
Group 31 31 31 31
N 369 369 369 369
Innovation (measured by patent_pop) is lagged. Time span: 2003-2014 (12 years). Panel data fixed effect
regressions. Variable description is given in Table 1. *** p value < 0.01, ** p value < 0.05, *p value < 0.1.
Standard errors are in the brackets.

37
Table A.3 Innovation versus income inequality at country level
with various time span and various number of countries
Variable
(1)
Gini EU-32
2003 - 2014
(2)
Gini EU-27
2003 - 2014
(3)
Gini EU-15
2003 - 2014
(4)
Gini EU
1998 - 2014
(unbalanced)
(5)
Gini EU
1998 - 2014
(15 countries)
Patent_pop 0.017*** 0.013** 0.012** 0.028*** 0.027***
(0.005) (0.006) (0.005) (0.004) (0.004)
Edu_high -0.134*** -0.168*** -0.065
(0.047) (0.048) (0.059)
Edu_low -0.092** -0.061 0.079*
(0.038) (0.040) (0.046)
Gov_Exp -3.005 -3.674 5.686 -12.144 1.906
(4.445) (4.400) (5.455) (4.333) (5.190)
Openness -0.894* -1.687*** -2.220*** 0.239 -1.285**
(0.520) (0.512) (0.709) (0.435) (0.511)
GDPpcap 0.000 0.000 0.000*** 0.000 0.000
(0.000) (0.000) (0.000) (0.000) (0.000)
Popgrowth -0.042** -0.057*** 0.005 -0.031 0.019
(0.020) (0.020) (0.028) (0.020) (0.028)
Unemploy 0.017 0.049 0.077* -0.019 -0.008
(0.032) (0.033) (0.041) (0.032) (0.037)
R square 0.1004 0.1256 0.017 0.1477 0.4584
Group 32 27 15 32 15
N 374 324 180 471 255
Innovation (measured by patent_pop) is 3 years lagged. In column 4 and 5, time spans are extended. Panel data
fixed effect regressions. Variable description is given in Table 1. *** p value < 0.01, ** p value < 0.05, *p
value < 0.1. Standard errors are in the brackets.
Table A.3 describes models with the extended time span and the different numbers of observations.
While the basic model consists of 31 observation groups (EU-27 + Switzerland, Iceland, Turkey, and
Norway) between 2003 and 2014, the extended models attempt to adjust the number of groups
consisting only EU-27 countries and EU-15 (earlier member of EU and also the member of OECD
countries). For the EU-15, Eurostat provides the extended timespan of the data up to 1998 and hence
it makes the panel observation become longer. The entire extended models consistently result the
positively significant effect of innovation to income inequality. The longer panel of EU-15 even
provides higher R square and lower p-value in comparison to the basic model, means that the effect of
innovation to inequality is stronger in advanced countries. This finding also suggests that the

38
inequality phenomenon in emerging and advanced country might be caused by different factors and
subsequently could not be treated similarly.
R square for each model varies between 0.10 and 0.50. Although those are relatively low, it is
comparable with similar studies about innovation and inequality relationship in European case. It can
be seen for instance in studies from Lee (2011), Antonelli and Gehringer (2013), and Tselios (2008)
which also show the low value of R square. R square indicates how much the observed dependent
variable varies from the prediction of independent variables. Thus it explains how well the variable is
explained by the model. Since the study aims only to test the hypothesis, instead of predicting the
future outcomes, low R square does not mean that the model is bad. It only confirms that the increase
of income inequality in a macro level is a complex phenomenon that cannot be easily explained by
mathematical model. In contrast, the model from Aghion et al (2015) in regards of innovation and top
income inequality relationship in U.S shows the very high value of R square (more than 0.9) even
when they stand alone without additional control variables. I would argue that the value exaggerates.
OLS regression model from Aghion et al (2015) which uses dummy variable for state and time effect
take the dummies into account for calculating R square. Reversely, fixed effect model in this study
subtracts out the effect for each group of observations.
4.1.2 Other robustness checks
Several robustness checks were also done in the regression models as follows
i. R&D expenditure as independent variable
Patent activity is widely accepted for measuring the innovation output. But we are also able to
measure the innovation activities by R&D as innovation input since R&D represents a portion of the
resources that spend on learning to produce new products or new methods (Grossman & Helpman,
1994). As the alternative for independent variable, I then used R&D expenditure and divided it by
millions of inhabitant to deal with country size effect. The result is also significant in a positive
direction against income inequality as can be seen in Table A.4. The best result is performed by 3
years of time lagged, suggesting that the R&D spending also need time to be benefited for the market
and society.
Afterwards I also try to combine both R&D expenditure variable as the measurer of innovation input
and patenting activity as the measurer of innovation output in a same model. The result is still
significant with the increase of R square, indicating that the model is improved. However, for the
patent variable, the level of significance decreases but is still significant at the 90 percent level of
confidence interval. This might be due to multi-collinearity between those variables. Innovation input
and innovation output might be influenced each other since the correlation is high (0.87 of Pearson
correlation).
This is in line with previous finding. For instance, using longitudinal data at the firm level in U.S
Gurmu and Perez-Sebastian (2007) find there is the contemporaneous relationship between patenting
and R&D expenditures in which patent activity accounts for over 60% of R&D elasticity. Previously,
Montalvo (1997) reveals potential simultaneity problems in the Patent-R&D relationship. On one
hand, commonly accepted assumption is the expenditure in R&D would boost the invention in firms.
But on the other hand, one should consider the fact that once a patent is granted; the firm probably
need to increase R&D spending to transform the invention into a more commercial innovation. To

39
deal with this issue, I prefer not to use them together. Instead, it is better to see the robustness by
using R&D expenditure and patent activity as measures of innovation activity separately.
ii. The use of moving average for patent activity
The basic model provides a relation between numbers of patent application and income inequality
with static time lagged. One might argue that the duration for innovation to be diffused to a whole
society is not always typical for each of them. Several patents may need a longer time to be impactful
more than the others. To deal with the issue, I use moving average between 3 to 5 years for the patent
per inhabitant as the independent variable. The moving average reflects that the innovation effect to
the distribution of income may vary in the context of time lag. The results also perform correlation
between innovation and income inequality, with 5 years of moving average patent as the most given
significant effect. In other words, within 5 years since it was patented, an innovation may give an
impact to the income distribution. The whole result is described in Table A.5.
iii. Other indicators of inequality
In the basic model I adopted Gini coefficient as the most commonly use indicator of income
inequality as the dependent variable. To check the robustness, I also test the regression for different
measures. I look at the ratios between income percentiles. The first one is 90-10 ratio which shows the
ratios between income at the top of distribution (more than 90th percentile) and at the bottom of the
distribution (less than 10th percentile). The second is 90-50 ratio to see the income differences in top
half distribution and the last one is 50-10 ratio which represents the bottom half of distribution.
Table A.6 describes the regression results. The most significant and robust result is shown by the
regression of 90-50 ratio variable. For 90-10 ratio variable, the result is only significant for the longer
time series. However, there is no correlation between innovation and bottom half inequality as
measured by 50-10 of income ratio. These results are essential for the study. It confirms that
innovations are mostly benefited for those top income earners; allow them to gain much more income
thus leave the middle and low income earners behind. On the other hand, the bottom half of income
distribution is not affected by innovation. It perhaps means that wage stagnation and wage
polarization due to innovation and technological changes are there in most of European countries.
Moreover, I also attempt to replace Gini coefficient gathered from Eurostat with the Gini index which
is calculated by Ramos-Royuela (2014) based on European Union Survey on Income and Living
Conditions (EU-SILC) between 2003 and 2011. Since the correlation of both Gini indexes are higher
than 90%, the result is robust confirming that innovation and inequality is strongly correlated.
4.1.3 Innovation and top income inequality
Besides testing the innovation effect to total income inequality, I investigate further its effect to the
top income earners in particular. I perform the similar regressions as before but using top 1% and top
10% income share as dependent variables. While the previous result confirms the theory of skill-
biased technical change, this second test focuses on the empirical support confirming theories about
the role of superstars and entrepreneurs which reap the largest benefit of innovation activities.
Table A.7 presents the fixed effect panel regression results. Overall, the results strongly indicate the
positive relationship between innovation and top income inequality. To see the robustness, several
checks are also done similarly to the previous section. Nevertheless, unlike the previous models,

40
education attainment as control variable is irrelevant in the regressions. There is no significant
correlation between education levels of workers and top income shares. When education levels
variables are excluded, the models are then improved with the significant increase of R square. This
finding suggests that rising income of the top earners is not related to their level of educations. It is in
contrast to the role of skill-biased effect which opposing high educated versus low educated workers
regarding their wages.
The relation between innovation and top income earners is more significant when I regressed
patenting activity to top 10% shares rather than to top 1% shares and also followed by the higher R
square. It is also in line with the previous findings concerning the significant relation between
innovation and the 90-50 ratio and 90-10 ratio of income distribution. In other words, it could be
claimed that the benefit of country innovativeness is mostly enjoyed by the top 10% of earners,
thereby widening their income compared to the stagnation of those in median (50th percentage) and
the lowest of society (10th percentage), and finally resulting the greater total inequality as measured by
Gini index. To support this claim, I then check the correlation between all of the dependent variables
in this study. As shown by Table A.8, Gini index has higher correlation with top 10% shares rather
than with top 1% shares.
However, this finding does not mean that the increase of top 1% shares is not important in respect of
the increase of total income inequality. Instead, it only confirms that innovation activities in European
countries give broader impact to the society rather than those in US. According to the recent work
from Aghion et al (2015), in contrast to this study, they only find the relationship between innovation
and top 1% income shares. The impact is not significant to both top 10% shares and total inequality as
measured by Gini index.
Furthermore, in the context of the level of country’s development, innovation and top income
inequality relationship in those advanced countries as limited by the EU-15 are more significant as
compared to the rest. It suggests that the increase of top income inequality in European emerging
countries might be determined by other factors in addition to the degree of patenting activities which
are still lagged behind those advanced countries.
4.1.4 Results at regional level
Table A.9, Table A.10, and Table A.11 present the fixed effect regression results of innovation -
inequality relationship at regional NUTS1 level. The basic model consists of 84 observation groups
with unbalance panel data covers 8 years period (2004 to 2011). In line with the previous findings at
country level, they also confirm the strong and robust correlation between innovation as measured by
patenting activities and income inequality. The direction of innovation effect is consistently positive
and significant. Control variables are similar to previous study at country level except trade openness
and government expenditure which are irrelevant. The shares of high and low education attainment
level perform negative direction against the income inequality while unemployment rate and GDP per
capita perform positive direction.
The robustness checks are also done in regard to independent and dependent variables. In context of
the choice of lags and the use of moving average, the results are robust but slightly different from
country level regressions. As shown by Table A.10, the use of moving average for patenting activities
perform better results compared to the basic static model. The most significant relation is performed
by 3 years lag with 5 years average of innovation effect (i.e innovation from t-7 to t-3) and it is also

41
followed by the higher R square, confirming that the model is better. It suggests that, the impact of
skill-biased and monopoly rent due to innovation activity in region are longer rather than in country
level. It also means that geographical proximity does matter. However, there is no evidence that the
diffusion effect come faster in regions as compared to countries, since the relation becomes
insignificant while the choice of lags less than 3 years in both of models.
Meanwhile Table A.11 describes the effect of innovation to several alternative measures of
inequality, including 90-10 ratio, 90-50 ratio, and 50-10 ratio of income distribution. The results are
consistent with the country level regressions. Innovation only affect the unequal distribution for 90-10
ratio and the top half distribution as measured 90-50 ratio, confirming that the largest benefit of
innovation is reaped by those in the top. Unfortunately, there is no data available for top 1% and 10%
shares at regional level to support this claim further.
4.2 The effect of technological specialization
The second main question for this research is to understand whether the diversity of innovation
activities matters to the income distribution. Using fixed effect regression, I test the correlation
between the reciprocal of the coefficient of variation (1/CV) of the RTA index as the measure of
technological diversification and the several measures of income inequality. The previous control
variables are also added to the model as well. Besides, patent per inhabitant which was the
independent variable in previous model is treated as the additional control variable in this current
model as suggested by the finding above that innovation intensity is strongly correlated with
inequality.
Table A.12, Table A.13 and Table A.14 present the results of the regressions. In general, the findings
confirm that technological diversification, as opposed to technological specialization, is strongly
correlated with income inequality in a negative direction. In other words, diversification leads to the
decrease of income inequality. In contrast, the higher specialization, as the opposite of diversification,
leads to the increase of inequality. Hence one should note that if a country/region tends to concentrate
its activity only to few sectors, it will likely increase the total income inequality.
Table A.12 gives results of the basic model at country level. The correlation is always significant in
various observations including EU-31, (EU-27 + Iceland, Norway, Switzerland, and Turkey), and EU-
15 respectively. The highest R square is shown by model which consists of EU-15 representing the
more advanced countries in EU. Furthermore, the result is robust when patenting activities as
innovation intensity variable is replaced by R&D expenditure.
Table A.13 presents the regression result of innovation diversification against other indicators of
income inequality, including 90:10 ratio, 90:50 ratio, 50:10 ratio, top 10% shares and top 1% shares.
The result is significant and robust except for 90:10 ratio and 50:10 ratio. Meanwhile for top 1%
shares, despite its significant correlation, the R square of the model is very low comparing to others.
These findings suggest that the role of innovation diversity is in line with innovation intensity. Both of
them benefit mostly for the top 10% earners and thus affect the total income inequality. On the
contrary, the diversification does not affect the distribution of income in bottom half level.
The diversity of innovation is reflected by the variation of RTA index which is calculated from patent
application of WIPO. It is classified into 35 technology fields as developed by Schmoch (2008). As
mentioned before, most of the data for this study are gathered from Eurostat, including patent
application of EPO for measuring innovation intensity. Unfortunately, Eurostat cannot distinguish

42
patent application into those 35 fields. Thus, I realize that this problem become one of the drawback
of this study. On one hand, innovation intensity is measured by EPO patent while on the other hand
the diversity is calculated from WIPO patent.
As comparison and for the robustness check, I then apply another strategy which fit with the data of
EPO patent statistics provided by Eurostat. Instead of classifying into 35 technological fields, using
Eurostat I am able to distinguish the patent application based on its hierarchical IPC code up to the
second level. Thus for each region/country, yearly patent application statistics for each IPC first level
of classification, consist of 8 classes from A (Human Necessities) to H (Electricity) and for each
second level of classification, consist of 123 subclasses (e.g A01, A02, G21, etc) are available. With
those data at hand, I calculate the degree of diversification using the same method as before.
Table A.14 gives the regression results of this alternative classification index against several
measures of income inequality. The results also confirm that the diversity of innovation affects total
income inequality and top income inequality through the shares of top 10% earners. Both at country
level and regional level, the correlation is strong with negative direction. The R square for models
which classify technological sector into 123 subclasses is very low. I assume that classifying
technological fields into subclasses is too specific. To sum up, both models which classifying
innovation sector based on Schmoch (2008) and based on IPC hierarchical level propose the same
finding: technological specialization as measured by RTA index does matter to income inequality.
However, when technological diversification is measured by entropy index, the results are not robust.
I found the strong correlation between entropy index and income inequality with negative direction
when the index is built based on IPC hierarchical level classification. Indeed those are in line with
previous findings. In contrast, when the index is built based on WIPO technological field
classification, the correlation is positive. This unexpected direction will be elaborated in the
discussion part later.
4.3 Discussion of the empirical findings
4.3.1 Evaluating the first hypothesis
Overall, the results confirm the presence of causal link between innovation and income inequality. In
this section, I try to connect those findings into the existing theories supporting the hypothesis of this
study. Firstly, the finding is in line with the theory of skill-biased technical change. Innovation effect
is not neutral in enhancing the whole of people income. Instead, it benefits partially while harms
others. The results show that strong effect of innovation is not only there in relation to total income
inequality as measured by Gini index, but also to top half inequality as measured by 90:50 ratio.
Innovation tends to increase along with the rising income of top earners (i.e high skilled labor) while
those in the median remain stagnant. In contrast, the effect of innovation is not significant to
inequality in low half income distribution as measured by 50:10 ratio.
Based on these findings, it confirms that middle skilled jobs with routine tasks are the most vulnerable
to the introduction of new technology. The explanation of this phenomenon is stressed well by
Acemoglu and Autor (2011). Hypothetically, the income stagnation of those in the median occurs
because their tasks are substituted by automation. Thus, it dampens their wages relatively to the high
skilled labor. Reversely, innovation allows high skilled labor whose tasks are more non-routine to
increase their productivities. It then leads to the significant growth of their income. Meanwhile, the
middle-level labor does not obtain more benefit of innovation as compared to low skilled labor at the

43
bottom of income distribution. Instead, innovation does not affect the demand of low skilled labor
whose jobs are characterized by non-routine manual service tasks. As a result, many labor displaced
from medium to low skilled jobs which is called as job polarization phenomenon. It then causes an
indirect increase of wages gap between top and the bottom of distribution (Dreger, López-Bazo,
Ramos, Vicente Royuela, & Suriñach, 2015).
Secondly, this study also confirms the role of monopoly rent which to some extent may increase the
income inequality. It is reflected by the empirical finding that innovation affects the income shares of
top 10% earners as well as top 1% earners. This is in line with the Schumpeterian model from Aghion
et al (2015) which then supported by their empirical study with U.S as the case study. According to
their model, the increase of top income shares is caused by the increase of entrepreneurial income
from innovators which then compensate the decrease of wages income shares (i.e employee salaries).
However, the results present that innovativeness in European countries have greater effects to top
10% earners relatively to top 1% earners. This confirms that the role of entrepreneurial share is
exaggerated. Since number of entrepreneur in most European countries is far less than 10% of its
population, one should consider the presence of the spillover effect. Innovation is not only benefitted
by the entrepreneur directly through the increase of his revenue. More than that, innovation could
benefit other stakeholders including high skilled workers through the increase of productivity. In other
words, innovation may benefit the entrepreneur without compensate the wage premium for high
skilled labor. They possibly go together. Apparently, it fits better with the superstars theory as
introduced by Rosen (1981), Kaplan and Rauh (2013), and Brynjolfsson and McAfee (2014).
Innovations and technological changes allow not only entrepreneurs but also those in various
occupations to boost their incomes. Those include superstars in sectors such as media, entertainment,
management, and even sport.
4.3.2 Comparing the result to previous empirical works
In this section, the comparison between the result and previous studies will be investigated. Some of
these findings confirm the previous studies while the others oppose them. Indeed these will enrich on
the innovation - inequality relationship discourse. Unsurprisingly, I found only few recent studies
which are typical to this study. Hence, the discussion will be limited only to three comparable recent
studies.
Firstly, this study is closely related to recent work from Aghion et al (2015) which provides U.S. state
panel data from 1975 to 2010 to investigate the relation between innovation and top income
inequality. As mentioned above, the similarity of this study with Aghion et al (2015) is that I also
found the identical strong and robust effect of innovation to top income inequality in Europe as
measured by top 1% shares. Nonetheless, their recent study did not find the positive effect of
innovativeness on other measures of inequality. They even found that innovation and Gini index are
correlated in negative direction, whereas this study suggests that the correlation is positive and
significant.
Those different findings bring me to the next question: why does innovation affect total income
inequality in Europe but not in U.S? On one hand, the inequality in U.S. is higher than in most
European countries. According to Krugman hypothesis, inequality in Europe has been successfully
suppressed due to the effective role of labor market institutions and welfare state policies (Krugman,
1994). It then becomes trade-off with the increase of unemployment in Europe relative to U.S. But on

44
the other hand, innovativeness to some extent affects inequality in Europe rather than inequality in the
U.S which is significantly higher.
Lee and Rodriguez Pose (2013) suggest that the variance is rooted in the dissimilarity of labor market
structures and welfare systems between them. In U.S, where welfare state policies are less developed,
low skilled workers are not affected by the new innovation because they are already involve in the
employment before new innovation is introduced. On the contrary, in rigid European labor market,
where unemployment is high, innovation generates new jobs for low skilled workers and attracts them
to involve in the employment. Since the new unskilled workers must be paid by low salaries, it leads
to the increase of income gap between high skilled and low skilled workers and hence affects total
income inequality. Another explanation is the role of fluid labor movement in U.S which allow low
skilled and high skilled labor to migrate across states. Thus, the effect of innovation to inequality
within state will be bias due to migration influence. Reversely, European countries and regions which
commonly have lower migration pattern will restrict their benefit of innovativeness only to their area.
Secondly, this study is comparable to the recent work from Antonelli and Gehringer (2013). Providing
panel data of European countries between 1995 and 2011, they also test the relation between
innovation and income inequality. Nevertheless, the result of this study is contradictory to their
empirical evidence which suggest that innovation leads to the decrease of income inequality in
European countries instead of increasing it. According to them, theoretically innovation tends to
decrease it through two channels: (1) directly as crucial factor in reducing market imperfection and (2)
indirectly via the positive effects of the increase of labor productivity. The fast rate of technological
change makes the duration of monopoly rent shorter and the transfer of the benefits to consumers
much faster. Furthermore, indirectly, technological change also increase total factor productivity that
leads to higher levels of labor productivity. Labor productivity increases the level of saving and thus it
increase the stock of financial resources, the consequent reduction of interest rates, the increase of
overall wages, and hence the reduction of income from wealth as the origin of income inequality.
I would argue that these contradiction results occur due to methodological issue. This study applies
Fixed Effect (FE) panel regression which focuses on within effect estimation while Antonelli and
Gehringer (2013) utilize Feasible Generalized Least Squares (FGLS) regression which treats between
and within country effect identically. To understand this difference, let us interpret the visualization of
innovation-inequality relationship in EU-15 countries in 2000 and 2010 in figure 8.
Figure 8 Patent versus Gini in EU countries in 2000 and 2010

45
FGLS method would suggest Portugal (PT), which located in the top left of the graphs, to catch up
Sweden (SE), located in the bottom right of the graphs, in term of its innovativeness in order to
decrease income inequality. Thus, it would lead to the conclusion that innovation tends to decrease
income inequality as recommended by Antonelli and Gehringer (2013). On the contrary, since FE
model controls time-invariant differences between the countries, it is designed to study the causes of
changes within a subject (Torres-Reyna, 2007). The Hausman test confirms this study to use FE
model instead of Random Effect or FGLS model. Furthermore, aside of the test, I would argue that in
this case FE fits better rather than FGLS since both inequality and innovativeness phenomenon is path
dependence. In other words, the heterogeneity between countries (and regions) is the result of their
past circumstances. While each entity has its own individual characteristics due to historical effects, it
is not apple to apple if we conclude that income inequality in Scandinavian is low because they are
more innovative rather than in Greece and Portugal which are less innovative.
Thus, this study focuses on the longitudinal trend of innovation-inequality relationship within
countries. Fixed effect model allows us to investigate whether those trends are similar one to another.
Figure 9 visualizes the fixed effect model of this study in particular for Finland, Netherlands, and
Sweden respectively.
Figure 9 Fixed effects model (LSDV) visualization for 3 countries
Lastly, this study is most similar to the recent work of Lee (2011) which also regress the innovation
activities against income inequality in Europe. The extension of this study is regarding the longer
panel data and the more macro level of observations. While Lee (2011) focuses on the relationship
within regions in 6 years period, I extend the study up to 8 to 19 years in both region and country
level. The results are consistent. Innovation strongly relates to income inequality both in region and
country level. However, based on this study, the result in country level seems to be more robust as
compared to regional level.
One might suggest that regions, rather than countries, have to be considered as unit of analysis as
Europe has been considerably integrated in term of their economy activities. Moreover, innovative
capacity may vary between regions within nations since innovations are often clustered and
concentrated geographically (Porter & Stern, 2001). Yet I would argue that country boundary is still
significant for investigating innovation - inequality relationship in Europe case. First of all, I agree
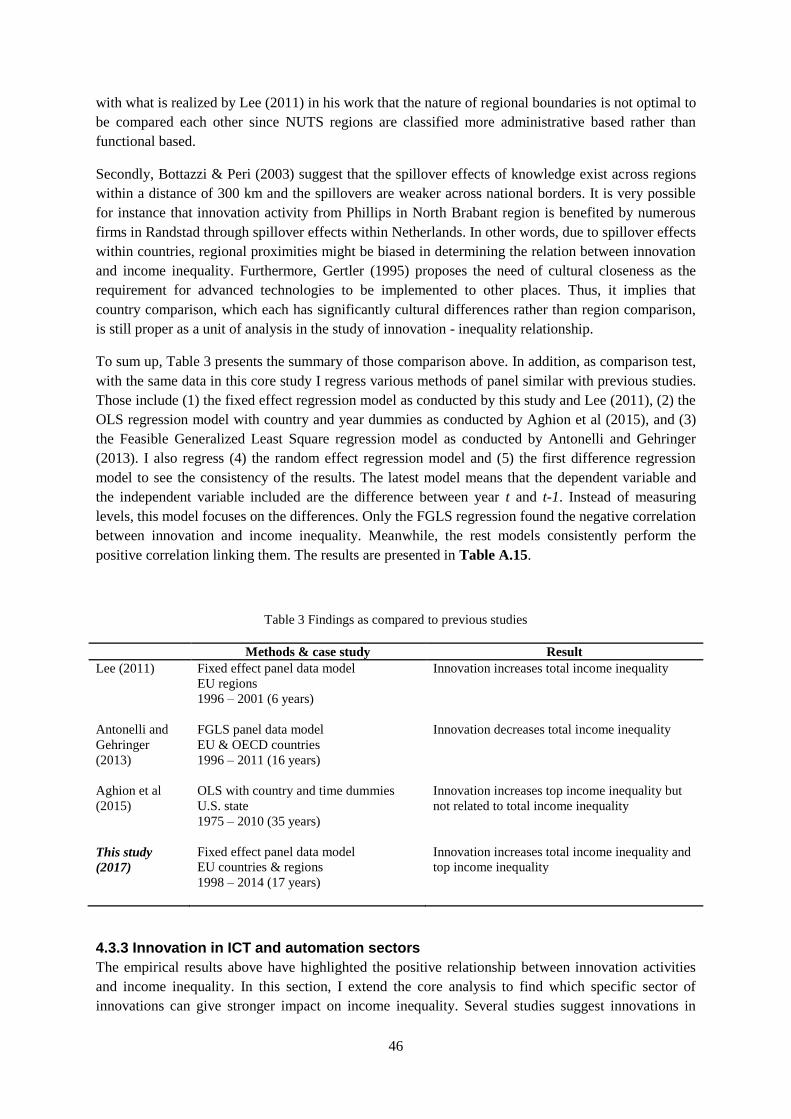
46
with what is realized by Lee (2011) in his work that the nature of regional boundaries is not optimal to
be compared each other since NUTS regions are classified more administrative based rather than
functional based.
Secondly, Bottazzi & Peri (2003) suggest that the spillover effects of knowledge exist across regions
within a distance of 300 km and the spillovers are weaker across national borders. It is very possible
for instance that innovation activity from Phillips in North Brabant region is benefited by numerous
firms in Randstad through spillover effects within Netherlands. In other words, due to spillover effects
within countries, regional proximities might be biased in determining the relation between innovation
and income inequality. Furthermore, Gertler (1995) proposes the need of cultural closeness as the
requirement for advanced technologies to be implemented to other places. Thus, it implies that
country comparison, which each has significantly cultural differences rather than region comparison,
is still proper as a unit of analysis in the study of innovation - inequality relationship.
To sum up, Table 3 presents the summary of those comparison above. In addition, as comparison test,
with the same data in this core study I regress various methods of panel similar with previous studies.
Those include (1) the fixed effect regression model as conducted by this study and Lee (2011), (2) the
OLS regression model with country and year dummies as conducted by Aghion et al (2015), and (3)
the Feasible Generalized Least Square regression model as conducted by Antonelli and Gehringer
(2013). I also regress (4) the random effect regression model and (5) the first difference regression
model to see the consistency of the results. The latest model means that the dependent variable and
the independent variable included are the difference between year t and t-1. Instead of measuring
levels, this model focuses on the differences. Only the FGLS regression found the negative correlation
between innovation and income inequality. Meanwhile, the rest models consistently perform the
positive correlation linking them. The results are presented in Table A.15.
Table 3 Findings as compared to previous studies
Methods & case study Result
Lee (2011) Fixed effect panel data model
EU regions
1996 – 2001 (6 years)
Innovation increases total income inequality
Antonelli and
Gehringer
(2013)
FGLS panel data model
EU & OECD countries
1996 – 2011 (16 years)
Innovation decreases total income inequality
Aghion et al
(2015)
OLS with country and time dummies
U.S. state
1975 – 2010 (35 years)
Innovation increases top income inequality but
not related to total income inequality
This study
(2017)
Fixed effect panel data model
EU countries & regions
1998 – 2014 (17 years)
Innovation increases total income inequality and
top income inequality
4.3.3 Innovation in ICT and automation sectors
The empirical results above have highlighted the positive relationship between innovation activities
and income inequality. In this section, I extend the core analysis to find which specific sector of
innovations can give stronger impact on income inequality. Several studies suggest innovations in

47
ICT as the key determinant of the ‘biased’ considering that since the end of 1970s innovations in ICT
have grown unprecedented along with the rise of inequality. Additionally, Ford (2015) argues that the
ability of ICT innovations to encapsulate intelligence allows them to act as humans: they can make
decisions or solve problems. Even further, computer is able to perform specialized, routine, and
predicted tasks better than human. Hence innovations in ICT lead to supress middle skilled labor,
affect to the polarization of jobs, and finally increase income inequality.
While in the previous model innovation activities are perceived as a ‘black box’, now innovations are
distinguished into several sectors. Eurostat is able to classify patent activities by ‘popular’ sectors.
Those include EPO patent applications in ICT sector, high tech sector, biotechnology sector, and
energy sector. ICT patents consist of four fields based on selected IPC codes including
telecommunications, consumer electronics, computers, office machinery and other related ICT
technologies. To investigate the role of ICT patents comparing to others, the first strategy is by
regressing a series of models with those variables as the explanatories respectively.
Table A.16 presents the results for basic model at country level. It confirms that relative to other
sectors, ICT patents are strongly correlated with income inequality as measured by Gini index. I found
no correlation between patents in high technology sector and income inequality. The explanation is
perhaps high tech sector consist of various fields of innovation, including patents in aviation, laser and
genetic engineering, which do not directly impact the working activities. Meanwhile, biotechnology
patents are weakly correlated; whereas energy patents, although are strongly correlated, have a very
low value of R-squared.
The next step is regressing ICT patents against several measures of inequality. Furthermore, the ICT
patent - inequality relationship in regional level is also tested. Table A.17 and Table A.18 show that
ICT patents also affect top-half of income distribution and the growing income of top 10% and top
1% of the richest population. The findings are consistent at country and regional level. Aside from
affecting total income distribution, one might question why ICT also affects earnings of those in the
top. Apparently, the empirical findings are in line with paper from Kim and Brynjolfsson (2009)
which explain how innovations in ICT affect superstars in various sectors of occupation. According to
them, since computer can ‘think’, ICT has amplified the ability of top executive in decision making
process. Specifically, the impact of management decisions can be amplified by ICT because
instructions and innovations from the top are “propagated, implemented, and monitored” (Kim &
Brynjolfsson, 2009). Thus, management decisions will be more valuable comparing to pre-ICT
approach. As a result, top management compensation can be expected to increase as the decision
effects enforce firms to generate larger revenue.
As the robustness checks, I then substitute ICT patent activities as independent variable by the shares
of ICT sector to GDP statistics which are also available in Eurostat. However the expected
relationship was not there. It means that the rise of income inequality is not affected by the size of
ICT sector. The explanation could be because innovations in ICT are not only benefited by those who
work in ICT sector. Since ICT is a general purpose of technology, its impact will occur across sectors.
The role of ICT is different from prior technological revolutions which generally disrupt only a
specific sector at a time but then are able to generate new emerging industries (Ford, 2015). In
contrast, innovations in ICT broadly affect numerous occupations in all sectors of industry.
Secondly, several studies rather concern to the role of automation instead of ICT solely. In other
words, not only ICT, but automation in general may reduce the demand of routine-task labor. The
International Society of Automation defines automation as "the creation and application of

48
technology to monitor and control the production and delivery of products and services”3. Thus,
automation can be achieved by various instruments aside of computer, but also those related to
electronic device, mechanical, or combination between them. Unfortunately, patent statistics in
automation field are not directly available. But Eurostat enable to distinguish patent statistics based on
their IPC code. I then focus on the first level of IPC code to investigate whether patents in which IPC
codes are related to automation is strongly correlated with income inequality among the rest.
Assuming that automation related patents are those classified within class F (Mechanical), G
(Physics), and H (Electricity), 8 models with diverse independent variables ranging from patent
members of IPC code A (human necessities) to H (electricity) are then regressed.
Table A.19 presents the results. It confirms that patent activities in class F (Mechanical), G (Physics),
and H (Electricity) are correlated to income inequality. The strongest correlations on inequality are
shown by the electricity and physics patents which also include ICT related patents such as
semiconductor, basic communications, and telecommunications. Aside from ICT patents, these
classes also consist of electrical machinery and control which also related to automation process.
Meanwhile, although the correlation is weak, mechanical patents does also matter in terms of
automation process which also affecting the skill-biased of innovations. In contrast, patents activities
within class B (Performing operations), C (Chemistry), D (Textiles), and E (Fixed constructions) are
not correlated with income inequality whereas patents activities in class A (human necessities) is
weakly correlated.
4.3.4 Evaluating the second hypothesis
The novelty of this study is providing the empirical evidence suggesting that technological
specialization may lead to income inequality. Many previous studies focus on how the intensity of
innovation activities affects income inequality; surprisingly I did not find any of them discuss the
impact of the level of specialization/diversification. Overall the findings suggest that concentrating
innovation activities into few narrow sectors will lead to the increase of income differences between
and within sectors. It confirms the hypothesis that has been constructed in chapter 2 above.
Firstly, technological specialization leads to inter-sector wage differentials. Sector in which
innovation activities are concentrated tend to be able to produce better goods with lower cost
comparing to the rest. Hence it leads to the increase of trade specialization which then followed by the
increase of exports. Since the sector is able to generate more money, demand for labor will also
increase along with the increase of their income. The higher demand is especially for those high
skilled labor which can complement the innovation activities. In other words, skill-biased technical
change is not only about the bias between high and low skilled workers, but also refers to the shift of
labor from low technological to high technological sector which offer higher salaries.
Secondly, the inter-sector wage differentials are compounded by the rise of inequality within sector
that cause total income inequality getting worse. The rise of inequality within sector is indicated by
job polarization. High skilled workers on one hand benefit from the introduction of new technology.
On the other hand, the middle skilled workers are threatened. Innovations push them to shift their jobs
into more unskilled tasks which paid lower. A finding from Shim and Yang (2015) confirm that
‘inter-industry wage differentials’ are the key source of the differences level of job polarization across
sectors. Sector which initially has high wage premium, as sign of a more high technology sector, tend
3 Referred to the definition from The International Society of Automation; website https://www.isa.org/about-
isa/what-is-automation/

49
to have higher gap of income inequality between high and low skilled workers. The explanation is
because firms in that sector cut production costs by substituting middle skill workers who perform
routine tasks with new technology while in contrast high skilled workers are prized higher as they are
able to complement innovations.
High technological specialization means that the distribution of innovation activities is limited into
few narrow sectors while the rest lagged behind. For those reasons above, this will increase the wage
differences between and within sector; and consequently it leads to the increase of total income
inequality. In other words, this finding also suggests that technological diversification, as oppose to
specialization, is better to restrain the increase of income inequality. Diversifying innovation activities
into broad sectors will create the equal wages premium across sectors and thus inter-sector wage
differential will be suppressed. Indeed, income gap within sectors will continually establish along
with the presence of skill-biased technical change in all sectors. However, since the level of
polarization is higher in more innovative sectors, diversifying innovations also to some extent will
limit the job polarization within sectors.
One might question whether technological diversification is good for growth; whether the action to
restrain inequality, instead, compensating a trade off into economic development. In chapter two I
have discussed previous literatures which suggest that technological specialization is good for growth.
Since technological specialization and trade specialization co-evolve, they will simultaneously
increase the value of exports in a particular sector and thus leads to the increase of total growth.
Another channel through which specialization affect growth is also suggested by Marshall-Arrow-
Romer (MAR) externality and supported by Porter (1990). According to them, knowledge spillovers
between firms intra-sector is the source of growth. Hence the specialization will help country to boost
the overall growth.
However, several studies on the other hand reveal the important role of technological diversification
as opposes to specialization. One of the most prominent theories is introduced by Jacobs (1969) which
is then called as Jacob externality. The basic idea is that knowledge spillovers occur across sectors
and ideas are able to be transmitted across different lines of work. Furthermore, recombination
between knowledge in different industries will fosters innovation and thus become source of growth.
For this reason, this view believes that variety across sectors, rather than specialization, is good for
growth considering that in diversification creates is more opportunities of different ideas to be
interchanged across sectors.
Glaeser et al (1992) provide empirical evidence confirming that diversity helps, while specialization
hurts, employment growth. Using panel data across industries in 170 cities in U.S, they found that the
employment growth in diversified cities is higher than specialised cities and argue that Jacobs
spillover across sectors is more important rather than MAR internal externalities. Additionally,
Frenken et al (2007), by approaching the Jacob technological diversification by the term of Related
Variety, confirm that spillovers between sectors in Netherlands regions are able to stimulate
employment creation and lead to growth. For those reasons, we can consider that technological
diversification is not only good to restrain income inequality but also to boost the growth.
Extended discussion and some drawbacks
Furthermore, in this section I also highlighted some points in the findings which are interesting to be
discussed. First of all, I found that the effect of technological specialization does not only exist on

50
total income inequality as measured by Gini index, but it also affects the shares of top 1% and top
10% earners. It might explain that aside from workers differentials, the specialization also affects the
entrepreneurial rent differentials. Those innovators in high technological sectors might benefit the
higher rent than in low technological sectors. Furthermore, within superstars, those in high tech
sectors also possibly gain larger benefit of innovation activities. However, further research is needed
to investigate the phenomenon, since, in this study, the sources of income are not specifically
distinguished.
Secondly, I also found that models which included innovation intensity as control variable together
with technological specialization as the predictor have a significantly higher value of R square.
Moreover, the predictor also gives the stronger correlation to the income inequality. It suggests that
technological specialization and innovation intensity are intertwined affecting the income distribution.
Putting those variables together is also worthy because RTA index is sensitive to country size in
context of innovation. Khramova et al (2013) suggest that RTA analysis is more relevant for countries
with a large number of patents while analysing RTA in a country with a small number of patents leads
to a distorted picture of country’s advantages. Therefore, he suggests that the analysis must be
complemented by other indicators.
Thirdly, the results also suggest that technological specialization is sensitive to the choice of measures
used in predicting the income inequality. I found the unexpected direction of the relationship when
technological specialization is measured by entropy index. I have two possible explanations for this
inconsistency. The first problem is that entropy index only reflects the inter-sector differences of
innovation activities. Entropy index suggests that innovation is more concentrated in sector which has
higher absolute number of patent activities than the lower one. Meanwhile, RTA index allows
comparing the activities relatively to other countries/regions. A sector is called more concentrated if
the patenting activities are relatively higher than other countries. As an example, consider a country
has two technological fields with different number of patent activities: sector A has 10 patent
applications per inhabitant while sector B only has 5 patent applications per inhabitant. Entropy index
will suggest that the distribution is unequal and this country tends to be more specialized in sector A.
However, RTA index will take global patent into account. It is able to investigate how high those two
sectors patent activities comparing to those in other countries. Let’s assume that in global average,
sector A and sector B patent activities are similar to the country, both 10 and 5 patents per inhabitant
respectively. It could be said that according to RTA index, the distribution of innovation activities are
fair and hence can be called as more diversified.
The second explanation is due to measurement error. As discussed earlier, I use WIPO patent to
calculate technological specialization level while innovation intensity is counted using EPO patent
because Eurostat cannot provide patent statistics in 35 fields of technology. But when technological
specialization is calculated from EPO patent, based on IPC code hierarchical level instead of 35
technological fields, I found that the effects of technological specialization as measured by RTA and
entropy index are parallel. It means that the choice of patent statistics (whether EPO, USPTO, or PCT
WIPO) is sensitive to the results and thus the choice must be consistent.
The final point that I want to discuss is regarding the basic assumption that technological
specialization and trade specialization co-evolve. This study assumes that when a country tends to
concentrate their innovation activities in one field, the benefit is only obtained by the industry related
to the sector. However, this theory is not without criticism. Apparently, it is commonly found that due
to its complexity, a product requires more than one innovation across fields. Patel and Pavitt (1994)
for instance found that companies in motor vehicle industries only have 28.8 percent of patent in
51
transport sector; but they also have 20.7 percent in of patent in electrical sectors. It suggests that
motor vehicle also needs innovation in electricity. Thus, since firms are able to orchestrate several
technologies into a single product, technological specialization cannot guarantee the specialization of
products.
4.3.5 Is there trickle-down from innovation to poverty reduction?
In this section, I extend the core analysis by investigating the effect of innovation on poverty rate and
incomes of those at the bottom of distribution. Although findings of this study confirm that innovation
increases income inequality and the income shares of those at the top, the proponents of trickle-down
economics may argue that the main problem of the society is poverty instead of inequality. According
to them, as long as the rising income at the top is able to generate more jobs and increase incomes at
the bottom, income inequality is considerably acceptable. In other words, the widening gap between
rich and poor is not an issue as long as both of their incomes increase together.
On the contrary, many studies oppose trickle-down effect theory by revealing that inequality and
poverty are connected in a positive direction. As examples, Atkinson (2015) exposes that higher
poverty tends to go together with larger top shares of income and Wade (2005) suggests that
inequality leads to a lower contribution of economic growth to poverty reduction. Furthermore,
Ravallion (2005) shows that the initial level of inequality in a country is important for the elasticity of
poverty reduction. According to his study, in the most unequal countries, a 1% increase in incomes
may reduce 0.6% of poverty; whereas in the most equal countries, it yields a 4.3% of reduction. For
this latter reason, Jafar (2015) in his recent article published in World Economic Forum claims that
trickle-down economies has failed to eliminate poverty. Even further, he reveals the need of inclusive
growth which represents the equality of opportunity for all people as the rejection to trickle-down
economies.
While in the recent decades the inequality-poverty discourses have been sharper and more obvious, I
found only few study take the role of innovation into account. Sachs (2003) for instance offers an
optimistic view regarding the role of innovation in overcoming poverty in developing countries.
Meanwhile, Cozzens and Kaplinsky (2009) propose a more evolutionary perspective on the
relationship between innovation and poverty. According to them, innovation affects poverty into two
opposite directions. Firstly, process innovation may increase poverty rate through skill biased and
unemployment. Capital intensity in process innovation substitutes people with machines in the work
process. In contrast, specific product innovations such as malaria and HIV drugs or cheap computers
show that innovation can work for the poor: providing new opportunities and allowing them to
increase their quality of life. In addition, claiming as the first study which considers the effect of
technology on poverty, the recent empirical study from Lee and Rodriguez-Pose (2016) investigates
whether growth in high-technology industries is associated with poverty reduction. The results of their
panel analysis in 295 US metropolitan regions show that no real effect of the presence of high-
technology industries on reducing poverty.
To investigate the role of innovation on poverty reduction, I extend the regression analysis into three
directions. First, I test the relationship between innovation as measured by patenting activities and the
absolute income of the poor groups; those include the average household income at bottom 10% and
bottom 20% of the distribution. Secondly, instead of focusing on the absolute income, I substitute the
dependent variable with the shares of income as the ratio to total household income. Third, I also test
the relationship between innovation and relative poverty income as measured by at risk poverty rate

52
with various poverty line thresholds. All data are obtained from the EU statistics on income and living
conditions (EU-SILC) available on Eurostat for country level in the period between 2003 and 2014.
Table A.20 presents the first series of regressions. It reveals that innovation has a strong correlation
with absolute income at the bottom of the distribution. As comparison, I also regress innovation
against the median and absolute income at the top of the distribution. Unsurprisingly, they are also
strongly correlated. It means that innovation has positive correlation with absolute income for all
households, including those in the bottom, in the middle, and in the top of income distribution. The
explanation may be linked to the relationship between innovation and economic growth. Since patent
activities and GDP per capita are strongly correlated, the increase of poor household incomes is
mediated by the increase of the entire GDP.
Table A.21 presents the opposite results to the previous one. I found the negative correlation between
innovation and income shares at the bottom of the distribution. The negative correlation is also there
between innovation and middle income shares. Yet, for the top income shares, the correlation is
positive. I would argue that, despite the increase of absolute income for those at the bottom and
middle of distribution, their income shares decrease along with the highly significant increase of top
earners income. It means that poor people in EU tend to be richer over time, but not as richer as the
riches.
Moreover, to delve deeply into the underlying explanations, I split the dependent variables of income
shares into decile of income distribution. As presented by Table A.22, I found that the negative
correlation between innovation and income shares are there in the shares of income at decile 1
(bottom 10%) to decile 9 (i.e shares of income at 80%-90% of income distribution level). The positive
correlation is only presented in the shares of decile 10 (i.e top 10% earners) suggesting that innovation
increases top income inequality. Meanwhile, the most significant negative correlation is presented in
the income shares at decile 6 (i.e middle income). This finding confirms the presence of job
polarization, suggesting that the middle skilled workers are suffered by the introduction of new
technology; thereby it reduces the shares of their income.
Table A.23 presents the last series of regressions in which I regress directly innovation against
poverty rate. At-risk-poverty rate is identified by EU-SILC as the percentage of population in which
household income is below the thresholds. This study uses 40%, 50%, and 60% of the national
median disposable income which are widely accepted as the thresholds of relative poverty line.
Moreover, EU-SILC also provides the rates of people at risk of poverty or social exclusion, including
those in one of the following conditions: (1) income poverty, (2) severely materially deprived or (3)
living in households with very low work intensity. In all models there are no correlation between
innovation and poverty rate. This is in line with the previous finding from Lee and Rodriguez-Pose
(2016). Technology alone does not seem to be able to reduce poverty rate.
In summary, this extension of study is unable to answer whether trickle down from innovation to poor
groups is exist. Further research must be done to focus on this question. These findings only propose a
more complex relationship between innovation and poverty, rather than innovation and income
inequality as presented in the core analysis of this study. In EU case, innovation has a positive
relationship with absolute income of poor groups, has a negative relationship with their income
shares, but has no relationship with the rate of poverty.
53
4.3.6 Reverse causation: Is income inequality good for innovation?
The focus of this study is to provide empirical evidence regarding the impact of innovation on income
inequality. To deal with the causal direction and to avoid the simultaneity problem, I used lagged
variable for the predictor as the modelling strategy. As presented by the result above, the effect is
most significant when 3 years of lag is used for patenting activities. However, one might consider the
presence of reverse causality: to some extent higher inequality maybe lead to higher opportunity for
innovation. This reverse premise is supported by several recent studies in particular those from
neoclassical and neoliberal economists.
Inequality has an impact to innovation based growth due to its effect on the structure and the
dynamics of demand (Zweimüller, 2000). On one hand, inequality may harm innovation through the
market size effect. Unequal distribution means a small market size for innovative products as only
small number of customer can afford them. On the other hand, inequality may be favourable for
innovation through the price effect, means that higher ‘willingness to pay’ of rich people may attract
innovators to increase their activities. Tselios (2011) then conducted empirical study to test the
relationship, whether the price effect outweighs market size effect or vice versa. By providing
dynamic panel model of European regions from 1995 to 2000, he confirms that inequality favours
innovation activity. Through unequal distribution, rich consumers tend to boost innovation activity as
they may have a very high willingness to pay for new expensive goods.
Another supportive argument comes from Acemoglu, Robinson and Verdier (2012) which focus more
on the effect of inequality on the supply side. According to them, greater inequality, which means a
greater gap of incomes between successful and unsuccessful entrepreneurs, will increase
entrepreneurial efforts to innovate. By providing a fact that U.S. which has higher inequality is more
innovative rather than Scandinavian Welfare State, they also suggest that innovation incentives are
greater when countries tend to sacrifice their insurance and safety net. In other words, inequality
forces entrepreneurs to increase their efforts to compensate their rewards which are not covered by
insurance. Furthermore, Saint-Paul (2008) also posits the existences of creative classes (i.e rich
people) and working classes (i.e poor people) in an unequal society are good for innovation. They
complement in a way while creative classes are able to invent new goods; poor people allow them to
be manufactured as they are recruited as workers.
Hence, to test the hypothesis above, I extend the core discussion of my study by conducting the
reverse regression: predicting innovation activities as dependent variable by the lagged index of
inequality as independent variable. The finding is interesting. Firstly, I did not find any significant
correlation from the basic model which includes 32 EU countries. But then when I only run regression
for 15 advanced European countries (EU-15) the correlation became significant with high R square. It
confirms that there is the feedback loop of innovation – inequality causation particularly in advanced
countries. On one hand, high innovation leads to the greater income inequality. On the other hand,
inequality is then good for attracting innovation activity. However the regression result is not robust
when I choose different time lag, replace independent variable by other measures of innovation, or
reduce/adjust several control variables.
In this study I do not go further to elaborate this reverse causation linking inequality and innovation
activities. Further research needs to be conducted with the improvement of model including the choice
of different control variables from those in this study. But one has to be aware of the presence of
feedback loop causation. Despite of the robustness problem, the result of my extended study suggests
that the reverse causation may exist.

54
Figure 10 Chicken-egg problem between innovation and income inequality
If the causal loop is there, as illustrated by figure 1, then further research must consider a dynamic
model to investigate the relationship between innovation and inequality. It has to be able to overcome
the issue of two way direction of causality between them.

55
Chapter 5 Conclusion
5.1 Answering the research question The aim of this study is to provide empirical evidence regarding the effect of innovation activities,
both their intensities and diversities, on income inequality. I tested this link for two levels of panel
dataset: (1) a panel of European countries in the period 1998-2014 and (2) a panel of European
regions in the period 2004-2011. A series of fixed effect panel data models were then regressed.
In chapter 2, I constructed the hypotheses based on previous theoretical and empirical literature.
Afterwards, in chapter 3, the econometric strategy was elaborated along with the data descriptions and
the relevance of EU as case study. In chapter 4, I presented the results of a series of regressions and
discussed those findings in comparison to previous studies. Several extensions were also done to
support the evidence that has been given. It is now the time to conclude what has been investigated in
this study.
Question on the relation between innovation and income inequality
The results show positive and significant correlations between innovativeness and income inequality
both at country and regional level of EU. The most significant effect is found when I used 3 years of
time lag in innovation activities as independent variable, suggesting that patent, as proxy of
innovation, needs a time delay since its priority year to be noticeably benefited by society and affects
the income distribution. In addition, I also found that the correlation between innovation and income
inequality seems stronger in advanced countries.
By using several measures of inequality, this study is also able to provide further evidence regarding
how innovation affects the income distribution. It could be concluded that innovation does not only
affect total income inequality as measured by Gini index, but also affects top income inequality as
measured the shares of top 1% and top 10% income. These findings confirm that innovations benefit
entrepreneurs through monopoly rent and even further innovation also benefit superstars in various
occupations. In other words, innovation allows the riches to earn much more prizes than the rest of the
population.
I also found that innovation affects the top-half income distribution as measured by 90:50 percentile
of income ratio, while for the bottom-half of income distribution the correlation, instead, was not
there. These findings confirm the theory of skill-biased technical change. The benefit of innovation is
only obtained by high skilled labor which more adaptive and complemented to the introduction of
new technologies. On the other hand, middle skilled labor with routine tasks is the most vulnerable to
new technologies. Innovations tend to replace their jobs, supress their wages, and even force them to
shift into more low skilled jobs joining the existing low skilled labor. For these reasons, the effects are
obvious in top-half distribution, reflecting that innovations allow high skilled labor to earn
significantly higher wage premium whereas those in the middle are stagnant. Meanwhile, it is also
clear that innovation does not affect bottom-half distribution since neither middle skilled nor low
skilled labor benefit from the introduction of new technologies.

56
Question on the relation between technological specialization and income inequality
The results show negative and significant correlation between technological diversification, as
opposes to technological specialization, and income inequality both at country and regional level of
EU. In other words, countries/regions tend to have higher level of income inequality if they
concentrate innovation activities into few narrow sectors. In contrast, diversifying innovation
activities into broad sectors will help them to restrain income inequality. Hypothetically speaking, the
effect of technological specialization on income inequality occurs through two channels: Firstly,
concentrating innovation into few narrow sectors increases between-sector wage differences as the
high technology sectors increase the demand for skilled labor. Secondly, specialization also increases
income inequality within sectors especially for those high technology sectors. It means that although
sectors with higher innovation activities could generate higher growth, the benefits are biased. The
growth is only benefited by high skilled labor while those middle and low skilled labor tends to suffer
as currently demand for their skills are relatively lower.
Similar to the innovation intensity model, I also found the most significant effect when I used 3 years
of time lag in technological specialization as independent variable. Moreover, the effects are also
there on the top-half income distribution and top income inequality as measured by shares of top 10%
and top 1% earners. Interestingly, technological specialization effect on income inequality is stronger
when I included innovation intensity variable to the model. It confirms that innovation and
technological specialization intertwine each other in affecting the rise of income inequality in recent
decades.
5.2 Concluding remarks and directions for future research This study makes several contributions to the literature on ‘inclusive growth’. In recent years, the
relationship between innovation and inequality has been widely discussed. However, there is still a
dispute regarding the direction in which innovation affects income inequality in Europe: whether it is
negative or positive. This study provides new evidence from panel studies at country and regional
levels. Both results found the positive and strong correlation between innovation and income
inequality. Furthermore, the novelty of this study is also regarding the findings on several measures of
income inequality: innovation affects not only total income inequality but also on top-half of
distribution and top income inequality in particular.
By conducting the extension regressions, this study also found the role of specific type of innovation.
While previous empirical studies assume innovation as a black box, this study found that innovation
in ICT and automation sectors, among the rest, have obvious impact on income inequality. This new
evidence is going in line with the concern of parallel rapid growth between innovation and income
inequality which was started in the same period when digital technology was emerged: an era which
called by Perez (2009) as ‘the fifth technological revolution’ or by Brynjolfsson and McAfee (2014)
as ‘the second machine age’. Since then, innovations in ICT sector have grown up rapidly and
transformed into general purpose of technology. It is then followed by an unprecedented wave of
automation with unintended consequences: threatening jobs and increasing income inequality.
Finally, the main scientific contribution of this study is providing empirical evidence suggesting that
technological specialization may lead to income inequality. Many previous studies focus on how the
intensity of innovation activities affects income inequality; surprisingly I did not find any of them
discuss the impact of the degree of specialization/diversification. With this study, I have provided

57
only the initial test linking technological specialization and income inequality. Further research might
focus on the theoretical model to support this evidence.
Nonetheless, apart from those findings, a number of limitations need to be noticed in this present
study. Along with the limitations I also propose some recommendations for further research. First,
this study provides aggregate measures of innovation and income inequality in macro level. For
instance, the study does not distinguish sources of income determining the increase of inequality.
Additionally, this study is also unable to distinguish between wage differentials between and within
sectors. Further research may consider focusing on a more micro level of observations. For example,
it could focus on the micro data of labor wage differentials, focus only to the gap between
entrepreneurs and capital earners, or focus into several specific sectors.
Secondly, it should be noted that the effect of technological specialization is sensitive to the choice of
measures. Moreover, I also found no previous studies linking directly technological specialization to
income inequality. Further research regarding the role of technological specialization has to be done
to confirm (or rejected) this initial finding.
Third, a trade off that should be realized in using cross-country dataset is the fact that there is no one-
size-fit-all approach for every country. Either innovation or income inequality is path dependence,
determined by social and institutional factors which are different across countries. In this study, one
strategy to face these problems is by conducting fixed effect models which only focus on the change
within a unit of analysis. For further research, I suggest to limit the study between regions within a
one single country as a boundary. Otherwise, it is also comparable if we only choose several most
innovative cities in Europe which have similar characteristics.
Fourth, I realize that regression models only reveal the input-output relation between innovation and
inequality without taking the dynamic process into account. At this point, evolutionary economics
significantly contribute to theories of innovation by highlighting the dynamic process rather than
outcomes. While this study proposes that innovation tends to increase income inequality in a macro-
level, in the further research one has to find how precisely the process occurs in micro-level. A
qualitative case study can be conducted to investigate how an innovation may give an impact to the
income distribution of the society. Another extension is to find the opposite direction of innovation
effect. In the future, I am optimistic that innovation will not harm income distribution. Thus, we have
to consider any frameworks that are useful for generating a more inclusive innovation. Several studies
have discussed those related frameworks, for instance the use of grassroots innovation framework for
sustainable development which is proposed by Seyfang and Smith (2007).
Fifth, this study also found the reverse causation from inequality to innovation. This might lead to
simultaneity issue: innovation and income inequality might be a chicken-egg problem and co-evolve
each other. Several previous studies, commonly from neoclassical and liberal economists, also
confirm that inequality is good for growth. Further research may consider the use of dynamic model
in determining the relationship between innovation and income inequality.
5.3 Policy implication for EU
One of the missions of inclusive growth policy in European Union is to ensure the benefits of growth
reach all parts of the society (European Commission, 2012). By 2020, EU sets several targets
including the increase of employment rate up to 75% and the reduction of 20 million people in or at

58
risk of poverty. To achieve those targets, EU proposes ‘Innovation Union’ initiative which aims to
forge better links between innovation and job creation by improving conditions and access to finance
for research and innovation (European Commission, 2012). This strategy is thus expected to be able to
create growth and jobs. It seems that Europe 2020 growth strategy is optimistic about innovation
policy in EU. Meanwhile, Mazzucato and Perez (2014) have claimed that this ambition of EU to
generate growth that is both smart and inclusive is not working. According to them, it was fail due to
the lack of a theoretical framework in economics to investigate the relation between innovation and
inequality.
This study presents two important issues that might be useful to be considered for formulating
policies, particularly in linking innovation, inequality, and inclusive growth in EU. First of all, the
study provides the evidence that both at country and regional level of EU, innovation activities are
strongly correlated with income inequality. While Mazzucato and Perez (2014) criticize the inability
of ‘skill-biased technical change’ theory to explain the most dramatic increase in top income
inequality, this study proposes the evidence that innovation also benefiting those top 10% and 1%
through entrepreneurial rents and superstars effect.
EU has to consider these findings in translating Innovation Union initiative into a series of practical
strategies. Laissez-faire policies should not be continued. Otherwise, boosting the innovation
activities, as suggested by the initiative, only leads to the worse income inequality. It will be naïve to
recommend that innovation activities must be limited. Therefore, as suggested in the previous section,
further research has to be conducted in order to explain the differences between innovations which
can empower all members of the society and innovations which rather biased only benefiting few
parties. One has to consider redirecting innovation activities toward a more inclusive outcome
especially for those middle skilled and low skilled labor.
The second finding seems more promising. This study suggests that concentrating technology into
few narrow sectors tend to increase inequality. Hence, while it is impossible to limit innovation
activities, I would suggest that diversifying innovation into broad sectors would help EU countries
and regions to restrain income inequality. Even further, increasing technological diversification is not
only able to create more equal society, but also to provide larger opportunities for knowledge
spillovers across sectors and thus generates more innovation and higher growth. One of EU 2020
initiatives is to build a platform to assess strength and weakness of countries innovation activities in
order to help them to build their competitive advantage (European Commission, 2012). I would
suggest that, instead of focusing only to the strength of countries, this assessment also should consider
the solution in improving the weakness for each country. Countries should not only concentrate their
innovation activities on their strength sectors, but also try to diversify their activities into sectors
which have long been regarded as weakness. By doing so, inclusive growth will be achieved and
income inequality will be restrained.

59
References
Acemoglu, D. (1998). Why Do New Technologies Complement Skills: Directed Technical Change
and Wage Inequality. Quarterly Journal of Economics, 113, 1055-1089.
Acemoglu, D. (2002). Technical Change, Inequality, and the Labor Market. Journal of Economic
Literature, 40, 7-72.
Acemoglu, D., & Autor, D. (2011). Skills, tasks and technologies: Implications for employment and
earnings. Handbook of labor economics 4, 1043-1171.
Acemoglu, D., Robinson, J., & Verdier, T. (2012). Can't We All Be More Like Scandinavians?
Asymmetric growth and institutions in an interdependent world. No. w18441. National
Bureau of Economic Research.
Aghion, P., & Howitt, P. (1992). A model of growth through creative destruction. Econometrica, Vol.
60, No. 2, 323-351.
Aghion, P., Akcigit, U., Bergeaud, A., Blundell, R., & Hémous, D. (2015). Innovation and top income
inequality. (No. w21247). National Bureau of Economic Research.
Ahluwalia, M. (1976). Inequality, poverty and development. Journal of development economics, 3.4,
307-342.
Alesina, A., & Perotti, R. (1994). The Political Economy of Growth: A Critical Survey of Recent
Literature. The World Bank Economic Review, 8(3), 351-371.
Alesina, A., & Perotti, R. (1996). Income distribution, political instability, and investment. European
Economic Review, 40(6), 1203-1228.
Andersen, E. (2013). Schumpeter’s core works revisited. Long Term Economic Development, 9-31.
Antonelli, C., & Gehringer, A. (2013). Innovation and income inequality. No. 201324. University of
Turin.
Atkinson, A. (2013). Reducing income inequality in Europe. IZA Journal of European Labor Studies
2.1, 1.
Atkinson, A. (2015). Inequality: What Can Be Done? Harvard University Press.
Atkinson, A., Piketty, T., & Saez, E. (2011). Top incomes in the long run of history. Journal of
Economic Literature 49.1, 3-71.
Attanasio, O., & Pistaferri, L. (2016). Consumption Inequality. Journal of Economic Perspectives, 30:
2, 1–27.
Autor, D. (2010). The polarization of job opportunities in the US labor market: Implications for
employment and earnings. Center for American Progress and The Hamilton Project.
Autor, D., Katz, L., & Krueger, A. (1998). Computing Inequality: Have Computers Changed the
Labor Market? Quarterly Journal of Economics 113, 1169-1213.

60
Autor, D., Levy, F., & Murnane, R. (2003). The Skill Content of Recent Technical Change: An
Empirical Exploration. Quarterly Journal of Economics 118, 1279-1334.
Baker, D., & Bernstein, J. (2013). Getting Back to Full Employment. Center for Economic and Policy
Research.
Baltagi, B. (2008). Econometric analysis of panel data. John Wiley & Sons.
Banerjee, A., & Duflo, E. (2003). Inequality and Growth: What Can the Data Say? Journal of
Economic Growth, 8, 267-299.
Barro, R. (2000). Inequality and Growth in a Panel of Countries. Journal of Economic Growth, 5, 5-
32.
Bartel, A., & Sicherman, N. (1997). Technological change and wages: an inter-industry analysis. No.
w5941. National Bureau of Economic Research.
Basberg, B. (1987). Patents and the measurement of technological change: a survey of the literature.
Research policy 16.2, 131-141.
Beitz, C. R. (2001). Does global inequality matter? Metaphilosophy, 32(1‐2), 95-112.
Bottazzi, L., & Peri, G. (2003). Innovation and spillovers in regions: Evidence from European patent
data. European economic review 47.4, 687-710.
Brynjolfsson, E., & McAfee, A. (2014). The second machine age: Work, progress, and prosperity in a
time of brilliant technologies. WW Norton & Company.
Campano, F., & Salvatore, D. (1988). Economic development, income inequality and Kuznets' U-
shaped hypothesis. Journal of Policy Modeling, 10(2), 265-280.
Cantwell, J., & Vertova, G. (2004). Historical evolution of technological diversification. Research
Policy 33, 511 - 529.
Cantwell, J., Gambardella, A., & Granstrand, O. (2004). The economics and management of
technological diversification Vol. 34. Routledge.
Comanor, W., & Scherer, F. (1969). Patent statistics as a measure of technical change. The Journal of
Political Economy, 392-398.
Cozzens, S., & Kaplinsky, R. (2009). Innovation, poverty and inequality: cause, coincidence, or co-
evolution. In B. Lundvall, C. Chaminade, & J. Vang, Handbook of innovation systems and
developing countries: Building domestic capabilities in a global setting (pp. 57-82). Edward
Elgar Publishing.
Dabla-Norris, M., Kochhar, M. K., Suphaphiphat, M. N., Ricka, M. F., & Tsounta, E. (2015). Causes
and consequences of income inequality: a global perspective. International Monetary Fund.
Deininger, K., & Squire, L. (1998). New ways of looking at old issues: inequality and growth. Journal
of Development Economics, 57, 259-287.
Dosi, G., Pavitt, K., & Soete, L. (1990). The economics of technical change and international trade.
LEM Book Series .

61
Dreger, C., López-Bazo, E., Ramos, R., Vicente Royuela, V., & Suriñach, J. (2015). Wage and
income inequality in the European Union. Policy Department Working Paper.
Ernst, H. (2001). Patent applications and subsequent changes of performance: evidence form time-
series cross-section analyses on the firm level. Research Policy, Vol.30, 143-157.
European Commission. (2012). Europe 2020: Europe's growth strategy. Retrieved from European
Union: http://ec.europa.eu/europe2020/pdf/europe_2020_explained.pdf
Feldstein, M. (1999). Reducing poverty, not inequality. The Public Interest No. 137.
Florida, R. (2012). The Rise of the Creative Class--Revisited. Basic books.
Ford, M. (2015). Rise of the Robots: Technology and the Threat of a Jobless Future. Basic Books.
Frenken, K., Van Oort, F., & Verburg, T. (2007). Related variety, unrelated variety and regional
economic growth. Regional studies 41.5, 685-697.
Galbraith, J. (2012). Inequality and Instability: A Study of the World Economy Just Before The Crisis.
New York: Oxford University Press.
Galor, O., & Moav, O. (2000). Ability-Biased Technological Transition, Wage Inequality, and
Economic Growth. Quarterly Journal of Economics, 115, 469-497.
Genre, V., Kohn, K., & Momferatou, D. (2011). Understanding inter-industry wage structures in the
euro area. Applied economics 43.11, 1299-1313.
Gertler, M. (1995). “Being there”: proximity, organization, and culture in the development and
adoption of advanced manufacturing technologies. Economic geography 71.1, 1-26.
Glaeser, E., Kallal, H., Scheinkman, J., & Shleifer, A. (1992). Growth in cities. Journal of Political
Economy vol.100 no. 6, 1126 - 1152.
Griliches, Z. (1998). Patent statistics as economic indicators: a survey. In Z. Griliches, R&D and
productivity: the econometric evidence (pp. 287-343). University of Chicago Press.
Grossman, G., & Helpman, E. (1994). Endogenous Innovation in the Theory of Growthh. The Journal
of Economic Perspectives, Vol. 8, No. 1, 23-44.
Gurmu, S., & Perez‐Sebastian, F. (2007). Patents, R&D and lag effects: Evidence from flexible
methods for count panel data on manufacturing Firms. Working papers Instituto Valenciano
de Investigaciones Económicas, SA (Ivie).
Hall, P., & Soskice, D. (2001). Varieties of capitalism: The institutional foundations of comparative
advantage. OUP Oxford.
Handaulah, R. (2014). Inequality and Economic Growth in Emerging Market Economies. Delft:
(Unpublished master thesis). TU Delft.
Jacobs, J. (1969). The Economy of Cities. New York: Vintage.

62
Jafar, B. (2015, October). Why trickle-down economics won't eliminate poverty. Retrieved from
World Economic Forum: https://www.weforum.org/agenda/2015/10/why-trickle-down-
economics-wont-eliminate-poverty/
Jones, C., & Kim, J. (2014). A Schumpeterian Model of Top Income Inequality. No. w20637. National
Bureau of Economic Research.
Kaplan, S., & Rauh, J. (2013). It's the market: The broad-based rise in the return to top talent. The
Journal of Economic Perspectives 27.3, 35-55.
Katz, L. F., & Murphy, K. M. (1992). Changes in relative wages, 1963-1987: Supply and demand
factors. The Quarterly Journal of Economics, Vol. 107, No. 1, 35-78.
Kawachi, I., & Kennedy, B. P. (1999). Income inequality and health: pathways and mechanisms.
Health services research, 34(1 Pt 2), 215-227.
Ken, Y., Tsai, T., & Ou, Y. (2008). Study of the time lag effect of patent impact on profitability of US
pharmaceutical industry from innovation to profit. PICMET'08-2008 Portland International
Conference on Management of Engineering & Technology (pp. 2588-2596). IEEE.
Khramova, E., Meissner, D., & Sagieva, G. (2013). Statistical patent analysis indicators as a means of
determining country technological specialisation. Higher School of Economics Research
Paper No. WP BRP 9.
Kim, H., & Brynjolfsson, E. (2009). CEO Compensation and Information Technology. ICIS 2009
Proceedings. Paper 38.
Kremer, M., & Maskin, E. (2003). Globalization and inequality. Harvard University, Department of
Economics. mimeo.
Krueger, A. B., & Summers, L. (1988). Efficiency wages and the inter-industry wage structure.
Econometrica: Journal of the Econometric Society, 259-293.
Krugman, P. (1994). Past and prospective causes of high unemployment. Economic Review-Federal
Reserve Bank of Kansas City, 79, 23.
Kuznets, S. (1955). Economic Growth and Income Inequality. The American Economic Review, 45, 1-
28.
Laursen, K. (2000). Trade specialisation, technology and economic growth. Edward Elgar Publishing.
Lee, N. (2011). Are innovative regions more unequal? Evidence from Europe. Environment and
Planning C: Government and Policy 29(1), 2-23.
Lee, N., & Rodríguez-Pose, A. (2013). Innovation and spatial inequality in Europe and USA. Journal
of Economic Geography 13.1, 1-22.
Lee, N., & Rodríguez-Pose, A. (2016). Is There Trickle-Down from Tech? Poverty, Employment, and
the High-Technology Multiplier in US Cities. Annals of the American Association of
Geographers, 1-21.
Levinson, T. (2015). Trade Specialization & the Occupational Wage Distribution: Evidence from
OECD Countries. Working papers.

63
Li, H., & Zou, H. (2002). Inflation, Growth, and Income Distribution: A Cross-Country Study. Annals
of Economics and Finance, 3, 85-101.
Luttmer, E. (2005). Neighbors as Negatives: Relative Earnings and Well-Being. Quarterly Journal of
Economics, 120, 963–1002.
Mazzucato, M., & Perez, C. (2014). Innovation as growth policy: the challenge for Europe. Working
paper series SPRU.
McKay, A. (2002). Defining and Measuring Inequality. Inequality Briefing Paper No 1 (1 of 3).
McKinnish, T. (2002). "Interpreting Lagged Effects of the Independent Variable: How does the Local
Economy Affect Welfare Caseloads? Working papers University of Colorado.
Michaels, G., Natraj, A., & Van Reenen, J. (2013). Has ICT Polarized Skill Demand? Evidence from
Eleven Countries over 25 years. Review of Economics and Statistics 96(1), 60-77.
Michaelsen, M. M. (2011). The hidden increase in wage inequality: skill-biased and ability-biased
technological change. Ruhr Economic Paper 262.
Milanovic, B. (2016). Global inequality: A new approach for the age of globalization. Harvard
University Press.
Mills, M. (2009). Globalization and inequality. European sociological review 25.1, 1-8.
Mokyr, J. (1992). The lever of riches: Technological creativity and economic progress. Oxford
University Press.
Montalvo, J. (1997). GMM estimation of count-panel-data models with fixed effects and
predetermined instruments. Journal of Business & Economic Statistics 15.1, 82-89.
Osburn, J. (2000). Interindustry wage differentials: patterns and possible sources. Monthly Lab. Rev.
123, 34.
Papanek, F., & Kyn, O. (1986). The Effect of Income Distribution of Development, The Growth Rate
and Economic Strategy. Journal of Development Economics, 23, 65-75.
Park, H. M. (2011). Practical Guides To Panel Data Modeling: A Step-by-step Analysis Using Stata.
Tutorial Working Paper. Graduate School of International Relations, International University
of Japan.
Perez, C. (2009). Technological revolutions and techno-economic paradigms. Cambridge journal of
economics.
Persson, T., & Tabellini, G. (1994). Is inequality harmful for growth? The American Economic
Review, 600-621.
Piketty, T. (2014). Capital in the 21 st century. Harvard University Press.
Porter, M. (1990). The Competitive Advantage of Nations. Harvard Business Review.
Porter, M., & Stern, S. (2001). Innovation: location matters. MIT Sloan management review 42.4, 28.

64
Ramos, R., & Royuela, V. (2014). Income inequality in Europe. Analysis of recent trends at the
regional level . University of Barcelona, Research Institute of Applied Economics Working
Paper No. 201425.
Ravallion, M. (2005). Inequality is bad for the Poor. World Bank Policy Research, Working Paper
3677.
Rosen, S. (1981). The Economics of Superstars. American Economic Review 71(5), 845-858.
Saint-Paul, G. (2008). Innovation and inequality: how does technical progress affect workers?
Princeton.
Savorelli, L., & Picci, L. (2013). The Technological Specialization of Countries: An Analysis of
Patent Data. Discussion Paper 201301, University of St. Andrews.
Schmoch, U. (2008). Concept of a Technology Classification for Country Comparisons. World
Intellectual Property Organisation (WIPO).
Schoenmakers, W., & Duysters, G. (2010). The technological origins of radical inventions. Research
Policy, 39(8), 1051-1059.
Schumpeter, J. A. (1942). Capitalism, socialism and democrac. New York: Harper and Brothers.
Schumpeter, J. A. (1942). Capitalism, socialism and democracy. New York: Harper and Brothers.
Seyfang, G., & Smith, A. (2007). Grassroots innovations for sustainable development: Towards a new
research and policy agenda. Environmental politics 16.4, 584-603.
Shim, M., & Yang, H. (2015). Interindustry wage differentials, technology adoption, and job
polarization. Working paper Monash University Business and Economics.
Soete, L. (1980). The Impact of Technological Innovation on International Trade Patterns: the
Evidence Reconsidered. Paper presented at the OECD Science and Technology Indicators
Conference. Paris.
Solow, M. (1957). Technical Change and the Aggregate Production Function. The Review of
Economics and Statistics, Vol. 39, No. 3 , 312-320.
Stiglitz, J. (2012). The price of inequality: How today's divided society endangers our future. WW
Norton & Company.
Temkin, L. (2003). Equality, Priority or What? Economics and Philosophy, 19 (1), 61–87.
The Economist. (2014, June 16). Measuring inequality A three headed hydra. Retrieved from The
Economist: http://www.economist.com/blogs/freeexchange/2014/07/measuring-inequality
Torres-Reyna, O. (2007). Retrieved from Panel Data Analysis Fixed and Random Effects using Stata
(v. 4.2). Princeton University: https://www.princeton.edu/~otorres/Panel101.pdf
Toth, I. G. (2013). Time series and cross country variation of income inequalities in Europe on the
medium run: are inequality structures converging in the past three decades. GINI Policy
Paper 3 .

65
Tselios, V. (2011). Is inequality good for innovation? International Regional Science Review 34.1,
75-101.
UNDP. (2013). Humanity Divided: Confronting Inequality in Developing Countries. New York.
Verspagen, B. (1993). Uneven Growth Between Independent Economies. Aldershot: Avebury.
Verspagen, B. (2005). Innovation and Economic Growth. In J. Fagerberg, The Oxford Handbook of
Innovation. Oxford university press.
Violante, G. L. (2008). Skill-biased technical change, . New York: Palgrave Macmillan.
Wade, R. (2005). Does inequality matter? Challenge, 48(5), 12-38.
Wilkinson, R., & Pickett, K. (2010). The spirit level: why equality is better for everyone. Penguin UK.
Zweimüller, J. (2000). Schumpeterian entrepreneurs meet Engel's law: the impact of inequality on
innovation-driven growth. Journal of Economic Growth 5.2, 185-206.

66
Appendix
Appendix 1 List of group observation at country and regional level Table 4 List of EU countries
No Country Country
code
EU-15 EU-27 EU-28 Included to the Model
1 Austria AT v v v v
2 Belgium BE v v v v
3 Bulgaria BG v v v
4 Cyprus CY v v v
5 Czech Republic CZ v v v
6 Denmark DK v v v v
7 Estonia EE v v v
8 Finland FI v v v v
9 France FR v v v v
10 Germany DE v v v v
11 Greece EL v v v v
12 Hungary HU v v v
13 Ireland IE v v v
14 Italy IT v v v v
15 Latvia LV v v v
16 Lithuania LT v v v
17 Luxembourg LU v v v v
18 Malta MT v v v
19 Netherlands NL v v v v
20 Poland PL v v v
21 Portugal PT v v v v
22 Romania RO v v v
23 Slovakia SK v v v
24 Slovenia SI v v v
25 Spain ES v v v v
26 Sweden SE v v v v
27 United Kingdom UK v v v v
28 Iceland IS v
29 Norway NO v
30 Switzerland CH v
31 Turkey TR v
32 Croatia HR v

67
Table 5 List of EU NUTS 1 regions
No Region code Region EU
member
Included to
the model
1 AT1 Ostösterreich v v
2 AT2 Südösterreich v v
3 AT3 Westösterreich v v
4 BE1 Région de Bruxelles-Capitale v v
5 BE2 Vlaams Gewest v v
6 BE3 Région wallonne v v
7 BG3 Severna i yugoiztochna Bulgaria v v
8 BG4 Yugozapadna i yuzhna tsentralna Bulgaria v v
9 CY0 Kypros v v
10 CZ0 Ceská republika v v
11 DE1 Baden-Württemberg v v
12 DE2 Bayern v v
13 DE3 Berlin v v
14 DE4 Brandenburg v v
15 DE5 Bremen v v
16 DE6 Hamburg v v
17 DE7 Hessen v v
18 DE8 Mecklenburg-Vorpommern v
19 DE9 Niedersachsen v
20 DEA Nordrhein-Westfalen v
21 DEB Rheinland-Pfalz v
22 DEC Saarland v
23 DED Sachsen v
24 DEE Sachsen-Anhalt v
25 DEF Schleswig-Holstein v
26 DEG Thüringen v
27 DK0 Danmark v v
28 EE0 Eesti v v
29 EL1 Voreia Ellada (NUTS 2010) v v
30 EL2 Kentriki Ellada (NUTS 2010) v v
31 EL3 Attiki v v
32 EL4 Nisia Aigaiou, Kriti v v
33 ES1 Noroeste (ES) v v
34 ES2 Noreste (ES) v v
35 ES3 Comunidad de Madrid v v
36 ES4 Centro (ES) v v
37 ES5 Este (ES) v v
38 ES6 Sur (ES) v v
39 ES7 Canarias (ES) v v
40 FI1 Manner-Suomi v v (merged)
41 FI2 Åland v

68
42 FR1 Île de France v v
43 FR2 Bassin Parisien v v
44 FR3 Nord - Pas-de-Calais v v
45 FR4 Est (FR) v v
46 FR5 Ouest (FR) v v
47 FR6 Sud-Ouest (FR) v v
48 FR7 Centre-Est (FR) v v
49 FR8 Méditerranée v v
50 HR0 Hrvatska v v
51 HU1 Közép-Magyarország v v
52 HU2 Dunántúl v v
53 HU3 Alföld és Észak v v
54 IE0 Éire/Ireland v v
55 ITC Nord-Ovest v v
56 ITF Sud v v
57 ITG Isole v v
58 ITH Nord-Est v v
59 ITI Centro (IT) v v
60 LT0 Lietuva v v
61 LU0 Luxembourg v v
62 LV0 Latvija v v
63 MT0 Malta v v
64 NL1 Noord-Nederland v v (merged)
65 NL2 Oost-Nederland v
66 NL3 West-Nederland v
67 NL4 Zuid-Nederland v
68 PL1 Region Centralny v v
69 PL2 Region Poludniowy v v
70 PL3 Region Wschodni v v
71 PL4 Region Pólnocno-Zachodni v v
72 PL5 Region Poludniowo-Zachodni v v
73 PL6 Region Pólnocny v v
74 PT1 Continente v v (merged)
75 PT2 Região Autónoma dos Açores (PT) v
76 PT3 Região Autónoma da Madeira (PT) v
77 RO1 Macroregiunea unu v v
78 RO2 Macroregiunea doi v v
79 RO3 Macroregiunea trei v v
80 RO4 Macroregiunea patru v v
81 SE1 Östra Sverige v v
82 SE2 Södra Sverige v v
83 SE3 Norra Sverige v v
84 SI0 Slovenija v v
85 SK0 Slovensko v v
86 UKC North East (UK) v v
87 UKD North West (UK) v v

69
88 UKE Yorkshire and The Humber v v
89 UKF East Midlands (UK) v v
90 UKG West Midlands (UK) v v
91 UKH East of England v v
92 UKI London v v
93 UKJ South East (UK) v v
94 UKK South West (UK) v v
95 UKL Wales v v
96 UKM Scotland v v
97 UKN Northern Ireland (UK) v v
98 IS0 Ísland v
99 CH0 Schweiz/Suisse/Svizzera v
100 NO0 Norge v

70
Appendix 2 WIPO IPC-Technology Concordance Table Available at http://www.wipo.int/ipstats/en/index.html#data
Table 6 WIPO 35 technological fields based on Schmoch (2008)
Field_number Field Sector
1 Electrical machinery, apparatus, energy Electrical engineering
2 Audio-visual technology Electrical engineering
3 Telecommunications Electrical engineering
4 Digital communication Electrical engineering
5 Basic communication processes Electrical engineering
6 Computer technology Electrical engineering
7 IT methods for management Electrical engineering
8 Semiconductors Electrical engineering
9 Optics Instruments
10 Measurement Instruments
11 Analysis of biological materials Instruments
12 Control Instruments
13 Medical technology Instruments
14 Organic fine chemistry Chemistry
15 Biotechnology Chemistry
16 Pharmaceuticals Chemistry
17 Macromolecular chemistry, polymers Chemistry
18 Food chemistry Chemistry
19 Basic materials chemistry Chemistry
20 Materials, metallurgy Chemistry
21 Surface technology, coating Chemistry
22 Micro-structural and nano-technology Chemistry
23 Chemical engineering Chemistry
24 Environmental technology Chemistry
25 Handling Mechanical engineering
26 Machine tools Mechanical engineering
27 Engines, pumps, turbines Mechanical engineering
28 Textile and paper machines Mechanical engineering
29 Other special machines Mechanical engineering
30 Thermal processes and apparatus Mechanical engineering
31 Mechanical elements Mechanical engineering
32 Transport Mechanical engineering
33 Furniture, games Other fields
34 Other consumer goods Other fields
35 Civil engineering Other fields

71
Appendix 3 Descriptive Statistics
Table 7 List of variables
Variable Names Description Source
Measure of inequality
Gini_eu Gini index of inequality in country level Eurostat
Gini_rr Gini index of inequality in regional level Ramos&Royuela (2014)
Top1_eu Share of income own by the richest 1% (on a scale of 0 to 100) Eurostat
Top10_eu Share of income own by the richest 10% (on a scale of 0 to 100) Eurostat
S9010 Ratio of income between the richest 10% and the poorest 10%
Eurostat &
Ramos&Royuela (2014) S9050 Ratio of income between the richest 10% and the median
S5010 Ratio of income between the median the poorest 10%
Measure of innovation
Patent_pop The number of patent application to the EPO per million
population
Eurostat
R&Dexp_pop R&D expenditure per million population Eurostat
HitechPatent_pop The number of patent application to the EPO per million
population for high-technology sector including computer and
automated business equipment, communication technology,
laser, microorganism and genetic engineering, and
semiconductor
Eurostat
BioPatent_pop The number of patent application to the EPO per million
population for biotechnology sector
Eurostat
EnergyPatent_pop The number of patent application to the EPO per million
population for energy and climate change related sector
Eurostat
ICTPatent_pop The number of patent application to the EPO per million
population for information and communication technology
(ICT) manufacturing and services
Eurostat
Measure of Technological diversification
Tech_div_RTA Index of technological diversification, adopted from Revealed
Technological Advantage index
Author calculation
(based on WIPO patents
application per
technological fields
obtained from WIPO IP
statistics)
Tech_div_entropy Index of technological diversification calculated by entropy
index
Control Variables
GDPpcap Real GDP per capita in Euro adjusted by Purchasing Power
Parity
Eurostat
Popgrowth Growth of total population Eurostat
Gov_Exp Ratio of government expenditure to GDP Penn World Table
Openness Ratio of country’s total trade (export plus import) to GDP Penn World Table
Edu_high Population of working age with tertiary education degree Eurostat
Edu_low Population of working age with lower than secondary education
degree
Eurostat
Unemploy Unemployment rate Eurostat

72
Table 8 Summary statistics at country level 1998 - 2014
Variable Obs Mean Std. Dev. Min Max
Dependent Variables
gini_eu 470 29.659 4.733 20.500 46.000
top10_eu 424 23.737 2.901 19.000 34.300
top1_eu 372 5.080 1.176 3.000 10.000
S9050 377 2.715 0.468 2.000 4.699
S5010 377 2.882 0.682 2.091 6.893
S9010 377 7.988 2.991 4.545 22.600
Independent Variables
patent_pop 526 92.887 107.019 0.190 434.930
patent_ict_pop 482 26.044 33.650 0.030 157.544
rndexp_pop 495 416.704 411.822 6.000 1930.600
tech_div_RTA 465 3.000 1.579 0.744 10.165
tech_div_entropy 465 3.150 0.201 2.338 3.392
Control Variables
edu_high 459 25.075 8.685 5.400 45.900
edu_low 459 28.226 17.210 6.600 81.900
gov_exp 527 0.204 0.057 0.070 0.358
openness 527 1.003 0.491 0.198 2.863
gdpcap 527 23,737 16,656 1,511 87,583
pop_growth 527 3.361 8.435 -35.000 30.900
unemploy 513 8.428 4.361 1.800 27.675
Table 9 Summary statistics at regional level 2004 – 2011
Variable Obs Mean Std. Dev. Min Max
Dependent Variables
gini_rr 536 0.294 0.039 0.214 0.465
p9010_rr 536 3.824 0.854 2.537 7.425
p9050_rr 528 1.887 0.191 1.501 2.467
p5010_rr 528 2.004 0.283 1.584 3.455
Independent Variables
patent_pop 743 99.473 111.446 0.187 590.057
patent_ict_pop 732 25.525 32.151 0.051 178.115
rndexp_pop 642 435.661 401.277 3.000 1844.300
Control Variables
edu_high 741 25.163 7.879 8.100 50.600
edu_low 741 26.942 14.277 3.800 76.400
gdpcap 744 25,120 10,922 5,800 72,330
pop_growth 744 3.457 7.376 -28.900 30.900
unemploy 744 8.515 4.462 1.600 28.900

73
Inequality
0,00
5,00
10,00
15,00
20,00
25,00
30,00
35,00
40,00
45,00
50,00
SI SE DK CZ FI SK NOMT CY IS DE FR AT LU HU NE BE IE ES CH IT BG EE UK EL PL LI RO LT PT TR
Gini index at EU country level 2003
0,00
5,00
10,00
15,00
20,00
25,00
30,00
35,00
40,00
45,00
50,00
IS NO SI CZ SE FI BE SK NE AT DK MTHU LU FR CH DE IE PL UK IT EL PT ES RO CY LI BG LT EE TR
Gini index at EU country level 2014

74
0 10 20 30 40 50
DK0FR5DE6SI0
BE2AT3DE5FR2FR4IS0
DE1AT2
NLFI
SK0HU3HU2CZ0DE3LU0DE4BE3FR7DE2FR3AT1HU1NO0
ITHCY0ES2FR8
ITIES5FR6FR1ES1ES6EL3EL4ITCEL1ES3IE0ITF
ES7PL2ES4PL3EE0PL4ITGEL2PL6PL5LV0LT0PT
PL1BE1
Gini index at EU regional level 2004
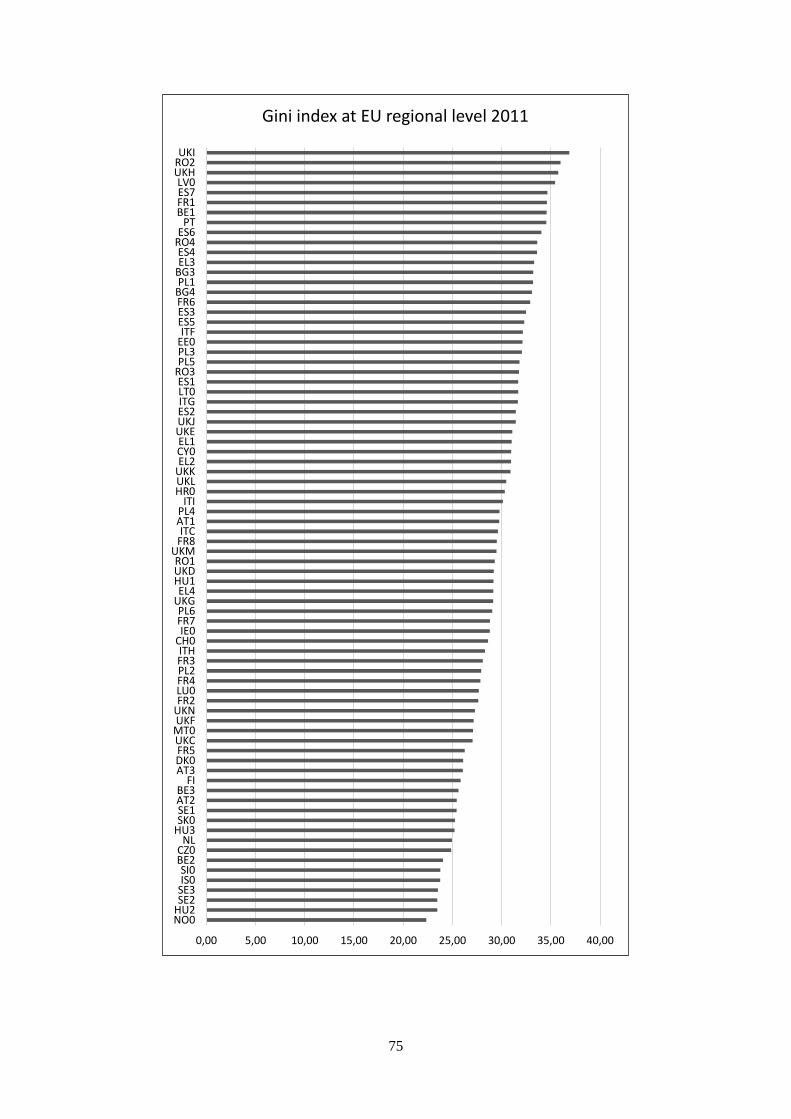
75
0,00 5,00 10,00 15,00 20,00 25,00 30,00 35,00 40,00
NO0HU2SE2SE3IS0SI0
BE2CZ0NL
HU3SK0SE1AT2BE3
FIAT3DK0FR5UKCMT0UKFUKNFR2LU0FR4PL2FR3ITH
CH0IE0
FR7PL6
UKGEL4
HU1UKDRO1
UKMFR8ITC
AT1PL4
ITIHR0UKLUKKEL2CY0EL1
UKEUKJES2ITGLT0ES1
RO3PL5PL3EE0ITF
ES5ES3FR6BG4PL1
BG3EL3ES4
RO4ES6PT
BE1FR1ES7LV0
UKHRO2UKI
Gini index at EU regional level 2011

76
0,00
5,00
10,00
15,00
20,00
25,00
30,00
35,00
40,00
SE SI MT DK CY CZ BE FI AT FR SK DE LU NL HU IR ES IS NO BG IT CH EE EL LI PL UK LT RO PT TR
Top 10% and Top 1% shares at EU country level 2003
top 10% top 1%
0,00
5,00
10,00
15,00
20,00
25,00
30,00
35,00
IS NO SE SI BE FI SK NL CZ MT LU AT DK HU DE PL RO CH IT UK IR FR ES EL EE PT LT LI BG CY TR
Top 10% and Top 1% shares at EU country level 2014
top 10% top 1%

77
Innovation
0,00
50,00
100,00
150,00
200,00
250,00
300,00
350,00
400,00
450,00
RO TR BG PL LT LI SK PT CY EL MT EE CZ HU ES SI IR IT NO UK IS FR BE AT LU DK NL SE FI DE CH
Patent applications per million population at EU country level 2003
0,00
50,00
100,00
150,00
200,00
250,00
300,00
350,00
400,00
450,00
RO TR BG CY SK MT EE EL PT PL LI HU CZ ES IR SI IT UK NO IS LU BE FR NL AT DK DE FI SE CH
Patent applications per million population at EU country level 2014

78
0,000 100,000 200,000 300,000 400,000 500,000 600,000
RO2PL3
RO1RO4BG3EL2PL6
RO3PL5LT0PL2
BG4SK0PL4EL4EL1FR9LV0ES7
HU2PT
ES6EE0PL1
HU3HR0CY0ES1CZ0EL3ES4
MT0ITGITF
UKNDEEES3
HU1UKLFR3ES2ES5DE8UKESI0ITI
UKCUKD
UKMUKIIE0
UKGUKFFR8DEDDE4FR6FR5
NO0FR2UKKDE5IS0
FR4DEGSE3BE3ITHBE1ITC
AT2DEFDECAT1BE2UKJ
UKHDE9DE3DK0FR7DE6AT3
NLFI
LU0DEASE2SE1DEBFR1DE7CH0DE2DE1
Patent applications per million population at EU regional level 2004

79
0,000 100,000 200,000 300,000 400,000 500,000 600,000
RO2BG3RO1RO4FR9EL2
HR0ES7PL3
BG4EL1LT0
RO3ITGPL6CY0ES4PL4
HU2LV0ES6PL5EL4SK0EL3PT
HU3PL2ITF
PL1ES1EE0CZ0
UKNDEEFR3ES5UKLDE8HU1ES3UKESI0ITI
UKMUKDUKI
UKGES2IS0
UKCIE0
FR6FR2FR5FR8DE4NO0UKFDEDDE5UKKBE3BE1
UKHFR4ITC
DEGSE3LU0UKJITHAT1DECBE2DEFDE9AT2DE3
NLDE6DEA
FIFR1DK0FR7SE2DEBDE7AT3SE1CH0DE2DE1
Patent applications per million population at EU regional level 2011

80
Technological Diversification
0
2
4
6
8
10
12
MT EE IS HR LT LV SI TR CY SK LU BG RO CZ PT HU EL PL FI IE DK BE ES NL NO AT SE CH IT UK DE FR
Degree of technological diversificationbased on RTA index of wipo patent application
at EU country level 2003
0
1
2
3
4
5
6
7
8
IS MT EE CY LT HR EL BG SK TR IE LV DK FI RO HU SI SE NO AT CZ BE PT CH LU NL PL IT ES DE UK FR
Degree of technological diversificationbased on RTA index of wipo patent application
at EU country level 2014

81
Appendix 4 Regression results
Variable
(1)
Gini EU
2003 - 2014
(2)
Gini EU
2003 - 2014
(3)
Gini EU
1998 - 2014
(15
countries)
Patent_pop 0.011*
(0.006)
R&D_exp 0.004*** 0.004*** 0.006***
(0.001) (0.001) (0.001)
Edu_high -0.151*** -0.151***
(0.051) (0.050)
Edu_low -0.070* -0.085**
(0.041) (0.042)
Gov_Exp -9.504* -9.854** -9.588
(4.863) (4.851) (6.287)
Openness -0.704 -0.869 -0.176
(0.543) (0.549) (0.551)
GDPpcap 0.000 0.000 0.000
(0.000) (0.000) (0.000)
Popgrowth -0.042** -0.040** -0.018
(0.021) (0.021) (0.030)
Unemploy 0.021 0.017 -0.065
(0.033) (0.033) (0.041)
R square 0.1386 0.1816 0.4688
Group 31 31 15
N 349 349 240
Table A.4 R&D Expenditure versus income inequality at country level
Innovation is 3 years lagged. Time span: 2003-2014 (12 years). Panel data fixed effect regressions.
Variable description is given in Table 1. *** p value < 0.01, ** p value < 0.05, *p value < 0.1.
Standard errors are in the brackets.

82
Variable
Dependent variable: Gini Index
Moving Averages
3 years 5 years 3 years 5 years 3 years 5 years
with no Lag with 1 years lag with 3 years lag
Patent_pop 0.004 0.016** 0.014** 0.023*** 0.025*** 0.032***
(0.006) (0.007) (0.007) (0.007) (0.007) (0.007)
gov_exp -1.487 -2.558 -2.147 -3.365 -4.390 -4.718
(4.537) (4.536) (4.485) (4.482) (4.473) (4.581)
edu_high -0.131***
-
0.141***
-
0.140***
-
0.146***
-
0.142***
-
0.130***
(0.049) (0.048) (0.048) (0.048) (0.047) (0.047)
edu_low -0.079** -0.097** -0.095**
-
0.102*** -0.096** -0.064*
(0.040) (0.040) (0.039) (0.039) (0.038) (0.038)
openness -0.826 -0.964* -0.937* -0.961* -0.871* -0.787
(0.541) (0.535) (0.532) (0.525) (0.517) (0.510)
GDPcap 0.000 0.000 0.000 0.000 -0.000 -0.000
(0.000) (0.000) (0.000) (0.000) (0.000) (0.000)
pop_growth -0.045** -0.042** -0.043** -0.040** -0.037* -0.042**
(0.021) (0.020) (0.020) (0.020) (0.020) (0.020)
unemploy 0.023 0.019 0.019 0.019 0.021 0.012
(0.033) (0.033) (0.033) (0.033) (0.032) (0.032)
R-square 0.0314 0.1055 0.0949 0.1192 0.1169 0.0935
Group 31 31 31 31 31 31
N 368 368 369 369 369 365
Table A.5 Innovation versus income inequality at country level with moving average
Innovation is 3 years lagged and with various moving averages. Time span: 2003-2014 (12 years).
Panel data fixed effect regressions. Variable description is given in Table 1. *** p value < 0.01, ** p
value < 0.05, *p value < 0.1. Standard errors are in the brackets.

83
Variable
(1)
Gini RR
2004 - 2011
(2)
P9010
1998 - 2014
(3)
P9050
2003 - 2014
(5)
P9050
1998 - 2014
(3)
P5010
2003 - 2014
Patent_pop 0.022*** 0.012*** 0.002*** 0.003*** 0.000
(0.007) (0.004) (0.001) (0.001) (0.002)
Edu_high -0.303*** -0.014** -0.010
(0.082) (0.007) (0.014)
Edu_low -0.139** -0.010* 0.015
(0.061) (0.006) (0.012)
Gov_Exp 5.236 5.811 -0.627 0.523 1.513
(6.873) (5.241) (0.705) (0.745) (1.454)
Openness -0.859 0.255 -0.110 -0.239*** -0.158
(0.802) (0.520) (0.079) (0.074) (0.163)
GDPpcap 0.000 0.000 0.000 0.000 0.000
(0.000) (0.000) (0.000) (0.000) (0.000)
Popgrowth 0.067** 0.033 -0.009*** 0.000 0.001
(0.030) (0.029) (0.003) (0.004) (0.006)
Unemploy 0.065 0.115*** -0.008* -0.010* 0.046***
(0.045) (0.038) (0.005) (0.005) (0.010)
R square 0.1450 0.1581 0.0911 0.2305 0.1673
Group 26 15 31 15 31
N 208 220 325 220 325
Table A.6 Innovation versus alternative measures of income inequality at country level
Innovation is 3 years lagged. Time span: 2003-2014 (12 years). Panel data fixed effect regressions.
Variable description is given in Table 1. *** p value < 0.01, ** p value < 0.05, *p value < 0.1.
Standard errors are in the brackets. Due to data limitation, Switzerland, Malta, Bulgaria, and Romania
are excluded in (1)

84
Variable
(1) (2) (3) (4) (5) (6)
EU31
Top10
EU27
Top10
EU15
Top10
EU31
Top1
EU27
Top1
EU15
Top1
patent_pop 0.015*** 0.011** 0.018*** 0.011*** 0.007** 0.010***
(0.004) (0.005) (0.003) (0.003) (0.003) (0.003)
edu_high -0.137*** -0.147***
-0.092*** -0.082***
(0.039) (0.040)
(0.027) (0.026)
edu_low -0.104*** -0.076**
-0.090*** -0.051**
(0.032) (0.033)
(0.022) (0.021)
gov_exp -3.867 -3.145 3.298 -5.171** -3.665 -5.179*
(3.697) (3.679) (4.443) (2.558) (2.354) (3.004)
openness -0.791* -1.306*** -1.168*** -0.639** -1.001*** -0.790**
(0.432) (0.428) (0.442) (0.299) (0.274) (0.393)
GDPcap -0.000 0.000** -0.000 -0.000* 0.000* 0.000
(0.000) (0.000) (0.000) (0.000) (0.000) (0.000)
pop_growth -0.030* -0.041** -0.003 0.003 -0.006 0.043***
(0.017) (0.017) (0.024) (0.012) (0.011) (0.016)
unemploy -0.011 0.003 -0.048 0.002 0.009 0.030
(0.027) (0.028) (0.032) (0.019) (0.018) (0.021)
R-square 0.0630 0.0794 0.3104 0.0116 0.0005 0.0634
Group 31 27 15 31 27 15
N 369 324 232 369 324 180
Table A.7 Innovation versus top income inequality at country level
Innovation is 3 years lagged. Time span: 2003-2014 (12 years). Panel data fixed effect regressions.
Variable description is given in Table 1. *** p value < 0.01, ** p value < 0.05, *p value < 0.1.
Standard errors are in the brackets.

85
Gini_eu top10_eu top1_eu S9050 S5010 S9010
Gini_eu 1
top10_eu 0.9553 1
top1_eu 0.6205 0.7779 1
S9050 0.9402 0.9939 0.7592 1
S5010 0.716 0.5494 0.2493 0.5136 1
S9010 0.9296 0.8581 0.5447 0.8463 0.8802 1
Table A.8 Pearson correlation between measures of inequality
Variable
(1)
Gini RR
(2)
Gini RR
(3)
Gini RR
(4)
Gini RR
Patent_pop 0.010* 0.015** 0.014** 0.013**
(0.006) (0.006) (0.006) (0.006)
Edu_high -0.262*** -0.260*** -0.255***
(0.056) (0.063) (0.062)
Edu_low -0.167*** -0.135*** -0.119**
(0.048) (0.049) (0.048)
GDPpcap 0.000 0.000
(0.000) (0.000)
Popgrowth -0.075 -0.026
(0.021) (0.024)
Unemploy 0.122***
(0.027)
R square 0.1553 0.1030 0.0785 0.0590
Group 84 84 84 84
N 588 588 588 588
Table A.9 Innovation versus income inequality at regional level (basic model)
Innovation is 3 years lagged. Time span: 2004-2011 (8 years). Panel data fixed effect regressions.
Variable description is given in Table 1. *** p value < 0.01, ** p value < 0.05, *p value < 0.1.
Standard errors are in the brackets.

86
Variable
(1)
Gini EU
Lag 3 years
(2)
Gini EU
Lag 2 years
(3)
Gini EU
Lag 4 years
(4)
Gini EU
Lag 5 years
(5)
Gini EU
Lag 3 years
(3 years
Moving
Average)
(6)
Gini EU
Lag 3 years
(5 years
Moving
Average)
Patent_pop 0.013** 0.002 0.020*** 0.023*** 0.030*** 0.041***
(0.006) (0.006) (0.006) (0.006) (0.007) (0.008)
Edu_high -0.255*** -0.245*** -0.279*** -0.280*** -0.282*** -0.289***
(0.062) (0.062) (0.062) (0.063) (0.062) (0.062)
Edu_low -0.119** -0.114** -0.125** -0.111** -0.118** -0.112**
(0.048) (0.048) (0.049) (0.049) (0.049) (0.049)
GDPpcap 0.000 0.000 0.000 0.000 0.000 0.000
(0.000) (0.000) (0.000) (0.000) (0.000) (0.000)
Popgrowth -0.026 -0.029 -0.023 -0.024 -0.021 -0.014
(0.024) (0.024) (0.024) (0.024) (0.024) (0.024)
Unemploy 0.122*** 0.125*** 0.120*** 0.118*** 0.118*** 0.117***
(0.027) (0.028) (0.027) (0.027) (0.027) (0.027)
R square 0.0590 0.0084 0.0879 0.0906 0.1213 0.1322
Group 84 84 84 84 84 84
N 588 590 584 580 580 571
Table A.10 Innovation versus income inequality at regional level with various time lag and
moving average
Innovation is lagged. Time span: 2004-2011 (8 years). Panel data fixed effect regressions. Variable
description is given in Table 1. *** p value < 0.01, ** p value < 0.05, *p value < 0.1. Standard errors
are in the brackets.

87
Variable
(1)
Gini RR
(2)
P9010
(3)
P9050
(4)
P5010
Patent_pop 0.041*** 0.004** 0.001*** 0.001
(0.008) (0.002) (0.000) (0.001)
Edu_high -0.289*** -0.057*** -0.009*** -0.018***
(0.062) (0.012) (0.003) (0.005)
Edu_low -0.112** -0.023** -0.003 -0.010**
(0.049) (0.009) (0.002) (0.004)
GDPpcap 0.000 0.000 0.000 0.000
(0.000) (0.000) (0.000) (0.000)
Popgrowth -0.014 -0.006 0.000 -0.004
(0.024) (0.005) (0.001) (0.002)
Unemploy 0.117*** 0.067*** 0.010*** 0.022***
(0.027) (0.005) (0.001) (0.002)
R square 0.1322 0.0302 0.1262 0.0185
Group 84 84 84 84
N 571 571 548 548
Table A.11 Innovation versus alternative measures of income inequality at regional level
Innovation is lagged. Time span: 2004-2011 (8 years). Panel data fixed effect regressions. Variable
description is given in Table 1. *** p value < 0.01, ** p value < 0.05, *p value < 0.1. Standard errors
are in the brackets.

88
Variable (1)
Gini EU
31 countries
(2)
Gini EU
27 countries
(3)
Gini EU
15 countries
(4)
Gini EU
31 countries
Tech_div -0.488*** -0.554*** -0.677*** -0.522***
(0.176) (0.168) (0.179) (0.176)
Patent_pop 0.017*** 0.013** 0.017***
(0.005) (0.006) (0.005)
R&Dexp_pop 0.004***
(0.001)
Edu_high -0.117** -0.144*** -0.126**
(0.047) (0.048) (0.051)
Edu_low -0.099** -0.070* -0.071*
(0.038) (0.039) (0.040)
Gov_Exp -5.842 -6.827 -6.827 -12.621**
(4.535) (4.432) (5.448) (4.918)
Openness -0.719 -1.507*** -1.583** -0.534
(0.521) (0.507) (0.677) (0.540)
GDPpcap 0.000 0.000*** 0.000*** 0.000
(0.000) (0.000) (0.000) (0.000)
Popgrowth -0.039* -0.055*** 0.019 -0.040*
(0.020) (0.020) (0.027) (0.020)
Unemploy 0.030 0.058* 0.064 0.032
(0.032) (0.032) (0.039) (0.033)
R square 0.1115 0.1467 0.3311 0.1418
Group 31 27 15 31
N 369 324 180 349
Table A.12 Technological diversification versus income inequality at country level (basic model)
Technological diversification (tech_div) and innovation (as measured by patent_pop) are 3 years
lagged. The independent variable is technological diversification which is the inverse of technological
specialization. Time span: 2003-2014 (12 years). Panel data fixed effect regressions. Variable
description is given in Table 1. *** p value < 0.01, ** p value < 0.05, *p value < 0.1. Standard errors
are in the brackets.

89
Variable (1)
Gini EU
2003 - 2014
(2)
S9010
2003 - 2014
(3)
S9050
2003 - 2014
(4)
Top 10%
2004 - 2011
(4)
Top 1%
2004 - 2011
Tech_div -0.488*** -0.140 -0.089*** -0.521*** -0.285***
(0.176) (0.160) (0.024) (0.144) (0.101)
Patent_pop 0.017*** 0.005 0.002*** 0.016*** 0.011***
(0.005) (0.005) (0.001) (0.004) (0.003)
Edu_high -0.117** -0.091* -0.009 -0.118*** -0.081***
(0.047) (0.046) (0.007) (0.039) (0.027)
Edu_low -0.099** -0.005 -0.010* -0.109*** -0.093***
(0.038) (0.038) (0.006) (0.031) (0.022)
Gov_Exp -5.842 0.986 -1.322 -6.801* -6.775***
(4.535) (4.775) (0.714) (3.721) (2.594)
Openness -0.719 -0.647 -0.069 -0.606 -0.538*
(0.521) (0.522) (0.078) (0.427) (0.298)
GDPpcap 0.000 0.000 0.000 0.000 0.000**
(0.000) (0.000) (0.000) (0.000) (0.000)
Popgrowth -0.039* -0.024 -0.008*** -0.028* 0.004
(0.020) (0.018) (0.003) (0.016) (0.011)
Unemploy 0.030 0.112*** -0.005 0.001 0.008
(0.032) (0.031) (0.005) (0.027) (0.019)
R square 0.1115 0.0900 0.1111 0.0742 0.0186
Group 31 31 31 31 31
N 369 325 325 369 369
Table A.13 Technological Diversification versus alternative measures of inequality at country
level
Technological diversification (tech_div) and innovation (as measured by patent_pop) are 3 years
lagged. The independent variable is technological diversification which is the inverse of technological
specialization. Time span: 2003-2014 (12 years). Panel data fixed effect regressions. Variable
description is given in Table 1. *** p value < 0.01, ** p value < 0.05, *p value < 0.1. Standard errors
are in the brackets.

90
Variable (1)
Gini EU
2003 - 2014
(2)
Gini EU
2003 - 2014
(3)
Top 10%
2003 - 2014
(4)
Top 10%
2003 - 2014
(5)
Gini RR
2004 - 2011
(6)
Gini RR
2004 - 2011
Tech_div -0.199*** -0.157** -0.578***
(8 class) (0.074) (0.062) (0.179)
Tech_div -2.049*** -1.831*** -5.211***
(123
subclass) (0.470) (0.391) (1.711)
Patent_pop 0.011** 0.010*** 0.010** 0.009*** 0.038*** 0.044***
(0.006) (0.006) (0.005) (0.005) (0.010) (0.010)
Edu_high -0.168*** -0.157 -0.147*** -0.137*** -0.294*** -0.271***
(0.048) (0.047) (0.040) (0.039) (0.068) (0.069)
Edu_low -0.063 -0.063 -0.077** -0.077** -0.122** -0.117**
(0.039) (0.039) (0.033) (0.032) (0.057) (0.057)
Gov_Exp -3.300 -5.988 -2.849 -5.212
(4.356) (4.302) (3.647) (3.579)
Openness -1.561*** -1.502*** -1.206*** -1.140***
(0.509) (0.499) (0.426) (0.415)
GDPpcap 0.000*** 0.000*** 0.000*** 0.000** -0.000 -0.000
(0.000) (0.000) (0.000) (0.000) (0.000) (0.000)
Popgrowth -0.058*** -0.056*** -0.042** -0.040** -0.027 -0.038
(0.020) (0.020) (0.017) (0.016) (0.025) (0.026)
Unemploy 0.052 0.054* 0.005 0.007 0.097*** 0.093***
(0.033) (0.032) (0.027) (0.027) (0.030) (0.030)
R square 0.1175 0.0417 0.0767 0.0074 0.0970 0.0221
Group 27 27 27 27 84 84
N 324 324 324 324 521 521
Table A.14 Technological Diversification based on hierarchical IPC code at county and regional
level
Technological diversification (tech_div) and innovation (as measured by patent_pop) are 3 years
lagged. The independent variable is technological diversification which is the inverse of technological
specialization. Time span: 2003-2014 (12 years) for country level and 2004-2011 (8 years) for
regional level. Panel data fixed effect regressions. Variable description is given in Table 1. *** p
value < 0.01, ** p value < 0.05, *p value < 0.1. Standard errors are in the brackets.

91
Variable
(1) (2) (3) (4) (5) (6) (7)
Fixed
Effect
Gini
Random
Effect
Gini
FGLS
Gini
OLS country
year
dummies
Gini
First
Difference
1
Gini
First
Difference
2
Gini
First
Difference
3
Gini
patent_pop 0.017*** 0.003 -0.007*** 0.020*** 0.011* 0.011** 0.012
(0.005) (0.004) (0.002) (0.006) (0.006) (0.006) (0.013)
edu_high -0.136*** -0.025 0.088*** -0.141** -0.002 -0.062 0.006
(0.047) (0.041) (0.028) (0.057) (0.012) (0.073) (0.030)
edu_low -0.094** 0.015 0.088*** -0.090** -0.001 0.012 0.002
(0.038) (0.029) (0.013) (0.039) (0.005) (0.063) (0.014)
gov_exp -3.092 -0.333 -22.814*** 4.558 2.006 0.664 0.981
(4.470) (4.304) (4.903) (5.422) (2.029) (6.133) (5.219)
openness -0.893* -0.971* -2.672*** -1.043* -0.147 -0.584 -0.222
(0.522) (0.501) (0.383) (0.622) (0.162) (0.636) (0.367)
GDPcap 0.000 -0.000 -0.000*** 0.000 0.000 -0.000 -0.000
(0.000) (0.000) (0.000) (0.000) (0.000) (0.000) (0.000)
pop_growth -0.041** -0.038* -0.156*** -0.041** 0.001 -0.061*** -0.019
(0.020) (0.021) (0.030) (0.020) (0.012) (0.022) (0.032)
unemploy 0.020 0.028 0.055 0.031 0.016 -0.044 0.019
(0.033) (0.033) (0.050) (0.034) (0.021) (0.050) (0.052)
R-square 0.1018 0.3591
0.9302 0.0179 0.0377 0.0323
Group 31 31 31
N 369 369 369 369 359 358 114
Table A.15 Innovation versus inequality at country level with various panel model regressions
Innovation (as measured by patent_pop) is 3 years lagged. Time span: 2003-2014 (12 years). Panel
data fixed effect regressions. Variable description is given in Table 1. *** p value < 0.01, ** p value
< 0.05, *p value < 0.1. Standard errors are in the brackets.
1) Fixed effect regression, as performed by this study and similar with Lee (2011),
2) Random effect regression
3) FGLS, similar with study conducted by Antonelli and Gehringer (2013)
4) Pool OLS with country and year dummies, similar with study conducted by Aghion et al
(2015)
5) Pool OLS with dependent and independent variables are the first differences, control variables
are levels
∆𝑦𝑡 = 𝑓(∆𝑥𝑡−ℎ, 𝑐𝑜𝑛𝑡𝑟𝑜𝑙 𝑣𝑎𝑟𝑖𝑎𝑏𝑙𝑒𝑠, 𝑒𝑟𝑟𝑜𝑟) ; ∆𝑦𝑡 = 𝑦𝑡 − 𝑦𝑡−1 and ∆𝑥𝑡 = 𝑥𝑡 − 𝑥𝑡−1
6) Pool OLS with dependent, independent, and control variables are the first differences
∆𝑦𝑡 = 𝑓(∆𝑥𝑡−ℎ , 𝑐𝑜𝑛𝑡𝑟𝑜𝑙 𝑣𝑎𝑟𝑖𝑎𝑏𝑙𝑒𝑠, 𝑒𝑟𝑟𝑜𝑟) ; ∆𝑐𝑜𝑛𝑡𝑟𝑜𝑙𝑡 = 𝑐𝑜𝑛𝑡𝑟𝑜𝑙𝑡 − 𝑐𝑜𝑛𝑡𝑟𝑜𝑙𝑡−1
7) Pool OLS with dependent and independent variables are the first differences, control variables
are levels; time (t) period are 3 years,
The model consists of 4 periods: 2003-2005, 2006-2008, 2009-2011, and 2012-2014
All models confirm positive direction linking innovation to income inequality except FGLS model
which is negative

92
Variable
(1) (2) (3) (4)
Gini index
Gini index
Gini index
Gini index
patent_ict_pop 0.019**
(0.009)
patent_ht_pop
0.014
(0.011)
patent_bio_pop
-0.047*
(0.026)
patent_energy_pop
0.082***
(0.023)
edu_high -0.124** -0.129*** -0.126** -0.139***
(0.049) (0.049) (0.049) (0.047)
edu_low -0.070* -0.067 -0.065 -0.089**
(0.040) (0.040) (0.040) (0.038)
gov_exp 0.357 0.947 -1.914 -6.549
(4.697) (4.698) (4.534) (4.653)
openness -0.695 -0.808 -0.616 -0.570
(0.536) (0.533) (0.534) (0.520)
GDPcap 0.000 0.000 0.000 0.000
(0.000) (0.000) (0.000) (0.000)
pop_growth -0.049** -0.028 -0.046** -0.043**
(0.020) (0.021) (0.020) (0.020)
unemploy 0.021 0.023 0.030 0.024
(0.033) (0.033) (0.033) (0.032)
R-square 0.0706 0.0312 0.0127 0.0054
group 31 31 31 31
N 362 360 366 369
Table A.16 ICT Patents, Hightech Patents, Biotech Patents and Energy Patents versus
inequality at country level
Innovation is 3 years lagged. Time span: 2003-2014 (12 years). Panel data fixed effect regressions.
Variable description is given in Table 1. *** p value < 0.01, ** p value < 0.05, *p value < 0.1.
Standard errors are in the brackets.

93
Variable
(1)
Gini
Index
EU31
(2)
Gini
Index
EU27
(3)
Gini
Index
EU15
(4)
Top10
(5)
Top1
(6)
S9010
(7)
S9050
patent_ict_pop 0.019** 0.011 0.032*** 0.026*** 0.017*** 0.015* 0.004***
(0.009) (0.009) (0.007) (0.006) (0.005) (0.008) (0.001)
edu_high -0.124** -0.152***
(0.049) (0.050)
edu_low -0.070* -0.026
(0.040) (0.041)
gov_exp 0.357 -1.830 9.406* 9.401** 0.004 9.421* 1.461*
(4.697) (4.567) (5.601) (4.598) (3.160) (5.350) (0.770)
openness -0.695 -1.604*** -0.530 -0.718 -0.514 0.559 -0.172**
(0.536) (0.524) (0.527) (0.435) (0.397) (0.506) (0.073)
GDPcap 0.000 0.000*** 0.000** 0.000 0.000 -0.000 0.000
(0.000) (0.000) (0.000) (0.000) (0.000) (0.000) (0.000)
pop_growth -0.049** -0.066*** -0.006 -0.016 0.037** 0.023 -0.002
(0.020) (0.020) (0.029) (0.025) (0.016) (0.029) (0.004)
unemploy 0.021 0.055* -0.043 -0.071** 0.015 0.099** -0.013**
(0.033) (0.033) (0.039) (0.032) (0.021) (0.038) (0.005)
R-square 0.0706 0.0613 0.4040 0.2144 0.0315 0.0585 0.1213
Group 31 27 15 15 15 15 15
N 362 317 255 232 180 220 220
Table A.17 ICT Patents versus several measures of inequality at country level
Innovation (as measured by patent_pop) is 3 years lagged. Time span: 2003-2014 (12 years). Panel data
fixed effect regressions. Variable description is given in Table 1. *** p value < 0.01, ** p value < 0.05,
*p value < 0.1. Standard errors are in the brackets.

94
Variable (1)
Gini
(2)
S9010
(3)
S9050
(4)
S5010
patent_ict_pop 0.048** 0.006* 0.002** 0.001
(0.023) (0.004) (0.001) (0.001)
edu_high -
0.210***
-0.043*** -0.003 -0.016***
(0.079) (0.013) (0.003) (0.005)
edu_low -0.097 -0.021** 0.001 -0.010**
(0.063) (0.010) (0.003) (0.004)
gdp_cap 0.000 0.000*** 0.000 0.000***
(0.000) (0.000) (0.000) (0.000)
pop_growth -0.074** -0.005 -0.001 -0.003
(0.029) (0.005) (0.001) (0.002)
unemploy 0.054 0.072*** 0.007*** 0.028***
(0.042) (0.007) (0.002) (0.003)
R-square 0.1583 0.0492 0.0282 0.0321
group 84 84 84 84
N 455 455 450 450
Table A.18 ICT Patents versus several measures of inequality at regional level
Innovation (as measured by patent_pop) is 3 years lagged. Time span: 2004-2011 (8 years). Panel data
fixed effect regressions. Variable description is given in Table 1. *** p value < 0.01, ** p value < 0.05,
*p value < 0.1. Standard errors are in the brackets.

95
Variable
Dependent variable: Gini Index
IPC class of patent_pop as IV A
necessity
B
prfm opr
C
chemistry
D
textile
E
fix cons
F
mechanic
G
physics
H
electricity
patent_pop 0.030** 0.016 -0.017 0.026 -0.046 0.070*** 0.049** 0.030***
(0.015) (0.018) (0.023) (0.091) (0.042) (0.021) (0.021) (0.012)
edu_high -0.119** -0.114** -0.129*** -0.099* -0.060 -0.085* -0.107** -0.138***
(0.049) (0.048) (0.049) (0.053) (0.054) (0.050) (0.050) (0.049)
edu_low -0.066* -0.060 -0.067* -0.022 0.009 -0.060 -0.047 -0.089**
(0.039) (0.039) (0.040) (0.043) (0.045) (0.040) (0.041) (0.040)
gov_exp -1.589 -0.911 -0.130 8.678 5.189 -6.922 -0.264 -0.029
(4.551) (4.584) (4.568) (5.508) (5.533) (5.083) (4.651) (4.580)
openness -0.840 -0.715 -0.758 -0.616 -0.721 -0.902 -0.797 -0.623
(0.546) (0.555) (0.531) (0.651) (0.599) (0.559) (0.573) (0.524)
GDPcap 0.000 0.000 0.000 0.000 0.000 -0.000 0.000 0.000
(0.000) (0.000) (0.000) (0.000) (0.000) (0.000) (0.000) (0.000)
pop_growth -0.046** -0.026 -0.026 0.006 -0.031 -0.031 -0.047** -0.023
(0.021) (0.022) (0.022) (0.026) (0.024) (0.022) (0.021) (0.021)
unemploy 0.024 0.027 0.029 0.050 0.043 0.016 0.024 0.021
(0.033) (0.033) (0.033) (0.040) (0.036) (0.034) (0.034) (0.033)
R-square 0.0175 0.0140 0.0024 0.0381 0.3180 0.0056 0.0373 0.1024
Group 31 31 31 31 31 31 31 31
N 362 354 363 265 312 343 352 355
Table A.19 Patents based on first class IPC code (A to H) versus inequality at country level
Innovation (as measured by patent_pop) is 3 years lagged. Time span: 2003-2014 (12 years). Panel data
fixed effect regressions. Variable description is given in Table 1. *** p value < 0.01, ** p value < 0.05,
*p value < 0.1. Standard errors are in the brackets.

96
Variable
(1) (2) (3) (4) (5) (6)
gini bottom10 bottom20 median top10 top20
patent_pop 0.017*** 8.879*** 11.354*** 25.933*** 105.364*** 75.616***
(0.005) (2.604) (2.505) (4.378) (16.071) (11.335)
edu_high -0.136*** 103.254*** 156.098*** 337.001*** 586.097*** 574.090***
(0.047) (19.092) (18.361) (32.094) (117.818) (83.101)
edu_low -0.094** 18.910 58.595*** 138.346*** 62.956 144.621*
(0.038) (19.304) (18.566) (32.452) (119.130) (84.027)
gov_exp -3.092 11679.033*** 15513.707*** 32963.951*** 65835.796*** 58865.359***
(4.470) (2426.741) (2333.931) (4079.530) (14975.982) (10563.104)
openness -0.893* 944.122*** 947.369*** 1509.705*** 2526.692 2337.971**
(0.522) (268.723) (258.445) (451.743) (1658.350) (1169.695)
GDPcap 0.000
(0.000)
pop_growth -0.041** -6.521 -7.606 -3.641 -117.988** -76.720*
(0.020) (9.098) (8.750) (15.294) (56.144) (39.600)
unemploy 0.020 -85.068*** -84.856*** -128.707*** -407.618*** -316.764***
(0.033) (15.994) (15.382) (26.887) (98.702) (69.618)
R-square 0.1018 0.4368 0.4501 0.4535 0.3283 0.3879
Group 31 31 31 31 31 31
N 369 325 325 325 325 325
Table A.20 Innovation versus absolute household income at country level
Innovation (as measured by patent_pop) is 3 years lagged. Time span: 2003-2014 (12 years). Panel data
fixed effect regressions. Variable description is given in Table 1. *** p value < 0.01, ** p value < 0.05,
*p value < 0.1. Standard errors are in the brackets.
The data of income distribution are gathered from EU statistics on income and living conditions (EU
SILC) available on Eurostat.

97
Variable
(1) (2) (3) (4)
Gini top shares middle shares bottom shares
patent_pop 0.017*** 0.012*** -0.007*** -0.005**
(0.005) (0.004) (0.003) (0.002)
edu_high -0.136*** -0.067* 0.036 0.026
(0.047) (0.040) (0.024) (0.021)
edu_low -0.094** -0.041 0.035* 0.001
(0.038) (0.034) (0.020) (0.018)
gov_exp -3.092 -1.260 2.438 -1.434
(4.470) (4.064) (2.394) (2.131)
openness -0.893* -0.823* 0.453* 0.377
(0.522) (0.455) (0.268) (0.239)
GDPcap 0.000 0.000 0.000 -0.000
(0.000) (0.000) (0.000) (0.000)
pop_growth -0.041** -0.045*** 0.032*** 0.013
(0.020) (0.016) (0.009) (0.008)
unemploy 0.020 -0.018 0.037** -0.021
(0.033) (0.027) (0.016) (0.014)
R-square 0.1018 0.1050 0.0823 0.0482
Group 31 31 31 31
N 369 325 325 325
Table A.21 Innovation versus shares of household income at country level
Innovation (as measured by patent_pop) is 3 years lagged. Time span: 2003-2014 (12 years). Panel data
fixed effect regressions. Variable description is given in Table 1. *** p value < 0.01, ** p value < 0.05,
*p value < 0.1. Standard errors are in the brackets.
The data of income distribution are gathered from EU statistics on income and living conditions (EU
SILC) available on Eurostat.
1) Top shares in column 2 includes the shares of 70-100 percentile of household income distribution
2) Middle shares in column 3 includes the shares of 30-70 percentile of household income
distribution
3) Bottom shares in column 4 includes the shares of 0-30 percentile of household income
distribution
The data of income distribution are gathered from EU statistics on income and living conditions (EU
SILC) which is available on Eurostat.

98
Table A.22 Innovation versus decile shares of household income at country level
Innovation (as measured by patent_pop) is 3 years lagged. Time span: 2003-2014 (12 years). Panel data fixed effect regressions. Variable
description is given in Table 1. *** p value < 0.01, ** p value < 0.05, *p value < 0.1. Standard errors are in the brackets.
Variable
bottom shares middle shares top shares
(1) (2) (3) (4) (5) (6) (7) (8) (9) (10)
decile1 decile2 decile3 decile4 decile5 decile6 decile7 decile8 decile9 decile10
patent_pop -0.001 -0.002** -0.002** -0.002** -0.002** -0.002*** -0.001** -0.002*** -0.001 0.015***
(0.001) (0.001) (0.001) (0.001) (0.001) (0.001) (0.001) (0.001) (0.001) (0.004)
edu_high 0.001 0.015** 0.011 0.012* 0.009 0.007 0.008 0.016** 0.018** -0.137***
(0.011) (0.007) (0.007) (0.007) (0.006) (0.006) (0.006) (0.007) (0.008) (0.039)
edu_low -0.014 0.007 0.008 0.010* 0.006 0.008 0.011** 0.015*** 0.027*** -0.104***
(0.009) (0.006) (0.006) (0.006) (0.005) (0.005) (0.005) (0.006) (0.007) (0.032)
gov_exp -0.528 -0.551 -0.356 0.168 0.248 0.891 1.132* 1.388** 1.644** -3.867
(1.071) (0.733) (0.708) (0.687) (0.652) (0.645) (0.635) (0.678) (0.814) (3.697)
openness 0.213* 0.061 0.103 0.140* 0.112 0.121* 0.079 -0.089 -0.073 -0.791*
(0.120) (0.082) (0.079) (0.077) (0.073) (0.072) (0.071) (0.076) (0.091) (0.432)
GDPcap -0.000 -0.000 -0.000 -0.000 -0.000 0.000 0.000** 0.000*** 0.000*** -0.000
(0.000) (0.000) (0.000) (0.000) (0.000) (0.000) (0.000) (0.000) (0.000) (0.000)
pop_growth 0.002 0.005* 0.006** 0.007*** 0.009*** 0.009*** 0.007*** 0.003 -0.006* -0.030*
(0.004) (0.003) (0.003) (0.003) (0.003) (0.003) (0.002) (0.003) (0.003) (0.017)
unemploy -0.024*** -0.002 0.005 0.007 0.009** 0.011** 0.010** 0.010** 0.009 -0.011
(0.007) (0.005) (0.005) (0.005) (0.004) (0.004) (0.004) (0.005) (0.005) (0.027)
R-square 0.0953 0.2116 0.2190 0.1510 0.1075 0.0664 0.0086 0.0130 0.0440 0.0630
group 31 31 31 31 31 31 31 31 31 31
N 325 325 325 325 325 325 325 325 325 369

99
Variable
(1) (2) (3) (4)
poverty rate
(below 40%
median)
poverty rate
(below 50%
median)
poverty rate
(below 60%
median)
at risk poverty
and social exclusion
rate
patent_pop 0.001 0.003 0.002 -0.004
(0.004) (0.005) (0.005) (0.011)
edu_high -0.048 -0.093** -0.070 -0.394***
(0.032) (0.042) (0.048) (0.097)
edu_low 0.010 -0.008 -0.004 -0.168**
(0.026) (0.035) (0.040) (0.081)
gov_exp -0.187 7.126* 11.173** 2.232
(3.190) (4.247) (4.838) (9.832)
openness -0.239 0.036 -0.151 -2.200**
(0.357) (0.476) (0.542) (1.102)
GDPcap 0.000* 0.000** 0.000** 0.000**
(0.000) (0.000) (0.000) (0.000)
pop_growth -0.009 -0.006 0.015 -0.029
(0.012) (0.017) (0.019) (0.038)
unemploy 0.117*** 0.067** 0.025 0.348***
(0.021) (0.028) (0.032) (0.066)
R-square 0.0802 0.0833 0.2228 0.0654
group 31 31 31 31
N 325 325 325 325
Table A.23 Innovation versus poverty rate at country level
Innovation (as measured by patent_pop) is 3 years lagged. Time span: 2003-2014 (12 years). Panel
data fixed effect regressions. Variable description is given in Table 1. *** p value < 0.01, ** p value
< 0.05, *p value < 0.1. Standard errors are in the brackets.
The data of poverty rate are gathered from EU statistics on income and living conditions (EU SILC)
available on Eurostat.
Related Documents


![[Awardee - Alumni] Kebijakan Beasiswa LPDP 2015](https://static.cupdf.com/doc/110x72/55cf8f94550346703b9daacb/awardee-alumni-kebijakan-beasiswa-lpdp-2015.jpg)