ARTICLE EIF3G is associated with narcolepsy across ethnicities Anja Holm 1,2 , Ling Lin 3 , Juliette Faraco 3 , Sara Mostafavi 4 , Alexis Battle 4 , Xiaowei Zhu 5 , Douglas F Levinson 5 , Fang Han 6 , Steen Gammeltoft 1 , Poul Jennum 2 , Emmanuel Mignot 3 and Birgitte R Kornum* ,1 Type 1 narcolepsy, an autoimmune disease affecting hypocretin (orexin) neurons, is strongly associated with HLA-DQB1*06:02. Among polymorphisms associated with the disease is single-nucleotide polymorphism rs2305795 (c.*638G4A) located within the P2RY11 gene. P2RY11 is in a region of synteny conserved in mammals and zebrafish containing PPAN, EIF3G and DNMT1 (DNA methyltransferase 1). As mutations in DNMT1 cause a rare dominant form of narcolepsy in association with deafness, cerebellar ataxia and dementia, we questioned whether the association with P2RY11 in sporadic narcolepsy could be secondary to linkage disequilibrium with DNMT1. Based on genome-wide association data from two cohorts of European and Chinese ancestry, we found that the narcolepsy association signal drops sharply between P2RY11/EIF3G and DNMT1, suggesting that the association with narcolepsy does not extend into the DNMT1 gene region. Interestingly, using transethnic mapping, we identified a novel single-nucleotide polymorphism rs3826784 (c.596–260A4G) in the EIF3G gene also associated with narcolepsy. The disease-associated allele increases EIF3G mRNA expression. EIF3G is located in the narcolepsy risk locus and EIF3G expression correlates with PPAN and P2RY11 expression. This suggests shared regulatory mechanisms that might be affected by the polymorphism and are of relevance to narcolepsy. European Journal of Human Genetics advance online publication, 11 February 2015; doi:10.1038/ejhg.2015.4 INTRODUCTION Narcolepsy with cataplexy (Type 1 narcolepsy) affects 1 in 3000 individuals and is caused by the loss of around 70 000 hypocretin- (hcrt, also known as orexin) producing neurons in the hypothalamus. The disease is strongly associated with HLA-DQB1*06:02 and DQA1*01:02, 1 the T-cell receptor alpha locus 2 and polymorphisms in other immune-related genes. 3 The loss of hcrt-producing cells is hypothesized to have an autoimmune basis. 4 One of the genetic associations in narcolepsy is rs2305795, a polymorphism located in the purinergic receptor P2RY11. 5,6 The disease-associated allele of rs2305795 decreases P2RY11 expression and increases the sensitivity of CD8 + T cells to cell death induced by ATP. Interestingly, we also recently found that missense mutation in exon 21 of the DNA methyltransferase 1 (DNMT1) gene causes a rare hereditary form of narcolepsy-associated deafness, cerebellar ataxia and eventually dementia (ADCA-DN). 7 As the P2RY11 and DNMT1 genes are located in close proximity (within 18 kb) on chromosome 19, we hypothesized that the two signals could be related at the pathophysiological level. In support of this hypothesis, Kornum et al. 5 observed a correlation between P2RY11 and DNMT1 expression in peripheral blood mononuclear cells (PBMCs) of both patients and healthy controls. These findings made us question whether the association with P2RY11 in spontaneous narcolepsy could be second- ary to linkage disequilibrium (LD) with DNMT1. In the original study, Kornum et al. 5 fine-mapped the locus using seven single-nucleotide polymorphisms (SNPs) and reported an association between DNMT1 and narcolepsy in individuals of European ancestry but not Asians. In Asians, LD pattern pointed towards an association with P2RY11. 5 One of the biggest challenges of association studies is to identify which genetic variant is causal within a given locus. To address this challenge, increased sample size, functional studies and transethnic mapping may be beneficial. In transethnic mapping, different LD patterns in the disease-associated locus can be explored to narrow down the associated genetic region. This approach has previously been shown to be very powerful in narcolepsy and other diseases. 1,8,9 In this study, we reinvestigated SNPs in the P2RY11-DNMT1 region in narcolepsy across three different ethnic backgrounds. Based on genome-wide association study (GWAS) data available in Chinese and Caucasians, we observed that the narcolepsy association signal drops sharply between P2RY11 and DNMT1 in both cohorts. Based on LD patterns, we next selected four SNPs for genotyping in a cohort of African Americans. Following genotyping, we identified a novel SNP in EIF3G, rs3826784, best associated with narcolepsy across all three cohorts. EIF3G is located between P2RY11 and DNMT1. To further explore association between these different genes and narcolepsy, we finally also examined gene expression patterns in the entire region. MATERIALS AND METHODS Subjects Narcolepsy with cataplexy cases were selected based on documented hypocretin deficiency or clearcut cataplexy and HLA-DQB1*06:02. 2,6 The initial European ancestry GWA data set was comprised of 807 cases and 1074 DQB1*06:02- positive controls: 415 cases and 753 controls were recruited from the United States and Canada; 392 cases and 321 controls were recruited from European centers. The Chinese GWA data set was comprised of 1078 cases and 1903 controls. Analysis of the GWA data (549 596 SNPs in Europeans and 603 382 SNPs in Chinese) was performed as described. 2,6 The African-American sample 1 Molecular Sleep Laboratory, Department of Diagnostics, Glostrup University Hospital, Glostrup, Denmark; 2 Danish Center for Sleep Medicine, Department of Neurophysiology, Glostrup Hospital, University of Copenhagen, Glostrup, Denmark; 3 Center for Sleep Sciences in Medicine and Department of Psychiatry, Stanford University School of Medicine, Palo Alto, CA, USA; 4 Department of Computer Science, Stanford University, Palo Alto, CA, USA; 5 Department of Psychiatry and Behavioral Sciences, Stanford University, Palo Alto, CA, USA; 6 Department of Pulmonary, Critical Care Medicine, Peking University People’s Hospital, Beijing, China *Correspondence: Dr BR Kornum, Molecular Sleep Laboratory, Department of Diagnostics, Glostrup University Hospital, Nordre Ringvej 69, Glostrup 2600, Denmark. Tel: +45 38634541; Fax: +45 38633958; E-mail: [email protected] Received 26 February 2014; revised 28 October 2014; accepted 9 December 2014 European Journal of Human Genetics (2015), 1–8 & 2015 Macmillan Publishers Limited All rights reserved 1018-4813/15 www.nature.com/ejhg

Welcome message from author
This document is posted to help you gain knowledge. Please leave a comment to let me know what you think about it! Share it to your friends and learn new things together.
Transcript
ARTICLE
EIF3G is associated with narcolepsy across ethnicities
Anja Holm1,2, Ling Lin3, Juliette Faraco3, Sara Mostafavi4, Alexis Battle4, Xiaowei Zhu5, Douglas F Levinson5,Fang Han6, Steen Gammeltoft1, Poul Jennum2, Emmanuel Mignot3 and Birgitte R Kornum*,1
Type 1 narcolepsy, an autoimmune disease affecting hypocretin (orexin) neurons, is strongly associated with HLA-DQB1*06:02.
Among polymorphisms associated with the disease is single-nucleotide polymorphism rs2305795 (c.*638G4A) located within
the P2RY11 gene. P2RY11 is in a region of synteny conserved in mammals and zebrafish containing PPAN, EIF3G and DNMT1(DNA methyltransferase 1). As mutations in DNMT1 cause a rare dominant form of narcolepsy in association with deafness,
cerebellar ataxia and dementia, we questioned whether the association with P2RY11 in sporadic narcolepsy could be secondary
to linkage disequilibrium with DNMT1. Based on genome-wide association data from two cohorts of European and Chinese
ancestry, we found that the narcolepsy association signal drops sharply between P2RY11/EIF3G and DNMT1, suggesting that
the association with narcolepsy does not extend into the DNMT1 gene region. Interestingly, using transethnic mapping, we
identified a novel single-nucleotide polymorphism rs3826784 (c.596–260A4G) in the EIF3G gene also associated with
narcolepsy. The disease-associated allele increases EIF3G mRNA expression. EIF3G is located in the narcolepsy risk locus and
EIF3G expression correlates with PPAN and P2RY11 expression. This suggests shared regulatory mechanisms that might be
affected by the polymorphism and are of relevance to narcolepsy.
European Journal of Human Genetics advance online publication, 11 February 2015; doi:10.1038/ejhg.2015.4
INTRODUCTION
Narcolepsy with cataplexy (Type 1 narcolepsy) affects 1 in 3000individuals and is caused by the loss of around 70 000 hypocretin-(hcrt, also known as orexin) producing neurons in the hypothalamus.The disease is strongly associated with HLA-DQB1*06:02 andDQA1*01:02,1 the T-cell receptor alpha locus2 and polymorphismsin other immune-related genes.3 The loss of hcrt-producing cells ishypothesized to have an autoimmune basis.4
One of the genetic associations in narcolepsy is rs2305795, apolymorphism located in the purinergic receptor P2RY11.5,6 Thedisease-associated allele of rs2305795 decreases P2RY11 expression andincreases the sensitivity of CD8+ T cells to cell death induced by ATP.Interestingly, we also recently found that missense mutation in exon21 of the DNA methyltransferase 1 (DNMT1) gene causes a rarehereditary form of narcolepsy-associated deafness, cerebellar ataxiaand eventually dementia (ADCA-DN).7 As the P2RY11 and DNMT1genes are located in close proximity (within 18 kb) on chromosome19, we hypothesized that the two signals could be related at thepathophysiological level. In support of this hypothesis, Kornum et al.5
observed a correlation between P2RY11 and DNMT1 expression inperipheral blood mononuclear cells (PBMCs) of both patients andhealthy controls. These findings made us question whether theassociation with P2RY11 in spontaneous narcolepsy could be second-ary to linkage disequilibrium (LD) with DNMT1. In the original study,Kornum et al.5 fine-mapped the locus using seven single-nucleotidepolymorphisms (SNPs) and reported an association between DNMT1and narcolepsy in individuals of European ancestry but not Asians. InAsians, LD pattern pointed towards an association with P2RY11.5
One of the biggest challenges of association studies is to identifywhich genetic variant is causal within a given locus. To address thischallenge, increased sample size, functional studies and transethnicmapping may be beneficial. In transethnic mapping, different LDpatterns in the disease-associated locus can be explored to narrowdown the associated genetic region. This approach has previously beenshown to be very powerful in narcolepsy and other diseases.1,8,9 In thisstudy, we reinvestigated SNPs in the P2RY11-DNMT1 region innarcolepsy across three different ethnic backgrounds. Based ongenome-wide association study (GWAS) data available in Chineseand Caucasians, we observed that the narcolepsy association signaldrops sharply between P2RY11 and DNMT1 in both cohorts. Based onLD patterns, we next selected four SNPs for genotyping in a cohort ofAfrican Americans. Following genotyping, we identified a novel SNPin EIF3G, rs3826784, best associated with narcolepsy across all threecohorts. EIF3G is located between P2RY11 and DNMT1. To furtherexplore association between these different genes and narcolepsy, wefinally also examined gene expression patterns in the entire region.
MATERIALS AND METHODS
SubjectsNarcolepsy with cataplexy cases were selected based on documented hypocretin
deficiency or clearcut cataplexy and HLA-DQB1*06:02.2,6 The initial Europeanancestry GWA data set was comprised of 807 cases and 1074 DQB1*06:02-
positive controls: 415 cases and 753 controls were recruited from the UnitedStates and Canada; 392 cases and 321 controls were recruited from Europeancenters. The Chinese GWA data set was comprised of 1078 cases and 1903
controls. Analysis of the GWA data (549 596 SNPs in Europeans and 603 382SNPs in Chinese) was performed as described.2,6 The African-American sample
1Molecular Sleep Laboratory, Department of Diagnostics, Glostrup University Hospital, Glostrup, Denmark; 2Danish Center for Sleep Medicine, Department of Neurophysiology,Glostrup Hospital, University of Copenhagen, Glostrup, Denmark; 3Center for Sleep Sciences in Medicine and Department of Psychiatry, Stanford University School of Medicine,Palo Alto, CA, USA; 4Department of Computer Science, Stanford University, Palo Alto, CA, USA; 5Department of Psychiatry and Behavioral Sciences, Stanford University, Palo Alto,CA, USA; 6Department of Pulmonary, Critical Care Medicine, Peking University People’s Hospital, Beijing, China*Correspondence: Dr BR Kornum, Molecular Sleep Laboratory, Department of Diagnostics, Glostrup University Hospital, Nordre Ringvej 69, Glostrup 2600, Denmark.Tel: +45 38634541; Fax: +45 38633958; E-mail: [email protected] 26 February 2014; revised 28 October 2014; accepted 9 December 2014
European Journal of Human Genetics (2015), 1–8& 2015 Macmillan Publishers Limited All rights reserved 1018-4813/15www.nature.com/ejhg
contained 1297 individuals (249 cases, 1048 controls). The controls wererecruited from the National Institute of Mental Health (NIMH).For the expression quantitative trait locus (eQTL) analysis, we used a large
case–control study of major depression, for which RNA-sequencing data fromwhole blood together with genotype data were available for 922 individuals ofEuropean ancestry.
Imputation of Chinese and European cohortsImputation for the PPAN-DNMT1 region (from rs7250025 to rs2043305) wasperformed in the European and Chinese cohorts separately, using Beagle v.3.2.110 against reference genotypes from the 1000 genomes integrated data set.Chinese genotypes, originally obtained through the Affymetrix Axiom CHParray, were imputed against the CHB reference population. European ancestrygenotypes from the Affymetrix 6.0 array were imputed using four Europeanpopulations as a reference (CEU, TSI, GBR, IBS). In the paper by Kornumet al.,5 SNPs rs2305795 and rs12460842 were fine typed in many of theCaucasian samples. Further, rs2305795 was also retyped in the Chinese cohort6
and all the results were consistent with imputed results. The imputation qualityscore for rs3826784 was consistently above 0.8 and the overall association onpooled imputed genotypes is considered valid. Therefore, SNP markers withpoor imputation quality score in either Chinese or Europeans (r2o0.8) wereexcluded from all further analysis.The data of this study is submitted to the ClinVar Database (http://www.ncbi.
nlm.nih.gov/clinvar/; accession numbers: SCV000196702−SCV000196705).
Fine mapping of the chromosome 19 locus, and replication ofpublished SNPsWe used 1297 African-American individuals (249 cases, 1048 controls) forgenotyping in the region of association. Based on LD and r2 data from theInternational HapMap Project (Hapmap.org), we observed that the LD patternbetween the SNPs found from the GWAS was different in African Americans.The selected SNPs were rs1551570: NM_020230.5:c.190− 151C4T;
rs12460842: NM_002566.4:c.−203A4G; rs2305795: NM_002566.4:c.*638G4A;and rs3826784: NM_003755.3:c.596− 260A4G. For genotyping, we usedpredesigned Taqman SNP genotyping assays (Applied Biosystems, Carlsbad,CA, USA) to validate the observed LD pattern from the International HapMapproject in a cohort of African-American narcolepsy patients and controls.Genotyping was performed at Stanford University. SNPs rs1551750, rs12460842and rs3826784 are all located within introns of P2RY11 and EIF3G, respectively.SNP rs2305795 is located in the 3′-UTR of P2RY11. Genotype results wereanalyzed (allelic associations, LD calculations and analysis) and standard r2 plotswere generated using Haploview 4.2.11
RNA sequencing and genotyping of 922 individuals of EuropeanancestryThe complete procedure for whole blood processing, RNA sequencing andgenotyping is described in Battle et al.12 Briefly, whole blood was collected inPAXGene tubes for RNA and in acid-citrate-dextrose tubes for DNA. Tubeswere stored at − 80 °C. Total RNA was extracted using the GLOBINclear Kit(Invitrogen, Carlsbad, CA, USA). Libraries for RNA sequencing was performedusing Illumina TruSeq protocol. DNA was genotyped on the IlluminaHumanOmni1-Quad BeadChip (Illumina, San Diego, CA, USA).
Statistical analysisGenome-wide association analysis of the European and Chinese ancestry hasbeen described previously.2,6 Statistical analysis of genotyped and imputedgenotype data were performed using the PLINK software package (v.1.07)(http://pngu.mgh.harvard.edu/purcell/plink/),13 and in Haploview 4.2.11
Associations within ethnic groups were performed with basic allelic χ2
statistic tests. For associations combining multiple ethnic groups, the Mantel–Haenszel test was used together with the Breslow Day test of homogeneity ofthe odds ratio (both implemented in Plink).The details of the cis-eQTL analysis are described in Battle et al.12 Briefly,
expression data was first normalized to remove the effect of technical factors,
population structure and ‘hidden’ factors (which have been shown to reducethe statistical power to identify cis-eQTLs14). Such normalization approachescan significantly increase power for detecting cis-eQTLs; however, in doing so,such approaches also remove broader expression patterns that may be driven bytrans-regulation (as a trans-acting factor may affect the expression levels ofmultiple target genes) or reflect coregulation. As a result, previous work hasshown that separate normalization of gene expression data may be appropriatefor detecting cis versus trans associations.12,14 Therefore, we quantified coex-pression levels between genes using the normalization approach optimized fordetecting trans-eQTLs. For each SNP, a P-value for association with geneexpression level of each nearby gene (1Mb from the transcription start site) wascomputed based on the Spearman's correlation coefficient. Significant associa-tions were reported using 0.05 FDR (false discovery rate).PPAN: NM_020230.4; P2RY11: NM_002566.4; EIF3G: NM_003755.3;
DNMT1: NM_001130823.1.Rs1551570: NM_020230.5:c.190− 151C4T; rs12460842: NM_002566.4:c.
− 203A4G; rs2305795: NM_002566.4:c.*638G4A; rs3826784: NM_003755.3:c.596− 260A4G.SNPs reported in Table 1: rs1551570: NM_020230.5:c.190− 151C4T;
rs12460842: NM_002566.4:c.− 203A4G; rs2010353: NM_002566.4:c.19+142G4T; rs3826784: NM_003755.3:c.596− 260T4C; rs2305795: NM_002566.4:c.*638G4A; rs12462506: NM_002566.4:c.20− 178T4G; rs3826785:NM_003755.3:c.595+327G4A; rs73011220: NM_002566.4:c.19+880G4A;rs112647895: NM_002566.4:c.19+446G4A; rs3745601: NM_002566.4:c.259G4A; rs2305789: NM_020230.5:c.291+50A4G; rs6511570: NM_001130823.1:c.2895− 855C4T; rs2288349: NM_001130823.1:c.2721− 45C4T;rs35693490: NM_001130823.1:c.2721− 959G4A; rs8101626: NM_001130823.1:c.4773+383C4T; rs4804122: NC_000019.10:g.10131268C4T; 9 rs2114724:NM_001130823.1:c.1832+14A4G; rs2290684: NM_001130823.1:c.3394+34T4C; rs8112801: NM_001130823.1:c.3117− 203A4C; rs11880553:NM_001130823.1:c.3117 − 660G4A; rs11880388: NM_001130823.1:c.3117− 677C4T; rs11085587: NC_000019.10:g.10124423G4C; rs35374357:NC_000019.10:g.10129267T4C; rs7710: NM_003755.3:c.846T4C; rs870612:NC_000019.10:g.10120814A4C; rs4555265: NC_000019.10:g.10121508G4A;rs11667630: NM_003755.3:c.300+47G4T; rs2290687: NM_003755.3:c.240+23G4A; rs55752217: NM_020230.5:c.292− 46C4T; rs2305792: NM_020230.5:c.902−10C4G; rs1037686: NM_002566.4:c.19+419T4A; rs3745600:NM_002566.4:c.237C4T; rs34484805: NM_002566.4:c.20− 882A4G; rs7401:NM_002566.4:c.*363A4G; rs11666402: NM_020230.5:c.513+266T4C;rs10414661: NC_000019.10:g.10131561T4A; rs12462004: NC_000019.10:g.10127588T4G; rs10404209: NC_000019.10:g.10126751T4C; rs9305012:NM_001130823.1:c.2266 − 225A4G; rs10407514: NM_001130823.1:c.2895−449G4C; rs10418707: NM_001130823.1:c.2894+810C4T; rs12611113:NM_001130823.1:c.2721− 212A4G; rs60565702: NM_001130823.1:c.2720+999C4T; rs72620548: NM_001130823.1:c.4490− 306C4T; rs10854076:NM_001130823.1:c.4293+238C4G; rs4804489: NM_001130823.1:c.2265+418T4C; rs57366074: NM_001130823.1:c.2586+99G4T; rs10414537:NC_000019.10:g.10126048C4T.
RESULTS
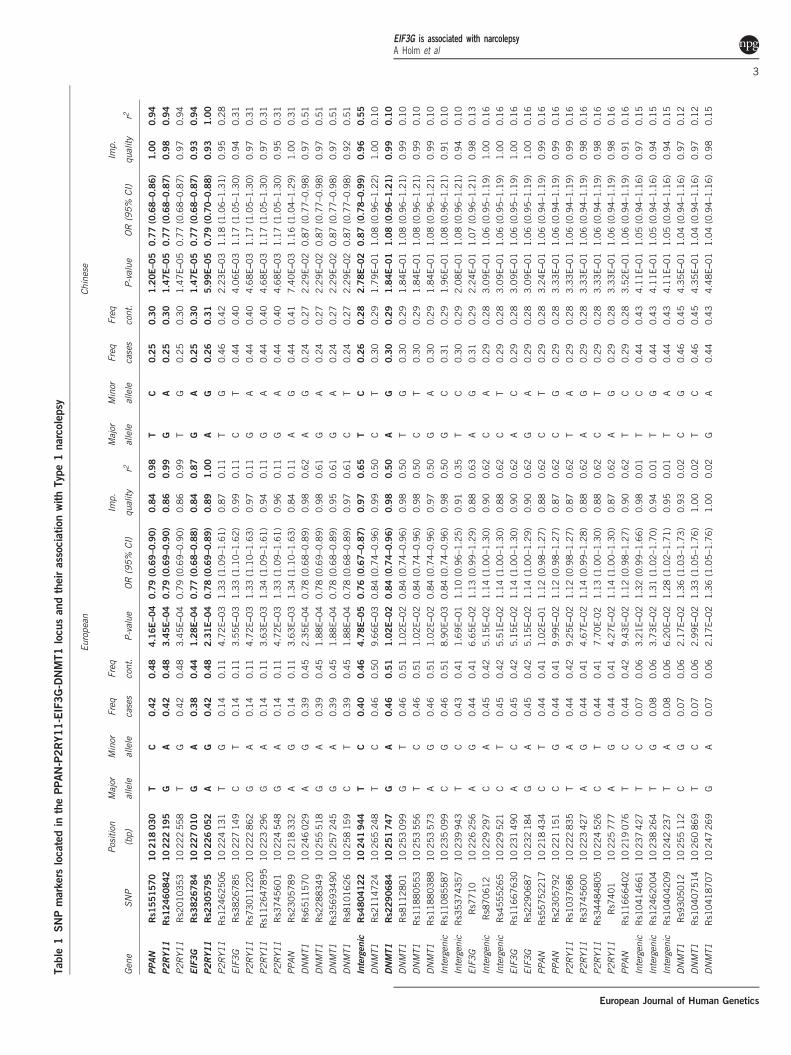
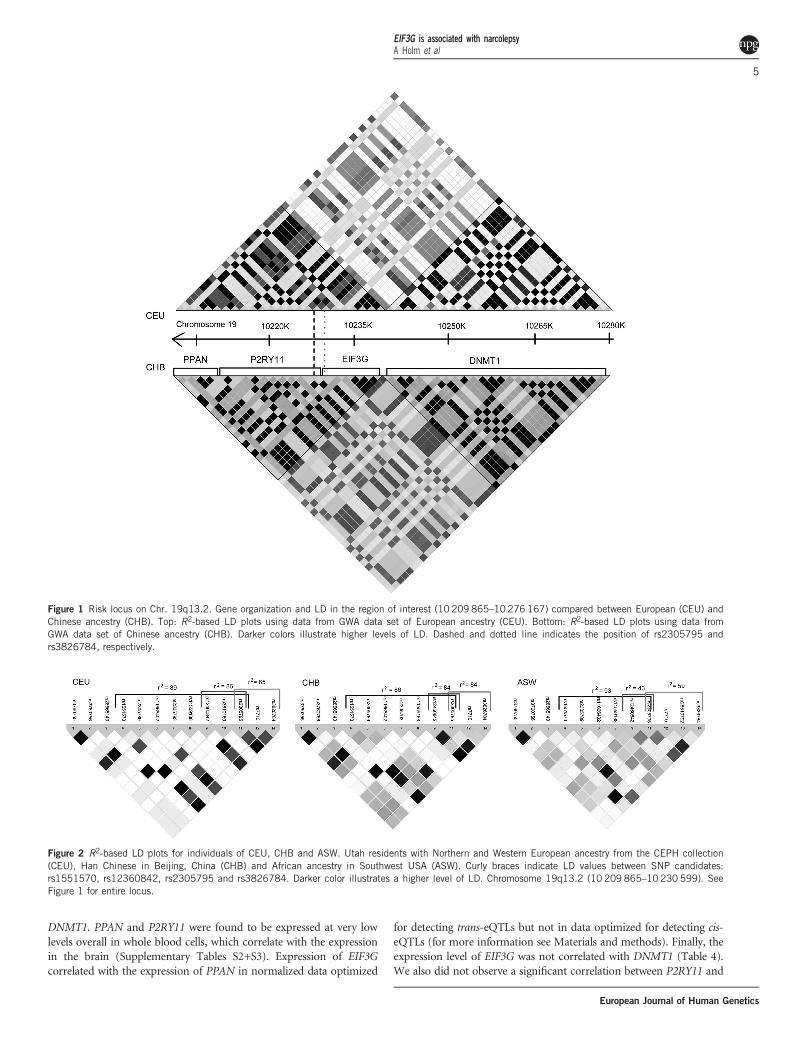
Association signal within the risk locusUsing two GWA data sets from narcoleptic patients and controls ofEuropean and Chinese ancestry, we investigated polymorphisms in theP2RY11-DNMT1 region. The cohorts included 1881 individuals ofEuropean ancestry (807 cases and 1074 controls) and 2981 Chinese(1078 cases and 1903 controls). SNPs in the region of interest wereimputed in each GWA data set, and ranked by statistical significancein the Chinese cohort (Table 1). The most significant SNPs in bothGWA data sets are in high LD with rs2305795 and located in thePPAN-P2RY11-EIF3G haplotype block, and not in DNMT1 (Table 1).R2 plots clearly illustrate that SNPs in high LD with rs2305795 arerestricted to the PPAN-P2RY11-EIF3G region, but not DNMT1(Figure 1), as was also observed by Han et al.6 Based on this analysis,five SNP markers (rs1551570 (PPAN), rs12460842 (P2RY11),rs2010353 (P2RY11), rs2305795 (P2RY11) and rs3826784 (EIF3G)
EIF3G is associated with narcolepsyA Holm et al
2
European Journal of Human Genetics
Table
1SNPmarkers
locatedin
thePPAN-P2RY11-EIF3G-DNMT1locusandtheirassociationwithType1narcolepsy
Europe
anCh
inese
Gen
eSN
P
Positio
n
(bp)
Major
allele
Minor
allele
Freq
cases
Freq
cont.
P-value
OR
(95%
CI)
Imp.
quality
r2Major
allele
Minor
allele
Freq
cases
Freq
cont.
P-value
OR
(95%
CI)
Imp.
quality
r2
PPAN
Rs1
551570
10218030
TC
0.42
0.48
4.16E−04
0.79(0.69–0.90)
0.84
0.98
TC
0.25
0.30
1.20E–05
0.77(0.68–0.86)
1.00
0.94
P2RY1
1Rs1
2460842
10222195
GA
0.42
0.48
3.45E–04
0.79(0.69–0.90)
0.86
0.99
GA
0.25
0.30
1.47E–05
0.77(0.68–0.87)
0.98
0.94
P2RY1
1Rs2
010353
10222558
TG
0.42
0.48
3.45E–04
0.79(0.69–0.90)
0.86
0.99
TG
0.25
0.30
1.47E–05
0.77(0.68–0.87)
0.97
0.94
EIF3
GRs3
826784
10227010
GA
0.38
0.44
1.28E–04
0.77(0.68–0.88)
0.84
0.87
GA
0.25
0.30
1.47E–05
0.77(0.68–0.87)
0.93
0.94
P2RY1
1Rs2
305795
10226052
AG
0.42
0.48
2.31E–04
0.78(0.69–0.89)
0.89
1.00
AG
0.26
0.31
5.99E–05
0.79(0.70–0.88)
0.93
1.00
P2RY1
1Rs1
2462506
10224131
TG
0.14
0.11
4.72E–03
1.33(1.09–1.61)
0.87
0.11
TG
0.46
0.42
2.23E–03
1.18(1.06–1.31)
0.95
0.28
EIF3
GRs3
826785
10227149
CT
0.14
0.11
3.55E–03
1.33(1.10–1.62)
0.99
0.11
CT
0.44
0.40
4.06E–03
1.17(1.05–1.30)
0.94
0.31
P2RY1
1Rs7
3011220
10222862
GA
0.14
0.11
4.72E–03
1.33(1.10–1.63)
0.97
0.11
GA
0.44
0.40
4.68E–03
1.17(1.05–1.30)
0.97
0.31
P2RY1
1Rs1
12647895
10223296
GA
0.14
0.11
3.63E–03
1.34(1.09–1.61)
0.94
0.11
GA
0.44
0.40
4.68E–03
1.17(1.05–1.30)
0.97
0.31
P2RY1
1Rs3
745601
10224548
GA
0.14
0.11
4.72E–03
1.33(1.09–1.61)
0.96
0.11
GA
0.44
0.40
4.68E–03
1.17(1.05–1.30)
0.95
0.31
PPAN
Rs2
305789
10218332
AG
0.14
0.11
3.63E–03
1.34(1.10–1.63)
0.84
0.11
AG
0.44
0.41
7.40E–03
1.16(1.04–1.29)
1.00
0.31
DNMT1
Rs6
511570
10246029
AG
0.39
0.45
2.35E–04
0.78(0.68–0.89)
0.98
0.62
AG
0.24
0.27
2.29E–02
0.87(0.77–0.98)
0.97
0.51
DNMT1
Rs2
288349
10255518
GA
0.39
0.45
1.88E–04
0.78(0.69–0.89)
0.98
0.61
GA
0.24
0.27
2.29E–02
0.87(0.77–0.98)
0.97
0.51
DNMT1
Rs3
5693490
10257245
GA
0.39
0.45
1.88E–04
0.78(0.68–0.89)
0.95
0.61
GA
0.24
0.27
2.29E–02
0.87(0.77–0.98)
0.97
0.51
DNMT1
Rs8
101626
10258159
CT
0.39
0.45
1.88E–04
0.78(0.68–0.89)
0.97
0.61
CT
0.24
0.27
2.29E–02
0.87(0.77–0.98)
0.92
0.51
Intergen
icRs4
804122
10241944
TC
0.40
0.46
4.78E–05
0.76(0.67–0.87)
0.97
0.65
TC
0.26
0.28
2.78E–02
0.87(0.78–0.99)
0.96
0.55
DNMT1
Rs2
114724
10265248
TC
0.46
0.50
9.66E–03
0.84(0.74–0.96)
0.99
0.50
CT
0.30
0.29
1.79E–01
1.08(0.96–1.22)
1.00
0.10
DNMT1
Rs2
290684
10251747
GA
0.46
0.51
1.02E–02
0.84(0.74–0.96)
0.98
0.50
AG
0.30
0.29
1.84E–01
1.08(0.96–1.21)
0.99
0.10
DNMT1
Rs8
112801
10253099
GT
0.46
0.51
1.02E–02
0.84(0.74–0.96)
0.98
0.50
TG
0.30
0.29
1.84E–01
1.08(0.96–1.21)
0.99
0.10
DNMT1
Rs1
1880553
10253556
TC
0.46
0.51
1.02E–02
0.84(0.74–0.96)
0.98
0.50
CT
0.30
0.29
1.84E–01
1.08(0.96–1.21)
0.99
0.10
DNMT1
Rs1
1880388
10253573
AG
0.46
0.51
1.02E–02
0.84(0.74–0.96)
0.97
0.50
GA
0.30
0.29
1.84E–01
1.08(0.96–1.21)
0.99
0.10
Intergen
icRs1
1085587
10235099
CG
0.46
0.51
8.90E–03
0.84(0.74–0.96)
0.98
0.50
GC
0.31
0.29
1.96E–01
1.08(0.96–1.21)
0.91
0.10
Intergen
icRs3
5374357
10239943
TC
0.43
0.41
1.69E–01
1.10(0.96–1.25)
0.91
0.35
TC
0.30
0.29
2.08E–01
1.08(0.96–1.21)
0.94
0.10
EIF3
GRs7
710
10226256
AG
0.44
0.41
6.65E–02
1.13(0.99–1.29)
0.88
0.63
AG
0.31
0.29
2.24E–01
1.07(0.96–1.21)
0.98
0.13
Intergen
icRs8
70612
10229297
CA
0.45
0.42
5.15E–02
1.14(1.00–1.30)
0.90
0.62
CA
0.29
0.28
3.09E–01
1.06(0.95–1.19)
1.00
0.16
Intergen
icRs4
555265
10229521
CT
0.45
0.42
5.51E–02
1.14(1.00–1.30)
0.88
0.62
CT
0.29
0.28
3.09E–01
1.06(0.95–1.19)
1.00
0.16
EIF3
GRs1
1667630
10231490
AC
0.45
0.42
5.15E–02
1.14(1.00–1.30)
0.90
0.62
AC
0.29
0.28
3.09E–01
1.06(0.95–1.19)
1.00
0.16
EIF3
GRs2
290687
10232184
GA
0.45
0.42
5.15E–02
1.14(1.00–1.29)
0.90
0.62
GA
0.29
0.28
3.09E–01
1.06(0.95–1.19)
1.00
0.16
PPAN
Rs5
5752217
10218434
CT
0.44
0.41
1.02E–01
1.12(0.98–1.27)
0.88
0.62
CT
0.29
0.28
3.24E–01
1.06(0.94–1.19)
0.99
0.16
PPAN
Rs2
305792
10221151
CG
0.44
0.41
9.99E–02
1.12(0.98–1.27)
0.87
0.62
CG
0.29
0.28
3.33E–01
1.06(0.94–1.19)
0.99
0.16
P2RY1
1Rs1
037686
10222835
TA
0.44
0.42
9.25E–02
1.12(0.98–1.27)
0.87
0.62
TA
0.29
0.28
3.33E–01
1.06(0.94–1.19)
0.99
0.16
P2RY1
1Rs3
745600
10223427
AG
0.44
0.41
4.67E–02
1.14(0.99–1.28)
0.88
0.62
AG
0.29
0.28
3.33E–01
1.06(0.94–1.19)
0.98
0.16
P2RY1
1Rs3
4484805
10224526
CT
0.44
0.41
7.70E-02
1.13(1.00–1.30)
0.88
0.62
CT
0.29
0.28
3.33E–01
1.06(0.94–1.19)
0.98
0.16
P2RY1
1Rs7
401
10225777
AG
0.44
0.41
4.27E–02
1.14(1.00–1.30)
0.87
0.62
AG
0.29
0.28
3.33E–01
1.06(0.94–1.19)
0.98
0.16
PPAN
Rs1
1666402
10219076
TC
0.44
0.42
9.43E–02
1.12(0.98–1.27)
0.90
0.62
TC
0.29
0.28
3.52E–01
1.06(0.94–1.19)
0.91
0.16
Intergen
icRs1
0414661
10237427
TC
0.07
0.06
3.21E–02
1.32(0.99–1.66)
0.98
0.01
TC
0.44
0.43
4.11E–01
1.05(0.94–1.16)
0.97
0.15
Intergen
icRs1
2462004
10238264
TG
0.08
0.06
3.73E–02
1.31(1.02–1.70)
0.94
0.01
TG
0.44
0.43
4.11E–01
1.05(0.94–1.16)
0.94
0.15
Intergen
icRs1
0404209
10242237
TA
0.08
0.06
6.20E–02
1.28(1.02–1.71)
0.95
0.01
TA
0.44
0.43
4.11E–01
1.05(0.94–1.16)
0.94
0.15
DNMT1
Rs9
305012
10255112
CG
0.07
0.06
2.17E–02
1.36(1.03–1.73)
0.93
0.02
CG
0.46
0.45
4.35E–01
1.04(0.94–1.16)
0.97
0.12
DNMT1
Rs1
0407514
10260869
TC
0.07
0.06
2.99E–02
1.33(1.05–1.76)
1.00
0.02
TC
0.46
0.45
4.35E–01
1.04(0.94–1.16)
0.97
0.12
DNMT1
Rs1
0418707
10247269
GA
0.07
0.06
2.17E–02
1.36(1.05–1.76)
1.00
0.02
GA
0.44
0.43
4.48E–01
1.04(0.94–1.16)
0.98
0.15
EIF3G is associated with narcolepsyA Holm et al
3
European Journal of Human Genetics
were significantly associated with narcolepsy in both cohorts, and wereselected for further analysis. Owing to a failure of the genotyping assay,however, rs2010353 was excluded, leaving four SNPs for all subse-quent analyses.Based on data from the International HapMap Project, we next
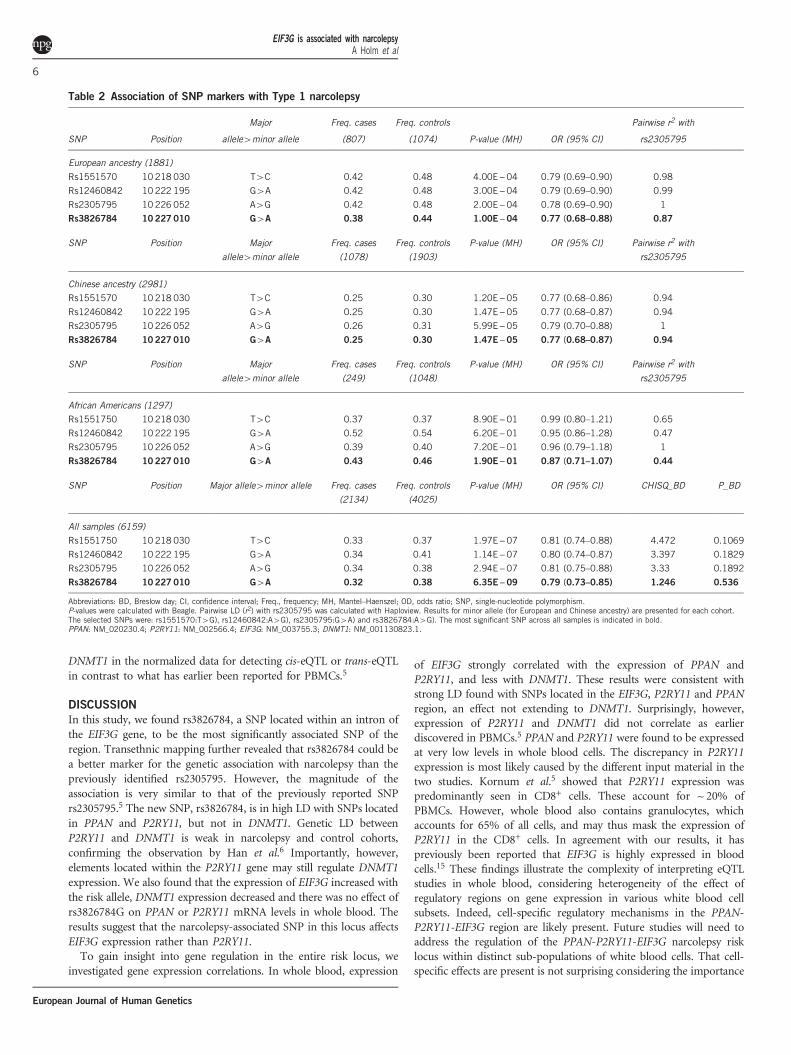
explored LD patterns for the four markers across ethnic groups.Interestingly, two SNPs rs12460842 (P2RY11) and rs3826784 (EIF3G)had a lower LD with rs1551570 (PPAN) and rs2305795 (P2RY11) inan African-American cohort (Figure 2), suggesting these to becandidates for transethnic mapping. Genotyping of these four markersin 1297 African Americans (249 cases and 1048 controls) showed thatsurprisingly rs3826784, and not the previously reported rs2305795,showed the strongest narcolepsy association based on odds ratio (OR)values, although none of the four SNPs reached statistical significancein this data set. A meta-analysis was performed across all ethnic groupsand here we replicated the finding by Kornum et al.5 of an increasedOR with the major allele rs2305795A (Table 2 shows data on minorallele). The meta-analysis further revealed that rs3826784 showed thestrongest association with narcolepsy across all ethnic groups (Table 2)with a slightly higher OR for the rs3826784G risk allele and a lowerP-value. There were no significant differences between the ORs fromthe four SNPs.
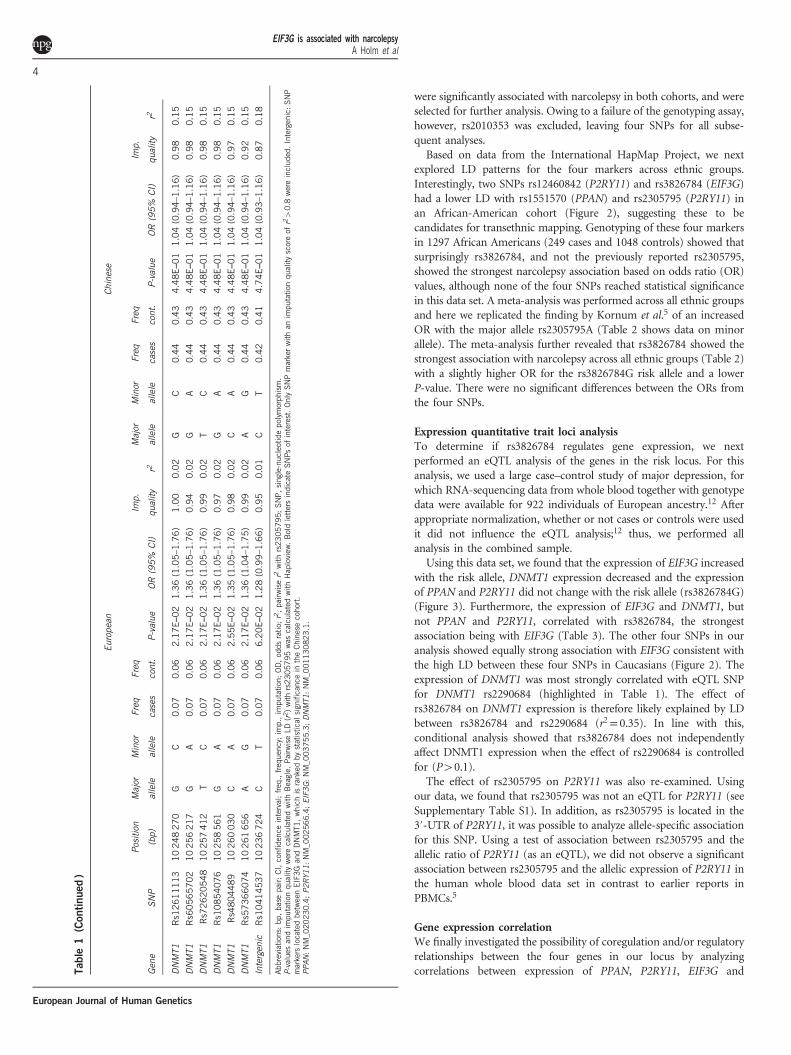
Expression quantitative trait loci analysisTo determine if rs3826784 regulates gene expression, we nextperformed an eQTL analysis of the genes in the risk locus. For thisanalysis, we used a large case–control study of major depression, forwhich RNA-sequencing data from whole blood together with genotypedata were available for 922 individuals of European ancestry.12 Afterappropriate normalization, whether or not cases or controls were usedit did not influence the eQTL analysis;12 thus, we performed allanalysis in the combined sample.Using this data set, we found that the expression of EIF3G increased
with the risk allele, DNMT1 expression decreased and the expressionof PPAN and P2RY11 did not change with the risk allele (rs3826784G)(Figure 3). Furthermore, the expression of EIF3G and DNMT1, butnot PPAN and P2RY11, correlated with rs3826784, the strongestassociation being with EIF3G (Table 3). The other four SNPs in ouranalysis showed equally strong association with EIF3G consistent withthe high LD between these four SNPs in Caucasians (Figure 2). Theexpression of DNMT1 was most strongly correlated with eQTL SNPfor DNMT1 rs2290684 (highlighted in Table 1). The effect ofrs3826784 on DNMT1 expression is therefore likely explained by LDbetween rs3826784 and rs2290684 (r2= 0.35). In line with this,conditional analysis showed that rs3826784 does not independentlyaffect DNMT1 expression when the effect of rs2290684 is controlledfor (P40.1).The effect of rs2305795 on P2RY11 was also re-examined. Using
our data, we found that rs2305795 was not an eQTL for P2RY11 (seeSupplementary Table S1). In addition, as rs2305795 is located in the3′-UTR of P2RY11, it was possible to analyze allele-specific associationfor this SNP. Using a test of association between rs2305795 and theallelic ratio of P2RY11 (as an eQTL), we did not observe a significantassociation between rs2305795 and the allelic expression of P2RY11 inthe human whole blood data set in contrast to earlier reports inPBMCs.5
Gene expression correlationWe finally investigated the possibility of coregulation and/or regulatoryrelationships between the four genes in our locus by analyzingcorrelations between expression of PPAN, P2RY11, EIF3G andT
able
1(Continued)
Europe
anCh
inese
Gen
eSN
P
Positio
n
(bp)
Major
allele
Minor
allele
Freq
cases
Freq
cont.
P-value
OR
(95%
CI)
Imp.
quality
r2Major
allele
Minor
allele
Freq
cases
Freq
cont.
P-value
OR
(95%
CI)
Imp.
quality
r2
DNMT1
Rs1
2611113
10248270
GC
0.07
0.06
2.17E–02
1.36(1.05–1.76)
1.00
0.02
GC
0.44
0.43
4.48E–01
1.04(0.94–1.16)
0.98
0.15
DNMT1
Rs6
0565702
10256217
GA
0.07
0.06
2.17E–02
1.36(1.05–1.76)
0.94
0.02
GA
0.44
0.43
4.48E–01
1.04(0.94–1.16)
0.98
0.15
DNMT1
Rs7
2620548
10257412
TC
0.07
0.06
2.17E–02
1.36(1.05–1.76)
0.99
0.02
TC
0.44
0.43
4.48E–01
1.04(0.94–1.16)
0.98
0.15
DNMT1
Rs1
0854076
10258561
GA
0.07
0.06
2.17E–02
1.36(1.05–1.76)
0.97
0.02
GA
0.44
0.43
4.48E–01
1.04(0.94–1.16)
0.98
0.15
DNMT1
Rs4
804489
10260030
CA
0.07
0.06
2.55E–02
1.35(1.05–1.76)
0.98
0.02
CA
0.44
0.43
4.48E–01
1.04(0.94–1.16)
0.97
0.15
DNMT1
Rs5
7366074
10261656
AG
0.07
0.06
2.17E–02
1.36(1.04–1.75)
0.99
0.02
AG
0.44
0.43
4.48E–01
1.04(0.94–1.16)
0.92
0.15
Intergen
icRs1
0414537
10236724
CT
0.07
0.06
6.20E–02
1.28(0.99–1.66)
0.95
0.01
CT
0.42
0.41
4.74E–01
1.04(0.93–1.16)
0.87
0.18
Abb
reviations:bp
,ba
sepa
ir;CI,confi
denc
einterval;freq
.,freq
uenc
y;im
p.,im
putatio
n;OD,od
dsratio
;r2,pa
irwiser2
with
rs23
0579
5;SNP,sing
le-nuc
leotidepo
lymorph
ism.
P-values
andim
putatio
nqu
ality
werecalculated
with
Beagle.
PairwiseLD
(r2)with
rs230
5795
was
calculated
with
Hap
loview
.Boldlettersindicate
SNPs
ofinterest.OnlySNPmarkerwith
anim
putatio
nqu
ality
scoreof
r240.8
wereinclud
ed.Intergen
ic:SNP
markers
locatedbe
tweenEIF3G
andDNMT1
,which
isrank
edby
statistic
alsign
ificanc
ein
theChine
secoho
rt.
PPAN
:NM_0
20230
.4;P2
RY1
1:NM_0
0256
6.4;EIF3
G:NM_0
0375
5.3;DNMT1
:NM_0
011
3082
3.1.
EIF3G is associated with narcolepsyA Holm et al
4
European Journal of Human Genetics
DNMT1. PPAN and P2RY11 were found to be expressed at very lowlevels overall in whole blood cells, which correlate with the expressionin the brain (Supplementary Tables S2+S3). Expression of EIF3Gcorrelated with the expression of PPAN in normalized data optimized
for detecting trans-eQTLs but not in data optimized for detecting cis-eQTLs (for more information see Materials and methods). Finally, theexpression level of EIF3G was not correlated with DNMT1 (Table 4).We also did not observe a significant correlation between P2RY11 and
Figure 1 Risk locus on Chr. 19q13.2. Gene organization and LD in the region of interest (10 209 865–10276 167) compared between European (CEU) andChinese ancestry (CHB). Top: R2-based LD plots using data from GWA data set of European ancestry (CEU). Bottom: R2-based LD plots using data fromGWA data set of Chinese ancestry (CHB). Darker colors illustrate higher levels of LD. Dashed and dotted line indicates the position of rs2305795 andrs3826784, respectively.
Figure 2 R2-based LD plots for individuals of CEU, CHB and ASW. Utah residents with Northern and Western European ancestry from the CEPH collection(CEU), Han Chinese in Beijing, China (CHB) and African ancestry in Southwest USA (ASW). Curly braces indicate LD values between SNP candidates:rs1551570, rs12360842, rs2305795 and rs3826784. Darker color illustrates a higher level of LD. Chromosome 19q13.2 (10 209 865–10230 599). SeeFigure 1 for entire locus.
EIF3G is associated with narcolepsyA Holm et al
5
European Journal of Human Genetics
DNMT1 in the normalized data for detecting cis-eQTL or trans-eQTLin contrast to what has earlier been reported for PBMCs.5
DISCUSSION
In this study, we found rs3826784, a SNP located within an intron ofthe EIF3G gene, to be the most significantly associated SNP of theregion. Transethnic mapping further revealed that rs3826784 could bea better marker for the genetic association with narcolepsy than thepreviously identified rs2305795. However, the magnitude of theassociation is very similar to that of the previously reported SNPrs2305795.5 The new SNP, rs3826784, is in high LD with SNPs locatedin PPAN and P2RY11, but not in DNMT1. Genetic LD betweenP2RY11 and DNMT1 is weak in narcolepsy and control cohorts,confirming the observation by Han et al.6 Importantly, however,elements located within the P2RY11 gene may still regulate DNMT1expression. We also found that the expression of EIF3G increased withthe risk allele, DNMT1 expression decreased and there was no effect ofrs3826784G on PPAN or P2RY11 mRNA levels in whole blood. Theresults suggest that the narcolepsy-associated SNP in this locus affectsEIF3G expression rather than P2RY11.To gain insight into gene regulation in the entire risk locus, we
investigated gene expression correlations. In whole blood, expression
of EIF3G strongly correlated with the expression of PPAN andP2RY11, and less with DNMT1. These results were consistent withstrong LD found with SNPs located in the EIF3G, P2RY11 and PPANregion, an effect not extending to DNMT1. Surprisingly, however,expression of P2RY11 and DNMT1 did not correlate as earlierdiscovered in PBMCs.5 PPAN and P2RY11 were found to be expressedat very low levels in whole blood cells. The discrepancy in P2RY11expression is most likely caused by the different input material in thetwo studies. Kornum et al.5 showed that P2RY11 expression waspredominantly seen in CD8+ cells. These account for ~ 20% ofPBMCs. However, whole blood also contains granulocytes, whichaccounts for 65% of all cells, and may thus mask the expression ofP2RY11 in the CD8+ cells. In agreement with our results, it haspreviously been reported that EIF3G is highly expressed in bloodcells.15 These findings illustrate the complexity of interpreting eQTLstudies in whole blood, considering heterogeneity of the effect ofregulatory regions on gene expression in various white blood cellsubsets. Indeed, cell-specific regulatory mechanisms in the PPAN-P2RY11-EIF3G region are likely present. Future studies will need toaddress the regulation of the PPAN-P2RY11-EIF3G narcolepsy risklocus within distinct sub-populations of white blood cells. That cell-specific effects are present is not surprising considering the importance
Table 2 Association of SNP markers with Type 1 narcolepsy
SNP Position
Major
allele4minor allele
Freq. cases
(807)
Freq. controls
(1074) P-value (MH) OR (95% CI)
Pairwise r2 with
rs2305795
European ancestry (1881)Rs1551570 10 218 030 T4C 0.42 0.48 4.00E−04 0.79 (0.69–0.90) 0.98
Rs12460842 10 222 195 G4A 0.42 0.48 3.00E−04 0.79 (0.69–0.90) 0.99
Rs2305795 10 226 052 A4G 0.42 0.48 2.00E−04 0.78 (0.69–0.90) 1
Rs3826784 10 227 010 G4A 0.38 0.44 1.00E−04 0.77 (0.68–0.88) 0.87
SNP Position Majorallele4minor allele
Freq. cases(1078)
Freq. controls(1903)
P-value (MH) OR (95% CI) Pairwise r2 withrs2305795
Chinese ancestry (2981)Rs1551570 10 218 030 T4C 0.25 0.30 1.20E−05 0.77 (0.68–0.86) 0.94
Rs12460842 10 222 195 G4A 0.25 0.30 1.47E−05 0.77 (0.68–0.87) 0.94
Rs2305795 10 226 052 A4G 0.26 0.31 5.99E−05 0.79 (0.70–0.88) 1
Rs3826784 10 227 010 G4A 0.25 0.30 1.47E−05 0.77 (0.68–0.87) 0.94
SNP Position Majorallele4minor allele
Freq. cases(249)
Freq. controls(1048)
P-value (MH) OR (95% CI) Pairwise r2 withrs2305795
African Americans (1297)Rs1551750 10 218 030 T4C 0.37 0.37 8.90E−01 0.99 (0.80–1.21) 0.65
Rs12460842 10 222 195 G4A 0.52 0.54 6.20E−01 0.95 (0.86–1.28) 0.47
Rs2305795 10 226 052 A4G 0.39 0.40 7.20E−01 0.96 (0.79–1.18) 1
Rs3826784 10 227 010 G4A 0.43 0.46 1.90E−01 0.87 (0.71–1.07) 0.44
SNP Position Major allele4minor allele Freq. cases(2134)
Freq. controls(4025)
P-value (MH) OR (95% CI) CHISQ_BD P_BD
All samples (6159)Rs1551750 10 218 030 T4C 0.33 0.37 1.97E−07 0.81 (0.74–0.88) 4.472 0.1069
Rs12460842 10 222 195 G4A 0.34 0.41 1.14E−07 0.80 (0.74–0.87) 3.397 0.1829
Rs2305795 10 226 052 A4G 0.34 0.38 2.94E−07 0.81 (0.75–0.88) 3.33 0.1892
Rs3826784 10 227 010 G4A 0.32 0.38 6.35E−09 0.79 (0.73–0.85) 1.246 0.536
Abbreviations: BD, Breslow day; CI, confidence interval; Freq., frequency; MH, Mantel–Haenszel; OD, odds ratio; SNP, single-nucleotide polymorphism.P-values were calculated with Beagle. Pairwise LD (r2) with rs2305795 was calculated with Haploview. Results for minor allele (for European and Chinese ancestry) are presented for each cohort.The selected SNPs were: rs1551570:T4G), rs12460842:A4G), rs2305795:G4A) and rs3826784:A4G). The most significant SNP across all samples is indicated in bold.PPAN: NM_020230.4; P2RY11: NM_002566.4; EIF3G: NM_003755.3; DNMT1: NM_001130823.1.
EIF3G is associated with narcolepsyA Holm et al
6
European Journal of Human Genetics

0 0.5 1 1.5 2−4
−3
−2
−1
0
1
2
3
4PPAN
Dosage (GG==2)
Nor
mal
ized
exp
ress
ion
leve
l
Spearman rho = 0.06
0 0.5 1 1.5 2−4
−3
−2
−1
0
1
2
3
4P2RY11
Dosage (GG==2)
Nor
mal
ized
exp
ress
ion
leve
l
Spearman rho = −0.02
0 0.5 1 1.5 2−4
−3
−2
−1
0
1
2
3
4EIF3G
Dosage (GG==2)
Nor
mal
ized
exp
ress
ion
leve
l
Spearman rho = 0.41
0 0.5 1 1.5 2−4
−3
−2
−1
0
1
2
3
4DNMT1
Dosage (GG==2)
Nor
mal
ized
exp
ress
ion
leve
l
Spearman rho = −0.20
Figure 3 Gene expression in whole blood with various rs3826784 genotypes. (a and b) The expression of PPAN and P2RY11 did not change with the riskallele (rs3826784G). (c) The expression of EIF3G increased with the risk allele (rs3826784GG). (d) The expression of DNMT1 decreased with the risk allele(rs3826784GG). The data are reported as normalized effect size, which equals the correlation coefficient (Spearman's ρ correlation coefficient is used as ameasure of change in expression level on the y axis).
Table 3 Association between SNPs and eQTLs in the Type 1 narcolepsy risk locus (negative log10 P-values for association between genotype
and expression levels)
Gene/SNP name Rs12460842 (genotyped) Rs2305795 (genotyped) Rs3826784 (imputed) Rs1551570 (genotyped)
PPAN 0.94 1.01 1.10 1.00
P2YR11 0.14 0.22 0.27 0.18
EIF3G 42.94 43.95 38.83 43.25
DNMT1 10.48 10.86 9.10 10.12
PPAN: NM_020230.4; P2RY11: NM_002566.4; EIF3G: NM_003755.3; DNMT1: NM_001130823.1.
Table 4 Correlation coefficient between gene expression levels of each gene pair was measured using the Spearman's correlation coefficient
Correlation coefficient Negative log10 P-value
PPAN P2RY11 EIF3G DNMT1 PPAN P2RY11 EIF3G DNMT1
PPAN 0.276 0.213 0.064 PPAN 16.75 10.10 1.28
P2RY11 0.276 0.155 0.008 P2RY11 16.75 5.64 0.09
EIF3G 0.212 0.155 0.050 EIF3G 10.10 5.64 0.88
DNMT1 0.064 0.008 0.050 DNMT1 1.28 0.09 0.88
PPAN: NM_020230.4; P2RY11: NM_002566.4; EIF3G: NM_003755.3; DNMT1: NM_001130823.1.
EIF3G is associated with narcolepsyA Holm et al
7
European Journal of Human Genetics

of the regulation of apoptosis in various immune cells types in reactionto changes in the environmental milieu.How could EIF3G be involved in narcolepsy? Eukaryotic initiation
factors (EIF) have an important role in the initiation phase ofeukaryotic translation by forming a complex with the 40S ribosomalsubunit and recruiting a Met-tRNAi called the 43S to the preinitiationcomplex. This complex recognizes and binds the 5′ cap structure ofmRNA, promoting ribosomal scanning of mRNA and regulatingrecognition of the AUG initiation codon.16,17 In mammals, EIF3 is thelargest scaffolding initiation factor (750 kDa), comprising 13 subunits(A–M). These subunits cluster together in subcomplexes, in whichEIF3G connects to EIF3B and EIF3I. EIF3B:G contains RNA recogni-tion motif subunits that are involved in RNA binding. Interestingly,EIF3B:G:I also interacts directly with certain viral mRNAs to promotethe translation of viral proteins.18 EIF4G, which interacts with EIF3,19
contains a binding domain for the non-structural influenza protein,NS1,20 and is recruited to the viral mRNA to initiate translation ofinfluenza virus. This is particularly interesting as recent findings haveimplicated a role of the H1N1 pandemic virus of 2009 as a trigger fornarcolepsy development.6 It has been suggested that the disruption ofEIF pathways in childhood H1N1/09 influenza increases diseaseseverity,21 so polymorphisms in this locus could indirectly changeimmune responses to influenza and narcolepsy risk.Another possibility could involve regulation of cell death, a function
that could be shared with P2RY11 and DNMT1, with coordinatedregulation of these loci explaining the conservation of synteny. The Nterminus of EIF3G indeed interacts with the C-terminal region ofapoptosis-inducing factor (AIF). AIF is a ubiquitous FAD-bindingflavoprotein that has an important role in caspase-independentapoptosis. Mature AIF inhibits newly translated protein synthesis viaits interactions with EIF3G. Additionally, mature AIF overexpressionspecifically activates caspase-7, thereby amplifying the inhibition ofprotein synthesis including EIF3G cleavage.22,23 Additionally, EIF3G isexpressed in the brain and the lateral hypothalamus (Allen Brain Atlas:www.brain-map.org).15 Higher EIF3G expression with the narcolepsyrisk allele could cause a dysregulated cell death, which again couldhave an important role in white blood cells in the context ofautoimmunity, or in the brain in the context of hypocretin cell loss.In conclusion, using transethnic mapping, we found a novel genetic
association of Type 1 narcolepsy with rs3826784, an SNP located inEIF3G. The new SNP is in high LD with the previously reportedP2YR11 rs2305795 SNP in individuals of European and Chineseancestry, but displays lower LD in African Americans. As theassociation signal from rs3826784 is nominally better compared withrs2305795 in all three cohorts, rs3826784 may be a better marker forthe genetic association with narcolepsy, although this conclusion istentative considering sample size of the African-American Cohort.Further confirmation is needed through extended GWA studies thatcombine multiple ethnic groups, and local resequencing. A complexcorrelation between the expression of three genes in the regionsuggests that a shared regulatory mechanism exists and might beaffected by the polymorphism.
CONFLICT OF INTEREST
The authors declare no conflict of interest.
ACKNOWLEDGEMENTS
We are indebted to all the narcoleptic patients of the study. Without theircontributions this study would not have been possible. This work wassupported by the Lundbeck Foundation and NIH Grant P50 NS23724.
1 Matsuki K, Grumet FC, Lin X et al: DQ (rather than DR) gene marks susceptibility tonarcolepsy. Lancet 1992;339:1052.
2 Hallmayer J, Faraco J, Lin L et al: Narcolepsy is strongly associated with the T-cellreceptor alpha locus. Nat Genet 2009; 41: 708–711.
3 Faraco J, Lin L, Kornum BR et al: ImmunoChip study implicates antigen presentation toT cells in narcolepsy. PLoS Genet 2013; 9: e1003270.
4 Partinen M, Kornum BR, Plazzi G et al: Narcolepsy as an autoimmune disease: the roleof H1N1 infection and vaccination. Lancet Neurol 2014; 13: 600–613.
5 Kornum BR, Kawashima M, Faraco J et al: Common variants in P2RY11 are associatedwith narcolepsy. Nat Genet 2011; 43: 66–71.
6 Han F, Faraco J, Dong XS et al: Genome wide analysis of narcolepsy in China implicatesnovel immune loci and reveals changes in association prior to versus after the 2009H1N1 influenza pandemic. PLoS Genet 2013; 9: e1003880.
7 Winkelmann J, Lin L, Schormair B et al: Mutations in DNMT1 cause autosomaldominant cerebellar ataxia, deafness and narcolepsy. Hum Mol Genet 2012; 21:2205–2210.
8 Mignot E, Lin L, Rogers W et al: Complex HLA-DR and -DQ interactions conferrisk of narcolepsy–cataplexy in three ethnic groups. Am J Hum Genet 2001; 68:686–699.
9 Wu Y, Waite LL, Jackson AU et al: Trans-ethnic fine-mapping of lipid loci identifiespopulation-specific signals and allelic heterogeneity that increases the trait varianceexplained. PLoS Genet 2013; 9: e1003379.
10 Browning SR, Browning BL: Rapid and accurate haplotype phasing and missing datainference for whole genome association studies by use of localized haplotypeclustering. Am J Hum Genet 2007; 81: 1084–1097.
11 Barrett JC, Fry B, Maller J et al: Haploview: analysis and visualization of LD andhaplotype maps. Bioinformatics 2005; 21: 263–265.
12 Battle A, Mostafavi S, Zhu X et al: Characterizing the genetic basis of transcriptomediversity through RNA-sequencing of 922 individuals. Genome Res 2014; 24:14–24.
13 Purcell S, Neale B, Todd-Brown K et al: PLINK: a toolset for whole-genome associationand population-based linkage analysis. Am J Hum Genet 2007; 81: 559–575.
14 Stegle O, Parts L, Durbin R, Winn J: A Bayesian framework to account for complex non-genetic factors in gene expression levels greatly increases power in eQTL studies. PLoSComput Biol 2010; 6: e1000770.
15 Wu C, Orozco C, Boyer J et al: BioGPS: an extensible and customizable portal forquerying and organizing gene annotation resources. Genome Biol 2009; 10: R130.
16 Zhou M, Sandercock AM, Fraser CS et al: Mass spectrometry reveals modularity and acomplete subunit interaction map of the eukaryotic translation factor eIF3. Proc NatlAcad Sci USA 2008; 105: 18139–18144.
17 Hinnebusch AG: eIF3: a versatile scaffold for translation initiation complexes. TrendsBiochem Sci 2006; 31: 553–562.
18 Park HS, Himmelbach A, Browning KS, Hohn T, Ryabova LA: A plant viral 'reinitiation'factor interacts with the host translational machinery. Cell 2001; 106: 723–733.
19 Spahn CM, Kieft JS, Grassucci RA et al Hepatitis C virus IRES RNA-induced changes inthe conformation of the 40 s ribosomal subunit. Science 2001;291:1959–1962.
20 Aragón T, de la Luna S, Novoa I, Carrasco L, Ortín J, Nieto A: Eukaryotic translationinitiation factor 4GI is a cellular target for NS1 protein, a translational activator ofinfluenza virus. Mol Cell Biol 2000; 20: 6259–6268.
21 Herberg JA, Kaforou M, Gormley S et al: Transcriptomic profiling in childhoodH1N1/09 influenza reveals reduced expression of protein synthesis genes. J InfectDis 2013; 208: 1664–1668.
22 Kim JT, Kim KD, Song EY et al: Apoptosis-inducing factor (AIF) inhibits proteinsynthesis by interacting with the eukaryotic translation initiation factor 3 subunit p44(eIF3g). FEBS Lett 2006; 580: 6375–6383.
23 Kim JT, Lee SJ, Kim BY et al: Caspase-mediated cleavage and DNase activityof the translation initiation factor 3, subunit G (eIF3g). FEBS Lett 2013; 587:3668–3674.
Supplementary Information accompanies this paper on European Journal of Human Genetics website (http://www.nature.com/ejhg)
EIF3G is associated with narcolepsyA Holm et al
8
European Journal of Human Genetics
Related Documents


