Welcome message from author
This document is posted to help you gain knowledge. Please leave a comment to let me know what you think about it! Share it to your friends and learn new things together.
Transcript

Contents
Forewords 4
EIF in Numbers 6
Highlights of 2019 8
Innovation 18
Growth & Competitiveness 32
Society 46
Agriculture 60
Cohesion & Regional 68
Impact & Looking Ahead 78
Breaking it Down 86
Capital & Shareholders 97
Board of Directors & Audit Board 99
Audit & Controls 100
Risk Management 101
Legal Service 102

4 5/ EIF Annual Report
“In 2019, 323,000 small businesses received financing thanks to the EIF and its partners in Europe. We worked with guarantee institutions, commercial and promotional banks, alternative lenders, microfinance providers, leasing companies and funds (financial intermediaries) to share the risk and expand their offering on a diverse range of loans, equity, crowdfunding, leases and alternative debt products in Europe, helping small businesses access better financing regardless of the stage of their lifecycle or their sector. We are catalysing new markets, particularly in the fields of private debt, where a third of our investments are in first-time teams. We have also fully deployed our first fund-of-funds in social impact, leading the way for further activity in this important area. However, we are aware of new challenges. Advances in technology – from digitalisation to artificial intelligence to life sciences are gathering strength in Europe, providing new thematic areas in which to grow our financing instruments. Ensuring that small businesses not only develop in Europe, but thrive on home turf is paramount as early-stage markets like venture capital mature and turn out more and more companies in search of growth-stage financing. On the threshold of the new European Union budgetary period and with new funds under EFSI 2, we are seizing this perfect opportunity to design new instruments that support SMEs (small and medium-sized enterprises) in a changing world, just as the InnovFin, COSME and other programmes did before them. These big plans only work, however, if we maximise the available resources. Together with our partners: the European Investment Bank (EIB), the European Commission (EC), Europe’s financial institutions, shareholders, institutional investors and other stakeholders, we are attracting new and international resources into Europe’s small businesses. With the expertise of our partners and staff, our job is to work together to make sure this capital reaches the right places.”
Dario ScannapiecoChairman of the Board of Directors
Pier Luigi GilibertChief Executive
“I am delighted that the EIF continues to deliver on its mission to support SMEs, as well as creating ongoing, sustainable sources of financing to one of the engines of the European economy. The EIF’s ability to make resources work hard is evidenced by its deployment of EUR 10.2bn in 2019, yet generating EUR 58.9bn to SMEs thanks to the crowding in of private investors. Making loans and equity financing available on better terms becomes all the more important when there are so many uncertainties in the wider economic environment. The EIF has also been careful to ensure a common approach - combining European structural funds with EFSI for the first time, creating a platform through which the national promotional institutions (NPIs) of every Member State can collaborate and actively attracting international institutional investment through its growing Asset Management Umbrella Fund (AMUF). Working with such a broad range of stakeholders requires initiative and innovation, something we also see reflected in the targeted focus of the EIF in 2019. From digitalisation to social impact, the EIF has a strong history of developing successful pilots and is now commanding resources from the EC that will build on these areas. To support us in these goals, we were delighted to welcome a new shareholder, Caixa Bank, in 2019. The EIF’s cooperation with many parties - the EIB, the EC, shareholders and stakeholders, NPIs and Member States, as well as its capacity to respond to the market needs of SMEs, makes me confident that the EIF’s approach is effective in addressing market fragmentation in Europe and supporting Capital Markets Union objectives for the benefit of European SMEs.”
“Helping small businesses access better financing regardless of the stage of their lifecycle or their sector” Chief Executive’s message
“Working with such a broad range of stakeholders requires initiative and innovation” Chairman’s message
76
EIF in Numbers
/ EIF Annual Report
EIF in Numbers
EIF inNumbers
€ 58.9bn 323,000
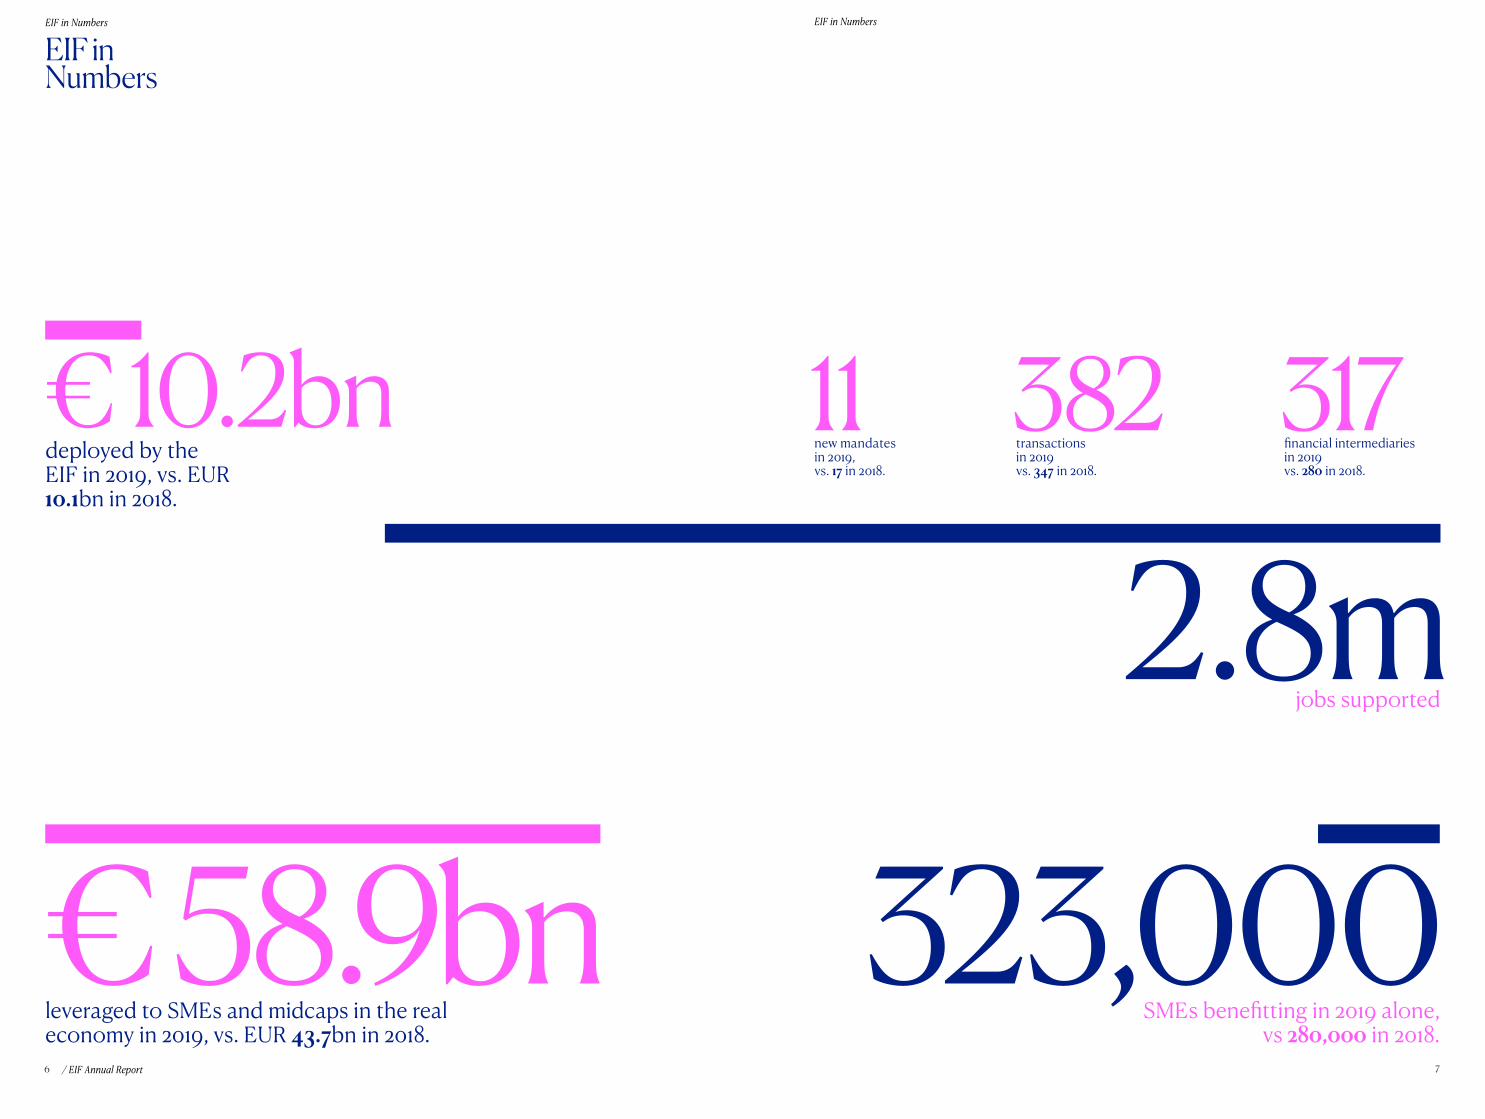
2.8mjobs supported
leveraged to SMEs and midcaps in the real economy in 2019, vs. EUR 43.7bn in 2018.
SMEs benefitting in 2019 alone,vs 280,000 in 2018.
deployed by the EIF in 2019, vs. EUR 10.1bn in 2018.
11new mandates in 2019, vs. 17 in 2018.
382transactionsin 2019vs. 347 in 2018.
317financial intermediariesin 2019vs. 280 in 2018.
€ 10.2bn

8 9/ EIF Annual Report
Highlights
10 11
Highlights Highlights
/ EIF Annual Report
Highlights
The European Investment Fund (EIF) makes it easier for small and medium-sized businesses (SMEs) in Europe to access financing - across multiple sectors, countries and needs.
Yet the needs of SMEs are always changing. Advances in life sciences, digitalisation and technology are breeding new types of start-ups in Europe, certain SMEs are prioritising their impact as much as their financial returns, and fragmentation between countries and sectors in Europe creates challenges that all need unique financing solutions.
That’s why in 2019 we have tried to strike the balance between delivering our existing programmes and spurring new initiatives to support Europe’s digitalisation, space, artificial intelligence (AI), blockchain, impact investing and blue economy areas. We know that sources of financing need to endure, so we continue to pool our resources with partners across Europe and attract diverse public and private investors to SMEs.
We also know we must stay true to our core values; including the policy goals of the European Commission (EC), the European Investment Bank (EIB) and Member States, crowding in private investors and successfully deploying the European Fund for Strategic Investments (EFSI). Ultimately, if we believe in small, big things can happen.
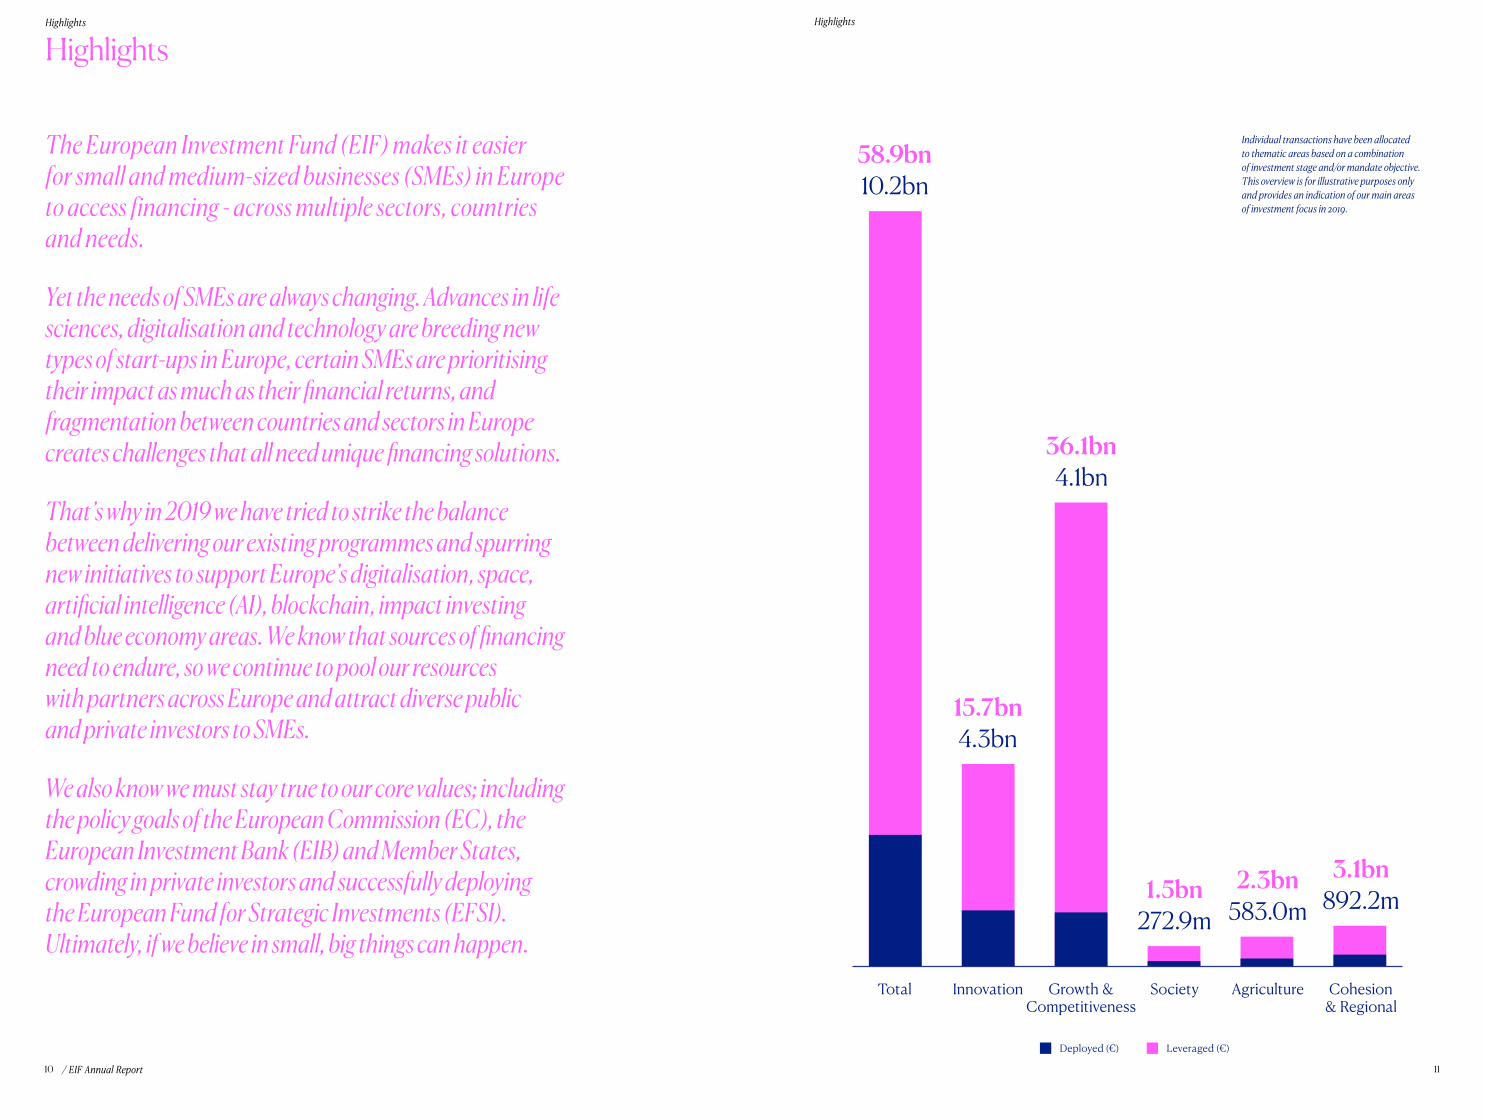
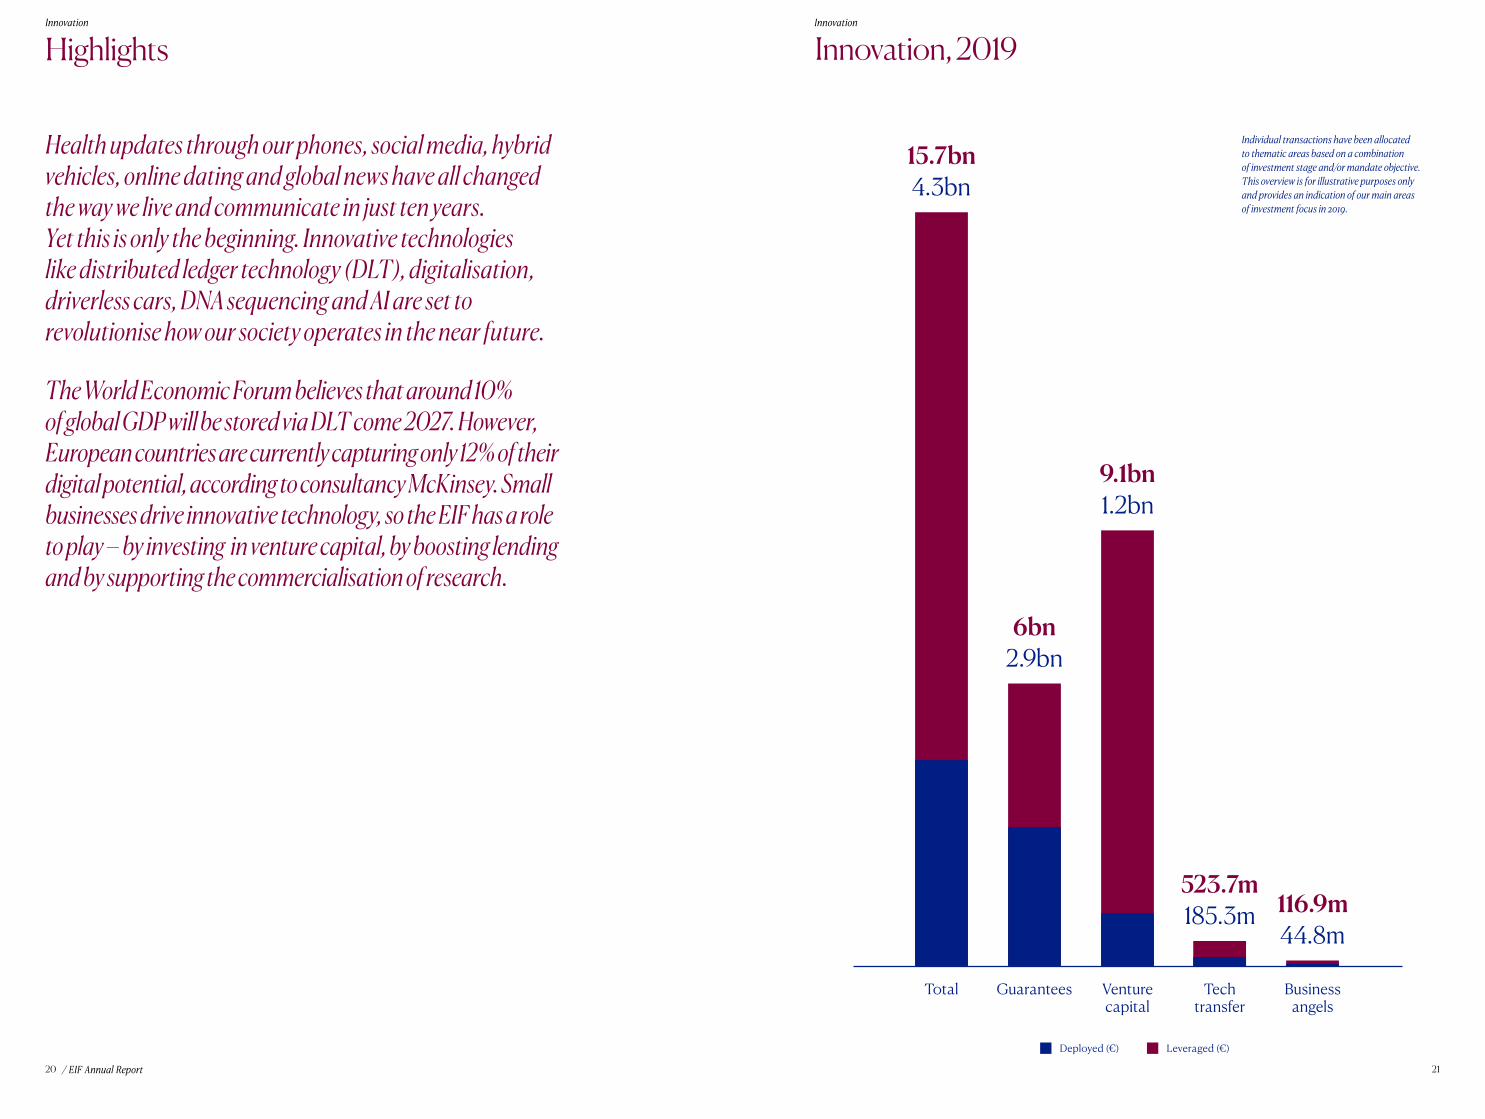
Individual transactions have been allocated to thematic areas based on a combination of investment stage and/or mandate objective. This overview is for illustrative purposes only and provides an indication of our main areas of investment focus in 2019.
58.9bn
15.7bn
36.1bn
1.5bn 2.3bn 3.1bn
10.2bn
4.3bn
4.1bn
272.9m 583.0m 892.2m
Total Innovation Cohesion& Regional
Growth &Competitiveness
Society Agriculture
Deployed (€) Leveraged (€)
12 13
Highlights Highlights
/ EIF Annual Report
What does the EIF do? The EIF designs financial instruments that absorb some of the risk that banks, guarantee institutions, microfinance lenders and funds take when they finance small businesses. This encourages banks to lend, funds to invest and private investment to crowd in, to create a sustainable financing ecosystems for Europe’s SMEs.
Our objectives? We believe in small – Europe’s small businesses. This means working with the EC and other partners to deploy capital in areas that need it, from innovative businesses to farmers. It means identifying underserved areas, whether that be geographical or simply structural, like early-stage businesses. It means knowing our markets so well that one comparatively small commitment in a carefully selected bank or fund can generate millions of extra euros to small businesses.
Who are our stakeholders? The EIF works with many stakeholders - Member States, the EC, a giant network of banks, including national promotional institutions (NPIs), funds and our parent, the EIB. Resources invested by the EIF come from our shareholders, the EIB and the EC, mandates like EFSI, national and regional institutions, other public bodies, private capital and the EIF’s own funds.
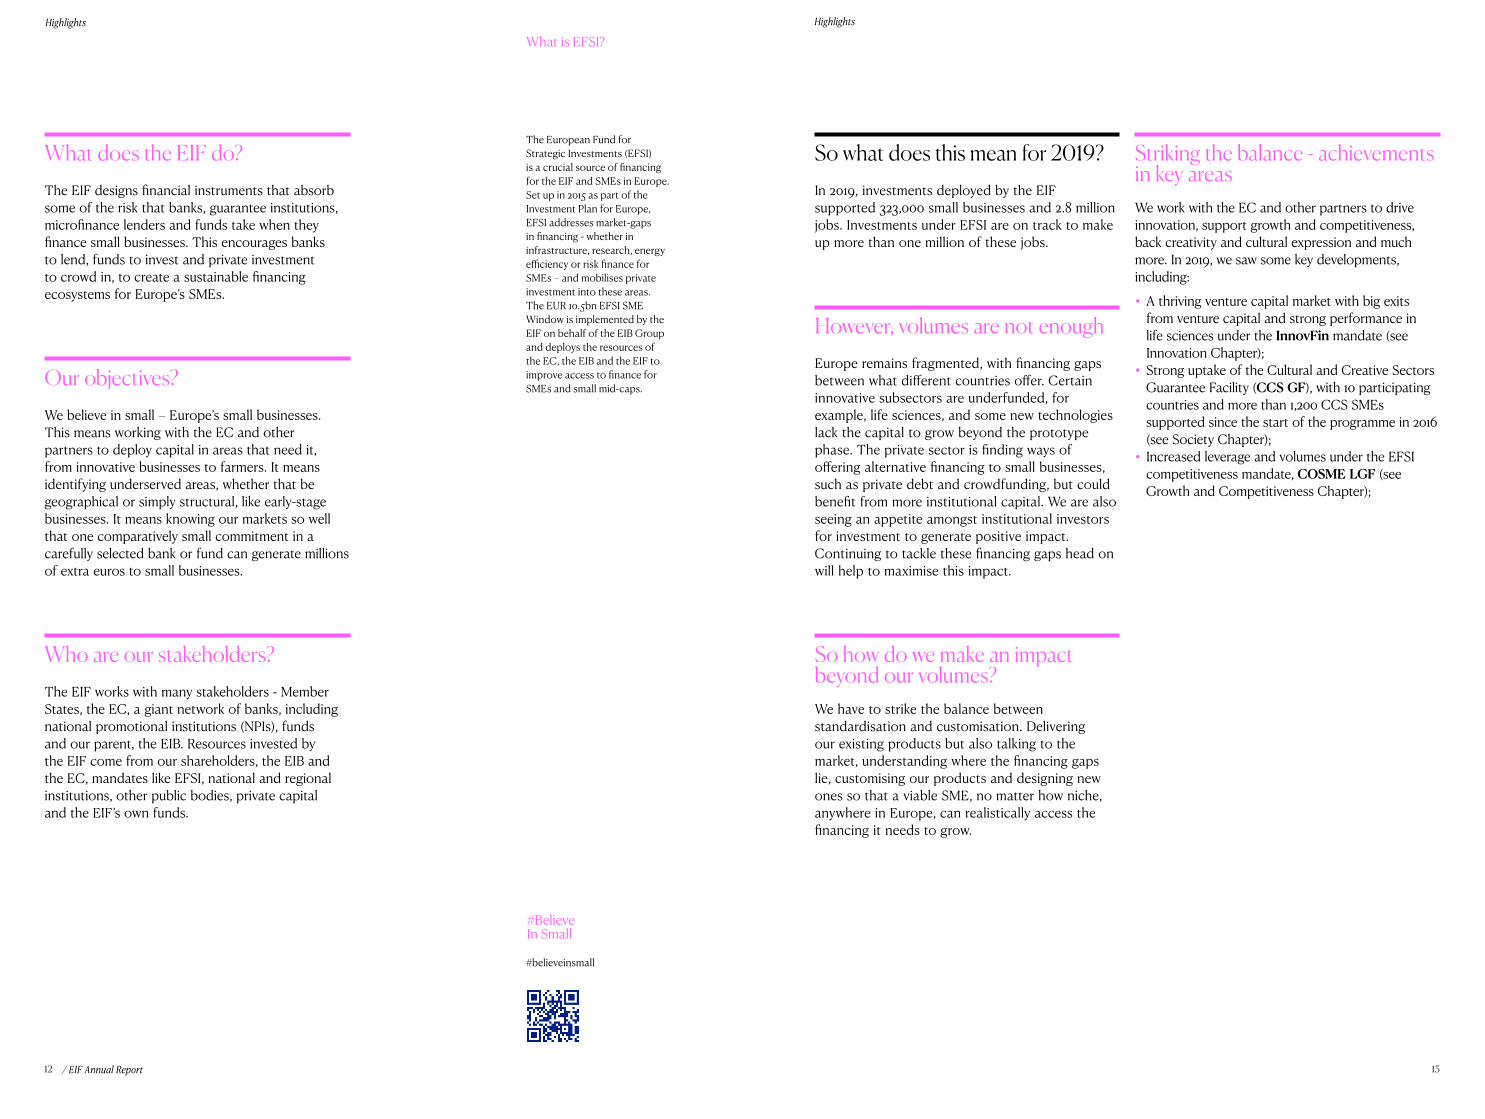
So what does this mean for 2019?In 2019, investments deployed by the EIF supported 323,000 small businesses and 2.8 million jobs. Investments under EFSI are on track to make up more than one million of these jobs.
However, volumes are not enough Europe remains fragmented, with financing gaps between what different countries offer. Certain innovative subsectors are underfunded, for example, life sciences, and some new technologies lack the capital to grow beyond the prototype phase. The private sector is finding ways of offering alternative financing to small businesses, such as private debt and crowdfunding, but could benefit from more institutional capital. We are also seeing an appetite amongst institutional investors for investment to generate positive impact. Continuing to tackle these financing gaps head on will help to maximise this impact.
So how do we make an impact beyond our volumes?We have to strike the balance between standardisation and customisation. Delivering our existing products but also talking to the market, understanding where the financing gaps lie, customising our products and designing new ones so that a viable SME, no matter how niche, anywhere in Europe, can realistically access the financing it needs to grow.
Striking the balance - achievements in key areasWe work with the EC and other partners to drive innovation, support growth and competitiveness, back creativity and cultural expression and much more. In 2019, we saw some key developments, including:
• A thriving venture capital market with big exits from venture capital and strong performance in life sciences under the InnovFin mandate (see Innovation Chapter);
• Strong uptake of the Cultural and Creative Sectors Guarantee Facility (CCS GF), with 10 participating countries and more than 1,200 CCS SMEs supported since the start of the programme in 2016 (see Society Chapter);
• Increased leverage and volumes under the EFSI competitiveness mandate, COSME LGF (see Growth and Competitiveness Chapter);
What is EFSI?
The European Fund for Strategic Investments (EFSI) is a crucial source of financing for the EIF and SMEs in Europe. Set up in 2015 as part of the Investment Plan for Europe, EFSI addresses market-gaps in financing - whether in infrastructure, research, energy efficiency or risk finance for SMEs – and mobilises private investment into these areas. The EUR 10.5bn EFSI SME Window is implemented by the EIF on behalf of the EIB Group and deploys the resources of the EC, the EIB and the EIF to improve access to finance for SMEs and small mid-caps.
#Believe In Small
#believeinsmall
14 15
Highlights Highlights
/ EIF Annual Report
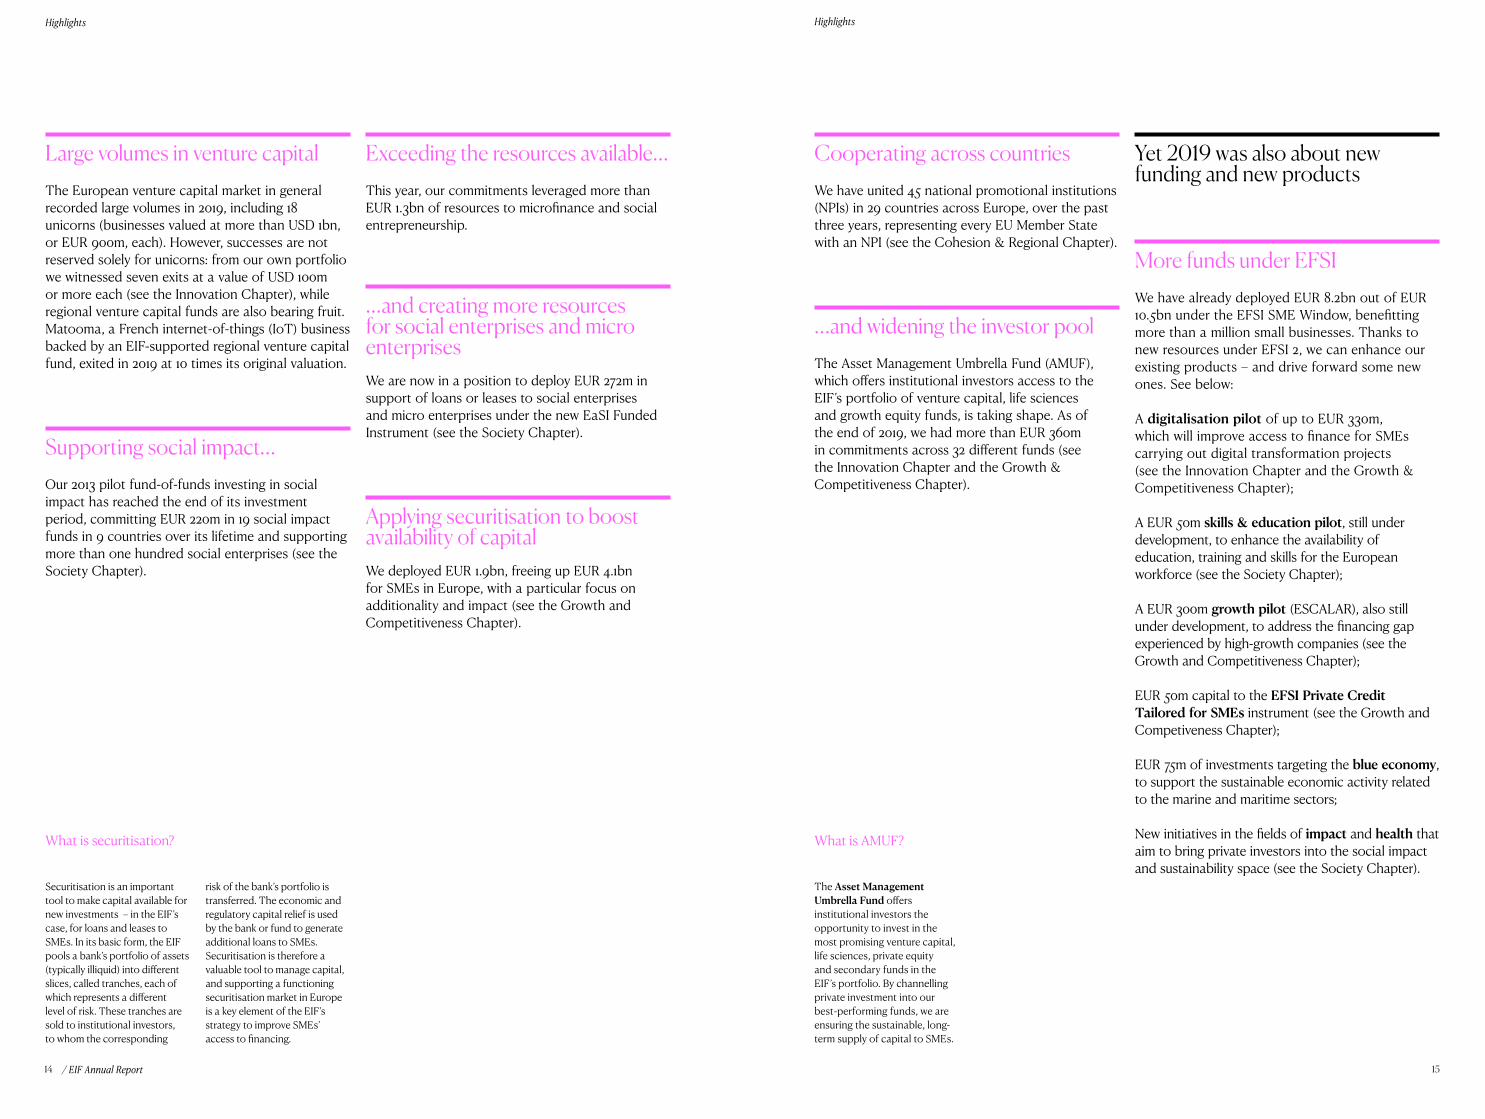
Securitisation is an important tool to make capital available for new investments – in the EIF’s case, for loans and leases to SMEs. In its basic form, the EIF pools a bank’s portfolio of assets (typically illiquid) into different slices, called tranches, each of which represents a different level of risk. These tranches are sold to institutional investors, to whom the corresponding
risk of the bank’s portfolio is transferred. The economic and regulatory capital relief is used by the bank or fund to generate additional loans to SMEs. Securitisation is therefore a valuable tool to manage capital, and supporting a functioning securitisation market in Europe is a key element of the EIF’s strategy to improve SMEs’ access to financing.
What is securitisation?
Large volumes in venture capital The European venture capital market in general recorded large volumes in 2019, including 18 unicorns (businesses valued at more than USD 1bn, or EUR 900m, each). However, successes are not reserved solely for unicorns: from our own portfolio we witnessed seven exits at a value of USD 100m or more each (see the Innovation Chapter), while regional venture capital funds are also bearing fruit. Matooma, a French internet-of-things (IoT) business backed by an EIF-supported regional venture capital fund, exited in 2019 at 10 times its original valuation.
Supporting social impact…Our 2013 pilot fund-of-funds investing in social impact has reached the end of its investment period, committing EUR 220m in 19 social impact funds in 9 countries over its lifetime and supporting more than one hundred social enterprises (see the Society Chapter).
Exceeding the resources available…This year, our commitments leveraged more than EUR 1.3bn of resources to microfinance and social entrepreneurship.
…and creating more resources for social enterprises and micro enterprisesWe are now in a position to deploy EUR 272m in support of loans or leases to social enterprises and micro enterprises under the new EaSI Funded Instrument (see the Society Chapter).
Applying securitisation to boost availability of capitalWe deployed EUR 1.9bn, freeing up EUR 4.1bn for SMEs in Europe, with a particular focus on additionality and impact (see the Growth and Competitiveness Chapter).
Cooperating across countriesWe have united 45 national promotional institutions (NPIs) in 29 countries across Europe, over the past three years, representing every EU Member State with an NPI (see the Cohesion & Regional Chapter).
…and widening the investor poolThe Asset Management Umbrella Fund (AMUF), which offers institutional investors access to the EIF’s portfolio of venture capital, life sciences and growth equity funds, is taking shape. As of the end of 2019, we had more than EUR 360m in commitments across 32 different funds (see the Innovation Chapter and the Growth & Competitiveness Chapter).
Yet 2019 was also about new funding and new products
More funds under EFSIWe have already deployed EUR 8.2bn out of EUR 10.5bn under the EFSI SME Window, benefitting more than a million small businesses. Thanks to new resources under EFSI 2, we can enhance our existing products – and drive forward some new ones. See below:
A digitalisation pilot of up to EUR 330m, which will improve access to finance for SMEs carrying out digital transformation projects (see the Innovation Chapter and the Growth & Competitiveness Chapter);
A EUR 50m skills & education pilot, still under development, to enhance the availability of education, training and skills for the European workforce (see the Society Chapter);
A EUR 300m growth pilot (ESCALAR), also still under development, to address the financing gap experienced by high-growth companies (see the Growth and Competitiveness Chapter);
EUR 50m capital to the EFSI Private Credit Tailored for SMEs instrument (see the Growth and Competiveness Chapter);
EUR 75m of investments targeting the blue economy, to support the sustainable economic activity related to the marine and maritime sectors;
New initiatives in the fields of impact and health that aim to bring private investors into the social impact and sustainability space (see the Society Chapter).
What is AMUF?
The Asset Management Umbrella Fund offers institutional investors the opportunity to invest in the most promising venture capital, life sciences, private equity and secondary funds in the EIF’s portfolio. By channelling private investment into our best-performing funds, we are ensuring the sustainable, long-term supply of capital to SMEs.
16 17
Highlights Highlights
/ EIF Annual Report
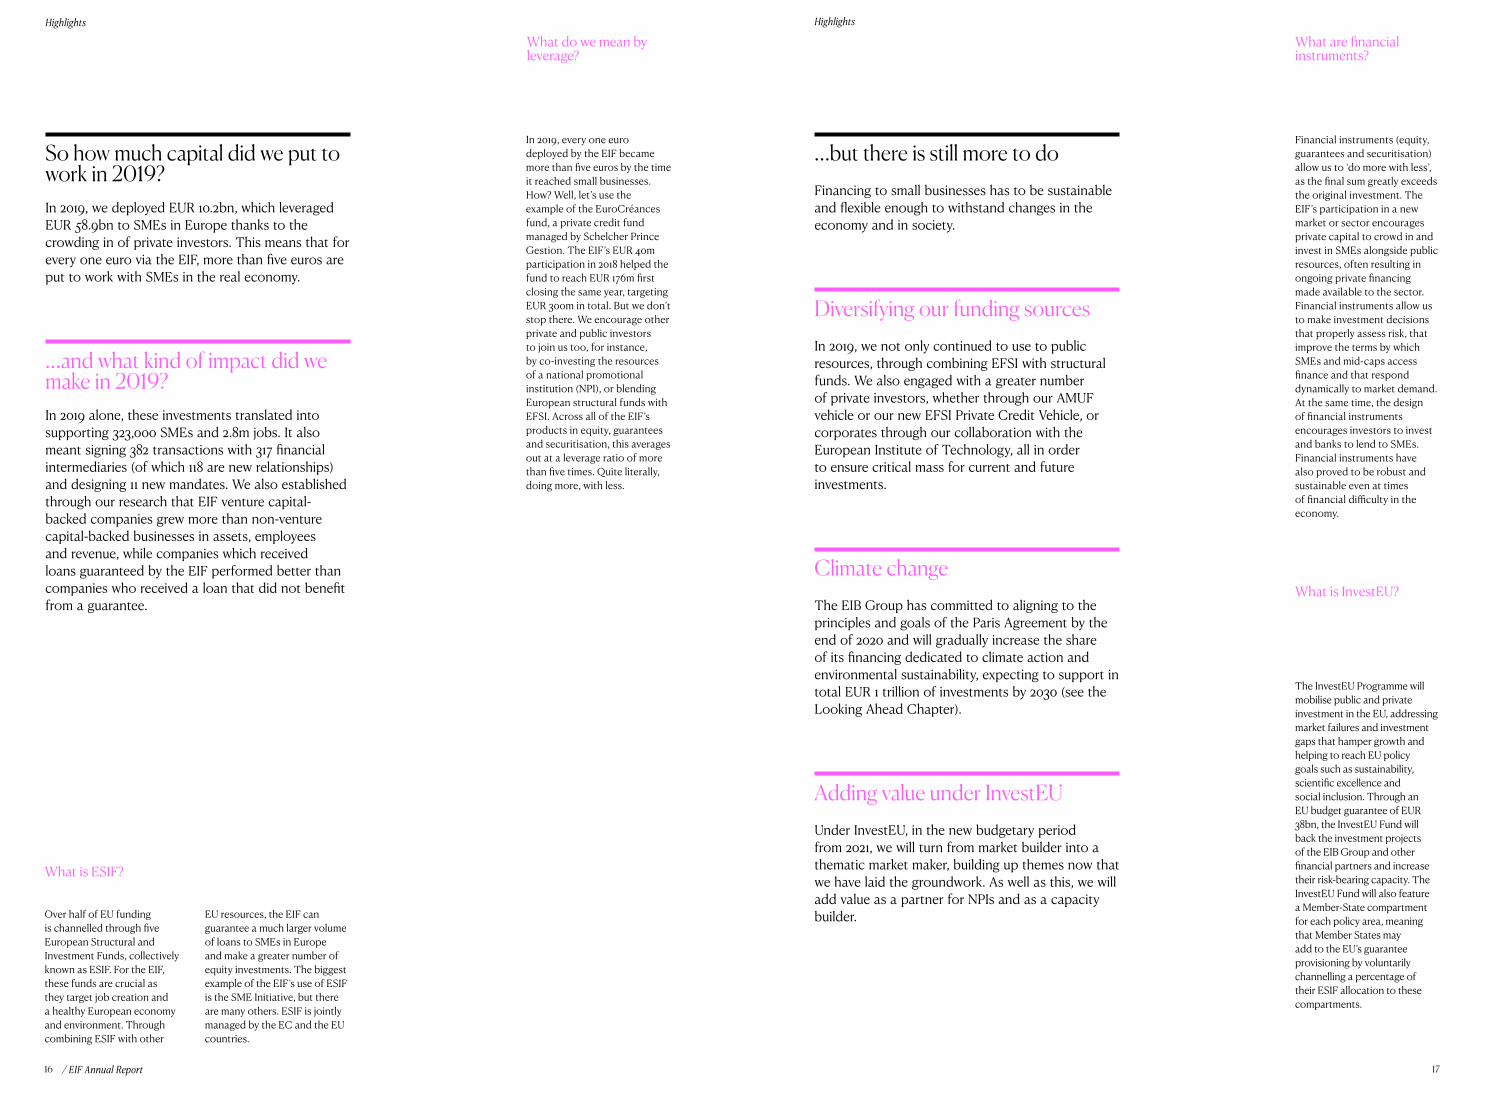
…but there is still more to doFinancing to small businesses has to be sustainable and flexible enough to withstand changes in the economy and in society.
Diversifying our funding sourcesIn 2019, we not only continued to use to public resources, through combining EFSI with structural funds. We also engaged with a greater number of private investors, whether through our AMUF vehicle or our new EFSI Private Credit Vehicle, or corporates through our collaboration with the European Institute of Technology, all in order to ensure critical mass for current and future investments.
Climate changeThe EIB Group has committed to aligning to the principles and goals of the Paris Agreement by the end of 2020 and will gradually increase the share of its financing dedicated to climate action and environmental sustainability, expecting to support in total EUR 1 trillion of investments by 2030 (see the Looking Ahead Chapter).
Adding value under InvestEUUnder InvestEU, in the new budgetary period from 2021, we will turn from market builder into a thematic market maker, building up themes now that we have laid the groundwork. As well as this, we will add value as a partner for NPIs and as a capacity builder.Over half of EU funding
is channelled through five European Structural and Investment Funds, collectively known as ESIF. For the EIF, these funds are crucial as they target job creation and a healthy European economy and environment. Through combining ESIF with other
What is ESIF?
EU resources, the EIF can guarantee a much larger volume of loans to SMEs in Europe and make a greater number of equity investments. The biggest example of the EIF’s use of ESIF is the SME Initiative, but there are many others. ESIF is jointly managed by the EC and the EU countries.
So how much capital did we put to work in 2019?In 2019, we deployed EUR 10.2bn, which leveraged EUR 58.9bn to SMEs in Europe thanks to the crowding in of private investors. This means that for every one euro via the EIF, more than five euros are put to work with SMEs in the real economy.
…and what kind of impact did we make in 2019?In 2019 alone, these investments translated into supporting 323,000 SMEs and 2.8m jobs. It also meant signing 382 transactions with 317 financial intermediaries (of which 118 are new relationships) and designing 11 new mandates. We also established through our research that EIF venture capital-backed companies grew more than non-venture capital-backed businesses in assets, employees and revenue, while companies which received loans guaranteed by the EIF performed better than companies who received a loan that did not benefit from a guarantee.
What do we mean by leverage?
In 2019, every one euro deployed by the EIF became more than five euros by the time it reached small businesses. How? Well, let’s use the example of the EuroCréances fund, a private credit fund managed by Schelcher Prince Gestion. The EIF’s EUR 40m participation in 2018 helped the fund to reach EUR 176m first closing the same year, targeting EUR 300m in total. But we don’t stop there. We encourage other private and public investors to join us too, for instance, by co-investing the resources of a national promotional institution (NPI), or blending European structural funds with EFSI. Across all of the EIF’s products in equity, guarantees and securitisation, this averages out at a leverage ratio of more than five times. Quite literally, doing more, with less.
Financial instruments (equity, guarantees and securitisation) allow us to ‘do more with less’, as the final sum greatly exceeds the original investment. The EIF’s participation in a new market or sector encourages private capital to crowd in and invest in SMEs alongside public resources, often resulting in ongoing private financing made available to the sector. Financial instruments allow us to make investment decisions that properly assess risk, that improve the terms by which SMEs and mid-caps access finance and that respond dynamically to market demand. At the same time, the design of financial instruments encourages investors to invest and banks to lend to SMEs. Financial instruments have also proved to be robust and sustainable even at times of financial difficulty in the economy.
What is InvestEU?
The InvestEU Programme will mobilise public and private investment in the EU, addressing market failures and investment gaps that hamper growth and helping to reach EU policy goals such as sustainability, scientific excellence and social inclusion. Through an EU budget guarantee of EUR 38bn, the InvestEU Fund will back the investment projects of the EIB Group and other financial partners and increase their risk-bearing capacity. The InvestEU Fund will also feature a Member-State compartment for each policy area, meaning that Member States may add to the EU’s guarantee provisioning by voluntarily channelling a percentage of their ESIF allocation to these compartments.
What are financial instruments?

/ EIF Annual Report 1918
Innovation
Innovation Innovation
/ EIF Annual Report 2120
Health updates through our phones, social media, hybrid vehicles, online dating and global news have all changed the way we live and communicate in just ten years. Yet this is only the beginning. Innovative technologies like distributed ledger technology (DLT), digitalisation, driverless cars, DNA sequencing and AI are set to revolutionise how our society operates in the near future.
The World Economic Forum believes that around 10% of global GDP will be stored via DLT come 2027. However, European countries are currently capturing only 12% of their digital potential, according to consultancy McKinsey. Small businesses drive innovative technology, so the EIF has a role to play – by investing in venture capital, by boosting lending and by supporting the commercialisation of research.
Highlights Innovation, 2019
Individual transactions have been allocated to thematic areas based on a combination of investment stage and/or mandate objective. This overview is for illustrative purposes only and provides an indication of our main areas of investment focus in 2019.
Total
4.3bn15.7bn
Guarantees
2.9bn6bn
Venturecapital
1.2bn9.1bn
185.3m
Techtransfer
523.7m
Businessangels
44.8m116.9m
Deployed (€) Leveraged (€)
Innovation Innovation
/ EIF Annual Report 2322
Boosting lending to innovation in 2019Highly innovative start-ups are often perceived as high-risk. Their intellectual property, limited track record and innovative potential cannot provide the security or collateral against which most banks lend. If they are at a very early stage, they may be unable to demonstrate steady earnings. However, it is these small businesses that are often developing nascent, game-changing technologies. Not just in terms of innovation, but also in terms of economic growth, employment, attracting the best minds and boosting productivity. That’s why the EIF works with banks and other financial institutions across Europe and Horizon 2020-associated countries to guarantee a portion of their debt portfolios on the condition that they provide more financing to innovative small businesses.
Impact across Europe and beyondSMEs in 40 countries have benefitted from better financing since 2014 thanks to InnovFin SMEG. This includes SMEs both in Europe (27 Member States) and in Horizon 2020-associated countries like Georgia, Israel, Tunisia and Armenia.
Supporting business in digitalisationEurope remains behind the US in terms of digitalisation. According to EIF research, the uptake of digital solutions by businesses also remains uneven between Member States and between large companies and SMEs. Therefore, we will provide guarantees that boost lending to small businesses planning on a digital transformation. In fact, the Digitalisation Initiative for SMEs and small mid-caps is expected to release up to EUR 7.9bn to digitalisation projects in Europe. See ‘What is the Digitalisation Initiative for SMEs and small mid-caps?’
Aside from digitalisation, InnovFin SMEG also supports SMEs in manufacturing, trade, ICT and scientific and technical activities.
Continuing coverage across the CEE and beyondAccessing financing as an innovative business is tough, because banks look for collateral in order to extend a loan. We have increased the guarantee available to banks in Central and Eastern Europe (CEE), with two significant umbrella transactions guaranteeing up to EUR 250m to UniCredit CEE, leveraging 500m and guaranteeing up to EUR 400m to ProCredit, which leverages EUR 800m to innovative SMEs across 15 CEE countries.
In 2019, we also extended a EUR 60m guarantee to Banque de l’Habitat in order to support SMEs and small mid-caps in Tunisia.
….and guarantees for alternative lendersInnovative SMEs have diverse needs. In 2019, we continued to provide guarantees to alternative lenders able to offer bespoke solutions, loans and bonds, or even capital from crowdfunding platforms. These include Sweden’s DBT Capital and Proventus (up to EUR 38.5m and EUR 37.5m guarantee, respectively), who design tailor-made financing solutions for SMEs and a EUR 15m guarantee for crowdfunder October Factory in France. The EIF’s guarantees will leverage extra financing to SMEs at double the guaranteed amounts.
What is the Digitalisation Initiative for SMEs and small mid-caps?
Digitalisation is a driver of competitiveness, but limited access to finance constrains SMEs and small mid-caps from digitalising their businesses.
What is InnovFin?
Simply put – the largest EU initiative to finance innovation for SMEs and small mid-caps in Europe. The EIF deploys capital under InnovFin in two ways; through providing guarantees to financial institutions that will provide loans to innovative companies (InnovFin SME Guarantee, or InnovFin SMEG), or through making equity investments to funds focusing on innovative companies in their pre-seed, seed and start-up phases (InnovFin Equity). Both InnovFin SMEG and InnovFin Equity are part of the EFSI SME Window and are a joint EIB Group and EC initiative resourced under Horizon 2020, the EU research programme for 2014-2020.
How else do we finance innovative businesses?
As well as InnovFin, we use equity resources from EFSI (known as EFSI Sub-Windows), equity resources from national promotional institutions and Member States throughout the EU (see the Cohesion & Regional Chapter), equity from private investors (see AMUF), resources from the EIB through the RCR mandate and our own financial resources to channel investment into funds that support innovative SMEs.
By enhancing access to finance to SMEs and small mid-caps for their digital transformation, all sectors of the economy - including traditional sectors - will benefit. The inclusion of the Digitalisation Pilot under the EU flagship facilities COSME LGF and InnovFin SMEG will
enable deployment through programmes that are already successfully delivered to the market and will offer targeted support to digitalisation via new or existing financial intermediaries. This initiative is supported by EFSI through a contribution of up to EUR
330m and is expected to release up to EUR 4bn of financing for digitalisation. It is also part of the Digital Single Market strategy, which aims to open up digital opportunities for people and businesses and enhance Europe’s position as a world leader in the digital economy.
Did you know?
Since 2014, the EIF has supported over 20,000 innovative SMEs through guaranteeing over EUR 25.5bn loans and leases under the InnovFin SME Guarantee (InnovFin SMEG), aiding the creation of over 845,000 jobs.
What is the RCR Mandate?
The Risk Capital Resources mandate, or RCR, is a mandate managed by the EIF on behalf of the EIB. It focuses on equity activity, such as early stage (venture capital and technology transfer) investments, growth and lower mid-market activities.

Innovation Innovation
/ EIF Annual Report 2524
Bolstering equity investments in 2019An equity investment and a little expertise can transform a good idea into a successful business. Business angels, venture capital investors and technology transfer (TT) funds focus on the earliest stage of a business’ life, often on products at the cutting edge of science or technology. However, capital alone is not enough. Funding game-changing innovation requires specialist investors who can combine financial expertise with scientific knowledge. These investors help entrepreneurs to position their product, develop their strategy and to grow and evolve with their business model. Although the markets in European venture capital are maturing, there remains more to be done. In fact, 16 countries were still below the European average percentage of venture capital as a share of GDP in 2018. Certain new technologies, for example, blockchain and space, need funding to compete in a globalised economy, while others, such as personalised immunotherapy, need funding in order to treat major diseases like cancer.
Innovation is no longer the privilege of a few hubs in Western Europe. Together, we can build a financing infrastructure that reaches underfunded geographies, making sure that innovative businesses everywhere can access equity financing.
Attracting investors to European venture capitalCrowding in private investors is essential to a thriving venture capital market. Thanks to years of cornerstone investments from the EIF, this market has grown. As of June 2019, the EIF was invested in over 750 funds and 8,800 portfolio companies across all of its venture capital and its private equity activity in Europe. Venture capital in Europe has caught up with the world, delivering attractive returns to investors since more than a decade now, while fundraising momentum has picked up, attracting capital from around the globe.
Bigger exitsIn 2019, venture capital funds backed by the EIF generated bigger company exits than ever before. These included unicorns and dragons (companies with an exit big enough to return an entire fund’s capital to its investors).
• Unicorn UiPath, a robotic process automation company,
originally supported by a number of EIF-backed venture capital funds, raised EUR 500m of funding at a EUR 7bn valuation. The company employs 3000 people, a quarter of which based in Romania.
Bjorn Tremmerie on what’s next for European venture capital
Hein Kruyt – SolyntaWageningen, Netherlands. Breeding the ultimate potato.
Financing purpose: commercialisation, product development.EIF financing: InnovFin
“We are convinced that the commercialisation will bring lots of benefits to consumers and farmers across the world, through the availability of highly nutritious potatoes, especially in regions suffering from severe malnutrition, and much lower use of pesticides. It will be better for the planet, the wallet and for health.”
Innovation Innovation
/ EIF Annual Report 2726
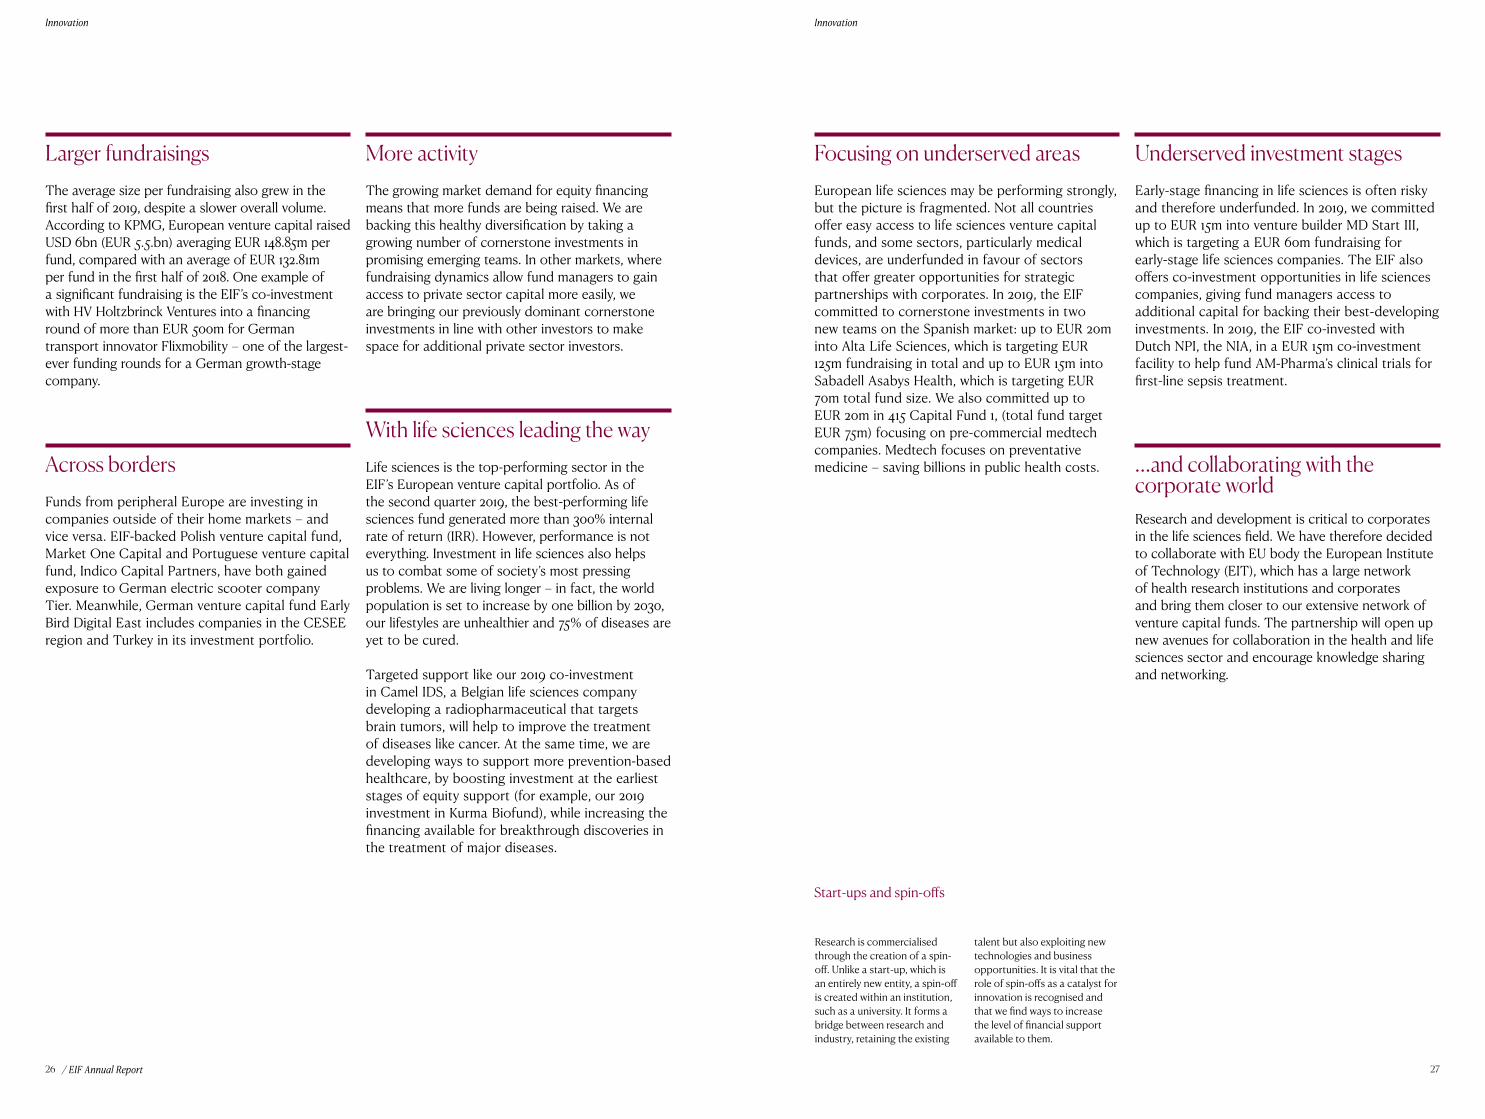
Larger fundraisingsThe average size per fundraising also grew in the first half of 2019, despite a slower overall volume. According to KPMG, European venture capital raised USD 6bn (EUR 5.5.bn) averaging EUR 148.85m per fund, compared with an average of EUR 132.81m per fund in the first half of 2018. One example of a significant fundraising is the EIF’s co-investment with HV Holtzbrinck Ventures into a financing round of more than EUR 500m for German transport innovator Flixmobility – one of the largest-ever funding rounds for a German growth-stage company.
Across bordersFunds from peripheral Europe are investing in companies outside of their home markets – and vice versa. EIF-backed Polish venture capital fund, Market One Capital and Portuguese venture capital fund, Indico Capital Partners, have both gained exposure to German electric scooter company Tier. Meanwhile, German venture capital fund Early Bird Digital East includes companies in the CESEE region and Turkey in its investment portfolio.
More activityThe growing market demand for equity financing means that more funds are being raised. We are backing this healthy diversification by taking a growing number of cornerstone investments in promising emerging teams. In other markets, where fundraising dynamics allow fund managers to gain access to private sector capital more easily, we are bringing our previously dominant cornerstone investments in line with other investors to make space for additional private sector investors.
With life sciences leading the wayLife sciences is the top-performing sector in the EIF’s European venture capital portfolio. As of the second quarter 2019, the best-performing life sciences fund generated more than 300% internal rate of return (IRR). However, performance is not everything. Investment in life sciences also helps us to combat some of society’s most pressing problems. We are living longer – in fact, the world population is set to increase by one billion by 2030, our lifestyles are unhealthier and 75% of diseases are yet to be cured. Targeted support like our 2019 co-investment in Camel IDS, a Belgian life sciences company developing a radiopharmaceutical that targets brain tumors, will help to improve the treatment of diseases like cancer. At the same time, we are developing ways to support more prevention-based healthcare, by boosting investment at the earliest stages of equity support (for example, our 2019 investment in Kurma Biofund), while increasing the financing available for breakthrough discoveries in the treatment of major diseases.
Focusing on underserved areasEuropean life sciences may be performing strongly, but the picture is fragmented. Not all countries offer easy access to life sciences venture capital funds, and some sectors, particularly medical devices, are underfunded in favour of sectors that offer greater opportunities for strategic partnerships with corporates. In 2019, the EIF committed to cornerstone investments in two new teams on the Spanish market: up to EUR 20m into Alta Life Sciences, which is targeting EUR 125m fundraising in total and up to EUR 15m into Sabadell Asabys Health, which is targeting EUR 70m total fund size. We also committed up to EUR 20m in 415 Capital Fund 1, (total fund target EUR 75m) focusing on pre-commercial medtech companies. Medtech focuses on preventative medicine – saving billions in public health costs.
Underserved investment stagesEarly-stage financing in life sciences is often risky and therefore underfunded. In 2019, we committed up to EUR 15m into venture builder MD Start III, which is targeting a EUR 60m fundraising for early-stage life sciences companies. The EIF also offers co-investment opportunities in life sciences companies, giving fund managers access to additional capital for backing their best-developing investments. In 2019, the EIF co-invested with Dutch NPI, the NIA, in a EUR 15m co-investment facility to help fund AM-Pharma’s clinical trials for first-line sepsis treatment.
…and collaborating with the corporate worldResearch and development is critical to corporates in the life sciences field. We have therefore decided to collaborate with EU body the European Institute of Technology (EIT), which has a large network of health research institutions and corporates and bring them closer to our extensive network of venture capital funds. The partnership will open up new avenues for collaboration in the health and life sciences sector and encourage knowledge sharing and networking.
Start-ups and spin-offs
Research is commercialised through the creation of a spin-off. Unlike a start-up, which is an entirely new entity, a spin-off is created within an institution, such as a university. It forms a bridge between research and industry, retaining the existing
talent but also exploiting new technologies and business opportunities. It is vital that the role of spin-offs as a catalyst for innovation is recognised and that we find ways to increase the level of financial support available to them.

Innovation Innovation
/ EIF Annual Report 2928
Innovation
Technology transfer demand outpaces supplyThe earliest-stage start-ups are the most risky and therefore in greatest need of funding. Technology transfer funds commercialise promising research, allowing it to make that crucial step from the prototype world into the commercial space. In 2019, we made our first commitment into a Finnish technology transfer fund – up to EUR 20m into Voima Ventures, which is targeting a EUR 40m close. Our existing ITAtech programme in Italy was also fully invested after just two and a half years, a full eighteen months ahead of the initial end of its investment period.
What is technology transfer?
Technology Transfer (TT) funds commercialise promising research, allowing it to make that crucial step from the prototype world into the commercial space. The EIF supports TT funds in Europe by using EU resources to take cornerstone investments in new funds. In total, we have invested in 53 funds, which in turn support hundreds of innovations in their journey to commercial use.
Who do we work with in Tech Transfer?
Our beneficiary and partner institutions in TT currently include Fraunhofer, Trinity col-lege, University College Dublin, Centre National de la Recherche Scientifique, Polimi, KULeuven, University College London, TNO, TU Delft, Universitat Politecnica de Valencia, VIB and SINTEF. In 2019, we committed EUR 185m to TT investments, bringing the business world and the research world closer together.
TT fund managers spill their secrets
TT explained
“We’ve been through a lot, from changing countries to working day in and day out from our living room…We believe in our team a lot. Things take their time, but nothing can crack us. We can change direction, we can adapt and we can find solutions to keep moving forward.”
Zsuzsa Kecsmart – AntavoSzeged, Hungary. Building loyalty schemes for fashion & retail.
Financing purpose: developing sales & marketing.EIF financing: InnovFin
Innovation Innovation
/ EIF Annual Report 3130
…but we are constantly focusing on new technologies and sectorsInnovation drives the changes necessary to help us secure a sustainable future. We need to tackle climate change, we need to use our resources more consciously, and we need to develop alternatives to the linear growth model for our economy. These changes require innovative approaches underpinned by AI, space technology, deep tech and the circular economy, to name only a few. Given the right support, these technologies may very well bring us to the brink of one of the biggest innovative periods in history. Here are a number of areas we focused on in 2019:
Successful entrepreneurs with money to invest (business angels) are often on the lookout for new businesses to support. The European Angels Fund (EAF) co-invests alongside business angels, uniting the angel’s unique expertise with the EIF’s experience and network, reducing risk for the angel, but maximising the capital that reaches the entrepreneur. Each business angel is granted the maximum degree of freedom to operate under the EAF, which supports the individual’s investment style while still providing significant financial support. The EAF is advised by the EIF and is financed under InnovFin and RCR.
What are business angels?
• Impact for the climate and environment
We already hold eight investments in cleantech funds, but in 2019, we made the first commitment into a cleantech fund whose financial incentives are subject to achieving environmental targets set for each portfolio company. SET Fund III targets companies active in the smart energy value chain and is fundraising EUR 75m. In January 2019, we increased our commitment to SET to EUR 25m.
• First investment into space
We have also made our first commitment into a space-focused fund. Primomiglio Space is a technology transfer fund investing in proof-of-concept space-related technologies in Italy, Europe, the US and Israel. The EIF’s EUR 30m investment in Primomiglio Space is a step towards the fund’s target size of EUR 80m and part of a planned EUR 100m of investments and co-investments in funds and companies active in upstream and downstream space technologies.
• Investments into AI and blockchain
With the EC, we are launching a dedicated investment scheme that will make EUR 100m available to venture capital funds or other investors that support AI and blockchain-based products and services. We expect a total of EUR 300m to be generated for AI and blockchain from other private investors crowding in. The scheme, which comes under the InnovFin Equity product, will also allow co-investments with national promotional banks, which will increase the capital even further. The process will start from 2020.
…while business angels gather strengthAngel investors are a key component in the equity financing mix, not only investing, but also mentoring entrepreneurs throughout their business lifecycle. Business angels actively shape the strategy and direction of a company, work closely with the team and can alert entrepreneurs to the common pitfalls and mistakes. We co-invested with 14 new business angels in 2019, bringing the EIF’s total portfolio to 118 business angels by the end of the year.
…with deeper connectionsKnowledge exchange between business angels is important. We added 152 companies to our digital networking platform for business angels in 2019, totalling 633. We launched a business angel survey, which shows the EIF’s added value to be useful in this segment and held the ConnectAngels event, uniting 54 business angels from 10 countries.
…in new regions and countriesWe launched the first compartment focusing on a region – Flanders, Belgium. We also signed the first business angel under the new Italian compartment of the European Angels Fund. In the future, we hope to consolidate the pan-European platform for business angels, as well as increasing angels’ interaction with one another and as part of an important investment community.

/ EIF Annual Report 3332
Growth & Competitiveness
Growth & Competitiveness Growth & Competitiveness
/ EIF Annual Report 3534
Highlights
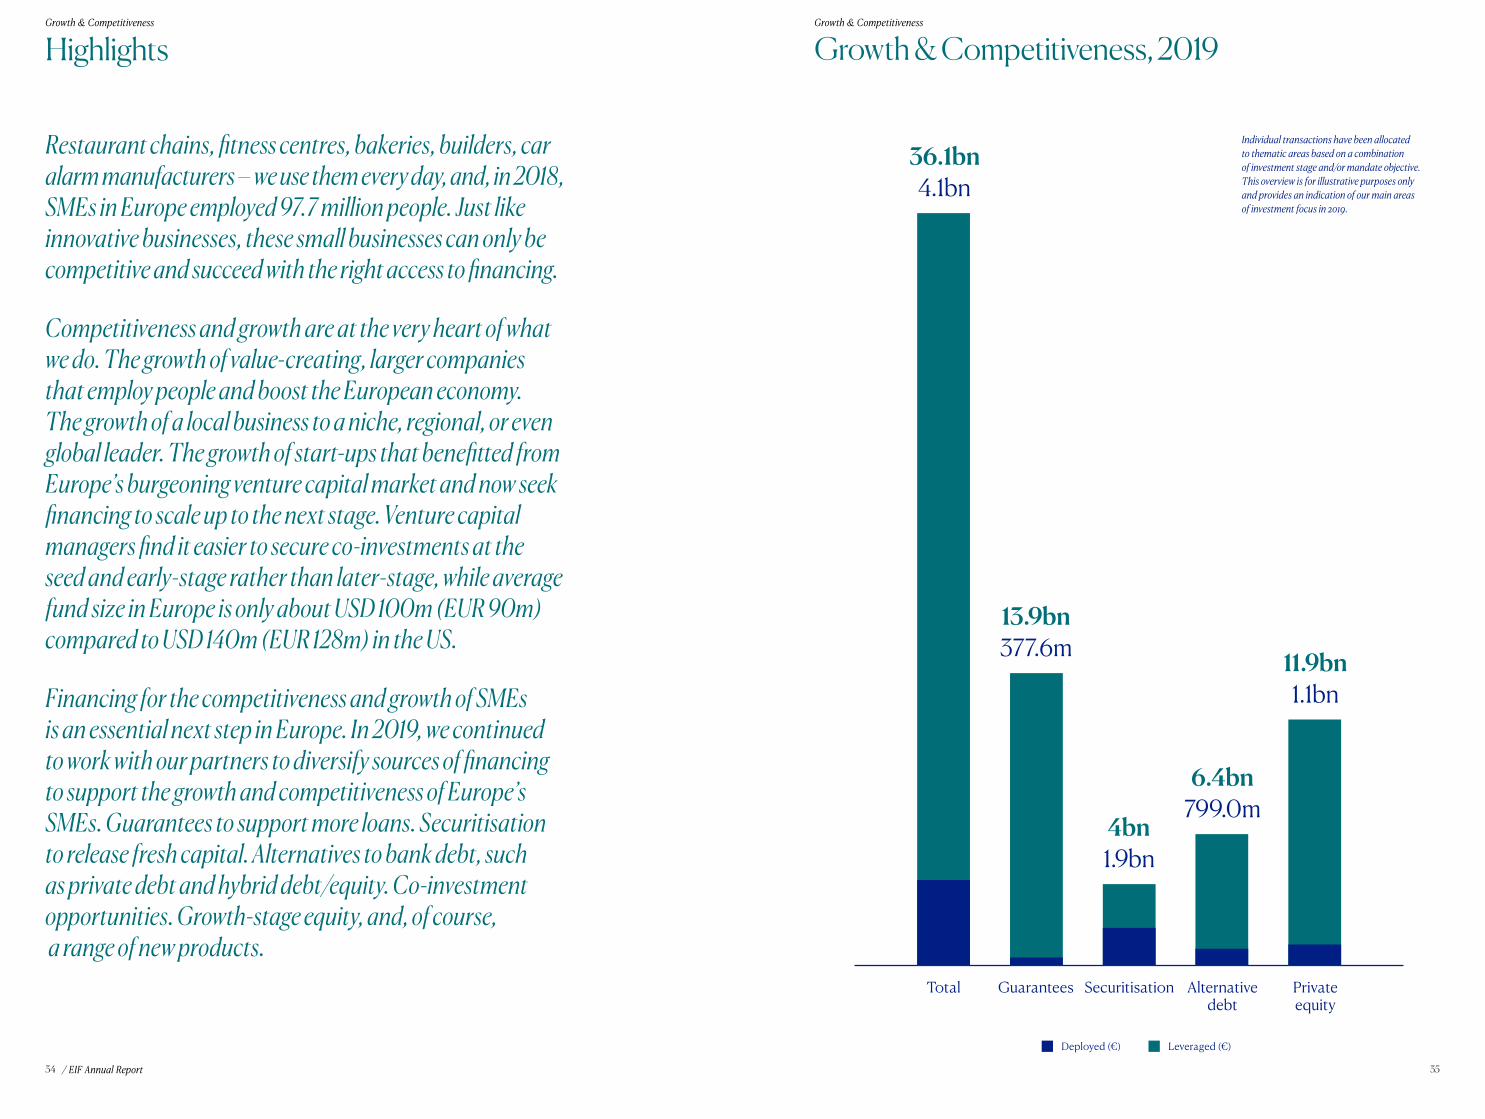
Restaurant chains, fitness centres, bakeries, builders, car alarm manufacturers – we use them every day, and, in 2018, SMEs in Europe employed 97.7 million people. Just like innovative businesses, these small businesses can only be competitive and succeed with the right access to financing.
Competitiveness and growth are at the very heart of what we do. The growth of value-creating, larger companies that employ people and boost the European economy. The growth of a local business to a niche, regional, or even global leader. The growth of start-ups that benefitted from Europe’s burgeoning venture capital market and now seek financing to scale up to the next stage. Venture capital managers find it easier to secure co-investments at the seed and early-stage rather than later-stage, while average fund size in Europe is only about USD 100m (EUR 90m) compared to USD 140m (EUR 128m) in the US.
Financing for the competitiveness and growth of SMEs is an essential next step in Europe. In 2019, we continued to work with our partners to diversify sources of financing to support the growth and competitiveness of Europe’s SMEs. Guarantees to support more loans. Securitisation to release fresh capital. Alternatives to bank debt, such as private debt and hybrid debt/equity. Co-investment opportunities. Growth-stage equity, and, of course, a range of new products.
Growth & Competitiveness, 2019
Individual transactions have been allocated to thematic areas based on a combination of investment stage and/or mandate objective. This overview is for illustrative purposes only and provides an indication of our main areas of investment focus in 2019.
377.6m
Guarantees
13.9bn
Total
36.1bn4.1bn
Securitisation
4bn1.9bn
Alternative debt
6.4bn799.0m
Privateequity
11.9bn1.1bn
Deployed (€) Leveraged (€)
Growth & Competitiveness Growth & Competitiveness
/ EIF Annual Report 3736
Increasing loans to Europe’s small businesses through guaranteesBoosting the volume of bank debt available to small businesses is one of the most important steps in helping them to grow. In fact, the EIF guarantee on loan portfolios for small businesses (COSME LGF) is the EIF’s best-leveraged product, with one euro guaranteed by the EIF generating 31 euros of SME financing on average. However ensuring the penetration of the guarantee into different geographies in Europe is essential. As is anticipating new challenges for businesses and ensuring the guarantee targets these areas.
Covering everything from water supply to transportationFrom sewage management to production of consumer electronics, small businesses are active in hundreds of sectors. That is why we cover so many areas; health work, administrative and support services, professional services, scientific and technical sectors, agriculture, forestry, fishing, storage, accommodation, food, construction, manufacturing, wholesale and retail trade. We have also supported close to 2.5 million jobs (as of the end of September 2019) since 2014.
Smashing targets to help more SMEs in EuropeOriginally, the COSME guarantee hoped to support between 220,000-330,000 SMEs. However, thanks to EFSI resources, we have been able to support almost double this number - more than 510,000 SMEs. In addition, we have gone beyond our volume targets – originally EUR 14.3-21.5bn, but now leveraging EUR 50bn to SMEs.
Increasing our presenceBy the end of 2019, the COSME guarantee was present in 33 countries, ensuring that SMEs across Europe can access debt financing on attractive terms.
What is COSME?
This is the EIF’s biggest mandate in terms of the number of SMEs financed and the EU’s programme to promote competitiveness. Under COSME, the EIF is responsible for guaranteeing loans (COSME Loan Guarantee Facility, or LGF) and for making equity investments (COSME Equity Facility for Growth, or EFG).
The programme addresses the financing needs of SMEs that are perceived as risky, due to their start-up nature, their business model or their lack of collateral. Set up in 2014 by the EC, COSME LGF is a high-impact mandate implemented by the EIF. Since 2014, the EIF has committed EUR 1.6bn under COSME LGF, thanks to the
additional capacity received from the EFSI SME Window on top of the COSME programme contribution.
“We don’t make soaps, we make gifts. All our products represent elements of our culture and that’s something we’re very proud of.”
Marta Araújo – CastelbelPorto, Portugal. Traditional cosmetics & lifestyle products.
Financing purpose: growth capital.EIF financing: PVCi
Growth & Competitiveness Growth & Competitiveness
/ EIF Annual Report 3938
First-time transactions in Kosovo and Finland In 2019, the EIF guaranteed up to EUR 22.5m of a maximum EUR 45m loan portfolio to Kosovan SMEs. The guarantee, with Kosovan guarantee institution KCGF, intends to provide financing for up to 2,250 higher-risk SMEs.
The EIF also guaranteed up to EUR 75m of a maximum EUR 150m loan portfolio to Finnish SMEs. Finnish national financial institution Finnvera expects to make 3,900 transactions off the back of the guarantee.
Greater volumes at our disposalWe made EUR 385m of guarantees under COSME LGF in 2019 and a cumulative 132 guarantees since inception. This is set to increase with an extra EUR 230m planned under EFSI 2.0 for guarantees. With guarantees under COSME, a little really does go a long way.
Including new volumes for digitalisation…Together with financing from InnovFin, COSME will contribute to a guarantee for loans to digitalisation projects (see What is the Digitalisation Initiative for SMEs and small mid-caps?).
Increasing financing through securitisationAnother way to release bank capital to Europe’s SMEs is through securitisation. Synthetic securitisation, responsibly applied, can help diversify an institution’s funding sources as well as release regulatory capital, playing an essential role in improving the quantity and cost of bank loans to small businesses in Europe. The EIF is active in securitisation for the purposes of improving financing for SMEs and has spearheaded an increase in significant risk transfer (SRT) trades in Europe. In 2019, we also connected our securitisation to environmental, social and governance-compliant (ESG) loans.
The seven myths of synthetic securitisation
Securitisation with extra impact• Gender equality
We have participated in the securitisation of a portfolio of around PLN 2.1bn of leases with Poland’s EFL Leasing. The transaction is expected to release around 39,000 leases on fixed assets, movables and real estate for clients in the SME sector. What makes this transaction unique is that one third of the additional leases in the portfolio will be dedicated to leases for female entrepreneurs.
• Substantial transactions
We take pride in creating a powerful signalling effect with our presence in the securitisation market. In 2019, we participated with a group of private investors in the biggest market placement of an SRT on a portfolio of senior secured and unsecured loans of around EUR 3bn to SMEs in Spain via Santander Magdalena.
• On-boarding new financial institutions
We are willing to go the extra mile to make sure financial institutions that have never pursued an SRT trade can participate with us. Since September 2018, financial institutions such as Ceska Sporitelna, Banco BPM, Alior, Cajamar and Banca Nazionale del Lavoro have all participated in SRT transactions thanks to the EIF.
• Active market role
The EIF’s structured finance experience has led to its securitisation team winning the ‘Investor of the Year’ award at the 2019 SCI Capital Relief Trades Awards and contributing to the ongoing debate on regulatory change that is shaping new securitisation regulation in Europe.
“It’s the dream of every kindergarten teacher actually – to do things their way and run their own shop. What held us back at first was the high financial risk that such a project entails. Nevertheless, we took a deep breath and took on the challenge.” Simona AmorettiLe Tatte Matte - kindergarten
Growth & Competitiveness Growth & Competitiveness
/ EIF Annual Report 4140
Increasing financing through debt alternativesWhat do you do if traditional bank debt financing does not fit your business model? The most innovative and fastest-growing businesses often need a tailor-made finance package. Alternative, bespoke debt, such as loans, bonds and leases provided by private credit funds and hybrid debt/equity financing may be more suitable.
Alternative lenders offer a deep understanding of the business itself and can execute transactions rapidly — in some cases as quickly as two weeks. They also give guidance, support and even introductions to advisers off which the business may leverage in the future. The EIF is playing a critical role in attracting institutional investors into this asset class. Our participation helps the alternative debt fund reach first close and start lending to SMEs, but it also acts as a ‘stamp of approval’ that encourages other institutional investors to crowd in. We are also supporting first-time teams, new geographies, as well as the origination of financing through crowdlending platforms.
Growing activity under new instrumentsThe EIF is one of the most active investors in Europe in the universe of private debt, with 19 debt funds invested in 2019 alone, for a total of EUR 799m. We have invested in direct lending funds, predominantly under our flagship EFSI Private Credit Tailored for SME Programme, as well as in mezzanine funds. One third of these funds were launched by first-time managers.
Support to crowdlending Crowdlending is an innovative and agile way for small businesses to access financing. The EIF makes cornerstone investments in debt funds originated through crowdlending as a signalling effect to institutional investors to enter this area. In 2019, we committed to supporting four funds under the EFSI Private Credit Programme, which invest alongside more than ten crowdfunding platforms across Europe. These include:• Credimi: launched in 2017, Credimi is an Italian
web-based SME invoice-financing platform funded by institutional investors;
• Creditshelf: launched in 2015, Creditshelf is a pioneer in the development of marketplace lending practices in Germany and the largest loan platform in the country by volume;
• October: launched in 2014, October was a key part of developing crowdlending in France and the largest loan platform in the country by funding volume. Following its success in France, platform operations were extended to Spanish, Italian and the Dutch markets.
Boosting resources for alternative debtThe overwhelming demand for cornerstone investments in alternative debt in Europe has allowed us to secure an extra EUR 50m under the new EFSI Private Credit Programme – all of which can be deployed in new cornerstone investments. This will bring EFSI’s contribution to the product to EUR 350m, with expected leverage of EUR 3bn to small businesses.
What are Selective Loan Funds?
The SLF strategy targets investments in mainly senior non-distressed debt, or hybrid debt and equity instruments to companies operating in EU Member States. The funds we invest in under SLFs are often the SME’s sole lender and aim to take a more active role with the SME than a bank might typically do.
What is the EFSI Private Credit Tailored for SMEs Programme?
Launched in December 2018, this programme aims to attract new investors into the alternative debt asset class. Under the programme, EIF will deploy a total of EUR 1bn of combined EFSI and EIF resources to diversified debt funds, through cash investment and, subject to investor demand, unfunded protection. Diversified debt funds are direct lending funds focusing on widening the availability of flexible senior financing with an investment strategy based on portfolio diversification.
See what EIF Chief Investment Officer Alessandro Tappi says about our role supporting alternative debt
Growth & Competitiveness Growth & Competitiveness
/ EIF Annual Report 4342
“We don’t want to be the pioneering innovative start-up that never took off. We now have 9000 clients across France… The future is digital.” Grégory LamotteComwatt – smart energy
Catalysing growth through equity financingEurope’s small businesses need growth capital in order to take their businesses to the next stage. However, later stage funding available in Europe was USD 7bn in 2017 (EUR 6.4bn), compared with USD 39bn (EUR 35.7bn) in the US. The EIF is responding to this funding gap by investing in equity financing at the growth stage, such as the growth end of private equity, scale-up funding, capital increases, buyout funding to execute buy-and-build strategies and hybrid growth equity. In 2019, we continued to diversify our funding sources, harnessing private sector investment from inside and outside Europe, as well as building private equity financing in different geographies.
Greater volumes from EFSIWe have deployed EUR 1.05bn of EFSI resources into European private equity this year, totalling EUR 2.95bn since EFSI inception.
We are channelling more financing for growthBusinesses scaling up their operations in Europe face a real financing gap. We hope to improve this by using a new pilot (the ESCALAR pilot) to make between four and six investments in late-stage equity fund managers, benefitting around 70 scale-up businesses. Because scaling up a business requires larger sums of capital, we will be making up to EUR 100m available per single fund commitment (please see ‘What is ESCALAR?’).
…and putting it to workBy the end of 2019, the AMUF Growth Capital compartment completed EUR 232m of investments in 15 funds managed by some of the best European private equity managers.
…in new marketsThe new AMUF European Secondaries Compartment will allow private investors to get exposure to the European Private Equity secondary market. Secondary investments allow investors to get another ‘bite of the apple’ by investing in existing private equity portfolios, rather than in new “blind pool” funds. The advantages include knowledge of underlying companies, earlier cash distributions and more predictable cash flows, as well as mitigation of the J-curve, which is usually inherent in PE investments. The EIF’s strong relationships in private equity and venture capital mean that it often has first-mover advantage when it comes to secondary market positions. From a policy perspective, a greater number and volume of secondary market investments means greater inflows of capital to SMEs. In 2019, the compartment already boasted a pipeline of up to nine interested investors and the compartment’s first close is forecast for 2020.
What is ESCALAR?
The European Scale-up Action for Risk capital (ESCALAR) will be a pilot facility to support scale-up businesses in Europe. Using a maximum of EUR 300m of EFSI funds, the EIF will make investments in funds supporting scale-ups. The EIF’s investment will take the form of "preferred"
equity investments in a separate class of shares to the other investors in the fund, or of a side vehicle established by a fund, therefore having a lower risk and return profile. Around EUR 600m is expected to be made available to these funds thanks to private investment crowding in.
Harnessing the private sectorAs well as EC resources, EFSI, other public resources and our own financing, the EIF attracts private sector financing directly into its portfolio through the AMUF vehicle. By 2019, AMUF’s investor pipeline was composed of private investors from a widening number of geographies, including Europe, the Middle East and the Far East. The diversified investor base reflects the growing appetite and recognition of European private equity as an asset class, as well as AMUF’s capacity to select unique investment opportunities (please see ‘what is AMUF?’).
Growth & Competitiveness Growth & Competitiveness
/ EIF Annual Report 4544 / EIF Annual Report
Investing funds from ChinaIn 2019, the EUR 500m China-EU Co-Investment Fund (CECIF) was fully invested, committing in aggregate EUR 110m to two funds and with a pipeline of three funds with an expected commitment date and three without as of 30 September 2019. CECIF, signed in 2018, has invested EIF (both own and managed) and Silk Road Fund resources into private equity and venture capital funds in Europe, particularly those interested in cross border expansion.
Building private equity across EuropeMaking sure that as many different European geographies as possible have access to growth financing is important for European growth as a whole. In 2019, we continued to set up investment programmes combining European structural funds, NPI, EC and our own resources, which are then invested into country or region-specific funds (see the Cohesion & Regional Chapter).
Materialising value creationIn 2019, funds financed by the EIF have provided financing to more than 4000 lower mid-market companies in the EU lower mid-market representing a total of EUR 26.1bn mobilised volumes. This financing will be instrumental in implementing strong value creation initiatives.
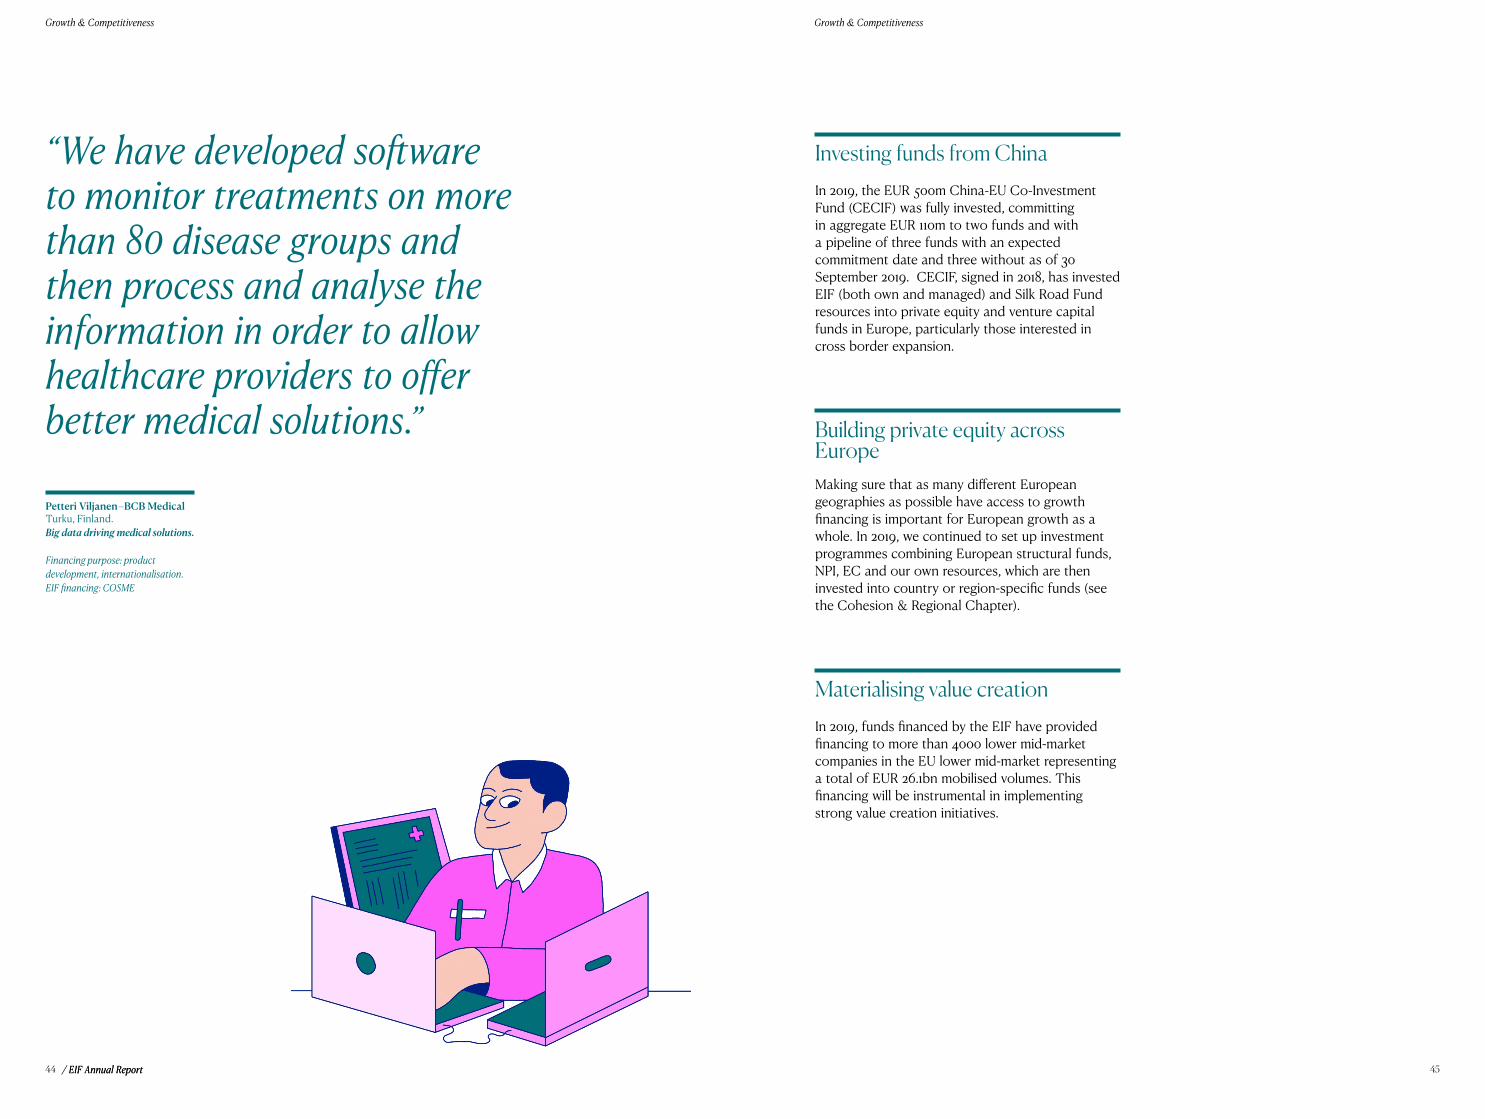
“We have developed software to monitor treatments on more than 80 disease groups and then process and analyse the information in order to allow healthcare providers to offer better medical solutions.”
Petteri Viljanen –BCB MedicalTurku, Finland. Big data driving medical solutions.
Financing purpose: product development, internationalisation.EIF financing: COSME

/ EIF Annual Report 4746
Society
Society Society
/ EIF Annual Report 4948
Highlights
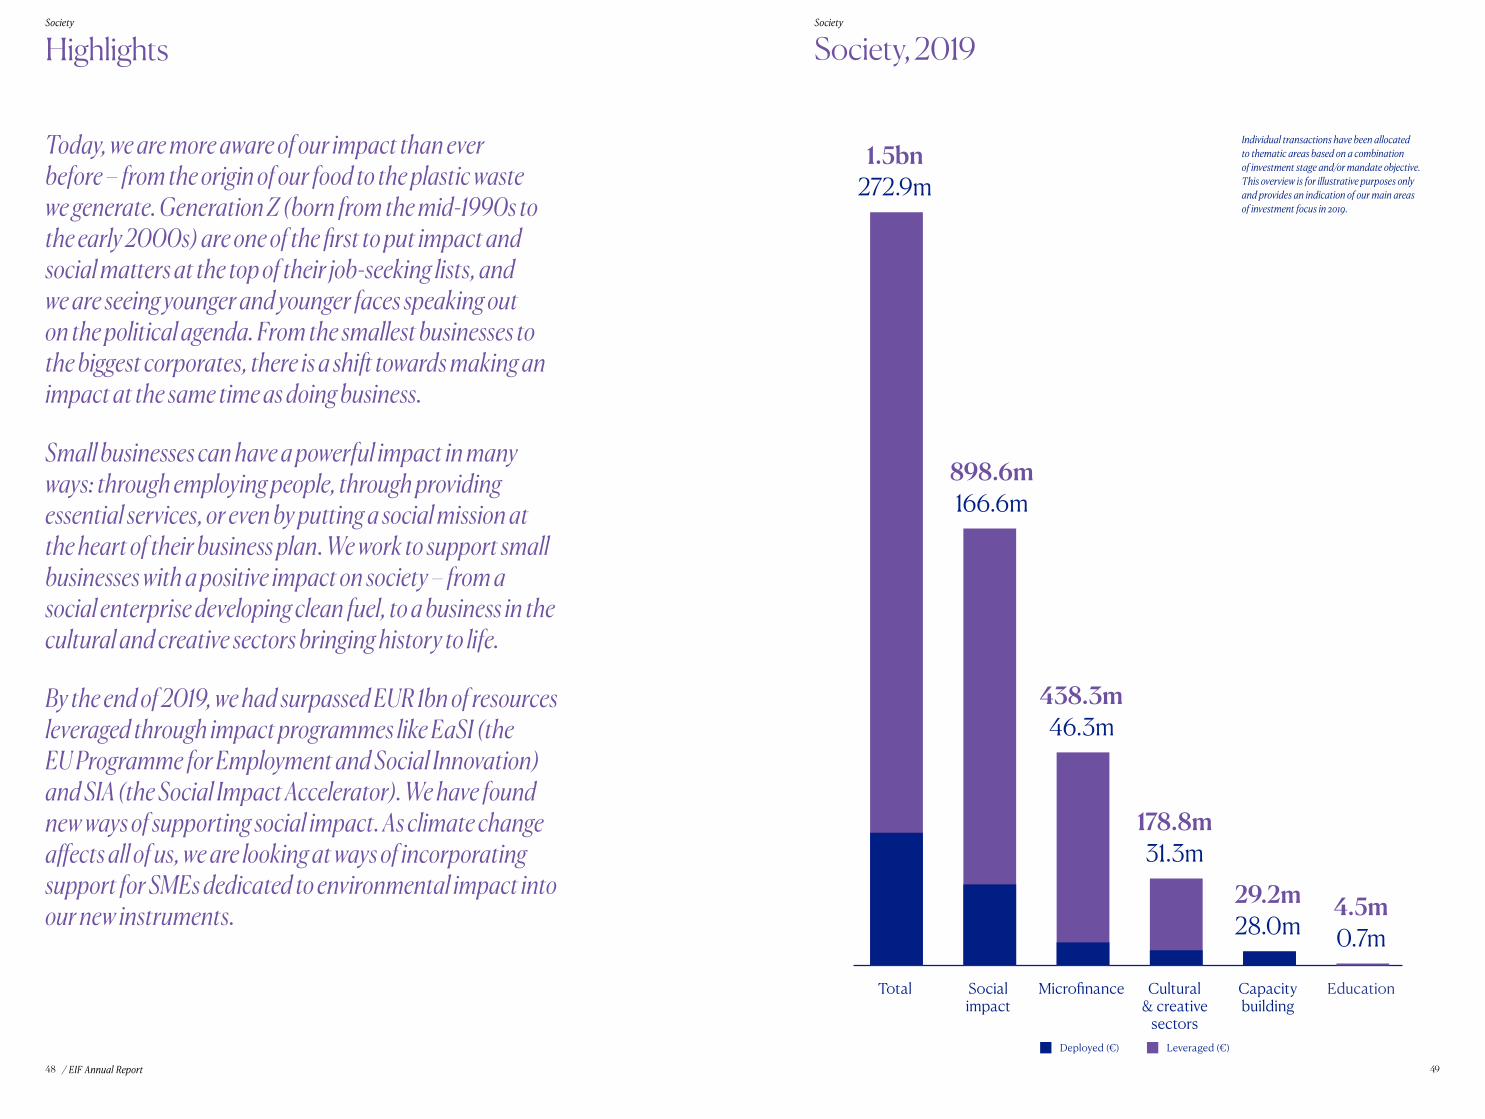
Today, we are more aware of our impact than ever before – from the origin of our food to the plastic waste we generate. Generation Z (born from the mid-1990s to the early 2000s) are one of the first to put impact and social matters at the top of their job-seeking lists, and we are seeing younger and younger faces speaking out on the political agenda. From the smallest businesses to the biggest corporates, there is a shift towards making an impact at the same time as doing business.
Small businesses can have a powerful impact in many ways: through employing people, through providing essential services, or even by putting a social mission at the heart of their business plan. We work to support small businesses with a positive impact on society – from a social enterprise developing clean fuel, to a business in the cultural and creative sectors bringing history to life.
By the end of 2019, we had surpassed EUR 1bn of resources leveraged through impact programmes like EaSI (the EU Programme for Employment and Social Innovation) and SIA (the Social Impact Accelerator). We have found new ways of supporting social impact. As climate change affects all of us, we are looking at ways of incorporating support for SMEs dedicated to environmental impact into our new instruments.
Society, 2019
Individual transactions have been allocated to thematic areas based on a combination of investment stage and/or mandate objective. This overview is for illustrative purposes only and provides an indication of our main areas of investment focus in 2019.
Total Socialimpact
EducationMicro�nance Cultural& creative
sectors
Capacitybuilding
1.5bn
438.3m
898.6m
178.8m
29.2m 4.5m
272.9m
166.6m
46.3m
31.3m
28.0m 0.7m
Deployed (€) Leveraged (€)
Society Society
/ EIF Annual Report 5150
…in new instruments……such as social impact bonds (SIBs), which engage private investment in solutions to societal problems. In 2019, using SIA, EFSI and our own resources, we committed to two new investments in SIBs:• Up to EUR 10m in ‘Joining Forces’, to help military
personnel in the Netherlands reintegrate into private sector employment;
• Up to EUR 5m in a co-investment arrangement with BNP Paribas to finance payment-by-results schemes in France;
• …and a wealth of new schemes in the pipeline.
…and new geographies, like Croatia…We have committed up to EUR 15m into the Feelsgood Social Impact Investment Fund, a social impact fund targeting up to EUR 30m for SMEs with an environmental and social focus in Croatia and Slovenia. The EIF’s commitment will send an important signal of the good health of impact funds in central and southern Europe.
Financing for social enterprises and impact in 2019Hundreds of social enterprises across Europe actively generate a positive societal impact. But, like any other business, they need access to finance in order to be successful and sustainable. The EIF supports intermediaries that pursue a positive impact by providing them with guarantees and equity investments. In 2019, the demand for financing was large enough to prompt new equity funds and new instruments supporting loans. Small businesses are becoming more accountable for their impact, and we are behind this all the way.
More equity financing for impact businessesIn 2013, we started supporting funds that invest in businesses making a social impact. In 2019, we completed the investment period of this first fund-of-funds, having committed EUR 220m into 19 social impact funds in nine countries, supporting more than one hundred social enterprises (see ‘What is SIA?’).
We have invested across the growth spectrum…In 2019, this included an investment in social impact incubator fund Makesense Seed under the InnovFin Equity instrument. The investment of up to EUR 4m will help the incubator fundraise up to EUR 8m to incubate start-ups with high impact potential.
What is SIA?
The Social Impact Accelerator (SIA) is the EIF’s equity instrument in the social sector. Through SIA, the EIF takes cornerstone equity investments in impact venture capital funds, which, in turn, invest to build successful, impact-driven enterprises. Under SIA, companies must pursue impact-focused business models, which correlate impact delivered with economic value creation. SIA was launched as a pilot in 2013, combining resources from the EIF, the EIB and external investors, including Crédit Coopératif, Deutsche Bank, the Finnish group SITRA and the Bulgarian Development Bank (BDB). It has successfully developed into a fully-fledged fund-of-funds programme and, in 2019, it completed its investment period.
What is EaSI?
It is Europe’s programme for unemployment and social innovation. The EIF is responsible for deploying the EaSI Guarantee, which focuses on microfinance (capped guarantees or counter-guarantees on loans and guarantees of up to EUR 25,000) and social entrepreneurship (capped guarantees or counter-guarantees on loans and guarantees of up to EUR 500,000). Set up in 2015 by the EC in cooperation with the EIF to promote employment and social inclusion in Europe, EaSI works in line with policy goals of the Europe 2020 strategy.
There are thousands of ways to make a positive social impact. Social entrepreneurs backed by the EIF see opportunities in everything from the environment to gender equality. Some of the impact includes: enabling disadvantaged workers to enter the labour market, improving
Did you know?
…but there is still more to doImpact investing is still a relatively young investment area. It can suffer from perception problems, for example, that social enterprises are non-profit organisations, or even charities. The EIF is delivering proof that this is not the case, and that social enterprises have a legitimate place within the investment spectrum. Indeed, a rising number of impact entrepreneurs, backed by impact-driven financial intermediaries, are emerging across Europe – accompanied by a rise in demand for capital. With more and more investors keen to see their money work for societal good and impact funds developing a track record where their businesses succeed in impact and in financial terms, our cornerstone investments can help new funds raise capital and take part in the social impact movement.
A new generation of impact financingImpact venture capital funds are a growing investment target for institutional investors. As we all become more aware of the importance of environmental, social and governance (ESG) principles and the United Nation’s Sustainable Development Goals (SDGs), we foresee initiatives that would give private investors access to funds in the fields of health and impact.
More debt financing for social enterprisesDe-risking is crucial to improving access to financing, particularly for young social enterprises and those lacking collateral. We continued to guarantee a large number of loan transactions under the social entrepreneurship strand of the EU programme, EaSI signing a total of 36 transactions in 18 countries to date.
the environment, enhancing solidarity with developing countries, delivering health and social care as well as social housing, delivering affordable food, facilitating learning and training, financing community development, strengthening democracy and civil rights and integrating migrants.
Society Society
/ EIF Annual Report 5352
What do we mean by ‘payment by results’ and ‘social impact bonds’?
To combat long-term social problems like unemployment or prisoner re-offending, governments increasingly invest in preventative measures, for example, education, training and mentoring support. However, these can require significant upfront investment, which entails both capital and the risk that the programme fails to deliver. A payment-by-results contract reduces this risk by setting out the desired results between the public body and the social services provider, ensuring that the provider is paid only if these results are obtained, for example, a percentage reduction in unemployment. The idea is to bring greater rigour and accountability to social interventions, but also to equip the public sector to venture into preventive measures tackling social challenges. A social impact bond takes this intervention one step further. With a social impact bond, a special purpose vehicle (SPV) is created, into which private investors put their capital, thus transferring the upfront investment in the project and the risk from the public body to the private investors. The government pays for the results of the programme, with the savings of the future costs of intervention passed to the investors as a return, but, crucially, does not pay if the intervention fails, placing the risk firmly with the investors. These schemes align the interests of the investor and the goals of the social enterprise carrying out the intervention and provide a private source of capital in cases where the public body lacks the funds or the risk appetite for certain interventions. The long-term risk capital investments can be in the form of equity, preferred equity, hybrid debt-equity instruments, other types of mezzanine financing and debt.
Additional debt financing available…From the end of 2019, up to EUR 200m will be available to fund new loans to micro enterprises and social enterprises in Europe. The funded instrument will provide loans to financial institutions for on lending to micro and social enterprises – increasing their origination capacity and allowing them to support longer term financing to a wider variety of businesses (please see ‘What is the EaSI Funded Instrument?’).
…as well as EUR 50m for building skills and educationInvestment in skills is at the very core of a flourishing society. It is also an important policy objective of the EC. We are therefore in discussions to deploy a EUR 50m guarantee pilot under EFSI to bolster skills and education in Europe. By running a pilot in this way, we want to pave the way for financial instruments to be used in skills and education in the next European budgetary period.
What is the EaSI Funded Instrument?
What is the Skills and Education Guarantee?
The EaSI Funded Instrument forms part of the EaSI mandate along with the EaSI Guarantee and the EaSI Capacity Building Investments Window. It provides up to EUR 200m over four years to financial intermediaries lending
This is a new EUR 50m pilot project under EFSI which will build on the experience from the Erasmus + Student Loan Guarantee Facility that enables Master students to study abroad, thus improving the skills of the EU
workforce. Using EFSI funds and deployed by the EIF, it is expected to leverage EUR 250m in loans to individual students, enterprises investing in skills and providers of education, training and skills – including universities.
Including our largest-ever guaranteeWe have guaranteed up to EUR 12.7m of a EUR 120m portfolio of loans for France’s la Nef, a cooperative bank based in Lyon. The guarantee (the largest ever under EaSI), will help la Nef provide attractive social loans to up to 1,000 social enterprises.
…and the first targeting early-stage in GermanyThe EIF is also guaranteeing up to EUR 3.2m of a EUR 20m portfolio managed by Germany’s Early-Stage Co-Investment Fund for Social Enterprises, which will provide sub-ordinated debt finance in around 70 transactions to around 60 social enterprises over the next five years. The guarantee will help fill the gap for early-stage social entrepreneurship financing in Germany.
to micro enterprises and social enterprises. Starting from 2020, it will provide continuity of support to micro and social enterprises.
“It’s important to keep retelling the story of Czechs and Germans working and living together. There is no more place for animosity in this region. We are all Europeans.” Petr MikšíčekBest Sequence – audiovisual production company
Society Society
/ EIF Annual Report 5554
Financing for micro enterprises in 2019
For many people, getting a job or starting a business is a path back to social inclusion, particularly if they have been out of work, in training, or suffered a setback. Micro enterprises (fewer than 10 employees and an annual turnover of no more than EUR 2m) make up nine out of ten non-financial European businesses. However, their diminutive size means that they sometimes struggle to access financing. By guaranteeing loans to micro enterprises, we are supporting entrepreneurs and vulnerable groups looking to start a business.
First microfinance deal in BulgariaWe carried out our first commitment to microfinance in Bulgaria, by guaranteeing up to EUR 700,000 of a EUR 5.1m microcredit portfolio for the JOBS Microfinance Institution. The estimated 320 loans will have a particular emphasis on enterprises created by young entrepreneurs, women, artisans and small-scale farmers.
What has our impact been in microfinance?The path to getting microfinance is easier for some than for others. That’s why we have supported nearly 15,000 female micro entrepreneurs since the beginning of the EaSI programme, 2,600 micro entrepreneurs with no formal education, almost 3,000 entrepreneurs aged under 25 and over 2,000 aged over 60, over 27,000 with a migrant background (EU or other) and 2,000 who have been unemployed for more than 12 months. Targeting a broad range of different groups through our activity makes the road a little smoother for everyone.
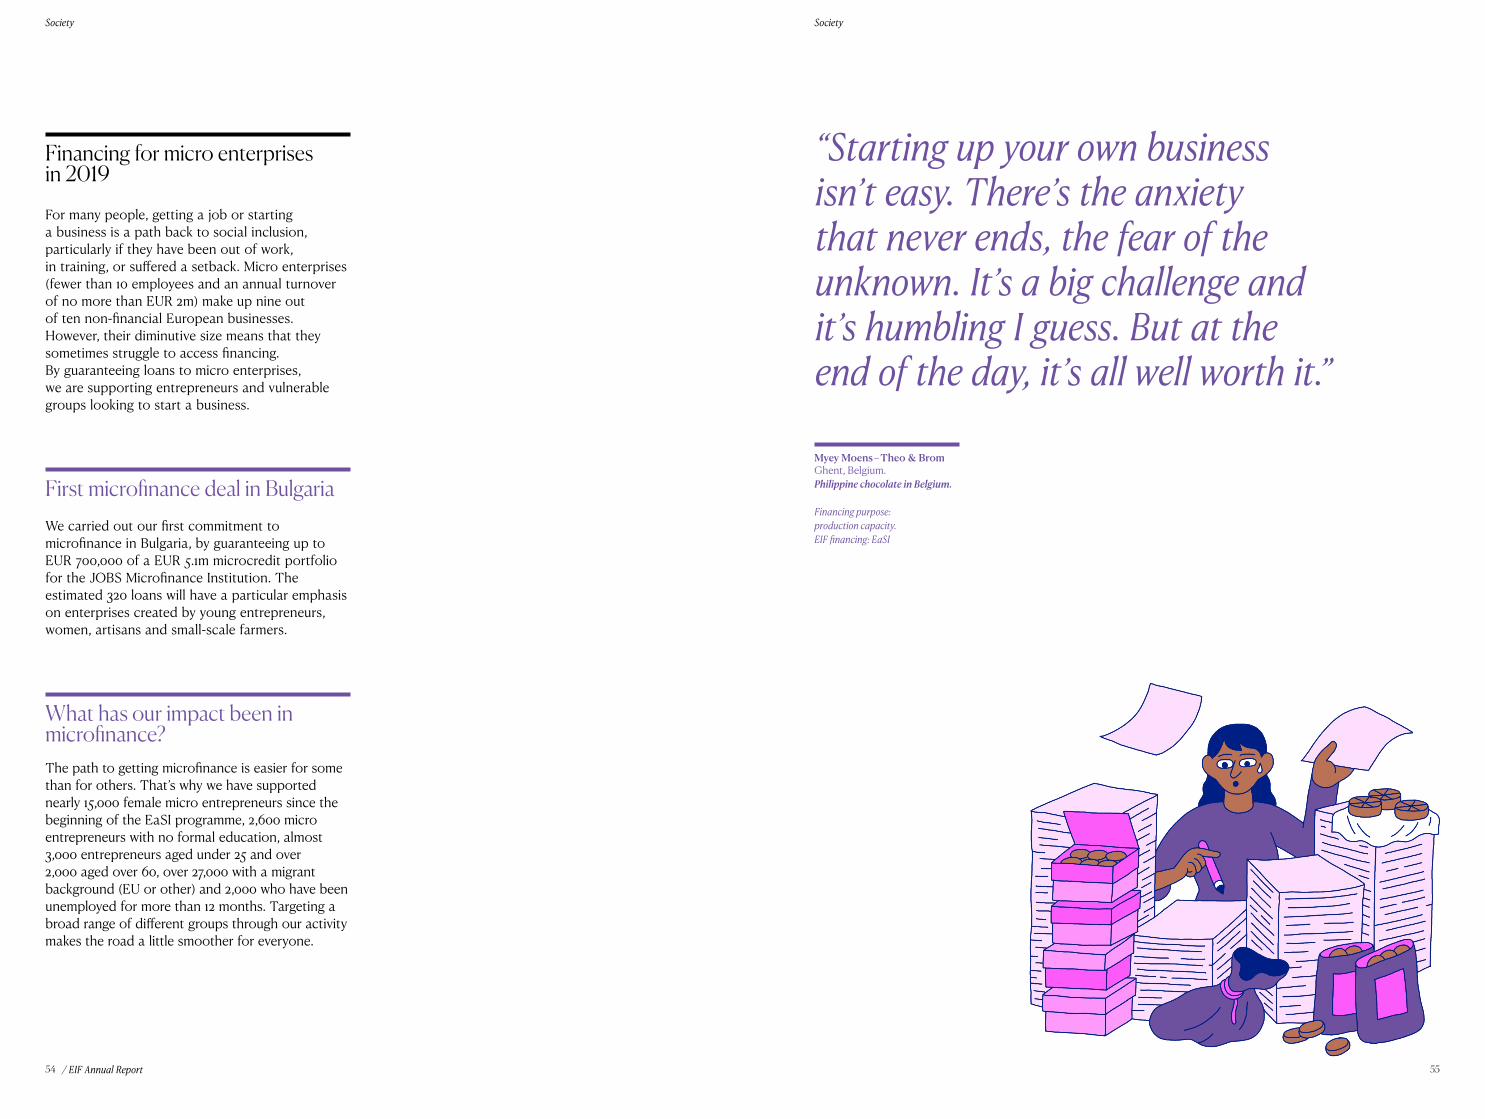
“Starting up your own business isn’t easy. There’s the anxiety that never ends, the fear of the unknown. It’s a big challenge and it’s humbling I guess. But at the end of the day, it’s all well worth it.”
Myey Moens – Theo & BromGhent, Belgium. Philippine chocolate in Belgium.
Financing purpose: production capacity.EIF financing: EaSI
Society Society
/ EIF Annual Report 5756
Moving into cross-border agreementsIn order to make cultural and creative sector financing more widely available across more geographies we have signed a multi-country agreement – a guarantee to IFCIC, which supports cultural and creative sector SMEs outside France as well as within.
Covering all sub sectorsThere are many subsectors in the cultural and creative sectors area. These include audio visual and multimedia, performing arts, books and press, visual arts, heritage, archives and museums, architecture and other domains. In 2019, we ensured all of these sub sectors were covered. We also know that young businesses struggle the most to get financing - so around 40% of the debt financing granted was to SMEs with an operational history of five years or less.
Creative and cultural sectors in 2019Culture and creativity shape the identity of society. Yet small businesses in this sector often lack tangible assets against which to secure a loan. They operate with specific cash-flow patterns and life cycles, with an output that can be early-stage or prototype in nature, making it difficult for banks to evaluate companies in the sector. By guaranteeing a portion of loans to SMEs in the cultural and creative sectors, the EIF can help to release more financing to small businesses in the creative and cultural sectors. Everyone benefits.
Growing our footprintSince 2016, we have signed 14 agreements in ten countries, including three transaction increases signed with CERSA, IFCIC and Bpifrance. These guarantee agreements have allowed an increase in loans that have supported more than 1,200 cultural and creative sector businesses in Europe.
What is CCS GF?
The Cultural and Creative Sectors Guarantee Facility (CCS GF) improves access to finance for creative SMEs by offering portfolio guarantees and counter-guarantees to financial intermediaries for loans and leases to entrepreneurs in the
cultural and creative industries. It is the guarantee facility of the EU’s Creative Europe programme, running from 2016 to 2020, and on top of guarantees, it also offers the CCS Capacity-Building Window, (see capacity building).
How CCS Works
Capacity building in 2019The specific nature and business model of social enterprises, micro enterprises, or SMEs in the cultural and creative sectors can be alien to the banks and funds financing them. The EIF has a role to play not just in providing guarantees and cornerstone investments, but to provide capacity-building services that help these intermediaries deepen their understanding of the sectors they serve, assess risk and support new areas. This can mean developing databases that help them access relevant industry data, holding workshops, or simply providing structuring input so that funds and banks optimise their operations.
The EIF takes two approaches to capacity building: investing directly in a financial intermediary, as with its activity under the EaSI Capacity-Building Investments Window; or through expert consulting services, as with the CCS Capacity-Building Window.
In 2019, the EIF carried out a number of capacity-building transactions under its new instruments, including in a crowd-investing platform. Few banks understand the specific nature and business model of SMEs in these sectors, hence the need to create more awareness and build capacity in this area.
Demand in social and microfinanceThrough the EaSI Capacity-Building Investments Window, the EIF invests or lends to financial intermediaries to improve their capacity to better serve their clients in microfinance and social entrepreneurship. In 2019, we fully deployed our capacity-building budget in financial intermediaries that serve social and micro enterprises – ten deals signed in 2019.
…including in social Fintech…The EIF made a EUR 1.2m subordinated loan to Litaco, France’s only crowd-investing platform to focus solely on the social economy and sustainable development in Europe. The capacity-building investment will support the scale-up and geographical expansion of the platform – allowing many more social enterprises to access finance through this Fintech.
Getting into debt
What it’s like to get a loan in the cultural and creative sectors

Society Society
/ EIF Annual Report 5958
…and two joining forces with Social Impact Italia…We also increased EIF-firepower by co-financing two Italian capacity-building investments with EIF shareholder and Italian NPI Cassa Depositi e Prestiti’s (CDP’s) Social Impact Italia mandate. A subordinated loan of up to EUR 4.05m to Per Micro will help finance the micro lender’s geographical expansion and IT system improvement, meanwhile, another subordinated loan of up to EUR 9.75m to ethical bank Banca Popolare Etica will allow the bank to improve its operations and strengthen its capital position.
…and one capacity-building loan in SerbiaWe are providing a subordinated loan of up to EUR 4m to Serbian microfinance provider, Opportunity Bank Serbia. This investment will allow the bank to develop its digitalisation modules and real-time performance reporting. With these changes, Opportunity Bank will be able to provide a faster service and ultimately pass on cost savings to its clients - very small businesses in rural areas of Serbia.
Capacity building in the creative and cultural sectorsWe also help to build capacity in the creative and cultural sectors through providing consultancy services and support to financial intermediaries active under the CCS GF. In 2019, the EIF provided capacity-building support to ten financial intermediaries through workshops, relevant market and risk assessment studies and guides, e-learnings and marketing support.
Reaching out to the market in 2019In 2019, we communicated widely to banks, funds and SMEs about the CCS GF through promotional events, publishing an e-guide for SMEs, and carrying out market studies to target our financing even better. As part of the capacity building under the CCS GF, financial intermediaries can benefit from the risk assesment guide in the CCS, a guide to assessing loan applications from CCS SMEs, as well as CCS market fact sheets providing key information on the CCS country-by-country (Member States as well as Norway, Iceland and Liechtenstein).
What is the EaSI Capacity-Building Investments Window?
Helping financial intermediaries to consolidate their operations is an important part of creating a thriving social finance ecosystem. Impact funds, ethical or alternative banks, microfinance institutions and foundations are just examples of the type of institutions the EIF is working with to maximise the outreach
to micro and social enterprises. The EaSI Capacity-Building Investments Window invests in microcredit and social finance providers to support a sustainable financing market. The EIF has around EUR 24m available to build the capacity of social finance providers.
Together with the CCS GF, this window helps financial intermediaries better serve creative and cultural SMEs by providing high-level consultancy and support. It was rolled out in 2018 and is open to all financial intermediaries signed up under the CCS GF.
What is the CCS Capacity-Building Window?
“Our aim is to help our students bring out their best, and provide an environment in which they feel comfortable to make mistakes and learn from them… We are able to computerize texts and the students can ‘read with the ears’ as we say… With digitalisation, reading and writing can become a lot easier for dyslexic people.”
Kirsten Weile Vrigsted EfterskoleStouby, Denmark. Social enterprise: education for dyslexic students.
Financing purpose: construction of facilities.EIF financing: EaSI

/ EIF Annual Report 6160
Agriculture
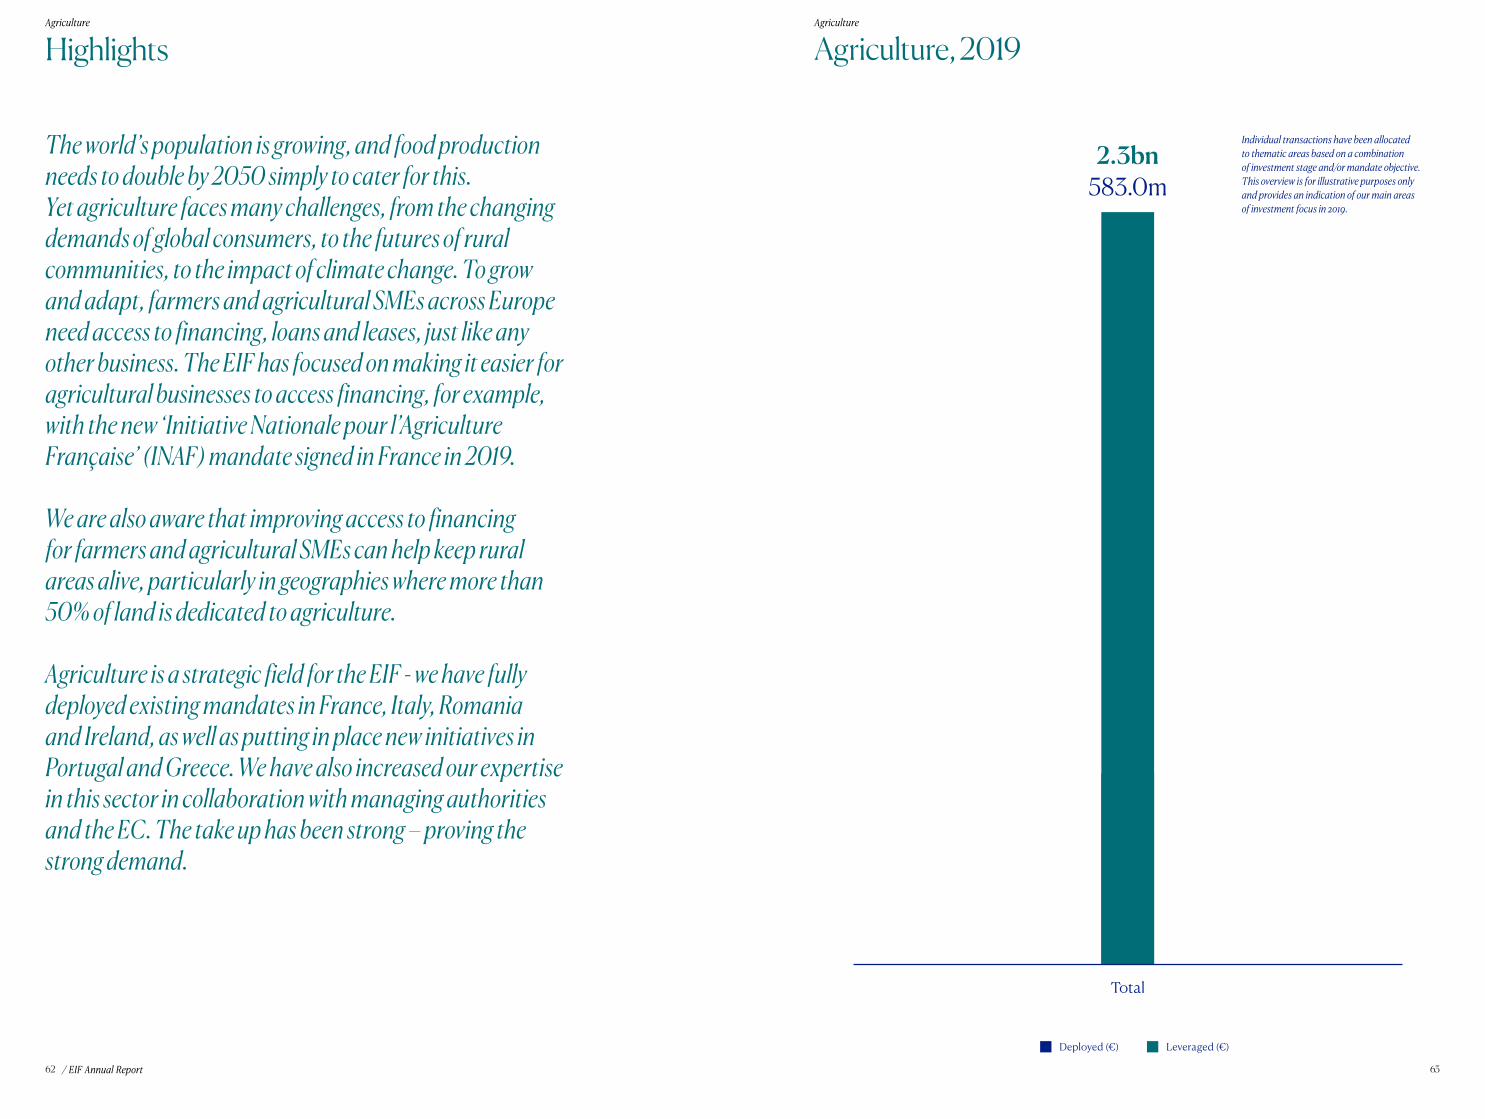
Agriculture Agriculture
/ EIF Annual Report 6362
Highlights
The world’s population is growing, and food production needs to double by 2050 simply to cater for this. Yet agriculture faces many challenges, from the changing demands of global consumers, to the futures of rural communities, to the impact of climate change. To grow and adapt, farmers and agricultural SMEs across Europe need access to financing, loans and leases, just like any other business. The EIF has focused on making it easier for agricultural businesses to access financing, for example, with the new ‘Initiative Nationale pour l’Agriculture Française’ (INAF) mandate signed in France in 2019.
We are also aware that improving access to financing for farmers and agricultural SMEs can help keep rural areas alive, particularly in geographies where more than 50% of land is dedicated to agriculture.
Agriculture is a strategic field for the EIF - we have fully deployed existing mandates in France, Italy, Romania and Ireland, as well as putting in place new initiatives in Portugal and Greece. We have also increased our expertise in this sector in collaboration with managing authorities and the EC. The take up has been strong – proving the strong demand.
Agriculture, 2019
Individual transactions have been allocated to thematic areas based on a combination of investment stage and/or mandate objective. This overview is for illustrative purposes only and provides an indication of our main areas of investment focus in 2019.
Total
583.0m2.3bn
Deployed (€) Leveraged (€)
Agriculture Agriculture
/ EIF Annual Report 6564
Not to mention supporting existing agricultural guarantees and loansINAF is only one of the mandates that supports SMEs in agriculture. In 2019, we also continued to deploy some of our existing instruments:
• the Agri Multi-Regional Guarantee Platform for Italy, which mobilises EUR 71m of regional contributions across eight regions in Italy, covering portfolios of new loans for a total of up to EUR 500m. Thanks to this initiative, more than 4,000 farmers and agricultural SMEs in Italy have benefitted from financing under more favourable conditions;
• the FOSTER mandate with the Region Occitane in France, combining EUR 12m of EAFRD and local regional resources with EUR 12m in the ex-region Midi-Pyrénées and EUR 15m in the ex-region Languedoc-Roussillon. Overall, the mandate is expected to produce EUR 135m of new loans to support at least 1,000 farmers and SMEs active in the agricultural, agri-business and forestry sectors;
• the EAFRD fund-of-funds in Romania, using EAFRD and local resources to co-finance agricultural subsidies and standalone loans for a total of EUR 94m. The portfolio risk-sharing loan is expected to result in up to EUR 126m of new loans, for at least 350 farmers and agricultural SMEs;
• …and the counter-guarantee with Irish NPI SBCI to support Irish SMEs affected by Brexit. This scheme will make EUR 300m available to eligible Irish businesses, with 50% targeting the agriculture and seafood sectors.
Creating new loans in France…In 2019, we signed a new mandate to guarantee portfolios of new loans and leases to around 10,000 French farmers. The INAF mandate is unique because it blends funds from the French government’s Investment Plan 2018-22 with EFSI resources. Under INAF, we have already committed to:
• Guaranteeing EUR 96m of a EUR 120m loan portfolio managed by Credit Mutuel, which expects to generate up to 350 loans to farmers and small businesses in agriculture;
• Guaranteeing EUR 625m of a EUR 780m loan portfolio managed by Credit Agricole, which aims to make available 5,600 loans to farmers and small businesses in agriculture;
• Guaranteeing up to EUR 241m of a EUR 300m loan portfolio managed by Confédération Nationale du Crédit Mutuel, which aims to support 2,500 loans;
• Guaranteeing up to 136m of a EUR 170m portfolio of loans and leases managed by BPCE France, targeting the release of 3,500 loans and leases to the agricultural sector.
What is INAF?
The Initiative Nationale pour l’Agriculture Française’ (INAF) aims to support approximately 10,000 French farmers in the next four years through unlocking a EUR 1.1bn loan portfolio held by four financial intermediaries. Specifically, INAF hopes to support new market entrants as well as generation renewal, the transformation of agricultural models for improved economic, social, environmental and health performance, the diversification of farming activities and revenues and the upgrading of assets. A collaboration between the EIF and the French Ministry of Agriculture in the context of France’s Grand Plan d’Investissement 2018-2022, INAF mobilises EUR 54m of the French government’s funds and EUR 45m of EFSI resources.
Did you know?
Agriculture and food-related industries and services provide over 44 million jobs in the EU, including regular work for 20 million people within the agricultural sector itself.
Did you know?
If you added up all our activity in this area since inception (including under centralised mandates like COSME), the EIF has deployed EUR 13.3bn in financing across 232,000
transactions, benefitting 187,000 SMEs and farmers in agriculture, forestry and fishing, as well as manufacturing, retail, wholesale and other services relevant to the bioeconomy.
Why are guarantees important in agriculture?
Guarantees widen the availability of financing for farmers and agricultural SMEs. A complement to the traditional grant-based support, guarantees allow SMEs to access loans and leases on better commercial terms than would otherwise be possible.
This is helpful in scenarios where farmers and other SMEs need rapid and agile access to capital, face unforeseen expenses, or require specialist machinery and equipment. Guarantees in agriculture also encourage banks and other financial
intermediaries to lend more to the agricultural sector, creating a sustainable source of financing for the area.
“At the end of the day, it’s about providing new solutions to old problems and making agriculture financially viable and attractive again.” David FrancésCodesian – precision agriculture
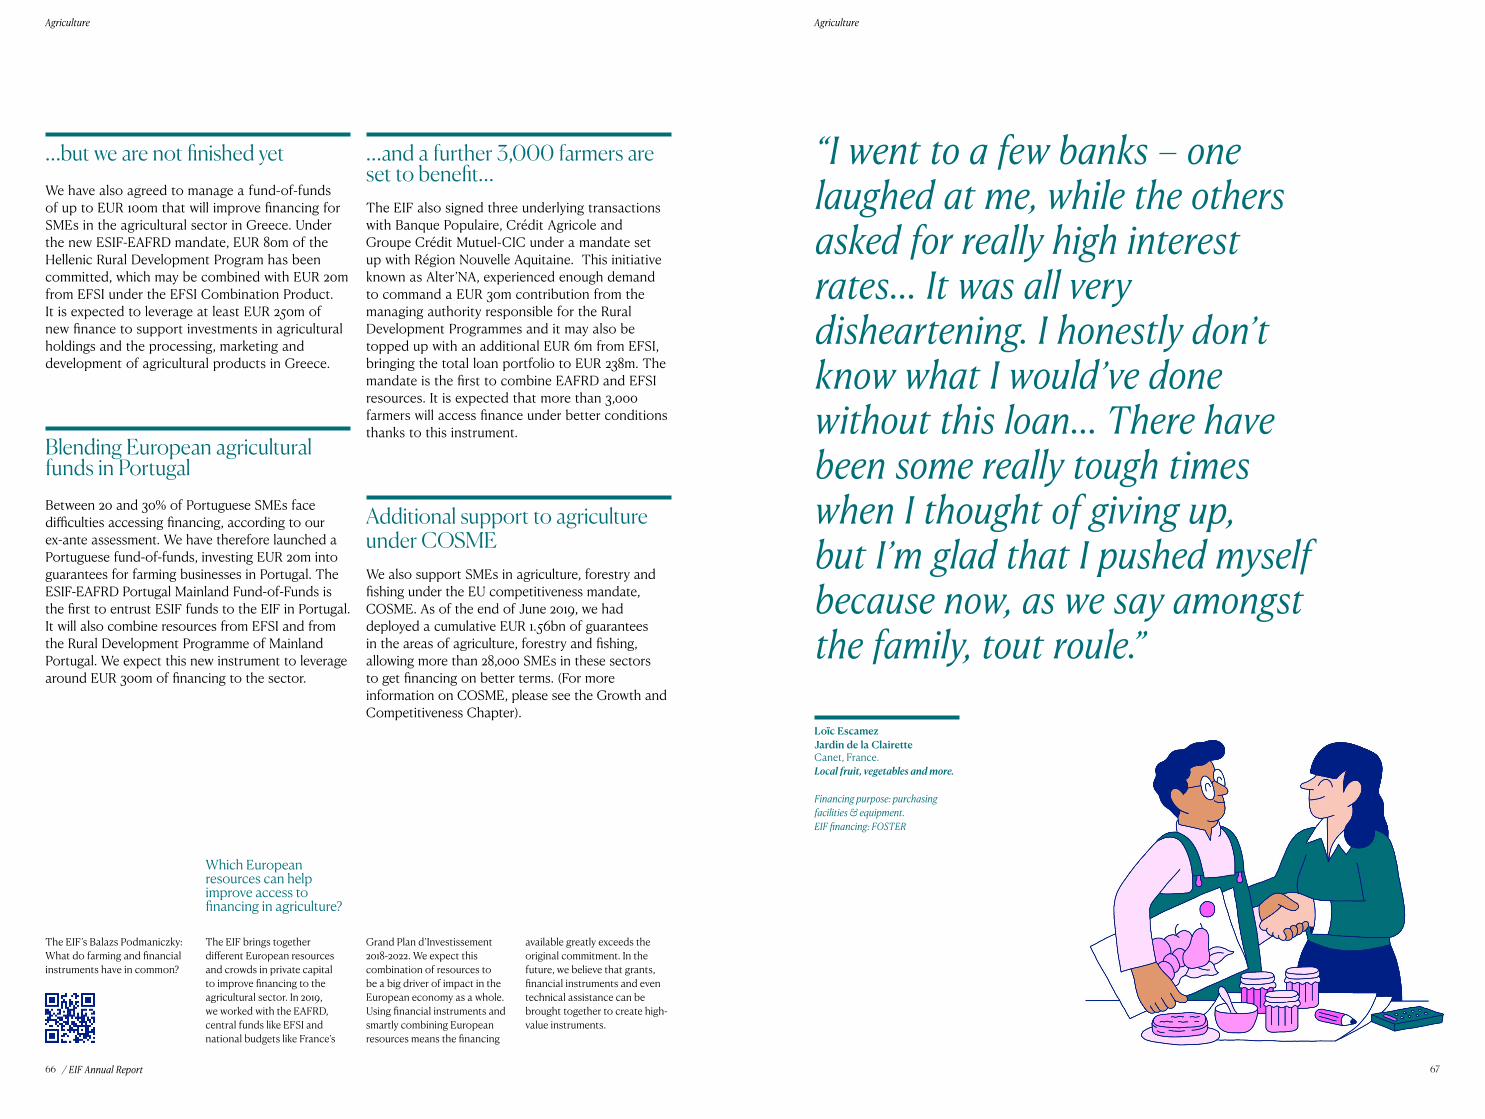
Agriculture Agriculture
/ EIF Annual Report 6766
…but we are not finished yetWe have also agreed to manage a fund-of-funds of up to EUR 100m that will improve financing for SMEs in the agricultural sector in Greece. Under the new ESIF-EAFRD mandate, EUR 80m of the Hellenic Rural Development Program has been committed, which may be combined with EUR 20m from EFSI under the EFSI Combination Product. It is expected to leverage at least EUR 250m of new finance to support investments in agricultural holdings and the processing, marketing and development of agricultural products in Greece.
Blending European agricultural funds in PortugalBetween 20 and 30% of Portuguese SMEs face difficulties accessing financing, according to our ex-ante assessment. We have therefore launched a Portuguese fund-of-funds, investing EUR 20m into guarantees for farming businesses in Portugal. The ESIF-EAFRD Portugal Mainland Fund-of-Funds is the first to entrust ESIF funds to the EIF in Portugal. It will also combine resources from EFSI and from the Rural Development Programme of Mainland Portugal. We expect this new instrument to leverage around EUR 300m of financing to the sector.
The EIF’s Balazs Podmaniczky: What do farming and financial instruments have in common?
“I went to a few banks – one laughed at me, while the others asked for really high interest rates… It was all very disheartening. I honestly don’t know what I would’ve done without this loan… There have been some really tough times when I thought of giving up, but I’m glad that I pushed myself because now, as we say amongst the family, tout roule.”
Loïc Escamez Jardin de la ClairetteCanet, France. Local fruit, vegetables and more.
Financing purpose: purchasing facilities & equipment.EIF financing: FOSTER
…and a further 3,000 farmers are set to benefit…The EIF also signed three underlying transactions with Banque Populaire, Crédit Agricole and Groupe Crédit Mutuel-CIC under a mandate set up with Région Nouvelle Aquitaine. This initiative known as Alter’NA, experienced enough demand to command a EUR 30m contribution from the managing authority responsible for the Rural Development Programmes and it may also be topped up with an additional EUR 6m from EFSI, bringing the total loan portfolio to EUR 238m. The mandate is the first to combine EAFRD and EFSI resources. It is expected that more than 3,000 farmers will access finance under better conditions thanks to this instrument.
Additional support to agriculture under COSMEWe also support SMEs in agriculture, forestry and fishing under the EU competitiveness mandate, COSME. As of the end of June 2019, we had deployed a cumulative EUR 1.56bn of guarantees in the areas of agriculture, forestry and fishing, allowing more than 28,000 SMEs in these sectors to get financing on better terms. (For more information on COSME, please see the Growth and Competitiveness Chapter).
Which European resources can help improve access to financing in agriculture?
The EIF brings together different European resources and crowds in private capital to improve financing to the agricultural sector. In 2019, we worked with the EAFRD, central funds like EFSI and national budgets like France’s
Grand Plan d’Investissement 2018-2022. We expect this combination of resources to be a big driver of impact in the European economy as a whole. Using financial instruments and smartly combining European resources means the financing
available greatly exceeds the original commitment. In the future, we believe that grants, financial instruments and even technical assistance can be brought together to create high-value instruments.

/ EIF Annual Report 6968
Cohesion & Regional
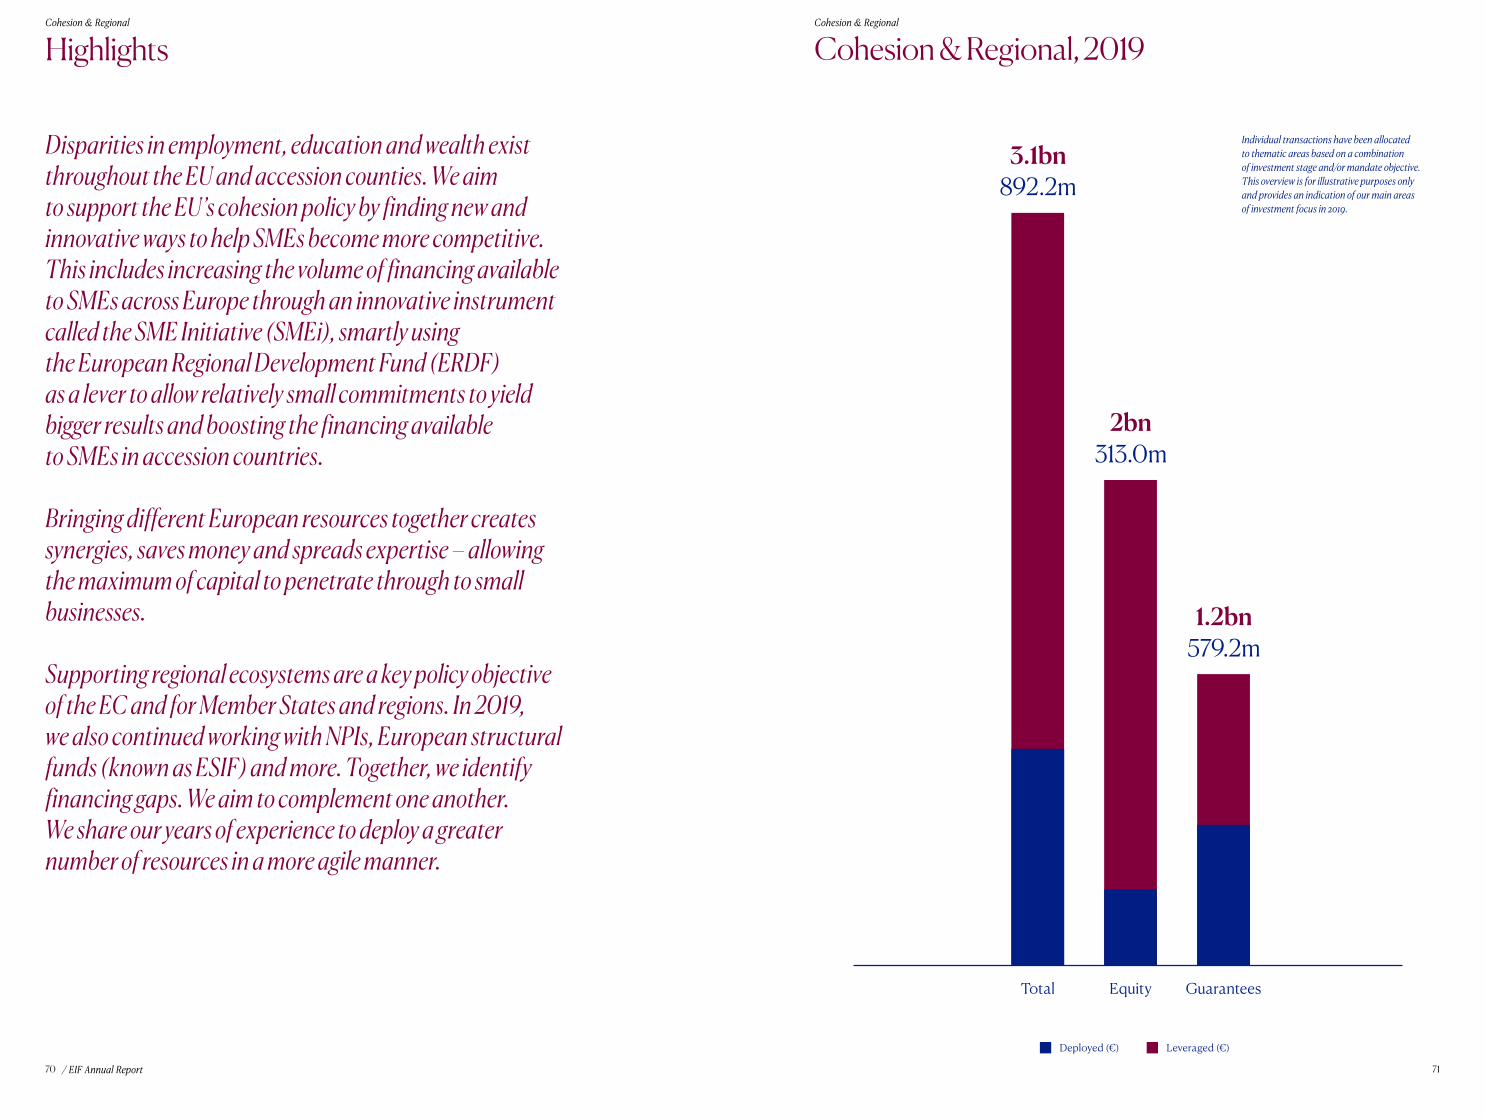
Cohesion & Regional Cohesion & Regional
/ EIF Annual Report 7170
Highlights
Disparities in employment, education and wealth exist throughout the EU and accession counties. We aim to support the EU’s cohesion policy by finding new and innovative ways to help SMEs become more competitive. This includes increasing the volume of financing available to SMEs across Europe through an innovative instrument called the SME Initiative (SMEi), smartly using the European Regional Development Fund (ERDF) as a lever to allow relatively small commitments to yield bigger results and boosting the financing available to SMEs in accession countries.
Bringing different European resources together creates synergies, saves money and spreads expertise – allowing the maximum of capital to penetrate through to small businesses.
Supporting regional ecosystems are a key policy objective of the EC and for Member States and regions. In 2019, we also continued working with NPIs, European structural funds (known as ESIF) and more. Together, we identify financing gaps. We aim to complement one another. We share our years of experience to deploy a greater number of resources in a more agile manner.
Cohesion & Regional, 2019
Individual transactions have been allocated to thematic areas based on a combination of investment stage and/or mandate objective. This overview is for illustrative purposes only and provides an indication of our main areas of investment focus in 2019.
EquityTotal
892.2m3.1bn
313.0m2bn
Guarantees
579.2m1.2bn
Deployed (€) Leveraged (€)
Cohesion & Regional Cohesion & Regional
/ EIF Annual Report 7372
Entrepreneurs benefit in Ile de la RéunionWe address financing gaps in the furthest reaches of the EU, including in Ile de la Réunion. In 2019, we saw the first operational year of the EUR 50m mandate between Réunion and the EIF – and the outcomes were positive: 30% of the portfolio has already supported more than 230 local entrepreneurs across the island, with 99% of them micro entrepreneurs and 92% of SMEs entrepreneurs whose businesses are less than five years old.
Building on equity financing options in underserved areasBuilding a VC infrastructure in regions of Europe suffering from lack of equity financing options is paramount. One of the steps we have taken towards equity cohesion in 2019 is to invest EUR 32.55m in Fil Rouge Capital II under the Croatian Venture Capital Initiative (CVCi). This is the first VC fund dedicated to Croatia, a country where capital for seed and early stage start-ups is largely absent. Its accelerator will allow Fil Rouge to invest in more than 100 start-ups at the idea stage while the fund will also have the capacity to invest in companies that already show validation of their product in the market. With the EIF’s involvement, the fund has reached a size of EUR 45m and we are confident that Fil Rouge will significantly accelerate the development of the Croatian venture capital market, an important contributor to faster economic growth and a modern economy.
Top ups for the SMEi Romania, Italy and FinlandIn 2019, a number of different countries decided to increase their contributions to the SMEi based on the local demand for financing. Finland increased its contribution by EUR 45m, now expected to generate EUR 750m of loans in the country. Italy increased its contribution by EUR 220m, which will generate more than EUR 1.5bn of additional financing for SMEs. Meanwhile, after fully deploying the initial facility, Romania topped up by EUR 150m, to a total of EUR 250m. This will generate almost EUR 1.4bn of loans to small businesses in Romania.
…and full deployment across all countriesDemand has been so strong that the facilities are now fully deployed in Bulgaria, Romania, Finland, Italy, Spain and Malta (for more information, please see ‘What is the SME Initiative?’).
Nourishing the private equity and venture capital market in the BalticsIn 2019, the EIF continued its support to the Baltic region. Together with the Baltic NPIs ALTUM, INVEGA and KredEx, the EIF launched a second generation EUR 156m fund-of-funds, the Baltic Innovation Fund 2 (BIF 2). BIF 2 will provide continuity from the original Baltic Innovation Fund, a pan-Baltic initiative that has already boosted the private equity and venture capital market in Estonia, Latvia and Lithuania by backing seven Baltic PE and VC funds and helping to attract EUR 78m from local private investors. In 2019, BIF 2 already contributed towards the EUR 125m BaltCap Private Equity Fund III.
The SME Initiative is a programme that allows us to mobilise even more loans to SMEs across Europe by providing partial risk cover to loan portfolios. Since the programme started in 2016, over 54,000 small businesses and over 554,000 jobs across Spain, Italy, Bulgaria, Romania, Malta and Finland have benefitted from over 65,000 loans.
Enlargement & NeighbourhoodIf we want a harmonious Europe, it is important to support not just the EU Member States, but also the countries to the east and south of the European territories. With our neighbours, we can build upon common values, such as democracy and human rights, the rule of law, good governance, market economy principles and sustainable development. Small businesses play a crucial role in economic health. That is why we work to improve access to financing for SMEs in the Western Balkans, Turkey, Georgia, Moldova and the Ukraine.
Targeting youth employment in the Western BalkansThe Western Balkans region is home to a number of EU accession countries. It is therefore in everyone’s best interests to facilitate its growth, expansion and success. One key area is youth unemployment, where rates are some of the highest in the world. With our partners, we are making it easier for young people in the region by guaranteeing loans for youth employment. The EUR 10m Guarantee facility for Youth Employment in Western Balkans will form part of the Western Balkan Enterprise Development and Innovation Facility, designed to improve access to finance for SMEs in the Balkans. In 2019, we signed the delegation agreement for this facility and approved five transactions.
Supporting SMEs in Georgia, Moldova and the UkraineBy the end of June 2019, we had guaranteed more than 1,300 loans issued to SMEs in Georgia, Moldova and Ukraine under the DCFTA initiative (Deep and Comprehensive Free Trade Agreement). About two thirds of the loans guaranteed under the DCFTA Initiative are issued in local currencies, improving access to finance for SMEs, supporting more than 37,000 jobs in the region and making loans available for longer terms. Thanks to this positive performance, the EC and the EIB agreed in 2019 to make a second tranche of EUR 40m available under the guarantee window of the facility. The DCFTA Initiative is a 2016 EIB and EC project, funded by the EU Neighbourhood Investment Facility and the EU Support to Ukraine to re-launch the Economy programme.
What is the SME Initiative?
The SME Initiative (SMEi) combines ESIF funds with EIB, EU and EIF resources, allowing different levels of risk to be assumed across the capital structure and ultimately mobilising a much larger volume of loans for SMEs in Europe. The combination of funds promotes economies of scale and larger investments. The SMEi is a joint financial instrument of
the EC and the EIB Group (the EIB and the EIF), which aims to stimulate SME financing by providing partial risk cover for newly originated or existing SME debt financing portfolios of originating financial institutions. Alongside ESIF, the SME Initiative is co-funded by the EU through COSME and Horizon 2020 resources as well as EIB resources. The SMEi is currently operational
in Bulgaria, Italy, Finland, Malta, Romania and Spain. Overall, close to EUR 1.3bn of ESIF are expected to leverage an aggregate EUR 8.6bn of new SME financing, generating EUR 12bn of new investment for over 70,000 SMEs.
Did you know?
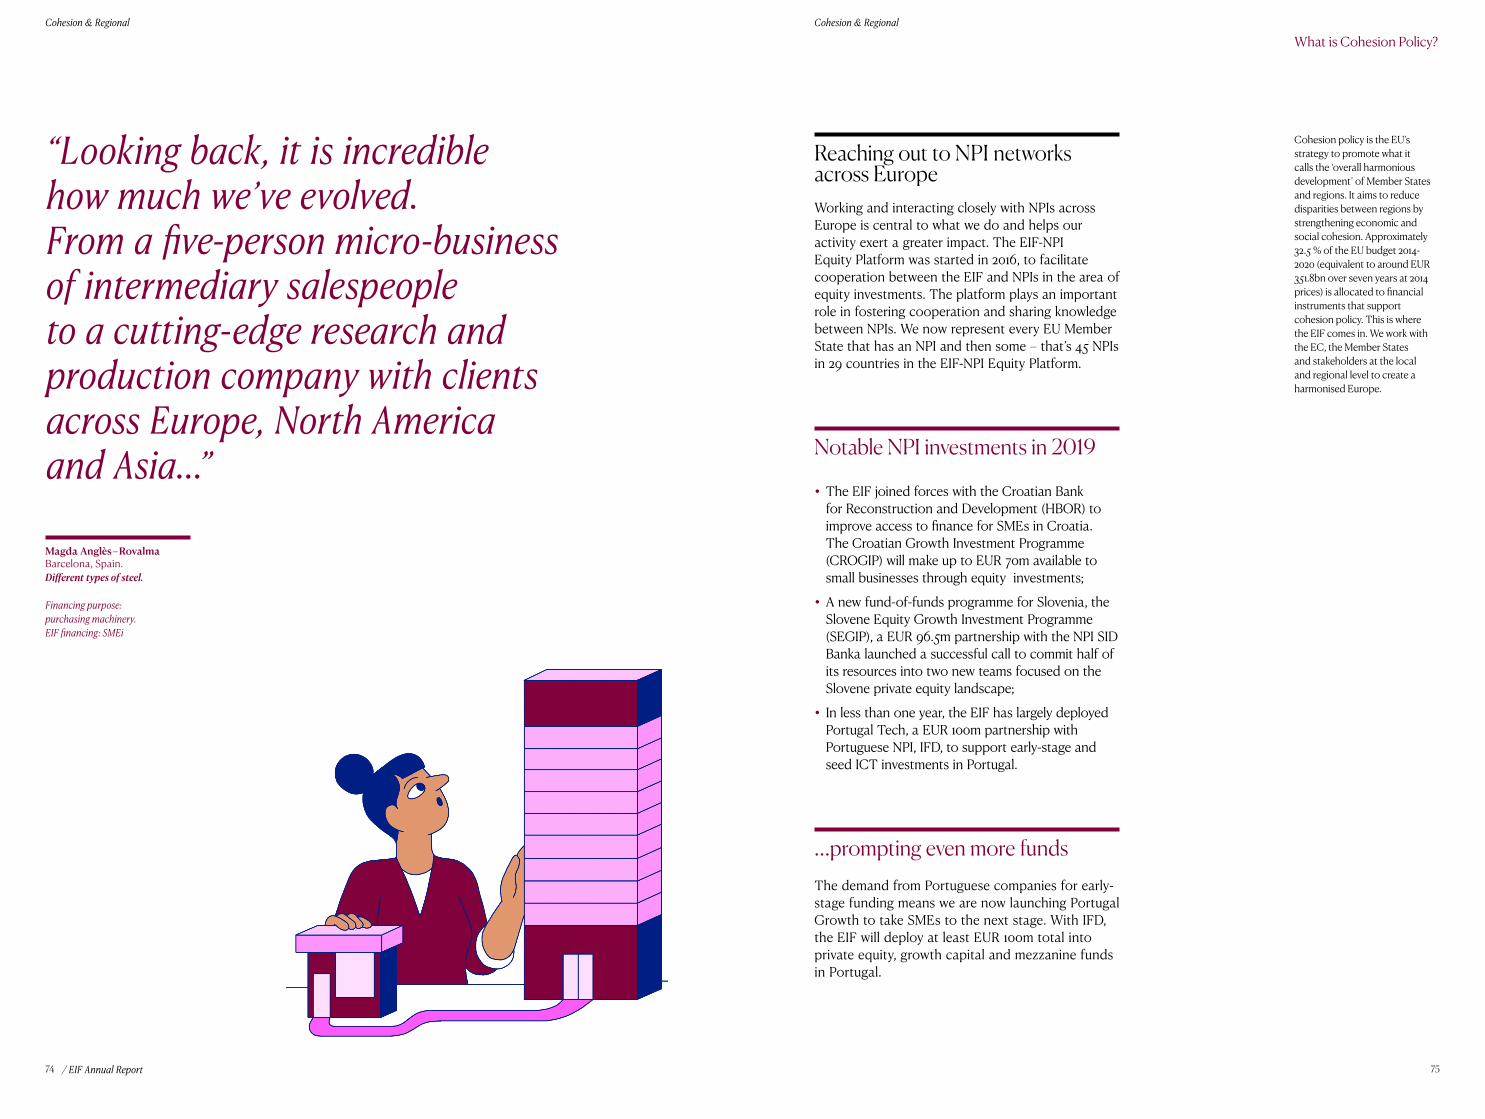
Cohesion & Regional Cohesion & Regional
/ EIF Annual Report 7574
Reaching out to NPI networks across EuropeWorking and interacting closely with NPIs across Europe is central to what we do and helps our activity exert a greater impact. The EIF-NPI Equity Platform was started in 2016, to facilitate cooperation between the EIF and NPIs in the area of equity investments. The platform plays an important role in fostering cooperation and sharing knowledge between NPIs. We now represent every EU Member State that has an NPI and then some – that’s 45 NPIs in 29 countries in the EIF-NPI Equity Platform.
Notable NPI investments in 2019
• The EIF joined forces with the Croatian Bank for Reconstruction and Development (HBOR) to improve access to finance for SMEs in Croatia. The Croatian Growth Investment Programme (CROGIP) will make up to EUR 70m available to small businesses through equity investments;
• A new fund-of-funds programme for Slovenia, the Slovene Equity Growth Investment Programme (SEGIP), a EUR 96.5m partnership with the NPI SID Banka launched a successful call to commit half of its resources into two new teams focused on the Slovene private equity landscape;
• In less than one year, the EIF has largely deployed Portugal Tech, a EUR 100m partnership with Portuguese NPI, IFD, to support early-stage and seed ICT investments in Portugal.
…prompting even more fundsThe demand from Portuguese companies for early-stage funding means we are now launching Portugal Growth to take SMEs to the next stage. With IFD, the EIF will deploy at least EUR 100m total into private equity, growth capital and mezzanine funds in Portugal.
What is Cohesion Policy?
Cohesion policy is the EU’s strategy to promote what it calls the ‘overall harmonious development’ of Member States and regions. It aims to reduce disparities between regions by strengthening economic and social cohesion. Approximately 32.5 % of the EU budget 2014-2020 (equivalent to around EUR 351.8bn over seven years at 2014 prices) is allocated to financial instruments that support cohesion policy. This is where the EIF comes in. We work with the EC, the Member States and stakeholders at the local and regional level to create a harmonised Europe.
“Looking back, it is incredible how much we’ve evolved. From a five-person micro-business of intermediary salespeople to a cutting-edge research and production company with clients across Europe, North America and Asia…”
Magda Anglès – RovalmaBarcelona, Spain. Different types of steel.
Financing purpose: purchasing machinery.EIF financing: SMEi

Cohesion & Regional Cohesion & Regional
/ EIF Annual Report 7776
Making connections with multilateral institutions…We have developed strong connections with NPIs in Member States. However, institutions outside of Member States can also be highly relevant for EU programmes. That is why Innovation Norway and New Business Venture Fund (Iceland) joined the EIF-NPI Equity Platform in 2019, bringing with them their local knowledge and expertise in their own equity markets. Another new member is Black Sea Trade and Development Bank, an international financial institution with a multilateral focus, covering geographies in Eastern Europe. Our new partners will help build the geographical spread of knowledge and skills even further.
…and building new programmes…We have a strong pan-European investment pipeline and we want NPIs to gain exposure to it. A new programme, known as the EIF-NPI Fund Underwriting Programme, means that the EIF will sign commitments in funds and transfer the economic interests to the relevant NPI when the fund invests in the NPI’s country or region. So far, our partnerships include:
• The participation of Belgian NPI SFPI-FPIM for up to EUR 100m;
• The participation of Catalonian NPI, ICF, for EUR 15m.
• By pooling resources and working together, we gradually defragment the venture capital market in the EU.
…but we can do moreWe already work closely with NPIs in the areas of equity and guarantees. We aim to continue working together across Europe to help deliver the objectives of the Capital Markets Union (CMU), namely defragmentation of capital markets.
Challenges aheadWith the new EU budgetary period (InvestEU) on the horizon in 2021, we will have to work out how we can continue to collaborate effectively. We welcome this opportunity to develop new programmes and new cooperation models.
“We gathered all the right ingredients from the start – a good working attitude, high production capacity… but success didn’t come straight away. I didn’t know anything about business plans or marketing so I’ve had to learn it all step by step… Had it not been for the EU’s help, we wouldn’t have been able to meet our demands and keep the business going.”
Dan Popescu – Pop IndustrySlatina, Romania. Production of long-lasting trailers and containers.
Financing purpose: cashflow, purchasing material.EIF financing: SMEi

/ EIF Annual Report 7978
Impact & Looking Ahead
Impact & Looking AheadImpact & Looking Ahead
/ EIF Annual Report 8180
Our Impact
Loan guarantees workLast year we published a large-scale analysis covering over 360,000 EU guaranteed loans granted from 2002 to 2016. These loans amounted to an overall EUR 22bn and represented 19 European countries (approximately 60% of all loan amounts guaranteed by the EU in this period). After receiving a loan guaranteed by the EIF, small businesses grew more rapidly than the control group in terms of total assets, sales and employment. The additional effect on growth is economically significant: it typically ranges from seven to more than 35 percentage points for total assets, 6 to 35% for sales (or turnover) and 8 to 30% for employment levels.
Securitisation mobilises additional lending volumesOur impact in securitisation is most powerful at a catalytic level – for mobilising resources for additional SME lending. By analysing the value added prior to closing (ex-ante), then after (ex-post), we could see where the EIF can add the most value through its securitisation transactions.
EIF-backed VC investments workEIF-backed start-ups grow almost three times as large in terms of assets, almost twice in terms of revenues and twice in terms of employment compared to innovative start-ups that did not receive VC financing. With the help of Invest Europe, we have been able to pull together data on more than 11,500 start-ups supported by venture capital between 2007 and 2014 and identify the economic impact of about 800 early stage VC investments backed by the EIF over this period. With the help of Invest Europe, we’ve also looked at the recent developments of the European VC ecosystem, the way start-ups grow after a VC investment and the way they would have grown had they not received it. VC can make all the difference for some bold and innovative ideas: if we remove VC backing from the picture, half of high growth start-ups (superstars, visionaries, all-rounders) would experience slower growth. For more information, please see The VC Factor report.
Exit environment and fundraising are the biggest challenges in European VCWe carried out the largest-ever survey on European venture capital firms (774 responses from 538 firms) and found that the exit environment, fundraising, high investee company valuations and the lack of high-quality entrepreneurs are perceived as the biggest challenges to the European VC business. Only half of the fund managers considered the fundraising environment to be good. However, the results differ substantially by the respondents’ investment stage and sector focus as well as by region. Analysing the EIF VC Survey results in detail helps us target our support better. For more information please see The EIF Survey 2019 and Ten Things Europe’s VC Managers are Talking About.
High added value of the EIF activities under the European Angels Fund (EAF)Most business angels (BAs) increased their investments thanks to the EAF and, at the same time, did not reduce their personal exposure to the business angel investment. The EAF enables BAs to increase both their reputation among investees and their network. Three quarters of the responding BAs perceive the EAF’s overall added value to be high or very high, and the vast majority of all respondents would work again with the EAF. The EAF procedures are reported to be appropriate, transparent and clear by most of the respondents. For more information, please see The EIF Business Angels Survey 2019.
Sweden has the best conditions for access to financeSmall businesses in Sweden experience the best access to finance and SMEs in Greece, the worst. Understanding which countries need extra support and in which areas, helps us design programmes which help. For more information, please see The EIF SME Access to Finance Index (June 2019 Update).
Improvement in access to finance but one in four SMEs still report severe difficultiesLoans remain important to SMEs. The availability of leasing has improved. Investments in private equity funds are increasing. The crowdfunding market is showing signs of maturity. Yet securitisation is still underdeveloped. Please read The European Small Business Finance Outlook to understand more about the state of small businesses’ access to finance in Europe.
So what is our impact? In 2019, we continued to research the effects of our financing on the different financial markets we support and the results are positive.
Impact & Looking AheadImpact & Looking Ahead
/ EIF Annual Report 8382
Looking Ahead
Climate changeThe EIB Group has ambitious targets to grow its support for climate action and environmental sustainability. This includes aligning to the principles and goals of the Paris Agreement by the end of 2020 and supporting a total of EUR 1 trillion of investments from 2021 to 2030. In fact, the EIB Group will gradually increase the share of its financing dedicated to climate action and environmental sustainability to reach 50% by 2025 and beyond.
…and how the EIF can helpThe EIF has identified climate change as a pressing issue for a number of years now and has actively supported environmental sustainability through its venture capital investments into cleantech funds but also through our guarantee programmes. Going forward, we believe we can play a critical role in delivering on climate action through InvestEU and other mandates:
• We are already designing equity and guarantee products that could support the delivery of InvestEU through all of the four future policy windows;
• We will work on aligning our future investments to the UN Paris Agreement as of 2021.
DigitalisationDLT (including blockchain), AI and IoT promise to change how we live and interact. Yet, according to the EC, Europe is behind in private investments in AI alone, which totalled around EUR 2.4-3.2bn in 2016, compared with EUR 6.5-9.7bn in Asia and EUR 12.1-18.6bn in North America. The launch of dedicated equity financial instruments in digitalisation will help to leverage investment of approximately EUR 600m in the period 2018-2020 (based on leverage targeted through the current EFSI SME Equity window) to small businesses developing these technologies.
Being more impactfulA focus on sustainability and impact-related themes is becoming more central to the European economy – and to our investments. We already invest for social impact under the EaSI and SIA programmes, but now we are looking at new initiatives that will pull institutional investors into a variety of impact-related investments, including health.
The EIF has worked with its partners to catalyse many markets – in different regions, such as Bulgaria, different financial instruments, such as microfinance and varying sectors, such as life sciences. However, many challenges remain. We are becoming more conscious of the world in which we live, particularly climate and sustainability.
Serious changes in technology mean we need to give small businesses and developers in Europe the support that they need, while high-growth businesses in Europe need support scaling up. Our challenge will be to anticipate the needs of future SMEs and meet these demands.
Impact & Looking AheadImpact & Looking Ahead
/ EIF Annual Report 8584
Raising the bar with InvestEUWe must continue to create a playing field in which European companies can kick off their business, scale up and compete internationally. We do this through our programmes, but also through contributing to the objectives of the Capital Markets Union and strengthening the EU single market. InvestEU will channel private and public investment into sustainable infrastructure, research, innovation and digitisation, SMEs and social and investment skills.
Filling financing gaps at earliest stage and latest…We need to offer continuity in our support throughout the lifetime of a company, from its early days to commercialisation, growth, straight through to internationalisation and eventually even IPO. This also goes for debt instruments. We have developed several generations of guarantee instruments and reached a point where they are working well. We need to capitalise on this and ensure that the next generation of debt instruments is equally ambitious and impactful.
DLT workshops, life sciences, AIIn 2019, we spoke in depth to market practitioners to understand how the EIF could support DLT, AI and life sciences. Our findings may produce new pilot mandates for these areas.
New markets for technologyWe are accessing one of the most developed markets for technology in the world with four venture capital investments signed in Israel. Three of them closed, while the fourth one is still raising an amount equivalent to what we committed. Our objective is to address the pre-seed and seed-stage market gap and to help develop the business relationship between the EU and Israel.
Diversifying our funding sourcesWe will continue to diversify funding sources. By building relationships with NPIs and multilateral institutions. By working on crowding in more institutional investors. By directly investing institutional investor capital in European small businesses through our AMUF vehicle and other new initiatives.
…and now we’re breaching new frontiersHow to support new innovative technologies such as DLT and AI is at the forefront of our priorities.
What is InvestEU?
InvestEU is a component of the Multi-Annual Financial Framework (MFF), the new seven-year EU budget beginning in 2021. The InvestEU Programme will mobilise public and private investment in the EU, addressing market failures and investment gaps that hamper growth and helping to reach EU policy goals such as sustainability, scientific excellence and social inclusion. Through an EU budget guarantee of EUR 38bn, the InvestEU Fund will back the investment projects of the EIB Group and other financial partners and increase their risk-bearing capacity. The InvestEU Fund will also feature a Member-State compartment for each policy area, meaning that Member States may add to the EU guarantee’s provisioning by voluntarily channelling a percentage of their Cohesion Policy funds.
What is EFSI 2?
The second phase of EFSI entered into force in January 2019. The additional scope’s objectives include sustainable agriculture, forestry, fishery, aquaculture and other elements of the wider bioeconomy. EFSI 2 also emphasises enhanced additionality and transparency. It has reinforced geographic
coverage: more targeted technical assistance and combination of other sources of Union funding to support less-developed regions and transition regions. The European Investment Advisory Hub is reinforced, targeting technical assistance and support on the establishment of investment platforms.
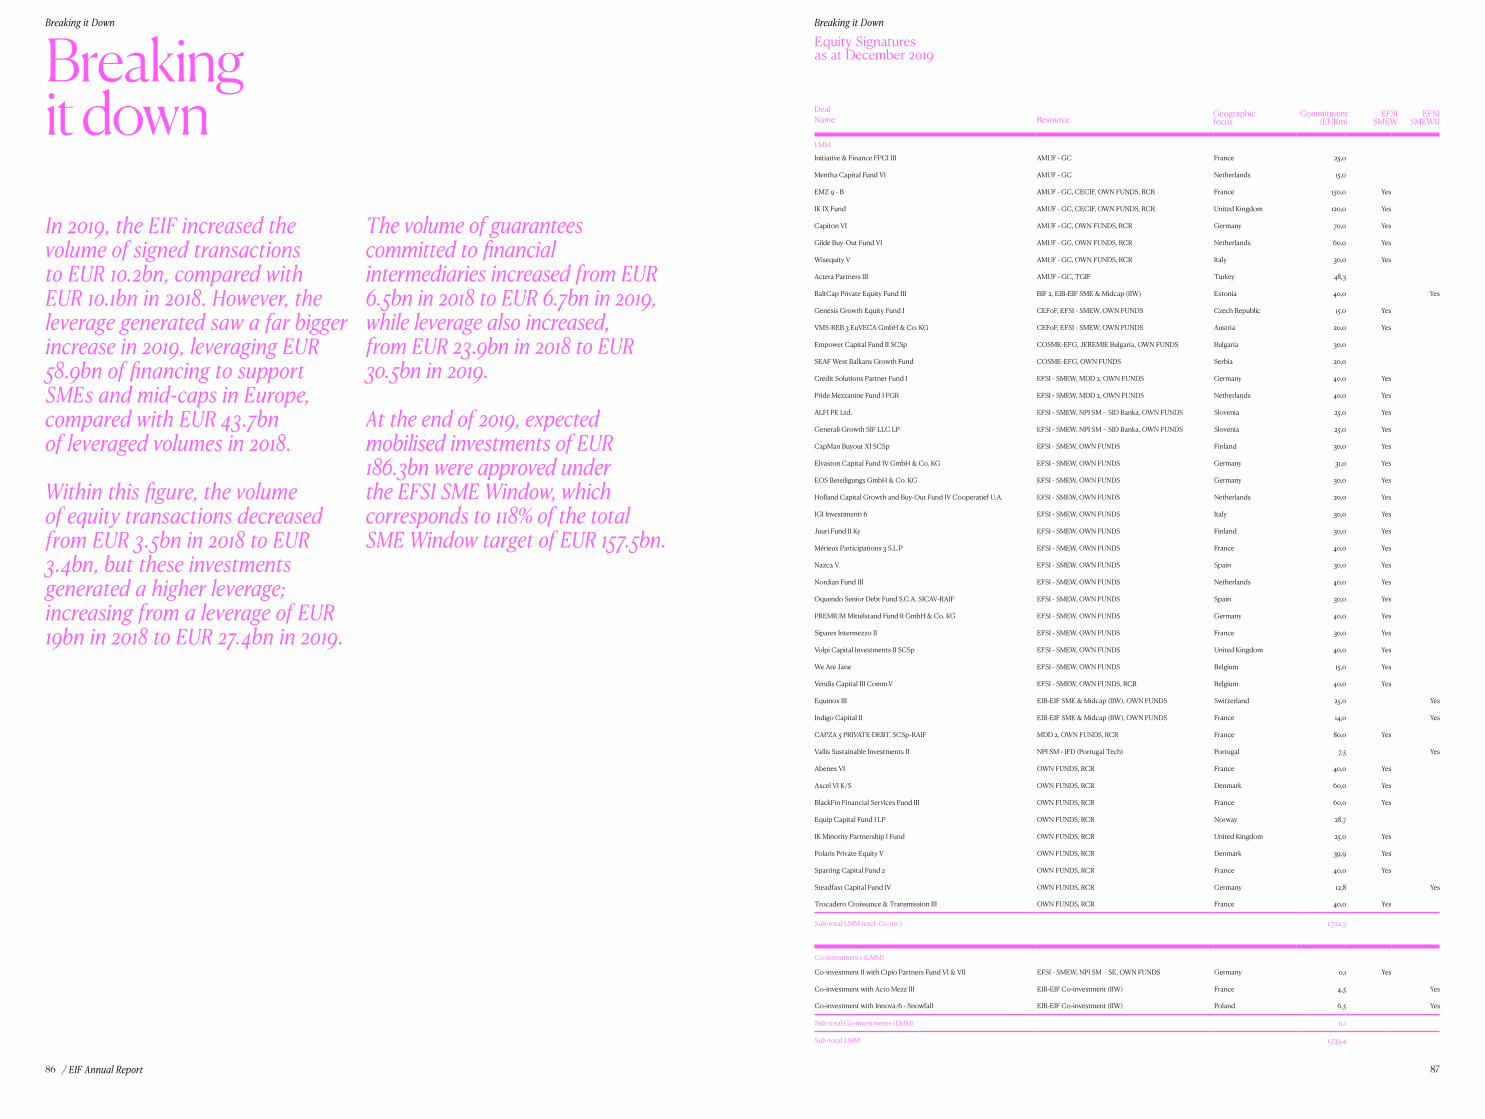
Breaking it DownBreaking it Down
/ EIF Annual Report 8786
Breaking it downIn 2019, the EIF increased the volume of signed transactions to EUR 10.2bn, compared with EUR 10.1bn in 2018. However, the leverage generated saw a far bigger increase in 2019, leveraging EUR 58.9bn of financing to support SMEs and mid-caps in Europe, compared with EUR 43.7bn of leveraged volumes in 2018.
Within this figure, the volume of equity transactions decreased from EUR 3.5bn in 2018 to EUR 3.4bn, but these investments generated a higher leverage; increasing from a leverage of EUR 19bn in 2018 to EUR 27.4bn in 2019.
The volume of guarantees committed to financial intermediaries increased from EUR 6.5bn in 2018 to EUR 6.7bn in 2019, while leverage also increased, from EUR 23.9bn in 2018 to EUR 30.5bn in 2019.
At the end of 2019, expected mobilised investments of EUR 186.3bn were approved under the EFSI SME Window, which corresponds to 118% of the total SME Window target of EUR 157.5bn.
Equity Signaturesas at December 2019
DealName Resource
Geographicfocus
Commitment(EURm)
EFSI SMEW
EFSI SMEWII
LMM
Initiative & Finance FPCI III AMUF - GC France 25,0
Mentha Capital Fund VI AMUF - GC Netherlands 15,0
EMZ 9 - B AMUF - GC, CECIF, OWN FUNDS, RCR France 150,0 Yes
IK IX Fund AMUF - GC, CECIF, OWN FUNDS, RCR United Kingdom 120,0 Yes
Capiton VI AMUF - GC, OWN FUNDS, RCR Germany 70,0 Yes
Gilde Buy-Out Fund VI AMUF - GC, OWN FUNDS, RCR Netherlands 60,0 Yes
Wisequity V AMUF - GC, OWN FUNDS, RCR Italy 30,0 Yes
Actera Partners III AMUF - GC, TGIF Turkey 48,3
BaltCap Private Equity Fund III BIF 2, EIB-EIF SME & Midcap (IIW) Estonia 40,0 Yes
Genesis Growth Equity Fund I CEFoF, EFSI - SMEW, OWN FUNDS Czech Republic 15,0 Yes
VMS-REB 3 EuVECA GmbH & Co. KG CEFoF, EFSI - SMEW, OWN FUNDS Austria 20,0 Yes
Empower Capital Fund II SCSp COSME-EFG, JEREMIE Bulgaria, OWN FUNDS Bulgaria 30,0
SEAF West Balkans Growth Fund COSME-EFG, OWN FUNDS Serbia 20,0
Credit Solutions Partner Fund I EFSI - SMEW, MDD 2, OWN FUNDS Germany 40,0 Yes
Pride Mezzanine Fund I FGR EFSI - SMEW, MDD 2, OWN FUNDS Netherlands 40,0 Yes
ALFI PE Ltd. EFSI - SMEW, NPI SM – SID Banka, OWN FUNDS Slovenia 25,0 Yes
Generali Growth SIF LLC LP EFSI - SMEW, NPI SM – SID Banka, OWN FUNDS Slovenia 25,0 Yes
CapMan Buyout XI SCSp EFSI - SMEW, OWN FUNDS Finland 30,0 Yes
Elvaston Capital Fund IV GmbH & Co. KG EFSI - SMEW, OWN FUNDS Germany 31,0 Yes
EOS Beteiligungs GmbH & Co. KG EFSI - SMEW, OWN FUNDS Germany 30,0 Yes
Holland Capital Growth and Buy-Out Fund IV Cooperatief U.A. EFSI - SMEW, OWN FUNDS Netherlands 20,0 Yes
IGI Investimenti 6 EFSI - SMEW, OWN FUNDS Italy 30,0 Yes
Juuri Fund II Ky EFSI - SMEW, OWN FUNDS Finland 30,0 Yes
Mérieux Participations 3 S.L.P EFSI - SMEW, OWN FUNDS France 40,0 Yes
Nazca V EFSI - SMEW, OWN FUNDS Spain 30,0 Yes
Nordian Fund III EFSI - SMEW, OWN FUNDS Netherlands 40,0 Yes
Oquendo Senior Debt Fund S.C.A. SICAV-RAIF EFSI - SMEW, OWN FUNDS Spain 30,0 Yes
PREMIUM Mittelstand Fund II GmbH & Co. KG EFSI - SMEW, OWN FUNDS Germany 40,0 Yes
Siparex Intermezzo II EFSI - SMEW, OWN FUNDS France 30,0 Yes
Volpi Capital Investments II SCSp EFSI - SMEW, OWN FUNDS United Kingdom 40,0 Yes
We Are Jane EFSI - SMEW, OWN FUNDS Belgium 15,0 Yes
Vendis Capital III Comm.V EFSI - SMEW, OWN FUNDS, RCR Belgium 40,0 Yes
Equinox III EIB-EIF SME & Midcap (IIW), OWN FUNDS Switzerland 25,0 Yes
Indigo Capital II EIB-EIF SME & Midcap (IIW), OWN FUNDS France 14,0 Yes
CAPZA 5 PRIVATE DEBT, SCSp-RAIF MDD 2, OWN FUNDS, RCR France 80,0 Yes
Vallis Sustainable Investments II NPI SM - IFD (Portugal Tech) Portugal 7,5 Yes
Abenex VI OWN FUNDS, RCR France 40,0 Yes
Axcel VI K/S OWN FUNDS, RCR Denmark 60,0 Yes
BlackFin Financial Services Fund III OWN FUNDS, RCR France 60,0 Yes
Equip Capital Fund I LP OWN FUNDS, RCR Norway 28,7
IK Minority Partnership I Fund OWN FUNDS, RCR United Kingdom 25,0 Yes
Polaris Private Equity V OWN FUNDS, RCR Denmark 39,9 Yes
Sparring Capital Fund 2 OWN FUNDS, RCR France 40,0 Yes
Steadfast Capital Fund IV OWN FUNDS, RCR Germany 12,8 Yes
Trocadero Croissance & Transmission III OWN FUNDS, RCR France 40,0 Yes
Sub-total LMM (excl. Co-inv.) 1.722,3
Co-investments (LMM)
Co-investment II with Cipio Partners Fund VI & VII EFSI - SMEW, NPI SM – SE, OWN FUNDS Germany 0,1 Yes
Co-investment with Acto Mezz III EIB-EIF Co-investment (IIW) France 4,5 Yes
Co-investment with Innova/6 - Snowfall EIB-EIF Co-investment (IIW) Poland 6,5 Yes
Sub-total Co-investments (LMM) 11,1
Sub-total LMM 1.733,4
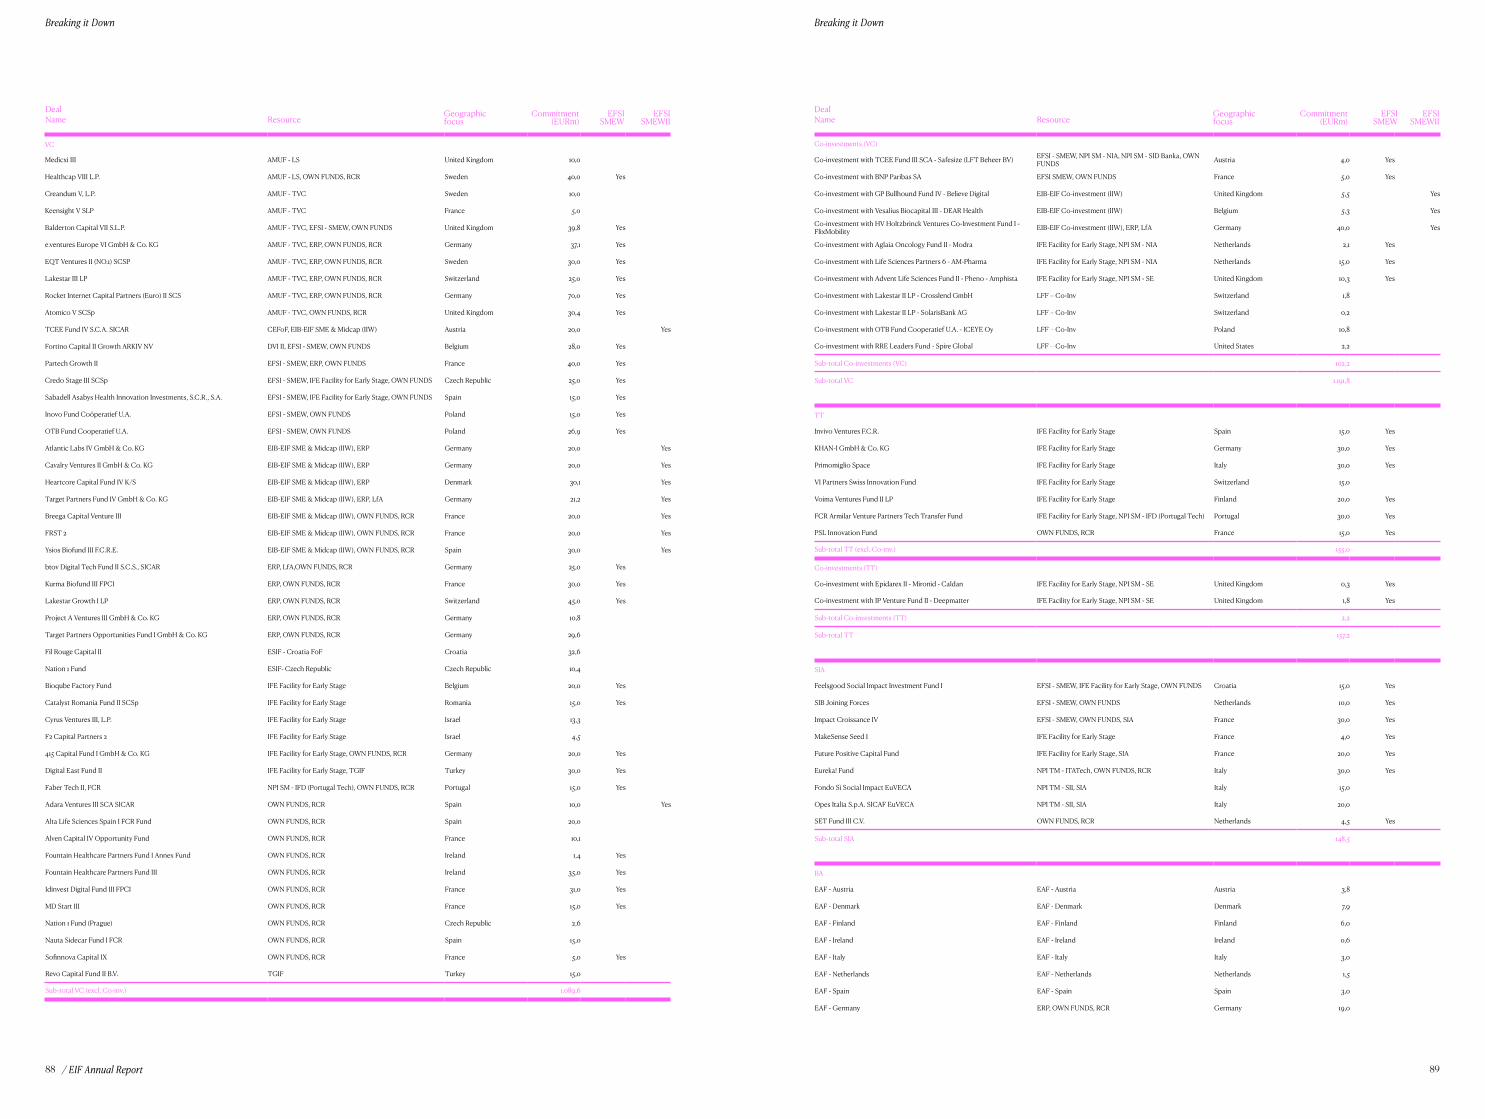
Breaking it DownBreaking it Down
/ EIF Annual Report 8988
DealName Resource
Geographicfocus
Commitment(EURm)
EFSI SMEW
EFSI SMEWII
VC
Medicxi III AMUF - LS United Kingdom 10,0
Healthcap VIII L.P. AMUF - LS, OWN FUNDS, RCR Sweden 40,0 Yes
Creandum V, L.P. AMUF - TVC Sweden 10,0
Keensight V SLP AMUF - TVC France 5,0
Balderton Capital VII S.L.P. AMUF - TVC, EFSI - SMEW, OWN FUNDS United Kingdom 39,8 Yes
e.ventures Europe VI GmbH & Co. KG AMUF - TVC, ERP, OWN FUNDS, RCR Germany 37,1 Yes
EQT Ventures II (NO.1) SCSP AMUF - TVC, ERP, OWN FUNDS, RCR Sweden 30,0 Yes
Lakestar III LP AMUF - TVC, ERP, OWN FUNDS, RCR Switzerland 25,0 Yes
Rocket Internet Capital Partners (Euro) II SCS AMUF - TVC, ERP, OWN FUNDS, RCR Germany 70,0 Yes
Atomico V SCSp AMUF - TVC, OWN FUNDS, RCR United Kingdom 30,4 Yes
TCEE Fund IV S.C.A. SICAR CEFoF, EIB-EIF SME & Midcap (IIW) Austria 20,0 Yes
Fortino Capital II Growth ARKIV NV DVI II, EFSI - SMEW, OWN FUNDS Belgium 28,0 Yes
Partech Growth II EFSI - SMEW, ERP, OWN FUNDS France 40,0 Yes
Credo Stage III SCSp EFSI - SMEW, IFE Facility for Early Stage, OWN FUNDS Czech Republic 25,0 Yes
Sabadell Asabys Health Innovation Investments, S.C.R., S.A. EFSI - SMEW, IFE Facility for Early Stage, OWN FUNDS Spain 15,0 Yes
Inovo Fund Coöperatief U.A. EFSI - SMEW, OWN FUNDS Poland 15,0 Yes
OTB Fund Cooperatief U.A. EFSI - SMEW, OWN FUNDS Poland 26,9 Yes
Atlantic Labs IV GmbH & Co. KG EIB-EIF SME & Midcap (IIW), ERP Germany 20,0 Yes
Cavalry Ventures II GmbH & Co. KG EIB-EIF SME & Midcap (IIW), ERP Germany 20,0 Yes
Heartcore Capital Fund IV K/S EIB-EIF SME & Midcap (IIW), ERP Denmark 30,1 Yes
Target Partners Fund IV GmbH & Co. KG EIB-EIF SME & Midcap (IIW), ERP, LfA Germany 21,2 Yes
Breega Capital Venture III EIB-EIF SME & Midcap (IIW), OWN FUNDS, RCR France 20,0 Yes
FRST 2 EIB-EIF SME & Midcap (IIW), OWN FUNDS, RCR France 20,0 Yes
Ysios Biofund III F.C.R.E. EIB-EIF SME & Midcap (IIW), OWN FUNDS, RCR Spain 30,0 Yes
btov Digital Tech Fund II S.C.S., SICAR ERP, LfA,OWN FUNDS, RCR Germany 25,0 Yes
Kurma Biofund III FPCI ERP, OWN FUNDS, RCR France 30,0 Yes
Lakestar Growth I LP ERP, OWN FUNDS, RCR Switzerland 45,0 Yes
Project A Ventures III GmbH & Co. KG ERP, OWN FUNDS, RCR Germany 10,8
Target Partners Opportunities Fund I GmbH & Co. KG ERP, OWN FUNDS, RCR Germany 29,6
Fil Rouge Capital II ESIF - Croatia FoF Croatia 32,6
Nation 1 Fund ESIF- Czech Republic Czech Republic 10,4
Bioqube Factory Fund IFE Facility for Early Stage Belgium 20,0 Yes
Catalyst Romania Fund II SCSp IFE Facility for Early Stage Romania 15,0 Yes
Cyrus Ventures III, L.P. IFE Facility for Early Stage Israel 13,3
F2 Capital Partners 2 IFE Facility for Early Stage Israel 4,5
415 Capital Fund I GmbH & Co. KG IFE Facility for Early Stage, OWN FUNDS, RCR Germany 20,0 Yes
Digital East Fund II IFE Facility for Early Stage, TGIF Turkey 30,0 Yes
Faber Tech II, FCR NPI SM - IFD (Portugal Tech), OWN FUNDS, RCR Portugal 15,0 Yes
Adara Ventures III SCA SICAR OWN FUNDS, RCR Spain 10,0 Yes
Alta Life Sciences Spain I FCR Fund OWN FUNDS, RCR Spain 20,0
Alven Capital IV Opportunity Fund OWN FUNDS, RCR France 10,1
Fountain Healthcare Partners Fund I Annex Fund OWN FUNDS, RCR Ireland 1,4 Yes
Fountain Healthcare Partners Fund III OWN FUNDS, RCR Ireland 35,0 Yes
Idinvest Digital Fund III FPCI OWN FUNDS, RCR France 31,0 Yes
MD Start III OWN FUNDS, RCR France 15,0 Yes
Nation 1 Fund (Prague) OWN FUNDS, RCR Czech Republic 2,6
Nauta Sidecar Fund I FCR OWN FUNDS, RCR Spain 15,0
Sofinnova Capital IX OWN FUNDS, RCR France 5,0 Yes
Revo Capital Fund II B.V. TGIF Turkey 15,0
Sub-total VC (excl. Co-inv.) 1.089,6
Co-investments (VC)
Co-investment with TCEE Fund III SCA - Safesize (LFT Beheer BV) EFSI - SMEW, NPI SM - NIA, NPI SM - SID Banka, OWN FUNDS Austria 4,0 Yes
Co-investment with BNP Paribas SA EFSI SMEW, OWN FUNDS France 5,0 Yes
Co-investment with GP Bullhound Fund IV - Believe Digital EIB-EIF Co-investment (IIW) United Kingdom 5,5 Yes
Co-investment with Vesalius Biocapital III - DEAR Health EIB-EIF Co-investment (IIW) Belgium 5,3 Yes
Co-investment with HV Holtzbrinck Ventures Co-Investment Fund I - FlixMobility EIB-EIF Co-investment (IIW), ERP, LfA Germany 40,0 Yes
Co-investment with Aglaia Oncology Fund II - Modra IFE Facility for Early Stage, NPI SM - NIA Netherlands 2,1 Yes
Co-investment with Life Sciences Partners 6 - AM-Pharma IFE Facility for Early Stage, NPI SM - NIA Netherlands 15,0 Yes
Co-investment with Advent Life Sciences Fund II - Pheno - Amphista IFE Facility for Early Stage, NPI SM - SE United Kingdom 10,3 Yes
Co-investment with Lakestar II LP - Crosslend GmbH LFF – Co-Inv Switzerland 1,8
Co-investment with Lakestar II LP - SolarisBank AG LFF – Co-Inv Switzerland 0,2
Co-investment with OTB Fund Cooperatief U.A. - ICEYE Oy LFF – Co-Inv Poland 10,8
Co-investment with RRE Leaders Fund - Spire Global LFF – Co-Inv United States 2,2
Sub-total Co-investments (VC) 102,2
Sub-total VC 1.191,8
TT
Invivo Ventures F.C.R. IFE Facility for Early Stage Spain 15,0 Yes
KHAN-I GmbH & Co. KG IFE Facility for Early Stage Germany 30,0 Yes
Primomiglio Space IFE Facility for Early Stage Italy 30,0 Yes
VI Partners Swiss Innovation Fund IFE Facility for Early Stage Switzerland 15,0
Voima Ventures Fund II LP IFE Facility for Early Stage Finland 20,0 Yes
FCR Armilar Venture Partners Tech Transfer Fund IFE Facility for Early Stage, NPI SM - IFD (Portugal Tech) Portugal 30,0 Yes
PSL Innovation Fund OWN FUNDS, RCR France 15,0 Yes
Sub-total TT (excl. Co-inv.) 155,0
Co-investments (TT)
Co-investment with Epidarex II - Mironid - Caldan IFE Facility for Early Stage, NPI SM - SE United Kingdom 0,3 Yes
Co-investment with IP Venture Fund II - Deepmatter IFE Facility for Early Stage, NPI SM - SE United Kingdom 1,8 Yes
Sub-total Co-investments (TT) 2,2
Sub-total TT 157,2
SIA
Feelsgood Social Impact Investment Fund I EFSI - SMEW, IFE Facility for Early Stage, OWN FUNDS Croatia 15,0 Yes
SIB Joining Forces EFSI - SMEW, OWN FUNDS Netherlands 10,0 Yes
Impact Croissance IV EFSI - SMEW, OWN FUNDS, SIA France 30,0 Yes
MakeSense Seed I IFE Facility for Early Stage France 4,0 Yes
Future Positive Capital Fund IFE Facility for Early Stage, SIA France 20,0 Yes
Eureka! Fund NPI TM - ITATech, OWN FUNDS, RCR Italy 30,0 Yes
Fondo Sì Social Impact EuVECA NPI TM - SII, SIA Italy 15,0
Opes Italia S.p.A. SICAF EuVECA NPI TM - SII, SIA Italy 20,0
SET Fund III C.V. OWN FUNDS, RCR Netherlands 4,5 Yes
Sub-total SIA 148,5
BA
EAF - Austria EAF - Austria Austria 3,8
EAF - Denmark EAF - Denmark Denmark 7,9
EAF - Finland EAF - Finland Finland 6,0
EAF - Ireland EAF - Ireland Ireland 0,6
EAF - Italy EAF - Italy Italy 3,0
EAF - Netherlands EAF - Netherlands Netherlands 1,5
EAF - Spain EAF - Spain Spain 3,0
EAF - Germany ERP, OWN FUNDS, RCR Germany 19,0
DealName Resource
Geographicfocus
Commitment(EURm)
EFSI SMEW
EFSI SMEWII
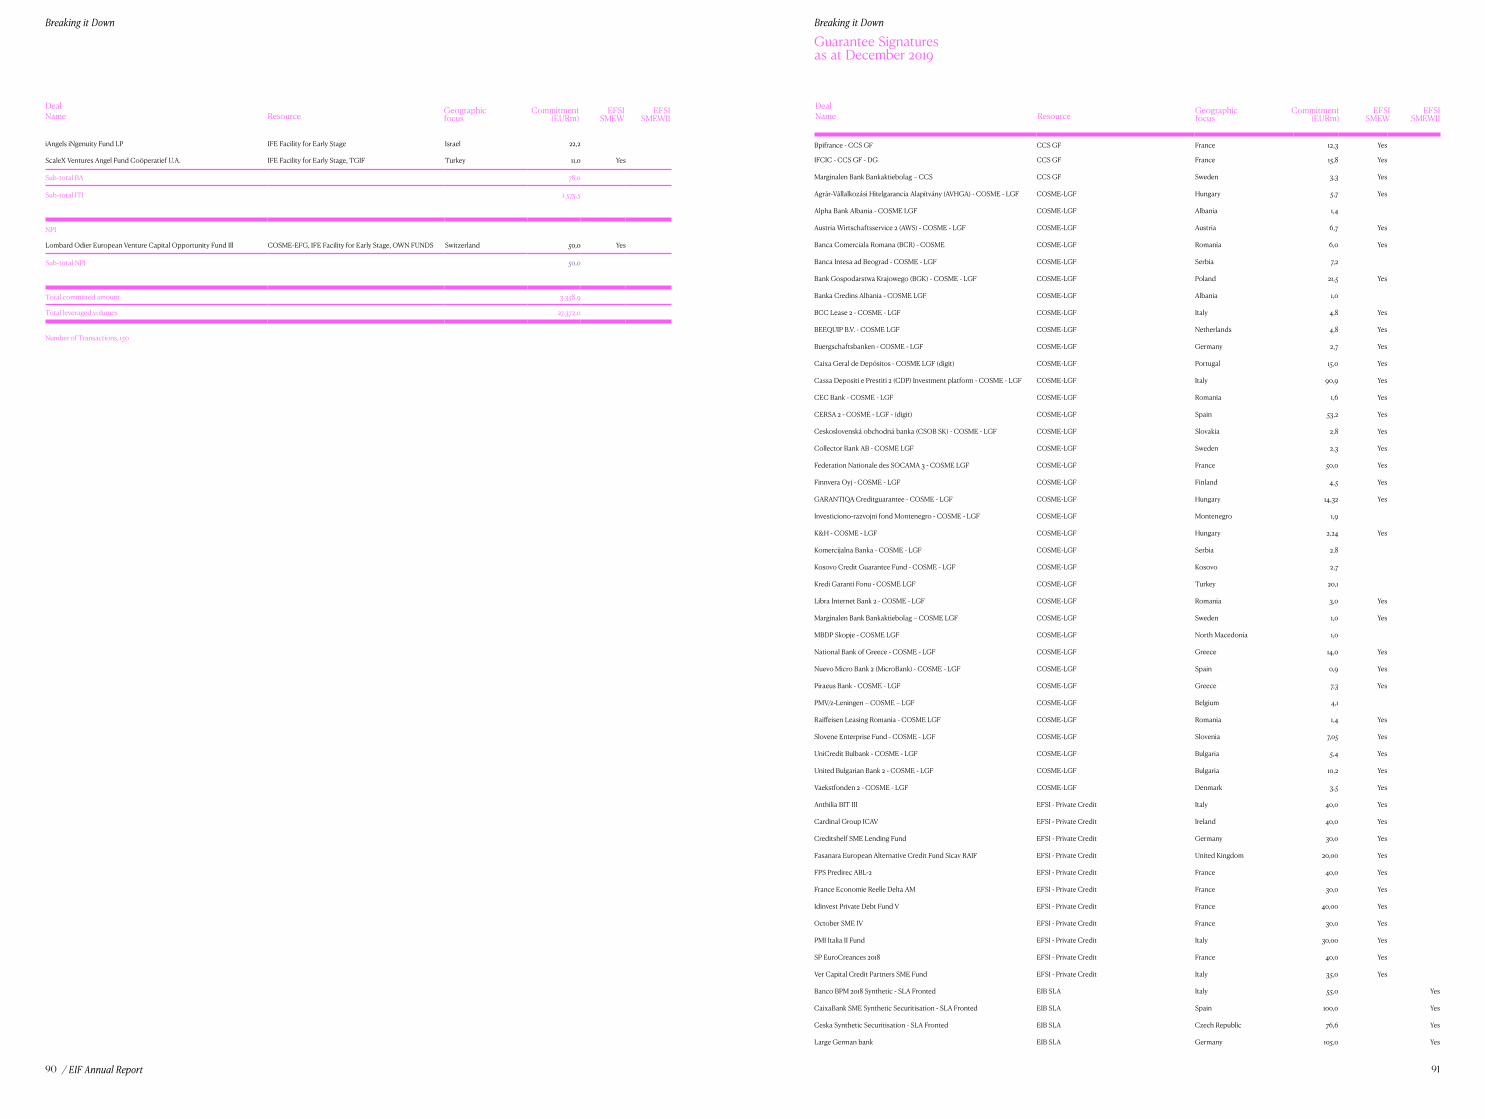
Breaking it DownBreaking it Down
/ EIF Annual Report 9190
DealName Resource Geographic
focusCommitment
(EURm)EFSI
SMEWEFSI
SMEWII
Number of Transactions, 150
Guarantee Signatures as at December 2019
DealName Resource Geographic
focusCommitment
(EURm)EFSI
SMEWEFSI
SMEWII
iAngels iNgenuity Fund LP IFE Facility for Early Stage Israel 22,2
ScaleX Ventures Angel Fund Coöperatief U.A. IFE Facility for Early Stage, TGIF Turkey 11,0 Yes
Sub-total BA 78,0
Sub-total ITI 1.575,5
NPI
Lombard Odier European Venture Capital Opportunity Fund Ill COSME-EFG, IFE Facility for Early Stage, OWN FUNDS Switzerland 50,0 Yes
Sub-total NPI 50,0
Total committed amount 3.358,9
Total leveraged volumes 27.372,0
Bpifrance - CCS GF CCS GF France 12,3 Yes
IFCIC - CCS GF - DG CCS GF France 15,8 Yes
Marginalen Bank Bankaktiebolag – CCS CCS GF Sweden 3,3 Yes
Agrár-Vállalkozási Hitelgarancia Alapítvány (AVHGA) - COSME - LGF COSME-LGF Hungary 5,7 Yes
Alpha Bank Albania - COSME LGF COSME-LGF Albania 1,4
Austria Wirtschaftsservice 2 (AWS) - COSME - LGF COSME-LGF Austria 6,7 Yes
Banca Comerciala Romana (BCR) - COSME COSME-LGF Romania 6,0 Yes
Banca Intesa ad Beograd - COSME - LGF COSME-LGF Serbia 7,2
Bank Gospodarstwa Krajowego (BGK) - COSME - LGF COSME-LGF Poland 21,5 Yes
Banka Credins Albania - COSME LGF COSME-LGF Albania 1,0
BCC Lease 2 - COSME - LGF COSME-LGF Italy 4,8 Yes
BEEQUIP B.V. - COSME LGF COSME-LGF Netherlands 4,8 Yes
Buergschaftsbanken - COSME - LGF COSME-LGF Germany 2,7 Yes
Caixa Geral de Depósitos - COSME LGF (digit) COSME-LGF Portugal 15,0 Yes
Cassa Depositi e Prestiti 2 (CDP) Investment platform - COSME - LGF COSME-LGF Italy 90,9 Yes
CEC Bank - COSME - LGF COSME-LGF Romania 1,6 Yes
CERSA 2 - COSME - LGF - (digit) COSME-LGF Spain 53,2 Yes
Ceskoslovenská obchodná banka (CSOB SK) - COSME - LGF COSME-LGF Slovakia 2,8 Yes
Collector Bank AB - COSME LGF COSME-LGF Sweden 2,3 Yes
Federation Nationale des SOCAMA 3 - COSME LGF COSME-LGF France 50,0 Yes
Finnvera Oyj - COSME - LGF COSME-LGF Finland 4,5 Yes
GARANTIQA Creditguarantee - COSME - LGF COSME-LGF Hungary 14,32 Yes
Investiciono-razvojni fond Montenegro - COSME - LGF COSME-LGF Montenegro 1,9
K&H - COSME - LGF COSME-LGF Hungary 2,24 Yes
Komercijalna Banka - COSME - LGF COSME-LGF Serbia 2,8
Kosovo Credit Guarantee Fund - COSME - LGF COSME-LGF Kosovo 2,7
Kredi Garanti Fonu - COSME LGF COSME-LGF Turkey 20,1
Libra Internet Bank 2 - COSME - LGF COSME-LGF Romania 3,0 Yes
Marginalen Bank Bankaktiebolag – COSME LGF COSME-LGF Sweden 1,0 Yes
MBDP Skopje - COSME LGF COSME-LGF North Macedonia 1,0
National Bank of Greece - COSME - LGF COSME-LGF Greece 14,0 Yes
Nuevo Micro Bank 2 (MicroBank) - COSME - LGF COSME-LGF Spain 0,9 Yes
Piraeus Bank - COSME - LGF COSME-LGF Greece 7,3 Yes
PMV/z-Leningen – COSME – LGF COSME-LGF Belgium 4,1
Raiffeisen Leasing Romania - COSME LGF COSME-LGF Romania 1,4 Yes
Slovene Enterprise Fund - COSME - LGF COSME-LGF Slovenia 7,05 Yes
UniCredit Bulbank - COSME - LGF COSME-LGF Bulgaria 5,4 Yes
United Bulgarian Bank 2 - COSME - LGF COSME-LGF Bulgaria 10,2 Yes
Vaekstfonden 2 - COSME - LGF COSME-LGF Denmark 3,5 Yes
Anthilia BIT III EFSI - Private Credit Italy 40,0 Yes
Cardinal Group ICAV EFSI - Private Credit Ireland 40,0 Yes
Creditshelf SME Lending Fund EFSI - Private Credit Germany 30,0 Yes
Fasanara European Alternative Credit Fund Sicav RAIF EFSI - Private Credit United Kingdom 20,00 Yes
FPS Predirec ABL-2 EFSI - Private Credit France 40,0 Yes
France Economie Reelle Delta AM EFSI - Private Credit France 30,0 Yes
Idinvest Private Debt Fund V EFSI - Private Credit France 40,00 Yes
October SME IV EFSI - Private Credit France 30,0 Yes
PMI Italia II Fund EFSI - Private Credit Italy 30,00 Yes
SP EuroCreances 2018 EFSI - Private Credit France 40,0 Yes
Ver Capital Credit Partners SME Fund EFSI - Private Credit Italy 35,0 Yes
Banco BPM 2018 Synthetic - SLA Fronted EIB SLA Italy 55,0 Yes
CaixaBank SME Synthetic Securitisation - SLA Fronted EIB SLA Spain 100,0 Yes
Ceska Synthetic Securitisation - SLA Fronted EIB SLA Czech Republic 76,6 Yes
Large German bank EIB SLA Germany 105,0 Yes
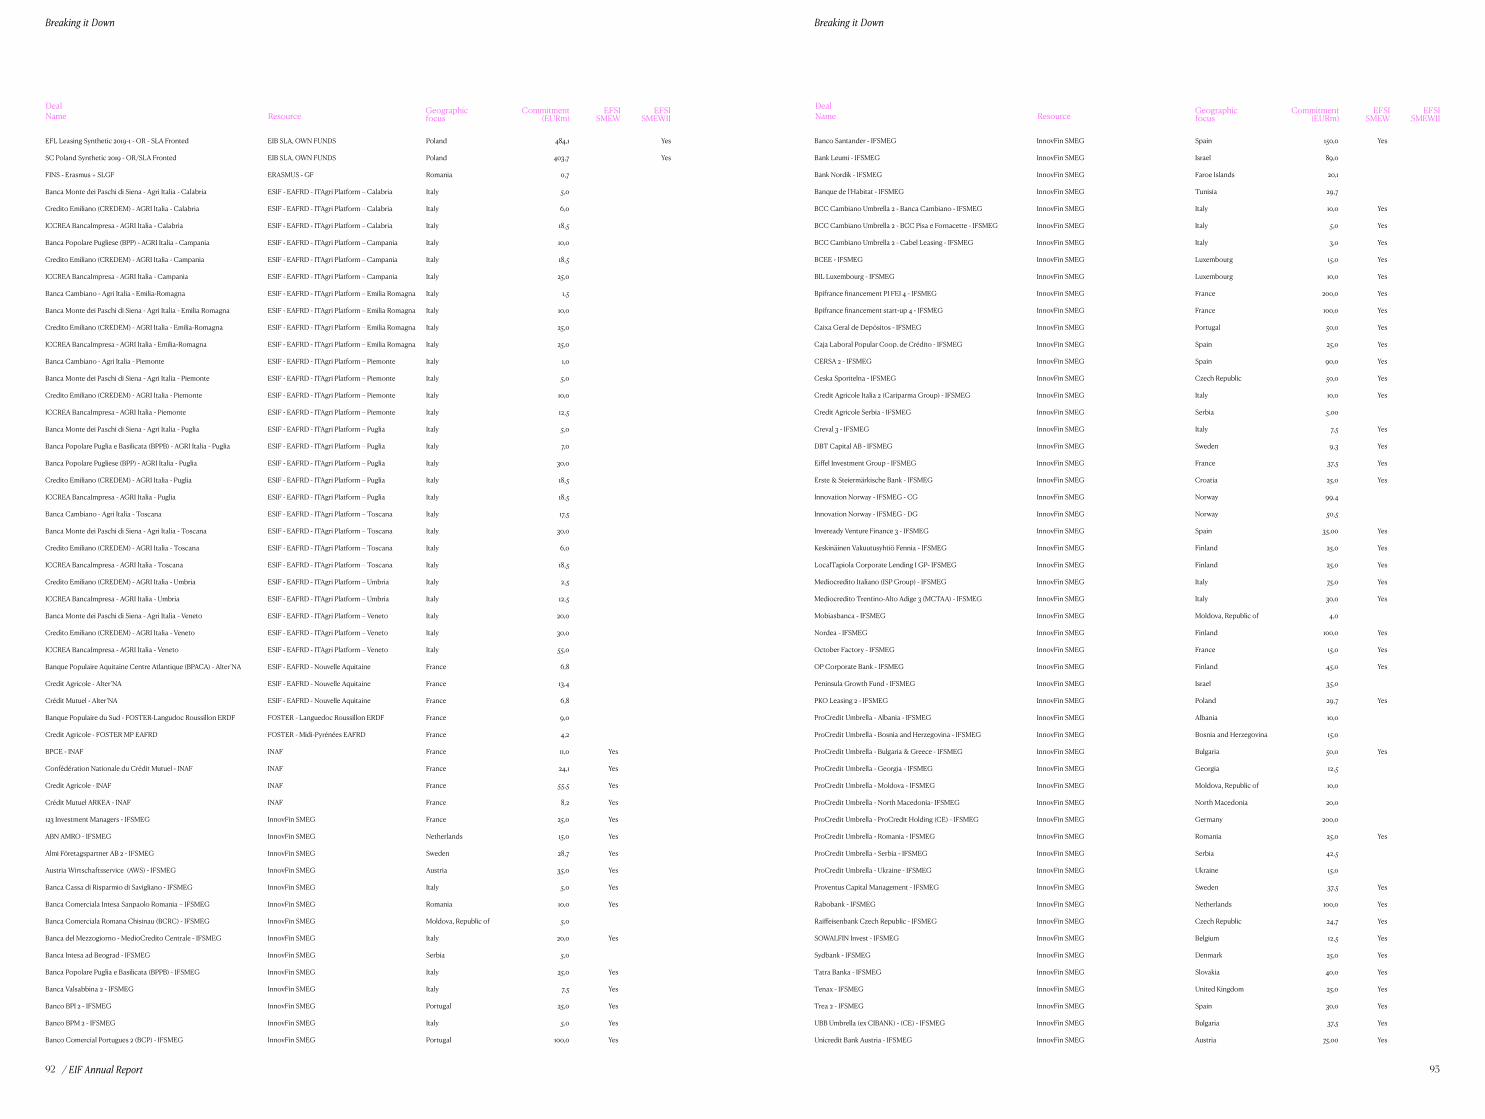
Breaking it DownBreaking it Down
/ EIF Annual Report 9392
EFL Leasing Synthetic 2019-1 - OR - SLA Fronted EIB SLA, OWN FUNDS Poland 484,1 Yes
SC Poland Synthetic 2019 - OR/SLA Fronted EIB SLA, OWN FUNDS Poland 403,7 Yes
FINS - Erasmus + SLGF ERASMUS - GF Romania 0,7
Banca Monte dei Paschi di Siena - Agri Italia - Calabria ESIF - EAFRD - ITAgri Platform – Calabria Italy 5,0
Credito Emiliano (CREDEM) - AGRI Italia - Calabria ESIF - EAFRD - ITAgri Platform – Calabria Italy 6,0
ICCREA BancaImpresa - AGRI Italia - Calabria ESIF - EAFRD - ITAgri Platform – Calabria Italy 18,5
Banca Popolare Pugliese (BPP) - AGRI Italia - Campania ESIF - EAFRD - ITAgri Platform – Campania Italy 10,0
Credito Emiliano (CREDEM) - AGRI Italia - Campania ESIF - EAFRD - ITAgri Platform – Campania Italy 18,5
ICCREA BancaImpresa - AGRI Italia - Campania ESIF - EAFRD - ITAgri Platform – Campania Italy 25,0
Banca Cambiano - Agri Italia - Emilia-Romagna ESIF - EAFRD - ITAgri Platform – Emilia Romagna Italy 1,5
Banca Monte dei Paschi di Siena - Agri Italia - Emilia Romagna ESIF - EAFRD - ITAgri Platform – Emilia Romagna Italy 10,0
Credito Emiliano (CREDEM) - AGRI Italia - Emilia-Romagna ESIF - EAFRD - ITAgri Platform – Emilia Romagna Italy 25,0
ICCREA BancaImpresa - AGRI Italia - Emilia-Romagna ESIF - EAFRD - ITAgri Platform – Emilia Romagna Italy 25,0
Banca Cambiano - Agri Italia - Piemonte ESIF - EAFRD - ITAgri Platform – Piemonte Italy 1,0
Banca Monte dei Paschi di Siena - Agri Italia - Piemonte ESIF - EAFRD - ITAgri Platform – Piemonte Italy 5,0
Credito Emiliano (CREDEM) - AGRI Italia - Piemonte ESIF - EAFRD - ITAgri Platform – Piemonte Italy 10,0
ICCREA BancaImpresa - AGRI Italia - Piemonte ESIF - EAFRD - ITAgri Platform – Piemonte Italy 12,5
Banca Monte dei Paschi di Siena - Agri Italia - Puglia ESIF - EAFRD - ITAgri Platform – Puglia Italy 5,0
Banca Popolare Puglia e Basilicata (BPPB) - AGRI Italia - Puglia ESIF - EAFRD - ITAgri Platform – Puglia Italy 7,0
Banca Popolare Pugliese (BPP) - AGRI Italia - Puglia ESIF - EAFRD - ITAgri Platform – Puglia Italy 30,0
Credito Emiliano (CREDEM) - AGRI Italia - Puglia ESIF - EAFRD - ITAgri Platform – Puglia Italy 18,5
ICCREA BancaImpresa - AGRI Italia - Puglia ESIF - EAFRD - ITAgri Platform – Puglia Italy 18,5
Banca Cambiano - Agri Italia - Toscana ESIF - EAFRD - ITAgri Platform – Toscana Italy 17,5
Banca Monte dei Paschi di Siena - Agri Italia - Toscana ESIF - EAFRD - ITAgri Platform – Toscana Italy 30,0
Credito Emiliano (CREDEM) - AGRI Italia - Toscana ESIF - EAFRD - ITAgri Platform – Toscana Italy 6,0
ICCREA BancaImpresa - AGRI Italia - Toscana ESIF - EAFRD - ITAgri Platform – Toscana Italy 18,5
Credito Emiliano (CREDEM) - AGRI Italia - Umbria ESIF - EAFRD - ITAgri Platform – Umbria Italy 2,5
ICCREA BancaImpresa - AGRI Italia - Umbria ESIF - EAFRD - ITAgri Platform – Umbria Italy 12,5
Banca Monte dei Paschi di Siena - Agri Italia - Veneto ESIF - EAFRD - ITAgri Platform – Veneto Italy 20,0
Credito Emiliano (CREDEM) - AGRI Italia - Veneto ESIF - EAFRD - ITAgri Platform – Veneto Italy 30,0
ICCREA BancaImpresa - AGRI Italia - Veneto ESIF - EAFRD - ITAgri Platform – Veneto Italy 55,0
Banque Populaire Aquitaine Centre Atlantique (BPACA) - Alter’NA ESIF - EAFRD - Nouvelle Aquitaine France 6,8
Credit Agricole - Alter’NA ESIF - EAFRD - Nouvelle Aquitaine France 13,4
Crédit Mutuel - Alter’NA ESIF - EAFRD - Nouvelle Aquitaine France 6,8
Banque Populaire du Sud - FOSTER-Langudoc Roussillon ERDF FOSTER - Languedoc Roussillon ERDF France 9,0
Credit Agricole - FOSTER MP EAFRD FOSTER - Midi-Pyrénées EAFRD France 4,2
BPCE - INAF INAF France 11,0 Yes
Confédération Nationale du Crédit Mutuel - INAF INAF France 24,1 Yes
Credit Agricole - INAF INAF France 55,5 Yes
Crédit Mutuel ARKEA - INAF INAF France 8,2 Yes
123 Investment Managers - IFSMEG InnovFin SMEG France 25,0 Yes
ABN AMRO - IFSMEG InnovFin SMEG Netherlands 15,0 Yes
Almi Företagspartner AB 2 - IFSMEG InnovFin SMEG Sweden 28,7 Yes
Austria Wirtschaftsservice (AWS) - IFSMEG InnovFin SMEG Austria 35,0 Yes
Banca Cassa di Risparmio di Savigliano - IFSMEG InnovFin SMEG Italy 5,0 Yes
Banca Comerciala Intesa Sanpaolo Romania – IFSMEG InnovFin SMEG Romania 10,0 Yes
Banca Comerciala Romana Chisinau (BCRC) - IFSMEG InnovFin SMEG Moldova, Republic of 5,0
Banca del Mezzogiorno - MedioCredito Centrale - IFSMEG InnovFin SMEG Italy 20,0 Yes
Banca Intesa ad Beograd - IFSMEG InnovFin SMEG Serbia 5,0
Banca Popolare Puglia e Basilicata (BPPB) - IFSMEG InnovFin SMEG Italy 25,0 Yes
Banca Valsabbina 2 - IFSMEG InnovFin SMEG Italy 7,5 Yes
Banco BPI 2 - IFSMEG InnovFin SMEG Portugal 25,0 Yes
Banco BPM 2 - IFSMEG InnovFin SMEG Italy 5,0 Yes
Banco Comercial Portugues 2 (BCP) - IFSMEG InnovFin SMEG Portugal 100,0 Yes
Banco Santander - IFSMEG InnovFin SMEG Spain 150,0 Yes
Bank Leumi - IFSMEG InnovFin SMEG Israel 89,0
Bank Nordik - IFSMEG InnovFin SMEG Faroe Islands 20,1
Banque de l’Habitat - IFSMEG InnovFin SMEG Tunisia 29,7
BCC Cambiano Umbrella 2 - Banca Cambiano - IFSMEG InnovFin SMEG Italy 10,0 Yes
BCC Cambiano Umbrella 2 - BCC Pisa e Fornacette - IFSMEG InnovFin SMEG Italy 5,0 Yes
BCC Cambiano Umbrella 2 - Cabel Leasing - IFSMEG InnovFin SMEG Italy 3,0 Yes
BCEE - IFSMEG InnovFin SMEG Luxembourg 15,0 Yes
BIL Luxembourg - IFSMEG InnovFin SMEG Luxembourg 10,0 Yes
Bpifrance financement PI FEI 4 - IFSMEG InnovFin SMEG France 200,0 Yes
Bpifrance financement start-up 4 - IFSMEG InnovFin SMEG France 100,0 Yes
Caixa Geral de Depósitos - IFSMEG InnovFin SMEG Portugal 50,0 Yes
Caja Laboral Popular Coop. de Crédito - IFSMEG InnovFin SMEG Spain 25,0 Yes
CERSA 2 - IFSMEG InnovFin SMEG Spain 90,0 Yes
Ceska Sporitelna - IFSMEG InnovFin SMEG Czech Republic 50,0 Yes
Credit Agricole Italia 2 (Cariparma Group) - IFSMEG InnovFin SMEG Italy 10,0 Yes
Credit Agricole Serbia - IFSMEG InnovFin SMEG Serbia 5,00
Creval 3 - IFSMEG InnovFin SMEG Italy 7,5 Yes
DBT Capital AB - IFSMEG InnovFin SMEG Sweden 9,3 Yes
Eiffel Investment Group - IFSMEG InnovFin SMEG France 37,5 Yes
Erste & Steiermärkische Bank - IFSMEG InnovFin SMEG Croatia 25,0 Yes
Innovation Norway - IFSMEG - CG InnovFin SMEG Norway 99,4
Innovation Norway - IFSMEG - DG InnovFin SMEG Norway 50,5
Inveready Venture Finance 3 - IFSMEG InnovFin SMEG Spain 35,00 Yes
Keskinäinen Vakuutusyhtiö Fennia - IFSMEG InnovFin SMEG Finland 25,0 Yes
LocalTapiola Corporate Lending I GP- IFSMEG InnovFin SMEG Finland 25,0 Yes
Mediocredito Italiano (ISP Group) - IFSMEG InnovFin SMEG Italy 75,0 Yes
Mediocredito Trentino-Alto Adige 3 (MCTAA) - IFSMEG InnovFin SMEG Italy 30,0 Yes
Mobiasbanca - IFSMEG InnovFin SMEG Moldova, Republic of 4,0
Nordea - IFSMEG InnovFin SMEG Finland 100,0 Yes
October Factory - IFSMEG InnovFin SMEG France 15,0 Yes
OP Corporate Bank - IFSMEG InnovFin SMEG Finland 45,0 Yes
Peninsula Growth Fund - IFSMEG InnovFin SMEG Israel 35,0
PKO Leasing 2 - IFSMEG InnovFin SMEG Poland 29,7 Yes
ProCredit Umbrella - Albania - IFSMEG InnovFin SMEG Albania 10,0
ProCredit Umbrella - Bosnia and Herzegovina - IFSMEG InnovFin SMEG Bosnia and Herzegovina 15,0
ProCredit Umbrella - Bulgaria & Greece - IFSMEG InnovFin SMEG Bulgaria 50,0 Yes
ProCredit Umbrella - Georgia - IFSMEG InnovFin SMEG Georgia 12,5
ProCredit Umbrella - Moldova - IFSMEG InnovFin SMEG Moldova, Republic of 10,0
ProCredit Umbrella - North Macedonia- IFSMEG InnovFin SMEG North Macedonia 20,0
ProCredit Umbrella - ProCredit Holding (CE) - IFSMEG InnovFin SMEG Germany 200,0
ProCredit Umbrella - Romania - IFSMEG InnovFin SMEG Romania 25,0 Yes
ProCredit Umbrella - Serbia - IFSMEG InnovFin SMEG Serbia 42,5
ProCredit Umbrella - Ukraine - IFSMEG InnovFin SMEG Ukraine 15,0
Proventus Capital Management - IFSMEG InnovFin SMEG Sweden 37,5 Yes
Rabobank - IFSMEG InnovFin SMEG Netherlands 100,0 Yes
Raiffeisenbank Czech Republic - IFSMEG InnovFin SMEG Czech Republic 24,7 Yes
SOWALFIN Invest - IFSMEG InnovFin SMEG Belgium 12,5 Yes
Sydbank - IFSMEG InnovFin SMEG Denmark 25,0 Yes
Tatra Banka - IFSMEG InnovFin SMEG Slovakia 40,0 Yes
Tenax - IFSMEG InnovFin SMEG United Kingdom 25,0 Yes
Trea 2 - IFSMEG InnovFin SMEG Spain 30,0 Yes
UBB Umbrella (ex CIBANK) - (CE) - IFSMEG InnovFin SMEG Bulgaria 37,5 Yes
Unicredit Bank Austria - IFSMEG InnovFin SMEG Austria 75,00 Yes
DealName Resource Geographic
focusCommitment
(EURm)EFSI
SMEWEFSI
SMEWIIDealName Resource Geographic
focusCommitment
(EURm)EFSI
SMEWEFSI
SMEWII
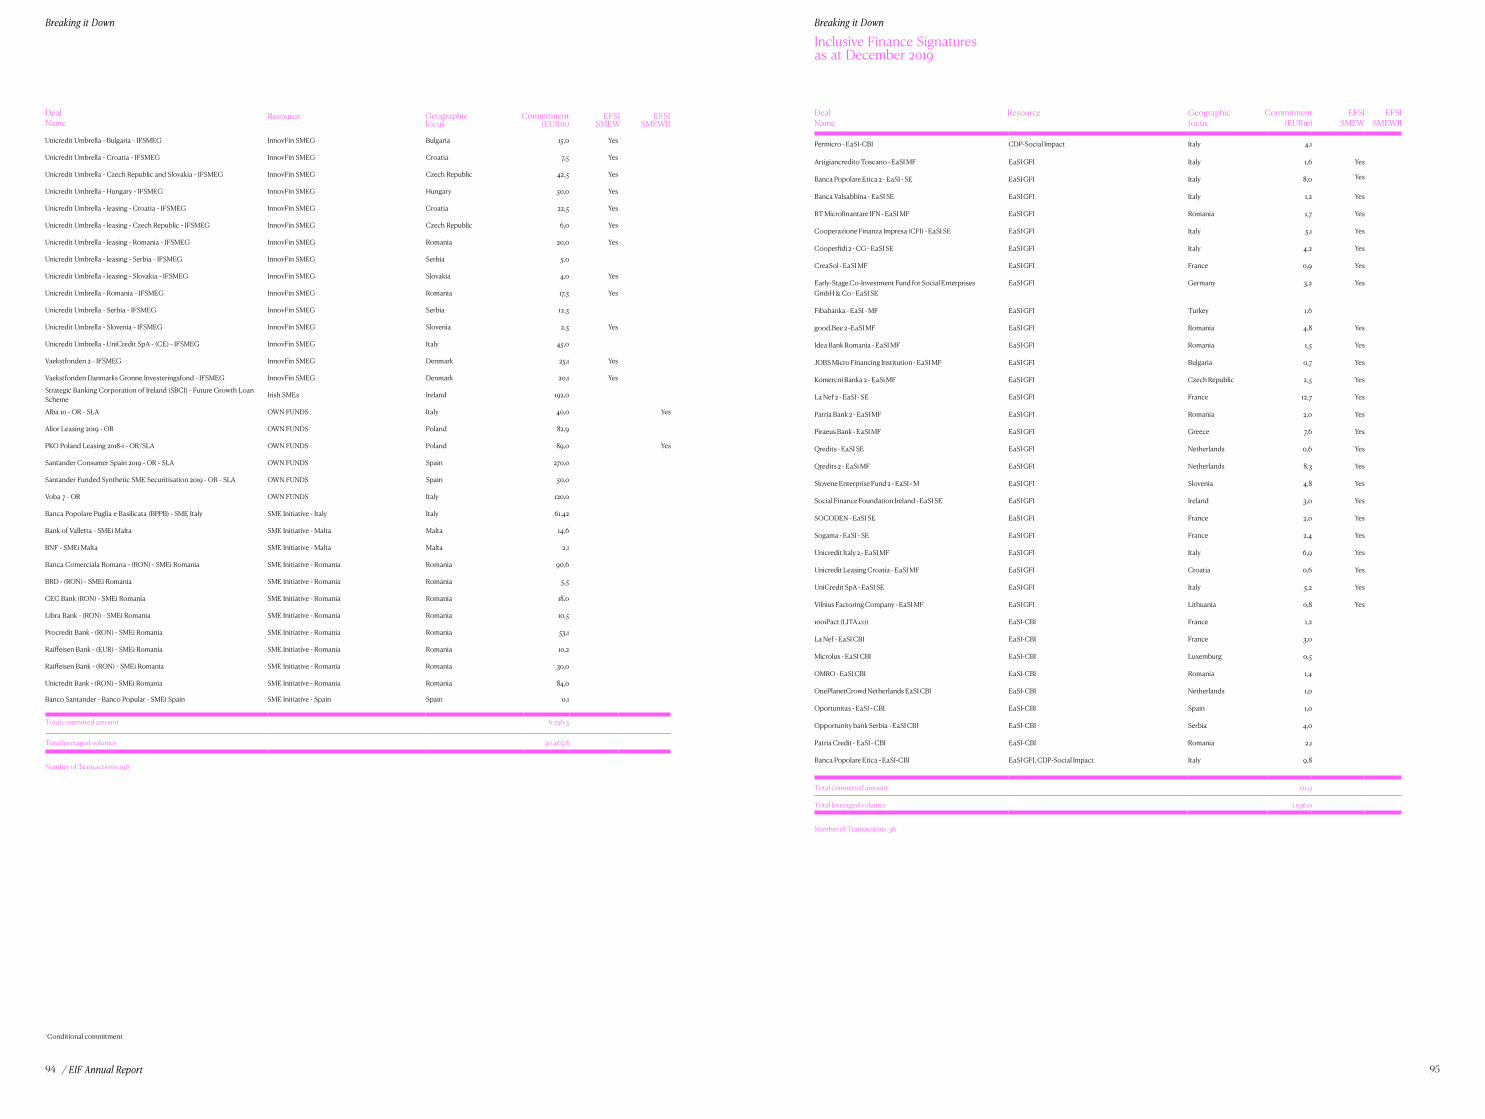
Breaking it DownBreaking it Down
/ EIF Annual Report 9594
Number of Transactions, 196
DealName
Resource Geographicfocus
Commitment(EURm)
EFSI SMEW
EFSI SMEWII
Inclusive Finance Signatures as at December 2019
DealName
Resource Geographicfocus
Commitment(EURm)
EFSI SMEW
EFSI SMEWII
Number of Transactions, 36
*Conditional commitment
Unicredit Umbrella - Bulgaria - IFSMEG InnovFin SMEG Bulgaria 15,0 Yes
Unicredit Umbrella - Croatia - IFSMEG InnovFin SMEG Croatia 7,5 Yes
Unicredit Umbrella - Czech Republic and Slovakia - IFSMEG InnovFin SMEG Czech Republic 42,5 Yes
Unicredit Umbrella - Hungary - IFSMEG InnovFin SMEG Hungary 50,0 Yes
Unicredit Umbrella - leasing - Croatia - IFSMEG InnovFin SMEG Croatia 22,5 Yes
Unicredit Umbrella - leasing - Czech Republic - IFSMEG InnovFin SMEG Czech Republic 6,0 Yes
Unicredit Umbrella - leasing - Romania - IFSMEG InnovFin SMEG Romania 20,0 Yes
Unicredit Umbrella - leasing - Serbia - IFSMEG InnovFin SMEG Serbia 5,0
Unicredit Umbrella - leasing - Slovakia - IFSMEG InnovFin SMEG Slovakia 4,0 Yes
Unicredit Umbrella - Romania - IFSMEG InnovFin SMEG Romania 17,5 Yes
Unicredit Umbrella - Serbia - IFSMEG InnovFin SMEG Serbia 12,5
Unicredit Umbrella - Slovenia - IFSMEG InnovFin SMEG Slovenia 2,5 Yes
Unicredit Umbrella - UniCredit SpA - (CE) - IFSMEG InnovFin SMEG Italy 45,0
Vaekstfonden 2 - IFSMEG InnovFin SMEG Denmark 25,1 Yes
Vaekstfonden Danmarks Gronne Investeringsfond - IFSMEG InnovFin SMEG Denmark 20,1 Yes
Strategic Banking Corporation of Ireland (SBCI) - Future Growth Loan Scheme Irish SMEs Ireland 192,0
Alba 10 - OR - SLA OWN FUNDS Italy 40,0 Yes
Alior Leasing 2019 - OR OWN FUNDS Poland 82,9
PKO Poland Leasing 2018-1 - OR/SLA OWN FUNDS Poland 89,0 Yes
Santander Consumer Spain 2019 - OR - SLA OWN FUNDS Spain 270,0
Santander Funded Synthetic SME Securitisation 2019 - OR - SLA OWN FUNDS Spain 50,0
Voba 7 - OR OWN FUNDS Italy 120,0
Banca Popolare Puglia e Basilicata (BPPB) - SME Italy SME Initiative - Italy Italy 61,42
Bank of Valletta - SMEi Malta SME Initiative - Malta Malta 14,6
BNF - SMEi Malta SME Initiative - Malta Malta 2,1
Banca Comerciala Romana - (RON) - SMEi Romania SME Initiative - Romania Romania 90,6
BRD - (RON) - SMEi Romania SME Initiative - Romania Romania 5,5
CEC Bank (RON) - SMEi Romania SME Initiative - Romania Romania 18,0
Libra Bank - (RON) - SMEi Romania SME Initiative - Romania Romania 10,5
Procredit Bank - (RON) - SMEi Romania SME Initiative - Romania Romania 53,1
Raiffeisen Bank - (EUR) - SMEi Romania SME Initiative - Romania Romania 10,2
Raiffeisen Bank - (RON) - SMEi Romania SME Initiative - Romania Romania 30,0
Unicredit Bank - (RON) - SMEi Romania SME Initiative - Romania Romania 84,0
Banco Santander - Banco Popular - SMEi Spain SME Initiative - Spain Spain 0,1
Total committed amount 6.746.5
Total leveraged volumes 30.463.8
Permicro - EaSI-CBI CDP-Social Impact Italy 4,1
Artigiancredito Toscano - EaSI MF EaSI GFI Italy 1,6 Yes
Banca Popolare Etica 2 - EaSI - SE EaSI GFI Italy 8,0 Yes
Banca Valsabbina - EaSI SE EaSI GFI Italy 1,2 Yes
BT Microfinantare IFN - EaSI MF EaSI GFI Romania 1,7 Yes
Cooperazione Finanza Impresa (CFI) - EaSI SE EaSI GFI Italy 5,1 Yes
Cooperfidi 2 - CG - EaSI SE EaSI GFI Italy 4,2 Yes
CreaSol - EaSI MF EaSI GFI France 0,9 Yes
Early-Stage Co-Investment Fund for Social Enterprises GmbH & Co - EaSI SE
EaSI GFI Germany 3,2 Yes
Fibabanka - EaSI - MF EaSI GFI Turkey 1,6
good.Bee 2 -EaSI MF EaSI GFI Romania 4,8 Yes
Idea Bank Romania - EaSI MF EaSI GFI Romania 1,5 Yes
JOBS Micro Financing Institution - EaSI MF EaSI GFI Bulgaria 0,7 Yes
Komercni Banka 2 - EaSi MF EaSI GFI Czech Republic 2,5 Yes
La Nef 2 - EaSI - SE EaSI GFI France 12,7 Yes
Patria Bank 2 - EaSI MF EaSI GFI Romania 2,0 Yes
Piraeus Bank - EaSI MF EaSI GFI Greece 7,6 Yes
Qredits - EaSI SE EaSI GFI Netherlands 0,6 Yes
Qredits 2 - EaSi MF EaSI GFI Netherlands 8,3 Yes
Slovene Enterprise Fund 2 - EaSI - M EaSI GFI Slovenia 4,8 Yes
Social Finance Foundation Ireland - EaSI SE EaSI GFI Ireland 3,0 Yes
SOCODEN - EaSI SE EaSI GFI France 2,0 Yes
Sogama - EaSI - SE EaSI GFI France 2,4 Yes
Unicredit Italy 2 - EaSI MF EaSI GFI Italy 6,9 Yes
Unicredit Leasing Croatia - EaSI MF EaSI GFI Croatia 0,6 Yes
UniCredit SpA - EaSI SE EaSI GFI Italy 5,2 Yes
Vilnius Factoring Company - EaSI MF EaSI GFI Lithuania 0,8 Yes
1001Pact (LITA.co) EaSI-CBI France 1,2
La Nef - EaSI CBI EaSI-CBI France 3,0
Microlux - EaSI CBI EaSI-CBI Luxemburg 0,5
OMRO - EaSI CBI EaSI-CBI Romania 1,4
OnePlanetCrowd Netherlands EaSI CBI EaSI-CBI Netherlands 1,0
Oportunitas - EaSI - CBI EaSI-CBI Spain 1,0
Opportunity bank Serbia - EaSI CBI EaSI-CBI Serbia 4,0
Patria Credit - EaSI - CBI EaSI-CBI Romania 2,1
Banca Popolare Etica - EaSI-CBI EaSI GFI, CDP-Social Impact Italy 9,8
Total committed amount 121,9
Total leveraged volumes 1.036,0
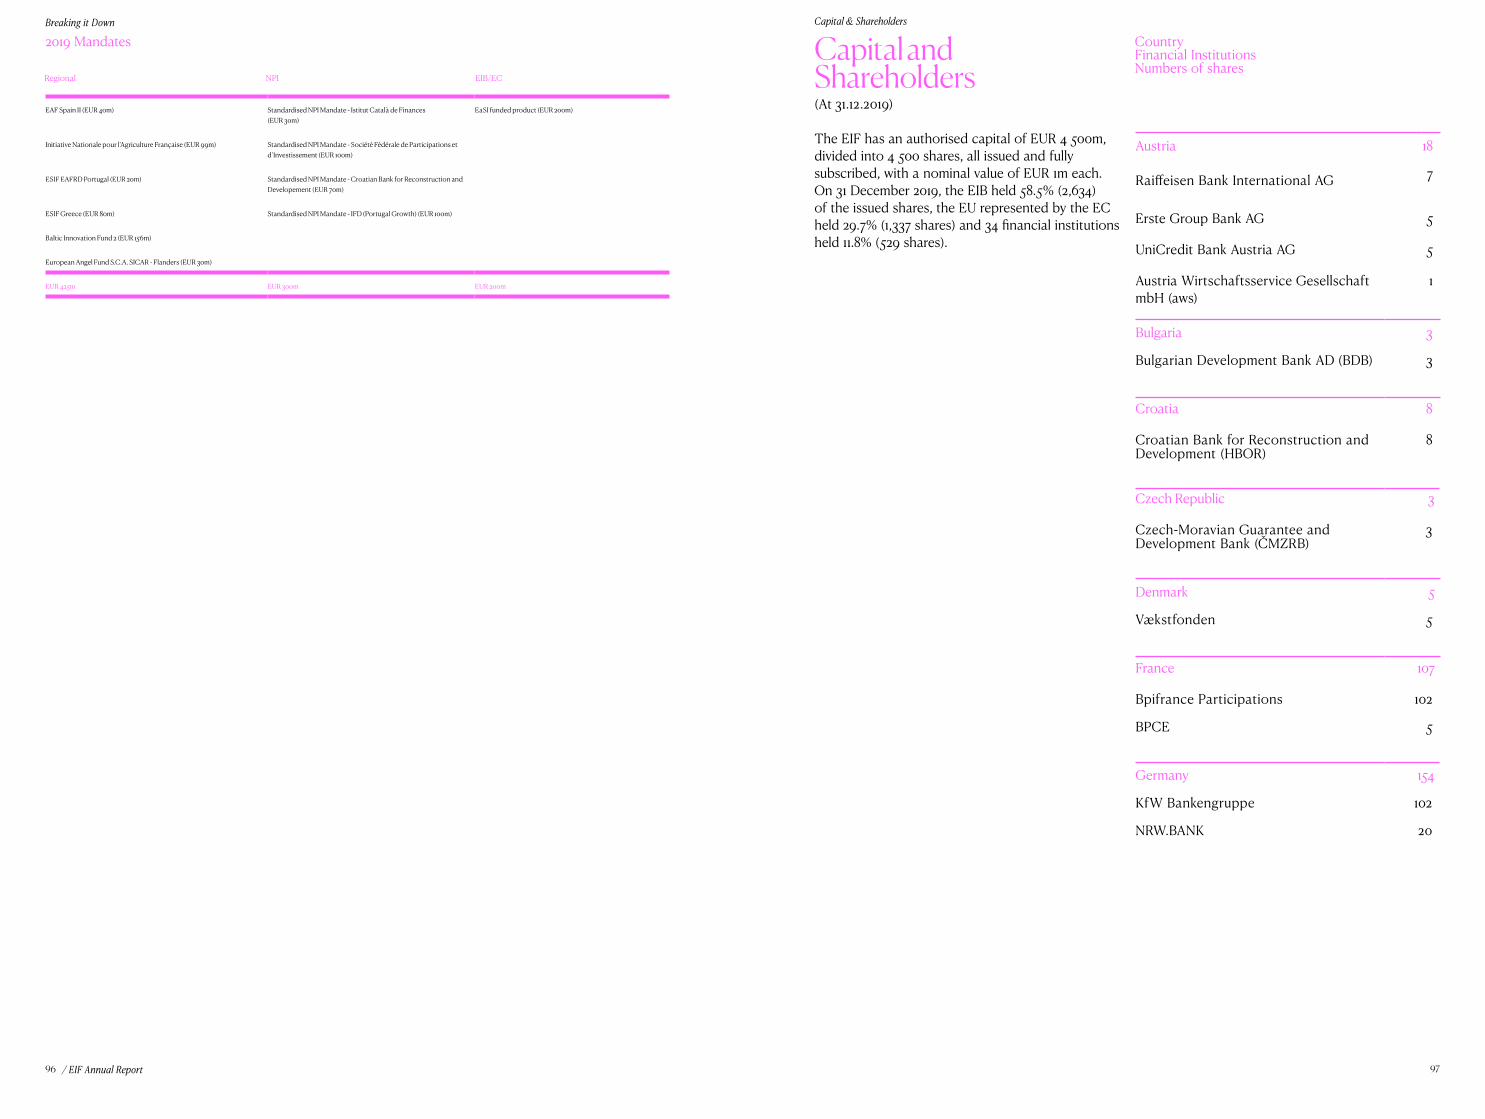
Breaking it Down
/ EIF Annual Report96 97
2019 Mandates
EIB/ECRegional NPI
(At 31.12.2019)
Austria 18
Raiffeisen Bank International AG 7
Erste Group Bank AG 5
UniCredit Bank Austria AG 5
Austria Wirtschaftsservice Gesellschaft mbH (aws)
1
Bulgaria 3
Bulgarian Development Bank AD (BDB) 3
Croatia 8
Croatian Bank for Reconstruction and Development (HBOR)
8
Czech Republic 3
Czech-Moravian Guarantee and Development Bank (ČMZRB)
3
Denmark 5
Vækstfonden 5
France 107
Bpifrance Participations 102
BPCE 5
Germany 154
KfW Bankengruppe 102
NRW.BANK 20
CountryFinancial Institutions Numbers of shares
The EIF has an authorised capital of EUR 4 500m, divided into 4 500 shares, all issued and fully subscribed, with a nominal value of EUR 1m each. On 31 December 2019, the EIB held 58.5% (2,634) of the issued shares, the EU represented by the EC held 29.7% (1,337 shares) and 34 financial institutions held 11.8% (529 shares).
Capital and Shareholders
Capital & Shareholders
EAF Spain II (EUR 40m) Standardised NPI Mandate - Istitut Català de Finances (EUR 30m)
EaSI funded product (EUR 200m)
Initiative Nationale pour l’Agriculture Française (EUR 99m) Standardised NPI Mandate - Société Fédérale de Participations et d’Investissement (EUR 100m)
ESIF EAFRD Portugal (EUR 20m) Standardised NPI Mandate - Croatian Bank for Reconstruction and Developement (EUR 70m)
ESIF Greece (EUR 80m) Standardised NPI Mandate - IFD (Portugal Growth) (EUR 100m)
Baltic Innovation Fund 2 (EUR 156m)
European Angel Fund S.C.A. SICAR - Flanders (EUR 30m)
EUR 425m EUR 300m EUR 200m
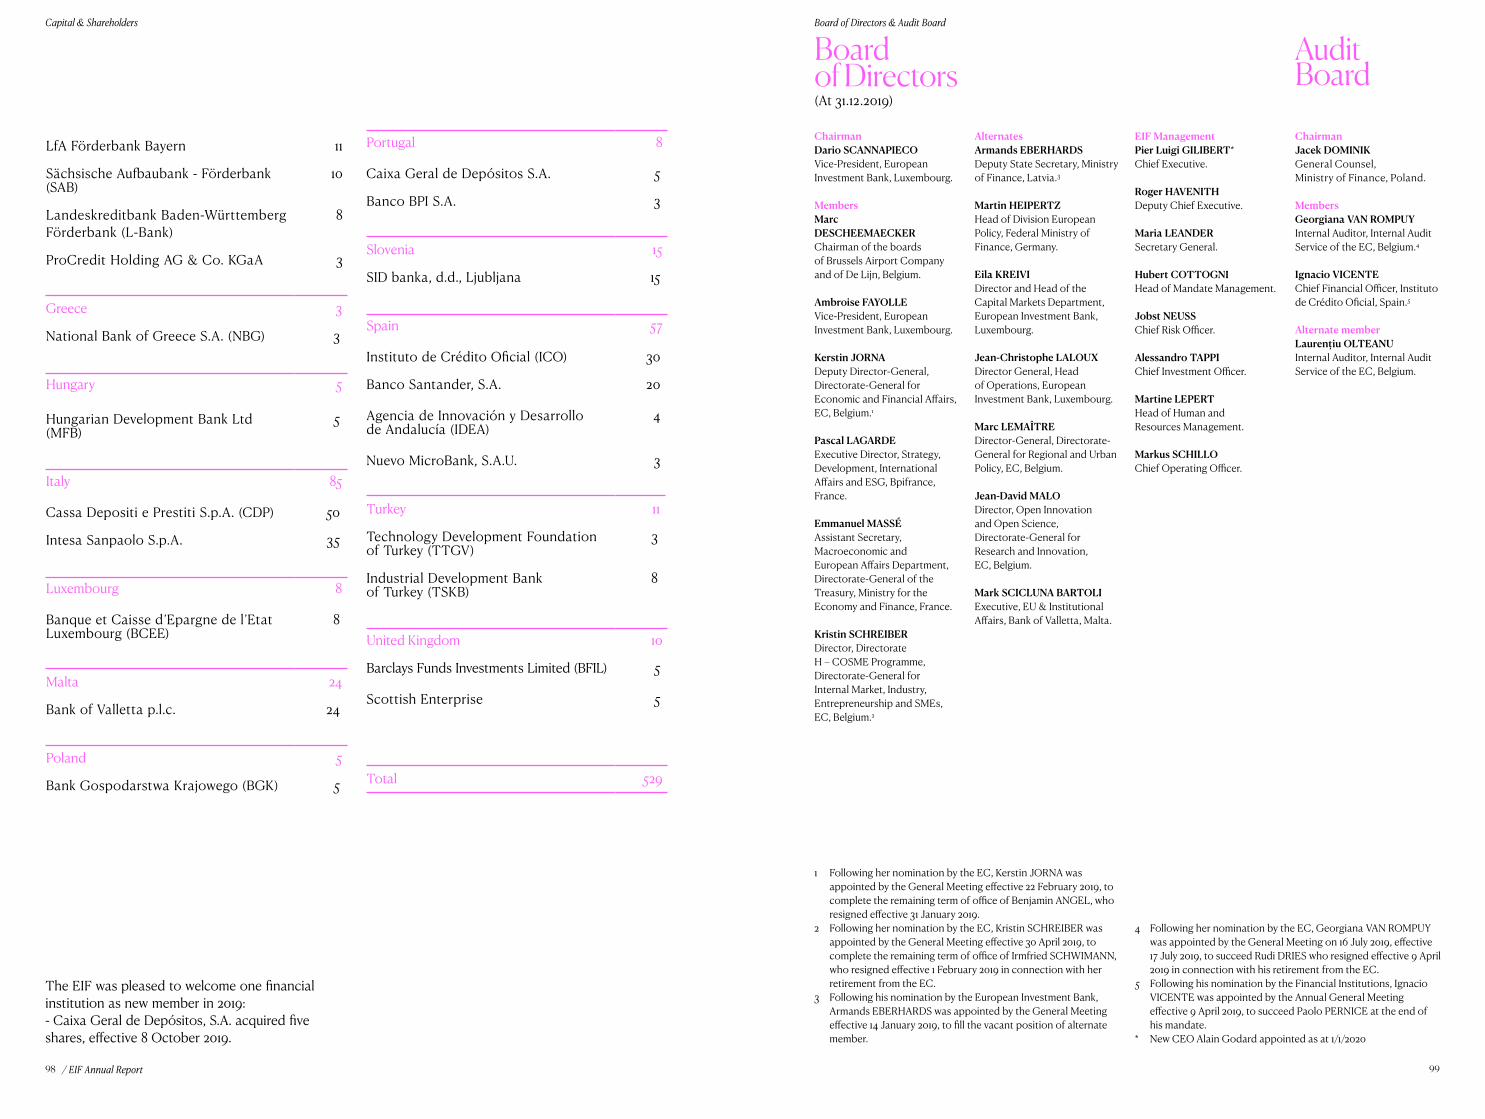
99/ EIF Annual Report98
Capital & Shareholders
LfA Förderbank Bayern 11
Sächsische Aufbaubank - Förderbank (SAB)
10
Landeskreditbank Baden-Württemberg Förderbank (L-Bank)
8
ProCredit Holding AG & Co. KGaA 3
Greece 3
National Bank of Greece S.A. (NBG) 3
Hungary 5
Hungarian Development Bank Ltd (MFB)
5
Italy 85
Cassa Depositi e Prestiti S.p.A. (CDP) 50
Intesa Sanpaolo S.p.A. 35
Luxembourg 8
Banque et Caisse d’Epargne de l’Etat Luxembourg (BCEE)
8
Malta 24
Bank of Valletta p.l.c. 24
Poland 5
Bank Gospodarstwa Krajowego (BGK) 5
Portugal 8
Caixa Geral de Depósitos S.A. 5
Banco BPI S.A. 3
Slovenia 15
SID banka, d.d., Ljubljana 15
Spain 57
Instituto de Crédito Oficial (ICO) 30
Banco Santander, S.A. 20
Agencia de Innovación y Desarrollo de Andalucía (IDEA)
4
Nuevo MicroBank, S.A.U. 3
Turkey 11
Technology Development Foundation of Turkey (TTGV)
3
Industrial Development Bank of Turkey (TSKB)
8
United Kingdom 10
Barclays Funds Investments Limited (BFIL) 5
Scottish Enterprise 5
Total 529
The EIF was pleased to welcome one financial institution as new member in 2019:- Caixa Geral de Depósitos, S.A. acquired five shares, effective 8 October 2019.
Chairman Dario SCANNAPIECO Vice-President, European Investment Bank, Luxembourg. Members MarcDESCHEEMAECKER Chairman of the boards of Brussels Airport Company and of De Lijn, Belgium.
Ambroise FAYOLLE Vice-President, European Investment Bank, Luxembourg.
Kerstin JORNADeputy Director-General, Directorate-General for Economic and Financial Affairs, EC, Belgium.1
Pascal LAGARDEExecutive Director, Strategy, Development, International Affairs and ESG, Bpifrance, France.
Emmanuel MASSÉ Assistant Secretary, Macroeconomic and European Affairs Department,Directorate-General of the Treasury, Ministry for the Economy and Finance, France.
Kristin SCHREIBERDirector, Directorate H – COSME Programme, Directorate-General for Internal Market, Industry, Entrepreneurship and SMEs, EC, Belgium.2
Audit Board
AlternatesArmands EBERHARDSDeputy State Secretary, Ministry of Finance, Latvia.3
Martin HEIPERTZHead of Division European Policy, Federal Ministry of Finance, Germany.
Eila KREIVI Director and Head of the Capital Markets Department, European Investment Bank, Luxembourg.
Jean-Christophe LALOUX Director General, Head of Operations, European Investment Bank, Luxembourg.
Marc LEMAÎTREDirector-General, Directorate-General for Regional and Urban Policy, EC, Belgium. Jean-David MALODirector, Open Innovation and Open Science, Directorate-General for Research and Innovation, EC, Belgium.
Mark SCICLUNA BARTOLI Executive, EU & Institutional Affairs, Bank of Valletta, Malta.
EIF ManagementPier Luigi GILIBERT*Chief Executive.
Roger HAVENITHDeputy Chief Executive.
Maria LEANDERSecretary General.
Hubert COTTOGNIHead of Mandate Management.
Jobst NEUSSChief Risk Officer.
Alessandro TAPPIChief Investment Officer.
Martine LEPERTHead of Human andResources Management.
Markus SCHILLOChief Operating Officer.
Boardof Directors(At 31.12.2019)
1 Following her nomination by the EC, Kerstin JORNA was appointed by the General Meeting effective 22 February 2019, to complete the remaining term of office of Benjamin ANGEL, who resigned effective 31 January 2019.
2 Following her nomination by the EC, Kristin SCHREIBER was appointed by the General Meeting effective 30 April 2019, to complete the remaining term of office of Irmfried SCHWIMANN, who resigned effective 1 February 2019 in connection with her retirement from the EC.
3 Following his nomination by the European Investment Bank, Armands EBERHARDS was appointed by the General Meeting effective 14 January 2019, to fill the vacant position of alternate member.
4 Following her nomination by the EC, Georgiana VAN ROMPUY was appointed by the General Meeting on 16 July 2019, effective 17 July 2019, to succeed Rudi DRIES who resigned effective 9 April 2019 in connection with his retirement from the EC.
5 Following his nomination by the Financial Institutions, Ignacio VICENTE was appointed by the Annual General Meeting effective 9 April 2019, to succeed Paolo PERNICE at the end of his mandate.
* New CEO Alain Godard appointed as at 1/1/2020
Board of Directors & Audit Board
ChairmanJacek DOMINIK General Counsel, Ministry of Finance, Poland.
MembersGeorgiana VAN ROMPUYInternal Auditor, Internal Audit Service of the EC, Belgium.4
Ignacio VICENTEChief Financial Officer, Instituto de Crédito Oficial, Spain.5
Alternate memberLaurențiu OLTEANUInternal Auditor, Internal Audit Service of the EC, Belgium.
101/ EIF Annual Report100
Audit & Controls
Audit & ControlsThe EIF is characterised by a multi-layered control environment embedded in the EU institutional framework and aligned with the financial sector’s principles and best practices.
The EIF’s first layer of control is exercised through internal processes and procedures developed and implemented by the Executive Management by means of financial and operational controls designed to enable effective and efficient day-to-day operations, ensure reliable financial reporting, compliance with applicable rules and policies and achieve the EIF’s objectives.
In this context, the EIF’s procedural and organisational framework sets out the competences, authorities and reporting lines within the EIF, with a view to ensuring segregation of duties both horizontally, through the interaction between front office, middle office and back office services and vertically, through central control by the Board of Directors of the decision-making process in relation to all business activities.
The second layer of control consists of independent risk and compliance functions which implement an ex-ante risk assessment and reporting framework for each transaction proposed for approval, complemented by ex-post risk monitoring where relevant (see sections on Risk Management and Legal Service).
The EIF maintains an Internal Control Framework (ICF) and produces an ICF report annually. The ICF relies in particular on a risk control matrix outlining the main operational risks to which the EIF is exposed. Through the ICF, the Executive Management is in a position to obtain the necessary comfort that key risks related to the EIF’s business activities are properly identified, that control objectives are defined, that significant risks are mitigated and that the controls designed to achieve these objectives are in place and are operating effectively.
In 2019, the ICF was complemented with an independent opinion from Deloitte on the design and effectiveness of the key controls of the mandate-related processes throughout the year, in line with the internationally recognised ISAE-3402 standard (type 2 report). This ISAE 3402 report with the same scope was completed by KPMG in 2019.
The ICF and the ISAE-3402 report form the basis for the confirmation by the Chief Executive to the Audit Board that the main risks have been identified and mitigated.
The risks, control objectives and agreed improvements described in the ICF are reviewed by Internal Audit, which, on the basis of the audits and the follow-up on agreed action plans performed, expresses an opinion on the achievement of the control objectives in the audited areas and on the design and effectiveness of the related internal controls.
The third layer includes both internal and external audit activities that are coordinated by the Audit Board. The Audit Board, as an oversight and controlling body, conducts its activity in accordance with the standards of the audit profession and relies on both internal and external audit assurances in order to confirm annually that, to the best of its knowledge and judgement, the operations of the EIF have been carried out in compliance with the Statutes and the Rules of Procedure and that the financial statements give a true and fair view of the financial position of the EIF as regards its assets and liabilities and of the results of its operations for the financial year under review. This information is included in the annual report submitted by the Board of Directors to the EIF’s Annual General Meeting.
In order to discharge its duty in relation to the financial statements, the Audit Board may have recourse to external auditors. The audit of the financial statements of the EIF for the year ending 31 December 2019 was carried out by KPMG Luxembourg, as external auditor.
KPMG performs its audits in accordance with the International Standards on Auditing (ISA) and is committed to inform the EIF Executive Management and the Audit Board of any material weaknesses in the design or implementation of internal controls over financial information that come to its attention during the audit of the financial statements. While performing the audit of the annual accounts, KPMG is acting independently, fulfilling the duty imposed on it by the Code of Professional Ethics adopted in Luxembourg by the Commission de Surveillance du Secteur Financier (CSSF).
Internal Audit (which is outsourced to EIB Internal Audit) examines and evaluates the relevance, design and effectiveness of the internal control systems and procedures within the EIF.
To that end, a yearly audit plan covering all key processes of the EIF is established, on the basis of a risk-assessment methodology, in alignment with the ICF. The plan is discussed with the Executive Management and the external auditor prior to being submitted to the Audit Board for approval.
Internal Audit examines the EIF’s activities in order to support the Executive Management’s statement on the design and effectiveness of internal controls, risk management and administration. Internal Audit reports on its findings by means of recommendations and agreed action plans to improve the EIF’s control and working procedures.
The Head of Internal Audit reports regularly on the execution of the internal audit programme to the Executive Management, the Audit Board and the Chairman of the Board of Directors. Internal Audit adheres to the professional and ethical guidance issued by the Institute of Internal Auditors and the Information Systems Audit and Control Association and is subject to a regular quality assurance and improvement programme that covers all aspects of the internal audit activity. Moreover, Internal Audit shall comply with the internal policy statements governing their actions.
In addition to the maintenance of an internal control environment in line with the highest standards of the financial and banking sector, the EIF is subject to periodic reviews by independent control bodies such as the European Court of Auditors (ECA), the Internal Audit Service of the EC and national or regional authorities entrusted with the task of monitoring the correct utilisation of funds under the relevant rules and within their respective remits.
Compliance The EIF’s compliance risk assessment strives to protect the institution against risks that could have an adverse effect on its reputation. Under the terms of its Compliance Charter, the Compliance team assesses - in line with best market practices and in line with the EIB Group’s policy framework – the (i) institutional, (ii) transactional and (iii) ethical aspects of the EIF’s compliance risk.
Ensuring the permanence of the compliance function, as well as the independence of the compliance risk assessment, as a matter of best practice, is a key requirement for any financial institution. In the EIF, the principles of permanence and independence are included in the EIF Compliance Charter and materialise through the unrestricted direct access of the Chief Compliance Officer to the Chief Executive, the Deputy Chief Executive, the Board of Directors and the Audit Board.
The compliance risk assessment in the transactional area follows a risk-based approach and is reflected in the independent compliance opinion provided to the EIF decision-making bodies. It is implemented through compliance risk scorings provided in the compliance opinions, in particular on the risk of the EIF being involved (or used) in (i) money laundering and terrorism financing cases and (ii) tax avoidance schemes. Data protection In order to ensure compliance with the new data protection regulation for EU institutions and bodies (Regulation EU 2018/1725), the Data Protection Officer (DPO) took a number of initiatives, including but not limited to giving regular training to staff and senior management, updating the EIF policy framework and providing ongoing support to the EIF Services.
In particular, the DPO ensured:
· maintenance of the inventory of records; · regular update of the data protection statements; · assistance in carrying out Data Protection Impact Assessments; · development of a surveillance programme aimed at verifying ongoing compliance with the new data protection regulation; · regular cooperation with the European Data Protection Supervisor.
RiskManagement
Risk Management
The EIF’s mission is supported through a robust and coherent approach to risk management which seeks to ensure the highest quality standards for its operations and the best corporate rating from the major rating agencies.
Risk management is embedded in the EIF’s corporate culture and is based on the so-called “three-lines-of-defence” model, which permeates all areas of the EIF’s business functions and processes. These are: first line – front office; second line – independent risk management and compliance; and third line – internal and external audit.
Early in 2019, the Risk Management function underwent a substantial reorganisation with the creation of a Compliance department and a Financial and Corporate Risk department, each with two divisions: a Compliance and a Privacy division for the Compliance department and a Transaction and Portfolio Management Division and a Corporate Risk Management Division for the Financial and Corporate Risk department. This reorganisation was based on an identification of key risk management processes each of which should be addressed by a dedicated team, established as Divisions in either of the referred departments. This new organisation should both equip EIF Risk Management to address the challenges expected from the upcoming policy initiatives within EIB Group and under the new EU budgetary period and create a more focused, as well as more cooperative, approach to the management of financial and non-financial risks in the EIF.
The highly dynamic business environment and the strong growth of the EIF’s transaction volumes considerably challenged the capital and limit management in place with the purpose of ensuring the EIF‘s capital sustainability in line with the applicable Group policies. In 2019, the EIF formalised its ICAAP and ILAAP processes, which will contribute to the relevant future Group capital and liquidity management processes. The medium term capital planning allowed the postponement of a proposed capital increase to 2022, corresponding to the start of a new EU budgetary period.
The cooperation between the EIF and EIB on risk management has been further intensified to prepare the ground for the establishment of the new Group Chief Risk Officer function expected in 2020. This found its expression not least in various new Group Committees, such as the Information Security Committee (ISeC) or the Group Risk Management Steering Committee. Joint projects between the EIB and the EIF are planned to advance further, in particular on compliance with Best Banking Practices (BBP) and, more specifically, the data aggregation standards under BCBS 239. In this context, the EIF adopted Best Market Practices Guidelines and the relevant process to identify and monitor Best Practices compliance, which will be fully implemented in 2020.
The mandate scoring methodology, developed in the course of 2018 on the basis of the contact with the UN Development Programme (UNDP) was adopted in September 2019. This methodology forms the basis of further considerations on the parameterisation and measurement of policy relevance and impact, which will be of increasing importance in the upcoming EU Budgeting period.

/ EIF Annual Report102
Legal Service
The EIF is supported by a strong in-house legal team whose remit, within its area of responsibility, is to pursue the strategic goals and protect and preserve the legal integrity of the Fund. This is achieved through the provision of legal advice based on the expertise and specialist knowledge of the team throughout the lifecycle of all the EIF’s transactional activities and in connection with institutional, strategic and policy-related matters, objectives that are reflected in the legal team’s internal structure.
With regard to transactions, in order to address increasing business volumes and the strategic goal of achieving performance gains through specialisation, the transactions team is split into two divisions, one focused on debt transactions and the other on equity transactions.
The legal service’s transaction teams work on all stages of transaction implementation, including (i) structuring and product development, (ii) review of proposals to the Investment and Risk Committee and the EIF’s Board of Directors, (iii) contractual negotiations and (iv) active portfolio management, in each case in close collaboration with other EIF services.
In terms of institutional and corporate matters, the legal service supports the implementation of good corporate governance, coordinates and advises on contractual arrangements at institutional level. The legal service aims to ensure that the EIF conducts its activities in accordance with its Statutes, mission and values, applicable law and relevant contractual obligations.
It further aims to ensure smooth functioning of the EIF’s corporate bodies, under the coordination of the EIF’s Secretary General. As a European Union body, a member of the EIB Group and a financial institution, institutional matters concerning the EIF cover a wide range of areas and at times necessitate cooperation with the EIF’s shareholders as well as specific and proactive attention to the development of EU policy and legislative and governance frameworks.
In addition, the legal service is called upon to advise on numerous structuring, corporate, governance and regulatory matters relating to third party mandates, including external structures (funds-of-funds), for which the EIF acts as manager and/or adviser. In order to create the necessary interface between the EIF’s institutional role, its mandate management activity and transaction delivery, the activities of the transactions and the corporate and institutional teams are closely coordinated, with the aim of providing seamless advice and expertise across the EIF’s business.
Legal Service

105/ EIF Annual Report104
European Investment Fund37b, avenue J. F KennedyL-2968 LuxembourgPhone +352 2485-1Fax +352 2485 [email protected]
EIFBucharest, Istanbul, Madrid,
Europe Direct is a service
to your questions aboutthe European Union.
Freephone: 00 800 67 89 10 11
Additional informationis also available on the internet:http://europa.eu
Numbers in the EIF AnnualReport are correct as at31 December 2019 and any
the text apply to the sameperiod unless otherwise stated.
SME outreach and employmentincluding the estimatednumbers and sustained jobs are indicative only and are based on reports received from
1 October 2018 and 30 September 2019. EIF assumes no liability for the accuracy thereof.The EIF shall not be heldresponsible for the use thatmight be made with theinformation contained herein.Reproduction is authorisedprovided the source isacknowledged. For any useor reproduction of photos orother material that is not underthe EIF’s copyright, permissionmust be sought directly fromthe copyright holders.
DisclaimerContacts and References
© European Investment Fund, 2020.
Creative direction blossoming.it
Design and layoutblossoming.it
IllustrationsSimon Landrein
Typefaces Canela Display and Text by Commercial Type
CatalogueQY-AA-20-001-EN-N
ISBN 978-92-861-4685-5ISSN 2363-4103DOI 10.2868/8335
Production

Contents
Independent Auditor’s Report 4
Statement by the Audit Board 10
Statement of Financial Position 11
Statement of Comprehensive Income 12
Statement of Changes in Equity 13
Cash Flow Statement 14
01 General 15
02 Significant accounting policies 16 and basis of preparation
03 Financial Risk Management 25
04 Detailed disclosures relating 56 to asset headings
05 Detailed disclosures relating to 62 liabilities and equity headings
06 Interest in unconsolidated 70 structured entities and in investment entities
07 Detailed disclosures related to the 76 statement of comprehensive income
08 Related party transactions 78
09 Taxation 80
4 5
Independent Auditor’s Report
/ EIF Financial Statements
Report of the Réviseur d’Entreprises Agréé
Report on the audit of the financial statements
OpinionWe have audited the financial statements of European Investment Fund (hereafter “the Fund”), which comprise the statement of financial position as at December 31, 2019, and the statement of comprehensive income, statement of changes in equity and statement of cash flows for the year then ended, and notes to the financial statements, including a summary of significant accounting policies as set out on pages 15 to 80. In our opinion, the accompanying financial statements give a true and fair view of the financial position of the Fund as at December 31, 2019, and of its financial performance and its cash flows for the year then ended in accordance with International Financial Reporting Standards (IFRSs) as adopted by the European Union.
Basis for OpinionWe conducted our audit in accordance with the Law of 23 July 2016 on the audit profession (“Law of 23 July 2016”) and with International Standards on Auditing (“ISAs”) as adopted for Luxembourg by the “Commission de Surveillance du Secteur Financier” (“CSSF”). Our responsibilities under the Law of 23 July 2016 and ISAs are further described in the « Responsibilities of “Réviseur d’Entreprises agréé” for the audit of the financial statements » section of our report. We are also independent of the Fund in accordance with the International Ethics Standards Board for Accountants’ Code of Ethics for Professional Accountants (“IESBA Code”) as adopted for Luxembourg by the CSSF together with the ethical requirements that are relevant to our audit of the financial statements, and have fulfilled our other ethical responsibilities under those ethical requirements. We believe that the audit evidence we have obtained is sufficient and appropriate to provide a basis for our opinion.
Key audit mattersKey audit matters are those matters that, in our professional judgment, were of most significance in our audit of the financial statements of the current period. These matters were addressed in the context of the audit of the financial statements as a whole, and in forming our opinion thereon, and we do not provide a separate opinion on these matters.In arriving at our audit opinion above, we determined there were two key audit matters as follows:
Recognition of Commission income
Why the matter was considered to be one of the most significant in the audit? Commission income, representing remuneration for management of mandates entrusted by mandators such as the European Commission or the Member States to EIF for the purpose of implementation of financial instruments on their behalf, is a significant component of the operating profit with EUR 160.5 million of commission income recognized by EIF for the year ended 31 December 2019.Under contractual agreements, EIF is tasked with deployment and management of mandators’ resources for extended periods of time, generally receiving consideration upfront within the first years after the setup of the mandates. EIF developed and implemented a deferred income mechanism for revenue recognition based on input method to consider the timing of cash inflows and stage of completion of these contracts led. As at 31 December 2019, the aggregate amount which EIF expects to be entitled to over the contract life (“transaction price”) allocated to the unsatisfied part of the performance obligation amounts to EUR 436.4 million of which EUR 192.3 million has already been invoiced and deferred in contract liabilities The latter includes EUR 97.7 million transferred from retained earnings following the initial application of IFRS 15 in 2018. The Fund expects to recognise such revenue over the remaining expected life of the mandates under management.Deferred income models for revenue recognition are complex and specific to each mandate and the recognition criteria under IFRS 15 involve significant judgments and estimates to be applied by Management in its assessment of revenue to be recognized in the relevant period. Inappropriate judgments made in relation to the methodology
Independent Auditor’s Report
To the Audit Board of the European Investment Fund 37B, avenue J.F. Kennedy L-2968 Luxembourg
and inputs used or the assumptions taken may have a material impact on the amount of commission income to be recognized in the statement of comprehensive income.The key inputs and assumptions used by Management in its assessment of the revenue to be recognised are detailed in Note 2.12 as well further disclosures are presented in Notes 4.4, 5.3 and 7.3 to the financial statements.
How our audit addressed the area of focus?Our procedures over the commission income included, but were not limited to:• We obtained an understanding of management’s
processes and controls for determining the transaction price that EIF expects to be entitled to over the contract life and of the timing of the satisfaction of performance obligation. This included discussing with Management the model preparation governance structure and protocols around their oversight of the cost assessment and corporate operational plan review process and corroborating our understanding by attending meetings with appropriate personnel of EIF.
• We have identified key controls in the process, assessed the design adequacy and tested the operating effectiveness of some of key controls. In addition, we obtained the ISAE 3402 report on EIF’s internal controls, compared our understanding of identified key controls in the process and inspected the conclusions reached based on the testing of operating effectiveness of those controls and noted no observations or exceptions in the report which allow us to rely on controls over fee accruals calculation, invoicing and preparation and annual review of deferred income models.
• We compared the revenue recognition methodology to IFRS 15 and EIF’s internal guidelines. We sought explanations from Management where there are judgments applied in their application of the guidelines, discussed and assessed their appropriateness and relevance.
• For a selection of mandates, we reconciled the management fees structure in the models to relevant contractual arrangements, assessed the assumptions made to derive the input parameters used in the deferred income models and adequateness of their application, reconciled the input parameters linked to past performance to annual operational reports issued to mandators.
• For the selected mandates, we evaluated the fee indicators expected to be triggered in the
future according to the Corporate Operational Plan with particular focus on adequateness of constraints applied to the variable component of the transaction price by the Management. We assessed that Corporate Operation Plans are correctly and timely updated to reflect amendments to the contractual arrangements, if any, and the current market absorption of financial instruments deployed under those agreements.
• For the selected mandates, we compared the cost assessment over their lifetime to the prior year assessment in order to identify and investigate changes in revenue recognition pattern and recalculated the revenue to be recognized for the current financial year.
Valuation of Financial guarantees
Why the matter was considered to be one of the most significant in the audit? Financial guarantee portfolio, for which an ongoing credit quality risk monitoring process has been set up to manage the EIF’s exposure, comprises both portfolio guarantees and structured financed transactions (together referred to as “G&S transactions”). As at 31 December 2019, EIF’s financial guarantees provisions amount to EUR 11.7 million and financial guarantee assets to EUR 26.6 million. Nevertheless, EIF’s exposure at risk amounts to EUR 10,724 million as at 31 December 2019.Under IFRS 9, at initial recognition, financial guarantees are recognised at fair value plus transaction costs that are directly attributable to issuance of the financial guarantees. The receiver leg of the financial guarantees is measured at fair value by discounting future cash flows and the payer leg of the financial guarantees is subsequently measured at the higher of the amount of the loss allowance determined in accordance with IFRS 9 or the amount initially recognised, i.e. the net present value of expected premium inflows less, where appropriate, cumulative amortisation recognised in accordance with IFRS 15. Any increase or decrease in the liability relating to financial guarantees, apart from the recognition of new financial guarantees, is recognised in the profit or loss under “Net result from financial guarantee operations”.Any increase or decrease in the fair value of the receiver leg of the financial guarantees is recognised in the profit or loss under “Net result from financial
6 7
Independent Auditor’s Report Independent Auditor’s Report
/ EIF Financial Statements
instruments at fair value through profit or loss”.The expected credit loss is recognised in the profit or loss under “Expected credit loss allowance”.Management of EIF has developed a set of tools to measure the credit exposure on G&S portfolio and to analyse and monitor portfolio guarantees and structured finance transactions using Exposure at Default and an internal rating system based on Expected Loss and Weighted Average Life.The implementation of IFRS 9 has required, in particular, the setup of a three-stage model for impairment based on changes in credit quality since initial recognition that leads to change in expected credit loss (ECL) measurement. The Expected Credit Loss is measured on either a 12-months (12M) or Lifetime basis depending on the staging of the exposure.EIF assigns an internal rating based on quantitative parameters and qualitative aspects to each G&S transaction to estimate the credit quality in accordance with an expected loss concept. Significant judgments and estimates are thus required to be applied by Management in the assessment and measurement of the financial guarantees and related provisions, especially in cases where there are differences between the rating levels assigned to these transactions among external rating agencies and EIF’s internal rating, or where the G&S transactions are not externally rated at all. Inappropriate judgments made in relation to the methodology and inputs used or the assumptions taken may have a material impact on the valuation of the financial guarantees portfolio.The key inputs and assumptions used by management in its assessment of the valuation of financial guarantee and related provisions are detailed in Note 2.4 as well further disclosures are presented in Notes 3.3 and 5.1 to the financial statements.
How our audit addressed the area of focus? Our procedures over the valuation of the Financial Guarantees included, but were not limited to:• We obtained an understanding of management’s
processes and controls for determining the valuation of financial guarantees. This included discussing with Management the risk management activities, valuation governance structure and protocols around their oversight of the valuation process and corroborating our understanding by attending meetings with appropriate personnel of EIF. We also involved
specialists to review the Internal Rating Model developed by EIF that reflects its assessment of the expected loss of the underlying portfolios of SME loans covered by guarantee agreements with financial intermediaries. The experts were also involved to review the three-stage model for impairment and its impact in the expected credit loss measurement.
• We have identified key controls in the process, assessed the design adequacy and tested the operating effectiveness of some of key controls. In addition, we have obtained the ISAE 3402 report on EIF’s internal controls, compared our understanding of identified key controls in the process, assessed adequacy of their design and implementation and inspected the conclusions reached based on the testing of operating effectiveness of those controls. We did not note significant observations or exceptions in the report that would prevent us to rely on relevant controls over the financial guarantees process.
• We compared management’s valuation methodology to IFRS 9 and EIF’s internal guidelines. We sought explanations from management where there are judgments applied in their application of the guidelines, discussed and assessed their appropriateness and relevance.
• On a sample basis, we assessed the assumptions made to derive the input parameters used in the Internal Rating Model and adequateness of their application, reconciled the input parameters described in the model documentation, and evaluated the assignment of the internal rating. For externally rated G&S transactions we compared the internal rating to ratings assigned by such agencies and checked that it was in line with EIF policy (second worst). We assessed that internal ratings are correctly and timely updated based on market events. We further assessed additional assumptions made to derive the valuation such as the weighted average life, expected maturity date, tranche full profile of guarantee contracts and present value of guarantee fee income and cross-checked these assumptions with market data where applicable. On a sample basis, we reconciled guarantee calls paid during the year to payment demand notices from financial intermediaries.
• We recalculated the provision for financial guarantees based on the expected credit loss three-stage model for impairment.
Other information
The Management is responsible for the other information. The other information comprises the information stated in the annual report and the statement by the Audit Board but does not include the financial statements and our report of “Réviseur d’Entreprises agréé” thereon.Our opinion on the financial statements does not cover the other information and we do not express any form of assurance conclusion thereon.In connection with our audit of the financial statements, our responsibility is to read the other information and, in doing so, consider whether the other information is materially inconsistent with the financial statements or our knowledge obtained in the audit or otherwise appears to be materially misstated. If, based on the work we have performed, we conclude that there is a material misstatement of this other information, we are required to report this fact. We have nothing to report in this regard.
Responsibilities of the Management and Those Charged with Governance for the financial statements
The Management is responsible for the preparation and fair presentation of the financial statements in accordance with IFRSs as adopted by the European Union, and for such internal control as the Management determines is necessary to enable the preparation of financial statements that are free from material misstatement, whether due to fraud or error.In preparing the financial statements, the Management is responsible for assessing the Fund’s ability to continue as a going concern, disclosing, as applicable, matters related to going concern and using the going concern basis of accounting unless the Management either intends to liquidate the Fund or to cease operations, or has no realistic alternative but to do so.Those charged with governance are responsible for overseeing the Fund’s financial reporting process.
8 9
Independent Auditor’s Report Independent Auditor’s Report
/ EIF Financial Statements
Luxembourg, March 11, 2020 KPMG Luxembourg Société coopérative Cabinet de révision agréé
M. Tabart
• Identify and assess the risks of material misstatement of the financial statements, whether due to fraud or error, design and perform audit procedures responsive to those risks, and obtain audit evidence that is sufficient and appropriate to provide a basis for our opinion. The risk of not detecting a material misstatement resulting from fraud is higher than for one resulting from error, as fraud may involve collusion, forgery, intentional omissions, misrepresentations, or the override of internal control.
• Obtain an understanding of internal control relevant to the audit in order to design audit procedures that are appropriate in the circumstances, but not for the purpose of expressing an opinion on the effectiveness of the Fund’s internal control.
• Evaluate the appropriateness of accounting policies used and the reasonableness of accounting estimates and related disclosures made by the Management.
• Conclude on the appropriateness of Managers’ use of the going concern basis of accounting and, based on the audit evidence obtained, whether a material uncertainty exists related to events or conditions that may cast significant doubt on the Fund’s ability to continue as a going concern. If we conclude that a material uncertainty exists, we are required to draw attention in our report of “Réviseur d’Entreprises agréé” to the related disclosures in the financial statements or, if such disclosures are inadequate, to modify our opinion. Our conclusions are based on the audit evidence obtained up to the date of our report of “Réviseur d’Entreprises agréé”. However, future events or conditions may cause the Fund to cease to continue as a going concern.
• Evaluate the overall presentation, structure and content of the financial statements, including the disclosures, and whether the financial statements represent the underlying transactions and events in a manner that achieves fair presentation.
We communicate with those charged with governance regarding, among other matters, the planned scope and timing of the audit and significant audit findings, including any significant deficiencies in internal control that we identify during our audit.From the matters communicated with those charged with governance, we determine those matters that were of most significance in the audit of the financial statements of the current period and are therefore the key audit matters. We describe these matters in our report unless law or regulation precludes public disclosure about the matter or when, in extremely rare circumstances, we determine that a matter should not be communicated in our report because the adverse consequences of doing so would reasonably be expected to outweigh the public interest benefits of such communication.
Responsibilities of the Réviseur d’Entreprises agréé for the audit of the financial statementsThe objectives of our audit are to obtain reasonable assurance about whether the financial statements as a whole are free from material misstatement, whether due to fraud or error, and to issue a report of “Réviseur d’Entreprises agréé” that includes our opinion. Reasonable assurance is a high level of assurance, but is not a guarantee that an audit conducted in accordance with the Law of 23 July 2016 and with ISAs as adopted for Luxembourg by the CSSF will always detect a material misstatement when it exists. Misstatements can arise from fraud or error and are considered material if, individually or in the aggregate, they could reasonably be expected to influence the economic decisions of users taken on the basis of these financial statements.As part of an audit in accordance with the Law of 23 July 2016 and with ISAs as adopted for Luxembourg by the CSSF, we exercise professional judgment and maintain professional skepticism throughout the audit. We also:
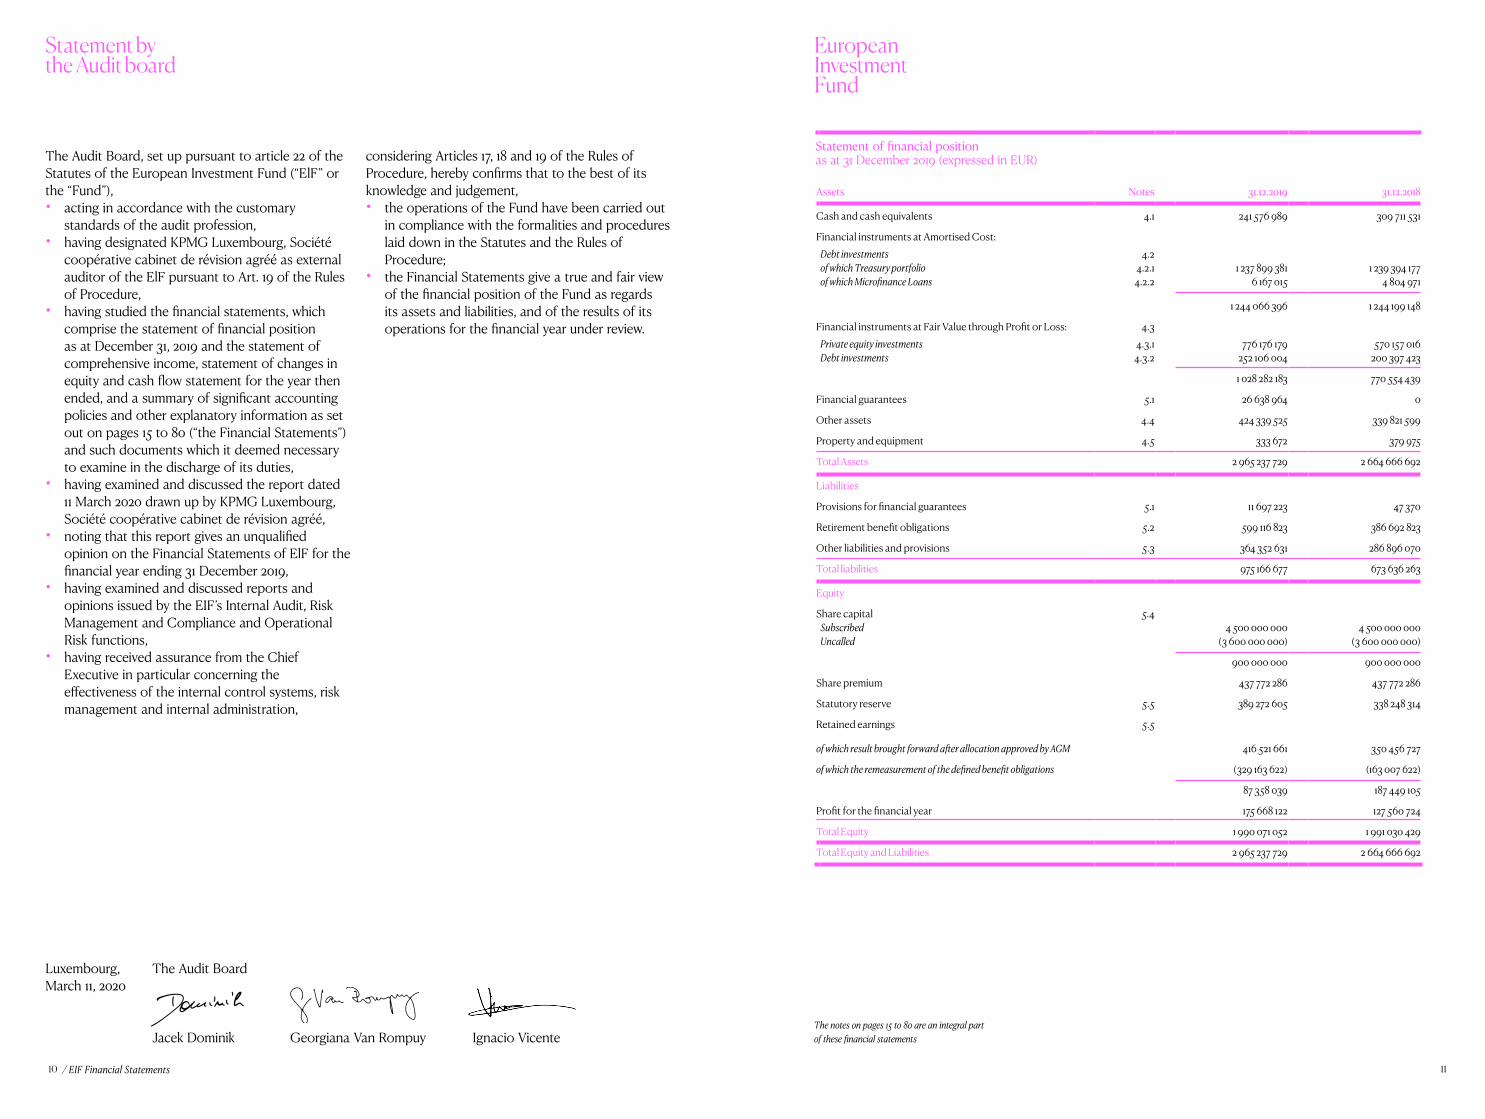
1110 / EIF Financial Statements
The Audit Board
Jacek Dominik Georgiana Van Rompuy Ignacio Vicente
Luxembourg, March 11, 2020
Statement bythe Audit board
European Investment Fund
considering Articles 17, 18 and 19 of the Rules of Procedure, hereby confirms that to the best of its knowledge and judgement,• the operations of the Fund have been carried out
in compliance with the formalities and procedures laid down in the Statutes and the Rules of Procedure;
• the Financial Statements give a true and fair view of the financial position of the Fund as regards its assets and liabilities, and of the results of its operations for the financial year under review.
The Audit Board, set up pursuant to article 22 of the Statutes of the European Investment Fund (“ElF” or the “Fund”),• acting in accordance with the customary
standards of the audit profession,• having designated KPMG Luxembourg, Société
coopérative cabinet de révision agréé as external auditor of the ElF pursuant to Art. 19 of the Rules of Procedure,
• having studied the financial statements, which comprise the statement of financial position as at December 31, 2019 and the statement of comprehensive income, statement of changes in equity and cash flow statement for the year then ended, and a summary of significant accounting policies and other explanatory information as set out on pages 15 to 80 (“the Financial Statements”) and such documents which it deemed necessary to examine in the discharge of its duties,
• having examined and discussed the report dated 11 March 2020 drawn up by KPMG Luxembourg, Société coopérative cabinet de révision agréé,
• noting that this report gives an unqualified opinion on the Financial Statements of ElF for the financial year ending 31 December 2019,
• having examined and discussed reports and opinions issued by the EIF’s Internal Audit, Risk Management and Compliance and Operational Risk functions,
• having received assurance from the Chief Executive in particular concerning the effectiveness of the internal control systems, risk management and internal administration,
The notes on pages 15 to 80 are an integral part of these financial statements
Statement of financial positionas at 31 December 2019 (expressed in EUR)
Assets Notes 31.12.2019 31.12.2018
Cash and cash equivalents 4.1 241 576 989 309 711 531
Financial instruments at Amortised Cost: Debt investments 4.2of which Treasury portfolio 4.2.1 1 237 899 381 1 239 394 177of which Microfinance Loans 4.2.2 6 167 015 4 804 971
1 244 066 396 1 244 199 148
Financial instruments at Fair Value through Profit or Loss: 4.3 Private equity investments 4.3.1 776 176 179 570 157 016Debt investments 4.3.2 252 106 004 200 397 423
1 028 282 183 770 554 439
Financial guarantees 5.1 26 638 964 0
Other assets 4.4 424 339 525 339 821 599
Property and equipment 4.5 333 672 379 975
Total Assets 2 965 237 729 2 664 666 692
Liabilities
Provisions for financial guarantees 5.1 11 697 223 47 370
Retirement benefit obligations 5.2 599 116 823 386 692 823
Other liabilities and provisions 5.3 364 352 631 286 896 070
Total liabilities 975 166 677 673 636 263
Equity
Share capital 5.4Subscribed 4 500 000 000 4 500 000 000Uncalled (3 600 000 000) (3 600 000 000)
900 000 000 900 000 000
Share premium 437 772 286 437 772 286
Statutory reserve 5.5 389 272 605 338 248 314
Retained earnings 5.5
of which result brought forward after allocation approved by AGM 416 521 661 350 456 727
of which the remeasurement of the defined benefit obligations (329 163 622) (163 007 622)
87 358 039 187 449 105
Profit for the financial year 175 668 122 127 560 724
Total Equity 1 990 071 052 1 991 030 429
Total Equity and Liabilities 2 965 237 729 2 664 666 692
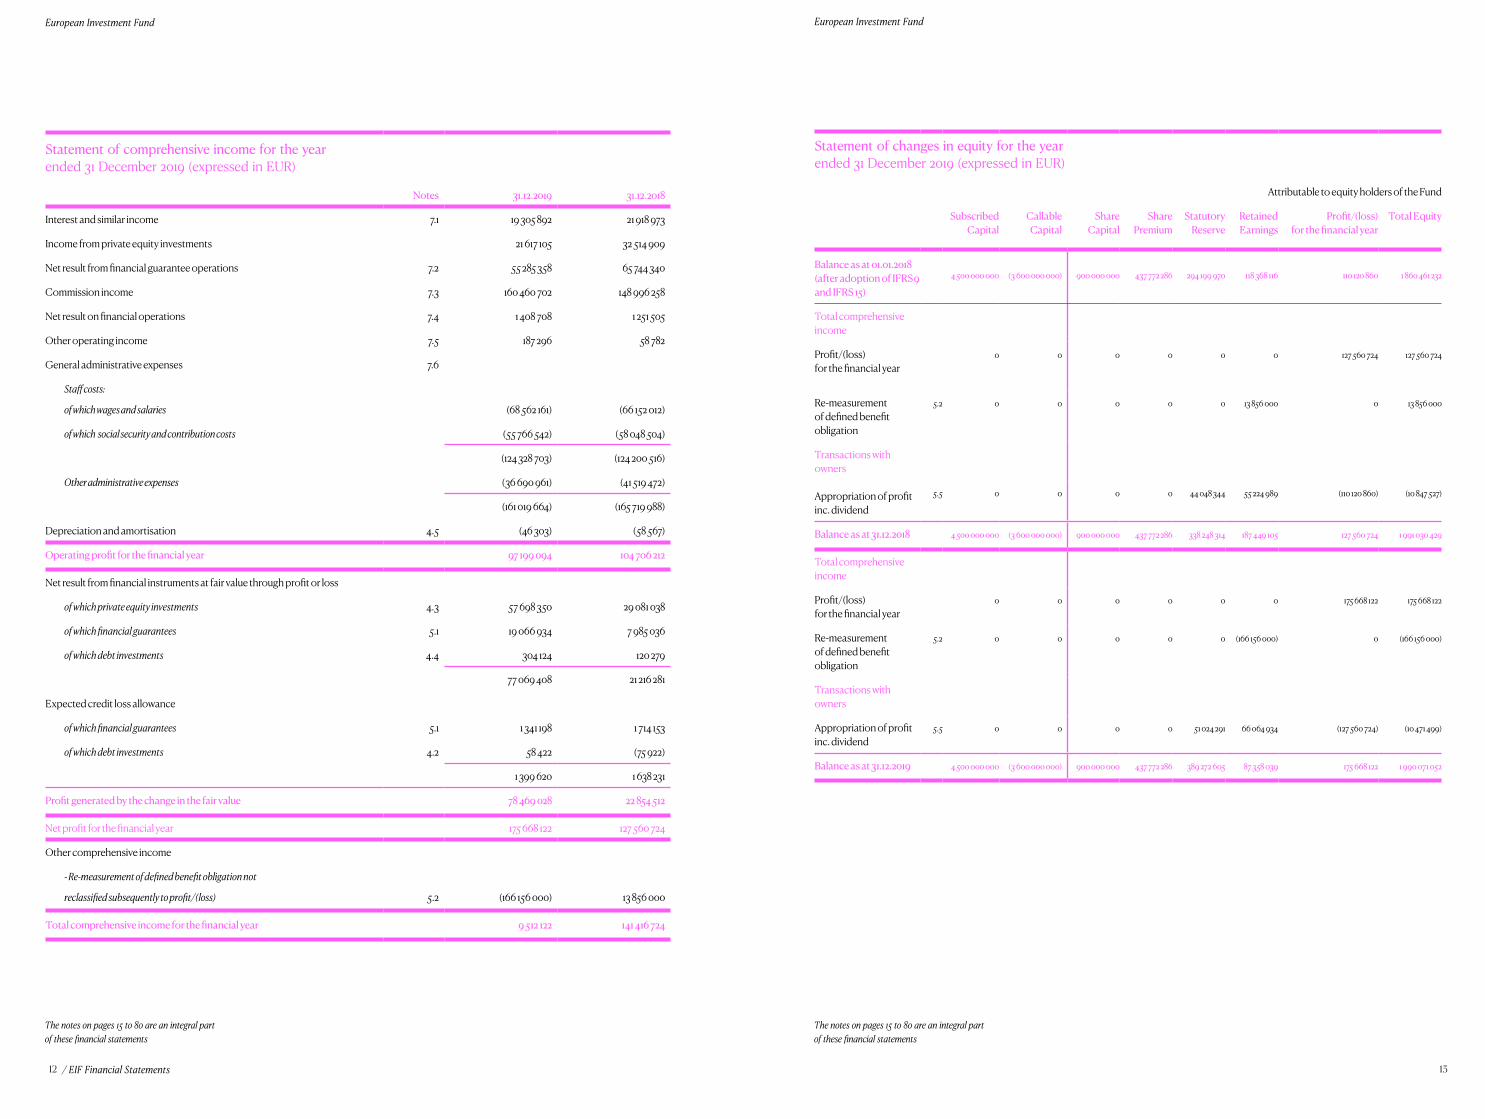
12 13
European Investment Fund European Investment Fund
/ EIF Financial Statements
The notes on pages 15 to 80 are an integral part of these financial statements
The notes on pages 15 to 80 are an integral part of these financial statements
Statement of comprehensive income for the year ended 31 December 2019 (expressed in EUR)
Notes 31.12.2019 31.12.2018
Interest and similar income 7.1 19 305 892 21 918 973
Income from private equity investments 21 617 105 32 514 909
Net result from financial guarantee operations 7.2 55 285 358 65 744 340
Commission income 7.3 160 460 702 148 996 258
Net result on financial operations 7.4 1 408 708 1 251 505
Other operating income 7.5 187 296 58 782
General administrative expenses 7.6
Staff costs:
of which wages and salaries (68 562 161) (66 152 012)
of which social security and contribution costs (55 766 542) (58 048 504)
(124 328 703) (124 200 516)
Other administrative expenses (36 690 961) (41 519 472)
(161 019 664) (165 719 988)
Depreciation and amortisation 4.5 (46 303) (58 567)
Operating profit for the financial year 97 199 094 104 706 212
Net result from financial instruments at fair value through profit or loss
of which private equity investments 4.3 57 698 350 29 081 038
of which financial guarantees 5.1 19 066 934 7 985 036
of which debt investments 4.4 304 124 120 279
77 069 408 21 216 281
Expected credit loss allowance
of which financial guarantees 5.1 1 341 198 1 714 153
of which debt investments 4.2 58 422 (75 922)
1 399 620 1 638 231
Profit generated by the change in the fair value 78 469 028 22 854 512
Net profit for the financial year 175 668 122 127 560 724
Other comprehensive income
- Re-measurement of defined benefit obligation not
reclassified subsequently to profit/(loss) 5.2 (166 156 000) 13 856 000
Total comprehensive income for the financial year 9 512 122 141 416 724
Statement of changes in equity for the year ended 31 December 2019 (expressed in EUR)
Attributable to equity holders of the Fund
Subscribed Capital
Callable Capital
Share Capital
Share Premium
Statutory Reserve
Retained Earnings
Profit/(loss) for the financial year
Total Equity
Balance as at 01.01.2018 (after adoption of IFRS 9 and IFRS 15)
4 500 000 000 (3 600 000 000) 900 000 000 437 772 286 294 199 970 118 368 116 110 120 860 1 860 461 232
Total comprehensive income
Profit/(loss) for the financial year
0 0 0 0 0 0 127 560 724 127 560 724
Re-measurement of defined benefit obligation
5.2 0 0 0 0 0 13 856 000 0 13 856 000
Transactions with owners
Appropriation of profit inc. dividend
5.5 0 0 0 0 44 048 344 55 224 989 (110 120 860) (10 847 527)
Balance as at 31.12.2018 4 500 000 000 (3 600 000 000) 900 000 000 437 772 286 338 248 314 187 449 105 127 560 724 1 991 030 429
Total comprehensive income
Profit/(loss) for the financial year
0 0 0 0 0 0 175 668 122 175 668 122
Re-measurement of defined benefit obligation
5.2 0 0 0 0 0 (166 156 000) 0 (166 156 000)
Transactions with owners
Appropriation of profit inc. dividend
5.5 0 0 0 0 51 024 291 66 064 934 (127 560 724) (10 471 499)
Balance as at 31.12.2019 4 500 000 000 (3 600 000 000) 900 000 000 437 772 286 389 272 605 87 358 039 175 668 122 1 990 071 052
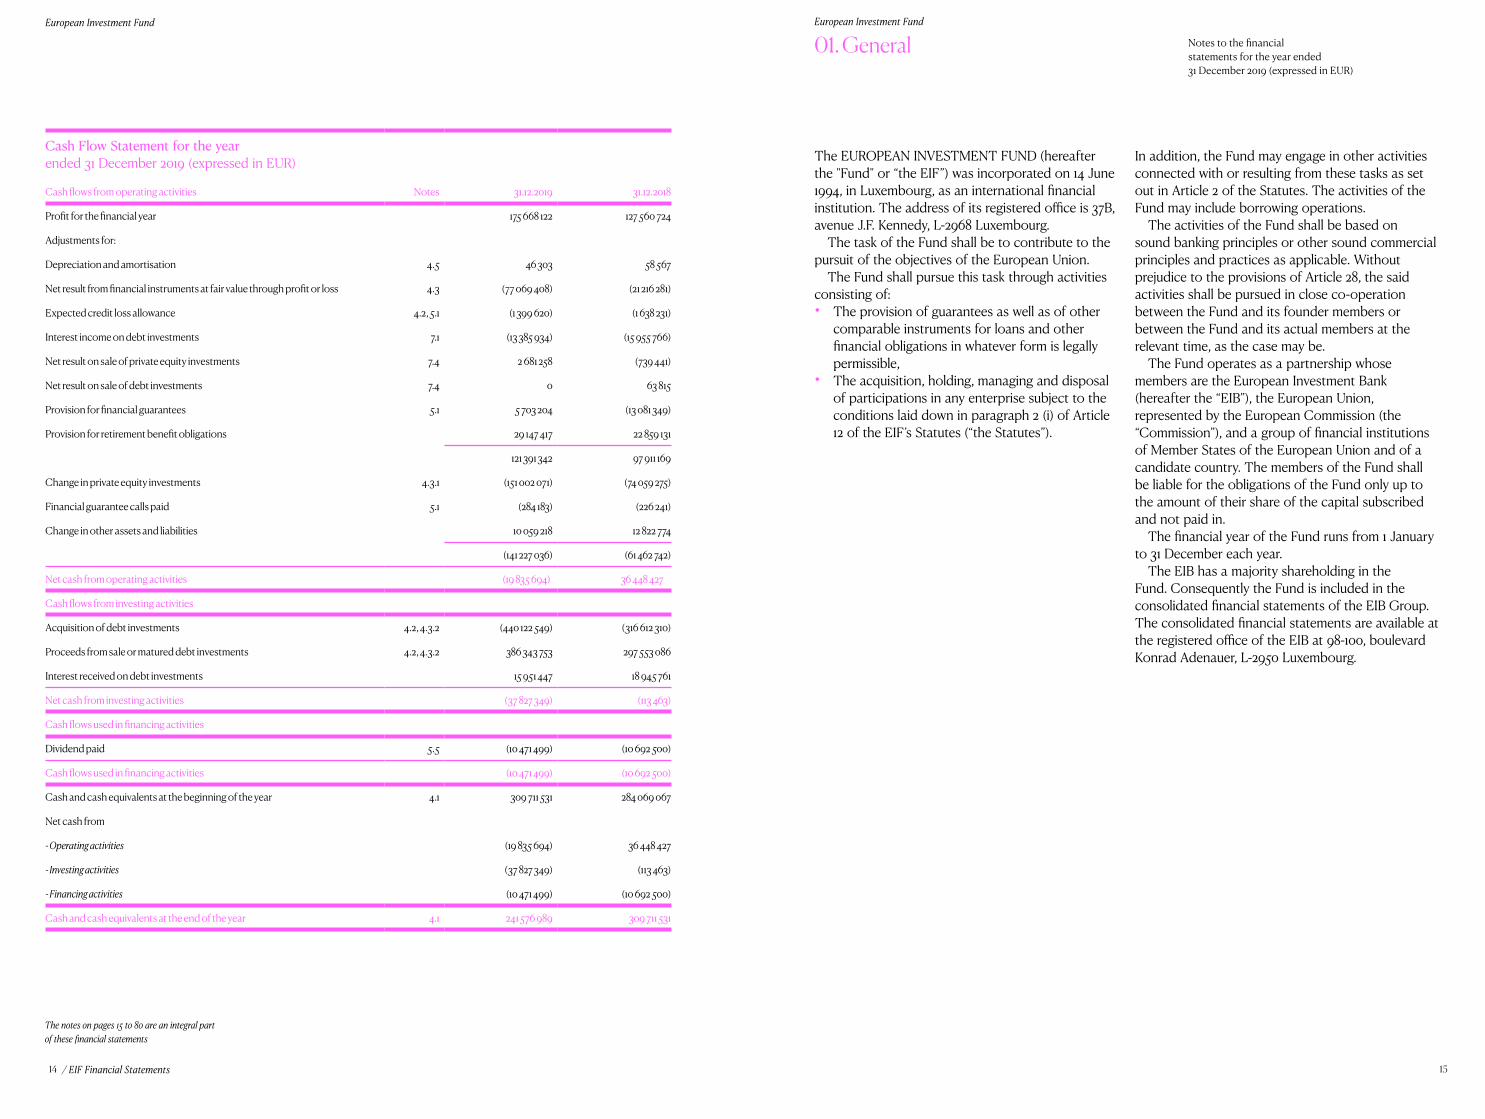
14 15
European Investment Fund European Investment Fund
/ EIF Financial Statements
The notes on pages 15 to 80 are an integral part of these financial statements
01. General Notes to the financial statements for the year ended 31 December 2019 (expressed in EUR)
The EUROPEAN INVESTMENT FUND (hereafter the "Fund" or “the EIF”) was incorporated on 14 June 1994, in Luxembourg, as an international financial institution. The address of its registered office is 37B, avenue J.F. Kennedy, L-2968 Luxembourg.
The task of the Fund shall be to contribute to the pursuit of the objectives of the European Union.
The Fund shall pursue this task through activities consisting of:• The provision of guarantees as well as of other
comparable instruments for loans and other financial obligations in whatever form is legally permissible,
• The acquisition, holding, managing and disposal of participations in any enterprise subject to the conditions laid down in paragraph 2 (i) of Article 12 of the EIF’s Statutes (“the Statutes”).
In addition, the Fund may engage in other activities connected with or resulting from these tasks as set out in Article 2 of the Statutes. The activities of the Fund may include borrowing operations.
The activities of the Fund shall be based on sound banking principles or other sound commercial principles and practices as applicable. Without prejudice to the provisions of Article 28, the said activities shall be pursued in close co-operation between the Fund and its founder members or between the Fund and its actual members at the relevant time, as the case may be.
The Fund operates as a partnership whose members are the European Investment Bank (hereafter the “EIB”), the European Union, represented by the European Commission (the “Commission”), and a group of financial institutions of Member States of the European Union and of a candidate country. The members of the Fund shall be liable for the obligations of the Fund only up to the amount of their share of the capital subscribed and not paid in.
The financial year of the Fund runs from 1 January to 31 December each year.
The EIB has a majority shareholding in the Fund. Consequently the Fund is included in the consolidated financial statements of the EIB Group. The consolidated financial statements are available at the registered office of the EIB at 98-100, boulevard Konrad Adenauer, L-2950 Luxembourg.
Cash Flow Statement for the year ended 31 December 2019 (expressed in EUR)
Cash flows from operating activities Notes 31.12.2019 31.12.2018
Profit for the financial year 175 668 122 127 560 724
Adjustments for:
Depreciation and amortisation 4.5 46 303 58 567
Net result from financial instruments at fair value through profit or loss 4.3 (77 069 408) (21 216 281)
Expected credit loss allowance 4.2, 5.1 (1 399 620) (1 638 231)
Interest income on debt investments 7.1 (13 385 934) (15 955 766)
Net result on sale of private equity investments 7.4 2 681 258 (739 441)
Net result on sale of debt investments 7.4 0 63 815
Provision for financial guarantees 5.1 5 703 204 (13 081 349)
Provision for retirement benefit obligations 29 147 417 22 859 131
121 391 342 97 911 169
Change in private equity investments 4.3.1 (151 002 071) (74 059 275)
Financial guarantee calls paid 5.1 (284 183) (226 241)
Change in other assets and liabilities 10 059 218 12 822 774
(141 227 036) (61 462 742)
Net cash from operating activities (19 835 694) 36 448 427
Cash flows from investing activities
Acquisition of debt investments 4.2, 4.3.2 (440 122 549) (316 612 310)
Proceeds from sale or matured debt investments 4.2, 4.3.2 386 343 753 297 553 086
Interest received on debt investments 15 951 447 18 945 761
Net cash from investing activities (37 827 349) (113 463)
Cash flows used in financing activities
Dividend paid 5.5 (10 471 499) (10 692 500)
Cash flows used in financing activities (10 471 499) (10 692 500)
Cash and cash equivalents at the beginning of the year 4.1 309 711 531 284 069 067
Net cash from
- Operating activities (19 835 694) 36 448 427
- Investing activities (37 827 349) (113 463)
- Financing activities (10 471 499) (10 692 500)
Cash and cash equivalents at the end of the year 4.1 241 576 989 309 711 531
16 17
02. Significant accounting policies and basis of preparation
/ EIF Financial Statements
2.1 Basis of preparation
2.1.1 Statement of compliance
The Fund’s financial statements have been prepared in accordance with International Financial Reporting Standards (IFRS), as issued by the International Accounting Standards Board (IASB), as endorsed by the European Union.
The Fund’s financial statements have been authorised for issue by the Board of Directors on 11 March 2020.
2.1.2 Basis of measurement
The financial statements have been prepared on an historical cost basis except for the following material items in the statement of financial position as at 31 December 2019:• Private equity investments which are measured
at fair value through profit or loss (hereafter “FVTPL“);
• Debt investments which are measured at fair value through profit or loss;
• Expected credit loss on the financial assets and financial liabilities measured at amortised cost (hereafter “AC“);
• The defined benefit liability is recognised as the present value of expected future payments;
• The payer leg of the financial guarantees is measured at the higher of the amount initially recognised less amortisation (when appropriate) under IFRS 15 and the loss allowance determined in accordance with IFRS 9. The receiver leg is measured at fair value through profit or loss by discounting the future cash flows according to IFRS 9.
2.1.3 Use of estimates and judgments
The preparation of financial statements in accordance with IFRS requires the use of certain critical accounting estimates. It also requires management to exercise its judgement when applying the Fund’s policies. Use of available information and application of judgement are inherent in the formation of estimates. Actual results in the future
02. Significant accounting policies and basis of preparation
could differ from such estimates and the differences may be material to the financial statements.
Estimates and underlying assumptions are reviewed on an ongoing basis. Revisions to accounting estimates are recognised in the period in which the estimates are revised and in any future periods affected.
Information about significant areas of estimation uncertainty and critical judgements in applying accounting policies that have the most significant effect on the amounts recognised in the financial statements are described in notes 2.3, 2.4, 2.7 and 3.
Judgements and estimates are principally made in the following areas:• Determination of expected credit loss
allowance of debt investments at amortised cost as disclosed in note 2.3.1 and 2.3.2;
• Determination of fair value of private equity investments as disclosed in notes 2.3.3.1 and 2.3.3.2;
• Determination of control over investees as described in note 2.3.3.3;
• Determination of fair value of debt investments at fair value through profit or loss as disclosed in note 2.3.4;
• Determination of expected credit losses for financial guarantees as disclosed in note 2.4;
• Determination of contract liabilities and commission income as disclosed in notes 2.8 and 2.12;
• Actuaries’ assumptions related to the measurement of pension liabilities and post-retirement benefits as described in note 5.2;
• Determination and disclosures of unconsolidated structured entities and investment entities in which the Fund has an interest as described in note 6.
In respect of unconsolidated structured entities and investment entities in which the Fund has an interest, further disclosures are described in note 6.Regarding the EIF’s exposure to the United Kingdom throughout 2019, the EIF has monitored the developments of the political situation in the United Kingdom and the negotiations between the United Kingdom and the European Union, in the context of the UK’s decision to withdraw from the EU. In this respect, it has been assessed that these events have not materially affected the financial position and performance of the Fund as at 31 December 2019 nor have an impact on its going concern.
2.2 Cash and cash equivalentsCash and cash equivalents comprise short-term, highly liquid securities and interest-earning deposits with short maturities of three months or less from the date of acquisition, which are measured at amortised cost. No expected credit loss allowance is recognised for cash and cash equivalents as they are considered to have low credit risk.
2.3 Financial assets
2.3.1 Classification and measurement
2.3.1.1 Initial recognition, measurement and derecognition
All EIF financial assets composed of debt investments at amortised cost, private equity investments at fair value through profit or loss, and debt investments at fair value through profit or loss, are measured initially at fair value plus transaction costs where applicable. The subsequent measurement is dependent on the classification.
Financial assets are written off (either partially or in full) when there is no reasonable expectation of recovering a financial asset in its entirety or a portion thereof.
All financial assets are derecognised when the contractual cash flows from such financial assets have expired or when EIF has substantially transferred all risks and rewards of ownership.
2.3.1.2 Classification
On initial recognition, a financial asset is classified and measured at amortised cost, fair value through other comprehensive income (hereafter “FVOCI”) or at fair value through profit or loss. Under IFRS 9, classification starts with determining whether the financial asset shall be considered as a debt instrument or an equity instrument.
Debt instruments are those instruments that meet the definition of a financial liability from the issuer’s perspective.
Equity instruments are instruments that meet the definition of equity from the issuer’s perspective; that is, instruments that do not contain a contractual obligation to deliver cash or other financial assets, that evidence a residual interest in the issuer’s net
2.1.4 Changes in accounting policies and presentation
The accounting policies adopted have been applied consistently with those used in the previous year apart from the change in presentation for financial guarantees in the statement of comprehensive income as described below.
During 2019, the methodology for calculating the Exposure at Risk (EaR) was amended in order to better reflect exposures from revolving facilities in the underlying portfolios. In prior years, EaR of such facilities had not been adjusted for repayments despite such being available for future drawdown. The total EaR for the year ended 31 December 2019 amounts to EUR 10 724 025 747 based on the new methodology. Had this not been applied, the EaR would have amounted to EUR 10 690 324 556 (2018: EUR 8 536 699 526).
2.1.5 Foreign currency translation
The Euro (EUR) is the functional and presentation currency.
Depending on the classification of a non-monetary financial asset, exchange differences are either recognised in the profit or loss or in equity.
Non-monetary items are reported using the exchange rate at the date of the transaction (historical cost). Exchange differences on non-monetary financial assets are a component of the change in their fair value. Non-monetary items measured at fair value in a foreign currency are translated using the exchange rates at the date when the fair value is determined.
Monetary items, which include all other assets and liabilities expressed in a currency other than EUR are reported using the closing exchange rate prevailing at the reporting date of the financial statements, as issued by the European Central Bank. Exchange differences are recognised in the profit or loss in the year in which they arise.
Income and charges in foreign currencies are translated into EUR at the exchange rate prevailing at the date of the transaction.
18 19
02. Significant accounting policies and basis of preparation 02. Significant accounting policies and basis of preparation
/ EIF Financial Statements
assets and that do not give the holder the right to put the instrument back to the issuer for cash or another financial asset or that is automatically put back to the issuer on occurrence of an uncertain future event.
Classification and subsequent measurement of debt instruments depend on:• The EIF’s business model for managing the asset;
and• The contractual cash flow characteristics of the
asset.A debt instrument is classified at AC if it meets both the following conditions and is not designated at FVTPL at initial recognition:• The asset is held within a business model whose
objective is to hold assets to collect contractual cash flows; and
• The contractual terms of the financial asset give rise on specified dates to cash flows that are solely payments of principal and interest (SPPI criteria) on the principal amount outstanding.
A debt instrument is classified at FVOCI only if it meets both the following conditions and is not designated at FVTPL at initial recognition:• The asset is held within a business model
whose objective is achieved by both collecting contractual cash flows and selling financial assets, and
• The contractual terms of the financial asset give rise on specific dates to cash flows that are fulfilling the SPPI criteria.
The above requirements should be applied to an entire financial asset, even if it contains an embedded derivative.On initial recognition of an equity instrument that is not held for trading, the Fund may irrevocably elect to present subsequent changes in other comprehensive income. This election is made on an investment-by-investment basis.
All other financial assets with the exception of financial guarantees (see note 2.4) are classified and measured at FVTPL.
Business model assessmentThe Fund makes an assessment of the objective of a business model in which a debt instrument is held at a portfolio level because this best reflects the way the business is managed and information provided to management. The information considered includes:
• The stated policies and objectives for the portfolio and the operation of those policies in practice. In particular, whether management´s strategy focuses on earning contractual interest revenue, maintaining a particular interest rate profile, matching the duration of the financial assets to the duration of the liabilities that are funding those assets or realising cash flows through the sale of the assets;
• How the performance of the portfolio is evaluated and reported to the management;
• The risks that affect the performance of the business model (and the financial assets held within that business model) and how those risks are managed; and
• The frequency, volume and timing of sales in prior periods, the reasons for such sales and its expectation about future sales activity. However, information about sales activity is not considered in isolation, but as part of an overall assessment of how the stated objective for managing the financial assets is achieved and how cash flows are realised.
The EIF business model is to hold future cash flows.
SPPI criteria For the purpose of this assessment, “principal” is defined as the fair value of the debt instrument on initial recognition. ‘Interest’ is defined as consideration for the time value of money and for the credit risk associated with the principal amount outstanding during a particular period of time and for other basic lending risks and costs (e.g. liquidity risk and administrative costs), as well as profit margin.In assessing whether the contractual cash flows are solely payments of principal and interest, the Fund considers the contractual terms of the instrument. This includes assessing whether the financial asset contains a contractual term that could change the timing or amount of contractual cash flows such that it would not meet this condition. The information considered includes: • Contingent events that would change the amount
and timing of cash flows;• Performance participation features;• Prepayment terms;• Terms that limit the Fund’s claim to cash flows
from specified assets; and• Features that modify consideration of the time
value of money – e.g. periodical reset of interest rates.
2.3.1.3 Fair value measurement
Fair value is defined as the price that would be received to sell an asset or paid to transfer a liability in an orderly transaction between market participants at the measurement date. When available, the EIF measures the fair value of an instrument using quoted prices in an active market for that instrument. A market is regarded as active if transactions take place with sufficient frequency and volume to provide pricing information on an ongoing basis.
The determination of fair value for financial assets and liabilities for which there is no observable market price requires the use of valuation techniques as described hereafter.
For financial instruments that trade infrequently and have limited price transparency, fair value is less objective, and requires varying degrees of judgement depending on liquidity, concentration, uncertainty of market factors, pricing assumptions and other risks affecting the specific instrument.
2.3.1.4 Expected credit loss measurement
The Fund assesses on a forward-looking basis the expected credit loss associated with its financial assets that are not measured at FVTPL. In the statement of financial position, the expected credit loss allowance is netted against the gross amounts.
Expected credit loss is recognised for the treasury portfolio, the microfinance loans and the financial guarantees. For more details, see note 3.3.1.5.
No expected credit loss allowance is recognised for cash and cash equivalents and accounts receivables as they are considered to have low credit risk.
2.3.2 Debt investments at amortised cost
Debt investments at amortised cost are composed of the treasury portfolio and microfinance loans. They are held by the Fund with the intention to collect contractual cash flows and classified at amortised cost. As part of the Fund’s business model, disposals of these debt investments at amortised cost are considered to be infrequent or insignificant in volume.
As classified and measured at amortised cost, a 12 month or lifetime expected credit loss depending on the allocated staging is calculated and accounted for at each reporting date. See note 3.3.1.5.
2.3.3 Private equity investments at fair value through profit or loss
Private equity investments (hereafter “PE”) at fair value through profit or loss include private equity investment funds and the EIF’s exposure in the European Fund for Strategic Investments SME window through sub-window 1 of the private credit tailored for SMEs product and its senior tranche exposure through sub-window 2 of the equity product.
2.3.3.1 Fair value measurement of the Private equity investments
Private equity (PE) investments are measured at FVTPL and disclosed in accordance with the fair value hierarchy required by IFRS 13. Given the nature of PE, market prices are often not readily available and in the absence of these, valuation techniques (level 3 according to the fair value hierarchy) are applied.
For the valuation of PE, the Fund further breaks down these valuation techniques into three categories as follows:• Category A - funds that have adopted the fair
value requirements of IFRS 9 or International Private Equity and Venture Capital guidelines (IPEV valuation guidelines). The fair value is calculated by applying the aggregated Net Asset Value (NAV) method. This valuation method implicitly assumes that if the NAVs of underlying funds can be considered as equivalent to the fair value as determined under IFRS 9, then the aggregation of the NAVs of all funds will itself be equivalent to the fair value as determined under IFRS 9.
• Category B - funds that have adopted other valuation guidelines or standards that can be considered as in line with IFRS 9 from which an equivalent NAV can be calculated.
• Category C – funds that have not adopted the fair value requirements of IFRS 9 or any other valuation guidelines complying with IFRS 9. These investments are further classified as:• Category C.1 – the valuation of investments
under this sub-category is re-performed internally by either Equity Investments & Guarantees department or Equity Transaction & Portfolio Services division, depending on the service in charge of the funds.
20 21
02. Significant accounting policies and basis of preparation 02. Significant accounting policies and basis of preparation
/ EIF Financial Statements
• Category C.2 – investments under this sub-category are internally fair valued by analysing the information communicated by fund managers when providing the NAV on a quarterly basis.
Although it is assumed for category A and B that the NAV is a reliable estimation of the fair value and a specific review is performed, it must be stated that underlying investments have been estimated in the absence of readily ascertainable market values. Due to the inherent uncertainty of valuations, and current market conditions, actual results in the future could differ from the fund managers’ estimates of values and such differences may be material to the financial statements.
The fair value is determined by applying either the Fund’s percentage ownership in the underlying vehicle to the net asset value reflected in the most recent report, adjusted for cash flows or, where available, the precise share value at the same date, submitted by the respective fund manager.
2.3.3.2 Fair value measurement of the EIF’s senior tranche exposure
Given the nature of EIF’s exposure in the European Fund for Strategic Investments SME window through sub-window 1 of the private credit tailored for SMEs product and its senior tranche exposure through sub-window 2 of the equity product, valuation technique (level 3) according to the fair value hierarchy are applied. The fair value is composed of the net paid in representing the drawdowns paid net of any repayment and of the 2.5% of internal rate return expected on the underlying portfolio calculated in arears. At each reporting date, the internal rate return is reviewed and adjusted according to the performance of the underlying investments. Finally, the carrying amount of EIF’s senior tranche exposure may be adjusted by an expected loss in case the junior tranche owned by a third party is fully utilised to cover future losses.
2.3.3.3 Interests in joint ventures and associates
The EIF complies with the conditions necessary to use the venture capital organisations and similar entities measurement exemption included in IFRS 11 and IAS 28.11 and consequently decides not to use equity accounting in respect of any investments in joint ventures or associates: upon initial recognition, holdings in the joint ventures or
associates are designated as at fair value through the profit or loss, and measured subsequently at fair value, with changes in fair value recognised in the profit or loss during the year of the change.
Joint ventures are contractual agreements whereby the EIF and other parties undertake an economic activity that is subject to joint control. Joint control is the contractually agreed sharing of control over an economic activity, and exists only when the strategic, financial and operating decisions relating to the activity require the unanimous consent of the parties sharing the control (the venturers).
The shares acquired by the EIF for its own account or on behalf of its mandate providers typically represent investments in private equity or venture capital funds. According to industry practice, such investments are generally investments subscribed to by a number of investors, none of whom is in a position to individually influence the daily operations and the investment activity of such funds. As a consequence, any membership by an investor in a governing body of such a fund does not, in principle, entitle said investor to influence the day-to-day operations of the fund. In addition, individual investors in a private equity or a venture capital fund do not determine policies of a fund such as distribution policies on capital repayments or other distributions. Such decisions are typically taken by the management of a fund on the basis of the shareholders’ agreement governing the rights and obligations of the management and all shareholders of the fund. The shareholders’ agreement also generally prevents individual investors from bilaterally executing material transactions with the fund, interchanging managerial personnel or obtaining privileged access to essential technical information.
The EIF’s investments, made for its own account or on behalf of its mandate providers, are executed in line with the aforementioned industry practice. In addition, the Fund is exposed to variability of returns from these investments. Therefore, in considering whether it has control, the Fund considers whether it manages key decisions that most significantly affect these investments’ returns. As a result and according to IFRS 10, the Fund has concluded that it does not control those vehicles.
2.3.4 Debt investments at fair value through profit or loss
These financial assets consist of Asset-Backed Securities with SME loans in the underlying portfolios which take the form of notes issued by Special Purpose Vehicles (“SPV”) or financial institutions.
At the reporting date, the whole portfolio does not pass the SPPI test and is thus classified and measured at FVTPL.
2.4 Financial guarantee operations
Financial guarantee contracts are contracts that require the EIF to make specified payments to reimburse the holder for a loss it incurs because a specified debtor fails to make payments when due in accordance with the terms of a debt instrument.
Financial guarantees consist of a receiver leg and a payer leg. The financial guarantees are presented in the statement of financial position by offsetting the receiver leg with the payer leg. They are initially recognised at fair value plus transaction costs that are directly attributable to the issuance of the financial guarantees. At initial recognition the obligation to pay corresponds to the Net Present Value (NPV) of expected premium inflows. The EIF has developed a model to estimate the NPV. This calculation is performed at the starting date of each transaction.
Subsequent to initial recognition, the payer leg of the financial guarantees is measured at the higher of:• the amount of the loss allowance determined in
accordance with IFRS 9; or• the amount initially recognised i.e. NPV less,
where appropriate, cumulative amortisation recognised in accordance with IFRS 15 Revenue from contracts with customers.
The receiver leg is then measured at fair value through profit or loss by discounting the future cash flows according to IFRS 9.
The EIF’s amortisation of the amount initially recognised is in line with the risk profile of the transactions. The transaction is fully amortised following full repayment of a securitisation tranche.
In the event that the measurement of a financial guarantee contract results in a net asset position, then the operation is presented in the statement of financial position under “Financial guarantees”.In the event that this results in a net liability, then
the guarantee is presented in the statement of financial position under “Provisions for financial guarantees”.
Any increase or decrease in the fair value of financial guarantees is recognised in the profit or loss under “Net result from financial instruments at fair value through profit or loss”.
Other increases or decreases, such as amortisation of the payer leg but not including the recognition of new financial guarantees, are recognised in the profit or loss under “Net result from financial guarantee operations”.
The expected credit loss is recognised in the profit or loss under “Expected credit loss allowance”.
2.5 Other assets
Other assets which are accounted for at amortised cost include mainly the funds designated to cover the pension liability, accrued commission income, debtors and contract assets.
A contract asset is the right to consideration in exchange for services transferred to the customer. If the Fund performs services to a customer before the customer pays consideration or before payment is due, a contract asset is recognised for the earned consideration that is conditional.
2.6 Property and Equipment
2.6.1 Property and Equipment
Equipment is stated at cost less accumulated depreciation and impairment losses. Equipment is reviewed for indications of impairment at the date of the statement of financial position.
Depreciation is calculated on a straight-line basis over the following estimated useful lives:
Fixtures and Fittings: 3 to 10 years
Office Equipment: 3 to 5 years
Computer Equipment and Vehicles: 3 years
Buildings: 30 years
22 23
02. Significant accounting policies and basis of preparation 02. Significant accounting policies and basis of preparation
/ EIF Financial Statements
2.6.2 Impairment of non-financial assets
The EIF assesses at each reporting date the carrying amounts of the non-financial assets to determine whether there is any indication of impairment. If any such indication exists, then the asset’s recoverable amount is estimated. If the carrying amount exceeds the estimated recoverable amount, impairment losses are recognised in the profit or loss.
2.7 Employee benefits
2.7.1 Post-employment benefits
Pension fundThe EIF operates an unfunded pension plan of the defined benefit type, providing retirement benefits based on final salary. The cost of providing this benefit is calculated by the actuary using the projected unit credit cost method. The defined benefit liability is recognised as the present value of expected future payments.
Actuarial valuations involve making assumptions about discount rates, expected rates of return of assets, future salary increases, mortality rates and future pension increases. All assumptions are reviewed at each reporting date. Due to the long-term nature of this pension scheme, such estimates are subject to significant uncertainty.Actuarial gains and losses arising from experience adjustments and changes in actuarial assumptions are debited or credited to equity in other comprehensive income in the period in which they arise.
The Fund’s defined benefit scheme was initiated in March 2003 to replace the previous defined contribution scheme. The scheme is financed by contributions from staff and the Fund. These amounts are transferred to the EIB for management with the EIB’s own assets and appear on the Fund’s statement of financial position as an asset under the heading “Other assets”.The charge for the year, actuarial gains and losses, and the total defined benefit obligation are calculated annually by qualified external actuaries.
Optional supplementary provident schemeThe optional supplementary provident scheme is a defined contribution pension scheme, funded
by voluntary staff contributions and employer contributions. It is accounted for on the basis of the contributions from staff and employer and the corresponding liability is recorded in “Other liabilities”.
Health insurance schemeThe Fund has subscribed to a health insurance scheme with an insurance company for the benefit of staff at retirement age, financed by contributions from the Fund and its employees. The entitlement is of a defined benefit type and is based on the employee remaining in service up to retirement age and on the completion of a minimum service period. The expected costs of this benefit are accrued over the period of employment, using a methodology similar to that for defined benefit pension plans. Health insurance liabilities are determined based on actuarial calculations, performed annually by qualified external actuaries.
2.7.2 Short-term employee benefits
Employee entitlements to short-term benefits are recognised when they accrue to employees. A provision is made for the estimated liability for any outstanding short-term benefit entitlement as a result of services rendered by employees up to the date of the statement of financial position.
2.7.3 Other long-term employee benefits
An accrual for other long-term employee benefit costs relating to the year is included in the profit or loss under the heading “Staff costs”, resulting in a provision for the estimated liability at the date of the statement of financial position.
2.8 Other liabilities and provisions
Other liabilities are classified according to the substance of the contractual arrangements entered into. Trade payables are non-interest bearing liabilities and are stated at amortised cost. They include contract liabilities that correspond
to advance commission income that the Fund receives for services that will be performed in the future. As the service is delivered over time, it will be recognised as revenue on the income statement. For the description of revenue recognition, see note 2.12.
Provisions are recognised when the Fund has a present obligation, legal or constructive, as a result of a past event, and it is probable that the Fund will be required to settle that obligation.
2.9 Interest and similar income
Interest income and similar income is recognised in the profit or loss for all interest-bearing instruments on an accrual basis using the effective interest method based on the purchase price including direct transaction costs. This is a method of calculating the amortised cost of a financial asset and allocating the interest income over the relevant period. The effective interest rate is the rate that exactly discounts estimated future cash receipts through the expected life of the financial instrument to the net carrying amount of the financial asset.
2.10 Income from Private equity investments
Income from Private equity investments includes capital dividends and repayments which are recognised when the EIF’s investment cost is fully reimbursed.
2.11 Net result from financial guarantee operations
Net result from financial guarantee operations includes:• Amortisation of the payer leg of the financial
guarantees;• Intermediation and risk cover fees, including for
risk-sharing mandates;• Net guarantee calls.
2.12 Commission income
This heading includes fees and commissions on active mandates and advisory activities but excludes guarantee premiums.
A mandate is a delegation agreement (hereafter “agreement”) signed between the EIF and a Mandator under which the EIF is designated responsibility for the implementation of a desired programme designed in order to support small and medium-sized businesses access finance, in return for which it is entitled to receive management fees and commissions.
The EIF receives remuneration from mandate management and advisory activities under an agreement with a set of clearly defined service requirements.
Commission income is recognised when control of the services is transferred at an amount that reflects the consideration that the EIF expects to be entitled to in exchange for these services.
Fees and commissions are recognised on an accruals basis when the service foreseen under an agreement has been provided. Management, advisory and service fees are recognised based on the applicable service contracts, usually on a pro-rata basis. Asset management fees related to investment funds are recognised over the period in which the service is provided.
The EIF considers services promised under agreements to be a series of distinct services that are satisfied over time (continuous service) and the same methodology is used to measure progress. Given the service criteria to be met, the EIF accounts for all of the services that make up the series as a single performance obligation.
The amount of commission income received is fixed or variable, based on certain criteria depending on different variable components such as percentage of the EU contribution committed or linked to this single performance obligation. If the consideration includes a variable amount, the EIF estimates the amount of consideration to which it will be entitled to in exchange for transferring the services to the customer.
Regarding the performance obligations satisfied over time, the EIF uses the “Input Method” to recognise income on the basis of its efforts or inputs to the satisfaction of these performance obligations and recognise over the time such fees.
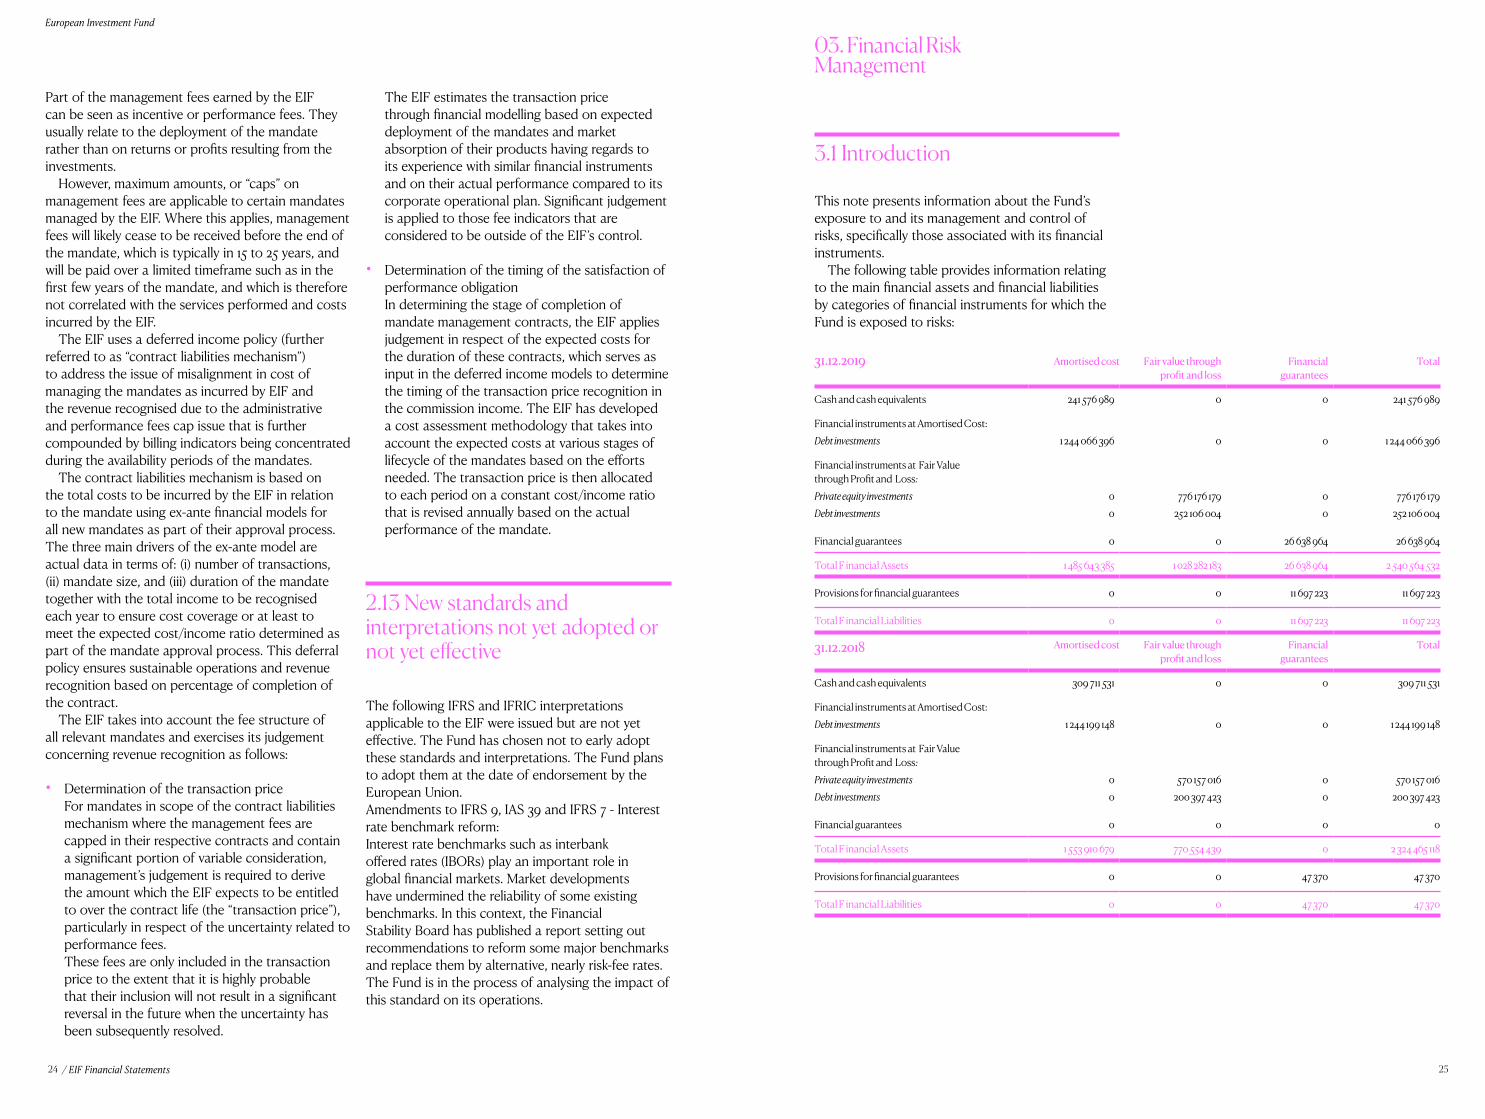
24
European Investment Fund
/ EIF Financial Statements 25
Part of the management fees earned by the EIF can be seen as incentive or performance fees. They usually relate to the deployment of the mandate rather than on returns or profits resulting from the investments.
However, maximum amounts, or “caps” on management fees are applicable to certain mandates managed by the EIF. Where this applies, management fees will likely cease to be received before the end of the mandate, which is typically in 15 to 25 years, and will be paid over a limited timeframe such as in the first few years of the mandate, and which is therefore not correlated with the services performed and costs incurred by the EIF.
The EIF uses a deferred income policy (further referred to as “contract liabilities mechanism”) to address the issue of misalignment in cost of managing the mandates as incurred by EIF and the revenue recognised due to the administrative and performance fees cap issue that is further compounded by billing indicators being concentrated during the availability periods of the mandates.
The contract liabilities mechanism is based on the total costs to be incurred by the EIF in relation to the mandate using ex-ante financial models for all new mandates as part of their approval process. The three main drivers of the ex-ante model are actual data in terms of: (i) number of transactions, (ii) mandate size, and (iii) duration of the mandate together with the total income to be recognised each year to ensure cost coverage or at least to meet the expected cost/income ratio determined as part of the mandate approval process. This deferral policy ensures sustainable operations and revenue recognition based on percentage of completion of the contract.
The EIF takes into account the fee structure of all relevant mandates and exercises its judgement concerning revenue recognition as follows:
• Determination of the transaction price For mandates in scope of the contract liabilities mechanism where the management fees are capped in their respective contracts and contain a significant portion of variable consideration, management’s judgement is required to derive the amount which the EIF expects to be entitled to over the contract life (the “transaction price”), particularly in respect of the uncertainty related to performance fees. These fees are only included in the transaction price to the extent that it is highly probable that their inclusion will not result in a significant reversal in the future when the uncertainty has been subsequently resolved.
3.1 Introduction
This note presents information about the Fund’s exposure to and its management and control of risks, specifically those associated with its financial instruments.
The following table provides information relating to the main financial assets and financial liabilities by categories of financial instruments for which the Fund is exposed to risks:
03. Financial Risk Management
The EIF estimates the transaction price through financial modelling based on expected deployment of the mandates and market absorption of their products having regards to its experience with similar financial instruments and on their actual performance compared to its corporate operational plan. Significant judgement is applied to those fee indicators that are considered to be outside of the EIF’s control.
• Determination of the timing of the satisfaction of performance obligation In determining the stage of completion of mandate management contracts, the EIF applies judgement in respect of the expected costs for the duration of these contracts, which serves as input in the deferred income models to determine the timing of the transaction price recognition in the commission income. The EIF has developed a cost assessment methodology that takes into account the expected costs at various stages of lifecycle of the mandates based on the efforts needed. The transaction price is then allocated to each period on a constant cost/income ratio that is revised annually based on the actual performance of the mandate.
2.13 New standards and interpretations not yet adopted or not yet effective
The following IFRS and IFRIC interpretations applicable to the EIF were issued but are not yet effective. The Fund has chosen not to early adopt these standards and interpretations. The Fund plans to adopt them at the date of endorsement by the European Union.Amendments to IFRS 9, IAS 39 and IFRS 7 - Interest rate benchmark reform:Interest rate benchmarks such as interbank offered rates (IBORs) play an important role in global financial markets. Market developments have undermined the reliability of some existing benchmarks. In this context, the Financial Stability Board has published a report setting out recommendations to reform some major benchmarks and replace them by alternative, nearly risk-fee rates.The Fund is in the process of analysing the impact of this standard on its operations.
31.12.2019 Amortised cost Fair value throughprofit and loss
Financialguarantees
Total
Cash and cash equivalents 241 576 989 0 0 241 576 989
Financial instruments at Amortised Cost:Debt investments 1 244 066 396 0 0 1 244 066 396
Financial instruments at Fair Valuethrough Profit and Loss:Private equity investments 0 776 176 179 0 776 176 179Debt investments 0 252 106 004 0 252 106 004
Financial guarantees 0 0 26 638 964 26 638 964
Total F inancial Assets 1 485 643 385 1 028 282 183 26 638 964 2 540 564 532
Provisions for financial guarantees 0 0 11 697 223 11 697 223
Total F inancial Liabilities 0 0 11 697 223 11 697 223
31.12.2018 Amortised cost Fair value throughprofit and loss
Financialguarantees
Total
Cash and cash equivalents 309 711 531 0 0 309 711 531
Financial instruments at Amortised Cost:Debt investments 1 244 199 148 0 0 1 244 199 148
Financial instruments at Fair Valuethrough Profit and Loss:Private equity investments 0 570 157 016 0 570 157 016Debt investments 0 200 397 423 0 200 397 423
Financial guarantees 0 0 0 0
Total F inancial Assets 1 553 910 679 770 554 439 0 2 324 465 118
Provisions for financial guarantees 0 0 47 370 47 370
Total F inancial Liabilities 0 0 47 370 47 370
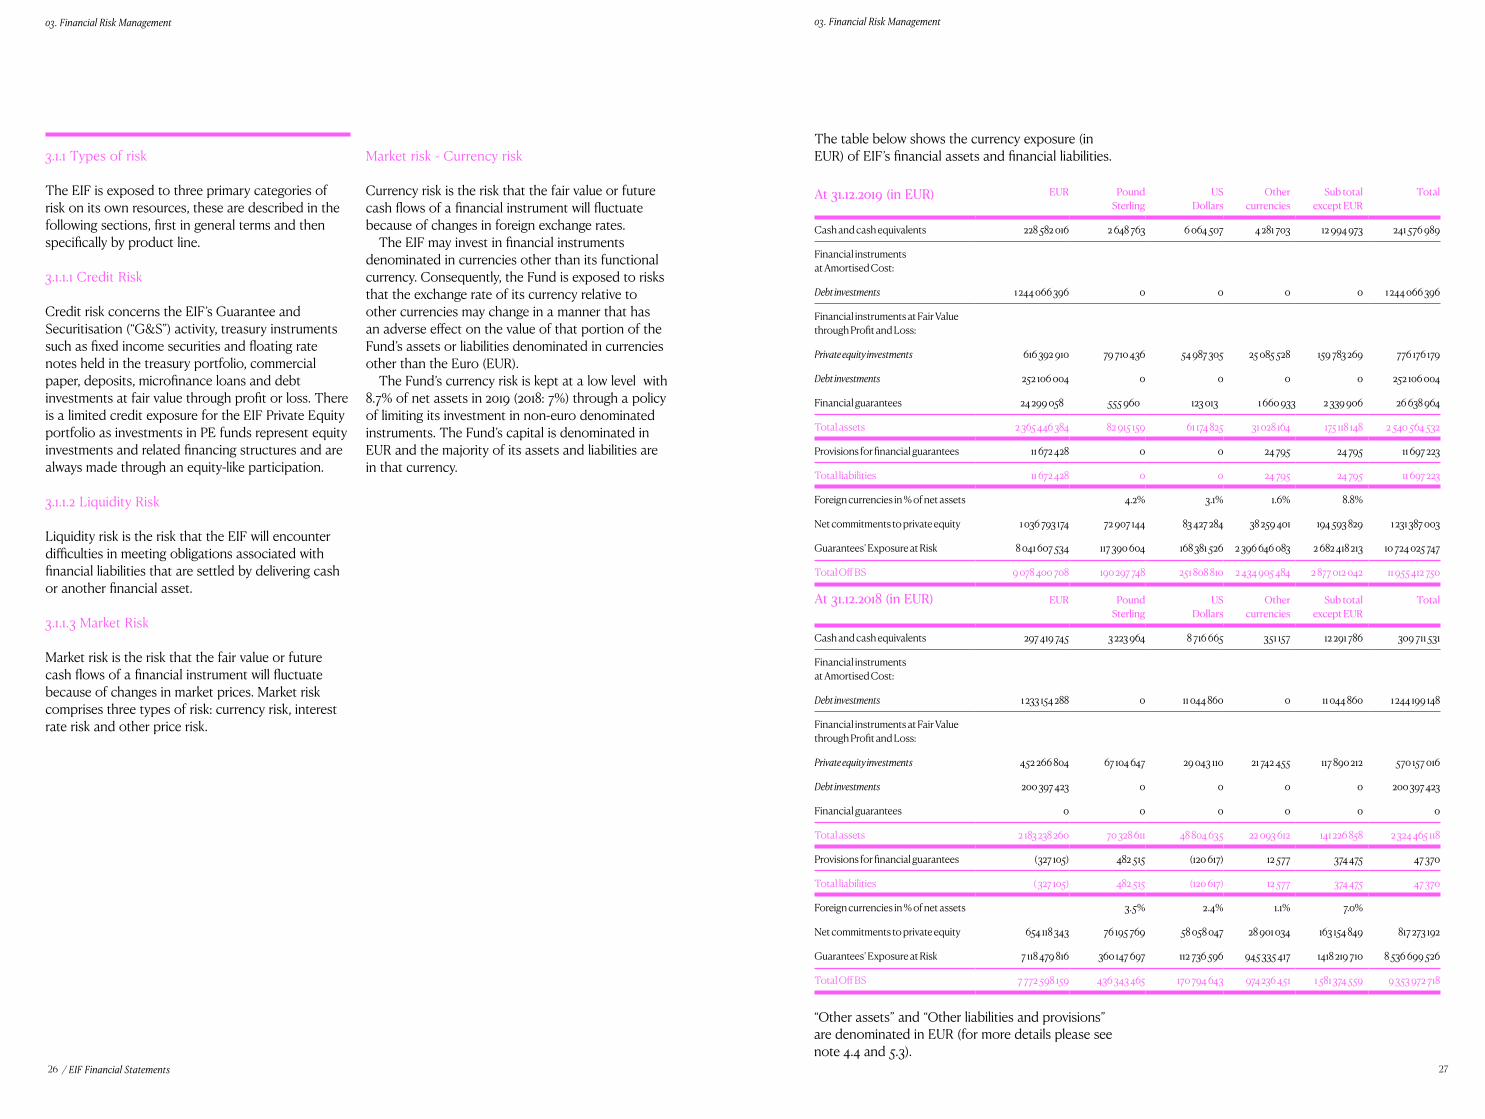
26 27
03. Financial Risk Management 03. Financial Risk Management
/ EIF Financial Statements
3.1.1 Types of risk
The EIF is exposed to three primary categories of risk on its own resources, these are described in the following sections, first in general terms and then specifically by product line.
3.1.1.1 Credit Risk
Credit risk concerns the EIF’s Guarantee and Securitisation (“G&S”) activity, treasury instruments such as fixed income securities and floating rate notes held in the treasury portfolio, commercial paper, deposits, microfinance loans and debt investments at fair value through profit or loss. There is a limited credit exposure for the EIF Private Equity portfolio as investments in PE funds represent equity investments and related financing structures and are always made through an equity-like participation.
3.1.1.2 Liquidity Risk
Liquidity risk is the risk that the EIF will encounter difficulties in meeting obligations associated with financial liabilities that are settled by delivering cash or another financial asset.
3.1.1.3 Market Risk
Market risk is the risk that the fair value or future cash flows of a financial instrument will fluctuate because of changes in market prices. Market risk comprises three types of risk: currency risk, interest rate risk and other price risk.
Market risk - Currency risk
Currency risk is the risk that the fair value or future cash flows of a financial instrument will fluctuate because of changes in foreign exchange rates.
The EIF may invest in financial instruments denominated in currencies other than its functional currency. Consequently, the Fund is exposed to risks that the exchange rate of its currency relative to other currencies may change in a manner that has an adverse effect on the value of that portion of the Fund’s assets or liabilities denominated in currencies other than the Euro (EUR).
The Fund’s currency risk is kept at a low level with 8.7% of net assets in 2019 (2018: 7%) through a policy of limiting its investment in non-euro denominated instruments. The Fund’s capital is denominated in EUR and the majority of its assets and liabilities are in that currency.
The table below shows the currency exposure (in EUR) of EIF’s financial assets and financial liabilities.
“Other assets” and “Other liabilities and provisions” are denominated in EUR (for more details please see note 4.4 and 5.3).
At 31.12.2019 (in EUR) EUR PoundSterling
USDollars
Othercurrencies
Sub total except EUR
Total
Cash and cash equivalents 228 582 016 2 648 763 6 064 507 4 281 703 12 994 973 241 576 989
Financial instrumentsat Amortised Cost:
Debt investments 1 244 066 396 0 0 0 0 1 244 066 396
Financial instruments at Fair Value through Profit and Loss:
Private equity investments 616 392 910 79 710 436 54 987 305 25 085 528 159 783 269 776 176 179
Debt investments 252 106 004 0 0 0 0 252 106 004
Financial guarantees 24 299 058 555 960 123 013 1 660 933 2 339 906 26 638 964
Total assets 2 365 446 384 82 915 159 61 174 825 31 028 164 175 118 148 2 540 564 532
Provisions for financial guarantees 11 672 428 0 0 24 795 24 795 11 697 223
Total liabilities 11 672 428 0 0 24 795 24 795 11 697 223
Foreign currencies in % of net assets 4.2% 3.1% 1.6% 8.8%
Net commitments to private equity 1 036 793 174 72 907 144 83 427 284 38 259 401 194 593 829 1 231 387 003
Guarantees’ Exposure at Risk 8 041 607 534 117 390 604 168 381 526 2 396 646 083 2 682 418 213 10 724 025 747
Total Off BS 9 078 400 708 190 297 748 251 808 810 2 434 905 484 2 877 012 042 11 955 412 750
At 31.12.2018 (in EUR) EUR PoundSterling
USDollars
Othercurrencies
Sub total except EUR
Total
Cash and cash equivalents 297 419 745 3 223 964 8 716 665 351 157 12 291 786 309 711 531
Financial instrumentsat Amortised Cost:
Debt investments 1 233 154 288 0 11 044 860 0 11 044 860 1 244 199 148
Financial instruments at Fair Value through Profit and Loss:
Private equity investments 452 266 804 67 104 647 29 043 110 21 742 455 117 890 212 570 157 016
Debt investments 200 397 423 0 0 0 0 200 397 423
Financial guarantees 0 0 0 0 0 0
Total assets 2 183 238 260 70 328 611 48 804 635 22 093 612 141 226 858 2 324 465 118
Provisions for financial guarantees (327 105) 482 515 (120 617) 12 577 374 475 47 370
Total liabilities ( 327 105) 482 515 (120 617) 12 577 374 475 47 370
Foreign currencies in % of net assets 3.5% 2.4% 1.1% 7.0%
Net commitments to private equity 654 118 343 76 195 769 58 058 047 28 901 034 163 154 849 817 273 192
Guarantees’ Exposure at Risk 7 118 479 816 360 147 697 112 736 596 945 335 417 1418 219 710 8 536 699 526
Total Off BS 7 772 598 159 436 343 465 170 794 643 974 236 451 1 581 374 559 9 353 972 718
28 29
03. Financial Risk Management 03. Financial Risk Management
/ EIF Financial Statements
Market risk – Interest rate riskInterest rate risk is the risk that the fair value or future cash flows of a financial instrument will fluctuate because of changes in market interest rates.
Market risk – Interest rate risk factors specific to activities are disclosed in the respective sections below.
Market risk – Other price riskOther price risk is the risk that the fair value or future cash flows of a financial instrument will fluctuate because of changes in market prices (other than those arising from interest rate risk or currency risk), whether those changes are caused by factors specific to the individual financial instrument or its issuer, or factors affecting all similar financial instruments traded in the market.
Market risk – Other price risk factors specific to activities are disclosed in the respective sections below.
Portfolio MonitoringThrough portfolio monitoring, ORM assess the evolution of the portfolio composition relative to the return, risk and liquidity objectives of the EIF. The EIF has developed a set of tools to design, monitor and manage the portfolio of PE funds. This set of tools is based on an internal process and model, the Grading-based Economic Model (“GEM”), which allows the EIF to systematically and consistently assess and verify funds’ operational quality, valuations and expected performances. This approach, supported by adequate Information Technology (“IT”) systems, improves the investment decision process and the management of the portfolio’s financial risks. The grades are defined as follows:
can be implemented after the portfolio has been built. At this stage Operations Risk Management division (“ORM”) ensures that the target portfolio is consistent with:• The return objectives of the EIF;• The tolerance for risk of the EIF;• The liquidity needs of the EIF.
3.2.1.2 Investment Process
The investment process of the EIF is led by the Equity Investments & Guarantees (“EIG”) department. ORM is involved in the investment process from its early stages. Following an initial screening of investment opportunities, ORM is called to express its opinion on EIG’s request to proceed with a full due diligence. Subsequently ORM reviews all the investment proposals prepared by EIG and issues an Independent Opinion to the Chief Executive and Deputy Chief Executive on the merit of the proposed investment. All investment decisions are submitted to the Board of Directors for final approval. Investment decisions are taken by the Board of Directors or under delegation from the Board of Directors to the Chief Executive.
3.2.1.3 Monitoring Process
Monitoring includes the valuation review of PE funds and the monitoring of the portfolio.
Valuation ReviewThis process is divided into several stages to achieve what is known as Valuation Adjustment:• Reporting: collection of financial reports sent
by the fund managers as a basis for valuation (typically on a quarterly basis).
• Valuations: assessment as to whether valuations done by the fund managers are in line with best market practice and applicable industry valuation guidelines. The monitoring aims to determine in good faith the fair value of the investments.
• Classification of funds: depending on the outcome of the monitoring outlined above, funds are classified into three categories as described in note 2.3.3.1.
3.2.3 Liquidity risk
PE Funds are generally structured as Limited Partnerships, where the Limited Partners, such as the EIF, commit a certain amount of capital to be called at the discretion of the fund manager, which is acting as General Partner. Such Limited Partnerships are generally structured as closed-end funds; therefore the discretion of the General Partner in deciding the timing of the capital calls is generally restricted by:1. The contractual duration of the Limited
Partnership, often being 10 to 12 years;2. The investment period, often being defined as the
first 5 years of the life of the Partnership. After the end of the investment period the General Partner cannot make new investments. Capital calls post investment period are generally made for follow-on investments in existing investee companies or to cover the fees and costs of the Limited Partnership.
Due to the discretion of General Partners in deciding the timing of the capital calls, the schedule of the future liquidity requirements of EIF PE portfolio cannot be precisely defined. However, as a result of the typical Limited Partnership structure described above, the majority of the capital is generally called during the investment period. Conversely, capital reflows resulting from the disposal of the investee companies generally take place after the investment period. Having a portfolio of investments in PE Funds which is well diversified across a wide range of vintage years, such as for EIF PE portfolio (see Chart 1), is an important component in the management of liquidity risk. Liquidity requirements resulting from capital calls of PE funds in the investment period can be matched by the stream of capital reflows generated by older PE funds in their divestment phase. The magnitude of this stream of reflows depends on the market conditions and the proportion of the portfolio that is in its divestment phase. It is also important to notice that, due to the inherent illiquid nature of the PE market, once a commitment has been signed it is difficult for a Limited Partner to sell its interest in a PE fund. Often the only way is by finding a buyer in the secondary market. This is usually only possible by offering to sell at a substantial discount to the fund’s Net Asset Value (“NAV”).
3.2 Private equity investments
3.2.1 Risk Management Process
In the framework of the EIF private equity business, the objective of Risk Management is to identify and measure the risk of its portfolio related to PE assets, to monitor its evolution and consistency with the EIF’s objectives and to propose corrective actions in case of divergence.
Such investments include private equity investment funds and the EIF’s exposure in the European Fund for Strategic Investments SME window through sub-window 1 of the private credit tailored for SMEs product and its senior tranche exposure through sub-window 2 of the equity product.
Risk Management is an integral part of the management of EIF’s investment activities.
3.2.1.1 Portfolio Design Process
Designing a portfolio consistent with the EIF’s objectives and constraints is a key element of the EIF’s investment activity. No liquid market exists for investments in private equity funds. Therefore only marginal changes to the portfolio composition
Expected performance grade
P-A The fund’s performance is expected to fall into the first quartile of the benchmark
P-B The fund’s performance is expected to fall into the second quartile of the benchmark
P-C The fund’s performance is expected to fall into the third quartile of the benchmark
P-D The fund’s performance is expected to fall into the fourth quartile of the benchmark
Operational status grade
O-A No adverse signals so far
O-B Some adverse signals, but not expected to have a material impact on the fund’s valuation
O-C Adverse signals, without changes/improvements likely to lead to a material impact on the fund’s valuation
O-D Critical events that had a material advserse impact on the fund’s valuation
3.2.2 Credit risk
Investments in PE funds are always made through an equity-like participation. Even in the case where these are channelled through mezzanine loans, currently representing less than 1% of the portfolio, their risk profile is typically akin to an equity participation. Therefore the credit risk of the PE portfolio is deemed not significant.
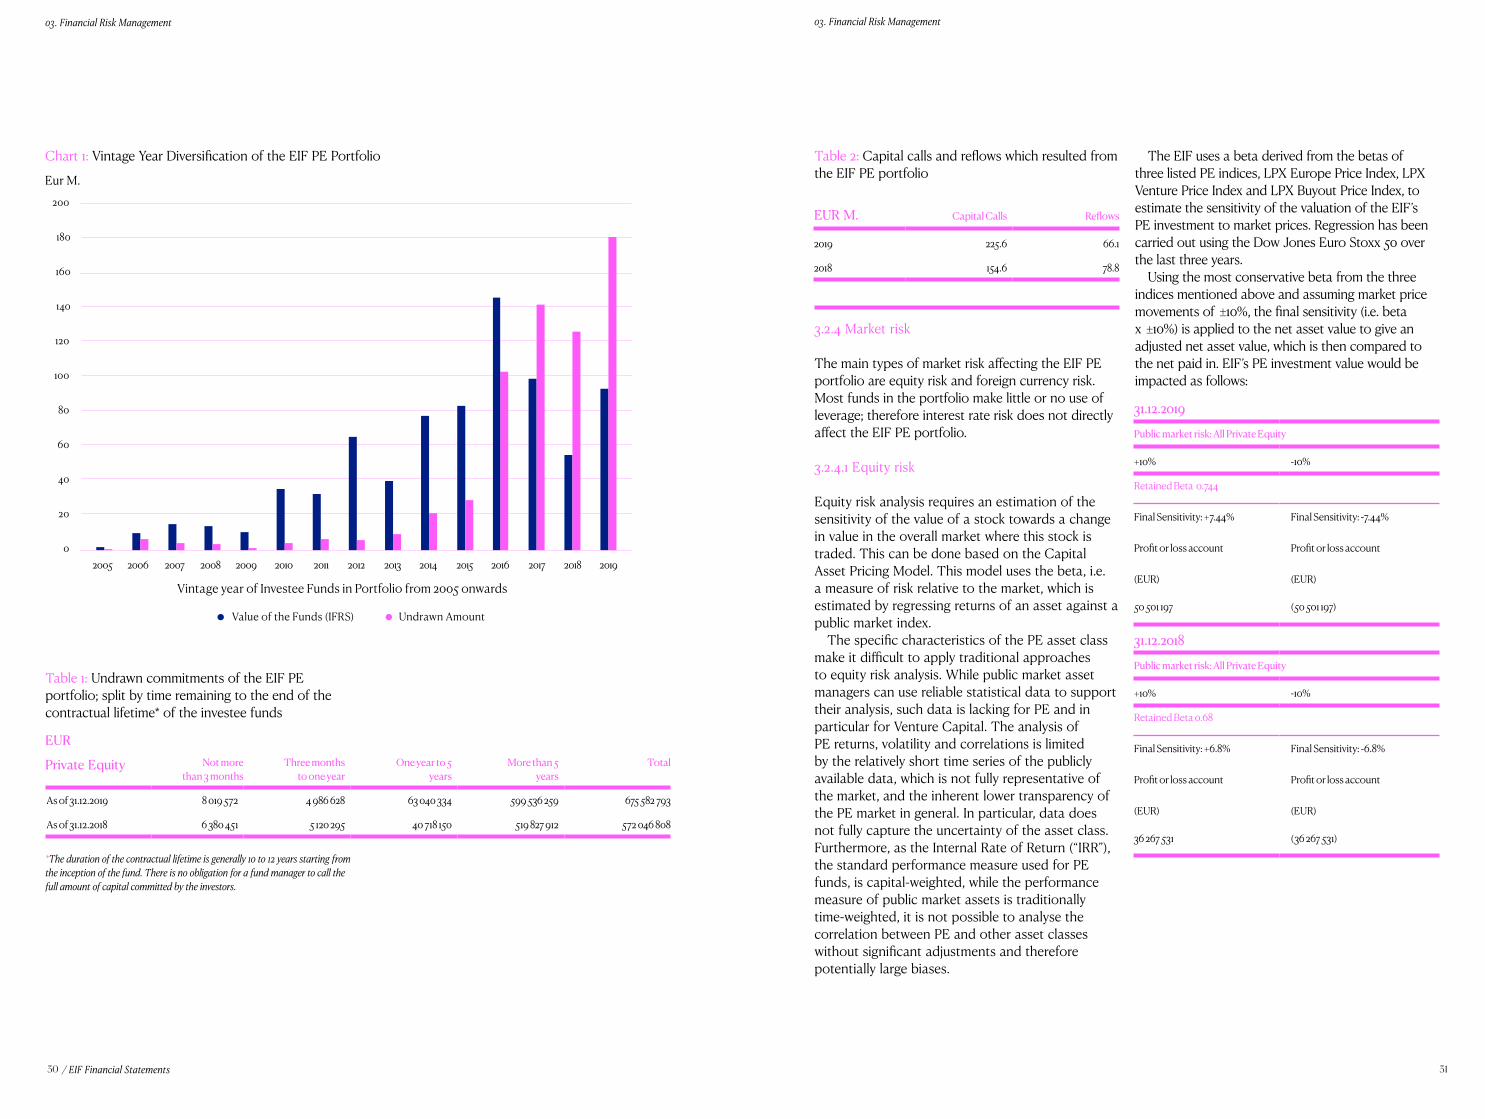
30 31
03. Financial Risk Management 03. Financial Risk Management
/ EIF Financial Statements
Table 1: Undrawn commitments of the EIF PE portfolio; split by time remaining to the end of the contractual lifetime* of the investee funds
*The duration of the contractual lifetime is generally 10 to 12 years starting from the inception of the fund. There is no obligation for a fund manager to call the full amount of capital committed by the investors.
Chart 1: Vintage Year Diversification of the EIF PE Portfolio Table 2: Capital calls and reflows which resulted from the EIF PE portfolio
3.2.4 Market risk
The main types of market risk affecting the EIF PE portfolio are equity risk and foreign currency risk. Most funds in the portfolio make little or no use of leverage; therefore interest rate risk does not directly affect the EIF PE portfolio.
3.2.4.1 Equity risk
Equity risk analysis requires an estimation of the sensitivity of the value of a stock towards a change in value in the overall market where this stock is traded. This can be done based on the Capital Asset Pricing Model. This model uses the beta, i.e. a measure of risk relative to the market, which is estimated by regressing returns of an asset against a public market index.
The specific characteristics of the PE asset class make it difficult to apply traditional approaches to equity risk analysis. While public market asset managers can use reliable statistical data to support their analysis, such data is lacking for PE and in particular for Venture Capital. The analysis of PE returns, volatility and correlations is limited by the relatively short time series of the publicly available data, which is not fully representative of the market, and the inherent lower transparency of the PE market in general. In particular, data does not fully capture the uncertainty of the asset class. Furthermore, as the Internal Rate of Return (“IRR”), the standard performance measure used for PE funds, is capital-weighted, while the performance measure of public market assets is traditionally time-weighted, it is not possible to analyse the correlation between PE and other asset classes without significant adjustments and therefore potentially large biases.
Eur M.
Vintage year of Investee Funds in Portfolio from 2005 onwards
Value of the Funds (IFRS) Undrawn Amount
The EIF uses a beta derived from the betas of three listed PE indices, LPX Europe Price Index, LPX Venture Price Index and LPX Buyout Price Index, to estimate the sensitivity of the valuation of the EIF’s PE investment to market prices. Regression has been carried out using the Dow Jones Euro Stoxx 50 over the last three years.
Using the most conservative beta from the three indices mentioned above and assuming market price movements of ±+_10%, the final sensitivity (i.e. beta x ±+_10%) is applied to the net asset value to give an adjusted net asset value, which is then compared to the net paid in. EIF’s PE investment value would be impacted as follows:
EUR M. Capital Calls Reflows
2019 225.6 66.1
2018 154.6 78.8
31.12.2019
Public market risk: All Private Equity
+10% -10%
Retained Beta 0.744
Final Sensitivity: +7.44% Final Sensitivity: -7.44%
Profit or loss account Profit or loss account
(EUR) (EUR)
50 501 197 (50 501 197)
31.12.2018
Public market risk: All Private Equity
+10% -10%
Retained Beta 0.68
Final Sensitivity: +6.8% Final Sensitivity: -6.8%
Profit or loss account Profit or loss account
(EUR) (EUR)
36 267 531 (36 267 531)
EUR
Private Equity Not morethan 3 months
Three monthsto one year
One year to 5years
More than 5years
Total
As of 31.12.2019 8 019 572 4 986 628 63 040 334 599 536 259 675 582 793
As of 31.12.2018 6 380 451 5 120 295 40 718 150 519 827 912 572 046 808
200
0
40
20
80
60
100
120
160
140
180
2018 20192008 2013 20172007 2012 20162006 2011 20152005 2010 20142009
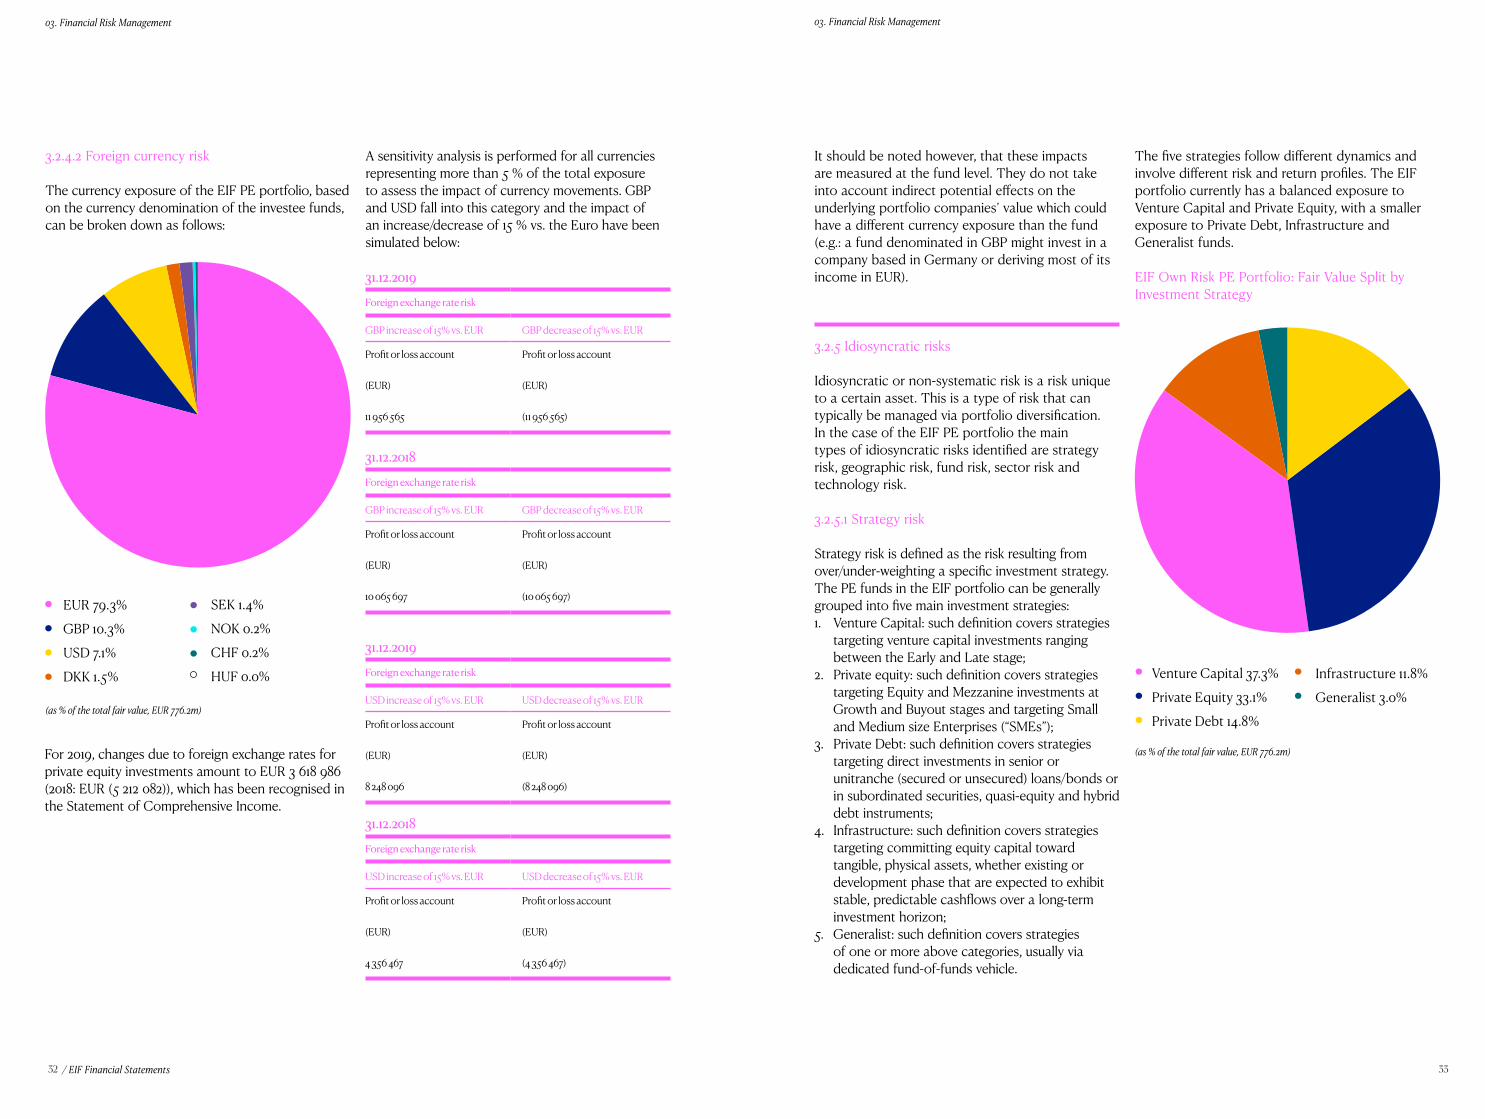
32 33
03. Financial Risk Management 03. Financial Risk Management
/ EIF Financial Statements
3.2.4.2 Foreign currency risk
The currency exposure of the EIF PE portfolio, based on the currency denomination of the investee funds, can be broken down as follows:
For 2019, changes due to foreign exchange rates for private equity investments amount to EUR 3 618 986 (2018: EUR (5 212 082)), which has been recognised in the Statement of Comprehensive Income.
The five strategies follow different dynamics and involve different risk and return profiles. The EIF portfolio currently has a balanced exposure to Venture Capital and Private Equity, with a smaller exposure to Private Debt, Infrastructure and Generalist funds.
EIF Own Risk PE Portfolio: Fair Value Split by Investment Strategy
Venture Capital 37.3%
Private Equity 33.1%
Private Debt 14.8%
EUR 79.3%
GBP 10.3%
USD 7.1%
DKK 1.5%
SEK 1.4%
NOK 0.2%
CHF 0.2%
HUF 0.0% Infrastructure 11.8%
Generalist 3.0%(as % of the total fair value, EUR 776.2m)
(as % of the total fair value, EUR 776.2m)
A sensitivity analysis is performed for all currencies representing more than 5 % of the total exposure to assess the impact of currency movements. GBP and USD fall into this category and the impact of an increase/decrease of 15 % vs. the Euro have been simulated below:
31.12.2019
Foreign exchange rate risk
GBP increase of 15% vs. EUR GBP decrease of 15% vs. EUR
Profit or loss account Profit or loss account
(EUR) (EUR)
11 956 565 (11 956 565)
31.12.2019
Foreign exchange rate risk
USD increase of 15% vs. EUR USD decrease of 15% vs. EUR
Profit or loss account Profit or loss account
(EUR) (EUR)
8 248 096 (8 248 096)
31.12.2018
Foreign exchange rate risk
GBP increase of 15% vs. EUR GBP decrease of 15% vs. EUR
Profit or loss account Profit or loss account
(EUR) (EUR)
10 065 697 (10 065 697)
31.12.2018
Foreign exchange rate risk
USD increase of 15% vs. EUR USD decrease of 15% vs. EUR
Profit or loss account Profit or loss account
(EUR) (EUR)
4 356 467 (4 356 467)
It should be noted however, that these impacts are measured at the fund level. They do not take into account indirect potential effects on the underlying portfolio companies’ value which could have a different currency exposure than the fund (e.g.: a fund denominated in GBP might invest in a company based in Germany or deriving most of its income in EUR).
3.2.5 Idiosyncratic risks
Idiosyncratic or non-systematic risk is a risk unique to a certain asset. This is a type of risk that can typically be managed via portfolio diversification. In the case of the EIF PE portfolio the main types of idiosyncratic risks identified are strategy risk, geographic risk, fund risk, sector risk and technology risk.
3.2.5.1 Strategy risk
Strategy risk is defined as the risk resulting from over/under-weighting a specific investment strategy. The PE funds in the EIF portfolio can be generally grouped into five main investment strategies:1. Venture Capital: such definition covers strategies
targeting venture capital investments ranging between the Early and Late stage;
2. Private equity: such definition covers strategies targeting Equity and Mezzanine investments at Growth and Buyout stages and targeting Small and Medium size Enterprises (“SMEs”);
3. Private Debt: such definition covers strategies targeting direct investments in senior or unitranche (secured or unsecured) loans/bonds or in subordinated securities, quasi-equity and hybrid debt instruments;
4. Infrastructure: such definition covers strategies targeting committing equity capital toward tangible, physical assets, whether existing or development phase that are expected to exhibit stable, predictable cashflows over a long-term investment horizon;
5. Generalist: such definition covers strategies of one or more above categories, usually via dedicated fund-of-funds vehicle.
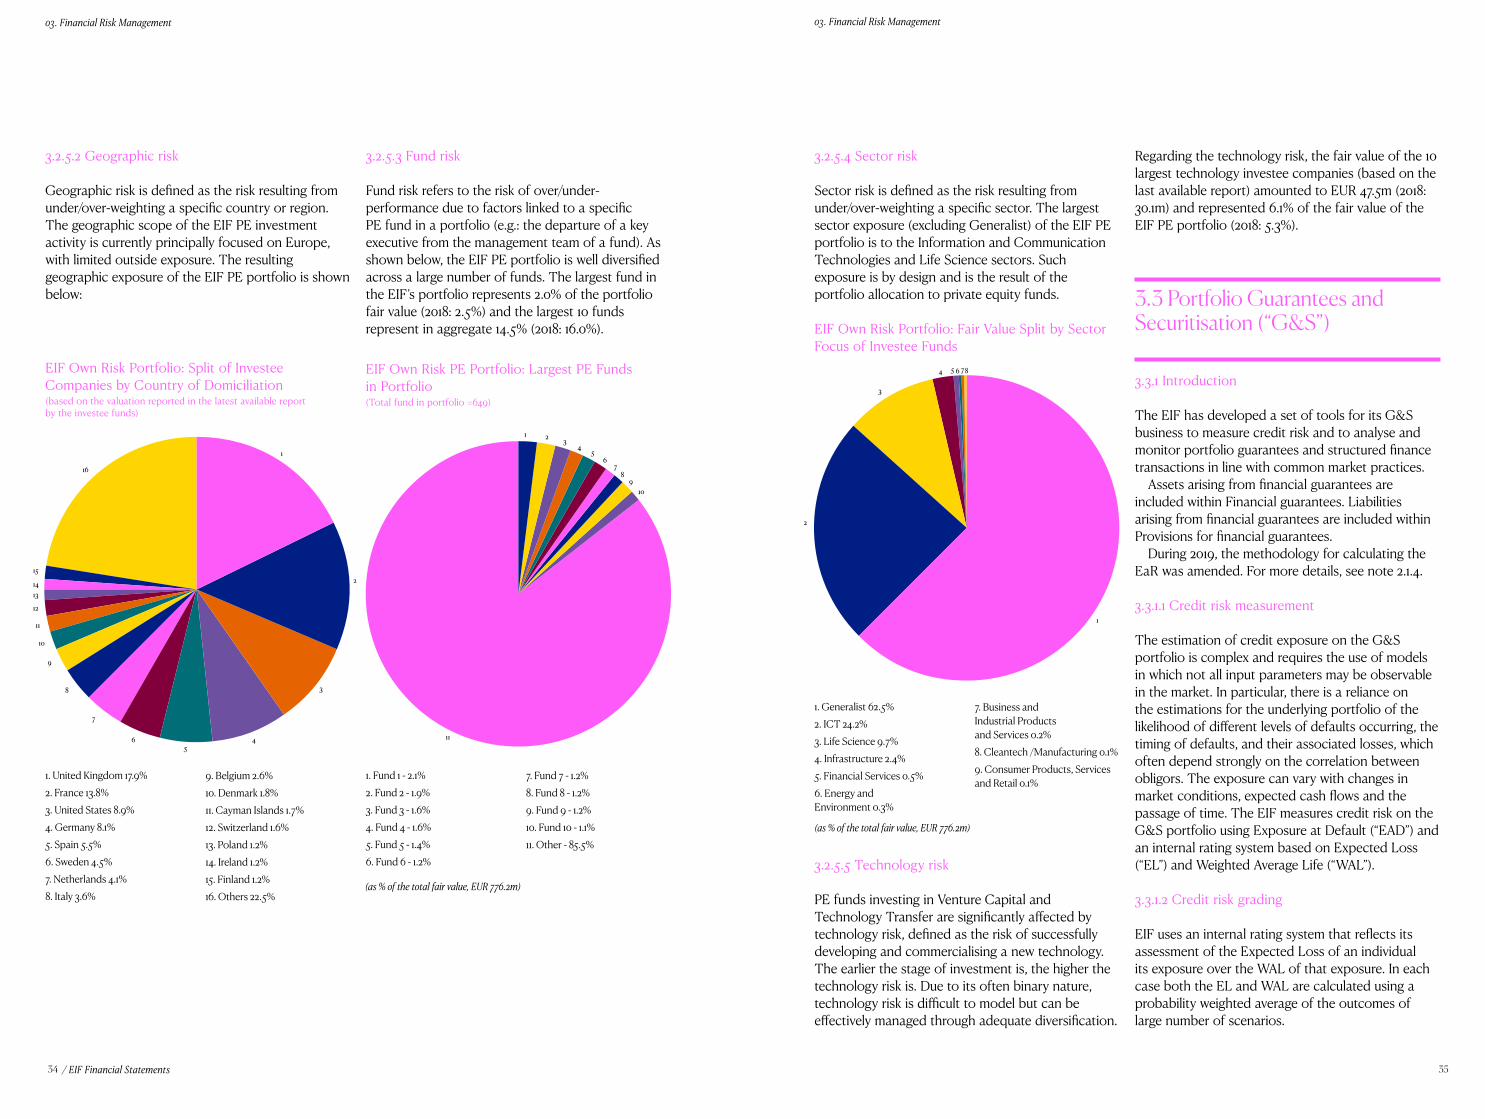
34 35
03. Financial Risk Management 03. Financial Risk Management
/ EIF Financial Statements
3.2.5.3 Fund risk
Fund risk refers to the risk of over/under-performance due to factors linked to a specific PE fund in a portfolio (e.g.: the departure of a key executive from the management team of a fund). As shown below, the EIF PE portfolio is well diversified across a large number of funds. The largest fund in the EIF’s portfolio represents 2.0% of the portfolio fair value (2018: 2.5%) and the largest 10 funds represent in aggregate 14.5% (2018: 16.0%).
3.2.5.4 Sector risk
Sector risk is defined as the risk resulting from under/over-weighting a specific sector. The largest sector exposure (excluding Generalist) of the EIF PE portfolio is to the Information and Communication Technologies and Life Science sectors. Such exposure is by design and is the result of the portfolio allocation to private equity funds.
EIF Own Risk Portfolio: Fair Value Split by Sector Focus of Investee Funds
Regarding the technology risk, the fair value of the 10 largest technology investee companies (based on the last available report) amounted to EUR 47.5m (2018: 30.1m) and represented 6.1% of the fair value of the EIF PE portfolio (2018: 5.3%).
3.3 Portfolio Guarantees and Securitisation (“G&S”)
3.3.1 Introduction
The EIF has developed a set of tools for its G&S business to measure credit risk and to analyse and monitor portfolio guarantees and structured finance transactions in line with common market practices.
Assets arising from financial guarantees are included within Financial guarantees. Liabilities arising from financial guarantees are included within Provisions for financial guarantees.
During 2019, the methodology for calculating the EaR was amended. For more details, see note 2.1.4.
3.3.1.1 Credit risk measurement
The estimation of credit exposure on the G&S portfolio is complex and requires the use of models in which not all input parameters may be observable in the market. In particular, there is a reliance on the estimations for the underlying portfolio of the likelihood of different levels of defaults occurring, the timing of defaults, and their associated losses, which often depend strongly on the correlation between obligors. The exposure can vary with changes in market conditions, expected cash flows and the passage of time. The EIF measures credit risk on the G&S portfolio using Exposure at Default (“EAD”) and an internal rating system based on Expected Loss (“EL”) and Weighted Average Life (“WAL”).
3.3.1.2 Credit risk grading
EIF uses an internal rating system that reflects its assessment of the Expected Loss of an individual its exposure over the WAL of that exposure. In each case both the EL and WAL are calculated using a probability weighted average of the outcomes of large number of scenarios.
3.2.5.5 Technology risk
PE funds investing in Venture Capital and Technology Transfer are significantly affected by technology risk, defined as the risk of successfully developing and commercialising a new technology. The earlier the stage of investment is, the higher the technology risk is. Due to its often binary nature, technology risk is difficult to model but can be effectively managed through adequate diversification.
1. Generalist 62.5%2. ICT 24.2%3. Life Science 9.7%4. Infrastructure 2.4%5. Financial Services 0.5%6. Energy and Environment 0.3%
7. Business and Industrial Products and Services 0.2%8. Cleantech /Manufacturing 0.1%9. Consumer Products, Services and Retail 0.1%
(as % of the total fair value, EUR 776.2m)
2
3
4 5 6 78
1
3.2.5.2 Geographic risk
Geographic risk is defined as the risk resulting from under/over-weighting a specific country or region. The geographic scope of the EIF PE investment activity is currently principally focused on Europe, with limited outside exposure. The resulting geographic exposure of the EIF PE portfolio is shown below:
EIF Own Risk Portfolio: Split of Investee Companies by Country of Domiciliation (based on the valuation reported in the latest available report by the investee funds)
EIF Own Risk PE Portfolio: Largest PE Funds in Portfolio (Total fund in portfolio =649)
1. United Kingdom 17.9%2. France 13.8%3. United States 8.9%4. Germany 8.1%5. Spain 5.5%6. Sweden 4.5%7. Netherlands 4.1%8. Italy 3.6%
9. Belgium 2.6%10. Denmark 1.8%11. Cayman Islands 1.7%12. Switzerland 1.6%13. Poland 1.2%14. Ireland 1.2%15. Finland 1.2%16. Others 22.5%
16
1
2
3
45
6
7
8
9
10
11
12
1314
15
1. Fund 1 - 2.1%2. Fund 2 - 1.9%3. Fund 3 - 1.6%4. Fund 4 - 1.6%5. Fund 5 - 1.4%6. Fund 6 - 1.2%
7. Fund 7 - 1.2%8. Fund 8 - 1.2%9. Fund 9 - 1.2%10. Fund 10 - 1.1%11. Other - 85.5%
(as % of the total fair value, EUR 776.2m)
45
67
89
10
11
321
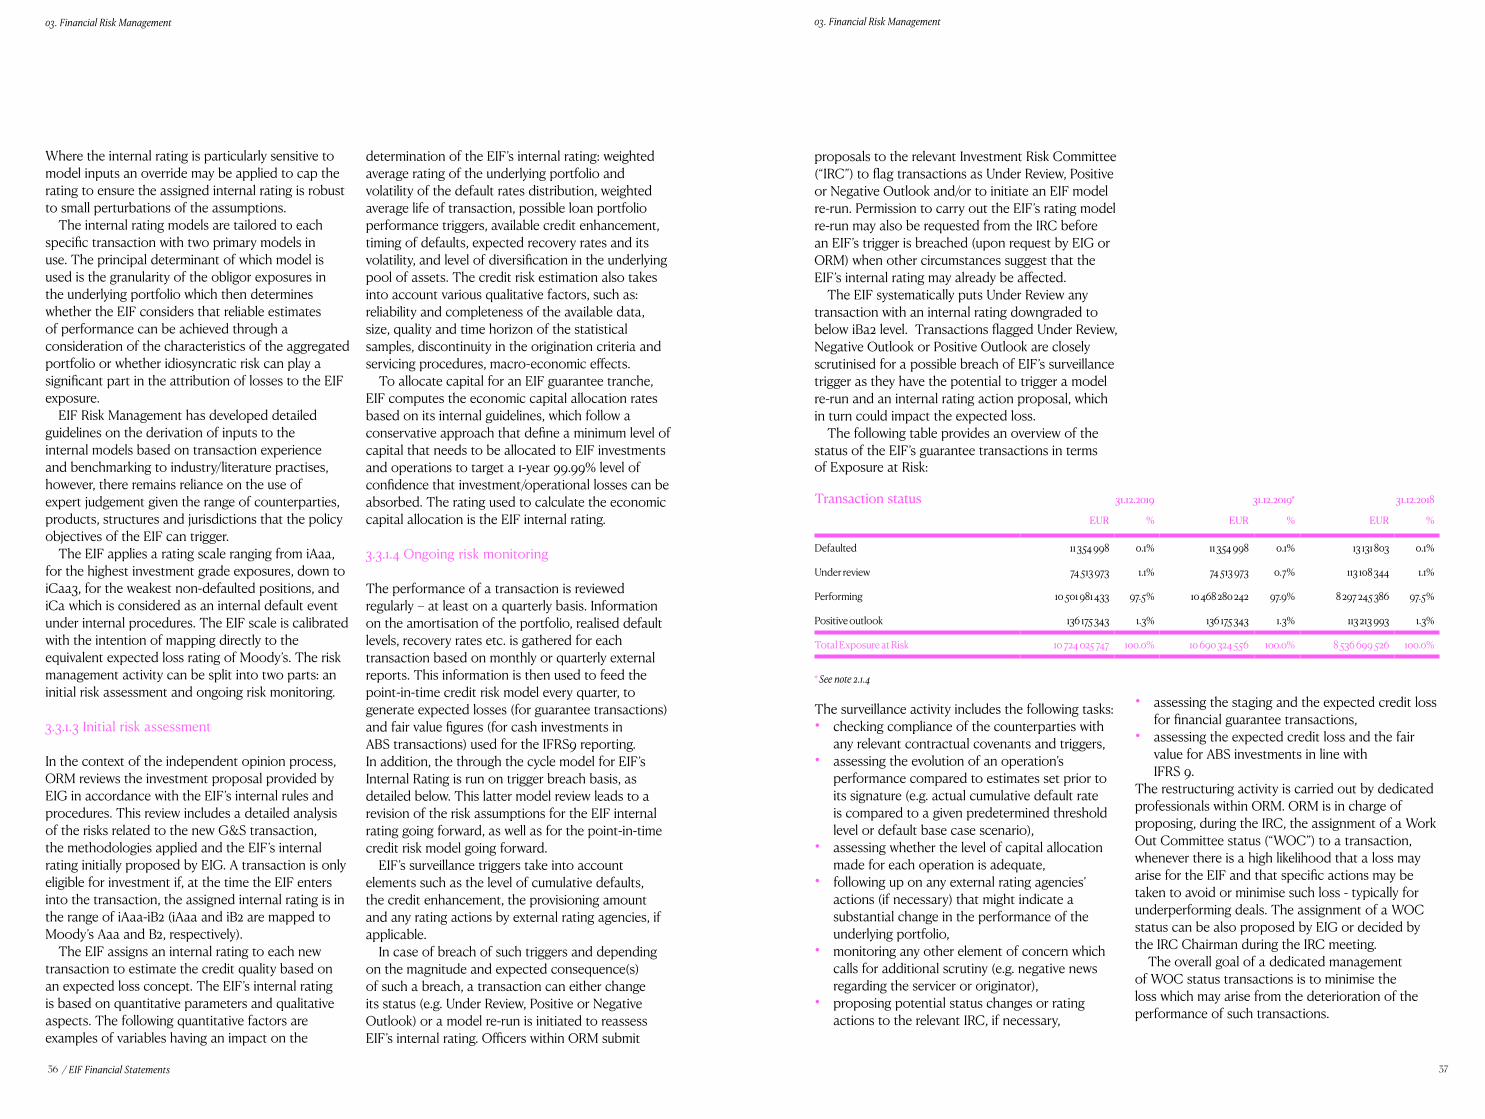
36 37
03. Financial Risk Management 03. Financial Risk Management
/ EIF Financial Statements
Where the internal rating is particularly sensitive to model inputs an override may be applied to cap the rating to ensure the assigned internal rating is robust to small perturbations of the assumptions.
The internal rating models are tailored to each specific transaction with two primary models in use. The principal determinant of which model is used is the granularity of the obligor exposures in the underlying portfolio which then determines whether the EIF considers that reliable estimates of performance can be achieved through a consideration of the characteristics of the aggregated portfolio or whether idiosyncratic risk can play a significant part in the attribution of losses to the EIF exposure.
EIF Risk Management has developed detailed guidelines on the derivation of inputs to the internal models based on transaction experience and benchmarking to industry/literature practises, however, there remains reliance on the use of expert judgement given the range of counterparties, products, structures and jurisdictions that the policy objectives of the EIF can trigger.
The EIF applies a rating scale ranging from iAaa, for the highest investment grade exposures, down to iCaa3, for the weakest non-defaulted positions, and iCa which is considered as an internal default event under internal procedures. The EIF scale is calibrated with the intention of mapping directly to the equivalent expected loss rating of Moody’s. The risk management activity can be split into two parts: an initial risk assessment and ongoing risk monitoring.
3.3.1.3 Initial risk assessment
In the context of the independent opinion process, ORM reviews the investment proposal provided by EIG in accordance with the EIF’s internal rules and procedures. This review includes a detailed analysis of the risks related to the new G&S transaction, the methodologies applied and the EIF’s internal rating initially proposed by EIG. A transaction is only eligible for investment if, at the time the EIF enters into the transaction, the assigned internal rating is in the range of iAaa-iB2 (iAaa and iB2 are mapped to Moody’s Aaa and B2, respectively).
The EIF assigns an internal rating to each new transaction to estimate the credit quality based on an expected loss concept. The EIF’s internal rating is based on quantitative parameters and qualitative aspects. The following quantitative factors are examples of variables having an impact on the
determination of the EIF’s internal rating: weighted average rating of the underlying portfolio and volatility of the default rates distribution, weighted average life of transaction, possible loan portfolio performance triggers, available credit enhancement, timing of defaults, expected recovery rates and its volatility, and level of diversification in the underlying pool of assets. The credit risk estimation also takes into account various qualitative factors, such as: reliability and completeness of the available data, size, quality and time horizon of the statistical samples, discontinuity in the origination criteria and servicing procedures, macro-economic effects.
To allocate capital for an EIF guarantee tranche, EIF computes the economic capital allocation rates based on its internal guidelines, which follow a conservative approach that define a minimum level of capital that needs to be allocated to EIF investments and operations to target a 1-year 99.99% level of confidence that investment/operational losses can be absorbed. The rating used to calculate the economic capital allocation is the EIF internal rating.
3.3.1.4 Ongoing risk monitoring
The performance of a transaction is reviewed regularly – at least on a quarterly basis. Information on the amortisation of the portfolio, realised default levels, recovery rates etc. is gathered for each transaction based on monthly or quarterly external reports. This information is then used to feed the point-in-time credit risk model every quarter, to generate expected losses (for guarantee transactions) and fair value figures (for cash investments in ABS transactions) used for the IFRS9 reporting. In addition, the through the cycle model for EIF’s Internal Rating is run on trigger breach basis, as detailed below. This latter model review leads to a revision of the risk assumptions for the EIF internal rating going forward, as well as for the point-in-time credit risk model going forward.
EIF’s surveillance triggers take into account elements such as the level of cumulative defaults, the credit enhancement, the provisioning amount and any rating actions by external rating agencies, if applicable.
In case of breach of such triggers and depending on the magnitude and expected consequence(s) of such a breach, a transaction can either change its status (e.g. Under Review, Positive or Negative Outlook) or a model re-run is initiated to reassess EIF’s internal rating. Officers within ORM submit
proposals to the relevant Investment Risk Committee (“IRC”) to flag transactions as Under Review, Positive or Negative Outlook and/or to initiate an EIF model re-run. Permission to carry out the EIF’s rating model re-run may also be requested from the IRC before an EIF’s trigger is breached (upon request by EIG or ORM) when other circumstances suggest that the EIF’s internal rating may already be affected.
The EIF systematically puts Under Review any transaction with an internal rating downgraded to below iBa2 level. Transactions flagged Under Review, Negative Outlook or Positive Outlook are closely scrutinised for a possible breach of EIF’s surveillance trigger as they have the potential to trigger a model re-run and an internal rating action proposal, which in turn could impact the expected loss.
The following table provides an overview of the status of the EIF’s guarantee transactions in terms of Exposure at Risk:
The surveillance activity includes the following tasks:• checking compliance of the counterparties with
any relevant contractual covenants and triggers, • assessing the evolution of an operation’s
performance compared to estimates set prior to its signature (e.g. actual cumulative default rate is compared to a given predetermined threshold level or default base case scenario),
• assessing whether the level of capital allocation made for each operation is adequate,
• following up on any external rating agencies’ actions (if necessary) that might indicate a substantial change in the performance of the underlying portfolio,
• monitoring any other element of concern which calls for additional scrutiny (e.g. negative news regarding the servicer or originator),
• proposing potential status changes or rating actions to the relevant IRC, if necessary,
• assessing the staging and the expected credit loss for financial guarantee transactions,
• assessing the expected credit loss and the fair value for ABS investments in line with IFRS 9.
The restructuring activity is carried out by dedicated professionals within ORM. ORM is in charge of proposing, during the IRC, the assignment of a Work Out Committee status (“WOC”) to a transaction, whenever there is a high likelihood that a loss may arise for the EIF and that specific actions may be taken to avoid or minimise such loss - typically for underperforming deals. The assignment of a WOC status can be also proposed by EIG or decided by the IRC Chairman during the IRC meeting.
The overall goal of a dedicated management of WOC status transactions is to minimise the loss which may arise from the deterioration of the performance of such transactions.
Transaction status 31.12.2019 31.12.2019* 31.12.2018
EUR % EUR % EUR %
Defaulted 11 354 998 0.1% 11 354 998 0.1% 13 131 803 0.1%
Under review 74 513 973 1.1% 74 513 973 0.7% 113 108 344 1.1%
Performing 10 501 981 433 97.5% 10 468 280 242 97.9% 8 297 245 386 97.5%
Positive outlook 136 175 343 1.3% 136 175 343 1.3% 113 213 993 1.3%
Total Exposure at Risk 10 724 025 747 100.0% 10 690 324 556 100.0% 8 536 699 526 100.0%
* See note 2.1.4
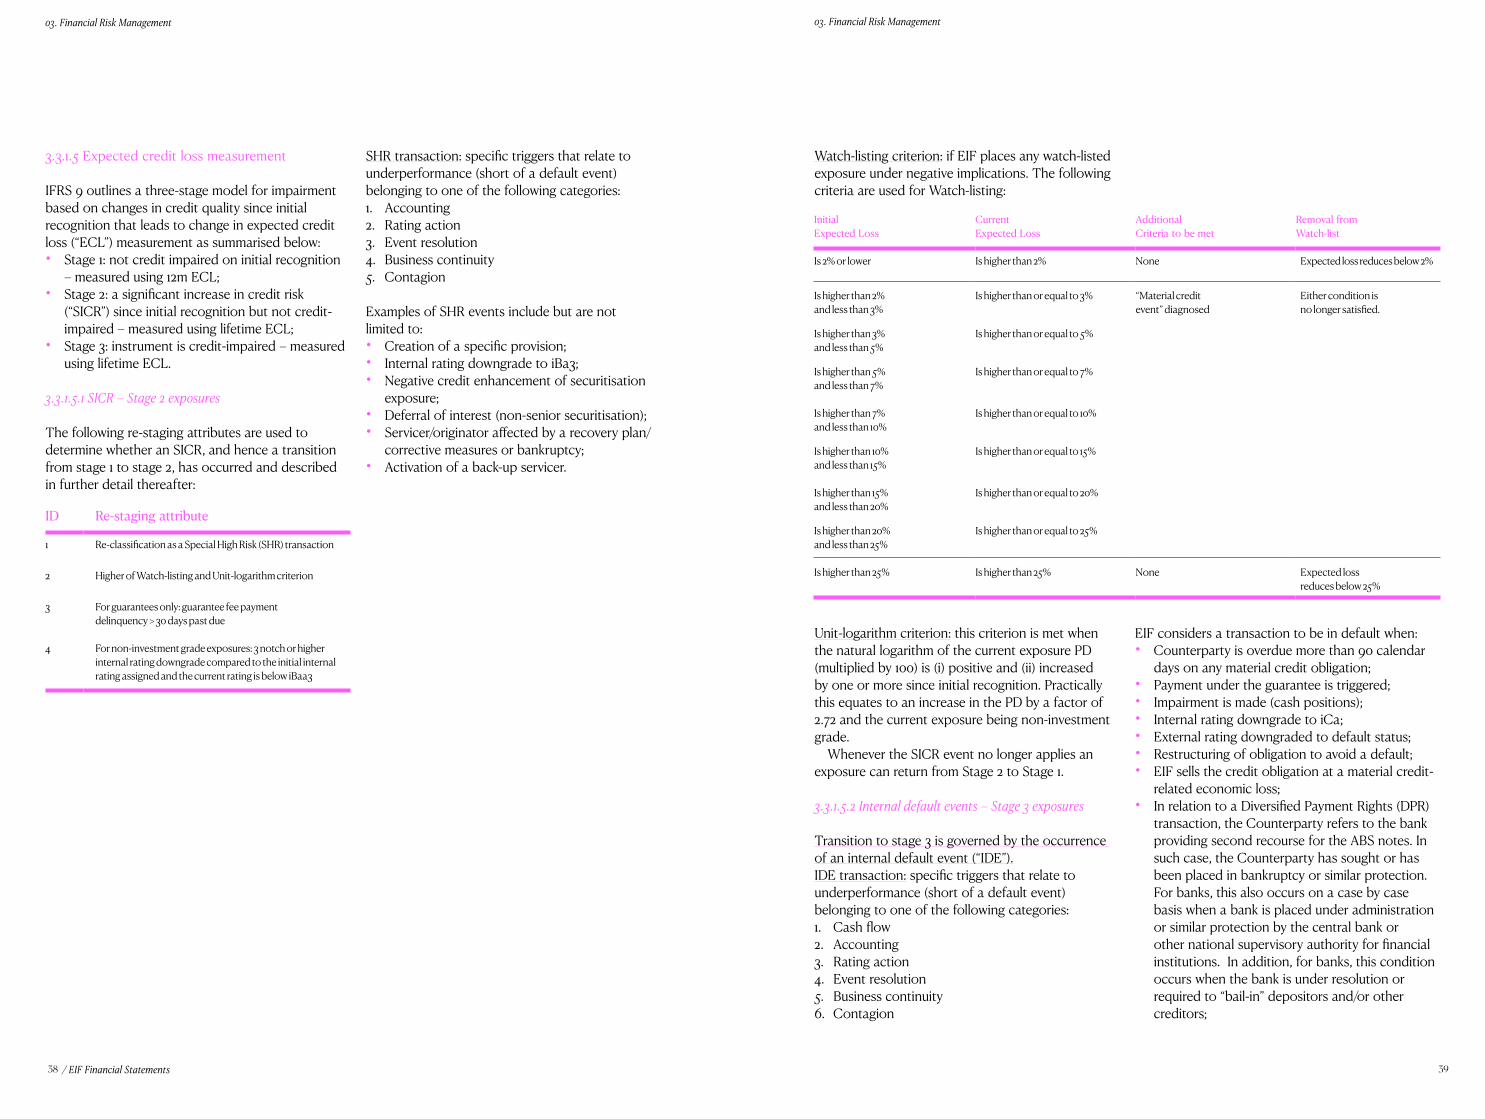
38 39
03. Financial Risk Management 03. Financial Risk Management
/ EIF Financial Statements
3.3.1.5 Expected credit loss measurement
IFRS 9 outlines a three-stage model for impairment based on changes in credit quality since initial recognition that leads to change in expected credit loss (“ECL”) measurement as summarised below:• Stage 1: not credit impaired on initial recognition
– measured using 12m ECL;• Stage 2: a significant increase in credit risk
(“SICR”) since initial recognition but not credit-impaired – measured using lifetime ECL;
• Stage 3: instrument is credit-impaired – measured using lifetime ECL.
3.3.1.5.1 SICR – Stage 2 exposures
The following re-staging attributes are used to determine whether an SICR, and hence a transition from stage 1 to stage 2, has occurred and described in further detail thereafter:
SHR transaction: specific triggers that relate to underperformance (short of a default event) belonging to one of the following categories:1. Accounting2. Rating action3. Event resolution4. Business continuity5. Contagion
Examples of SHR events include but are not limited to:• Creation of a specific provision;• Internal rating downgrade to iBa3;• Negative credit enhancement of securitisation
exposure;• Deferral of interest (non-senior securitisation);• Servicer/originator affected by a recovery plan/
corrective measures or bankruptcy;• Activation of a back-up servicer.
Watch-listing criterion: if EIF places any watch-listed exposure under negative implications. The following criteria are used for Watch-listing:
Unit-logarithm criterion: this criterion is met when the natural logarithm of the current exposure PD (multiplied by 100) is (i) positive and (ii) increased by one or more since initial recognition. Practically this equates to an increase in the PD by a factor of 2.72 and the current exposure being non-investment grade.
Whenever the SICR event no longer applies an exposure can return from Stage 2 to Stage 1.
3.3.1.5.2 Internal default events – Stage 3 exposures
Transition to stage 3 is governed by the occurrence of an internal default event (“IDE”).IDE transaction: specific triggers that relate to underperformance (short of a default event) belonging to one of the following categories:1. Cash flow2. Accounting3. Rating action4. Event resolution5. Business continuity6. Contagion
EIF considers a transaction to be in default when:• Counterparty is overdue more than 90 calendar
days on any material credit obligation;• Payment under the guarantee is triggered;• Impairment is made (cash positions);• Internal rating downgrade to iCa;• External rating downgraded to default status;• Restructuring of obligation to avoid a default;• EIF sells the credit obligation at a material credit-
related economic loss;• In relation to a Diversified Payment Rights (DPR)
transaction, the Counterparty refers to the bank providing second recourse for the ABS notes. In such case, the Counterparty has sought or has been placed in bankruptcy or similar protection. For banks, this also occurs on a case by case basis when a bank is placed under administration or similar protection by the central bank or other national supervisory authority for financial institutions. In addition, for banks, this condition occurs when the bank is under resolution or required to “bail-in” depositors and/or other creditors;
ID Re-staging attribute
1 Re-classification as a Special High Risk (SHR) transaction
2 Higher of Watch-listing and Unit-logarithm criterion
3 For guarantees only: guarantee fee payment delinquency > 30 days past due
4 For non-investment grade exposures: 3 notch or higher internal rating downgrade compared to the initial internal rating assigned and the current rating is below iBaa3
InitialExpected Loss
CurrentExpected Loss
AdditionalCriteria to be met
Removal fromWatch-list
Is 2% or lower Is higher than 2% None Expected loss reduces below 2%
Is higher than 2% and less than 3%
Is higher than or equal to 3% “Material creditevent” diagnosed
Either condition isno longer satisfied.
Is higher than 3%and less than 5%
Is higher than or equal to 5%
Is higher than 5%and less than 7%
Is higher than or equal to 7%
Is higher than 7%and less than 10%
Is higher than or equal to 10%
Is higher than 10%and less than 15%
Is higher than or equal to 15%
Is higher than 15%and less than 20%
Is higher than or equal to 20%
Is higher than 20%and less than 25%
Is higher than or equal to 25%
Is higher than 25% Is higher than 25% None Expected lossreduces below 25%
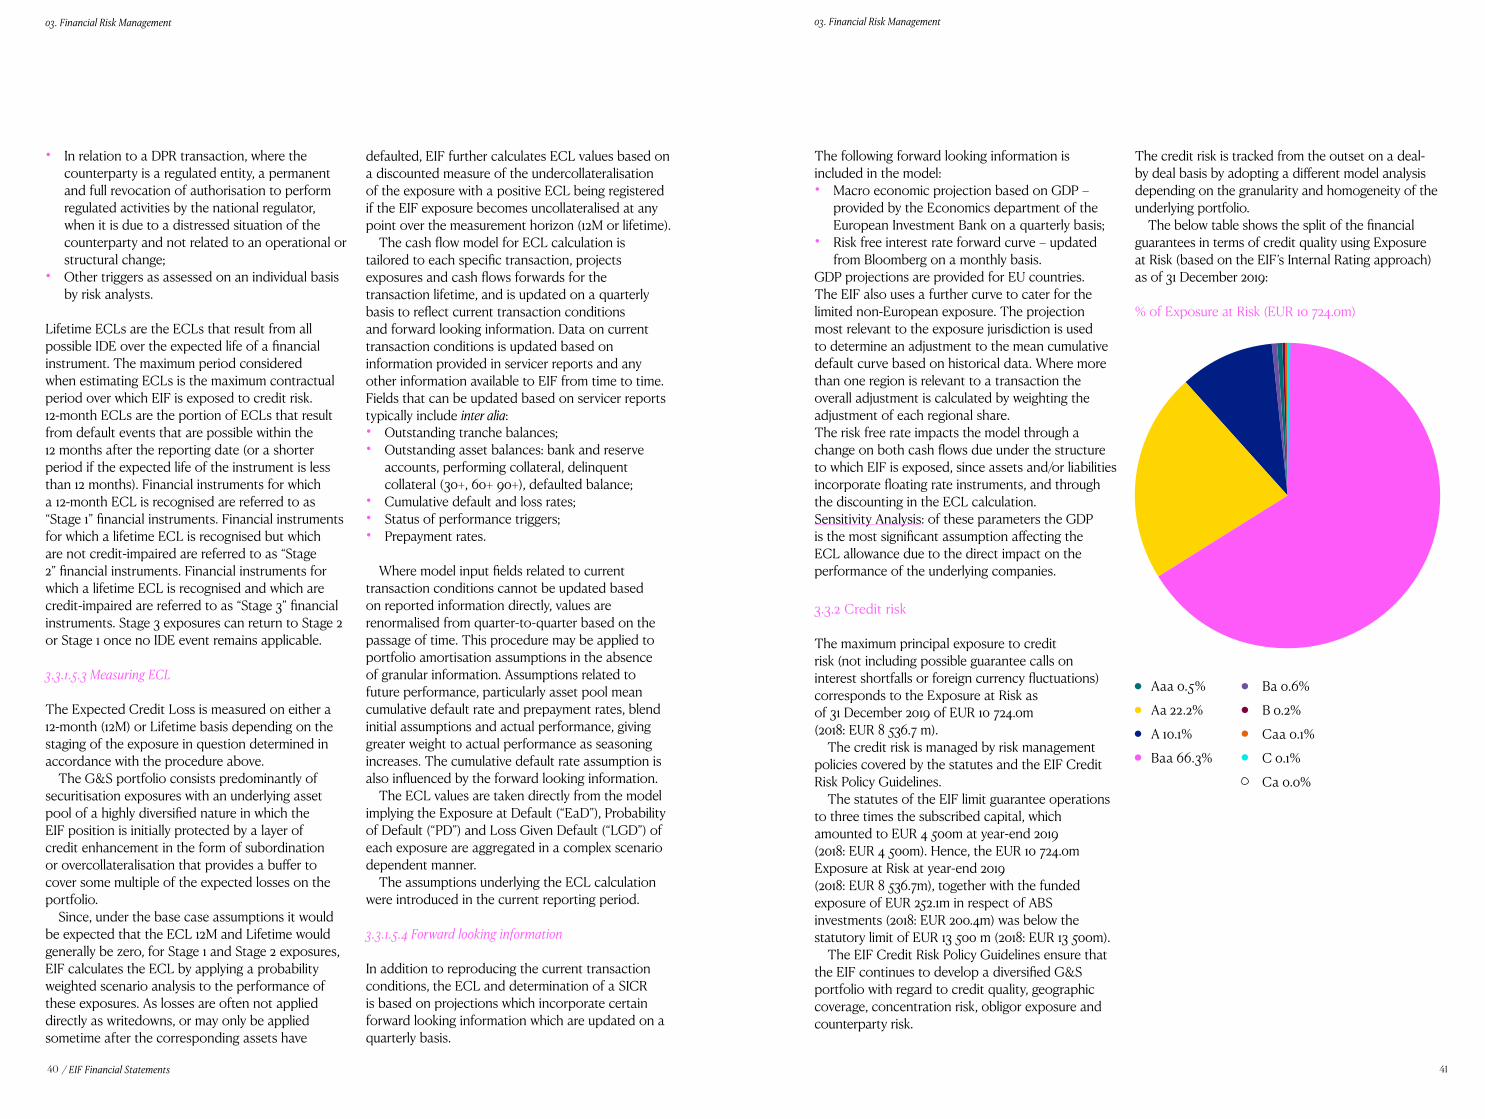
40 41
03. Financial Risk Management 03. Financial Risk Management
/ EIF Financial Statements
• In relation to a DPR transaction, where the counterparty is a regulated entity, a permanent and full revocation of authorisation to perform regulated activities by the national regulator, when it is due to a distressed situation of the counterparty and not related to an operational or structural change;
• Other triggers as assessed on an individual basis by risk analysts.
Lifetime ECLs are the ECLs that result from all possible IDE over the expected life of a financial instrument. The maximum period considered when estimating ECLs is the maximum contractual period over which EIF is exposed to credit risk. 12-month ECLs are the portion of ECLs that result from default events that are possible within the 12 months after the reporting date (or a shorter period if the expected life of the instrument is less than 12 months). Financial instruments for which a 12-month ECL is recognised are referred to as “Stage 1” financial instruments. Financial instruments for which a lifetime ECL is recognised but which are not credit-impaired are referred to as “Stage 2” financial instruments. Financial instruments for which a lifetime ECL is recognised and which are credit-impaired are referred to as “Stage 3” financial instruments. Stage 3 exposures can return to Stage 2 or Stage 1 once no IDE event remains applicable.
3.3.1.5.3 Measuring ECL
The Expected Credit Loss is measured on either a 12-month (12M) or Lifetime basis depending on the staging of the exposure in question determined in accordance with the procedure above.
The G&S portfolio consists predominantly of securitisation exposures with an underlying asset pool of a highly diversified nature in which the EIF position is initially protected by a layer of credit enhancement in the form of subordination or overcollateralisation that provides a buffer to cover some multiple of the expected losses on the portfolio.
Since, under the base case assumptions it would be expected that the ECL 12M and Lifetime would generally be zero, for Stage 1 and Stage 2 exposures, EIF calculates the ECL by applying a probability weighted scenario analysis to the performance of these exposures. As losses are often not applied directly as writedowns, or may only be applied sometime after the corresponding assets have
defaulted, EIF further calculates ECL values based on a discounted measure of the undercollateralisation of the exposure with a positive ECL being registered if the EIF exposure becomes uncollateralised at any point over the measurement horizon (12M or lifetime).
The cash flow model for ECL calculation is tailored to each specific transaction, projects exposures and cash flows forwards for the transaction lifetime, and is updated on a quarterly basis to reflect current transaction conditions and forward looking information. Data on current transaction conditions is updated based on information provided in servicer reports and any other information available to EIF from time to time. Fields that can be updated based on servicer reports typically include inter alia:• Outstanding tranche balances;• Outstanding asset balances: bank and reserve
accounts, performing collateral, delinquent collateral (30+, 60+ 90+), defaulted balance;
• Cumulative default and loss rates;• Status of performance triggers;• Prepayment rates.
Where model input fields related to current transaction conditions cannot be updated based on reported information directly, values are renormalised from quarter-to-quarter based on the passage of time. This procedure may be applied to portfolio amortisation assumptions in the absence of granular information. Assumptions related to future performance, particularly asset pool mean cumulative default rate and prepayment rates, blend initial assumptions and actual performance, giving greater weight to actual performance as seasoning increases. The cumulative default rate assumption is also influenced by the forward looking information.
The ECL values are taken directly from the model implying the Exposure at Default (“EaD”), Probability of Default (“PD”) and Loss Given Default (“LGD”) of each exposure are aggregated in a complex scenario dependent manner.
The assumptions underlying the ECL calculation were introduced in the current reporting period.
3.3.1.5.4 Forward looking information
In addition to reproducing the current transaction conditions, the ECL and determination of a SICR is based on projections which incorporate certain forward looking information which are updated on a quarterly basis.
The following forward looking information is included in the model:• Macro economic projection based on GDP –
provided by the Economics department of the European Investment Bank on a quarterly basis;
• Risk free interest rate forward curve – updated from Bloomberg on a monthly basis.
GDP projections are provided for EU countries. The EIF also uses a further curve to cater for the limited non-European exposure. The projection most relevant to the exposure jurisdiction is used to determine an adjustment to the mean cumulative default curve based on historical data. Where more than one region is relevant to a transaction the overall adjustment is calculated by weighting the adjustment of each regional share.The risk free rate impacts the model through a change on both cash flows due under the structure to which EIF is exposed, since assets and/or liabilities incorporate floating rate instruments, and through the discounting in the ECL calculation.Sensitivity Analysis: of these parameters the GDP is the most significant assumption affecting the ECL allowance due to the direct impact on the performance of the underlying companies.
3.3.2 Credit risk
The maximum principal exposure to credit risk (not including possible guarantee calls on interest shortfalls or foreign currency fluctuations) corresponds to the Exposure at Risk as of 31 December 2019 of EUR 10 724.0m (2018: EUR 8 536.7 m).
The credit risk is managed by risk management policies covered by the statutes and the EIF Credit Risk Policy Guidelines.
The statutes of the EIF limit guarantee operations to three times the subscribed capital, which amounted to EUR 4 500m at year-end 2019 (2018: EUR 4 500m). Hence, the EUR 10 724.0m Exposure at Risk at year-end 2019 (2018: EUR 8 536.7m), together with the funded exposure of EUR 252.1m in respect of ABS investments (2018: EUR 200.4m) was below the statutory limit of EUR 13 500 m (2018: EUR 13 500m).
The EIF Credit Risk Policy Guidelines ensure that the EIF continues to develop a diversified G&S portfolio with regard to credit quality, geographic coverage, concentration risk, obligor exposure and counterparty risk.
The credit risk is tracked from the outset on a deal-by deal basis by adopting a different model analysis depending on the granularity and homogeneity of the underlying portfolio.
The below table shows the split of the financial guarantees in terms of credit quality using Exposure at Risk (based on the EIF’s Internal Rating approach) as of 31 December 2019:
% of Exposure at Risk (EUR 10 724.0m)
Aaa 0.5%
Aa 22.2%
A 10.1%
Baa 66.3%
Ba 0.6%
B 0.2%
Caa 0.1%
C 0.1%
Ca 0.0%
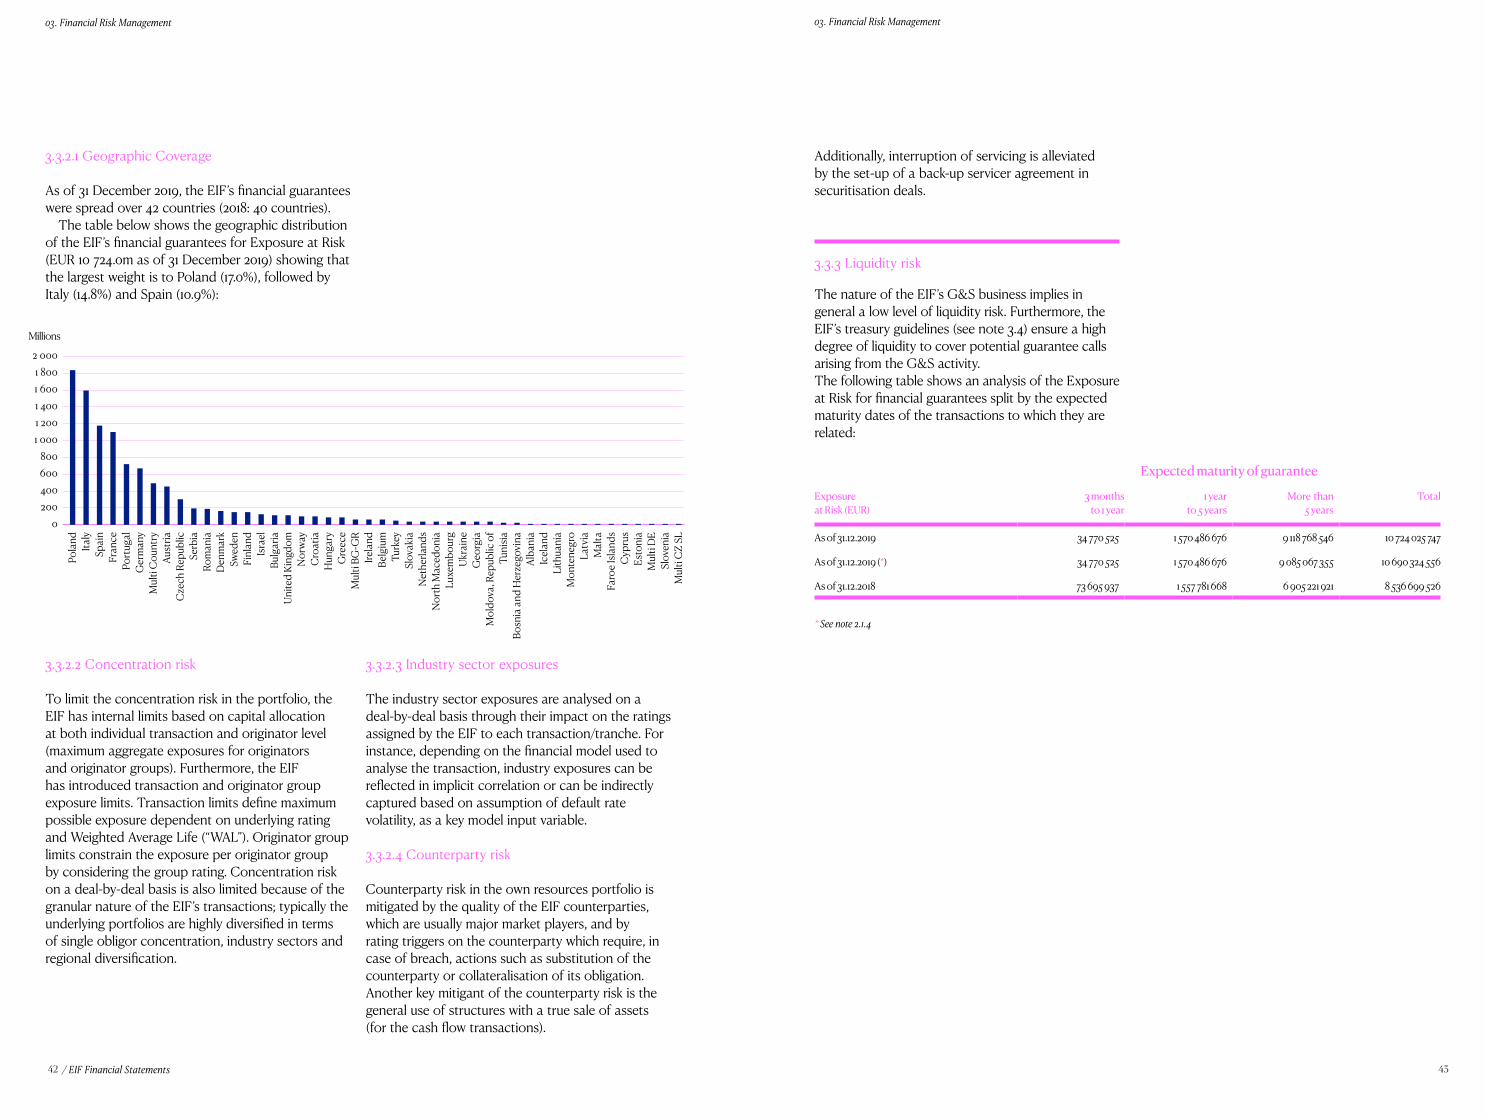
42 43
03. Financial Risk Management 03. Financial Risk Management
/ EIF Financial Statements
3.3.2.1 Geographic Coverage
As of 31 December 2019, the EIF’s financial guarantees were spread over 42 countries (2018: 40 countries).
The table below shows the geographic distribution of the EIF’s financial guarantees for Exposure at Risk (EUR 10 724.0m as of 31 December 2019) showing that the largest weight is to Poland (17.0%), followed by Italy (14.8%) and Spain (10.9%):
3.3.2.2 Concentration risk
To limit the concentration risk in the portfolio, the EIF has internal limits based on capital allocation at both individual transaction and originator level (maximum aggregate exposures for originators and originator groups). Furthermore, the EIF has introduced transaction and originator group exposure limits. Transaction limits define maximum possible exposure dependent on underlying rating and Weighted Average Life (“WAL”). Originator group limits constrain the exposure per originator group by considering the group rating. Concentration risk on a deal-by-deal basis is also limited because of the granular nature of the EIF’s transactions; typically the underlying portfolios are highly diversified in terms of single obligor concentration, industry sectors and regional diversification.
3.3.2.3 Industry sector exposures
The industry sector exposures are analysed on a deal-by-deal basis through their impact on the ratings assigned by the EIF to each transaction/tranche. For instance, depending on the financial model used to analyse the transaction, industry exposures can be reflected in implicit correlation or can be indirectly captured based on assumption of default rate volatility, as a key model input variable.
3.3.2.4 Counterparty risk
Counterparty risk in the own resources portfolio is mitigated by the quality of the EIF counterparties, which are usually major market players, and by rating triggers on the counterparty which require, in case of breach, actions such as substitution of the counterparty or collateralisation of its obligation. Another key mitigant of the counterparty risk is the general use of structures with a true sale of assets (for the cash flow transactions).
Additionally, interruption of servicing is alleviated by the set-up of a back-up servicer agreement in securitisation deals.
3.3.3 Liquidity risk
The nature of the EIF’s G&S business implies in general a low level of liquidity risk. Furthermore, the EIF’s treasury guidelines (see note 3.4) ensure a high degree of liquidity to cover potential guarantee calls arising from the G&S activity.The following table shows an analysis of the Exposure at Risk for financial guarantees split by the expected maturity dates of the transactions to which they are related:
Expected maturity of guarantee
Exposureat Risk (EUR)
3 monthsto 1 year
1 yearto 5 years
More than5 years
Total
As of 31.12.2019 34 770 525 1 570 486 676 9 118 768 546 10 724 025 747
As of 31.12.2019 (*) 34 770 525 1 570 486 676 9 085 067 355 10 690 324 556
As of 31.12.2018 73 695 937 1 557 781 668 6 905 221 921 8 536 699 526
2 000
2000
1 8001 600
1 000
1 400
800
1 200
600400
Millions
Pola
nd Italy
Spai
nFr
ance
Port
ugal
Ger
man
yM
ulti
Cou
ntry
Aust
riaC
zech
Rep
ublic
Serb
ia
Rom
ania
D
enm
ark
Swed
enFi
nlan
dIsr
ael
Bulg
aria
Unite
d Ki
ngdo
mNo
rway
Cro
atia
Hun
gary
Gre
ece
Mul
ti BG
-GR
Irela
ndBe
lgiu
mTu
rkey
Slov
akia
Net
herla
nds
Nor
th M
aced
onia
Lu
xem
bour
gUk
rain
eG
eorg
iaM
oldo
va, R
epub
lic o
fTu
nisia
Bosn
ia a
nd H
erze
govi
naAl
bani
aIc
elan
d Li
thua
nia
Mon
tene
gro
Latv
iaM
alta
Faro
e Isla
nds
Cyp
rus
Esto
nia
Mul
ti D
ESl
oven
iaM
ulti
CZ
SL
* See note 2.1.4
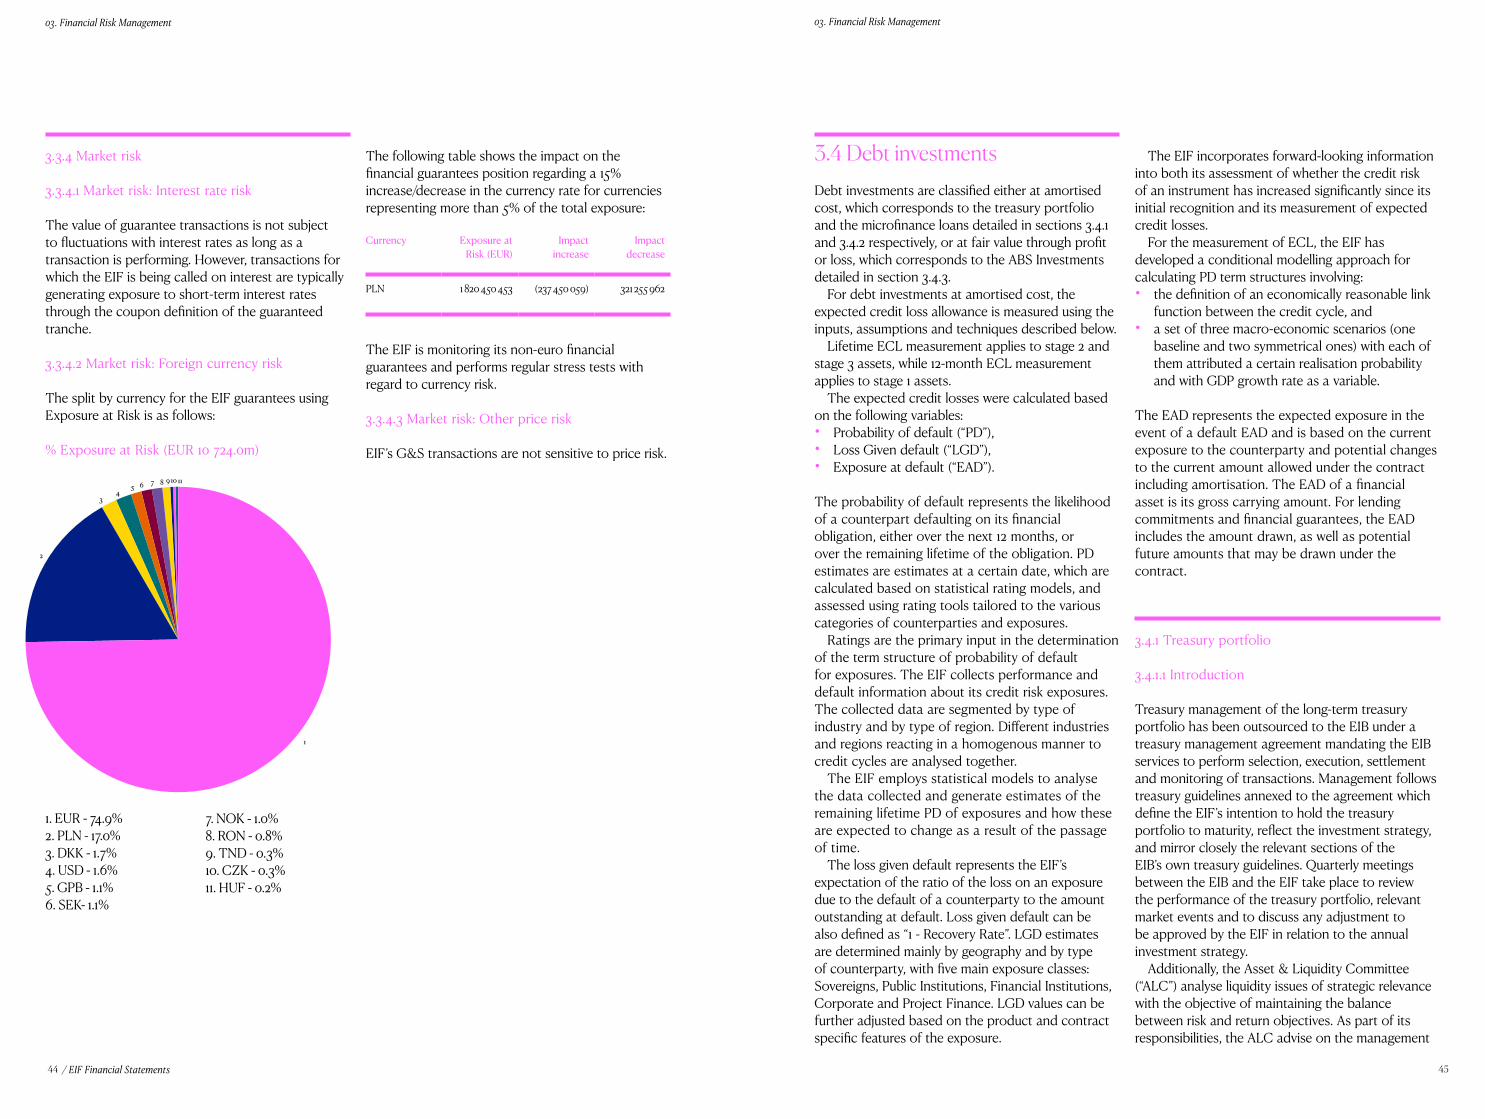
44 45
03. Financial Risk Management 03. Financial Risk Management
/ EIF Financial Statements
3.3.4 Market risk
3.3.4.1 Market risk: Interest rate risk
The value of guarantee transactions is not subject to fluctuations with interest rates as long as a transaction is performing. However, transactions for which the EIF is being called on interest are typically generating exposure to short-term interest rates through the coupon definition of the guaranteed tranche.
3.3.4.2 Market risk: Foreign currency risk
The split by currency for the EIF guarantees using Exposure at Risk is as follows:
% Exposure at Risk (EUR 10 724.0m)
The following table shows the impact on the financial guarantees position regarding a 15% increase/decrease in the currency rate for currencies representing more than 5% of the total exposure:
The EIF is monitoring its non-euro financial guarantees and performs regular stress tests with regard to currency risk.
3.3.4.3 Market risk: Other price risk
EIF’s G&S transactions are not sensitive to price risk.
1. EUR - 74.9%2. PLN - 17.0%3. DKK - 1.7%4. USD - 1.6%5. GPB - 1.1%6. SEK- 1.1%
7. NOK - 1.0%8. RON - 0.8%9. TND - 0.3%10. CZK - 0.3%11. HUF - 0.2%
The EIF incorporates forward-looking information into both its assessment of whether the credit risk of an instrument has increased significantly since its initial recognition and its measurement of expected credit losses.
For the measurement of ECL, the EIF has developed a conditional modelling approach for calculating PD term structures involving:• the definition of an economically reasonable link
function between the credit cycle, and• a set of three macro-economic scenarios (one
baseline and two symmetrical ones) with each of them attributed a certain realisation probability and with GDP growth rate as a variable.
The EAD represents the expected exposure in the event of a default EAD and is based on the current exposure to the counterparty and potential changes to the current amount allowed under the contract including amortisation. The EAD of a financial asset is its gross carrying amount. For lending commitments and financial guarantees, the EAD includes the amount drawn, as well as potential future amounts that may be drawn under the contract.
3.4.1 Treasury portfolio
3.4.1.1 Introduction
Treasury management of the long-term treasury portfolio has been outsourced to the EIB under a treasury management agreement mandating the EIB services to perform selection, execution, settlement and monitoring of transactions. Management follows treasury guidelines annexed to the agreement which define the EIF’s intention to hold the treasury portfolio to maturity, reflect the investment strategy, and mirror closely the relevant sections of the EIB’s own treasury guidelines. Quarterly meetings between the EIB and the EIF take place to review the performance of the treasury portfolio, relevant market events and to discuss any adjustment to be approved by the EIF in relation to the annual investment strategy.
Additionally, the Asset & Liquidity Committee (“ALC”) analyse liquidity issues of strategic relevance with the objective of maintaining the balance between risk and return objectives. As part of its responsibilities, the ALC advise on the management
3.4 Debt investments Debt investments are classified either at amortised cost, which corresponds to the treasury portfolio and the microfinance loans detailed in sections 3.4.1 and 3.4.2 respectively, or at fair value through profit or loss, which corresponds to the ABS Investments detailed in section 3.4.3.
For debt investments at amortised cost, the expected credit loss allowance is measured using the inputs, assumptions and techniques described below.
Lifetime ECL measurement applies to stage 2 and stage 3 assets, while 12-month ECL measurement applies to stage 1 assets.
The expected credit losses were calculated based on the following variables: • Probability of default (“PD”), • Loss Given default (“LGD”), • Exposure at default (“EAD”).
The probability of default represents the likelihood of a counterpart defaulting on its financial obligation, either over the next 12 months, or over the remaining lifetime of the obligation. PD estimates are estimates at a certain date, which are calculated based on statistical rating models, and assessed using rating tools tailored to the various categories of counterparties and exposures.
Ratings are the primary input in the determination of the term structure of probability of default for exposures. The EIF collects performance and default information about its credit risk exposures. The collected data are segmented by type of industry and by type of region. Different industries and regions reacting in a homogenous manner to credit cycles are analysed together.
The EIF employs statistical models to analyse the data collected and generate estimates of the remaining lifetime PD of exposures and how these are expected to change as a result of the passage of time.
The loss given default represents the EIF’s expectation of the ratio of the loss on an exposure due to the default of a counterparty to the amount outstanding at default. Loss given default can be also defined as “1 - Recovery Rate”. LGD estimates are determined mainly by geography and by type of counterparty, with five main exposure classes: Sovereigns, Public Institutions, Financial Institutions, Corporate and Project Finance. LGD values can be further adjusted based on the product and contract specific features of the exposure.
45 6 7 8 9 10 11
3
2
1
Currency Exposure at Risk (EUR)
Impact increase
Impact decrease
PLN 1 820 450 453 (237 450 059) 321 255 962
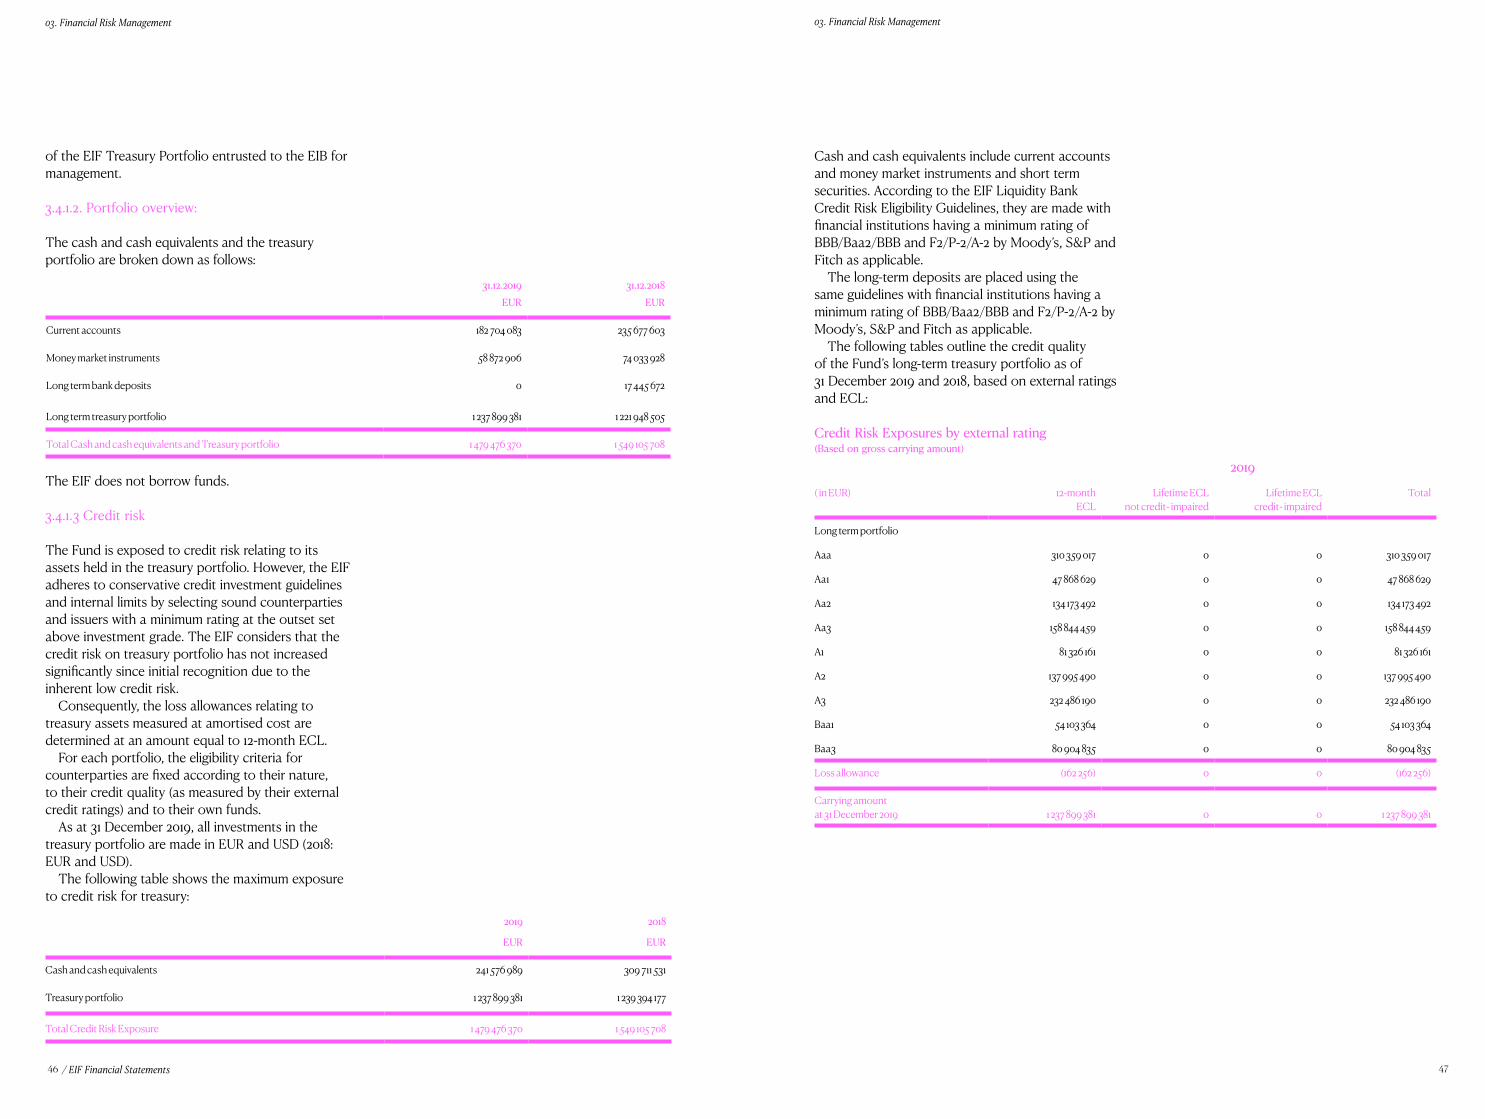
46 47
03. Financial Risk Management 03. Financial Risk Management
/ EIF Financial Statements
of the EIF Treasury Portfolio entrusted to the EIB for management.
3.4.1.2. Portfolio overview:
The cash and cash equivalents and the treasury portfolio are broken down as follows:
The EIF does not borrow funds.
3.4.1.3 Credit risk
The Fund is exposed to credit risk relating to its assets held in the treasury portfolio. However, the EIF adheres to conservative credit investment guidelines and internal limits by selecting sound counterparties and issuers with a minimum rating at the outset set above investment grade. The EIF considers that the credit risk on treasury portfolio has not increased significantly since initial recognition due to the inherent low credit risk.
Consequently, the loss allowances relating to treasury assets measured at amortised cost are determined at an amount equal to 12-month ECL.
For each portfolio, the eligibility criteria for counterparties are fixed according to their nature, to their credit quality (as measured by their external credit ratings) and to their own funds.
As at 31 December 2019, all investments in the treasury portfolio are made in EUR and USD (2018: EUR and USD).
The following table shows the maximum exposure to credit risk for treasury:
Cash and cash equivalents include current accounts and money market instruments and short term securities. According to the EIF Liquidity Bank Credit Risk Eligibility Guidelines, they are made with financial institutions having a minimum rating of BBB/Baa2/BBB and F2/P-2/A-2 by Moody’s, S&P and Fitch as applicable.
The long-term deposits are placed using the same guidelines with financial institutions having a minimum rating of BBB/Baa2/BBB and F2/P-2/A-2 by Moody’s, S&P and Fitch as applicable.
The following tables outline the credit quality of the Fund’s long-term treasury portfolio as of 31 December 2019 and 2018, based on external ratings and ECL:
31.12.2019EUR
31.12.2018EUR
Current accounts 182 704 083 235 677 603
Money market instruments 58 872 906 74 033 928
Long term bank deposits 0 17 445 672
Long term treasury portfolio 1 237 899 381 1 221 948 505
Total Cash and cash equivalents and Treasury portfolio 1 479 476 370 1 549 105 708
2019
EUR
2018
EUR
Cash and cash equivalents 241 576 989 309 711 531
Treasury portfolio 1 237 899 381 1 239 394 177
Total Credit Risk Exposure 1 479 476 370 1 549 105 708
Credit Risk Exposures by external rating(Based on gross carrying amount)
( in EUR) 12-monthECL
Lifetime ECLnot credit- impaired
Lifetime ECLcredit- impaired
Total
Long term portfolio
Aaa 310 359 017 0 0 310 359 017
Aa1 47 868 629 0 0 47 868 629
Aa2 134 173 492 0 0 134 173 492
Aa3 158 844 459 0 0 158 844 459
A1 81 326 161 0 0 81 326 161
A2 137 995 490 0 0 137 995 490
A3 232 486 190 0 0 232 486 190
Baa1 54 103 364 0 0 54 103 364
Baa3 80 904 835 0 0 80 904 835
Loss allowance (162 256) 0 0 (162 256)
Carrying amountat 31 December 2019 1 237 899 381 0 0 1 237 899 381
2019
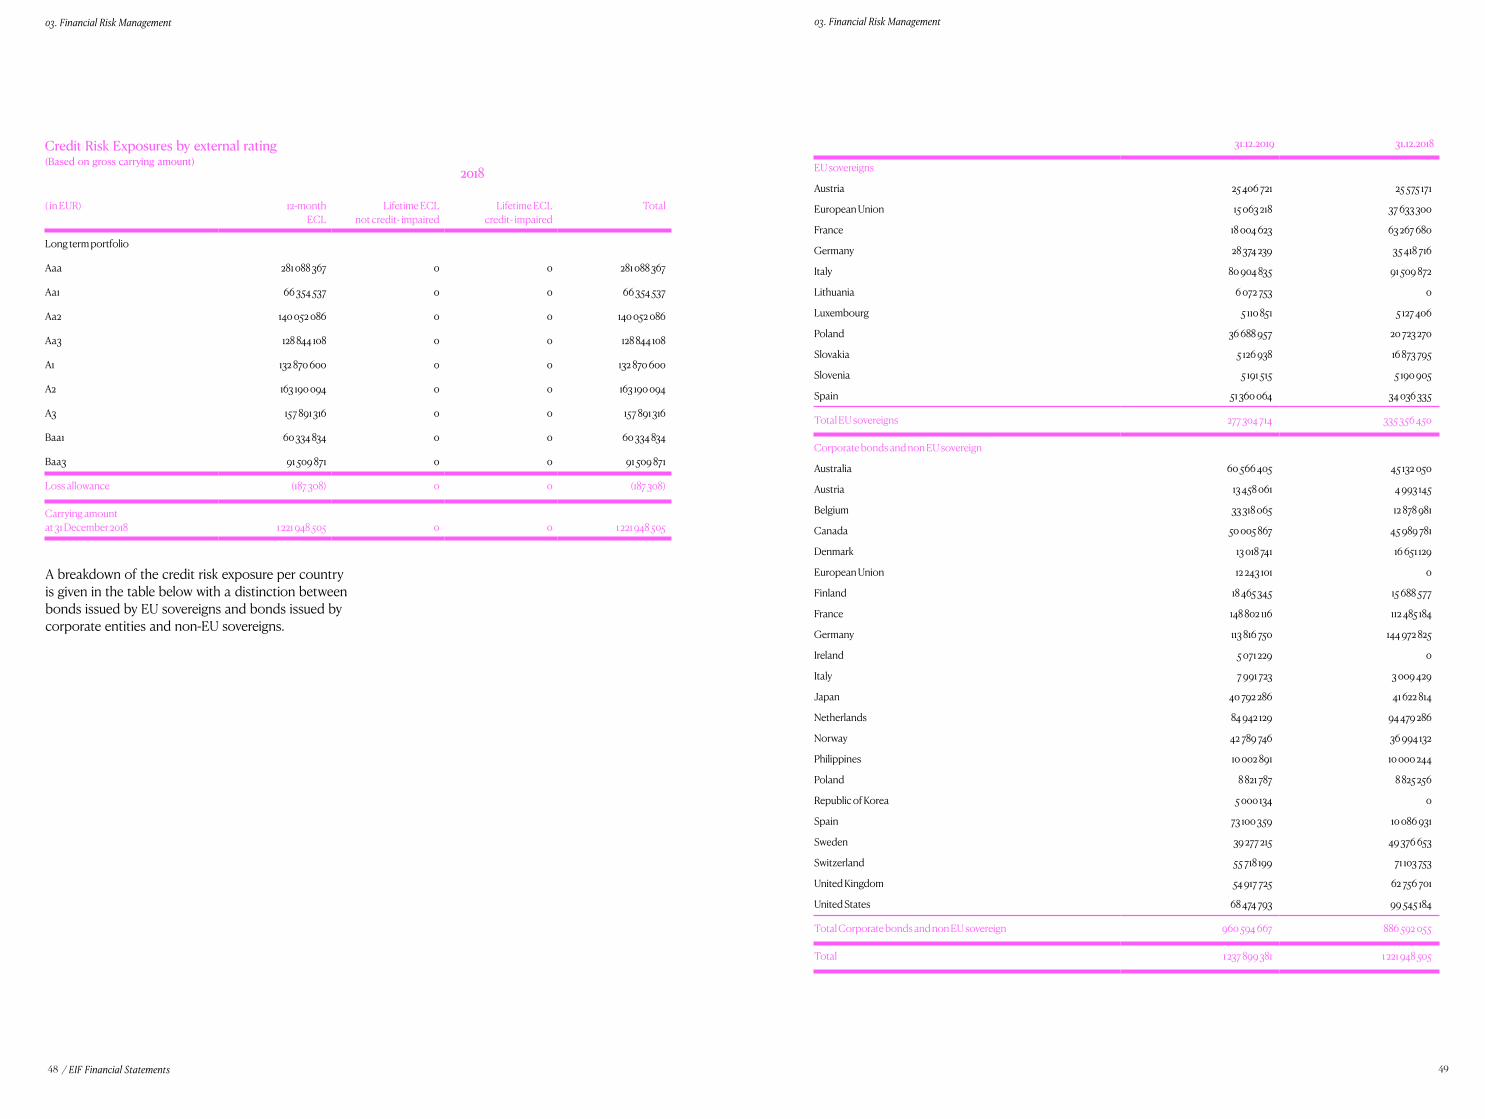
48 49
03. Financial Risk Management 03. Financial Risk Management
/ EIF Financial Statements
A breakdown of the credit risk exposure per country is given in the table below with a distinction between bonds issued by EU sovereigns and bonds issued by corporate entities and non-EU sovereigns.
Credit Risk Exposures by external rating(Based on gross carrying amount)
( in EUR) 12-monthECL
Lifetime ECLnot credit- impaired
Lifetime ECLcredit- impaired
Total
Long term portfolio
Aaa 281 088 367 0 0 281 088 367
Aa1 66 354 537 0 0 66 354 537
Aa2 140 052 086 0 0 140 052 086
Aa3 128 844 108 0 0 128 844 108
A1 132 870 600 0 0 132 870 600
A2 163 190 094 0 0 163 190 094
A3 157 891 316 0 0 157 891 316
Baa1 60 334 834 0 0 60 334 834
Baa3 91 509 871 0 0 91 509 871
Loss allowance (187 308) 0 0 (187 308)
Carrying amountat 31 December 2018 1 221 948 505 0 0 1 221 948 505
31.12.2019 31.12.2018
EU sovereigns
Austria 25 406 721 25 575 171
European Union 15 063 218 37 633 300
France 18 004 623 63 267 680
Germany 28 374 239 35 418 716
Italy 80 904 835 91 509 872
Lithuania 6 072 753 0
Luxembourg 5 110 851 5 127 406
Poland 36 688 957 20 723 270
Slovakia 5 126 938 16 873 795
Slovenia 5 191 515 5 190 905
Spain 51 360 064 34 036 335
Total EU sovereigns 277 304 714 335 356 450
Corporate bonds and non EU sovereign
Australia 60 566 405 45 132 050
Austria 13 458 061 4 993 145
Belgium 33 318 065 12 878 981
Canada 50 005 867 45 989 781
Denmark 13 018 741 16 651 129
European Union 12 243 101 0
Finland 18 465 345 15 688 577
France 148 802 116 112 485 184
Germany 113 816 750 144 972 825
Ireland 5 071 229 0
Italy 7 991 723 3 009 429
Japan 40 792 286 41 622 814
Netherlands 84 942 129 94 479 286
Norway 42 789 746 36 994 132
Philippines 10 002 891 10 000 244
Poland 8 821 787 8 825 256
Republic of Korea 5 000 134 0
Spain 73 100 359 10 086 931
Sweden 39 277 215 49 376 653
Switzerland 55 718 199 71 103 753
United Kingdom 54 917 725 62 756 701
United States 68 474 793 99 545 184
Total Corporate bonds and non EU sovereign 960 594 667 886 592 055
Total 1 237 899 381 1 221 948 505
2018
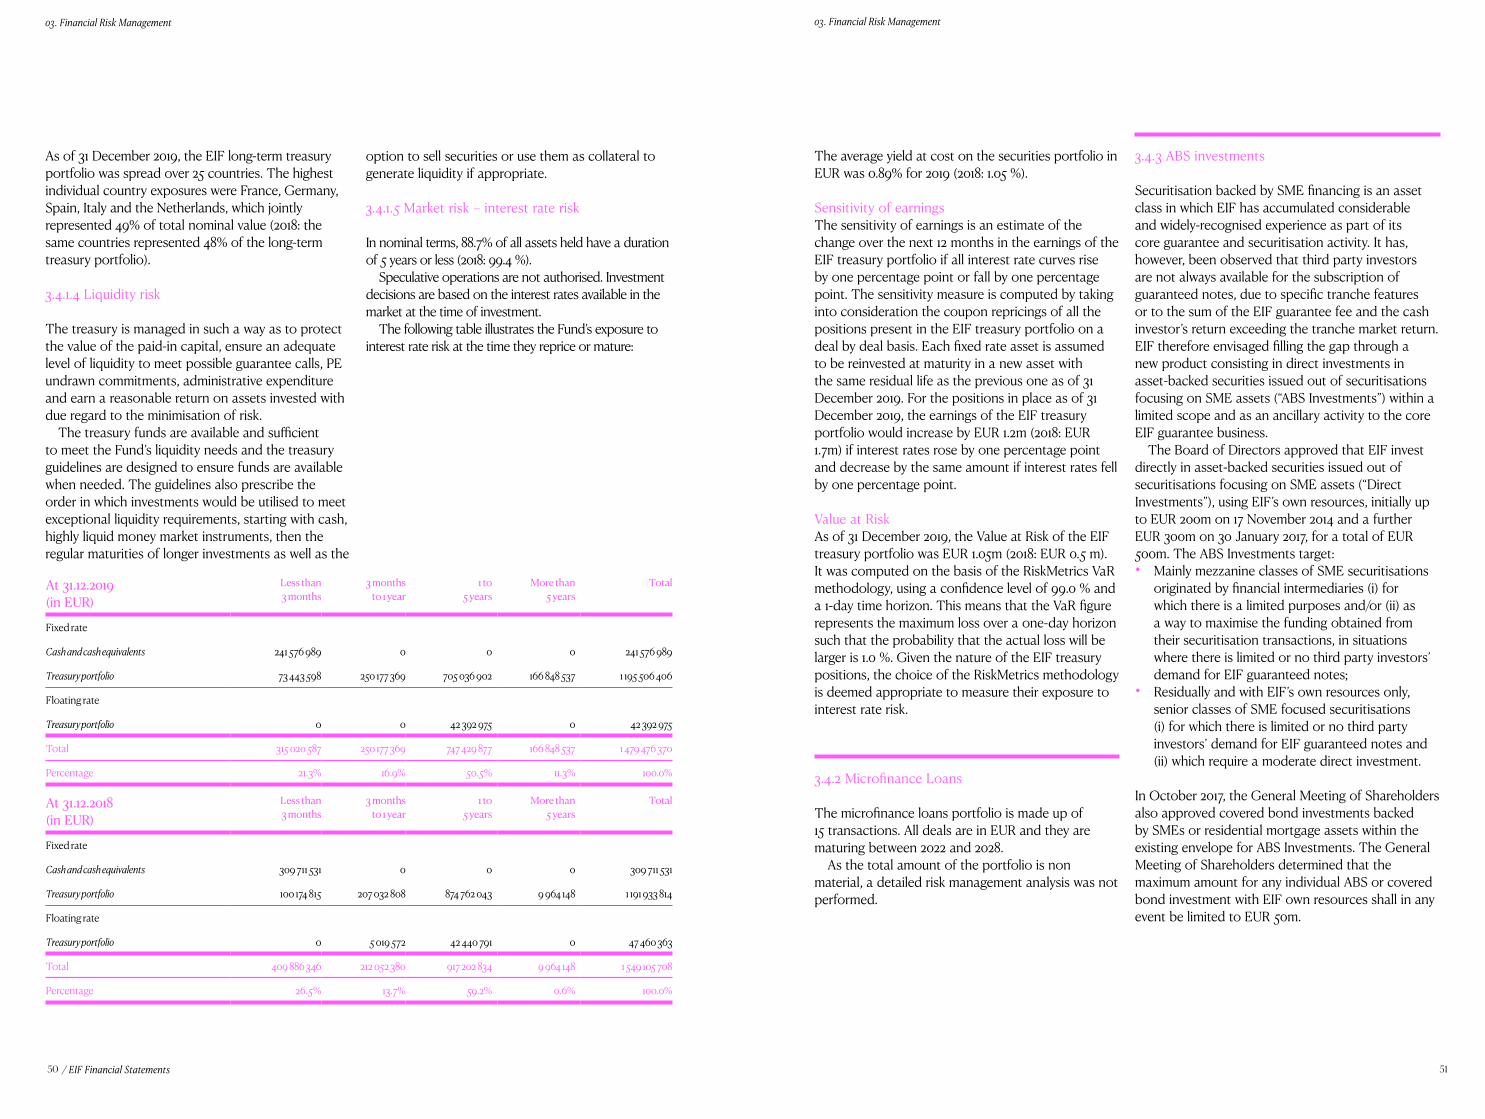
50 51
03. Financial Risk Management 03. Financial Risk Management
/ EIF Financial Statements
As of 31 December 2019, the EIF long-term treasury portfolio was spread over 25 countries. The highest individual country exposures were France, Germany, Spain, Italy and the Netherlands, which jointly represented 49% of total nominal value (2018: the same countries represented 48% of the long-term treasury portfolio).
3.4.1.4 Liquidity risk
The treasury is managed in such a way as to protect the value of the paid-in capital, ensure an adequate level of liquidity to meet possible guarantee calls, PE undrawn commitments, administrative expenditure and earn a reasonable return on assets invested with due regard to the minimisation of risk.
The treasury funds are available and sufficient to meet the Fund’s liquidity needs and the treasury guidelines are designed to ensure funds are available when needed. The guidelines also prescribe the order in which investments would be utilised to meet exceptional liquidity requirements, starting with cash, highly liquid money market instruments, then the regular maturities of longer investments as well as the
The average yield at cost on the securities portfolio in EUR was 0.89% for 2019 (2018: 1.05 %).
Sensitivity of earningsThe sensitivity of earnings is an estimate of the change over the next 12 months in the earnings of the EIF treasury portfolio if all interest rate curves rise by one percentage point or fall by one percentage point. The sensitivity measure is computed by taking into consideration the coupon repricings of all the positions present in the EIF treasury portfolio on a deal by deal basis. Each fixed rate asset is assumed to be reinvested at maturity in a new asset with the same residual life as the previous one as of 31 December 2019. For the positions in place as of 31 December 2019, the earnings of the EIF treasury portfolio would increase by EUR 1.2m (2018: EUR 1.7m) if interest rates rose by one percentage point and decrease by the same amount if interest rates fell by one percentage point.
Value at RiskAs of 31 December 2019, the Value at Risk of the EIF treasury portfolio was EUR 1.05m (2018: EUR 0.5 m). It was computed on the basis of the RiskMetrics VaR methodology, using a confidence level of 99.0 % and a 1-day time horizon. This means that the VaR figure represents the maximum loss over a one-day horizon such that the probability that the actual loss will be larger is 1.0 %. Given the nature of the EIF treasury positions, the choice of the RiskMetrics methodology is deemed appropriate to measure their exposure to interest rate risk.
3.4.2 Microfinance Loans
The microfinance loans portfolio is made up of 15 transactions. All deals are in EUR and they are maturing between 2022 and 2028.
As the total amount of the portfolio is non material, a detailed risk management analysis was not performed.
option to sell securities or use them as collateral to generate liquidity if appropriate.
3.4.1.5 Market risk – interest rate risk
In nominal terms, 88.7% of all assets held have a duration of 5 years or less (2018: 99.4 %).
Speculative operations are not authorised. Investment decisions are based on the interest rates available in the market at the time of investment.
The following table illustrates the Fund’s exposure to interest rate risk at the time they reprice or mature:
3.4.3 ABS investments
Securitisation backed by SME financing is an asset class in which EIF has accumulated considerable and widely-recognised experience as part of its core guarantee and securitisation activity. It has, however, been observed that third party investors are not always available for the subscription of guaranteed notes, due to specific tranche features or to the sum of the EIF guarantee fee and the cash investor’s return exceeding the tranche market return. EIF therefore envisaged filling the gap through a new product consisting in direct investments in asset-backed securities issued out of securitisations focusing on SME assets (“ABS Investments”) within a limited scope and as an ancillary activity to the core EIF guarantee business.
The Board of Directors approved that EIF invest directly in asset-backed securities issued out of securitisations focusing on SME assets (“Direct Investments”), using EIF’s own resources, initially up to EUR 200m on 17 November 2014 and a further EUR 300m on 30 January 2017, for a total of EUR 500m. The ABS Investments target:• Mainly mezzanine classes of SME securitisations
originated by financial intermediaries (i) for which there is a limited purposes and/or (ii) as a way to maximise the funding obtained from their securitisation transactions, in situations where there is limited or no third party investors’ demand for EIF guaranteed notes;
• Residually and with EIF’s own resources only, senior classes of SME focused securitisations (i) for which there is limited or no third party investors’ demand for EIF guaranteed notes and (ii) which require a moderate direct investment.
In October 2017, the General Meeting of Shareholders also approved covered bond investments backed by SMEs or residential mortgage assets within the existing envelope for ABS Investments. The General Meeting of Shareholders determined that the maximum amount for any individual ABS or covered bond investment with EIF own resources shall in any event be limited to EUR 50m.
At 31.12.2019 (in EUR)
Less than3 months
3 monthsto 1 year
1 to5 years
More than5 years
Total
Fixed rate
Cash and cash equivalents 241 576 989 0 0 0 241 576 989
Treasury portfolio 73 443 598 250 177 369 705 036 902 166 848 537 1 195 506 406
Floating rate
Treasury portfolio 0 0 42 392 975 0 42 392 975
Total 315 020 587 250 177 369 747 429 877 166 848 537 1 479 476 370
Percentage 21.3% 16.9% 50.5% 11.3% 100.0%
At 31.12.2018 (in EUR)
Less than3 months
3 monthsto 1 year
1 to5 years
More than5 years
Total
Fixed rate
Cash and cash equivalents 309 711 531 0 0 0 309 711 531
Treasury portfolio 100 174 815 207 032 808 874 762 043 9 964 148 1 191 933 814
Floating rate
Treasury portfolio 0 5 019 572 42 440 791 0 47 460 363
Total 409 886 346 212 052 380 917 202 834 9 964 148 1 549 105 708
Percentage 26.5% 13.7% 59.2% 0.6% 100.0%
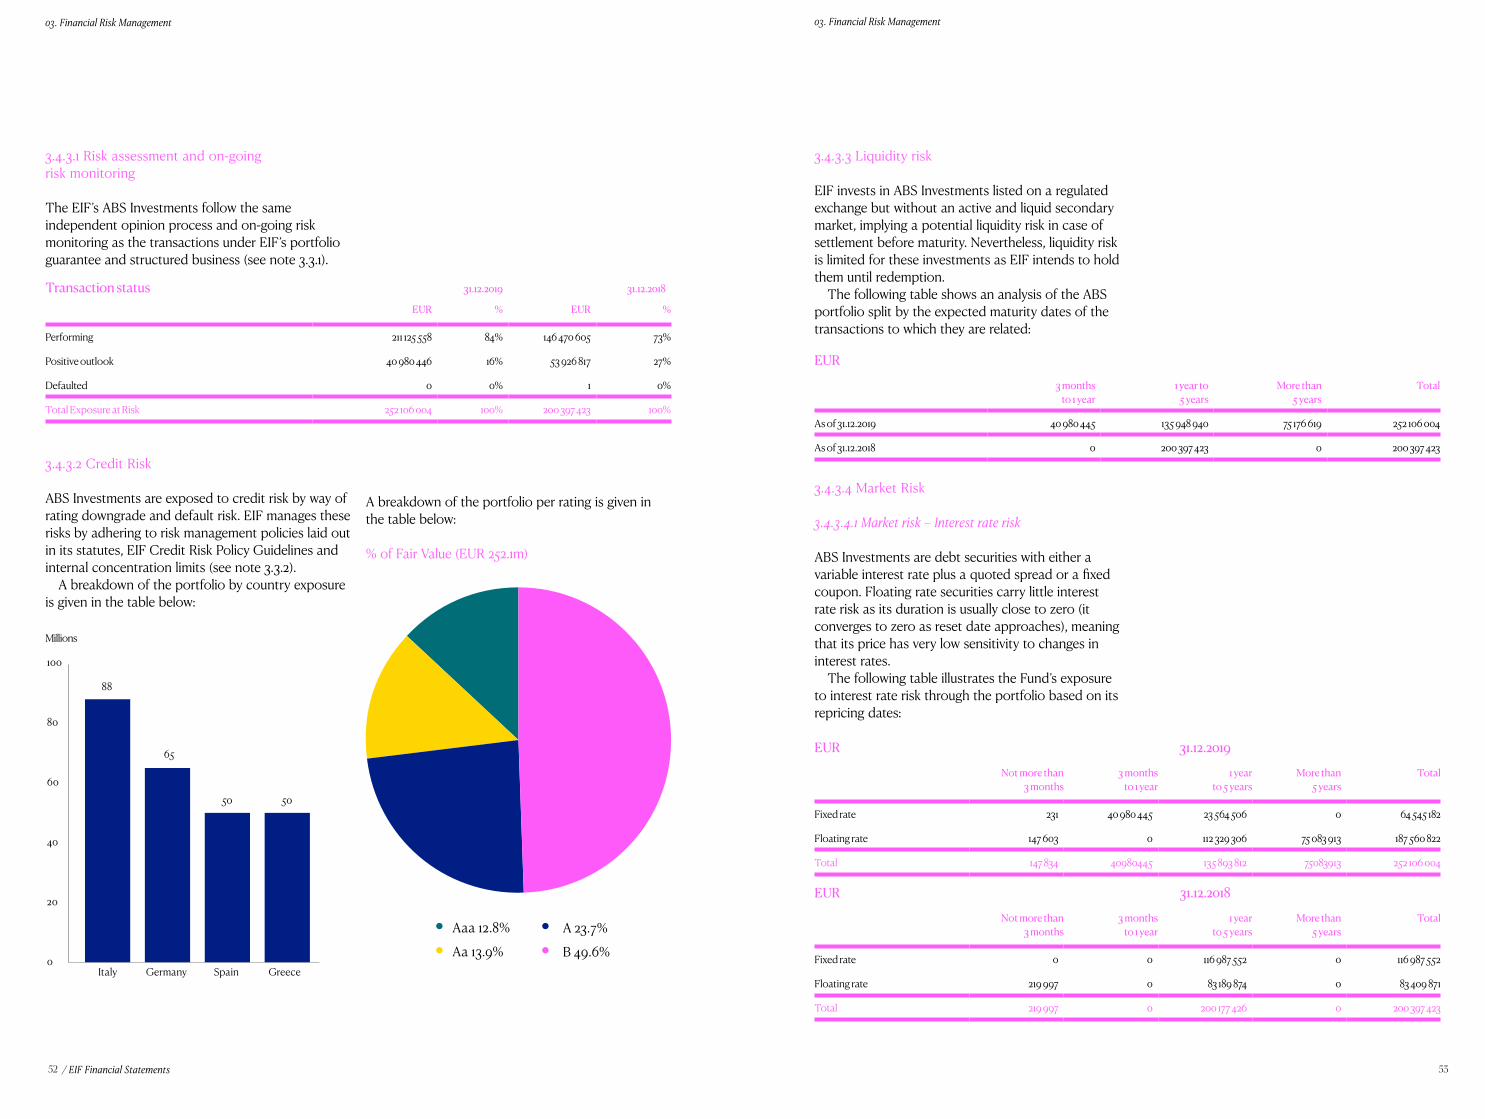
52 53
03. Financial Risk Management 03. Financial Risk Management
/ EIF Financial Statements
3.4.3.1 Risk assessment and on-going risk monitoring
The EIF’s ABS Investments follow the same independent opinion process and on-going risk monitoring as the transactions under EIF’s portfolio guarantee and structured business (see note 3.3.1).
3.4.3.2 Credit Risk
ABS Investments are exposed to credit risk by way of rating downgrade and default risk. EIF manages these risks by adhering to risk management policies laid out in its statutes, EIF Credit Risk Policy Guidelines and internal concentration limits (see note 3.3.2).
A breakdown of the portfolio by country exposure is given in the table below:
3.4.3.3 Liquidity risk
EIF invests in ABS Investments listed on a regulated exchange but without an active and liquid secondary market, implying a potential liquidity risk in case of settlement before maturity. Nevertheless, liquidity risk is limited for these investments as EIF intends to hold them until redemption.
The following table shows an analysis of the ABS portfolio split by the expected maturity dates of the transactions to which they are related:
3.4.3.4 Market Risk
3.4.3.4.1 Market risk – Interest rate risk
ABS Investments are debt securities with either a variable interest rate plus a quoted spread or a fixed coupon. Floating rate securities carry little interest rate risk as its duration is usually close to zero (it converges to zero as reset date approaches), meaning that its price has very low sensitivity to changes in interest rates.
The following table illustrates the Fund’s exposure to interest rate risk through the portfolio based on its repricing dates:
A breakdown of the portfolio per rating is given in the table below:
% of Fair Value (EUR 252.1m)
Transaction status 31.12.2019 31.12.2018
EUR % EUR %
Performing 211 125 558 84% 146 470 605 73%
Positive outlook 40 980 446 16% 53 926 817 27%
Defaulted 0 0% 1 0%
Total Exposure at Risk 252 106 004 100% 200 397 423 100%
EUR
3 months to 1 year
1 year to5 years
More than5 years
Total
As of 31.12.2019 40 980 445 135 948 940 75 176 619 252 106 004
As of 31.12.2018 0 200 397 423 0 200 397 423
EUR 31.12.2019
Not more than3 months
3 months to 1 year
1 year to 5 years
More than 5 years
Total
Fixed rate 231 40 980 445 23 564 506 0 64 545 182
Floating rate 147 603 0 112 329 306 75 083 913 187 560 822
Total 147 834 40980445 135 893 812 75083913 252 106 004
EUR 31.12.2018
Not more than3 months
3 months to 1 year
1 year to 5 years
More than 5 years
Total
Fixed rate 0 0 116 987 552 0 116 987 552
Floating rate 219 997 0 83 189 874 0 83 409 871
Total 219 997 0 200 177 426 0 200 397 423
Aaa 12.8%
Aa 13.9% A 23.7%
B 49.6%
Millions
Germany Spain GreeceItaly
88
65
50 50
100
80
60
40
20
0
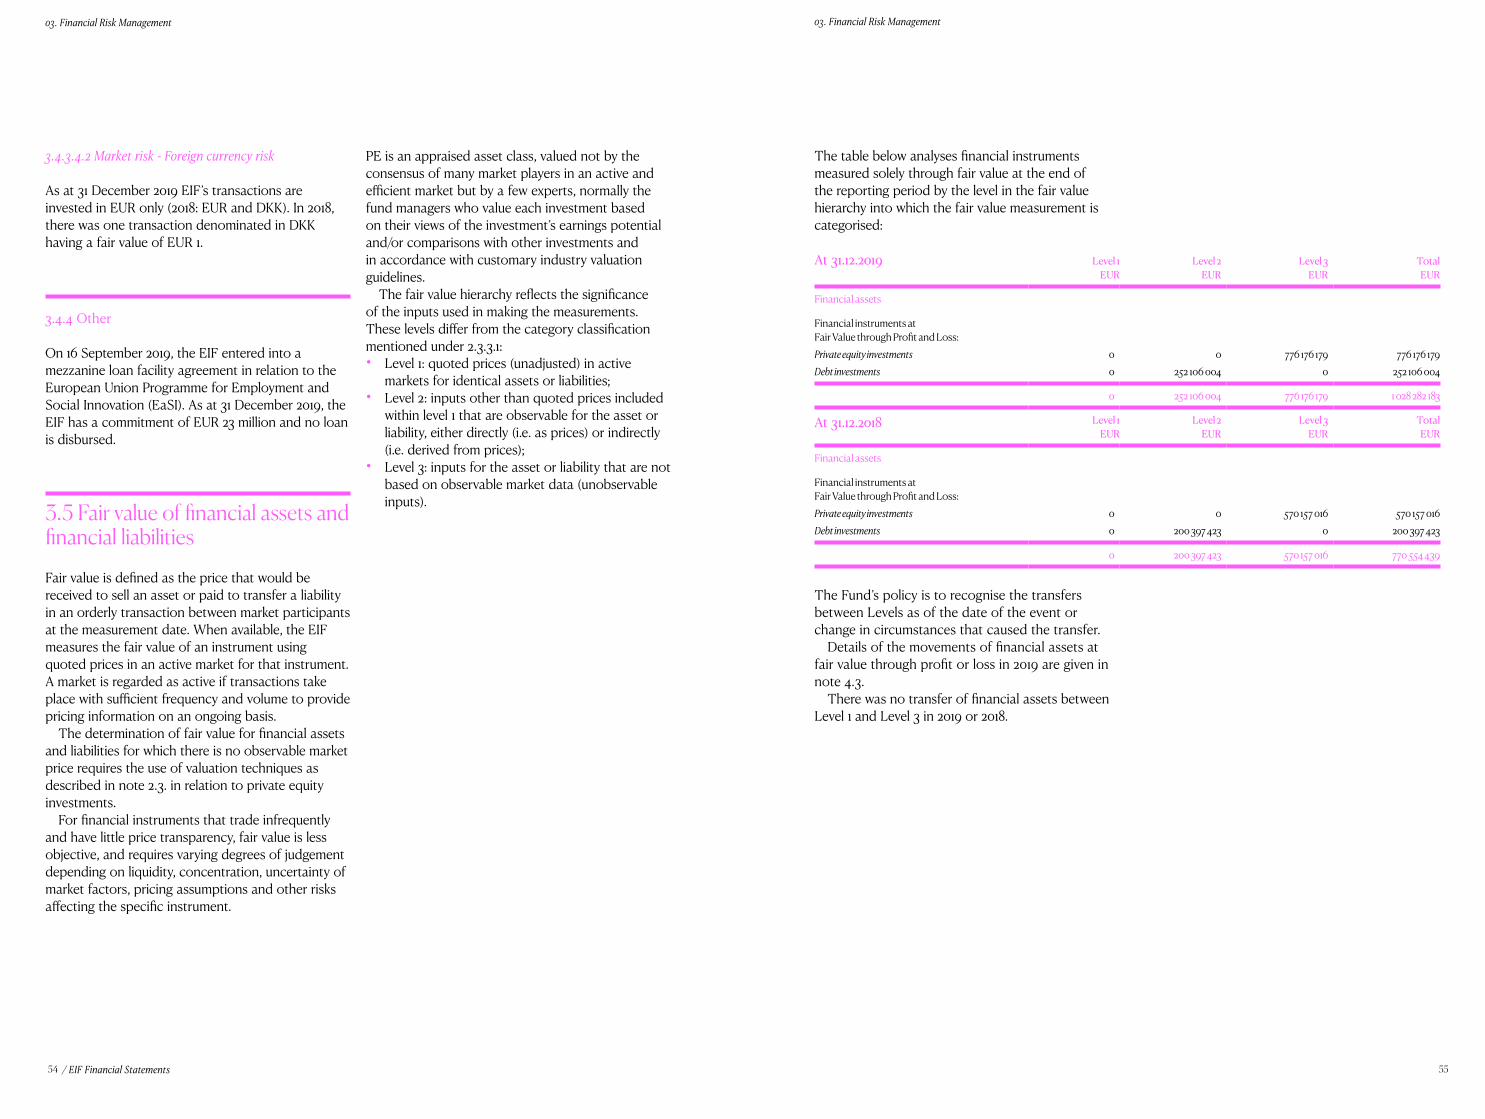
54 55
03. Financial Risk Management 03. Financial Risk Management
/ EIF Financial Statements
3.4.3.4.2 Market risk - Foreign currency risk
As at 31 December 2019 EIF’s transactions are invested in EUR only (2018: EUR and DKK). In 2018, there was one transaction denominated in DKK having a fair value of EUR 1.
3.4.4 Other
On 16 September 2019, the EIF entered into a mezzanine loan facility agreement in relation to the European Union Programme for Employment and Social Innovation (EaSI). As at 31 December 2019, the EIF has a commitment of EUR 23 million and no loan is disbursed.
3.5 Fair value of financial assets and financial liabilities
Fair value is defined as the price that would be received to sell an asset or paid to transfer a liability in an orderly transaction between market participants at the measurement date. When available, the EIF measures the fair value of an instrument using quoted prices in an active market for that instrument. A market is regarded as active if transactions take place with sufficient frequency and volume to provide pricing information on an ongoing basis.
The determination of fair value for financial assets and liabilities for which there is no observable market price requires the use of valuation techniques as described in note 2.3. in relation to private equity investments.
For financial instruments that trade infrequently and have little price transparency, fair value is less objective, and requires varying degrees of judgement depending on liquidity, concentration, uncertainty of market factors, pricing assumptions and other risks affecting the specific instrument.
PE is an appraised asset class, valued not by the consensus of many market players in an active and efficient market but by a few experts, normally the fund managers who value each investment based on their views of the investment’s earnings potential and/or comparisons with other investments and in accordance with customary industry valuation guidelines.
The fair value hierarchy reflects the significance of the inputs used in making the measurements. These levels differ from the category classification mentioned under 2.3.3.1: • Level 1: quoted prices (unadjusted) in active
markets for identical assets or liabilities;• Level 2: inputs other than quoted prices included
within level 1 that are observable for the asset or liability, either directly (i.e. as prices) or indirectly (i.e. derived from prices);
• Level 3: inputs for the asset or liability that are not based on observable market data (unobservable inputs).
The table below analyses financial instruments measured solely through fair value at the end of the reporting period by the level in the fair value hierarchy into which the fair value measurement is categorised:
The Fund’s policy is to recognise the transfers between Levels as of the date of the event or change in circumstances that caused the transfer.
Details of the movements of financial assets at fair value through profit or loss in 2019 are given in note 4.3.
There was no transfer of financial assets between Level 1 and Level 3 in 2019 or 2018.
At 31.12.2019 Level 1EUR
Level 2EUR
Level 3EUR
TotalEUR
Financial assets
Financial instruments atFair Value through Profit and Loss:Private equity investments 0 0 776 176 179 776 176 179Debt investments 0 252 106 004 0 252 106 004
0 252 106 004 776 176 179 1 028 282 183
At 31.12.2018 Level 1EUR
Level 2EUR
Level 3EUR
TotalEUR
Financial assets
Financial instruments atFair Value through Profit and Loss:Private equity investments 0 0 570 157 016 570 157 016Debt investments 0 200 397 423 0 200 397 423
0 200 397 423 570 157 016 770 554 439
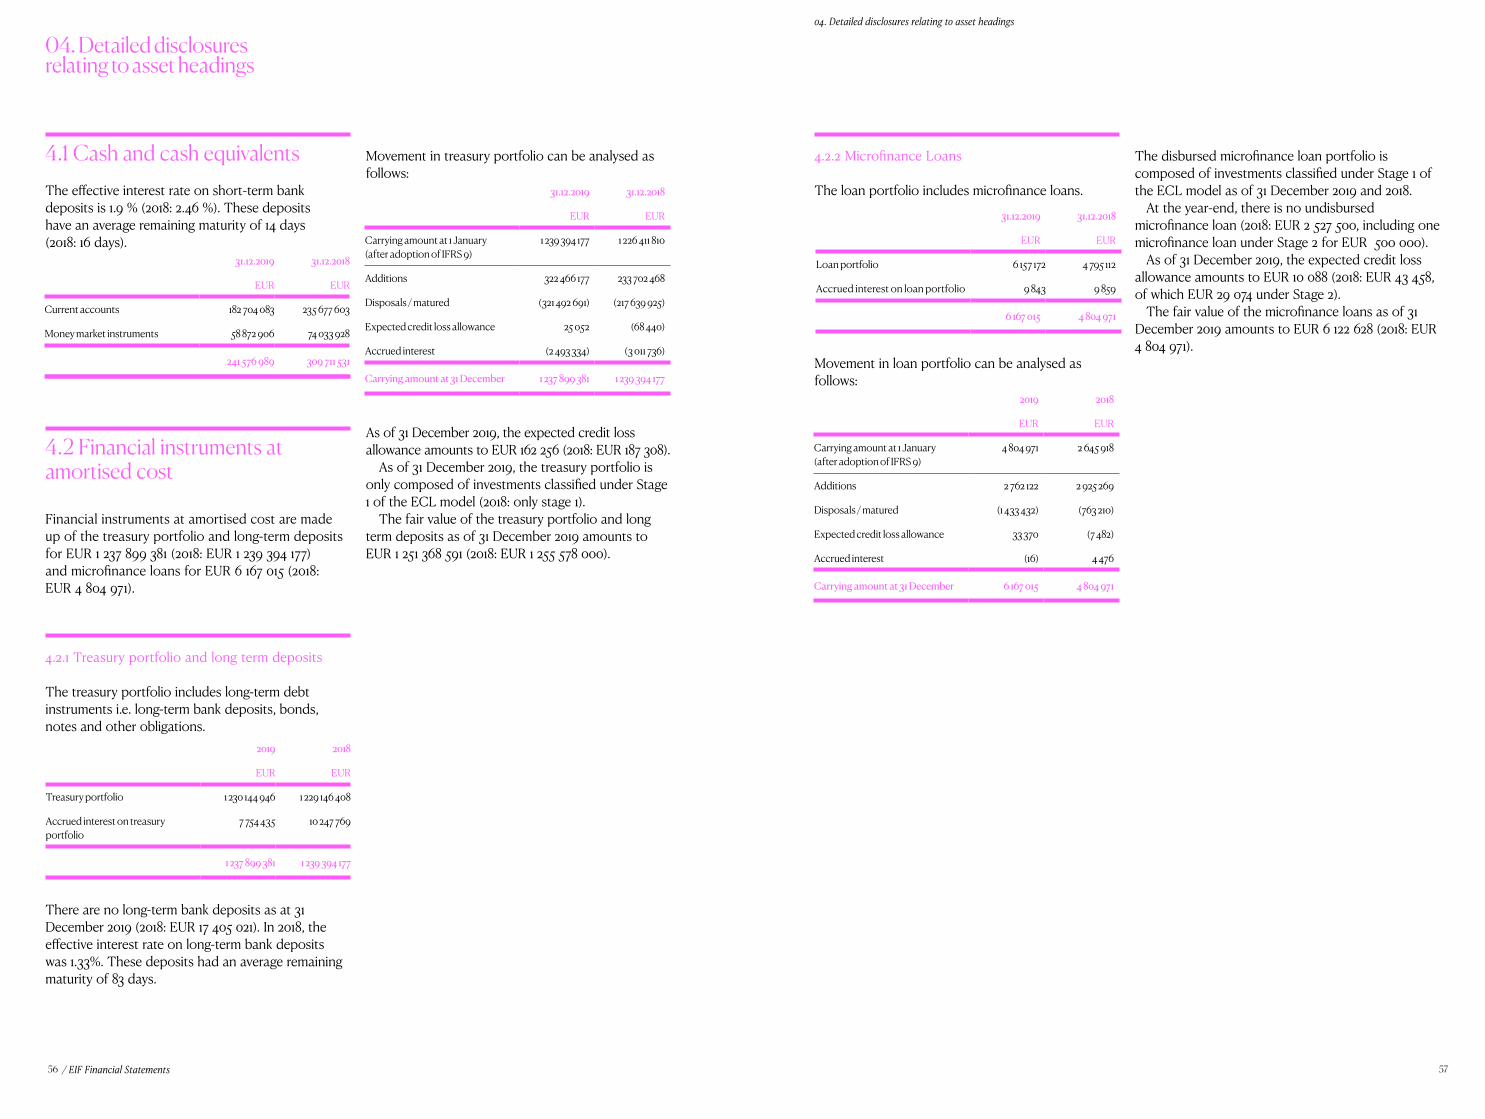
57
04. Detailed disclosures relating to asset headings
56 / EIF Financial Statements
04. Detailed disclosures relating to asset headings
4.1 Cash and cash equivalentsThe effective interest rate on short-term bank deposits is 1.9 % (2018: 2.46 %). These deposits have an average remaining maturity of 14 days (2018: 16 days).
4.2 Financial instruments at amortised cost
Financial instruments at amortised cost are made up of the treasury portfolio and long-term deposits for EUR 1 237 899 381 (2018: EUR 1 239 394 177) and microfinance loans for EUR 6 167 015 (2018: EUR 4 804 971).
4.2.1 Treasury portfolio and long term deposits
The treasury portfolio includes long-term debt instruments i.e. long-term bank deposits, bonds, notes and other obligations.
There are no long-term bank deposits as at 31 December 2019 (2018: EUR 17 405 021). In 2018, the effective interest rate on long-term bank deposits was 1.33%. These deposits had an average remaining maturity of 83 days.
Movement in treasury portfolio can be analysed as follows:
As of 31 December 2019, the expected credit loss allowance amounts to EUR 162 256 (2018: EUR 187 308).
As of 31 December 2019, the treasury portfolio is only composed of investments classified under Stage 1 of the ECL model (2018: only stage 1).
The fair value of the treasury portfolio and long term deposits as of 31 December 2019 amounts to EUR 1 251 368 591 (2018: EUR 1 255 578 000).
The disbursed microfinance loan portfolio is composed of investments classified under Stage 1 of the ECL model as of 31 December 2019 and 2018.
At the year-end, there is no undisbursed microfinance loan (2018: EUR 2 527 500, including one microfinance loan under Stage 2 for EUR 500 000).
As of 31 December 2019, the expected credit loss allowance amounts to EUR 10 088 (2018: EUR 43 458, of which EUR 29 074 under Stage 2).
The fair value of the microfinance loans as of 31 December 2019 amounts to EUR 6 122 628 (2018: EUR 4 804 971).
4.2.2 Microfinance Loans
The loan portfolio includes microfinance loans.
Movement in loan portfolio can be analysed as follows:
31.12.2019 31.12.2018
EUR EUR
Current accounts 182 704 083 235 677 603
Money market instruments 58 872 906 74 033 928
241 576 989 309 711 531
2019 2018
EUR EUR
Treasury portfolio 1 230 144 946 1 229 146 408
Accrued interest on treasury portfolio
7 754 435 10 247 769
1 237 899 381 1 239 394 177
31.12.2019 31.12.2018
EUR EUR
Carrying amount at 1 January (after adoption of IFRS 9)
1 239 394 177 1 226 411 810
Additions 322 466 177 233 702 468
Disposals / matured (321 492 691) (217 639 925)
Expected credit loss allowance 25 052 (68 440)
Accrued interest (2 493 334) (3 011 736)
Carrying amount at 31 December 1 237 899 381 1 239 394 177
31.12.2019 31.12.2018
EUR EUR
Loan portfolio 6 157 172 4 795 112
Accrued interest on loan portfolio 9 843 9 859
6 167 015 4 804 971
2019 2018
EUR EUR
Carrying amount at 1 January (after adoption of IFRS 9)
4 804 971 2 645 918
Additions 2 762 122 2 925 269
Disposals / matured (1 433 432) (763 210)
Expected credit loss allowance 33 370 (7 482)
Accrued interest (16) 4 476
Carrying amount at 31 December 6 167 015 4 804 971
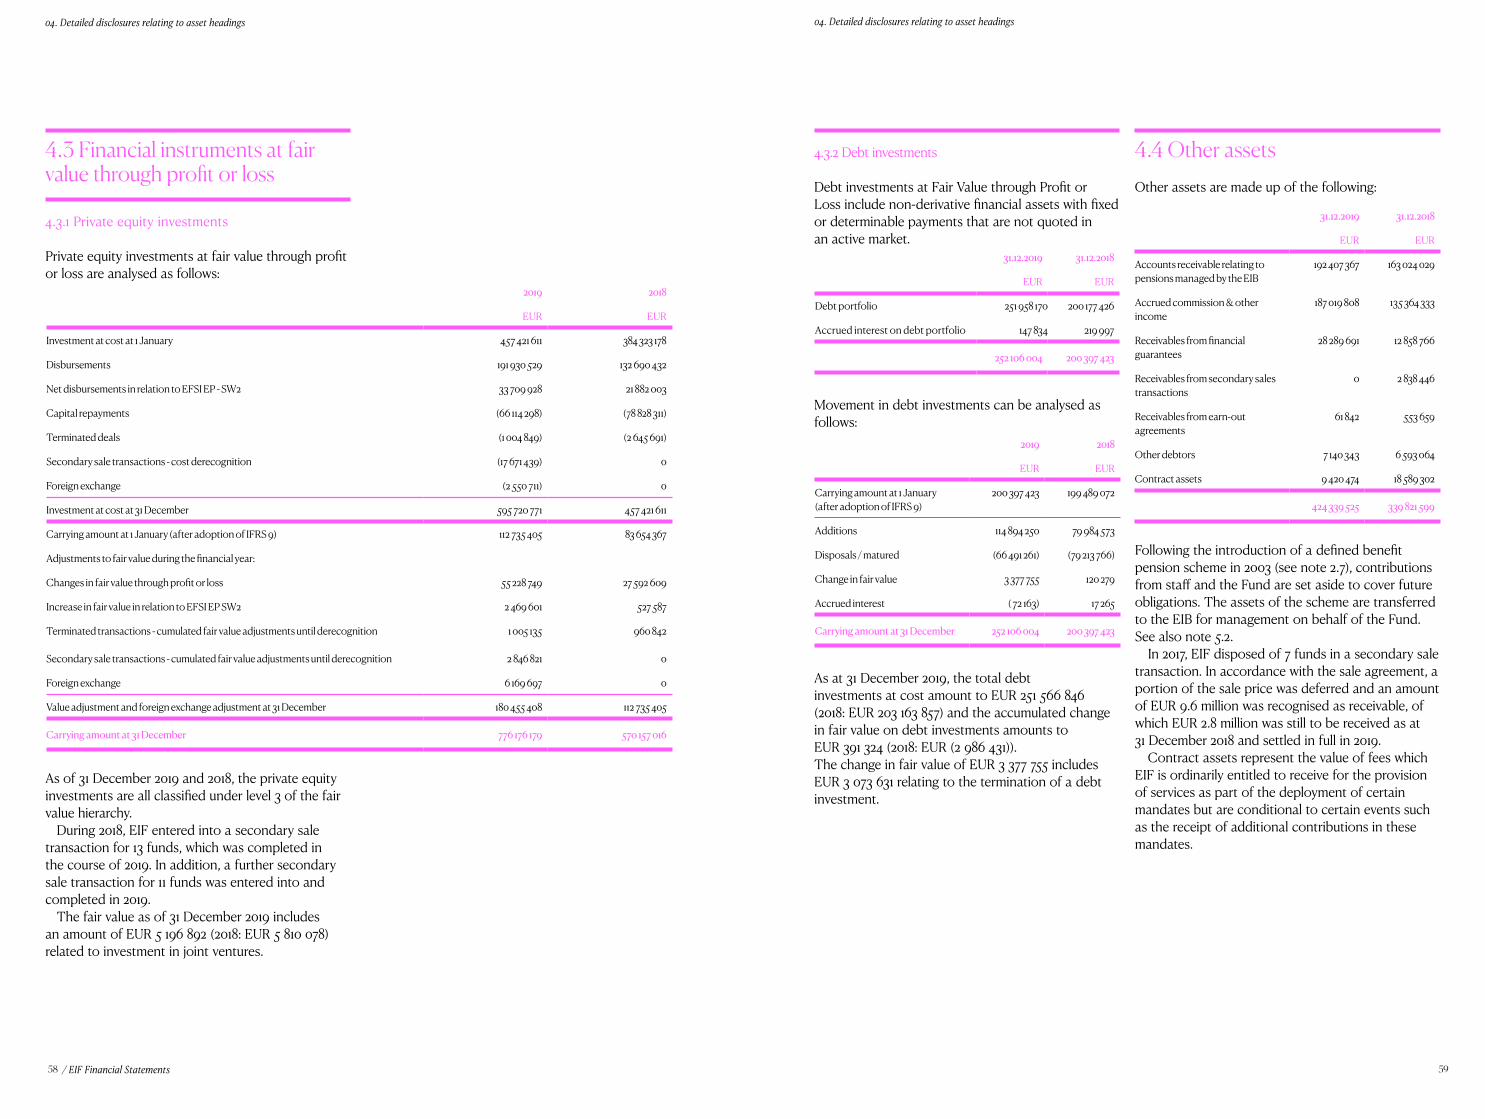
58 59
04. Detailed disclosures relating to asset headings 04. Detailed disclosures relating to asset headings
/ EIF Financial Statements
4.3 Financial instruments at fair value through profit or loss
4.3.1 Private equity investments
Private equity investments at fair value through profit or loss are analysed as follows:
As of 31 December 2019 and 2018, the private equity investments are all classified under level 3 of the fair value hierarchy.
During 2018, EIF entered into a secondary sale transaction for 13 funds, which was completed in the course of 2019. In addition, a further secondary sale transaction for 11 funds was entered into and completed in 2019.
The fair value as of 31 December 2019 includes an amount of EUR 5 196 892 (2018: EUR 5 810 078) related to investment in joint ventures.
4.3.2 Debt investments
Debt investments at Fair Value through Profit or Loss include non-derivative financial assets with fixed or determinable payments that are not quoted in an active market.
Movement in debt investments can be analysed as follows:
As at 31 December 2019, the total debt investments at cost amount to EUR 251 566 846 (2018: EUR 203 163 857) and the accumulated change in fair value on debt investments amounts to EUR 391 324 (2018: EUR (2 986 431)).The change in fair value of EUR 3 377 755 includes EUR 3 073 631 relating to the termination of a debt investment.
4.4 Other assetsOther assets are made up of the following:
Following the introduction of a defined benefit pension scheme in 2003 (see note 2.7), contributions from staff and the Fund are set aside to cover future obligations. The assets of the scheme are transferred to the EIB for management on behalf of the Fund. See also note 5.2.
In 2017, EIF disposed of 7 funds in a secondary sale transaction. In accordance with the sale agreement, a portion of the sale price was deferred and an amount of EUR 9.6 million was recognised as receivable, of which EUR 2.8 million was still to be received as at 31 December 2018 and settled in full in 2019.
Contract assets represent the value of fees which EIF is ordinarily entitled to receive for the provision of services as part of the deployment of certain mandates but are conditional to certain events such as the receipt of additional contributions in these mandates.
2019 2018
EUR EUR
Investment at cost at 1 January 457 421 611 384 323 178
Disbursements 191 930 529 132 690 432
Net disbursements in relation to EFSI EP - SW2 33 709 928 21 882 003
Capital repayments (66 114 298) (78 828 311)
Terminated deals (1 004 849) (2 645 691)
Secondary sale transactions - cost derecognition (17 671 439) 0
Foreign exchange (2 550 711) 0
Investment at cost at 31 December 595 720 771 457 421 611
Carrying amount at 1 January (after adoption of IFRS 9) 112 735 405 83 654 367
Adjustments to fair value during the financial year:
Changes in fair value through profit or loss 55 228 749 27 592 609
Increase in fair value in relation to EFSI EP SW2 2 469 601 527 587
Terminated transactions - cumulated fair value adjustments until derecognition 1 005 135 960 842
Secondary sale transactions - cumulated fair value adjustments until derecognition 2 846 821 0
Foreign exchange 6 169 697 0
Value adjustment and foreign exchange adjustment at 31 December 180 455 408 112 735 405
Carrying amount at 31 December 776 176 179 570 157 016
31.12.2019 31.12.2018
EUR EUR
Debt portfolio 251 958 170 200 177 426
Accrued interest on debt portfolio 147 834 219 997
252 106 004 200 397 423
2019 2018
EUR EUR
Carrying amount at 1 January (after adoption of IFRS 9)
200 397 423 199 489 072
Additions 114 894 250 79 984 573
Disposals / matured (66 491 261) (79 213 766)
Change in fair value 3 377 755 120 279
Accrued interest ( 72 163) 17 265
Carrying amount at 31 December 252 106 004 200 397 423
31.12.2019 31.12.2018
EUR EUR
Accounts receivable relating to pensions managed by the EIB
192 407 367 163 024 029
Accrued commission & other income
187 019 808 135 364 333
Receivables from financial guarantees
28 289 691 12 858 766
Receivables from secondary sales transactions
0 2 838 446
Receivables from earn-out agreements
61 842 553 659
Other debtors 7 140 343 6 593 064
Contract assets 9 420 474 18 589 302
424 339 525 339 821 599
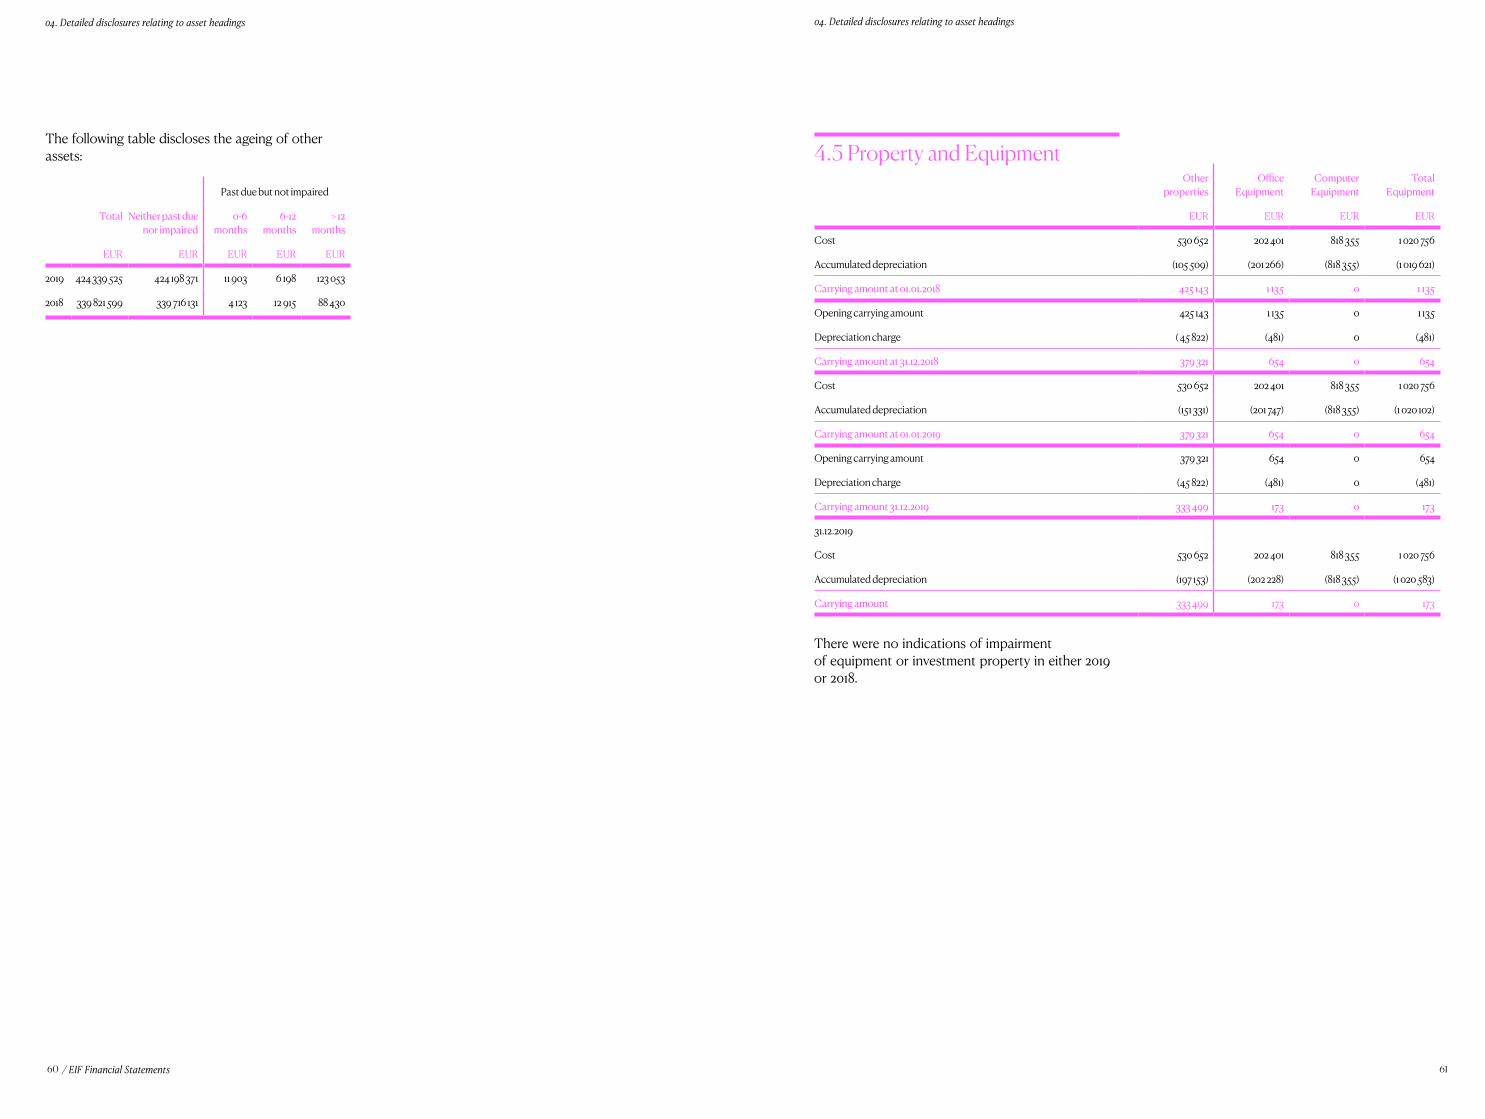
60 61
04. Detailed disclosures relating to asset headings 04. Detailed disclosures relating to asset headings
/ EIF Financial Statements
4.5 Property and Equipment
There were no indications of impairment of equipment or investment property in either 2019 or 2018.
The following table discloses the ageing of other assets:
Past due but not impaired
Total Neither past due nor impaired
0-6 months
6-12 months
> 12 months
EUR EUR EUR EUR EUR
2019 424 339 525 424 198 371 11 903 6 198 123 053
2018 339 821 599 339 716 131 4 123 12 915 88 430
Other properties
Office Equipment
Computer Equipment
Total Equipment
EUR EUR EUR EUR
Cost 530 652 202 401 818 355 1 020 756
Accumulated depreciation (105 509) (201 266) (818 355) (1 019 621)
Carrying amount at 01.01.2018 425 143 1 135 0 1 135
Opening carrying amount 425 143 1 135 0 1 135
Depreciation charge ( 45 822) (481) 0 (481)
Carrying amount at 31.12.2018 379 321 654 0 654
Cost 530 652 202 401 818 355 1 020 756
Accumulated depreciation (151 331) (201 747) (818 355) (1 020 102)
Carrying amount at 01.01.2019 379 321 654 0 654
Opening carrying amount 379 321 654 0 654
Depreciation charge (45 822) (481) 0 (481)
Carrying amount 31.12.2019 333 499 173 0 173
31.12.2019
Cost 530 652 202 401 818 355 1 020 756
Accumulated depreciation (197 153) (202 228) (818 355) (1 020 583)
Carrying amount 333 499 173 0 173
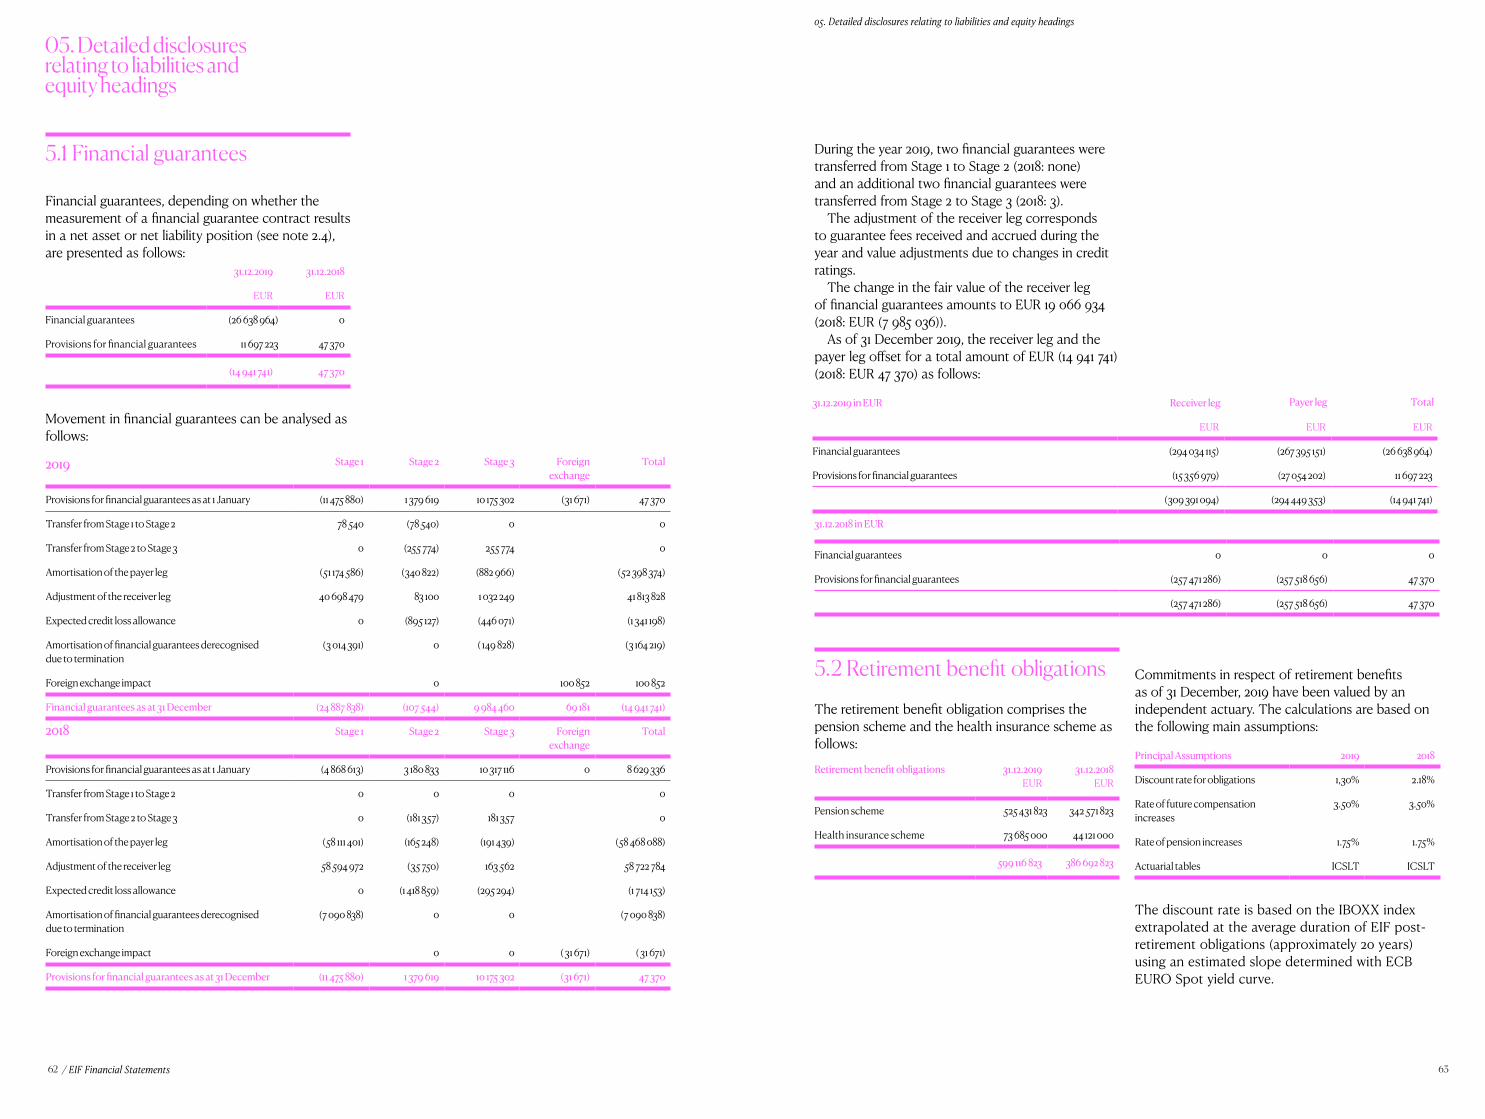
62 63
05. Detailed disclosures relating to liabilities and equity headings
/ EIF Financial Statements
5.1 Financial guarantees
Financial guarantees, depending on whether the measurement of a financial guarantee contract results in a net asset or net liability position (see note 2.4), are presented as follows:
Movement in financial guarantees can be analysed as follows:
05. Detailed disclosures relating to liabilities and equity headings
During the year 2019, two financial guarantees were transferred from Stage 1 to Stage 2 (2018: none) and an additional two financial guarantees were transferred from Stage 2 to Stage 3 (2018: 3).
The adjustment of the receiver leg corresponds to guarantee fees received and accrued during the year and value adjustments due to changes in credit ratings.
The change in the fair value of the receiver leg of financial guarantees amounts to EUR 19 066 934 (2018: EUR (7 985 036)).
As of 31 December 2019, the receiver leg and the payer leg offset for a total amount of EUR (14 941 741) (2018: EUR 47 370) as follows:
5.2 Retirement benefit obligations
The retirement benefit obligation comprises the pension scheme and the health insurance scheme as follows:
31.12.2019 31.12.2018
EUR EUR
Financial guarantees (26 638 964) 0
Provisions for financial guarantees 11 697 223 47 370
(14 941 741) 47 370
2019 Stage 1 Stage 2 Stage 3 Foreign exchange
Total
Provisions for financial guarantees as at 1 January (11 475 880) 1 379 619 10 175 302 (31 671) 47 370
Transfer from Stage 1 to Stage 2 78 540 (78 540) 0 0
Transfer from Stage 2 to Stage 3 0 (255 774) 255 774 0
Amortisation of the payer leg (51 174 586) (340 822) (882 966) (52 398 374)
Adjustment of the receiver leg 40 698 479 83 100 1 032 249 41 813 828
Expected credit loss allowance 0 (895 127) (446 071) (1 341 198)
Amortisation of financial guarantees derecognised due to termination
(3 014 391) 0 ( 149 828) (3 164 219)
Foreign exchange impact 0 100 852 100 852
Financial guarantees as at 31 December (24 887 838) (107 544) 9 984 460 69 181 (14 941 741)
2018 Stage 1 Stage 2 Stage 3 Foreign exchange
Total
Provisions for financial guarantees as at 1 January (4 868 613) 3 180 833 10 317 116 0 8 629 336
Transfer from Stage 1 to Stage 2 0 0 0 0
Transfer from Stage 2 to Stage 3 0 (181 357) 181 357 0
Amortisation of the payer leg (58 111 401) (165 248) (191 439) (58 468 088)
Adjustment of the receiver leg 58 594 972 (35 750) 163 562 58 722 784
Expected credit loss allowance 0 (1 418 859) (295 294) (1 714 153)
Amortisation of financial guarantees derecognised due to termination
(7 090 838) 0 0 (7 090 838)
Foreign exchange impact 0 0 ( 31 671) ( 31 671)
Provisions for financial guarantees as at 31 December (11 475 880) 1 379 619 10 175 302 (31 671) 47 370
Retirement benefit obligations 31.12.2019 EUR
31.12.2018 EUR
Pension scheme 525 431 823 342 571 823
Health insurance scheme 73 685 000 44 121 000
599 116 823 386 692 823
Principal Assumptions 2019 2018
Discount rate for obligations 1,30% 2.18%
Rate of future compensation increases
3.50% 3.50%
Rate of pension increases 1.75% 1.75%
Actuarial tables ICSLT ICSLT
31.12.2019 in EUR Receiver leg Payer leg Total
EUR EUR EUR
Financial guarantees (294 034 115) (267 395 151) (26 638 964)
Provisions for financial guarantees (15 356 979) (27 054 202) 11 697 223
(309 391 094) (294 449 353) (14 941 741)
31.12.2018 in EUR
Financial guarantees 0 0 0
Provisions for financial guarantees (257 471 286) (257 518 656) 47 370
(257 471 286) (257 518 656) 47 370
Commitments in respect of retirement benefits as of 31 December, 2019 have been valued by an independent actuary. The calculations are based on the following main assumptions:
The discount rate is based on the IBOXX index extrapolated at the average duration of EIF post-retirement obligations (approximately 20 years) using an estimated slope determined with ECB EURO Spot yield curve.
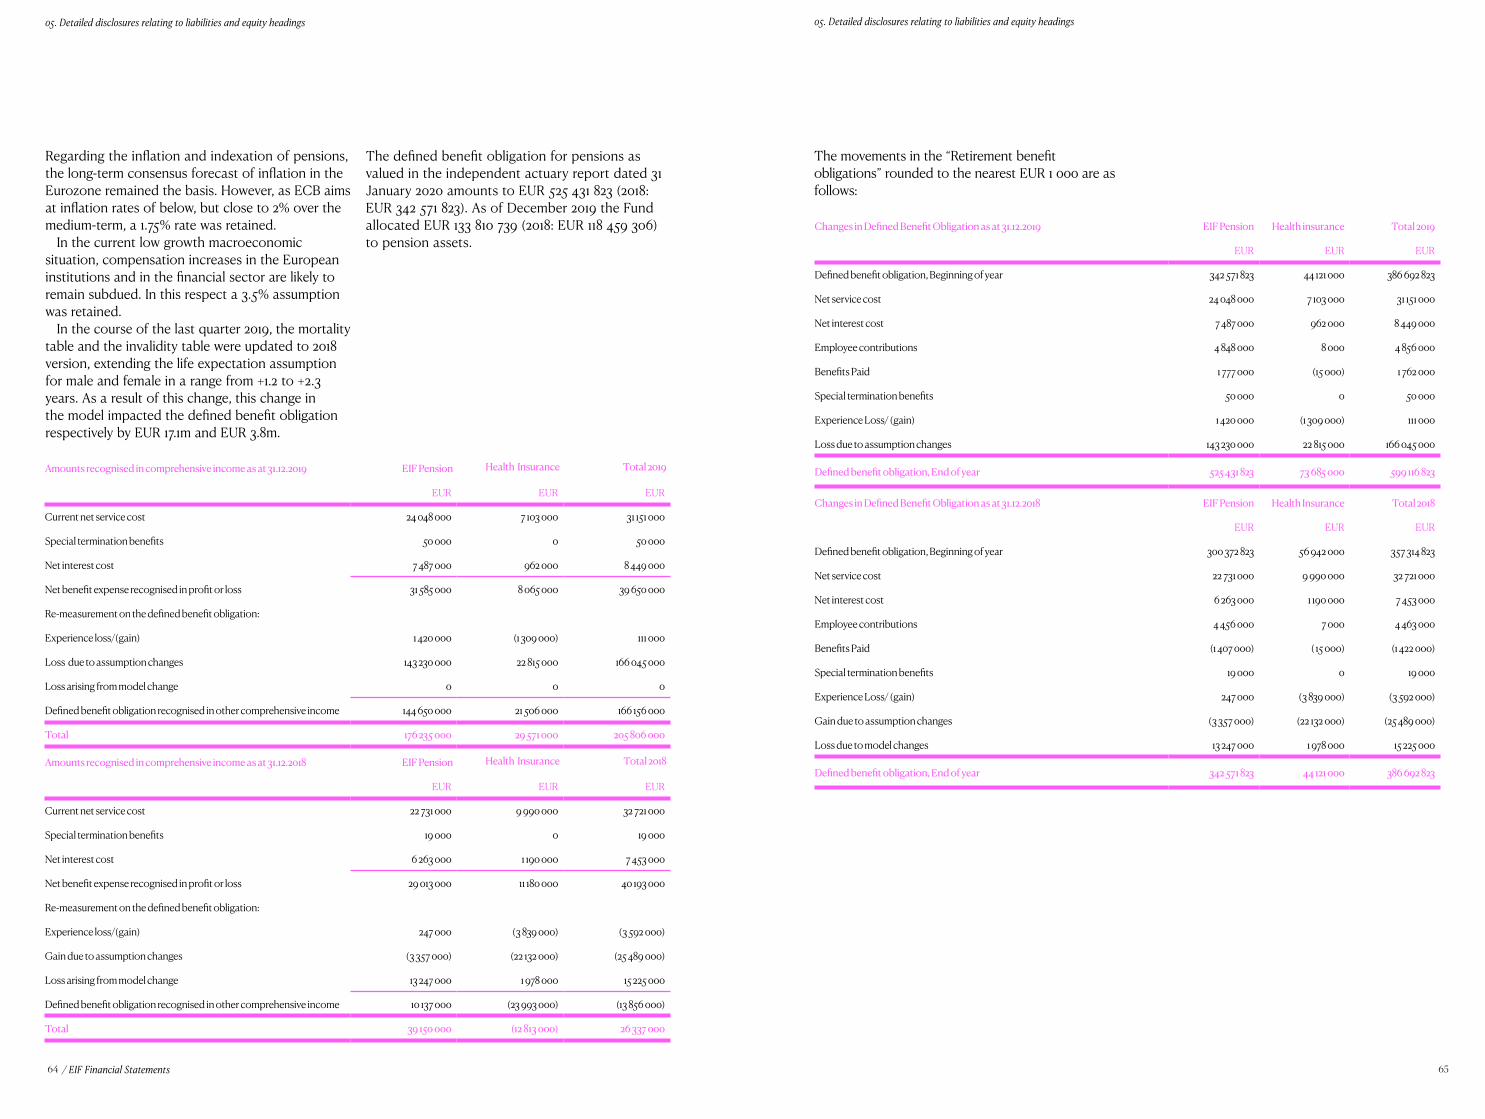
64 65
05. Detailed disclosures relating to liabilities and equity headings 05. Detailed disclosures relating to liabilities and equity headings
/ EIF Financial Statements
The movements in the “Retirement benefit obligations” rounded to the nearest EUR 1 000 are as follows:
Amounts recognised in comprehensive income as at 31.12.2019 EIF Pension Health Insurance Total 2019
EUR EUR EUR
Current net service cost 24 048 000 7 103 000 31 151 000
Special termination benefits 50 000 0 50 000
Net interest cost 7 487 000 962 000 8 449 000
Net benefit expense recognised in profit or loss 31 585 000 8 065 000 39 650 000
Re-measurement on the defined benefit obligation:
Experience loss/(gain) 1 420 000 (1 309 000) 111 000
Loss due to assumption changes 143 230 000 22 815 000 166 045 000
Loss arising from model change 0 0 0
Defined benefit obligation recognised in other comprehensive income 144 650 000 21 506 000 166 156 000
Total 176 235 000 29 571 000 205 806 000
Amounts recognised in comprehensive income as at 31.12.2018 EIF Pension Health Insurance Total 2018
EUR EUR EUR
Current net service cost 22 731 000 9 990 000 32 721 000
Special termination benefits 19 000 0 19 000
Net interest cost 6 263 000 1 190 000 7 453 000
Net benefit expense recognised in profit or loss 29 013 000 11 180 000 40 193 000
Re-measurement on the defined benefit obligation:
Experience loss/(gain) 247 000 (3 839 000) (3 592 000)
Gain due to assumption changes (3 357 000) (22 132 000) (25 489 000)
Loss arising from model change 13 247 000 1 978 000 15 225 000
Defined benefit obligation recognised in other comprehensive income 10 137 000 (23 993 000) (13 856 000)
Total 39 150 000 (12 813 000) 26 337 000
Changes in Defined Benefit Obligation as at 31.12.2019 EIF Pension Health insurance Total 2019
EUR EUR EUR
Defined benefit obligation, Beginning of year 342 571 823 44 121 000 386 692 823
Net service cost 24 048 000 7 103 000 31 151 000
Net interest cost 7 487 000 962 000 8 449 000
Employee contributions 4 848 000 8 000 4 856 000
Benefits Paid 1 777 000 (15 000) 1 762 000
Special termination benefits 50 000 0 50 000
Experience Loss/ (gain) 1 420 000 (1 309 000) 111 000
Loss due to assumption changes 143 230 000 22 815 000 166 045 000
Defined benefit obligation, End of year 525 431 823 73 685 000 599 116 823
Changes in Defined Benefit Obligation as at 31.12.2018 EIF Pension Health Insurance Total 2018
EUR EUR EUR
Defined benefit obligation, Beginning of year 300 372 823 56 942 000 357 314 823
Net service cost 22 731 000 9 990 000 32 721 000
Net interest cost 6 263 000 1 190 000 7 453 000
Employee contributions 4 456 000 7 000 4 463 000
Benefits Paid (1 407 000) ( 15 000) (1 422 000)
Special termination benefits 19 000 0 19 000
Experience Loss/ (gain) 247 000 (3 839 000) (3 592 000)
Gain due to assumption changes (3 357 000) (22 132 000) (25 489 000)
Loss due to model changes 13 247 000 1 978 000 15 225 000
Defined benefit obligation, End of year 342 571 823 44 121 000 386 692 823
Regarding the inflation and indexation of pensions, the long-term consensus forecast of inflation in the Eurozone remained the basis. However, as ECB aims at inflation rates of below, but close to 2% over the medium-term, a 1.75% rate was retained.
In the current low growth macroeconomic situation, compensation increases in the European institutions and in the financial sector are likely to remain subdued. In this respect a 3.5% assumption was retained.
In the course of the last quarter 2019, the mortality table and the invalidity table were updated to 2018 version, extending the life expectation assumption for male and female in a range from +1.2 to +2.3 years. As a result of this change, this change in the model impacted the defined benefit obligation respectively by EUR 17.1m and EUR 3.8m.
The defined benefit obligation for pensions as valued in the independent actuary report dated 31 January 2020 amounts to EUR 525 431 823 (2018: EUR 342 571 823). As of December 2019 the Fund allocated EUR 133 810 739 (2018: EUR 118 459 306) to pension assets.
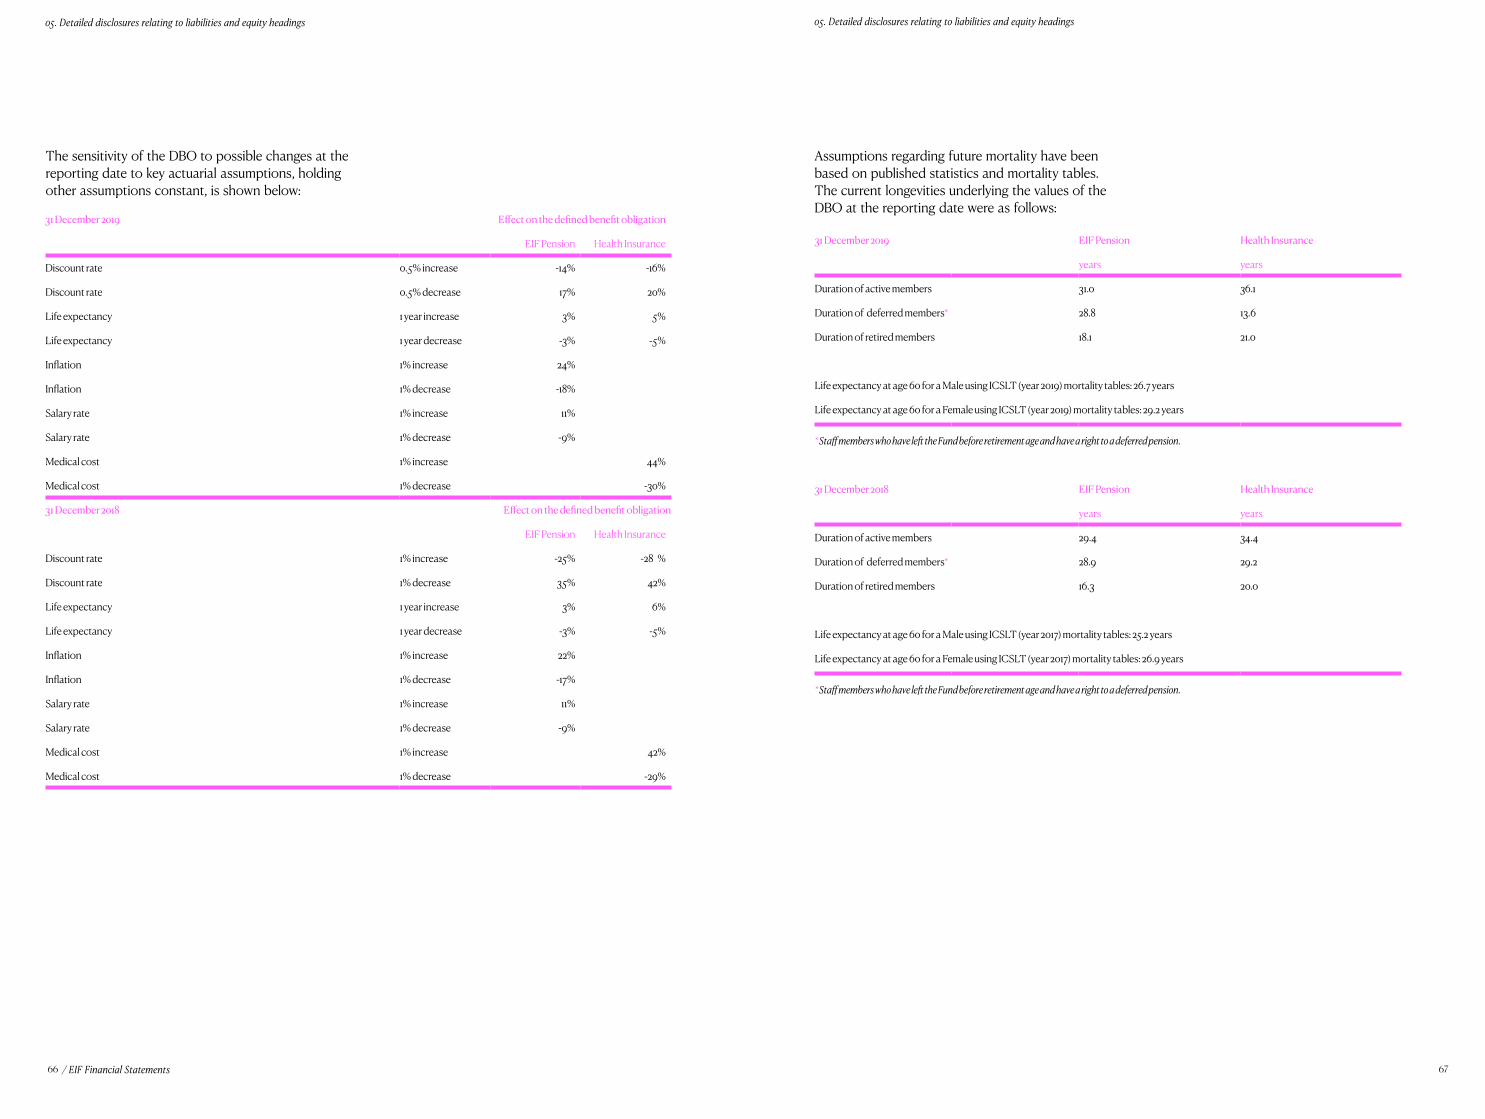
66 67
05. Detailed disclosures relating to liabilities and equity headings 05. Detailed disclosures relating to liabilities and equity headings
/ EIF Financial Statements
The sensitivity of the DBO to possible changes at the reporting date to key actuarial assumptions, holding other assumptions constant, is shown below:
Assumptions regarding future mortality have been based on published statistics and mortality tables. The current longevities underlying the values of the DBO at the reporting date were as follows:
31 December 2019 Effect on the defined benefit obligation
EIF Pension Health Insurance
Discount rate 0.5% increase -14% -16%
Discount rate 0.5% decrease 17% 20%
Life expectancy 1 year increase 3% 5%
Life expectancy 1 year decrease -3% -5%
Inflation 1% increase 24%
Inflation 1% decrease -18%
Salary rate 1% increase 11%
Salary rate 1% decrease -9%
Medical cost 1% increase 44%
Medical cost 1% decrease -30%
31 December 2018 Effect on the defined benefit obligation
EIF Pension Health Insurance
Discount rate 1% increase -25% -28 %
Discount rate 1% decrease 35% 42%
Life expectancy 1 year increase 3% 6%
Life expectancy 1 year decrease -3% -5%
Inflation 1% increase 22%
Inflation 1% decrease -17%
Salary rate 1% increase 11%
Salary rate 1% decrease -9%
Medical cost 1% increase 42%
Medical cost 1% decrease -29%
31 December 2019 EIF Pension Health Insurance
years years
Duration of active members 31.0 36.1
Duration of deferred members* 28.8 13.6
Duration of retired members 18.1 21.0
Life expectancy at age 60 for a Male using ICSLT (year 2019) mortality tables: 26.7 years
Life expectancy at age 60 for a Female using ICSLT (year 2019) mortality tables: 29.2 years
* Staff members who have left the Fund before retirement age and have a right to a deferred pension.
31 December 2018 EIF Pension Health Insurance
years years
Duration of active members 29.4 34.4
Duration of deferred members* 28.9 29.2
Duration of retired members 16.3 20.0
Life expectancy at age 60 for a Male using ICSLT (year 2017) mortality tables: 25.2 years
Life expectancy at age 60 for a Female using ICSLT (year 2017) mortality tables: 26.9 years
* Staff members who have left the Fund before retirement age and have a right to a deferred pension.
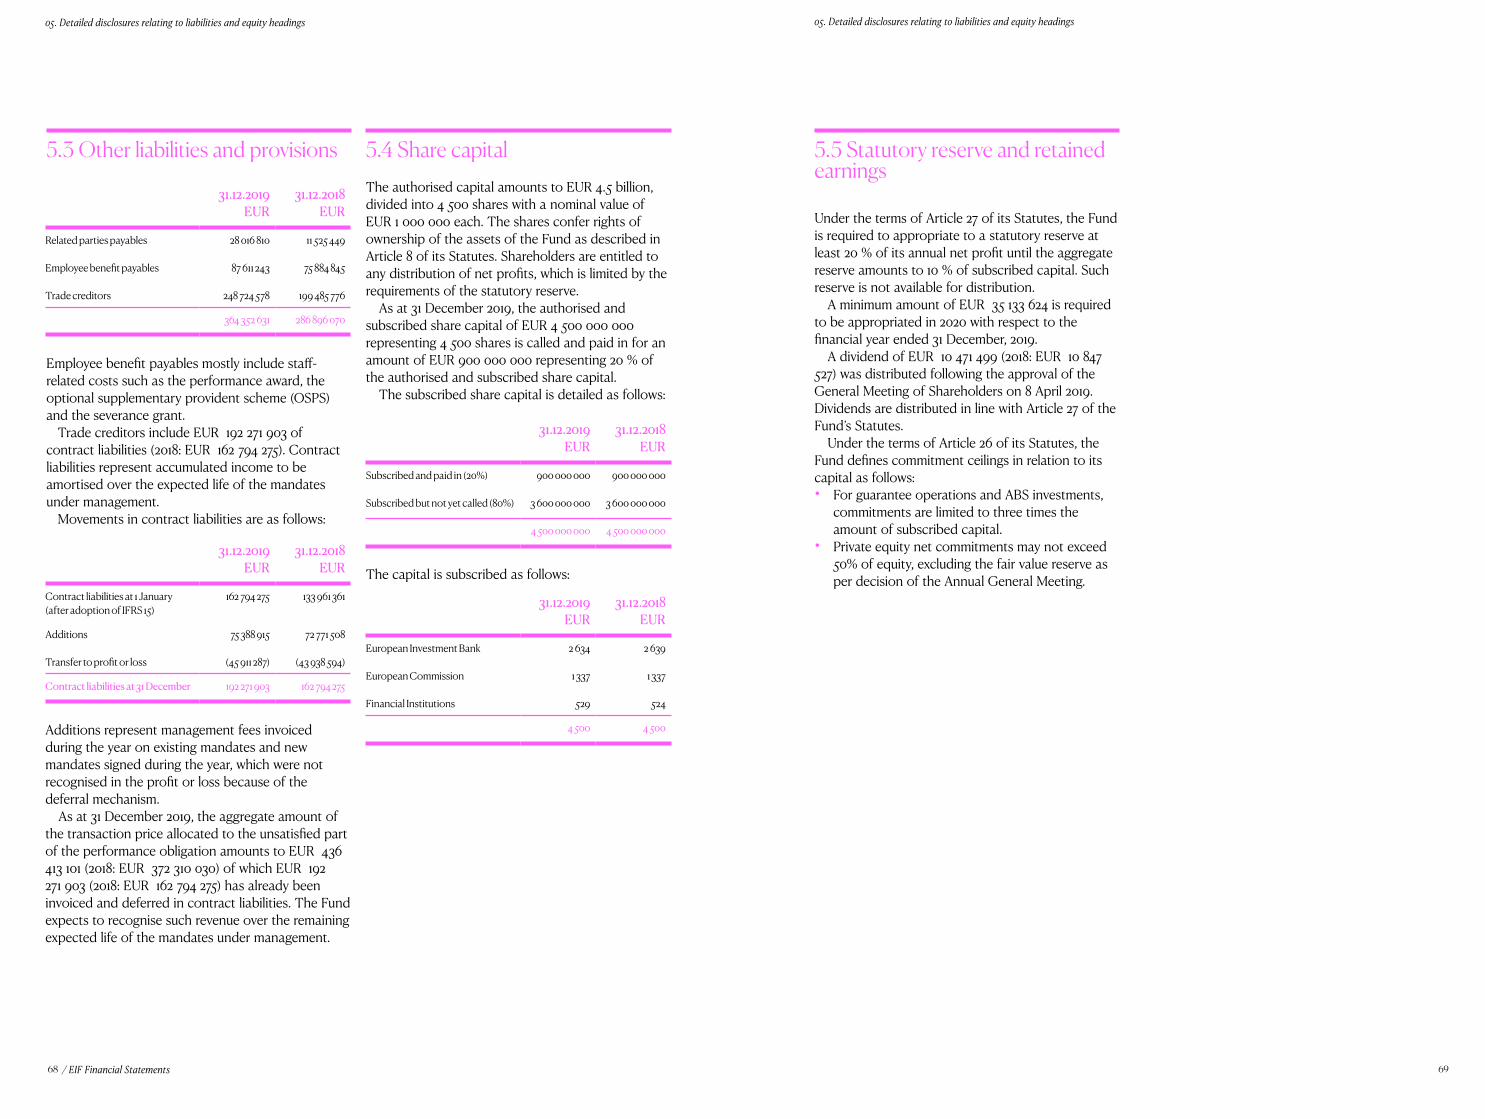
68 69
05. Detailed disclosures relating to liabilities and equity headings 05. Detailed disclosures relating to liabilities and equity headings
/ EIF Financial Statements
Additions represent management fees invoiced during the year on existing mandates and new mandates signed during the year, which were not recognised in the profit or loss because of the deferral mechanism.
As at 31 December 2019, the aggregate amount of the transaction price allocated to the unsatisfied part of the performance obligation amounts to EUR 436 413 101 (2018: EUR 372 310 030) of which EUR 192 271 903 (2018: EUR 162 794 275) has already been invoiced and deferred in contract liabilities. The Fund expects to recognise such revenue over the remaining expected life of the mandates under management.
5.3 Other liabilities and provisions
Employee benefit payables mostly include staff-related costs such as the performance award, the optional supplementary provident scheme (OSPS) and the severance grant.
Trade creditors include EUR 192 271 903 of contract liabilities (2018: EUR 162 794 275). Contract liabilities represent accumulated income to be amortised over the expected life of the mandates under management.
Movements in contract liabilities are as follows:
5.4 Share capitalThe authorised capital amounts to EUR 4.5 billion, divided into 4 500 shares with a nominal value of EUR 1 000 000 each. The shares confer rights of ownership of the assets of the Fund as described in Article 8 of its Statutes. Shareholders are entitled to any distribution of net profits, which is limited by the requirements of the statutory reserve.
As at 31 December 2019, the authorised and subscribed share capital of EUR 4 500 000 000 representing 4 500 shares is called and paid in for an amount of EUR 900 000 000 representing 20 % of the authorised and subscribed share capital.
The subscribed share capital is detailed as follows:
5.5 Statutory reserve and retained earnings
Under the terms of Article 27 of its Statutes, the Fund is required to appropriate to a statutory reserve at least 20 % of its annual net profit until the aggregate reserve amounts to 10 % of subscribed capital. Such reserve is not available for distribution.
A minimum amount of EUR 35 133 624 is required to be appropriated in 2020 with respect to the financial year ended 31 December, 2019.
A dividend of EUR 10 471 499 (2018: EUR 10 847 527) was distributed following the approval of the General Meeting of Shareholders on 8 April 2019. Dividends are distributed in line with Article 27 of the Fund’s Statutes.
Under the terms of Article 26 of its Statutes, the Fund defines commitment ceilings in relation to its capital as follows:• For guarantee operations and ABS investments,
commitments are limited to three times the amount of subscribed capital.
• Private equity net commitments may not exceed 50% of equity, excluding the fair value reserve as per decision of the Annual General Meeting.
31.12.2019EUR
31.12.2018 EUR
Related parties payables 28 016 810 11 525 449
Employee benefit payables 87 611 243 75 884 845
Trade creditors 248 724 578 199 485 776
364 352 631 286 896 070
31.12.2019EUR
31.12.2018 EUR
Contract liabilities at 1 January (after adoption of IFRS 15)
162 794 275 133 961 361
Additions 75 388 915 72 771 508
Transfer to profit or loss (45 911 287) (43 938 594)
Contract liabilities at 31 December 192 271 903 162 794 275
31.12.2019EUR
31.12.2018 EUR
Subscribed and paid in (20%) 900 000 000 900 000 000
Subscribed but not yet called (80%) 3 600 000 000 3 600 000 000
4 500 000 000 4 500 000 000
31.12.2019EUR
31.12.2018 EUR
European Investment Bank 2 634 2 639
European Commission 1 337 1 337
Financial Institutions 529 524
4 500 4 500
The capital is subscribed as follows:
71
06. Interest in unconsolidated structured entities and in investment entities
70 / EIF Financial Statements
06. Interest in unconsolidated structured entities and in investment entities
The EIF has interests in entities that have been designed so that voting or similar rights are not the dominant factor in deciding who controls the entity, such as when any voting rights relate to administrative tasks only, or when the relevant activities are directed by means of contractual arrangements. The Fund has interests in unconsolidated structured entities as described below.
Structured entities are used either to meet statutory obligations or to provide mandators with access to EIF expertise in relation to its primary activities. Structured entities or investment entities may be established as corporations, trusts or partnerships. Structured entities or investment entities generally:• subscribe to equity issued by SMEs in the context
of private equity transactions; or• issue debt securities guaranteed either directly by
the Fund or by a structured entity managed by the EIF on behalf of a mandator.
The table below describes the types of structured entities in which the EIF concluded that the Fund has an interest and no control:
• In the context of a bilateral guaranteeUnder this type of financial guarantee, even if the Fund provides a bilateral guarantee for the benefit of the holder of the mezzanine/senior notes, the Fund is not a direct party to the securitisation transactions agreement to benefit from the operation. The Fund enters into a financial guarantee agreement directly with the beneficiary, which is typically the beneficiary of the securitisation transaction agreement. Through the financial guarantee agreement, the Fund has no negotiating power and no voting rights within the structure and the role of the Fund is to guarantee one of the tranches of a more global transaction.
In the context of such transactions, an SPV could be established to initially purchase a pool of receivables from the originator and to issue consequently several classes of notes, which will be guaranteed. On the other hand, if no SPV is established, the originator will issue the notes and will retain the pool of receivables.
• In the context of an embedded guaranteeUnder this type of operation and contrary to a bilateral guarantee, an SPV shall be established to issue the notes and to be the owner of the pool of receivables. In such operations, the Fund, as guarantor, will be part of the structure of the transaction and will be part of the agreement without having any control over the SPV.
Maximum loss exposure from guarantee operations structured entities is limited to the total Exposure at Risk as disclosed in note 3.3.
As at December 31, 2019, the Fund is exposed to 81 bilateral guarantees (2018: 72) and to 3 embedded guarantees (2018: 3), which represent respectively EUR 10 704m (2018: EUR 8 495m) and EUR 20m (2018: EUR 41m) of the EIF’s guarantees in terms of Exposure at Risk.
For more quantitative details on the guarantee portfolio, please refer to note 3.3.
6.1 Interest in structured entities in relation to Private Equity operations
Operations are typically structured as follows:• An investment fund is setup with a General
Partner (hereafter “GP”) and with a number of Limited Partners (hereafter “LPs”), who form together the Limited Partnership. In addition, the Limited Partnership Agreement discloses the investment strategy foreseen within the entity and agreed between the GP and the LPs;
• When financing is brought by the LPs, full authority and power is given to the GP, which could delegate the investment part to an investment manager;
• The use of voting rights by the LPs is often foreseen to revocate the GP either with a cause or without cause. Even if an investment board within the entity is setup, it should be noted that such an investment board has a consultative role only and is not therefore one of the decision-making bodies of the Limited Partnership.
The Fund is an LP, it does not act as a GP and is from time to time a member of the consultative investment board. The Fund’s interest typically ranges from 0.1% to 50%.
Maximum loss exposure from PE structured entities is limited to the amount of committed investment as disclosed in note 3.2.
For more quantitative details on PE operations, please refer to note 3.2.
6.2 Interest in structured entities in relation to financial guarantee operations
When the Fund enters into a securitisation transaction in the context of its activity of financial guarantee provided to the European financial institutions, the Fund could be exposed to a special purpose vehicle (hereafter “SPV”) as follows:
Below is a description of the Fund’s involvement in unconsolidated structured entities by type. The Fund concluded that it does not control and therefore should not consolidate any entity described in sections 6.1, 6.2, 6.3, 6.4 and 6.5 as the Fund does not have power over the relevant activities of the entities.
Type of structured entity Nature and purpose Interest held by the Fund
Limited Partnership in relation to PE operations (see section 6.1)
Acquisition, holding, managing and disposal of participations in any enterprise subject to the conditions laid down in paragraph 2 (i) of Article 12 of the EIF Statutes
• Investments in shares issued by the Limited Partnership• Capital and revenues repayments
Special Purpose Vehicles (“SPV”) in relation to financial guarantee operations (see section 6.2)
Provision of guarantees as well as of other comparable instruments for loans and other financial obligations in whatever form
• Fees for financial guarantee servicing
Special Purpose Vehicles (“SPV”) in relation to ABS investments (see section 6.3)
Acquisition of ABS investments • Interest income from ABS investments
Mandates in relation to management of facilities by the Fund on behalf of a mandator (see section 6.4 and section 6.5)
To deploy the resources allocated to the mandate by any Managing Authority and according to each individual agreement and to the EIF expertise
• Fees for mandates servicing
72 73
06. Interest in unconsolidated structured entities and in investment entities 06. Interest in unconsolidated structured entities and in investment entities
/ EIF Financial Statements
6.3 Interest in structured entities in relation to ABS investments
When the Fund enters into a securitisation backed by SME financing, the Fund could be exposed to an SPV, which may be established to issue the ABS investment. In such operations, the Fund will make a direct investment in the ABS issued out by the SPV.
As at December 31, 2019, the Fund invested in 9 ABS investments issued by SPVs (2018: 9) for a total amount of EUR 252.1m, which are classified into the caption “Debt investments at fair value through profit or loss” (2018: 200.4m).
For more quantitative details on ABS investments, please refer to note 3.4.
6.4 Interest in structured entities in relation to management of facilities by the Fund on behalf of a mandator
The Fund acts as an integrated operational platform for SME finance, deploying resources mandated for management by its related parties (EIB and EC see note 8.1 and 8.2, respectively) and other third parties (public and private entities) depending on the nature of the investment but also in relation to the Fund’s expertise and in compliance with its Statutes. When the Fund manages a facility on behalf of a mandator, the management will be performed by the Fund either through a trusteeship or partnership depending on the requirements of the mandatory, which have been classified as follows:• The EIB, which means EIB resources is managed
by the Fund according to a defined scope;• The European Commission, which means
European Commission contributions managed by the Fund according to the financial regulation and to dedicated agreements;
• Other third parties: the Fund has sought to further enhance its market impact by establishing joint investment facilities with public and private entities through trust accounts and country, multi-country or sector-specific funds-of-funds.
The EIF is entrusted with the management of the funds, operating under clear rules defined in an agreement, investing in entities whose maximum risk is defined in the agreement and performing the treasury asset management under guidelines defined in the agreement. The Fund is remunerated for its services through management fees (or on a cost recovery basis for some mandates) which are defined upfront in the agreement. In that context, the Fund classifies the mandates as follows and according to the nature of financial instruments foreseen under each individual agreement:
(1) “Resources” means the net amount of the contribution already paid by the mandator to the Fund or the amount committed to be paid by the mandator.(2) “Committed transactions” corresponds to the transactions committed by the Fund for the purpose of managing the mandate on behalf of the mandator.
Mandator Nature and purposeof the structured entity
Interest heldby the Fund
Resources Committedtransactions
Services offered in the context of financial guarantee operations
EuropeanInvestment Bank
On behalf of the mandator and according to the Fund’s expertise:- To originate financial guarantee transactions;- To monitor the financial guarantee transactions;- To report to the mandator accordingly.
Management fees for servicing
843 988 000 385 847 646
EuropeanCommission
5 90 7 442 245 5 180 655 986
Other thirdparties
2 290 549 530 1 581 046 457
Services offered in the context of private equity operations
EuropeanInvestment Bank
On behalf of the mandator andaccording to the Fund’s expertise:- To originate private equitytransactions;- To monitor the private equitytransactions;- To report to the mandatoraccordingly.
Managementfees for servicing
12 873 160 000 14 793 379 710
EuropeanCommission
4 624 593 499 3 073 844 043
Other thirdparties
3 925 736 979 2 969 210 276
Services offered in the context of microfinance operations
EuropeanInvestment Bank
On behalf of the mandator andaccording to the Fund’s expertise:- To originate microfinancetransactions;- To monitor the private equitytransactions;- To report to the mandatoraccordingly.
Managementfees for servicing
185 535 000 125 400 000
EuropeanCommission
26 000 000 17 662 218
Other thirdparties
0 0
Services offered in the context of multi-products structured entities
EuropeanCommission
On behalf of the mandator andaccording to the Fund’s expertise:- To originate multi productstransactions;- To monitor the multi productstransactions;- To report to the mandatoraccordingly.
Managementfees for servicing
157 666 328 0
Otherthird party
On behalf of the mandator andaccording to the Fund’s expertise:- To originate multi productstransactions;- To monitor the multi productstransactions;- To report to the mandatoraccordingly.
Managementfees for servicing
1 104 581 605 964 270 454
74 75
06. Interest in unconsolidated structured entities and in investment entities 06. Interest in unconsolidated structured entities and in investment entities
/ EIF Financial Statements
6.5 Interest in investment entities in relation to management of facilities by the Fund on behalf of a mandator
Under certain circumstances and depending on the requirements of a mandatory, the EIF could establish a legal entity from which the EIF will act as an integrated operational platform for SME finance, deploying resources mandated for management by its related parties and other third parties.
The EIF is entrusted with the management of the funds, operating under clear rules defined in an agreement, investing in entities whose maximum risk is defined in the agreement and performing the treasury asset management under guidelines defined in the agreement. The Fund is remunerated for its services through management fees (or on a cost recovery basis for some mandates) which are defined upfront in the agreement. In that context, the Fund classifies the mandates as follows and according to the nature of financial instruments foreseen under each individual agreement:
(1) “Resources” means the net amount of contribution already paid by the mandator to the Fund or the amount committed to be paid by the mandator.(2) “Committed transactions” corresponds to the transactions committed by the Fund for the purpose of managing the mandate on behalf of the mandator.
As at 31 December 2019, total assets under management defined as the initial resources and contributions allocated to each mandate amounts to EUR 34.96 billion (2018 restated: EUR 32.27 billion).
Mandator Country Nature and purposeof the structured entity
Interestheld bythe Fund
Resources(1) Committedtransactions
EuropeanInvestment Bank
Multicountry witha focus on EuropeanMicrofinance
On behalf of themandator and accordingto the Fund’s expertise:
- To act as investment adviser and to propose private equity transaction for the approval of governing bodies of the fund of funds;
- To originate private equity transactions;
- To monitor the private equity transactions;
- To report to the mandator accordingly.
Managementfees for servicing
210 000 000 82 096 915
EuropeanCommission
Multicountry with a focus on Global Energy Efficiency and Renewable Energy Fund
465 679 409 255 216 754
Other thirdparties
Portugal 111 330 000 102 319 018
Spain 183 000 000 174 288 389
The Netherlands 402 500 000 387 000 000
The United Kingdom 235 072 879 230 391 190
Turkey 360 000 000 332 102 417
Multi-country 1 057 136 789 588 541 817
76 77
07.Detailed disclosures related to the statement of comprehensive income
/ EIF Financial Statements
07. Detailed disclosures related to the statement of comprehensive income
7.1 Interest and similar incomeInterest and similar income comprises:
Interest income on debt securities include discounts of EUR 529 592 (2018: EUR 486 676) and premiums amount to EUR (4 898 163) (2018: EUR (7 529 148).
7.2 Net result from financial guarantee operations
Net result from guarantee operations comprises:
7.3 Commission incomeCommission income is detailed as follows:
Commission income include EUR 45 911 287 (2018: EUR 43 938 594), which was previously recognised in contract liabilities. See note 5.3.
7.4 Net result on financial operations
Net result on financial operations comprises EUR (2 681 258) of realised losses on the disposal of private equity investments following the completion of a Sale Purchase Agreement (2018: gain of EUR 739 441). Additional details of the secondary sale transaction are given in note 4.3.1 and additional details on the remaining amount to be received from the buyer on note 4.4.
Net result on financial operations also includes unrealised results arising from transactions or cash positions denominated in currency for a total of EUR 4 089 966 (2018: EUR 575 879).
In 2018, net result on financial operations included EUR 63 815 of realised loss on debt investments at amortised cost. See note 4.2.1.
7.5 Other operating income
Other operating income includes mainly attendance fees and commitment fees.
7.6 General administrative expenses
The number of persons employed at the year-end, including 1 EIF secondee to EIB (2018: 1), is as follows:
The Fund has identified members of the Board of Directors, members of the Audit Board and members of the EIF Management as key management personnel.
Key management compensation for the period is disclosed as follows:
(1) Short-term employee benefits comprise salaries and allowances, performance awards and social security contributions of key management personnel(2) Post employment benefits comprise pensions and expenses for post employment health insurance paid to key management personnel
2019EUR
2018EUR
Interest income on debt investments 13 385 934 15 955 766
Interest income on money market instruments 306 277 324 255
Interest income on bank current accounts 330 868 555 334
Other interest income 5 282 813 5 083 618
19 305 892 21 918 973
2019EUR
2018EUR
Amortisation of the payer leg 55 562 593 65 244 143
Intermediation and risk cover fees 6 948 726 439
Guarantee calls net of recoveries (284 183) (226 242)
55 285 358 65 744 340
2019EUR
2018EUR
Commissions on EIB mandates 66 499 888 62 911 631
Commissions on EC mandates 37 196 662 39 418 084
Commissions on Regional and Funds of Funds mandates 56 722 558 46 520 583
Other commissions 41 594 145 960
160 460 702 148 996 258
2019 2018
Chief Executive/Deputy Chief Executive
2 2
Employees 526 487
528 489
2019 2018
Short-term benefits (1) 2 753 428 3 184 308
Post employment benefits (2) 433 119 455 250
3 186 547 3 639 558
Other administrative expenses include contributions under the service level agreement with the EIB for the use of office space amounting to EUR 12 580 748 (2018: EUR 11 949 023).
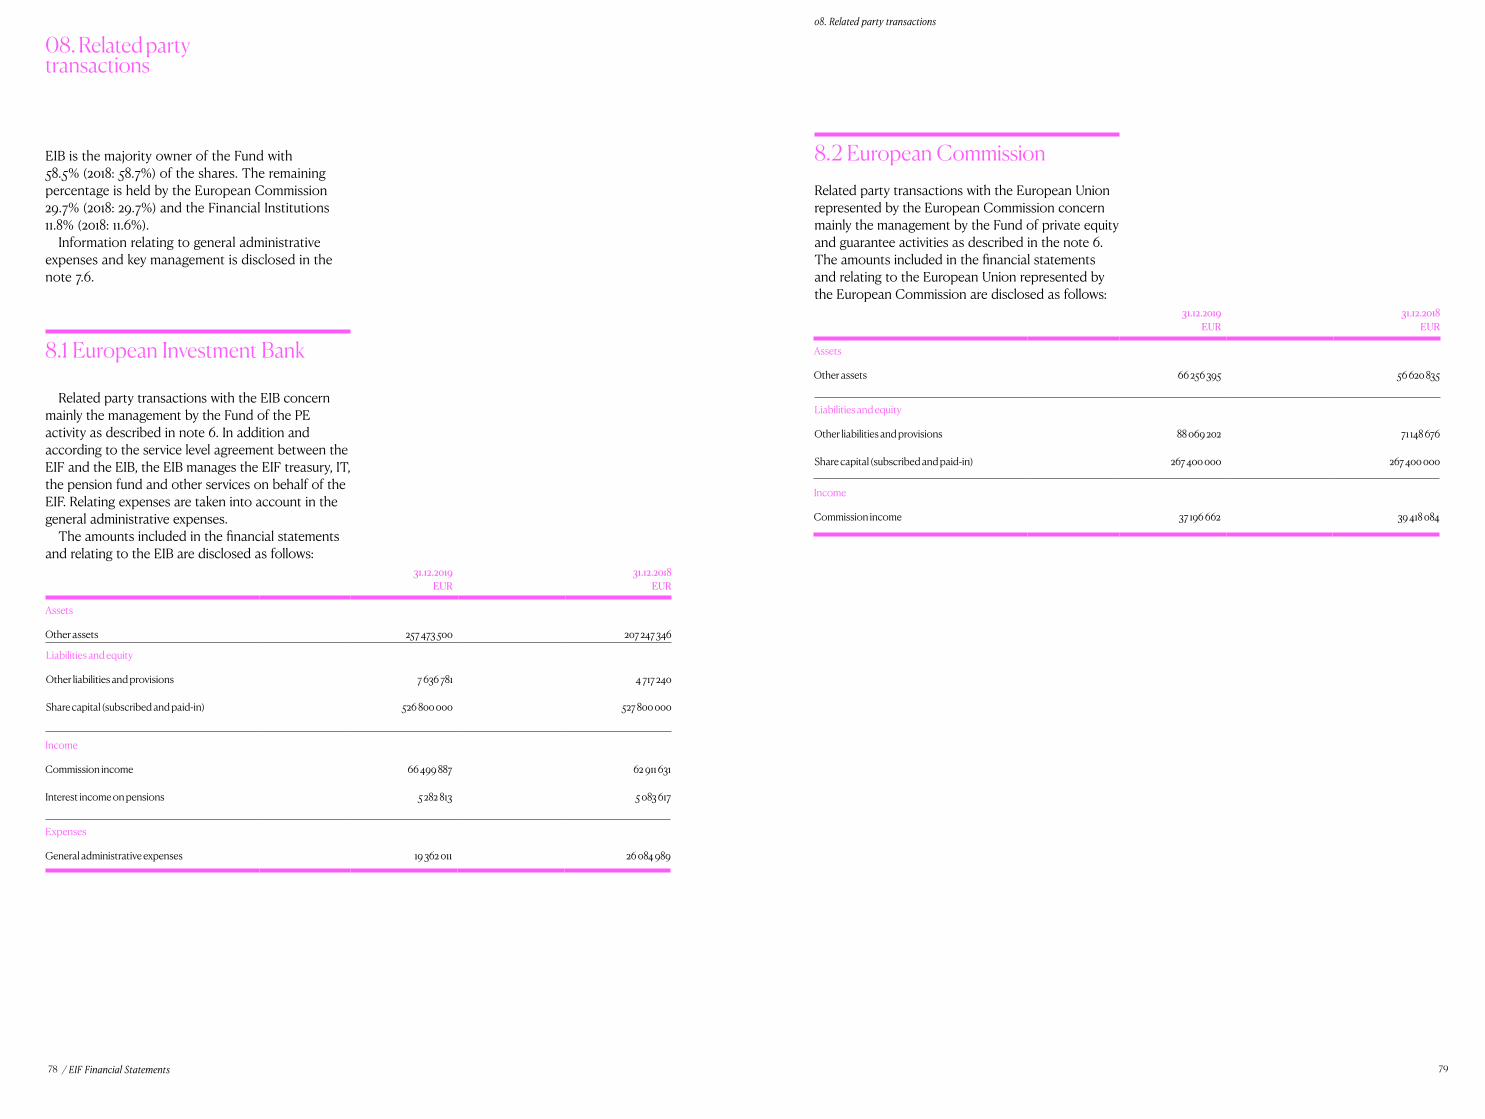
7978 / EIF Financial Statements
08. Related party transactions
08. Related party transactions
EIB is the majority owner of the Fund with 58.5% (2018: 58.7%) of the shares. The remaining percentage is held by the European Commission 29.7% (2018: 29.7%) and the Financial Institutions 11.8% (2018: 11.6%).
Information relating to general administrative expenses and key management is disclosed in the note 7.6.
8.1 European Investment Bank
Related party transactions with the EIB concern mainly the management by the Fund of the PE activity as described in note 6. In addition and according to the service level agreement between the EIF and the EIB, the EIB manages the EIF treasury, IT, the pension fund and other services on behalf of the EIF. Relating expenses are taken into account in the general administrative expenses.
The amounts included in the financial statements and relating to the EIB are disclosed as follows:
8.2 European CommissionRelated party transactions with the European Union represented by the European Commission concern mainly the management by the Fund of private equity and guarantee activities as described in the note 6. The amounts included in the financial statements and relating to the European Union represented by the European Commission are disclosed as follows:
31.12.2019EUR
31.12.2018EUR
Assets
Other assets 257 473 500 207 247 346
Liabilities and equity
Other liabilities and provisions
Share capital (subscribed and paid-in)
7 636 781
526 800 000
4 717 240
527 800 000
Income
Commission income
Interest income on pensions
Expenses
General administrative expenses 19 362 011 26 084 989
66 499 887
5 282 813
62 911 631
5 083 617
31.12.2019EUR
31.12.2018EUR
Assets
Other assets 66 256 395 56 620 835
Liabilities and equity
Other liabilities and provisions
Share capital (subscribed and paid-in)
88 069 202
267 400 000
71 148 676
267 400 000
Income
Commission income 37 196 662 39 418 084

80 / EIF Financial Statements
09. Taxation
The Protocol on the Privileges and Immunities of the European Union, appended to the Treaty on the Functioning of the European Union, applies to the Fund, which means that the assets, revenues and other property of the Fund are exempt from all direct and indirect taxes.

82 83/ EIF Financial Statements
European Investment Fund37b, avenue J. F KennedyL-2968 LuxembourgPhone +352 2485-1Fax +352 2485 [email protected]
EIFBucharest, Istanbul, Madrid,
Europe Direct is a service
to your questions aboutthe European Union.
Freephone: 00 800 67 89 10 11
Additional informationis also available on the internet:http://europa.eu
Numbers in the EIF Annual Report are correct as at 31 December 2019 and any
the text apply to the same period unless otherwise stated.
SME outreach and employment including the estimated numbers and sustained jobs are indicative only and are based on reports received from
1 October 2018 and 30 September 2019. EIF assumes no liability for the accuracy thereof.The EIF shall not be held responsible for the use that might be made with the information contained herein. Reproduction is authorised provided the source is acknowledged. For any use or reproduction of photos or other material that is not under the EIF’s copyright, permission must be sought directly from the copyright holders.
DisclaimerContacts and References
Creative direction blossoming.it
Design and layoutblossoming.it
IllustrationsSimon Landrein
Typefaces Canela Display and Text by Commercial Type
CatalogueQY-AA-20-001-EN-N
ISBN 978-92-861-4685-5ISSN 2363-4103DOI 10.2868/8335
Production
© European Investment Fund, 2020.

Related Documents