EIDES 2019 The European Index of Digital Entrepreneurship Systems Erkko Autio, László Szerb, Éva Komlósi and Mónika Tiszberger Editors: Fiammetta Rossetti, Daniel Nepelski, and Vincent Van Roy EUR 29892 EN

Welcome message from author
This document is posted to help you gain knowledge. Please leave a comment to let me know what you think about it! Share it to your friends and learn new things together.
Transcript
EIDES 2019
The European Index of Digital Entrepreneurship Systems
Erkko Autio, László Szerb, Éva Komlósi
and Mónika Tiszberger
Editors: Fiammetta Rossetti, Daniel
Nepelski, and Vincent Van Roy
EUR 29892 EN
This publication is a Technical report by the Joint Research Centre (JRC), the European Commission’s science
and knowledge service. It aims to provide evidence-based scientific support to the European policymaking pro-
cess. The scientific output expressed does not imply a policy position of the European Commission. Neither the
European Commission nor any person acting on behalf of the Commission is responsible for the use that might
be made of this publication. For information on the methodology and quality underlying the data used in this
publication for which the source is neither Eurostat nor other Commission services, users should contact the
referenced source. The designations employed and the presentation of material on the maps do not imply the
expression of any opinion whatsoever on the part of the European Union concerning the legal status of any
country, territory, city or area or of its authorities, or concerning the delimitation of its frontiers or boundaries.
EU Science Hub
https://ec.europa.eu/jrc
JRC117495
EUR 29892 EN
PDF ISBN 978-92-76-12269-2 ISSN 1831-9424 doi:10.2760/107900
Luxembourg: Publications Office of the European Union, 2019
© European Union, 2019
The reuse policy of the European Commission is implemented by the Commission Decision 2011/833/EU of 12
December 2011 on the reuse of Commission documents (OJ L 330, 14.12.2011, p. 39). Except otherwise noted,
the reuse of this document is authorised under the Creative Commons Attribution 4.0 International (CC BY 4.0)
licence (https://creativecommons.org/licenses/by/4.0/). This means that reuse is allowed provided appropriate
credit is given and any changes are indicated. For any use or reproduction of photos or other material that is
not owned by the EU, permission must be sought directly from the copyright holders.
All content © European Union 2019
How to cite this report: Autio, E., Szerb, L., Komlósi, E.and Tiszberger, M., EIDES 2019 - The European Index of
Digital Entrepreneurship Systems, EUR 29892 EN, Publications Office of the European Union, Luxembourg,
2019, ISBN 978-92-76-12269-2, doi:10.2760/107900, JRC117495.
3
Contents
Foreword .............................................................................................................. 5
Executive Summary ............................................................................................... 6
1 Introduction ...................................................................................................... 8
2 Measuring Entrepreneurship: Challenges and Solutions .......................................... 9
3 The Digital Context of Entrepreneurial Activity..................................................... 12
4 EIDES Methodology ......................................................................................... 14
4.1 Conceptual Grounding ................................................................................ 14
4.2 Index Structure ......................................................................................... 14
4.3 Index Operationalisation ............................................................................. 17
4.4 Variable Content of EIDES 2019 .................................................................. 20
4.4.1 General Framework Conditions ............................................................ 20
4.4.2 Systemic Framework Conditions .......................................................... 23
5 EIDES Results ................................................................................................. 29
5.1 Country Rankings ...................................................................................... 29
5.2 Comparison Between EIDES and Other Measures of Country-Level
Entrepreneurship ............................................................................................. 35
6 Country Pages ................................................................................................. 39
6.1 Country Page Guide ................................................................................... 39
6.2 Country Profiles ......................................................................................... 41
6.2.1 Austria ............................................................................................. 41
6.2.2 Belgium ............................................................................................ 43
6.2.3 Bulgaria ............................................................................................ 45
6.2.4 Croatia ............................................................................................. 47
6.2.5 Cyprus ............................................................................................. 49
6.2.6 Czech Republic .................................................................................. 51
6.2.7 Denmark .......................................................................................... 53
6.2.8 Estonia ............................................................................................. 55
6.2.9 Finland ............................................................................................. 57
6.2.10 France .............................................................................................. 59
6.2.11 Germany .......................................................................................... 61
6.2.12 Greece ............................................................................................. 63
6.2.13 Hungary ........................................................................................... 65
6.2.14 Ireland ............................................................................................. 67
6.2.15 Italy ................................................................................................. 69
6.2.16 Latvia ............................................................................................... 71
6.2.17 Lithuania .......................................................................................... 73
6.2.18 Luxembourg ...................................................................................... 75
4
6.2.19 Malta ................................................................................................ 77
6.2.20 Netherlands ...................................................................................... 79
6.2.21 Poland .............................................................................................. 81
6.2.22 Portugal............................................................................................ 83
6.2.23 Romania ........................................................................................... 85
6.2.24 Slovakia ........................................................................................... 87
6.2.25 Slovenia ........................................................................................... 89
6.2.26 Spain ............................................................................................... 91
6.2.27 Sweden ............................................................................................ 93
6.2.28 United Kingdom ................................................................................. 95
7 Entrepreneurial Ecosystems: Policy Challenges and Approaches ............................ 97
7.1 National and Regional Dimensions of the Policy Challenge ............................... 97
7.2 Recommended Use of EIDES Data in Entrepreneurial Ecosystem Policy Design 100
7.3 Entrepreneurial Ecosystems and Digitalisation: General Policy Recommendations .
............................................................................................................. 100
References ....................................................................................................... 102
List of Figures ................................................................................................... 104
List of Tables .................................................................................................... 105
Annexes ........................................................................................................... 108
Annex 1. Calculation of the EIDES Scores ......................................................... 108
Annex 2 Robustness Analyses of the EIDES and Its Components ......................... 115
Annex 3. Structure and Description of EIDES Components .................................. 123

5
Foreword
This report is prepared in the context of the three-year research project on Research on
Innovation, Start-up Europe and Standardisation (RISES), jointly launched in 2017 by
JRC and DG CONNECT of the European Commission. The JRC provides evidence-based
support to policies in the domain of digital innovation and start-ups. In particular:
Innovation with the focus on maximising the innovation output of EC funded re-
search projects, notably building on the Innovation Radar;
Start-ups and scale-ups – providing support to Start-up Europe; and
Standardisation and IPR policy aims under the Digital Single Market priorities.
This research builds on the work and expertise gathered within the EURIPIDIS project. It
is part of the long-standing collaboration between the JRC and DG CONNECT in the do-
main of digital innovation and start-ups.
6
Executive Summary
Digitalisation continues to shape both the nature and location of entrepreneurial opportu-
nities as well as effective practices to pursue them. This development has prompted the
global adoption of new organisational innovations to support entrepreneurial opportunity
pursuit, such as new venture accelerators, crowdfunding sites, co-working spaces, and
entrepreneurship academies. We have witnessed the emergence of a new type of region-
al agglomeration of economic activity: the entrepreneurial ecosystem1. This digital
entrepreneurial transformation of the economy creates important challenges for policy.
To unlock the productivity potential of digital entrepreneurs and thus advance progress
towards a Digital Economy, policy-makers need data that describe the framework condi-
tions for digitally enhanced entrepreneurship in their countries.
The European Index of Digital Entrepreneurship Systems (EIDES) responds to this
policy challenge. The EIDES monitors three kinds of framework conditions in the 28 EU
Member States that define how well each EU country supports the digital entrepreneurial
dynamic. First, general framework conditions describe the general context of doing
business in each country. Second, systemic framework conditions directly connect
with entrepreneurial stand-up, start-up and scale-up. Third, digital framework condi-
tions describe the general level of digitalisation of the economy, as it pertains to entre-
preneurial activity through its impact on general and systemic framework conditions.
In the EIDES structure, the general framework conditions apply broadly to entrepreneur-
ship, while the systemic framework conditions differ across three stages of the
entrepreneurial dynamic: stand-up, start-up, and scale-up. The stand-up stage
relates to the self-selection of individuals into entrepreneurship. The start-up stage is the
subsequent creation of new start-ups. The scale-up stage concerns the scaling up of the
start-ups that have discovered a business model with promising growth potential. Ac-
cordingly, the EIDES includes three sub-indices for each systemic framework conditions
plus their digital versions calculated with measures of the corresponding digital contexts.
The EIDES is a systemic framework index: it describes the context within which the
country’s entrepreneurial dynamic is embedded and which regulates the quality of this
dynamic – i.e., its ability to allocate human, knowledge, financial, and physical capital to
productive uses. This systemic aspect is built into the EIDES methodology: in the index,
the various components of the system (i.e., the framework conditions) are thought to
work as a system to collectively generate the system outputs. This implies that weak
system components may operate as bottlenecks that constrain the system’s ability to
create systemic outputs. The EIDES operationalises the notion of 'Penalty for Bottleneck',
which ‘penalises’ individual index pillars, if some pillars are considerably weaker than
others they act as bottlenecks that hold back the system performance.
The 2019 EIDES release is the second EIDES edition. The 2019 EIDES structure has been
adjusted in response to changes in data availability. While the names of the sub-indices
and individual index pillars have not changed, their variables and indicator composition is
different with respect to the 2018 EIDES edition (see Chapter 4 for details) (Autio et al
2018c). For comparability, this report also includes the 2018 EIDES scores recalculated
with the new 2019 EIDES structure. According to the recalculated 2018 EIDES, from
2018 to 2019 the average index scores increased from 45,5 to 48,0 signalling a 5,6%
overall improvement in the digitally enhanced framework conditions for entrepreneurship
in the EU28 countries.
According to 2019 EIDES ranking, Sweden, Denmark, Netherlands, the United
Kingdom, Finland, Germany, and Luxembourg are the EU leaders in terms of
their digitally enhanced general and systemic framework conditions for entre-
preneurship. Comparing with the 2018 EIDES, the Leader group accounts for the same
1 An entrepreneurial ecosystem is a regional community of entrepreneurs, advisors, accelerators, and other
stakeholders and specialised resources who support entrepreneurial stand-up, start-up, and scale-up and entrepreneurial opportunity pursuit through digitally enhanced business models.
7
countries. However, Denmark lost the first place while Sweden gained it. Finland climbed
two places, from seventh to fifth. Sweden ranks first for both start-up and scale-up sub-
indices and second for the stand-up sub-index. Denmark ranks first for the stand-up
sub-index, while secondand third for the scale-up and start-up sub-indices. Netherlands
ranks third for both stand-up and scale-up sub-indices but fifth for start-up sub-index.
Behind the Leader group, with a notable gap, there is the Follower group, composed of
seven countries: Ireland, Belgium, Austria, Estonia, France, Malta, and Spain. A
third cluster, the group of Cathers-up, is composed of the Czech Republic, Lithuania,
Slovenia, Portugal, Cyprus, and Poland. From this latter group, Portugal, Cyprus, and
Poland moved up from the Laggards group from 2018 to 2019. Finally, the Laggards
group within the 2019 EIDES ranking comprises the remaining eight countries: Italy,
Hungary, Latvia, Slovakia, Croatia, Romania, Greece and Bulgaria. It is stricking
that Italy, one of the G7 countries, is in this group with former centrally planned econo-
mies and Greece.
In most countries, the general and systemic framework conditions tend to per-
form at a similar level. There do not appear to be systematic patterns in terms of the
relative performance of each group of framework conditions. This means that countries
with a lower overall performance may need to invest relatively greater effort to improv-
ing general framework conditions, as these regulate all types of business and can also
significantly hamper regional dynamics (e.g., market conditions and formal institutional
conditions).
The country pages of this report provide an overview of each country’s EIDES data, in-
cluding the policy optimisation simulation. This data and the simulation provide a
good starting point for entrepreneurial ecosystem policy design in different countries. The
bulk of policy attention should be focused at those pillars that are flagged as the more
significant bottlenecks in the policy simulation. In some countries, specific pillars are
flagged as particularly important bottlenecks, whereas in others, policy attention should
focus on two or more pillars. The general objective should be to achieve a good balance
across the index pillars.
Attention should be paid to both digitalised pillar scores and non-digitalised pillar scores.
This also implies the need for coordination between digitalisation policy and entrepre-
neurial ecosystem policy.
The EIDES data should be treated as a starting point that feeds into the ecosystem facili-
tation heuristic as described above and not as the final prescription.
8
1 Introduction
Digitalisation – the reorganisation of business and society around digital technologies and
infrastructures – keeps creating opportunities for entrepreneurs to discover radical new
business models and thus challenge established businesses. A novel form of regional
clustering of entrepreneurial activity, the ‘entrepreneurial ecosystem’, has emerged to
support this discovery process (Autio, Nambisan, Thomas, & Wright, 2018a). Since this
entrepreneurial challenge forces established companies to adopt new and more efficient
business practices, entrepreneurial ecosystems can act as an important mechanism to
unlock the productivity potential of the Digital Economy.
At present, the productivity potential opened up by digitalisation seems almost inexhaus-
tible, as the Moore’s Law shows few signs of slowing down. Intel’s founder Gordon Moore
famously suggested that the amount of computing power that can be purchased for a
given amount of money will keep doubling every 18 months. This trend provides con-
stantly increasing opportunities to boost the wealth-creation potential of the economy in
ways that are socially and environmentally sustainable and allow to spot and appropri-
ately respond to any unintended consequences.
In order to effectively harness the opportunities opened up by digitalisation, EU govern-
ments need information on how well their respective countries are able to support the
entrepreneurial discovery process prompted by digitalisation. Unfortunately, only few
metrics exist specifically designed for this purpose. The EIDES has been designed to ad-
dress this gap and thus help the EU28 governments to design more effective policies to
progress towards the Digital Economy.
The digital entrepreneurial transformation of the economy is a broad systemic phenome-
non that cannot be satisfactorily captured by count-based measures of individual-level
entrepreneurial action. Digitalisation not only shapes opportunities for entrepreneurial
action: it also shapes the context within which that action takes place. It is therefore im-
portant to monitor the general and systemic framework conditions that regulate the en-
trepreneurial discovery process set in motion by digitalisation. This report therefore con-
structs a systemic index that captures both general and systemic framework conditions
for digital stand-ups, start-ups and scale-ups.
The 2019 EIDES index presented in this report is the second of three annual updates of
entrepreneurial conditions for stand-up, start-up, and scale-up activity in the EU28 coun-
tries under the project: JRC/SVQ/ 2017/B.6/0009/NC: “Review and annual updates of
the Entrepreneurship and Scale-up Indices”. This project builds upon an earlier version of
‘Entrepreneurship and Scale-up Indices’ (ESIS), created by the Joint Research Centre of
the European Commission (Van Roy & Nepelski, 2016). In this report we revise and up-
date the 2018 version of the EIDES and provide an updated account of the digital entre-
preneurial framework conditions of the EU28 countries.
We begin by elaborating on the nature and consequences of the process of digitalisation
and on how this trend shapes entrepreneurship. Subsequently, we provide an overview
of the EIDES structure, including the updates to the 2018 version. We then construct the
EIDES and rank the performance of the EU countries with the revised index, and we pro-
vide an update of the 2018 EIDES rankings according to the 2019 EIDES structure. We
conclude by discussing insights and implications for EU digitalisation, innovation, and
entrepreneurship policy.
9
2 Measuring Entrepreneurship: Challenges and Solutions
As more extensively elaborated in the 2018 EIDES report (Autio, Szerb, Komlósi, &
Tiszberger, 2018c), there are many approaches to measuring country-level entrepre-
neurship. The 2018 EIDES report discussed five categories of these: (1) output (count)
measures; (2) attitude measures; (3) framework measures; (4) mixed (weighted)
measures; and (5) entrepreneurial ecosystem measures (Acs, Szerb, & Autio, 2014a;
Bogdanowicz, 2015; Stam, 2018; Van Roy & Nepelski, 2016). We briefly summarise
these below.
Output measures count the incidence of entrepreneurial entries in a given region or
country. These can be, for example, counts of new business registrations (World_Bank,
2011), survey-based self-reports of self-employment (Reynolds, Bosma, & Autio, 2005),
or counts of specific types of start-ups, such as unicorns (Insights, 2017). Whereas sta-
tistics of new business registrations tend to cover all new business registrations while not
necessarily covering genuine start-up activity, survey-based measures tend to create
estimates of more genuine entrepreneurial and self-employment activity based on limited
samples from the underlying population. Both, however, are count measures that track
the outputs of the systemic entrepreneurial dynamic (i.e., new entrepreneurial business-
es), yet seldom provide insight into the processes that generate those outputs.
Attitude measures proxy social norms and attitudes that are thought to regulate entre-
preneurial action through their influence on perceived trade-offs individuals face when
considering entrepreneurial action (Autio, Pathak, & Wennberg, 2013). Examples include
the Eurobarometer survey, which tracks entrepreneurial career preferences, as self-
reported by individuals (Gallup, 2009) and the International Social Survey (ISSP, 1997).
Such measures particularly provide a useful proxy of the early stage of the entrepreneur-
ial dynamic– i.e., the stand-up stage, as this is when individuals decide whether or not to
engage in entrepreneurial activities – and also, a wider reflection of an ‘entrepreneurial
culture’. However, these are not measures of actual entrepreneurial activity, and, for
example, wider institutional conditions in the country may exercise an important influ-
ence on whether and how attitudes give rise to different forms of entrepreneurial action
(Autio & Fu, 2015).
Framework measures profile the context for entrepreneurial activity and tend to cap-
ture formal institutions and tangible structural conditions (e.g., education level of the
population; quality of regulations and entrepreneurship policy interventions; and the
availability of resources for entrepreneurship). Example include World Bank’s ‘Ease of
Doing Business’ index compared national regulatory frameworks for new business entry
(Djankov, La Porta, Lopez-de-Silanes, & Shleifer, 2002), OECD’s Entrepreneurship Indi-
cators Programme (Ahmad & Hoffmann, 2008), and the Nordic Entrepreneurship Monitor
(Nordic_Council, 2010). While framework measures provide useful information on tangi-
ble contextual factors that policy can address, there is usually little information on actual
entrepreneurial activity. Most framework measures also treat each framework component
individually, without considering how the different conditions work together as a system.
This is similar to simply weighing the building materials of a house without considering
how these are assembled together.
Weighted measures combine contextual conditions and entrepreneurial outcomes, thus
mixing output and framework measures. Examples in point include the Global Entrepre-
neurship Index (GEI) and the Regional Entrepreneurship and Development Index (REDI)
(Acs, Szerb, Autio, & Ainsley, 2017; Acs, Autio, & Szerb, 2014b; Szerb, Acs, Autio, Orte-
ga-Argiles, & Komlosi, 2013). These indices are measures of individual-level entrepre-
neurial attitudes, abilities, and activity as weights to adjust the magnitude of contextual
factors, in an attempt to reflect the quality of the entrepreneurial resource allocation dy-
namic in the economy (Acs et al., 2014b). In the GEI index theory, entrepreneurs are
seen as operating a trial-and-error resource allocation dynamic by mobilising resources
to pursue perceived opportunities, whereas contextual conditions moderate the potential
impact of such resource allocations. Combining the two, weighted measures seek to
10
move beyond simply tracking entrepreneurial activity and instead focus on the potential
economic consequences of such activity. On the downside, interpreting the index tends to
grow more challenging with the complexity of the index methodology.
Ecosystem measures are a sub-category of weighted measures and represent the lat-
est evolution in the measurement of entrepreneurship (Stam, 2018; Stangler & Bell-
Masterson, 2015). Examples include the Kauffman Foundation’s entrepreneurial ecosys-
tem initiative (Stangler & Bell-Masterson, 2015) and the GEI Index. The Kauffman Foun-
dation approach focuses on the structural properties and related dynamics of the entre-
preneurial ecosystem in terms of ecosystem density, fluidity, connectivity, and diversity.
The GEI index developed a weighted approach, as described above, and as a third alter-
native approach, Stam (2014, 2018) distinguished between ‘framework conditions’ and
‘systemic conditions’, as well as ‘outputs’ and ‘outcomes’. The EIDES has drawn some
inspiration from each, as we will elaborate later in the method section.
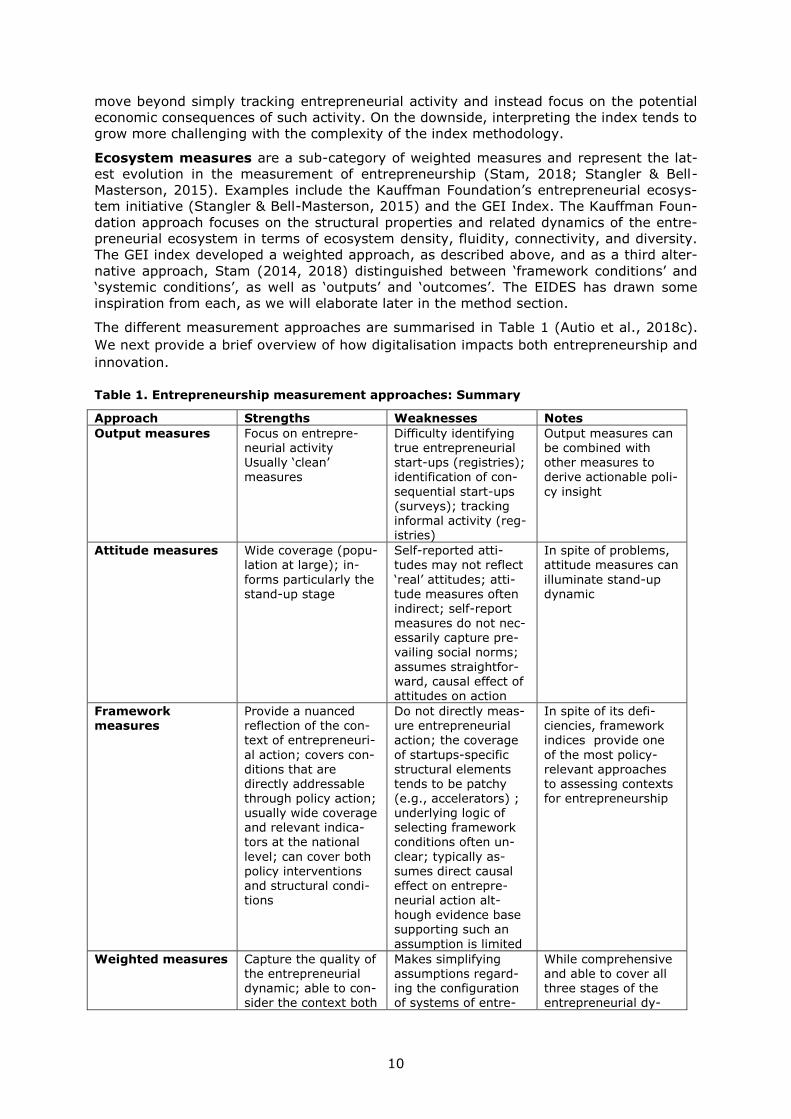
The different measurement approaches are summarised in Table 1 (Autio et al., 2018c).
We next provide a brief overview of how digitalisation impacts both entrepreneurship and
innovation.
Table 1. Entrepreneurship measurement approaches: Summary
Approach Strengths Weaknesses Notes
Output measures Focus on entrepre-neurial activity Usually ‘clean’ measures
Difficulty identifying true entrepreneurial start-ups (registries); identification of con-
sequential start-ups (surveys); tracking informal activity (reg-istries)
Output measures can be combined with other measures to derive actionable poli-
cy insight
Attitude measures Wide coverage (popu-lation at large); in-
forms particularly the stand-up stage
Self-reported atti-tudes may not reflect
‘real’ attitudes; atti-tude measures often indirect; self-report
measures do not nec-essarily capture pre-vailing social norms;
assumes straightfor-ward, causal effect of attitudes on action
In spite of problems, attitude measures can
illuminate stand-up dynamic
Framework measures
Provide a nuanced reflection of the con-text of entrepreneuri-
al action; covers con-ditions that are directly addressable through policy action; usually wide coverage and relevant indica-tors at the national
level; can cover both
policy interventions and structural condi-tions
Do not directly meas-ure entrepreneurial action; the coverage
of startups-specific structural elements tends to be patchy (e.g., accelerators) ; underlying logic of selecting framework conditions often un-
clear; typically as-
sumes direct causal effect on entrepre-neurial action alt-hough evidence base supporting such an
assumption is limited
In spite of its defi-ciencies, framework indices provide one
of the most policy-relevant approaches to assessing contexts for entrepreneurship
Weighted measures Capture the quality of the entrepreneurial dynamic; able to con-sider the context both
Makes simplifying assumptions regard-ing the configuration of systems of entre-
While comprehensive and able to cover all three stages of the entrepreneurial dy-
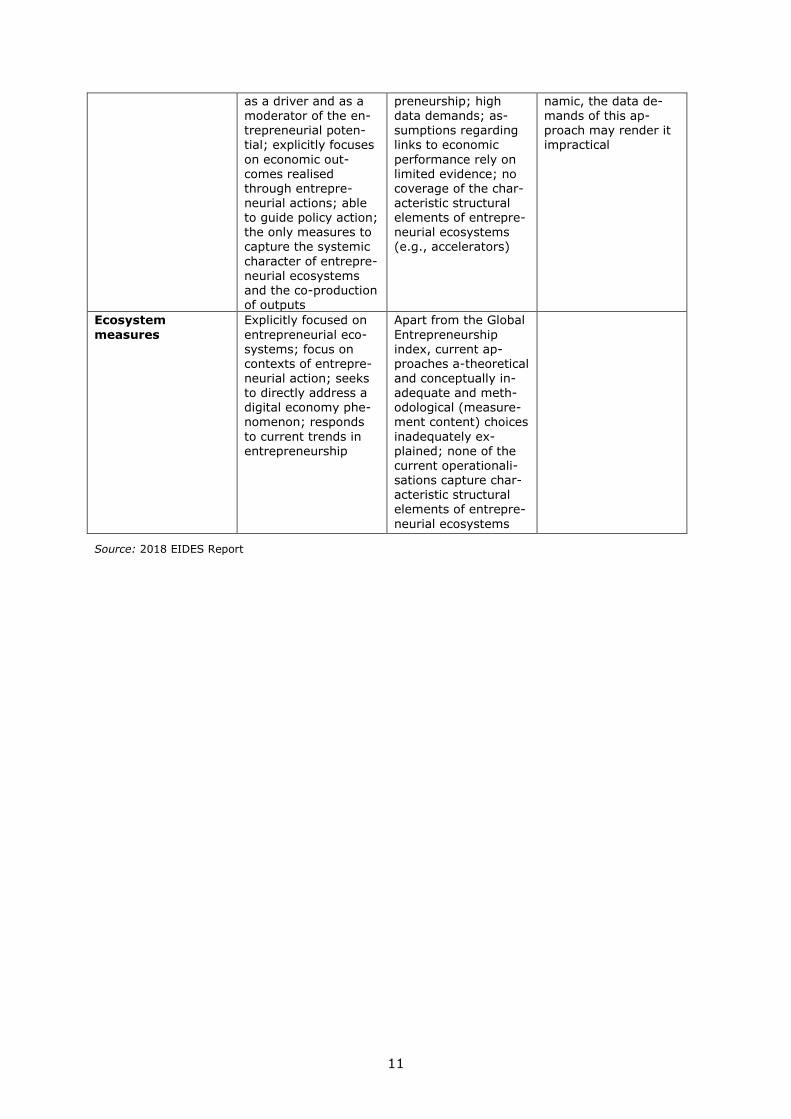
11
as a driver and as a moderator of the en-
trepreneurial poten-tial; explicitly focuses
on economic out-comes realised through entrepre-neurial actions; able to guide policy action; the only measures to capture the systemic
character of entrepre-neurial ecosystems and the co-production of outputs
preneurship; high data demands; as-
sumptions regarding links to economic
performance rely on limited evidence; no coverage of the char-acteristic structural elements of entrepre-neurial ecosystems (e.g., accelerators)
namic, the data de-mands of this ap-
proach may render it impractical
Ecosystem
measures
Explicitly focused on
entrepreneurial eco-systems; focus on contexts of entrepre-
neurial action; seeks to directly address a digital economy phe-nomenon; responds
to current trends in entrepreneurship
Apart from the Global
Entrepreneurship index, current ap-proaches a-theoretical
and conceptually in-adequate and meth-odological (measure-ment content) choices
inadequately ex-plained; none of the current operationali-sations capture char-acteristic structural elements of entrepre-
neurial ecosystems
Source: 2018 EIDES Report
12
3 The Digital Context of Entrepreneurial Activity
Digitalisation is the process by which digital technologies and infrastructures get woven
into the fabric of the economy and society (Autio & Rannikko, 2017; Yoo, Henfridsson, &
Lyytinen, 2010). Two characteristics of digital technologies help explain their trans-
formative impact on innovation and entrepreneurship. First, digital technologies and in-
frastructures are general-purpose technologies: they can be applied in virtually any sec-
tor and to a wide range of functions and activities, potentially transforming these
(Carlsson, 2004). Second, being communication and coordination technologies, digital
technologies and infrastructures open up new ways to organise business operations.
Combined, these two properties make digital technologies and infrastructures a potent
enabler of business model innovation – i.e., the re-think of how businesses organise for
the creation, delivery, and capture of value (Autio, Nambisan, Thomas, & Wright,
2018b).
Digitalisation enables structural change in the economy by enabling either entirely new
functions or by enabling the performance of existing functions in a substantially more
effective, efficient, or different way than before (Autio et al., 2018b; Majchrzak &
Markus, 2013). Actual structural changes can take many forms in specific settings, but
two macro-level outcomes are inevitably driven by digitalisation: (1) horizontalisation of
the economy; and (2) servitisation. Horizontalisation refers to the general break-up of
long, vertical supply chains and partial reorganisation and connectivity of these around
digital platforms. Vertical supply chains are being broken up and flattened through the
introduction of business models that harness the Internet for direct delivery of services to
and interaction with the end user, thereby bypassing supply chain intermediaries such as
downstream distributors. As a case in point, the disruptive business model of low-cost
airlines used the Internet to bypass conventional travel agencies, thus helping minimise
their costs and cutting steps from the downstream value chain. New fintech companies
challenge traditional banks by offering bank account services directly through smart-
phone applications, thereby challenging the business model of traditional banks, which
continue to rely on bank branches for the delivery of some of their services. This is also
referred to as the ‘disintermediation’ effect of the Internet (Jallat & Capek, 2001). As the
other aspect of the horizontalisation process, previously linear supply chains are also be-
ing reorganised digital platforms, for example, with the introduction of business models
that harness digital technologies in novel ways to connect supply and demand. As a case
in point, Airbnb is disrupting the hotel industry by connecting travellers and apartment
owners. As an example of the second macro trend, servitisation, mobility-as-a-service
(MaaS) business models alleviate the need of commuters to own cars and bicycles by
offering access to these as a micro-lease service.
The examples above also illustrate some of the ways entrepreneurial ventures leverage
digitalisation to undercut traditional industry leaders with innovative business models. As
a more general point, the examples also illustrate how entrepreneurs tend to be at the
forefront of the business model discovery process triggered by digitalisation. As noted
earlier, digitalisation keeps creating, at a geometric rate, opportunities to radically re-
think business models. However, the exact nature of these may not be immediately obvi-
ous (although sometimes it is), and many reorganisation opportunities need to be dis-
covered and validated through trial-and-error experimentation. It is this discovery pro-
cess where the role of entrepreneurs is crucial, because new firms are not constrained by
legacy investment in old business models that may be rendered obsolete by digital ad-
vances. In the Airbnb example above, traditional hotel chains were always an unlikely
candidate to discover and launch the apartment mediation model, simply because they
had optimised their operations around a physical asset: the hotel buildings around which
they had built their operation. Similarly, Netflix was able to end the dominance of the
Blockbuster Video in video rental business, not because Blockbuster Video had been blind
to the threat that Netflix’s original DVD rental business model posed, but simply because
its hands were tied by its considerable investment in video rental stores. These could not
13
be dismantled overnight, enabling Netflix an opportunity to scale its business model and
eventually transition its dominance from DVD rental to direct streaming.
It is this digitally enabled business model discovery dynamic that makes entrepreneurial
ventures a central driver of progress towards the Digital Economy and towards unlocking
the productivity potential opened up by digitalisation. It is therefore centrally important
for policy-makers to pay attention to this dynamic and to design effective policies for its
support.
A novel cluster type, the entrepreneurial ecosystem, has emerged during the past decade
or so to support the digitally enhanced business model discovery dynamic (Autio et al.,
2018a; Feld, 2012; Spigel, 2017). Entrepreneurial ecosystems are regional communities
of entrepreneurs, business angels, accelerators, and other stakeholders who specialise in
facilitating business model experimentation and related knowledge spill-over among new
stand-up, start-up, and scale-up ventures. Entrepreneurial ecosystems also facilitate new
ventures’ access to specialised resources to support entrepreneurial start-up and scale-
up. Characteristic structural elements of entrepreneurial ecosystems include, for exam-
ple, new venture accelerators, co-working spaces, specialist financiers, consultants, lean
entrepreneurship coaches, entrepreneurial networks and event organisers. The im-
portance of digitalisation for the entrepreneurial ecosystem phenomenon is highlighted in
the fact that the first modern new venture accelerator, the Y-Combinator, was launched
in Silicon Valley in 2005, only a year after the term: ‘Web 2.0’ was coined – in a web de-
veloper conference also held in Silicon Valley.
The above review suggests one distinctive aspect about entrepreneurial ecosystems as a
novel cluster type that characterises the digital economy2. As reviewed above, in tradi-
tional clusters of the vertical manufacturing economy, the locus of entrepreneurial oppor-
tunities was localised, driven by value chain specialisation, and tended to drive process
innovation: greater output efficiency at the level of the value chain through enhanced
user-producer role specialisation and coordination (Autio & Levie, 2017a). Most
knowledge spill-overs operated vertically, in user-producer relationships. Horizontally
organised digital platforms dominating as sources of opportunity in entrepreneurial eco-
systems, the key source of knowledge spill-overs migrates towards horizontal relation-
ships among non-competing firms. As new ventures in venture accelerators typically do
not compete directly with one another, yet compete with the same means (i.e., radical
business model innovation), they have an incentive to share experiences, as such experi-
ence sharing helps all new ventures become more effective in competing against industry
incumbents. This also means that entrepreneurial ecosystems facilitate not so much line-
ar, technology-push innovation, but rather, business model innovation, which harnesses
digital affordances for the transformation of value processes in the economy (Autio &
Levie, 2017a).
These trends create new challenges for policy. In the digital age, the key policy challenge
becomes facilitating regional entrepreneurial ecosystems and country-level systems of
entrepreneurship instead of focusing on individual SMEs, as is the case in traditional SME
policy (Autio, 2016; Autio & Rannikko, 2016). An ecosystems approach to entrepreneur-
ship policy emphasises the facilitation of entrepreneurial experimentation and business
model discovery – for example, by facilitating interactions among stand-ups and start-
ups to share effective business model practices. Supporting such sharing is typically a
key objective of, say, co-working spaces, new venture accelerators, and corporate accel-
erators. Instead of a siloed, top-down approach aimed at fixing static, easily observable
‘market’ and ‘system’ failures, entrepreneurship policies need to address the entire en-
trepreneurial discovery and resource allocation dynamic that is facilitated by entrepre-
neurial ecosystems (Autio & Levie, 2017b; Autio & Rannikko, 2017). At the national level,
we label this as a ‘systems of entrepreneurship’ approach (Acs et al., 2014b). The EIDES
has been designed to cater to these policy challenges. We next introduce the EIDES
methodology.
2 The entrepreneurial ecosystem phenomenon is in no way limited to advanced economies only. The first
new venture accelerator in Bangalore was opened in 2008, and by 2016, their number had grown to 13.

14
4 EIDES Methodology
4.1 Conceptual Grounding
The underlying EIDES concept draws on the entrepreneurial ecosystem (EE) literature.
Although this is a fresh approach, it also introduces some conceptual ambiguity, given
the (until recently) relatively weak theoretical grounding of this literature. The strength
of the entrepreneurial ecosystems approach is the ability to incorporate many layers of
the entrepreneur’s context, highlighting the close relationships, interdependencies, and
reinforcing mechanisms across the different constituent elements of the entrepreneurial
ecosystem, often centred around a focal community of ecosystem constituents (Autio et
al., 2018a; Spigel, 2017). A weakness of the approach is that most conceptualisations
are descriptive, rather than theory-grounded, and tend to emphasize different layers,
structural elements, and processes of entrepreneurial ecosystems (Mason & Brown,
2014; Stam, 2018).
One theoretical ambiguity of the entrepreneurial ecosystems literature concerns the level
of analysis. While there are some country-level conceptualisations, most conceptualisa-
tions tend to treat entrepreneurial ecosystems as a regional phenomenon. A recent com-
prehensive theoretical review confirmed that entrepreneurial ecosystems should be
viewed as a novel, distinct type of regional cluster, one that harnesses both digital and
spatial affordances (Autio et al., 2018a). The review argued that the essence of the en-
trepreneurial ecosystem phenomenon is the exploitation of digital affordances created by
rapid advances in digital technologies and ubiquitous digital infrastructures for radical
business model innovation – i.e., for a re-think on how businesses organise to create,
deliver, and capture value. Many modern-day structural elements of entrepreneurial eco-
systems, such as new venture accelerators and co-working spaces have emerged to facil-
itate business model experimentation and the discovery of robust and scalable business
models. Such structural elements become focal points around which regional clusters of
specialised actors and resources tend to cluster, thereby giving birth to regional hubs of
entrepreneurial activity. Given the spatial clustering pattern associated with such devel-
opments, we suggest that, for conceptual clarity, it is best to restrict the use of the term:
’entrepreneurial ecosystems’ to regional phenomena.
Although the entrepreneurial ecosystems literature is best suited for understanding re-
gional phenomena, we are not implying that a country-level analysis would not be rele-
vant. For example, many framework conditions only operate at the national level and are
shared across regions (e.g., legal and regulatory frameworks). And, although many re-
sources tend to exhibit regional clustering, so does entrepreneurial activity. Therefore,
national aggregates provide a reasonable proxy of what is going on in that country’s re-
gional concentrations of entrepreneurial activity. Finally, although entrepreneurial eco-
systems may be spatially concentrated, the contributions of their dynamic still add to
countries' GDP. In order to distinguish a country-level unit of analysis, we therefore
adopt the concept of ’systems of entrepreneurship’ to communicate the country-level
focus of the EIDES (Acs et al., 2014b).
4.2 Index Structure
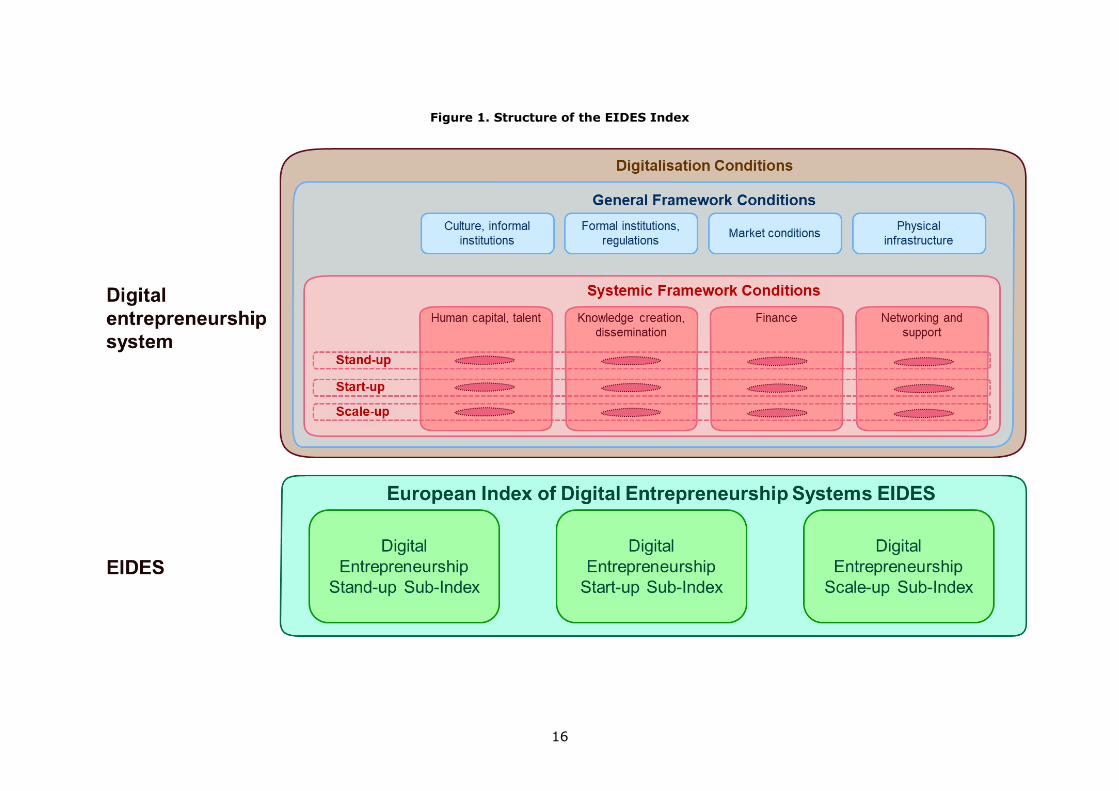
The EIDES structure is presented in Figure 1. As core pillars of the index, the EIDES dis-
tinguishes between General Framework Conditions and Systemic Framework Conditions.
General Framework Conditions represent country-level conditions that regulate entre-
preneurial activity in the country through their effect on social and economic trade-offs,
as experienced by individuals and entrepreneurial teams. Systemic Framework Condi-
tions represent various types of resources available to entrepreneurial firms at three
stages of their lifecycle: (1) the stand-up stage, which captures idea formation and the
self-selection of individuals to entrepreneurship; (2) the start-up stage, which captures
the actual launch and start-up of the new venture including early business model exper-
iments; and (3) the scale-up stage, which captures the scale-up of those new ventures
15
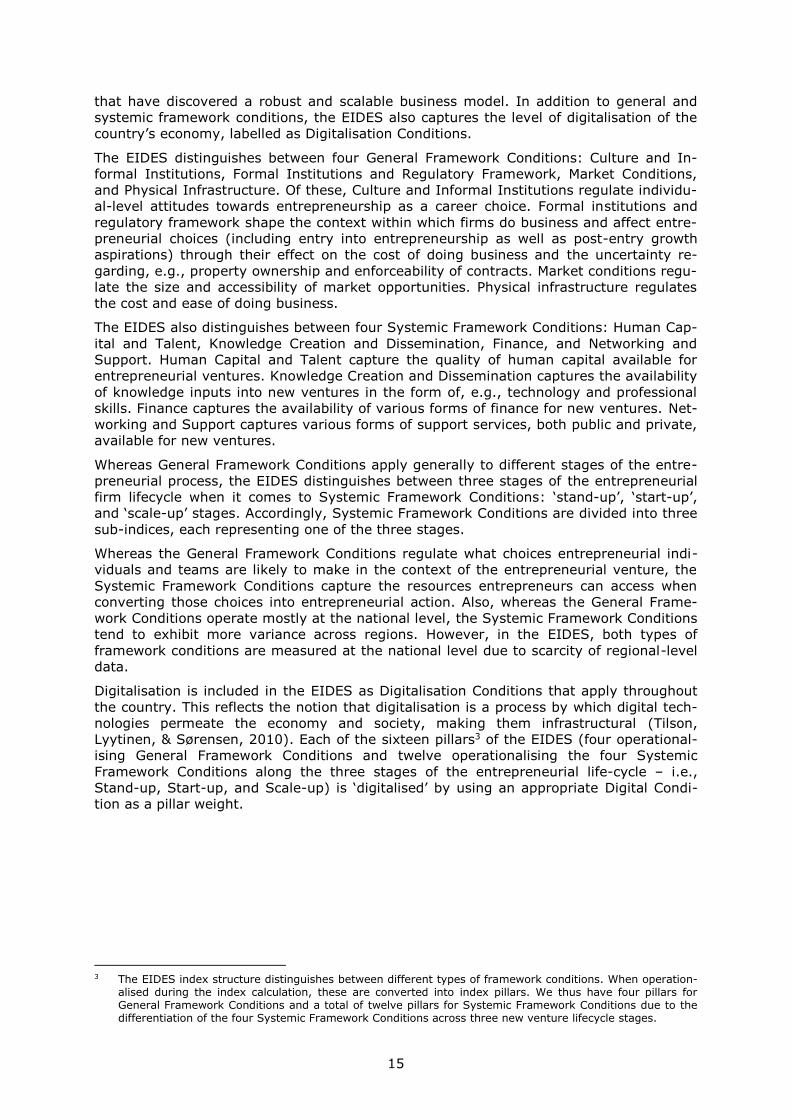
that have discovered a robust and scalable business model. In addition to general and
systemic framework conditions, the EIDES also captures the level of digitalisation of the
country’s economy, labelled as Digitalisation Conditions.
The EIDES distinguishes between four General Framework Conditions: Culture and In-
formal Institutions, Formal Institutions and Regulatory Framework, Market Conditions,
and Physical Infrastructure. Of these, Culture and Informal Institutions regulate individu-
al-level attitudes towards entrepreneurship as a career choice. Formal institutions and
regulatory framework shape the context within which firms do business and affect entre-
preneurial choices (including entry into entrepreneurship as well as post-entry growth
aspirations) through their effect on the cost of doing business and the uncertainty re-
garding, e.g., property ownership and enforceability of contracts. Market conditions regu-
late the size and accessibility of market opportunities. Physical infrastructure regulates
the cost and ease of doing business.
The EIDES also distinguishes between four Systemic Framework Conditions: Human Cap-
ital and Talent, Knowledge Creation and Dissemination, Finance, and Networking and
Support. Human Capital and Talent capture the quality of human capital available for
entrepreneurial ventures. Knowledge Creation and Dissemination captures the availability
of knowledge inputs into new ventures in the form of, e.g., technology and professional
skills. Finance captures the availability of various forms of finance for new ventures. Net-
working and Support captures various forms of support services, both public and private,
available for new ventures.
Whereas General Framework Conditions apply generally to different stages of the entre-
preneurial process, the EIDES distinguishes between three stages of the entrepreneurial
firm lifecycle when it comes to Systemic Framework Conditions: ‘stand-up’, ‘start-up’,
and ‘scale-up’ stages. Accordingly, Systemic Framework Conditions are divided into three
sub-indices, each representing one of the three stages.
Whereas the General Framework Conditions regulate what choices entrepreneurial indi-
viduals and teams are likely to make in the context of the entrepreneurial venture, the
Systemic Framework Conditions capture the resources entrepreneurs can access when
converting those choices into entrepreneurial action. Also, whereas the General Frame-
work Conditions operate mostly at the national level, the Systemic Framework Conditions
tend to exhibit more variance across regions. However, in the EIDES, both types of
framework conditions are measured at the national level due to scarcity of regional-level
data.
Digitalisation is included in the EIDES as Digitalisation Conditions that apply throughout
the country. This reflects the notion that digitalisation is a process by which digital tech-
nologies permeate the economy and society, making them infrastructural (Tilson,
Lyytinen, & Sørensen, 2010). Each of the sixteen pillars3 of the EIDES (four operational-
ising General Framework Conditions and twelve operationalising the four Systemic
Framework Conditions along the three stages of the entrepreneurial life-cycle – i.e.,
Stand-up, Start-up, and Scale-up) is ‘digitalised’ by using an appropriate Digital Condi-
tion as a pillar weight.
3 The EIDES index structure distinguishes between different types of framework conditions. When operation-
alised during the index calculation, these are converted into index pillars. We thus have four pillars for General Framework Conditions and a total of twelve pillars for Systemic Framework Conditions due to the differentiation of the four Systemic Framework Conditions across three new venture lifecycle stages.
16
Figure 1. Structure of the EIDES Index
17
4.3 Index Operationalisation
The variable composition of this, the second edition of the EIDES has been slightly re-
vised and updated from the first, 2018 edition. The structure of the EIDES is provided in
Table 2. The operationalisation of the EIDES includes the following steps:
- Determination of the overall structure of the EIDES (explained in Chapters 4.1
and 4.2 above)
- Determination of the variable composition of EIDES pillars
- Calculation of individual pillar values
- Digital weighting of individual pillar values for a digitalised form of the pillar
- Calculation of sub-index values
o General Framework Conditions (digitalised or non-digitalised)
o Systemic Framework Conditions (digitalised or non-digitalised), including
Stand-up (digitalised or non-digitalised)
Start-up (digitalised or non-digitalised)
Scale-up (digitalised or non-digitalised)
- Calculation of the overall EIDES value
Annex 2 provides a detailed explanation of the methodological steps.
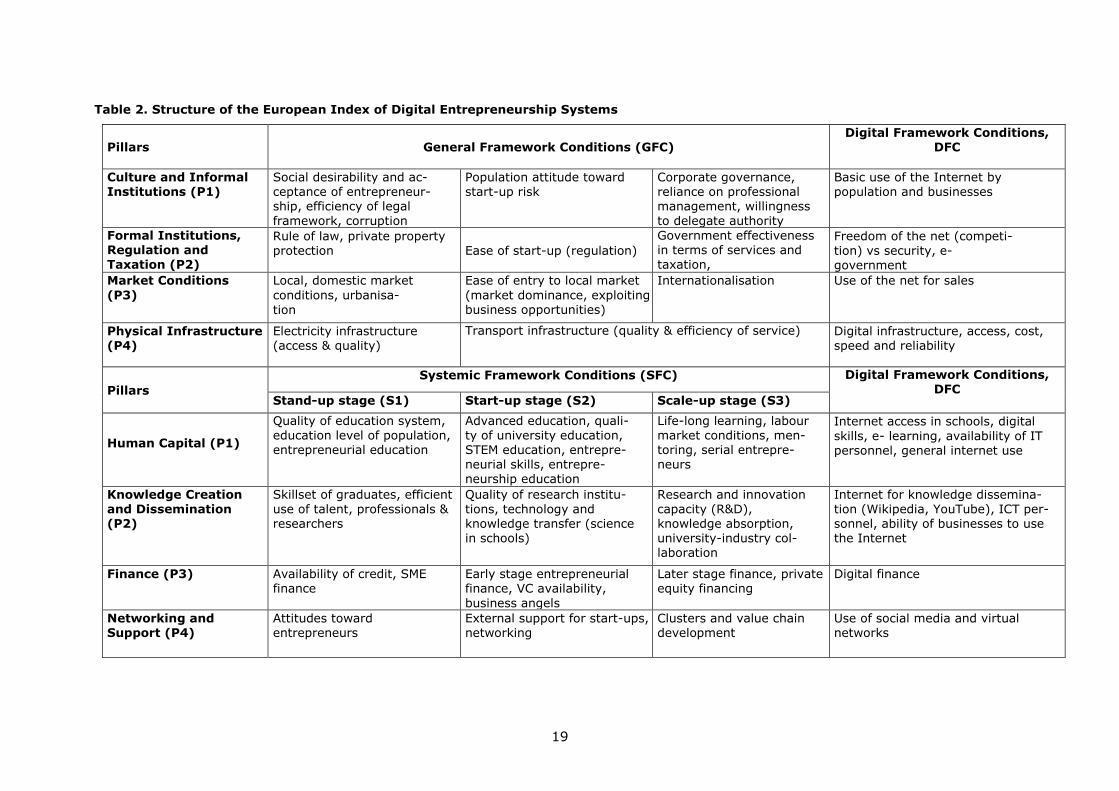
In the EIDES, both General Framework Conditions and Systemic Framework Conditions
are operationalised as index pillars that are composed of sets of individual variables. The
variables included in each index pillar are listed in Table 2.
Individual pillar values are calculated as arithmetic averages of the values of individual
pillar variables after normalisation. Each framework condition is thus represented by a
single pillar value. Because the EIDES calculates different pillar values for Systemic
Framework Conditions for each of the three lifecycle stages of entrepreneurial firms, the
index is composed of a total of 16 pillars.
The EIDES also calculates a measure of the digital context for each index pillar. These
measures are listed in the rightmost column of Table 2. Each index pillar is matched with
a Digital Framework Condition that resonates with it. The measures of the different Digi-
tal Conditions (one for each pillar) are calculated as the arithmetic average of their con-
stituent variables after normalisation.
The resulting measures of specific Digital Framework conditions are then used as weights
to calculate the digitalised version of each of the index pillars. The index thus offers two
pillar values for each General and Systemic Framework Conditions: a digitalised value
and a non-digitalised value.
In order to capture system dynamics, two important methodological steps are followed
when aggregating individual pillar values into sub-indices: the equalisation of pillar aver-
ages and the Penalty for Bottleneck algorithm (Acs, Autio and Szerb 2014). Most of the
indices make the strong and often unrealistic assumption that individual pillar values are
fully substitutable among one another. In the context of the EIDES, this would mean
making the strong assumption that, say, the negative impact of weak Market Conditions
could be fully mitigated by, say, strong Culture and Informal Institutions; or, making the
assumption that the negative impact of gaps in Human Capital and Talent could be fully
remedied by increases in Finance. Methodologically, the full substitutability assumption is
reflected in the way most indices calculate sub-index values as the simple arithmetic
mean of the pillar values that compose that sub-index. However, the assumption of full
substitutability among index pillars is simplistic, and it does not reflect the reality of most
economic systems. We know, for example, that if a given venture has zero access to Fi-
nance, it cannot fully leverage its Human Capital and Talent, however good these might
be. Similarly, a strong entrepreneurial culture cannot easily overcome weak market de-
mand. In complex systems, the different constituent elements tend to complement, ra-
ther than substitute one another, and they need to come together to co-produce system-

18
level outcomes. If one spoke of a bicycle wheel is broken, this cannot be made up for by
making another spoke longer.
In order to address the assumption of full substitutability among system components that
affects most indices, the EIDES equalises pillar averages and applies the Penalty for Bot-
tleneck algorithm when aggregating individual pillar values into sub-indices. The full de-
tails of these steps are explained in Annex 2. The equalisation of pillar averages involves
adjusting the scales of each pillar within the sample such that the average of the values
for each pillar is the same. The Penalty of Bottleneck algorithm introduces partial non-
substitutability across individual pillars (say, increases in Finance can only partly substi-
tute for gaps in Human Capital and Talent). When individual pillars can only partly substi-
tute each other, each of the General or Systemic Framework Conditions may act as a
bottleneck that holds back the performance of the entire system. To capture this issue,
the Penalty for Bottleneck algorithm ‘penalises’ for gaps in the pillar composition of a
given sub-index by inflicting a greater bottleneck penalisations for greater variances
among pillar values (i.e., greater differences among individual pillar values) in any given
sub-index,. This captures the notion that a poorly performing framework condition can
hold back the performance of the entire system.
After these steps, the values of each sub-index (one for General Framework Conditions,
three for Systemic Framework Conditions, all framework conditions in digital and non-
digital versions) are calculated as arithmetic means of equalised, bottleneck-penalised
pillar values. The overall sub-index value for Systemic Framework Conditions is calculat-
ed as the arithmetic mean of the sub-index value for stand-up, start-up, and scale-up
sub-indices.
Finally, the value of the overall EIDES is the arithmetic mean of the measures for General
and Systemic Framework Conditions.
This approach, we believe, provides a good and true-to-phenomenon portrayal of nation-
al entrepreneurship systems, where general framework conditions regulate the degree to
which the systemic conditions can realise their full potential, and where the systemic
conditions are directly involved in the co-production of the national-level entrepreneurial
dynamic. The EIDES approach also distinguishes between digital and non-digital versions
of the dynamic, making it possible to estimate the effect of digitalisation on the system’s
ability to support a high-quality entrepreneurial dynamic. The distinction between sys-
temic conditions and the three sub-dynamics of the overall entrepreneurial dynamic also
makes it possible to support more nuanced policy insights: first, for general framework
conditions for entrepreneurship; second, for digitalisation; and third, for the three sub-
dynamics of the overall entrepreneurial dynamic.
In this report we focus on the creation and the analysis of the EIDES and only marginally
deal with the connection between EIDES and the outputs of the country’s entrepreneurial
dynamic. The variable composition of each of the EIDES pillars is shown in Table 2.
19
Table 2. Structure of the European Index of Digital Entrepreneurship Systems
Pillars
General Framework Conditions (GFC)
Digital Framework Conditions, DFC
Culture and Informal Institutions (P1)
Social desirability and ac-ceptance of entrepreneur-ship, efficiency of legal
framework, corruption
Population attitude toward start-up risk
Corporate governance, reliance on professional management, willingness
to delegate authority
Basic use of the Internet by population and businesses
Formal Institutions, Regulation and Taxation (P2)
Rule of law, private property protection
Ease of start-up (regulation)
Government effectiveness in terms of services and taxation,
Freedom of the net (competi-tion) vs security, e-government
Market Conditions
(P3)
Local, domestic market
conditions, urbanisa-
tion
Ease of entry to local market
(market dominance, exploiting business opportunities)
Internationalisation Use of the net for sales
Physical Infrastructure (P4)
Electricity infrastructure (access & quality)
Transport infrastructure (quality & efficiency of service) Digital infrastructure, access, cost, speed and reliability
Pillars
Systemic Framework Conditions (SFC) Digital Framework Conditions, DFC
Stand-up stage (S1) Start-up stage (S2) Scale-up stage (S3)
Human Capital (P1)
Quality of education system, education level of population, entrepreneurial education
Advanced education, quali-ty of university education, STEM education, entrepre-neurial skills, entrepre-neurship education
Life-long learning, labour market conditions, men-toring, serial entrepre-neurs
Internet access in schools, digital
skills, e- learning, availability of IT personnel, general internet use
Knowledge Creation
and Dissemination (P2)
Skillset of graduates, efficient
use of talent, professionals & researchers
Quality of research institu-
tions, technology and knowledge transfer (science in schools)
Research and innovation
capacity (R&D), knowledge absorption, university-industry col-laboration
Internet for knowledge dissemina-
tion (Wikipedia, YouTube), ICT per-sonnel, ability of businesses to use the Internet
Finance (P3) Availability of credit, SME finance
Early stage entrepreneurial finance, VC availability,
business angels
Later stage finance, private equity financing
Digital finance
Networking and Support (P4)
Attitudes toward entrepreneurs
External support for start-ups, networking
Clusters and value chain development
Use of social media and virtual networks
20
4.4 Variable Content of EIDES 2019
The variable content of EIDES 2019 has been amended to capture the availability of new
data and the obsolescence of some old data. A major source of changes was the publication
of a new version of the Global Competitiveness Index (WEF, 2018), which dropped some
variables used in the previous edition of EIDES. These have been replaced with appropriate
proxies from the new GCI data. There were also other instances where previously used indi-
cators were either no longer available or had not been updated since the previous EIDES
edition. All changes in the dataset are summarised in Annex 1.
In updating the EIDES variable content, we tested alternative proxies for each pillar and se-
lected variables on the basis of their coverage of the relevant aspect as well as their perti-
nence to the phenomenon we sought to portray. Specific selection criteria for individual vari-
ables were:
1. Relevance of the variable for the construct we sought to measure
2. Clear interpretation of the variable
3. Explanatory power
4. Distinctiveness relative to other variables in the pillar
5. Comprehensiveness of the combined set of variables in the pillar relative to the con-
struct we sought to measure
6. Positive correlation between each pillar, when fully composed, and the overall EIDES
7. Specificity of the variable to the phenomenon it represents
So as to ensure index continuity, we have re-computed the 2018 edition of the EIDES using
the variables of the EIDES 2019 edition. This is provided in Table 5.
4.4.1 General Framework Conditions
By influencing financial and social trade-offs related to entrepreneurial choices, General
Framework Conditions (GFC) regulate the quality of a country’s entrepreneurial dynamic.
Most GFCs change slowly. The EIDES assumes that each general framework condition exer-
cises a more or less equal influence on the country's entrepreneurial dynamic.
Culture and Informal Institutions (GFC_P1 and DFC_P1)
Corruption has a negative effect on economic activity because it undermines the rule of law
and erodes the predictability of economic relationships. When the level of corruption is low
and the quality of governance is high, citizens are more likely to accept entrepreneurial risk.
To incorporate the effect of corruption we used two survey-based composite indices. The
World Economic Forum (WEF) Efficiency of legal framework in setting disputes indicator re-
flects the efficiency of the national level legal and judicial systems for companies in settling
disputes. The Transparency International Corruption Perceptions Index aggregates data from
a number of different sources and gives an estimate of the perceived level of corruption in
the public sector. In addition, the WEF Corporate governance reflects different dimensions of
good corporate governance, such as auditing and reporting standards, interest regulations,
and shareholder governance, and also, the country’s norms of business ethics.
21
In addition to corruption, fear of failure can have a negative impact at all stages of the
entrepreneurial dynamic. The way how a nation’s citizens perceive and handle failure is
influenced by their sociocultural norms. We use the WEF Attitudes towards entrepreneur-
ial risk indicator as a proxy of this construct.
Another important aspect of entrepreneurial culture is the reliance upon professional
management. If professional management is not valued, this may hold back the coun-
try’s entrepreneurial dynamic. We therefore included the WEF Reliance on professional
management survey indicator into our composite pillar.
Another reflection of managerial professionalism is the willingness to delegate. If entre-
preneurs are unwilling or unable to delegate, this will hold back their ability to grow their
businesses. The WEF Willingness to delegate authority indicator captures the willingness
to devolve decision-making and involve other managers and subordinates in business
planning and operations.
Digitalisation is rapidly shaping and changing social norms, cultural values and practices,
and other informal institutions. This impact of digitalisation will depend on the availability
and accessibility of digital technologies and infrastructures. The digital pillar comple-
menting the general Culture and Informal Institutions (DFC_P1) pillar therefore includes
proxies capturing how easily citizens and businesses can harness the digital infrastruc-
ture of their country. We use four indicators to proxy the accessibility and use of digital
technologies and infrastructures by households and firms in a given country. All data are
derived from Eurostat database: (1) Percentage of households having access to, via one
of its members, a computer, (2) Percentage of households with Internet access at home,
(3) Percentage of individuals using the Internet (in the last 3 months), and (4) Percent-
age of enterprises having a website (Eurostat).
Formal Institutions and Regulatory Framework (GFC_P2 and DFC_P2)
The connection between a country’s formal institutions (including the regulatory frame-
work) and entrepreneurship has been widely investigated, and it has been shown to im-
pact both the quality and quantity of entrepreneurship in a given country (e.g., Autio &
Fu, 2015). The indicators included in the EIDES inform on obstacles of the regulatory
environment and on the need to improve the quality and efficiency of formal institutions
and regulations: (1) Rule of Law (Property rights), (2) Rule of Law (Judicial Effective-
ness), (3) Distortive effect of taxes and subsidies on competition, (4) Total tax rate and
(5) Efficiency of legal framework in challenging regulations.
The Heritage Foundation Rule of Law index captures mechanisms by which societies en-
force laws and regulations and protect property. The rule of law is a crucial mechanism
that curtails corruption and therefore encourages entrepreneurial risk taking. Under a
strong rule of law people feel that their personal liberty and the fruits of their labour will
be protected. In contrast, under a weak rule of law, there are no guarantees that any
effort by citizens will be respected, nor are there effective limits to government abuse,
bribery, special interests, and corrupt rent seeking. This composite index incorporates
different aspects of the rule of law, including physical and intellectual property rights, the
strength of investor protection, the risk of expropriation, the judicial effectiveness and
independence, and the transparency of governmental policymaking and civil services.
In a favourable business environment, entrepreneurial activities are supported by pre-
dictable fiscal regulation and a reliable governance system. In the EIDES, the World
Bank Total tax rate indicator and WEF Distortive effect of taxes and subsidies on compe-
tition compare national tax systems and capture their effect on business investment. We
also included WEF indicator Efficiency of legal framework in challenging regulations to
capture the quality of government.
As outlined earlier, digitalisation brings about many benefits. As a downside, digitalisa-
tion can also introduce new risks that may inhibit entrepreneurial action. A particular
potential downside concerns loss of privacy and security. In the EIDES, the digitalisation
related Formal Institutions, Regulation, and Taxation (DFC_P2) pillar therefore encom-
22
passes several indicators reflecting this aspect of digitalisation. This pillar also includes
proxies that measure how formal institutions and the regulatory environment shape digi-
talisation processes and competition. The pillar also captures the digitisation of public
services, focusing on e-government. Modernisation and digitalisation of public services
can lead to efficiency gains for the public administration, citizens and businesses through
the delivery of high-quality services. The pillar includes indicators such as: (1) Govern-
ment future orientation (WEF), (2) Percentage of network attacks by Kaspersky (Secure-
list), (3) Percentage of WEB treats (Securelist), (4) Software piracy rate (World Bank),
(5) Competition in network services (WEF) and (6) E-government (UN Department of
Economic and Social Affairs).
Market conditions (GFC_P3 and DFC_P3)
Market conditions constitute one of the most important regulators of a country’s entre-
preneurial dynamic. This pillar includes indicators reflecting different features of market
conditions, such as the effect of agglomeration externalities, the market power of exist-
ing businesses and business groups, domestic and foreign market size, and also, percep-
tions of entrepreneurial opportunities.
Agglomeration externalities are positively associated with entrepreneurship because they
facilitate opportunity recognition and exploitation, and also, make it easier for demand
and supply to meet. These processes are enhanced by urbanisation. This pillar therefore
includes the WEF Domestic market size and the Level of urbanisation calculated by World
Population Prospects. Domestic market size indicator refers to the sum of gross domestic
product plus the value of imports of goods and services minus exports of goods and ser-
vices.
Market conditions can also influence opportunity perception. The Flash Eurobarometer
Survey Opportunity motivation indicator refers to the entrepreneurial opportunity per-
ception by the population. Specifically, it measures the degree to which a country’s citi-
zens prefer self-employment over regular employment.
The intensity of competition among business firms is an important indicator of the entre-
preneurial dynamic. The relevant indicators in the EIDES reflect managerial perceptions
regarding the freedom of market competition (WEF Extent of Market dominance), the
freedom (WEF Prevalence of trade barriers), and complexity of trade (Economic com-
plexity index developed by the Observatory of Economic Complexity (OEC)).
The digital counterpart of the Market Conditions (DFC_P3) pillar characterises the exploi-
tation of online market channels (e.g., e-commerce, e-sales, e-advertisement) by
households and firms. By adopting digital technology, entrepreneurial businesses can
enhance efficiency, reduce costs and better engage customers, collaborators, and busi-
ness partners. Furthermore, the Internet also offers wider access to markets. The digital
pillar includes the following six indicators derived from Eurostat and one from Trans-
late.net database: (1) Individuals using the Internet for ordering goods or services, (2)
Enterprises having received orders via computer-mediated networks, (3) Enterprises'
total turnover from e-commerce, (4) Enterprises’ turnover from web sales, (5) T-index,
and (6) Pay to advertise on the Internet.
Physical infrastructure (GFC_P4 and DFC_P4)
A country’s physical infrastructure plays an important role in supporting business opera-
tions, and therefore, also entrepreneurship. Physical infrastructure regulates, e.g., firms’
accessibility and connectivity with markets, resources, and other firms. Good accessibil-
ity and connectivity enabled by physical infrastructures help business firms and entre-
preneurs effectively discover and pursue market opportunities and run their operations.
Countries with an effective physical infrastructure are also better positioned to promote
the internationalisation of firms, therefore facilitating the realisation of their growth po-
tential.
23
The EIDES distinguishes between two types of physical infrastructures: first, the electric-
ity infrastructure, and second, the transportation infrastructure. The WEF Electricity in-
frastructure aggregate index consists of two indicators measuring electricity access and
the quality of the electricity infrastructure. Another WEF aggregate indicator, namely,
the Transportation infrastructure, comprises indicators of the perceived quality of gen-
eral infrastructures (e.g., transport, communication, and energy).
The digital pillar complementing the Physical Infrastructure pillar (DFC_P4) encompasses
indicators reflecting quality-related features – such as affordability, speed, security, and
coverage – of the digital infrastructure. Limited affordability of network services, devices,
and applications impedes consumer engagement with the digital economy and widens
the digital divide. In EIDES, therefore, the digital affordability indicator captures the
costs of mobile telephony and fixed broadband Internet, as well as the level of competi-
tion in the Internet and telephony sectors. Here we use indicators derived from the WEF
database, such as the (1) Prepaid mobile cellular tariffs, the (2) Fixed broadband Inter-
net tariffs.
Speed related indicators measure the performance of digital services such as mobile and
fixed broadband. To capture the speed of digital devices and services we use: (1) Aver-
age download speed and (2) Average upload speed measured by TestMy.net, and the (3)
DESI Speed indicator.
Mobile network coverage refers to the penetration rate of portable digital devices. To
express the penetration of mobile infrastructure we use the WEF Mobile network cover-
age indicator.
In addition to capacity measures, another important aspect of digital infrastructures re-
lates to trust and safety. Poor protection of data and communications hampers digital
trust and potentially undermines the degree to which citizens and businesses embrace
the digital capacity available to them. The EIDES therefore employs the WEF Secured
Internet servers indicator to capture digital trust and safety.
4.4.2 Systemic Framework Conditions
As explained in the conceptual grounding, the Systemic Framework Conditions (SFC)
relate more directly to the different stages of entrepreneurial sub-dynamics within a
country’s system of entrepreneurship. Each stage constitutes its own sub-index. We use
the same four pillars for each stage, but pick different indicators (or indexes) for each of
them.
● The Stand-up stage covers all activities and mechanisms associated with the
self-selection of individuals and teams into the entrepreneurial process: a well-
functioning stand-up framework will attract high-potential individuals and teams
into entrepreneurship.
● The Start-up stage covers all activities and mechanisms associated with the ac-
tual start-up of new ventures, including concept search and refinement and busi-
ness model experimentation. In our model, start-up continues beyond the actual
incorporation of the new venture and covers the business model experimentation
to discover a robust and scalable business model.
● The Scale-up stage covers scale-up activities once a robust and scalable busi-
ness model has been discovered.
The EIDES also distinguishes between conditions that are not affected by digitalisation
(Systemic Entrepreneurship Conditions, SEC) and that are affected by digitalisation (Sys-
temic Digital Conditions, SDC). Both groups use the same pillar structure, but the com-
position of each individual pillar is different. The pillar structure of both SEC and SDC is
listed below:
1. Human capital (SEC_P1 and SDC_P1)
24
2. Knowledge creation, transfer, and absorption (SEC_P2 and SDC_P2)
3. Finance (SEC_P3 and SDC_P3)
4. Networking and support (SEC_P4 and SDC_P4)
Systemic Entrepreneurship Conditions and Systemic Digital Conditions
Stand-up sub-index (S1)
The Stand-up sub-index captures mechanisms that influence the self-selection of indi-
viduals into entrepreneurship – i.e., the decision of whether or not to start a new busi-
ness. The EIDES structure includes both digital and non-digital versions of this sub-
index.
Human Capital pillar (S1_SEC_P1 and S1_SDC_P1)
Human capital constitutes an important determinant of the quality of entrepreneurial
businesses. Individuals with a higher human capital will be better able to recognise and
pursue high-quality opportunities for entrepreneurship (Davidsson & Honig, 2003). The
opportunity costs associated with the allocation of high-quality human capital among
alternative occupational pursuits will also ensure that entrepreneurs with high human
capital will be more motivated to pursue potential growth opportunities (Autio & Acs,
2010).
The availability of high-quality human capital is determined by the quality of the educa-
tion system. We measure two aspects of this human capital, namely, general human
capital (general quality of the education system) and entrepreneurial human capital, as
shaped by the ability of the education system to encourage entrepreneurial attitudes. In
order to measure the two types of human capital we used the following indicators: (1)
IMD World Talent Ranking Quality of Education is an aggregate index based on three
measures (educational system, university education, and management education), (2)
Flash Eurobarometer Survey measures Entrepreneurial attitudes at school, and (3) WEF
Future workforce evaluates the capacities of the future workforce based on different
characteristics of the education system.
The digital counterpart of the Human Capital pillar captures the availability of digital in-
frastructure in educational institutions and the basic digital skills of the population. To
evaluate the digitalisation of education we use Eurostat Individuals with a daily access.
To measure people’s digital skills we employ two indicators: (1) WEF Digital Skills Among
Population, and (2) Eurostat Individuals above basic digital skills.
Knowledge creation, transfer and absorption pillar (S1_SEC_P2 and
S1_SDC_P2)
Entrepreneurial stand-up in a country is shaped by the degree to which potential entre-
preneurs can access valuable knowledge to fuel their business ventures. Much of this
knowledge is carried by individuals, in the form of their human and social capital. A
country’s ability to attract and retain talent not only provides entrepreneurial ventures
with access to valuable human resources, such talent will also boost knowledge creation
in the country, facilitating potential knowledge spill-overs to new ventures. The EIDES
uses WEF index data to capture this aspect: Skillset of graduates (WEF), Percentage of
professionals & researchers (Global Talent Competitiveness Index), and Attracting and
retaining talents (IMD World Talent Ranking).
Digitalisation shapes the process of knowledge creation, transfer and dissemination. With
digitalisation, access to knowledge becomes less constrained by spatial distance, as the
Internet can facilitate access to digitalised knowledge resources regardless of location.
The indicator Open access of scientific documents offered by OECD and indicators of
Global Innovation Index such as Wikipedia yearly edits and YouTube video uploads are
25
therefore used in the EIDES as proxies of the impact of digital technologies and infra-
structures on the creation and dissemination of knowledge.
Finance (S1_SEC_P3 and S1_SDC_P3)
Availability of finance is widely recognised as a key regulator of the entrepreneurial dy-
namic in countries, including the Stand-up stage. Both the amount of funding matters,
as does the accessibility by entrepreneurial ventures to such funding. The Domestic
credit (International Monetary Fund, International Financial Statistics) indicator
measures the generally prevalent forms of funding, such as loans, non-equity securities,
and trade credits and other accounts receivable. Additionally, the Financing SMEs (WEF)
indicator provides insight into the extent small- and medium-sized enterprises can ac-
cess finance through the financial sector.
As digital proxies we use indicators as Digital payment transactions and Number of cash-
less payment transactions. Both indicators are offered by Statista and Internet Banking
measured by Eurostat. On the one hand, these indicators capture the effect of digital
technologies and infrastructures on the functional operation of financial institutions. On
the other hand, these proxies offer insight into the new generation of digitalised financial
products and services.
Support, networking (S1_SEC_P4 and S1_SDC_P4)
Positive attitudes towards entrepreneurship encourage entrepreneurial stand-up, as does
informal access to resources though social networks. We therefore included the Opinion
about Entrepreneurs indicator offered by Flash Eurobarometer Survey in the EIDES. To
capture networking and digitalisation, we included the Generic top-level domains
(gTLDs) (GII) and Participating in social networks (Eurostat), and Use of virtual profes-
sional networks (Global Talent Competitiveness Index) in this pillar.
Start-up sub-index (S2)
Human capital (S2_SEC_P1 and S2_SDC_P1)
Societies with high-quality educational systems are better able to supply entrepreneurial
start-ups with high-quality human capital. In the start-up sub-index, we therefore in-
cluded several proxies of different aspects of the education system. These included Ter-
tiary education enrolment (WEF) and Percentage of universities with top rankings in in-
ternational league tables (Webometrix). Furthermore, human resources in science and
technology are particularly relevant for new start-ups. This pillar therefore employs indi-
cators such as the STEM education and the Human resources in science and technology
indicator offered by Eurostat. As digital proxy of the educational system, we included the
Employed ICT specialists (Eurostat) indicator to capture the availability of digitally skilled
human capital.
Knowledge creation, transfer and absorption (S2_SEC_P2 and S2_SDC_P2)
Start-ups need access to advanced research-based knowledge in order to nurture dis-
tinctive capabilities and create sophisticated products and services. In order to convert
this knowledge into a source of distinctive competitive advantage, however, start-ups
also need absorptive capacity – i.e., capacity to recognise valuable knowledge and inte-
grate it into their products and services. Scientific institutions constitute an important
source of research advances, and the Start-up sub-index therefore includes the WEF
Quality of research institutions, which provides insight into the quality of a country’s
knowledge production system. To capture start-ups’ ability to take advantage of re-
search-based knowledge spillovers, we use the Technicians and associate professionals
as a proxy derived from International Labour Organisation (ILO) database. This indicator
measures the availability of the latest technology in a country and the absorptive capaci-
ty of business firms. We also use Science in school as an indicator derived from IMD
World Talent Ranking report. This proxy measures how sufficiently science is emphasised
26
in schools.
To capture the digital aspect of knowledge creation, transfer, and absorption, we use
Employment in high tech and KIBs (Eurostat) and Software developers (Developer sur-
vey). These indicators provide proxies of the degree to which the processes of
knowledge creation, transfer and dissemination are digitalised.
Finance (S2_SEC_P3 and S2_SDC_P3)
Venture capital funding and other forms of equity investment are an important determi-
nant of the risk-taking capacity of start-ups and therefore play an important and growing
role in supporting the exploitation of as yet undiscovered and therefore risky entrepre-
neurial opportunities. The indicators chosen for the Finance pillar of the Start-up sub-
index therefore measure different forms of formal and informal investment: (1) Venture
capital availability (WEF), (2) Business angel investment (EBAN Statistics Compendium
European Early Stage Market Statistics) and (3) Early phase VC (Venture Source, Dow
Jones).
As a digital proxy of start-up Finance pillar we used the Alternative finance indicator (1)
(Cambridge Centre) which provides insight into new forms of alternative finance such as
crowdfunding, peer-to-peer markets, invoice trading and debt-based securities triggered
by the development of digital technologies and infrastructures. As a similar measure, we
include two Alternative finance indicators (2, 3) offered by The 3rd European Alternative
Finance Industry Report, and the Alternative finance (4) was used as a measure offered
by the Statista database.
Support, networking (S2_SEC_P4 and S2_SDC_P4)
To progress from the Stand-up stage to the Start-up stage, a positive and supportive
attitude towards domestic and international networks and collaborations is important.
Among other things, and specific to the Start-up stage, such networks serve as a forum
for cultivating and disseminating cluster-specific architectural knowledge on ‘what works’
in terms of business model design and facilitate horizontal sharing of knowledge regard-
ing novel business model practices among start-ups (Autio, Cao, Chumjit, Kaensup, &
Temsiripoj, 2019). Specific to this aspect, the Enterprise Europe Network offers a large
online database of new business opportunities containing thousands of business, tech-
nology and research cooperation requests and offers from companies and research and
development institutions.
As digital proxy of Networking and Support pillar, we used the Accelerators (European
Accelerators Report) and the Meetup Events (Tech Group Indicator MTGI, Tech Event
Activity, MTEA) and members (Tech Member indicator MTMI, Tech Member Activity
MTMA) (meetup.com) indicators. These are distinctive structural elements of entrepre-
neurial ecosystems. The new venture accelerator phenomenon is largely driven by ad-
vances in digitalisation, and new venture accelerators have evolved beyond simple busi-
ness-service providers or investment vehicles. Networking events bring together
different participants of entrepreneurial ecosystems, facilitating their access to resources
as well as dissemination of experiential knowledge regarding business model innovation.
Scale-up sub-index (S3)
Human capital (S3_SEC_P1 and S3_SDC_P1)
In order to scale, start-ups need both access to managerial knowledge and an ability to
upgrade their workforce during the scale-up phase. Scale-up firms also need access to
advanced managerial knowledge in order to build and run efficient organisations around
their business models. Staff training and lifelong learning practices and institutions in a
country are designed to constantly upgrade the skills of the labour force in order to ad-
just to technological progress and new economic opportunities. Management schools
provide an important source of managerial skills. The Human capital pillar of the Scale-
27
up sub-index therefore includes proxies of these: (1) Eurostat Lifelong learning, (2) WEF
Extent of staff training, (3) IMD World Talent Ranking Skilled labor. In addition to these
supply-side indicators, and as a reflection of the ability of scale-ups to re-adjust their
business models in the face of rapidly shifting opportunities characteristic of dynamic
markets (including the possibility of reducing employment size when necessary), the
Labour Freedom index from Heritage Foundation proxies this aspect. This index covers
regulation relating to minimum wages, hiring and firing practices, hours of work, and
severance requirements, among others.
Opportunity-driven scale-up entrepreneurs often leverage digital technologies and infra-
structures when searching for information about market opportunities. Therefore, as dig-
ital proxies we use the Eurostat (1) Internet use: finding information for goods and ser-
vices and (2) Internet use: doing online course indicators to capture the influence of
digitalisation on conditions affecting entrepreneurial scale-up process.
Knowledge creation, transfer and absorption (S3_SEC_P2 and S3_SDC_P2)
Constant access to cutting-edge knowledge is important to fuel scale-ups. The Knowl-
edge Creation and Dissemination pillar includes proxies of both knowledge inputs (in the
form of the availability of knowledge-intensive human capital and investment in R&D)
and outputs (in the form of patents). The Eurostat GERD, Number of PCT patent applica-
tions were selected as proxies of these.
Similar to start-ups, absorptive capacity is needed in order for business firms to trans-
late knowledge inputs into distinctive products and services. As a proxy of these, we
used the Knowledge absorption (GII) indicator.
In addition to knowledge production, knowledge accessibility is important for knowledge
spill-overs to materialise. Accessing external sources of knowledge implies the need to
participate in multi-stakeholder networks and knowledge-intensive collaborations with
others, often as participants of innovation ecosystems. As proxies of these processes we
included (WEF) University-industry collaboration in R&D.
Integrating digital technologies in business operations is an important determinant of
scale-up ability due to the inherent scalability of many digital resources, as well as due
to the potential of digital tools to support the coordination of complex operations. To this
end, the EIDES Scale-up sub-index includes two indicators: the Eurostat Enterprises who
have ERP software and the Website has online ordering, reservation or booking offered
by Eurostat.
Finance (S3_SEC_P3 and S3_SDC_P3)
Access to finance is of obvious importance for scale-ups. The finance pillar of the EIDES
Scale-up sub-index includes the Later phase VC (Venture Source, Dow Jones) and Mar-
ket capitalization (WEF) indicators. In addition, the European Private Equity data source
is the most comprehensive and authoritative source for European private equity fund-
raising, investment, and divestment data. Finally, the Depth of Capital Market is a com-
plex index that measures the access to different capital markets by new ventures.
As noted previously, digitalisation has led to the introduction of many alternative finan-
cial instruments. The use of smartphones for mobile banking and investing services are
examples of technologies aiming to make financial services more accessible to the gen-
eral public. Financial technology companies consist of both start-ups and established
financial and technology companies trying to replace or enhance financial services pro-
vided by existing financial companies. Dealroom.co Fintech indicator measures the num-
ber of financial technology businesses.
Support, networking (S2_SEC_P4 and S2_SDC_P4)
Scale-ups need resource munificent environments to grow their operations, ones that
are rich in the kind of specialised resources and business infrastructure they rely on. In
order to capture this aspect, the networking and support pillar of the EIDES scale-up
28
sub-index includes one indicator of cluster development, one indicator of business so-
phistication, and one indicator of the quality of the physical business infrastructure. Clus-
ters provide good access to sophisticated resources and to beneficial demand and supply
conditions. The business sophistication indicator provides insight into the quality of po-
tential partners. The logistic index provides an indication of the quality of the physical
infrastructure: (1) State of cluster development (WEF), (2) Multi-stakeholder collabora-
tion (WEF) and (3) Logistic index.
Both domestic and international logistics are central to economic growth and competi-
tiveness of countries. Efficient logistics connects firms to domestic and international
markets in a reliable and cost-efficient manner. Conversely, businesses in countries
characterised by low logistics performance face high costs, not merely because of trans-
portation costs, but also because of unreliable supply chains, a major handicap in inte-
grating and competing in global value chains.
Business sophistication is conducive to higher efficiency in the production of goods and
services. The quality of a country’s business networks and supporting industries, as
measured by the quantity and quality of local suppliers and the extent of their interac-
tion, is important for a variety of reasons. When companies and suppliers from a particu-
lar sector are interconnected in geographically proximate clusters, efficiency is en-
hanced, opportunities for innovation are opened, and barriers to entry for new firms are
reduced. Individual firms’ operations and strategies (branding, marketing, the presence
of a value chain, and the production of unique and sophisticated products) all support
modern, sophisticated business processes.
The digital aspect of the networking and support pillar captures the effect of digital infra-
structures and technologies on networking. The (1) Enterprises whose business process-
es are automatically linked to those of their suppliers and/or customers, (2) Enterprises
using software solutions, like CRM to analyse information about clients for marketing
purposes, and (3) Total investment in networks by the electronic communications sec-
tor indicators provide insight into what extent businesses in a given country rely on digi-
tal solutions in their interactions with other businesses and consumers.
29
5 EIDES Results
5.1 Country Rankings
The 2019 EIDES index for the EU28 countries is shown in Table 3. The table shows the
digitalised versions of the index for the three sub-systems – i.e., the stand-up system,
the start-up system and the scale-up system. These sub-indices represent a combination
of the general framework conditions and the sub-index score for each of the three sub-
systems, as composed of systemic framework conditions. The rightmost column shows
the overall EIDES score, which represents the arithmetic average of the three sub-index
scores. The range for all scales is from 0 (lowest) to 100 (highest).
We divide the countries into four groups: leaders (EIDES score above 60), followers
(EIDES score above 45 and up to 60), catchers-up (EIDES score above 35 and up to 45)
and laggards (EIDES score below 35). The four groups are highlighted using different
colours. These cut-off points emerge naturally from the data, as shown in Figure 2.
In the 2018 EIDES ranking, seven countries emerge as leaders in terms of their
digitalised general and systemic framework conditions for entrepreneurship. These are:
Sweden, Denmark, The Netherlands, United Kingdom, Finland, Germany, and
Luxembourg. Of these, Sweden and Denmark are virtually even in terms of their overall
EIDES score. Sweden ranks first for two out of the three sub-systems (start-up and
scale-up). Denmark ranks first for stand-up and second for scale-up and third for start-
up systems. Netherlands scores 3rd for the stand-up and scale-up systems and 5th for
start-up.
After the group of seven leading countries, there is a gap of seven index score points to
the second group, followers. This group comprises seven countries: Ireland, Belgium,
Austria, Estonia, France, Malta, and Spain. Of these, Ireland, Belgium are ahead of
Austria, Estonia, and France while Malta and Spain rank at the bottom of this group.
The catchers-up group comprises six countries: Czech Republic, Lithuania, Slovenia,
Portugal and Cyprus. The EIDES scores for this group range from 35,2 (Poland) to 43,9
(Czech Republic), which is clearly behind the leader group, whose index scores average
above 70.
Finally, the group of laggards comprises eight countries:, Italy, Hungary, Latvia,
Slovakia, Croatia, Romania, Greece and Bulgaria. It is notable that Italy is ranked in this
group, in spite of being one of the G7 countries. Other than Italy, this group comprises
former centrally planned economies and Greece.
Several patterns are notable in this grouping. The Nordic EU28 countries all rank in the
leader group. The follower group comprises mostly Western European countries plus
Malta and Estonia – the latter being the only former centrally planned economy to rank
in the top half of the ranking. The catchers-up group includes a mix of Southern
European and new Member States. The follower group includes the new EU Memebr
States plus Italy and Greece.
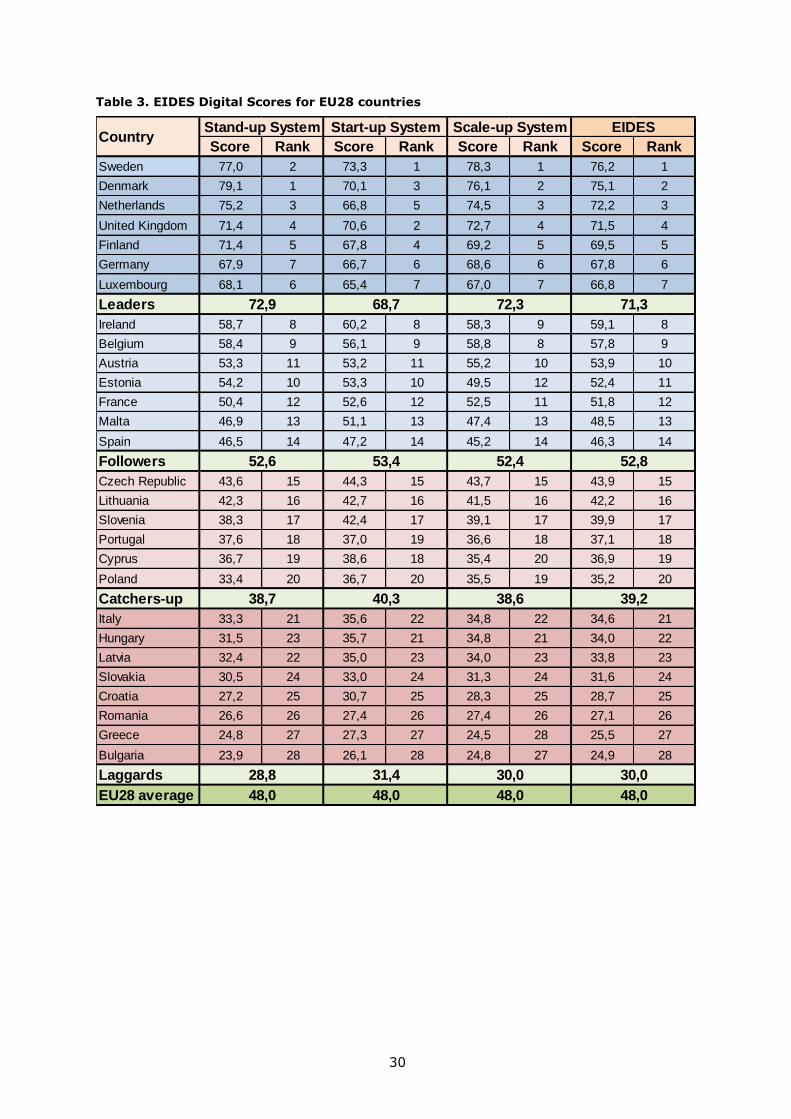
30
Table 3. EIDES Digital Scores for EU28 countries
Score Rank Score Rank Score Rank Score Rank
Sweden 77,0 2 73,3 1 78,3 1 76,2 1
Denmark 79,1 1 70,1 3 76,1 2 75,1 2
Netherlands 75,2 3 66,8 5 74,5 3 72,2 3
United Kingdom 71,4 4 70,6 2 72,7 4 71,5 4
Finland 71,4 5 67,8 4 69,2 5 69,5 5
Germany 67,9 7 66,7 6 68,6 6 67,8 6
Luxembourg 68,1 6 65,4 7 67,0 7 66,8 7
Leaders
Ireland 58,7 8 60,2 8 58,3 9 59,1 8
Belgium 58,4 9 56,1 9 58,8 8 57,8 9
Austria 53,3 11 53,2 11 55,2 10 53,9 10
Estonia 54,2 10 53,3 10 49,5 12 52,4 11
France 50,4 12 52,6 12 52,5 11 51,8 12
Malta 46,9 13 51,1 13 47,4 13 48,5 13
Spain 46,5 14 47,2 14 45,2 14 46,3 14
Followers
Czech Republic 43,6 15 44,3 15 43,7 15 43,9 15
Lithuania 42,3 16 42,7 16 41,5 16 42,2 16
Slovenia 38,3 17 42,4 17 39,1 17 39,9 17
Portugal 37,6 18 37,0 19 36,6 18 37,1 18
Cyprus 36,7 19 38,6 18 35,4 20 36,9 19
Poland 33,4 20 36,7 20 35,5 19 35,2 20
Catchers-up
Italy 33,3 21 35,6 22 34,8 22 34,6 21
Hungary 31,5 23 35,7 21 34,8 21 34,0 22
Latvia 32,4 22 35,0 23 34,0 23 33,8 23
Slovakia 30,5 24 33,0 24 31,3 24 31,6 24
Croatia 27,2 25 30,7 25 28,3 25 28,7 25
Romania 26,6 26 27,4 26 27,4 26 27,1 26
Greece 24,8 27 27,3 27 24,5 28 25,5 27
Bulgaria 23,9 28 26,1 28 24,8 27 24,9 28
Laggards
EU28 average
72,9 68,7 72,3 71,3
CountryStand-up System Start-up System Scale-up System EIDES
52,6 53,4 52,4 52,8
38,7 40,3 38,6 39,2
28,8 31,4 30,0 30,0
48,0 48,0 48,0 48,0
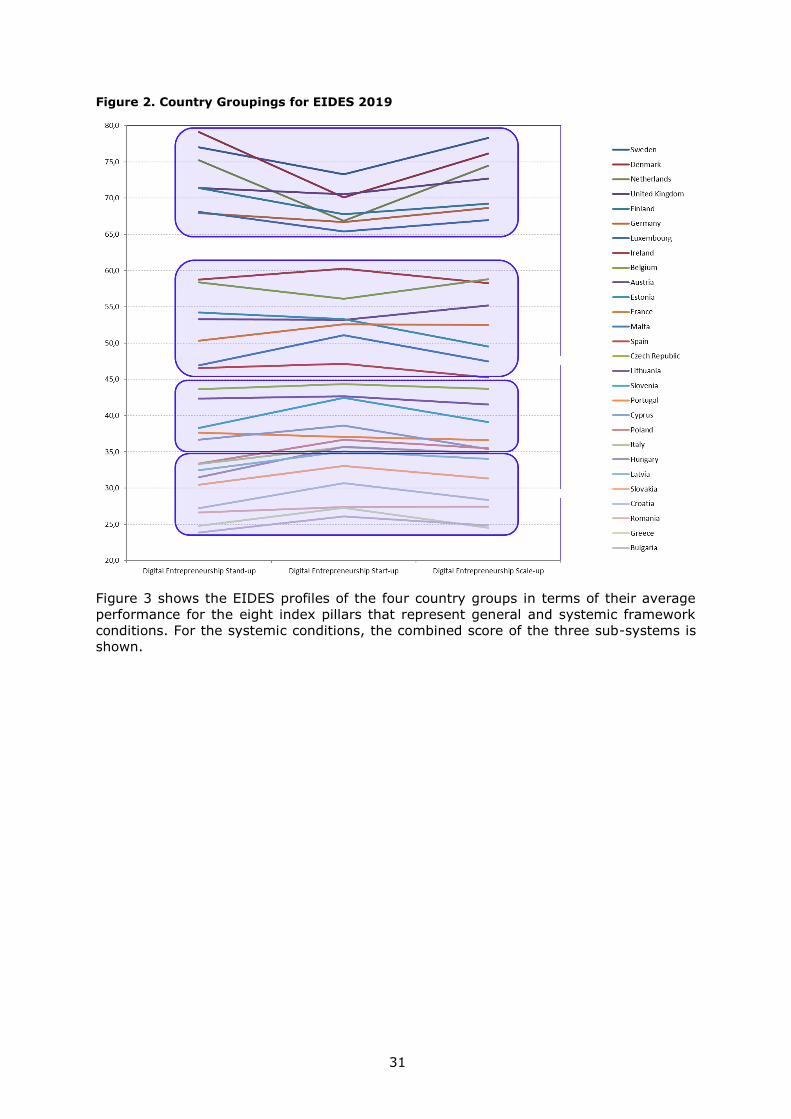
31
Figure 2. Country Groupings for EIDES 2019
Figure 3 shows the EIDES profiles of the four country groups in terms of their average
performance for the eight index pillars that represent general and systemic framework
conditions. For the systemic conditions, the combined score of the three sub-systems is
shown.
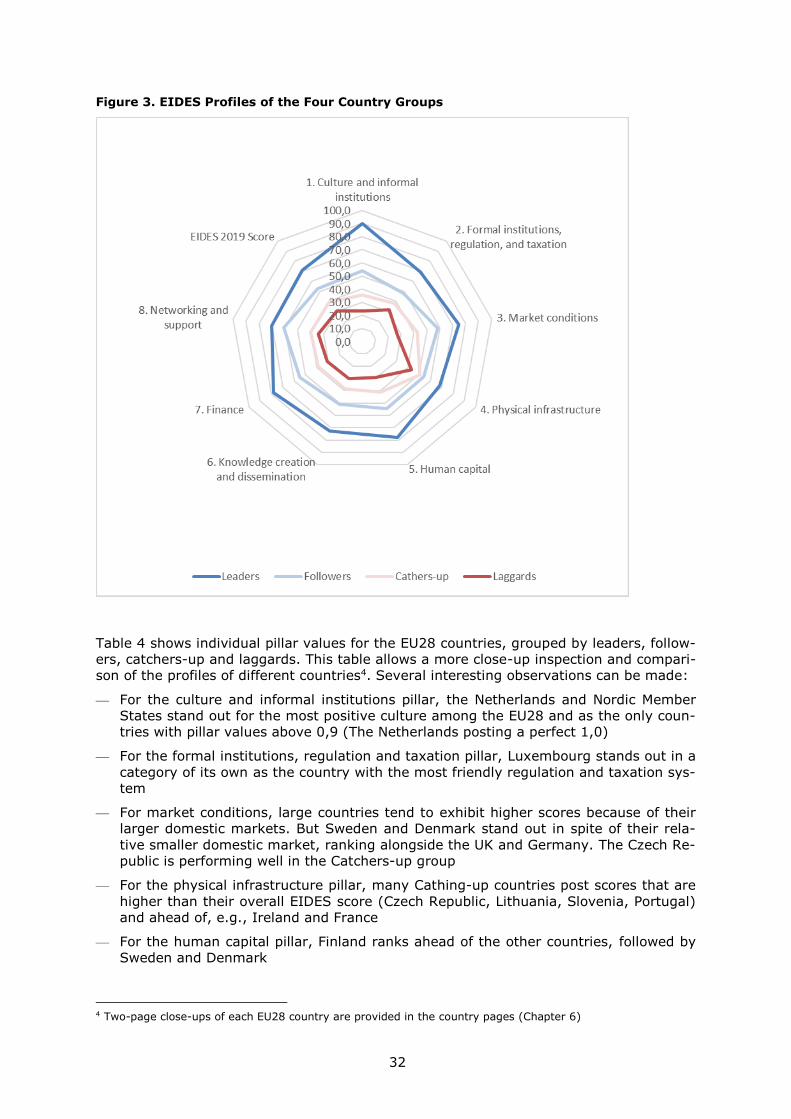
32
Figure 3. EIDES Profiles of the Four Country Groups
Table 4 shows individual pillar values for the EU28 countries, grouped by leaders, follow-
ers, catchers-up and laggards. This table allows a more close-up inspection and compari-
son of the profiles of different countries4. Several interesting observations can be made:
— For the culture and informal institutions pillar, the Netherlands and Nordic Member
States stand out for the most positive culture among the EU28 and as the only coun-
tries with pillar values above 0,9 (The Netherlands posting a perfect 1,0)
— For the formal institutions, regulation and taxation pillar, Luxembourg stands out in a
category of its own as the country with the most friendly regulation and taxation sys-
tem
— For market conditions, large countries tend to exhibit higher scores because of their
larger domestic markets. But Sweden and Denmark stand out in spite of their rela-
tive smaller domestic market, ranking alongside the UK and Germany. The Czech Re-
public is performing well in the Catchers-up group
— For the physical infrastructure pillar, many Cathing-up countries post scores that are
higher than their overall EIDES score (Czech Republic, Lithuania, Slovenia, Portugal)
and ahead of, e.g., Ireland and France
— For the human capital pillar, Finland ranks ahead of the other countries, followed by
Sweden and Denmark
4 Two-page close-ups of each EU28 country are provided in the country pages (Chapter 6)
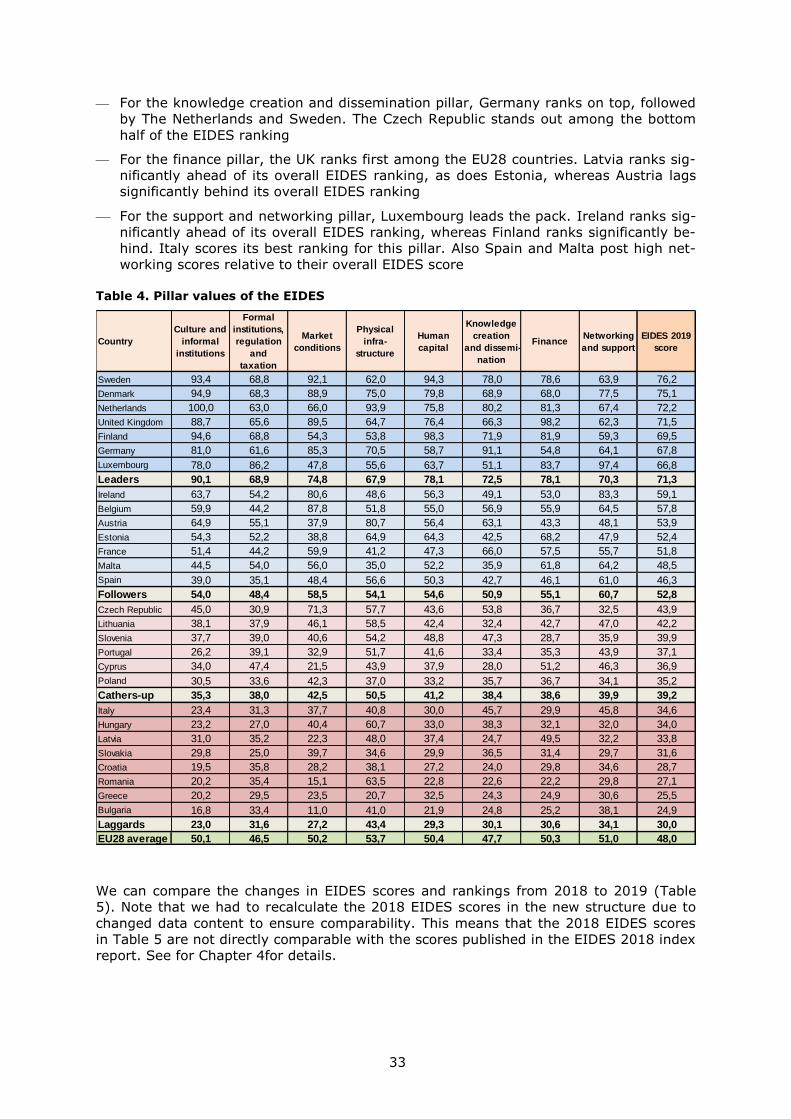
33
— For the knowledge creation and dissemination pillar, Germany ranks on top, followed
by The Netherlands and Sweden. The Czech Republic stands out among the bottom
half of the EIDES ranking
— For the finance pillar, the UK ranks first among the EU28 countries. Latvia ranks sig-
nificantly ahead of its overall EIDES ranking, as does Estonia, whereas Austria lags
significantly behind its overall EIDES ranking
— For the support and networking pillar, Luxembourg leads the pack. Ireland ranks sig-
nificantly ahead of its overall EIDES ranking, whereas Finland ranks significantly be-
hind. Italy scores its best ranking for this pillar. Also Spain and Malta post high net-
working scores relative to their overall EIDES score
Table 4. Pillar values of the EIDES
We can compare the changes in EIDES scores and rankings from 2018 to 2019 (Table
5). Note that we had to recalculate the 2018 EIDES scores in the new structure due to
changed data content to ensure comparability. This means that the 2018 EIDES scores
in Table 5 are not directly comparable with the scores published in the EIDES 2018 index
report. See for Chapter 4for details.
Country
Culture and
informal
institutions
Formal
institutions,
regulation
and
taxation
Market
conditions
Physical
infra-
structure
Human
capital
Knowledge
creation
and dissemi-
nation
FinanceNetworking
and support
EIDES 2019
score
Sweden 93,4 68,8 92,1 62,0 94,3 78,0 78,6 63,9 76,2
Denmark 94,9 68,3 88,9 75,0 79,8 68,9 68,0 77,5 75,1
Netherlands 100,0 63,0 66,0 93,9 75,8 80,2 81,3 67,4 72,2
United Kingdom 88,7 65,6 89,5 64,7 76,4 66,3 98,2 62,3 71,5
Finland 94,6 68,8 54,3 53,8 98,3 71,9 81,9 59,3 69,5
Germany 81,0 61,6 85,3 70,5 58,7 91,1 54,8 64,1 67,8
Luxembourg 78,0 86,2 47,8 55,6 63,7 51,1 83,7 97,4 66,8
Leaders 90,1 68,9 74,8 67,9 78,1 72,5 78,1 70,3 71,3
Ireland 63,7 54,2 80,6 48,6 56,3 49,1 53,0 83,3 59,1
Belgium 59,9 44,2 87,8 51,8 55,0 56,9 55,9 64,5 57,8
Austria 64,9 55,1 37,9 80,7 56,4 63,1 43,3 48,1 53,9
Estonia 54,3 52,2 38,8 64,9 64,3 42,5 68,2 47,9 52,4
France 51,4 44,2 59,9 41,2 47,3 66,0 57,5 55,7 51,8
Malta 44,5 54,0 56,0 35,0 52,2 35,9 61,8 64,2 48,5
Spain 39,0 35,1 48,4 56,6 50,3 42,7 46,1 61,0 46,3
Followers 54,0 48,4 58,5 54,1 54,6 50,9 55,1 60,7 52,8
Czech Republic 45,0 30,9 71,3 57,7 43,6 53,8 36,7 32,5 43,9
Lithuania 38,1 37,9 46,1 58,5 42,4 32,4 42,7 47,0 42,2
Slovenia 37,7 39,0 40,6 54,2 48,8 47,3 28,7 35,9 39,9
Portugal 26,2 39,1 32,9 51,7 41,6 33,4 35,3 43,9 37,1
Cyprus 34,0 47,4 21,5 43,9 37,9 28,0 51,2 46,3 36,9
Poland 30,5 33,6 42,3 37,0 33,2 35,7 36,7 34,1 35,2
Cathers-up 35,3 38,0 42,5 50,5 41,2 38,4 38,6 39,9 39,2
Italy 23,4 31,3 37,7 40,8 30,0 45,7 29,9 45,8 34,6
Hungary 23,2 27,0 40,4 60,7 33,0 38,3 32,1 32,0 34,0
Latvia 31,0 35,2 22,3 48,0 37,4 24,7 49,5 32,2 33,8
Slovakia 29,8 25,0 39,7 34,6 29,9 36,5 31,4 29,7 31,6
Croatia 19,5 35,8 28,2 38,1 27,2 24,0 29,8 34,6 28,7
Romania 20,2 35,4 15,1 63,5 22,8 22,6 22,2 29,8 27,1
Greece 20,2 29,5 23,5 20,7 32,5 24,3 24,9 30,6 25,5
Bulgaria 16,8 33,4 11,0 41,0 21,9 24,8 25,2 38,1 24,9
Laggards 23,0 31,6 27,2 43,4 29,3 30,1 30,6 34,1 30,0
EU28 average 50,1 46,5 50,2 53,7 50,4 47,7 50,3 51,0 48,0
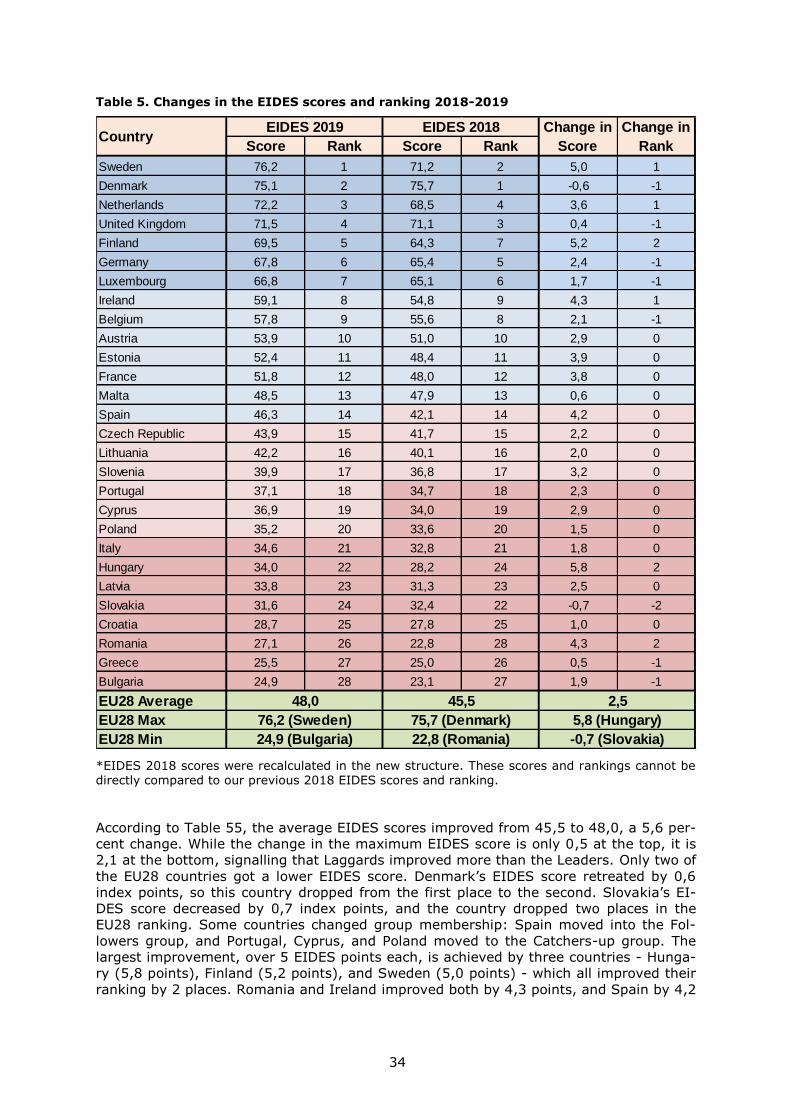
34
Table 5. Changes in the EIDES scores and ranking 2018-2019
*EIDES 2018 scores were recalculated in the new structure. These scores and rankings cannot be directly compared to our previous 2018 EIDES scores and ranking.
According to Table 55, the average EIDES scores improved from 45,5 to 48,0, a 5,6 per-
cent change. While the change in the maximum EIDES score is only 0,5 at the top, it is
2,1 at the bottom, signalling that Laggards improved more than the Leaders. Only two of
the EU28 countries got a lower EIDES score. Denmark’s EIDES score retreated by 0,6
index points, so this country dropped from the first place to the second. Slovakia’s EI-
DES score decreased by 0,7 index points, and the country dropped two places in the
EU28 ranking. Some countries changed group membership: Spain moved into the Fol-
lowers group, and Portugal, Cyprus, and Poland moved to the Catchers-up group. The
largest improvement, over 5 EIDES points each, is achieved by three countries - Hunga-
ry (5,8 points), Finland (5,2 points), and Sweden (5,0 points) - which all improved their
ranking by 2 places. Romania and Ireland improved both by 4,3 points, and Spain by 4,2
Score Rank Score Rank
Sweden 76,2 1 71,2 2 5,0 1
Denmark 75,1 2 75,7 1 -0,6 -1
Netherlands 72,2 3 68,5 4 3,6 1
United Kingdom 71,5 4 71,1 3 0,4 -1
Finland 69,5 5 64,3 7 5,2 2
Germany 67,8 6 65,4 5 2,4 -1
Luxembourg 66,8 7 65,1 6 1,7 -1
Ireland 59,1 8 54,8 9 4,3 1
Belgium 57,8 9 55,6 8 2,1 -1
Austria 53,9 10 51,0 10 2,9 0
Estonia 52,4 11 48,4 11 3,9 0
France 51,8 12 48,0 12 3,8 0
Malta 48,5 13 47,9 13 0,6 0
Spain 46,3 14 42,1 14 4,2 0
Czech Republic 43,9 15 41,7 15 2,2 0
Lithuania 42,2 16 40,1 16 2,0 0
Slovenia 39,9 17 36,8 17 3,2 0
Portugal 37,1 18 34,7 18 2,3 0
Cyprus 36,9 19 34,0 19 2,9 0
Poland 35,2 20 33,6 20 1,5 0
Italy 34,6 21 32,8 21 1,8 0
Hungary 34,0 22 28,2 24 5,8 2
Latvia 33,8 23 31,3 23 2,5 0
Slovakia 31,6 24 32,4 22 -0,7 -2
Croatia 28,7 25 27,8 25 1,0 0
Romania 27,1 26 22,8 28 4,3 2
Greece 25,5 27 25,0 26 0,5 -1
Bulgaria 24,9 28 23,1 27 1,9 -1
EU28 Average
EU28 Max
EU28 Min -0,7 (Slovakia)
75,7 (Denmark)
22,8 (Romania)24,9 (Bulgaria)
76,2 (Sweden)
48,0 45,5 2,5
5,8 (Hungary)
CountryEIDES 2019 EIDES 2018 Change in
Score
Change in
Rank
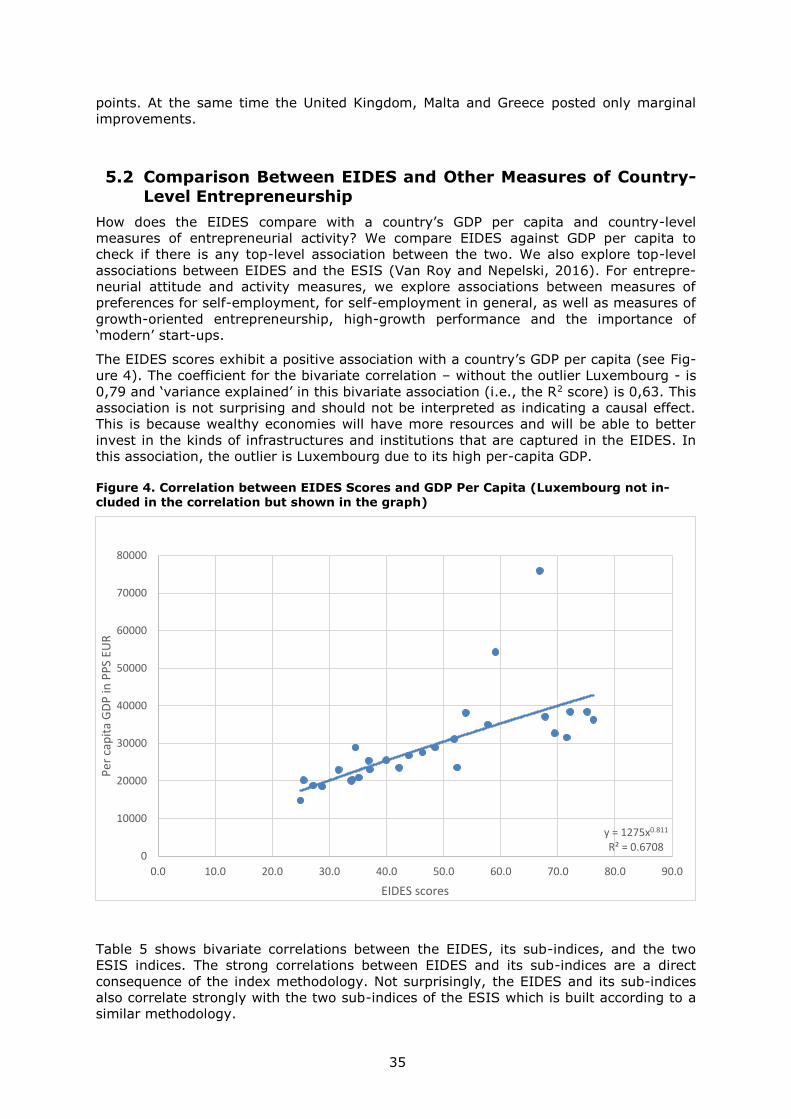
35
points. At the same time the United Kingdom, Malta and Greece posted only marginal
improvements.
5.2 Comparison Between EIDES and Other Measures of Country-
Level Entrepreneurship
How does the EIDES compare with a country’s GDP per capita and country-level
measures of entrepreneurial activity? We compare EIDES against GDP per capita to
check if there is any top-level association between the two. We also explore top-level
associations between EIDES and the ESIS (Van Roy and Nepelski, 2016). For entrepre-
neurial attitude and activity measures, we explore associations between measures of
preferences for self-employment, for self-employment in general, as well as measures of
growth-oriented entrepreneurship, high-growth performance and the importance of
‘modern’ start-ups.
The EIDES scores exhibit a positive association with a country’s GDP per capita (see Fig-
ure 4). The coefficient for the bivariate correlation – without the outlier Luxembourg - is
0,79 and ‘variance explained’ in this bivariate association (i.e., the R2 score) is 0,63. This
association is not surprising and should not be interpreted as indicating a causal effect.
This is because wealthy economies will have more resources and will be able to better
invest in the kinds of infrastructures and institutions that are captured in the EIDES. In
this association, the outlier is Luxembourg due to its high per-capita GDP.
Figure 4. Correlation between EIDES Scores and GDP Per Capita (Luxembourg not in-cluded in the correlation but shown in the graph)
Table 5 shows bivariate correlations between the EIDES, its sub-indices, and the two
ESIS indices. The strong correlations between EIDES and its sub-indices are a direct
consequence of the index methodology. Not surprisingly, the EIDES and its sub-indices
also correlate strongly with the two sub-indices of the ESIS which is built according to a
similar methodology.
y = 1275x0.811
R² = 0.67080
10000
20000
30000
40000
50000
60000
70000
80000
0.0 10.0 20.0 30.0 40.0 50.0 60.0 70.0 80.0 90.0
Per
cap
ita
GD
P in
PP
S EU
R
EIDES scores
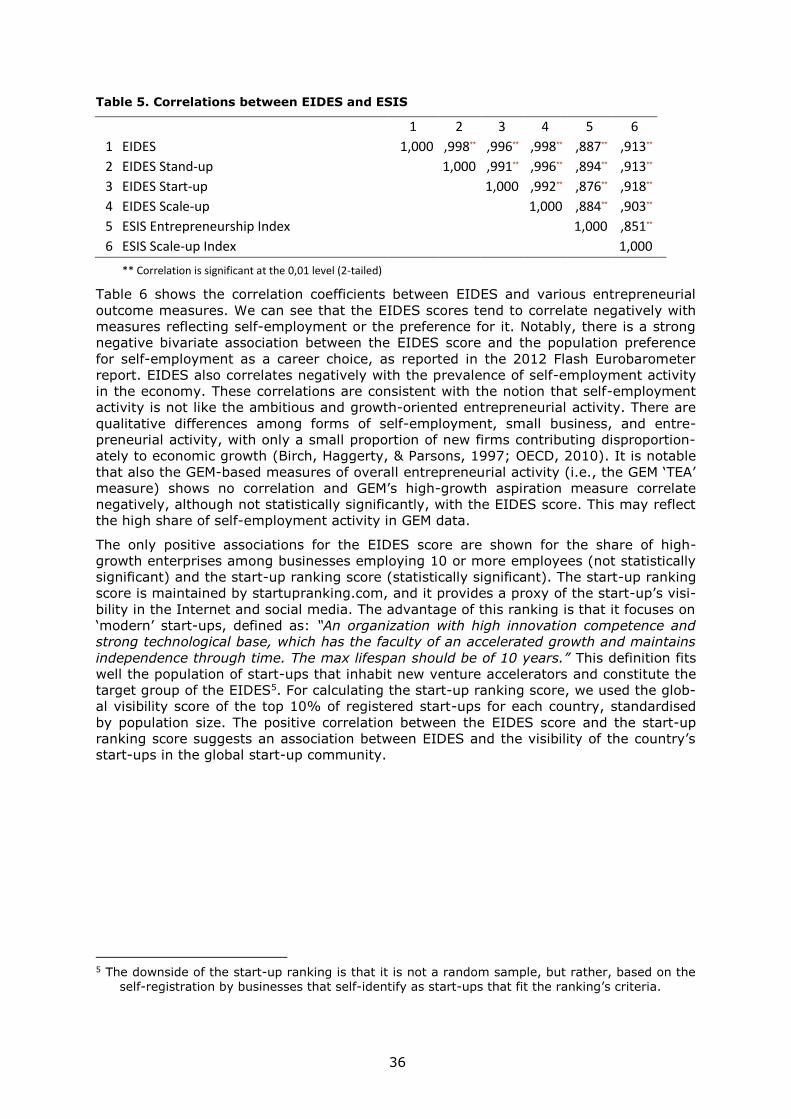
36
Table 5. Correlations between EIDES and ESIS
1 2 3 4 5 6
1 EIDES 1,000 ,998** ,996** ,998** ,887** ,913**
2 EIDES Stand-up 1,000 ,991** ,996** ,894** ,913**
3 EIDES Start-up 1,000 ,992** ,876** ,918**
4 EIDES Scale-up 1,000 ,884** ,903**
5 ESIS Entrepreneurship Index 1,000 ,851**
6 ESIS Scale-up Index 1,000
** Correlation is significant at the 0,01 level (2-tailed)
Table 6 shows the correlation coefficients between EIDES and various entrepreneurial
outcome measures. We can see that the EIDES scores tend to correlate negatively with
measures reflecting self-employment or the preference for it. Notably, there is a strong
negative bivariate association between the EIDES score and the population preference
for self-employment as a career choice, as reported in the 2012 Flash Eurobarometer
report. EIDES also correlates negatively with the prevalence of self-employment activity
in the economy. These correlations are consistent with the notion that self-employment
activity is not like the ambitious and growth-oriented entrepreneurial activity. There are
qualitative differences among forms of self-employment, small business, and entre-
preneurial activity, with only a small proportion of new firms contributing disproportion-
ately to economic growth (Birch, Haggerty, & Parsons, 1997; OECD, 2010). It is notable
that also the GEM-based measures of overall entrepreneurial activity (i.e., the GEM ‘TEA’
measure) shows no correlation and GEM’s high-growth aspiration measure correlate
negatively, although not statistically significantly, with the EIDES score. This may reflect
the high share of self-employment activity in GEM data.
The only positive associations for the EIDES score are shown for the share of high-
growth enterprises among businesses employing 10 or more employees (not statistically
significant) and the start-up ranking score (statistically significant). The start-up ranking
score is maintained by startupranking.com, and it provides a proxy of the start-up’s visi-
bility in the Internet and social media. The advantage of this ranking is that it focuses on
‘modern’ start-ups, defined as: “An organization with high innovation competence and
strong technological base, which has the faculty of an accelerated growth and maintains
independence through time. The max lifespan should be of 10 years.” This definition fits
well the population of start-ups that inhabit new venture accelerators and constitute the
target group of the EIDES5. For calculating the start-up ranking score, we used the glob-
al visibility score of the top 10% of registered start-ups for each country, standardised
by population size. The positive correlation between the EIDES score and the start-up
ranking score suggests an association between EIDES and the visibility of the country’s
start-ups in the global start-up community.
5 The downside of the start-up ranking is that it is not a random sample, but rather, based on the
self-registration by businesses that self-identify as start-ups that fit the ranking’s criteria.
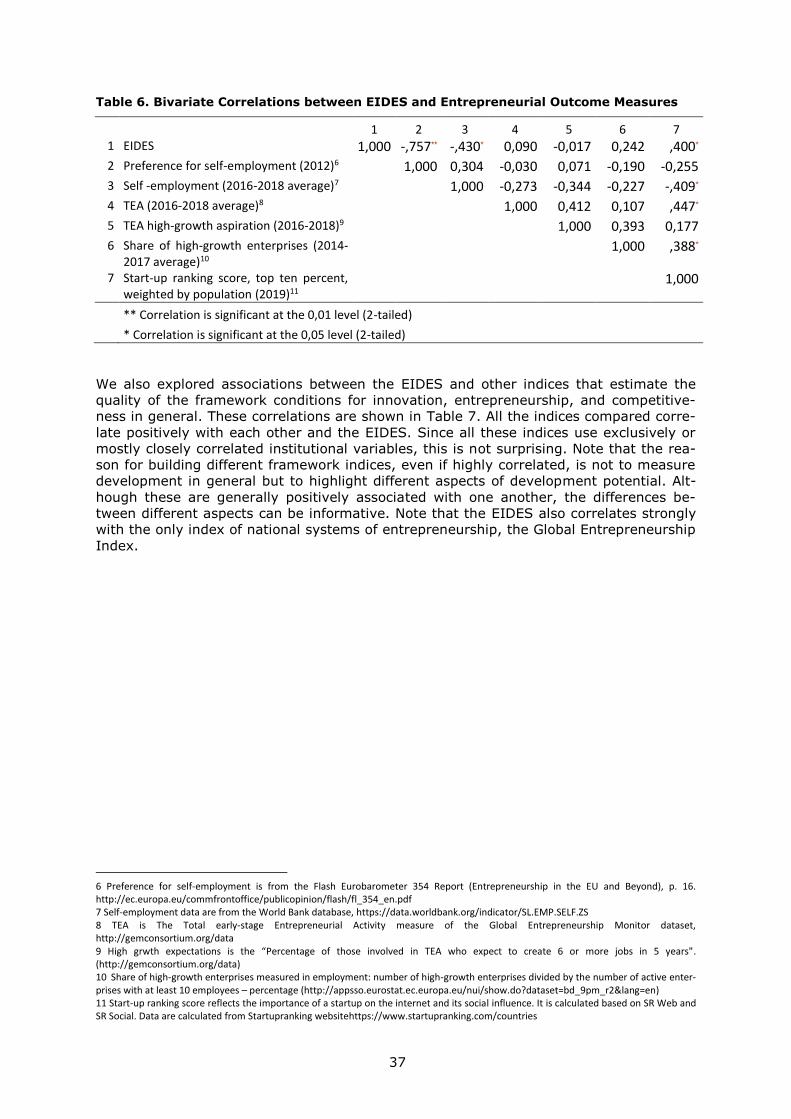
37
Table 6. Bivariate Correlations between EIDES and Entrepreneurial Outcome Measures
1 2 3 4 5 6 7
1 EIDES 1,000 -,757** -,430* 0,090 -0,017 0,242 ,400*
2 Preference for self-employment (2012)6 1,000 0,304 -0,030 0,071 -0,190 -0,255
3 Self -employment (2016-2018 average)7 1,000 -0,273 -0,344 -0,227 -,409*
4 TEA (2016-2018 average)8 1,000 0,412 0,107 ,447*
5 TEA high-growth aspiration (2016-2018)9 1,000 0,393 0,177
6 Share of high-growth enterprises (2014-2017 average)10
1,000 ,388*
7 Start-up ranking score, top ten percent, weighted by population (2019)11
1,000
** Correlation is significant at the 0,01 level (2-tailed)
* Correlation is significant at the 0,05 level (2-tailed)
We also explored associations between the EIDES and other indices that estimate the
quality of the framework conditions for innovation, entrepreneurship, and competitive-
ness in general. These correlations are shown in Table 7. All the indices compared corre-
late positively with each other and the EIDES. Since all these indices use exclusively or
mostly closely correlated institutional variables, this is not surprising. Note that the rea-
son for building different framework indices, even if highly correlated, is not to measure
development in general but to highlight different aspects of development potential. Alt-
hough these are generally positively associated with one another, the differences be-
tween different aspects can be informative. Note that the EIDES also correlates strongly
with the only index of national systems of entrepreneurship, the Global Entrepreneurship
Index.
6 Preference for self-employment is from the Flash Eurobarometer 354 Report (Entrepreneurship in the EU and Beyond), p. 16. http://ec.europa.eu/commfrontoffice/publicopinion/flash/fl_354_en.pdf 7 Self-employment data are from the World Bank database, https://data.worldbank.org/indicator/SL.EMP.SELF.ZS 8 TEA is The Total early-stage Entrepreneurial Activity measure of the Global Entrepreneurship Monitor dataset, http://gemconsortium.org/data 9 High grwth expectations is the “Percentage of those involved in TEA who expect to create 6 or more jobs in 5 years". (http://gemconsortium.org/data) 10 Share of high-growth enterprises measured in employment: number of high-growth enterprises divided by the number of active enter-prises with at least 10 employees – percentage (http://appsso.eurostat.ec.europa.eu/nui/show.do?dataset=bd_9pm_r2&lang=en) 11 Start-up ranking score reflects the importance of a startup on the internet and its social influence. It is calculated based on SR Web and SR Social. Data are calculated from Startupranking websitehttps://www.startupranking.com/countries

38
Table 7. Bivariate Correlations between EIDES and Framework Indices
1 2 3 4 5 6
1 EIDES 1,000 ,943** ,952** ,927** ,961** ,935**
2 Global Competitiveness Index (2018-2019)12 1,000 ,933** ,821** ,918** ,911**
3 Global Innovation Index (2018)13 1,000 ,882** ,910** ,904**
4 Digital Economy and Society Index (2019)14 1,000 ,919** ,871**
5 Networked Readiness Index (2016)15 1,000 ,930**
6 Global Entrepreneurship Index (2012-2016 average)16 1,000
** Correlation is significant at the 0,01 level (2-tailed)
* Correlation is significant at the 0,05 level (2-tailed)
12 Global Competitiveness Index score is the World Economic Forum’s flagship product, measuring presents a framework and a corre-sponding set of indicators in three principal categories (subindexes) and twelve policy domains (pillars) for the economies. present data are from the 2017-2018 edition. (https://www.weforum.org/reports/the-global-competitiveness-report-2017-2018) 13 Global Innovation Index score is from the Global Innovation Index 2017 INSEAD report. measuring various aspect of the innovation system. Data are from the 2017 issue (https://www.globalinnovationindex.org/) 14 Digital Economy and Society Index is a composite index that summarises relevant indicators on Europe’s digital performance and tracks the evolution of EU Member States in digital competitiveness (https://ec.europa.eu/digital-single-market/en/desi). We used the most recent 2017 data. 15 Networked Readiness Index (NRI) scores are from the World Economic Forum Global information Technology Report. NRI is a tool assessing countries’ preparedness to reap the benefits of emerging technologies and capitalize on the opportunities presented by the digital transformation and beyond. (http://reports.weforum.org/global-information-technology-report-2016/1-1-the-networked-readiness-index-2016/) 16 Global Entrepreneurship Index is a measure of countries’ entrepreneurship system in fourteen categories by combining both the indi-vidual and the institutional aspects of potentially high impact startups. Data are from the 2011-2015 GEI reports and GEDI dataset (http://thegedi.org/downloads/)
39
6 Country Pages
6.1 Country Page Guide
1. General information starts with the official country name, followed by popula-
tion size (millions, average for years 2016-2018) and GDP per capita (purchasing
power parity based on euro averages for years 2015-2017). This data was re-
trieved from the Eurostat database17 on the 31st of May 2019.
2. Performance overview provides the country’s overall performance in EIDES.
3. Country group indicates the country’s performance relative to others, grouped
in four categories:
Laggards (EIDES score below 35)
Catchers-up (35 < EIDES score ≤45)
Followers (45 < EIDES score ≤ 60)
Leaders (EIDES score over 60)
4. EIDES rank is the country’s EIDES ranking among the EU28 countries.
5. EIDES score is the EIDES overall index score on a scale from 0 (low) to 100
(high).
6. The three sub-indices show the country’s EU28 ranking and the country’s score
(in parentheses) for each of the three sub-indices: the Digital Entrepreneurship
Stand-up sub-index, the Digital Entrepreneurship Start-up sub-index, and the
Digital Entrepreneurship Scale-up sub-index. Sub-index scores are on a scale
from 0 to 100 index points.
7. EIDES profile is a spider diagram that shows the performance of each country
for the eight EIDES pillars. The country performance is compared against the av-
erage pillar scores of each country group. For individual countries in the Leader
and the Follower groups, the country’s pillar score is compared against the Leader
and Follower group averages. For countries in the Catchers-up group, the coun-
try’s pillar score is compared against the Follower and Catchers-up group averag-
es. For countries in the Laggards group, the country’s pillar score is shown
against the group averages for the Catchers-up and the Followers groups. All
scales are from 0 to 100.
8. Pillar performance. Below the EIDES profile diagram we show the country’s
scores for its strongest and weakest index pillar (in parentheses). Pillar scores are
from 0 to 100.
9. EIDES pillar and component values. On page two of the individual country re-
ports we present the pillar values for each of the eight EIDES pillars. We also list
the non-digitalised value of the pillar (‘non-digital score’), as well as the value of
the digitalisation parameter (‘digital’). It is important to recognise that the scores
of individual pillar components are NOT the result of a simple multiplication of the
non-digital (i.e., ‘non-digital score’) and the digital (i.e., ‘digital’) components.
The EIDES pillar scores are calculated from ‘raw’ values. In columns ‘non-digital
score’ and ‘digital’ we report normalised and average adjusted values for the re-
spective pillar components. The colours in each cell of the table denote the quar-
tile within which the country is grouped for each component. Dark blue colour of
the cell indicates the top quartile; light blue the second quartile; light brown the
third quartile; and dark brown the bottom quartile.
17 http://ec.europa.eu/eurostat/data/database
40
(a) Pillar: In the first column we list the eight pillar names and the three sub-
index names as well as the EIDES score.
(b) Pillar score column shows the country’s pillar scores on a 0-100 point
scale.
(c) Non-digital score column shows the country’s non-digitalised pillar
scores. The calculation of these scores is described in Annex 1 (scale from
0 to 100).
(d) Digital column shows the digital component scores on a scale from 0 to
100. The calculation of these scores is described in Annex 1.
(e) EIDES score shows the overall index score, as well as the scores for non-
digital and digital components on a scale from 0 to 100.
(f) Sub-index scores are shown for each of the digital entrepreneurship sub-
indices on a scale from 0 to 100. Colour codes are as described above.
10. Policy optimisation simulation. Finally, we present a policy optimisation simu-
lation for each country. This simulation informs on the ‘optimal’ allocation of poli-
cy attention and policy resources for improving the country’s EIDES performance.
This simulation assumes that the country’s entrepreneurial dynamic is held back
most by its ‘weakest’, or ‘bottleneck’ pillar – i.e., the pillar with the lowest pillar
score. Under this assumption, the ‘optimal’ allocation of policy resources should
always target the weakest pillar first. Once the individual pillar performance has
improved such that the pillar no longer constitutes a bottleneck, policy attention
should shift to focus on the second weakest pillar, and so on. An ‘optimal’ policy
therefore systematically and dynamically addresses ‘bottleneck’ pillars until the
desired improvement in the EIDES score has been achieved.
This simulation assumes that the marginal cost of performance improvement is
the same for each index pillar. Because of this simplifying assumption, the sce-
nario shown in the policy optimisation simulation should NOT be taken as pre-
scriptive. Instead, the simulation simply suggests potential bottlenecks in each
country’s digital entrepreneurship system, providing material for policy debates.
In the simulation, we have set the target for each country as reaching a 10% in-
crease in the EIDES score. The graph then shows the ‘optimal’ allocation of policy
resources across the four General Framework Condition Pillars (GFC) and the
twelve Systemic Framework Condition Pillars (SFC; remember that separate SFC
pillar values are calculated for the stand-up, start-up, and scale-up stages, creat-
ing a total of 12 SFC pillar values).
11. Sum of additional resources (in unit per population): Below the policy simula-
tion table we report the sum of the addition units that is required to reach a 10
point increase in the EIDES score. While the monetary value of the unit is un-
known, its magnitude reflects to the amount of additional money required for the
10 point EIDES score increase. This value is expressed in unit per population. The
additional unit for this 10% increase ranges from 12,0 (Romania) to 96,0 (Den-
mark).
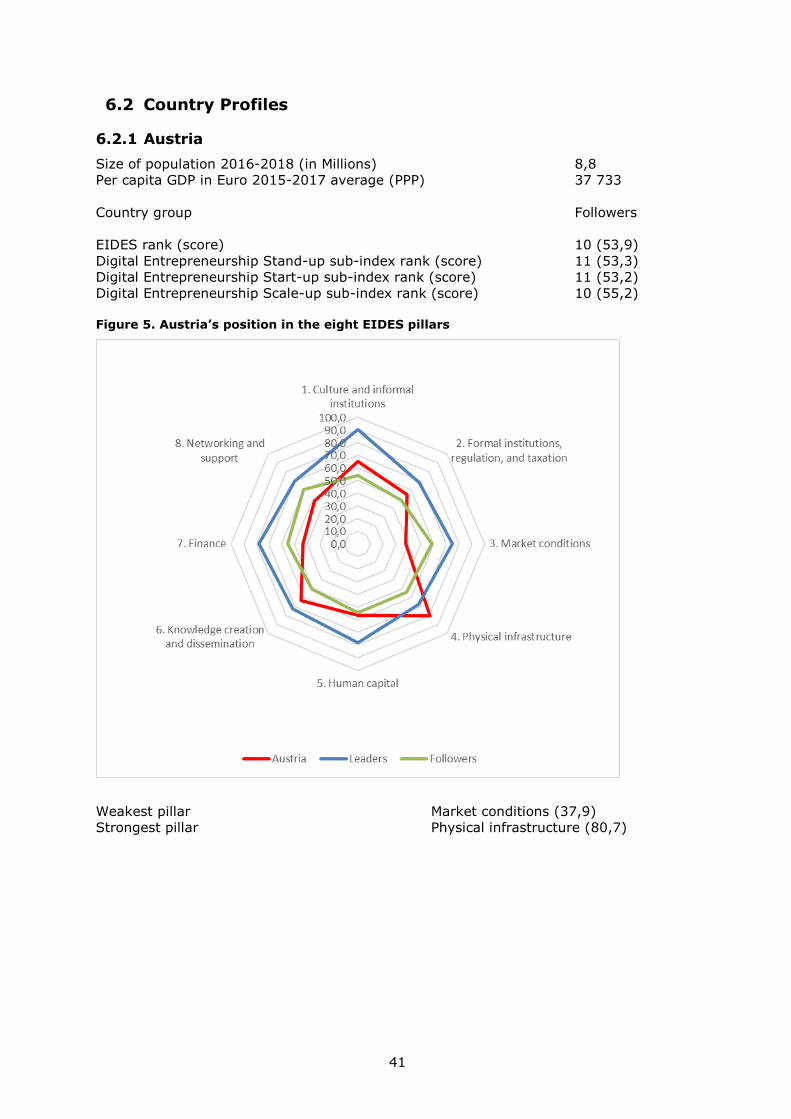
41
6.2 Country Profiles
6.2.1 Austria
Size of population 2016-2018 (in Millions) 8,8
Per capita GDP in Euro 2015-2017 average (PPP) 37 733
Country group Followers
EIDES rank (score) 10 (53,9)
Digital Entrepreneurship Stand-up sub-index rank (score) 11 (53,3)
Digital Entrepreneurship Start-up sub-index rank (score) 11 (53,2)
Digital Entrepreneurship Scale-up sub-index rank (score) 10 (55,2)
Figure 5. Austria’s position in the eight EIDES pillars
Weakest pillar Market conditions (37,9)
Strongest pillar Physical infrastructure (80,7)
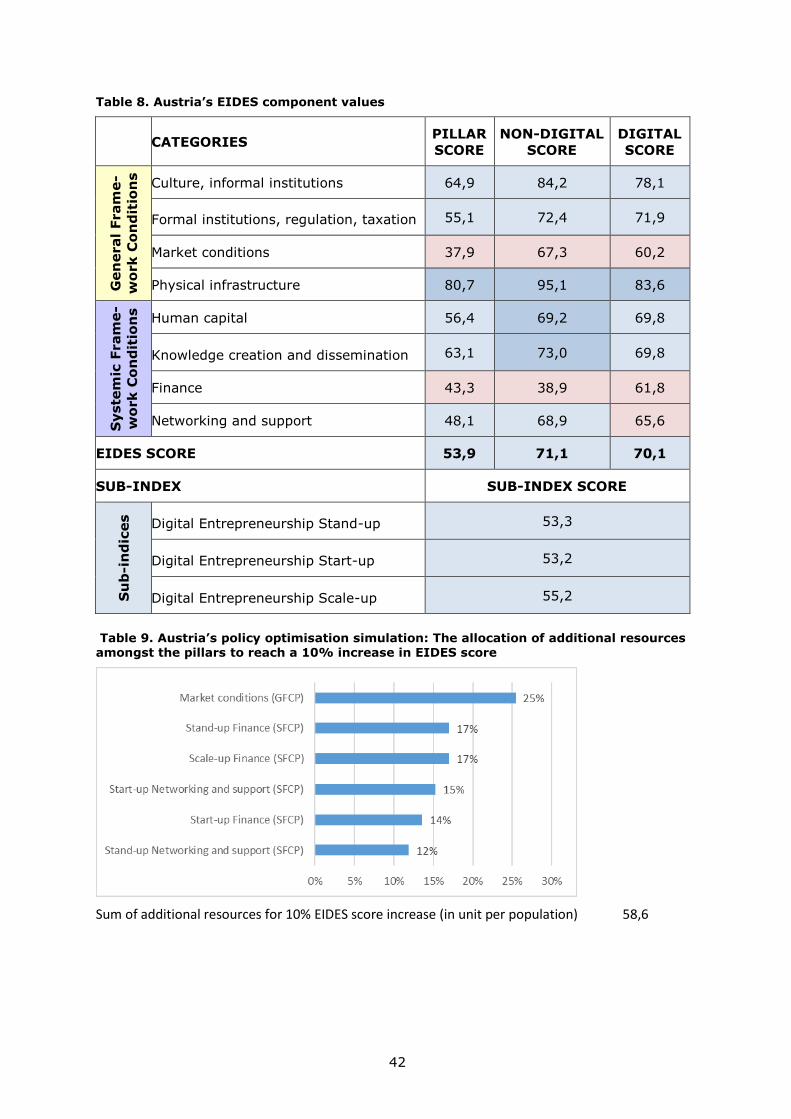
42
Table 8. Austria’s EIDES component values
CATEGORIES PILLAR
SCORE
NON-DIGITAL
SCORE
DIGITAL
SCORE
Gen
eral
Fram
e-
wo
rk
Co
nd
itio
ns
Culture, informal institutions 64,9 84,2 78,1
Formal institutions, regulation, taxation 55,1 72,4 71,9
Market conditions 37,9 67,3 60,2
Physical infrastructure 80,7 95,1 83,6
Syste
mic
Fram
e-
wo
rk
Co
nd
itio
ns
Human capital 56,4 69,2 69,8
Knowledge creation and dissemination 63,1 73,0 69,8
Finance 43,3 38,9 61,8
Networking and support 48,1 68,9 65,6
EIDES SCORE 53,9 71,1 70,1
SUB-INDEX SUB-INDEX SCORE
Su
b-i
nd
ices
Digital Entrepreneurship Stand-up 53,3
Digital Entrepreneurship Start-up 53,2
Digital Entrepreneurship Scale-up 55,2
Table 9. Austria’s policy optimisation simulation: The allocation of additional resources amongst the pillars to reach a 10% increase in EIDES score
Sum of additional resources for 10% EIDES score increase (in unit per population) 58,6
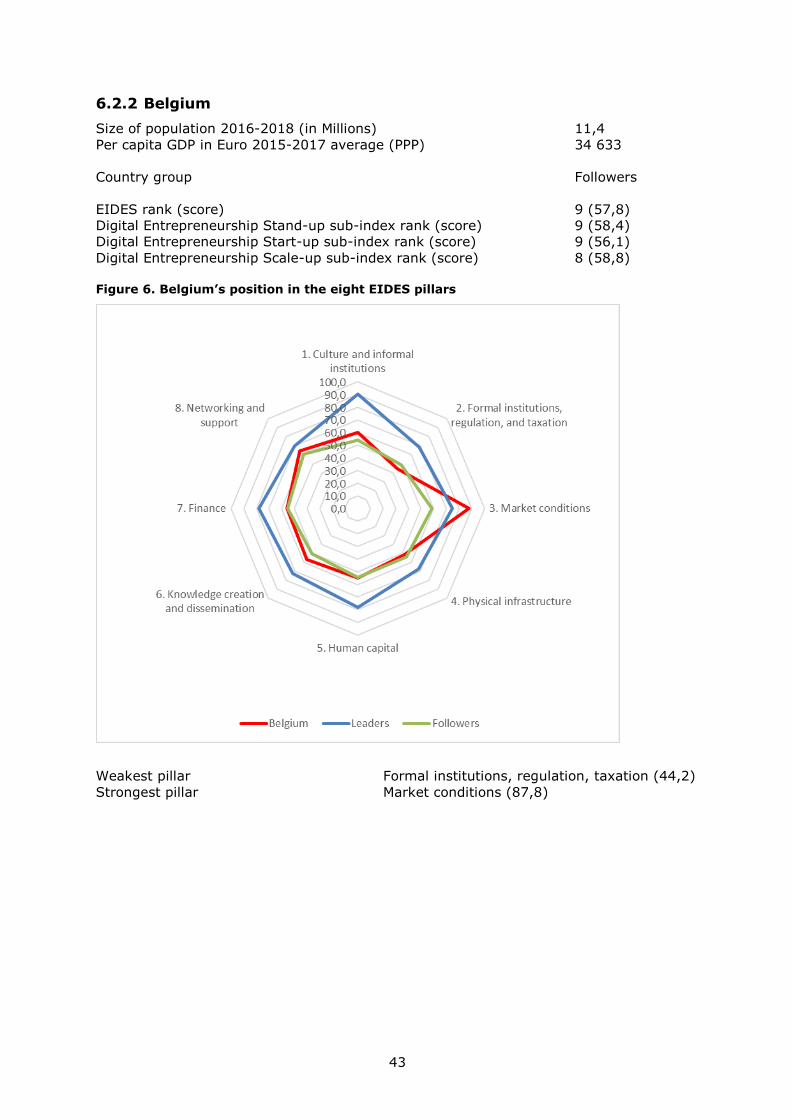
43
6.2.2 Belgium
Size of population 2016-2018 (in Millions) 11,4
Per capita GDP in Euro 2015-2017 average (PPP) 34 633
Country group Followers
EIDES rank (score) 9 (57,8)
Digital Entrepreneurship Stand-up sub-index rank (score) 9 (58,4)
Digital Entrepreneurship Start-up sub-index rank (score) 9 (56,1)
Digital Entrepreneurship Scale-up sub-index rank (score) 8 (58,8)
Figure 6. Belgium’s position in the eight EIDES pillars
Weakest pillar Formal institutions, regulation, taxation (44,2)
Strongest pillar Market conditions (87,8)
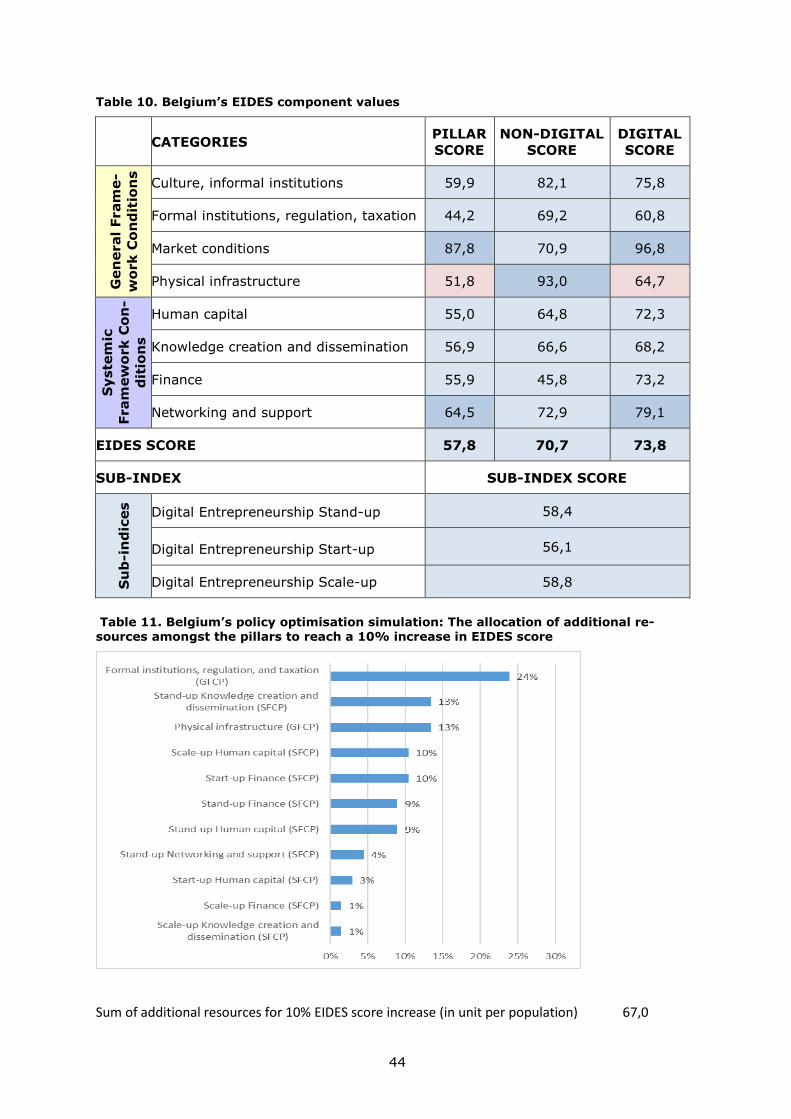
44
Table 10. Belgium’s EIDES component values
CATEGORIES PILLAR
SCORE
NON-DIGITAL
SCORE
DIGITAL
SCORE
Gen
eral
Fram
e-
wo
rk
Co
nd
itio
ns
Culture, informal institutions 59,9 82,1 75,8
Formal institutions, regulation, taxation 44,2 69,2 60,8
Market conditions 87,8 70,9 96,8
Physical infrastructure 51,8 93,0 64,7
Syste
mic
Fram
ew
ork C
on
-
dit
ion
s
Human capital 55,0 64,8 72,3
Knowledge creation and dissemination 56,9 66,6 68,2
Finance 55,9 45,8 73,2
Networking and support 64,5 72,9 79,1
EIDES SCORE 57,8 70,7 73,8
SUB-INDEX SUB-INDEX SCORE
Su
b-i
nd
ices
Digital Entrepreneurship Stand-up 58,4
Digital Entrepreneurship Start-up 56,1
Digital Entrepreneurship Scale-up 58,8
Table 11. Belgium’s policy optimisation simulation: The allocation of additional re-sources amongst the pillars to reach a 10% increase in EIDES score
Sum of additional resources for 10% EIDES score increase (in unit per population) 67,0

45
6.2.3 Bulgaria
Size of population 2016-2018 (in Millions) 7,1
Per capita GDP in Euro 2015-2017 average (PPP) 14 233
Country group Laggards
EIDES rank (score) 28 (24,9)
Digital Entrepreneurship Stand-up sub-index rank (score) 28 (23,9)
Digital Entrepreneurship Start-up sub-index rank (score) 28 (26,1)
Digital Entrepreneurship Scale-up sub-index rank (score) 27 (24,8)
Figure 7. Bulgaria’s position in the eight EIDES pillars
Weakest pillar Market conditions (11,0)
Strongest pillar Physical infrastructure (41,0)

46
Table 12. Bulgaria’s EIDES component values
CATEGORIES PILLAR
SCORE
NON-DIGITAL
SCORE
DIGITAL
SCORE
Gen
eral
Fram
e-
wo
rk
Co
nd
itio
ns
Culture, informal institutions 16,8 62,8 33,8
Formal institutions, regulation, taxation 33,4 60,6 53,1
Market conditions 11,0 62,7 29,7
Physical infrastructure 41,0 78,0 70,2
Syste
mic
Fram
e-
wo
rk
Co
nd
itio
ns
Human capital 21,9 48,4 44,3
Knowledge creation and dissemination 24,8 39,1 51,3
Finance 25,2 30,4 40,5
Networking and support 38,1 60,8 59,8
EIDES SCORE 24,9 55,4 47,8
SUB-INDEX SUB-INDEX SCORE
Su
b-i
nd
ices
Digital Entrepreneurship Stand-up 23,9
Digital Entrepreneurship Start-up 26,1
Digital Entrepreneurship Scale-up 24,8
Table 13. Bulgaria’s policy optimisation simulation: The allocation of additional re-sources amongst the pillars to reach a 10% increase in EIDES score
Sum of additional resources for 10% EIDES score increase (in unit per population) 14,0
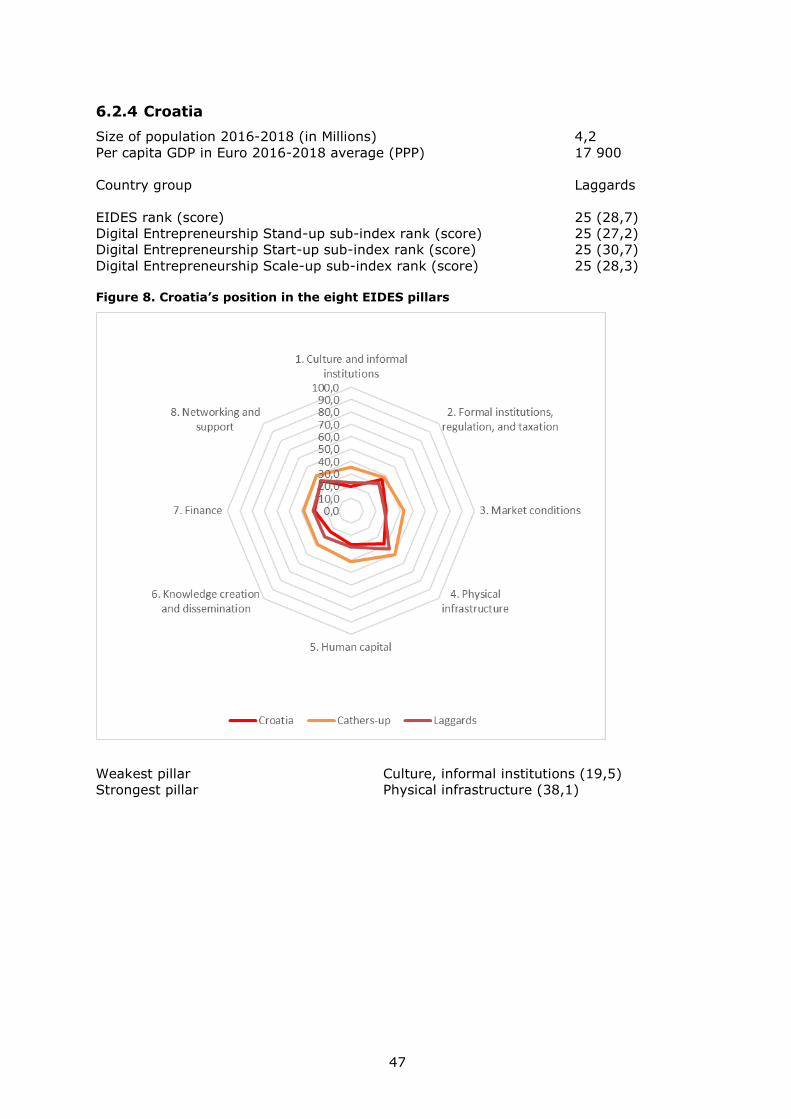
47
6.2.4 Croatia
Size of population 2016-2018 (in Millions) 4,2
Per capita GDP in Euro 2016-2018 average (PPP) 17 900
Country group Laggards
EIDES rank (score) 25 (28,7)
Digital Entrepreneurship Stand-up sub-index rank (score) 25 (27,2)
Digital Entrepreneurship Start-up sub-index rank (score) 25 (30,7)
Digital Entrepreneurship Scale-up sub-index rank (score) 25 (28,3)
Figure 8. Croatia’s position in the eight EIDES pillars
Weakest pillar Culture, informal institutions (19,5)
Strongest pillar Physical infrastructure (38,1)
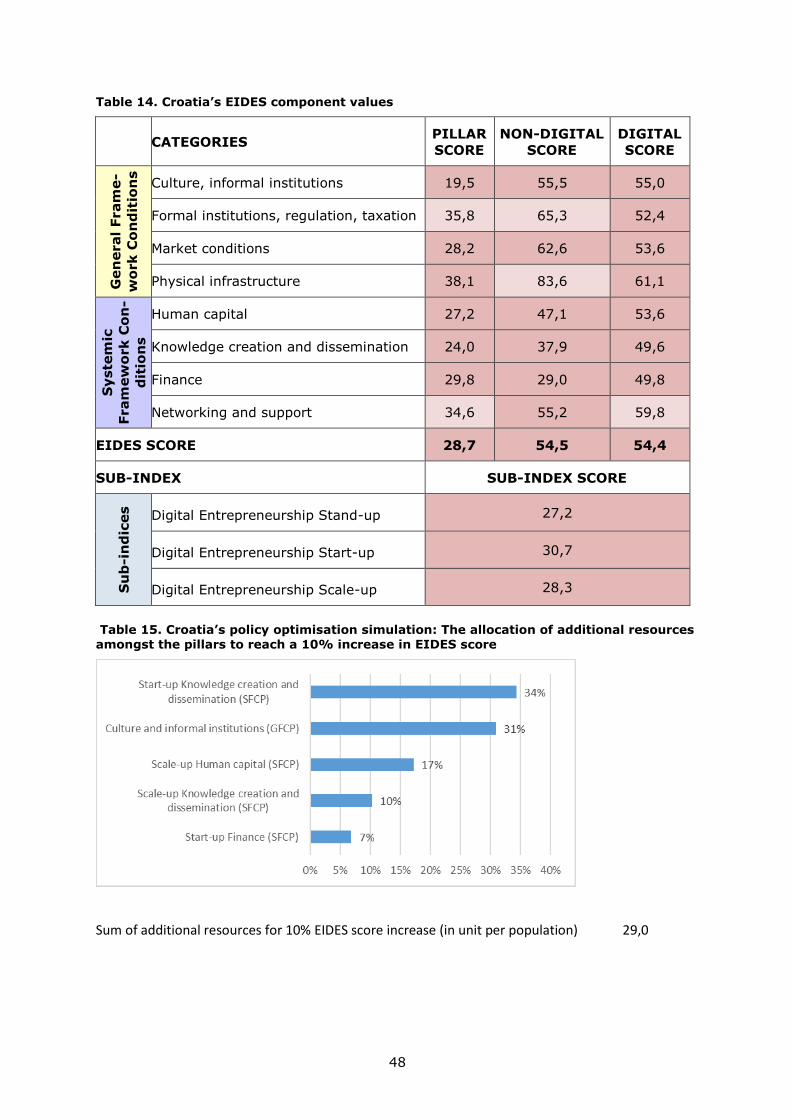
48
Table 14. Croatia’s EIDES component values
CATEGORIES PILLAR
SCORE
NON-DIGITAL
SCORE
DIGITAL
SCORE
Gen
eral
Fram
e-
wo
rk
Co
nd
itio
ns
Culture, informal institutions 19,5 55,5 55,0
Formal institutions, regulation, taxation 35,8 65,3 52,4
Market conditions 28,2 62,6 53,6
Physical infrastructure 38,1 83,6 61,1
Syste
mic
Fram
ew
ork C
on
-
dit
ion
s
Human capital 27,2 47,1 53,6
Knowledge creation and dissemination 24,0 37,9 49,6
Finance 29,8 29,0 49,8
Networking and support 34,6 55,2 59,8
EIDES SCORE 28,7 54,5 54,4
SUB-INDEX SUB-INDEX SCORE
Su
b-i
nd
ices
Digital Entrepreneurship Stand-up 27,2
Digital Entrepreneurship Start-up 30,7
Digital Entrepreneurship Scale-up 28,3
Table 15. Croatia’s policy optimisation simulation: The allocation of additional resources
amongst the pillars to reach a 10% increase in EIDES score
Sum of additional resources for 10% EIDES score increase (in unit per population) 29,0

49
6.2.5 Cyprus
Size of population 2016-2018 (in Millions) 0,90
Per capita GDP in Euro 2016-2018 average (PPP) 24 533
Country group Catchers-up
EIDES rank (score) 19 (36,9)
Digital Entrepreneurship Stand-up sub-index rank (score) 19 (36,7)
Digital Entrepreneurship Start-up sub-index rank (score) 18 (38,6)
Digital Entrepreneurship Scale-up sub-index rank (score) 20 (35,4)
Figure 9. Cyprus’s position in the eight EIDES pillars
Weakest pillar Market conditions (21,5)
Strongest pillar Finance (51,2)
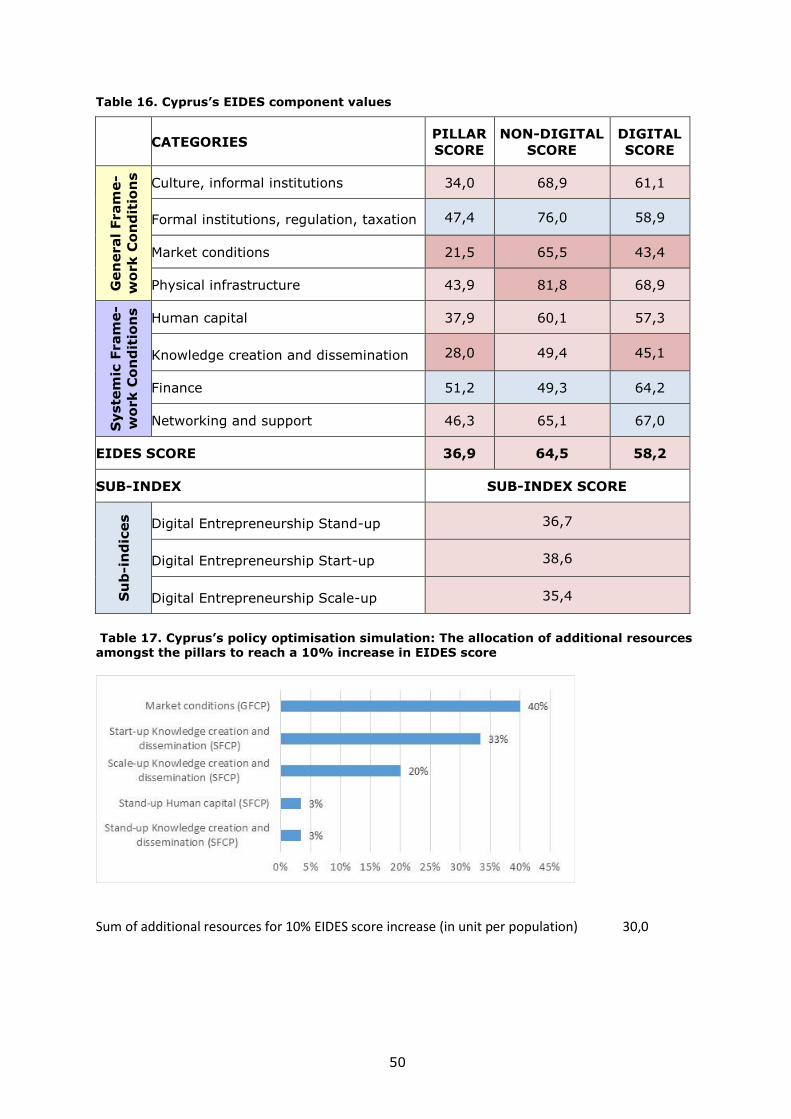
50
Table 16. Cyprus’s EIDES component values
CATEGORIES PILLAR
SCORE
NON-DIGITAL
SCORE
DIGITAL
SCORE
Gen
eral
Fram
e-
wo
rk
Co
nd
itio
ns
Culture, informal institutions 34,0 68,9 61,1
Formal institutions, regulation, taxation 47,4 76,0 58,9
Market conditions 21,5 65,5 43,4
Physical infrastructure 43,9 81,8 68,9
Syste
mic
Fram
e-
wo
rk
Co
nd
itio
ns
Human capital 37,9 60,1 57,3
Knowledge creation and dissemination 28,0 49,4 45,1
Finance 51,2 49,3 64,2
Networking and support 46,3 65,1 67,0
EIDES SCORE 36,9 64,5 58,2
SUB-INDEX SUB-INDEX SCORE
Su
b-i
nd
ices
Digital Entrepreneurship Stand-up 36,7
Digital Entrepreneurship Start-up 38,6
Digital Entrepreneurship Scale-up 35,4
Table 17. Cyprus’s policy optimisation simulation: The allocation of additional resources amongst the pillars to reach a 10% increase in EIDES score
Sum of additional resources for 10% EIDES score increase (in unit per population) 30,0
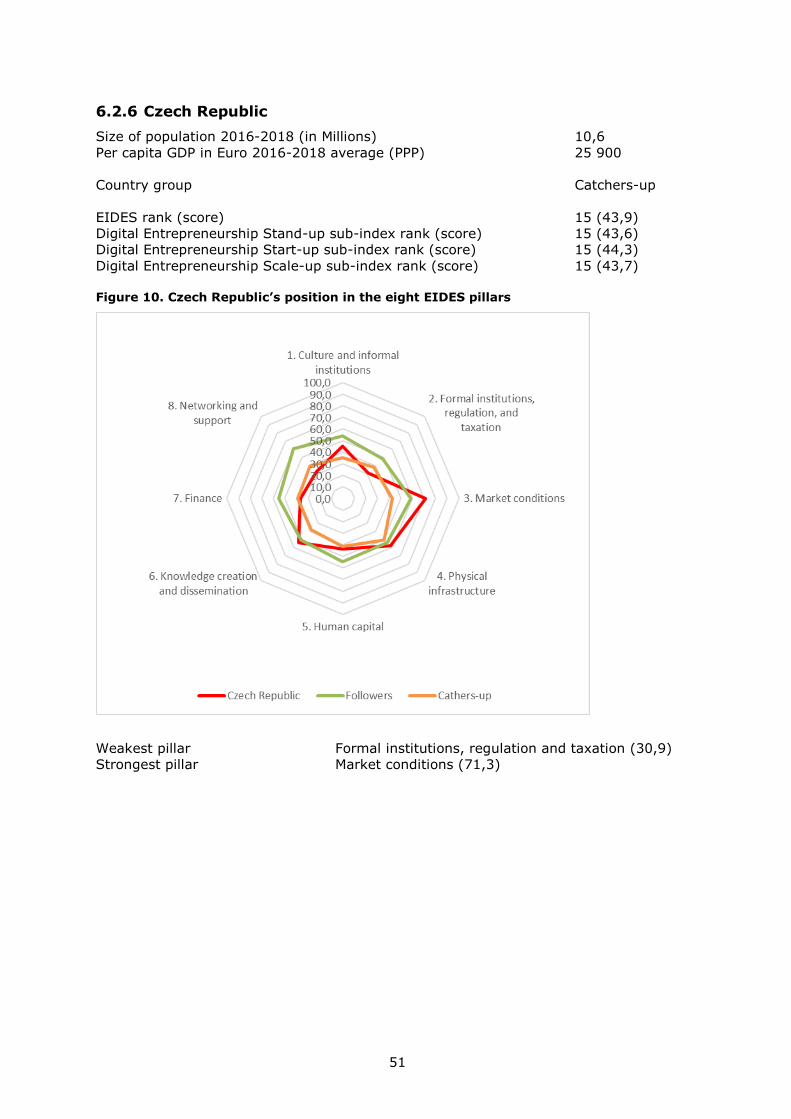
51
6.2.6 Czech Republic
Size of population 2016-2018 (in Millions) 10,6
Per capita GDP in Euro 2016-2018 average (PPP) 25 900
Country group Catchers-up
EIDES rank (score) 15 (43,9)
Digital Entrepreneurship Stand-up sub-index rank (score) 15 (43,6)
Digital Entrepreneurship Start-up sub-index rank (score) 15 (44,3)
Digital Entrepreneurship Scale-up sub-index rank (score) 15 (43,7)
Figure 10. Czech Republic’s position in the eight EIDES pillars
Weakest pillar Formal institutions, regulation and taxation (30,9)
Strongest pillar Market conditions (71,3)
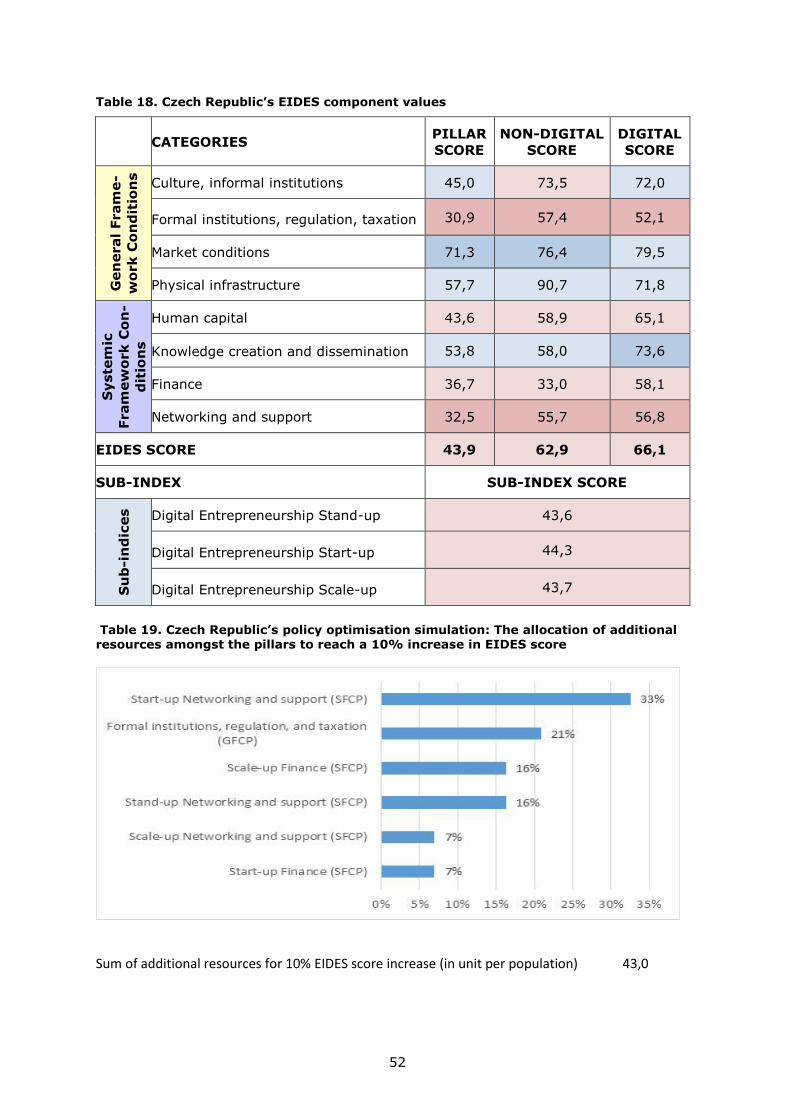
52
Table 18. Czech Republic’s EIDES component values
CATEGORIES PILLAR
SCORE
NON-DIGITAL
SCORE
DIGITAL
SCORE
Gen
eral
Fram
e-
wo
rk
Co
nd
itio
ns
Culture, informal institutions 45,0 73,5 72,0
Formal institutions, regulation, taxation 30,9 57,4 52,1
Market conditions 71,3 76,4 79,5
Physical infrastructure 57,7 90,7 71,8
Syste
mic
Fram
ew
ork C
on
-
dit
ion
s
Human capital 43,6 58,9 65,1
Knowledge creation and dissemination 53,8 58,0 73,6
Finance 36,7 33,0 58,1
Networking and support 32,5 55,7 56,8
EIDES SCORE 43,9 62,9 66,1
SUB-INDEX SUB-INDEX SCORE
Su
b-i
nd
ices
Digital Entrepreneurship Stand-up 43,6
Digital Entrepreneurship Start-up 44,3
Digital Entrepreneurship Scale-up 43,7
Table 19. Czech Republic’s policy optimisation simulation: The allocation of additional resources amongst the pillars to reach a 10% increase in EIDES score
Sum of additional resources for 10% EIDES score increase (in unit per population) 43,0
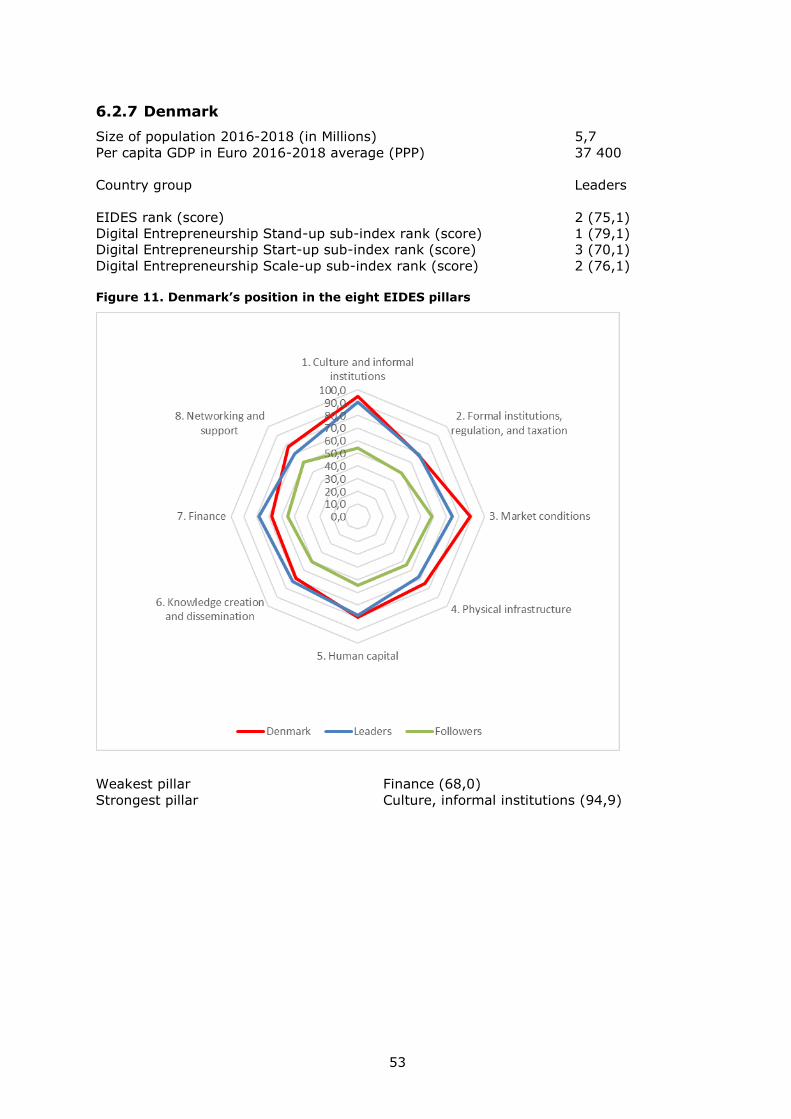
53
6.2.7 Denmark
Size of population 2016-2018 (in Millions) 5,7
Per capita GDP in Euro 2016-2018 average (PPP) 37 400
Country group Leaders
EIDES rank (score) 2 (75,1)
Digital Entrepreneurship Stand-up sub-index rank (score) 1 (79,1)
Digital Entrepreneurship Start-up sub-index rank (score) 3 (70,1)
Digital Entrepreneurship Scale-up sub-index rank (score) 2 (76,1)
Figure 11. Denmark’s position in the eight EIDES pillars
Weakest pillar Finance (68,0)
Strongest pillar Culture, informal institutions (94,9)
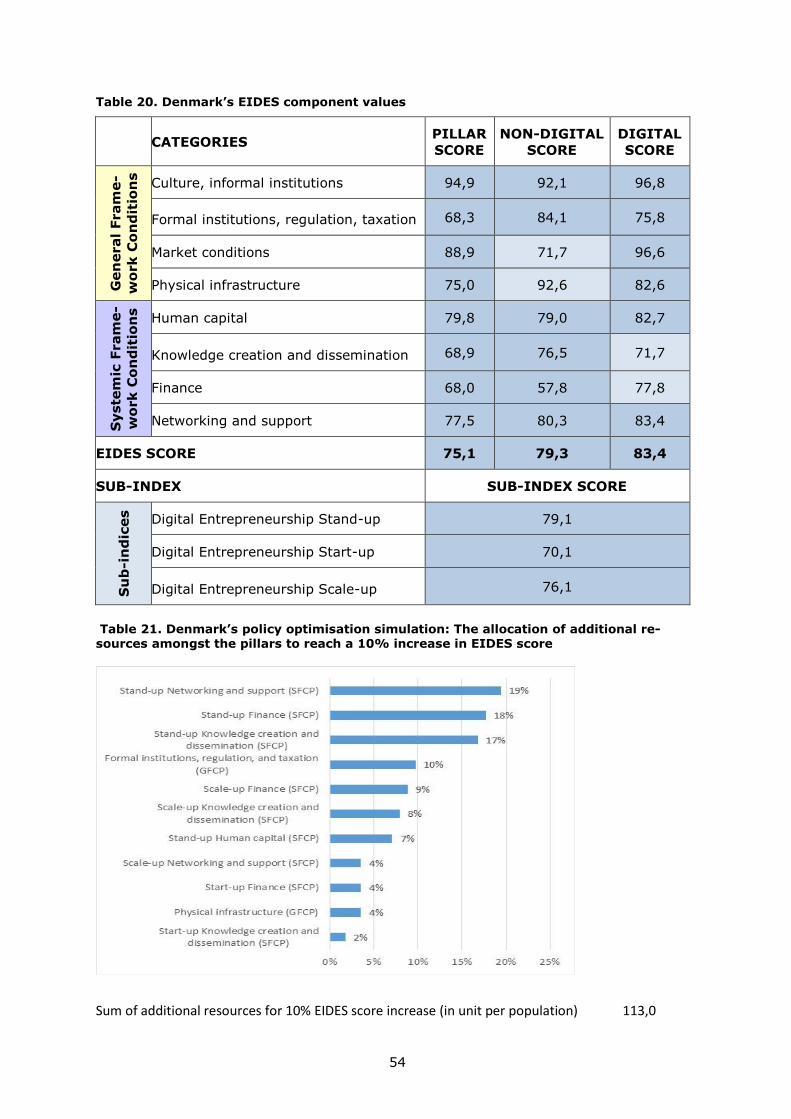
54
Table 20. Denmark’s EIDES component values
CATEGORIES PILLAR
SCORE
NON-DIGITAL
SCORE
DIGITAL
SCORE
Gen
eral
Fram
e-
wo
rk
Co
nd
itio
ns
Culture, informal institutions 94,9 92,1 96,8
Formal institutions, regulation, taxation 68,3 84,1 75,8
Market conditions 88,9 71,7 96,6
Physical infrastructure 75,0 92,6 82,6
Syste
mic
Fram
e-
wo
rk
Co
nd
itio
ns
Human capital 79,8 79,0 82,7
Knowledge creation and dissemination 68,9 76,5 71,7
Finance 68,0 57,8 77,8
Networking and support 77,5 80,3 83,4
EIDES SCORE 75,1 79,3 83,4
SUB-INDEX SUB-INDEX SCORE
Su
b-i
nd
ices
Digital Entrepreneurship Stand-up 79,1
Digital Entrepreneurship Start-up 70,1
Digital Entrepreneurship Scale-up 76,1
Table 21. Denmark’s policy optimisation simulation: The allocation of additional re-sources amongst the pillars to reach a 10% increase in EIDES score
Sum of additional resources for 10% EIDES score increase (in unit per population) 113,0
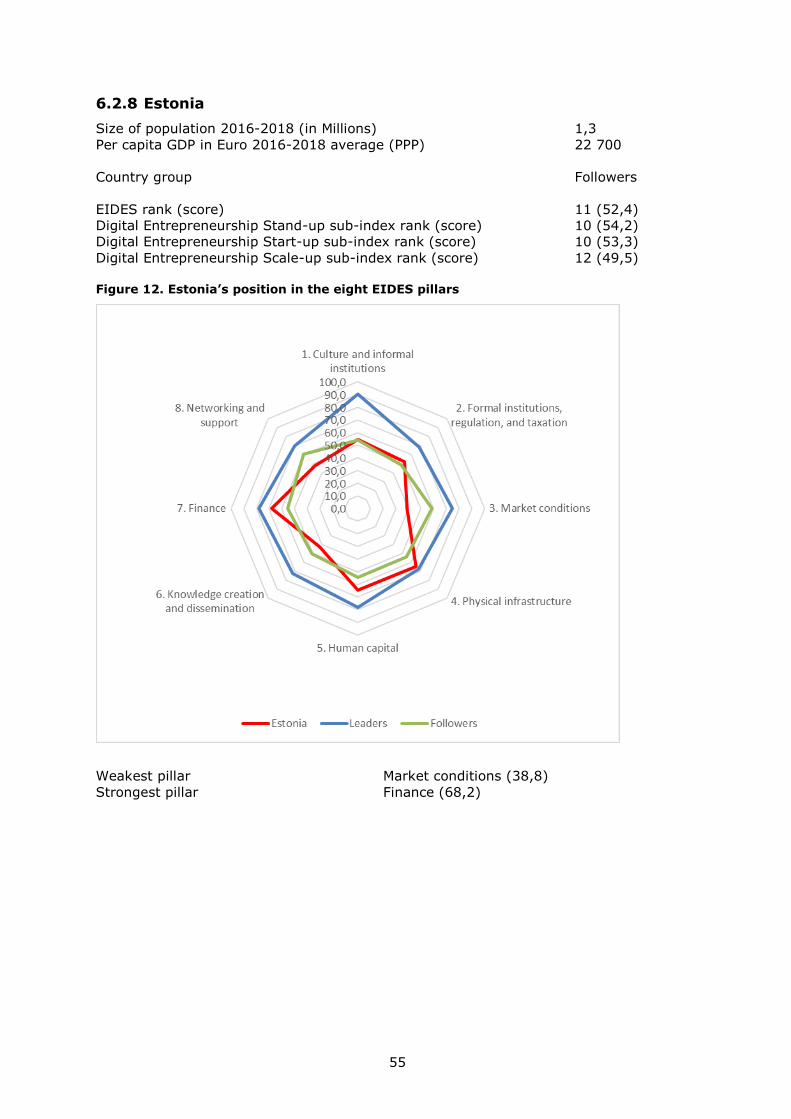
55
6.2.8 Estonia
Size of population 2016-2018 (in Millions) 1,3
Per capita GDP in Euro 2016-2018 average (PPP) 22 700
Country group Followers
EIDES rank (score) 11 (52,4)
Digital Entrepreneurship Stand-up sub-index rank (score) 10 (54,2)
Digital Entrepreneurship Start-up sub-index rank (score) 10 (53,3)
Digital Entrepreneurship Scale-up sub-index rank (score) 12 (49,5)
Figure 12. Estonia’s position in the eight EIDES pillars
Weakest pillar Market conditions (38,8)
Strongest pillar Finance (68,2)
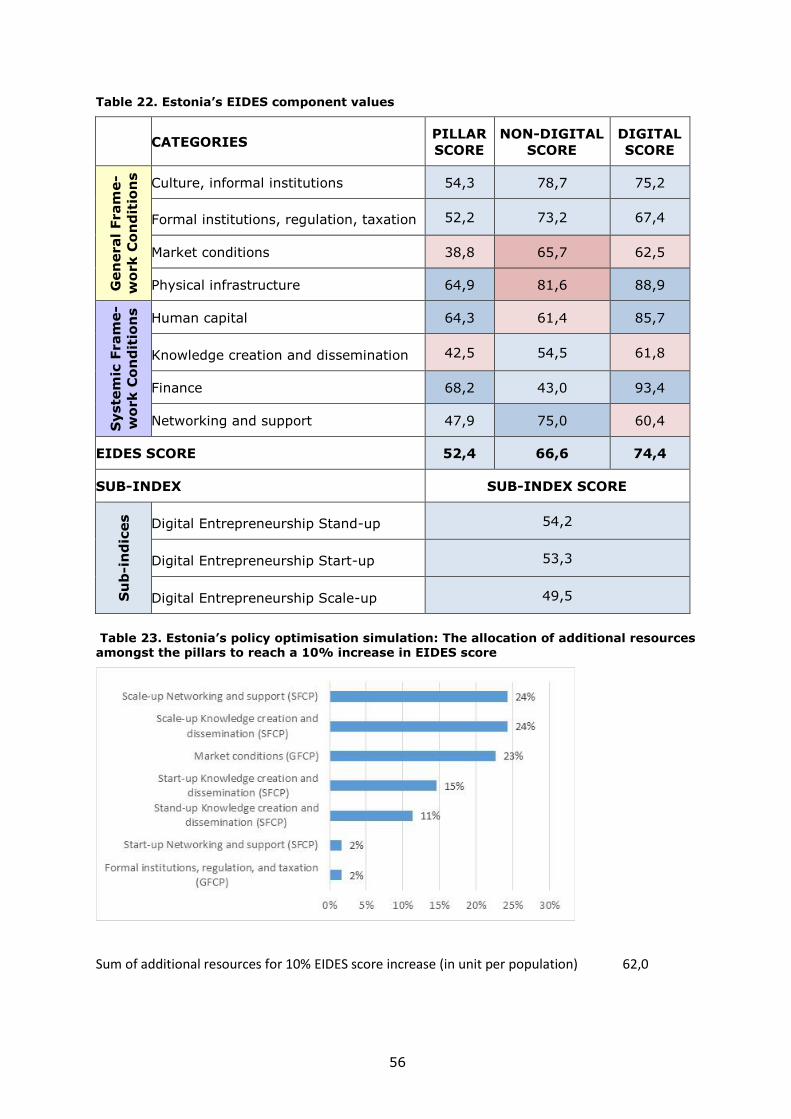
56
Table 22. Estonia’s EIDES component values
CATEGORIES PILLAR
SCORE
NON-DIGITAL
SCORE
DIGITAL
SCORE
Gen
eral
Fram
e-
wo
rk
Co
nd
itio
ns
Culture, informal institutions 54,3 78,7 75,2
Formal institutions, regulation, taxation 52,2 73,2 67,4
Market conditions 38,8 65,7 62,5
Physical infrastructure 64,9 81,6 88,9
Syste
mic
Fram
e-
wo
rk
Co
nd
itio
ns
Human capital 64,3 61,4 85,7
Knowledge creation and dissemination 42,5 54,5 61,8
Finance 68,2 43,0 93,4
Networking and support 47,9 75,0 60,4
EIDES SCORE 52,4 66,6 74,4
SUB-INDEX SUB-INDEX SCORE
Su
b-i
nd
ices
Digital Entrepreneurship Stand-up 54,2
Digital Entrepreneurship Start-up 53,3
Digital Entrepreneurship Scale-up 49,5
Table 23. Estonia’s policy optimisation simulation: The allocation of additional resources amongst the pillars to reach a 10% increase in EIDES score
Sum of additional resources for 10% EIDES score increase (in unit per population) 62,0
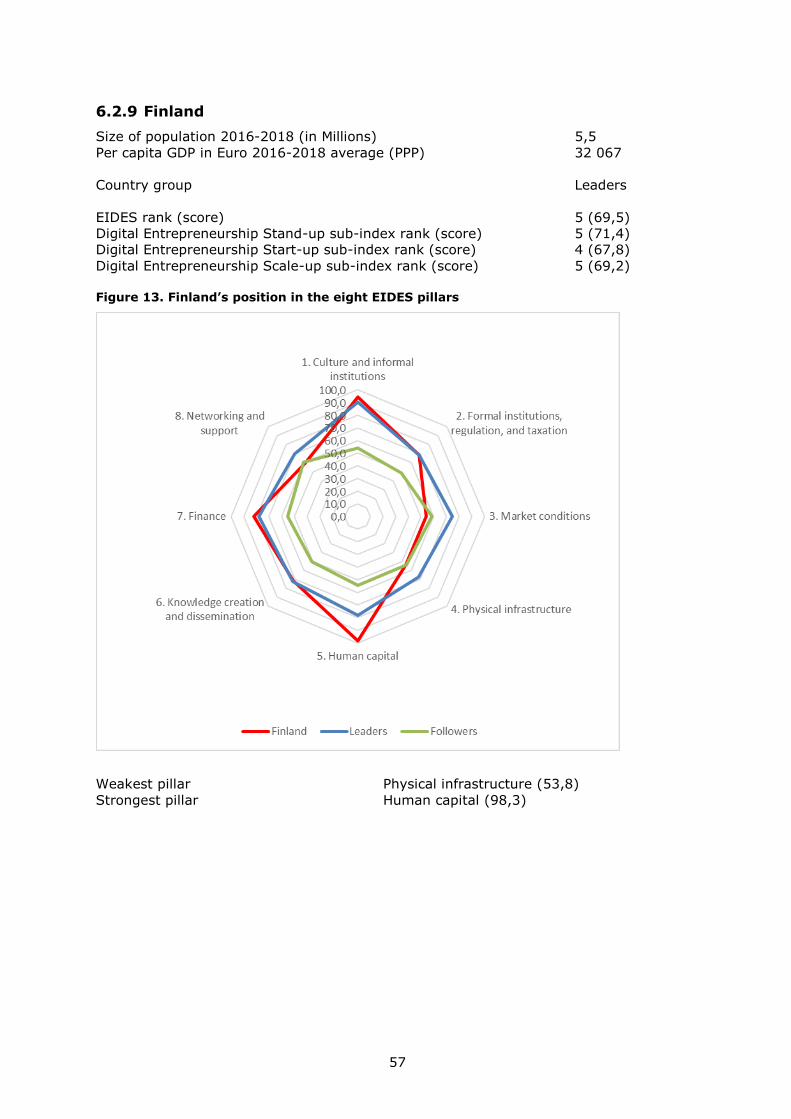
57
6.2.9 Finland
Size of population 2016-2018 (in Millions) 5,5
Per capita GDP in Euro 2016-2018 average (PPP) 32 067
Country group Leaders
EIDES rank (score) 5 (69,5)
Digital Entrepreneurship Stand-up sub-index rank (score) 5 (71,4)
Digital Entrepreneurship Start-up sub-index rank (score) 4 (67,8)
Digital Entrepreneurship Scale-up sub-index rank (score) 5 (69,2)
Figure 13. Finland’s position in the eight EIDES pillars
Weakest pillar Physical infrastructure (53,8)
Strongest pillar Human capital (98,3)
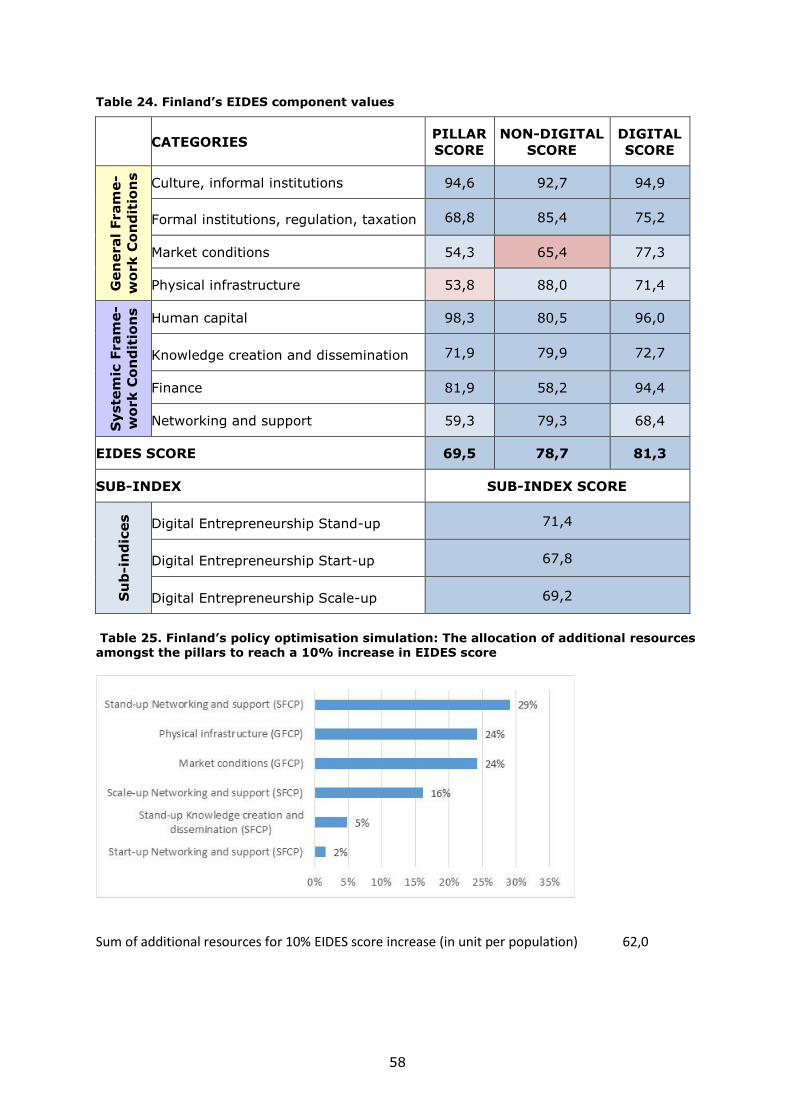
58
Table 24. Finland’s EIDES component values
CATEGORIES PILLAR
SCORE
NON-DIGITAL
SCORE
DIGITAL
SCORE
Gen
eral
Fram
e-
wo
rk
Co
nd
itio
ns
Culture, informal institutions 94,6 92,7 94,9
Formal institutions, regulation, taxation 68,8 85,4 75,2
Market conditions 54,3 65,4 77,3
Physical infrastructure 53,8 88,0 71,4
Syste
mic
Fram
e-
wo
rk
Co
nd
itio
ns
Human capital 98,3 80,5 96,0
Knowledge creation and dissemination 71,9 79,9 72,7
Finance 81,9 58,2 94,4
Networking and support 59,3 79,3 68,4
EIDES SCORE 69,5 78,7 81,3
SUB-INDEX SUB-INDEX SCORE
Su
b-i
nd
ices
Digital Entrepreneurship Stand-up 71,4
Digital Entrepreneurship Start-up 67,8
Digital Entrepreneurship Scale-up 69,2
Table 25. Finland’s policy optimisation simulation: The allocation of additional resources amongst the pillars to reach a 10% increase in EIDES score
Sum of additional resources for 10% EIDES score increase (in unit per population) 62,0
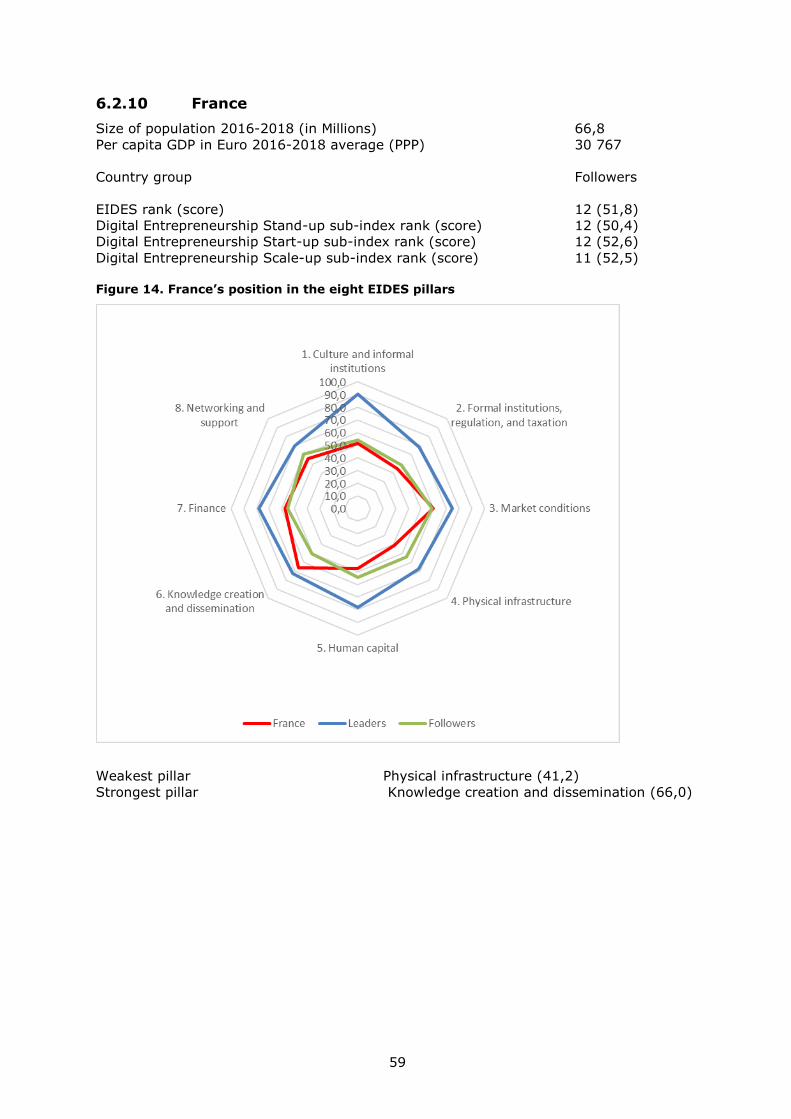
59
6.2.10 France
Size of population 2016-2018 (in Millions) 66,8
Per capita GDP in Euro 2016-2018 average (PPP) 30 767
Country group Followers
EIDES rank (score) 12 (51,8)
Digital Entrepreneurship Stand-up sub-index rank (score) 12 (50,4)
Digital Entrepreneurship Start-up sub-index rank (score) 12 (52,6)
Digital Entrepreneurship Scale-up sub-index rank (score) 11 (52,5)
Figure 14. France’s position in the eight EIDES pillars
Weakest pillar Physical infrastructure (41,2)
Strongest pillar Knowledge creation and dissemination (66,0)
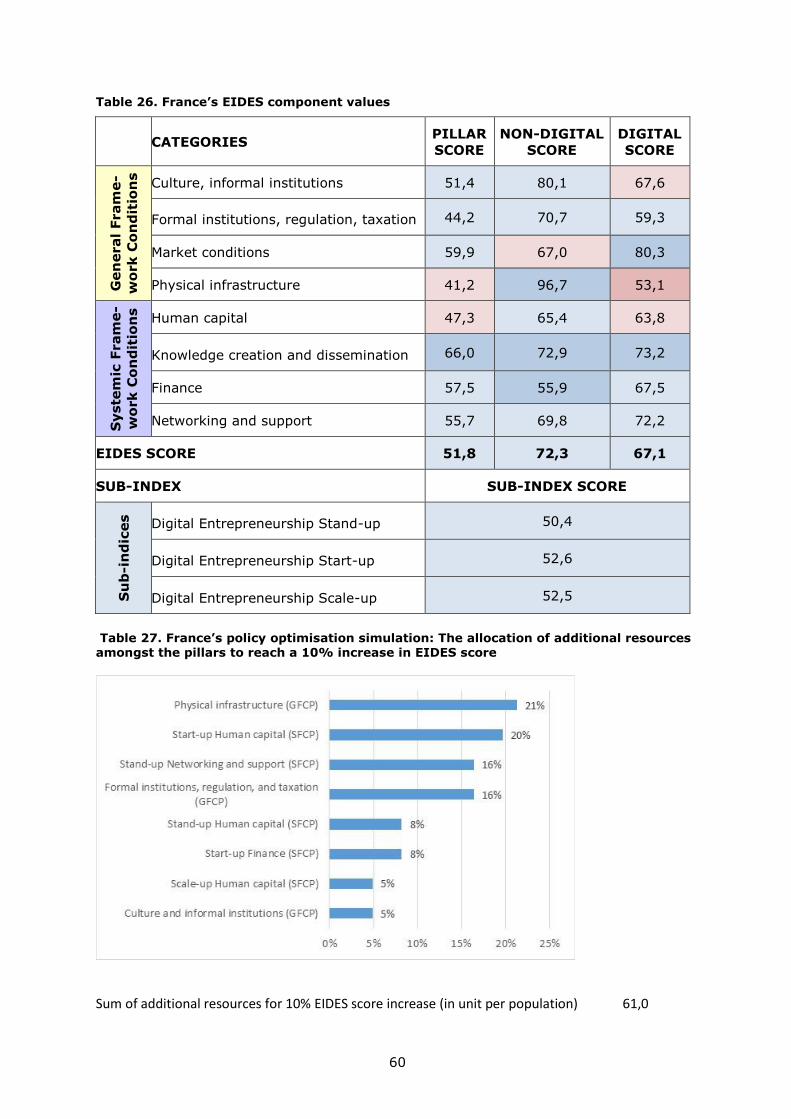
60
Table 26. France’s EIDES component values
CATEGORIES PILLAR
SCORE
NON-DIGITAL
SCORE
DIGITAL
SCORE
Gen
eral
Fram
e-
wo
rk
Co
nd
itio
ns
Culture, informal institutions 51,4 80,1 67,6
Formal institutions, regulation, taxation 44,2 70,7 59,3
Market conditions 59,9 67,0 80,3
Physical infrastructure 41,2 96,7 53,1
Syste
mic
Fram
e-
wo
rk
Co
nd
itio
ns
Human capital 47,3 65,4 63,8
Knowledge creation and dissemination 66,0 72,9 73,2
Finance 57,5 55,9 67,5
Networking and support 55,7 69,8 72,2
EIDES SCORE 51,8 72,3 67,1
SUB-INDEX SUB-INDEX SCORE
Su
b-i
nd
ices
Digital Entrepreneurship Stand-up 50,4
Digital Entrepreneurship Start-up 52,6
Digital Entrepreneurship Scale-up 52,5
Table 27. France’s policy optimisation simulation: The allocation of additional resources amongst the pillars to reach a 10% increase in EIDES score
Sum of additional resources for 10% EIDES score increase (in unit per population) 61,0
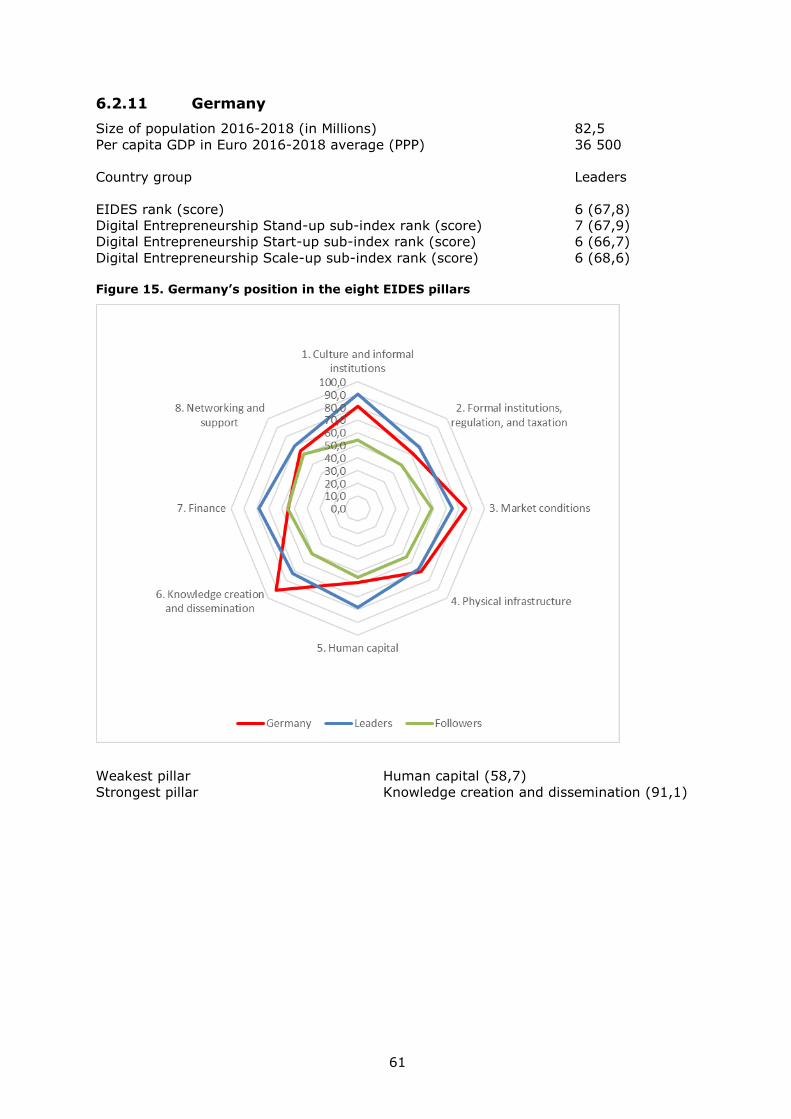
61
6.2.11 Germany
Size of population 2016-2018 (in Millions) 82,5
Per capita GDP in Euro 2016-2018 average (PPP) 36 500
Country group Leaders
EIDES rank (score) 6 (67,8)
Digital Entrepreneurship Stand-up sub-index rank (score) 7 (67,9)
Digital Entrepreneurship Start-up sub-index rank (score) 6 (66,7)
Digital Entrepreneurship Scale-up sub-index rank (score) 6 (68,6)
Figure 15. Germany’s position in the eight EIDES pillars
Weakest pillar Human capital (58,7)
Strongest pillar Knowledge creation and dissemination (91,1)
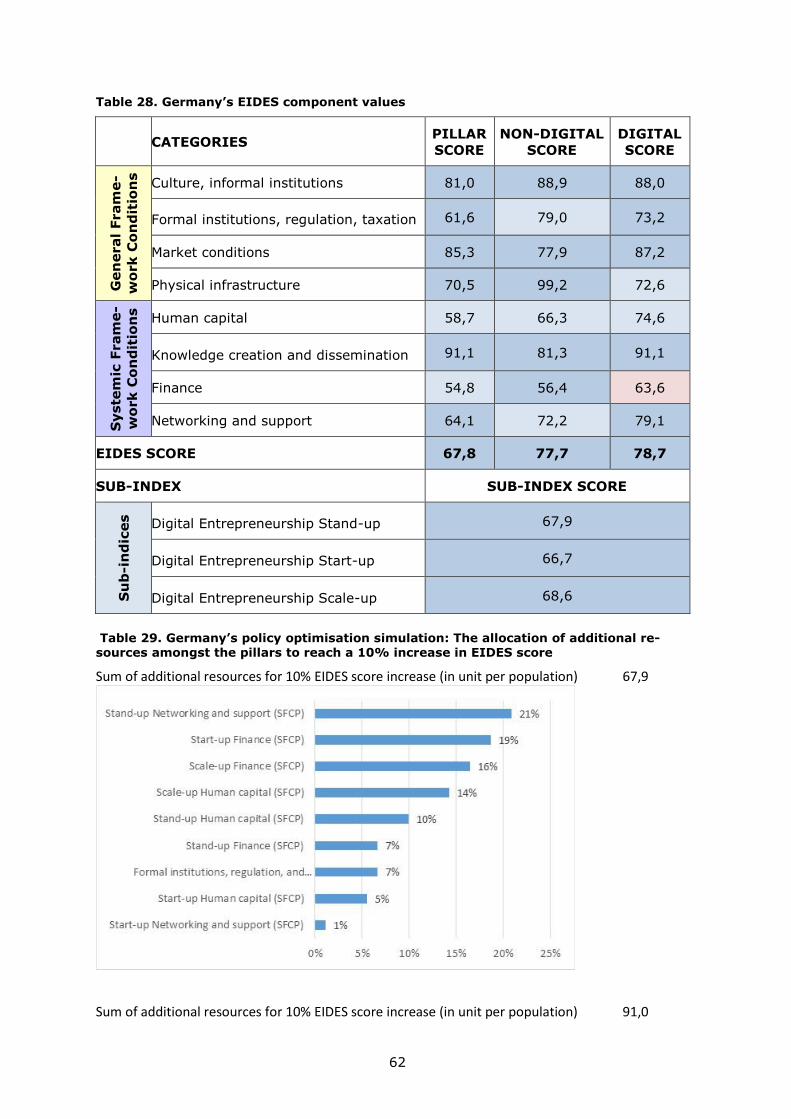
62
Table 28. Germany’s EIDES component values
CATEGORIES PILLAR
SCORE
NON-DIGITAL
SCORE
DIGITAL
SCORE
Gen
eral
Fram
e-
wo
rk
Co
nd
itio
ns
Culture, informal institutions 81,0 88,9 88,0
Formal institutions, regulation, taxation 61,6 79,0 73,2
Market conditions 85,3 77,9 87,2
Physical infrastructure 70,5 99,2 72,6
Syste
mic
Fram
e-
wo
rk
Co
nd
itio
ns
Human capital 58,7 66,3 74,6
Knowledge creation and dissemination 91,1 81,3 91,1
Finance 54,8 56,4 63,6
Networking and support 64,1 72,2 79,1
EIDES SCORE 67,8 77,7 78,7
SUB-INDEX SUB-INDEX SCORE
Su
b-i
nd
ices
Digital Entrepreneurship Stand-up 67,9
Digital Entrepreneurship Start-up 66,7
Digital Entrepreneurship Scale-up 68,6
Table 29. Germany’s policy optimisation simulation: The allocation of additional re-sources amongst the pillars to reach a 10% increase in EIDES score
Sum of additional resources for 10% EIDES score increase (in unit per population) 67,9
Sum of additional resources for 10% EIDES score increase (in unit per population) 91,0
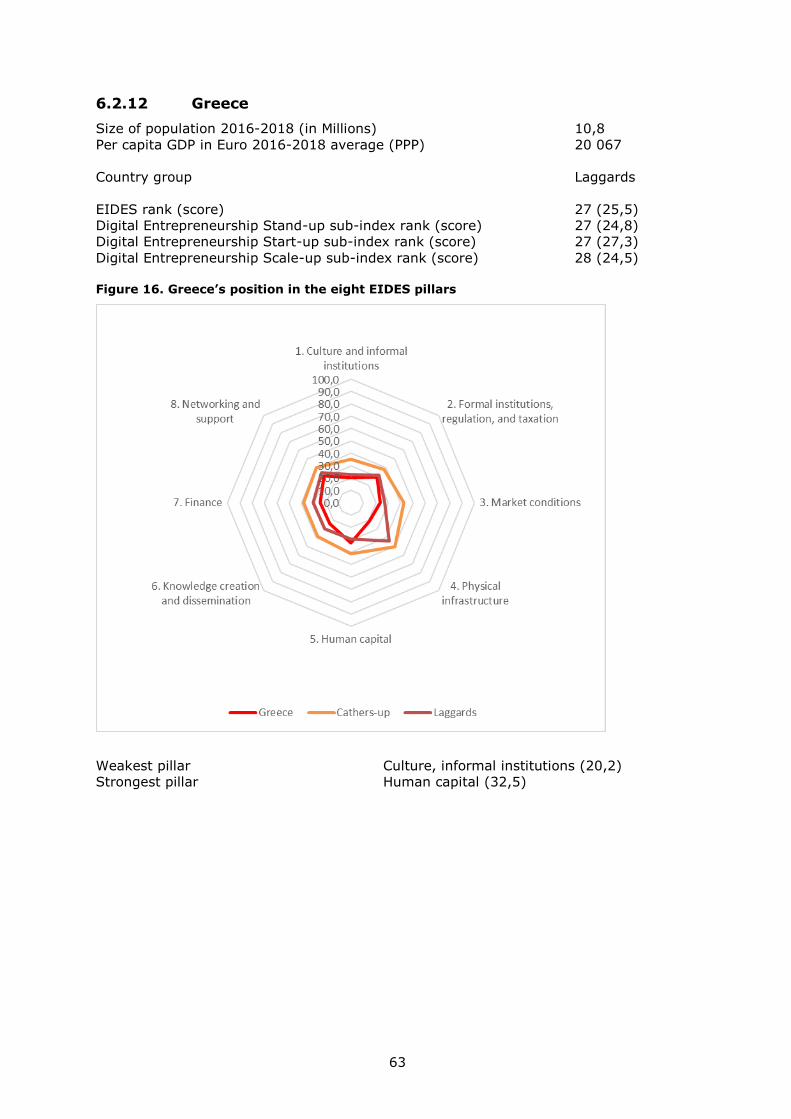
63
6.2.12 Greece
Size of population 2016-2018 (in Millions) 10,8
Per capita GDP in Euro 2016-2018 average (PPP) 20 067
Country group Laggards
EIDES rank (score) 27 (25,5)
Digital Entrepreneurship Stand-up sub-index rank (score) 27 (24,8)
Digital Entrepreneurship Start-up sub-index rank (score) 27 (27,3)
Digital Entrepreneurship Scale-up sub-index rank (score) 28 (24,5)
Figure 16. Greece’s position in the eight EIDES pillars
Weakest pillar Culture, informal institutions (20,2)
Strongest pillar Human capital (32,5)
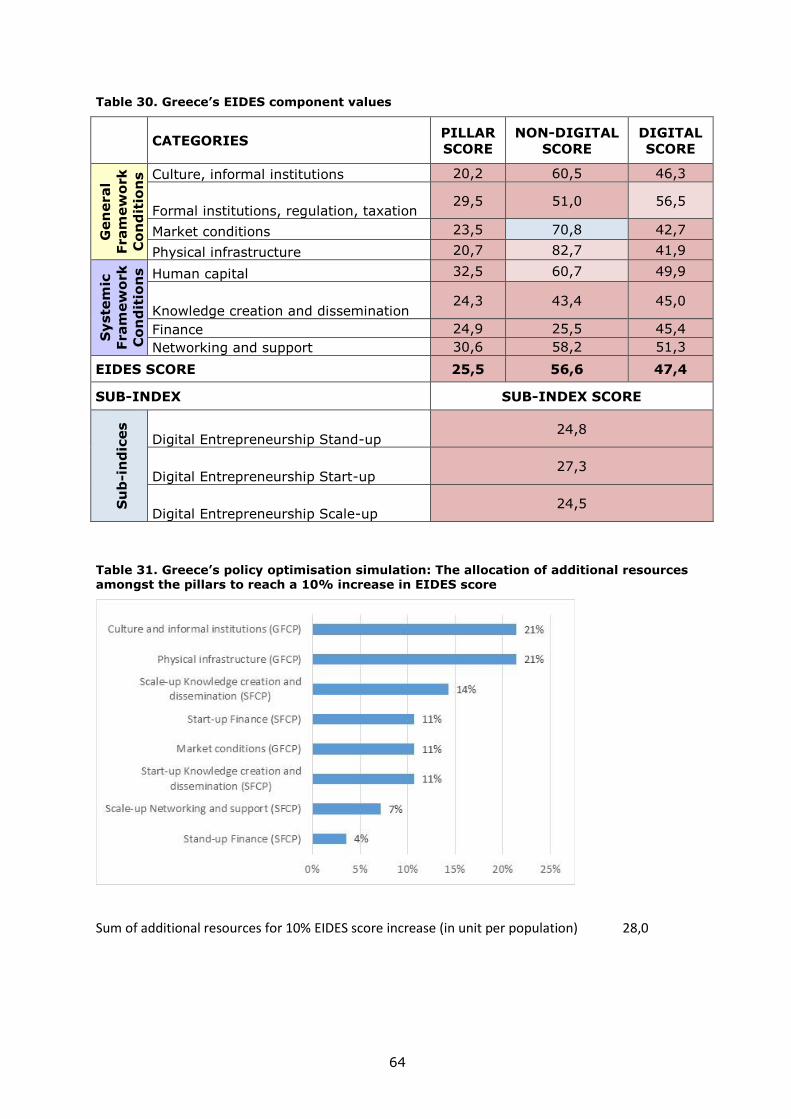
64
Table 30. Greece’s EIDES component values
CATEGORIES
PILLAR
SCORE
NON-DIGITAL
SCORE
DIGITAL
SCORE
Gen
eral
Fram
ew
ork
Co
nd
itio
ns
Culture, informal institutions 20,2 60,5 46,3
Formal institutions, regulation, taxation 29,5 51,0 56,5
Market conditions 23,5 70,8 42,7
Physical infrastructure 20,7 82,7 41,9
Syste
mic
Fram
ew
ork
Co
nd
itio
ns
Human capital 32,5 60,7 49,9
Knowledge creation and dissemination 24,3 43,4 45,0
Finance 24,9 25,5 45,4
Networking and support 30,6 58,2 51,3
EIDES SCORE 25,5 56,6 47,4
SUB-INDEX SUB-INDEX SCORE
Su
b-i
nd
ices
Digital Entrepreneurship Stand-up 24,8
Digital Entrepreneurship Start-up 27,3
Digital Entrepreneurship Scale-up 24,5
Table 31. Greece’s policy optimisation simulation: The allocation of additional resources amongst the pillars to reach a 10% increase in EIDES score
Sum of additional resources for 10% EIDES score increase (in unit per population) 28,0
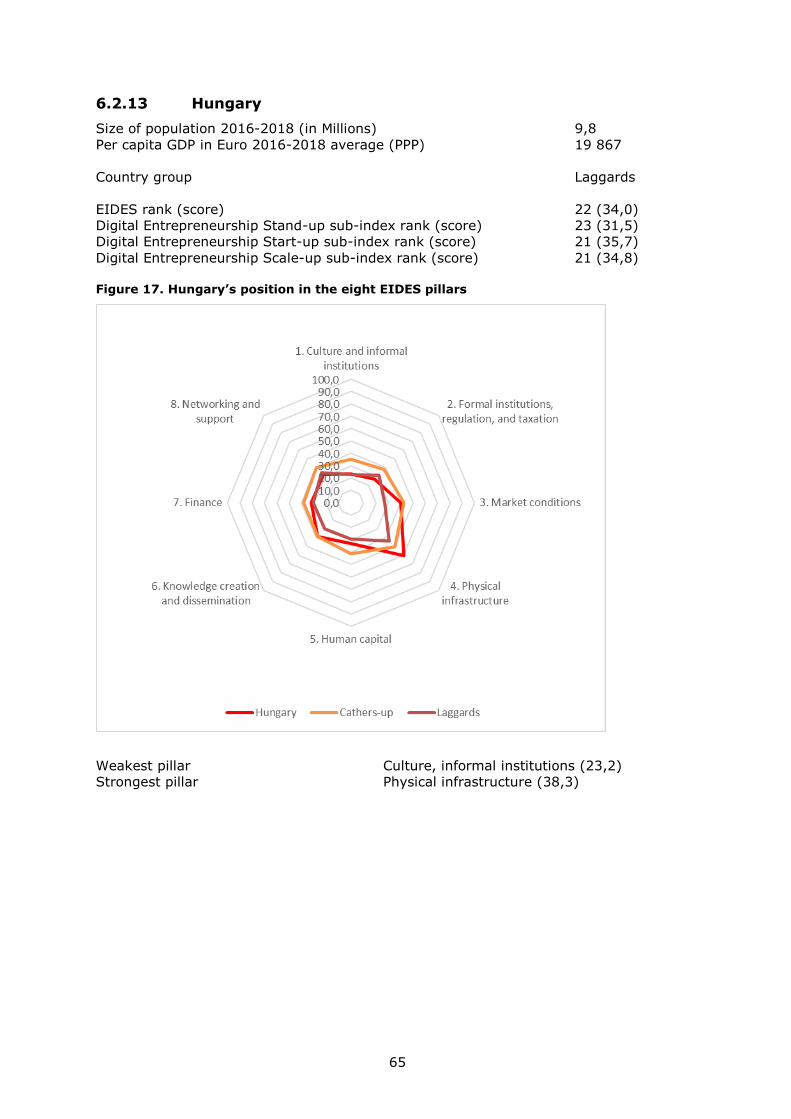
65
6.2.13 Hungary
Size of population 2016-2018 (in Millions) 9,8
Per capita GDP in Euro 2016-2018 average (PPP) 19 867
Country group Laggards
EIDES rank (score) 22 (34,0)
Digital Entrepreneurship Stand-up sub-index rank (score) 23 (31,5)
Digital Entrepreneurship Start-up sub-index rank (score) 21 (35,7)
Digital Entrepreneurship Scale-up sub-index rank (score) 21 (34,8)
Figure 17. Hungary’s position in the eight EIDES pillars
Weakest pillar Culture, informal institutions (23,2)
Strongest pillar Physical infrastructure (38,3)
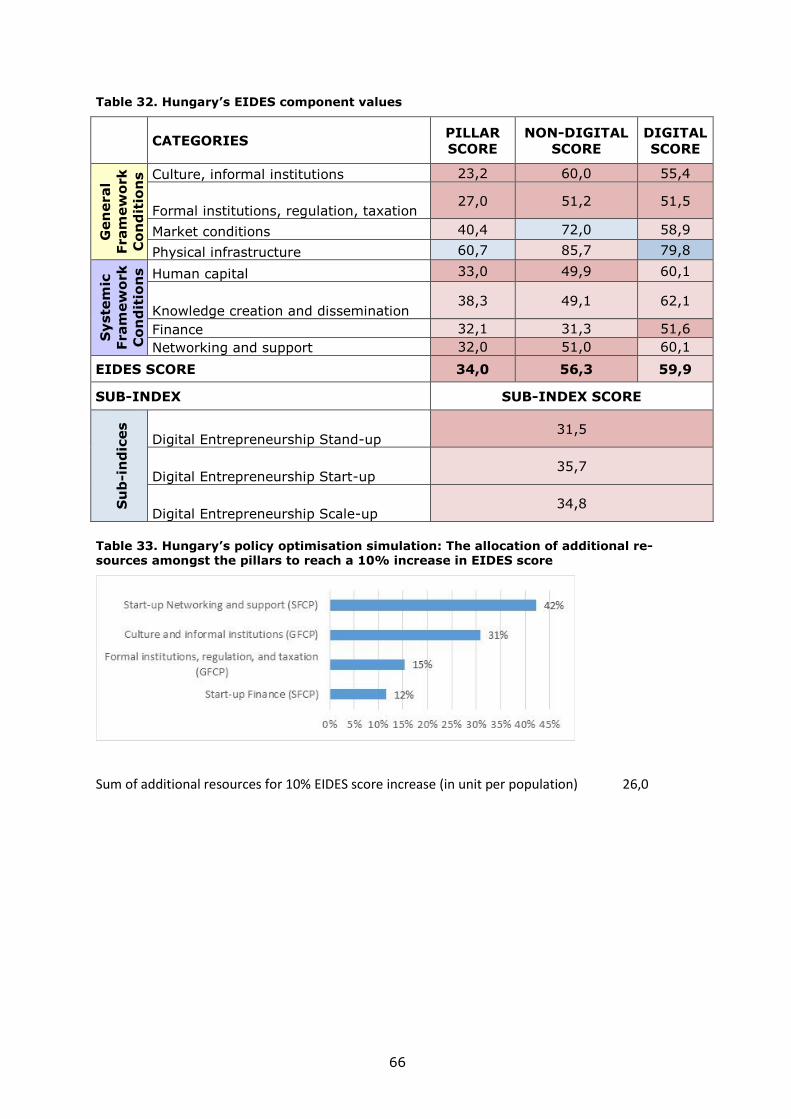
66
Table 32. Hungary’s EIDES component values
CATEGORIES
PILLAR
SCORE
NON-DIGITAL
SCORE
DIGITAL
SCORE
Gen
eral
Fram
ew
ork
Co
nd
itio
ns
Culture, informal institutions 23,2 60,0 55,4
Formal institutions, regulation, taxation 27,0 51,2 51,5
Market conditions 40,4 72,0 58,9
Physical infrastructure 60,7 85,7 79,8
Syste
mic
Fram
ew
ork
Co
nd
itio
ns
Human capital 33,0 49,9 60,1
Knowledge creation and dissemination 38,3 49,1 62,1
Finance 32,1 31,3 51,6
Networking and support 32,0 51,0 60,1
EIDES SCORE 34,0 56,3 59,9
SUB-INDEX SUB-INDEX SCORE
Su
b-i
nd
ices
Digital Entrepreneurship Stand-up 31,5
Digital Entrepreneurship Start-up 35,7
Digital Entrepreneurship Scale-up 34,8
Table 33. Hungary’s policy optimisation simulation: The allocation of additional re-sources amongst the pillars to reach a 10% increase in EIDES score
Sum of additional resources for 10% EIDES score increase (in unit per population) 26,0
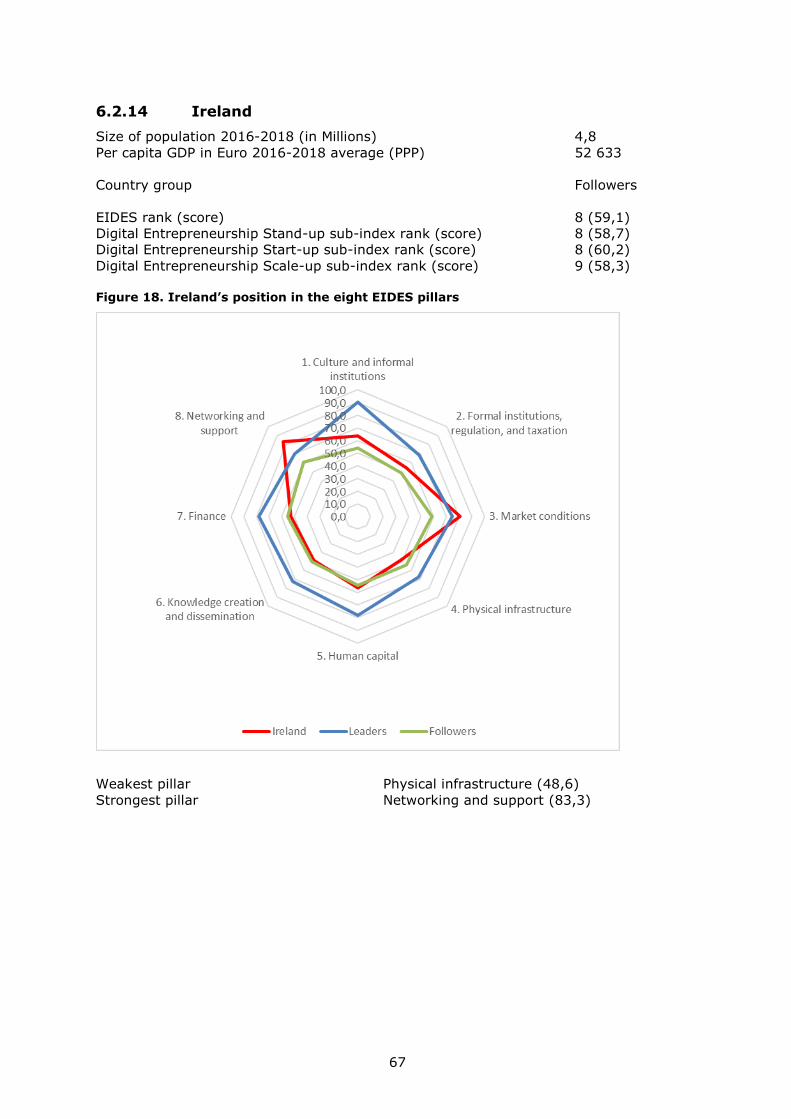
67
6.2.14 Ireland
Size of population 2016-2018 (in Millions) 4,8
Per capita GDP in Euro 2016-2018 average (PPP) 52 633
Country group Followers
EIDES rank (score) 8 (59,1)
Digital Entrepreneurship Stand-up sub-index rank (score) 8 (58,7)
Digital Entrepreneurship Start-up sub-index rank (score) 8 (60,2)
Digital Entrepreneurship Scale-up sub-index rank (score) 9 (58,3)
Figure 18. Ireland’s position in the eight EIDES pillars
Weakest pillar Physical infrastructure (48,6)
Strongest pillar Networking and support (83,3)
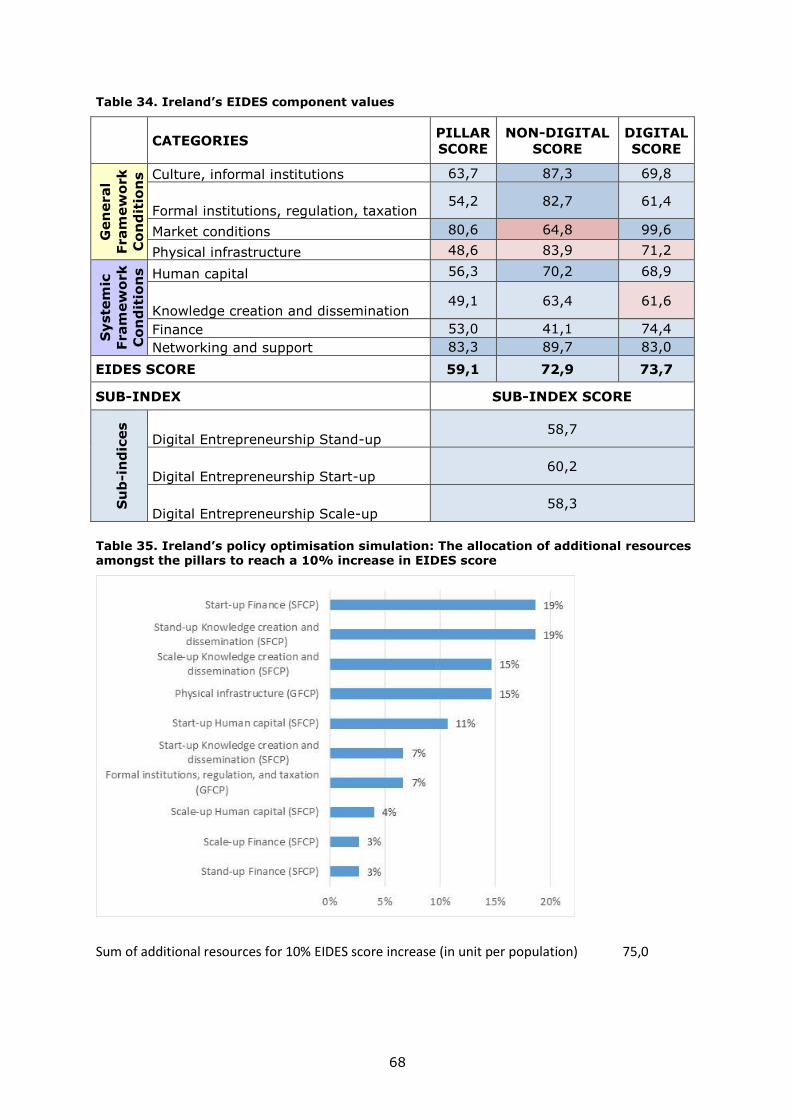
68
Table 34. Ireland’s EIDES component values
CATEGORIES
PILLAR
SCORE
NON-DIGITAL
SCORE
DIGITAL
SCORE
Gen
eral
Fram
ew
ork
Co
nd
itio
ns
Culture, informal institutions 63,7 87,3 69,8
Formal institutions, regulation, taxation 54,2 82,7 61,4
Market conditions 80,6 64,8 99,6
Physical infrastructure 48,6 83,9 71,2
Syste
mic
Fram
ew
ork
Co
nd
itio
ns
Human capital 56,3 70,2 68,9
Knowledge creation and dissemination 49,1 63,4 61,6
Finance 53,0 41,1 74,4
Networking and support 83,3 89,7 83,0
EIDES SCORE 59,1 72,9 73,7
SUB-INDEX SUB-INDEX SCORE
Su
b-i
nd
ices
Digital Entrepreneurship Stand-up 58,7
Digital Entrepreneurship Start-up 60,2
Digital Entrepreneurship Scale-up 58,3
Table 35. Ireland’s policy optimisation simulation: The allocation of additional resources amongst the pillars to reach a 10% increase in EIDES score
Sum of additional resources for 10% EIDES score increase (in unit per population) 75,0
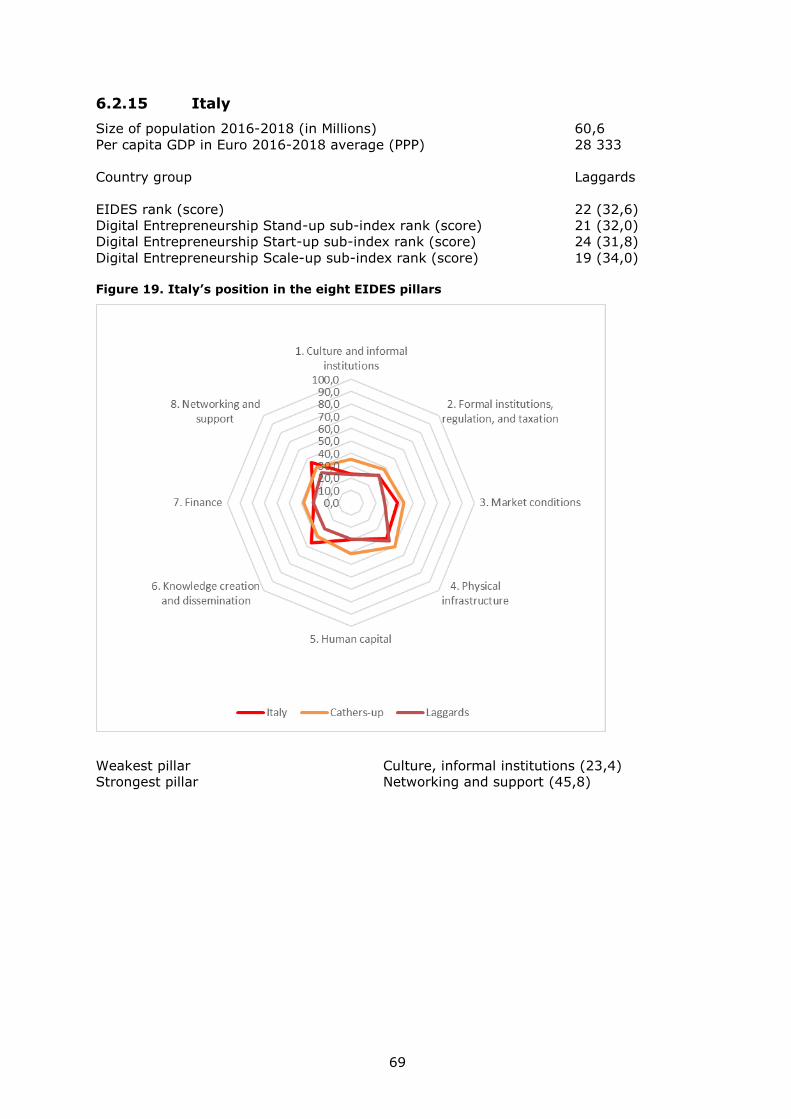
69
6.2.15 Italy
Size of population 2016-2018 (in Millions) 60,6
Per capita GDP in Euro 2016-2018 average (PPP) 28 333
Country group Laggards
EIDES rank (score) 22 (32,6)
Digital Entrepreneurship Stand-up sub-index rank (score) 21 (32,0)
Digital Entrepreneurship Start-up sub-index rank (score) 24 (31,8)
Digital Entrepreneurship Scale-up sub-index rank (score) 19 (34,0)
Figure 19. Italy’s position in the eight EIDES pillars
Weakest pillar Culture, informal institutions (23,4)
Strongest pillar Networking and support (45,8)
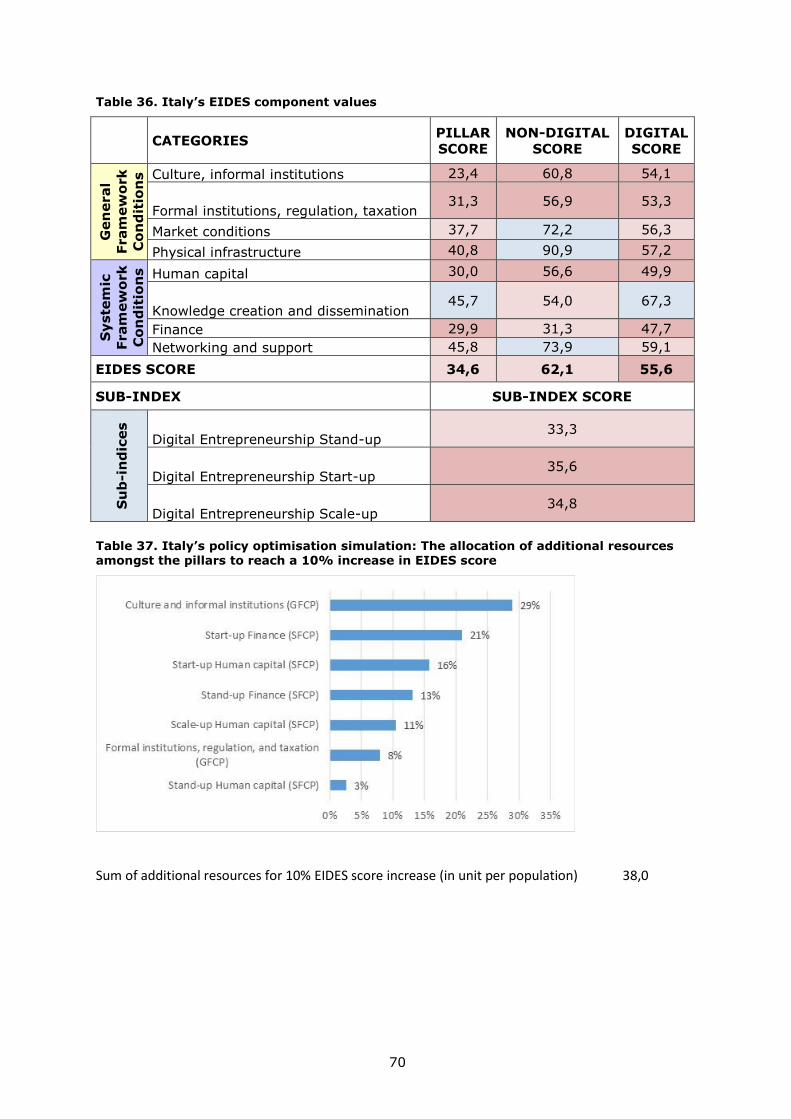
70
Table 36. Italy’s EIDES component values
CATEGORIES
PILLAR
SCORE
NON-DIGITAL
SCORE
DIGITAL
SCORE
Gen
eral
Fram
ew
ork
Co
nd
itio
ns
Culture, informal institutions 23,4 60,8 54,1
Formal institutions, regulation, taxation 31,3 56,9 53,3
Market conditions 37,7 72,2 56,3
Physical infrastructure 40,8 90,9 57,2
Syste
mic
Fram
ew
ork
Co
nd
itio
ns
Human capital 30,0 56,6 49,9
Knowledge creation and dissemination 45,7 54,0 67,3
Finance 29,9 31,3 47,7
Networking and support 45,8 73,9 59,1
EIDES SCORE 34,6 62,1 55,6
SUB-INDEX SUB-INDEX SCORE
Su
b-i
nd
ices
Digital Entrepreneurship Stand-up 33,3
Digital Entrepreneurship Start-up 35,6
Digital Entrepreneurship Scale-up 34,8
Table 37. Italy’s policy optimisation simulation: The allocation of additional resources amongst the pillars to reach a 10% increase in EIDES score
Sum of additional resources for 10% EIDES score increase (in unit per population) 38,0
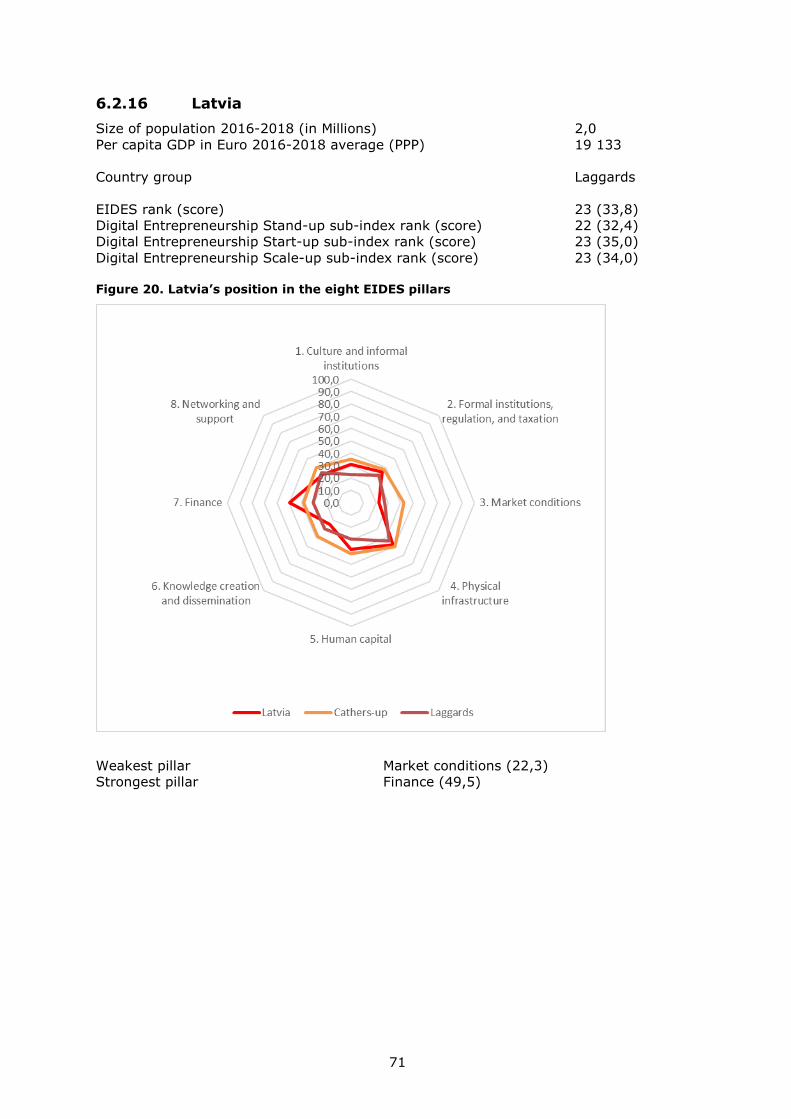
71
6.2.16 Latvia
Size of population 2016-2018 (in Millions) 2,0
Per capita GDP in Euro 2016-2018 average (PPP) 19 133
Country group Laggards
EIDES rank (score) 23 (33,8)
Digital Entrepreneurship Stand-up sub-index rank (score) 22 (32,4)
Digital Entrepreneurship Start-up sub-index rank (score) 23 (35,0)
Digital Entrepreneurship Scale-up sub-index rank (score) 23 (34,0)
Figure 20. Latvia’s position in the eight EIDES pillars
Weakest pillar Market conditions (22,3)
Strongest pillar Finance (49,5)
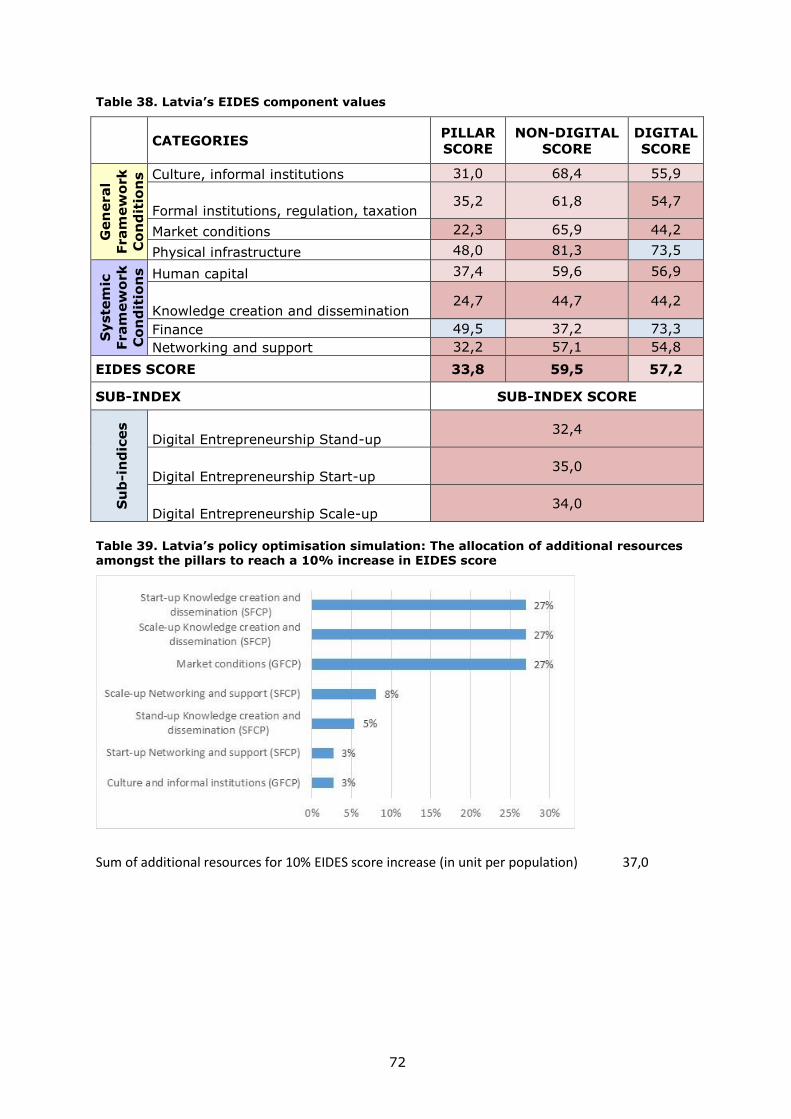
72
Table 38. Latvia’s EIDES component values
CATEGORIES
PILLAR
SCORE
NON-DIGITAL
SCORE
DIGITAL
SCORE
Gen
eral
Fram
ew
ork
Co
nd
itio
ns
Culture, informal institutions 31,0 68,4 55,9
Formal institutions, regulation, taxation 35,2 61,8 54,7
Market conditions 22,3 65,9 44,2
Physical infrastructure 48,0 81,3 73,5
Syste
mic
Fram
ew
ork
Co
nd
itio
ns
Human capital 37,4 59,6 56,9
Knowledge creation and dissemination 24,7 44,7 44,2
Finance 49,5 37,2 73,3
Networking and support 32,2 57,1 54,8
EIDES SCORE 33,8 59,5 57,2
SUB-INDEX SUB-INDEX SCORE
Su
b-i
nd
ices
Digital Entrepreneurship Stand-up 32,4
Digital Entrepreneurship Start-up 35,0
Digital Entrepreneurship Scale-up 34,0
Table 39. Latvia’s policy optimisation simulation: The allocation of additional resources amongst the pillars to reach a 10% increase in EIDES score
Sum of additional resources for 10% EIDES score increase (in unit per population) 37,0

73
6.2.17 Lithuania
Size of population 2016-2018 (in Millions) 2,8
Per capita GDP in Euro 2016-2018 average (PPP) 22 400
Country group Catchers-up
EIDES rank (score) 16 (42,2)
Digital Entrepreneurship Stand-up sub-index rank (score) 16 (42,3)
Digital Entrepreneurship Start-up sub-index rank (score) 16 (42,7)
Digital Entrepreneurship Scale-up sub-index rank (score) 16 (41,5)
Figure 21. Lithuania’s position in the eight EIDES pillars
Weakest pillar Knowledge creation and dissemination (32,4)
Strongest pillar Physical infrastructure (58,5)
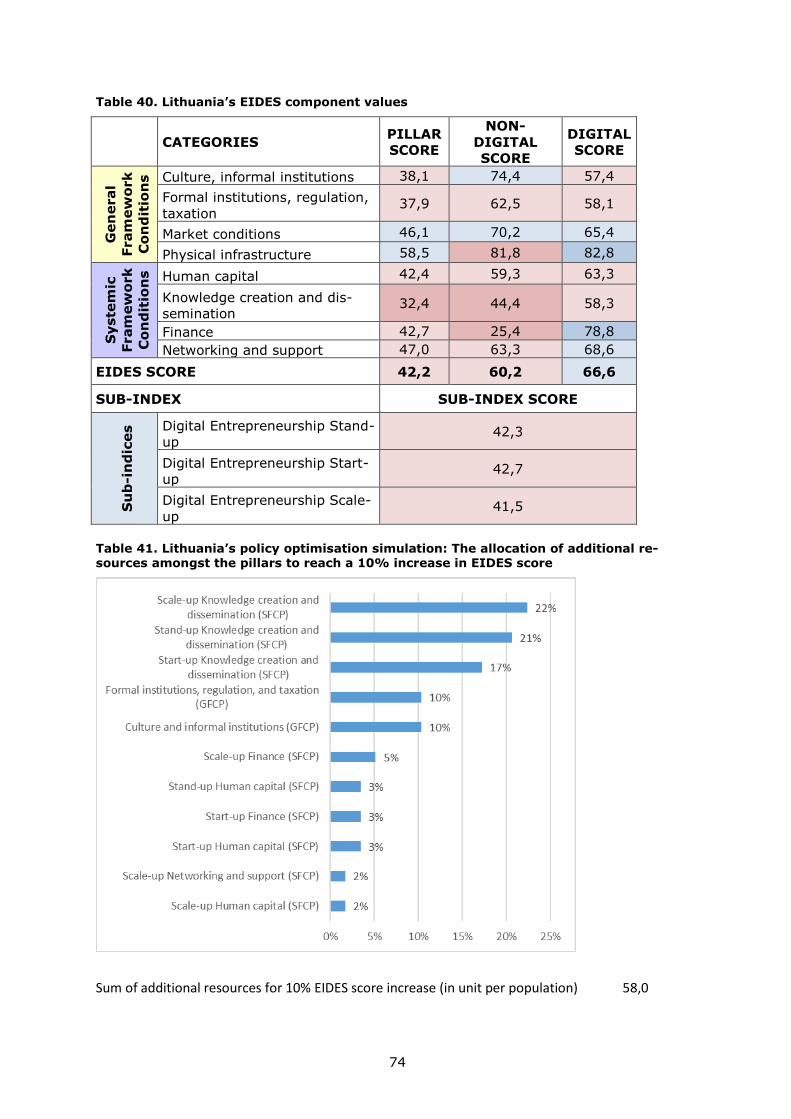
74
Table 40. Lithuania’s EIDES component values
CATEGORIES PILLAR
SCORE
NON-
DIGITAL
SCORE
DIGITAL
SCORE
Gen
eral
Fram
ew
ork
Co
nd
itio
ns
Culture, informal institutions 38,1 74,4 57,4
Formal institutions, regulation,
taxation 37,9 62,5 58,1
Market conditions 46,1 70,2 65,4
Physical infrastructure 58,5 81,8 82,8
Syste
mic
Fram
ew
ork
Co
nd
itio
ns
Human capital 42,4 59,3 63,3
Knowledge creation and dis-
semination 32,4 44,4 58,3
Finance 42,7 25,4 78,8
Networking and support 47,0 63,3 68,6
EIDES SCORE 42,2 60,2 66,6
SUB-INDEX SUB-INDEX SCORE
Su
b-i
nd
ices Digital Entrepreneurship Stand-
up 42,3
Digital Entrepreneurship Start-
up 42,7
Digital Entrepreneurship Scale-
up 41,5
Table 41. Lithuania’s policy optimisation simulation: The allocation of additional re-sources amongst the pillars to reach a 10% increase in EIDES score
Sum of additional resources for 10% EIDES score increase (in unit per population) 58,0
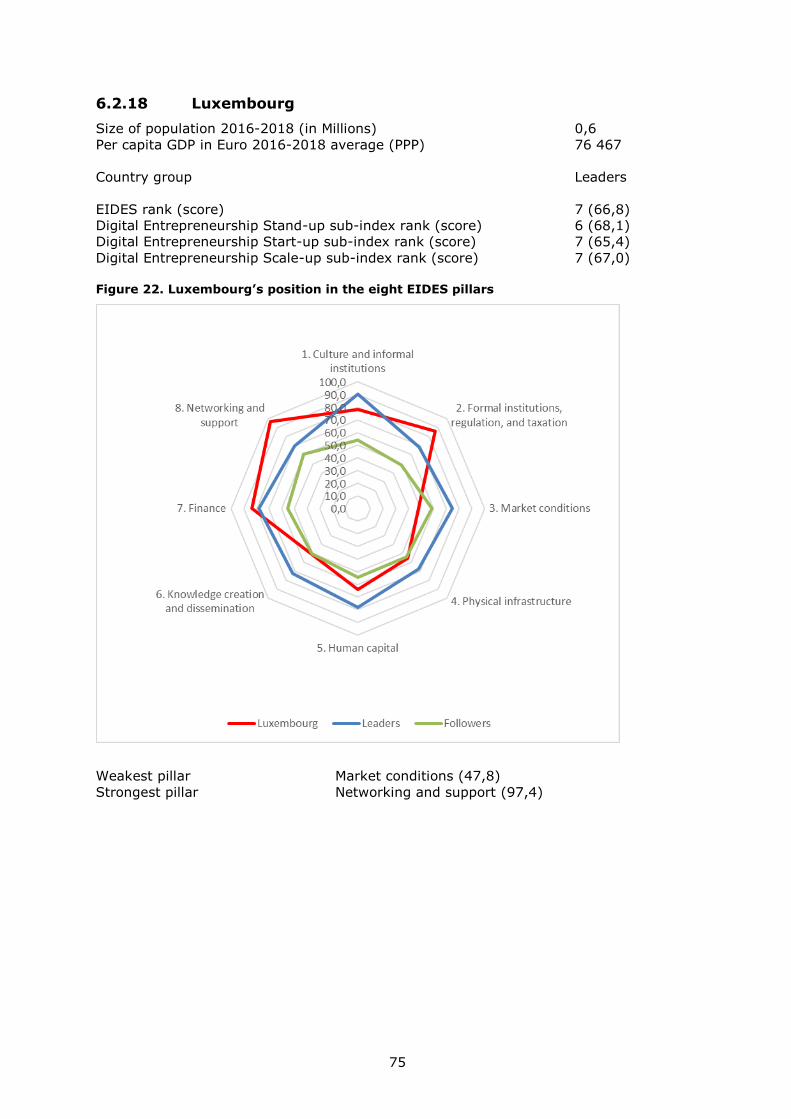
75
6.2.18 Luxembourg
Size of population 2016-2018 (in Millions) 0,6
Per capita GDP in Euro 2016-2018 average (PPP) 76 467
Country group Leaders
EIDES rank (score) 7 (66,8)
Digital Entrepreneurship Stand-up sub-index rank (score) 6 (68,1)
Digital Entrepreneurship Start-up sub-index rank (score) 7 (65,4)
Digital Entrepreneurship Scale-up sub-index rank (score) 7 (67,0)
Figure 22. Luxembourg’s position in the eight EIDES pillars
Weakest pillar Market conditions (47,8)
Strongest pillar Networking and support (97,4)
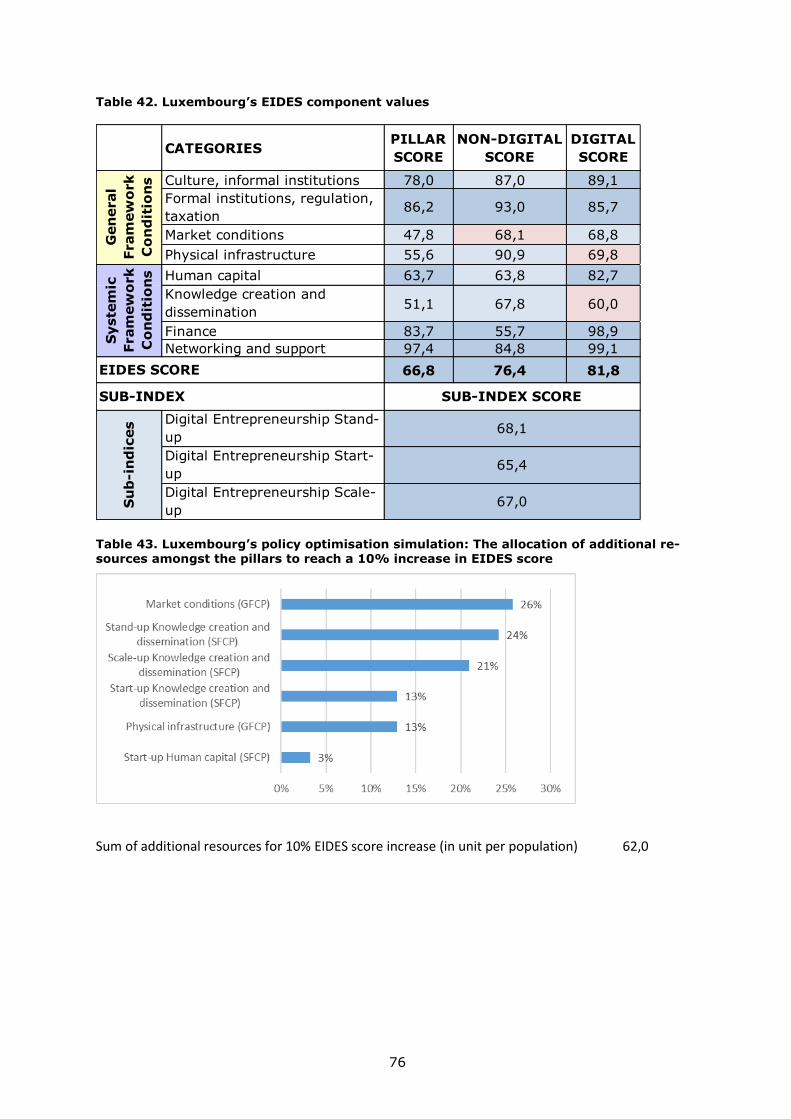
76
Table 42. Luxembourg’s EIDES component values
Table 43. Luxembourg’s policy optimisation simulation: The allocation of additional re-sources amongst the pillars to reach a 10% increase in EIDES score
Sum of additional resources for 10% EIDES score increase (in unit per population) 62,0
CATEGORIESPILLAR
SCORE
NON-DIGITAL
SCORE
DIGITAL
SCORE
Culture, informal institutions 78,0 87,0 89,1
Formal institutions, regulation,
taxation86,2 93,0 85,7
Market conditions 47,8 68,1 68,8
Physical infrastructure 55,6 90,9 69,8
Human capital 63,7 63,8 82,7
Knowledge creation and
dissemination51,1 67,8 60,0
Finance 83,7 55,7 98,9
Networking and support 97,4 84,8 99,1
66,8 76,4 81,8
Digital Entrepreneurship Stand-
up
Digital Entrepreneurship Start-
up
Digital Entrepreneurship Scale-
up
EIDES SCORE
Gen
eral
Fram
ew
ork
Co
nd
itio
ns
Syste
mic
Fram
ew
ork
Co
nd
itio
ns
SUB-INDEX SCORE
68,1
65,4
67,0Su
b-in
dic
es
SUB-INDEX
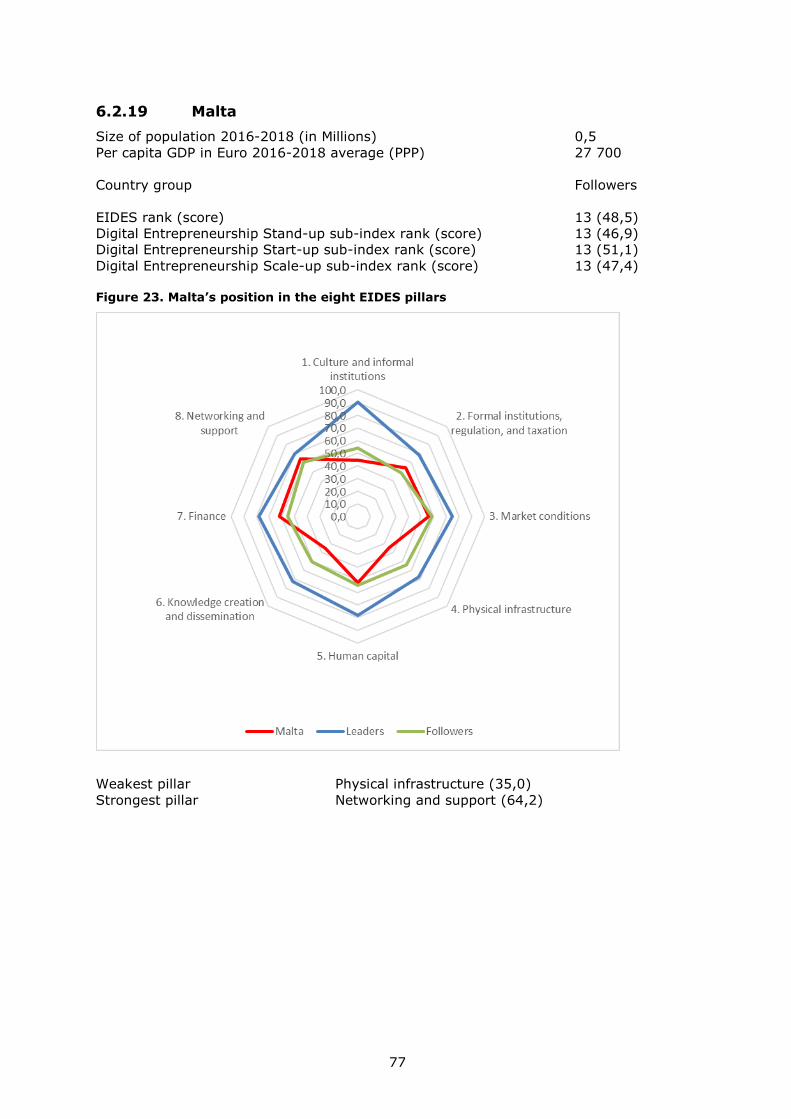
77
6.2.19 Malta
Size of population 2016-2018 (in Millions) 0,5
Per capita GDP in Euro 2016-2018 average (PPP) 27 700
Country group Followers
EIDES rank (score) 13 (48,5)
Digital Entrepreneurship Stand-up sub-index rank (score) 13 (46,9)
Digital Entrepreneurship Start-up sub-index rank (score) 13 (51,1)
Digital Entrepreneurship Scale-up sub-index rank (score) 13 (47,4)
Figure 23. Malta’s position in the eight EIDES pillars
Weakest pillar Physical infrastructure (35,0)
Strongest pillar Networking and support (64,2)
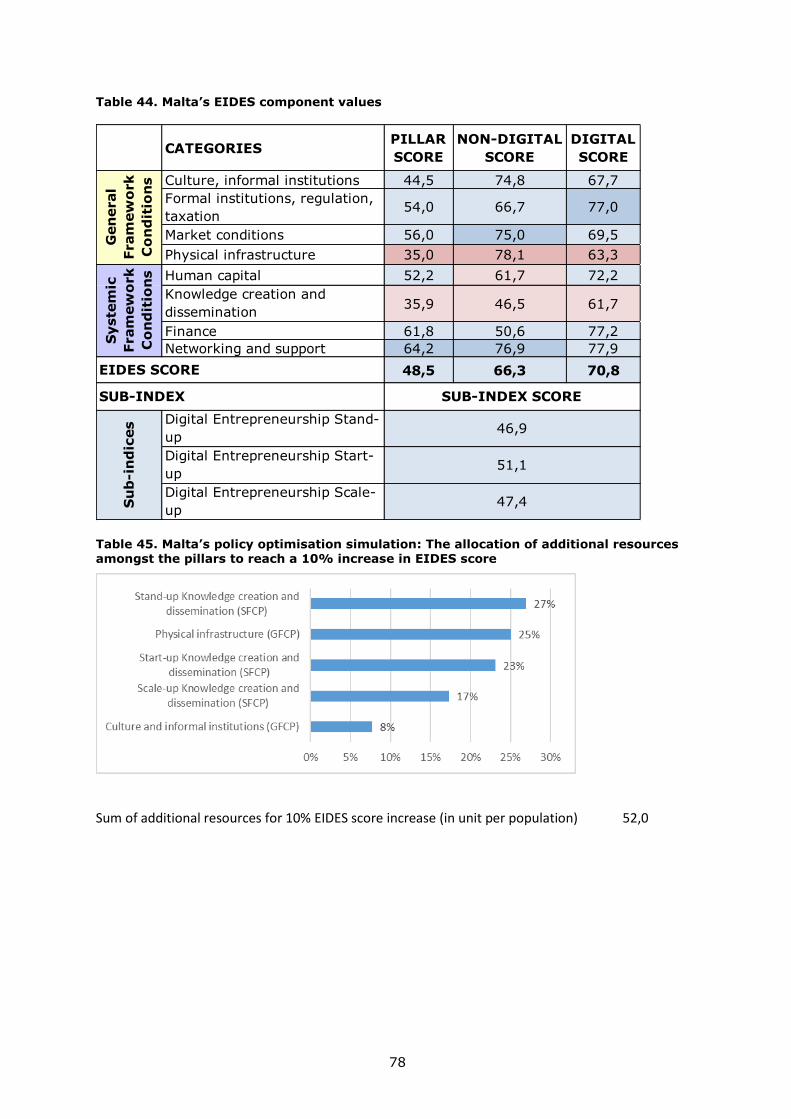
78
Table 44. Malta’s EIDES component values
Table 45. Malta’s policy optimisation simulation: The allocation of additional resources amongst the pillars to reach a 10% increase in EIDES score
Sum of additional resources for 10% EIDES score increase (in unit per population) 52,0
CATEGORIESPILLAR
SCORE
NON-DIGITAL
SCORE
DIGITAL
SCORE
Culture, informal institutions 44,5 74,8 67,7
Formal institutions, regulation,
taxation54,0 66,7 77,0
Market conditions 56,0 75,0 69,5
Physical infrastructure 35,0 78,1 63,3
Human capital 52,2 61,7 72,2
Knowledge creation and
dissemination35,9 46,5 61,7
Finance 61,8 50,6 77,2
Networking and support 64,2 76,9 77,9
48,5 66,3 70,8
Digital Entrepreneurship Stand-
up
Digital Entrepreneurship Start-
up
Digital Entrepreneurship Scale-
up
EIDES SCORE
Gen
eral
Fram
ew
ork
Co
nd
itio
ns
Syste
mic
Fram
ew
ork
Co
nd
itio
ns
SUB-INDEX SCORE
46,9
51,1
47,4Su
b-in
dic
es
SUB-INDEX
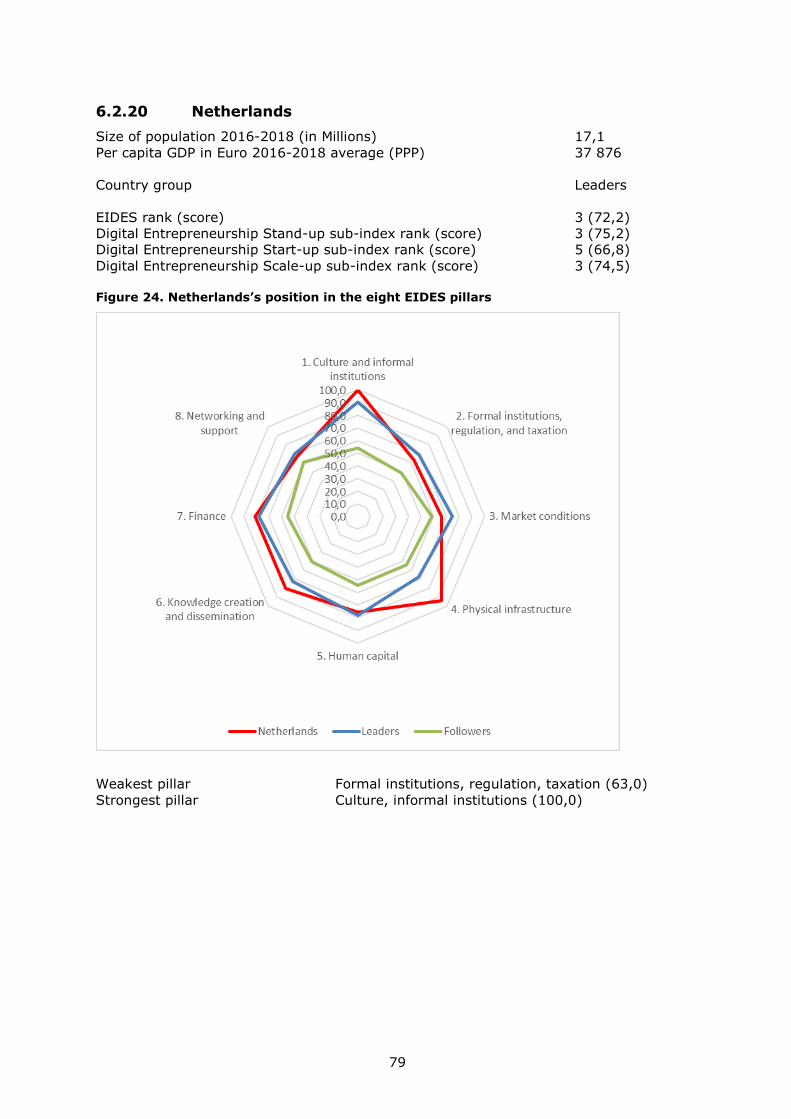
79
6.2.20 Netherlands
Size of population 2016-2018 (in Millions) 17,1
Per capita GDP in Euro 2016-2018 average (PPP) 37 876
Country group Leaders
EIDES rank (score) 3 (72,2)
Digital Entrepreneurship Stand-up sub-index rank (score) 3 (75,2)
Digital Entrepreneurship Start-up sub-index rank (score) 5 (66,8)
Digital Entrepreneurship Scale-up sub-index rank (score) 3 (74,5)
Figure 24. Netherlands’s position in the eight EIDES pillars
Weakest pillar Formal institutions, regulation, taxation (63,0)
Strongest pillar Culture, informal institutions (100,0)
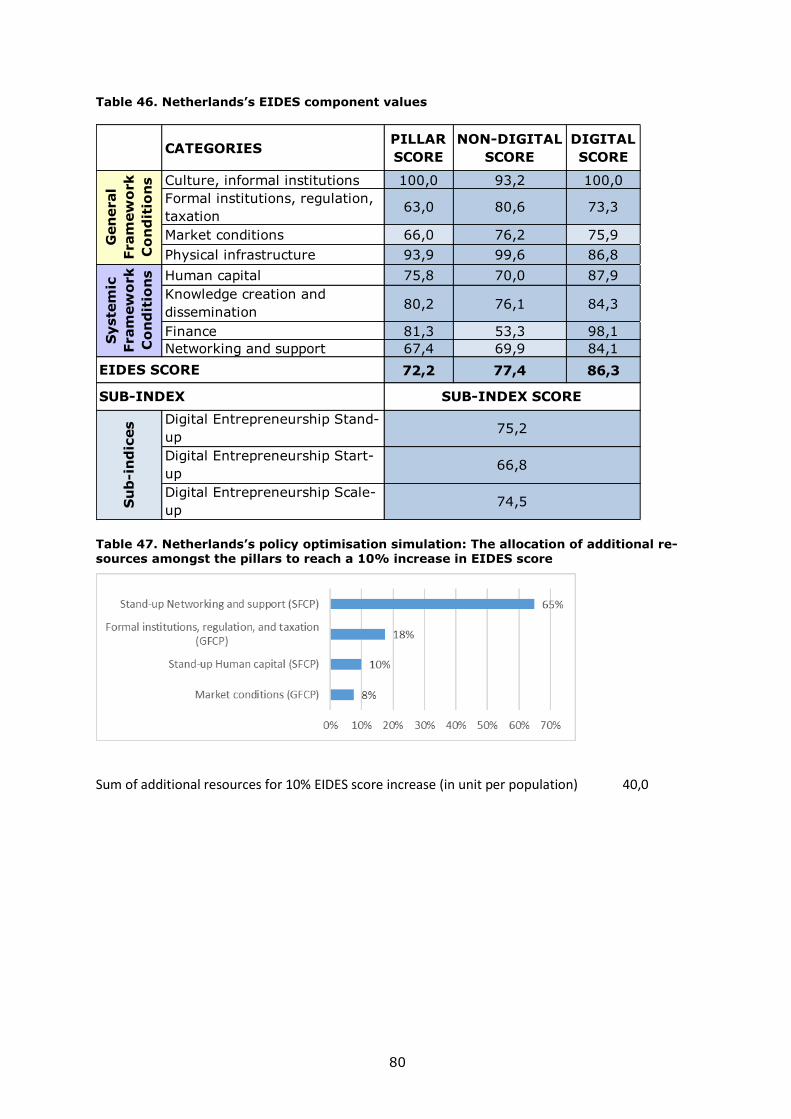
80
Table 46. Netherlands’s EIDES component values
Table 47. Netherlands’s policy optimisation simulation: The allocation of additional re-sources amongst the pillars to reach a 10% increase in EIDES score
Sum of additional resources for 10% EIDES score increase (in unit per population) 40,0
CATEGORIESPILLAR
SCORE
NON-DIGITAL
SCORE
DIGITAL
SCORE
Culture, informal institutions 100,0 93,2 100,0
Formal institutions, regulation,
taxation63,0 80,6 73,3
Market conditions 66,0 76,2 75,9
Physical infrastructure 93,9 99,6 86,8
Human capital 75,8 70,0 87,9
Knowledge creation and
dissemination80,2 76,1 84,3
Finance 81,3 53,3 98,1
Networking and support 67,4 69,9 84,1
72,2 77,4 86,3
Digital Entrepreneurship Stand-
up
Digital Entrepreneurship Start-
up
Digital Entrepreneurship Scale-
up
EIDES SCORE
Gen
eral
Fram
ew
ork
Co
nd
itio
ns
Syste
mic
Fram
ew
ork
Co
nd
itio
ns
SUB-INDEX SCORE
75,2
66,8
74,5Su
b-in
dic
es
SUB-INDEX
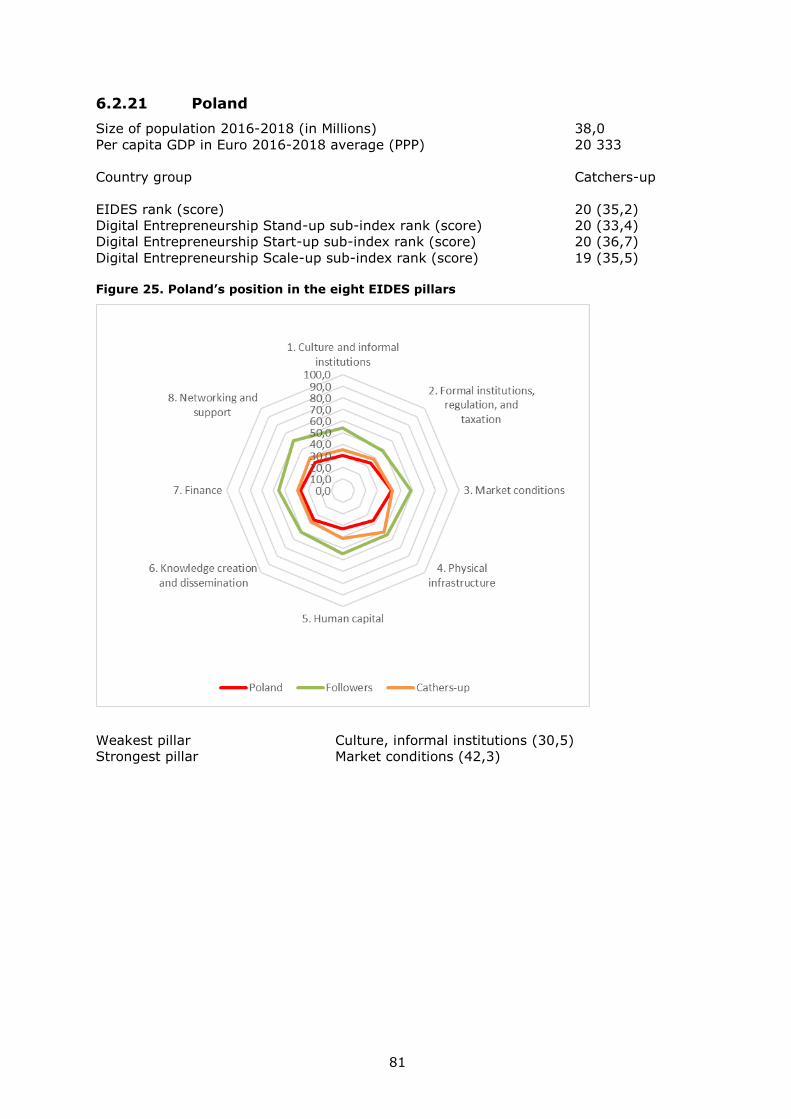
81
6.2.21 Poland
Size of population 2016-2018 (in Millions) 38,0
Per capita GDP in Euro 2016-2018 average (PPP) 20 333
Country group Catchers-up
EIDES rank (score) 20 (35,2)
Digital Entrepreneurship Stand-up sub-index rank (score) 20 (33,4)
Digital Entrepreneurship Start-up sub-index rank (score) 20 (36,7)
Digital Entrepreneurship Scale-up sub-index rank (score) 19 (35,5)
Figure 25. Poland’s position in the eight EIDES pillars
Weakest pillar Culture, informal institutions (30,5)
Strongest pillar Market conditions (42,3)
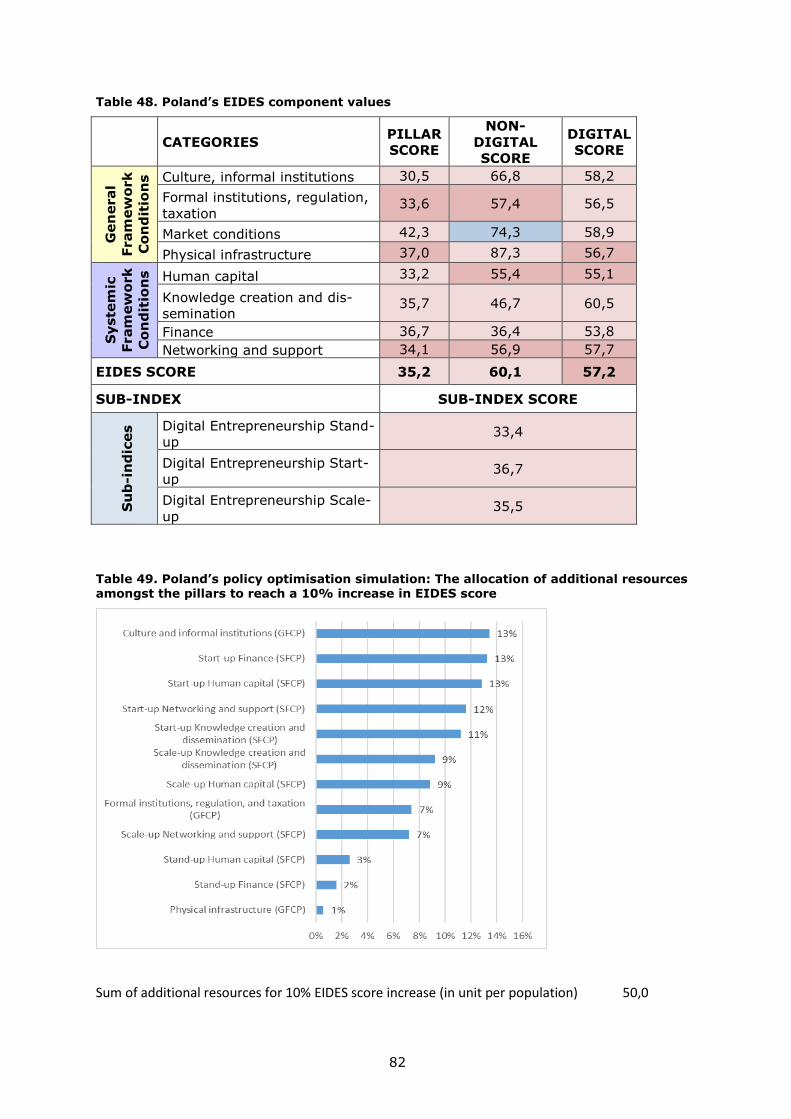
82
Table 48. Poland’s EIDES component values
CATEGORIES PILLAR
SCORE
NON-
DIGITAL
SCORE
DIGITAL
SCORE
Gen
eral
Fram
ew
ork
Co
nd
itio
ns
Culture, informal institutions 30,5 66,8 58,2
Formal institutions, regulation,
taxation 33,6 57,4 56,5
Market conditions 42,3 74,3 58,9
Physical infrastructure 37,0 87,3 56,7
Syste
mic
Fram
ew
ork
Co
nd
itio
ns
Human capital 33,2 55,4 55,1
Knowledge creation and dis-
semination 35,7 46,7 60,5
Finance 36,7 36,4 53,8
Networking and support 34,1 56,9 57,7
EIDES SCORE 35,2 60,1 57,2
SUB-INDEX SUB-INDEX SCORE
Su
b-i
nd
ices Digital Entrepreneurship Stand-
up 33,4
Digital Entrepreneurship Start-
up 36,7
Digital Entrepreneurship Scale-
up 35,5
Table 49. Poland’s policy optimisation simulation: The allocation of additional resources amongst the pillars to reach a 10% increase in EIDES score
Sum of additional resources for 10% EIDES score increase (in unit per population) 50,0

83
6.2.22 Portugal
Size of population 2016-2018 (in Millions) 10,3
Per capita GDP in Euro 2016-2018 average (PPP) 22 633
Country group Catchers-up
EIDES rank (score) 18 (37,1)
Digital Entrepreneurship Stand-up sub-index rank (score) 18 (37,6)
Digital Entrepreneurship Start-up sub-index rank (score) 19 (37,0)
Digital Entrepreneurship Scale-up sub-index rank (score) 18 (36,6)
Figure 26. Portugal’s position in the eight EIDES pillars
Weakest pillar Culture, informal institutions (26,2)
Strongest pillar Physical infrastructure (51,7)
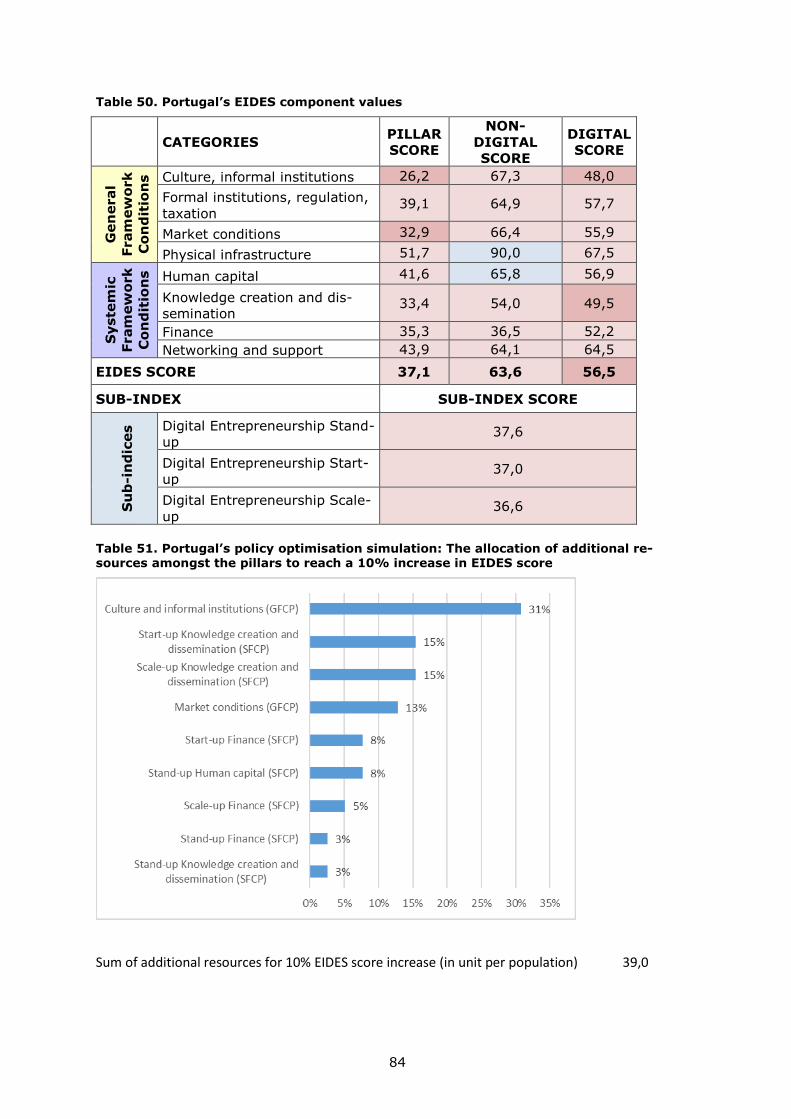
84
Table 50. Portugal’s EIDES component values
CATEGORIES PILLAR
SCORE
NON-
DIGITAL
SCORE
DIGITAL
SCORE
Gen
eral
Fram
ew
ork
Co
nd
itio
ns
Culture, informal institutions 26,2 67,3 48,0
Formal institutions, regulation,
taxation 39,1 64,9 57,7
Market conditions 32,9 66,4 55,9
Physical infrastructure 51,7 90,0 67,5
Syste
mic
Fram
ew
ork
Co
nd
itio
ns
Human capital 41,6 65,8 56,9
Knowledge creation and dis-
semination 33,4 54,0 49,5
Finance 35,3 36,5 52,2
Networking and support 43,9 64,1 64,5
EIDES SCORE 37,1 63,6 56,5
SUB-INDEX SUB-INDEX SCORE
Su
b-i
nd
ices Digital Entrepreneurship Stand-
up 37,6
Digital Entrepreneurship Start-
up 37,0
Digital Entrepreneurship Scale-
up 36,6
Table 51. Portugal’s policy optimisation simulation: The allocation of additional re-sources amongst the pillars to reach a 10% increase in EIDES score
Sum of additional resources for 10% EIDES score increase (in unit per population) 39,0
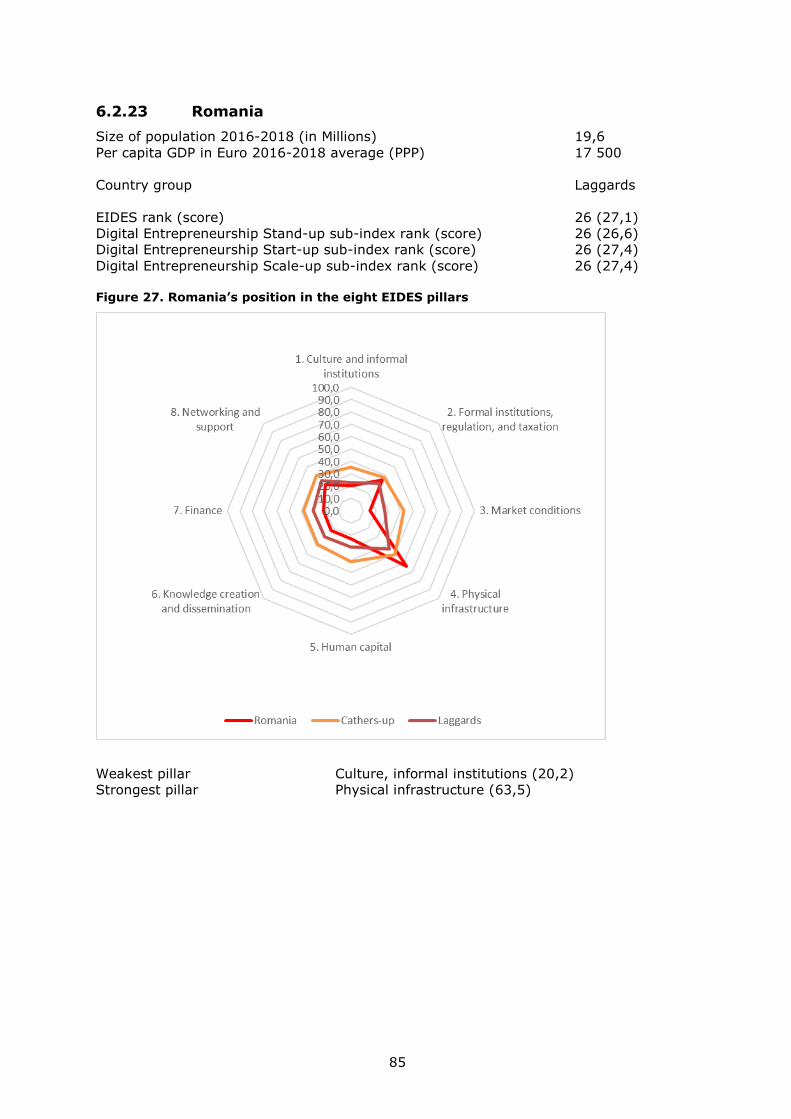
85
6.2.23 Romania
Size of population 2016-2018 (in Millions) 19,6
Per capita GDP in Euro 2016-2018 average (PPP) 17 500
Country group Laggards
EIDES rank (score) 26 (27,1)
Digital Entrepreneurship Stand-up sub-index rank (score) 26 (26,6)
Digital Entrepreneurship Start-up sub-index rank (score) 26 (27,4)
Digital Entrepreneurship Scale-up sub-index rank (score) 26 (27,4)
Figure 27. Romania’s position in the eight EIDES pillars
Weakest pillar Culture, informal institutions (20,2)
Strongest pillar Physical infrastructure (63,5)
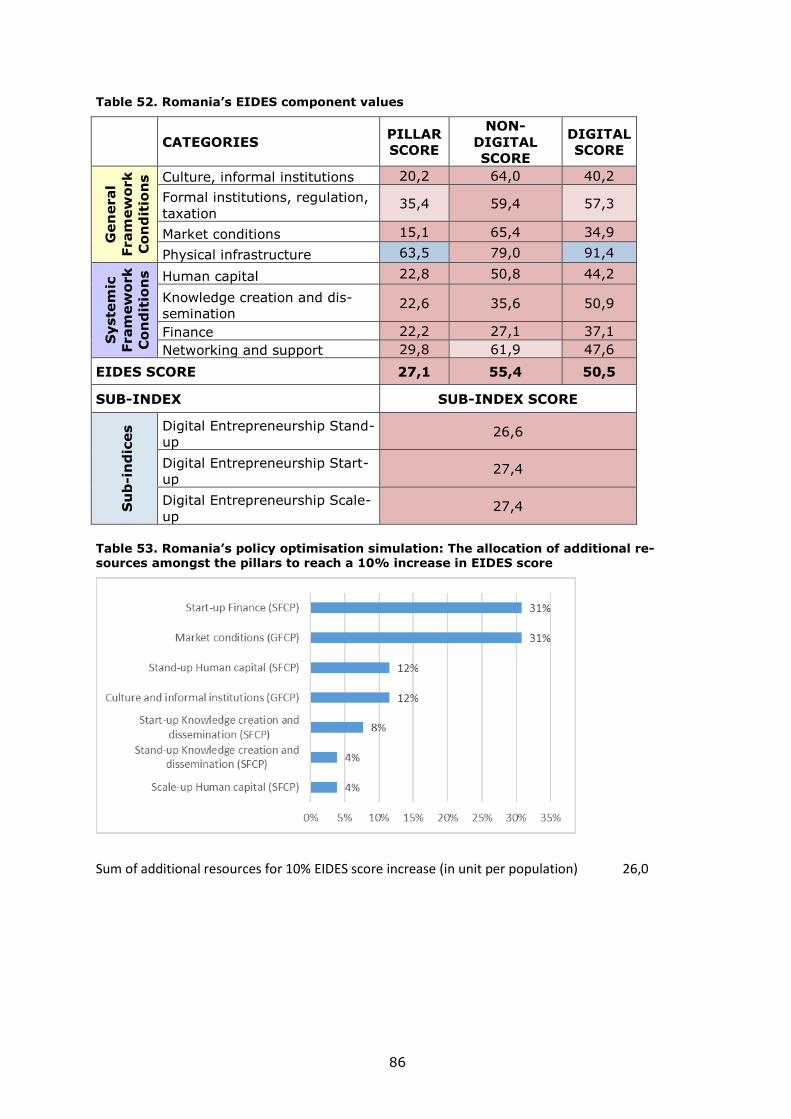
86
Table 52. Romania’s EIDES component values
CATEGORIES PILLAR
SCORE
NON-
DIGITAL
SCORE
DIGITAL
SCORE
Gen
eral
Fram
ew
ork
Co
nd
itio
ns
Culture, informal institutions 20,2 64,0 40,2
Formal institutions, regulation,
taxation 35,4 59,4 57,3
Market conditions 15,1 65,4 34,9
Physical infrastructure 63,5 79,0 91,4
Syste
mic
Fram
ew
ork
Co
nd
itio
ns
Human capital 22,8 50,8 44,2
Knowledge creation and dis-
semination 22,6 35,6 50,9
Finance 22,2 27,1 37,1
Networking and support 29,8 61,9 47,6
EIDES SCORE 27,1 55,4 50,5
SUB-INDEX SUB-INDEX SCORE
Su
b-i
nd
ices Digital Entrepreneurship Stand-
up 26,6
Digital Entrepreneurship Start-
up 27,4
Digital Entrepreneurship Scale-
up 27,4
Table 53. Romania’s policy optimisation simulation: The allocation of additional re-sources amongst the pillars to reach a 10% increase in EIDES score
Sum of additional resources for 10% EIDES score increase (in unit per population) 26,0
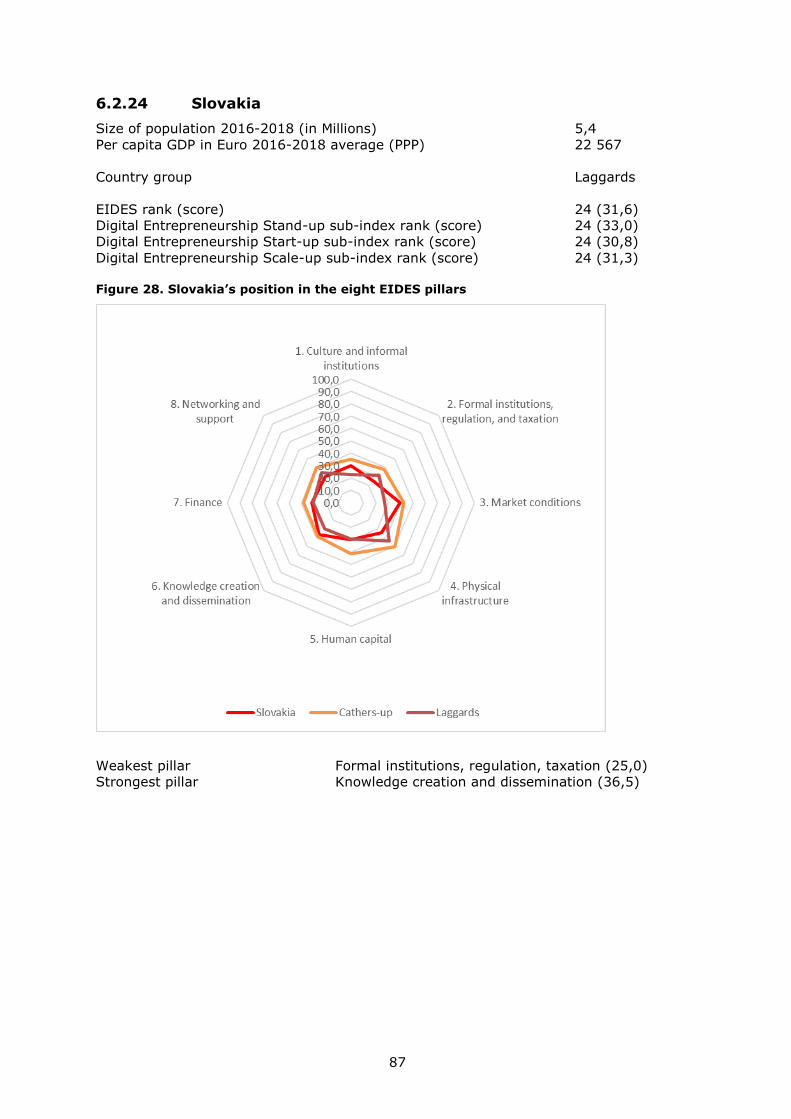
87
6.2.24 Slovakia
Size of population 2016-2018 (in Millions) 5,4
Per capita GDP in Euro 2016-2018 average (PPP) 22 567
Country group Laggards
EIDES rank (score) 24 (31,6)
Digital Entrepreneurship Stand-up sub-index rank (score) 24 (33,0)
Digital Entrepreneurship Start-up sub-index rank (score) 24 (30,8)
Digital Entrepreneurship Scale-up sub-index rank (score) 24 (31,3)
Figure 28. Slovakia’s position in the eight EIDES pillars
Weakest pillar Formal institutions, regulation, taxation (25,0)
Strongest pillar Knowledge creation and dissemination (36,5)
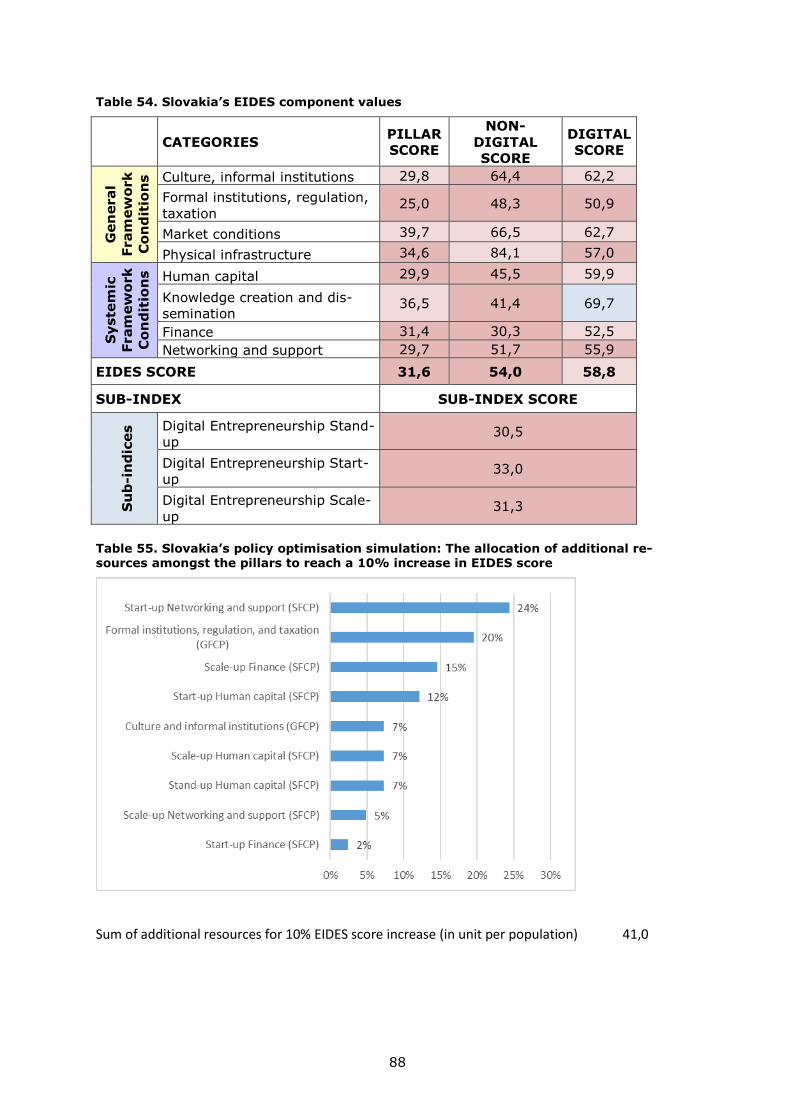
88
Table 54. Slovakia’s EIDES component values
CATEGORIES PILLAR
SCORE
NON-
DIGITAL
SCORE
DIGITAL
SCORE
Gen
eral
Fram
ew
ork
Co
nd
itio
ns
Culture, informal institutions 29,8 64,4 62,2
Formal institutions, regulation,
taxation 25,0 48,3 50,9
Market conditions 39,7 66,5 62,7
Physical infrastructure 34,6 84,1 57,0
Syste
mic
Fram
ew
ork
Co
nd
itio
ns
Human capital 29,9 45,5 59,9
Knowledge creation and dis-
semination 36,5 41,4 69,7
Finance 31,4 30,3 52,5
Networking and support 29,7 51,7 55,9
EIDES SCORE 31,6 54,0 58,8
SUB-INDEX SUB-INDEX SCORE
Su
b-i
nd
ices Digital Entrepreneurship Stand-
up 30,5
Digital Entrepreneurship Start-
up 33,0
Digital Entrepreneurship Scale-
up 31,3
Table 55. Slovakia’s policy optimisation simulation: The allocation of additional re-sources amongst the pillars to reach a 10% increase in EIDES score
Sum of additional resources for 10% EIDES score increase (in unit per population) 41,0

89
6.2.25 Slovenia
Size of population 2016-2018 (in Millions) 2,1
Per capita GDP in Euro 2016-2018 average (PPP) 24 467
Country group Catchers-up
EIDES rank (score) 17 (39,9)
Digital Entrepreneurship Stand-up sub-index rank (score) 17 (38,3)
Digital Entrepreneurship Start-up sub-index rank (score) 17 (42,2)
Digital Entrepreneurship Scale-up sub-index rank (score) 17 (39,1)
Figure 29. Slovenia’s position in the eight EIDES pillars
Weakest pillar Finance (28,7)
Strongest pillar Physical infrastructure (54,2)
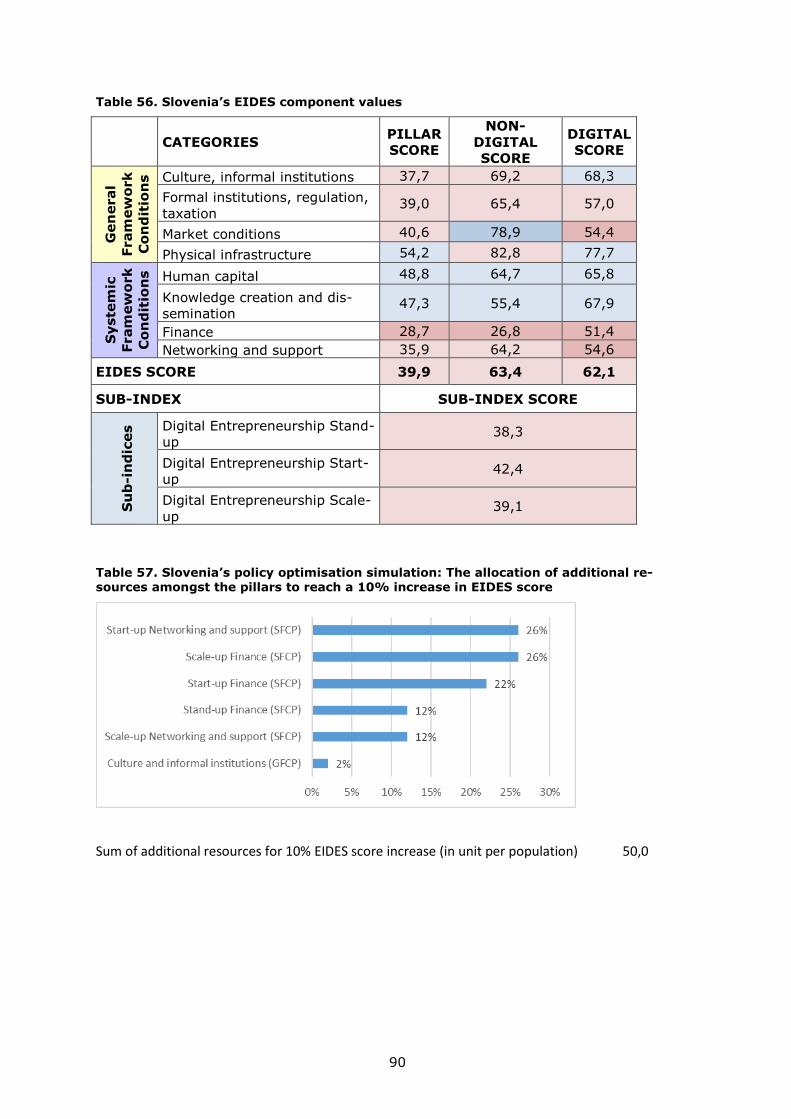
90
Table 56. Slovenia’s EIDES component values
CATEGORIES PILLAR
SCORE
NON-
DIGITAL
SCORE
DIGITAL
SCORE
Gen
eral
Fram
ew
ork
Co
nd
itio
ns
Culture, informal institutions 37,7 69,2 68,3
Formal institutions, regulation,
taxation 39,0 65,4 57,0
Market conditions 40,6 78,9 54,4
Physical infrastructure 54,2 82,8 77,7
Syste
mic
Fram
ew
ork
Co
nd
itio
ns
Human capital 48,8 64,7 65,8
Knowledge creation and dis-
semination 47,3 55,4 67,9
Finance 28,7 26,8 51,4
Networking and support 35,9 64,2 54,6
EIDES SCORE 39,9 63,4 62,1
SUB-INDEX SUB-INDEX SCORE
Su
b-i
nd
ices Digital Entrepreneurship Stand-
up 38,3
Digital Entrepreneurship Start-
up 42,4
Digital Entrepreneurship Scale-
up 39,1
Table 57. Slovenia’s policy optimisation simulation: The allocation of additional re-sources amongst the pillars to reach a 10% increase in EIDES score
Sum of additional resources for 10% EIDES score increase (in unit per population) 50,0
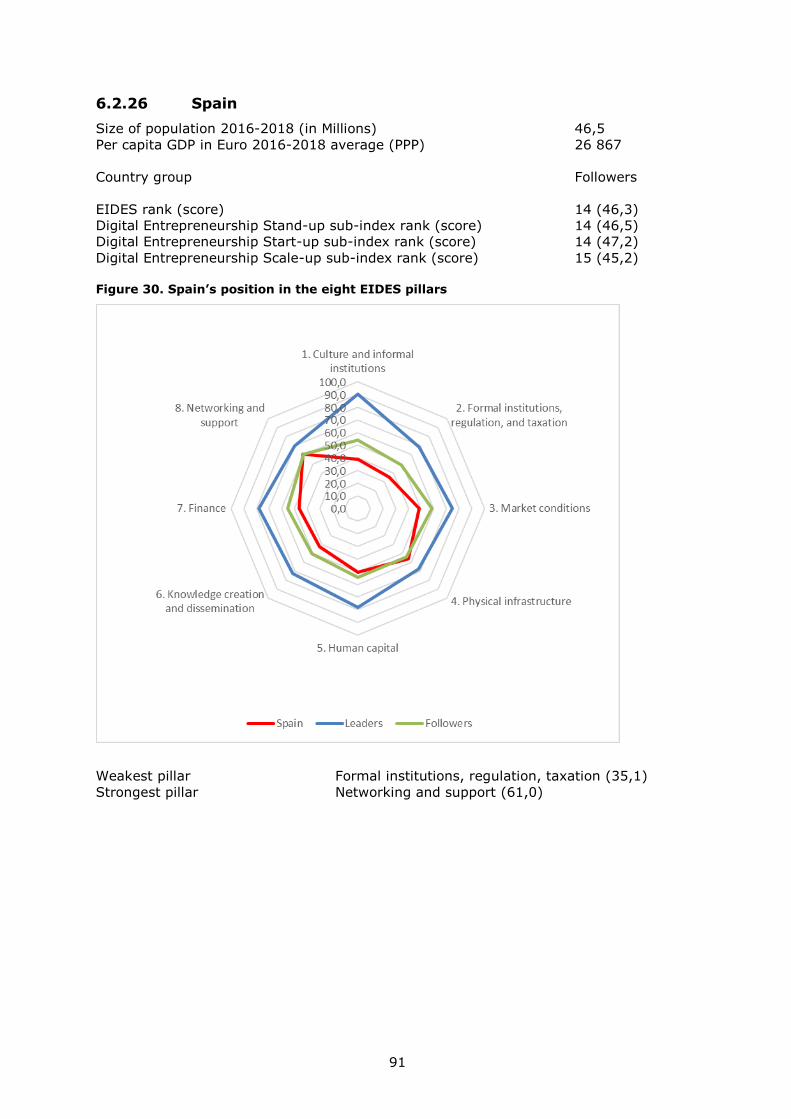
91
6.2.26 Spain
Size of population 2016-2018 (in Millions) 46,5
Per capita GDP in Euro 2016-2018 average (PPP) 26 867
Country group Followers
EIDES rank (score) 14 (46,3)
Digital Entrepreneurship Stand-up sub-index rank (score) 14 (46,5)
Digital Entrepreneurship Start-up sub-index rank (score) 14 (47,2)
Digital Entrepreneurship Scale-up sub-index rank (score) 15 (45,2)
Figure 30. Spain’s position in the eight EIDES pillars
Weakest pillar Formal institutions, regulation, taxation (35,1)
Strongest pillar Networking and support (61,0)
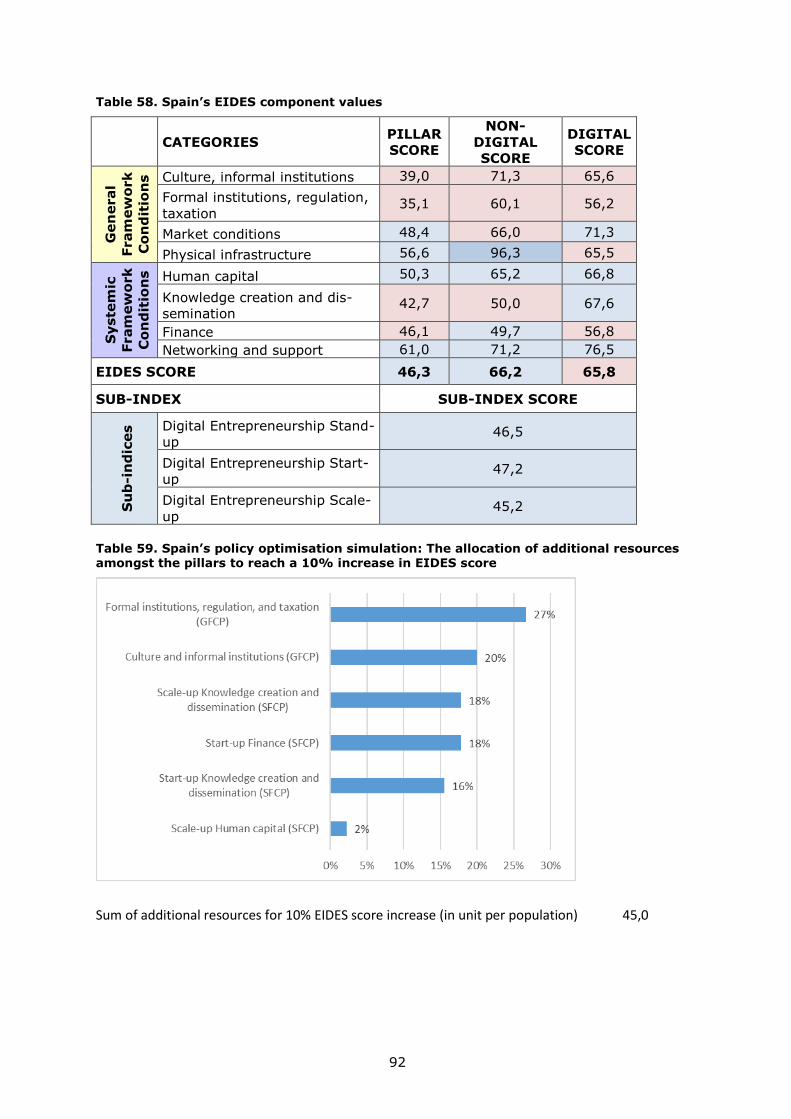
92
Table 58. Spain’s EIDES component values
CATEGORIES PILLAR
SCORE
NON-
DIGITAL
SCORE
DIGITAL
SCORE
Gen
eral
Fram
ew
ork
Co
nd
itio
ns
Culture, informal institutions 39,0 71,3 65,6
Formal institutions, regulation,
taxation 35,1 60,1 56,2
Market conditions 48,4 66,0 71,3
Physical infrastructure 56,6 96,3 65,5
Syste
mic
Fram
ew
ork
Co
nd
itio
ns
Human capital 50,3 65,2 66,8
Knowledge creation and dis-
semination 42,7 50,0 67,6
Finance 46,1 49,7 56,8
Networking and support 61,0 71,2 76,5
EIDES SCORE 46,3 66,2 65,8
SUB-INDEX SUB-INDEX SCORE
Su
b-i
nd
ices Digital Entrepreneurship Stand-
up 46,5
Digital Entrepreneurship Start-
up 47,2
Digital Entrepreneurship Scale-
up 45,2
Table 59. Spain’s policy optimisation simulation: The allocation of additional resources amongst the pillars to reach a 10% increase in EIDES score
Sum of additional resources for 10% EIDES score increase (in unit per population) 45,0
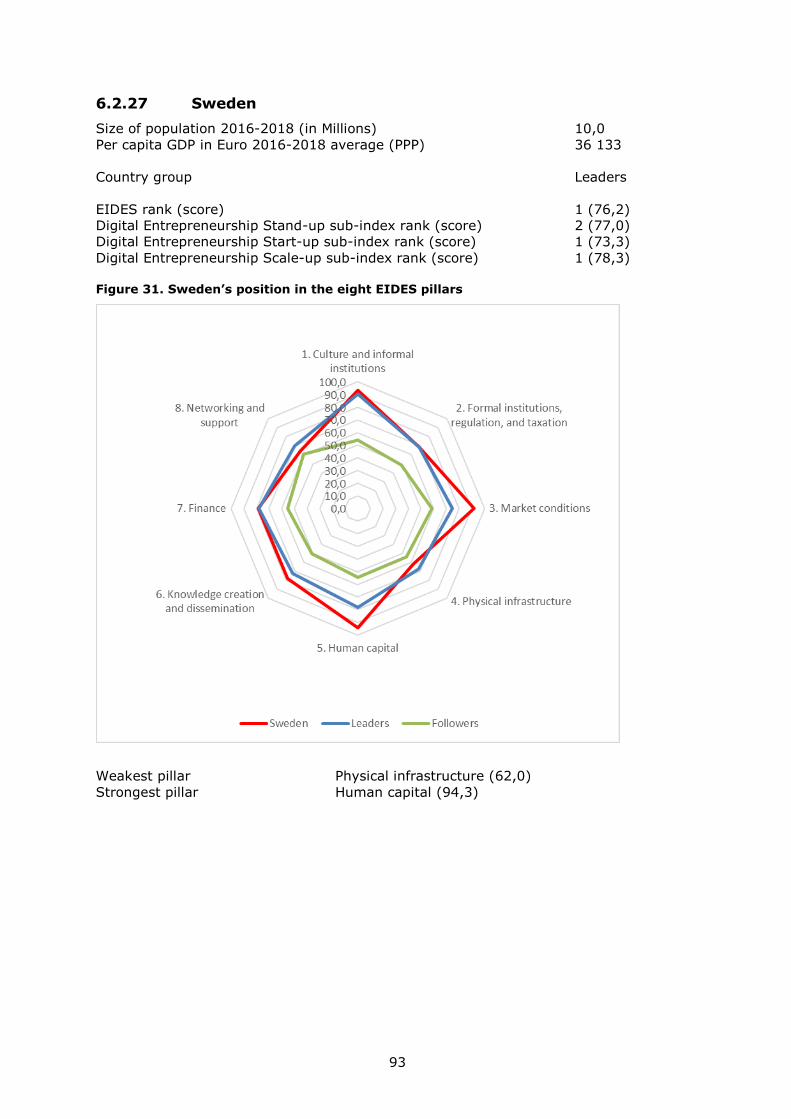
93
6.2.27 Sweden
Size of population 2016-2018 (in Millions) 10,0
Per capita GDP in Euro 2016-2018 average (PPP) 36 133
Country group Leaders
EIDES rank (score) 1 (76,2)
Digital Entrepreneurship Stand-up sub-index rank (score) 2 (77,0)
Digital Entrepreneurship Start-up sub-index rank (score) 1 (73,3)
Digital Entrepreneurship Scale-up sub-index rank (score) 1 (78,3)
Figure 31. Sweden’s position in the eight EIDES pillars
Weakest pillar Physical infrastructure (62,0)
Strongest pillar Human capital (94,3)

94
Table 60. Sweden’s EIDES component values
CATEGORIES PILLAR
SCORE
NON-
DIGITAL
SCORE
DIGITAL
SCORE
Gen
eral
Fram
ew
ork
Co
nd
itio
ns
Culture, informal institutions 93,4 94,2 89,9
Formal institutions, regulation,
taxation 68,8 81,0 79,6
Market conditions 92,1 74,6 95,2
Physical infrastructure 62,0 90,8 75,1
Syste
mic
Fram
ew
ork
Co
nd
itio
ns
Human capital 94,3 74,2 100,0
Knowledge creation and dis-
semination 78,0 79,4 78,7
Finance 78,6 61,6 87,4
Networking and support 63,9 76,6 75,8
EIDES SCORE 76,2 79,0 85,2
SUB-INDEX SUB-INDEX SCORE
Su
b-i
nd
ices Digital Entrepreneurship Stand-
up 77,0
Digital Entrepreneurship Start-
up 73,3
Digital Entrepreneurship Scale-
up 78,3
Table 61. Sweden’s policy optimisation simulation: The allocation of additional resources amongst the pillars to reach a 10% increase in EIDES score
Sum of additional resources for 10% EIDES score increase (in unit per population) 88,0
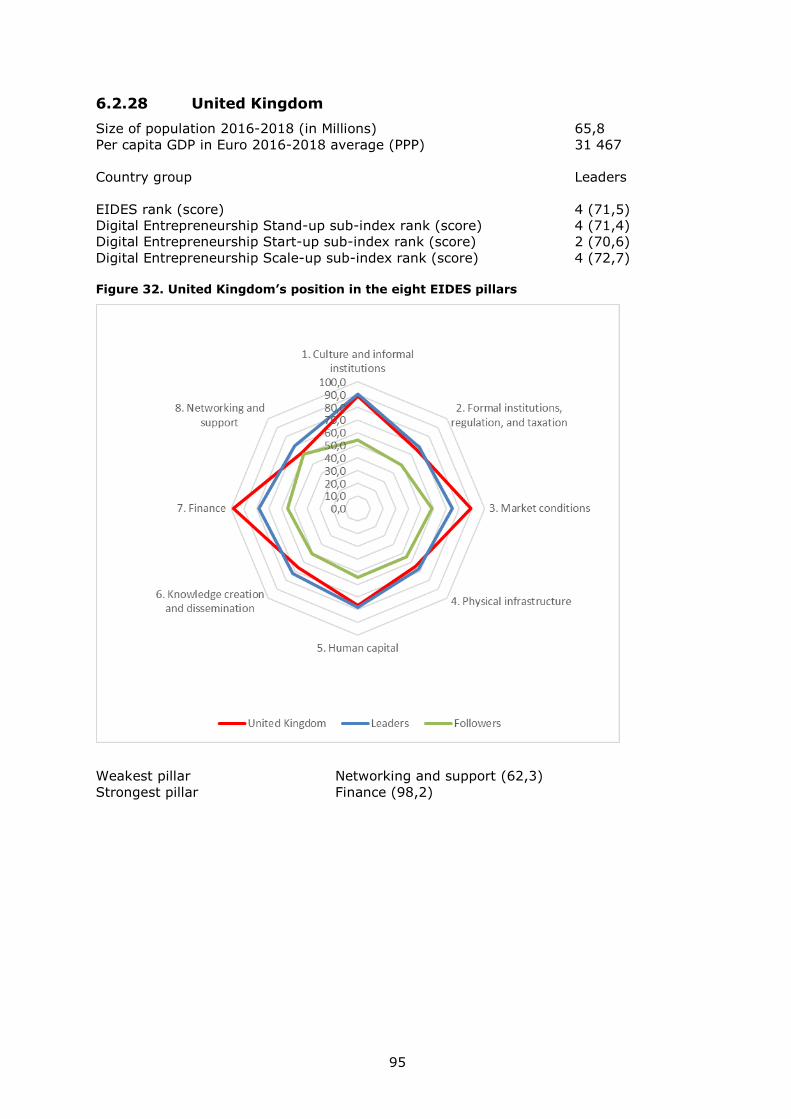
95
6.2.28 United Kingdom
Size of population 2016-2018 (in Millions) 65,8
Per capita GDP in Euro 2016-2018 average (PPP) 31 467
Country group Leaders
EIDES rank (score) 4 (71,5)
Digital Entrepreneurship Stand-up sub-index rank (score) 4 (71,4)
Digital Entrepreneurship Start-up sub-index rank (score) 2 (70,6)
Digital Entrepreneurship Scale-up sub-index rank (score) 4 (72,7)
Figure 32. United Kingdom’s position in the eight EIDES pillars
Weakest pillar Networking and support (62,3)
Strongest pillar Finance (98,2)
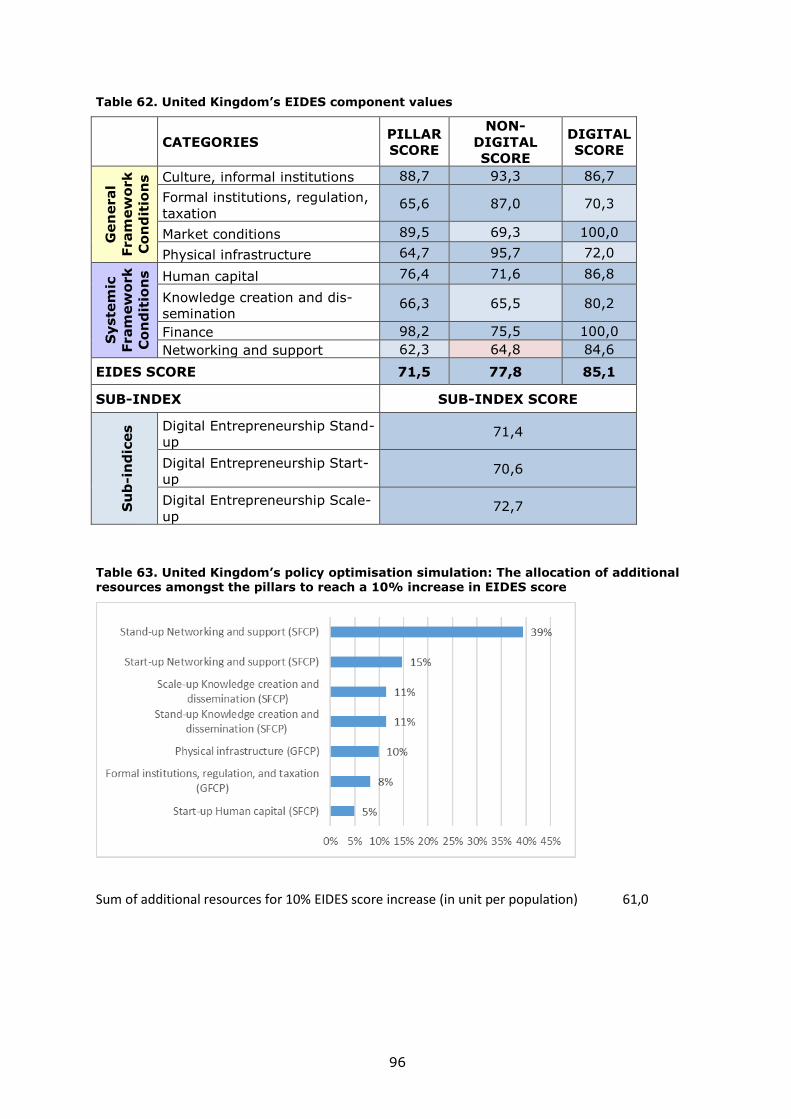
96
Table 62. United Kingdom’s EIDES component values
CATEGORIES PILLAR
SCORE
NON-
DIGITAL
SCORE
DIGITAL
SCORE
Gen
eral
Fram
ew
ork
Co
nd
itio
ns
Culture, informal institutions 88,7 93,3 86,7
Formal institutions, regulation,
taxation 65,6 87,0 70,3
Market conditions 89,5 69,3 100,0
Physical infrastructure 64,7 95,7 72,0
Syste
mic
Fram
ew
ork
Co
nd
itio
ns
Human capital 76,4 71,6 86,8
Knowledge creation and dis-
semination 66,3 65,5 80,2
Finance 98,2 75,5 100,0
Networking and support 62,3 64,8 84,6
EIDES SCORE 71,5 77,8 85,1
SUB-INDEX SUB-INDEX SCORE
Su
b-i
nd
ices Digital Entrepreneurship Stand-
up 71,4
Digital Entrepreneurship Start-
up 70,6
Digital Entrepreneurship Scale-
up 72,7
Table 63. United Kingdom’s policy optimisation simulation: The allocation of additional resources amongst the pillars to reach a 10% increase in EIDES score
Sum of additional resources for 10% EIDES score increase (in unit per population) 61,0
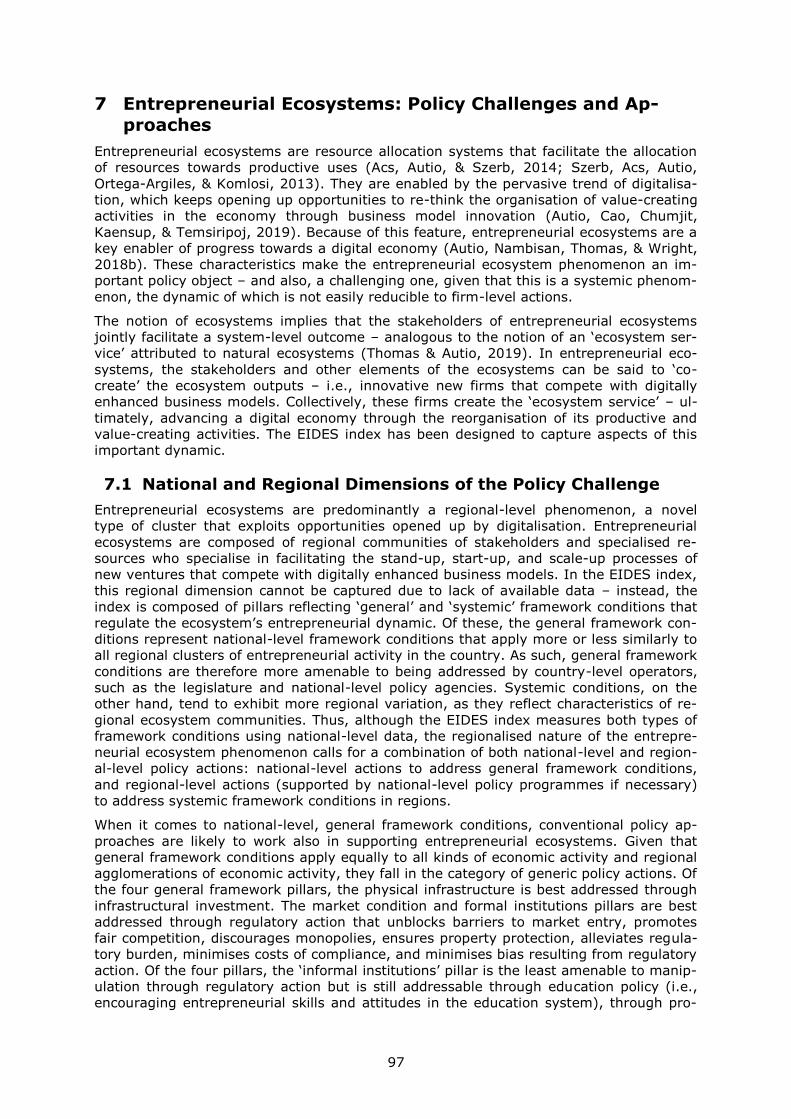
97
7 Entrepreneurial Ecosystems: Policy Challenges and Ap-
proaches
Entrepreneurial ecosystems are resource allocation systems that facilitate the allocation
of resources towards productive uses (Acs, Autio, & Szerb, 2014; Szerb, Acs, Autio,
Ortega-Argiles, & Komlosi, 2013). They are enabled by the pervasive trend of digitalisa-
tion, which keeps opening up opportunities to re-think the organisation of value-creating
activities in the economy through business model innovation (Autio, Cao, Chumjit,
Kaensup, & Temsiripoj, 2019). Because of this feature, entrepreneurial ecosystems are a
key enabler of progress towards a digital economy (Autio, Nambisan, Thomas, & Wright,
2018b). These characteristics make the entrepreneurial ecosystem phenomenon an im-
portant policy object – and also, a challenging one, given that this is a systemic phenom-
enon, the dynamic of which is not easily reducible to firm-level actions.
The notion of ecosystems implies that the stakeholders of entrepreneurial ecosystems
jointly facilitate a system-level outcome – analogous to the notion of an ‘ecosystem ser-
vice’ attributed to natural ecosystems (Thomas & Autio, 2019). In entrepreneurial eco-
systems, the stakeholders and other elements of the ecosystems can be said to ‘co-
create’ the ecosystem outputs – i.e., innovative new firms that compete with digitally
enhanced business models. Collectively, these firms create the ‘ecosystem service’ – ul-
timately, advancing a digital economy through the reorganisation of its productive and
value-creating activities. The EIDES index has been designed to capture aspects of this
important dynamic.
7.1 National and Regional Dimensions of the Policy Challenge
Entrepreneurial ecosystems are predominantly a regional-level phenomenon, a novel
type of cluster that exploits opportunities opened up by digitalisation. Entrepreneurial
ecosystems are composed of regional communities of stakeholders and specialised re-
sources who specialise in facilitating the stand-up, start-up, and scale-up processes of
new ventures that compete with digitally enhanced business models. In the EIDES index,
this regional dimension cannot be captured due to lack of available data – instead, the
index is composed of pillars reflecting ‘general’ and ‘systemic’ framework conditions that
regulate the ecosystem’s entrepreneurial dynamic. Of these, the general framework con-
ditions represent national-level framework conditions that apply more or less similarly to
all regional clusters of entrepreneurial activity in the country. As such, general framework
conditions are therefore more amenable to being addressed by country-level operators,
such as the legislature and national-level policy agencies. Systemic conditions, on the
other hand, tend to exhibit more regional variation, as they reflect characteristics of re-
gional ecosystem communities. Thus, although the EIDES index measures both types of
framework conditions using national-level data, the regionalised nature of the entrepre-
neurial ecosystem phenomenon calls for a combination of both national-level and region-
al-level policy actions: national-level actions to address general framework conditions,
and regional-level actions (supported by national-level policy programmes if necessary)
to address systemic framework conditions in regions.
When it comes to national-level, general framework conditions, conventional policy ap-
proaches are likely to work also in supporting entrepreneurial ecosystems. Given that
general framework conditions apply equally to all kinds of economic activity and regional
agglomerations of economic activity, they fall in the category of generic policy actions. Of
the four general framework pillars, the physical infrastructure is best addressed through
infrastructural investment. The market condition and formal institutions pillars are best
addressed through regulatory action that unblocks barriers to market entry, promotes
fair competition, discourages monopolies, ensures property protection, alleviates regula-
tory burden, minimises costs of compliance, and minimises bias resulting from regulatory
action. Of the four pillars, the ‘informal institutions’ pillar is the least amenable to manip-
ulation through regulatory action but is still addressable through education policy (i.e.,
encouraging entrepreneurial skills and attitudes in the education system), through pro-
98
motion efforts, and also, through policy actions that lower the opportunity costs of entre-
preneurial career choice. Such policies are well established and do not necessarily require
novel policy approaches.
In contrast, the regional dimension of entrepreneurial ecosystems does represent novel
challenges to policy, ones that arise from their community-centric nature and from the
fact that entrepreneurial ecosystems are composed of hierarchically independent partici-
pants, whose interests might not always be co-aligned. In their study of the policy man-
agement of entrepreneurial ecosystems, Autio and Levie (2017) noted four distinctive
policy challenges posed by the characteristics of entrepreneurial ecosystems:
(1) knowledge of the ‘inner workings’ of an entrepreneurial ecosystem community is
both imperfect and unevenly distributed within the ecosystem community and
therefore not easily observable from outside the ecosystem
(2) actions taken by individual ecosystem participants may generated cascading ef-
fects along complex causal chains, creating the possibility of unintended conse-
quences for policy actions
(3) the interests of ecosystem participants may be imperfectly aligned, giving rise to
potential resistance to policy actions
(4) interlocking relationships among ecosystem participants, combined with imper-
fect understanding how the ecosystem works, can make entrepreneurial ecosys-
tems highly inertial and resistant to policy action
Noting these challenges, Autio and Levie (2017) observed that traditional entrepreneur-
ship policy approaches are not likely to be effective in entrepreneurial ecosystems. These
approaches can be categorised into two categories: ‘market failure’ policies and ‘struc-
tural failure’ policies (Acs et al., 2014). Market failure policies address specific, externally
observable ‘market failures’ in economic systems. Such market failures usually arise from
the ‘failure’ of the market pricing mechanism to correctly price certain desired actions,
thereby creating a disincentive for such action (Arrow, 1962). A classic example concerns
investment in innovative activity and R&D: because R&D activities are both uncertain and
their outcomes prone to leak, firms are discouraged to invest in such activity. This is be-
cause it is not guaranteed that investments in R&D will result in meaningful, value-
adding technological advances, and even if it did, there is a risk that competitors could
quickly copy such advances and thus neutralise the resulting advantage for the inventor.
Because of such concerns, firms might not invest sufficiently in R&D, with the result that
positive system-wide effects resulting from knowledge spill-overs fail to materialise. Such
a failure is normally fairly straightforward to address through policy action because it is
possible to observe the failure from outside (firms under-invest in R&D) and address it
through targeted, top-down policy action (create an R&D subsidy to incentivise firms to
invest in R&D). Such top-down, targeted policy action is easy to address through conven-
tional policy action, by instituting a law legalising such subsidies and assigning the ad-
ministration of these to an appropriate policy agency.
The other conventional approach to entrepreneurship and innovation policy seeks to simi-
larly observe and fix ‘structural failures’ in national and regional systems of innovation.
This approach reflects the institutional emphasis of the systems of innovation literature
and seeks to fix structural gaps in national and regional institutional landscapes designed
to support innovative activity (Edquist & Johnson, 1997). As an example of a structural
failure, an analysis of a given regional system of innovation might notice a lack of bridg-
ing institutions to connect research advances achieved in universities and research insti-
tutions to empirical application. Such a gap could be addressed, for example, by setting
up a technology licensing office, or by establishing a science park to support spin-out
companies that commercialise advances in basic and applied research. The primary em-
phasis, thus, is in fixing structural gaps by building new institutional structures such as
science parks. Similar to market failure policy, also structural failure policy measures
would identify externally observable gaps in national and regional innovation structures
and plug these through top-down policy action.
99
Given the characteristics of entrepreneurial ecosystems highlighted above, traditional,
‘top-down’ policies may not be effective in addressing what we would like to call ‘ecosys-
tem failures’. This is because of several reasons:
- whereas both ‘market’ and ‘structural’ failures tend to be quite static and endur-
ing, ecosystem failures tend to be dynamic and emergent, being co-produced by
ecosystem participant interactions
- whereas both ‘market’ and ‘structural’ failures can be observed from ‘outside’
(i.e., by an external observer), the patterns of participant interactions are less
easy to observe by an outsider – and being embedded in dyadic interactions be-
tween ecosystem participants, difficult to observe even for most insiders
- whereas both ‘market’ and ‘structural’ failure correction lend themselves for cor-
rective action in a top-down mode, the hierarchically independent (yet mutually
co-dependent) nature of ecosystem participants, combined by their sometimes
limited awareness of other ecosystem participants, render ‘top-down’ actions
more difficult in entrepreneurial ecosystem contexts
- whereas both ‘market’ and ‘structural’ failures can be addressed from the outside,
many ecosystem failures can only be addressed from the inside
- whereas both ‘market’ and ‘structural’ failures can be effectively addressed with
highly specific actions, more broad-based and orchestrated actions are required to
overcome ecosystem inertia
Because of these challenges, effective policies targeting entrepreneurial ecosystems need
to:
- be operated in a bottom-up mode
- actively engage ecosystem participants in a collective effort to both promote mu-
tual awareness among ecosystem participants, foster productive interactions
among these, distil a shared understanding of what the ecosystem entails and
how it operates, where the gaps are, and what collective actions are required to
address them
- focus on coordination of emergent actions and understandings among heteroge-
neous participants (as opposed to top-down implementation of predetermined ac-
tions)
- when necessary, orchestrate ecosystem actions with specific top-down actions
such as targeted subsidies
- be long term to allow time to overcome ecosystem inertia
- employ broad-based monitoring of ecosystem dynamics and processes over time
To this end, Autio and Levie (2017) and Autio et al. (2018a), based on ecosystem facili-
tation experiments conducted in Scotland, Estonia, and Thailand, proposed the following
heuristic for facilitating entrepreneurial ecosystems:
- create a core group of 6-8 central and committed ecosystem stakeholders, tasked
with coordinating the regional entrepreneurial ecosystem facilitation initiative
- create an early analysis of the regional entrepreneurial ecosystem, using a meas-
urement template such as the Entrepreneurial Ecosystem Maturity Model (Autio &
Cao, 2019)
- organise three workshops, with appropriate intervals, with participation by some
20 ecosystem participants representing different perspectives to the ecosystem –
the first focusing on understanding the ecosystem workings and bottlenecks, the
second on bottleneck drivers and possible solutions, and the third on actions re-
quired to improve the ecosystem functioning
- organise a post-workshop implementation agenda and a monitoring system to
monitor progress
100
7.2 Recommended Use of EIDES Data in Entrepreneurial Ecosys-
tem Policy Design
As noted, the EIDES index covers both national-level, general framework conditions and
national-level data concerning the more regional dimension of entrepreneurial ecosys-
tems, as captured in systemic framework conditions. The country pages of this report
provide an overview of each country’s EIDES data, including the policy optimisation
simulation. This data and the simulation provide a good starting point for entrepreneurial
ecosystem policy design in different countries.
Several general observations can be made from the country-level EIDES data:
- First, in most countries, the general and systemic framework conditions tend to
perform at a similar level. There do not appear to be systematic patterns in terms
of the relative performance of each group of framework conditions.
- Nevertheless, this general pattern means that countries with a lower overall per-
formance may need to invest relatively greater effort to improving general frame-
work conditions, as these regulate all types of business and can also significantly
hamper regional dynamics (e.g., market conditions and formal institutional condi-
tions).
- The bulk of policy attention should be focused at those pillars that are flagged as
the more significant bottlenecks in the policy simulation. In some countries, spe-
cific pillars are flagged as particularly important bottlenecks, whereas in others,
policy attention should focus on two or more pillars. The general objective should
be to achieve a good balance across the index pillars.
- Attention should be paid to both digitalised pillar scores and non-digitalised pillar
scores. This also implies the need for coordination between digitalisation policy
and entrepreneurial ecosystem policy.
- The EIDES data should be treated as a starting point that feeds into the ecosys-
tem facilitation heuristic as described above and not as the final prescription. The
emphasis in regional-level ecosystem facilitation should be in facilitating sense-
making regarding the functioning of regional entrepreneurial ecosystems, and
more detailed analyses should be carried out during the regional facilitation pro-
jects using region-specific data, as collected, for example, using the Entrepreneur-
ial Ecosystem Maturity Model (Autio & Cao, 2019).
7.3 Entrepreneurial Ecosystems and Digitalisation: General Policy
Recommendations
Entrepreneurial ecosystem policy needs to take a comprehensive look at both stand-up,
start-up and scale-up systems and consider ecosystem dynamics as a whole.
As policy attention shifts towards scale-up dynamics, the less effective firm-specific poli-
cy actions are likely to be, and the greater will be the need to consider system-level dy-
namics and systemic framework conditions.
Ecosystem-specific policy initiatives should be designed and implemented in coordination
with support initiatives in the ‘market’ and ‘system failure’ modes. The latter may not be
effective in addressing ecosystem failures, especially if implemented in isolation.
In order to be successful, entrepreneurial ecosystem policies need to actively engage
ecosystem stakeholders. A top-down approach is not likely to work in an ecosystem
where most stakeholders are hierarchically independent.
To be effective, entrepreneurial ecosystem policies need to: (a) facilitate identification by
the ecosystem participants with the broader ecosystem; (b) strengthen commitment
among ecosystem stakeholders to coordinate their actions – and actively identify and
address dynamic ecosystem failures.
101
Entrepreneurial ecosystem policies require a long-term approach, as ‘quick fixes’ are like-
ly to be rare. Therefore, successful ecosystem interventions need to be coordinated and
facilitated by a credible, committed backbone organisation in order to ensure that suffi-
cient momentum is maintained to overcome ecosystem inertia.
An ecosystems approach to entrepreneurship policy is likely to present considerable chal-
lenges to policy-making and implementing agencies, as these tend to be moulded in the
traditional, ‘top-down’ mode of policy-making. A key to overcoming this challenge is op-
erating in partnership with and through regional backbone organisations who command
sufficient authority and commitment to take on long-term ecosystem facilitation pro-
cesses.
In order to successfully implement an EU-wide entrepreneurial ecosystem policy, that
policy needs to: (a) combine region-specific and national approaches; (b) recognise that
ecosystem structures and processes will be different at different levels of policy deploy-
ment (e.g., regional, national, EU-wide); (c) foster learning and experience exchange
across regions; (d) assume an ecosystem-wide approach to understanding how those
ecosystem work (see also Autio (2016)).
Given that the entrepreneurial ecosystem phenomenon is ultimately driven by digitalisa-
tion, close coordination is needed between entrepreneurial ecosystem and digitalisation
policies.
102
References
Acs, Z. J., Autio, E., & Szerb, L. 2014b. National Systems of Entrepreneurship:
Measurement Issues and Policy Implications. Research Policy, 43(1): 476-494.
Acs, Z., Szerb, L., & Autio, E. 2014a. Global Entrepreneurship and Development
Index 2014. Amazon: Amazon Books.
Acs, Z., Szerb, L., Autio, E., & Ainsley, L. 2017. Global Entrepreneurship Index 2017.
London and New York: Global Entrepreneurship and Development Institute.
Ahmad, N., & Hoffmann, A. 2008. A Framework for Addressing and Measuring
Entrepreneurship. SSRN eLibrary.
Arrow, K. J. 1962. Economic welfare and the allocation of resources for invention. In R.
Nelson (Ed.), The Rate and Direction of Inventive Activity: 609-625. New
Jersey: Princeton University Press.
Autio, E. 2016. Entrepreneurship Support in Europe: Trends and Challenges for EU Policy.
In EU DG GROWTH (Ed.), Policy Reports. Brussels: European Commission.
Autio, E., & Acs, Z. 2010. Intellectual property protection and the formation of
entrepreneurial growth aspirations. Strategic Entrepreneurship Journal, 4(3):
234-251.
Autio, E., & Cao, S. 2019. Fostering Digital Start-ups: Structural Model of
Entrepreneurial Ecosystems. Paper presented at the 52nd Hawaii International
Conference on Systems Sciences, Maui, Hawaii.
Autio, E., & Fu, K. 2015. Economic and political institutions and entry into formal and
informal entrepreneurship. Asia Pacific Journal of Management, 32(1): 67-94.
Autio, E., & Levie, J. 2017a. Entrepreneurial ecosystems: Concepts and policy challenges.
In Imperial College Business School Working papers: 53. London.
Autio, E., & Levie, J. 2017b. Management of entrepreneurial ecosystems. In G.
Ahmetoglu, T. Chamorro-Premuzic, B. Klinger, & T. Karcisky (Eds.), The Wiley
Handbook of Entrepreneurship: 423-450. Chichester: John Wiley & Sons.
Autio, E., & Rannikko, H. 2016. Retaining winners: Can policy boost high-growth
entrepreneurship? Research Policy, 45(1): 42-55.
Autio, E., & Rannikko, H. 2017. Entrepreneurial dynamic of the digital economy and
Finland's international competitiveness. In Prime Minister’s Office (Ed.),
Publications of the Government´s Analysis, Assessment and Research
Activities. Helsinki: Prime Minister's Office.
Autio, E., Cao, S., Chumjit, S., Kaensup, P., & Temsiripoj, W. 2019. Entrepreneurial
Ecosystem Advantage: Ecosystem Interactions and Business Model Innovation,
Academy of Management Conference. Boston, August 11.
Autio, E., Cao, S., Temsiripoj, W., Guntasopatr, P., Kaensup, P., & Chumjit, S. 2018a.
Enhancing Thailand's Ecosystems for Entrepreneurship. Bangkok: King
Mongkut University of Technology.
Autio, E., Nambisan, S., Thomas, L., & Wright, M. 2018. Digital affordances, spatial
affordances, and the genesis of entrepreneurial ecosystems. Strategic
Entrepreneurship Journal, in print.
Autio, E., Pathak, S., & Wennberg, K. 2013. Consequences of cultural practices for
entrepreneurial behaviors. Journal of International Business Studies, 44(4):
334-362.
Autio, E., Szerb, L., Komlósi, É., & Tiszberger, M. 2018c. The European Index of Digital
Entrepreneurship Systems. In Publications Office of the European Union (Ed.),
JRC Technical Reports: 153. Luxembourg: European Commission,.
Birch, D., Haggerty, A., & Parsons, W. 1997. Who's Creating Jobs? Cambridge, MA:
Cognetics.
Bogdanowicz, M. 2015. Digital entrepreneurship barriers and drivers: The need for a
specific measurement framework. In J. S. Hub (Ed.), JRC Technical Reports:
132. European Union: Institute for Prospective Technological Studies.
Carlsson, B. 2004. The Digital Economy: what is new and what is not? Structural
change and economic dynamics, 15(3): 245-264.
103
Davidsson, P., & Honig, B. 2003. The Role of Social and Human Capital Among Nascent
Entrepreneurs. Journal of Business Venturing, 18: 301-331.
Djankov, S., La Porta, R., Lopez-de-Silanes, F., & Shleifer, A. 2002. The Regulation of
Entry. Quarterly Journal of Economics, 117(1): 453-517.
Edquist, C., & Johnson, B. 1997. Institutions and organizations in systems of innovation.
In C. Edquist (Ed.), Systems of Innovation – Technologies, Institutions and
Organizations: 41-63. London: Pinter.
Feld, B. 2012. Startup communities: Building an entrepreneurial ecosystem in
your city. Hoboken, NJ: Wiley.
Gallup. 2009. Entrepreneurship in the EU and beyond. In EU DG Industry (Ed.), Flash
Eurobarometer series, Vol. 283. Brussels: European Commission.
Insights, C. 2017. The Global Unicorn Club, Vol. 2017.
ISSP. 1997. International Social Survey Programme -- Work Orientations Package II. In
L. Gemeinschaft (Ed.). Berlin: Leibniz Gemeinschaft.
Jallat, F., & Capek, M. J. 2001. Disintermediation in question: New economy, new
networks, new middlemen. Business Horizons(March-April): 55-60.
Majchrzak, A., & Markus, M. 2013. Technology affordances and constraints theory (of
MIS). In E. Kessler (Ed.), Encyclopedia of Management Theory: 832-836.
Thousand Oaks, CA: SAGE Publications.
Mason, C., & Brown, R. 2014. Entrepreneurial ecosystems and growth oriented
entrepreneurship: 38. Paris: OECD LEED Programme.
Nordic_Council. 2010. Nordic Entrepreneurship Monitor 2010. In Nordic Council of
Ministers (Ed.): 132. Copenhagen: Nordic Council.
OECD. 2010. Innovative SMEs and entrepreneurship for job creation and growth. In
OECD Centre for Entrepreneurship (Ed.), Issues Papers. Paris.
Reynolds, P. D., Bosma, N., & Autio, E. 2005. Global Entrepreneurship Monitor: Data
Collection Design and Implementation 1998–2003. Small Business Economics,
24(3): 205-231.
Spigel, B. 2017. The relational organization of entrepreneurial ecosystems.
Entrepreneurship Theory and Practice, 41(1): 49-72.
Stam, E. 2014. The Dutch Entrepreneurial Ecosystem: 41. SSRN.
Stam, E. 2018. Measuring entrepreneurial ecosystems. In A. O'Connor, E. Stam, F.
Sussan, & D. Audretsch (Eds.), Entrepreneurial ecosystems: Place-based
transformations and transitions: forthcoming. New York: Springer.
Stangler, D., & Bell-Masterson, J. 2015. Measuring an entrepreneurial ecosystem,
Kauffman Foundation Research Series on City, Metro, and Regional
Entrepreneurship: 16. Kansas City: Ewing Marion Kauffman Foundation.
Szerb, L., Acs, Z., Autio, E., Ortega-Argiles, R., & Komlosi, E. 2013. REDI: The
Regional Entrepreneurship and Development Index -- Measuring Regional
Entrepreneurship Final Report. Brussels: EU Commission Directorate-General
for Regional and Urban Policy.
Thomas, L., & Autio, E. 2019. Innovation Ecosystems. In R. Aldag (Ed.), Oxford
Research Encyclopaedia of Business and Management: in print. Oxford:
Oxford University Press.
Tilson, D., Lyytinen, K., & Sørensen, C. 2010. Research commentary-digital
infrastructures: the missing IS research agenda. Information Systems
Research, 21(4): 748-759.
Van Roy, V., & Nepelski, D. 2016. Assessment of Framework Conditions for the Creation
and Growth of Firms in Europe. In EU Joint Research Centre (Ed.), JRC Scientific
and Policy Reports: 105. Luxembourg: EU Joint Research Centre.
World Bank. 2011. New business registration database. In World Bank (Ed.), Vol. 2011.
Washington, D.C.: World Bank.
Yoo, Y., Henfridsson, O., & Lyytinen, K. 2010. Research commentary-The new organizing
logic of digital innovation: An agenda for information systems research.
Information Systems Research, 21(4): 724-735.
104
List of Figures
Figure 1. Structure of the EIDES Index ..............................................................16
Figure 2. Country Groupings for EIDES 2019 ............................................................31
Figure 3. EIDES Profiles of the Four Country Groups .................................................32
Figure 4. Correlation between EIDES Scores and GDP Per Capita (Luxembourg not
included in the correlation but shown in the graph) ...................................................35
Figure 5. Austria’s position in the eight EIDES pillars.................................................41
Figure 6. Belgium’s position in the eight EIDES pillars ...............................................43
Figure 7. Bulgaria’s position in the eight EIDES pillars ...............................................45
Figure 8. Croatia’s position in the eight EIDES pillars ................................................47
Figure 9. Cyprus’s position in the eight EIDES pillars .................................................49
Figure 10. Czech Republic’s position in the eight EIDES pillars ....................................51
Figure 11. Denmark’s position in the eight EIDES pillars ............................................53
Figure 12. Estonia’s position in the eight EIDES pillars ..............................................55
Figure 13. Finland’s position in the eight EIDES pillars...............................................57
Figure 14. France’s position in the eight EIDES pillars ...............................................59
Figure 15. Germany’s position in the eight EIDES pillars ............................................61
Figure 16. Greece’s position in the eight EIDES pillars ...............................................63
Figure 17. Hungary’s position in the eight EIDES pillars .............................................65
Figure 18. Ireland’s position in the eight EIDES pillars ...............................................67
Figure 19. Italy’s position in the eight EIDES pillars ..................................................69
Figure 20. Latvia’s position in the eight EIDES pillars ................................................71
Figure 21. Lithuania’s position in the eight EIDES pillars ............................................73
Figure 22. Luxembourg’s position in the eight EIDES pillars .......................................75
Figure 23. Malta’s position in the eight EIDES pillars .................................................77
Figure 24. Netherlands’s position in the eight EIDES pillars ........................................79
Figure 25. Poland’s position in the eight EIDES pillars ...............................................81
Figure 26. Portugal’s position in the eight EIDES pillars .............................................83
Figure 27. Romania’s position in the eight EIDES pillars ............................................85
Figure 28. Slovakia’s position in the eight EIDES pillars .............................................87
Figure 29. Slovenia’s position in the eight EIDES pillars .............................................89
Figure 30. Spain’s position in the eight EIDES pillars .................................................91
Figure 31. Sweden’s position in the eight EIDES pillars ..............................................93
Figure 32. United Kingdom’s position in the eight EIDES pillars ..................................95
105
List of Tables
Table 1. Entrepreneurship measurement approaches: Summary ................................10
Table 2. Structure of the European Index of Digital Entrepreneurship Systems .............19
Table 3. EIDES Digital Scores for EU28 countries ......................................................30
Table 4. Pillar values of the EIDES ..........................................................................33
Table 5. Correlations between EIDES and ESIS ........................................................36
Table 6. Bivariate Correlations between EIDES and Entrepreneurial Outcome Measures .37
Table 7. Bivariate Correlations between EIDES and Framework Indices .......................38
Table 8. Austria’s EIDES component values .............................................................42
Table 9. Austria’s policy optimisation simulation: The allocation of additional resources
amongst the pillars to reach a 10% increase in EIDES score ......................................42
Table 10. Belgium’s EIDES component values ..........................................................44
Table 11. Belgium’s policy optimisation simulation: The allocation of additional resources
amongst the pillars to reach a 10% increase in EIDES score ......................................44
Table 12. Bulgaria’s EIDES component values ..........................................................46
Table 13. Bulgaria’s policy optimisation simulation: The allocation of additional resources
amongst the pillars to reach a 10% increase in EIDES score ......................................46
Table 14. Croatia’s EIDES component values ...........................................................48
Table 15. Croatia’s policy optimisation simulation: The allocation of additional resources
amongst the pillars to reach a 10% increase in EIDES score ......................................48
Table 16. Cyprus’s EIDES component values ............................................................50
Table 17. Cyprus’s policy optimisation simulation: The allocation of additional resources
amongst the pillars to reach a 10% increase in EIDES score ......................................50
Table 18. Czech Republic’s EIDES component values ................................................52
Table 19. Czech Republic’s policy optimisation simulation: The allocation of additional
resources amongst the pillars to reach a 10% increase in EIDES score ........................52
Table 20. Denmark’s EIDES component values .........................................................54
Table 21. Denmark’s policy optimisation simulation: The allocation of additional resources
amongst the pillars to reach a 10% increase in EIDES score ......................................54
Table 22. Estonia’s EIDES component values ...........................................................56
Table 23. Estonia’s policy optimisation simulation: The allocation of additional resources
amongst the pillars to reach a 10% increase in EIDES score ......................................56
Table 24. Finland’s EIDES component values ...........................................................58
Table 25. Finland’s policy optimisation simulation: The allocation of additional resources
amongst the pillars to reach a 10% increase in EIDES score ......................................58
Table 26. France’s EIDES component values ............................................................60
Table 27. France’s policy optimisation simulation: The allocation of additional resources
amongst the pillars to reach a 10% increase in EIDES score ......................................60
Table 28. Germany’s EIDES component values .........................................................62
Table 29. Germany’s policy optimisation simulation: The allocation of additional resources
amongst the pillars to reach a 10% increase in EIDES score ......................................62
Table 30. Greece’s EIDES component values ............................................................64
106
Table 31. Greece’s policy optimisation simulation: The allocation of additional resources
amongst the pillars to reach a 10% increase in EIDES score ......................................64
Table 32. Hungary’s EIDES component values ..........................................................66
Table 33. Hungary’s policy optimisation simulation: The allocation of additional resources
amongst the pillars to reach a 10% increase in EIDES score ......................................66
Table 34. Ireland’s EIDES component values ............................................................68
Table 35. Ireland’s policy optimisation simulation: The allocation of additional resources
amongst the pillars to reach a 10% increase in EIDES score ......................................68
Table 36. Italy’s EIDES component values ...............................................................70
Table 37. Italy’s policy optimisation simulation: The allocation of additional resources
amongst the pillars to reach a 10% increase in EIDES score ......................................70
Table 38. Latvia’s EIDES component values .............................................................72
Table 39. Latvia’s policy optimisation simulation: The allocation of additional resources
amongst the pillars to reach a 10% increase in EIDES score ......................................72
Table 40. Lithuania’s EIDES component values .........................................................74
Table 41. Lithuania’s policy optimisation simulation: The allocation of additional resources
amongst the pillars to reach a 10% increase in EIDES score ......................................74
Table 42. Luxembourg’s EIDES component values ....................................................76
Table 43. Luxembourg’s policy optimisation simulation: The allocation of additional
resources amongst the pillars to reach a 10% increase in EIDES score ........................76
Table 44. Malta’s EIDES component values ..............................................................78
Table 45. Malta’s policy optimisation simulation: The allocation of additional resources
amongst the pillars to reach a 10% increase in EIDES score ......................................78
Table 46. Netherlands’s EIDES component values .....................................................80
Table 47. Netherlands’s policy optimisation simulation: The allocation of additional
resources amongst the pillars to reach a 10% increase in EIDES score ........................80
Table 48. Poland’s EIDES component values ............................................................82
Table 49. Poland’s policy optimisation simulation: The allocation of additional resources
amongst the pillars to reach a 10% increase in EIDES score ......................................82
Table 50. Portugal’s EIDES component values ..........................................................84
Table 51. Portugal’s policy optimisation simulation: The allocation of additional resources
amongst the pillars to reach a 10% increase in EIDES score ......................................84
Table 52. Romania’s EIDES component values .........................................................86
Table 53. Romania’s policy optimisation simulation: The allocation of additional resources
amongst the pillars to reach a 10% increase in EIDES score ......................................86
Table 54. Slovakia’s EIDES component values ..........................................................88
Table 55. Slovakia’s policy optimisation simulation: The allocation of additional resources
amongst the pillars to reach a 10% increase in EIDES score ......................................88
Table 56. Slovenia’s EIDES component values ..........................................................90
Table 57. Slovenia’s policy optimisation simulation: The allocation of additional resources
amongst the pillars to reach a 10% increase in EIDES score ......................................90
Table 58. Spain’s EIDES component values ..............................................................92
107
Table 59. Spain’s policy optimisation simulation: The allocation of additional resources
amongst the pillars to reach a 10% increase in EIDES score ......................................92
Table 60. Sweden’s EIDES component values...........................................................94
Table 61. Sweden’s policy optimisation simulation: The allocation of additional resources
amongst the pillars to reach a 10% increase in EIDES score ......................................94
Table 62. United Kingdom’s EIDES component values ...............................................96
Table 63. United Kingdom’s policy optimisation simulation: The allocation of additional
resources amongst the pillars to reach a 10% increase in EIDES score ........................96

108
Annexes
Annex 1. Calculation of the EIDES Scores
In constructing the index we followed eleven steps:
1. Normalisation of indicators: Altogether we have selected 116 indicators. Out of
these there are 23 general framework entrepreneurship, 39 systemic framework
entrepreneurship, 26 general framework digital and 27 systemic framework digital
indicators. First, we normalised all the indicators using the distance methodology:
𝑥𝑖,𝑘 =𝑧𝑖,𝑗
max 𝑧𝑖,𝑗 (1)
for all i= 1….28, the number of countries
j= 1 ... 121, the number of indicators where 𝑥𝑖,𝑗 is the normalised indicator score value for country i and indicator
j 𝑧𝑖,𝑗 is the original indicator value for country i and indicator j
2. The construction of the variables: We calculate all variables from the indica-
tors by calculating the simple arithmetic averages. Altogether we have 24 varia-
bles, 16 entrepreneurship and eight digital variables.
The four general framework entrepreneurship variables are calculated as follows:
GFC_P1𝑖 =∑ x6
1 i,j
6 (2a)
GFC_P2𝑖 =∑ x13
7 i,j
7 (2b)
GFC_P3𝑖 =∑ x20
14 i,j
7 (2c)
GFC_P1𝑖 =∑ x23
21 i,j
3 (2d)
for all countries i
GFC_P1=Culture and Informal Institution entrepreneurship
GFC_P2= Formal Institutions and Regulatory Framework entrepreneurship
GFC_P3=Market Conditions entrepreneurship
GFC_P4= Physical Infrastructure entrepreneurship
The systemic entrepreneurship variables are calculated independently for the three stag-
es.
S1_SEC_P1𝑖 =∑ x25
24 i,j
2 (2e)
S2_SEC_P1𝑖 =∑ x29
26 i,j
4 (2f)
S3_SEC_P1𝑖 =∑ x33
30 i,j
4 (2g)
S1_SEC_P1= Human Capital entrepreneurship Stand-up
S2_SEC_P1= Human Capital entrepreneurship Start-up
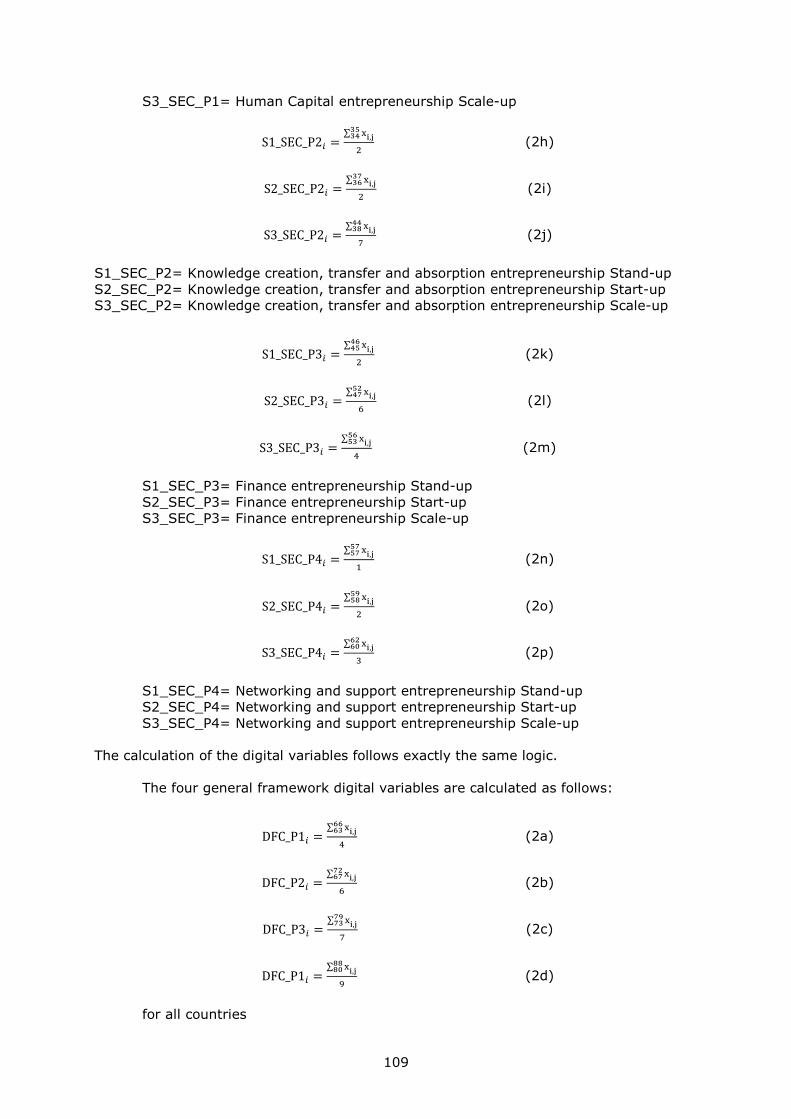
109
S3_SEC_P1= Human Capital entrepreneurship Scale-up
S1_SEC_P2𝑖 =∑ x35
34 i,j
2 (2h)
S2_SEC_P2𝑖 =∑ x37
36 i,j
2 (2i)
S3_SEC_P2𝑖 =∑ x44
38 i,j
7 (2j)
S1_SEC_P2= Knowledge creation, transfer and absorption entrepreneurship Stand-up
S2_SEC_P2= Knowledge creation, transfer and absorption entrepreneurship Start-up
S3_SEC_P2= Knowledge creation, transfer and absorption entrepreneurship Scale-up
S1_SEC_P3𝑖 =∑ x46
45 i,j
2 (2k)
S2_SEC_P3𝑖 =∑ x52
47 i,j
6 (2l)
S3_SEC_P3𝑖 =∑ x56
53 i,j
4 (2m)
S1_SEC_P3= Finance entrepreneurship Stand-up
S2_SEC_P3= Finance entrepreneurship Start-up
S3_SEC_P3= Finance entrepreneurship Scale-up
S1_SEC_P4𝑖 =∑ x57
57 i,j
1 (2n)
S2_SEC_P4𝑖 =∑ x59
58 i,j
2 (2o)
S3_SEC_P4𝑖 =∑ x62
60 i,j
3 (2p)
S1_SEC_P4= Networking and support entrepreneurship Stand-up
S2_SEC_P4= Networking and support entrepreneurship Start-up
S3_SEC_P4= Networking and support entrepreneurship Scale-up
The calculation of the digital variables follows exactly the same logic.
The four general framework digital variables are calculated as follows:
DFC_P1𝑖 =∑ x66
63 i,j
4 (2a)
DFC_P2𝑖 =∑ x72
67 i,j
6 (2b)
DFC_P3𝑖 =∑ x79
73 i,j
7 (2c)
DFC_P1𝑖 =∑ x88
80 i,j
9 (2d)
for all countries
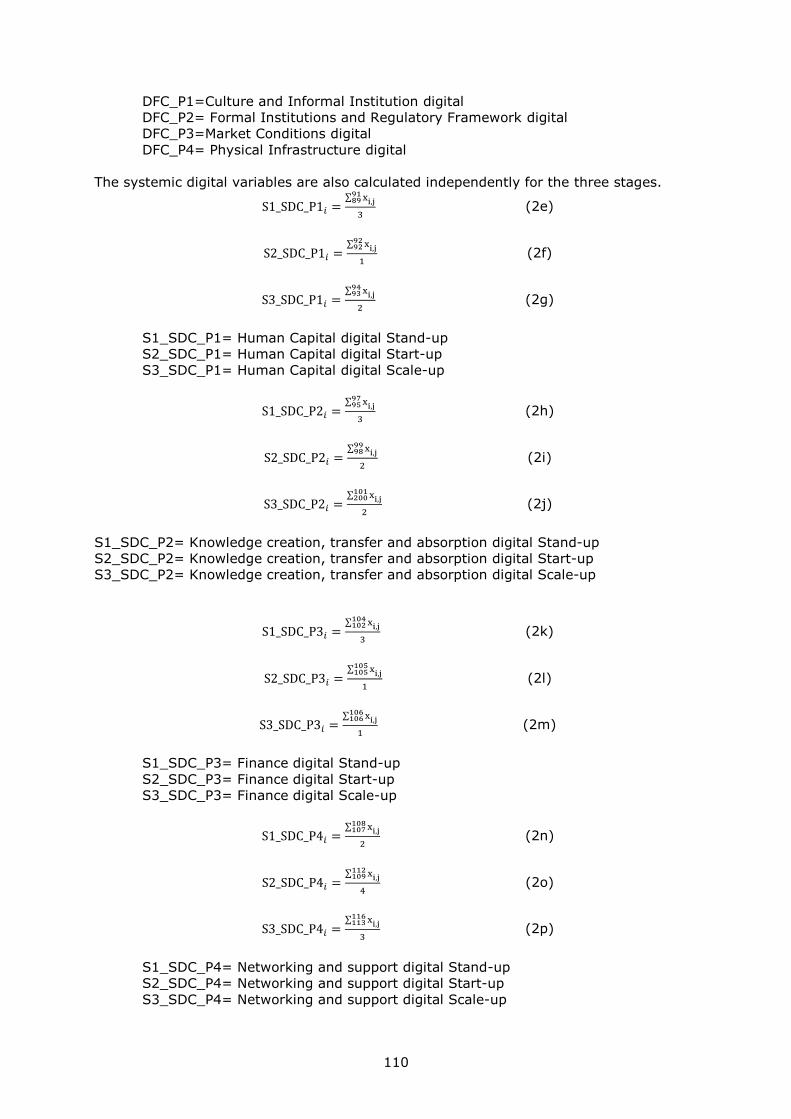
110
DFC_P1=Culture and Informal Institution digital
DFC_P2= Formal Institutions and Regulatory Framework digital
DFC_P3=Market Conditions digital
DFC_P4= Physical Infrastructure digital
The systemic digital variables are also calculated independently for the three stages.
S1_SDC_P1𝑖 =∑ x91
89 i,j
3 (2e)
S2_SDC_P1𝑖 =∑ x92
92 i,j
1 (2f)
S3_SDC_P1𝑖 =∑ x94
93 i,j
2 (2g)
S1_SDC_P1= Human Capital digital Stand-up
S2_SDC_P1= Human Capital digital Start-up
S3_SDC_P1= Human Capital digital Scale-up
S1_SDC_P2𝑖 =∑ x97
95 i,j
3 (2h)
S2_SDC_P2𝑖 =∑ x99
98 i,j
2 (2i)
S3_SDC_P2𝑖 =∑ x101
200 i,j
2 (2j)
S1_SDC_P2= Knowledge creation, transfer and absorption digital Stand-up
S2_SDC_P2= Knowledge creation, transfer and absorption digital Start-up
S3_SDC_P2= Knowledge creation, transfer and absorption digital Scale-up
S1_SDC_P3𝑖 =∑ x104
102 i,j
3 (2k)
S2_SDC_P3𝑖 =∑ x105
105 i,j
1 (2l)
S3_SDC_P3𝑖 =∑ x106
106 i,j
1 (2m)
S1_SDC_P3= Finance digital Stand-up
S2_SDC_P3= Finance digital Start-up
S3_SDC_P3= Finance digital Scale-up
S1_SDC_P4𝑖 =∑ x108
107 i,j
2 (2n)
S2_SDC_P4𝑖 =∑ x112
109 i,j
4 (2o)
S3_SDC_P4𝑖 =∑ x116
113 i,j
3 (2p)
S1_SDC_P4= Networking and support digital Stand-up
S2_SDC_P4= Networking and support digital Start-up
S3_SDC_P4= Networking and support digital Scale-up
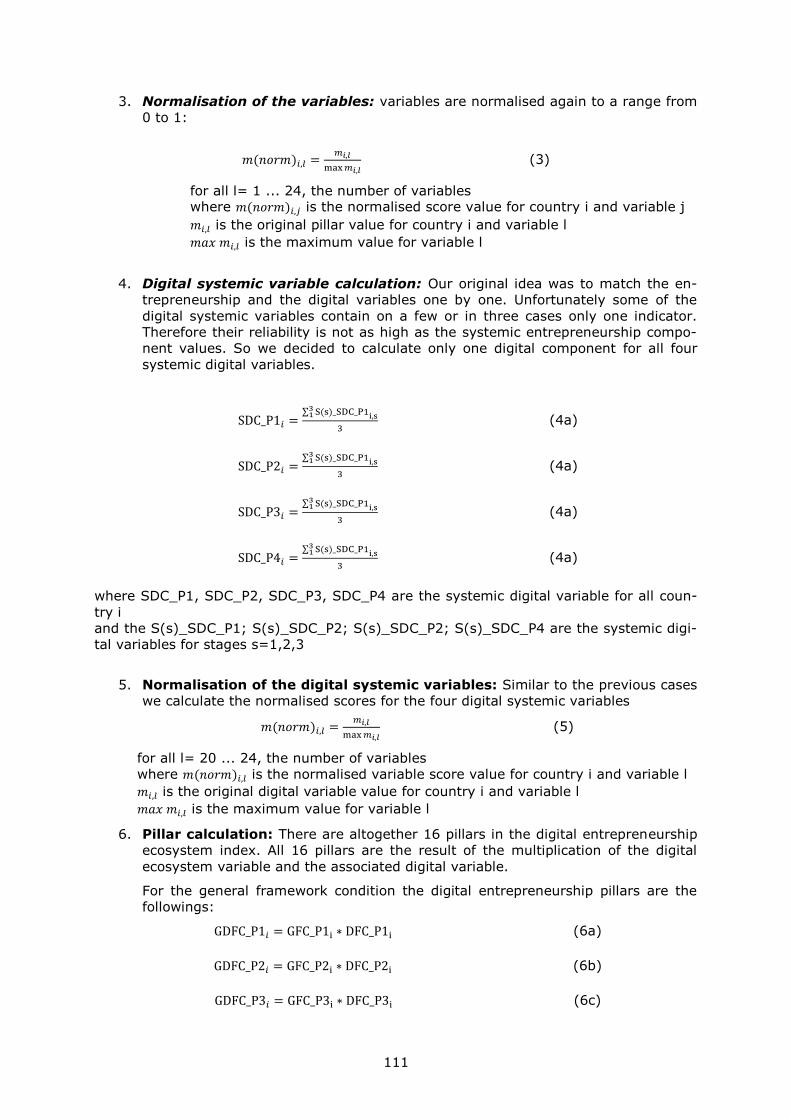
111
3. Normalisation of the variables: variables are normalised again to a range from
0 to 1:
𝑚(𝑛𝑜𝑟𝑚)𝑖,𝑙 =𝑚𝑖,𝑙
max 𝑚𝑖,𝑙 (3)
for all l= 1 ... 24, the number of variables where 𝑚(𝑛𝑜𝑟𝑚)𝑖,𝑗 is the normalised score value for country i and variable j
𝑚𝑖,𝑙 is the original pillar value for country i and variable l
𝑚𝑎𝑥 𝑚𝑖,𝑙 is the maximum value for variable l
4. Digital systemic variable calculation: Our original idea was to match the en-
trepreneurship and the digital variables one by one. Unfortunately some of the
digital systemic variables contain on a few or in three cases only one indicator.
Therefore their reliability is not as high as the systemic entrepreneurship compo-
nent values. So we decided to calculate only one digital component for all four
systemic digital variables.
SDC_P1𝑖 =∑ S(s)_SDC_P13
1 i,s
3 (4a)
SDC_P2𝑖 =∑ S(s)_SDC_P13
1 i,s
3 (4a)
SDC_P3𝑖 =∑ S(s)_SDC_P13
1 i,s
3 (4a)
SDC_P4𝑖 =∑ S(s)_SDC_P13
1 i,s
3 (4a)
where SDC_P1, SDC_P2, SDC_P3, SDC_P4 are the systemic digital variable for all coun-
try i
and the S(s)_SDC_P1; S(s)_SDC_P2; S(s)_SDC_P2; S(s)_SDC_P4 are the systemic digi-
tal variables for stages s=1,2,3
5. Normalisation of the digital systemic variables: Similar to the previous cases
we calculate the normalised scores for the four digital systemic variables
𝑚(𝑛𝑜𝑟𝑚)𝑖,𝑙 =𝑚𝑖,𝑙
max 𝑚𝑖,𝑙 (5)
for all l= 20 ... 24, the number of variables
where 𝑚(𝑛𝑜𝑟𝑚)𝑖,𝑙 is the normalised variable score value for country i and variable l
𝑚𝑖,𝑙 is the original digital variable value for country i and variable l
𝑚𝑎𝑥 𝑚𝑖,𝑙 is the maximum value for variable l
6. Pillar calculation: There are altogether 16 pillars in the digital entrepreneurship
ecosystem index. All 16 pillars are the result of the multiplication of the digital
ecosystem variable and the associated digital variable.
For the general framework condition the digital entrepreneurship pillars are the
followings:
GDFC_P1𝑖 = GFC_P1i ∗ DFC_P1i (6a)
GDFC_P2𝑖 = GFC_P2i ∗ DFC_P2i (6b)
GDFC_P3𝑖 = GFC_P3i ∗ DFC_P3i (6c)
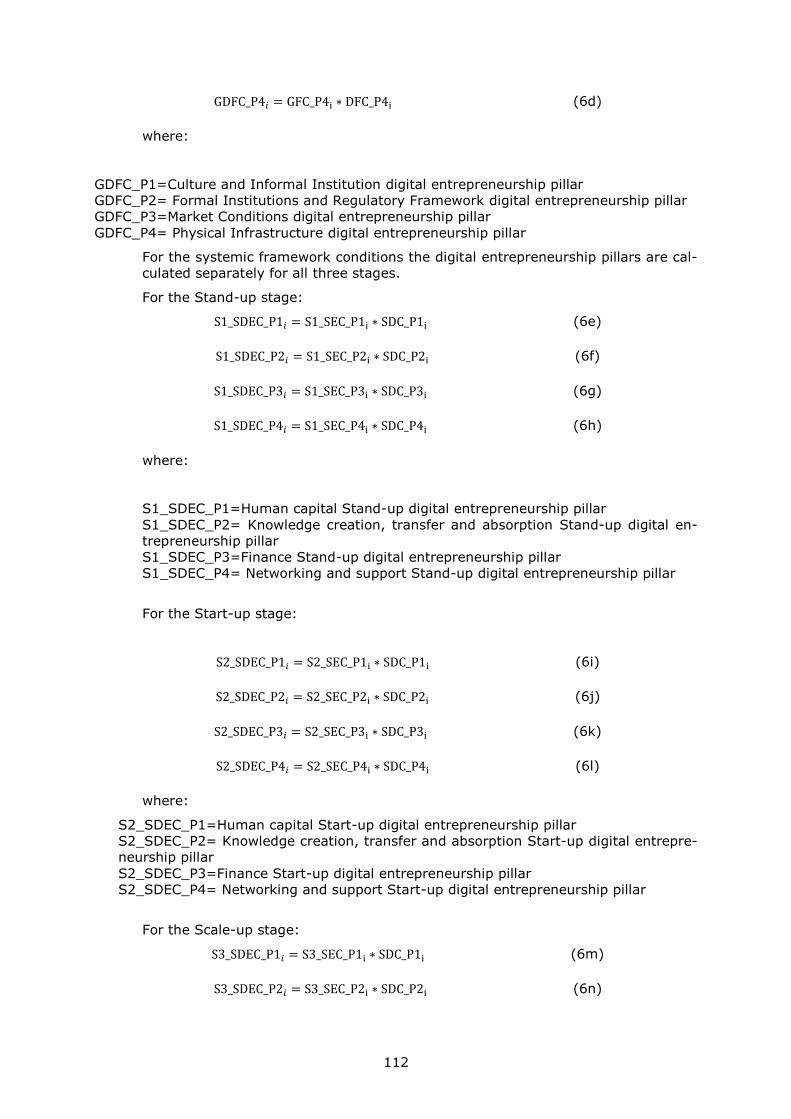
112
GDFC_P4𝑖 = GFC_P4i ∗ DFC_P4i (6d)
where:
GDFC_P1=Culture and Informal Institution digital entrepreneurship pillar
GDFC_P2= Formal Institutions and Regulatory Framework digital entrepreneurship pillar
GDFC_P3=Market Conditions digital entrepreneurship pillar
GDFC_P4= Physical Infrastructure digital entrepreneurship pillar
For the systemic framework conditions the digital entrepreneurship pillars are cal-
culated separately for all three stages.
For the Stand-up stage:
S1_SDEC_P1𝑖 = S1_SEC_P1i ∗ SDC_P1i (6e)
S1_SDEC_P2𝑖 = S1_SEC_P2i ∗ SDC_P2i (6f)
S1_SDEC_P3𝑖 = S1_SEC_P3i ∗ SDC_P3i (6g)
S1_SDEC_P4𝑖 = S1_SEC_P4i ∗ SDC_P4i (6h)
where:
S1_SDEC_P1=Human capital Stand-up digital entrepreneurship pillar
S1_SDEC_P2= Knowledge creation, transfer and absorption Stand-up digital en-
trepreneurship pillar
S1_SDEC_P3=Finance Stand-up digital entrepreneurship pillar
S1_SDEC_P4= Networking and support Stand-up digital entrepreneurship pillar
For the Start-up stage:
S2_SDEC_P1𝑖 = S2_SEC_P1i ∗ SDC_P1i (6i)
S2_SDEC_P2𝑖 = S2_SEC_P2i ∗ SDC_P2i (6j)
S2_SDEC_P3𝑖 = S2_SEC_P3i ∗ SDC_P3i (6k)
S2_SDEC_P4𝑖 = S2_SEC_P4i ∗ SDC_P4i (6l)
where:
S2_SDEC_P1=Human capital Start-up digital entrepreneurship pillar
S2_SDEC_P2= Knowledge creation, transfer and absorption Start-up digital entrepre-
neurship pillar
S2_SDEC_P3=Finance Start-up digital entrepreneurship pillar
S2_SDEC_P4= Networking and support Start-up digital entrepreneurship pillar
For the Scale-up stage:
S3_SDEC_P1𝑖 = S3_SEC_P1i ∗ SDC_P1i (6m)
S3_SDEC_P2𝑖 = S3_SEC_P2i ∗ SDC_P2i (6n)
113
S3_SDEC_P3𝑖 = S3_SEC_P3i ∗ SDC_P3i (6o)
S3_SDEC_P4𝑖 = S3_SEC_P4i ∗ SDC_P4i (6p)
where:
S3_SDEC_P1=Human capital Scale-up digital entrepreneurship pillar
S3_SDEC_P2= Knowledge creation, transfer and absorption Scale-up digital en-
trepreneurship pillar
S3_SDEC_P3=Finance Scale-up digital entrepreneurship pillar
S3_SDEC_P4= Networking and support Scale-up digital entrepreneurship pillar
7. Normalisation of the pillars: Similar to the previous cases we calculate the
normalised scores for all the 16 pillars
𝑝(𝑛𝑜𝑟𝑚)𝑖,𝑘 =𝑝𝑖,𝑘
max 𝑝𝑖,𝑘 (7)
for all k= 1 ... 16, the number of pillars
where 𝑝(𝑛𝑜𝑟𝑚)𝑖,𝑘 is the normalised score value for country i and pillar k
𝑝𝑖,𝑘 is the original digital pillar value for country i and pillar k
𝑚𝑎𝑥 𝑝𝑖,𝑘 is the maximum value for pillar k
8. Average pillar adjustment: The different averages of the normalised values of
the pillars imply that reaching the same indicator values requires different effort
and resources. Since we want to apply the EIDES for public policy purposes, the
additional resources for the same marginal improvement of the pillar values
should be the same for all pillars. Therefore, we need a transformation to equalize
the average values of the pillar components. Equation 8 shows the calculation of
the average value of the k pillar:
𝑝(𝑛𝑜𝑟𝑚)̅̅ ̅̅ ̅̅ ̅̅ ̅̅ ̅̅k =
∑ p(norm)ni=1 i,k
n for all k (8a)
where p(norm)̅̅ ̅̅ ̅̅ ̅̅ ̅̅ ̅k is the average value of all k=16 normalised pillars
We want to transform the p(norm)i,k values such that the potential values to be in the
[0, 1] range.
yi,k = p(norm)i,kt (8b)
where t is the “strength of adjustment”, the t-th moment of p(norm)k is exactly the
needed average, y̅j
We have to find the root of the following equation for k:
∑ p(norm)i,kt − ny̅j = 0n
i=1 (8c)
It is easy to see based on previous conditions and derivatives that the function is de-
creasing and convex which means it can be quickly solved using the well-known New-
ton-Raphson method with an initial guess of 0. After obtaining k, the computations
are straightforward.
114
9. Penalising: After these transformations, the Penalty for Bottleneck (PFB) meth-
odology was used to create pillar-adjusted PFB values. We define our penalty
function following as:
ℎ(𝑖),𝑘 = 𝑚𝑖𝑛 𝑦(𝑖),𝑘 + (1 − 𝑒−(𝑦(𝑖)𝑘−𝑚𝑖𝑛 𝑦(𝑖),𝑘)) (9)
where ℎ𝑖,𝑘 is the modified, post-penalty value of pillar k in country i
𝑦𝑖,𝑗 is the normalised value of index component k in country i
𝑦𝑚𝑖𝑛 is the lowest value of 𝑦𝑖,𝑘 for country i.
i = 1, 2,……28 = the number of countries
k= 1, 2,.……16= the number of pillars
10. Sub-index calculation: The value of a sub-index for any country was then calcu-
lated as the arithmetic average of its PFB-adjusted pillars for that sub-index mul-
tiplied by 100 to get a 100 point scale. Note that the general framework condi-
tions pillars are the same for all stages
𝐷𝐸_𝑆𝑡𝑎𝑛𝑑_𝑢𝑝𝑖 =100
8(∑ GDFCP𝑖,𝑘
4
𝑘=1 + ∑ S1_SDEC_P𝑖,𝑘
8
𝑘=5) (10𝑎)
𝐷𝐸_𝑆𝑡𝑎𝑟𝑡_𝑢𝑝𝑖 =100
8(∑ GDFCP𝑖,𝑘
4
𝑘=1 + ∑ S2_SDEC_P𝑖,𝑘
8
𝑘=5) (10𝑏)
𝐷𝐸_𝑆𝑐𝑎𝑙𝑒_𝑢𝑝𝑖 =100
8(∑ GDFCP𝑖,𝑘
4
𝑘=1 + ∑ S3_SDEC_P𝑖,𝑘
8
𝑘=5) (10𝑐)
where
DE_Stand_up= Digital Entrepreneurship Stand-up sub-index
DE_Start_up= Digital Entrepreneurship Start-up sub-index
DE_Scale_up= Digital Entrepreneurship Scale-up sub-index
11. EIDES point calculation: Finally, the scores are calculated as simple arithmetic
averages of the three sub-indices.
𝐷𝐸𝐸𝐼𝑖 =1
3(𝐷𝐸_𝑆𝑡𝑎𝑛𝑑_𝑢𝑝𝑖 + 𝐷𝐸_𝑆𝑡𝑎𝑟𝑡_𝑢𝑝𝑖 + 𝐷𝐸_𝑆𝑐𝑎𝑙𝑒_𝑢𝑝𝑖) (11)
115
Annex 2 Robustness Analyses of the EIDES and Its Components
In composite indicator analysis, the setting up of the final index is based upon a series of
choices. The aim of the robustness (or uncertainty) analysis is to examine the extent to
which the final ranking depends on the set of choices made during the selection and
transformation of the variables (Van Roy-Nepelski 2016, Saisana et al. 2005).
The indicators which populate the pillars in the framework are generally chosen by inte-
grating experts’ judgment, data availability and checks on statistical consistency.
Robustness analysis in our case involves the followings:
— compensability effect analysis;
— the role of the pillars and the sub-indices in the development stages;
— drop out effect of the pillars.
1. Compensability effect analysis
In connection with the analysis of the effect of excluding one pillar at a time the next
question is the amount of compensability effects. Compensability is the “existence of
trade-off, i.e. the possibility of offsetting a disadvantage on some criteria by a sufficiently
large advantage on another criterion” (Munda, 2008 71. p.). The EIDES will be the base
for the comparison. More methods are applied. Ordered Weighted Averaging (OWA) ap-
proach is used for the pillars to present one aspect of compensability in case of EIDES.
(Yager, 1996) This technique looks for different scenarios of weights to put together
more variables into a single index. The variables are to be in descending order. From our
point of view there are three special cases defined for the OWA operators (set of weights,
where the sum of the weights is 1).
— Purely optimistic operator (o): the highest variable (in our case pillar) gets all of the
weight (1). So the sub-index gets the highest pillar value. This concept expresses an
“or” multiple criteria condition, where the satisfaction of at least one criterion is
enough to have a good position.
— Purely pessimistic operator (p): the lowest pillar gets the weight 1. So the overall
index will include only the value of the lowest pillar. It can be understood as an “and”
condition. No compensation is allowed, all criteria must be satisfied at the same time.
— From our point of view an operator, which calculates a simple arithmetic mean of the
pillars is interesting as well, to see, how far the penalty weighted results from the av-
erage situation are.
In each case, the final index value is calculated as a simple arithmetic mean from the
sub-indices. So OWA operators are applied for the pillars.
Going further the best/worst/average possible outcomes two other well-known weighting
schemes are also considered:
— Equal weights for the pillars (simple arithmetic mean) to get the sub-indices and ge-
ometric mean to receive the final index values (arithmetic+geometric).
— Geometric mean of the pillars to get the sub-indices and also geometric mean to re-
ceive the final index values (geometric+geometric).
Geometric mean, similarly to out penalised weighting scheme, supports the “and” condi-
tion as it gives the lower results if the distribution of the pillar values is uneven.
Monte Carlo experiments are often applied in case of robustness checks, where random
weights within a given range are simulated. In our case the penalised weighting accounts
for different weights by countries according to the consistency of the pillar values. There-
fore this type of simulation is not sufficient in our case. That is why we apply the above
mentioned “extreme” (optimistic, pessimistic) scenarios together with different combina-
tion of the geometric mean, as its concept is closer to the idea behind the EIDES
weighting.
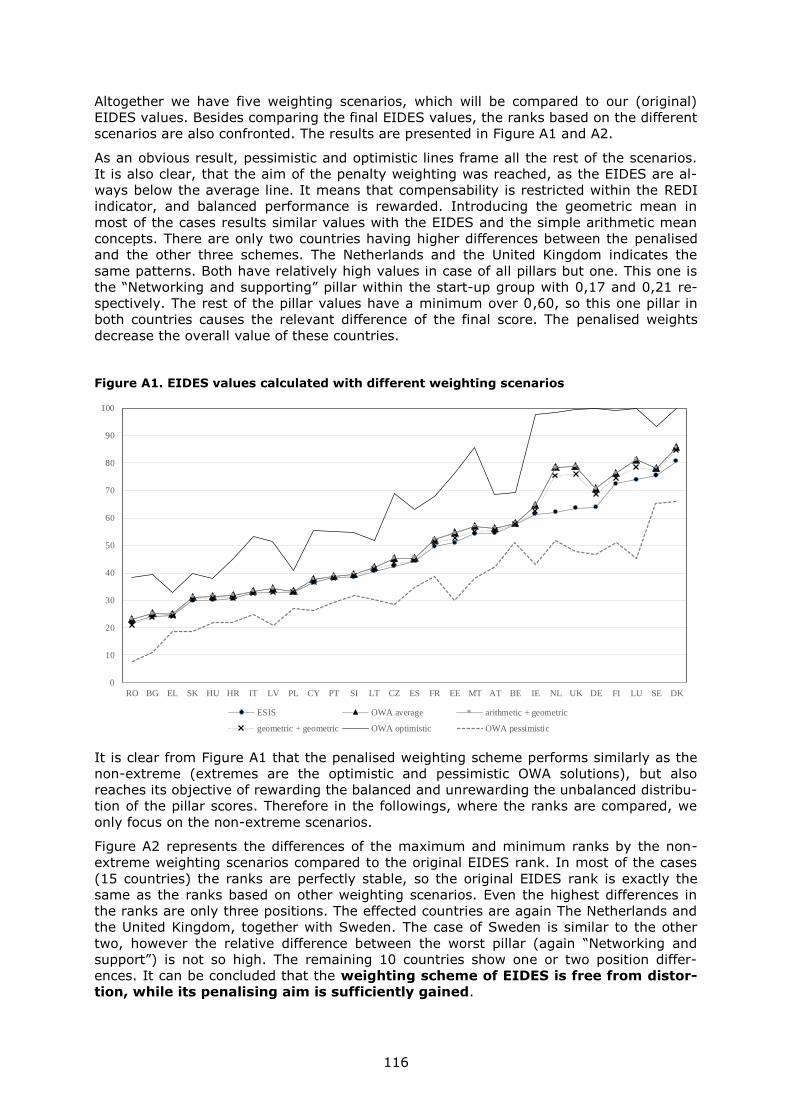
116
Altogether we have five weighting scenarios, which will be compared to our (original)
EIDES values. Besides comparing the final EIDES values, the ranks based on the different
scenarios are also confronted. The results are presented in Figure A1 and A2.
As an obvious result, pessimistic and optimistic lines frame all the rest of the scenarios.
It is also clear, that the aim of the penalty weighting was reached, as the EIDES are al-
ways below the average line. It means that compensability is restricted within the REDI
indicator, and balanced performance is rewarded. Introducing the geometric mean in
most of the cases results similar values with the EIDES and the simple arithmetic mean
concepts. There are only two countries having higher differences between the penalised
and the other three schemes. The Netherlands and the United Kingdom indicates the
same patterns. Both have relatively high values in case of all pillars but one. This one is
the “Networking and supporting” pillar within the start-up group with 0,17 and 0,21 re-
spectively. The rest of the pillar values have a minimum over 0,60, so this one pillar in
both countries causes the relevant difference of the final score. The penalised weights
decrease the overall value of these countries.
Figure A1. EIDES values calculated with different weighting scenarios
It is clear from Figure A1 that the penalised weighting scheme performs similarly as the
non-extreme (extremes are the optimistic and pessimistic OWA solutions), but also
reaches its objective of rewarding the balanced and unrewarding the unbalanced distribu-
tion of the pillar scores. Therefore in the followings, where the ranks are compared, we
only focus on the non-extreme scenarios.
Figure A2 represents the differences of the maximum and minimum ranks by the non-
extreme weighting scenarios compared to the original EIDES rank. In most of the cases
(15 countries) the ranks are perfectly stable, so the original EIDES rank is exactly the
same as the ranks based on other weighting scenarios. Even the highest differences in
the ranks are only three positions. The effected countries are again The Netherlands and
the United Kingdom, together with Sweden. The case of Sweden is similar to the other
two, however the relative difference between the worst pillar (again “Networking and
support”) is not so high. The remaining 10 countries show one or two position differ-
ences. It can be concluded that the weighting scheme of EIDES is free from distor-
tion, while its penalising aim is sufficiently gained.
0
10
20
30
40
50
60
70
80
90
100
RO BG EL SK HU HR IT LV PL CY PT SI LT CZ ES FR EE MT AT BE IE NL UK DE FI LU SE DK
ESIS OWA average arithmetic + geometric
geometric + geometric OWA optimistic OWA pessimistic
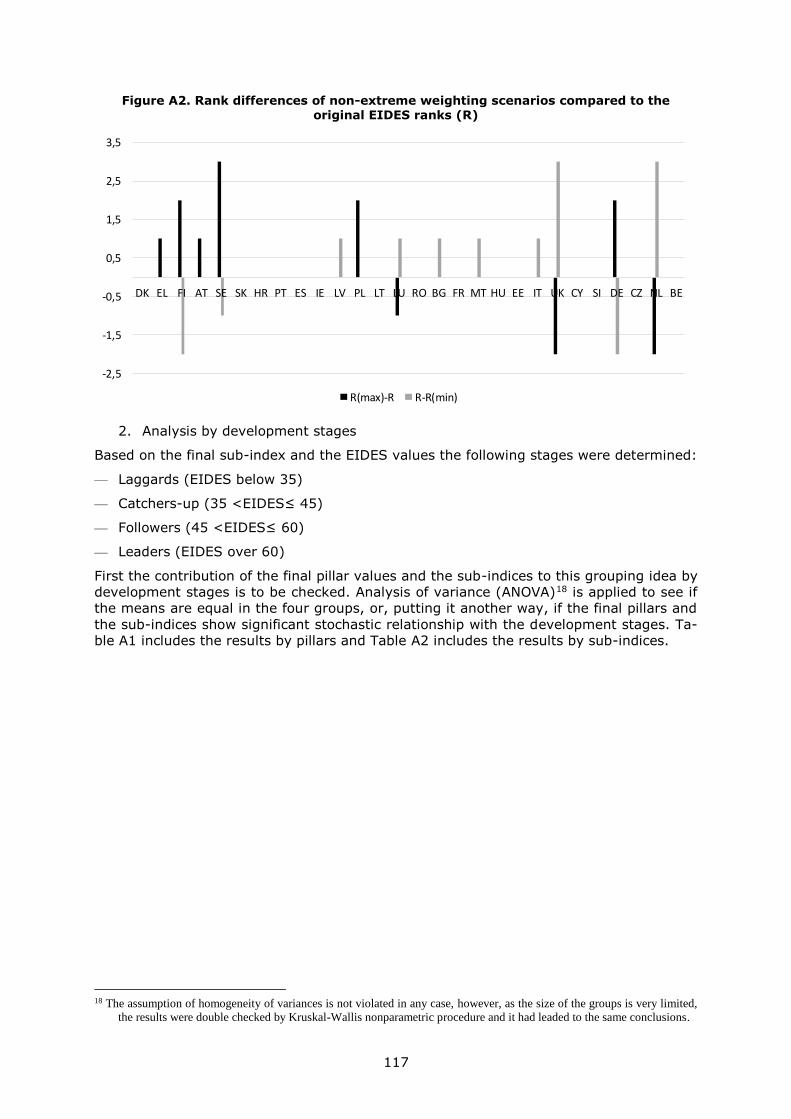
117
Figure A2. Rank differences of non-extreme weighting scenarios compared to the original EIDES ranks (R)
2. Analysis by development stages
Based on the final sub-index and the EIDES values the following stages were determined:
— Laggards (EIDES below 35)
— Catchers-up (35 <EIDES≤ 45)
— Followers (45 <EIDES≤ 60)
— Leaders (EIDES over 60)
First the contribution of the final pillar values and the sub-indices to this grouping idea by
development stages is to be checked. Analysis of variance (ANOVA)18 is applied to see if
the means are equal in the four groups, or, putting it another way, if the final pillars and
the sub-indices show significant stochastic relationship with the development stages. Ta-
ble A1 includes the results by pillars and Table A2 includes the results by sub-indices.
18 The assumption of homogeneity of variances is not violated in any case, however, as the size of the groups is very limited,
the results were double checked by Kruskal-Wallis nonparametric procedure and it had leaded to the same conclusions.
-2,5
-1,5
-0,5
0,5
1,5
2,5
3,5
DK EL FI AT SE SK HR PT ES IE LV PL LT LU RO BG FR MT HU EE IT UK CY SI DE CZ NL BE
R(max)-R R-R(min)
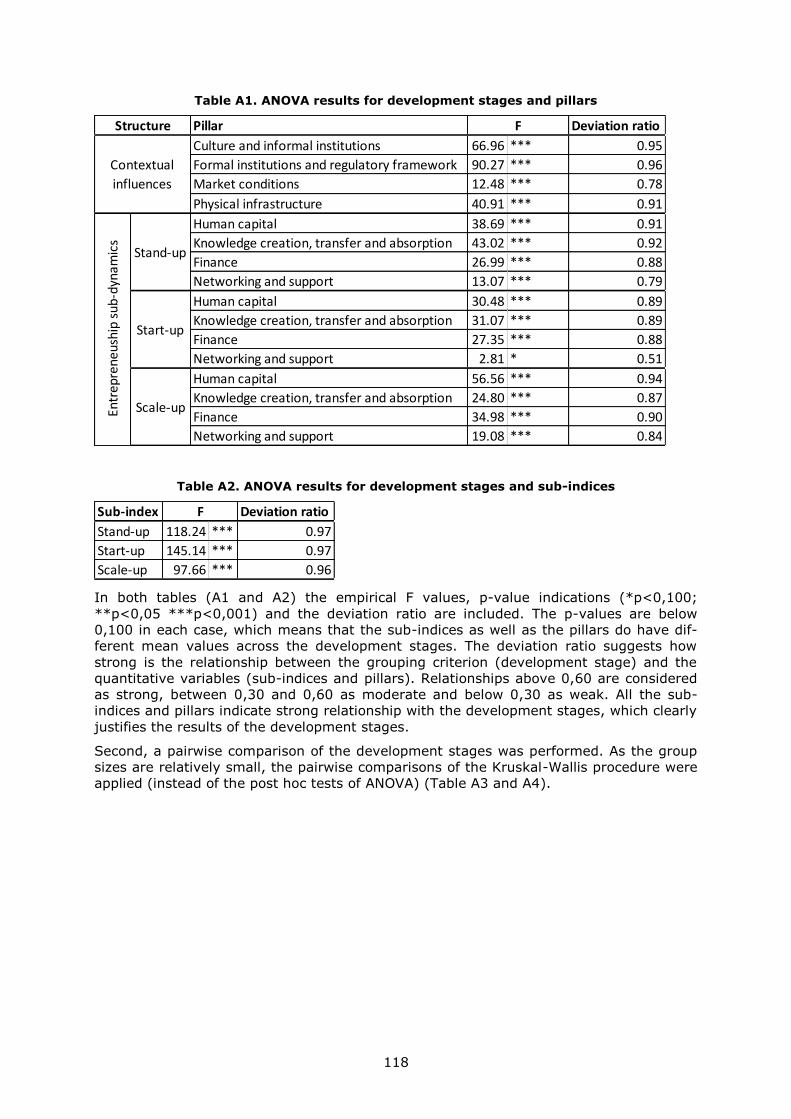
118
Table A1. ANOVA results for development stages and pillars
Table A2. ANOVA results for development stages and sub-indices
In both tables (A1 and A2) the empirical F values, p-value indications (*p<0,100;
**p<0,05 ***p<0,001) and the deviation ratio are included. The p-values are below
0,100 in each case, which means that the sub-indices as well as the pillars do have dif-
ferent mean values across the development stages. The deviation ratio suggests how
strong is the relationship between the grouping criterion (development stage) and the
quantitative variables (sub-indices and pillars). Relationships above 0,60 are considered
as strong, between 0,30 and 0,60 as moderate and below 0,30 as weak. All the sub-
indices and pillars indicate strong relationship with the development stages, which clearly
justifies the results of the development stages.
Second, a pairwise comparison of the development stages was performed. As the group
sizes are relatively small, the pairwise comparisons of the Kruskal-Wallis procedure were
applied (instead of the post hoc tests of ANOVA) (Table A3 and A4).
Pillar Deviation ratio
Culture and informal institutions 66.96 *** 0.95
Formal institutions and regulatory framework 90.27 *** 0.96
Market conditions 12.48 *** 0.78
Physical infrastructure 40.91 *** 0.91
Human capital 38.69 *** 0.91
Knowledge creation, transfer and absorption 43.02 *** 0.92
Finance 26.99 *** 0.88
Networking and support 13.07 *** 0.79
Human capital 30.48 *** 0.89
Knowledge creation, transfer and absorption 31.07 *** 0.89
Finance 27.35 *** 0.88
Networking and support 2.81 * 0.51
Human capital 56.56 *** 0.94
Knowledge creation, transfer and absorption 24.80 *** 0.87
Finance 34.98 *** 0.90
Networking and support 19.08 *** 0.84
Scale-up
Structure FEn
trep
rene
ushi
p su
b-dy
nam
ics
Contextual
influences
Stand-up
Start-up
Sub-index Deviation ratio
Stand-up 118.24 *** 0.97
Start-up 145.14 *** 0.97
Scale-up 97.66 *** 0.96
F
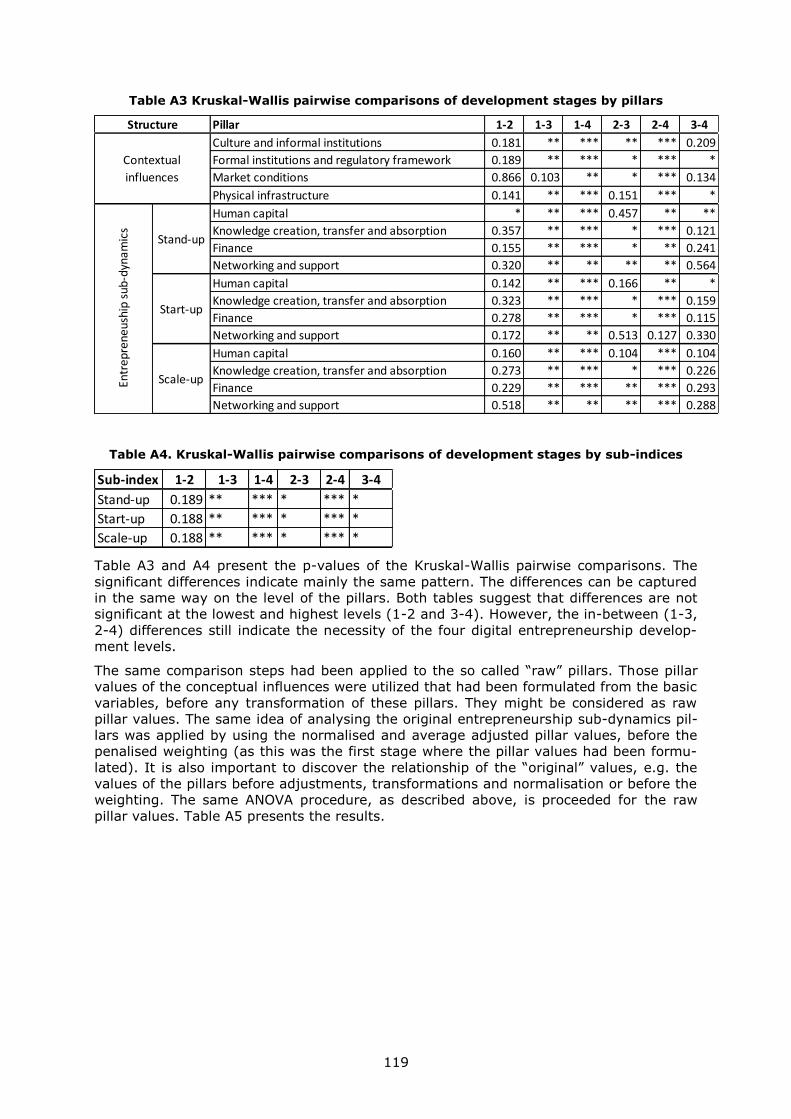
119
Table A3 Kruskal-Wallis pairwise comparisons of development stages by pillars
Table A4. Kruskal-Wallis pairwise comparisons of development stages by sub-indices
Table A3 and A4 present the p-values of the Kruskal-Wallis pairwise comparisons. The
significant differences indicate mainly the same pattern. The differences can be captured
in the same way on the level of the pillars. Both tables suggest that differences are not
significant at the lowest and highest levels (1-2 and 3-4). However, the in-between (1-3,
2-4) differences still indicate the necessity of the four digital entrepreneurship develop-
ment levels.
The same comparison steps had been applied to the so called “raw” pillars. Those pillar
values of the conceptual influences were utilized that had been formulated from the basic
variables, before any transformation of these pillars. They might be considered as raw
pillar values. The same idea of analysing the original entrepreneurship sub-dynamics pil-
lars was applied by using the normalised and average adjusted pillar values, before the
penalised weighting (as this was the first stage where the pillar values had been formu-
lated). It is also important to discover the relationship of the “original” values, e.g. the
values of the pillars before adjustments, transformations and normalisation or before the
weighting. The same ANOVA procedure, as described above, is proceeded for the raw
pillar values. Table A5 presents the results.
Pillar 1-2 1-3 1-4 2-3 2-4 3-4
Culture and informal institutions 0.181 ** *** ** *** 0.209
Formal institutions and regulatory framework 0.189 ** *** * *** *
Market conditions 0.866 0.103 ** * *** 0.134
Physical infrastructure 0.141 ** *** 0.151 *** *
Human capital * ** *** 0.457 ** **
Knowledge creation, transfer and absorption 0.357 ** *** * *** 0.121
Finance 0.155 ** *** * ** 0.241
Networking and support 0.320 ** ** ** ** 0.564
Human capital 0.142 ** *** 0.166 ** *
Knowledge creation, transfer and absorption 0.323 ** *** * *** 0.159
Finance 0.278 ** *** * *** 0.115
Networking and support 0.172 ** ** 0.513 0.127 0.330
Human capital 0.160 ** *** 0.104 *** 0.104
Knowledge creation, transfer and absorption 0.273 ** *** * *** 0.226
Finance 0.229 ** *** ** *** 0.293
Networking and support 0.518 ** ** ** *** 0.288
Structure
Contextual
influences
Entr
epre
neus
hip
sub-
dyna
mic
s
Stand-up
Start-up
Scale-up
Sub-index 1-2 1-3 1-4 2-3 2-4 3-4
Stand-up 0.189 ** *** * *** *
Start-up 0.188 ** *** * *** *
Scale-up 0.188 ** *** * *** *
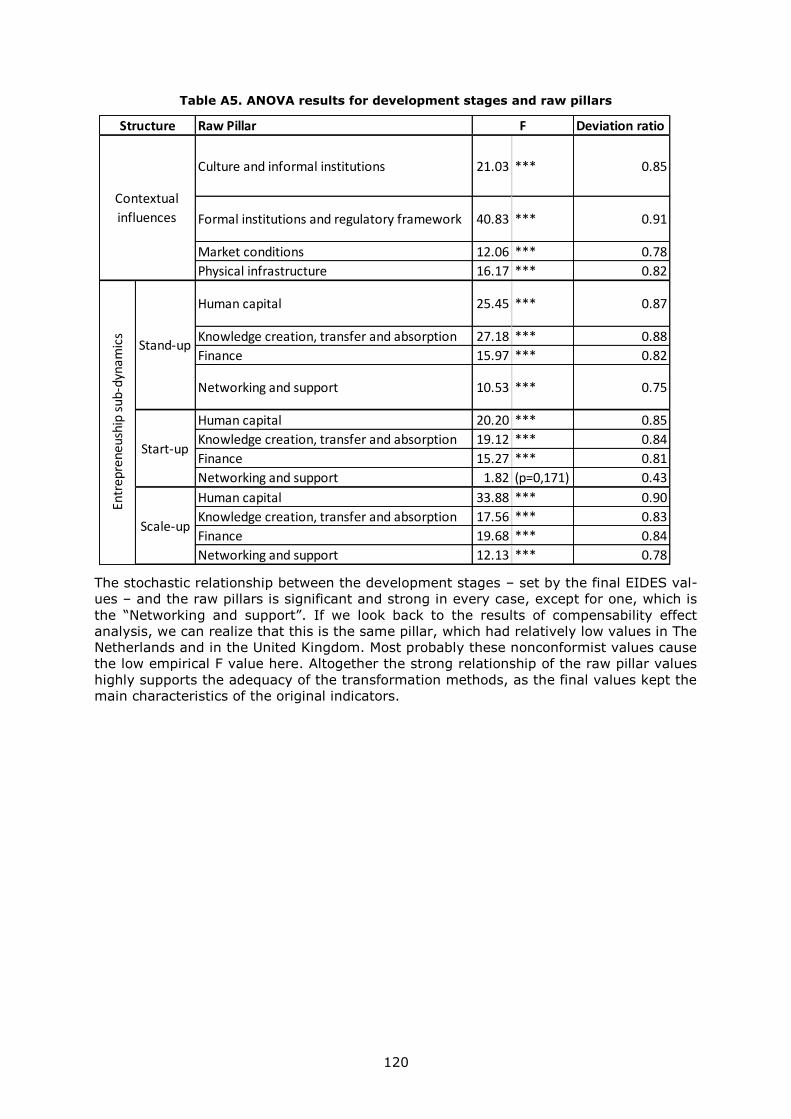
120
Table A5. ANOVA results for development stages and raw pillars
The stochastic relationship between the development stages – set by the final EIDES val-
ues – and the raw pillars is significant and strong in every case, except for one, which is
the “Networking and support”. If we look back to the results of compensability effect
analysis, we can realize that this is the same pillar, which had relatively low values in The
Netherlands and in the United Kingdom. Most probably these nonconformist values cause
the low empirical F value here. Altogether the strong relationship of the raw pillar values
highly supports the adequacy of the transformation methods, as the final values kept the
main characteristics of the original indicators.
Raw Pillar Deviation ratio
Culture and informal institutions 21.03 *** 0.85
Formal institutions and regulatory framework 40.83 *** 0.91
Market conditions 12.06 *** 0.78
Physical infrastructure 16.17 *** 0.82
Human capital 25.45 *** 0.87
Knowledge creation, transfer and absorption 27.18 *** 0.88
Finance 15.97 *** 0.82
Networking and support 10.53 *** 0.75
Human capital 20.20 *** 0.85
Knowledge creation, transfer and absorption 19.12 *** 0.84
Finance 15.27 *** 0.81
Networking and support 1.82 (p=0,171) 0.43
Human capital 33.88 *** 0.90
Knowledge creation, transfer and absorption 17.56 *** 0.83
Finance 19.68 *** 0.84
Networking and support 12.13 *** 0.78
F
Contextual
influences
Entr
epre
neus
hip
sub-
dyna
mic
s
Stand-up
Start-up
Scale-up
Structure
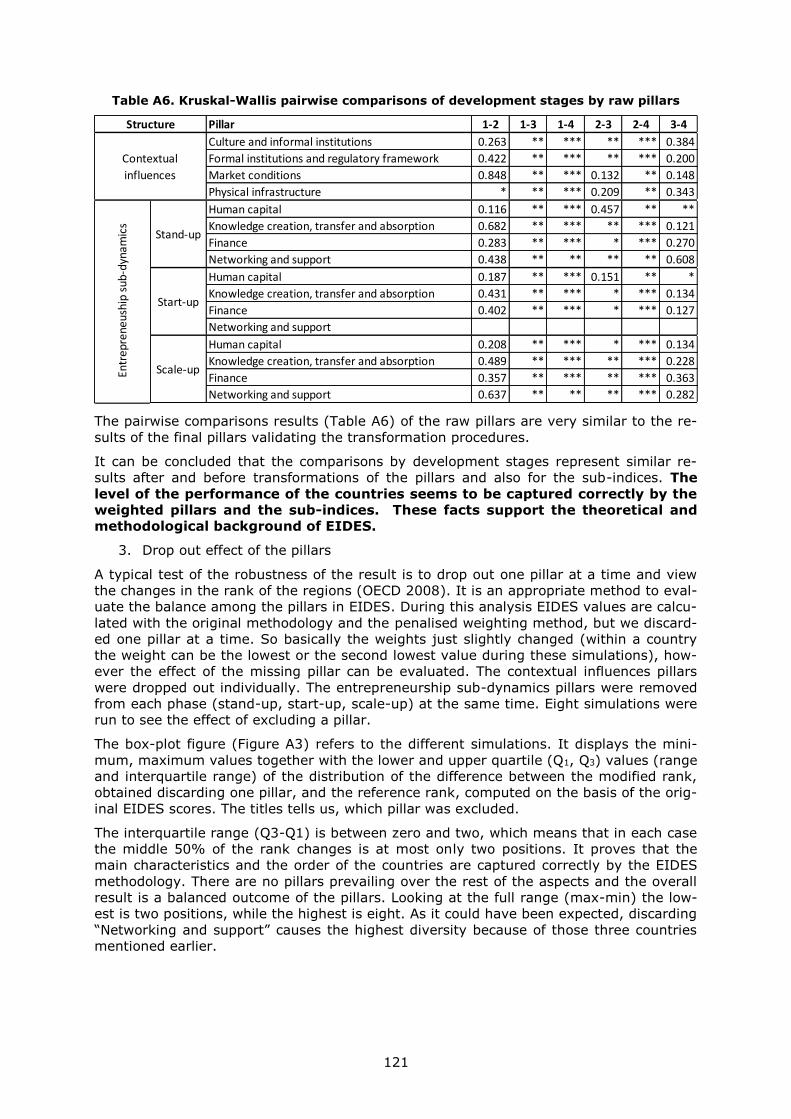
121
Table A6. Kruskal-Wallis pairwise comparisons of development stages by raw pillars
The pairwise comparisons results (Table A6) of the raw pillars are very similar to the re-
sults of the final pillars validating the transformation procedures.
It can be concluded that the comparisons by development stages represent similar re-
sults after and before transformations of the pillars and also for the sub-indices. The
level of the performance of the countries seems to be captured correctly by the
weighted pillars and the sub-indices. These facts support the theoretical and
methodological background of EIDES.
3. Drop out effect of the pillars
A typical test of the robustness of the result is to drop out one pillar at a time and view
the changes in the rank of the regions (OECD 2008). It is an appropriate method to eval-
uate the balance among the pillars in EIDES. During this analysis EIDES values are calcu-
lated with the original methodology and the penalised weighting method, but we discard-
ed one pillar at a time. So basically the weights just slightly changed (within a country
the weight can be the lowest or the second lowest value during these simulations), how-
ever the effect of the missing pillar can be evaluated. The contextual influences pillars
were dropped out individually. The entrepreneurship sub-dynamics pillars were removed
from each phase (stand-up, start-up, scale-up) at the same time. Eight simulations were
run to see the effect of excluding a pillar.
The box-plot figure (Figure A3) refers to the different simulations. It displays the mini-
mum, maximum values together with the lower and upper quartile (Q1, Q3) values (range
and interquartile range) of the distribution of the difference between the modified rank,
obtained discarding one pillar, and the reference rank, computed on the basis of the orig-
inal EIDES scores. The titles tells us, which pillar was excluded.
The interquartile range (Q3-Q1) is between zero and two, which means that in each case
the middle 50% of the rank changes is at most only two positions. It proves that the
main characteristics and the order of the countries are captured correctly by the EIDES
methodology. There are no pillars prevailing over the rest of the aspects and the overall
result is a balanced outcome of the pillars. Looking at the full range (max-min) the low-
est is two positions, while the highest is eight. As it could have been expected, discarding
“Networking and support” causes the highest diversity because of those three countries
mentioned earlier.
Pillar 1-2 1-3 1-4 2-3 2-4 3-4
Culture and informal institutions 0.263 ** *** ** *** 0.384
Formal institutions and regulatory framework 0.422 ** *** ** *** 0.200
Market conditions 0.848 ** *** 0.132 ** 0.148
Physical infrastructure * ** *** 0.209 ** 0.343
Human capital 0.116 ** *** 0.457 ** **
Knowledge creation, transfer and absorption 0.682 ** *** ** *** 0.121
Finance 0.283 ** *** * *** 0.270
Networking and support 0.438 ** ** ** ** 0.608
Human capital 0.187 ** *** 0.151 ** *
Knowledge creation, transfer and absorption 0.431 ** *** * *** 0.134
Finance 0.402 ** *** * *** 0.127
Networking and support
Human capital 0.208 ** *** * *** 0.134
Knowledge creation, transfer and absorption 0.489 ** *** ** *** 0.228
Finance 0.357 ** *** ** *** 0.363
Networking and support 0.637 ** ** ** *** 0.282
Structure
Contextual
influences
Entr
epre
neus
hip
sub-
dyna
mic
s
Stand-up
Start-up
Scale-up
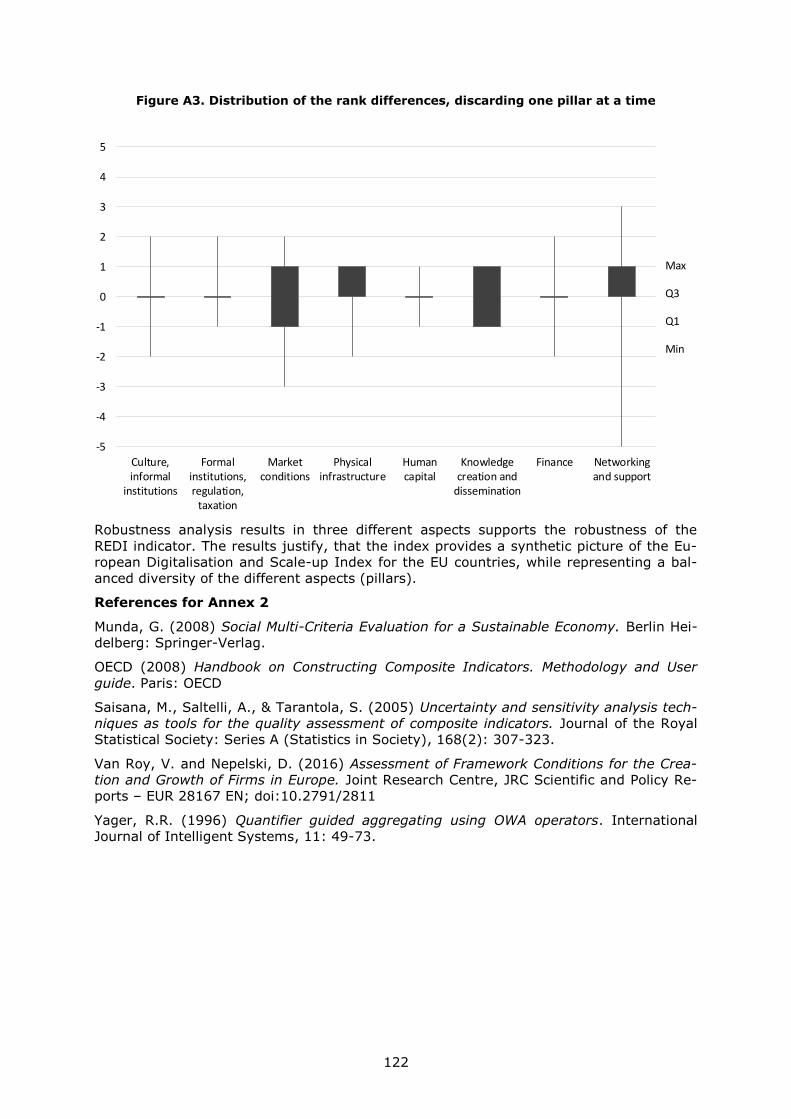
122
Figure A3. Distribution of the rank differences, discarding one pillar at a time
Robustness analysis results in three different aspects supports the robustness of the
REDI indicator. The results justify, that the index provides a synthetic picture of the Eu-
ropean Digitalisation and Scale-up Index for the EU countries, while representing a bal-
anced diversity of the different aspects (pillars).
References for Annex 2
Munda, G. (2008) Social Multi-Criteria Evaluation for a Sustainable Economy. Berlin Hei-
delberg: Springer-Verlag.
OECD (2008) Handbook on Constructing Composite Indicators. Methodology and User
guide. Paris: OECD
Saisana, M., Saltelli, A., & Tarantola, S. (2005) Uncertainty and sensitivity analysis tech-
niques as tools for the quality assessment of composite indicators. Journal of the Royal
Statistical Society: Series A (Statistics in Society), 168(2): 307-323.
Van Roy, V. and Nepelski, D. (2016) Assessment of Framework Conditions for the Crea-
tion and Growth of Firms in Europe. Joint Research Centre, JRC Scientific and Policy Re-
ports – EUR 28167 EN; doi:10.2791/2811
Yager, R.R. (1996) Quantifier guided aggregating using OWA operators. International
Journal of Intelligent Systems, 11: 49-73.
-5
-4
-3
-2
-1
0
1
2
3
4
5
Culture,informal
institutions
Formalinstitutions,regulation,
taxation
Marketconditions
Physicalinfrastructure
Humancapital
Knowledgecreation and
dissemination
Finance Networkingand support
Max
Q3
Q1
Min
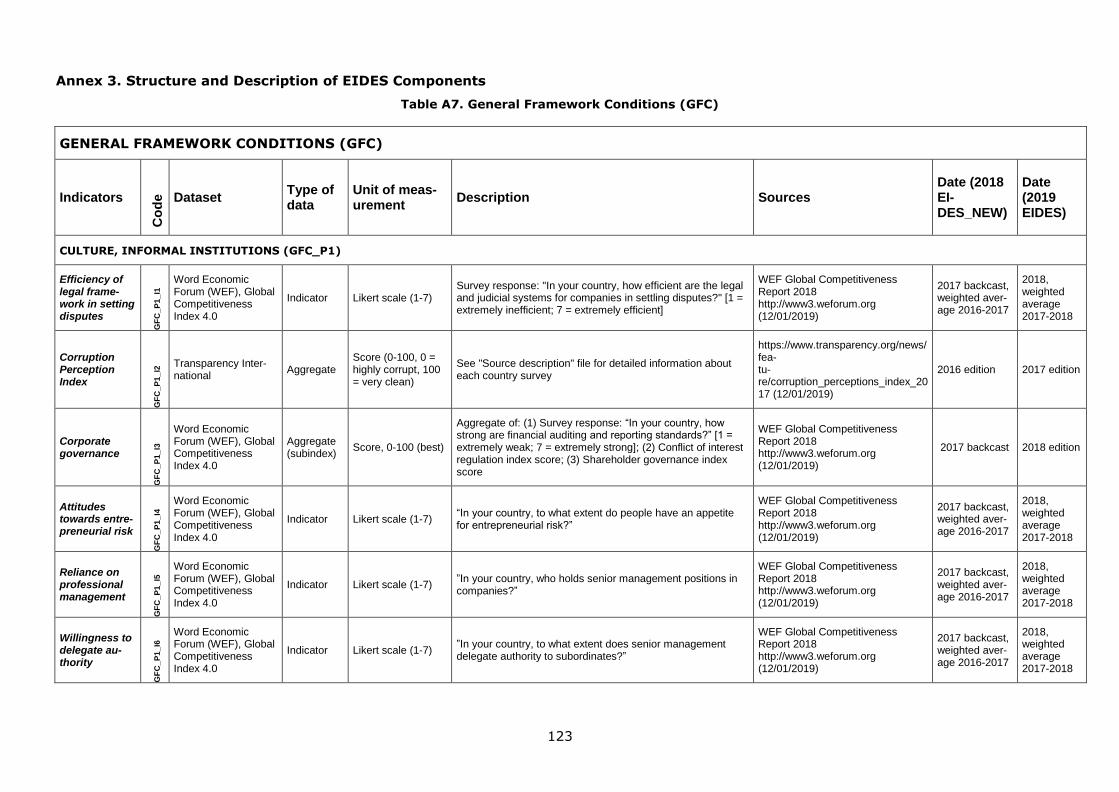
123
Annex 3. Structure and Description of EIDES Components
Table A7. General Framework Conditions (GFC)
GENERAL FRAMEWORK CONDITIONS (GFC)
Indicators
Co
de
Dataset Type of data
Unit of meas-urement
Description Sources Date (2018 EI-DES_NEW)
Date (2019 EIDES)
CULTURE, INFORMAL INSTITUTIONS (GFC_P1)
Efficiency of legal frame-work in setting disputes
GF
C_P
1_
I1
Word Economic Forum (WEF), Global Competitiveness Index 4.0
Indicator Likert scale (1-7) Survey response: "In your country, how efficient are the legal and judicial systems for companies in settling disputes?" [1 = extremely inefficient; 7 = extremely efficient]
WEF Global Competitiveness Report 2018 http://www3.weforum.org (12/01/2019)
2017 backcast, weighted aver-age 2016-2017
2018, weighted average 2017-2018
Corruption Perception Index
GF
C_P
1_
I2 Transparency Inter-
national Aggregate
Score (0-100, 0 = highly corrupt, 100 = very clean)
See "Source description" file for detailed information about each country survey
https://www.transparency.org/news/fea-tu-re/corruption_perceptions_index_2017 (12/01/2019)
2016 edition 2017 edition
Corporate governance
GF
C_P
1_
I3
Word Economic Forum (WEF), Global Competitiveness Index 4.0
Aggregate (subindex)
Score, 0-100 (best)
Aggregate of: (1) Survey response: “In your country, how strong are financial auditing and reporting standards?” [1 = extremely weak; 7 = extremely strong]; (2) Conflict of interest regulation index score; (3) Shareholder governance index score
WEF Global Competitiveness Report 2018 http://www3.weforum.org (12/01/2019)
2017 backcast 2018 edition
Attitudes towards entre-preneurial risk
GF
C_P
1_
I4
Word Economic Forum (WEF), Global Competitiveness Index 4.0
Indicator Likert scale (1-7) “In your country, to what extent do people have an appetite for entrepreneurial risk?”
WEF Global Competitiveness Report 2018 http://www3.weforum.org (12/01/2019)
2017 backcast, weighted aver-age 2016-2017
2018, weighted average 2017-2018
Reliance on professional management
GF
C_P
1_
I5
Word Economic Forum (WEF), Global Competitiveness Index 4.0
Indicator Likert scale (1-7) ”In your country, who holds senior management positions in companies?”
WEF Global Competitiveness Report 2018 http://www3.weforum.org (12/01/2019)
2017 backcast, weighted aver-age 2016-2017
2018, weighted average 2017-2018
Willingness to delegate au-thority
GF
C_P
1_
I6
Word Economic Forum (WEF), Global Competitiveness Index 4.0
Indicator Likert scale (1-7) ”In your country, to what extent does senior management delegate authority to subordinates?”
WEF Global Competitiveness Report 2018 http://www3.weforum.org (12/01/2019)
2017 backcast, weighted aver-age 2016-2017
2018, weighted average 2017-2018
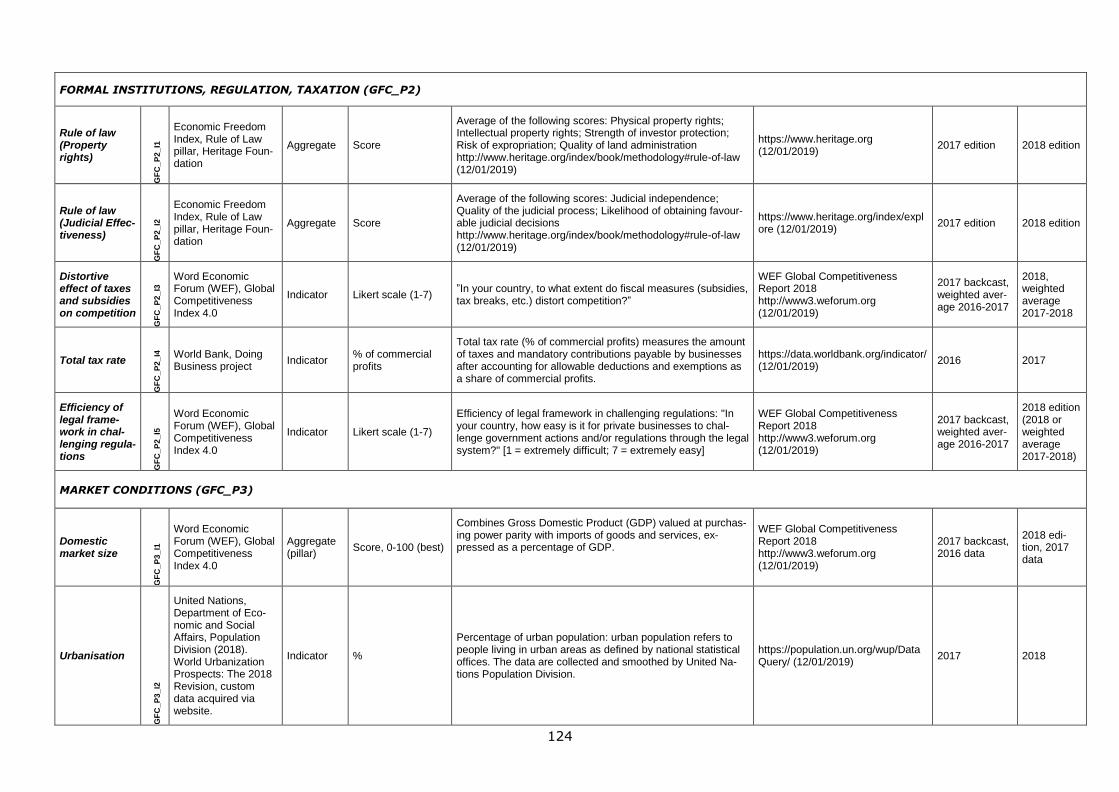
124
FORMAL INSTITUTIONS, REGULATION, TAXATION (GFC_P2)
Rule of law (Property rights)
GF
C_P
2_
I1
Economic Freedom Index, Rule of Law pillar, Heritage Foun-dation
Aggregate Score
Average of the following scores: Physical property rights; Intellectual property rights; Strength of investor protection; Risk of expropriation; Quality of land administration http://www.heritage.org/index/book/methodology#rule-of-law (12/01/2019)
https://www.heritage.org (12/01/2019)
2017 edition 2018 edition
Rule of law (Judicial Effec-tiveness)
GF
C_P
2_
I2
Economic Freedom Index, Rule of Law pillar, Heritage Foun-dation
Aggregate Score
Average of the following scores: Judicial independence; Quality of the judicial process; Likelihood of obtaining favour-able judicial decisions http://www.heritage.org/index/book/methodology#rule-of-law (12/01/2019)
https://www.heritage.org/index/explore (12/01/2019)
2017 edition 2018 edition
Distortive effect of taxes and subsidies on competition
GF
C_P
2_
I3
Word Economic Forum (WEF), Global Competitiveness Index 4.0
Indicator Likert scale (1-7) ”In your country, to what extent do fiscal measures (subsidies, tax breaks, etc.) distort competition?”
WEF Global Competitiveness Report 2018 http://www3.weforum.org (12/01/2019)
2017 backcast, weighted aver-age 2016-2017
2018, weighted average 2017-2018
Total tax rate
GF
C_P
2_
I4
World Bank, Doing Business project
Indicator % of commercial profits
Total tax rate (% of commercial profits) measures the amount of taxes and mandatory contributions payable by businesses after accounting for allowable deductions and exemptions as a share of commercial profits.
https://data.worldbank.org/indicator/ (12/01/2019)
2016 2017
Efficiency of legal frame-work in chal-lenging regula-tions
GF
C_
P2
_I5
Word Economic Forum (WEF), Global Competitiveness Index 4.0
Indicator Likert scale (1-7)
Efficiency of legal framework in challenging regulations: "In your country, how easy is it for private businesses to chal-lenge government actions and/or regulations through the legal system?" [1 = extremely difficult; 7 = extremely easy]
WEF Global Competitiveness Report 2018 http://www3.weforum.org (12/01/2019)
2017 backcast, weighted aver-age 2016-2017
2018 edition (2018 or weighted average 2017-2018)
MARKET CONDITIONS (GFC_P3)
Domestic market size
GF
C_P
3_
I1
Word Economic Forum (WEF), Global Competitiveness Index 4.0
Aggregate (pillar)
Score, 0-100 (best)
Combines Gross Domestic Product (GDP) valued at purchas-ing power parity with imports of goods and services, ex-pressed as a percentage of GDP.
WEF Global Competitiveness Report 2018 http://www3.weforum.org (12/01/2019)
2017 backcast, 2016 data
2018 edi-tion, 2017 data
Urbanisation
GF
C_
P3
_I2
United Nations, Department of Eco-nomic and Social Affairs, Population Division (2018). World Urbanization Prospects: The 2018 Revision, custom data acquired via website.
Indicator %
Percentage of urban population: urban population refers to people living in urban areas as defined by national statistical offices. The data are collected and smoothed by United Na-tions Population Division.
https://population.un.org/wup/DataQuery/ (12/01/2019)
2017 2018
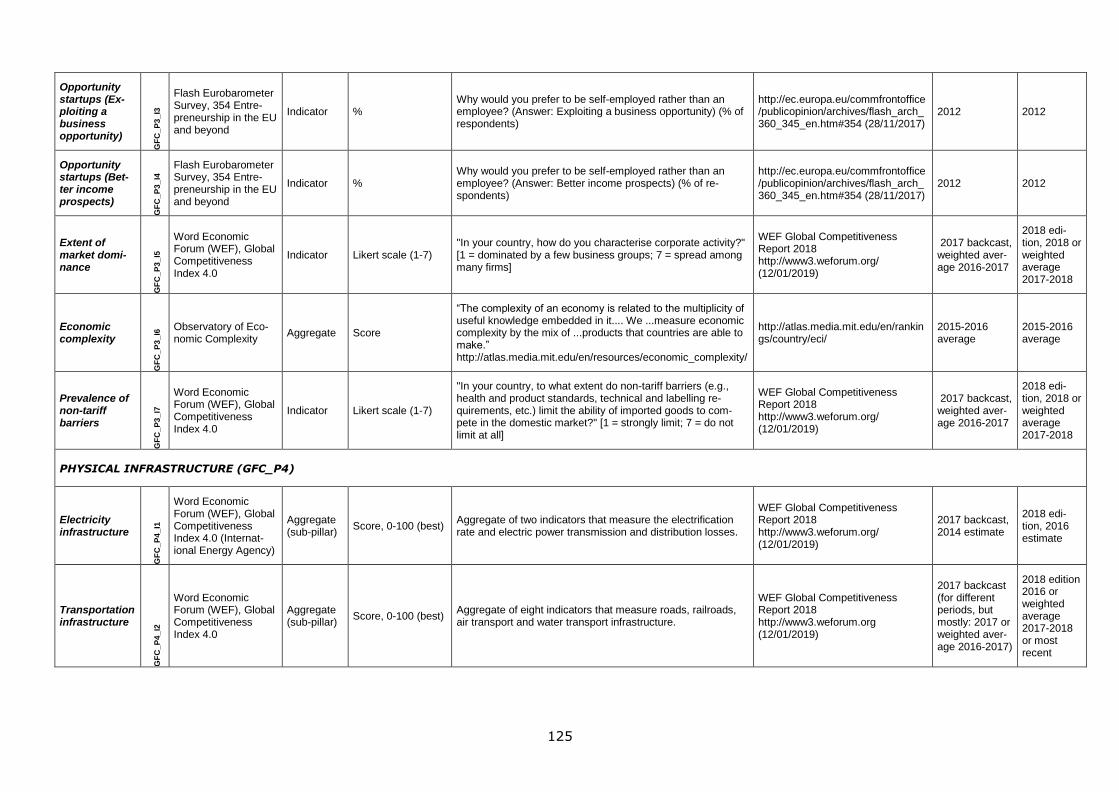
125
Opportunity startups (Ex-ploiting a business opportunity)
GF
C_P
3_
I3
Flash Eurobarometer Survey, 354 Entre-preneurship in the EU and beyond
Indicator % Why would you prefer to be self-employed rather than an employee? (Answer: Exploiting a business opportunity) (% of respondents)
http://ec.europa.eu/commfrontoffice/publicopinion/archives/flash_arch_360_345_en.htm#354 (28/11/2017)
2012 2012
Opportunity startups (Bet-ter income prospects)
GF
C_P
3_
I4
Flash Eurobarometer Survey, 354 Entre-preneurship in the EU and beyond
Indicator % Why would you prefer to be self-employed rather than an employee? (Answer: Better income prospects) (% of re-spondents)
http://ec.europa.eu/commfrontoffice/publicopinion/archives/flash_arch_360_345_en.htm#354 (28/11/2017)
2012 2012
Extent of market domi-nance
GF
C_P
3_
I5
Word Economic Forum (WEF), Global Competitiveness Index 4.0
Indicator Likert scale (1-7) "In your country, how do you characterise corporate activity?" [1 = dominated by a few business groups; 7 = spread among many firms]
WEF Global Competitiveness Report 2018 http://www3.weforum.org/ (12/01/2019)
2017 backcast, weighted aver-age 2016-2017
2018 edi-tion, 2018 or weighted average 2017-2018
Economic complexity
GF
C_P
3_
I6 Observatory of Eco-
nomic Complexity Aggregate Score
“The complexity of an economy is related to the multiplicity of useful knowledge embedded in it.... We ...measure economic complexity by the mix of ...products that countries are able to make.” http://atlas.media.mit.edu/en/resources/economic_complexity/
http://atlas.media.mit.edu/en/rankings/country/eci/
2015-2016 average
2015-2016 average
Prevalence of non-tariff barriers
GF
C_P
3_
I7
Word Economic Forum (WEF), Global Competitiveness Index 4.0
Indicator Likert scale (1-7)
"In your country, to what extent do non-tariff barriers (e.g., health and product standards, technical and labelling re-quirements, etc.) limit the ability of imported goods to com-pete in the domestic market?" [1 = strongly limit; 7 = do not limit at all]
WEF Global Competitiveness Report 2018 http://www3.weforum.org/ (12/01/2019)
2017 backcast, weighted aver-age 2016-2017
2018 edi-tion, 2018 or weighted average 2017-2018
PHYSICAL INFRASTRUCTURE (GFC_P4)
Electricity infrastructure
GF
C_P
4_
I1
Word Economic Forum (WEF), Global Competitiveness Index 4.0 (Internat-ional Energy Agency)
Aggregate (sub-pillar)
Score, 0-100 (best) Aggregate of two indicators that measure the electrification rate and electric power transmission and distribution losses.
WEF Global Competitiveness Report 2018 http://www3.weforum.org/ (12/01/2019)
2017 backcast, 2014 estimate
2018 edi-tion, 2016 estimate
Transportation infrastructure
GF
C_P
4_
I2
Word Economic Forum (WEF), Global Competitiveness Index 4.0
Aggregate (sub-pillar)
Score, 0-100 (best) Aggregate of eight indicators that measure roads, railroads, air transport and water transport infrastructure.
WEF Global Competitiveness Report 2018 http://www3.weforum.org (12/01/2019)
2017 backcast (for different periods, but mostly: 2017 or weighted aver-age 2016-2017)
2018 edition 2016 or weighted average 2017-2018 or most recent
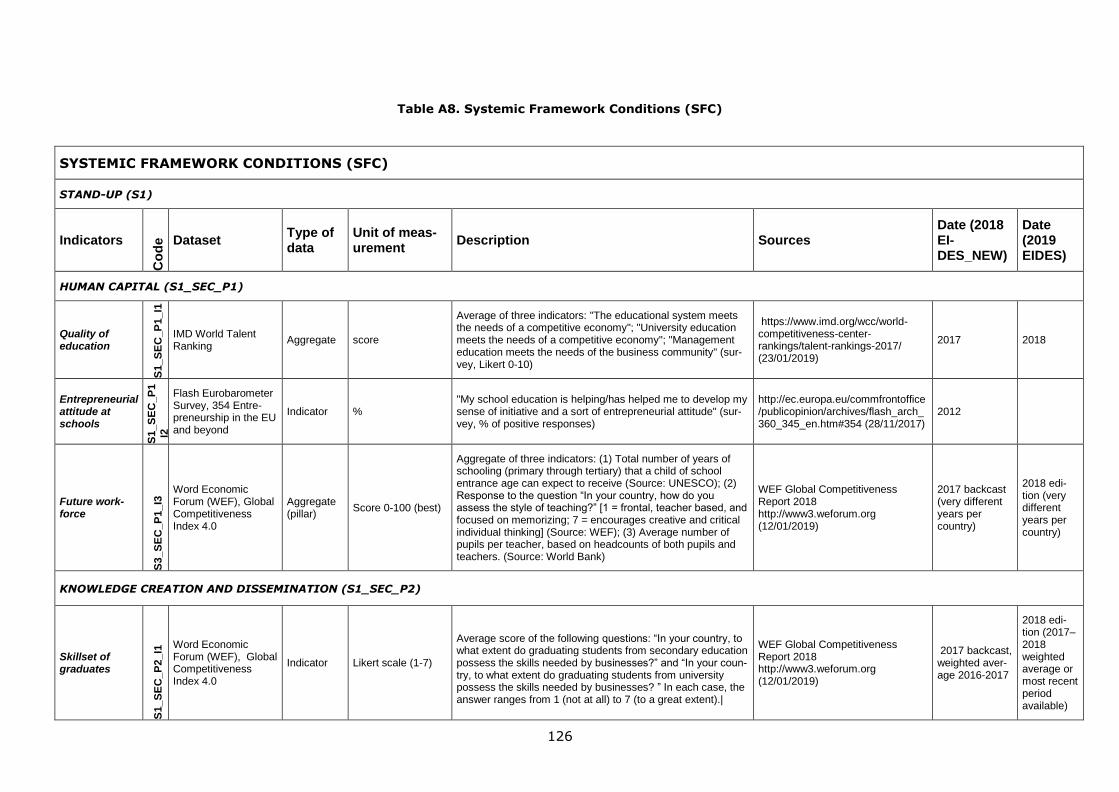
126
Table A8. Systemic Framework Conditions (SFC)
SYSTEMIC FRAMEWORK CONDITIONS (SFC)
STAND-UP (S1)
Indicators
Co
de
Dataset Type of data
Unit of meas-urement
Description Sources Date (2018 EI-DES_NEW)
Date (2019 EIDES)
HUMAN CAPITAL (S1_SEC_P1)
Quality of education
S1_S
EC
_P
1_I1
IMD World Talent Ranking
Aggregate score
Average of three indicators: "The educational system meets the needs of a competitive economy"; "University education meets the needs of a competitive economy"; "Management education meets the needs of the business community" (sur-vey, Likert 0-10)
https://www.imd.org/wcc/world-competitiveness-center-rankings/talent-rankings-2017/ (23/01/2019)
2017 2018
Entrepreneurial attitude at schools
S1_S
EC
_P
1
_I2
Flash Eurobarometer Survey, 354 Entre-preneurship in the EU and beyond
Indicator % "My school education is helping/has helped me to develop my sense of initiative and a sort of entrepreneurial attitude" (sur-vey, % of positive responses)
http://ec.europa.eu/commfrontoffice/publicopinion/archives/flash_arch_360_345_en.htm#354 (28/11/2017)
2012
Future work-force
S3_S
EC
_P
1_I3
Word Economic Forum (WEF), Global Competitiveness Index 4.0
Aggregate (pillar)
Score 0-100 (best)
Aggregate of three indicators: (1) Total number of years of schooling (primary through tertiary) that a child of school entrance age can expect to receive (Source: UNESCO); (2) Response to the question “In your country, how do you assess the style of teaching?” [1 = frontal, teacher based, and focused on memorizing; 7 = encourages creative and critical individual thinking] (Source: WEF); (3) Average number of pupils per teacher, based on headcounts of both pupils and teachers. (Source: World Bank)
WEF Global Competitiveness Report 2018 http://www3.weforum.org (12/01/2019)
2017 backcast (very different years per country)
2018 edi-tion (very different years per country)
KNOWLEDGE CREATION AND DISSEMINATION (S1_SEC_P2)
Skillset of graduates
S1_S
EC
_P
2_I1
Word Economic Forum (WEF), Global Competitiveness Index 4.0
Indicator Likert scale (1-7)
Average score of the following questions: “In your country, to what extent do graduating students from secondary education possess the skills needed by businesses?” and “In your coun-try, to what extent do graduating students from university possess the skills needed by businesses? ” In each case, the answer ranges from 1 (not at all) to 7 (to a great extent).|
WEF Global Competitiveness Report 2018 http://www3.weforum.org (12/01/2019)
2017 backcast, weighted aver-age 2016-2017
2018 edi-tion (2017–2018 weighted average or most recent period available)
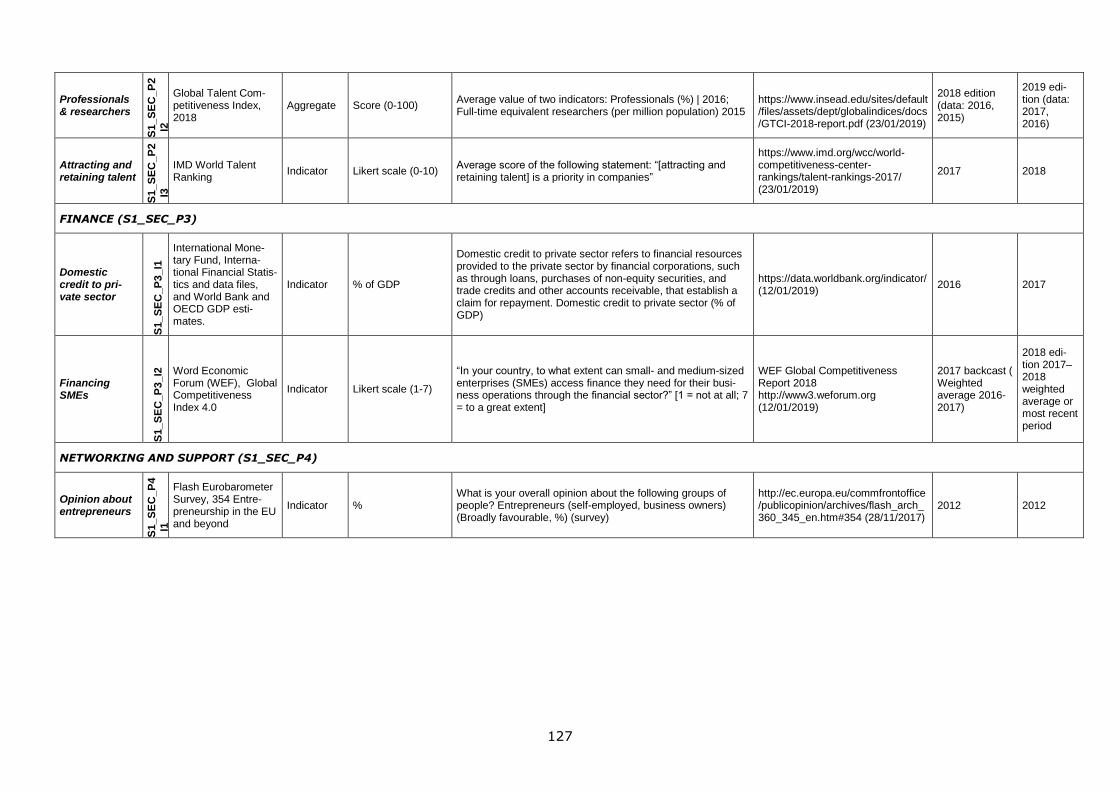
127
Professionals & researchers
S1_S
EC
_P
2
_I2
Global Talent Com-petitiveness Index, 2018
Aggregate Score (0-100) Average value of two indicators: Professionals (%) | 2016; Full-time equivalent researchers (per million population) 2015
https://www.insead.edu/sites/default/files/assets/dept/globalindices/docs/GTCI-2018-report.pdf (23/01/2019)
2018 edition (data: 2016, 2015)
2019 edi-tion (data: 2017, 2016)
Attracting and retaining talent
S1_S
EC
_P
2
_I3
IMD World Talent Ranking
Indicator Likert scale (0-10) Average score of the following statement: “[attracting and retaining talent] is a priority in companies”
https://www.imd.org/wcc/world-competitiveness-center-rankings/talent-rankings-2017/ (23/01/2019)
2017 2018
FINANCE (S1_SEC_P3)
Domestic credit to pri-vate sector
S1_S
EC
_P
3_I1
International Mone-tary Fund, Interna-tional Financial Statis-tics and data files, and World Bank and OECD GDP esti-mates.
Indicator % of GDP
Domestic credit to private sector refers to financial resources provided to the private sector by financial corporations, such as through loans, purchases of non-equity securities, and trade credits and other accounts receivable, that establish a claim for repayment. Domestic credit to private sector (% of GDP)
https://data.worldbank.org/indicator/ (12/01/2019)
2016 2017
Financing SMEs
S1_S
EC
_P
3_I2
Word Economic Forum (WEF), Global Competitiveness Index 4.0
Indicator Likert scale (1-7)
“In your country, to what extent can small- and medium-sized enterprises (SMEs) access finance they need for their busi-ness operations through the financial sector?” [1 = not at all; 7 = to a great extent]
WEF Global Competitiveness Report 2018 http://www3.weforum.org (12/01/2019)
2017 backcast ( Weighted average 2016-2017)
2018 edi-tion 2017–2018 weighted average or most recent period
NETWORKING AND SUPPORT (S1_SEC_P4)
Opinion about entrepreneurs
S1_S
EC
_P
4
_I1
Flash Eurobarometer Survey, 354 Entre-preneurship in the EU and beyond
Indicator % What is your overall opinion about the following groups of people? Entrepreneurs (self-employed, business owners) (Broadly favourable, %) (survey)
http://ec.europa.eu/commfrontoffice/publicopinion/archives/flash_arch_360_345_en.htm#354 (28/11/2017)
2012 2012
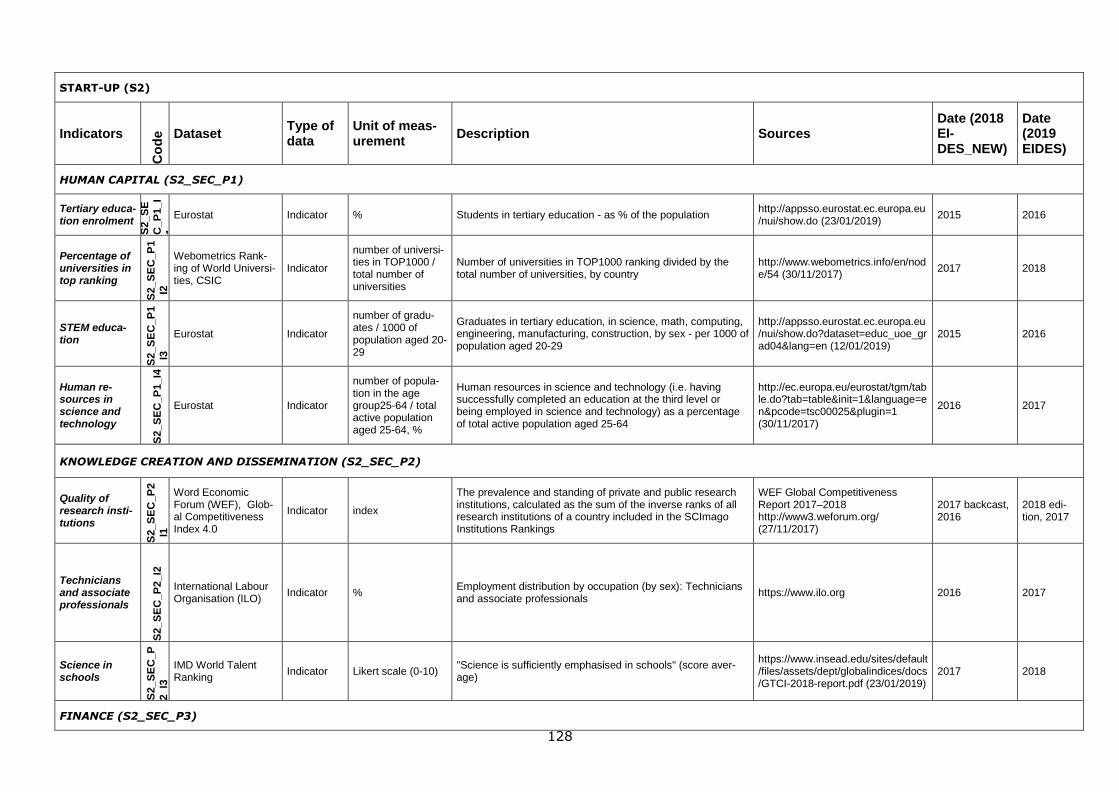
128
START-UP (S2)
Indicators
Co
de
Dataset Type of data
Unit of meas-urement
Description Sources Date (2018 EI-DES_NEW)
Date (2019 EIDES)
HUMAN CAPITAL (S2_SEC_P1)
Tertiary educa-tion enrolment
S2_S
E
C_P
1_I
1
Eurostat Indicator % Students in tertiary education - as % of the population http://appsso.eurostat.ec.europa.eu/nui/show.do (23/01/2019)
2015 2016
Percentage of universities in top ranking
S2_S
EC
_P
1
_I2
Webometrics Rank-ing of World Universi-ties, CSIC
Indicator
number of universi-ties in TOP1000 / total number of universities
Number of universities in TOP1000 ranking divided by the total number of universities, by country
http://www.webometrics.info/en/node/54 (30/11/2017)
2017 2018
STEM educa-tion
S2_S
EC
_P
1
_I3
Eurostat Indicator
number of gradu-ates / 1000 of population aged 20-29
Graduates in tertiary education, in science, math, computing, engineering, manufacturing, construction, by sex - per 1000 of population aged 20-29
http://appsso.eurostat.ec.europa.eu/nui/show.do?dataset=educ_uoe_grad04&lang=en (12/01/2019)
2015 2016
Human re-sources in science and technology
S2_S
EC
_P
1_I4
Eurostat Indicator
number of popula-tion in the age group25-64 / total active population aged 25-64, %
Human resources in science and technology (i.e. having successfully completed an education at the third level or being employed in science and technology) as a percentage of total active population aged 25-64
http://ec.europa.eu/eurostat/tgm/table.do?tab=table&init=1&language=en&pcode=tsc00025&plugin=1 (30/11/2017)
2016 2017
KNOWLEDGE CREATION AND DISSEMINATION (S2_SEC_P2)
Quality of research insti-tutions
S2_S
EC
_P
2
_I1
Word Economic Forum (WEF), Glob-al Competitiveness Index 4.0
Indicator index
The prevalence and standing of private and public research institutions, calculated as the sum of the inverse ranks of all research institutions of a country included in the SCImago Institutions Rankings
WEF Global Competitiveness Report 2017–2018 http://www3.weforum.org/ (27/11/2017)
2017 backcast, 2016
2018 edi-tion, 2017
Technicians and associate professionals
S2_S
EC
_P
2_I2
International Labour Organisation (ILO)
Indicator % Employment distribution by occupation (by sex): Technicians and associate professionals
https://www.ilo.org 2016 2017
Science in schools
S2_S
EC
_P
2_I3
IMD World Talent Ranking
Indicator Likert scale (0-10) "Science is sufficiently emphasised in schools" (score aver-age)
https://www.insead.edu/sites/default/files/assets/dept/globalindices/docs/GTCI-2018-report.pdf (23/01/2019)
2017 2018
FINANCE (S2_SEC_P3)
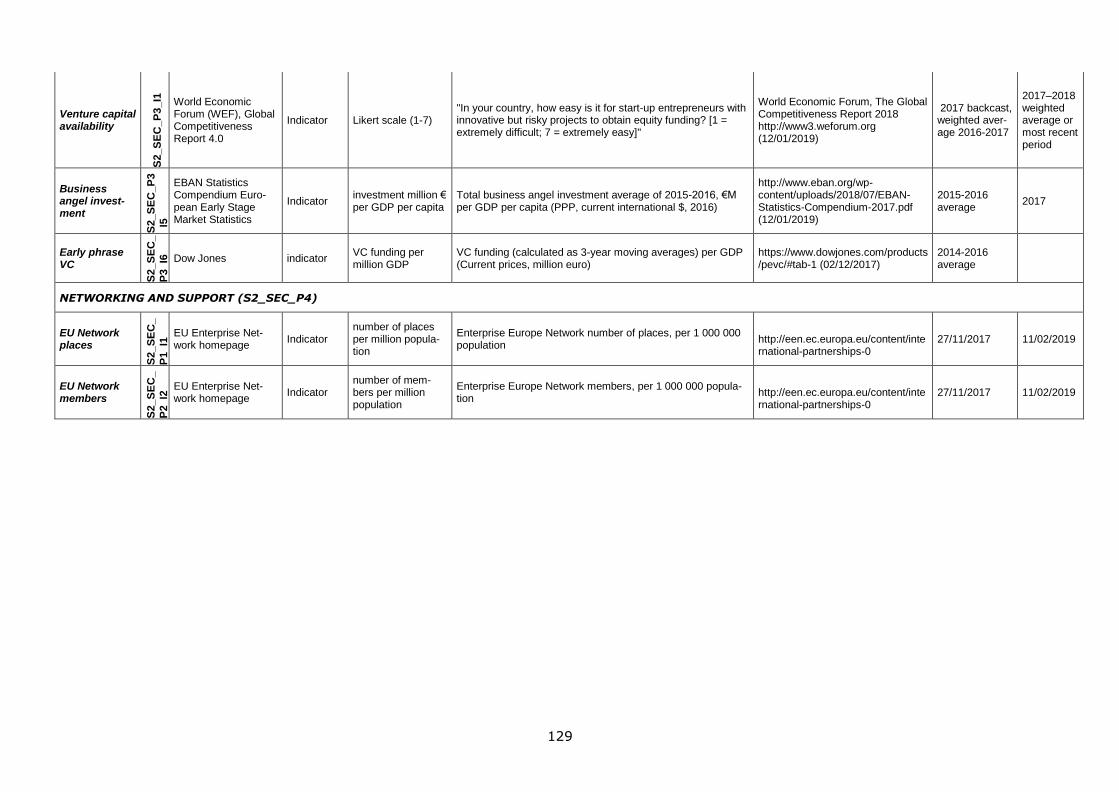
129
Venture capital availability
S2_S
EC
_P
3_I1
World Economic Forum (WEF), Global Competitiveness Report 4.0
Indicator Likert scale (1-7) "In your country, how easy is it for start-up entrepreneurs with innovative but risky projects to obtain equity funding? [1 = extremely difficult; 7 = extremely easy]"
World Economic Forum, The Global Competitiveness Report 2018 http://www3.weforum.org (12/01/2019)
2017 backcast, weighted aver-age 2016-2017
2017–2018 weighted average or most recent period
Business angel invest-ment
S2_S
EC
_P
3
_I5
EBAN Statistics Compendium Euro-pean Early Stage Market Statistics
Indicator investment million € per GDP per capita
Total business angel investment average of 2015-2016, €M per GDP per capita (PPP, current international $, 2016)
http://www.eban.org/wp-content/uploads/2018/07/EBAN-Statistics-Compendium-2017.pdf (12/01/2019)
2015-2016 average
2017
Early phrase VC
S2_S
EC
_
P3_I6
Dow Jones indicator VC funding per million GDP
VC funding (calculated as 3-year moving averages) per GDP (Current prices, million euro)
https://www.dowjones.com/products/pevc/#tab-1 (02/12/2017)
2014-2016 average
NETWORKING AND SUPPORT (S2_SEC_P4)
EU Network places
S2_S
EC
_
P1_I1
EU Enterprise Net-work homepage
Indicator number of places per million popula-tion
Enterprise Europe Network number of places, per 1 000 000 population
http://een.ec.europa.eu/content/international-partnerships-0
27/11/2017 11/02/2019
EU Network members
S2_S
EC
_
P2_I2
EU Enterprise Net-work homepage
Indicator number of mem-bers per million population
Enterprise Europe Network members, per 1 000 000 popula-tion
http://een.ec.europa.eu/content/international-partnerships-0
27/11/2017 11/02/2019
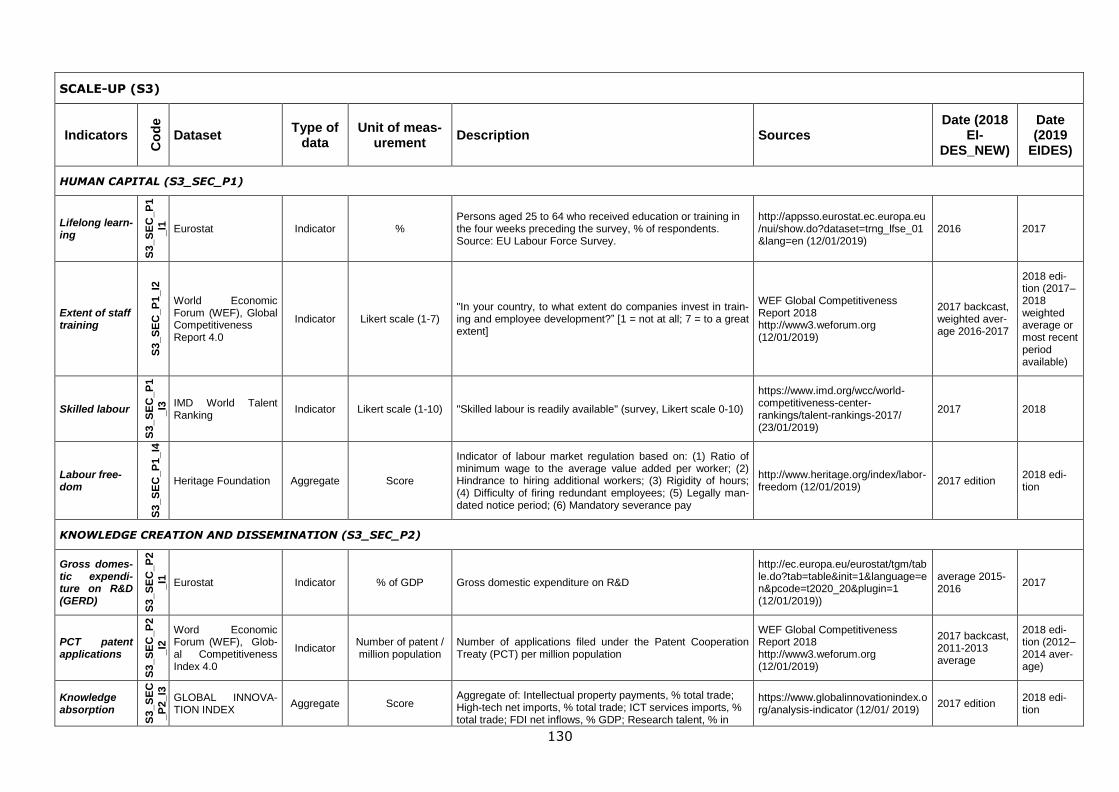
130
SCALE-UP (S3)
Indicators
Co
de
Dataset Type of
data Unit of meas-
urement Description Sources
Date (2018 EI-
DES_NEW)
Date (2019
EIDES)
HUMAN CAPITAL (S3_SEC_P1)
Lifelong learn-ing
S3_S
EC
_P
1
_I1
Eurostat Indicator % Persons aged 25 to 64 who received education or training in the four weeks preceding the survey, % of respondents. Source: EU Labour Force Survey.
http://appsso.eurostat.ec.europa.eu/nui/show.do?dataset=trng_lfse_01&lang=en (12/01/2019)
2016 2017
Extent of staff training
S3_S
EC
_P
1_I2
World Economic Forum (WEF), Global Competitiveness Report 4.0
Indicator Likert scale (1-7) "In your country, to what extent do companies invest in train-ing and employee development?” [1 = not at all; 7 = to a great extent]
WEF Global Competitiveness Report 2018 http://www3.weforum.org (12/01/2019)
2017 backcast, weighted aver-age 2016-2017
2018 edi-tion (2017–2018 weighted average or most recent period available)
Skilled labour
S3_S
EC
_P
1
_I3
IMD World Talent Ranking
Indicator Likert scale (1-10) "Skilled labour is readily available" (survey, Likert scale 0-10)
https://www.imd.org/wcc/world-competitiveness-center-rankings/talent-rankings-2017/ (23/01/2019)
2017 2018
Labour free-dom
S3_S
EC
_P
1_I4
Heritage Foundation Aggregate Score
Indicator of labour market regulation based on: (1) Ratio of minimum wage to the average value added per worker; (2) Hindrance to hiring additional workers; (3) Rigidity of hours; (4) Difficulty of firing redundant employees; (5) Legally man-dated notice period; (6) Mandatory severance pay
http://www.heritage.org/index/labor-freedom (12/01/2019)
2017 edition 2018 edi-tion
KNOWLEDGE CREATION AND DISSEMINATION (S3_SEC_P2)
Gross domes-tic expendi-ture on R&D (GERD)
S3_S
EC
_P
2
_I1
Eurostat Indicator % of GDP Gross domestic expenditure on R&D
http://ec.europa.eu/eurostat/tgm/table.do?tab=table&init=1&language=en&pcode=t2020_20&plugin=1 (12/01/2019))
average 2015-2016
2017
PCT patent applications
S3_S
EC
_P
2
_I2
Word Economic Forum (WEF), Glob-al Competitiveness Index 4.0
Indicator Number of patent / million population
Number of applications filed under the Patent Cooperation Treaty (PCT) per million population
WEF Global Competitiveness Report 2018 http://www3.weforum.org (12/01/2019)
2017 backcast, 2011-2013 average
2018 edi-tion (2012–2014 aver-age)
Knowledge absorption
S3_S
EC
_P
2_I3
GLOBAL INNOVA-TION INDEX
Aggregate Score Aggregate of: Intellectual property payments, % total trade; High-tech net imports, % total trade; ICT services imports, % total trade; FDI net inflows, % GDP; Research talent, % in
https://www.globalinnovationindex.org/analysis-indicator (12/01/ 2019)
2017 edition 2018 edi-tion
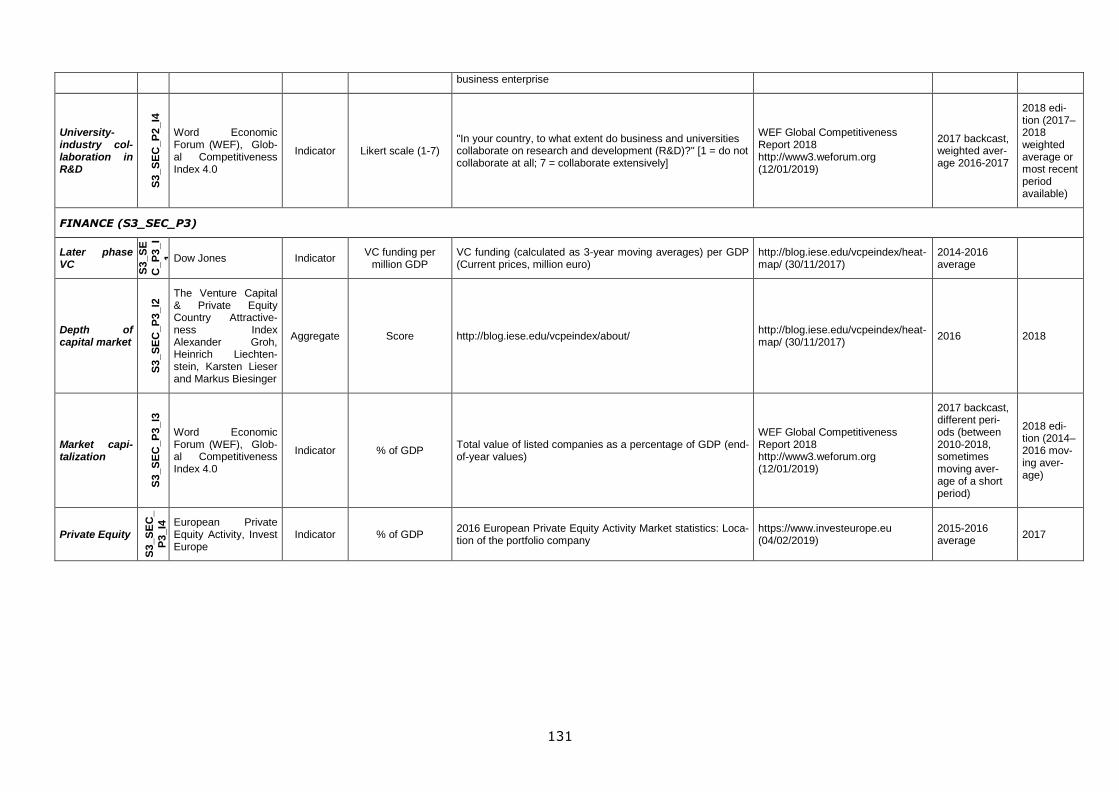
131
business enterprise
University-industry col-laboration in R&D
S3_S
EC
_P
2_I4
Word Economic Forum (WEF), Glob-al Competitiveness Index 4.0
Indicator Likert scale (1-7) "In your country, to what extent do business and universities collaborate on research and development (R&D)?" [1 = do not collaborate at all; 7 = collaborate extensively]
WEF Global Competitiveness Report 2018 http://www3.weforum.org (12/01/2019)
2017 backcast, weighted aver-age 2016-2017
2018 edi-tion (2017–2018 weighted average or most recent period available)
FINANCE (S3_SEC_P3)
Later phase VC
S3_S
E
C_P
3_I
1
Dow Jones Indicator VC funding per
million GDP VC funding (calculated as 3-year moving averages) per GDP (Current prices, million euro)
http://blog.iese.edu/vcpeindex/heat-map/ (30/11/2017)
2014-2016 average
Depth of capital market
S3_S
EC
_P
3_I2
The Venture Capital & Private Equity Country Attractive-ness Index Alexander Groh, Heinrich Liechten-stein, Karsten Lieser and Markus Biesinger
Aggregate Score http://blog.iese.edu/vcpeindex/about/ http://blog.iese.edu/vcpeindex/heat-map/ (30/11/2017)
2016 2018
Market capi-talization
S3_S
EC
_P
3_I3
Word Economic Forum (WEF), Glob-al Competitiveness Index 4.0
Indicator % of GDP Total value of listed companies as a percentage of GDP (end-of-year values)
WEF Global Competitiveness Report 2018 http://www3.weforum.org (12/01/2019)
2017 backcast, different peri-ods (between 2010-2018, sometimes moving aver-age of a short period)
2018 edi-tion (2014–2016 mov-ing aver-age)
Private Equity
S3_S
EC
_
P3_I4
European Private Equity Activity, Invest Europe
Indicator % of GDP 2016 European Private Equity Activity Market statistics: Loca-tion of the portfolio company
https://www.investeurope.eu (04/02/2019)
2015-2016 average
2017
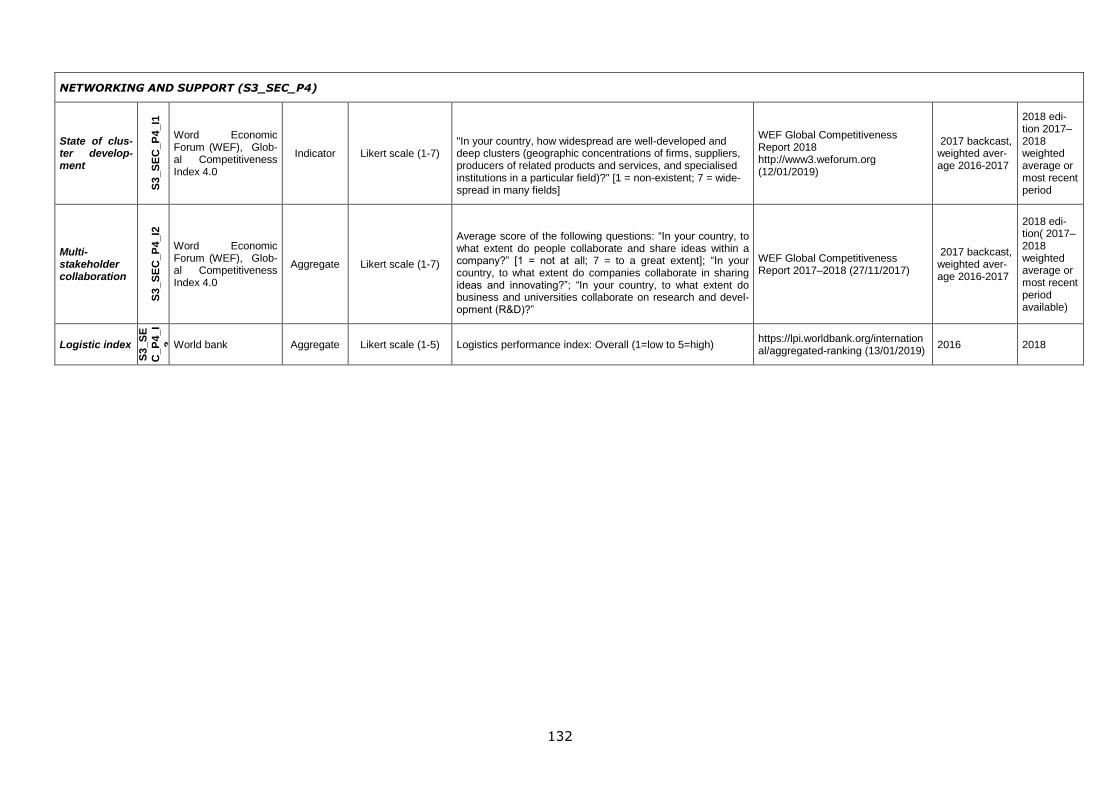
132
NETWORKING AND SUPPORT (S3_SEC_P4)
State of clus-ter develop-ment
S3_S
EC
_P
4_I1
Word Economic Forum (WEF), Glob-al Competitiveness Index 4.0
Indicator Likert scale (1-7) "In your country, how widespread are well-developed and deep clusters (geographic concentrations of firms, suppliers, producers of related products and services, and specialised institutions in a particular field)?" [1 = non-existent; 7 = wide-spread in many fields]
WEF Global Competitiveness Report 2018 http://www3.weforum.org (12/01/2019)
2017 backcast, weighted aver-age 2016-2017
2018 edi-tion 2017–2018 weighted average or most recent period
Multi-stakeholder collaboration
S3_S
EC
_P
4_I2
Word Economic Forum (WEF), Glob-al Competitiveness Index 4.0
Aggregate Likert scale (1-7)
Average score of the following questions: “In your country, to what extent do people collaborate and share ideas within a company?” [1 = not at all; 7 = to a great extent]; “In your country, to what extent do companies collaborate in sharing ideas and innovating?”; “In your country, to what extent do business and universities collaborate on research and devel-opment (R&D)?”
WEF Global Competitiveness Report 2017–2018 (27/11/2017)
2017 backcast, weighted aver-age 2016-2017
2018 edi-tion( 2017–2018 weighted average or most recent period available)
Logistic index
S3_S
E
C_P
4_I
3
World bank Aggregate Likert scale (1-5) Logistics performance index: Overall (1=low to 5=high) https://lpi.worldbank.org/international/aggregated-ranking (13/01/2019)
2016 2018
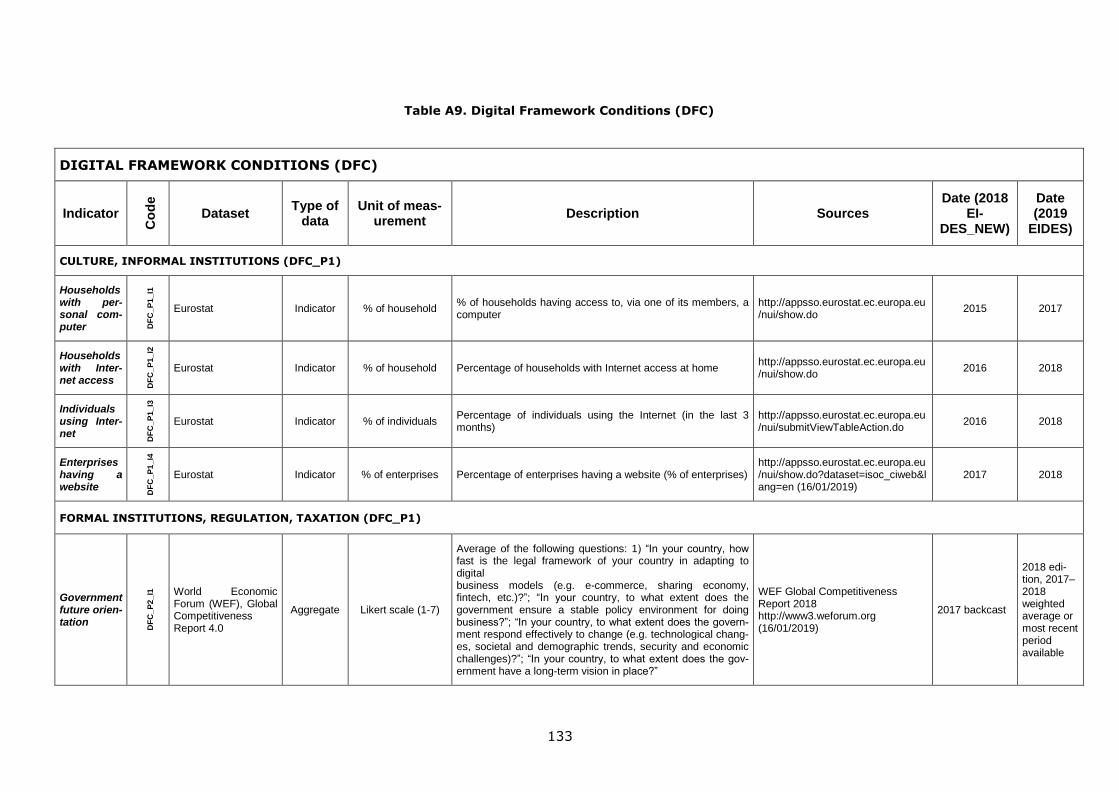
133
Table A9. Digital Framework Conditions (DFC)
DIGITAL FRAMEWORK CONDITIONS (DFC)
Indicator
Co
de
Dataset Type of
data Unit of meas-
urement Description Sources
Date (2018 EI-
DES_NEW)
Date (2019
EIDES)
CULTURE, INFORMAL INSTITUTIONS (DFC_P1)
Households with per-sonal com-puter D
FC
_P
1_
I1
Eurostat Indicator % of household % of households having access to, via one of its members, a computer
http://appsso.eurostat.ec.europa.eu/nui/show.do
2015 2017
Households with Inter-net access
DF
C_P
1_
I2
Eurostat Indicator % of household Percentage of households with Internet access at home http://appsso.eurostat.ec.europa.eu/nui/show.do
2016 2018
Individuals using Inter-net
DF
C_P
1_
I3
Eurostat Indicator % of individuals Percentage of individuals using the Internet (in the last 3 months)
http://appsso.eurostat.ec.europa.eu/nui/submitViewTableAction.do
2016 2018
Enterprises having a website
DF
C_P
1_
I4
Eurostat Indicator % of enterprises Percentage of enterprises having a website (% of enterprises) http://appsso.eurostat.ec.europa.eu/nui/show.do?dataset=isoc_ciweb&lang=en (16/01/2019)
2017 2018
FORMAL INSTITUTIONS, REGULATION, TAXATION (DFC_P1)
Government future orien-tation
DF
C_P
2_
I1
World Economic Forum (WEF), Global Competitiveness Report 4.0
Aggregate Likert scale (1-7)
Average of the following questions: 1) “In your country, how fast is the legal framework of your country in adapting to digital business models (e.g. e-commerce, sharing economy, fintech, etc.)?”; “In your country, to what extent does the government ensure a stable policy environment for doing business?”; “In your country, to what extent does the govern-ment respond effectively to change (e.g. technological chang-es, societal and demographic trends, security and economic challenges)?”; “In your country, to what extent does the gov-ernment have a long-term vision in place?”
WEF Global Competitiveness Report 2018 http://www3.weforum.org (16/01/2019)
2017 backcast
2018 edi-tion, 2017–2018 weighted average or most recent period available
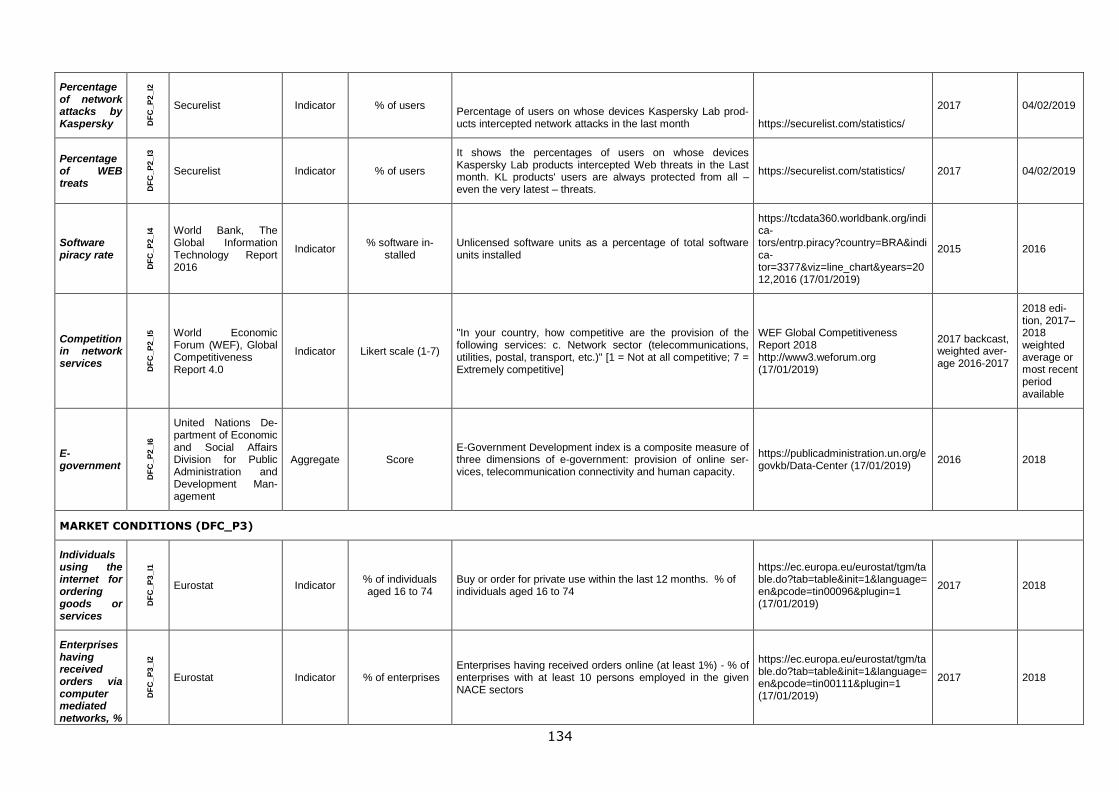
134
Percentage of network attacks by Kaspersky D
FC
_P
2_
I2
Securelist Indicator % of users Percentage of users on whose devices Kaspersky Lab prod-ucts intercepted network attacks in the last month https://securelist.com/statistics/
2017 04/02/2019
Percentage of WEB treats
DF
C_P
2_
I3
Securelist Indicator % of users
It shows the percentages of users on whose devices Kaspersky Lab products intercepted Web threats in the Last month. KL products' users are always protected from all – even the very latest – threats.
https://securelist.com/statistics/ 2017 04/02/2019
Software piracy rate
DF
C_P
2_
I4
World Bank, The Global Information Technology Report 2016
Indicator % software in-
stalled Unlicensed software units as a percentage of total software units installed
https://tcdata360.worldbank.org/indica-tors/entrp.piracy?country=BRA&indica-tor=3377&viz=line_chart&years=2012,2016 (17/01/2019)
2015 2016
Competition in network services
DF
C_P
2_
I5
World Economic Forum (WEF), Global Competitiveness Report 4.0
Indicator Likert scale (1-7)
"In your country, how competitive are the provision of the following services: c. Network sector (telecommunications, utilities, postal, transport, etc.)" [1 = Not at all competitive; 7 = Extremely competitive]
WEF Global Competitiveness Report 2018 http://www3.weforum.org (17/01/2019)
2017 backcast, weighted aver-age 2016-2017
2018 edi-tion, 2017–2018 weighted average or most recent period available
E-government
DF
C_P
2_
I6
United Nations De-partment of Economic and Social Affairs Division for Public Administration and Development Man-agement
Aggregate Score E-Government Development index is a composite measure of three dimensions of e-government: provision of online ser-vices, telecommunication connectivity and human capacity.
https://publicadministration.un.org/egovkb/Data-Center (17/01/2019)
2016 2018
MARKET CONDITIONS (DFC_P3)
Individuals using the internet for ordering goods or services
DF
C_P
3_
I1
Eurostat Indicator % of individuals aged 16 to 74
Buy or order for private use within the last 12 months. % of individuals aged 16 to 74
https://ec.europa.eu/eurostat/tgm/table.do?tab=table&init=1&language=en&pcode=tin00096&plugin=1 (17/01/2019)
2017 2018
Enterprises having received orders via computer mediated networks, %
DF
C_P
3_
I2
Eurostat Indicator % of enterprises Enterprises having received orders online (at least 1%) - % of enterprises with at least 10 persons employed in the given NACE sectors
https://ec.europa.eu/eurostat/tgm/table.do?tab=table&init=1&language=en&pcode=tin00111&plugin=1 (17/01/2019)
2017 2018
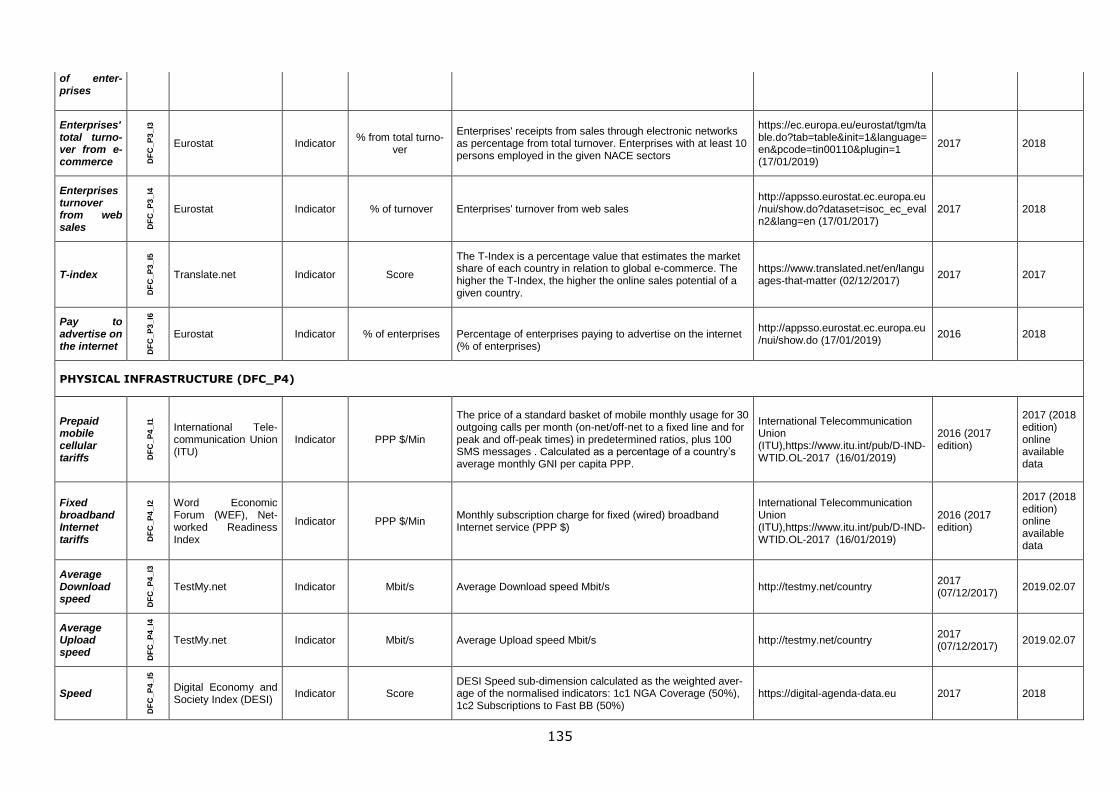
135
of enter-prises
Enterprises' total turno-ver from e-commerce D
FC
_P
3_
I3
Eurostat Indicator % from total turno-
ver
Enterprises' receipts from sales through electronic networks as percentage from total turnover. Enterprises with at least 10 persons employed in the given NACE sectors
https://ec.europa.eu/eurostat/tgm/table.do?tab=table&init=1&language=en&pcode=tin00110&plugin=1 (17/01/2019)
2017 2018
Enterprises turnover from web sales D
FC
_P
3_
I4
Eurostat Indicator % of turnover Enterprises' turnover from web sales http://appsso.eurostat.ec.europa.eu/nui/show.do?dataset=isoc_ec_evaln2&lang=en (17/01/2017)
2017 2018
T-index
DF
C_P
3_
I5
Translate.net Indicator Score
The T-Index is a percentage value that estimates the market share of each country in relation to global e-commerce. The higher the T-Index, the higher the online sales potential of a given country.
https://www.translated.net/en/languages-that-matter (02/12/2017)
2017 2017
Pay to advertise on the internet
DF
C_P
3_
I6
Eurostat Indicator % of enterprises Percentage of enterprises paying to advertise on the internet (% of enterprises)
http://appsso.eurostat.ec.europa.eu/nui/show.do (17/01/2019)
2016 2018
PHYSICAL INFRASTRUCTURE (DFC_P4)
Prepaid mobile cellular tariffs D
FC
_P
4_
I1
International Tele-communication Union (ITU)
Indicator PPP $/Min
The price of a standard basket of mobile monthly usage for 30 outgoing calls per month (on-net/off-net to a fixed line and for peak and off-peak times) in predetermined ratios, plus 100 SMS messages . Calculated as a percentage of a country’s average monthly GNI per capita PPP.
International Telecommunication Union (ITU),https://www.itu.int/pub/D-IND-WTID.OL-2017 (16/01/2019)
2016 (2017 edition)
2017 (2018 edition) online available data
Fixed broadband Internet tariffs D
FC
_P
4_
I2
Word Economic Forum (WEF), Net-worked Readiness Index
Indicator PPP $/Min Monthly subscription charge for fixed (wired) broadband Internet service (PPP $)
International Telecommunication Union (ITU),https://www.itu.int/pub/D-IND-WTID.OL-2017 (16/01/2019)
2016 (2017 edition)
2017 (2018 edition) online available data
Average Download speed
DF
C_P
4_
I3
TestMy.net Indicator Mbit/s Average Download speed Mbit/s http://testmy.net/country
2017 (07/12/2017)
2019.02.07
Average Upload speed
DF
C_P
4_
I4
TestMy.net Indicator Mbit/s Average Upload speed Mbit/s http://testmy.net/country 2017 (07/12/2017)
2019.02.07
Speed
DF
C_P
4_
I5
Digital Economy and Society Index (DESI)
Indicator Score DESI Speed sub-dimension calculated as the weighted aver-age of the normalised indicators: 1c1 NGA Coverage (50%), 1c2 Subscriptions to Fast BB (50%)
https://digital-agenda-data.eu 2017 2018
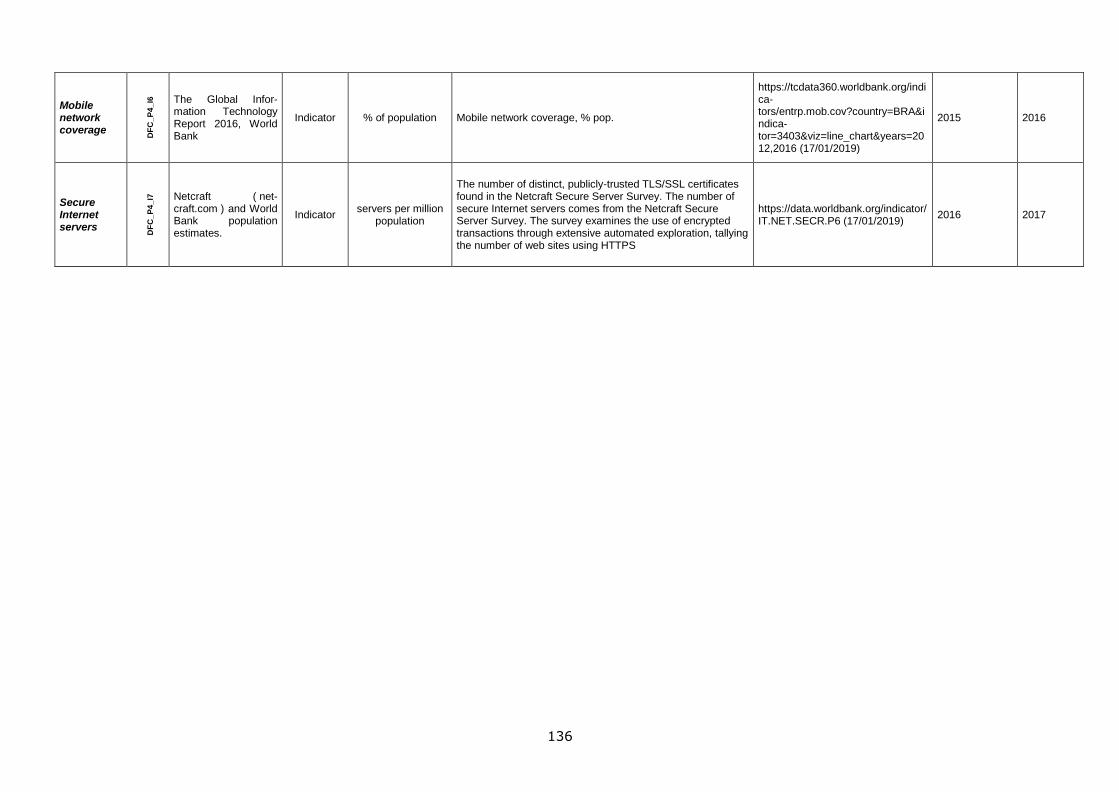
136
Mobile network coverage
DF
C_P
4_
I6
The Global Infor-mation Technology Report 2016, World Bank
Indicator % of population Mobile network coverage, % pop.
https://tcdata360.worldbank.org/indica-tors/entrp.mob.cov?country=BRA&indica-tor=3403&viz=line_chart&years=2012,2016 (17/01/2019)
2015 2016
Secure Internet servers
DF
C_P
4_
I7
Netcraft ( net-craft.com ) and World Bank population estimates.
Indicator servers per million
population
The number of distinct, publicly-trusted TLS/SSL certificates found in the Netcraft Secure Server Survey. The number of secure Internet servers comes from the Netcraft Secure Server Survey. The survey examines the use of encrypted transactions through extensive automated exploration, tallying the number of web sites using HTTPS
https://data.worldbank.org/indicator/IT.NET.SECR.P6 (17/01/2019)
2016 2017
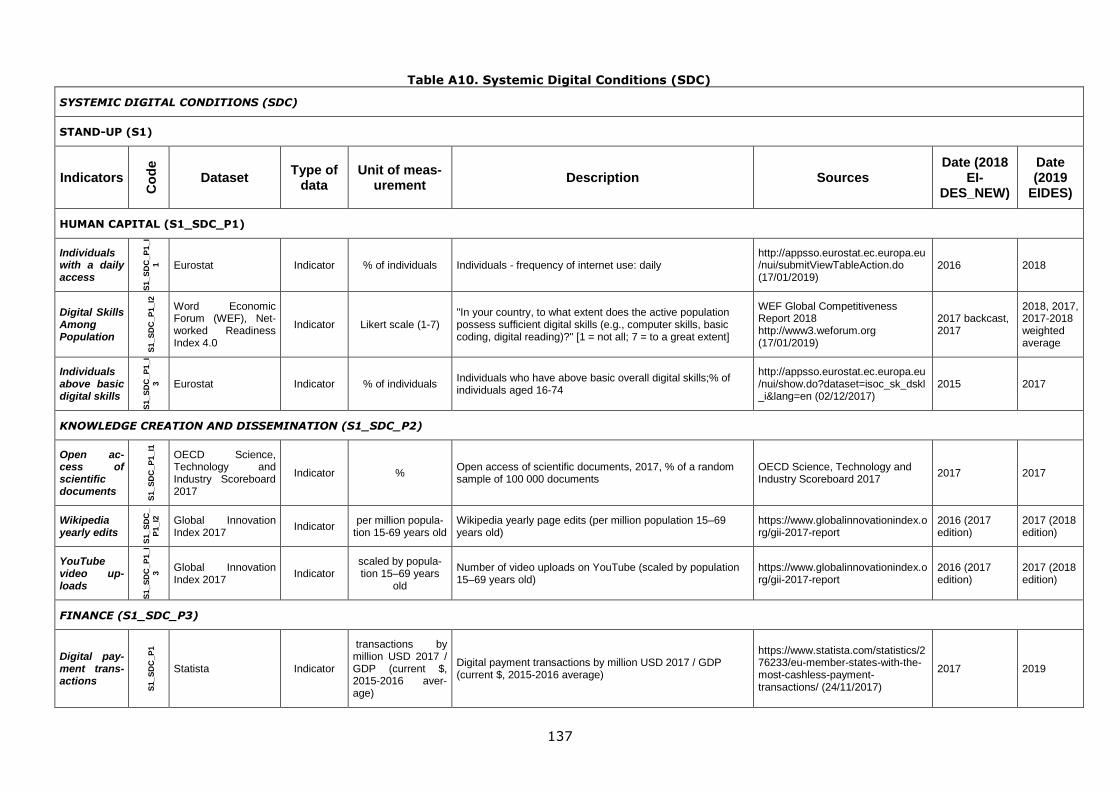
137
Table A10. Systemic Digital Conditions (SDC)
SYSTEMIC DIGITAL CONDITIONS (SDC)
STAND-UP (S1)
Indicators
Co
de
Dataset Type of
data Unit of meas-
urement Description Sources
Date (2018 EI-
DES_NEW)
Date (2019
EIDES)
HUMAN CAPITAL (S1_SDC_P1)
Individuals with a daily access
S1
_S
DC
_P
1_
I
1
Eurostat Indicator % of individuals Individuals - frequency of internet use: daily http://appsso.eurostat.ec.europa.eu/nui/submitViewTableAction.do (17/01/2019)
2016 2018
Digital Skills Among Population
S1
_S
DC
_P
1_
I2
Word Economic Forum (WEF), Net-worked Readiness Index 4.0
Indicator Likert scale (1-7) "In your country, to what extent does the active population possess sufficient digital skills (e.g., computer skills, basic coding, digital reading)?" [1 = not all; 7 = to a great extent]
WEF Global Competitiveness Report 2018 http://www3.weforum.org (17/01/2019)
2017 backcast, 2017
2018, 2017, 2017-2018 weighted average
Individuals above basic digital skills
S1
_S
DC
_P
1_
I
3
Eurostat Indicator % of individuals Individuals who have above basic overall digital skills;% of individuals aged 16-74
http://appsso.eurostat.ec.europa.eu/nui/show.do?dataset=isoc_sk_dskl_i&lang=en (02/12/2017)
2015 2017
KNOWLEDGE CREATION AND DISSEMINATION (S1_SDC_P2)
Open ac-cess of scientific documents
S1
_S
DC
_P
1_
I1
OECD Science, Technology and Industry Scoreboard 2017
Indicator % Open access of scientific documents, 2017, % of a random sample of 100 000 documents
OECD Science, Technology and Industry Scoreboard 2017
2017 2017
Wikipedia yearly edits
S1
_S
DC
_
P1
_I2
Global Innovation Index 2017
Indicator per million popula-
tion 15-69 years old Wikipedia yearly page edits (per million population 15–69 years old)
https://www.globalinnovationindex.org/gii-2017-report
2016 (2017 edition)
2017 (2018 edition)
YouTube video up-loads
S1
_S
DC
_P
1_
I
3 Global Innovation
Index 2017 Indicator
scaled by popula-tion 15–69 years
old
Number of video uploads on YouTube (scaled by population 15–69 years old)
https://www.globalinnovationindex.org/gii-2017-report
2016 (2017 edition)
2017 (2018 edition)
FINANCE (S1_SDC_P3)
Digital pay-ment trans-actions
S1
_S
DC
_P
1
Statista Indicator
transactions by million USD 2017 / GDP (current $, 2015-2016 aver-age)
Digital payment transactions by million USD 2017 / GDP (current $, 2015-2016 average)
https://www.statista.com/statistics/276233/eu-member-states-with-the-most-cashless-payment-transactions/ (24/11/2017)
2017 2019

138
Number of cashless payment transactions S
1_
SD
C_
P2
Statista Indicator
transactions, million / GDP (cur-rent $, 2015-2016 average)
Number of cashless payment transactions, million / GDP (current $, 2015-2016 average)
https://www.statista.com/statistics/276233/eu-member-states-with-the-most-cashless-payment-transactions/ (24/11/2017)
2017 2017
Internet banking
S1
_S
DC
_P
3
Eurostat Indicator % of individuals
Percentage of individuals using internet banking (average of 2016-2017 data), internet banking includes electronic trans-actions with a bank for payment etc. or for looking up account information
http://ec.europa.eu/eurostat/tgm/table.do?tab=table&init=1&plugin=1&language=en&pcode=tin00099
average 2016-2017
2018
NETWORKING AND SUPPORT (S1_SDC_P4)
Generic top-level do-mains (gTLDs)
S1
_S
DC
_P
4_
I1
Global Innovation Index 2017
Indicator (per thousand
population 15–69 years old
Generic top-level domains (gTLDs) (per thousand population 15–69 years old)
http://www3.weforum.org/docs/GITR2016/WEF_GITR_Full_Report.pdf (02/12/2017)
2016 (2017 edition)
2017 (2018 edition)
Participating in social networks
S1
_S
DC
_P
4_
I
2
Eurostat Indicator % of individuals aged 16 to 74
Internet use: participating in social networks (creating user profile, posting messages or other contributions to Facebook, twitter, etc.). % of individuals
https://ec.europa.eu/eurostat/tgm/table.do?tab=table&init=1&language=en&pcode=tin00127&plugin=1
2016 2018
Use of virtu-al profes-sional net-works
S1
_S
DC
_P
4_
I3
Global Talent Com-petitiveness Index, 2019
Score LinkedIn users (per 1,000 labour force)
| 2015 LinkedIn users (per 1,000 labour force)
https://www.insead.edu/sites/default/files/assets/dept/globalindices/docs/GTCI-2018-report.pdf (23/01/2019)
2015 (2018 report)
2016 (2019 report)
1.1.1.1.1.1.1
START-UP (S2)
Indicators
Co
de
Dataset Type of
data Unit of meas-
urement Description Sources
Date (2018 EI-
DES_NEW)
Date (2019
EIDES)
HUMAN CAPITAL (S2_SDC_P1)
Employed ICT special-ists
S2
_S
DC
_P
1_
I
1
Eurostat Indicator Employed ICT specialists per
population Employed ICT specialists per population
http://appsso.eurostat.ec.europa.eu/nui/show.do?dataset=isoc_sks_itspt&lang=en (17/01/2019)
2016 2017
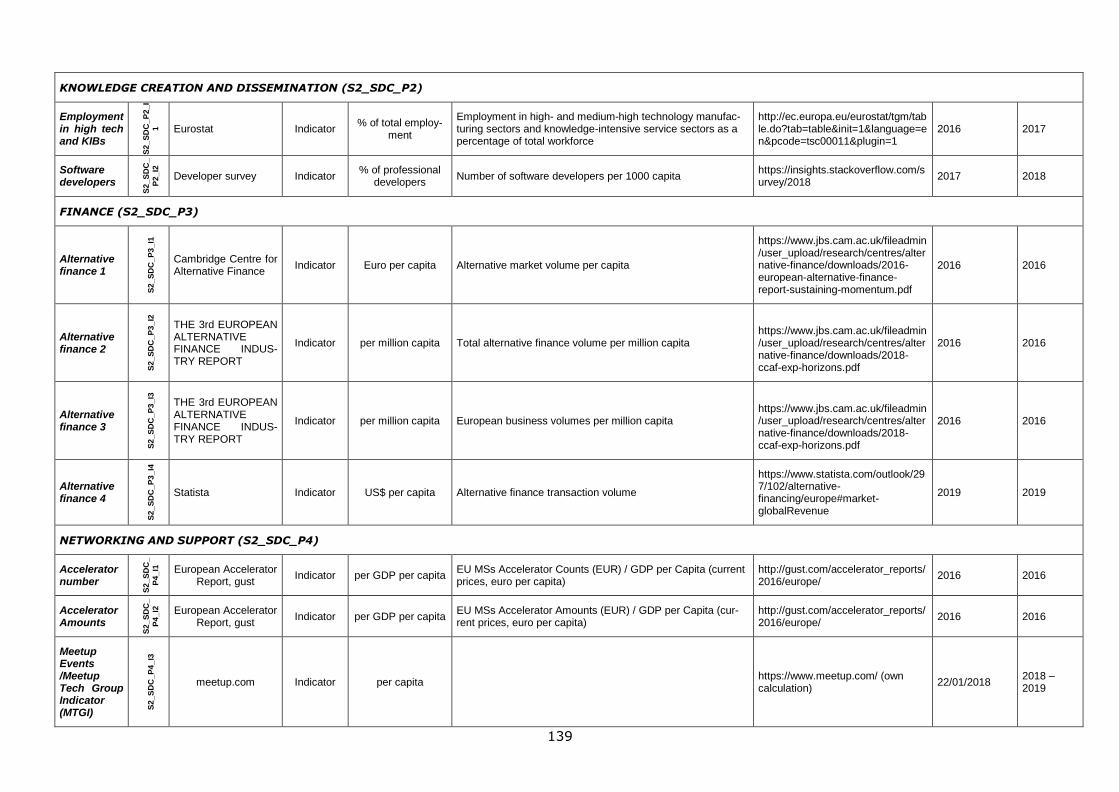
139
KNOWLEDGE CREATION AND DISSEMINATION (S2_SDC_P2)
Employment in high tech and KIBs
S2
_S
DC
_P
2_
I
1
Eurostat Indicator % of total employ-
ment
Employment in high- and medium-high technology manufac-turing sectors and knowledge-intensive service sectors as a percentage of total workforce
http://ec.europa.eu/eurostat/tgm/table.do?tab=table&init=1&language=en&pcode=tsc00011&plugin=1
2016 2017
Software developers
S2
_S
DC
_
P2
_I2
Developer survey Indicator % of professional
developers Number of software developers per 1000 capita
https://insights.stackoverflow.com/survey/2018
2017 2018
FINANCE (S2_SDC_P3)
Alternative finance 1
S2
_S
DC
_P
3_
I1
Cambridge Centre for Alternative Finance
Indicator Euro per capita Alternative market volume per capita
https://www.jbs.cam.ac.uk/fileadmin/user_upload/research/centres/alternative-finance/downloads/2016-european-alternative-finance-report-sustaining-momentum.pdf
2016 2016
Alternative finance 2
S2
_S
DC
_P
3_
I2
THE 3rd EUROPEAN ALTERNATIVE FINANCE INDUS-TRY REPORT
Indicator per million capita Total alternative finance volume per million capita
https://www.jbs.cam.ac.uk/fileadmin/user_upload/research/centres/alternative-finance/downloads/2018-ccaf-exp-horizons.pdf
2016 2016
Alternative finance 3
S2
_S
DC
_P
3_
I3
THE 3rd EUROPEAN ALTERNATIVE FINANCE INDUS-TRY REPORT
Indicator per million capita European business volumes per million capita
https://www.jbs.cam.ac.uk/fileadmin/user_upload/research/centres/alternative-finance/downloads/2018-ccaf-exp-horizons.pdf
2016 2016
Alternative finance 4
S2
_S
DC
_P
3_
I4
Statista Indicator US$ per capita Alternative finance transaction volume
https://www.statista.com/outlook/297/102/alternative-financing/europe#market-globalRevenue
2019 2019
NETWORKING AND SUPPORT (S2_SDC_P4)
Accelerator number
S2
_S
DC
_
P4
_I1
European Accelerator Report, gust
Indicator per GDP per capita EU MSs Accelerator Counts (EUR) / GDP per Capita (current prices, euro per capita)
http://gust.com/accelerator_reports/2016/europe/
2016 2016
Accelerator Amounts
S2
_S
DC
_
P4
_I2
European Accelerator Report, gust
Indicator per GDP per capita EU MSs Accelerator Amounts (EUR) / GDP per Capita (cur-rent prices, euro per capita)
http://gust.com/accelerator_reports/2016/europe/
2016 2016
Meetup Events /Meetup Tech Group Indicator (MTGI)
S2
_S
DC
_P
4_
I3
meetup.com Indicator per capita https://www.meetup.com/ (own calculation)
22/01/2018 2018 – 2019
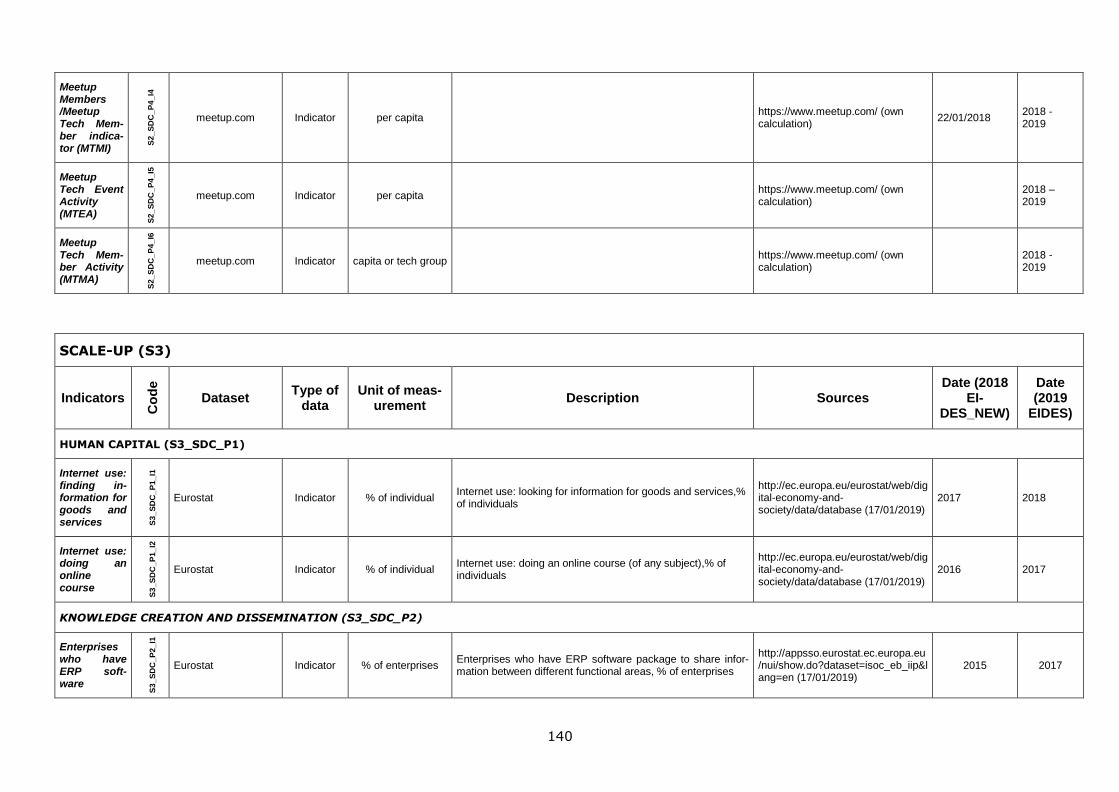
140
Meetup Members /Meetup Tech Mem-ber indica-tor (MTMI)
S2
_S
DC
_P
4_
I4
meetup.com Indicator per capita https://www.meetup.com/ (own calculation)
22/01/2018 2018 - 2019
Meetup Tech Event Activity (MTEA)
S2
_S
DC
_P
4_
I5
meetup.com Indicator per capita https://www.meetup.com/ (own calculation)
2018 – 2019
Meetup Tech Mem-ber Activity (MTMA)
S2
_S
DC
_P
4_
I6
meetup.com Indicator capita or tech group https://www.meetup.com/ (own calculation)
2018 - 2019
SCALE-UP (S3)
Indicators
Co
de
Dataset Type of
data Unit of meas-
urement Description Sources
Date (2018 EI-
DES_NEW)
Date (2019
EIDES)
HUMAN CAPITAL (S3_SDC_P1)
Internet use: finding in-formation for goods and services S
3_
SD
C_
P1
_I1
Eurostat Indicator % of individual Internet use: looking for information for goods and services,% of individuals
http://ec.europa.eu/eurostat/web/digital-economy-and-society/data/database (17/01/2019)
2017 2018
Internet use: doing an online course
S3
_S
DC
_P
1_
I2
Eurostat Indicator % of individual Internet use: doing an online course (of any subject),% of individuals
http://ec.europa.eu/eurostat/web/digital-economy-and-society/data/database (17/01/2019)
2016 2017
KNOWLEDGE CREATION AND DISSEMINATION (S3_SDC_P2)
Enterprises who have ERP soft-ware
S3
_S
DC
_P
2_
I1
Eurostat Indicator % of enterprises Enterprises who have ERP software package to share infor-mation between different functional areas, % of enterprises
http://appsso.eurostat.ec.europa.eu/nui/show.do?dataset=isoc_eb_iip&lang=en (17/01/2019)
2015 2017
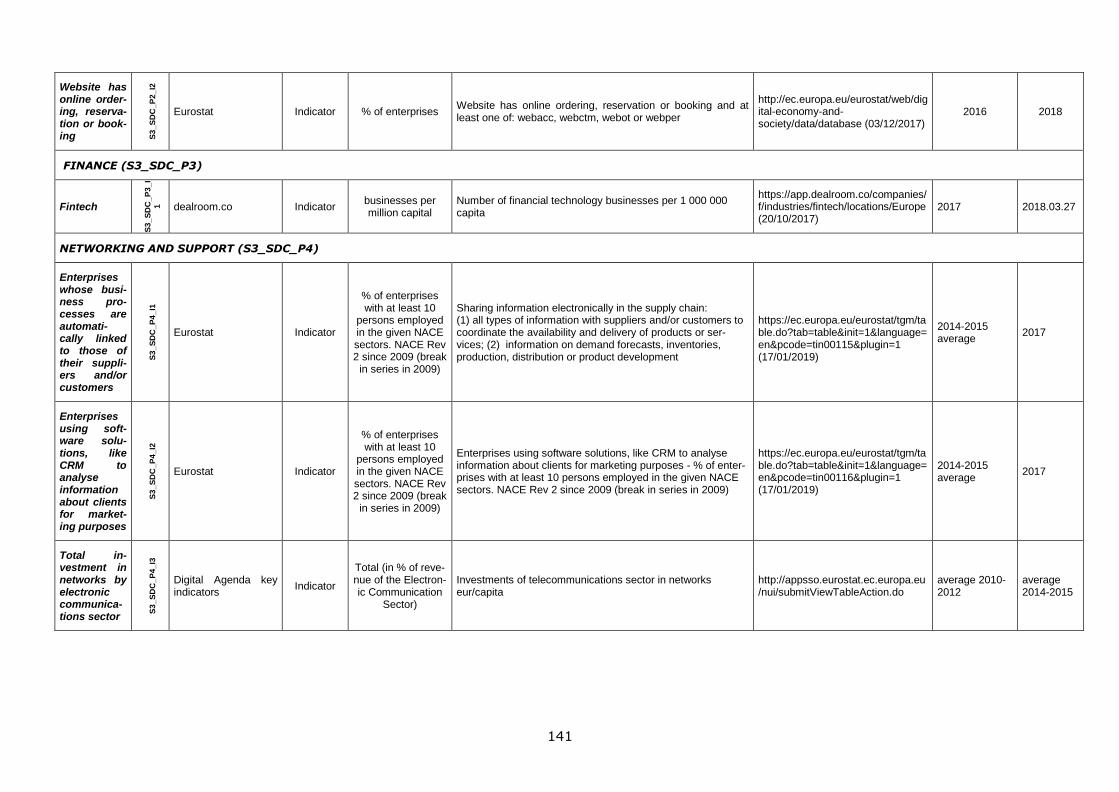
141
Website has online order-ing, reserva-tion or book-ing S
3_
SD
C_
P2
_I2
Eurostat Indicator % of enterprises Website has online ordering, reservation or booking and at least one of: webacc, webctm, webot or webper
http://ec.europa.eu/eurostat/web/digital-economy-and-society/data/database (03/12/2017)
2016 2018
FINANCE (S3_SDC_P3)
Fintech
S3
_S
DC
_P
3_
I
1
dealroom.co Indicator businesses per million capital
Number of financial technology businesses per 1 000 000 capita
https://app.dealroom.co/companies/f/industries/fintech/locations/Europe (20/10/2017)
2017 2018.03.27
NETWORKING AND SUPPORT (S3_SDC_P4)
Enterprises whose busi-ness pro-cesses are automati-cally linked to those of their suppli-ers and/or customers
S3
_S
DC
_P
4_
I1
Eurostat Indicator
% of enterprises with at least 10
persons employed in the given NACE sectors. NACE Rev 2 since 2009 (break
in series in 2009)
Sharing information electronically in the supply chain: (1) all types of information with suppliers and/or customers to coordinate the availability and delivery of products or ser-vices; (2) information on demand forecasts, inventories, production, distribution or product development
https://ec.europa.eu/eurostat/tgm/table.do?tab=table&init=1&language=en&pcode=tin00115&plugin=1 (17/01/2019)
2014-2015 average
2017
Enterprises using soft-ware solu-tions, like CRM to analyse information about clients for market-ing purposes
S3
_S
DC
_P
4_
I2
Eurostat Indicator
% of enterprises with at least 10
persons employed in the given NACE sectors. NACE Rev 2 since 2009 (break
in series in 2009)
Enterprises using software solutions, like CRM to analyse information about clients for marketing purposes - % of enter-prises with at least 10 persons employed in the given NACE sectors. NACE Rev 2 since 2009 (break in series in 2009)
https://ec.europa.eu/eurostat/tgm/table.do?tab=table&init=1&language=en&pcode=tin00116&plugin=1 (17/01/2019)
2014-2015 average
2017
Total in-vestment in networks by electronic communica-tions sector
S3
_S
DC
_P
4_
I3
Digital Agenda key indicators
Indicator
Total (in % of reve-nue of the Electron-ic Communication
Sector)
Investments of telecommunications sector in networks eur/capita
http://appsso.eurostat.ec.europa.eu/nui/submitViewTableAction.do
average 2010-2012
average 2014-2015
GETTING IN TOUCH WITH THE EU
In person
All over the European Union there are hundreds of Europe Direct information centres. You can find the address of the centre nearest you at: http://europea.eu/contact
On the phone or by email
Europe Direct is a service that answers your questions about the European Union. You can contact this service:
- by freephone: 00 800 6 7 8 9 10 11 (certain operators may charge for these calls),
- at the following standard number: +32 22999696, or
- by electronic mail via: http://europa.eu/contact
FINDING INFORMATION ABOUT THE EU
Online
Information about the European Union in all the official languages of the EU is available on the Europa website at: http://europa.eu
EU publications You can download or order free and priced EU publications from EU Bookshop at:
http://bookshop.europa.eu. Multiple copies of free publications may be obtained by contacting Europe
Direct or your local information centre (see http://europa.eu/contact).
KJ-N
A-2
9892-E
N-N
doi:10.2760/107900
ISBN 978-92-76-12269-2
Related Documents


