ENVIRONMENTAL HEALTH PERSPECTIVES This article will be available in its final, 508-conformant form 2–4 months after Advance Publication. If you require assistance accessing this article before then, please contact Dorothy L. Ritter, EHP Web Editor. EHP will provide an accessible version within 3 working days of request. http://www.ehponline.org ehp Early-life Exposure to Organophosphate Pesticides and Pediatric Respiratory Symptoms in the CHAMACOS Cohort Rachel Raanan, Kim G. Harley, John R. Balmes, Asa Bradman, Michael Lipsett, and Brenda Eskenazi http://dx.doi.org/10.1289/ehp.1408235 Received: 5 February 2014 Accepted: 3 November 2014 Advance Publication: 4 November 2014

Welcome message from author
This document is posted to help you gain knowledge. Please leave a comment to let me know what you think about it! Share it to your friends and learn new things together.
Transcript
ENVIRONMENTALHEALTH PERSPECTIVES
This article will be available in its final, 508-conformant form 2–4 months after Advance Publication. If you require assistance accessing this article before then, please contact Dorothy L. Ritter, EHP Web Editor. EHP will provide an accessible version within 3 working days of request.
http://www.ehponline.org
ehpEarly-life Exposure to Organophosphate Pesticides
and Pediatric Respiratory Symptoms in the CHAMACOS Cohort
Rachel Raanan, Kim G. Harley, John R. Balmes, Asa Bradman, Michael Lipsett, and Brenda Eskenazi
http://dx.doi.org/10.1289/ehp.1408235
Received: 5 February 2014Accepted: 3 November 2014
Advance Publication: 4 November 2014
1
Early-life Exposure to Organophosphate Pesticides and Pediatric
Respiratory Symptoms in the CHAMACOS Cohort
Rachel Raanan,1 Kim G. Harley,1 John R. Balmes,2,3 Asa Bradman,1 Michael Lipsett,4 and
Brenda Eskenazi1
1Center for Environmental Research and Children's Health (CERCH), School of Public Health,
University of California, Berkeley, California, USA; 2Division of Environmental Health
Sciences, School of Public Health, University of California, Berkeley, California, USA; 3Divison
of Occupational and Environmental Medicine, University of California, San Francisco,
California, USA; 4California Department of Public Health, Richmond, California, USA
Address correspondence to Rachel Raanan, Center for Environmental Research and Children's
Health (CERCH), UC Berkeley School of Public Health, 1995 University Avenue, Suite 265,
Berkeley, CA, USA 94704. Telephone: (510) 642-9431. E-mail: [email protected]
Running head: OP pesticides and respiratory symptoms in children
Acknowledgments: We thank the CHAMACOS staff, students, community partners, and
participants and families, without whom this study would not be possible. We especially thank
Michelle Vedar, MPH, Robert Gunier, PhD, the CHAMACOS field office staff as well as Nina
Holland, PhD and the staff of the UC Berkeley School of Public Health Biorepository for their
assistance in specimen management and Dana Barr, PhD and her staff at CDC for the
measurements of urinary dialkyl phosphate metabolites. This work was supported by the grants
2P01ES009605 from NIEHS and RD- 82670901, RD-83171001, and RD-83451301 from the
2
U.S. EPA (Eskenazi, PI), and by a post-doctoral fellowship from the Environment and Health
Fund, Jerusalem, Israel. The contents of this article are solely the responsibility of the authors
and do not necessarily represent the official views of the funders.
Competing financial interests: AB has served as a consultant on cases unrelated to the issues
covered in this paper and has participated as a member of the Science Advisory Board for The
Organic Center, a non-profit organization that provides information for scientific research about
organic food and farming. The other authors declare they have no actual or potential competing
financial interests.
3
Abstract
Background: Although pesticide use is widespread, the possible effect of early-life exposure to
organophosphate (OP) on pediatric respiratory health is not well described.
Objectives: We investigated the relationship between early-life exposure to OPs and respiratory
outcomes.
Methods: Participants included 359 mothers and children from the CHAMACOS birth cohort.
Dialkyl phosphate (DAP) metabolites of OP pesticides, specifically diethyl (DE) and dimethyl
(DM) phosphate metabolites, were measured in urine from mothers twice during pregnancy
(mean=13 and 26 weeks gestation) and from children five times during childhood (0.5-5 years).
Childhood DAP concentrations were estimated by the area under curve (AUC). Mothers reported
their child’s respiratory symptoms at ages 5 and 7. We used generalized estimating equations
(GEE) to examine associations of prenatal and childhood DAP concentrations with repeated
measures of respiratory symptoms and exercise-induced coughing at age 5 and 7 years, adjusting
for child’s sex and age, maternal smoking during pregnancy, secondhand tobacco smoke, season
of birth, PM2.5, breastfeeding, mold and cockroaches in home, and distance from highway.
Results: Higher prenatal DAP concentrations, in particular DE, were non-significantly
associated with respiratory symptoms in the previous 12 months at 5 or 7 years of age (aOR per
10-fold increase = 1.44; 95% CI: 0.98, 2.12). This association was strongest with total DAP and
DE from the second half of pregnancy (aOR per 10-fold increase = 1.77; 95% CI: 1.06, 2.95;
1.61; 95% CI: 1.08, 2.39, respectively). Childhood DAP, DE, and DM concentrations were
associated with respiratory symptoms and exercise-induced coughing in the previous 12 months
at age 5 or 7 years (total DAPs: aOR per 10-fold increase = 2.53; 95% CI: 1.32, 4.86; aOR =
5.40; 95% CI: 2.10, 13.91, respectively).

4
Conclusions: Early-life exposure to OP pesticides was associated with respiratory symptoms
consistent with possible asthma in childhood.
5
Introduction
Asthma is the most prevalent pediatric chronic disease (Cruz 2007; Pijnenburg 2012), and is a
leading cause of hospitalization in children (Mellon and Parasuraman 2004) and school
absenteeism due to chronic disease (Mellon and Parasuraman 2004). By 2025, it is estimated that
more than 350 million people globally, mostly children, will have asthma (Cruz 2007; Pawankar
et al. 2011). Early-life exposures to maternal smoking, secondhand tobacco smoke, and various
ambient air pollutants have been linked to respiratory symptoms and disease in childhood (Cruz
2007; Pawankar et al. 2011; Selgrade et al. 2013) and adulthood (Cruz 2007; Stocks and
Sonnappa 2013). The impact of early life exposures on later respiratory health is biologically
plausible: during the first half of gestation bronchi are developing and airways are branching,
during the second half of gestation alveoli begin to develop, and for several years after birth the
lungs continue to mature with rapid increase in number, size, and complexity of the alveoli (De
Luca et al. 2010).
Organophosphate pesticides (OPs) are one of the most commonly used classes of insecticides
worldwide. The US Environmental Protection Agency (EPA) phased out most residential use of
OP pesticides by the mid 2000s. However, in 2007, 15 million kilograms (kg) of OPs— 36% of
total insecticide use— were applied in agriculture in the US (Grube et al. 2011; Guha et al. 2013;
U.S. EPA 2013). Widespread OP exposure to the general US population is supported by the
frequent detection of diakyl phosphates (DAPs), urinary metabolites of OP pesticides, in the US
National Health and Nutrition Examination Survey (NHANES) (Bradman et al. 2005; CDC
2004; CDC 2014).
6
OPs depress acetylcholinesterase (AChE) allowing acetylcholine to build up in neuronal
junctions, including those of the parasympathetic nervous system, which helps modulate control
of the airways (Barnes 1986). In animal studies, the OPs, chlorpyrifos, parathion, and diazinon,
induced airway hyperreactivity at doses below those causing AChE inhibition (Fryer et al. 2004;
Lein and Fryer 2005; Ndlovu et al. 2011; Proskocil et al. 2013). OP exposure has been associated
with respiratory symptoms in adults in occupational settings (Hoppin et al. 2006; Kwak et al.
2009; Ndlovu et al. 2011) and in case studies of children following pesticide poisonings (Cavari
et al. 2013); however, there have been few investigations of respiratory symptoms following
low-level exposure. One nested case-control study (Salam et al. 2004) reported an association
between maternal report of exposure to pesticides and herbicides in the first year of life and
asthma before age five. A cross-sectional study of Lebanese children aged five to 16 years
(Salameh et al. 2003) reported an association between parental report of para-occupational and
residential exposure to pesticides and respiratory symptoms. As noted by others (Kwak et al.
2009; Ndlovu et al. 2011), these studies were based on reported exposure to pesticides and no
studies of children’s respiratory health have included biological measures of exposure.
Here, we investigate associations between maternally-reported respiratory symptoms consistent
with possible asthma and pre- and postnatal exposure to OPs, as measured by DAP metabolite
concentrations in urine samples collected from pregnant women and their children from an
agricultural community in California. We previously reported an association between maternal
work in agriculture and increased levels of Th2 cytokines in these children at age 2 years, which
likely play a key role in the pathophysiology of allergic diseases, including childhood asthma
(Duramad et al. 2006).
7
Methods
Study setting and design
The Center for the Health Assessment of Mothers and Children of Salinas (CHAMACOS) study
is a longitudinal birth cohort investigating the effects of in utero and postnatal environmental
exposures on growth, neurodevelopment, and respiratory disease in residents of the Salinas
Valley, California (Eskenazi et al. 2007). Approximately 235,000 kg of OP pesticides were
applied in this agricultural valley during the years of enrollment (CDPR 2001). Detailed methods
have been described elsewhere (Eskenazi et al. 2007). In brief, pregnant women were screened
for eligibility between October 1999 and 2000 at community clinics primarily serving
farmworker families. Women were eligible for enrollment if they were ≥18 years old, <20 weeks
gestation, Spanish- or English-speaking, eligible for low-income health insurance, receiving
prenatal care, and planning to deliver at the local county hospital. Research protocols were
approved by the University of California, Berkeley, Committee for the Protection of Human
Subjects. Written informed consent was obtained from the mothers and verbal assent was
obtained from the children at age 7 years.
A total of 601 pregnant women were enrolled in the CHAMACOS cohort. Of these, 526
delivered live-born surviving singletons. We assessed respiratory symptomatology for 344 of
these children at age five and 347 at age seven, with 327 assessed at both time points and 364
children assessed at least once. A total of 359 mothers of the 364 children had a urinary DAP
measurement during their pregnancy.
8
Maternal interviews and respiratory symptom assessment
Information on respiratory symptoms and relevant covariates was obtained by maternal
interviews and home visits. Mothers were interviewed twice during pregnancy (mean ±
SD=13.5±4.8 and 26.4±2.4 weeks gestation), after delivery, and when children were 0.5, one,
two, three and a half, five, and seven years old. Urine samples were collected at each prenatal
visit and at each child visit, except at age seven, and stored at -80˚C. Homes were inspected by
trained personnel when the children were six and 12 months old. Additional data from prenatal
and delivery records were abstracted by a registered nurse.
For the present study, we used maternal report of the child’s respiratory symptoms when the
child was five and seven years. Mothers were asked questions based on the International Study
of Asthma and Allergies in Childhood (ISAAC) questionnaire (Asher et al. 1995; Stellman et al.
2013; Holguin et al. 2007; Kraai et al. 2013). Additionally, mothers were asked whether the child
had been prescribed any medication for asthma or wheezing/whistling, or tightness in the chest.
We defined respiratory symptoms as a binary outcome based on a positive response to any of the
following during the previous 12 months: (1) wheezing or whistling in the chest; (2) wheezing,
whistling, or shortness of breath so severe that the child could not finish saying a sentence; (3)
trouble going to sleep or being awakened from sleep because of wheezing, whistling, shortness
of breath, or coughing that was not associated with a cold; or (4) having to stop running or
playing active games because of wheezing, whistling, shortness of breath, or coughing that was
not associated with a cold. In addition, a child was included as having respiratory symptoms if
the mother reported use of asthma controller or rescue medications, even in the absence of the
above symptoms. We also analyzed separately the binary outcome of maternal report of the child
9
having to stop running or playing active games due to coughing that was not associated with a
cold in the previous 12 months (i.e., exercise-induced coughing). Exercise-induced coughing was
included under the respiratory symptoms variable— all children with exercise-induced coughing
were also classified as having respiratory symptoms. Children that were not categorized as
positive for exercise-induced coughing but had other respiratory symptoms were classified as
non-cases for these analyses and were not excluded from the analyses. Exercise-induced
coughing was analyzed separately without including coughing that was associated with sleep
(either trouble going to sleep or being awakened from sleep) because coughing associated with
sleep issues may be related to health conditions other than asthma. We did not analyze wheezing
separately because of the relatively small percentage of mothers that reported on wheezing.
OP pesticide exposure: DAP metabolites
Six non-specific DAP metabolites – three dimethyl phosphate (DM) and three diethyl phosphate
(DE) metabolites – were measured in urine samples collected from mothers twice during
pregnancy and from children at 0.5, one, two, three and a half, and five years of age. Analyses
were conducted by the Division of Laboratory Science at the Centers for Disease Control and
Prevention using gas chromatography-tandem mass spectrometry and quantified using isotope
dilution calibration (Bravo et al. 2002). Detailed methods of urine sample collection and analysis
are described elsewhere (Bradman et al. 2005). To account for urine dilution, we measured
specific gravity using a hand-held refractometer (National Instrument Company Inc., Baltimore,
MD) and measured creatinine concentration using a commercially available diagnostic assay
(Vitros CREA slides; Ortho Clinical Diagnostics, Raritan, NJ). The individual DAP metabolites
were summed on a molar basis to yield total DAPs, as well as total DE and DM metabolites
10
(Bradman et al. 2005). These metabolites are biomarkers for about 80% of OP pesticides used in
the Salinas Valley (CDC 2009). In 2001, the most commonly used OPs in the Salinas Valley that
metabolized to DEs were diazinon (60,571 kgs) and chlorpyrifos (24,923 kgs) and to DMs were
malathion (43,781 kgs) and oxydemeton methyl (26,244 kgs) (CDPR 2001).
Data analysis
We examined the relationship of DEs, DMs and total DAP concentrations (nmoles/L) from
maternal urine collected during the first and second halves of pregnancy (0-20, 21-40 weeks
gestation), and the average of the two pregnancy samples. For childhood metabolite
concentrations, we used the area under the curve (AUC) from the five measurements made
during childhood to summarize DAP concentrations over time during childhood. We calculated
the time-weighted average concentration for each time interval by multiplying the time between
measurements in years by the average of the two measured concentrations. The AUC was
calculated by summing the time-weighted averages from each time interval using the trapezoidal
method. We excluded from the AUC calculation 86 children who were missing DAP
measurements at either six months or five years or missing more than one measurement from the
other three time points. For children with a single missing DAP measurement at one, two, or
three and a half years (n=65) of age, we derived the time-weighted average for the interval
defined by time points with available data by calculating the mean of the two closest measures.
A total of 270 children had a childhood AUC calculation and data on the relevant covariates. We
also performed a sensitivity analysis of the association between respiratory symptoms during the
previous year reported at 5 or 7 years of age and a summary of childhood OP exposures based on
measured values through 3.5 years of age only. In this analysis we excluded the concurrent five-
11
year value to ensure that the DAP measurements preceded the respiratory symptoms and
exercise-induced coughing outcomes. DAP concentrations in maternal samples were corrected
for urinary dilution using urine specific gravity, and child DAP samples were corrected for
urinary dilution by dividing by urinary creatinine concentration. The variables for total
concentrations of DEs, DMs and total DAPs were log10 transformed.
We used Generalized Estimation Equation (GEE) models (Hubbard et al. 2010; Zeger and Liang
1986) to estimate the longitudinal associations of prenatal and early childhood DAPs on
respiratory symptoms in children at five and seven years of age, while accounting for within-
subject correlation of repeated measures of respiratory symptoms that were assessed at five and
seven years of age (Hubbard et al. 2010; Zeger and Liang 1986). The repeated measures of
respiratory symptoms were assessed at five and seven years of age and were defined as positive
if they were categorized as such at age five, or seven, or both. The same definition was done for
exercise-induced coughing.
Covariates were selected based on directed acyclic graphs (DAGs) and included in models if
associated with respiratory symptoms in bivariate analysis (p<0.25). Final adjusted models
controlled for child's sex, maternal smoking during pregnancy (yes/no), exposure to secondhand
tobacco smoke in the first year of life (yes/no), season of birth (wet/pollen/dry/ mold), mean
daily particulate matter concentrations with aerodynamic diameter ≤2.5 µm (PM2.5) during first 3
months of life, breast feeding duration (months), signs of moderate or extensive mold noted at
either home visit (six and 12 months), home located ≤150m from a highway in first year of life
(based on GIS), and signs of cockroaches noted at home visit (six and 12 months). We also
controlled for the child’s age in months. Season of birth corresponds generally, but not exactly,
12
to mold = fall, wet = winter, pollen = spring, dry = summer. Discrete seasons of high spore and
pollen concentrations were determined by ambient aeroallergen concentrations that were
measured throughout the birth periods of the participants. Detailed methods for the
differentiation of the four seasons have been described elsewhere (Harley et al. 2009). Average
PM2.5 concentration in the first 3 months of life was calculated using data from the Monterey
Unified Air Pollution Control District (MBAPCD) air monitoring station, which uses high-
volume Sierra-Andersen gravimetric samplers for 24 hours every sixth day (Thermo Scientific,
Waltham, MA). We conducted sensitivity analyses to verify the robustness and consistency of
our findings. Models were re-run without adjusting for specific gravity (maternal DAPs) or urine
creatinine (child DAPs). Additional models were run controlling for both prenatal DAP levels
(we analyzed average and first and second halves of pregnancy measurements separately) and
DAP concentrations measured during childhood (calculated by the AUC) in the same model.
Potential selection bias due to exclusion from final models of children with missing outcome
data or missing covariates was addressed by comparing our results to GEE models that included
stabilized inverse probability weights (Hernan et al. 2004). Weights were determined using
multiple logistic regression with independent demographic variables selected based on a “Super
Learner” algorithm using V-fold cross-validation (van der Laan et al. 2007). Estimates for both
weighted and unweighted regression models yielded similar results (data not shown), suggesting
that selection bias did not substantially modify our results.
We analyzed the data using SPSS (version 20.0; IBM Corp., Somers, NY) for bivariate analyses,
Stata (version IC11.2; StataCorp, College Station, TX) for GEE models, and R (v.2.14.2; R
13
Foundation for Statistical Computing, Vienna, Austria) for Super Learner models. We set
statistical significance at p < 0.05 for all analyses.
Results
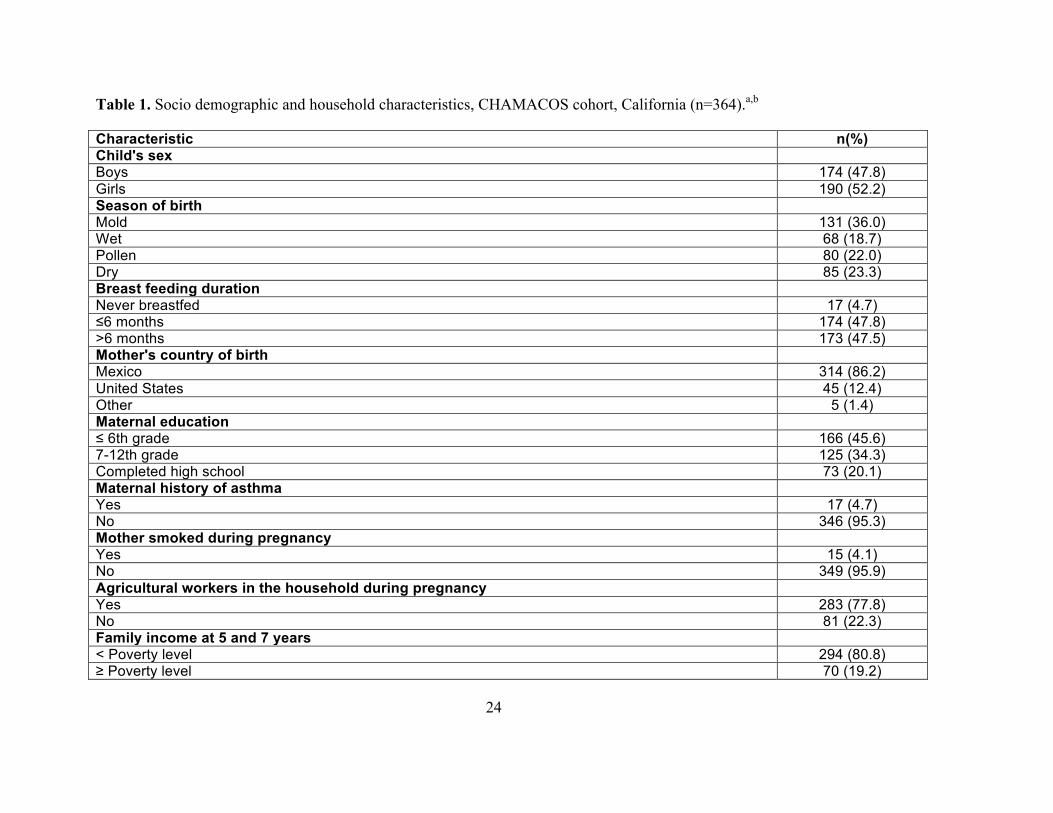
Characteristics of the CHAMACOS cohort are shown in Table 1. The cohort subjects were
primarily born of mothers who were from Mexico, had less than a high school education, and
lived in families with income at or below the federal poverty level. A total of 78% of pregnant
mothers and about 70% of 5 and 7-year olds lived in a household with at least one farm worker.
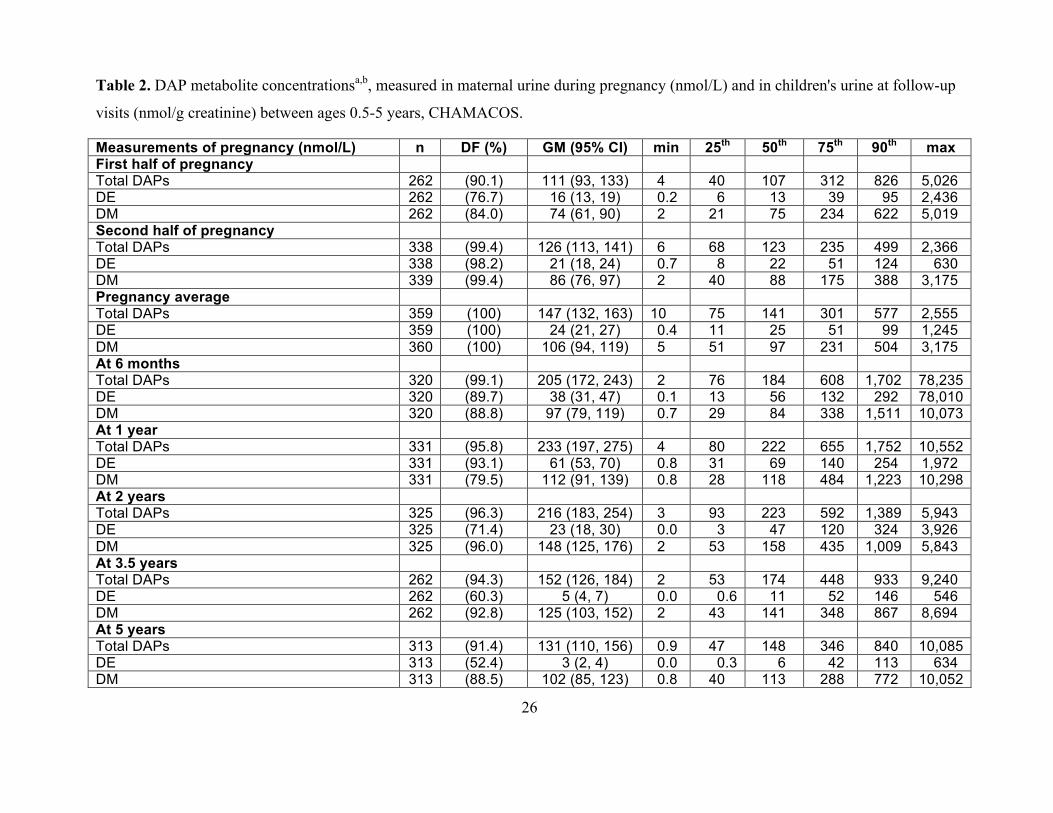
The geometric mean (GM) of total DAP, DE, and DM specific gravity-adjusted concentrations
during pregnancy were 147, 24, and 106 nmol/L, respectively (see Table 2). Child creatinine-
adjusted total DAP concentrations decreased with age, averaging 205, 233, 216, 152, and 131
nmol/g-cr at 0.5, one, two, three and a half, and five years of age, respectively (Table 2). The
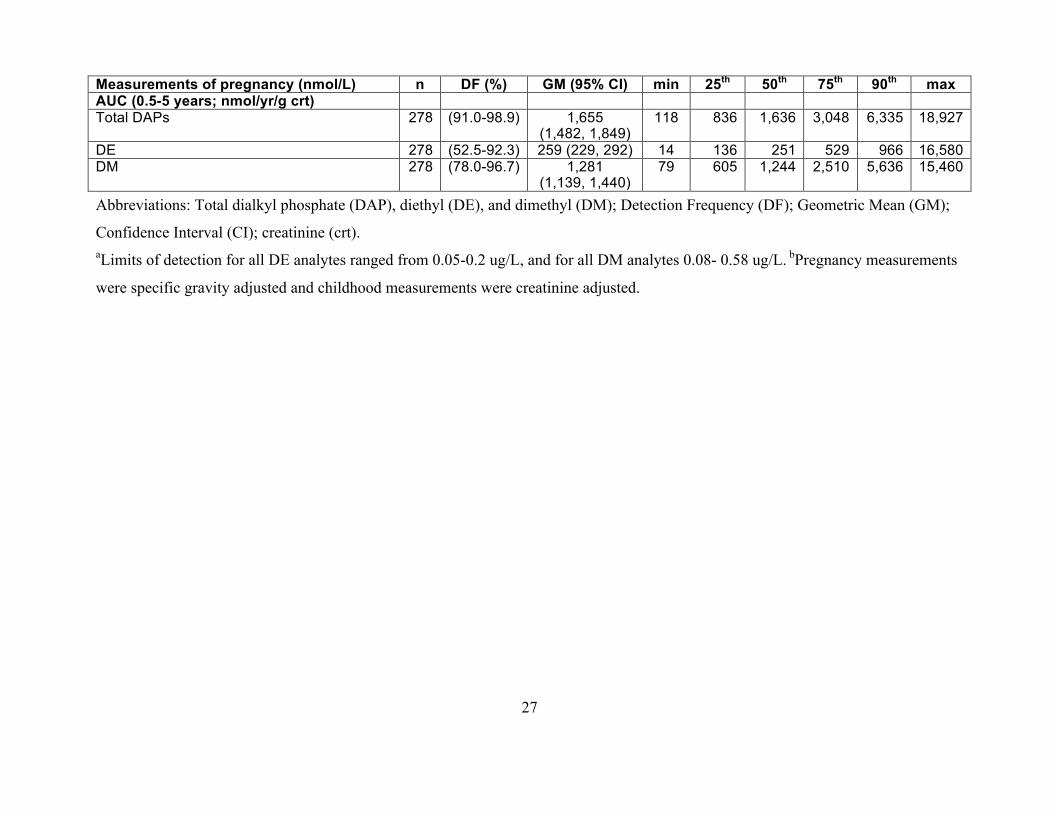
geometric mean (GM) of total DAP, DE, and DM creatinine-adjusted concentrations during
childhood as measured by the AUC were 1,655, 259, and 1,281 nmol/year/gram creatinine
(Table 2). Maternal DAP metabolites were not correlated with childhood measurements (total
DAPs: r=-0.01 to 0.01, p=0.84 to 0.95; DEs: r=-0.07 to -0.01, p=0.25 to 0.93; DMs: r=0.00 to
0.02, p=0.7 to 0.97). A total of 25.9% and 16.1% of five- and seven-year-olds, respectively were
reported to have respiratory symptoms or to be taking controller or rescue medication during the
previous 12 months (see Supplemental Material, Table S1). A total of 11.1% and 3.8% of five-
and seven-year-olds, respectively were reported to have to stop running or playing active games
because of coughing that was not associated with a cold during the previous 12 months (i.e.,
exercise-induced coughing) (see Supplemental Material, Table S1).
14
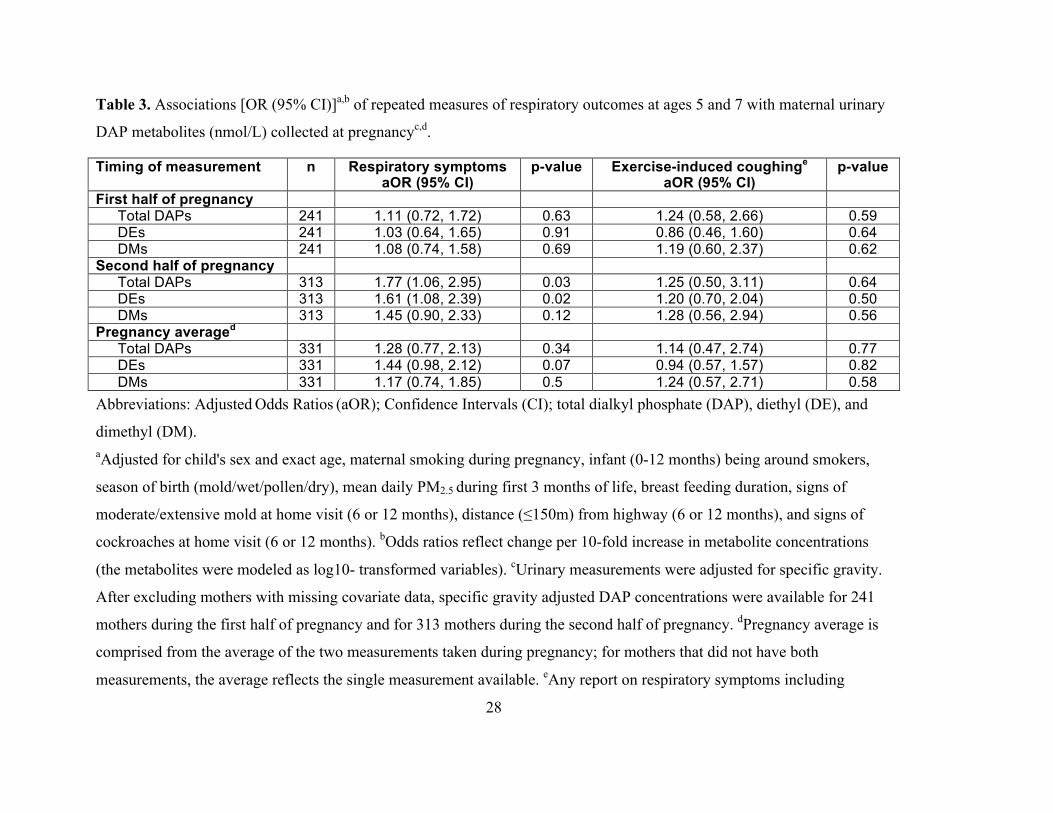
Total average DAPs and DM urinary concentrations during pregnancy were not significantly
associated with reported respiratory symptoms assessed at five and seven years (Table 3).
However, higher prenatal DE concentrations were non-significantly associated with increased
odds of respiratory symptoms (adjusted odds ratio (aOR) for a 10-fold increase in concentration
= 1.44; 95% CI: 0.98, 2.12, p=0.07). Prenatal total DAPs, DE, and DM concentrations were not
significantly associated with exercise-induced coughing. Examining timing of exposure, we
found no associations with DAP concentrations in the first half of pregnancy but significantly
increased odds of respiratory symptoms in the children with total DAPs and DE metabolites from
the second half of pregnancy (aOR for a 10-fold increase in concentration = 1.77; 95% CI: 1.06,
2.95, p=0.03; aOR = 1.61; 95% CI: 1.08, 2.39, p=0.02, respectively) (Table 3). DM metabolites
from the second half of pregnancy were not significantly associated with respiratory symptoms.
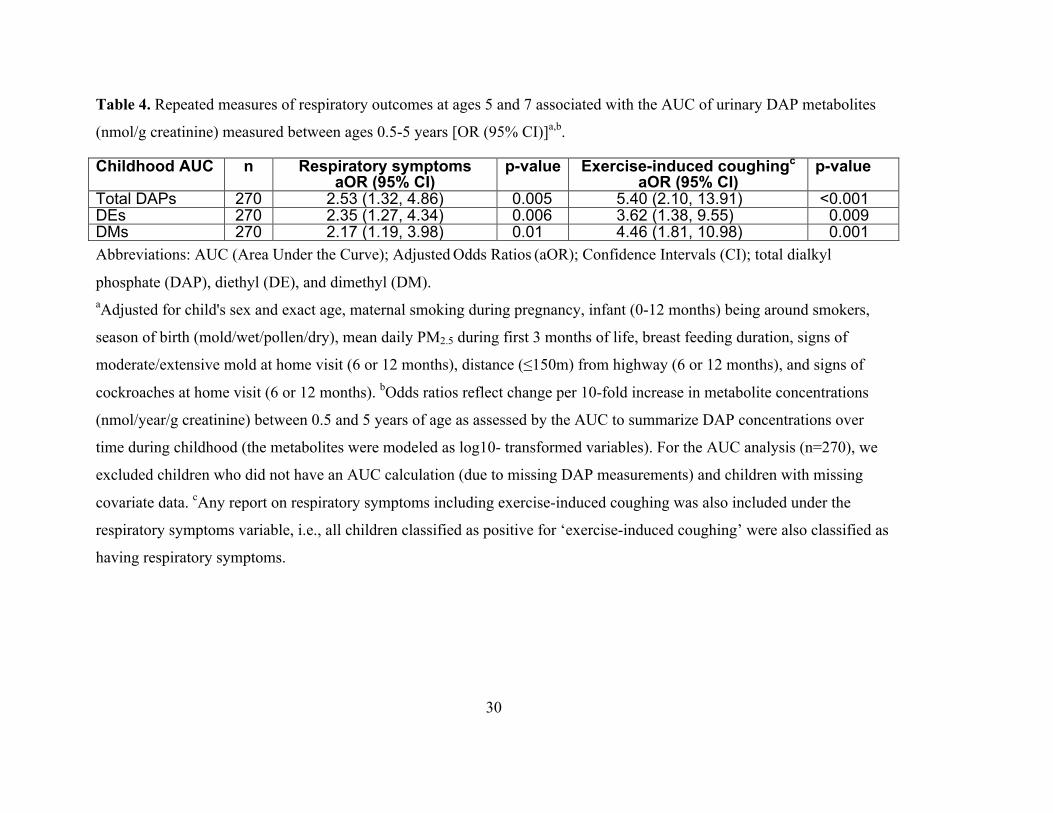
The concentrations of total DAPs, DEs, and DMs measured in child urine collected between the
ages of six months and five years (AUC) were significantly associated with both reported
respiratory symptoms and exercise-induced coughing at five and seven years of age (total DAPs,
aOR for a 10-fold increase in concentration = 2.53; 95% CI: 1.32, 4.86, p=0.005 for symptoms;
aOR = 5.40; 95% CI: 2.10, 13.91, p<0.001, for coughing) (Table 4). Similar results were
obtained when the AUC-based estimate of childhood exposure was derived for metabolite
concentrations through 3.5 years of age only (see Supplemental Material, Table S2).
Similar results were obtained when we did not adjust maternal DAP concentrations for specific
gravity or child AUC levels for creatinine and when the models included both prenatal and child
AUC measures in the same model (data not shown).
15
Discussion
To our knowledge, the present study is the first prospective investigation of the relationship of
prenatal and postnatal OP exposure and respiratory symptoms in children and the first study to
investigate this relationship using a biomarker of exposure. Our results are consistent with
findings from cross-sectional studies of associations between maternal report of early life
exposure to pesticides and asthma (Salam et al. 2004; Salameh et al. 2003). Our finding that
prenatal exposure to OP pesticides as assessed by DAP metabolites in the second half of
pregnancy and in particular those that devolve to DE metabolites (e.g., chlorpyrifos, diazinon) is
associated with increased odds of reported respiratory symptoms five to seven years later is
biologically plausible. OP pesticides can readily pass through the placenta (Rauh et al. 2006;
Whyatt et al. 2009) and DAP metabolites can be found in amniotic fluid (Bradman et al. 2003).
Furthermore, during the second half of pregnancy the alveoli are forming and surfactant is being
synthesized; lung surfactant dysfunction is known to be related to the pathophysiology of asthma
(Hameed et al. 2013; Wright et al. 2000).
We also found that postnatal exposure to OPs over the course of childhood was associated with
higher odds of reported respiratory symptoms assessed at five and seven years of age. These
findings are consistent with previous results from our cohort, which showed that maternal work
in agriculture during the child’s first year of life was associated with increased levels of Th2
cytokines at age 2 years which are thought to play an important role in the development of
asthma (Duramad et al. 2006).
Use of DAP metabolites as a marker of OP exposure is both a strength and a limitation of our
study. Assessing exposure to specific individual OP pesticides is challenging because there are
16
sensitive and specific assays for only a few parent compounds in blood or pesticide-specific
metabolites in urine, e.g. TCPy for chlorpyrifos. DAPs are non-specific metabolites commonly
used as biomarkers in epidemiological studies; they represent an integrated measure of exposure
to many OPs, reflecting the usual scenario in agricultural communities (Chen et al. 2012;
Sudakin and Stone 2011). However, because OP pesticides can break down into DAPs in the
environment, urinary DAP concentrations may reflect exposure both to the parent pesticide
compounds and to preformed DAPs in food or dust (Lu et al. 2005).
In addition, because exposure to OP pesticides is highly variable, DAP metabolite levels may
fluctuate considerably from day to day. These sources for exposure misclassification are non-
differential and we assume that exposure misclassification resulting in bias towards the null may
have potentially occurred in this study. Bias toward the null has been also previously suggested
for associations between DAP measurements and health effects in children (Bradman et al.
2013). However, we assessed exposure to OP pesticides by measuring DAPs in urines collected
twice during pregnancy and five times throughout early childhood, providing a better estimate of
early life exposure than single measurements.
This study has other strengths, in particular, its longitudinal design and relatively large sample
size. Furthermore, we used the well-established validated ISAAC questionnaire to interview the
mothers about their children’s respiratory symptoms, and we adjusted for many covariates
including exposure to other environmental agents and socioeconomic factors in the first year of
life. Additionally, our study population was relatively homogeneous with regard to cultural and
socioeconomic background, reducing the potential for uncontrolled confounding.
17
Our study was conducted within an agricultural community and, as expected, the prenatal
concentrations of urinary DAP metabolites in women from our study were higher than a
representative US sample of women of reproductive age [NHANES] (Bradman et al. 2005). In
the current CHAMACOS study sample the median of total maternal DAP concentrations among
pregnant women was 127.5 nmol/L. NHANES median DAP levels, also measured between 1999
to- 2000, were 72 nmol/L among pregnant women and 90 nmol/L among non-pregnant women
of childbearing age (Bradman et al. 2005). Still more than a quarter of the NHANES sample had
DAP levels above the median levels measured in our current study, suggesting that the findings
of this study have relevance for non-agricultural populations.
Conclusions
Prevention and control of pediatric chronic respiratory diseases is a global health priority (Cruz
2007; Samoliński et al. 2012) and it has been suggested that prevention should begin before
childbirth (Samoliński et al. 2012). Although indoor use of most OPs was phased out by the US
EPA during the early to mid-2000’s, these pesticides are still widely used in agriculture (Grube
et al. 2011; U.S. EPA 2013). Our findings suggest that early-life exposure to OP pesticides is
associated with respiratory symptoms consistent with a possible diagnosis of asthma among a
population of children of primarily Mexican origin and living in an agricultural community in
California. More research is needed to determine if our findings are generalizable to other study
populations as well as to further assess the possibility of susceptible period(s) and the
mechanisms by which OP exposure may affect respiratory system development. Future studies
on potential early-life exposure to pesticides should consider more objective measures of
respiratory health such as spirometry.
18
References
Asher MI, Keil U, Anderson HR, Beasley R, Crane J, Martinez F, et al. 1995. International Study
of Asthma and Allergies in Childhood (ISAAC): rationale and methods. Eur Respir J
8(3):483–91. DOI: 10.1183/09031936.95.08030483.
Barnes PJ. 1986. Neural control of human airways in health and disease. Am Rev Respir Dis
134(6):1289–314.
Bradman A, Barr DB, Claus Henn BG, Drumheller T, Curry C, Eskenazi B. 2003. Measurement
of pesticides and other toxicants in amniotic fluid as a potential biomarker of prenatal
exposure: a validation study. Environ Health Perspect 111:1779–82. DOI:10.1289/ehp.6259
Bradman A, Eskenazi B, Barr DB, Bravo R, Castorina R, Chevrier J, et al. 2005.
Organophosphate urinary metabolite levels during pregnancy and after delivery in women
living in an agricultural community. Environ Health Perspect 113:1802–7. DOI:
10.1289/ehp.7894
Bradman A, Kogut K, Eisen EA, Jewell NP, Quirós-Alcalá L, Castorina R, et al. 2013.
Variability of Organophosphorous Pesticide Metabolite Levels in Spot and 24-hr Urine
Samples Collected from Young Children during 1 Week. Environ health perspect
121(1):118–24. DOI: 10.1289/ehp.1104808.
Bravo R, Driskell WJ, Whitehead RD, Needham LL, Barr DB. 2002. Quantitation of dialkyl
phosphate metabolites of organophosphate pesticides in human urine using GC-MS-MS
with isotopic internal standards. J Anal Toxicol 26:245–52. DOI: 10.1093/jat/26.5.245
Cavari Y, Lifshitz M, Leibson T, Shorer Z, Rubinstein M, Sofer S. 2013. Severe and uncommon
complications of anticholinesterase intoxication in children. Harefuah 152(7):391–4.
PMID:23957083
CDC (Centers for Disease Control and Prevention). 2004. 2001–2002 National Health and
Nutrition Examination Survey (NHANES). Atlanta, GA: Centers for Disease Control and
Prevention, National Center for Health Statistics. Available:
http://www.cdc.gov/nchs/about/major/nhanes/datalink.htm [accessed 4 February 2014].
19
CDC (Centers for Disease Control and Prevention). 2009. Fourth National Report on Human
Exposure to Environmental Chemicals. Chemical Information. Organophosphorus
Insecticides: Dialkyl Phosphate Metabolites, 2009. Atlanta, GA: Centers for Disease Control
and Prevention, National Center for Health, Division of Laboratory Sciences. Available:
http://www.cdc.gov/exposurereport/pdf/fourthreport.pdf [accessed 4 February 2014].
CDC (Centers for Disease Control and Prevention). 2014. Fourth Report on Human Exposure to
Environmental Chemicals, Updated Tables, (August, 2014). Atlanta, GA: U.S. Department
of Health and Human Services, Centers for Disease Control and Prevention. Available:
http://www.cdc.gov/exposurereport/pdf/fourthreport_updatedtables_aug2014.pdf [accessed
18 September 2014].CDPR (California Department of Pesticide Regulation). 2001.
Summary of Pesticide Use Report Data for 2001. Available:
http://calpip.cdpr.ca.gov/year.cfm [accessed 4 February 2014].
Chen L, Zhao T, Pan C, Ross JH, Krieger RI. 2012. Preformed Biomarkers Including
Dialkylphosphates (DAPs) in Produce May Confound Biomonitoring in Pesticide Exposure
and Risk Assessment. J Agric Food Chem 60(36):9342–51. DOI: 10.1021/jf303116p.
Cruz, AA. 2007. World Health Organization. Global surveillance, prevention and control of
chronic respiratory diseases: a comprehensive approach. Bousquet J, and Khaltaev NG
(Eds.). Available: http://www.who.int/gard/publications/GARD_Manual/en/ [accessed 4
February 2014].
De Luca G, Olivieri F, Melotti G, Aiello G, Lubrano L, Boner AL. 2010. Fetal and early
postnatal life roots of asthma. J Matern Fetal Neonatal Med 23(Suppl 3):80–3. DOI:
10.3109/14767058.2010.509931.
Duramad P, Harley K, Lipsett M, Bradman A, Eskenazi B, Holland N, et al. 2006. Early
Environmental Exposures and Intracellular Th1/Th2 Cytokine Profiles in 24-Month-Old
Children Living in an Agricultural Area. Environ Health Perspect 114(12):1916–22. DOI:
10.1289/ehp.9306
Eskenazi B, Marks AR, Bradman A, Harley K, Barr DB, Johnson C, et al. 2007.
Organophosphate pesticide exposure and neurodevelopment in young Mexican-American
children. Environ Health Perspect 115(5):792–8. DOI: 10.1289/ehp.9828
20
Fryer AD, Lein PJ, Howard AS, Yost BL, Beckles RA, Jett DA. 2004. Mechanisms of
organophosphate insecticide-induced airway hyperreactivity. Am J Physiol Lung Cell Mol
Physiol 286:963–9. DOI: 10.1152/ajplung.00343.2003
Grube A, Donaldson D, Kiely T, Wu L. 2011. Pesticides Industry Sales and Usage: 2006 and
2007 Market Estimates. Environmental Protection Agency, US, Office of Chemical Safety
and Pollution Prevention. Available:
http://www.epa.gov/opp00001/pestsales/07pestsales/market_estimates2007.pdf [accessed 4
February 2014].
Guha N, Ward MH, Gunier R, Colt JS, Lea CS, Buffler PA, et al. 2013. Characterization of
Residential Pesticide Use and Chemical Formulations through Self-Report and Household
Inventory: The Northern California Childhood Leukemia Study. Environ health perspect
121(2):276–82. DOI: 10.1289/ehp.1204926.
Harley KG, Macher JM, Lipsett M, Duramad P, Holland NT, Prager SS, et al. 2009. Fungi and
Pollen Exposure in the First Months of Life and Risk of Early Childhood Wheezing. Thorax,
64(4), 353-58. DOI: 10.1136/thx.2007.090241.Hameed A, Sherkheli MA, Hussain A, Ul-
haq R. 2013. Molecular and Physiological Determinants of Pulmonary Developmental
Biology: a Review. Am J of Biomed Res 1(1):13–24. DOI: 10.12691/ajbr-1-1-3
Hernan MA, Hernandez-Diaz S, Robins JM. 2004. A structural approach to selection bias.
Epidemiology 15(5):615–25. DOI: 10.1097/01.ede.0000135174.63482.43
Hubbard AE, Ahern J, Fleischer NL, Van der Laan M, Lippman S. A, Jewell N, et al. 2010. To
GEE or not to GEE: comparing population average and mixed models for estimating the
associations between neighborhood risk factors and health. Epidemiology 21(4):467–74.
DOI: 10.1097/EDE.0b013e3181caeb90
Holguin F, Flores S, Ross Z, Cortez M, Molina M, Molina L. 2007. Traffic-related exposures,
airway function, inflammation, and respiratory symptoms in children. Am J Respir Crit Care
Med 176(12):1236–42. DOI: 10.1164/rccm.200611-1616OC
Hoppin JA, Umbach DM, London SJ, Lynch CF, Alavanja MCR, Sandler DP. 2006. Pesticides
associated with wheeze among commercial pesticide applicators in the Agricultural Health
Study. Am J Epidemiol 163:1129–37. DOI: 10.1093/aje/kwj138
21
Kraai S, Verhagen LM, Valladares E, Goecke J, Rasquin L, Colmenares P. 2013. High
prevalence of asthma symptoms in Warao Amerindian children in Venezuela is significantly
associated with open-fire cooking: a cross-sectional observational study. Respir Res.
14(1):76. PMCID: PMC3723947 [Epub ahead of print].
Kwak ES, Just A, Whyatt R, Miller RL. 2009. Phthalates, pesticides, and bisphenol-A exposure
and the development of nonoccupational asthma and allergies: how valid are the links? Open
Allergy J 2:45–50. DOI: 10.2174/1874838400902010045
Lein PJ, Fryer AD. 2005. Organophosphorus insecticides induce airway hyperreactivity by
decreasing neuronal M2 muscarinic receptor function independent of acetylcholinesterase
inhibition. Toxicol Sci 83:166–76. DOI: 10.1093/toxsci/kfi001
Lu C, Bravo R, Caltabiano LM, Irish RM, Weerasekera G, Barr DB. 2005. The presence of
dialkylphosphates in fresh fruit juices: implication for organophosphorus pesticide exposure
and risk assessments. J Toxicol Environ Health A 68(3):209–27.
DOI:10.1080/15287390590890554
Mellon M, Parasuraman B. 2004. Pediatric asthma: improving management to reduce cost of
care. J Manag Care Pharm 10(2):130–41. PMID: 15032562
Ndlovu V, Dalvie MA, Jeebhay MF. 2011. Allergies in the workplace. Curr Allergy & Clin
Immunol 24(4):212–7.
Pawankar R, Canonica GW, Holgate ST, Lockey RF. 2011. WAO (World Allergy Organization)
white book on allergy. Milwaukee, WI: World Allergy Organization, 1–216.
http://www.worldallergy.org/UserFiles/file/WAO-White-Book-on-Allergy_web.pdf
[accessed 4 February 2014].
Pijnenburg MW. 2012. Pediatric asthma: where to go?. Eur Respir Rev 21(125):173–4. DOI:
10.1183/09059180.00004012
Proskocil BJ, Bruun DA, Jacoby DB, van Rooijen N, Lein PJ, Fryer, AD. 2013. Macrophage
TNFα mediates parathion-induced airway hyperreactivity in guinea pigs. Am J Physiol Lung
Cell Mol Physiol 304(8):519–29. DOI: 10.1152/ajplung.00381.2012.
Rauh VA, Garfinkel R, Perera FP, Andrews HF, Hoepner L, Barr DB, et al. 2006. Impact of
prenatal chlorpyrifos exposure on neurodevelopment in the first 3 years of life among inner-
city children. Pediatrics 118:1845–59. DOI: 10.1542/peds.2006-0338
22
Salam MT, Li YF, Langholz B, Gilliland FD. 2004. Early-life environmental risk factors for
asthma: findings from the Children’s Health Study. Environ Health Perspect 112:760–5.
PMCID: PMC1241973
Salameh P, Baldi I, Brochard P, Raherison C, Abi S, Salamon R. 2003. Respiratory symptoms in
children and exposure to pesticides. Eur Respir J 22:507–12. DOI:
10.1183/09031936.03.00107403a
Samoliński B, Fronczak A, Włodarczyk A, Bousquet J. 2012. Council of the European Union
conclusions on chronic respiratory diseases in children. Lancet 379(9822):45–6.
doi:10.1016/S0140-6736(12)60514-5
Selgrade MK, Blain RB, Fedak KM, Cawley, MA. 2013. Potential risk of asthma associated with
in utero exposure to xenobiotics. Birth Defects Research Part C: Birth Defects Res C
Embryo Today 99(1):1–13. DOI: 10.1002/bdrc.21028
Stellman SD, Thomas PA, Osahan S, Brackbill RM, Farfel MR. 2013. Respiratory Health of 985
Children Exposed to the World Trade Center Disaster: Report on World Trade Center
Health Registry Wave 2 Follow-up, 2007-2008. J Asthma 50(4):354–63. DOI:
doi:10.3109/02770903.2013.776073
Stocks J, Sonnappa S. 2013. Early life influences on the development of chronic obstructive
pulmonary disease. Ther Adv Respir Dis 7(3):161–73. DOI: 10.1177/1753465813479428.
Sudakin DL, Stone DL. 2011. Dialkyl phosphates as biomarkers of organophosphates: The
current divide between epidemiology and clinical toxicology. Clin Toxicol (Phila)
49(9):771–81. DOI: 10.3109/15563650.2011.624101.
U.S. EPA (U.S. Environmental Protection Agency). 2013. Pesticide registration status for
Organophosphates, 2013. Available
http://www.epa.gov/oppsrrd1/reregistration/status_op.htm [accessed 4 February 2014].
van der Laan MJ, Polley EC, Hubbard AE. Super Learner. UC Berkeley Division of Biostatistics
Working Paper Series, 2007: Working Paper 222. Available:
http://biostats.bepress.com/ucbbiostat/paper22 [accessed 4 February 2014].
Whyatt RM, Garfinkel R, Hoepner LA, Andrews H, Holmes D, Williams MK, et al. 2009. A
biomarker validation study of prenatal chlorpyrifos exposure within an inner-city cohort
during pregnancy. Environ Health Perspect 117:559–67. DOI: 10.1289/ehp.0800041

23
Wright SM, Hockey PM, Enhorning G, Strong, P, Reid KB, Holgate ST, et al. 2000. Altered
airway surfactant phospholipid composition and reduced lung function in asthma. J Appl
Physiol (1985) 89(4):1283–92.
Zeger SL, Liang KY. 1986. Longitudinal data analysis for discrete and continuous outcomes.
Biometrics 42:121–30.
24
Table 1. Socio demographic and household characteristics, CHAMACOS cohort, California (n=364).a,b
Characteristic n(%) Child's sex Boys 174 (47.8) Girls 190 (52.2) Season of birth Mold 131 (36.0) Wet 68 (18.7) Pollen 80 (22.0) Dry 85 (23.3) Breast feeding duration Never breastfed 17 (4.7) ≤6 months 174 (47.8) >6 months 173 (47.5) Mother's country of birth Mexico 314 (86.2) United States 45 (12.4) Other 5 (1.4) Maternal education ≤ 6th grade 166 (45.6) 7-12th grade 125 (34.3) Completed high school 73 (20.1) Maternal history of asthma Yes 17 (4.7) No 346 (95.3) Mother smoked during pregnancy Yes 15 (4.1) No 349 (95.9) Agricultural workers in the household during pregnancy Yes 283 (77.8) No 81 (22.3) Family income at 5 and 7 years < Poverty level 294 (80.8) ≥ Poverty level 70 (19.2)
25
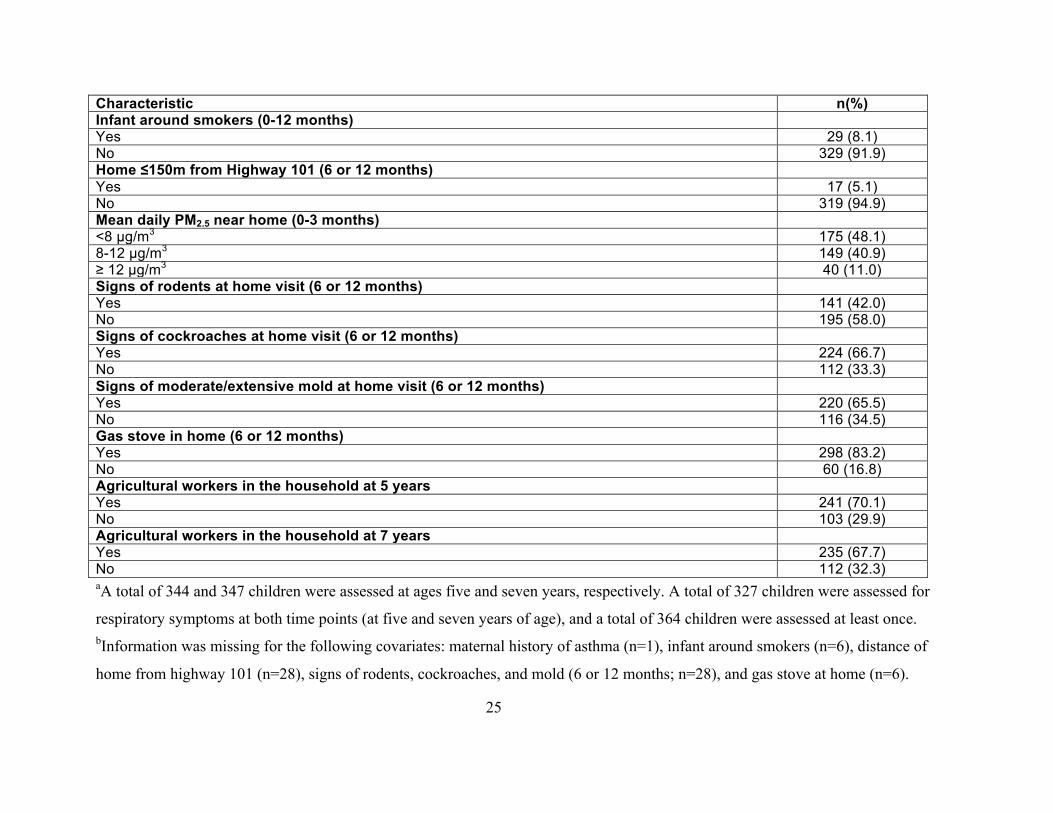
Characteristic n(%) Infant around smokers (0-12 months) Yes 29 (8.1) No 329 (91.9) Home ≤150m from Highway 101 (6 or 12 months) Yes 17 (5.1) No 319 (94.9) Mean daily PM2.5 near home (0-3 months) <8 µg/m3 175 (48.1) 8-12 µg/m3 149 (40.9) ≥ 12 µg/m3 40 (11.0) Signs of rodents at home visit (6 or 12 months) Yes 141 (42.0) No 195 (58.0) Signs of cockroaches at home visit (6 or 12 months) Yes 224 (66.7) No 112 (33.3) Signs of moderate/extensive mold at home visit (6 or 12 months) Yes 220 (65.5) No 116 (34.5) Gas stove in home (6 or 12 months) Yes 298 (83.2) No 60 (16.8) Agricultural workers in the household at 5 years Yes 241 (70.1) No 103 (29.9) Agricultural workers in the household at 7 years Yes 235 (67.7) No 112 (32.3) aA total of 344 and 347 children were assessed at ages five and seven years, respectively. A total of 327 children were assessed for
respiratory symptoms at both time points (at five and seven years of age), and a total of 364 children were assessed at least once. bInformation was missing for the following covariates: maternal history of asthma (n=1), infant around smokers (n=6), distance of
home from highway 101 (n=28), signs of rodents, cockroaches, and mold (6 or 12 months; n=28), and gas stove at home (n=6).
26
Table 2. DAP metabolite concentrationsa,b, measured in maternal urine during pregnancy (nmol/L) and in children's urine at follow-up
visits (nmol/g creatinine) between ages 0.5-5 years, CHAMACOS.
Measurements of pregnancy (nmol/L) n DF (%) GM (95% CI) min 25th 50th 75th 90th max First half of pregnancy Total DAPs 262 (90.1) 111 (93, 133) 4 40 107 312 826 5,026 DE 262 (76.7) 16 (13, 19) 0.2 6 13 39 95 2,436 DM 262 (84.0) 74 (61, 90) 2 21 75 234 622 5,019 Second half of pregnancy Total DAPs 338 (99.4) 126 (113, 141) 6 68 123 235 499 2,366 DE 338 (98.2) 21 (18, 24) 0.7 8 22 51 124 630 DM 339 (99.4) 86 (76, 97) 2 40 88 175 388 3,175 Pregnancy average Total DAPs 359 (100) 147 (132, 163) 10 75 141 301 577 2,555 DE 359 (100) 24 (21, 27) 0.4 11 25 51 99 1,245 DM 360 (100) 106 (94, 119) 5 51 97 231 504 3,175 At 6 months Total DAPs 320 (99.1) 205 (172, 243) 2 76 184 608 1,702 78,235 DE 320 (89.7) 38 (31, 47) 0.1 13 56 132 292 78,010 DM 320 (88.8) 97 (79, 119) 0.7 29 84 338 1,511 10,073 At 1 year Total DAPs 331 (95.8) 233 (197, 275) 4 80 222 655 1,752 10,552 DE 331 (93.1) 61 (53, 70) 0.8 31 69 140 254 1,972 DM 331 (79.5) 112 (91, 139) 0.8 28 118 484 1,223 10,298 At 2 years Total DAPs 325 (96.3) 216 (183, 254) 3 93 223 592 1,389 5,943 DE 325 (71.4) 23 (18, 30) 0.0 3 47 120 324 3,926 DM 325 (96.0) 148 (125, 176) 2 53 158 435 1,009 5,843 At 3.5 years Total DAPs 262 (94.3) 152 (126, 184) 2 53 174 448 933 9,240 DE 262 (60.3) 5 (4, 7) 0.0 0.6 11 52 146 546 DM 262 (92.8) 125 (103, 152) 2 43 141 348 867 8,694 At 5 years Total DAPs 313 (91.4) 131 (110, 156) 0.9 47 148 346 840 10,085 DE 313 (52.4) 3 (2, 4) 0.0 0.3 6 42 113 634 DM 313 (88.5) 102 (85, 123) 0.8 40 113 288 772 10,052
27
Measurements of pregnancy (nmol/L) n DF (%) GM (95% CI) min 25th 50th 75th 90th max AUC (0.5-5 years; nmol/yr/g crt) Total DAPs 278 (91.0-98.9) 1,655
(1,482, 1,849) 118 836 1,636 3,048 6,335 18,927
DE 278 (52.5-92.3) 259 (229, 292) 14 136 251 529 966 16,580 DM 278 (78.0-96.7) 1,281
(1,139, 1,440) 79 605 1,244 2,510 5,636 15,460
Abbreviations: Total dialkyl phosphate (DAP), diethyl (DE), and dimethyl (DM); Detection Frequency (DF); Geometric Mean (GM);
Confidence Interval (CI); creatinine (crt). aLimits of detection for all DE analytes ranged from 0.05-0.2 ug/L, and for all DM analytes 0.08- 0.58 ug/L. bPregnancy measurements
were specific gravity adjusted and childhood measurements were creatinine adjusted.
28
Table 3. Associations [OR (95% CI)]a,b of repeated measures of respiratory outcomes at ages 5 and 7 with maternal urinary
DAP metabolites (nmol/L) collected at pregnancyc,d.
Timing of measurement n Respiratory symptoms aOR (95% CI)
p-value Exercise-induced coughinge aOR (95% CI)
p-value
First half of pregnancy Total DAPs 241 1.11 (0.72, 1.72) 0.63 1.24 (0.58, 2.66) 0.59 DEs 241 1.03 (0.64, 1.65) 0.91 0.86 (0.46, 1.60) 0.64 DMs 241 1.08 (0.74, 1.58) 0.69 1.19 (0.60, 2.37) 0.62 Second half of pregnancy Total DAPs 313 1.77 (1.06, 2.95) 0.03 1.25 (0.50, 3.11) 0.64 DEs 313 1.61 (1.08, 2.39) 0.02 1.20 (0.70, 2.04) 0.50 DMs 313 1.45 (0.90, 2.33) 0.12 1.28 (0.56, 2.94) 0.56 Pregnancy averaged Total DAPs 331 1.28 (0.77, 2.13) 0.34 1.14 (0.47, 2.74) 0.77 DEs 331 1.44 (0.98, 2.12) 0.07 0.94 (0.57, 1.57) 0.82 DMs 331 1.17 (0.74, 1.85) 0.5 1.24 (0.57, 2.71) 0.58 Abbreviations: Adjusted Odds Ratios (aOR); Confidence Intervals (CI); total dialkyl phosphate (DAP), diethyl (DE), and
dimethyl (DM). aAdjusted for child's sex and exact age, maternal smoking during pregnancy, infant (0-12 months) being around smokers,
season of birth (mold/wet/pollen/dry), mean daily PM2.5 during first 3 months of life, breast feeding duration, signs of
moderate/extensive mold at home visit (6 or 12 months), distance (≤150m) from highway (6 or 12 months), and signs of
cockroaches at home visit (6 or 12 months). bOdds ratios reflect change per 10-fold increase in metabolite concentrations
(the metabolites were modeled as log10- transformed variables). cUrinary measurements were adjusted for specific gravity.
After excluding mothers with missing covariate data, specific gravity adjusted DAP concentrations were available for 241
mothers during the first half of pregnancy and for 313 mothers during the second half of pregnancy. dPregnancy average is
comprised from the average of the two measurements taken during pregnancy; for mothers that did not have both
measurements, the average reflects the single measurement available. eAny report on respiratory symptoms including
29
exercise-induced coughing was also included under the respiratory symptoms variable, i.e., all children classified as positive
for ‘exercise-induced coughing’ were also classified as having respiratory symptoms.
30
Table 4. Repeated measures of respiratory outcomes at ages 5 and 7 associated with the AUC of urinary DAP metabolites
(nmol/g creatinine) measured between ages 0.5-5 years [OR (95% CI)]a,b.
Childhood AUC n Respiratory symptoms aOR (95% CI)
p-value Exercise-induced coughingc aOR (95% CI)
p-value
Total DAPs 270 2.53 (1.32, 4.86) 0.005 5.40 (2.10, 13.91) <0.001 DEs 270 2.35 (1.27, 4.34) 0.006 3.62 (1.38, 9.55) 0.009 DMs 270 2.17 (1.19, 3.98) 0.01 4.46 (1.81, 10.98) 0.001 Abbreviations: AUC (Area Under the Curve); Adjusted Odds Ratios (aOR); Confidence Intervals (CI); total dialkyl
phosphate (DAP), diethyl (DE), and dimethyl (DM). aAdjusted for child's sex and exact age, maternal smoking during pregnancy, infant (0-12 months) being around smokers,
season of birth (mold/wet/pollen/dry), mean daily PM2.5 during first 3 months of life, breast feeding duration, signs of
moderate/extensive mold at home visit (6 or 12 months), distance (≤150m) from highway (6 or 12 months), and signs of
cockroaches at home visit (6 or 12 months). bOdds ratios reflect change per 10-fold increase in metabolite concentrations
(nmol/year/g creatinine) between 0.5 and 5 years of age as assessed by the AUC to summarize DAP concentrations over
time during childhood (the metabolites were modeled as log10- transformed variables). For the AUC analysis (n=270), we
excluded children who did not have an AUC calculation (due to missing DAP measurements) and children with missing
covariate data. cAny report on respiratory symptoms including exercise-induced coughing was also included under the
respiratory symptoms variable, i.e., all children classified as positive for ‘exercise-induced coughing’ were also classified as
having respiratory symptoms.
Related Documents