ORIGINAL ARTICLE Egypt. J. Agric. Res., (2020), 98 (4), 613-633 Utilization of antibacterial edible coating and nano-silver to enhance the quality of fresh and dried onion Omar Shahat Younes Food Engineering and Packaging Res. Dept. Food Technology Research Institute, Agricultural Research Center, Giza, Egypt, E-mail: [email protected] (Manuscript received 29 Dec 2020) 10.21608/ejar.2021.67300.1093 ABSTRACT The effect of edible coating on shelf life of fresh and dried onion was studied using different coating materials such as carboxy methyl cellulose (A), alginate (B), starch (C), carboxy methyl cellulose incorporated into nano-silver (D) , alginate incorporated into nano-silver (E), starch incorporated into nano-silver, (F) and nano-silver (G). Chemical analysis included (moisture content, total soluble solids, total sugars, total phenol content, vitamin C), and microbial analysis included (total count of bacteria, fungi and yeasts) were determined. The results indicated that the lowest percentage of weight loss at the end of the storage period was an average of 0.12%, 0.16% for fresh onions (whole - slices) for treatment (D). The lowest percentage weight gain for dried onion was an average of (0.03%) for treatment (D)at the end of the storage period. The fresh onion color value 277 did not change until the end of the storage period for the treatments (D, E, F, G). Also, the color value was constant until the end of the storage period for the dried onion slices under all treatments except for the control treatment where the average color value decreased up to 313. It was noticed that treatment (D) preserved the largest percentage in both total soluble solids, total sugars, total phenols, vitamin C and also pungency until the end of the storage period of fresh and dried onion samples. Lowest value for total bacterial count was an average 1.91 CFU x 10 -2 /g for the treatments (D, E, F, G) this is in the case of fresh onions (whole – slices). Also, these treatments kept dried onion slices without bacterial growth until the end of the storage period. The lowest value for the total count for fungi and yeasts was with a mean 0.97 CFU x 10 -2 / g for the treatments (D, E, F, G) this is in the case of fresh onions (whole - slices) for treatment. Also, these treatments kept dried onion slices without fungi and yeast growth until the end of the storage period. Sensory evaluation of the quality overall acceptability was excellent for all treatments (D, E, F, G). It was observed that the treatments (A, B, C) were average and that the control samples were not acceptable. The moisture content decreased from 86% to 9% during the drying period, which ranged between 4-6.5 hours under the influence of different treatments, while the drying rates in the first stage of the drying process ranged between 0.494 to 0.3196 Kg/ hour under the influence of different treatments, while was lowest specific energy consumption during the drying process is 12.61 Kj / (Kg at treatment (G). The lowest cost of evaporating one kilogram of water during the drying process was 1.71 LE/Kg for treatment (G) and the largest percentage of moisture absorption during rehydration was 56.8% for treatment G. Keywords: edible coating, microbial, drying the onion, nano coating. INTRODUCTION Onions (Allium cepa L.) is one of the oldest vegetable crops grown under the Allium family, they are a major source of flavor in fresh and cooked foods, and they also have great healing values. Onions work as a good medicinal compound for cataracts, cardiovascular diseases and cancer due to its cholesterol-lowering and antioxidants effects (Jurgiel et al.,2015). Egypt's production of onions in 2017 reached 2914,503 tons produced from an area of 200,500 acres. According to the data of the (Food and Agriculture Organization, 2017). New onion varieties of different colors, shapes, scents and flavors are available on the market. At the same time, clients are now more health-oriented and aware of healthy eating habits and are interested not only in the appearance of onions but also their nutritional value and preventive and medicinal values. And often farmers suffer heavy losses due to low prices due to abundance of supply and lack of demand, where the percentage of damaged onions ranges from 30% to 60% due to physiological weight loss and the percentage of losses due to mold ranges from 25% - 30% (Goudra et al., 2014). In addition, the contamination of the skin of the onion leads to biochemical deterioration such as brown coloration, and the breakdown of texture, which causes the presence of microorganisms that cause diseases in humans such as salmonella bacteria as well E. coli O157: H7 was involved in food outbreaks by consuming (Bowen et al., 2006). Edible coatings have the ability to carry Active ingredients such as antioxidants, spices and antimicrobials, which reduce the risk of pathogens growing on vegetables and fruits, which prolongs the shelf life of the product. It Egyptian Journal of Agricultural Research Food Technology

Welcome message from author
This document is posted to help you gain knowledge. Please leave a comment to let me know what you think about it! Share it to your friends and learn new things together.
Transcript
ORIGINAL ARTICLE Egypt. J. Agric. Res., (2020), 98 (4), 613-633
Utilization of antibacterial edible coating and nano-silver to enhance the quality of fresh and dried onion
Omar Shahat Younes Food Engineering and Packaging Res. Dept. Food Technology Research Institute, Agricultural Research Center, Giza, Egypt,
E-mail: [email protected] (Manuscript received 29 Dec 2020) 10.21608/ejar.2021.67300.1093
ABSTRACT The effect of edible coating on shelf life of fresh and dried onion was studied using different coating materials such as carboxy methyl cellulose (A), alginate (B), starch (C), carboxy methyl cellulose incorporated into nano-silver (D) , alginate incorporated into nano-silver (E), starch incorporated into nano-silver, (F) and nano-silver (G). Chemical analysis included (moisture content, total soluble solids, total sugars, total phenol content, vitamin C), and microbial analysis included (total count of bacteria, fungi and yeasts) were determined. The results indicated that the lowest percentage of weight loss at the end of the storage period was an average of 0.12%, 0.16% for fresh onions (whole - slices) for treatment (D). The lowest percentage weight gain for dried onion was an average of (0.03%) for treatment (D)at the end of the storage period. The fresh onion color value 277 did not change until the end of the storage period for the treatments (D, E, F, G). Also, the color value was constant until the end of the storage period for the dried onion slices under all treatments except for the control treatment where the average color value decreased up to 313. It was noticed that treatment (D) preserved the largest percentage in both total soluble solids, total sugars, total phenols, vitamin C and also pungency until the end of the storage period of fresh and dried onion samples. Lowest value for total bacterial count was an average 1.91 CFU x 10-2 /g for the treatments (D, E, F, G) this is in the case of fresh onions (whole – slices). Also, these treatments kept dried onion slices without bacterial growth until the end of the storage period. The lowest value for the total count for fungi and yeasts was with a mean 0.97 CFU x 10-2 / g for the treatments (D, E, F, G) this is in the case of fresh onions (whole - slices) for treatment. Also, these treatments kept dried onion slices without fungi and yeast growth until the end of the storage period. Sensory evaluation of the quality overall acceptability was excellent for all treatments (D, E, F, G). It was observed that the treatments (A, B, C) were average and that the control samples were not acceptable. The moisture content decreased from 86% to 9% during the drying period, which ranged between 4-6.5 hours under the influence of different treatments, while the drying rates in the first stage of the drying process ranged between 0.494 to 0.3196 Kg/ hour under the influence of different treatments, while was lowest specific energy consumption during the drying process is 12.61 Kj / (Kg at treatment (G). The lowest cost of evaporating one kilogram of water during the drying process was 1.71 LE/Kg for treatment (G) and the largest percentage of moisture absorption during rehydration was 56.8% for treatment G. Keywords: edible coating, microbial, drying the onion, nano coating.
INTRODUCTION Onions (Allium cepa L.) is one of the oldest vegetable crops grown under the Allium family, they are a major source of flavor in fresh and cooked foods, and they also have great healing values. Onions work as a good medicinal compound for cataracts, cardiovascular diseases and cancer due to its cholesterol-lowering and antioxidants effects (Jurgiel et al.,2015). Egypt's production of onions in 2017 reached 2914,503 tons produced from an area of 200,500 acres. According to the data of the (Food and Agriculture Organization, 2017). New onion varieties of different colors, shapes, scents and flavors are available on the market. At the same time, clients are now more health-oriented and aware of healthy eating habits and are interested not only in the appearance of onions but also their nutritional value and preventive and medicinal values. And often farmers suffer heavy losses due to low prices due to abundance of supply and lack of demand, where the percentage of damaged onions ranges from 30% to 60% due to physiological weight loss and the percentage of losses due to mold ranges from 25% - 30% (Goudra et al., 2014).
In addition, the contamination of the skin of the onion leads to biochemical deterioration such as brown coloration, and the breakdown of texture, which causes the presence of microorganisms that cause diseases in humans such as salmonella bacteria as well E. coli O157: H7 was involved in food outbreaks by consuming (Bowen et al., 2006).
Edible coatings have the ability to carry Active ingredients such as antioxidants, spices and antimicrobials, which reduce the risk of pathogens growing on vegetables and fruits, which prolongs the shelf life of the product. It
Egyptian Journal of Agricultural Research
Foo
d T
ech
no
log
y
614
enhances the sensory properties and nutritional value of foods (Pranotoet al.,2005).Starch is a polysaccharide and is found in legumes, tubers and grains and is low-cost and most starches contain two types of glucose polymers: a linear series glucose polymer called amylase and a glucose branching polymer called amylopectin (Rodriguez et al., 2006).Mark et al., (1966) noted that Starch alone does not consist of suitable mechanical properties (low levels of elongation, tensile strength and external strength) unless it is treated with plasticizers or other genetic or chemical materials. With complete biodegradation in mixtures, it can be achieved by adding biodegradable plasticizers. Common plasticizers of water-loving polymers, such as starch, are Glycerol and other low-molecular-weight Polyhydroxy compounds, polyether, and urea. Starch is a polysaccharide that is commonly used as an edible coating.
Glucomannan is a polysaccharide found in starch. This will act as a film-forming agent. Since starch has a compact structure and a low solubility, it makes an excellent oxygen barrier in edible coatings (Retno et al.,2020). Baldwin et al. (1996) noted that one of the advantages of edible coatings is that they are biodegradable in the environment and therefore their use reduces the synthetic non-degradable waste packaging. So, research focuses on developing edible coatings to extend the storage life of fresh vegetables and fruits and also improve quality attributes. Alginate is commonly used as a thickening agent, stabilizer, emulsifier, chelating agent, encapsulation, swelling, a suspending agent, or to shape gels, films, and membranes in various industries such as food, beverage, clothing, printing, and pharmaceutical. The most popular salt of alginate is sodium alginate (Tugce et al.,2018).
Eça et al. (2014). pointed out that the use of essential oils can be mixed with edible paint materials and also can be combined with other synthetic chemicals such as potassium sorbate or sodium benzoate and this is due to the fact that the essential oils are distinguished by having anti-microbial properties and are barrier to moisture and oxygen and work to protect fresh fruits and vegetables and prolong the storage period (Sarsavadia et al.,2007). studied the kinetics of drying with a thin layer of salted onion slices in a tunnel dryer at different levels of temperatures ranging between 50-80° C and at four air speeds ranging from 15 - 60 m / min It was noted that the rate of drying Onion slices increases with increasing temperature and decrease with increasing air speed. It was observed that the drying period at a fixed rate was not visible in the drying of the onion slices.
The dried product not only has a longer shelf life, but less storage space and cheaper transportation. Quality characteristics (taste, aroma, flavor and overall acceptability) are also affected by the circumstance of the drying process of vegetables and fruits in terms of exposure to a high temperature for a long time. It is necessary to choose the appropriate drying method (Workneh et al., 2011). Sarsavadia et al. (1999) studied the kinetics of drying with a thin layer of salted onion slices in a tunnel dryer at different levels of temperatures ranging between 50 - 80 ° C and at four air speeds ranging from 15 - 60 m/min It was noted that the rate of drying Onion slices increases with increasing temperature and decrease with increasing air speed. It was observed that the drying period at a fixed rate was not visible in the drying of the onion slices. Motta et al., (2010) studied the motility of onion drying at three different temperatures ranging from 30 to 70 ° C. They studied the effect of drying temperature on the chemical composition of onions and concluded that while sugars, acidity and vitamin C were significantly affected by temperature, other parameters such as fats, ash, raw protein and raw fibers were not at all affected by heat.
Kaymak-Ertekin and Gedik (2005) indicated that the occurrence of non-enzymatic brown discoloration during storage of onion slices increased at a temperature of 30 ° C and water activity 0.57 with increasing storage time. Edible coatings are produced from biopolymers (lipid, carbohydrate, protein or multi component mixture) and applied by immersion. These coatings are used with the function of acting as a barrier against water vapor and gases. also aims to improve the visual and tactile characteristics of the product and carry bioactive compounds as well (Rangel et al.,2019). Nano-silver has a variety of inhibitory infection modes against a variety of plant pathogens in a reasonably healthy manner. Until now, only a few studies have looked into the effectiveness of nano-silver coatings in preventing post-harvest rot in storage conditions (Khaleel et al.,2019). The present study is for solve a problem facing minimally processed fresh onion factories, as well as onion drying factories. Where peeled onions happen enzymatic changes that lead to a change in color and aroma, which affects the quality of the final product. The objectives are as follows: Extend the shelf life of fresh onions in limited preparation (whole - sliced), and the dried by using different coating materials without a major loss of flavor, taste, color and aroma. The fresh minimally processed onion (whole - sliced) stored in a cold storage at (5±1°C) and relative humidity of 70-75%, while the dried onion slices were stored under room temperature for a period of 35 days. Reducing the operating costs of dried onion slices with a hot air dryer and various coating materials. Rationalizing the specific energy consumption needed to vaporize a kilogram of onion moisture during the drying process using the convection oven.
Egypt. J. Agric. Res., (2020), 98 (4), 613-633
615
MATERIAL AND METHODS 2.1.Methods: 2.1.1. Mass of onion: The mass of onion samples was measured using an electrical digital balance model D-type with a maximum capacity of 400 g and measured to an accuracy of 0.01 g 2.1.3. Weight loss: According to Han et al. (2004), the weight loss of onion samples during storage was calculated using the following equation:
2.1.4. The initial moisture content of samples: The initial moisture content (m) on wet basis of samples was determined vacuum drying oven method according to (A. O.A.C. 1990). 2.1.5. Moisture content of sample during drying: The moisture content was calculated once every 30 minutes during the experiments. The moisture content was estimated according to Tayel et al. (2012) using the following equation:
1)1( −+= it MA
BM
→ (2)
Where (A) is the mass of fresh sample (ɡ), (B) mass of sample at any time (ɡ) and (Mi)initial moisture content, w.b. %. 2.1.6. Drying rate: The drying rate was calculated once every 30 minutes during the experiments according to the following equation: Mi – Mf D.R. = --------------------- →(3) D Where: Mi= Product moisture content at the beginning of drying time (w.b.) Mf= Product moisture content at the final of drying time (w.b.) D = The duration time (hour) (t = t2 – t1) 2.1.7.Quality evaluation: 2.1.7.1. Rehydration ratio: The rehydration capacities of dried slices were evaluated by immersing 10g of dried samples in boiled distilled water. Samples were removed at regular time intervals (each 2 min.) and weighed until difference in successive weighing was insignificant. Rehydration ratio was calculated using the following equation according to Sacilik and Unal, (2005): Weight of water absorbed during rehydration (Kg) Rehydration capacity =-------------------------------------------------------------------------- ×100 → (4) Weight of water removed during drying (Kg) 2.1.7.2. General appearance: General appearance was determined according to Larmond, (1977). laboratory methods for sensory evaluation of foods. 2.1.7.3. Color measurement: The internal colors of L were measured for freshly minimally processed onion values and also dried onion slices using the Minolta Chroma Meter, Model CR - 200. Calibration was performed by a white plate before use. Color changes were determined for the L value indicating lightness, and a value indicating the yellow tone (Barbagallo et al.,2012).
Weight loss % = initial weight of samples – samples weight during storage period × 100→
(3) (1)
initial weight of samples
616
2.1.7.4. Specific energy consumption: The specific energy consumption requirement for moisture removal was calculated according the following equation: Total energy consumption (kJ) Sp. Energy = -------------------------------------------- →((5) Quantity of lost water (kg) The energy consumption during the drying process is the sum of energy required for heating the ambient air. For each experimental run, the energy consumption was calculated using the following relationship (Afzal et al.,1999). Total energy consumption = P D = I V D (kW)→(5-1) Where: P = power consumption W I = amperage eA V = voltag eV D = drying time h
hkWofpriceSECkgLECost removedwater =)/(
→ (5-2)
2.1.8 Material 2.1.8.1 Preparation of coabed samples: Onion was purchased at ripening stage in mid-June, then washed using calcium hypochlorite 0.25 g/lit distilled water for 10 sec, then running water. Samples were sliced with special cutting tools. Whole onion and slices were prepared in three groups as follows: First group: Whole fresh peeled onion. second group: fresh onion slices (3mm) thickness. third group: dried onion slices (3 mm) thickness. onion samples prepared were immersed in coating solutions for 15 min as follows: (A) CMC (carboxy methyl cellulose). (B) Alginate. (C) Starch. (G)Nano-Silver. Samples were packed with a weight of 400 grams in metallic bags. The fresh onion (whole-sliced) stored in refrigerator storage at (5±1°C) and relative humidity of 70-75%, while the dried onion slices were stored under room temperature for a period of 35 days. 2.1.9. Preparation of different treatments: (a)Carboxy methyl cellulose (CMC) Coating: 1g of (CMC) was dissolved in 100 mL distilled water, Glycerol was added as plasticizer at 0.4 g/100 mL. Then potassium sorbate (1 g/100 mL) was added to coating solutions. Coating solutions were heated until reached to 85 ° C for 10 min. Then cooled to room temperature (Sarasayanjali et al.,2011). (b) Alginate Coating: dissolving 3.0 g of alginate in 200 mL of distilled water at 70 ° C under mechanical stirring for 30 min. After complete dissolution, glycerol (0.243 g/g of alginate) was added as a plasticizer (Rhim, 2004). (c) Starch Coating: Were prepared by casting aqueous modified maize starch solution (1.5 gram / 100 ml), then gelatinized at 90 ° C for one hour using water bath, Glycerol (3%) and xanthenes modified mixture (0.5%) were added to the - forming solution. The solution was homogenized 4000 rpm for 5 min, Danijela et al. (2016). (d) Carboxy methyl cellulose (CMC) /Nano silver coating: Transactions (e) are represented by adding 0.3% nano silver to the solution(a) (Wittmar, 2012). (e) Alginate coating /Nano silver coating: Transactions (f) are represented by adding 0.3% nano silver to the solution (b) (Wittmar, 2012). (f) Starch coating /Nano silver coating: Transactions (g) are represented by adding0.3% nano silver to the solution(c) (Wittmar, 2012).
Egypt. J. Agric. Res., (2020), 98 (4), 613-633
617
2.1.10. Specifications of convection dryer used in experiments. A standard oven model (EBT 82) equipped with three shelves was used. Heat was generated by 2 electric heaters (3 kW.h) installed on the side walls of the dryer, hot air was distributed using an electric fan (0.1 KW. h) with constant air speed of 0.5 m/s. The air temperature of the drying oven was controlled by a thermostat and a wind gauge, (Sato Sk-73D) was used to measure the air speed of the drying room. 2.2. Analytical Methods: 2.2.1. Drying process: Treated and coated samples were dried using constant air speed 0.5 m/s, there were eight experiments, each one contain 4 kɡ of onion slices (3mm thickness) placed on oven trays which were placed in drying chamber. Oven temperature reached 90 O C for the first stage then 50 O C for the second stage. Also, the samples were weighed every one hour until weight stability (Muller and Heindl, 2006). 2.2.2. Chemical analyzes The chemical composition was determined by analysis of moisture, total soluble solids, total sugars, pungency, and vitamin C, made in duplicate and following standard methods, according to the Association of Official Analytical Chemists A.O.A.C. (1990). Determination of total Phenol’s content: Total Phenols content were extracted using the method of Kahkonen et al., (1999). * Carboxy methyl cellulose, alginate, starch and nano-silver were purchased from Technogen Chemicals. Company – Giza - Egypt. *MBOPP metalizebiaxial orientedpolypropylenepoly propylene purchased fromEgy-warp Company 6th October - Giza - Egypt. 2.2.3. Microbial analysis: Total microbial count, mold and yeast counts were determined according to Marchall (1992). 2.2.4. Sensory evaluation of onion samples: Sensory assessment was done on a 10-point hedonic scale, with 1 - 3 indicating bad, 4 - 6 indicating average, and 7 - 10 indicating excellent. The following qualities were considered in terms of quality: appearance, colour, aroma, taste, and overall acceptability. The Ministry of Trade and Industry's Food and Agriculture Technology Center (FAITC) conducted the sensory assessment. In May 2019, seven onion samples (whole - sli) were compared. 2.2.5. Statistical analysis The SAS program was used to perform an ANOVA procedure for statistical analysis of the data. The difference between means was determined using the least significant difference test. Atp≤0.05, significance was presumed. RESULTS AND DISCUSSION 3.1. Physicochemical properties of fresh onion: The physicochemical properties of fresh onion samples are shown in Table 1. The moisture content of fresh onion (wet basis) was (86 percent) + 0.19, total soluble solids (12%) 0.65, total sugars (43 %) +1.15g/100), and pungency was (10 +0.32 umal /) of fresh onion, according to the findings (Jurgiel et al., 2015). The total phenolic content was 7.581.66 (mol/g), and the total phenolic content was 7.581.66 (mol/g). Table (1). The Physical and chemical composition of fresh onion (On a wet weight basis).
Properties Fresh onion
Moisture % 86±0.1901
total soluble solids% 12±0.65
Total sugars (g/100 g dry solids) 43.00 ±1.15
Pungency (μmol/g, as pyruvic acid) 10±0.32
The total phenolic content (mg/g) 75 ±1.66
Vitamin C (mg/100 g dry solids) 4841 mg
Color index 277±0.003
618
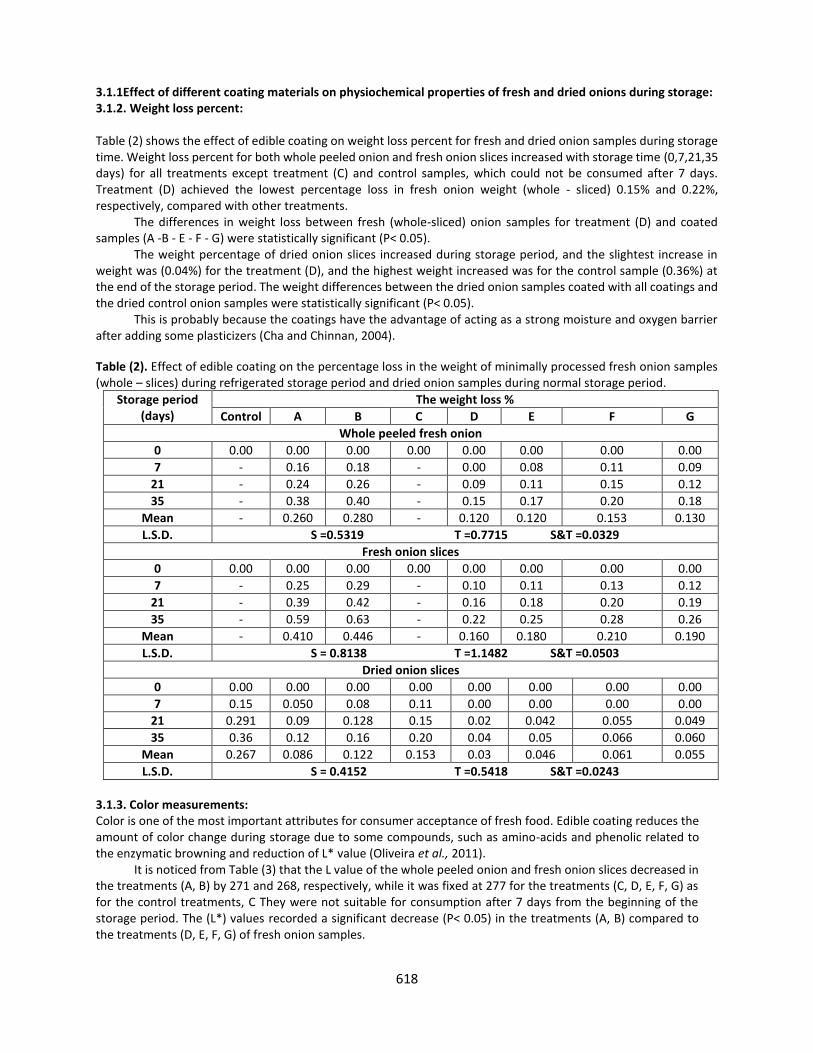
3.1.1Effect of different coating materials on physiochemical properties of fresh and dried onions during storage: 3.1.2. Weight loss percent: Table (2) shows the effect of edible coating on weight loss percent for fresh and dried onion samples during storage time. Weight loss percent for both whole peeled onion and fresh onion slices increased with storage time (0,7,21,35 days) for all treatments except treatment (C) and control samples, which could not be consumed after 7 days. Treatment (D) achieved the lowest percentage loss in fresh onion weight (whole - sliced) 0.15% and 0.22%, respectively, compared with other treatments.
The differences in weight loss between fresh (whole-sliced) onion samples for treatment (D) and coated samples (A -B - E - F - G) were statistically significant (P˂ 0.05).
The weight percentage of dried onion slices increased during storage period, and the slightest increase in weight was (0.04%) for the treatment (D), and the highest weight increased was for the control sample (0.36%) at the end of the storage period. The weight differences between the dried onion samples coated with all coatings and the dried control onion samples were statistically significant (P˂ 0.05).
This is probably because the coatings have the advantage of acting as a strong moisture and oxygen barrier after adding some plasticizers (Cha and Chinnan, 2004).
Table (2). Effect of edible coating on the percentage loss in the weight of minimally processed fresh onion samples (whole – slices) during refrigerated storage period and dried onion samples during normal storage period.
Storage period (days)
The weight loss %
Control A B C D E F G
Whole peeled fresh onion
0 0.00 0.00 0.00 0.00 0.00 0.00 0.00 0.00
7 - 0.16 0.18 - 0.00 0.08 0.11 0.09
21 - 0.24 0.26 - 0.09 0.11 0.15 0.12
35 - 0.38 0.40 - 0.15 0.17 0.20 0.18
Mean - 0.260 0.280 - 0.120 0.120 0.153 0.130
L.S.D. S =0.5319 T =0.7715 S&T =0.0329
Fresh onion slices
0 0.00 0.00 0.00 0.00 0.00 0.00 0.00 0.00
7 - 0.25 0.29 - 0.10 0.11 0.13 0.12
21 - 0.39 0.42 - 0.16 0.18 0.20 0.19
35 - 0.59 0.63 - 0.22 0.25 0.28 0.26
Mean - 0.410 0.446 - 0.160 0.180 0.210 0.190
L.S.D. S = 0.8138 T =1.1482 S&T =0.0503
Dried onion slices
0 0.00 0.00 0.00 0.00 0.00 0.00 0.00 0.00
7 0.15 0.050 0.08 0.11 0.00 0.00 0.00 0.00
21 0.291 0.09 0.128 0.15 0.02 0.042 0.055 0.049
35 0.36 0.12 0.16 0.20 0.04 0.05 0.066 0.060
Mean 0.267 0.086 0.122 0.153 0.03 0.046 0.061 0.055
L.S.D. S = 0.4152 T =0.5418 S&T =0.0243
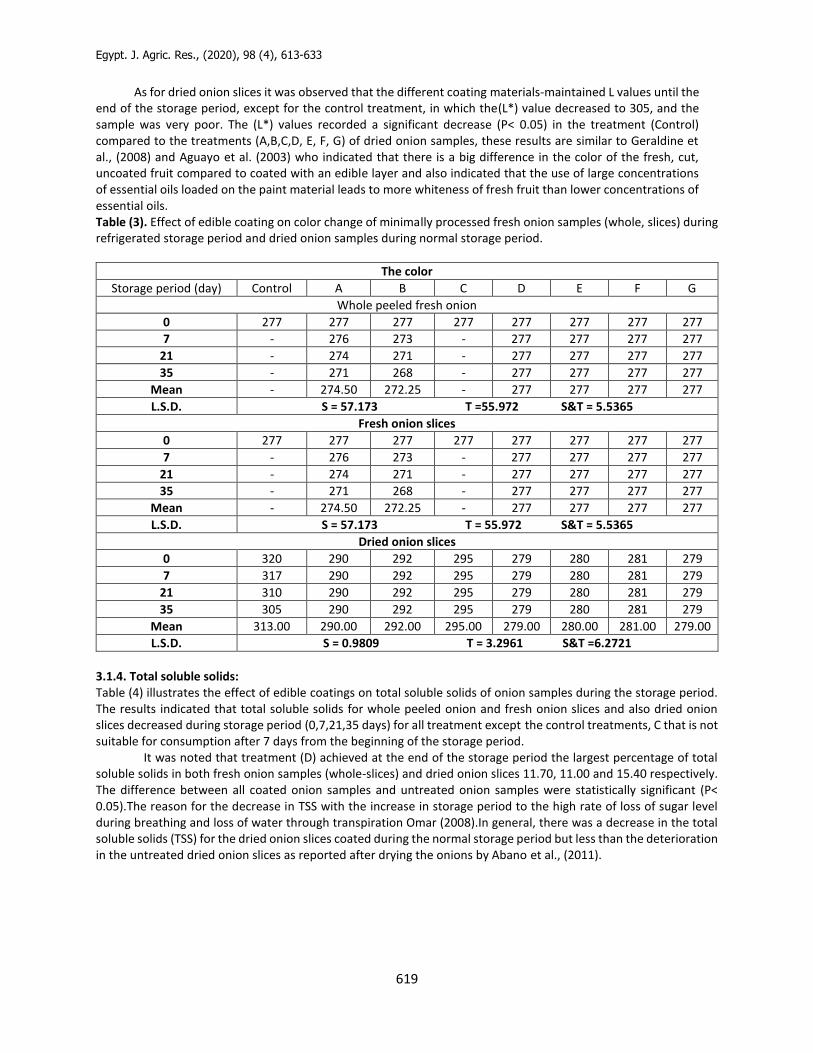
3.1.3. Color measurements: Color is one of the most important attributes for consumer acceptance of fresh food. Edible coating reduces the amount of color change during storage due to some compounds, such as amino-acids and phenolic related to the enzymatic browning and reduction of L* value (Oliveira et al., 2011).
It is noticed from Table (3) that the L value of the whole peeled onion and fresh onion slices decreased in the treatments (A, B) by 271 and 268, respectively, while it was fixed at 277 for the treatments (C, D, E, F, G) as for the control treatments, C They were not suitable for consumption after 7 days from the beginning of the storage period. The (L*) values recorded a significant decrease (P˂ 0.05) in the treatments (A, B) compared to the treatments (D, E, F, G) of fresh onion samples.
Egypt. J. Agric. Res., (2020), 98 (4), 613-633
619
As for dried onion slices it was observed that the different coating materials-maintained L values until the end of the storage period, except for the control treatment, in which the(L*) value decreased to 305, and the sample was very poor. The (L*) values recorded a significant decrease (P˂ 0.05) in the treatment (Control) compared to the treatments (A,B,C,D, E, F, G) of dried onion samples, these results are similar to Geraldine et al., (2008) and Aguayo et al. (2003) who indicated that there is a big difference in the color of the fresh, cut, uncoated fruit compared to coated with an edible layer and also indicated that the use of large concentrations of essential oils loaded on the paint material leads to more whiteness of fresh fruit than lower concentrations of essential oils. Table (3). Effect of edible coating on color change of minimally processed fresh onion samples (whole, slices) during refrigerated storage period and dried onion samples during normal storage period.
The color
Storage period (day) Control A B C D E F G
Whole peeled fresh onion
0 277 277 277 277 277 277 277 277
7 - 276 273 - 277 277 277 277
21 - 274 271 - 277 277 277 277
35 - 271 268 - 277 277 277 277
Mean - 274.50 272.25 - 277 277 277 277
L.S.D. S = 57.173 T =55.972 S&T = 5.5365
Fresh onion slices
0 277 277 277 277 277 277 277 277
7 - 276 273 - 277 277 277 277
21 - 274 271 - 277 277 277 277
35 - 271 268 - 277 277 277 277
Mean - 274.50 272.25 - 277 277 277 277
L.S.D. S = 57.173 T = 55.972 S&T = 5.5365
Dried onion slices
0 320 290 292 295 279 280 281 279
7 317 290 292 295 279 280 281 279
21 310 290 292 295 279 280 281 279
35 305 290 292 295 279 280 281 279
Mean 313.00 290.00 292.00 295.00 279.00 280.00 281.00 279.00
L.S.D. S = 0.9809 T = 3.2961 S&T =6.2721
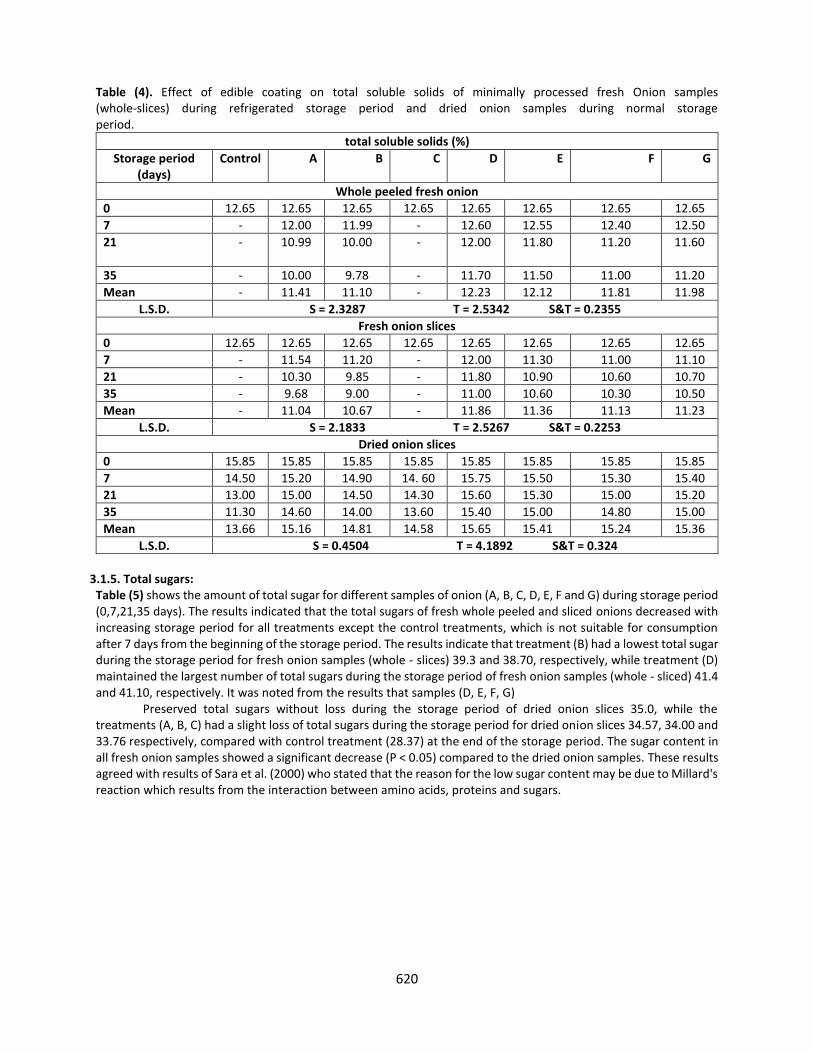
3.1.4. Total soluble solids: Table (4) illustrates the effect of edible coatings on total soluble solids of onion samples during the storage period. The results indicated that total soluble solids for whole peeled onion and fresh onion slices and also dried onion slices decreased during storage period (0,7,21,35 days) for all treatment except the control treatments, C that is not suitable for consumption after 7 days from the beginning of the storage period.
It was noted that treatment (D) achieved at the end of the storage period the largest percentage of total soluble solids in both fresh onion samples (whole-slices) and dried onion slices 11.70, 11.00 and 15.40 respectively. The difference between all coated onion samples and untreated onion samples were statistically significant (P˂ 0.05).The reason for the decrease in TSS with the increase in storage period to the high rate of loss of sugar level during breathing and loss of water through transpiration Omar (2008).In general, there was a decrease in the total soluble solids (TSS) for the dried onion slices coated during the normal storage period but less than the deterioration in the untreated dried onion slices as reported after drying the onions by Abano et al., (2011).
620
Table (4). Effect of edible coating on total soluble solids of minimally processed fresh Onion samples (whole-slices) during refrigerated storage period and dried onion samples during normal storage period.
total soluble solids (%)
Storage period (days)
Control A B C D E F G
Whole peeled fresh onion
0 12.65 12.65 12.65 12.65 12.65 12.65 12.65 12.65
7 - 12.00 11.99 - 12.60 12.55 12.40 12.50
21 - 10.99 10.00 - 12.00 11.80
11.20 11.60
35 - 10.00 9.78 - 11.70 11.50 11.00 11.20
Mean - 11.41 11.10 - 12.23 12.12 11.81 11.98
L.S.D. S = 2.3287 T = 2.5342 S&T = 0.2355
Fresh onion slices
0 12.65 12.65 12.65 12.65 12.65 12.65 12.65 12.65
7 - 11.54 11.20 - 12.00 11.30 11.00 11.10
21 - 10.30 9.85 - 11.80 10.90 10.60 10.70
35 - 9.68 9.00 - 11.00 10.60 10.30 10.50
Mean - 11.04 10.67 - 11.86 11.36 11.13 11.23
L.S.D. S = 2.1833 T = 2.5267 S&T = 0.2253
Dried onion slices
0 15.85 15.85 15.85 15.85 15.85 15.85 15.85 15.85
7 14.50 15.20 14.90 14. 60 15.75 15.50 15.30 15.40
21 13.00 15.00 14.50 14.30 15.60 15.30 15.00 15.20
35 11.30 14.60 14.00 13.60 15.40 15.00 14.80 15.00
Mean 13.66 15.16 14.81 14.58 15.65 15.41 15.24 15.36
L.S.D. S = 0.4504 T = 4.1892 S&T = 0.324
3.1.5. Total sugars:
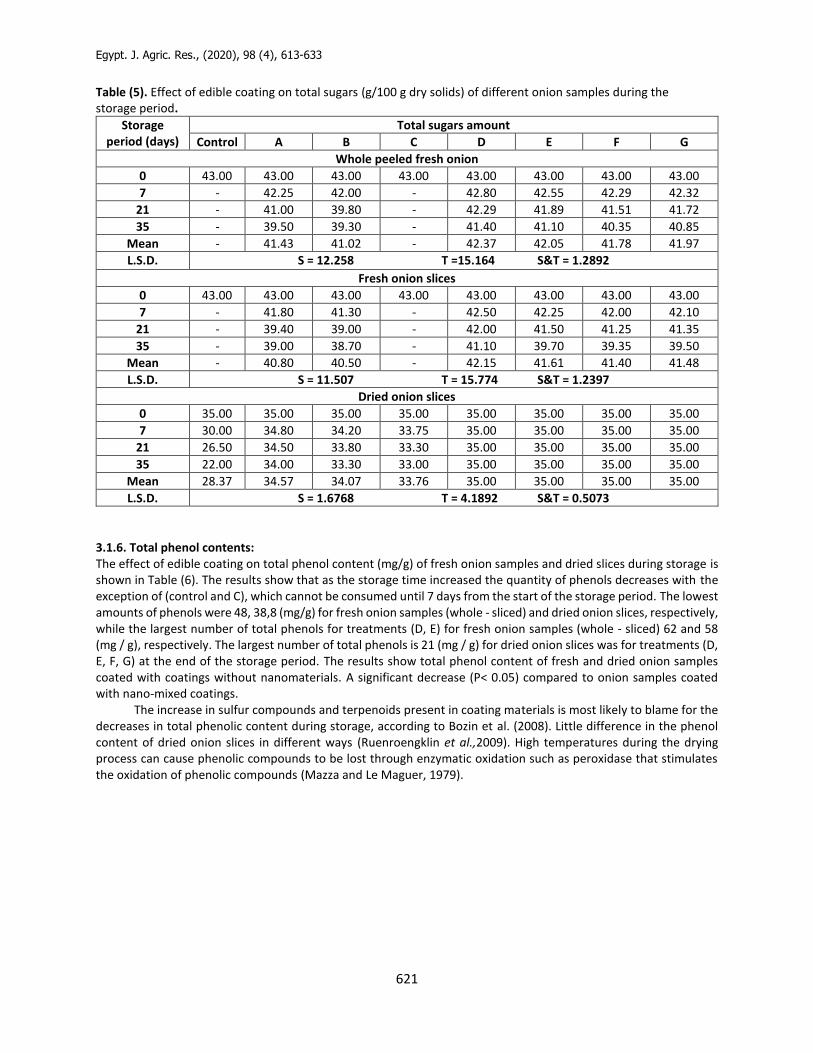
Table (5) shows the amount of total sugar for different samples of onion (A, B, C, D, E, F and G) during storage period (0,7,21,35 days). The results indicated that the total sugars of fresh whole peeled and sliced onions decreased with increasing storage period for all treatments except the control treatments, which is not suitable for consumption after 7 days from the beginning of the storage period. The results indicate that treatment (B) had a lowest total sugar during the storage period for fresh onion samples (whole - slices) 39.3 and 38.70, respectively, while treatment (D) maintained the largest number of total sugars during the storage period of fresh onion samples (whole - sliced) 41.4 and 41.10, respectively. It was noted from the results that samples (D, E, F, G) Preserved total sugars without loss during the storage period of dried onion slices 35.0, while the treatments (A, B, C) had a slight loss of total sugars during the storage period for dried onion slices 34.57, 34.00 and 33.76 respectively, compared with control treatment (28.37) at the end of the storage period. The sugar content in all fresh onion samples showed a significant decrease (P ˂ 0.05) compared to the dried onion samples. These results agreed with results of Sara et al. (2000) who stated that the reason for the low sugar content may be due to Millard's reaction which results from the interaction between amino acids, proteins and sugars.
Egypt. J. Agric. Res., (2020), 98 (4), 613-633
621
Table (5). Effect of edible coating on total sugars (g/100 g dry solids) of different onion samples during the storage period.
Storage period (days)
Total sugars amount
Control A B C D E F G
Whole peeled fresh onion
0 43.00 43.00 43.00 43.00 43.00 43.00 43.00 43.00
7 - 42.25 42.00 - 42.80 42.55 42.29 42.32
21 - 41.00 39.80 - 42.29 41.89 41.51 41.72
35 - 39.50 39.30 - 41.40 41.10 40.35 40.85
Mean - 41.43 41.02 - 42.37 42.05 41.78 41.97
L.S.D. S = 12.258 T =15.164 S&T = 1.2892
Fresh onion slices
0 43.00 43.00 43.00 43.00 43.00 43.00 43.00 43.00
7 - 41.80 41.30 - 42.50 42.25 42.00 42.10
21 - 39.40 39.00 - 42.00 41.50 41.25 41.35
35 - 39.00 38.70 - 41.10 39.70 39.35 39.50
Mean - 40.80 40.50 - 42.15 41.61 41.40 41.48
L.S.D. S = 11.507 T = 15.774 S&T = 1.2397
Dried onion slices
0 35.00 35.00 35.00 35.00 35.00 35.00 35.00 35.00
7 30.00 34.80 34.20 33.75 35.00 35.00 35.00 35.00
21 26.50 34.50 33.80 33.30 35.00 35.00 35.00 35.00
35 22.00 34.00 33.30 33.00 35.00 35.00 35.00 35.00
Mean 28.37 34.57 34.07 33.76 35.00 35.00 35.00 35.00
L.S.D. S = 1.6768 T = 4.1892 S&T = 0.5073
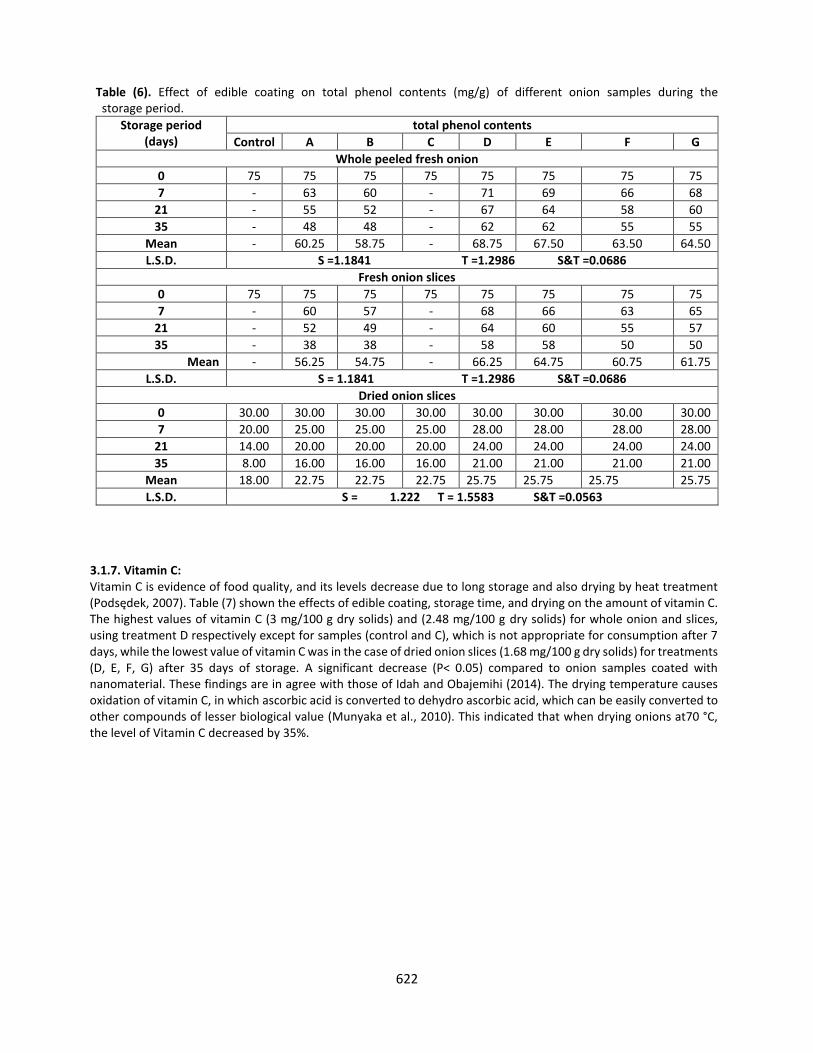
3.1.6. Total phenol contents: The effect of edible coating on total phenol content (mg/g) of fresh onion samples and dried slices during storage is shown in Table (6). The results show that as the storage time increased the quantity of phenols decreases with the exception of (control and C), which cannot be consumed until 7 days from the start of the storage period. The lowest amounts of phenols were 48, 38,8 (mg/g) for fresh onion samples (whole - sliced) and dried onion slices, respectively, while the largest number of total phenols for treatments (D, E) for fresh onion samples (whole - sliced) 62 and 58 (mg / g), respectively. The largest number of total phenols is 21 (mg / g) for dried onion slices was for treatments (D, E, F, G) at the end of the storage period. The results show total phenol content of fresh and dried onion samples coated with coatings without nanomaterials. A significant decrease (P˂ 0.05) compared to onion samples coated with nano-mixed coatings.
The increase in sulfur compounds and terpenoids present in coating materials is most likely to blame for the decreases in total phenolic content during storage, according to Bozin et al. (2008). Little difference in the phenol content of dried onion slices in different ways (Ruenroengklin et al.,2009). High temperatures during the drying process can cause phenolic compounds to be lost through enzymatic oxidation such as peroxidase that stimulates the oxidation of phenolic compounds (Mazza and Le Maguer, 1979).
622
Table (6). Effect of edible coating on total phenol contents (mg/g) of different onion samples during the storage period.
Storage period (days)
total phenol contents
Control A B C D E F G
Whole peeled fresh onion
0 75 75 75 75 75 75 75 75
7 - 63 60 - 71 69 66 68
21 - 55 52 - 67 64 58 60
35 - 48 48 - 62 62 55 55
Mean - 60.25 58.75 - 68.75 67.50 63.50 64.50
L.S.D. S =1.1841 T =1.2986 S&T =0.0686
Fresh onion slices
0 75 75 75 75 75 75 75 75
7 - 60 57 - 68 66 63 65
21 - 52 49 - 64 60 55 57
35 - 38 38 - 58 58 50 50
Mean - 56.25 54.75 - 66.25 64.75 60.75 61.75
L.S.D. S = 1.1841 T =1.2986 S&T =0.0686
Dried onion slices
0 30.00 30.00 30.00 30.00 30.00 30.00 30.00 30.00
7 20.00 25.00 25.00 25.00 28.00 28.00 28.00 28.00
21 14.00 20.00 20.00 20.00 24.00 24.00 24.00 24.00
35 8.00 16.00 16.00 16.00 21.00 21.00 21.00 21.00
Mean 18.00 22.75 22.75 22.75 25.75 25.75 25.75 25.75
L.S.D. S = 1.222 T = 1.5583 S&T =0.0563
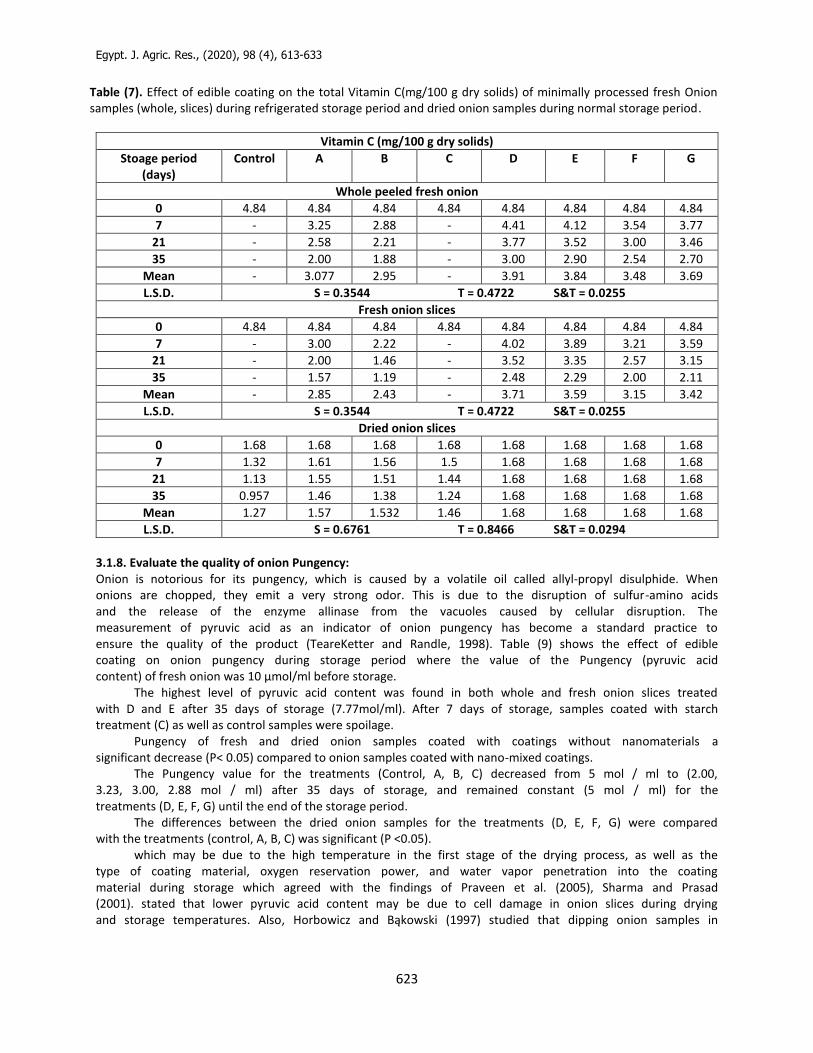
3.1.7. Vitamin C: Vitamin C is evidence of food quality, and its levels decrease due to long storage and also drying by heat treatment (Podsędek, 2007). Table (7) shown the effects of edible coating, storage time, and drying on the amount of vitamin C. The highest values of vitamin C (3 mg/100 g dry solids) and (2.48 mg/100 g dry solids) for whole onion and slices, using treatment D respectively except for samples (control and C), which is not appropriate for consumption after 7 days, while the lowest value of vitamin C was in the case of dried onion slices (1.68 mg/100 g dry solids) for treatments (D, E, F, G) after 35 days of storage. A significant decrease (P˂ 0.05) compared to onion samples coated with nanomaterial. These findings are in agree with those of Idah and Obajemihi (2014). The drying temperature causes oxidation of vitamin C, in which ascorbic acid is converted to dehydro ascorbic acid, which can be easily converted to other compounds of lesser biological value (Munyaka et al., 2010). This indicated that when drying onions at70 °C, the level of Vitamin C decreased by 35%.
Egypt. J. Agric. Res., (2020), 98 (4), 613-633
623
Table (7). Effect of edible coating on the total Vitamin C(mg/100 g dry solids) of minimally processed fresh Onion samples (whole, slices) during refrigerated storage period and dried onion samples during normal storage period.
Vitamin C (mg/100 g dry solids)
Stoage period (days)
Control A B C D E F G
Whole peeled fresh onion
0 4.84 4.84 4.84 4.84 4.84 4.84 4.84 4.84
7 - 3.25 2.88 - 4.41 4.12 3.54 3.77
21 - 2.58 2.21 - 3.77 3.52 3.00 3.46
35 - 2.00 1.88 - 3.00 2.90 2.54 2.70
Mean - 3.077 2.95 - 3.91 3.84 3.48 3.69
L.S.D. S = 0.3544 T = 0.4722 S&T = 0.0255
Fresh onion slices
0 4.84 4.84 4.84 4.84 4.84 4.84 4.84 4.84
7 - 3.00 2.22 - 4.02 3.89 3.21 3.59
21 - 2.00 1.46 - 3.52 3.35 2.57 3.15
35 - 1.57 1.19 - 2.48 2.29 2.00 2.11
Mean - 2.85 2.43 - 3.71 3.59 3.15 3.42
L.S.D. S = 0.3544 T = 0.4722 S&T = 0.0255
Dried onion slices
0 1.68 1.68 1.68 1.68 1.68 1.68 1.68 1.68
7 1.32 1.61 1.56 1.5 1.68 1.68 1.68 1.68
21 1.13 1.55 1.51 1.44 1.68 1.68 1.68 1.68
35 0.957 1.46 1.38 1.24 1.68 1.68 1.68 1.68
Mean 1.27 1.57 1.532 1.46 1.68 1.68 1.68 1.68
L.S.D. S = 0.6761 T = 0.8466 S&T = 0.0294
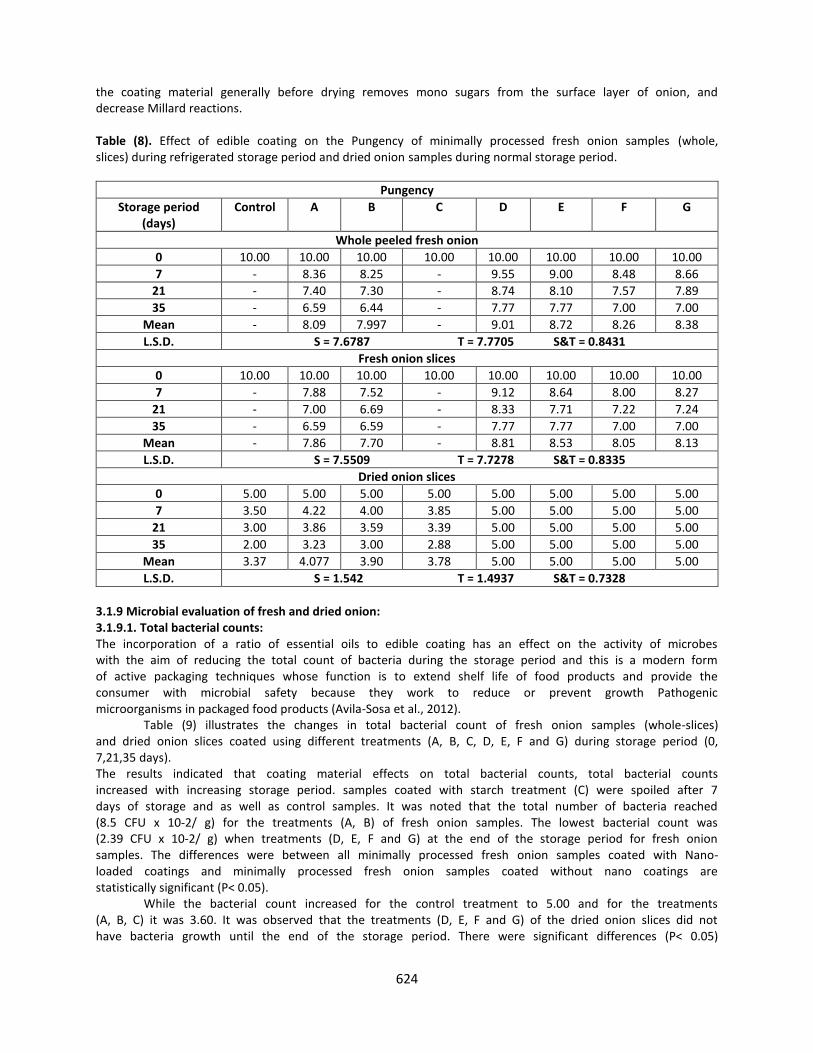
3.1.8. Evaluate the quality of onion Pungency: Onion is notorious for its pungency, which is caused by a volatile oil called allyl-propyl disulphide. When onions are chopped, they emit a very strong odor. This is due to the disruption of sulfur-amino acids and the release of the enzyme allinase from the vacuoles caused by cellular disruption. The measurement of pyruvic acid as an indicator of onion pungency has become a standard practice to ensure the quality of the product (TeareKetter and Randle, 1998). Table (9) shows the effect of edible coating on onion pungency during storage period where the value of the Pungency (pyruvic acid content) of fresh onion was 10 μmol/ml before storage.
The highest level of pyruvic acid content was found in both whole and fresh onion slices treated with D and E after 35 days of storage (7.77mol/ml). After 7 days of storage, samples coated with starch treatment (C) as well as control samples were spoilage.
Pungency of fresh and dried onion samples coated with coatings without nanomaterials a significant decrease (P˂ 0.05) compared to onion samples coated with nano-mixed coatings.
The Pungency value for the treatments (Control, A, B, C) decreased from 5 mol / ml to (2.00, 3.23, 3.00, 2.88 mol / ml) after 35 days of storage, and remained constant (5 mol / ml) for the treatments (D, E, F, G) until the end of the storage period.
The differences between the dried onion samples for the treatments (D, E, F, G) were compared with the treatments (control, A, B, C) was significant (P <0.05).
which may be due to the high temperature in the first stage of the drying process, as well as the type of coating material, oxygen reservation power, and water vapor penetration into the coating material during storage which agreed with the findings of Praveen et al. (2005), Sharma and Prasad (2001). stated that lower pyruvic acid content may be due to cell damage in onion slices during drying and storage temperatures. Also, Horbowicz and Bąkowski (1997) studied that dipping onion samples in
624
the coating material generally before drying removes mono sugars from the surface layer of onion, and decrease Millard reactions. Table (8). Effect of edible coating on the Pungency of minimally processed fresh onion samples (whole, slices) during refrigerated storage period and dried onion samples during normal storage period.
Pungency
Storage period (days)
Control A B C D E F G
Whole peeled fresh onion
0 10.00 10.00 10.00 10.00 10.00 10.00 10.00 10.00
7 - 8.36 8.25 - 9.55 9.00 8.48 8.66
21 - 7.40 7.30 - 8.74 8.10 7.57 7.89
35 - 6.59 6.44 - 7.77 7.77 7.00 7.00
Mean - 8.09 7.997 - 9.01 8.72 8.26 8.38
L.S.D. S = 7.6787 T = 7.7705 S&T = 0.8431
Fresh onion slices
0 10.00 10.00 10.00 10.00 10.00 10.00 10.00 10.00
7 - 7.88 7.52 - 9.12 8.64 8.00 8.27
21 - 7.00 6.69 - 8.33 7.71 7.22 7.24
35 - 6.59 6.59 - 7.77 7.77 7.00 7.00
Mean - 7.86 7.70 - 8.81 8.53 8.05 8.13
L.S.D. S = 7.5509 T = 7.7278 S&T = 0.8335
Dried onion slices
0 5.00 5.00 5.00 5.00 5.00 5.00 5.00 5.00
7 3.50 4.22 4.00 3.85 5.00 5.00 5.00 5.00
21 3.00 3.86 3.59 3.39 5.00 5.00 5.00 5.00
35 2.00 3.23 3.00 2.88 5.00 5.00 5.00 5.00
Mean 3.37 4.077 3.90 3.78 5.00 5.00 5.00 5.00
L.S.D. S = 1.542 T = 1.4937 S&T = 0.7328
3.1.9 Microbial evaluation of fresh and dried onion: 3.1.9.1. Total bacterial counts: The incorporation of a ratio of essential oils to edible coating has an effect on the activity of microbes with the aim of reducing the total count of bacteria during the storage period and this is a modern form of active packaging techniques whose function is to extend shelf life of food products and provide the consumer with microbial safety because they work to reduce or prevent growth Pathogenic microorganisms in packaged food products (Avila-Sosa et al., 2012).
Table (9) illustrates the changes in total bacterial count of fresh onion samples (whole-slices) and dried onion slices coated using different treatments (A, B, C, D, E, F and G) during storage period (0, 7,21,35 days). The results indicated that coating material effects on total bacterial counts, total bacterial counts increased with increasing storage period. samples coated with starch treatment (C) were spoiled after 7 days of storage and as well as control samples. It was noted that the total number of bacteria reached (8.5 CFU x 10-2/ g) for the treatments (A, B) of fresh onion samples. The lowest bacterial count was (2.39 CFU x 10-2/ g) when treatments (D, E, F and G) at the end of the storage period for fresh onion samples. The differences were between all minimally processed fresh onion samples coated with Nano-loaded coatings and minimally processed fresh onion samples coated without nano coatings are statistically significant (P˂ 0.05).
While the bacterial count increased for the control treatment to 5.00 and for the treatments (A, B, C) it was 3.60. It was observed that the treatments (D, E, F and G) of the dried onion slices did not have bacteria growth until the end of the storage period. There were significant differences (P˂ 0.05)
Egypt. J. Agric. Res., (2020), 98 (4), 613-633
625
between dried onion samples coated with nonmaterial incorporated with different coating materials compared to dried onion samples coated without nano and also control. These results are consistent with the results of Péreza et al. (2011). Where he used garlic oil to coating fresh garlic it was found to be anti-bacterial and indicated the application of the coating in many nutritional applications. In general, it was noted that the incorporation of nano materials into coating materials had an effect of inhibiting bacterial growth during the storage period.
Table (9) Effect of edible coating on total count (CFU x 10-2/ g) of different samples of onion during storage period.
Total bacterial count
Storage period (days)
Control A B C D E F G
Whole peeled fresh onion
0 1.25 1.25 1.25 1.25 1.25 1.25 1.25 1.25
7 - 3.00 3.00 - 1.80 1.80 1.80 1.80
21 - 6.50 6.50 - 2.20 2.20 2.20 2.20
35 - 8.50 8.50 - 2.39 2.39 2.39 2.39
Mean - 4.81 4.81 - 1.91 1.91 1.91 1.91
L.S.D. S = 0.6549 T = 1.091 S&T = 0.0738
Fresh onion slices
0 1.25 1.25 1.25 1.25 1.25 1.25 1.25 1.25
7 - 3.00 3.00 - 1.80 1.80 1.80 1.80
21 - 6.5 6.5 - 2.20 2.20 2.20 2.20
35 - 8.50 8.50 - 2.39 2.39 2.39 2.39
Mean - 4.81 4.81 - 1.91 1.91 1.91 1.91
L.S.D. S = 0.5965 T = 1.186 S&T = 0.0693
Dried onion slices
0 0.00 0.00 0.00 0.00 0.00 0.00 0.00 0.00
7 2.90 0.00 0.00 0.00 0.00 0.00 0.00 0.00
21 3.50 2.20 2.20 2.20 0.00 0.00 0.00 0.00
35 5.00 3.6 3.6 3.6 0.00 0.00 0.00 0.00
Mean 3.80 2.90 2.90 2.90 0.00 0.00 0.00 0.00
L.S.D. S = 0.0972 T = 0.1025 S&T = 0.0341
3.1.9.2. mold and yeast counts: Table (10) illustrates the changes in the mold and yeast counts of fresh onion samples (whole- slices) and dried onion slices coated using different treatments (A, B, C, D, E, F and G) during storage period (0,7,21,35days).The results indicated that coating material effects on the mold and yeast counts, the mold and yeast counts increased with increasing storage period. Samples coated with starch treatment (C) were spoiled after 7 days of storage and as well as control samples. It was noted that the mold and yeast counts reached (2.10 CFU x 10-2/ g) for the treatments (A, B) of fresh onion samples. The lowest the mold and yeast counts was (1.60 CFU x 10-2/ g) when treatments (D, E, F and G) at the end of the storage period for fresh onion samples. The differences were between all minimally processed fresh onion samples coated with nano-loaded coatings and minimally processed fresh onion samples coated without nano coatings are statistically significant (P˂ 0.05).
The type of coating material and drying temperature had an effective effect on mold and yeast count, as it was (0.30 CFU x 10-2/ g) In the case of fresh onion and disappeared after drying. While coating with nano material only or merging it with carboxy methyl cellulose or alginate or starch has preserved dried onion slices for 35 days without mold and yeast counts counting it is mentioned that the coating of dried onion slices with carboxy methyl cellulose or alginate or starch without merging with nano structure allowed the growth of a mold and yeast counts (1.20CFU x 10-2/ g) in comparison, the mold and yeast counts increased with the uncoated dried onion slices to (7.00 CFU x 10-2/ g ) at the end of the normal storage period. The differences between all coated dried onion samples and untreated dehydrated onion samples were statistically significant (P˂ 0.05). Similar results were reported by Rojas-Graü et al. (2007) who indicated that edible coatings with essential oils were effectives to control bacteria and fungi
626
growth in fresh fruit and vegetable. In general, it was noted that the incorporation of nano materials into coating materials had an effect of inhibiting mold and yeast count growth during the storage period. Table (10) Effect of edible coating on mold and yeast count (CFU x 10-2/ g) of minimally processed fresh Onion samples (whole, slices) during refrigerated storage period and dried onion samples during normal storage period.
mold and yeast count
Storage period (days) Control A B C D E F G
Whole peeled fresh onion
0 0.30 0.30 0.30 0.30 0.30 0.30 0.30 0.30
7 - 1.70 1.70 - 0.80 0.80 0.80 0.80
21 - 2.00 2.00 - 1.20 1.20 1.20 1.20
35 - 2.10 2.10 - 1.60 1.60 1.60 1.60
Mean - 1.52 1.52 - 0.97 0.97 0.97 0.97
L.S.D. S = 1.5996 T = 2.0398 S&T = 0.1705
Fresh onion slices
0 0.30 0.30 0.30 0.30 0.30 0.30 0.30 0.30
7 - 1.70 1.70 - 0.80 0.80 0.80 0.80
21 - 2.00 2.00 - 1.20 1.20 1.20 1.20
35 - 2.10 2.10 - 1.60 1.60 1.60 1.60
Mean - 1.52 1.52 - 0.97 0.97 0.97 0.97
L.S.D. S = 1.5376 T = 2.0314 S&T = 0.1659
Dried onion slices
0 0.00 0.00 0.00 0.00 0.00 0.00 0.00 0.00
7 1.00 0.60 0.60 0.60 0.00 0.00 0.00 0.00
21 1.50 0.80 0.80 0.80 0.00 0.00 0.00 0.00
35 7.00 1.20 1.20 1.20 0.00 0.00 0.00 0.00
Mean 3.17 0.87 0.87 0.87 0.00 0.00 0.00 0.00
L.S.D. S = 0.3652 T = 0.5007 S&T = 0.0945
Table (11): illustrates Sensory evaluation of onion by scaling method using10-pointscalenumber of samples used.
Sensory evaluation
Type of samples Type of coating material Color Taste aroma overall acceptability
fresh onion samples whole
Control 10.00
10.00 10.00 10.00
A 8.00 5.00 5.00 6.00
B 7.00 5.00 5.00 5.00
C - - - -
D 10.00 9.00 9.00 9.00
E 9.00 8.00 8.00 9.00
F 9.00 7.00 7.00 7.00
G 10.00 7.00 7.00 9.00
fresh onion samples slices
Control 10.00 10.00 10.00 10.00
A 8.00 5.00 5.00 5.00
B 7.00 4.00 4.00 4.00
C - - - -
D 10.00 9.00 9.00 9.00
E 9.00 8.00 8.00 8.00
F 9.00 7.00 7.00 7.00
G 10.00 7.00 7.00 8.00
Dried onion slices Control 10.00 10.00 10.00 10.00
A 7.00 7.00 7.00 7.00
B 6.00 6.00 6.00 6.00
C 5.00 4.00 4.00 3.00
D 10.00 9.00 9.00 9.00
E 9.00 9.00 9.00 9.00
F 8.00 9.00 9.00 9.00
G 10.00 8.00 8.00 10.00
Egypt. J. Agric. Res., (2020), 98 (4), 613-633
627
3.1.11. Sensory evaluation: Edible coating and storage time can cause changes in the sensory properties of the product, so it's best if food coated with various materials which appropriate to consumers. Table (11) illustrates sensory evaluation of (Rojas-Graü et al., 2009) by scaling method using10-pointscalenumber of different samples studied. Sensory evaluations of coated and uncoated onion samples were conducted after 35 days of storage for color, taste, aroma, and overall acceptability. It's important to note that all edible coatings using nano material had excellent general acceptance in the range of (7-10) that didn't change dramatically when compared to other material, which had an average acceptability of (4-6) that was significantly higher P<0.05, while the overall acceptability of the dried onion slices coated with nano materials had excellent acceptability (9) compared with the overall acceptability of the dried ranged between (4-7) as compared with untreated dried onion slices. The overall acceptability was significantly reduced (P 0.05) within limits (3) at the end of the normal storage period. Compact coatings distinguished with nano preserving both color – taste, the strong aroma of fresh and dried onion. Samples coated with starch treatment (C) were spoiled after 7 days of storage as well as control samples. These findings are consistent with those of Anju and Salil. (2010) who discovered that the taste of dried onion slices is superior to that of fresh onion slices, owing to the higher concentration of total sugars in dried onion slices compared to fresh onions.
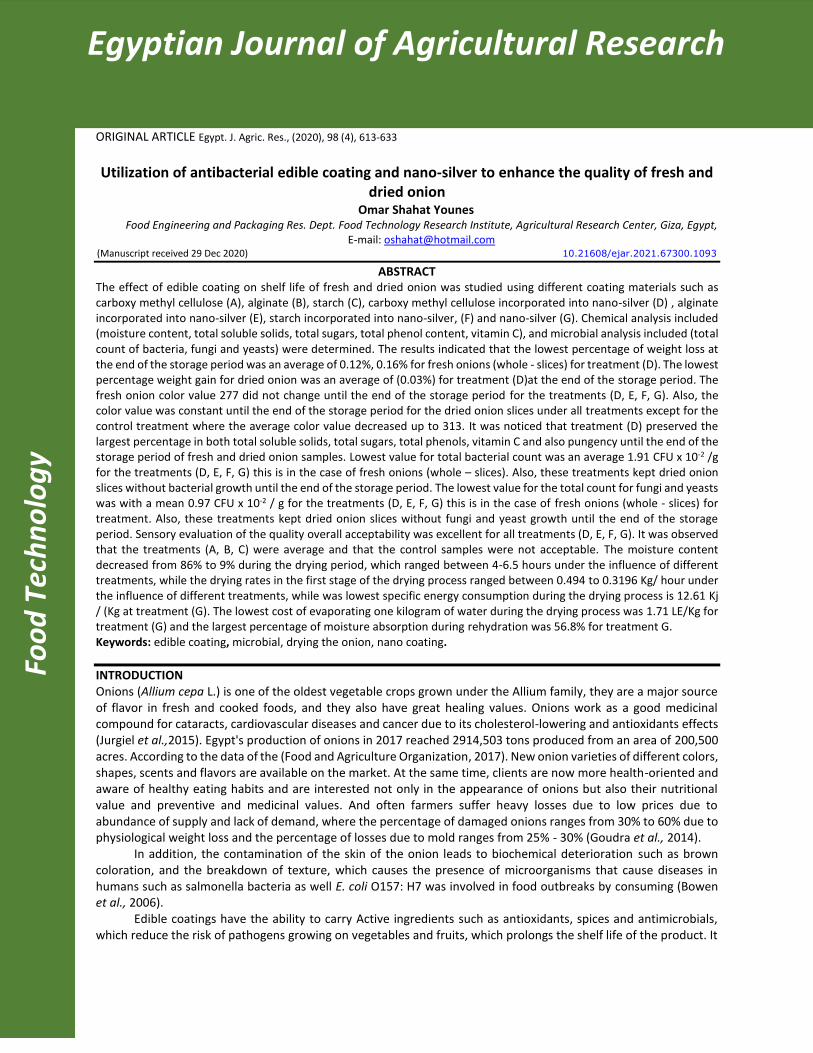
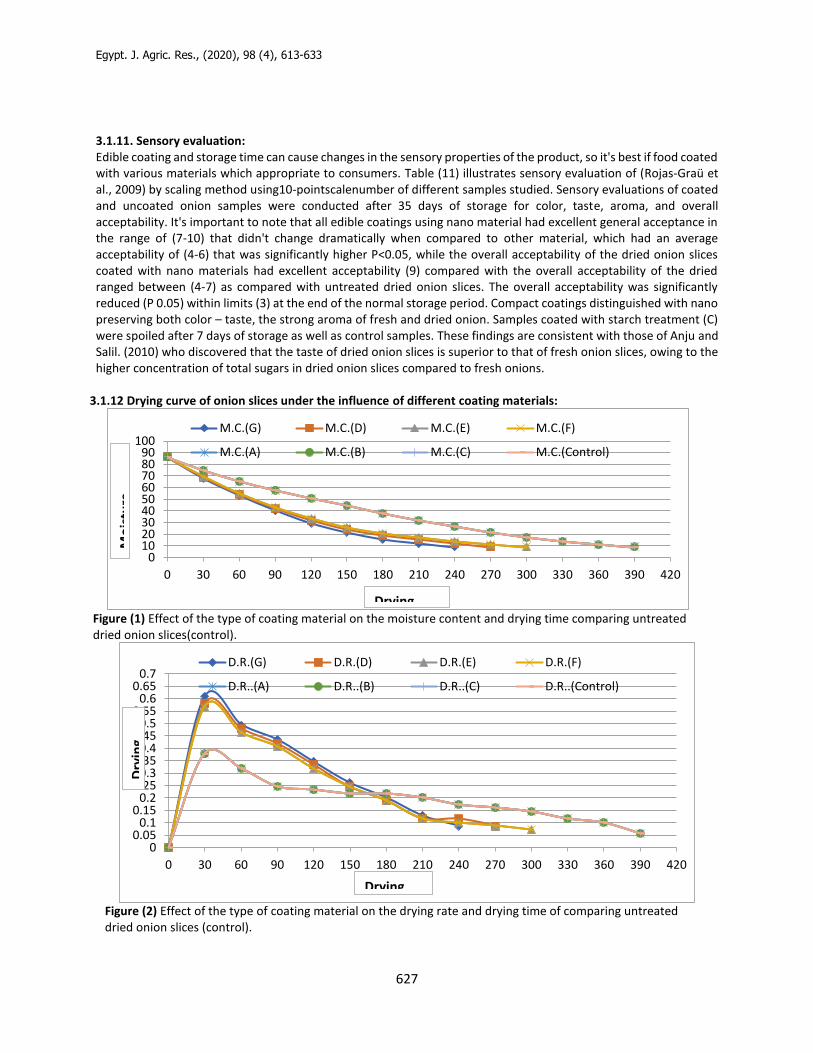
3.1.12 Drying curve of onion slices under the influence of different coating materials:
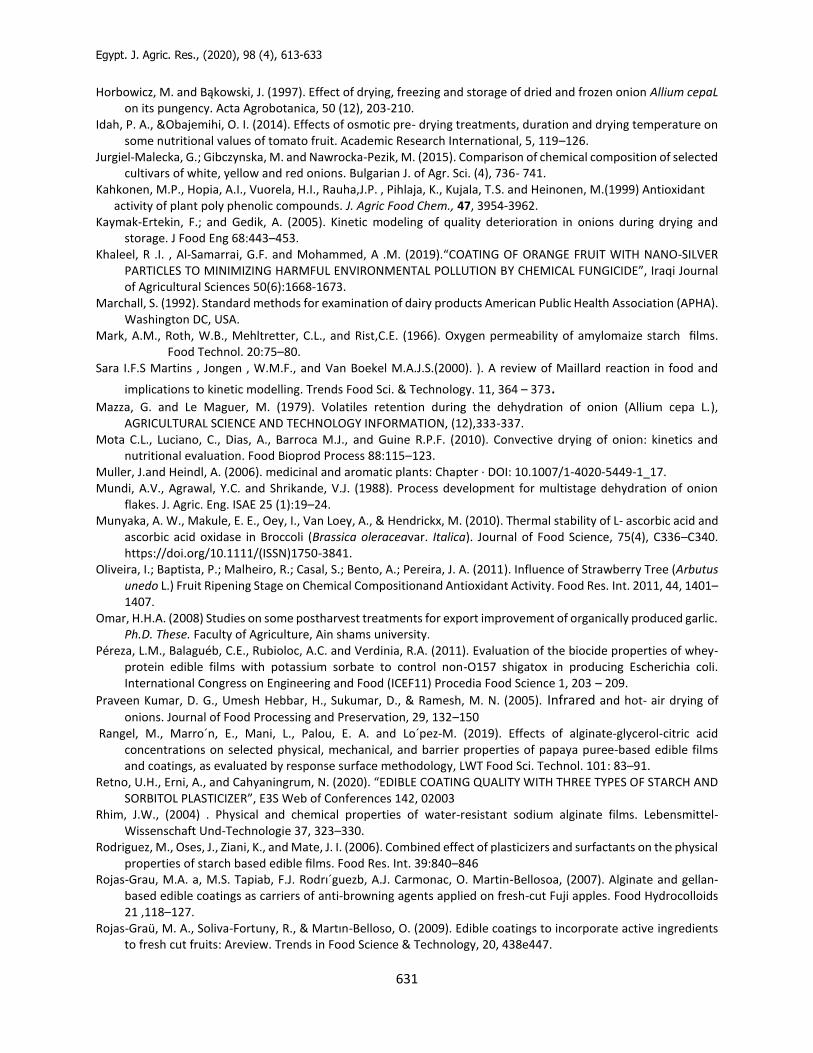
Figure (1) Effect of the type of coating material on the moisture content and drying time comparing untreated dried onion slices(control).
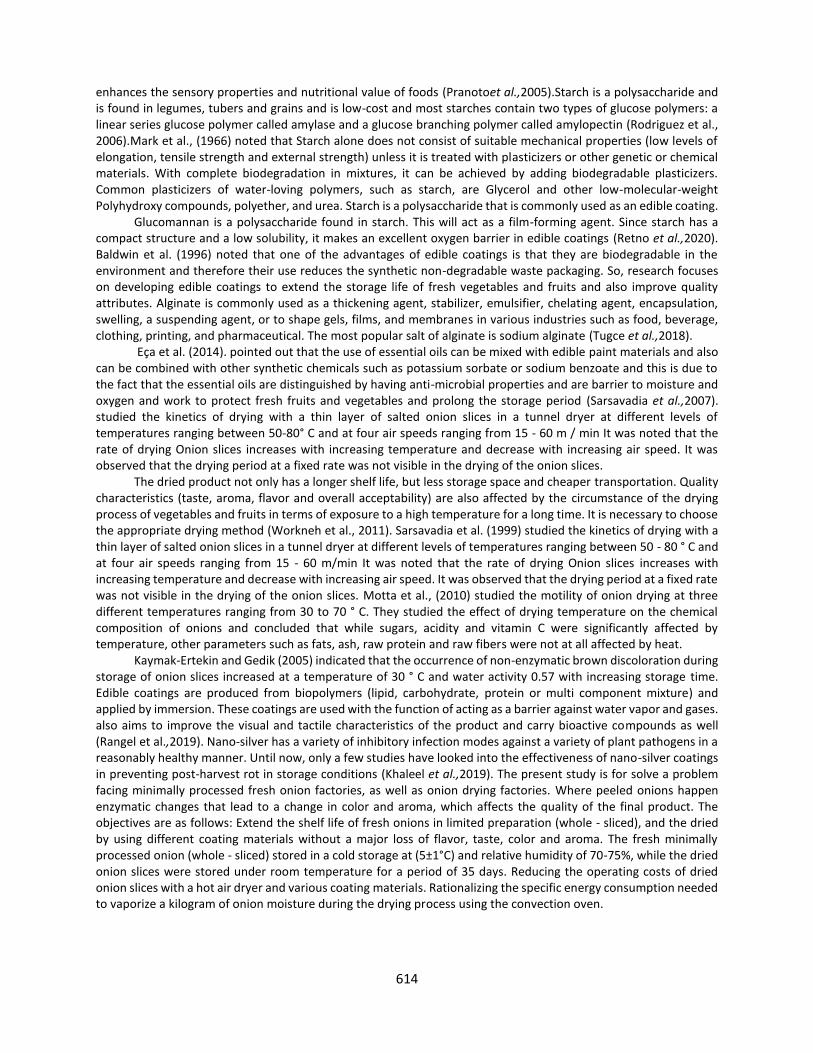
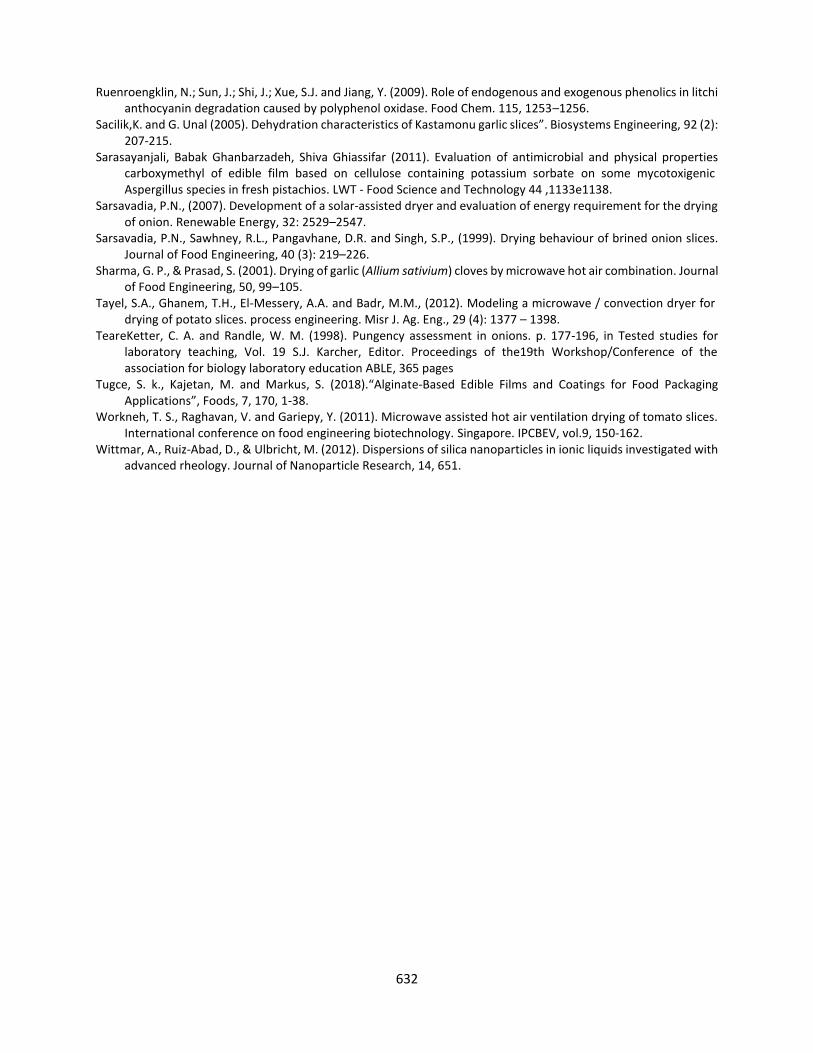
Figure (2) Effect of the type of coating material on the drying rate and drying time of comparing untreated dried onion slices (control).
0102030405060708090
100
0 30 60 90 120 150 180 210 240 270 300 330 360 390 420
M.C.(G) M.C.(D) M.C.(E) M.C.(F)
M.C.(A) M.C.(B) M.C.(C) M.C.(Control)
Mo
istu
re
Drying
00.05
0.10.15
0.20.25
0.30.35
0.40.45
0.50.55
0.60.65
0.7
0 30 60 90 120 150 180 210 240 270 300 330 360 390 420
D.R.(G) D.R.(D) D.R.(E) D.R.(F)
D.R..(A) D.R..(B) D.R..(C) D.R..(Control)
Drying
Dry
ing
628
3.1.12. Moisture content and drying rate of onion slices during the drying process: Onion samples were dried at initial moisture content86.1901 for all treatments in two stages using a convection oven at a constant air velocity of 0.5 m/S. The drying temperature of the first stage was 90 ° C for 60 minutes to remove of 53.057 % to 65.264 % of the initial moisture content during the drying process of onion slices under all treatments. The temperature used in the second stage was 60 ° C for 3-5.3 hours until the weight stabilized to reach a final moisture content of 9% for all dried onion samples.
Figures (1) and (2) shows the effect of drying time on moisture content and drying rate for different samples of coated and uncoated onion it was observed that the moisture content decreased rapidly at the beginning of the drying process then decreased slowly with increasing time of drying. Also, the drying rate increase for the first 60 min. then began to decrease with increasing drying time, due to the fact that the high temperature in the first stage of the drying process gives high thermal energy that works in conjunction with nano materials and different coatings to increase the size of the interstitial distances of onion chip cells, which leads to an increase in the rate of evaporation of water relative to time during this stage.
Initial moisture content decreased from 86.19% to 53.05%and the highest drying rate was 0.49 (Kg) / (hour) for onion samples treated with nano silver(G).Followed by onion slices treated with (D or E) as initial moisture content was decreased from 86.19% to 54.36 % with drying rate 0.47(Kg) / ( hour),then treatment ( F ) with moisture content 55.23 % and drying rate 0.46(Kg) / ( hour)followed by treatment A,B,C and control samples, the initial moisture content has decreased from 86.19% to 65.26 %, with the lowest drying rate was 0.31(Kg)/ ( hour).It is also noted that the remaining moisture was slowly eliminated with an increase in drying time during the second stage of the drying process to reach a final moisture content of 9% during a drying time of 4 hours fin the case of coating onion slices with nano material only, 4.30 hours for onion slices coated with nano materials incorporated into carboxy methyl cellulose or alginate, 5 hours for onion slices coated with nano materials incorporated into starch, 5.30 hours onion slices coated with carboxy methyl cellulose or alginate or starch also onion slices that are not coated ( control).
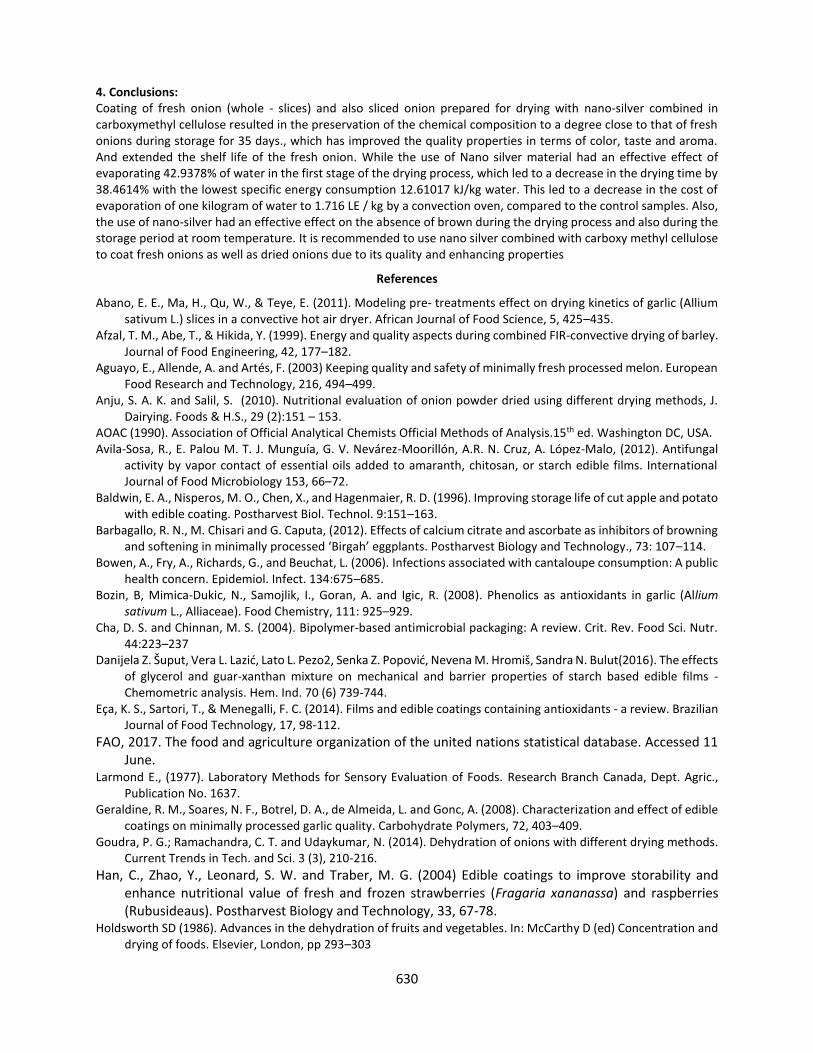
These results agreed with Holdsworth (1986) and Mundi et al. (1988) stated that drying process of onion slices with a thickness of 3 mm is carried out in four stages - the first stage at a temperature of 90 ᴼC to remove 50% of the moisture while the second stage at a temperature of 80 ᴼC to remove from 50 to 40% of the moisture while the third at a temperature of 70 ° C to remove from 40 to 30% of the moisture. The fourth stage at a temperature of 50 ° C to reach a moisture content of 8% can be used to save 25% of the drying time compared to the time required for two-stage drying. 3.1.13. specific energy consumption and cost: The cost of a kg of evaporated water was determined by multiplying the amount of specific energy needed to evaporate a kg of water by the price of one kw on the basis that the price of kw is 1.52 pounds, as shown in Table (13).The results shown in Table (13) indicate that onion slices coated with CMC, alginate and starch as well as control samples achieved the lowest percentage of evaporated water 27.11 % in the first stage of the drying process and the largest drying time was 6.50 hours who reached the greatest value of specific energy consumption 20.49 kJ/kg water. Onion samples coated with nano material reached the highest percentage of evaporated water42.93 % for the first stage of the drying process and the least drying time was 4 hours and the largest percentage of specific energy consumption was (38.46%) compared with dried control samples. Onion slices coated with treatments (D, E). The proportion of evaporated water in the first stage of drying process was (41.24%) and the rate of decrease in both the drying time and the specific energy consumption reached 30.76%. For onion slices coated treatment (G) the proportion of evaporated water in the first stage of the drying process was 40.11%, and the percentage of decrease in both the drying time and the specific energy consumption reached 23.07 %, these results agreed with Afzal et al. (1999).
Where the lowest cost of evaporation was one kilogram of water when drying onion, slices coated with nano-silver only 1.71 pounds. Followed by onion slices coated with nano-silver mixed with carboxy methyl cellulose or alginate where the cost of evaporation of one kilogram of water was 1.93 pounds. Followed by onion slices coated with nano-silver mixed with starch, the cost of evaporating one kilogram of water was 2.14 pounds. While each of the onion slices coated with carboxy methyl cellulose or alginate or starch and onion slices, the control achieved the highest cost of evaporating one kilogram of water 2.79 pounds.
Egypt. J. Agric. Res., (2020), 98 (4), 613-633
629
Table (13) The effect of different coating materials on specific energy consumption drying time, and the cost of evaporation of 1 kg of water during drying process of 4 kg of onion slices using convection oven.
Type of coating material
specific energy consumption (Kj) / (Kg)to
remove 3.54 kg of water
proportion int he specific
energy consumption
(%)
Drying time
(hour)
proportion in the
drying time (%)
Weight of evaporated
water in the first
stage (kg)
proportion of evaporated water in the first stage,
from a total of 3.540 kg of
water
cost of evaporation of 3.54 kg of
water (LE/ Kg) or cost of
drying 4 kg onion
(LE/ Kg)
cost of evaporation
of 1 kg of water
(LE/ Kg)
Control 20.49 0% 6.50 0% 0.96 Kg 27.11 % 9.88 2.79
A 20.4915 0% 6.50 0% 0.96 Kg 27.11 % 9.88 2.79
B 20.49 0% 6.50 0% 0.96 Kg 27.11 % 9.88 2.79
C 20.49 0% 6.50 0% 0.96 Kg 27.11 % 9.88 2.79
D 14.18 30.7693% 4.50 30.76% 1.46 Kg 41.24 % 6.84 1.93
E 14.18 30.7693% 4.50 30.76% 1.46 Kg 41.24 % 6.84 1.93
F 15.76 23.0768 % 5.00 23.07% 1.42 Kg 40.11 % 7.6 2.14
G 12.61 38.4614% 4.00 38.46% 1.52 Kg 42.93 % 6.08 1.71
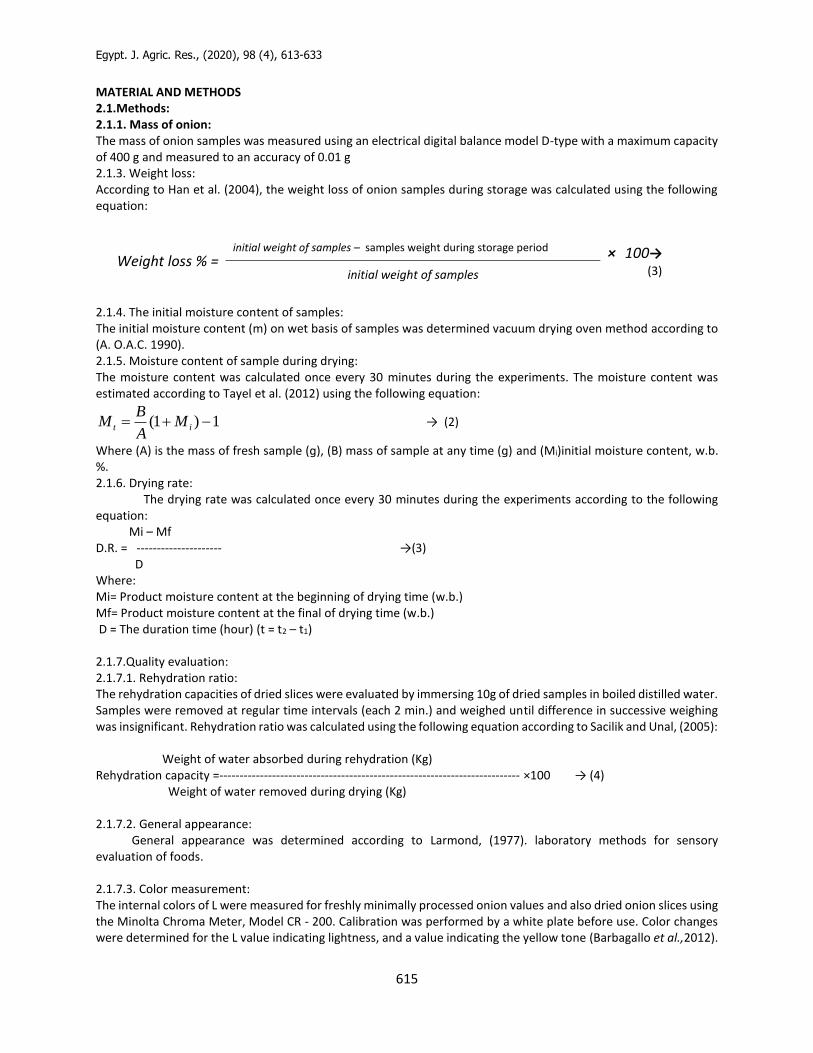
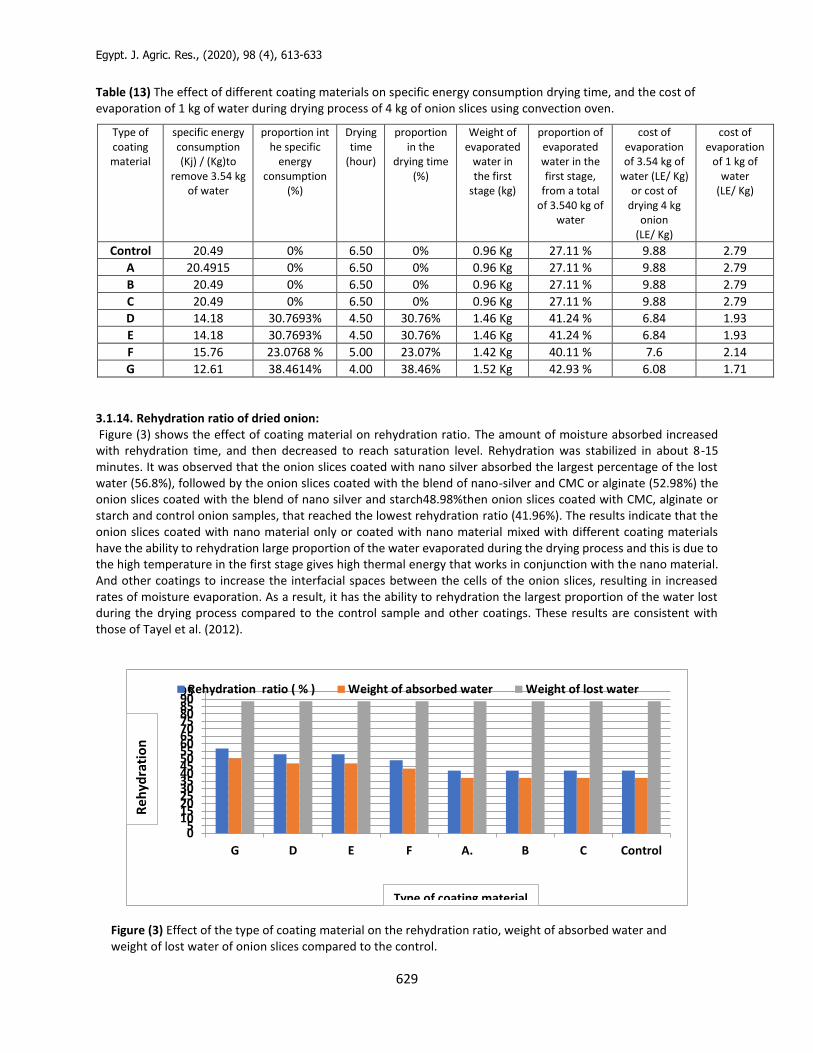
3.1.14. Rehydration ratio of dried onion: Figure (3) shows the effect of coating material on rehydration ratio. The amount of moisture absorbed increased with rehydration time, and then decreased to reach saturation level. Rehydration was stabilized in about 8-15 minutes. It was observed that the onion slices coated with nano silver absorbed the largest percentage of the lost water (56.8%), followed by the onion slices coated with the blend of nano-silver and CMC or alginate (52.98%) the onion slices coated with the blend of nano silver and starch48.98%then onion slices coated with CMC, alginate or starch and control onion samples, that reached the lowest rehydration ratio (41.96%). The results indicate that the onion slices coated with nano material only or coated with nano material mixed with different coating materials have the ability to rehydration large proportion of the water evaporated during the drying process and this is due to the high temperature in the first stage gives high thermal energy that works in conjunction with the nano material. And other coatings to increase the interfacial spaces between the cells of the onion slices, resulting in increased rates of moisture evaporation. As a result, it has the ability to rehydration the largest proportion of the water lost during the drying process compared to the control sample and other coatings. These results are consistent with those of Tayel et al. (2012).
Figure (3) Effect of the type of coating material on the rehydration ratio, weight of absorbed water and weight of lost water of onion slices compared to the control.
05
101520253035404550556065707580859095
G D E F A. B C Control
Rehydration ratio ( % ) Weight of absorbed water Weight of lost water
Re
hyd
rati
on
rati
o (
% )
Type of coating material
630
4. Conclusions: Coating of fresh onion (whole - slices) and also sliced onion prepared for drying with nano-silver combined in carboxymethyl cellulose resulted in the preservation of the chemical composition to a degree close to that of fresh onions during storage for 35 days., which has improved the quality properties in terms of color, taste and aroma. And extended the shelf life of the fresh onion. While the use of Nano silver material had an effective effect of evaporating 42.9378% of water in the first stage of the drying process, which led to a decrease in the drying time by 38.4614% with the lowest specific energy consumption 12.61017 kJ/kg water. This led to a decrease in the cost of evaporation of one kilogram of water to 1.716 LE / kg by a convection oven, compared to the control samples. Also, the use of nano-silver had an effective effect on the absence of brown during the drying process and also during the storage period at room temperature. It is recommended to use nano silver combined with carboxy methyl cellulose to coat fresh onions as well as dried onions due to its quality and enhancing properties
References
Abano, E. E., Ma, H., Qu, W., & Teye, E. (2011). Modeling pre- treatments effect on drying kinetics of garlic (Allium sativum L.) slices in a convective hot air dryer. African Journal of Food Science, 5, 425–435.
Afzal, T. M., Abe, T., & Hikida, Y. (1999). Energy and quality aspects during combined FIR-convective drying of barley. Journal of Food Engineering, 42, 177–182.
Aguayo, E., Allende, A. and Artés, F. (2003) Keeping quality and safety of minimally fresh processed melon. European Food Research and Technology, 216, 494–499.
Anju, S. A. K. and Salil, S. (2010). Nutritional evaluation of onion powder dried using different drying methods, J. Dairying. Foods & H.S., 29 (2):151 – 153.
AOAC (1990). Association of Official Analytical Chemists Official Methods of Analysis.15th ed. Washington DC, USA. Avila-Sosa, R., E. Palou M. T. J. Munguía, G. V. Nevárez-Moorillón, A.R. N. Cruz, A. López-Malo, (2012). Antifungal
activity by vapor contact of essential oils added to amaranth, chitosan, or starch edible films. International Journal of Food Microbiology 153, 66–72.
Baldwin, E. A., Nisperos, M. O., Chen, X., and Hagenmaier, R. D. (1996). Improving storage life of cut apple and potato with edible coating. Postharvest Biol. Technol. 9:151–163.
Barbagallo, R. N., M. Chisari and G. Caputa, (2012). Effects of calcium citrate and ascorbate as inhibitors of browning and softening in minimally processed ‘Birgah’ eggplants. Postharvest Biology and Technology., 73: 107–114.
Bowen, A., Fry, A., Richards, G., and Beuchat, L. (2006). Infections associated with cantaloupe consumption: A public health concern. Epidemiol. Infect. 134:675–685.
Bozin, B, Mimica-Dukic, N., Samojlik, I., Goran, A. and Igic, R. (2008). Phenolics as antioxidants in garlic (Allium sativum L., Alliaceae). Food Chemistry, 111: 925–929.
Cha, D. S. and Chinnan, M. S. (2004). Bipolymer-based antimicrobial packaging: A review. Crit. Rev. Food Sci. Nutr. 44:223–237
Danijela Z. Šuput, Vera L. Lazić, Lato L. Pezo2, Senka Z. Popović, Nevena M. Hromiš, Sandra N. Bulut(2016). The effects of glycerol and guar-xanthan mixture on mechanical and barrier properties of starch based edible films - Chemometric analysis. Hem. Ind. 70 (6) 739-744.
Eça, K. S., Sartori, T., & Menegalli, F. C. (2014). Films and edible coatings containing antioxidants - a review. Brazilian Journal of Food Technology, 17, 98-112.
FAO, 2017. The food and agriculture organization of the united nations statistical database. Accessed 11 June.
Larmond E., (1977). Laboratory Methods for Sensory Evaluation of Foods. Research Branch Canada, Dept. Agric., Publication No. 1637.
Geraldine, R. M., Soares, N. F., Botrel, D. A., de Almeida, L. and Gonc, A. (2008). Characterization and effect of edible coatings on minimally processed garlic quality. Carbohydrate Polymers, 72, 403–409.
Goudra, P. G.; Ramachandra, C. T. and Udaykumar, N. (2014). Dehydration of onions with different drying methods. Current Trends in Tech. and Sci. 3 (3), 210-216.
Han, C., Zhao, Y., Leonard, S. W. and Traber, M. G. (2004) Edible coatings to improve storability and enhance nutritional value of fresh and frozen strawberries (Fragaria xananassa) and raspberries (Rubusideaus). Postharvest Biology and Technology, 33, 67-78.
Holdsworth SD (1986). Advances in the dehydration of fruits and vegetables. In: McCarthy D (ed) Concentration and drying of foods. Elsevier, London, pp 293–303
Egypt. J. Agric. Res., (2020), 98 (4), 613-633
631
Horbowicz, M. and Bąkowski, J. (1997). Effect of drying, freezing and storage of dried and frozen onion Allium cepaL on its pungency. Acta Agrobotanica, 50 (12), 203-210.
Idah, P. A., &Obajemihi, O. I. (2014). Effects of osmotic pre- drying treatments, duration and drying temperature on some nutritional values of tomato fruit. Academic Research International, 5, 119–126.
Jurgiel-Malecka, G.; Gibczynska, M. and Nawrocka-Pezik, M. (2015). Comparison of chemical composition of selected cultivars of white, yellow and red onions. Bulgarian J. of Agr. Sci. (4), 736- 741.
Kahkonen, M.P., Hopia, A.I., Vuorela, H.I., Rauha,J.P. , Pihlaja, K., Kujala, T.S. and Heinonen, M.(1999) Antioxidant activity of plant poly phenolic compounds. J. Agric Food Chem., 47, 3954-3962. Kaymak-Ertekin, F.; and Gedik, A. (2005). Kinetic modeling of quality deterioration in onions during drying and
storage. J Food Eng 68:443–453. Khaleel, R .I. , Al-Samarrai, G.F. and Mohammed, A .M. (2019).“COATING OF ORANGE FRUIT WITH NANO-SILVER
PARTICLES TO MINIMIZING HARMFUL ENVIRONMENTAL POLLUTION BY CHEMICAL FUNGICIDE”, Iraqi Journal of Agricultural Sciences 50(6):1668-1673.
Marchall, S. (1992). Standard methods for examination of dairy products American Public Health Association (APHA). Washington DC, USA.
Mark, A.M., Roth, W.B., Mehltretter, C.L., and Rist,C.E. (1966). Oxygen permeability of amylomaize starch films. Food Technol. 20:75–80.
Sara I.F.S Martins , Jongen , W.M.F., and Van Boekel M.A.J.S.(2000). ). A review of Maillard reaction in food and
implications to kinetic modelling. Trends Food Sci. & Technology. 11, 364 – 373. Mazza, G. and Le Maguer, M. (1979). Volatiles retention during the dehydration of onion (Allium cepa L.),
AGRICULTURAL SCIENCE AND TECHNOLOGY INFORMATION, (12),333-337. Mota C.L., Luciano, C., Dias, A., Barroca M.J., and Guine R.P.F. (2010). Convective drying of onion: kinetics and
nutritional evaluation. Food Bioprod Process 88:115–123. Muller, J.and Heindl, A. (2006). medicinal and aromatic plants: Chapter · DOI: 10.1007/1-4020-5449-1_17. Mundi, A.V., Agrawal, Y.C. and Shrikande, V.J. (1988). Process development for multistage dehydration of onion
flakes. J. Agric. Eng. ISAE 25 (1):19–24. Munyaka, A. W., Makule, E. E., Oey, I., Van Loey, A., & Hendrickx, M. (2010). Thermal stability of L- ascorbic acid and
ascorbic acid oxidase in Broccoli (Brassica oleraceavar. Italica). Journal of Food Science, 75(4), C336–C340. https://doi.org/10.1111/(ISSN)1750-3841.
Oliveira, I.; Baptista, P.; Malheiro, R.; Casal, S.; Bento, A.; Pereira, J. A. (2011). Influence of Strawberry Tree (Arbutus unedo L.) Fruit Ripening Stage on Chemical Compositionand Antioxidant Activity. Food Res. Int. 2011, 44, 1401–1407.
Omar, H.H.A. (2008) Studies on some postharvest treatments for export improvement of organically produced garlic. Ph.D. These. Faculty of Agriculture, Ain shams university.
Péreza, L.M., Balaguéb, C.E., Rubioloc, A.C. and Verdinia, R.A. (2011). Evaluation of the biocide properties of whey-protein edible films with potassium sorbate to control non-O157 shigatox in producing Escherichia coli. International Congress on Engineering and Food (ICEF11) Procedia Food Science 1, 203 – 209.
Praveen Kumar, D. G., Umesh Hebbar, H., Sukumar, D., & Ramesh, M. N. (2005). Infrared and hot- air drying of
onions. Journal of Food Processing and Preservation, 29, 132–150 Rangel, M., Marro´n, E., Mani, L., Palou, E. A. and Lo´pez-M. (2019). Effects of alginate-glycerol-citric acid
concentrations on selected physical, mechanical, and barrier properties of papaya puree-based edible films and coatings, as evaluated by response surface methodology, LWT Food Sci. Technol. 101: 83–91.
Retno, U.H., Erni, A., and Cahyaningrum, N. (2020). “EDIBLE COATING QUALITY WITH THREE TYPES OF STARCH AND SORBITOL PLASTICIZER”, E3S Web of Conferences 142, 02003
Rhim, J.W., (2004) . Physical and chemical properties of water-resistant sodium alginate films. Lebensmittel-Wissenschaft Und-Technologie 37, 323–330.
Rodriguez, M., Oses, J., Ziani, K., and Mate, J. I. (2006). Combined effect of plasticizers and surfactants on the physical properties of starch based edible films. Food Res. Int. 39:840–846
Rojas-Grau, M.A. a, M.S. Tapiab, F.J. Rodrı´guezb, A.J. Carmonac, O. Martin-Bellosoa, (2007). Alginate and gellan-based edible coatings as carriers of anti-browning agents applied on fresh-cut Fuji apples. Food Hydrocolloids 21 ,118–127.
Rojas-Graü, M. A., Soliva-Fortuny, R., & Martın-Belloso, O. (2009). Edible coatings to incorporate active ingredients to fresh cut fruits: Areview. Trends in Food Science & Technology, 20, 438e447.
632
Ruenroengklin, N.; Sun, J.; Shi, J.; Xue, S.J. and Jiang, Y. (2009). Role of endogenous and exogenous phenolics in litchi anthocyanin degradation caused by polyphenol oxidase. Food Chem. 115, 1253–1256.
Sacilik,K. and G. Unal (2005). Dehydration characteristics of Kastamonu garlic slices”. Biosystems Engineering, 92 (2): 207-215.
Sarasayanjali, Babak Ghanbarzadeh, Shiva Ghiassifar (2011). Evaluation of antimicrobial and physical properties carboxymethyl of edible film based on cellulose containing potassium sorbate on some mycotoxigenic Aspergillus species in fresh pistachios. LWT - Food Science and Technology 44 ,1133e1138.
Sarsavadia, P.N., (2007). Development of a solar-assisted dryer and evaluation of energy requirement for the drying of onion. Renewable Energy, 32: 2529–2547.
Sarsavadia, P.N., Sawhney, R.L., Pangavhane, D.R. and Singh, S.P., (1999). Drying behaviour of brined onion slices. Journal of Food Engineering, 40 (3): 219–226.
Sharma, G. P., & Prasad, S. (2001). Drying of garlic (Allium sativium) cloves by microwave hot air combination. Journal of Food Engineering, 50, 99–105.
Tayel, S.A., Ghanem, T.H., El-Messery, A.A. and Badr, M.M., (2012). Modeling a microwave / convection dryer for drying of potato slices. process engineering. Misr J. Ag. Eng., 29 (4): 1377 – 1398.
TeareKetter, C. A. and Randle, W. M. (1998). Pungency assessment in onions. p. 177-196, in Tested studies for laboratory teaching, Vol. 19 S.J. Karcher, Editor. Proceedings of the19th Workshop/Conference of the association for biology laboratory education ABLE, 365 pages
Tugce, S. k., Kajetan, M. and Markus, S. (2018).“Alginate-Based Edible Films and Coatings for Food Packaging Applications”, Foods, 7, 170, 1-38.
Workneh, T. S., Raghavan, V. and Gariepy, Y. (2011). Microwave assisted hot air ventilation drying of tomato slices. International conference on food engineering biotechnology. Singapore. IPCBEV, vol.9, 150-162.
Wittmar, A., Ruiz-Abad, D., & Ulbricht, M. (2012). Dispersions of silica nanoparticles in ionic liquids investigated with advanced rheology. Journal of Nanoparticle Research, 14, 651.
Egypt. J. Agric. Res., (2020), 98 (4), 613-633
633
ن جودة الفضة و لألكل األغشية الصالحةاألستفادة من يا لتحسير النانوية المضادة للبكتير البصل الطازج والمجفف
عمر شحاته يونس
مصر –الجيزه –مركز البحوث الزراعية -معهد بحوث تكنولوجيا األغذيه
تأثير دراسة الصالحةتمت باستخدام األغشية والمجفف الطازج البصل )محتوى اغشيةلألكل ومدة صالحية ي
الكيميائ التحليل مختلفة. وشمل ي ش )ج( ، الحرافية. والتحليل الميكروئ
ن مل ) العد الكل الرطوبة ، المواد الصلبة الذائبة الكلية ، السكريات الكلية ، محتوى الفينول الكلي ، فيتاميريا والفطريات والخ مائر(. للبكير
ة التخزين كانت بمتوسط أقل نسبة للفقد ي الوزن عند نهاية فيرائح البصل D٪ للمعاملة )0,16٪ ، 0,12فن ي حالة البصل الكامل وشر
( فني الوزن بمتوسط) الطازج. كانت أقل نسبة
ة تخزينD٪( للمعاملة )0,03للزيادة فن ي نهاية فيرائح البصل المجفف. ( فن البصل الطازج لم تتغير قيمة لون شر
ة التخزين ائح البصل المجفف تحتD ،E ،F ،Gللمعامالت ) 277حتر نهاية فير ة التخزين لشر جميع. ( وكذلك كانت قيمة اللون ثابتة حتر نهاية فيرول المعامالت . 313قيمة اللون حتر حيث انخفض متوسط باستثناء معاملة الكنير
ن ( حافظت عل النسDلوحظ أن المعاملة ) Cبة األكي لكل من المواد الصلبة الذائبة الكلية والسكريات الكلية والفينوالت الكلية وفيتاميرة التخزين لعينات البصل الطازج والمجفف. وكذلك الحرافية حتر نهاية فير
ى بمتوسط كانت أقل قيمة للعد ي D ،E ،F ،Gللمعامالت ) / جم CFU × 10-2( 1.91)البكتيرائح البصل ( وهذا فن حالة البصل الكامل وشر
ا ، حافظت هذه المعامالتً. أيض ة التخزين الطازج عل التوالي ي حتر نهاية فير ائح البصل المجففة دون نمو بكتير كانت أقل قيمة للعد الكلي .عل شر
ي حالة D ،E ،F ،Gللمعامالت ) / جم CFU × 10-2( 0.97)للفطريات والخمائر بمتوسط ائح البصل الطازج عل التوالي ( وهذا فن البصل الكامل وشر
ائح البصل المجففة بدون نمو ا حافظت هذه المعامالت عل شرًة التخزين. كان التقييم الحسي الفطريات والخمائر . أيض للقبول العام حتر نهاية فير
ن ) ا لكل من المعاملتيرًمتوسطة وأن عينات التحكم غير مقبولة ، وانخفض محتوى ( كانتA ،B ،C( ولوحظ أن المعامالت )D ،E ،F ،Gممتاز
ن 9 -٪ 86الرطوبة من ي تراوحت بيرة التجفيف والتر ي 6.5-4٪ خالل فير
ساعات تحت تأثير المعامالت المختلفة ، بينما تراوحت معدالت التجفيف فنن المعامالت المختلفة. بينما كان أقل استهالك نوعي للطاقة )كجم( / )ساعة( تحت تأثير 0.3196 - 0.494المرحلة األول من عملية التجفيف بير
) جنية 1.71(. ، أقل تكلفة لتبخير كيلوغرام واحد من الماء أثناء عملية التجفيف كانت G( عند المعاملة )Kg) / (Kj) 12.61أثناء عملية التجفيف هو (. G٪ للمعالجة ) 56.8جاع كانت ( وأكي نسبة امتصاص للرطوبة أثناء إعادة األسير Gللمعالجة ) كجم ( / ية -الميكروبات - البصل المجفف - األغشية الصالحةالكلمات المفتاحية: اغشية نانومير
Related Documents


