egtplot: A Python Package for Three-Strategy Evolutionary Games Inom Mirzaev 1, 2 , Drew FK Williamson 2 , and Jacob G Scott 2, 3 1 Mathematical Biosciences Institute, The Ohio State University 2 Department of Translational Hematology and Oncology Research, Cleveland Clinic Foundation 3 Department of Radiation Oncology, Cleveland Clinic Foundation DOI: 10.21105/joss.00735 Software • Review • Repository • Archive Submitted: 24 April 2018 Published: 17 June 2018 License Authors of papers retain copyright and release the work under a Cre- ative Commons Attribution 4.0 In- ternational License (CC-BY). Summary In the study of evolutionary game theory (EGT), there exists a need for open source software for the visualization of the dynamics of games. The Python package egtplot represents an attempt to make simple, visual analysis of a particular class of evolutionary games–those with three players and which can be represented by a payoff matrix. Using egtplot, these games can be visualized as static images or as animations with a variety of parameters to control what information is presented in the graphic. EGT is a reformulation of classical game theory wherein the players of the game are mem- bers of a population. These members do not choose a strategy, but instead are born with their strategy ingrained, i.e., they cannot change strategy during the game. In biological terms, the strategies might represent discrete species or genotypes, hawks and doves being a classic example. Payoffs the players gain or lose based on their interactions with other players increase or decrease their fitness, thereby influencing the number or proportion of members playing that strategy in the next generation. As such, the populations of strategies can wax and wane as they outcompete or are outcompeted by other strategies. As a very general model of cooperation and competition, EGT is well-suited for quantita- tive investigations of the dynamics of interactions between populations. EGT has been used to model phenomena from disparate areas of study, from poker (Javarone 2016) to hawks and doves (Smith and Price 1973) to host-parasite coevolution (Schenk, Traulsen, and Gokhale 2017). Example Usage in Research While there are many use cases for this software, our group’s particular focus is on the mathematical modeling of cancer and cancer therapies through evolutionary game theory (Kaznatcheev, Vander Velde, et al. 2017, Kaznatcheev, Scott, and Basanta (2015), Kaz- natcheev, Peacock, et al. (2017)). For details on analytical treatments of evolutionary games, please see Artem Kaznatcheev’s blog at Theory, Evolution, and Games Group. We demonstrate the features of egtplot via an example drawn from work modelling the interactions between cancer and healthy cells. Consider the following game from (Bas- anta et al. 2012) which describes the evolutionary game between three strategies of cells, labeled “S” (Stroma), “D” (micronenvironmentally dependent), and “I” (microenviron- mentally independent): S D I S 0 α 0 Mirzaev et al., (2018). egtplot: A Python Package for Three-Strategy Evolutionary Games. Journal of Open Source Software, 3(26), 735. https://doi.org/10.21105/joss.00735 1

Welcome message from author
This document is posted to help you gain knowledge. Please leave a comment to let me know what you think about it! Share it to your friends and learn new things together.
Transcript

egtplot: A Python Package for Three-StrategyEvolutionary GamesInom Mirzaev1, 2, Drew FK Williamson2, and Jacob G Scott2, 3
1 Mathematical Biosciences Institute, The Ohio State University 2 Department of TranslationalHematology and Oncology Research, Cleveland Clinic Foundation 3 Department of RadiationOncology, Cleveland Clinic FoundationDOI: 10.21105/joss.00735
Software• Review• Repository• Archive
Submitted: 24 April 2018Published: 17 June 2018
LicenseAuthors of papers retain copyrightand release the work under a Cre-ative Commons Attribution 4.0 In-ternational License (CC-BY).
Summary
In the study of evolutionary game theory (EGT), there exists a need for open sourcesoftware for the visualization of the dynamics of games. The Python package egtplotrepresents an attempt to make simple, visual analysis of a particular class of evolutionarygames–those with three players and which can be represented by a payoff matrix. Usingegtplot, these games can be visualized as static images or as animations with a varietyof parameters to control what information is presented in the graphic.EGT is a reformulation of classical game theory wherein the players of the game are mem-bers of a population. These members do not choose a strategy, but instead are born withtheir strategy ingrained, i.e., they cannot change strategy during the game. In biologicalterms, the strategies might represent discrete species or genotypes, hawks and doves beinga classic example. Payoffs the players gain or lose based on their interactions with otherplayers increase or decrease their fitness, thereby influencing the number or proportionof members playing that strategy in the next generation. As such, the populations ofstrategies can wax and wane as they outcompete or are outcompeted by other strategies.As a very general model of cooperation and competition, EGT is well-suited for quantita-tive investigations of the dynamics of interactions between populations. EGT has beenused to model phenomena from disparate areas of study, from poker (Javarone 2016) tohawks and doves (Smith and Price 1973) to host-parasite coevolution (Schenk, Traulsen,and Gokhale 2017).
Example Usage in Research
While there are many use cases for this software, our group’s particular focus is on themathematical modeling of cancer and cancer therapies through evolutionary game theory(Kaznatcheev, Vander Velde, et al. 2017, Kaznatcheev, Scott, and Basanta (2015), Kaz-natcheev, Peacock, et al. (2017)). For details on analytical treatments of evolutionarygames, please see Artem Kaznatcheev’s blog at Theory, Evolution, and Games Group.We demonstrate the features of egtplot via an example drawn from work modelling theinteractions between cancer and healthy cells. Consider the following game from (Bas-anta et al. 2012) which describes the evolutionary game between three strategies of cells,labeled “S” (Stroma), “D” (micronenvironmentally dependent), and “I” (microenviron-mentally independent):
S D IS 0 α 0
Mirzaev et al., (2018). egtplot: A Python Package for Three-Strategy Evolutionary Games. Journal of Open Source Software, 3(26), 735.https://doi.org/10.21105/joss.00735
1

S D ID 1 + α− β 1− 2β 1− β + ρI 1− γ 1− γ 1− γ
where α is the benefit derived from the cooperation between a S cell and a D cell, γ isthe cost of being microenvironmentally independent, β is the cost of extracting resourcesfrom the microenvironment, and ρ is the benefit derived by a D cell from paracrine growthfactors produced by I cells. This paper studies how the healthy cells that make up themajority of the prostate can cooperate and compete with mutant protate cells to producea clinically-detectable prostate cancer.Using our package, we can quickly and easily analyze this game numerically and visually.To start, let us choose some simple values for each parameter: α = 1, β = 1, γ = 1,and ρ = 1. Figure 1 illustrates the output of the static visualization with the defaultparameters. This simplex depicts stable equilibria within the S-D and D-I edges, unstableequilibria at each vertex, and shows that every initial condition on the S-I edge is a stableequilibria.
Figure 1: Standard output of the package for α = 1, β = 1, γ = 1, and ρ = 1.
Altering Plot Outputs
By altering the default values for the plotting function, a variety of different plottingstyles can be achieved as demonstrated in Figure 2.
Mirzaev et al., (2018). egtplot: A Python Package for Three-Strategy Evolutionary Games. Journal of Open Source Software, 3(26), 735.https://doi.org/10.21105/joss.00735
2
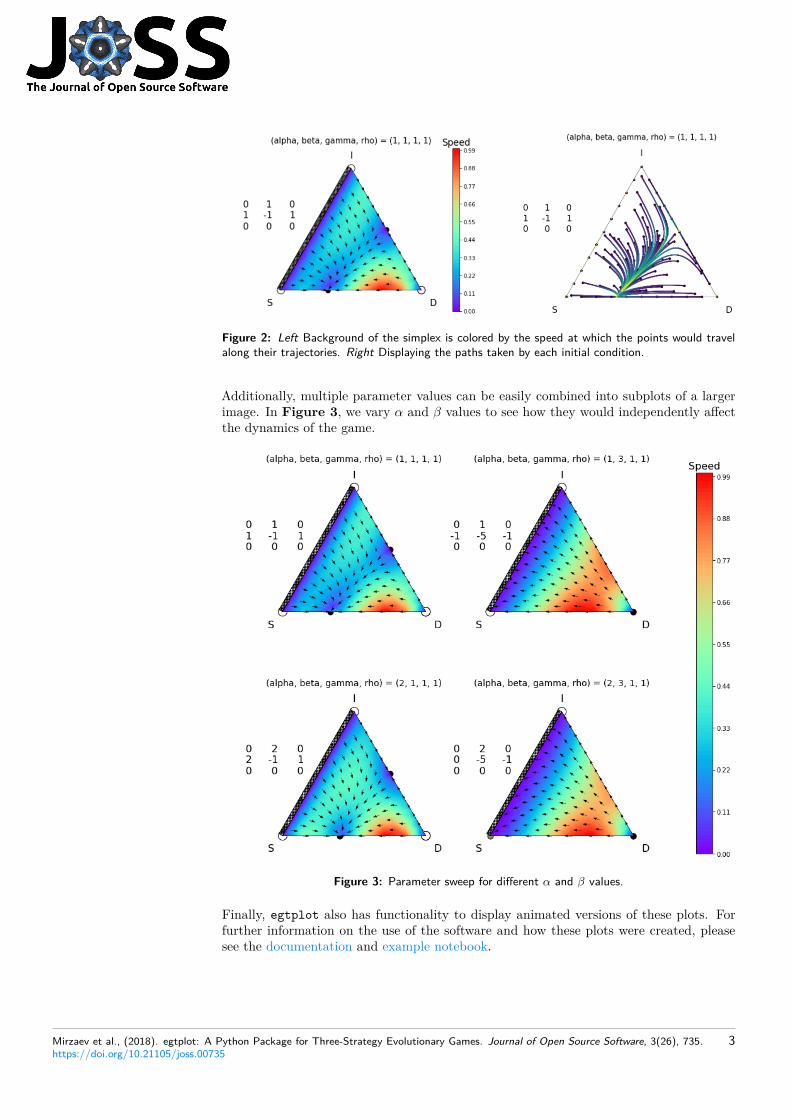
Figure 2: Left Background of the simplex is colored by the speed at which the points would travelalong their trajectories. Right Displaying the paths taken by each initial condition.
Additionally, multiple parameter values can be easily combined into subplots of a largerimage. In Figure 3, we vary α and β values to see how they would independently affectthe dynamics of the game.
Figure 3: Parameter sweep for different α and β values.
Finally, egtplot also has functionality to display animated versions of these plots. Forfurther information on the use of the software and how these plots were created, pleasesee the documentation and example notebook.
Mirzaev et al., (2018). egtplot: A Python Package for Three-Strategy Evolutionary Games. Journal of Open Source Software, 3(26), 735.https://doi.org/10.21105/joss.00735
3

Acknowledgements
The authors would like to thank Mathematical Biosciences Institue (MBI) at Ohio StateUniversity, for partially supporting this research. MBI receives its funding through theNational Science Foundation grant DMS 1440386. We gratefully acknowledge the workof Hanna Schenk whose code on her GitHub inspired this project.
Authorship
Inom Mirzaev and Drew FK Williamson contributed equally to this work.
References
Basanta, David, Jacob G Scott, Mayer N Fishman, Gustavo Ayala, Simon W Hayward,and Alexander RA Anderson. 2012. “Investigating Prostate Cancer Tumour–Stroma In-teractions: Clinical and Biological Insights from an Evolutionary Game.” British Journalof Cancer 106 (1). Nature Publishing Group:174–81.Javarone, Marco Alberto. 2016. “Modeling Poker Challenges by Evolutionary GameTheory.” Games 7 (4). Multidisciplinary Digital Publishing Institute:39.Kaznatcheev, Artem, Jeffrey Peacock, David Basanta, Andriy Marusyk, and Jacob G.Scott. 2017. “Fibroblasts and Alectinib Switch the Evolutionary Games That Non-SmallCell Lung Cancer Plays.” bioRxiv. Cold Spring Harbor Laboratory. https://doi.org/10.1101/179259.Kaznatcheev, Artem, Jacob G Scott, and David Basanta. 2015. “Edge Effects in Game-Theoretic Dynamics of Spatially Structured Tumours.” Journal of the Royal SocietyInterface 12 (108). The Royal Society:20150154.Kaznatcheev, Artem, Robert Vander Velde, Jacob G Scott, and David Basanta. 2017.“Cancer Treatment Scheduling and Dynamic Heterogeneity in Social Dilemmas of Tu-mour Acidity and Vasculature.” British Journal of Cancer 116 (6). Nature PublishingGroup:785.Schenk, Hanna, Arne Traulsen, and Chaitanya S Gokhale. 2017. “Chaotic Provinces inthe Kingdom of the Red Queen.” Journal of Theoretical Biology 431. Elsevier:1–10.Smith, J Maynard, and George R Price. 1973. “The Logic of Animal Conflict.” Nature246 (5427). Nature Publishing Group:15.
Mirzaev et al., (2018). egtplot: A Python Package for Three-Strategy Evolutionary Games. Journal of Open Source Software, 3(26), 735.https://doi.org/10.21105/joss.00735
4
Related Documents