ADP-Glo™ Kinase Assay Application Notes TYROSINE KINASE SERIES: EGFR EGFR Kinase Assay By Hicham Zegzouti, Ph.D., Jolanta Vidugiriene, Ph.D., and Said A. Goueli, Ph.D., Promega Corporation Scientific Background: EGFR is the receptor for members of the EGF family and is a transmembrane glycoprotein that has tyrosine kinase activity. Binding of epidermal growth factor to EGFR induces receptor dimerization and tyrosine autophosphorylation and leads to cell proliferation, differentiation, motility, and cell survival. Activation of EGFR triggers mitogenic signaling in gastrointestinal mucosa, and its expression is upregulated in colon cancers and most neoplasms. Activation of EGFR triggers activation of the ERK‐signaling pathway in normal gastric epithelial and colon cancer cell lines. Inactivation of EGFR with selective inhibitors significantly reduces ERK2 activation, c‐ fos mRNA expression and cell proliferation. 1. Wang K, et al: Epidermal growth factor receptor‐deficient mice have delayed primary endochondral ossification because of defective osteoclast recruitment. J. Biol. Chem. 279: 53848‐53856, 2004. 2. Kobayashi S, et al: EGFR mutation and resistance of non‐ small‐cell lung cancer to gefitinib. New Eng. J. Med. 352: 786‐792, 2005. ADP-Glo™ Kinase Assay Description ADP‐Glo™ Kinase Assay is a luminescent kinase assay that measures ADP formed from a kinase reaction; ADP is converted into ATP, which is converted into light by Ultra‐Glo™ Luciferase (Fig. 1). The luminescent signal positively correlates with ADP amount (Fig. 2) and kinase activity (Fig. 3A). The assay is well suited for measuring the effects chemical compounds have on the activity of a broad range of purified kinases—making it ideal for both primary screening as well as kinase selectivity profiling (Fig. 3B). The ADP‐Glo™ Kinase Assay can be used to monitor the activity of virtually any ADP‐generating enzyme (e.g., kinase or ATPase) using up to 1mM ATP. Figure 1. Principle of the ADP‐Glo™ Kinase Assay. The ATP remaining after completion of the kinase reaction is depleted prior to an ADP to ATP conversion step and quantitation of the newly synthesized ATP using luciferase/luciferin reaction. Figure 2. Linearity of the ADP‐Glo Kinase Assay. ATP‐to‐ADP conversion curve was prepared at 5μM ATP+ADP concentration range. This standard curve is used to calculate the amount of ADP formed in the kinase reaction. Z’ factors were determined using 200 replicates of each of the % conversions shown.

Welcome message from author
This document is posted to help you gain knowledge. Please leave a comment to let me know what you think about it! Share it to your friends and learn new things together.
Transcript
ADP-Glo™ Kinase Assay Application Notes
TYROSINE KINASE SERIES: EGFR EGFR Kinase Assay
By Hicham Zegzouti, Ph.D., Jolanta Vidugiriene, Ph.D., and Said A. Goueli, Ph.D., Promega Corporation Scientific Background: EGFR is the receptor for members of the EGF family and is a transmembrane glycoprotein that has tyrosine kinase activity. Binding of epidermal growth factor to EGFR induces receptor dimerization and tyrosine autophosphorylation and leads to cell proliferation, differentiation, motility, and cell survival. Activation of EGFR triggers mitogenic signaling in gastrointestinal mucosa, and its expression is upregulated in colon cancers and most neoplasms. Activation of EGFR triggers activation of the ERK‐signaling pathway in normal gastric epithelial and colon cancer cell lines. Inactivation of EGFR with selective inhibitors significantly reduces ERK2 activation, c‐fos mRNA expression and cell proliferation.
1. Wang K, et al: Epidermal growth factor receptor‐deficient mice have delayed primary endochondral ossification because of defective osteoclast recruitment. J. Biol. Chem. 279: 53848‐53856, 2004.
2. Kobayashi S, et al: EGFR mutation and resistance of non‐small‐cell lung cancer to gefitinib. New Eng. J. Med. 352: 786‐792, 2005.
ADP-Glo™ Kinase Assay
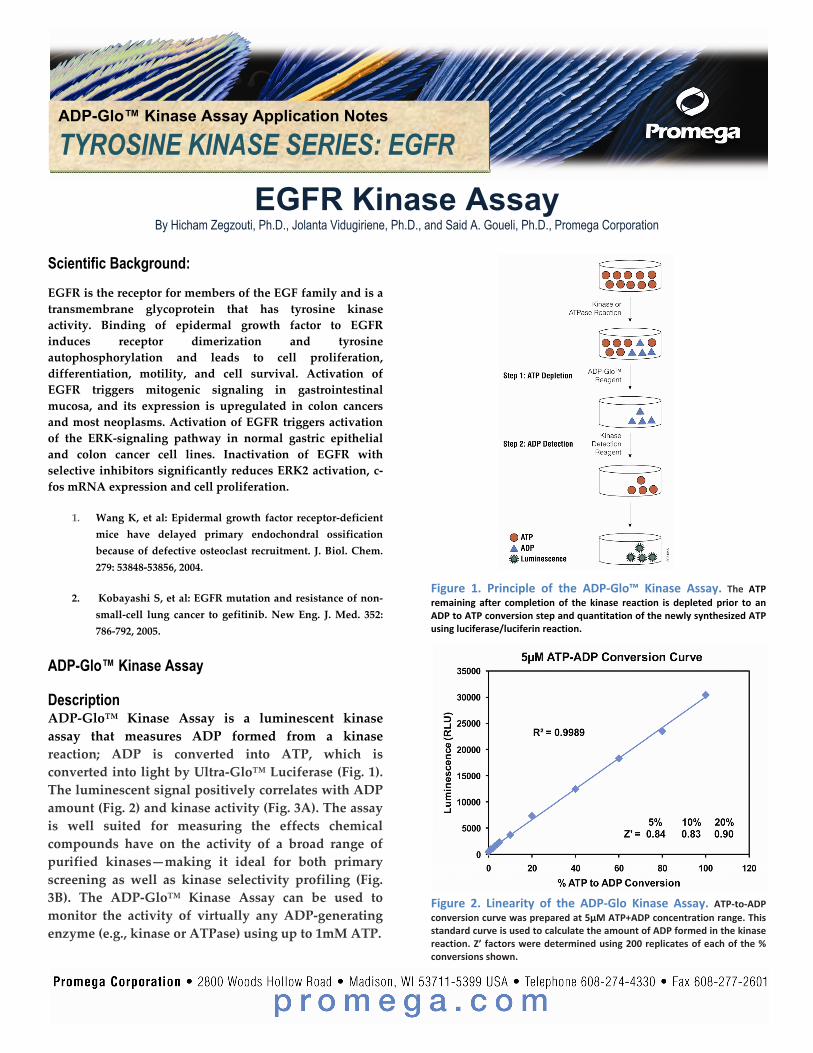
Description ADP‐Glo™ Kinase Assay is a luminescent kinase assay that measures ADP formed from a kinase reaction; ADP is converted into ATP, which is converted into light by Ultra‐Glo™ Luciferase (Fig. 1). The luminescent signal positively correlates with ADP amount (Fig. 2) and kinase activity (Fig. 3A). The assay is well suited for measuring the effects chemical compounds have on the activity of a broad range of purified kinases—making it ideal for both primary screening as well as kinase selectivity profiling (Fig. 3B). The ADP‐Glo™ Kinase Assay can be used to monitor the activity of virtually any ADP‐generating enzyme (e.g., kinase or ATPase) using up to 1mM ATP.
Figure 1. Principle of the ADP‐Glo™ Kinase Assay. The ATP remaining after completion of the kinase reaction is depleted prior to an ADP to ATP conversion step and quantitation of the newly synthesized ATP using luciferase/luciferin reaction.
Figure 2. Linearity of the ADP‐Glo Kinase Assay. ATP‐to‐ADP conversion curve was prepared at 5µM ATP+ADP concentration range. This standard curve is used to calculate the amount of ADP formed in the kinase reaction. Z’ factors were determined using 200 replicates of each of the % conversions shown.

For detailed protocols on conversion curves, kinase assays and inhibitor screening, see The ADP‐Glo™ Kinase Assay Technical Manual #TM313, available at www.promega.com/tbs/tm313/tm313.html
Protocol
• Dilute enzyme, substrate, ATP and inhibitors in Tyrosine Kinase Buffer.
• Add to the wells of 384 low volume plate: 1 μl of inhibitor or (5% DMSO) 2 μl of enzyme (defined from table 1) 2 μl of substrate/ATP mix
• Incubate at room temperature for 60 minutes.
• Add 5 μl of ADP‐Glo™ Reagent • Incubate at room temperature for 40 minutes. • Add 10 μl of Kinase Detection Reagent • Incubate at room temperature for 30 minutes. • Record luminescence (Integration time 0.5‐1second).
Table 1. EGFR Enzyme Titration. Data are shown as relative light units (RLU) that directly correlate to the amount of ADP produced. The correlation between the % of ATP converted to ADP and corresponding signal to background ratio is indicated for each kinase amount.
EGFR, ng 100 50 25 12.5 6.3 3.1 1.56 0.78 0
Luminescence 20792 16758 15593 9910 7561 3620 2408 1653 429
S/B 48 39 36 23 18 8.4 5.6 3.9 1
% Conversion 97 78 72 45 34 14.9 9.1 5.5 0
Figure 3. EGFR Kinase Assay Development. (A) EGFR enzyme was titrated using 5µM ATP and the luminescence signal generated from each of the amounts of the enzyme is shown. (B) Staurosporine dose response was created using 4ng of EGFR to determine the potency of the inhibitor (IC50).
Assay Components and Ordering Information: Products Company Cat.#
ADP-Glo™ Kinase Assay Promega V9101 EGFR Kinase Enzyme System Promega V3831 ADP-Glo + EGFR Kinase Enzyme System Promega V9261 EGFR Kinase Buffer: 40mM Tris,7.5; 20mM MgCl2; 0.1mg/ml BSA; 2mM MnCl2; 50μM DTT.
Related Documents