Key Findings: EFInA Access to Financial Services in Nigeria 2020 Survey June 3, 2021

Welcome message from author
This document is posted to help you gain knowledge. Please leave a comment to let me know what you think about it! Share it to your friends and learn new things together.
Transcript

Key Findings:
EFInA Access to Financial Services in Nigeria
2020 Survey
June 3, 2021

2
B
C
D
E
G
Nigeria at a Glance
Impact of COVID-19
Financial Inclusion and Drivers
Financial Inclusion Indicators (Financial Access Strands)
Beyond Financial Inclusion
F
National Financial Inclusion Strategy (NFIS) Targets
Contents
H Excluded Population
A Background – Objectives & Methodology
Conclusion/Key Take OutsI

Background
4
Objectives of A2F 2020 Survey
• To measure the levels of financial inclusion (i.e. levels of access/usage of financial products and services – both
formal and informal)
• Measure trends in access to and usage of financial services in Nigeria
• Understand Nigerians' financial behaviours, including various products/services used to meet their financial
needs
• Understand financial health of Nigerians
• Provide credible data that can highlight opportunities for policy reform and market opportunities for financial
service providers

5
Coverage and methodology of the A2F 2020 Survey
Design
• Provided by the National Bureau of Statistics (NBS)
• Sampling of respondents was based on equal representation (around 750 respondents) per state
• Allows for statistically robust headline indicators of financial access at the state, regional and national level
Coverage
• Nationally representative sample of Nigerian adults (18+) across all 36 States and FCT Abuja
• Achieved 27,938 interviews (99% of target sample (28,380)), slightly high compared to 2018
• The survey also includes 2 booster samples for Kaduna state (4600 respondents) and the teen (15-17) population
which are not covered in this report
• Household listing and data collection was conducted from November 2020 to February 2021 by the Research Firm -
Ipsos Nigeria, with supervision from the National Bureau of Statistics (NBS)
Questionnaire
• The questionnaire (in English), was translated into and administered in Hausa, Yoruba, Igbo and Pidgin English
Results
• Results were weighted by the NBS to provide for the total adult population
• Also benchmarked to national population estimates for verification
Nigeria at a Glance

7Source: EFInA Access to Financial Services in Nigeria 2020 survey
The Nigerian adult population (18 years and
above) is 106 million
Of this adult population:
▪ About two thirds (70m) live in rural areas
▪ 59m (55%) are 35 years and younger
▪ 20m adults (19%) have no formal education
▪ 4.9 average household size
▪ 1.6 average income earners per household
55% Between 18-35
Years Old
81%
Own a Mobile
Phone
19% have
No Formal
Education50% | 50%
Adult
Population
106m
Nigeria’s high rural, female, youth, and dependent adult population has implications for financial inclusion
46%
Business
Owners

8
Nigerian economy remains under strain
• Real household (HH) consumption expenditure is on a contractionary
trend from 2019
• Unemployment continues to be on a sharp rise. The rate rose from 22.7%
in second quarter of 2018 to 27.1% in the same quarter of 2020
• This reflects the difficulties that consumers faced in 2020, with rising
unemployment, and high inflation resulting in eroded purchasing power
Source: NBS - Nigerian Gross Domestic Product Report (Expenditure and Income approach) Q2, 2020
GDPEmployment
Oil Revenue
Currency Value Population
Economy Population
• Growth rate for the first half of 2020 was lower by
4.3 percentage points than in 2019
• Sharp GDP contractions are as a result of the
collapse in oil prices and pandemic-induced
lockdowns
• Inflation is on the rise and there is tight forex liquidity
Inflation

9Source: EFInA Access to Financial Services in Nigeria 2020 survey
As the ailing economy continues to negatively impact on livelihoods, the
pandemic seems to be turning retrenchment into entrepreneurship
Rely mainly on farming
Formal sector
-1.0%
Own business (other services)
+2.8%
Own business (farming)
+0.2%
Own business (non-farming)
-0.4%
8% 16.7% 23.4%
-3.1%
11.2% 11.9% 2018
2020 7% 16.3% 20.3% 11.5% 14.7%

10Source: EFInA Access to Financial Services in Nigeria 2020 survey
Economic challenges and retrenchments could have resulted in more micro business owners, mainly within the service sector
49.3 million
Business owners
+5m
• Micro enterprises (less than 10 employees) = 96%
• Small enterprises (10 – 49 employees) = 1%
Driven by:
1. Service (42.1%)
2. Trade (33.0%)
3. Agriculture (28.3%)
4. Industrial (6.2%)
37.1m individual entrepreneurs
10.4m business owners with employees
75.3%
22.1%
Employing 33.2 million people (excluding owners)
Important contribution to
employment
Creating about 70.3 million jobs including owners

12Source: EFInA Access to Financial Services in Nigeria 2020 survey
86 million (80%) adults’ livelihoods were negatively affected by the pandemic
12
7%
23%
63%
14%
1% 2% 2%
23%
4% 4%
Gotretrenched
Stoppedworking forsome time
Incomereduced
Same asbefore
Benefitsreduced
Incomeincreased
Unable to paystaff wages
Could notoperate due
to restrictions
Other Do not know

Financial Inclusion
1. Banking sector: Uptake and Usage

15Source: EFInA Access to Financial Services in Nigeria 2020 survey
Bank growth is driven by use of digital financial services, savings, remittances, and agents
2016 2018 2020 % DIFF
(2018-2020)
Banked population 38% 40% 45% +5%
Remittances 24% 22% 25% +3%
Savings account 28% 21% 27% +6%
Payments 12% 16% 29% +13%
Receive income 8% 10% 12% +2%
Loan with a bank 3% 1% 2% +1%
Banking agents 3% 3% 19% +16%
Total population 106 million
Total population96 million
Total population100 million
16Source: EFInA Access to Financial Services in Nigeria 2020 survey16
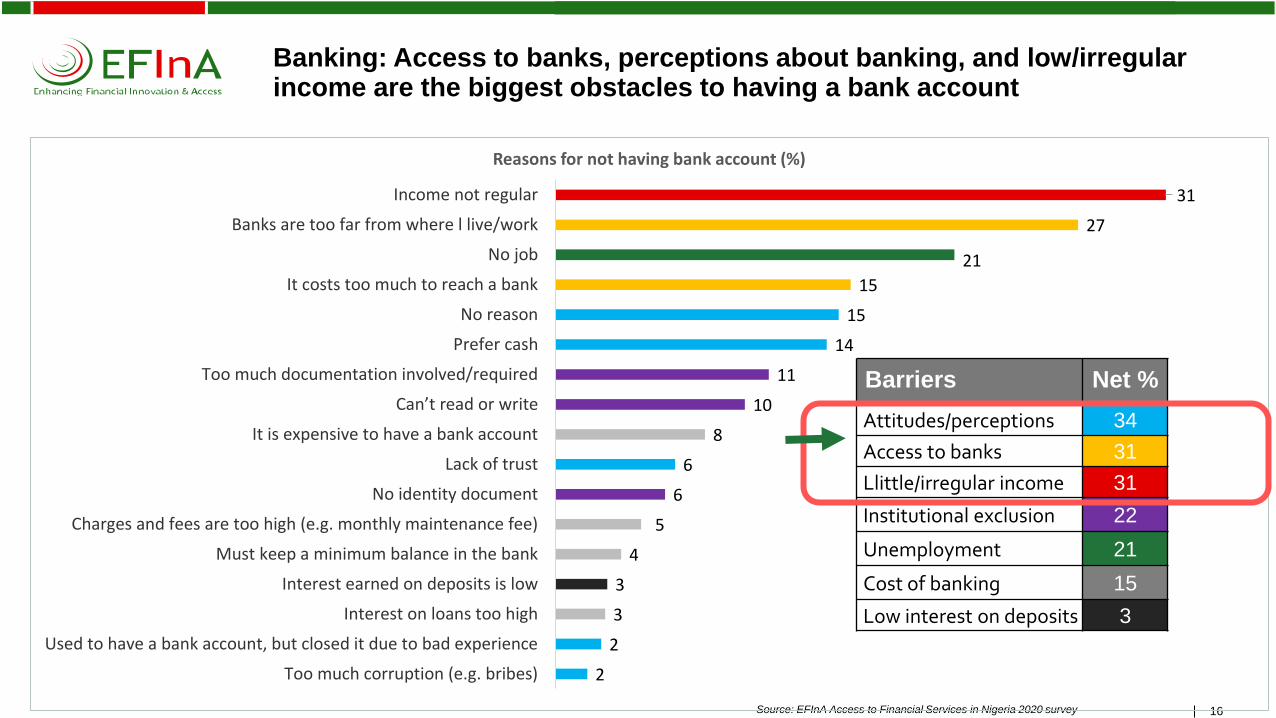
Banking: Access to banks, perceptions about banking, and low/irregular income are the biggest obstacles to having a bank account
2
2
3
3
4
5
6
6
8
10
11
14
15
15
21
27
31
Too much corruption (e.g. bribes)
Used to have a bank account, but closed it due to bad experience
Interest on loans too high
Interest earned on deposits is low
Must keep a minimum balance in the bank
Charges and fees are too high (e.g. monthly maintenance fee)
No identity document
Lack of trust
It is expensive to have a bank account
Can’t read or write
Too much documentation involved/required
Prefer cash
No reason
It costs too much to reach a bank
No job
Banks are too far from where l live/work
Income not regular
Reasons for not having bank account (%)
Barriers Net %
Attitudes/perceptions 34
Access to banks 31
Llittle/irregular income 31
Institutional exclusion 22
Unemployment 21
Cost of banking 15
Low interest on deposits 3

2. Other Formal Financial Products / Services: Uptake and Usage
18Source: EFInA Access to Financial Services in Nigeria 2020 survey
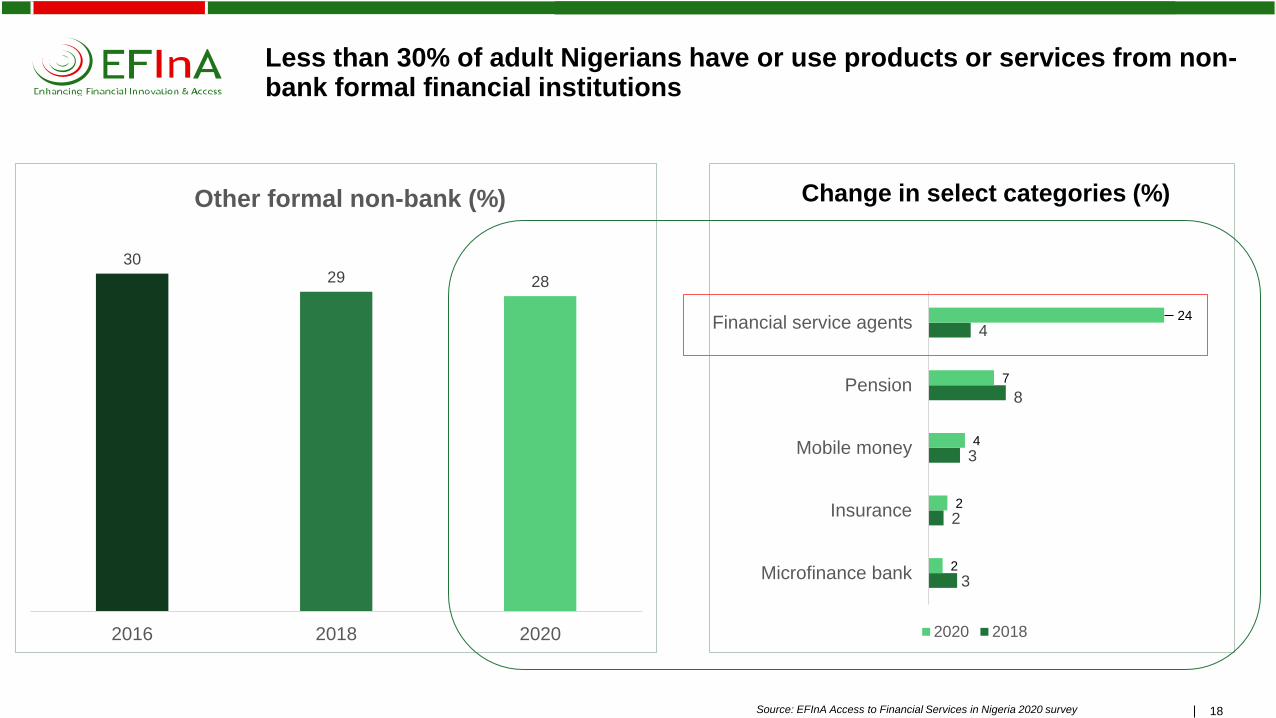
Less than 30% of adult Nigerians have or use products or services from non-bank formal financial institutions
18
3029 28
2016 2018 2020
Other formal non-bank (%)
3
2
3
8
4
2
2
4
7
24
Microfinance bank
Insurance
Mobile money
Pension
Financial service agents
2020 2018
Change in select categories (%)

19Source: EFInA Access to Financial Services in Nigeria 2020 survey
Lack of awareness and suitability of products are main barriers to non-bank formal financial services
19
3
4
6
9
13
16
16
19
20
23
They do not settle claims
Do not trust insurance firms
Religious reasons
Lack of information
Not sure about the benefits
Haven’t thought about it yet
Cant afford insurance
No reason
I do not believe in insurance
I have nothing to insure
Reasons for not being insured (%)
2
3
5
6
9
14
21
28
30
Other
Limited services
It is expensive
It is not easy to use
Don't knowwhere/how to get…
I do not trust it
Use other ways
Don't know whatmobile money is
No reason
Reasons for not using mobile money (%)
8 1222
92 8878
Aware of micropension plan
Aware of microinsurance
Aware of mobilemoney
Awareness (%)
Yes No
3. Informal Financial Products / Services: Uptake and Usage

21Source: EFInA Access to Financial Services in Nigeria 2020 survey21
29 30
33
2016 2018 2020
Informal financial services uptake (%)
1
1
2
4
8
11
9
1
1
2
6
11
13
15
Microfinanceinstitutions
Moneylender
Runner
Co-operative
Village association
Savings thrift
Savings groups
2020 2018
A third of Nigerians use informal financial services to manage some of their financial needs. The number of adults using informal services increased by 5.3 million between 2018 and 2020
Drivers (%)
22Source: EFInA Access to Financial Services in Nigeria 2020 survey
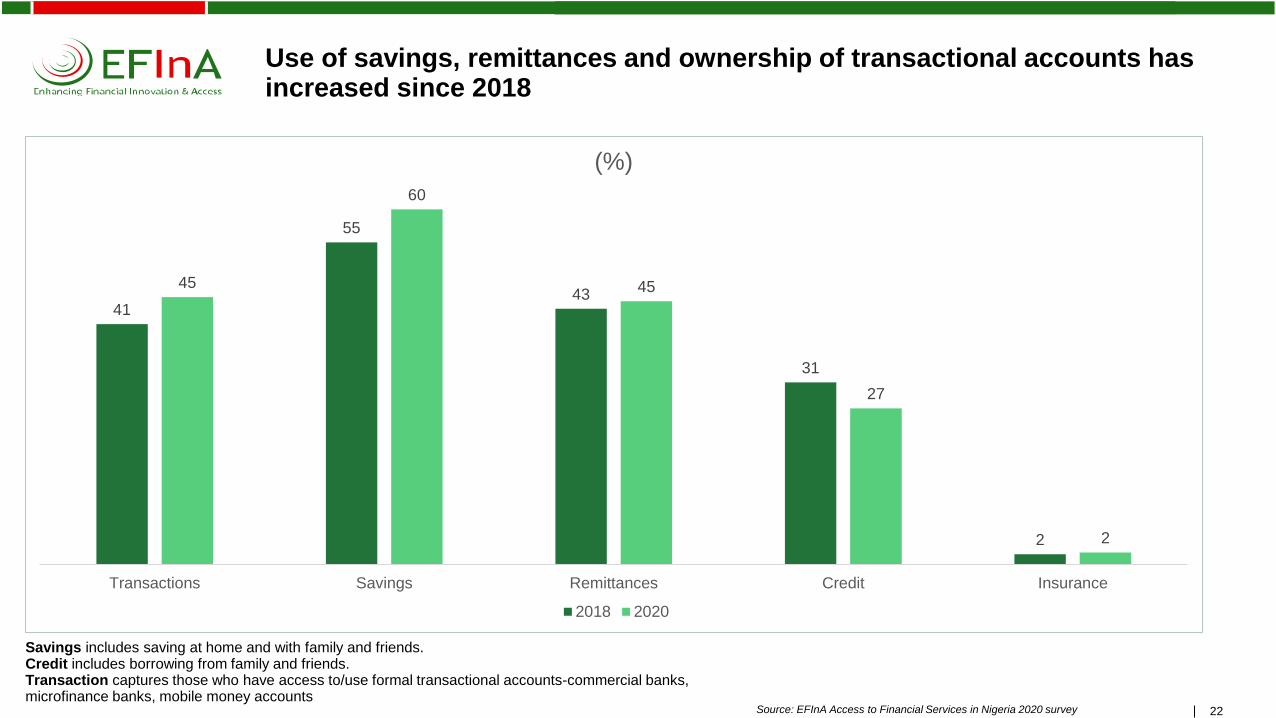
Use of savings, remittances and ownership of transactional accounts has increased since 2018
22
41
55
43
31
2
45
60
45
27
2
Transactions Savings Remittances Credit Insurance
(%)
2018 2020
Savings includes saving at home and with family and friends. Credit includes borrowing from family and friends. Transaction captures those who have access to/use formal transactional accounts-commercial banks, microfinance banks, mobile money accounts

Beyond Financial Inclusion
Financial needs, health & capabilities

Financial Needs
1. Digital use2. Meeting goals3. Liquidity4. Resilience

25Source: EFInA Access to Financial Services in Nigeria 2020 survey
Financial needs framework
25
Need: A collection of use cases that can be fulfilled by
financial services
Child is sick
Cash
Medical
insurance
Loan
Relatives
For an example: Everyone expresses financial
use cases, pursued through financial devices

Transfer of value/Digital usage
How do people receive and make payments?

27Source: EFInA Access to Financial Services in Nigeria 2020 survey
100% of the adult population expressed had experienced at least one of the use cases categorised as transfer of value in the past 12 months
27
100%
Transfer of money
100%
86%
45%
Payments
Income
Remittances
100% 24%
Cash
(100%)
Digital
(28%)
80% 13%
44% 7%
Adult population (106 million)

28Source: EFInA Access to Financial Services in Nigeria 2020 survey
Significant increase in digital usage shows positive moves in embracing digitization. About 60% of adults with digital accounts use digital services
28
2018
100M
2020
106M
Have access to mobile phone (own or borrow) 85% 89%
Ever accessed a digital stored value account 39% 46%
Own a phone 69% 81%
Active digital stored-value account users 41% 45%
Active digital financial services users 16% 28%

Liquidity
How do people manage liquidity?

30Source: EFInA Access to Financial Services in Nigeria 2020 survey
72% of the adult population experienced an episode of liquidity distress in the past 12 months
30
72
28
% of adults who had a liquidity need
Yes No
61
11
28
Severedistress
Somedistress
Nodistress
Level of distress (%)
Liquidity distress is defined as being unable to balance income and expenses. Severe – more than one month, some distress – once in the past year

31Source: EFInA Access to Financial Services in Nigeria 2020 survey
About 40% of distressed adults did nothing or readjusted their expenses to manage liquidity issues
31
20
20
14
2
15
20
10
8
2
Did nothing specific
Cut down on other expenses
Used savings from bank or other financial institution
Informal institution such as savings group, villageassociation etc
Received gifts/donations/contributions fromfriends/family
Sold asset(s)
Borrowed from family/friends
Borrowed money from formal and/or informalfinancial institution
Other
%
24% used financial mechanisms when they couldn’t
meet their regular spending needs
33.9% used physical and social mechanisms

Meeting goals
How do people meet goals?

33Source: EFInA Access to Financial Services in Nigeria 2020 survey
About 73% of adults have specific life goals they are currently trying to meet
33
73
27
% of adults trying to meet goals
Yes No
51
30
10
4
4
1
Investing in business
Investing in land/apartment/building
Invest in education
Buying asset
Paying for event
Other
Expressed goals (%)

34Source: EFInA Access to Financial Services in Nigeria 2020 survey
Only 12% of Nigerians report using formal savings to meet goals
34
5
5
6
7
7
11
12
12
19
20
26
Borrowed from formal institution
Got money or other assistance from community
Used savings from savings group
Borrowed from informal institutions
Used savings held with friends or family
Used savings held in a secret hiding place
Sold assets
Formal savings
Cut back on my expenses
Worked more or got additional jobs
Have a goal but did nothing in the past 12 months
How are the goals being met (%)
• 26% do not have a plan or have not
started to work towards their goals
• About 40% use non-financial
mechanisms
• 23% use some sort of savings

Resilience
How do people manage/cope with risks?

36Source: EFInA Access to Financial Services in Nigeria 2020 survey
About 3 out of 5 adults experienced a financial shock or an event that had a large negative impact on their finances in the past 12 months, mainly driven by economic and health related shocks
36
59
42
% of adults who experienced financial shocks
Yes No2
1
1
1
1
1
2
2
3
5
7
8
13
1
19
20
Other
Loss of household goods
Theft of household property
Theft of business stock/goods
Disability due to accident/illness
Theft of agricultural crop/livestock
Maintenance of business equipments
Agricultural crop/livestock destroyed
Member of household lost job/income
Assist family/friends with money
Death of a relative
Failure of business
Loss of job/income due to COVID-19…
Recession/bad economy
Price increases
Serious illness of a household member
Risks experienced (%)

37Source: EFInA Access to Financial Services in Nigeria 2020 survey
Nigerians were more likely to do nothing, sell assets, or cut down on expenses than to use savings to cope with these crises
37
2.4
2.6
3.4
4
4.1
8.7
9.5
9.6
15
16.4
19.9
Comparing prices to get best deal
Waited/asked for donations
Cancelled other policies
Borrowed - formal/informa
Savings from informal groups
Used savings from formal institution
Borrowed money from friend/family
Cut down on food expenses
Cut down on non-food expenses
Sold assets to get money
Did nothing
Coping mechanism (%)

Financial Health
1. Spend score
2. Save score
3. Plan Score
4. Ability to cope with risk score
5. FinHealth Score (overall)

39Source: EFInA Access to Financial Services in Nigeria 2020 survey
Only about 1 in 4 Nigerian adults (27%) are considered "financially healthy"
39
FinHealth dimensions Low score Medium High score
Ability to manage day to day (spend score)No trouble making money last, plan for allocating
money, never went without food61% 11% 28%
Build and maintain reserves (save score)Save money, invest in assets
23% 59% 18%
Planning and prioritising (Plan score)Plan ahead financially
33% 46% 22%
Ability to manage risksNever went without medicine, could raise N45,000 for
emergency in 7 days, could recover from financial shock44% 25% 31%34
39
27
Financially Healthy
Financially Coping
Financially Vulnerable
FinHealth score (%)
40Source: EFInA Access to Financial Services in Nigeria 2020 survey
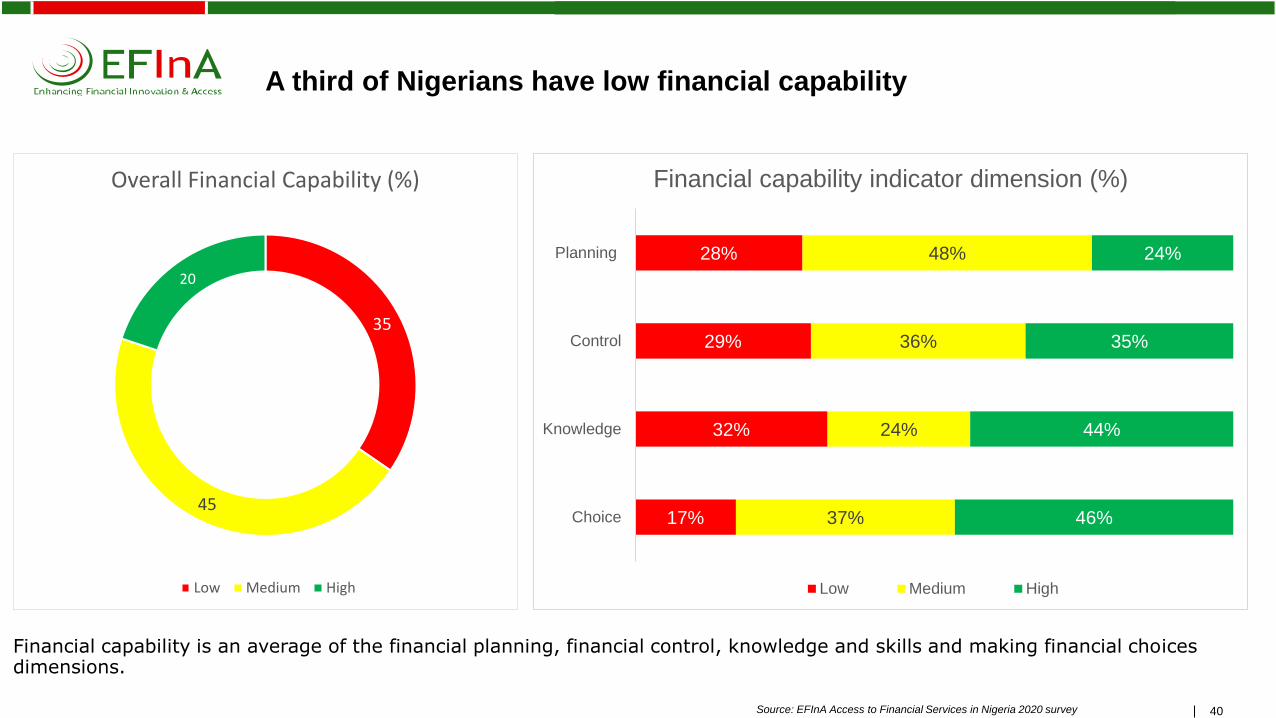
A third of Nigerians have low financial capability
40
35
45
20
Overall Financial Capability (%)
Low Medium High
17%
32%
29%
28%
37%
24%
36%
48%
46%
44%
35%
24%
Choice
Knowledge
Control
Planning
Financial capability indicator dimension (%)
Low Medium High
Financial capability is an average of the financial planning, financial control, knowledge and skills and making financial choices dimensions.

41Source: EFInA Access to Financial Services in Nigeria 2020 survey
There is a positive correlation between digital financial services and financial capability
41
10
26
51
30
Low capability
Moderate capability
High capability
National uptake
Digital financial services usage by financial capability levels (%)

Levels of Financial Inclusion (Financial Access Strands)

43
Defining financial inclusion
Total adult population 18 years and older in Nigeria
Financially included = have/use financial products and/or services – formal and/or informal
Financially excluded = do not have/use any financial products and/or services –– formal and/or informal
Formally served= have/use formal financial products and/or services provided by a financial institution (bank and/or non-bank)
Informally served= have/use financial products and/or services which are not regulated
Banked= have/use financial products/ services provided by a bank regulated by the CBN
Served by other formal financial institutions= have/use financial products/services provided by regulated non-bank financial institutions
Source: EFInA Access to Financial Services in Nigeria 2020

44
44.8% 5.7% 13.6% 35.9%
Just above half of adults (50.5% of adults, or 53.6 million adults) now use formal financial services, up from 48.4 million
BankedFormal
other Informal Financially excluded
50.5% Formally included
64.1% Financially served 35.9% Financially excluded
47.6m 38.1m14.4m6.0m
These four strands are mutually exclusive
106m
• Nearly 1 in 2 Nigerian adults do not use any formal (regulated) financial services
• More than 1 in 3 Nigerian adults remain completely financially excluded
Source: EFInA Access to Financial Services in Nigeria 2020

45Source: EFInA Access to Financial Services in Nigeria 2020 survey
Nigerian adults continue to use a combination of financial services to meet their needs
45
44.8%
28.0%
32.7%
Banked
Formal Other (non-bank)
Informal
Aggregate Levels of Financial Access*
Banked Formal Other (non-bank) Informal
Informal
only
13.6%
Formal Other
3%
Banked
15.0%
13.5%7.5%
2.7%
8.8%
• Consumers generally use a combination of financial products and services to meet their financial needs• Formally served adults use a combination of formal and informal mechanisms to manage their financial needs, indicating that their needs are
not fully met by the formal sector alone

46Source: EFInA Access to Financial Services in Nigeria 2008 / 2010 / 2012 / 2014 / 2016 / 2018 / 2020
Financial inclusion progress continues to be incremental
46
21
30
33
36
38
40
45
3
6
11
12
10
9
6
24
17
17
12
10
15
14
53
46
40
40
42
37
36
2008
2010
2012
2014
2016
2018
2020
% of the adult population
Banked Formal other (non-bank) Informal Excluded
• The proportion of formally served adults increased for the first time since 2014• While the percentage of financially excluded adults decreased slightly between 2018 and 2020, the actual number of financially excluded adults
increased from 36.6 million to 38.1 million, as population growth outpaces the rate of financial inclusion growth

47
Nigeria has a higher rate of financial exclusion than many other countries in Sub-Saharan Africa
47
81
68
45
44
36
22
18
13
10
10
5
6
39
41
36
22
52
39
2
5
14
6
16
20
21
7
15
7
22
36
11
7
22
39
28
36
South Africa 2020
Namibia 2017
Nigeria 2020
Kenya 2019
Rwanda 2020
Uganda 2017
Burkina Faso 2016
Tanzania 2017
Cameroon 2017
Banked Other formal (non-bank) Informal Excluded
Note: There are some slight differences in the classification of products/services in the categories of the access strand between the countries
• Although Nigeria has a higher proportion of banked adults than many comparator countries, it also has a high proportion of financially
excluded adults at 36%
• Several countries have expanded financial inclusion via non-bank mobile money (reflected in yellow sections)
Source: EFInA Access to Financial Services in Nigeria 2020 survey and countries implemented FinScope surveys

48Source: EFInA Access to Financial Services in Nigeria 2020 survey
The financial inclusion gender gap has persisted
• Adult men are more likely to be banked than adult women• Adult women tend to use more informal financial services than adult men• Women remain significantly excluded compared to men
Adult Population18+ Years
52.8 m
53.3 m
106 m
-0.7%
Reduction in the excluded
-1.0%
-0.9%
51%
39%
45%
6%
6%
6%
12%
15%
14%
32%
40%
36%
Male
Female
Total
Banked Formal other (non-bank) Informal Excluded

49Source: EFInA Access to Financial Services in Nigeria 2020 survey
Most Nigerians between the ages of 15-17 are financially excluded
9% 7% 5% 78%13.2m
Banked Formal Other Informal Excluded
• 77% are living in rural areas
• 43% own a mobile phone
• 39% are living in communities with financial access points

50Source: EFInA Access to Financial Services in Nigeria 2020 survey
Young adults continue to be significantly more excluded than older adults
• Adults in the 18 to 25 age bracket are significantly more likely than older adults to be financially excluded
33.5 m
Adult Population18+ Years
22.4m
25.2m
12.2m
12.8 m
-0.3%
Reduction in the excluded
-1.7%
-3.8%
-1.2%
-0.9%
36%
48%
51%
47%
43%
6%
5%
5%
6%
6%
11%
14%
15%
15%
14%
47%
30%
29%
33%
38%
18 to 25 Years
26 to 35 Years
36 to 45 Years
46 to 55 Years
Above 56 Years
Banked Formal other (non-bank) Informal Excluded

51Source: EFInA Access to Financial Services in Nigeria 2020 survey
Adults with higher levels of education are significantly more likely to be financially included
51
68%
16%
5%
7%
11%
17%
17%
59%
Completed secondary levels of education & above
Seconday levels of education incomplete and less
Banked Formal other (non-bank) Informal only Financially excluded
Adult Population18+ Years
58.9 m
47.2 m

52Source: EFInA Access to Financial Services in Nigeria 2020 survey52
The formally employed market is nearly saturated for banks
93%
51%
59%
26%
26%
2.3%
6%
5%
7%
6%
2.1%
17%
95
19%
8%
2.1%
26%
28%
48%
60%
Employed in the formalsector
Business owners
Employed in the Informalsector
Farming
Dependants
Banked Formal other (non-bank) Informal Financially excluded
Adult Population18+ Years
8. 3m
45.1 m
8.7 m
22.4 m
21.5m
53Source: EFInA Access to Financial Services in Nigeria 2020 survey
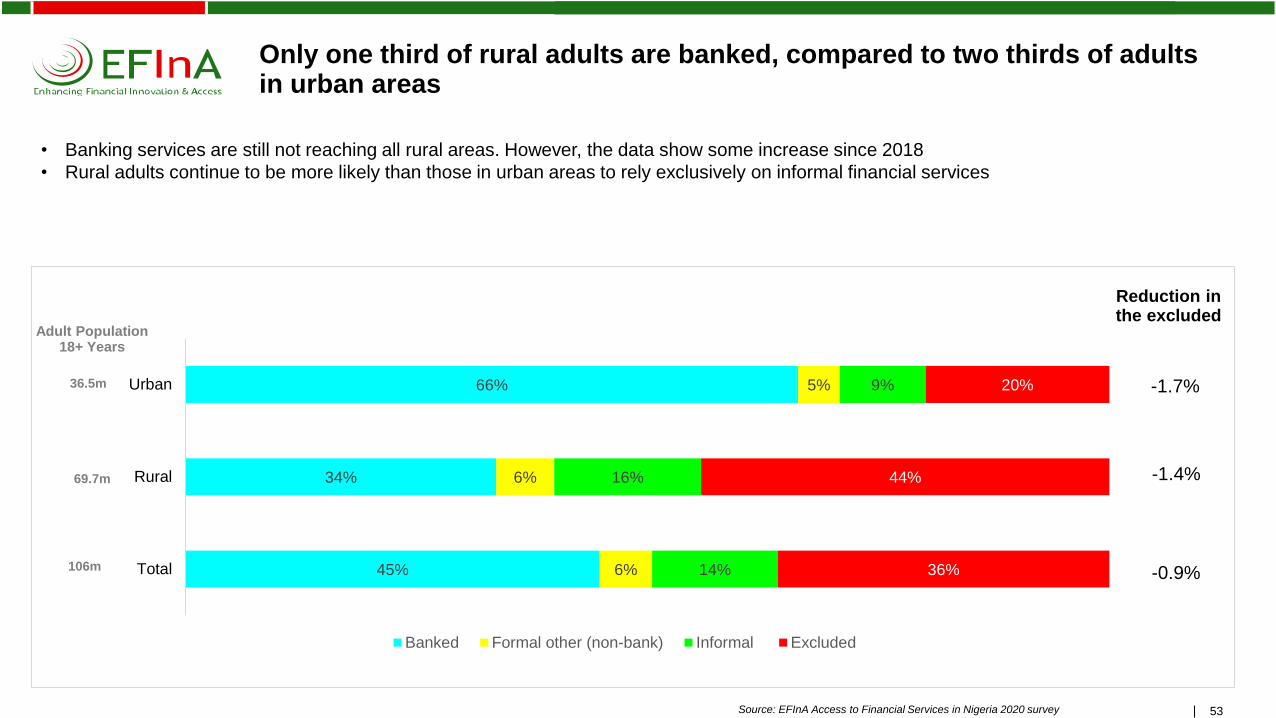
Only one third of rural adults are banked, compared to two thirds of adults in urban areas
36.5m
69.7m
106m
• Banking services are still not reaching all rural areas. However, the data show some increase since 2018
• Rural adults continue to be more likely than those in urban areas to rely exclusively on informal financial services
Adult Population18+ Years
Reduction in the excluded
66%
34%
45%
5%
6%
6%
9%
16%
14%
20%
44%
36%
Urban
Rural
Total
Banked Formal other (non-bank) Informal Excluded
-1.7%
-1.4%
-0.9%

54Source: EFInA Access to Financial Services in Nigeria 2020 survey
Rural population: Only 38% of adults in rural areas are within proximity of financial access points/financial service providers. Of the 38%, 84% are Financial Services Agents.
54
38
62
Proportion of EAs (communities) with financial access points (%)
% of sampled communities that have financial access points
% of sampled communities without financial access points
84%
7%
4%
1%
Financial Service Agents
Bank branches
Other FSP
ATM (stand alone)
1% Cooperative or social groups
Type of financial service
agent (Drivers)
Banking agents (45%)
Other formal (30%)
Other & non licensed (26%)
MNO (13%)

55Source: EFInA Access to Financial Services in Nigeria 2020 survey55
Rural populations with financial access points (FAP) in their communities are more likely to be financially included
47%
26%
6%
7%
15%
17%
33%
51%
Adults from communities with FAP
Adults from communities without FAPs in and around
Banked Formal other (non-bank) Informal Excluded

56Source: EFInA Access to Financial Services in Nigeria 2020 survey
The North West and North East zones continue to be most excluded. While progress has been made in the NE, the large population in the NW is predominantly excluded
63%
55%
58%
51%
33%
16%
5%
6%
5%
7%
4%
7%
15%
17
11%
17%
13%
9%
17%
22%
26%
26%
50%
68%
South West
South South
South East
North Central
North East
North West
Banked Other formal (non-bank) Informal Excluded
23.9m
13.1m
15.4m
13.1m
17.1m
23.4m
-4.5%
Reduction in the excluded
+5.4%
-0.5%
-4.1%
-3.5%
-1.9%
Adult Population18+ Years

57Source: EFInA Access to Financial Services in Nigeria 2020 survey
There is a direct correlation between financial health and financial inclusion
57
61%
46%
31%
6%
6%
6%
12%
14%
14%
22%
34%
50%
Financially healthy
Financially coping
Financially vulnerable
Banked Formal other (non-bank) Informal Excluded

58Source: EFInA Access to Financial Services in Nigeria 2020 survey
Out of the 59 million unbanked adults, 43m (73%) do not have the required documents to open a Tier 3 bank account
58
27%
73%
% of unbanked adults with formal ID document and proof of address
Have ID & proof of address Do not have both ID & proof of address

National Financial Inclusion Strategy (NFIS) Targets
60Source: EFInA Access to Financial Services in Nigeria 2020 survey
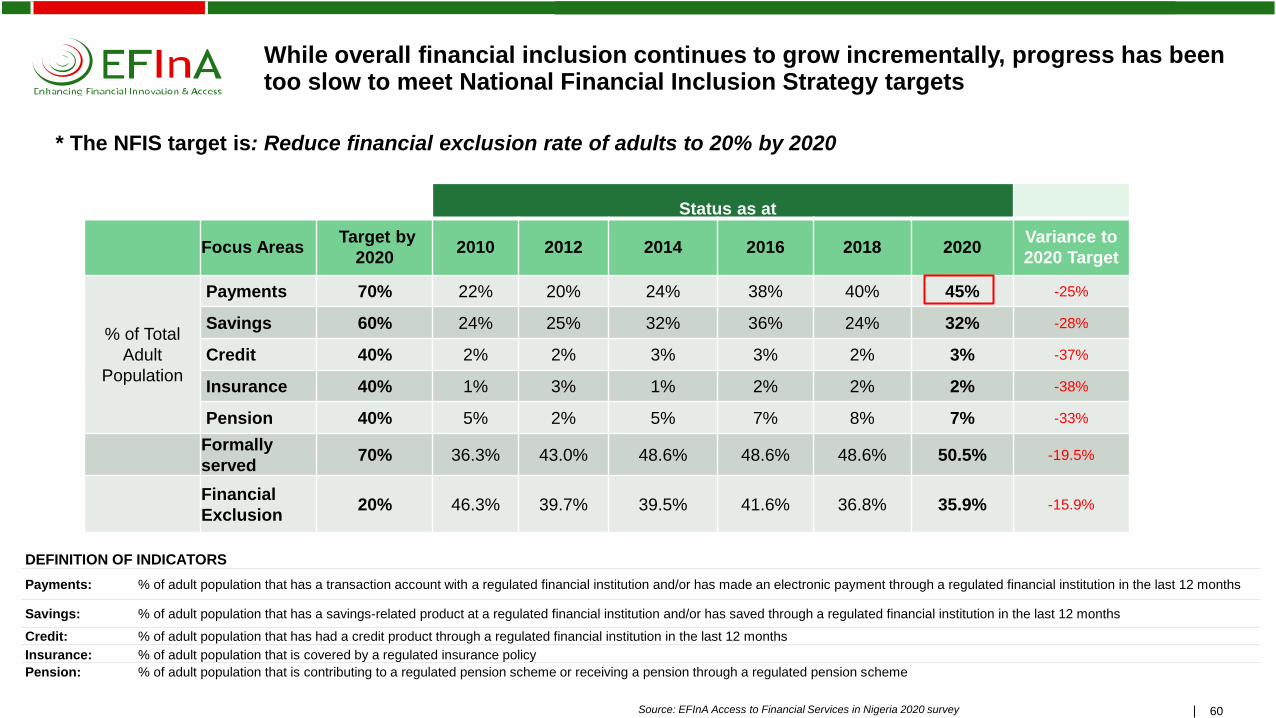
While overall financial inclusion continues to grow incrementally, progress has been too slow to meet National Financial Inclusion Strategy targets
60
* The NFIS target is: Reduce financial exclusion rate of adults to 20% by 2020
Status as at
Focus AreasTarget by
20202010 2012 2014 2016 2018 2020
Variance to
2020 Target
% of Total
Adult
Population
Payments 70% 22% 20% 24% 38% 40% 45% -25%
Savings 60% 24% 25% 32% 36% 24% 32% -28%
Credit 40% 2% 2% 3% 3% 2% 3% -37%
Insurance 40% 1% 3% 1% 2% 2% 2% -38%
Pension 40% 5% 2% 5% 7% 8% 7% -33%
Formally
served 70% 36.3% 43.0% 48.6% 48.6% 48.6% 50.5% -19.5%
Financial
Exclusion20% 46.3% 39.7% 39.5% 41.6% 36.8% 35.9% -15.9%
DEFINITION OF INDICATORS
Payments: % of adult population that has a transaction account with a regulated financial institution and/or has made an electronic payment through a regulated financial institution in the last 12 months
Savings: % of adult population that has a savings-related product at a regulated financial institution and/or has saved through a regulated financial institution in the last 12 months
Credit: % of adult population that has had a credit product through a regulated financial institution in the last 12 months
Insurance: % of adult population that is covered by a regulated insurance policy
Pension: % of adult population that is contributing to a regulated pension scheme or receiving a pension through a regulated pension scheme
**

Excluded Population
62Source: EFInA Access to Financial Services in Nigeria 2020 survey
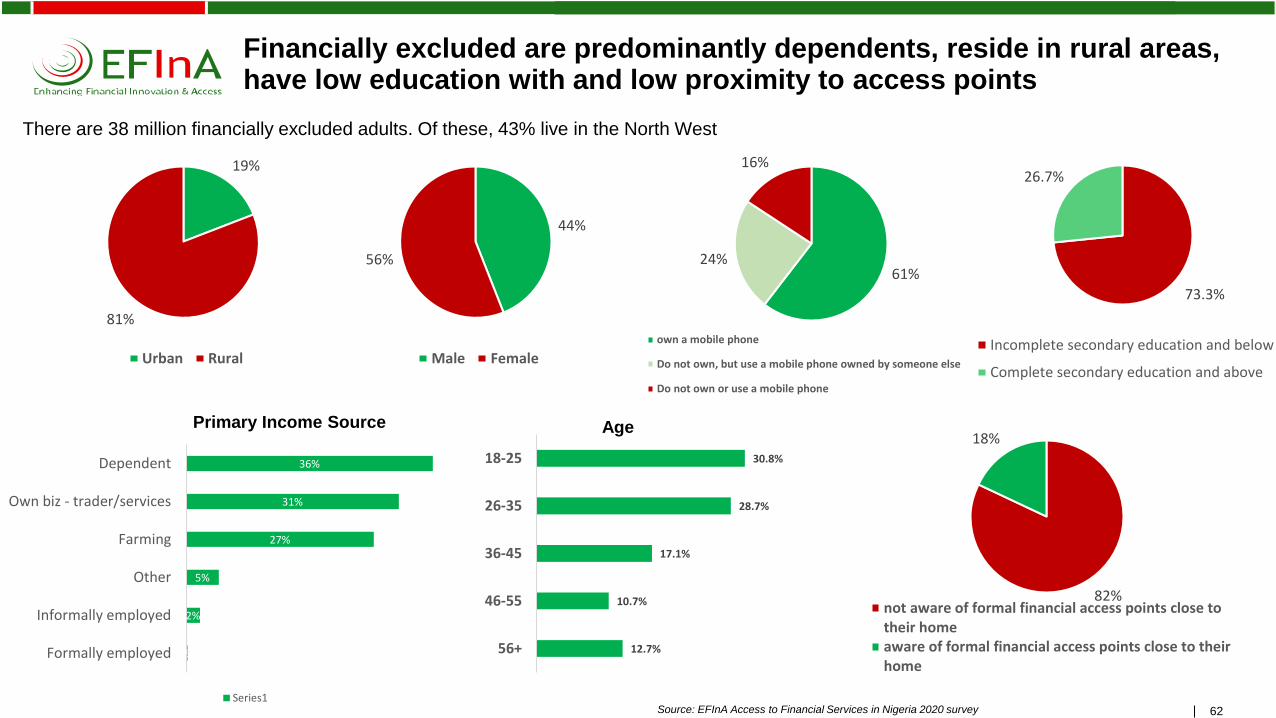
Financially excluded are predominantly dependents, reside in rural areas, have low education with and low proximity to access points
62
There are 38 million financially excluded adults. Of these, 43% live in the North West
Primary Income Source Age
44%
56%
Male Female
19%
81%
Urban Rural
30.8%
28.7%
17.1%
10.7%
12.7%
18-25
26-35
36-45
46-55
56+0%
2%
5%
27%
31%
36%
Formally employed
Informally employed
Other
Farming
Own biz - trader/services
Dependent
Series1
82%
18%
not aware of formal financial access points close totheir homeaware of formal financial access points close to theirhome
61%24%
16%
own a mobile phone
Do not own, but use a mobile phone owned by someone else
Do not own or use a mobile phone
73.3%
26.7%
Incomplete secondary education and below
Complete secondary education and above
Key Findings

64
Key Findings
.▪ Despite challenging economic circumstances, financial inclusion continued to grow incrementally, with more than half
of Nigerian adults using formal (regulated) financial services for the first time
▪ However, at the current rate of progress, the National Financial Inclusion Strategy targets for 2020 will not be met until
around 2030
▪ Stubborn access gaps have persisted since 2008 for the most excluded groups: women, Northern Nigerians, Nigerians
in rural areas, and youth
▪ The main barriers to financial inclusion remain institutional exclusion, affordability, access, and low awareness
▪ In 2020, we saw faster growth in banking, use of financial service agents, and use of digital financial services
▪ Use of informal financial services also grew, with many Nigerians continuing to use a combination of formal and
informal financial services to meet their needs
▪ Only about 1 in 4 Nigerian adults are considered financially healthy (27%), while 39% are coping and 34% are
financially vulnerable
▪ Growth in digital financial services, agent networks, and mobile phone ownership (now at 81%) highlights
the opportunity to drive faster financial inclusion growth through digital financial services such as mobile money

65
If Nigeria experiences rapid uptake of mobile money experienced in some neighbouring countries, financial inclusion targets could be met much faster
Source: WorldData Lab and ConsumerCentrix predictive analysis of financial access trends in NigeriaAnalysis used multiple data sources including EFInA Access to Financial Services in Nigeria survey datasets

66
Coming Soon- Kaduna State Deep Dive
For the first time, the EFInA Access to Financial Services in Nigeria 2020 Survey includes a deep-dive sample
for one state that is representative at the Local Government Area (LGA) level.
• With funding support from the Bill & Melinda Gates Foundation, EFInA conducted a deep dive survey in
Kaduna State
• This survey sampled 4600 adults across 23 Local Government Areas
• The survey covers the same data as the main Access to Financial Services in Nigeria Survey, including:
• Financial Inclusion Landscape
• Financial behavior
• COVID-19 impact
• Beyond Financial Inclusion – Financial health, needs and capabilities
• This data can be disaggregated by Local Government areas and allows for in-depth analysis with multiple
variables at the state level
Stay tuned for a launch of the data in June 2021

67
How to use the Access to Financial Services in Nigeria 2020 Survey Data
These Key Findings are just the tip of the iceberg. The A2F dataset can be used for in-depth analysis
of a variety of topics.
Reports and datasets are available to the public
• Access to Financial Services in Nigeria Survey website: www.a2f.ng
• EFInA website: www.efina.org.ng
Want specific insights? Let us know
Send a request to [email protected]
Contact
Website
www.efina.org.ng

68
Acknowledgements
We would like to thank the many partners who contributed to the success of the EFInA Access to
Financial Services in Nigeria 2020 Survey, including:
Delivery partners:
• National Bureau of Statistics
• Ipsos Nigeria
• FinMark Trust
Funding partners:
• UK Foreign, Commonwealth & Development Office (funding support for main survey)
• Bill & Melinda Gates Foundation (funding support for Kaduna State deep dive)
The many stakeholders and partners who provided input to the survey questionnaire, and advised on
approaches for conducting fieldwork safely following COVID
And the more than 30,000 Nigerian survey respondents who contributed their time and information to
benefit this research.
Related Documents


![Nigeria Malaria Indicator Survey (MIS) 2015 [MIS20] Malaria Indicator Survey (MIS) 2015 NIGERIA 2015 Malaria Indicator Survey (MIS) The Federal Republic of Nigeria Nigeria Malaria](https://static.cupdf.com/doc/110x72/5ab7b6f17f8b9a28468bebde/nigeria-malaria-indicator-survey-mis-2015-mis20-malaria-indicator-survey-mis.jpg)