Copyright © 2010 SAS Institute Inc. All rights reserved. Efficient Test Design Using Both Design of Experiments Methods and Modeling & Simulation NDIA 28 th Annual T&E Conference 13 March 2012 Tom Donnelly, PhD SAS Institute Inc. Marshall Millett, PhD, PE ManTech International Inc.

Welcome message from author
This document is posted to help you gain knowledge. Please leave a comment to let me know what you think about it! Share it to your friends and learn new things together.
Transcript

Copyright © 2010 SAS Institute Inc. All rights reserved.
Efficient Test Design Using Both Design of Experiments Methods and Modeling & Simulation
NDIA 28th Annual T&E Conference 13 March 2012
Tom Donnelly, PhD SAS Institute Inc. Marshall Millett, PhD, PE ManTech International Inc.

2
Copyright © 2010, SAS Institute Inc. All rights reserved.
Goal is to look at existing data with “new eyes” so that lessons learned can be applied to future testing
Use both Design of Experiments (DOE) and Modeling & Simulation (M&S) to get the most statistically valid results with the minimum of real testing Sufficient data collected to find eight replications of a 66-trial
full-factorial design in three factors Monte Carlo simulation used to assess use of model fit to
analog data to predict binary P(d) to Alarm vs. No Alarm
Future testing will Generate DOE as part of planning to include more factors and
“potentially” more levels for some factors Leverage physics-based M&S to identify regions requiring
more or less real testing

3
Copyright © 2010, SAS Institute Inc. All rights reserved.
Summary of Analyses
Models fit to two subsets of the detector count data (12.4% and 6.75% of total) are used to show that Mean of detector counts can accurately be predicted Alarm state can accurately be predicted for factor combinations
when detector counts are far from the threshold for alarm – i.e. when P(d) = 1.
In the more difficult situation of predicting P(d) when detector counts are near threshold for Alarm, Monte Carlo simulation is used to improve estimation of P(d). Key assumptions for validity of MC simulation are
» Uniform error across the test space (transformation used) » Relationship between response and factors is well modeled

4
Copyright © 2010, SAS Institute Inc. All rights reserved.
Background
Government Agency where the synthesis of testing and modeling is in infancy but developing fast
Must determine performance of potentially deployable radiation detection systems
Test factors include shielding, source, and relative speed; tests often near full factorial
Need to demonstrate that M&S can inform test design and support DOE to improve cost effectiveness of testing

5
Copyright © 2010, SAS Institute Inc. All rights reserved.
Problem Details
Three types of models in play: Radiation transport is understood well enough to support pre-test
physics modeling to help refine test requirements Empirical regression modeling may be applied real-time in
testing for parallel DOE Operational modeling is applied using results from the previous
two in order to assess or develop operations and assess high level performance
Test execution costs are relatively high
Highly complex system with binary output; other helpful response metrics considered

6
Copyright © 2010, SAS Institute Inc. All rights reserved.
Distributions of 1067 Test Runs by Responses: Alarms, Detector Counts, SQRT(Detector Counts) Factor Settings: 3 Threats, 11 Shielding Types, and 2 Target Speeds
Analog threshold for alarm is 1 on either scale.
“Metric data can be grouped so as to evaluate it by statistical methods applicable to categorical or ordinal data. But to do so would be to throw away information, and reduce the power of any tests and the precision of any estimates.”
Common Errors in Statistics (and How to Avoid Them)
by Phillip. I Good and James W. Hardin
Avoid focus on binary response!

7
Copyright © 2010, SAS Institute Inc. All rights reserved.
Distributions of 1067 Test Runs by Blocks of all 66 unique combinations of 2 Target Speeds X 3 Threats X 11 Shielding Types

8
Copyright © 2010, SAS Institute Inc. All rights reserved.
3-D Scatterplots of All 1067 Tests and the 2 X 66 Trial Subset of Unique Combinations - the Full-Factorial Design

9
Copyright © 2010, SAS Institute Inc. All rights reserved.
3-D Scatterplots of 4 X 18 = 72 Trial and the 2 X 66 = 132 Trial Subsets of Unique Combinations
10
Copyright © 2010, SAS Institute Inc. All rights reserved.
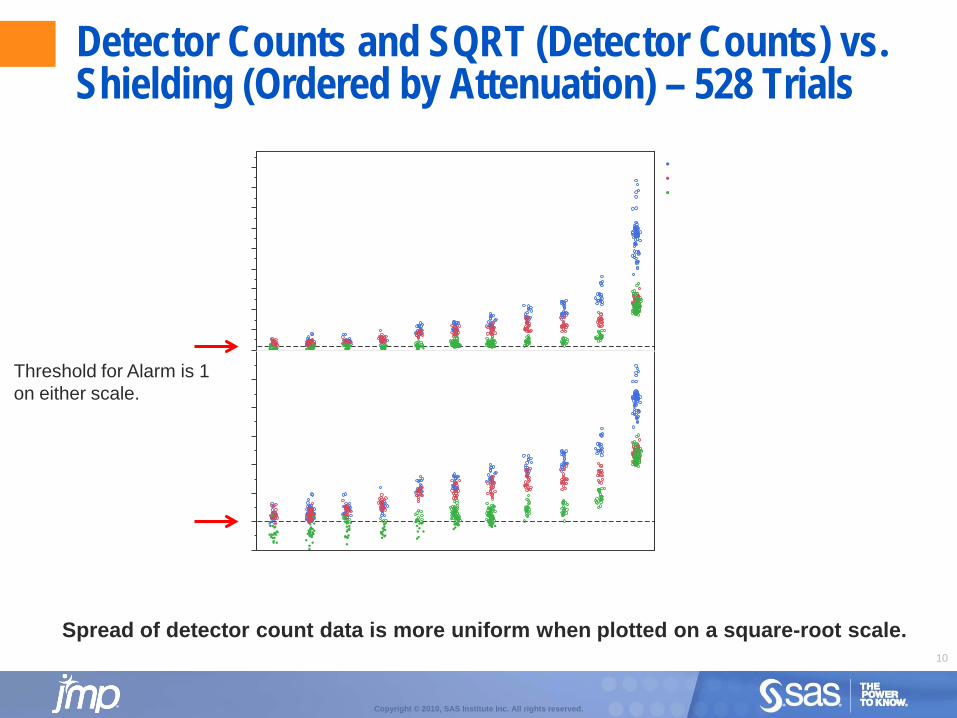
Detector Counts and SQRT (Detector Counts) vs. Shielding (Ordered by Attenuation) – 528 Trials
Spread of detector count data is more uniform when plotted on a square-root scale.
Threshold for Alarm is 1 on either scale.
11
Copyright © 2010, SAS Institute Inc. All rights reserved.
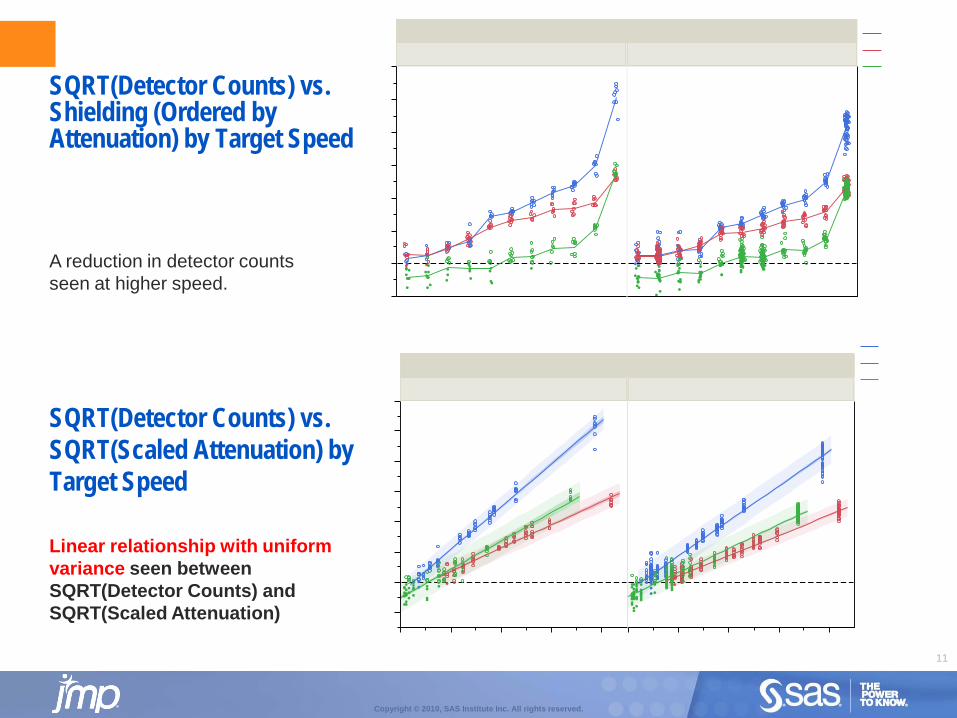
SQRT(Detector Counts) vs. SQRT(Scaled Attenuation) by Target Speed
SQRT(Detector Counts) vs. Shielding (Ordered by Attenuation) by Target Speed
A reduction in detector counts seen at higher speed.
Linear relationship with uniform variance seen between SQRT(Detector Counts) and SQRT(Scaled Attenuation)

12
Copyright © 2010, SAS Institute Inc. All rights reserved.
SQRT(Detector Counts) vs. SQRT (Scaled Attenuation) Overlaid by Target Speed and Wrapped by Threat
A reduction in detector counts seen at higher speed.
Overlaid by Target Speed and Wrapped by Threat
Most data – especially for Threats I and II – are far from threshold for Alarm

13
Copyright © 2010, SAS Institute Inc. All rights reserved.
SQRT(Detector Counts) vs. SQRT (Scaled Attenuation) Overlaid by Target Speed and Wrapped by Threat for 528 trials
Small reduction in detector counts seen at higher speed.
Overlaid by Target Speed and Wrapped by Threat
Most data – especially for Threats I and II - are far from threshold for Alarm
EFGHI J K EFGHI J K
J K

14
Copyright © 2010, SAS Institute Inc. All rights reserved.
Comparing the eight “66s” and four “132s” (NOTE: Effect of Target Speed is IGNORED)

15
Copyright © 2010, SAS Institute Inc. All rights reserved.
Comparing the two“264s” and one“528s” (NOTE: Effect of Target Speed is IGNORED)

16
Copyright © 2010, SAS Institute Inc. All rights reserved.
Plot of Actual vs. Predicted SQRT(Detector Counts) for 539 checkpoints using model with largest RMSE among fits of 8 sets of 66 trials and Scatterplot Matrix of Actual vs Predicted for 4 models

17
Copyright © 2010, SAS Institute Inc. All rights reserved.
Two Subsets of Data Used in Analyses
132 Runs (12.4% of
1067) Using 11 Different Shielding
25.0% of 528
72 Runs (6.75% of
1067) Using 3 Different Shielding
13.7% of 528

18
Copyright © 2010, SAS Institute Inc. All rights reserved.
3-D Scatterplots of 4 X 18 = 72 Trial and the 2 X 66 = 132 Trial Subsets of Unique Combinations

19
Copyright © 2010, SAS Institute Inc. All rights reserved.
12.19
Choosing Variables:
Set the ranges boldly
Experiment sequentially
Make midcourse corrections when required

20
Copyright © 2010, SAS Institute Inc. All rights reserved.
12.20
Timid vs. Bold Experimentation
Worst case scenario for just 1 data point at each setting of x

21
Copyright © 2010, SAS Institute Inc. All rights reserved.
12.21
Timid vs. Bold Experimentation
Better conclusion about y = f(x) What?

22
Copyright © 2010, SAS Institute Inc. All rights reserved.
12.22
Bold Experimentation
Boldness helps to overcome the need for large number of trials.

23
Copyright © 2010, SAS Institute Inc. All rights reserved.
Polynomial Regression Model Fit to Data from 18, 36, 72, and 144 tests at 2 Target Speeds, 3 Threats and 9 of 33 levels of Attenuation associated with 3 levels of Shielding for 3 Threats

24
Copyright © 2010, SAS Institute Inc. All rights reserved.
Plot of Actual vs. Predicted SQRT(Detector Counts) for 534 checkpoints (excludes 5 points at 1X Target Speed) for FF model fit to 144 AFK Runs – 25 of 33 Shielding Cases ALL Alarm, P(d) = 1
All 11 Shielding Cases ALL Alarm
Ten of 11 Shielding Cases (exception is B) ALL Alarm
Four of 11 Shielding Cases (H, I, J & K) ALL Alarm

25
Copyright © 2010, SAS Institute Inc. All rights reserved.
Monte Carlo Simulation of 100 Runs for the Case: Shielding = A [SQRT (Scaled Atten) = 0.0376], Threat = I, & Target Speed = 2X, and Using RMSE = 0.192 from FF Model Fit to 144 Trials

26
Copyright © 2010, SAS Institute Inc. All rights reserved.
1800 Monte Carlo Simulations of SQRT(Detector Counts) and the Associated Alarms Out of 100
100
80
100 100
100 100
100 100 100 100 100
97 0
94
71 95 3
80
27
Copyright © 2010, SAS Institute Inc. All rights reserved.
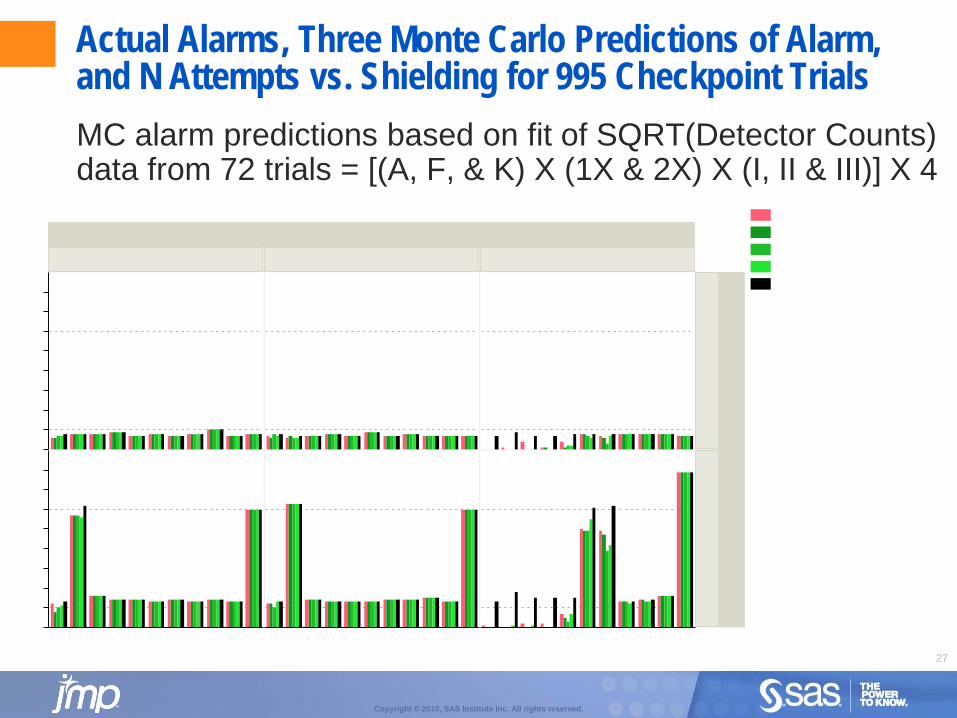
Actual Alarms, Three Monte Carlo Predictions of Alarm, and N Attempts vs. Shielding for 995 Checkpoint Trials MC alarm predictions based on fit of SQRT(Detector Counts) data from 72 trials = [(A, F, & K) X (1X & 2X) X (I, II & III)] X 4

28
Copyright © 2010, SAS Institute Inc. All rights reserved.
44 of 66 “ALL Alarm” Conditions Predicted Exactly
Actual Alarm Number Predicted Alarm Numbers 1 Predicted Alarm Numbers 2 Predicted Alarm Numbers 3 N Attempts
29
Copyright © 2010, SAS Institute Inc. All rights reserved.
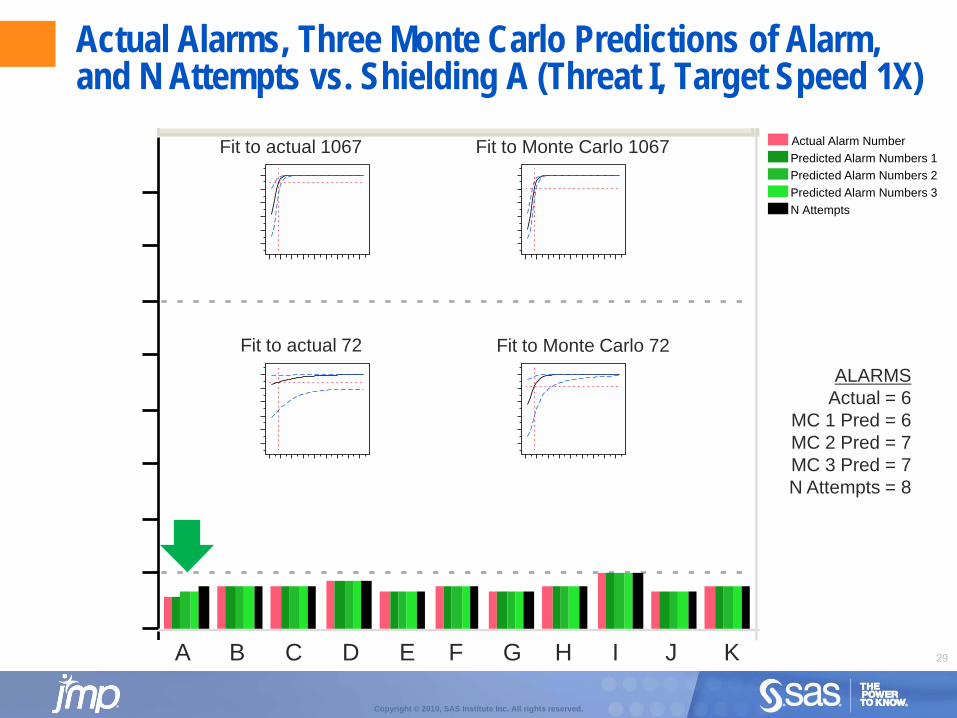
Actual Alarms, Three Monte Carlo Predictions of Alarm, and N Attempts vs. Shielding A (Threat I, Target Speed 1X)
Actual Alarm Number Predicted Alarm Numbers 1 Predicted Alarm Numbers 2 Predicted Alarm Numbers 3 N Attempts
Fit to actual 1067
Fit to actual 72
Fit to Monte Carlo 1067
Fit to Monte Carlo 72 ALARMS
Actual = 6 MC 1 Pred = 6 MC 2 Pred = 7 MC 3 Pred = 7 N Attempts = 8
A B C D E F G H I J K

30
Copyright © 2010, SAS Institute Inc. All rights reserved.
Actual Alarms, Three Monte Carlo Predictions of Alarm, and N Attempts vs. Shielding G (Threat III, Target Speed 2X)
Actual Alarm Number Predicted Alarm Numbers 1 Predicted Alarm Numbers 2 Predicted Alarm Numbers 3 N Attempts
Fit to actual 1067
Fit to actual 72
Fit to Monte Carlo 1067
ALARMS Actual = 49
MC 1 Pred = 47 MC 2 Pred = 39 MC 3 Pred = 42 N Attempts = 62
Fit to Monte Carlo 72

31
Copyright © 2010, SAS Institute Inc. All rights reserved.
Using 6.75% of Original Data (72 of 1067) able to Predict… 44 of 66 cases that ALL alarm (636 out of 636 individual alarms) Of 22 cases with P(d) < 1, Monte Carlo simulation used to
better estimate P(d) » MC simulation based on fit to 3 of the 11 shielding types.
P(d) prediction made for other 8 types (as well as unused data for 3 types fit) based on attenuation value for shielding.
» When N Attempts for an individual case are > 60, the margin of error for P(d) is smaller than when N Attempts for an individual case are < 10
» Goal is to be as efficient as possible in running the fewest real experiments
» Knowledge of effect of attenuation (understanding physics) reduces need to test all shielding types to same degree
Most of analog prediction error is likely due to random noise in process. The means of groups of trials are well estimated.

32
Copyright © 2010, SAS Institute Inc. All rights reserved.
Summary of Analyses
Models fit to two subsets of the detector count data (12.4% and 6.75% of total) are used to show that Mean of detector counts can accurately be predicted Alarm state can accurately be predicted for factor combinations
when detector counts are far from the threshold for alarm – i.e. when P(d) = 1.
In the more difficult situation of predicting P(d) when detector counts are near threshold for Alarm, Monte Carlo simulation is used to improve estimation of P(d). Key assumptions for validity of MC simulation are
» Uniform error across the test space (transformation used) » Relationship between response and factors is well
modeled

33
Copyright © 2010, SAS Institute Inc. All rights reserved.
Recommendations for Future Testing
Use DOE to better cover the space of all factors: Threat (18), Shielding (22), Target Speed (2) & Cargo (7) E.g. 1386 runs in ¼ fraction of 5544 full factorial Constrain design or create multiple smaller designs if some
combinations don’t make sense to use together
Use Transformations to make error uniform across design space
Use both existing analyses as well as physics-based M&S to identify factor combinations in vicinity of threshold for detection that may require more trials

Copyright © 2010 SAS Institute Inc. All rights reserved.
Thanks. Questions or comments?

35
Copyright © 2010, SAS Institute Inc. All rights reserved.
Contnuous vs Categorical responses
Surveys Polls – why ask 1000 people?
Margin of Error = Confidence Interval = 1.96 *sqrt(p*(1-p)/n-1) When p = 0.5, then (1-p) = 0.5 For n = 1000, MOE ≈ 1/sqrt(n) = 1/(31.6) = 0.0316 ≈ 3%
As values of p deviate further from 0.5, MOE shrinks p = 0.50, MOE = 0.032 p = 0.20, MOE = 0.025 p = 0.10, MOE = 0.019 p = 0.05, MOE = 0.014 p = 0.02, MOE = 0.009

36
Copyright © 2010, SAS Institute Inc. All rights reserved.
Margin of Error for P(d) Surveys Polls – why ask 1000 people?
Margin of Error (MOE) = Confidence Interval (CI) = 1.96 *sqrt(p*(1-p)/n-1) When p = 0.5, then (1-p) = 0.5 and MOE ≈ 1/sqrt(n) For a fixed n as p moves away from 0.5, MOE shrinks or For a fixed MOE as p moves away from 0.5, fewer n required
p 1-p n MOE p 1-p MOE n0.50 0.50 1000 3.1% 0.50 0.50 3.0% 10670.20 0.80 1000 2.5% 0.20 0.80 3.0% 6830.10 0.90 1000 1.9% 0.10 0.90 3.0% 3840.05 0.95 1000 1.4% 0.05 0.95 3.0% 2030.02 0.98 1000 0.9% 0.02 0.98 3.0% 840.01 0.99 1000 0.6% 0.01 0.99 3.0% 42
p 1-p n MOE p 1-p MOE n0.50 0.50 100 9.8% 0.50 0.50 10.0% 960.20 0.80 100 7.9% 0.20 0.80 10.0% 610.10 0.90 100 5.9% 0.10 0.90 10.0% 350.05 0.95 100 4.3% 0.05 0.95 10.0% 180.02 0.98 100 2.8% 0.02 0.98 10.0% 80.01 0.99 100 2.0% 0.01 0.99 10.0% 4
p vs. n for fixed MOEp vs. MOE for fixed n

37
Copyright © 2010, SAS Institute Inc. All rights reserved.
Mean(SQRT(Detector Counts)) vs. Shielding (Ordered by Attenuation) by Target Speed
Mean(SQRT(Detector Counts)) vs. SQRT(Scaled Attenuation) by Target Speed
Small reduction in detector counts seen at higher speed.
Linear relationship with uniform variance seen between SQRT(Detector Counts) and SQRT(Scaled Attenuation)

38
Copyright © 2010, SAS Institute Inc. All rights reserved.
Comparing the two“264s” and one“528s” (NOTE: Effect of Target Speed is INCLUDED)

39
Copyright © 2010, SAS Institute Inc. All rights reserved.
40
Copyright © 2010, SAS Institute Inc. All rights reserved.
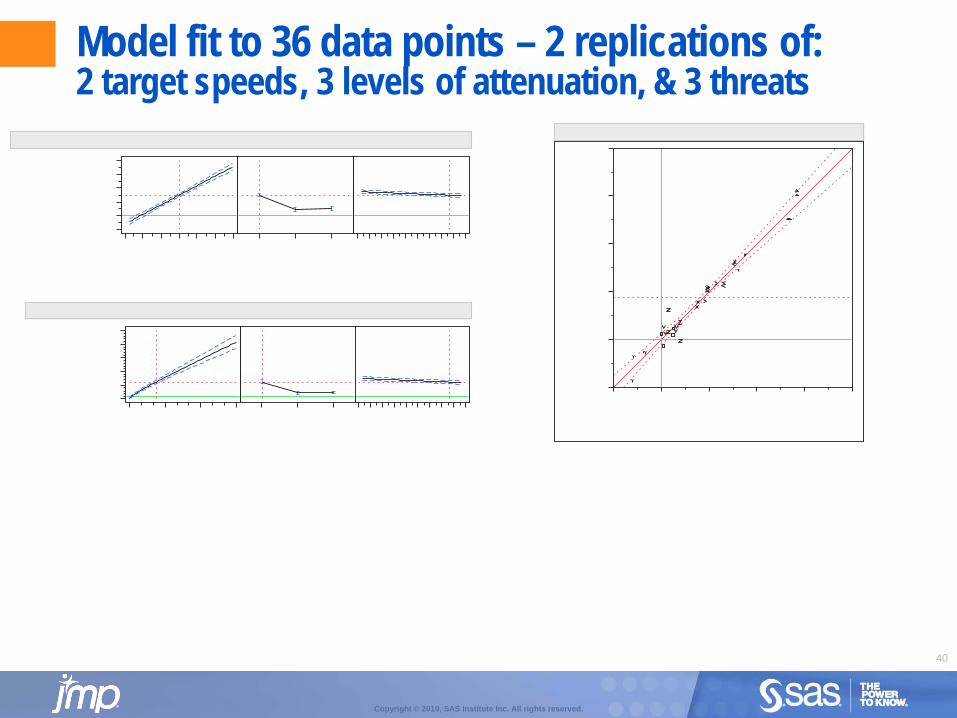
Model fit to 36 data points – 2 replications of: 2 target speeds, 3 levels of attenuation, & 3 threats

41
Copyright © 2010, SAS Institute Inc. All rights reserved.
Model fit to 72 data points – 4 replications of: 2 target speeds, 3 levels of attenuation, & 3 threats

42
Copyright © 2010, SAS Institute Inc. All rights reserved.
Model fit to 144 data points – 8 replications of: 3 of 11 levels of attenuation, 3 threats, and 2 target speeds
43
Copyright © 2010, SAS Institute Inc. All rights reserved.
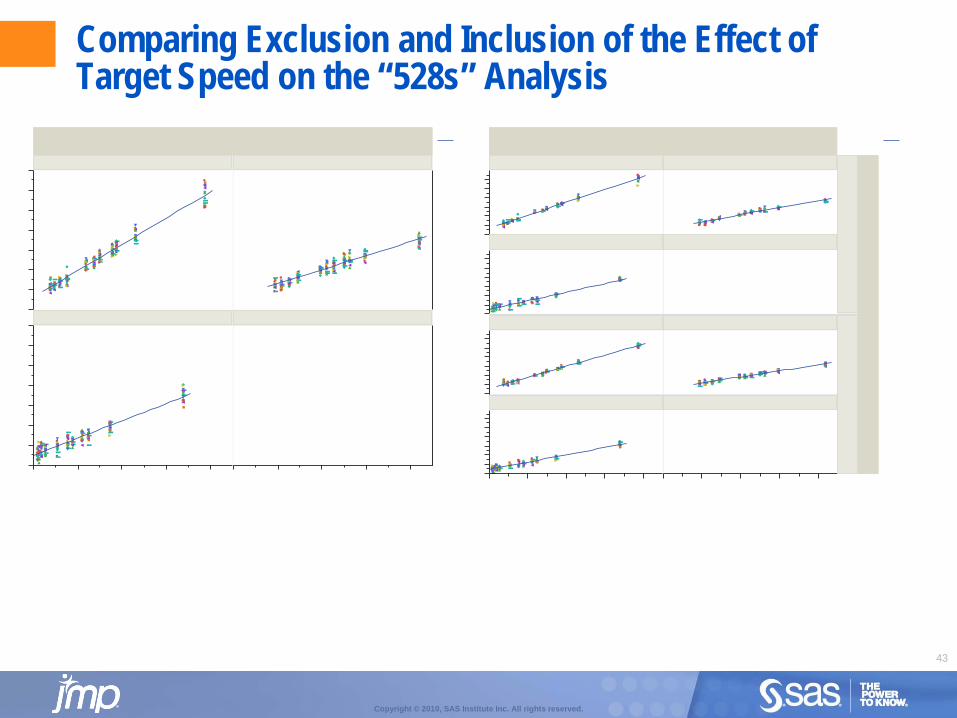
Comparing Exclusion and Inclusion of the Effect of Target Speed on the “528s” Analysis

44
Copyright © 2010, SAS Institute Inc. All rights reserved.
Distributions of 1067 Test Runs by Blocks of all 66 unique combinations of 2 Target Speeds X 3 Threats X 11 Shielding Types
539 of 1067 set aside as checkpoint trials – not to be fit, but to be used to test predictions from full-factorial DOE subsets of the remaining 528 trials 534 of the 539 checkpoints are at Target Speed = 2X with other 5 at Target Speed = 1X The 528 trials are made up of 8 separate sets of the 66 unique combinations of the three factors at their levels (2 X 3 X 11 = 66) 66 trials make up 6.2% of 1067 ≈ 1/16th. 132 trials make up 12.4% of 1067 ≈ 1/8th. 264 trials make up 24.7% of 1067 ≈ 1/4th. 528 trials make up 49.5% of 1067 ≈ 1/2.

45
Copyright © 2010, SAS Institute Inc. All rights reserved.
Plot of Actual vs. Predicted SQRT(Detector Counts) for 539 checkpoints for models with largest RMSE among fits of 8 sets of 66 trials, 4 sets of 132 trials, 2 sets of 264 trials and 1 set of 528 trials.
Data points removed to better see small differences in lines

46
Copyright © 2010, SAS Institute Inc. All rights reserved.
3,850 tests were run for a particular detector technology using 244 (4.4%) of the 5,544 unique combinations of 2 levels of Target Speed*, 7 levels of Cargo, 18 levels of Threat Source*, and 22 levels of Shielding*
Detector Counts*§ and Alarm Status were recorded.
This analysis focuses on 1,067 tests (27.7% of the 3,850) using all 66 unique combinations (27.0% of the 244) of 2 levels of Target Speed, 1 level of Cargo (none), 3 levels of Threat Source, and 11 levels of Shielding
Distributions of these data are shown on the next slide. * NOTE: Data have been rescaled to blind information about actual detection levels, threats, and shielding §NOTE: Some detector count data was imputed because original values were deleted when neutrons were detected
Scope of Original Testing

47
Copyright © 2010, SAS Institute Inc. All rights reserved.
One Subset of Data Used to Predict 995 Checkpoints
72 Runs (6.75% of
1067) Using 3 Different Shielding
13.7% of 528
144 Runs (13.5% of
1067) Using 3 Different Shielding
27.3% of 528

48
Copyright © 2010, SAS Institute Inc. All rights reserved.
Model fit to 18 data points – 1 replication of: 2 target speeds, 3 levels of attenuation, & 3 threats

49
Copyright © 2010, SAS Institute Inc. All rights reserved.
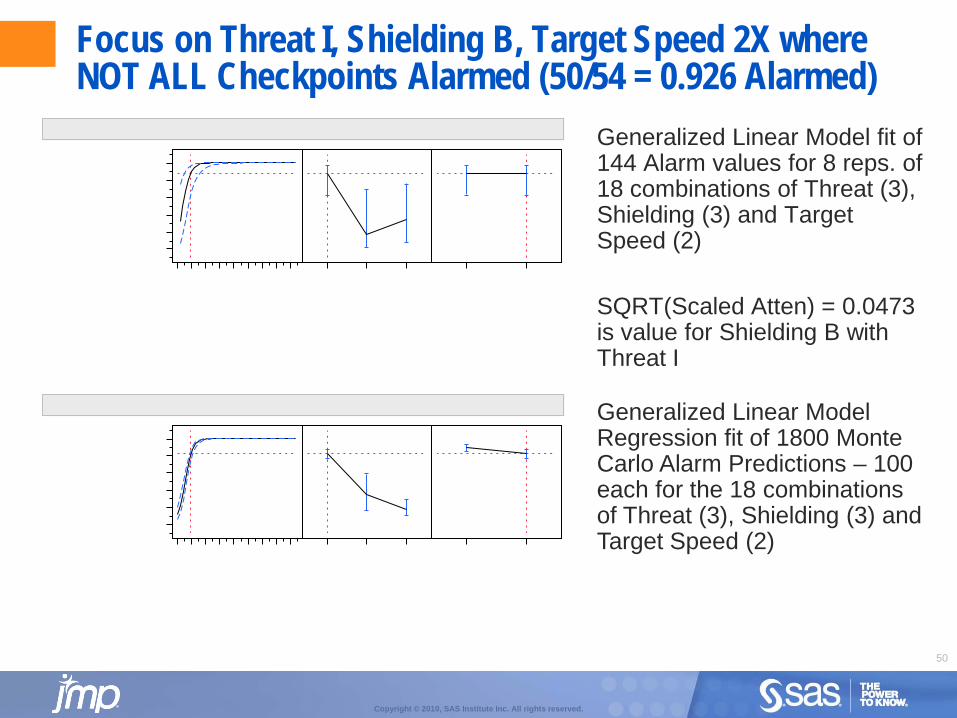
Focus on Threat I, Shielding B, Target Speed 2X where NOT ALL Checkpoints Alarmed (50/54 = 0.926 Alarmed)
Generalized Linear Model Regression fit of 1800 Monte Carlo Alarm Predictions – 100 each for the 18 combinations of Threat (3), Shielding (3) and Target Speed (2)
SQRT(Scaled Atten) = 0.0473 is value for Shielding B with Threat I
50
Copyright © 2010, SAS Institute Inc. All rights reserved.
Focus on Threat I, Shielding B, Target Speed 2X where NOT ALL Checkpoints Alarmed (50/54 = 0.926 Alarmed)
Generalized Linear Model fit of 144 Alarm values for 8 reps. of 18 combinations of Threat (3), Shielding (3) and Target Speed (2)
SQRT(Scaled Atten) = 0.0473 is value for Shielding B with Threat I
Generalized Linear Model Regression fit of 1800 Monte Carlo Alarm Predictions – 100 each for the 18 combinations of Threat (3), Shielding (3) and Target Speed (2)

51
Copyright © 2010, SAS Institute Inc. All rights reserved.
Looking for Comments…
Use of Monte Carlo simulation in lieu or in support of real P(d) testing References to past work in field Own experience Approach used
Modeling of all factors together as opposed to breaking out models by case – e.g. Threat I, Shielding B, & Speed 2X
Approach of focusing on Shielding at extremes of Attenuation Scale vs. Using all Shielding
Metrics and Methods for quantifying accuracy of predictions
Numbers of trials to run near threshold and far from threshold for detection

52
Copyright © 2010, SAS Institute Inc. All rights reserved.
Using 12.4% or 6.75% of original data, able to predict checkpoint results – both analog count data as well as binary alarm data
25 of 33 cases ALL alarm Of 8 cases with P(d) < 1, examined use of Monte Carlo
simulation to better estimate P(d) Monte Carlo simulation based on fit to three of the eleven
shielding types. P(d) prediction made for other eight types based on attenuation value for shielding. Goal is to be as efficient as possible in running the fewest real
experiments » Can knowledge of effect of attenuation reduce need to test so
many shielding types? Most of analog prediction error is likely due to random noise in
process. The means of groups of trials are well estimated.
Related Documents