Edited by Efficient Technology for the Pretreatment of Biomass II Ivet Ferrer, Cigdem Eskicioglu, Georgia Antonopoulou and Audrey Battimelli Printed Edition of the Special Issue Published in Molecules www.mdpi.com/journal/molecules

Welcome message from author
This document is posted to help you gain knowledge. Please leave a comment to let me know what you think about it! Share it to your friends and learn new things together.
Transcript

Edited by
Efficient Technology for the Pretreatment of Biomass II
Ivet Ferrer, Cigdem Eskicioglu, Georgia Antonopoulou and Audrey Battimelli
Printed Edition of the Special Issue Published in Molecules
www.mdpi.com/journal/molecules

Efficient Technology for thePretreatment of Biomass II

Efficient Technology for thePretreatment of Biomass II
Editors
Ivet FerrerCigdem EskiciogluGeorgia AntonopoulouAudrey Battimelli
MDPI • Basel • Beijing • Wuhan • Barcelona • Belgrade • Manchester • Tokyo • Cluj • Tianjin
Editors
Ivet Ferrer
Department of Civil and
Environmental Engineering
Universitat Politecnica de
Catalunya BarcelonaTech
Barcelona
Spain
Cigdem Eskicioglu
University of British Columbia
School of Engineering
Kelowna
Canada
Georgia Antonopoulou
Institute of Chemical
Engineering Sciences
(ICE-HT/FORTH)
Patras
Greece
Audrey Battimelli
Montpellier Universite
LBE INRAE
Narbonne
France
Editorial Office
MDPI
St. Alban-Anlage 66
4052 Basel, Switzerland
This is a reprint of articles from the Special Issue published online in the open access journal Molecules
(ISSN 1420-3049) (available at: www.mdpi.com/journal/molecules/special issues/pretreatment
biomass ii).
For citation purposes, cite each article independently as indicated on the article page online and as
indicated below:
LastName, A.A.; LastName, B.B.; LastName, C.C. Article Title. Journal Name Year, Volume Number,
Page Range.
ISBN 978-3-0365-1794-0 (Hbk)
ISBN 978-3-0365-1793-3 (PDF)
© 2021 by the authors. Articles in this book are Open Access and distributed under the Creative
Commons Attribution (CC BY) license, which allows users to download, copy and build upon
published articles, as long as the author and publisher are properly credited, which ensures maximum
dissemination and a wider impact of our publications.
The book as a whole is distributed by MDPI under the terms and conditions of the Creative Commons
license CC BY-NC-ND.
Contents
About the Editors . . . . . . . . . . . . . . . . . . . . . . . . . . . . . . . . . . . . . . . . . . . . . . vii
Preface to ”Efficient Technology for the Pretreatment of Biomass II” . . . . . . . . . . . . . . . ix
Helen Coarita Fernandez, Diana Amaya Ramirez, Ruben Teixeira Franco, Pierre Buffiere andRemy BayardMethods for the Evaluation of Industrial Mechanical Pretreatments before Anaerobic DigestersReprinted from: Molecules 2020, 25, 860, doi:10.3390/molecules25040860 . . . . . . . . . . . . . . 1
Emna Feki, Audrey Battimelli, Sami Sayadi, Abdelhafidh Dhouib and Sonia KhoufiHigh-Rate Anaerobic Digestion of Waste Activated Sludge by Integration of Electro-FentonProcessReprinted from: Molecules 2020, 25, 626, doi:10.3390/molecules25030626 . . . . . . . . . . . . . . 15
Ummihan Gunerhan, Ender Us, Lutfiye Dumlu, Vedat Yılmaz, Helene Carrere and AltınayN. PerendeciImpacts of Chemical-Assisted Thermal Pretreatments on Methane Production from Fruit andVegetable Harvesting Wastes: Process OptimizationReprinted from: Molecules 2020, 25, 500, doi:10.3390/molecules25030500 . . . . . . . . . . . . . . 29
Gokce Kor-Bicakci, Timothy Abbott, Emine Ubay-Cokgor and Cigdem EskiciogluOccurrence of the Persistent Antimicrobial Triclosan in Microwave Pretreated andAnaerobically Digested Municipal Sludges under Various Process ConditionsReprinted from: Molecules 2020, 25, 310, doi:10.3390/molecules25020310 . . . . . . . . . . . . . . 51
Georgia Antonopoulou, Dimitrios Vayenas and Gerasimos LyberatosBiogas Production from Physicochemically Pretreated Grass Lawn Waste: Comparison ofDifferent Process SchemesReprinted from: Molecules 2020, 25, 296, doi:10.3390/molecules25020296 . . . . . . . . . . . . . . 71
Marinela Zhurka, Apostolos Spyridonidis, Ioanna A. Vasiliadou and Katerina StamatelatouBiogas Production from Sunflower Head and Stalk Residues: Effect of Alkaline PretreatmentReprinted from: Molecules 2019, 25, 164, doi:10.3390/molecules25010164 . . . . . . . . . . . . . . 85
Aurelie Bichot, Mickael Lerosty, Laureline Geirnaert, Valerie Mechin, Helene Carrere,Nicolas Bernet, Jean-Philippe Delgenes and Diana Garcıa-BernetSoft Microwave Pretreatment to Extract P-Hydroxycinnamic Acids from Grass StalksReprinted from: Molecules 2019, 24, 3885, doi:10.3390/molecules24213885 . . . . . . . . . . . . . . 101
Ana Sılvia de Almeida Scarcella, Alexandre Favarin Somera, Christiane da Costa CarreiraNunes, Eleni Gomes, Ana Claudia Vici, Marcos Silveira Buckeridge and Maria de LourdesTeixeira de Moraes PolizeliMatrix Discriminant Analysis Evidenced Surface-Lithium as an Important Factor to Increasethe Hydrolytic Saccharification of Sugarcane BagasseReprinted from: Molecules 2019, 24, 3614, doi:10.3390/molecules24193614 . . . . . . . . . . . . . . 123
David Steinbach, Dominik Wust, Simon Zielonka, Johannes Krumpel, Simon Munder,Matthias Pagel and Andrea KruseSteam Explosion Conditions Highly Influence the Biogas Yield of Rice StrawReprinted from: Molecules 2019, 24, 3492, doi:10.3390/molecules24193492 . . . . . . . . . . . . . . 139
v
Yen-Keong Cheah, Joan Dosta and Joan Mata-AlvarezEnhancement of Volatile Fatty Acids Production from Food Waste by Mature Compost AdditionReprinted from: Molecules 2019, 24, 2986, doi:10.3390/molecules24162986 . . . . . . . . . . . . . . 153
Chrysoula Mirtsou-Xanthopoulou, Ioannis V. Skiadas and Hariklia N. GavalaOn the Effect of Aqueous Ammonia Soaking Pre-Treatment on Continuous Anaerobic Digestionof Digested Swine Manure FibersReprinted from: Molecules 2019, 24, 2469, doi:10.3390/molecules24132469 . . . . . . . . . . . . . . 171
Maria Patsalou, Charis G. Samanides, Eleni Protopapa, Stella Stavrinou, Ioannis Vyrides andMichalis KoutinasA Citrus Peel Waste Biorefinery for Ethanol and Methane ProductionReprinted from: Molecules 2019, 24, 2451, doi:10.3390/molecules24132451 . . . . . . . . . . . . . . 183
Shangyuan Tang, Chunming Xu, Linh Tran Khanh Vu, Sicheng Liu, Peng Ye, Lingci Li,Yuxuan Wu, Mengyu Chen, Yao Xiao, Yue Wu, Yining Wang, Qiong Yan and Xiyu ChengEnhanced Enzymatic Hydrolysis of Pennisetum alopecuroides by Dilute Acid, Alkaline and FerricChloride PretreatmentsReprinted from: Molecules 2019, 24, 1715, doi:10.3390/molecules24091715 . . . . . . . . . . . . . . 199
Long Lin, Ehssan Hosseini Koupaie, Armineh Azizi, Amir Abbas Bazyar Lakeh, Bipro R.Dhar, Hisham Hafez and Elsayed ElbeshbishyComparison of Two Process Schemes Combining Hydrothermal Treatment and AcidogenicFermentation of Source-Separated OrganicsReprinted from: Molecules 2019, 24, 1466, doi:10.3390/molecules24081466 . . . . . . . . . . . . . . 213
Joana R. Bernardo, Francisco M. Gırio and Rafał M. ŁukasikThe Effect of the Chemical Character of Ionic Liquids on Biomass Pre-Treatment and PosteriorEnzymatic HydrolysisReprinted from: Molecules 2019, 24, 808, doi:10.3390/molecules24040808 . . . . . . . . . . . . . . 227
vi
About the Editors
Ivet Ferrer
Dr. Ivet Ferrer is a full professor at the Department of Civil and Environmental Engineering
of the Universitat Politecnica de Catalunya·BarcelonaTech. Currently, she leads the Research Group
of Environmental Engineering and Microbiology (GEMMA-UPC). Her main area of research is the
optimization of biomass anaerobic digestion by applying pretreatments and co-digestion. She has
also addressed the implementation and assessment of low-tech digesters for rural areas. Her research
is now focused on the recovery of resources from waste streams, including high-value bioproducts
and biogas.
Cigdem Eskicioglu
Dr. Cigdem Eskicioglu is a full professor and NSERC/Metro Vancouver Senior Industrial
Research Chair in the area of Resource Recovery from Wastewater in the School of Engineering at
University of British Columbia (UBC)’s Okanagan Campus. She is also the founder/leader of the
Bioreactor Technology Group (BTG), which focuses on advanced wastewater treatment processes
for more efficient contaminant removal, energy conservation and production, resource recovery and
mitigation of trace contaminants of emerging concern.
Georgia Antonopoulou
Dr. Antonopoulou Georgia is a senior research associate in the Institute of Chemical Engineering
Sciences (ICE-HT) of the Foundation for Research and Technology (FORTH), in Greece. She is a
chemical engineer and completed her PhD and MSc at the Department of Chemical Engineer of Patras
University. Her research interests focus on waste and wastewater treatment via biological processes,
anaerobic digestion and fermentation, bioreactor design, pretreatment of lignocellulosic biomass and
modeling of microbial processes.
Audrey Battimelli
Dr. Audrey Battimelli is a research engineer at the LBE, Laboratory of Environmental
Biotechnology INRAE, of the French National Research Institute for Agriculture, Food and the
Environment. She is in charge of Bio2E Platform and specialises in application bioprocesses and
physico-chemical pretreatments in collaborative work with professionals.
vii

Preface to ”Efficient Technology for the Pretreatmentof Biomass II”
Biomass can be used as feedstock for the production of biomaterials, chemicals, platform
molecules and biofuels. It is the most reliable alternative to reduce fossil fuel consumption and
greenhouse gas emissions. Within the framework of the circular economy, resource recovery from
organic waste, including sewage sludge, biowaste, manure and slaughterhouse waste, is particularly
useful, as it helps save resources while reducing environmental pollution. In contrast to energy crops,
lignocellulosic biomass and algae do not compete for food production; therefore, they represent
an important source of biomass for bioenergy and bioproducts. However, biomass may require a
pretreatment step in order to enhance its conversion into valuable products in terms of process yield
and/or productivity. Furthermore, a pretreatment step may be mandatory for waste management
(i.e., animal by-products).
Pretreatment technologies are applied upstream of various conversion processes of biomass
into biofuels or biomaterials, including bioethanol, biohydrogen, biomethane, biomolecules or
bioproducts. Pretreatments may include mechanical, thermal, chemical and biological techniques,
which represent a crucial, cost-intensive step for the development of biorefineries. Thus, research
is needed to help identify the most effective, economic, and environmentally friendly pretreatment
options for each feedstock.
This Special Issue aims to gather recent developments of biomass pretreatments for bioproduct
and biofuel production.
Ivet Ferrer, Cigdem Eskicioglu, Georgia Antonopoulou, Audrey Battimelli
Editors
ix


molecules
Article
Methods for the Evaluation of Industrial MechanicalPretreatments before Anaerobic Digesters
Helen Coarita Fernandez, Diana Amaya Ramirez, Ruben Teixeira Franco , Pierre Buffière * andRémy Bayard
DEEP Laboratory, Univ. Lyon, INSA Lyon, EA7429, F-69621 Villeurbanne, CEDEX, France;[email protected] (H.C.F.); [email protected] (D.A.R.);[email protected] (R.T.F.); [email protected] (R.B.)* Correspondence: [email protected]
Academic Editors: Mara G. Freire and Jalel LabidiReceived: 15 January 2020; Accepted: 11 February 2020; Published: 15 February 2020
Abstract: Different methods were tested to evaluate the performance of a pretreatment beforeanaerobic digestion. Besides conventional biochemical parameters, such as the biochemical methanepotential (BMP), the methane production rate, or the extent of solubilization of organic compounds,methods for physical characterization were also developed in the present work. Criteria, such asthe particle size distribution, the water retention capacity, and the rheological properties, were thusmeasured. These methods were tested on samples taken in two full-scale digesters operating withcattle manure as a substrate and using hammer mills. The comparison of samples taken before andafter the pretreatment unit showed no significant improvement in the methane potential. However,the methane production rate increased by 15% and 26% for the two hammer mills, respectively. Arelevant improvement of the rheological properties was also observed. This feature is likely correlatedwith the average reduction in particle size during the pretreatment operation, but these results needsconfirmation in a wider range of systems.
Keywords: anaerobic digestion; mechanical pretreatments; agricultural wastes; rheology; physicalproperties
1. Introduction
In the field of anaerobic digestion, a vast number of reviews have been published in the lasttwenty years about substrate conditioning and pretreatments of organic biowaste [1–3], or morespecifically, on different products such as municipal wastewater sludge [4], municipal organic solidwastes [5–8], lignocellulosic biomass [9–12], and agricultural wastes [13]. Even with an extensive anddiverse research literature about different substrates, pretreatments, and the biomass recovery sector,research on mechanical pretreatments is still, to our knowledge, limited [14]. However, mechanicalpretreatments are the most commonly used devices at full-scale [15,16]. Many functions and objectivesare attributed to mechanical (physical) pretreatments. One of the most important objectives is toupgrade the digester feeding conditions in order to avoid floating layers [1] and reduce the size ofmaterials and, consequently, to improve mixing, heat, and mass transfer [17]. Biomass pretreatmentalso extends to the types of feedstocks usable in anaerobic digestion The reduction in particle sizeleads to an increment in the accessible surface area and may increase methane production, either byincreasing the methane yield or by increasing the methane production rate [18]. Nevertheless, physicalpretreatments require considerable energy, ranging from 1 to 50 kWh per ton of fresh matter [3,18,19].
Different techniques are cited in the bibliography in order to perform substrate comminution,grinding or milling. Instruments, such as ball mills, knife mills, vibratory mills, hammer mills, andextruders, are used. Kratky and Jirout [3] concluded that the adequate device will mainly depend
1
Molecules 2020, 25, 860
on the moisture content of the substrate. Knife and hammer mills were cited as the most suitabletechniques for dry matter comminution, while extruders are more suitable for wet matter. In addition,they point out that particle size reduction will depend on the feeding system and the equipmentoperation (e.g., rotational rate). However, studies on mechanical devices are principally focused onenergy requirements [3,20], and generally their functions and integral performance description arenot explained. Thus, the performances of industrial mechanical pretreatments are mostly found incommercial booklets. In this context, knife mills are supposed to comminute and shear the biomass.Hammer mills break up the matter through a crippling effect which is a more advanced treatment.On the other hand, discs mills fragment and compress the biomass; string mills pull fibers of biomassreducing their size and cylindric mills dilacerate and decompact the biomass. There are also grindingpumps, pulpers, presses, and extruders, and their main functions are to reduce particle size andimprove the fluidity. However, some mechanical pretreatments have been evaluated at full-scale such ascross-flow grinders [14,21], ball mills [22], and knife mills [23]. In these studies, the recurrent parametersinvestigated were the methane production yield (BMP) and the methane production rate, before andafter pretreatment. Some authors also evaluated the potential release of inhibiting compounds duringpretreatments through BMP tests and continuous experiments [14,15,24–26]. Tsapekos et al. [27]proposed physicochemical analysis, such as electrical conductivity tests, soluble chemical oxygendemand tests, and enzymatic hydrolysis on lignocellulosic biomass, as part of a pretreatment evaluationin order to find a correlation with the methane yield. Other methods, such as the measurement ofthe accessible surface area and of the water retention capacity, were suggested to evaluate theaccessibility as an indicator of pretreatment efficiency [28]. The results obtained were interestingbut not conclusive. By their side, Cai et al. [29] summarized some physicochemical characterizationmethods on lignocellulosic biomass such as particle size, grindability, density, flowability, and moistureadsorption, among others. Those analytical methods were pointed out as relevant for the processperformance. Indeed, evaluation methods of a pretreatment must be in accordance with its mainobjectives. In summary, kinetics, biochemical, and solubilization parameters are the most commonindicators to evaluate the pretreatment performance. However, physical parameters evaluations arealso important, and their evaluation could be innovative to assess the benefits of the process in termsof energy consumption (lower mixing) and maintenance cost.
Parameters, such as size particle distribution, water retention capacity (WRC) and fluidity, aremodified by a physical pretreatment. Water retention capacity is defined as the permanently boundamount of water attached to substrate when an external suction force is applied [30]. It is related withsome properties of the substrate’s nature, such as porosity, and it can be an indicator of accessibilityimprovement [31]. In addition, water availability is important to make a substrate more flowable [32].A substrate’s rheological properties play an important role in reactor mixing; among other parameters,homogeneity, mixing energy, and heat and mass transfer depend on these properties [33,34]. Manystudies have demonstrated that rheological properties are related to a substrate’s physico-chemicalproperties, total solids (TS) content, particle size, and temperature [35]. Further research on theinfluence of mechanical pretreatments at the industrial scale on the rheological behavior of untreatedand treated substrates with high TS and long-sized fiber contents is important in order to evaluate theirperformance. Mönch-Tegeder et al. [36] reported that smaller particles resulted in an improvementof the flow behavior. Indeed, energy efficiency in anaerobic digestion from unit operations is deeplyassociated to flow rheology characteristics. The pattern and the specific features, such as agitators andpumps, depend on raw and digested manure’s rheological behavior [37]. As an example, mixing in thereactor is an important energy factor to be considered, because it avoids significant gradients in theconcentration of nutrients, inhibitor substances formation, suspended biomass and solids, temperatureor pH. Besides, it limits the sedimentation of heavy solids, the formation of floating foams and scum aswell as promotes the transfer of biogas [36–38].
In short, contrary to chemical, thermal or enzymatic pretreatments, mechanical pretreatmentsbefore anaerobic digestion have received very little attention by the research community. Despite this,
2
Molecules 2020, 25, 860
it is clear that mechanical treatments affect the biochemical properties, soluble fractions, particle size,and rheological behavior of a given substrate.
The main novelty of the present work is the proposal of a comprehensive method to evaluatemechanical pretreatments at full-scale. In addition to biochemical parameters, physical parameters,such as size reduction, rheological properties, and water retention capacity, were evaluated. Thismethod was tested on two anaerobic digesters using two different hammer mills as pretreatments.
2. Results and Discussion
2.1. Characterization of Incoming Products
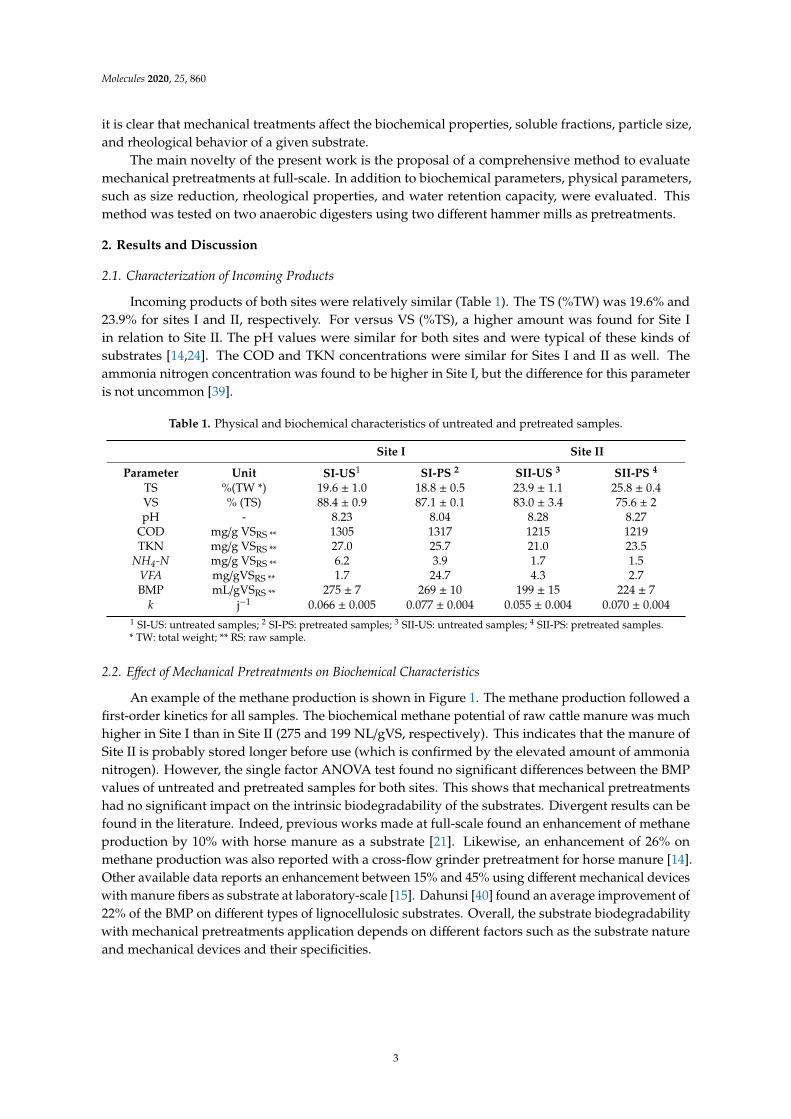
Incoming products of both sites were relatively similar (Table 1). The TS (%TW) was 19.6% and23.9% for sites I and II, respectively. For versus VS (%TS), a higher amount was found for Site Iin relation to Site II. The pH values were similar for both sites and were typical of these kinds ofsubstrates [14,24]. The COD and TKN concentrations were similar for Sites I and II as well. Theammonia nitrogen concentration was found to be higher in Site I, but the difference for this parameteris not uncommon [39].
Table 1. Physical and biochemical characteristics of untreated and pretreated samples.
Site I Site II
Parameter Unit SI-US1 SI-PS 2 SII-US 3 SII-PS 4
TS %(TW *) 19.6 ± 1.0 18.8 ± 0.5 23.9 ± 1.1 25.8 ± 0.4VS % (TS) 88.4 ± 0.9 87.1 ± 0.1 83.0 ± 3.4 75.6 ± 2pH - 8.23 8.04 8.28 8.27
COD mg/g VSRS ** 1305 1317 1215 1219TKN mg/g VSRS ** 27.0 25.7 21.0 23.5
NH4-N mg/g VSRS ** 6.2 3.9 1.7 1.5VFA mg/gVSRS ** 1.7 24.7 4.3 2.7BMP mL/gVSRS ** 275 ± 7 269 ± 10 199 ± 15 224 ± 7
k j−1 0.066 ± 0.005 0.077 ± 0.004 0.055 ± 0.004 0.070 ± 0.0041 SI-US: untreated samples; 2 SI-PS: pretreated samples; 3 SII-US: untreated samples; 4 SII-PS: pretreated samples.* TW: total weight; ** RS: raw sample.
2.2. Effect of Mechanical Pretreatments on Biochemical Characteristics
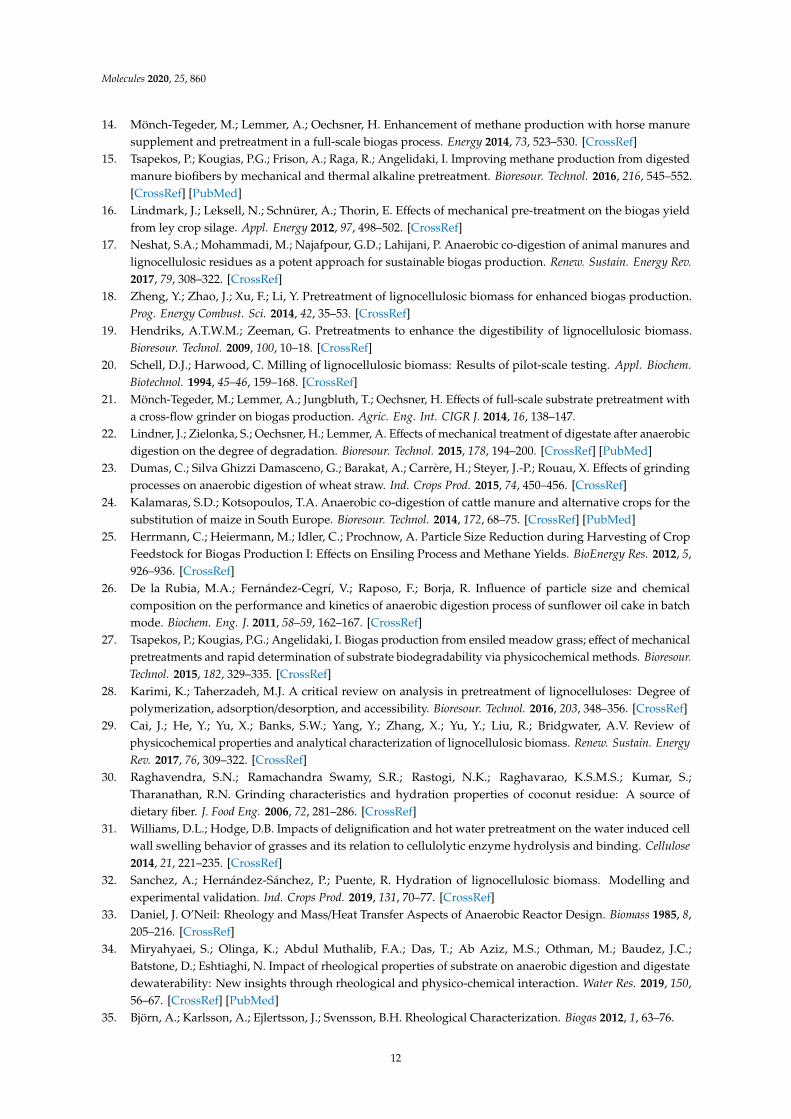
An example of the methane production is shown in Figure 1. The methane production followed afirst-order kinetics for all samples. The biochemical methane potential of raw cattle manure was muchhigher in Site I than in Site II (275 and 199 NL/gVS, respectively). This indicates that the manure ofSite II is probably stored longer before use (which is confirmed by the elevated amount of ammonianitrogen). However, the single factor ANOVA test found no significant differences between the BMPvalues of untreated and pretreated samples for both sites. This shows that mechanical pretreatmentshad no significant impact on the intrinsic biodegradability of the substrates. Divergent results can befound in the literature. Indeed, previous works made at full-scale found an enhancement of methaneproduction by 10% with horse manure as a substrate [21]. Likewise, an enhancement of 26% onmethane production was also reported with a cross-flow grinder pretreatment for horse manure [14].Other available data reports an enhancement between 15% and 45% using different mechanical deviceswith manure fibers as substrate at laboratory-scale [15]. Dahunsi [40] found an average improvement of22% of the BMP on different types of lignocellulosic substrates. Overall, the substrate biodegradabilitywith mechanical pretreatments application depends on different factors such as the substrate natureand mechanical devices and their specificities.
3
Molecules 2020, 25, 860
Molecules 2019, 24, x FOR PEER REVIEW 4 of 15
biodegradability with mechanical pretreatments application depends on different factors such as the substrate nature and mechanical devices and their specificities.
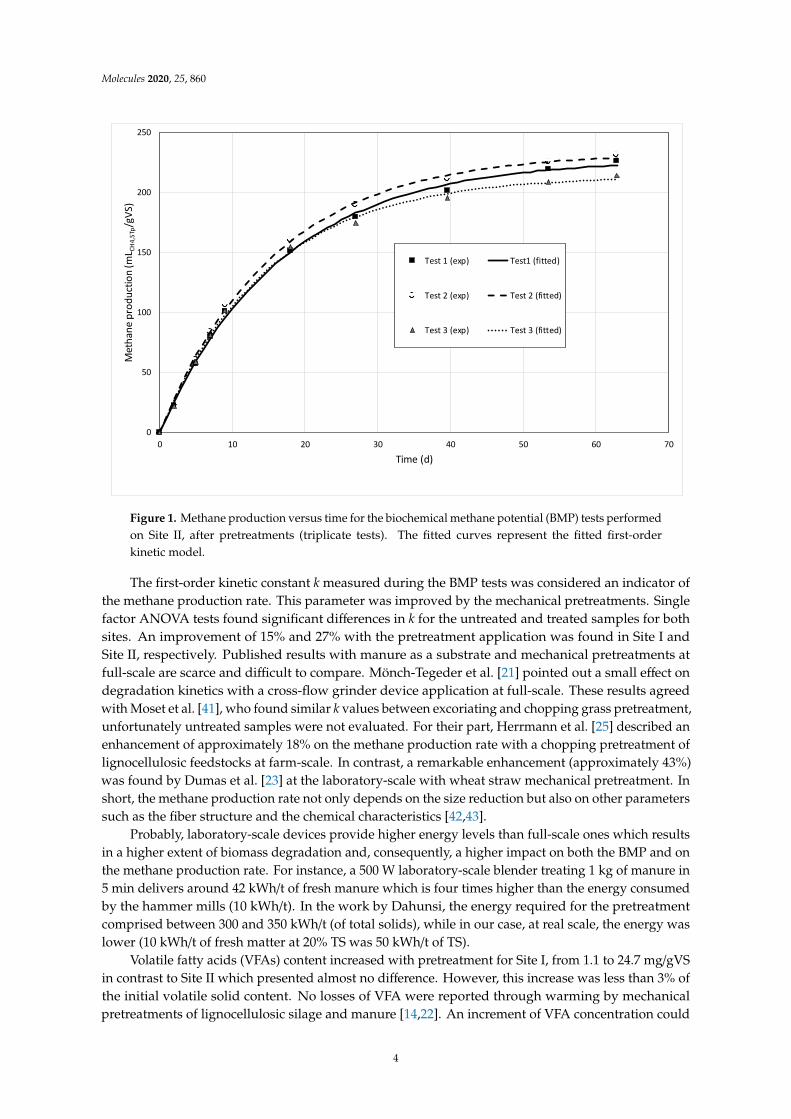
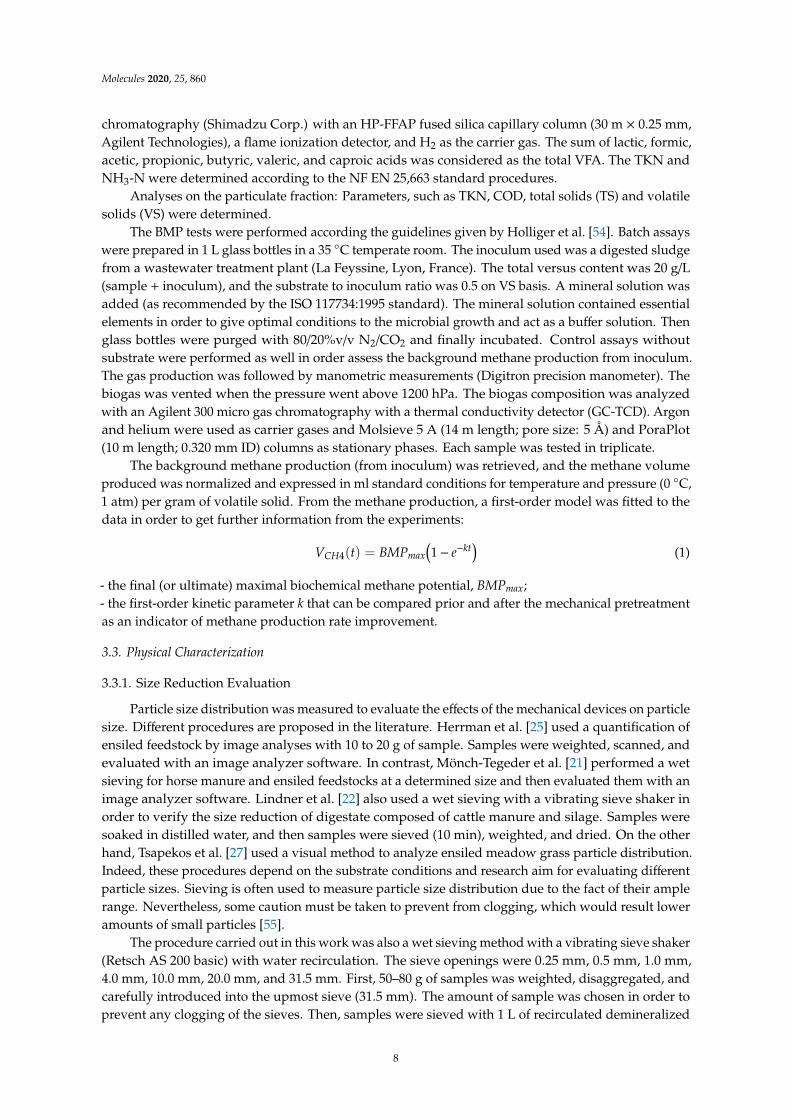
Figure 1. Methane production versus time for the biochemical methane potential (BMP) tests performed on Site II, after pretreatments (triplicate tests). The fitted curves represent the fitted first-order kinetic model.
The first-order kinetic constant k measured during the BMP tests was considered an indicator of
the methane production rate. This parameter was improved by the mechanical pretreatments. Single factor ANOVA tests found significant differences in k for the untreated and treated samples for both sites. An improvement of 15% and 27% with the pretreatment application was found in Site I and Site II, respectively. Published results with manure as a substrate and mechanical pretreatments at full-scale are scarce and difficult to compare. Mönch-Tegeder et al. [21] pointed out a small effect on degradation kinetics with a cross-flow grinder device application at full-scale. These results agreed with Moset et al. [41], who found similar k values between excoriating and chopping grass pretreatment, unfortunately untreated samples were not evaluated. For their part, Herrmann et al. [25] described an enhancement of approximately 18% on the methane production rate with a chopping pretreatment of lignocellulosic feedstocks at farm-scale. In contrast, a remarkable enhancement (approximately 43%) was found by Dumas et al. [23] at the laboratory-scale with wheat straw mechanical pretreatment. In short, the methane production rate not only depends on the size reduction but also on other parameters such as the fiber structure and the chemical characteristics [42,43].
Probably, laboratory-scale devices provide higher energy levels than full-scale ones which results in a higher extent of biomass degradation and, consequently, a higher impact on both the BMP and on the methane production rate. For instance, a 500 W laboratory-scale blender treating 1 kg of manure in 5 min delivers around 42 kWh/t of fresh manure which is four times higher than the energy consumed by the hammer mills (10 kWh/t). In the work by Dahunsi, the energy required for the pretreatment comprised between 300 and 350 kWh/t (of total solids), while in our case, at real scale, the energy was lower (10 kWh/t of fresh matter at 20% TS was 50 kWh/t of TS).
0
50
100
150
200
250
0 10 20 30 40 50 60 70
Met
hane
pro
duct
ion
(mL C
H4,S
Tp/g
VS)
Time (d)
Test 1 (exp) Test1 (fitted)
Test 2 (exp) Test 2 (fitted)
Test 3 (exp) Test 3 (fitted)
Figure 1. Methane production versus time for the biochemical methane potential (BMP) tests performedon Site II, after pretreatments (triplicate tests). The fitted curves represent the fitted first-orderkinetic model.
The first-order kinetic constant k measured during the BMP tests was considered an indicator ofthe methane production rate. This parameter was improved by the mechanical pretreatments. Singlefactor ANOVA tests found significant differences in k for the untreated and treated samples for bothsites. An improvement of 15% and 27% with the pretreatment application was found in Site I andSite II, respectively. Published results with manure as a substrate and mechanical pretreatments atfull-scale are scarce and difficult to compare. Mönch-Tegeder et al. [21] pointed out a small effect ondegradation kinetics with a cross-flow grinder device application at full-scale. These results agreedwith Moset et al. [41], who found similar k values between excoriating and chopping grass pretreatment,unfortunately untreated samples were not evaluated. For their part, Herrmann et al. [25] described anenhancement of approximately 18% on the methane production rate with a chopping pretreatment oflignocellulosic feedstocks at farm-scale. In contrast, a remarkable enhancement (approximately 43%)was found by Dumas et al. [23] at the laboratory-scale with wheat straw mechanical pretreatment. Inshort, the methane production rate not only depends on the size reduction but also on other parameterssuch as the fiber structure and the chemical characteristics [42,43].
Probably, laboratory-scale devices provide higher energy levels than full-scale ones which resultsin a higher extent of biomass degradation and, consequently, a higher impact on both the BMP and onthe methane production rate. For instance, a 500 W laboratory-scale blender treating 1 kg of manure in5 min delivers around 42 kWh/t of fresh manure which is four times higher than the energy consumedby the hammer mills (10 kWh/t). In the work by Dahunsi, the energy required for the pretreatmentcomprised between 300 and 350 kWh/t (of total solids), while in our case, at real scale, the energy waslower (10 kWh/t of fresh matter at 20% TS was 50 kWh/t of TS).
Volatile fatty acids (VFAs) content increased with pretreatment for Site I, from 1.1 to 24.7 mg/gVSin contrast to Site II which presented almost no difference. However, this increase was less than 3% ofthe initial volatile solid content. No losses of VFA were reported through warming by mechanicalpretreatments of lignocellulosic silage and manure [14,22]. An increment of VFA concentration could
4
Molecules 2020, 25, 860
be attributed to a better VFA solubilization [22,26]. In addition, the substrate nature’s, such as theinitial proteins contents, and its fermentation may affect VFA concentration [26]. In all samples, nosoluble sugars were detected.
2.3. Effect of Mechanical Pretreatments on Physical Characteristics
2.3.1. Size Reduction
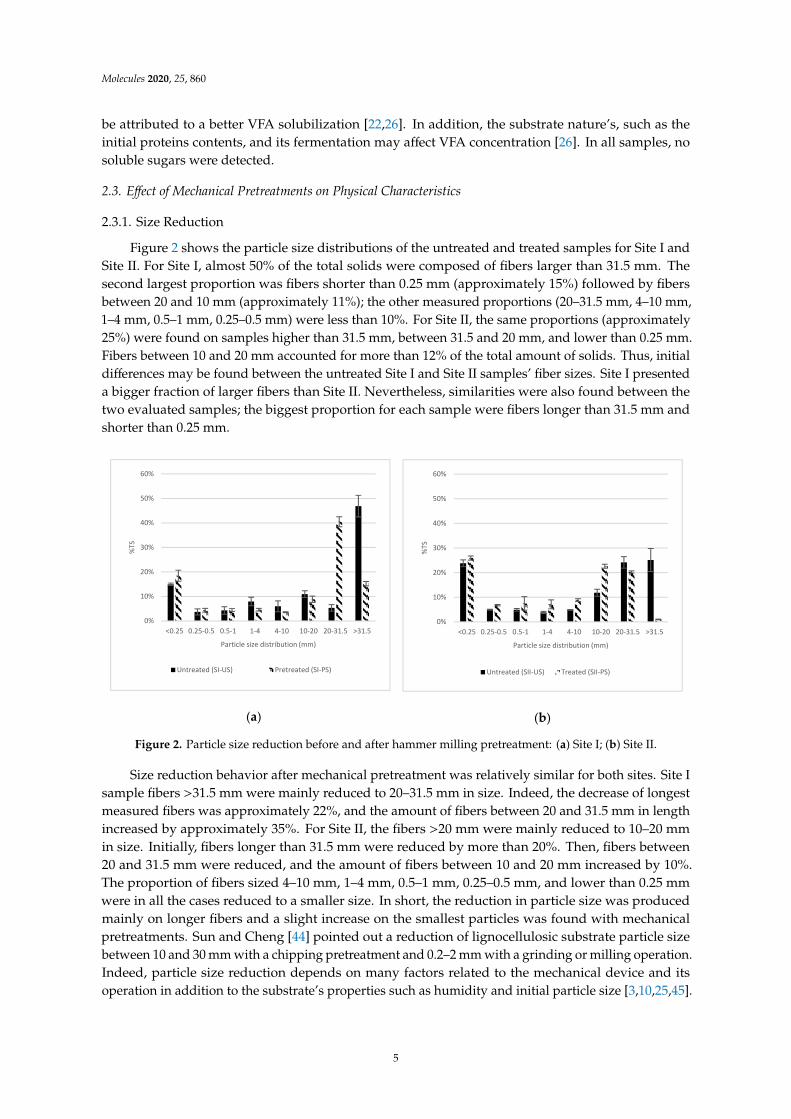
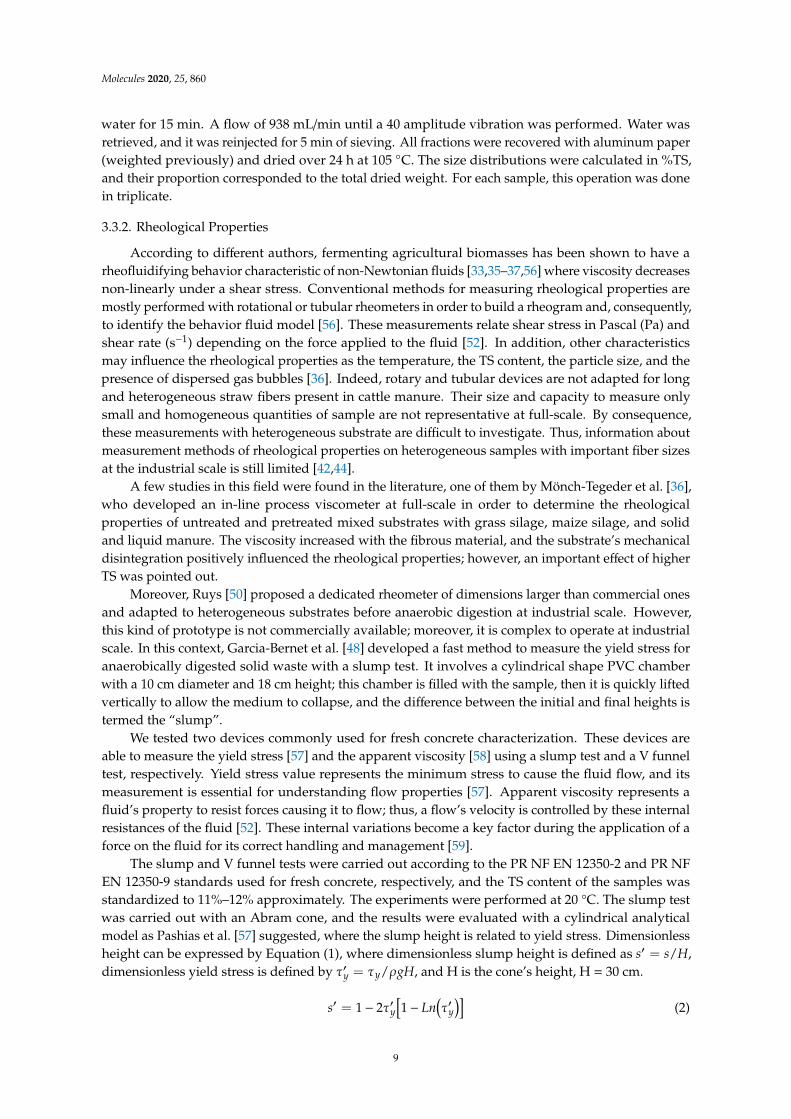
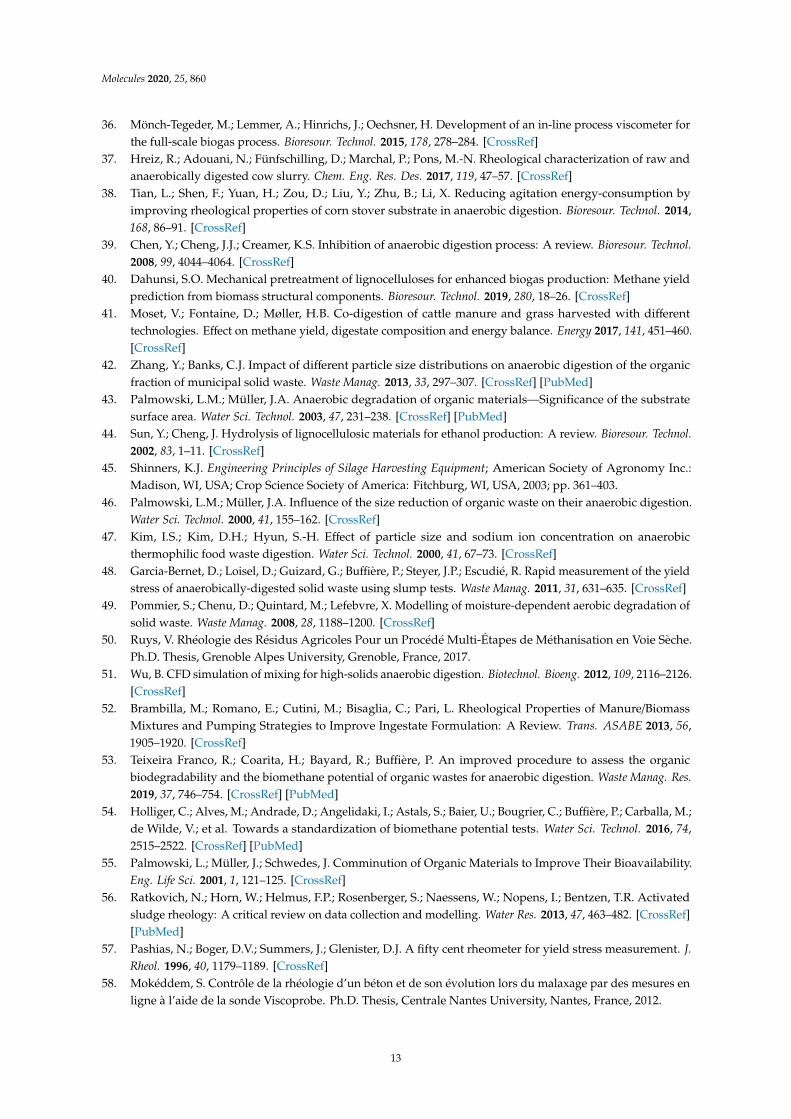
Figure 2 shows the particle size distributions of the untreated and treated samples for Site I andSite II. For Site I, almost 50% of the total solids were composed of fibers larger than 31.5 mm. Thesecond largest proportion was fibers shorter than 0.25 mm (approximately 15%) followed by fibersbetween 20 and 10 mm (approximately 11%); the other measured proportions (20–31.5 mm, 4–10 mm,1–4 mm, 0.5–1 mm, 0.25–0.5 mm) were less than 10%. For Site II, the same proportions (approximately25%) were found on samples higher than 31.5 mm, between 31.5 and 20 mm, and lower than 0.25 mm.Fibers between 10 and 20 mm accounted for more than 12% of the total amount of solids. Thus, initialdifferences may be found between the untreated Site I and Site II samples’ fiber sizes. Site I presenteda bigger fraction of larger fibers than Site II. Nevertheless, similarities were also found between thetwo evaluated samples; the biggest proportion for each sample were fibers longer than 31.5 mm andshorter than 0.25 mm.Molecules 2019, 24, x FOR PEER REVIEW 6 of 15
(a) (b)
Figure 2. Particle size reduction before and after hammer milling pretreatment: (a) Site I; (b) Site II.
2.3.2. Water Retention Capacity
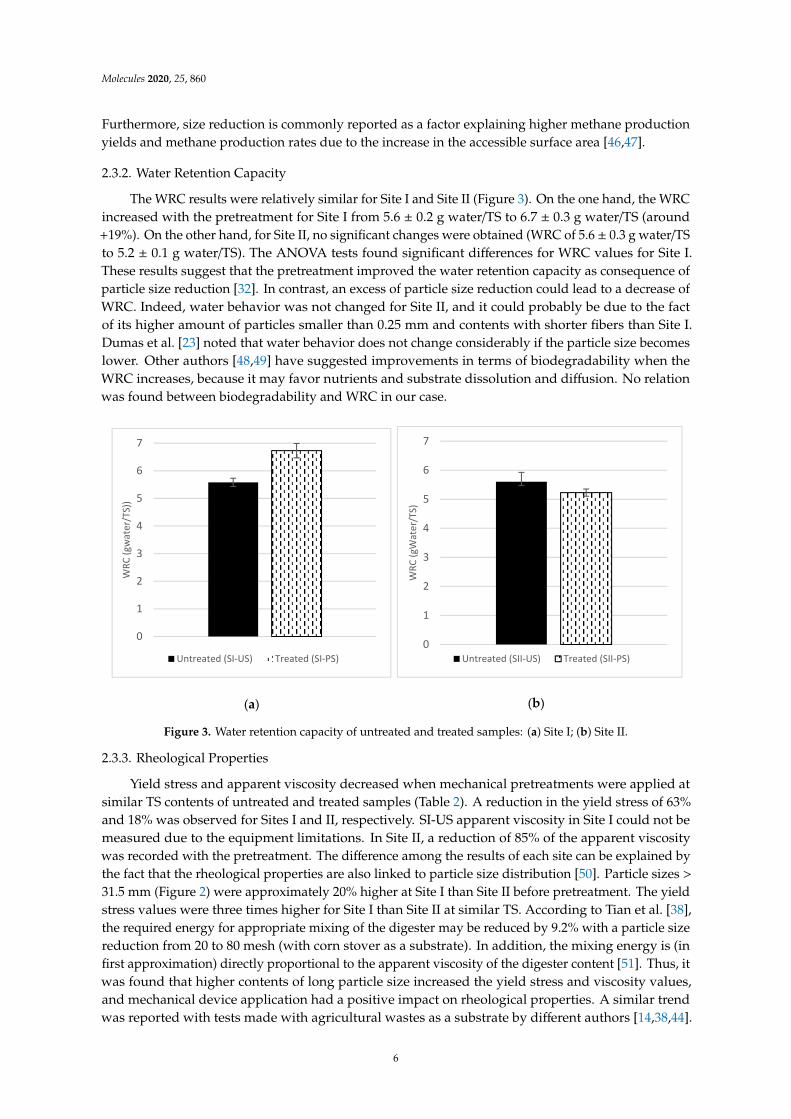
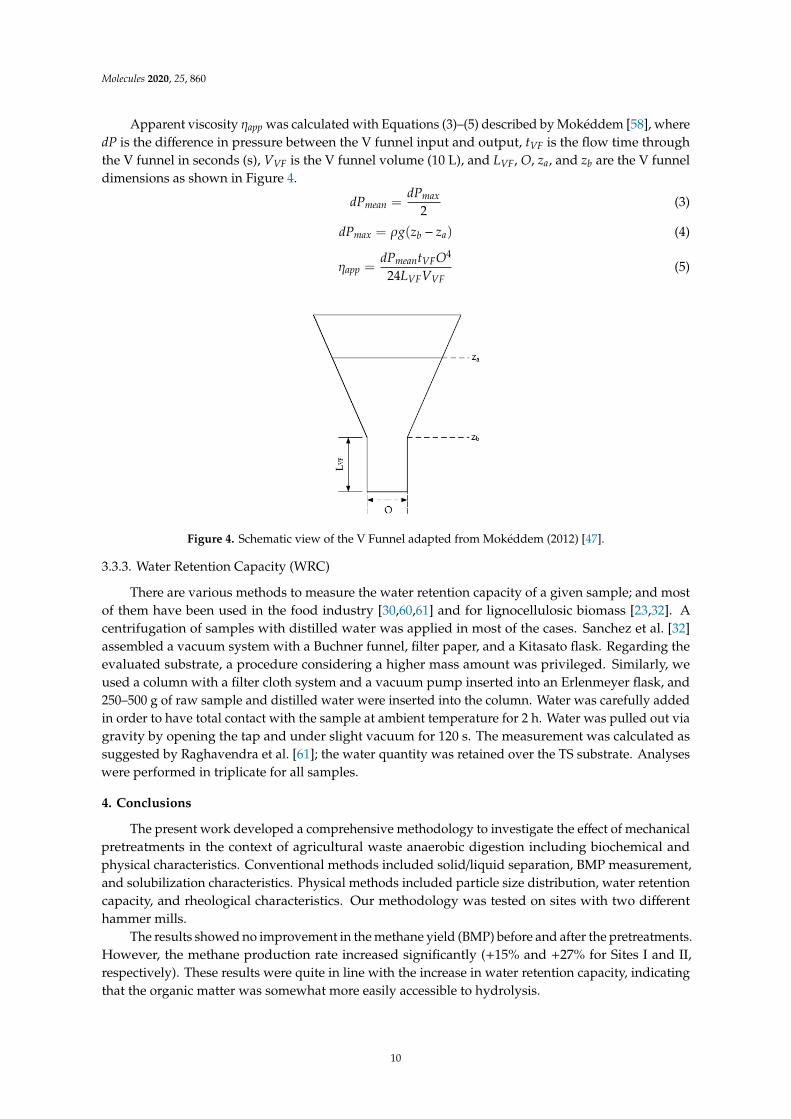
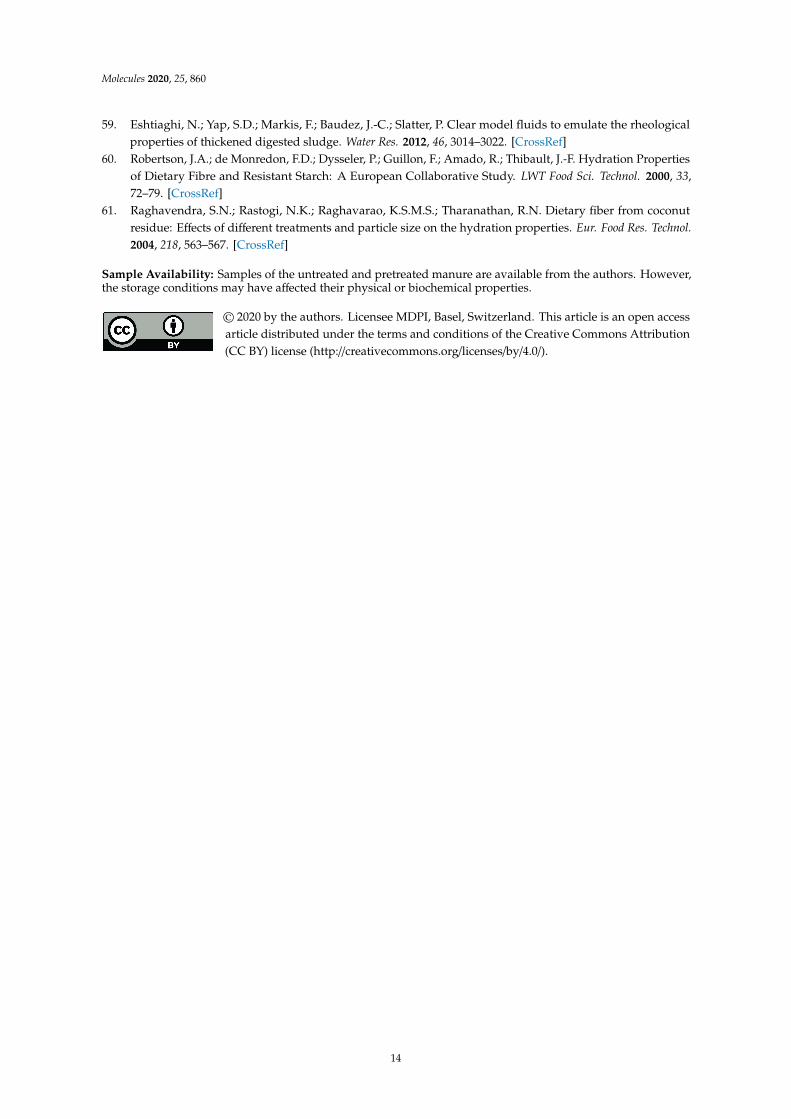
The WRC results were relatively similar for Site I and Site II (Figure 3). On the one hand, the WRC increased with the pretreatment for Site I from 5.6 ± 0.2 g water/TS to 6.7 ± 0.3 g water/TS (around +19%). On the other hand, for Site II, no significant changes were obtained (WRC of 5.6 ± 0.3 g water/TS to 5.2 ± 0.1 g water/TS). The ANOVA tests found significant differences for WRC values for Site I. These results suggest that the pretreatment improved the water retention capacity as consequence of particle size reduction [32]. In contrast, an excess of particle size reduction could leadto a decrease of WRC. Indeed, water behavior was not changed for Site II, and it could probably be due to the fact of its higher amount of particles smaller than 0.25 mm and contents with shorter fibersthan Site I. Dumas et al. [23] noted that water behavior does not change considerably if the particle size becomes lower. Other authors [48,49] have suggested improvements in terms of biodegradability when the WRC increases, because it may favor nutrients and substrate dissolution and diffusion. Norelation was found between biodegradability and WRC in our case.
(a) (b)
Figure 3. Water retention capacity of untreated and treated samples: (a) Site I; (b) Site II.
2.3.3. Rheological Properties
0%
10%
20%
30%
40%
50%
60%
<0.25 0.25-0.5 0.5-1 1-4 4-10 10-20 20-31.5 >31.5
%TS
Particle size distribution (mm)
Untreated (SII-US) Treated (SII-PS)
0
1
2
3
4
5
6
7
WRC
(gw
ater
/TS)
)
Untreated (SI-US) Treated (SI-PS)0
1
2
3
4
5
6
7
WRC
(gW
ater
/TS)
Untreated (SII-US) Treated (SII-PS)
0%
10%
20%
30%
40%
50%
60%
<0.25 0.25-0.5 0.5-1 1-4 4-10 10-20 20-31.5 >31.5
%TS
Particle size distribution (mm)
Untreated (SI-US) Pretreated (SI-PS)
Figure 2. Particle size reduction before and after hammer milling pretreatment: (a) Site I; (b) Site II.
Size reduction behavior after mechanical pretreatment was relatively similar for both sites. Site Isample fibers >31.5 mm were mainly reduced to 20–31.5 mm in size. Indeed, the decrease of longestmeasured fibers was approximately 22%, and the amount of fibers between 20 and 31.5 mm in lengthincreased by approximately 35%. For Site II, the fibers >20 mm were mainly reduced to 10–20 mmin size. Initially, fibers longer than 31.5 mm were reduced by more than 20%. Then, fibers between20 and 31.5 mm were reduced, and the amount of fibers between 10 and 20 mm increased by 10%.The proportion of fibers sized 4–10 mm, 1–4 mm, 0.5–1 mm, 0.25–0.5 mm, and lower than 0.25 mmwere in all the cases reduced to a smaller size. In short, the reduction in particle size was producedmainly on longer fibers and a slight increase on the smallest particles was found with mechanicalpretreatments. Sun and Cheng [44] pointed out a reduction of lignocellulosic substrate particle sizebetween 10 and 30 mm with a chipping pretreatment and 0.2–2 mm with a grinding or milling operation.Indeed, particle size reduction depends on many factors related to the mechanical device and itsoperation in addition to the substrate’s properties such as humidity and initial particle size [3,10,25,45].
5
Molecules 2020, 25, 860
Furthermore, size reduction is commonly reported as a factor explaining higher methane productionyields and methane production rates due to the increase in the accessible surface area [46,47].
2.3.2. Water Retention Capacity
The WRC results were relatively similar for Site I and Site II (Figure 3). On the one hand, the WRCincreased with the pretreatment for Site I from 5.6 ± 0.2 g water/TS to 6.7 ± 0.3 g water/TS (around+19%). On the other hand, for Site II, no significant changes were obtained (WRC of 5.6 ± 0.3 g water/TSto 5.2 ± 0.1 g water/TS). The ANOVA tests found significant differences for WRC values for Site I.These results suggest that the pretreatment improved the water retention capacity as consequence ofparticle size reduction [32]. In contrast, an excess of particle size reduction could lead to a decrease ofWRC. Indeed, water behavior was not changed for Site II, and it could probably be due to the factof its higher amount of particles smaller than 0.25 mm and contents with shorter fibers than Site I.Dumas et al. [23] noted that water behavior does not change considerably if the particle size becomeslower. Other authors [48,49] have suggested improvements in terms of biodegradability when theWRC increases, because it may favor nutrients and substrate dissolution and diffusion. No relationwas found between biodegradability and WRC in our case.
Molecules 2019, 24, x FOR PEER REVIEW 6 of 15
(a) (b)
Figure 2. Particle size reduction before and after hammer milling pretreatment: (a) Site I; (b) Site II.
2.3.2. Water Retention Capacity
The WRC results were relatively similar for Site I and Site II (Figure 3). On the one hand, the WRC increased with the pretreatment for Site I from 5.6 ± 0.2 g water/TS to 6.7 ± 0.3 g water/TS (around +19%). On the other hand, for Site II, no significant changes were obtained (WRC of 5.6 ± 0.3 g water/TS to 5.2 ± 0.1 g water/TS). The ANOVA tests found significant differences for WRC values for Site I. These results suggest that the pretreatment improved the water retention capacity as consequence of particle size reduction [32]. In contrast, an excess of particle size reduction could leadto a decrease of WRC. Indeed, water behavior was not changed for Site II, and it could probably be due to the fact of its higher amount of particles smaller than 0.25 mm and contents with shorter fibers than Site I. Dumas et al. [23] noted that water behavior does not change considerably if the particle size becomes lower. Other authors [48,49] have suggested improvements in terms of biodegradability when the WRC increases, because it may favor nutrients and substrate dissolution and diffusion. Norelation was found between biodegradability and WRC in our case.
(a) (b)
Figure 3. Water retention capacity of untreated and treated samples: (a) Site I; (b) Site II.
2.3.3. Rheological Properties
0%
10%
20%
30%
40%
50%
60%
<0.25 0.25-0.5 0.5-1 1-4 4-10 10-20 20-31.5 >31.5
%TS
Particle size distribution (mm)
Untreated (SII-US) Treated (SII-PS)
0
1
2
3
4
5
6
7
WRC
(gw
ater
/TS)
)
Untreated (SI-US) Treated (SI-PS)0
1
2
3
4
5
6
7
WRC
(gW
ater
/TS)
Untreated (SII-US) Treated (SII-PS)
0%
10%
20%
30%
40%
50%
60%
<0.25 0.25-0.5 0.5-1 1-4 4-10 10-20 20-31.5 >31.5
%TS
Particle size distribution (mm)
Untreated (SI-US) Pretreated (SI-PS)
Figure 3. Water retention capacity of untreated and treated samples: (a) Site I; (b) Site II.
2.3.3. Rheological Properties
Yield stress and apparent viscosity decreased when mechanical pretreatments were applied atsimilar TS contents of untreated and treated samples (Table 2). A reduction in the yield stress of 63%and 18% was observed for Sites I and II, respectively. SI-US apparent viscosity in Site I could not bemeasured due to the equipment limitations. In Site II, a reduction of 85% of the apparent viscositywas recorded with the pretreatment. The difference among the results of each site can be explained bythe fact that the rheological properties are also linked to particle size distribution [50]. Particle sizes >
31.5 mm (Figure 2) were approximately 20% higher at Site I than Site II before pretreatment. The yieldstress values were three times higher for Site I than Site II at similar TS. According to Tian et al. [38],the required energy for appropriate mixing of the digester may be reduced by 9.2% with a particle sizereduction from 20 to 80 mesh (with corn stover as a substrate). In addition, the mixing energy is (infirst approximation) directly proportional to the apparent viscosity of the digester content [51]. Thus, itwas found that higher contents of long particle size increased the yield stress and viscosity values,and mechanical device application had a positive impact on rheological properties. A similar trendwas reported with tests made with agricultural wastes as a substrate by different authors [14,38,44].
6
Molecules 2020, 25, 860
In addition, flow and viscosity behavior did not necessarily correspond at similar biomass TS valuesaccording to published data [33,35].
Table 2. Rheological properties for untreated and treated samples.
Site I Site II
Parameter Unit Untreated * Pretreated * Untreated ** Pretreated **
τy Pa 755.3 ± 18.4 281.0± 4.2 250.7 ± 6.6 ** 205.0 ± 16.1ηapp Pa.s ND *** 28.6 ± 3.9 38.7 ± 2.1 5.8 ± 0.2
* TS = 12%; ** TS = 11%; *** ND = non-determined.
As mentioned previously, the reduction in the yield stress and viscosity values could mean animportant reduction of energy consumption in terms of pumping and mixing at full-scale sites [36,52].Moreover, the relationship between high solids concentration and different particle sizes should beinvestigated more in detail for a better comprehension of rheological properties, biodegradability,hydrophilicity, and mechanical pretreatments influence.
3. Materials and Methods
3.1. Biomass Sampling and Handling
Two full-scale plants with mechanical pretreatment operations were selected for this study. Inboth units, cattle manure was the main feedstock.
Site I: The mechanical pretreatment was a mobile hammer mill. Samples were collected beforeand after the hammer mill device and just before the anaerobic digestion tank. Untreated and treatedsamples were stored at 4 C and analyzed within a few days. At this site, a mesophilic digesteris operated. Mechanical pretreatment is used to improve the feeding system and to avoid digesterdifficulties such as clogging.
Site II: A fixed (in-line) hammer mill was evaluated. Samples were collected before and after themechanical pretreatment operation. This site operates with a mesophilic digester and produces heatand electricity from biogas. This mechanical operation is mainly used to reduce the fiber size. At eachsite, 50 kg of untreated and 50 kg of treated manure was sampled. The samples were transported andstored in a 4 C cold chamber and processed less than 48 h after storage for further analysis.
3.2. Biochemical Characterization
The biochemical characterization of the samples followed the procedure suggested by TeixeiraFranco et al. [53]. A fractionation of the sample was made through a leaching test with water. Theleaching test was performed with 10:1 water/dry matter proportion over 2 h under a constant bottlerotation. Subsequently, the sample was centrifuged (20 min at 5000× g). The liquid fraction wasfiltrated (1.2 µm), while the particulate fraction was dried at 70 C and ground to 1 mm length. Themeasurements carried out on the biomass samples are described below.
Analyses on the raw (untreated) sample: parameters as total solids (TS); volatile solids (VS); andbiochemical methane potential (BMP) test assays were carried out. The samples were dried at 105 Cwith a drying oven in order to measure TS; afterwards, samples were burned at 550 C then versuswere calculated.
Analyses on the liquid fraction: liquid fraction was used to measure pH, dissolved chemicalorganic demand (COD); ammonia nitrogen (NH3-N); total Kjeldahl nitrogen (TKN); volatile fatty acids(VFAs); BMP; TS; and VS. The pH was measured with a consort C3020 device with SP10B. Lacticand formic acids were analyzed with a high-performance liquid chromatography (LC Module 1 plus,Waters) equipped with a Supelcogel™ C-610 H column (300 mm × 7.8 mm, Sigma–Aldrich), withboth refractive index (RID) and UV detectors and operating with H3PO4 0.1%v/v as solvent (flow rateof 0.5 mL/min). Acetic, propionic, butyric, valeric, and caproic acids contents were analyzed by gas
7
Molecules 2020, 25, 860
chromatography (Shimadzu Corp.) with an HP-FFAP fused silica capillary column (30 m × 0.25 mm,Agilent Technologies), a flame ionization detector, and H2 as the carrier gas. The sum of lactic, formic,acetic, propionic, butyric, valeric, and caproic acids was considered as the total VFA. The TKN andNH3-N were determined according to the NF EN 25,663 standard procedures.
Analyses on the particulate fraction: Parameters, such as TKN, COD, total solids (TS) and volatilesolids (VS) were determined.
The BMP tests were performed according the guidelines given by Holliger et al. [54]. Batch assayswere prepared in 1 L glass bottles in a 35 C temperate room. The inoculum used was a digested sludgefrom a wastewater treatment plant (La Feyssine, Lyon, France). The total versus content was 20 g/L(sample + inoculum), and the substrate to inoculum ratio was 0.5 on VS basis. A mineral solution wasadded (as recommended by the ISO 117734:1995 standard). The mineral solution contained essentialelements in order to give optimal conditions to the microbial growth and act as a buffer solution. Thenglass bottles were purged with 80/20%v/v N2/CO2 and finally incubated. Control assays withoutsubstrate were performed as well in order assess the background methane production from inoculum.The gas production was followed by manometric measurements (Digitron precision manometer). Thebiogas was vented when the pressure went above 1200 hPa. The biogas composition was analyzedwith an Agilent 300 micro gas chromatography with a thermal conductivity detector (GC-TCD). Argonand helium were used as carrier gases and Molsieve 5 A (14 m length; pore size: 5 Å) and PoraPlot(10 m length; 0.320 mm ID) columns as stationary phases. Each sample was tested in triplicate.
The background methane production (from inoculum) was retrieved, and the methane volumeproduced was normalized and expressed in ml standard conditions for temperature and pressure (0 C,1 atm) per gram of volatile solid. From the methane production, a first-order model was fitted to thedata in order to get further information from the experiments:
VCH4(t) = BMPmax(1− e−kt
)(1)
- the final (or ultimate) maximal biochemical methane potential, BMPmax;- the first-order kinetic parameter k that can be compared prior and after the mechanical pretreatmentas an indicator of methane production rate improvement.
3.3. Physical Characterization
3.3.1. Size Reduction Evaluation
Particle size distribution was measured to evaluate the effects of the mechanical devices on particlesize. Different procedures are proposed in the literature. Herrman et al. [25] used a quantification ofensiled feedstock by image analyses with 10 to 20 g of sample. Samples were weighted, scanned, andevaluated with an image analyzer software. In contrast, Mönch-Tegeder et al. [21] performed a wetsieving for horse manure and ensiled feedstocks at a determined size and then evaluated them with animage analyzer software. Lindner et al. [22] also used a wet sieving with a vibrating sieve shaker inorder to verify the size reduction of digestate composed of cattle manure and silage. Samples weresoaked in distilled water, and then samples were sieved (10 min), weighted, and dried. On the otherhand, Tsapekos et al. [27] used a visual method to analyze ensiled meadow grass particle distribution.Indeed, these procedures depend on the substrate conditions and research aim for evaluating differentparticle sizes. Sieving is often used to measure particle size distribution due to the fact of their amplerange. Nevertheless, some caution must be taken to prevent from clogging, which would result loweramounts of small particles [55].
The procedure carried out in this work was also a wet sieving method with a vibrating sieve shaker(Retsch AS 200 basic) with water recirculation. The sieve openings were 0.25 mm, 0.5 mm, 1.0 mm,4.0 mm, 10.0 mm, 20.0 mm, and 31.5 mm. First, 50–80 g of samples was weighted, disaggregated, andcarefully introduced into the upmost sieve (31.5 mm). The amount of sample was chosen in order toprevent any clogging of the sieves. Then, samples were sieved with 1 L of recirculated demineralized
8
Molecules 2020, 25, 860
water for 15 min. A flow of 938 mL/min until a 40 amplitude vibration was performed. Water wasretrieved, and it was reinjected for 5 min of sieving. All fractions were recovered with aluminum paper(weighted previously) and dried over 24 h at 105 C. The size distributions were calculated in %TS,and their proportion corresponded to the total dried weight. For each sample, this operation was donein triplicate.
3.3.2. Rheological Properties
According to different authors, fermenting agricultural biomasses has been shown to have arheofluidifying behavior characteristic of non-Newtonian fluids [33,35–37,56] where viscosity decreasesnon-linearly under a shear stress. Conventional methods for measuring rheological properties aremostly performed with rotational or tubular rheometers in order to build a rheogram and, consequently,to identify the behavior fluid model [56]. These measurements relate shear stress in Pascal (Pa) andshear rate (s−1) depending on the force applied to the fluid [52]. In addition, other characteristicsmay influence the rheological properties as the temperature, the TS content, the particle size, and thepresence of dispersed gas bubbles [36]. Indeed, rotary and tubular devices are not adapted for longand heterogeneous straw fibers present in cattle manure. Their size and capacity to measure onlysmall and homogeneous quantities of sample are not representative at full-scale. By consequence,these measurements with heterogeneous substrate are difficult to investigate. Thus, information aboutmeasurement methods of rheological properties on heterogeneous samples with important fiber sizesat the industrial scale is still limited [42,44].
A few studies in this field were found in the literature, one of them by Mönch-Tegeder et al. [36],who developed an in-line process viscometer at full-scale in order to determine the rheologicalproperties of untreated and pretreated mixed substrates with grass silage, maize silage, and solidand liquid manure. The viscosity increased with the fibrous material, and the substrate’s mechanicaldisintegration positively influenced the rheological properties; however, an important effect of higherTS was pointed out.
Moreover, Ruys [50] proposed a dedicated rheometer of dimensions larger than commercial onesand adapted to heterogeneous substrates before anaerobic digestion at industrial scale. However,this kind of prototype is not commercially available; moreover, it is complex to operate at industrialscale. In this context, Garcia-Bernet et al. [48] developed a fast method to measure the yield stress foranaerobically digested solid waste with a slump test. It involves a cylindrical shape PVC chamberwith a 10 cm diameter and 18 cm height; this chamber is filled with the sample, then it is quickly liftedvertically to allow the medium to collapse, and the difference between the initial and final heights istermed the “slump”.
We tested two devices commonly used for fresh concrete characterization. These devices areable to measure the yield stress [57] and the apparent viscosity [58] using a slump test and a V funneltest, respectively. Yield stress value represents the minimum stress to cause the fluid flow, and itsmeasurement is essential for understanding flow properties [57]. Apparent viscosity represents afluid’s property to resist forces causing it to flow; thus, a flow’s velocity is controlled by these internalresistances of the fluid [52]. These internal variations become a key factor during the application of aforce on the fluid for its correct handling and management [59].
The slump and V funnel tests were carried out according to the PR NF EN 12350-2 and PR NFEN 12350-9 standards used for fresh concrete, respectively, and the TS content of the samples wasstandardized to 11%–12% approximately. The experiments were performed at 20 °C. The slump testwas carried out with an Abram cone, and the results were evaluated with a cylindrical analyticalmodel as Pashias et al. [57] suggested, where the slump height is related to yield stress. Dimensionlessheight can be expressed by Equation (1), where dimensionless slump height is defined as s′ = s/H,dimensionless yield stress is defined by τ′y = τy/ρgH, and H is the cone’s height, H = 30 cm.
s′ = 1− 2τ′y[1− Ln
(τ′y
)](2)
9
Molecules 2020, 25, 860
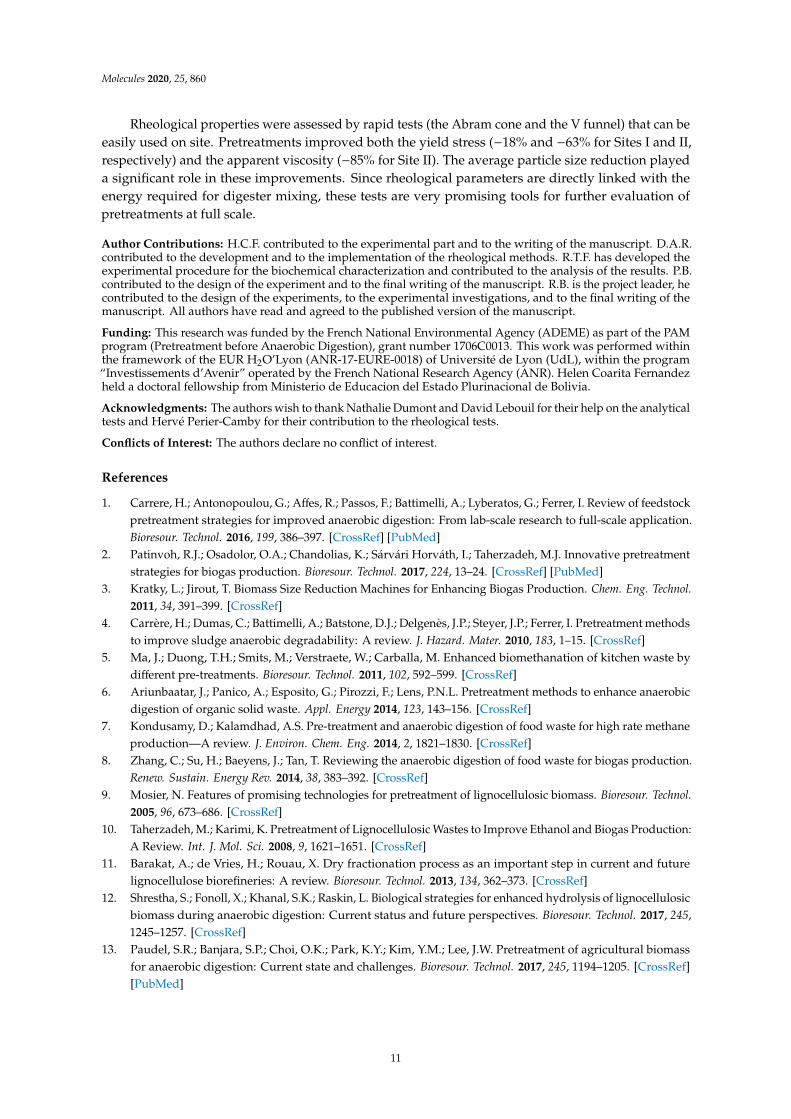
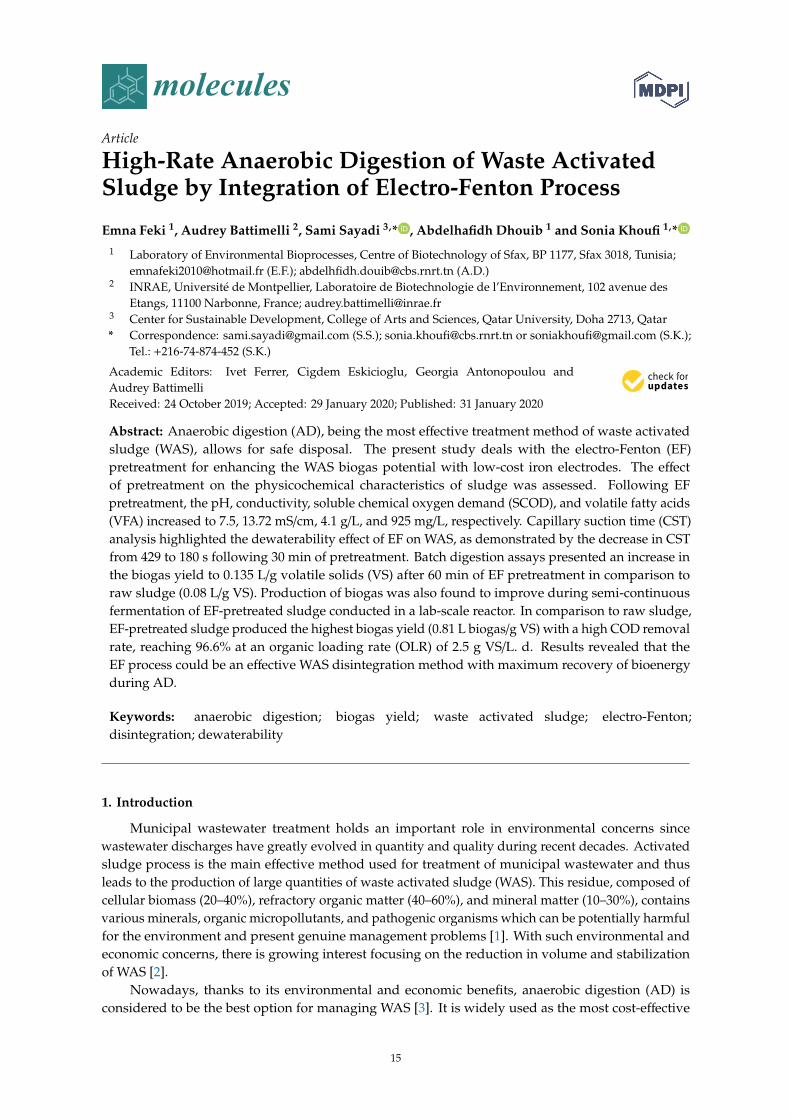
Apparent viscosity ηapp was calculated with Equations (3)–(5) described by Mokéddem [58], wheredP is the difference in pressure between the V funnel input and output, tVF is the flow time throughthe V funnel in seconds (s), VVF is the V funnel volume (10 L), and LVF, O, za, and zb are the V funneldimensions as shown in Figure 4.
dPmean =dPmax
2(3)
dPmax = ρg(zb − za) (4)
ηapp =dPmeantVFO4
24LVFVVF(5)
Molecules 2019, 24, x FOR PEER REVIEW 10 of 15
resistances of the fluid [52]. These internal variations become a key factor during the application of a force on the fluid for its correct handling and management [59].
The slump and V funnel tests were carried out according to the PR NF EN 12350-2 and PR NF EN 12350-9 standards used for fresh concrete, respectively, and the TS content of the samples was standardized to 11%–12% approximately. The experiments were performed at 20 . The slump test was carried out with an Abram cone, and the results were evaluated with a cylindrical analytical model as Pashias et al. [57] suggested, where the slump height is related to yield stress. Dimensionless height can be expressed by Equation (1), where dimensionless slump height is defined as 𝑠 = 𝑠/𝐻, dimensionless yield stress is defined by 𝜏 = 𝜏 /𝜌𝑔𝐻, and H is the cone’s height, H = 30 cm. 𝑠 = 1 − 2𝜏 1 − 𝐿𝑛(𝜏 )
(2)
Apparent viscosity 𝜂𝑎𝑝𝑝 was calculated with Equations (3)–(5) described by Mokéddem [58], where dP is the difference in pressure between the V funnel input and output, tVF is the flow time through the V funnel in seconds (s), VVF is the V funnel volume (10 L), and LVF, O, za, and zb are the V funnel dimensions as shown in Figure 4.
Figure 4. Schematic view of the V Funnel adapted from Mokéddem (2012) [47].
𝑑𝑃 = 𝑑𝑃2 (3) 𝑑𝑃 = 𝜌𝑔(𝑧 − 𝑧 ) (4) 𝜂 = 𝑑𝑃 𝑡 𝑂24𝐿 𝑉 (5)
3.3.3. Water Retention Capacity (WRC)
There are various methods to measure the water retention capacity of a given sample; and most of them have been used in the food industry [30,60,61] and for lignocellulosic biomass [23,32]. A centrifugation of samples with distilled water was applied in most of the cases. Sanchez et al. [32] assembled a vacuum system with a Buchner funnel, filter paper, and a Kitasato flask. Regarding the evaluated substrate, a procedure considering a higher mass amount was privileged. Similarly, we used a column with a filter cloth system and a vacuum pump inserted into an Erlenmeyer flask, and 250–500 g of raw sample and distilled water were inserted into the column. Water was carefully added in order to have total contact with the sample at ambient temperature for 2 h. Water was pulled out via gravity by opening the tap and under slight vacuum for 120 s. The measurement was calculated as suggested by Raghavendra et al. [61]; the water quantity was retained over the TS substrate. Analyses were performed in triplicate for all samples.
Figure 4. Schematic view of the V Funnel adapted from Mokéddem (2012) [47].
3.3.3. Water Retention Capacity (WRC)
There are various methods to measure the water retention capacity of a given sample; and mostof them have been used in the food industry [30,60,61] and for lignocellulosic biomass [23,32]. Acentrifugation of samples with distilled water was applied in most of the cases. Sanchez et al. [32]assembled a vacuum system with a Buchner funnel, filter paper, and a Kitasato flask. Regarding theevaluated substrate, a procedure considering a higher mass amount was privileged. Similarly, weused a column with a filter cloth system and a vacuum pump inserted into an Erlenmeyer flask, and250–500 g of raw sample and distilled water were inserted into the column. Water was carefully addedin order to have total contact with the sample at ambient temperature for 2 h. Water was pulled out viagravity by opening the tap and under slight vacuum for 120 s. The measurement was calculated assuggested by Raghavendra et al. [61]; the water quantity was retained over the TS substrate. Analyseswere performed in triplicate for all samples.
4. Conclusions
The present work developed a comprehensive methodology to investigate the effect of mechanicalpretreatments in the context of agricultural waste anaerobic digestion including biochemical andphysical characteristics. Conventional methods included solid/liquid separation, BMP measurement,and solubilization characteristics. Physical methods included particle size distribution, water retentioncapacity, and rheological characteristics. Our methodology was tested on sites with two differenthammer mills.
The results showed no improvement in the methane yield (BMP) before and after the pretreatments.However, the methane production rate increased significantly (+15% and +27% for Sites I and II,respectively). These results were quite in line with the increase in water retention capacity, indicatingthat the organic matter was somewhat more easily accessible to hydrolysis.
10
Molecules 2020, 25, 860
Rheological properties were assessed by rapid tests (the Abram cone and the V funnel) that can beeasily used on site. Pretreatments improved both the yield stress (−18% and −63% for Sites I and II,respectively) and the apparent viscosity (−85% for Site II). The average particle size reduction playeda significant role in these improvements. Since rheological parameters are directly linked with theenergy required for digester mixing, these tests are very promising tools for further evaluation ofpretreatments at full scale.
Author Contributions: H.C.F. contributed to the experimental part and to the writing of the manuscript. D.A.R.contributed to the development and to the implementation of the rheological methods. R.T.F. has developed theexperimental procedure for the biochemical characterization and contributed to the analysis of the results. P.B.contributed to the design of the experiment and to the final writing of the manuscript. R.B. is the project leader, hecontributed to the design of the experiments, to the experimental investigations, and to the final writing of themanuscript. All authors have read and agreed to the published version of the manuscript.
Funding: This research was funded by the French National Environmental Agency (ADEME) as part of the PAMprogram (Pretreatment before Anaerobic Digestion), grant number 1706C0013. This work was performed withinthe framework of the EUR H2O’Lyon (ANR-17-EURE-0018) of Université de Lyon (UdL), within the program“Investissements d’Avenir” operated by the French National Research Agency (ANR). Helen Coarita Fernandezheld a doctoral fellowship from Ministerio de Educacion del Estado Plurinacional de Bolivia.
Acknowledgments: The authors wish to thank Nathalie Dumont and David Lebouil for their help on the analyticaltests and Hervé Perier-Camby for their contribution to the rheological tests.
Conflicts of Interest: The authors declare no conflict of interest.
References
1. Carrere, H.; Antonopoulou, G.; Affes, R.; Passos, F.; Battimelli, A.; Lyberatos, G.; Ferrer, I. Review of feedstockpretreatment strategies for improved anaerobic digestion: From lab-scale research to full-scale application.Bioresour. Technol. 2016, 199, 386–397. [CrossRef] [PubMed]
2. Patinvoh, R.J.; Osadolor, O.A.; Chandolias, K.; Sárvári Horváth, I.; Taherzadeh, M.J. Innovative pretreatmentstrategies for biogas production. Bioresour. Technol. 2017, 224, 13–24. [CrossRef] [PubMed]
3. Kratky, L.; Jirout, T. Biomass Size Reduction Machines for Enhancing Biogas Production. Chem. Eng. Technol.2011, 34, 391–399. [CrossRef]
4. Carrère, H.; Dumas, C.; Battimelli, A.; Batstone, D.J.; Delgenès, J.P.; Steyer, J.P.; Ferrer, I. Pretreatment methodsto improve sludge anaerobic degradability: A review. J. Hazard. Mater. 2010, 183, 1–15. [CrossRef]
5. Ma, J.; Duong, T.H.; Smits, M.; Verstraete, W.; Carballa, M. Enhanced biomethanation of kitchen waste bydifferent pre-treatments. Bioresour. Technol. 2011, 102, 592–599. [CrossRef]
6. Ariunbaatar, J.; Panico, A.; Esposito, G.; Pirozzi, F.; Lens, P.N.L. Pretreatment methods to enhance anaerobicdigestion of organic solid waste. Appl. Energy 2014, 123, 143–156. [CrossRef]
7. Kondusamy, D.; Kalamdhad, A.S. Pre-treatment and anaerobic digestion of food waste for high rate methaneproduction—A review. J. Environ. Chem. Eng. 2014, 2, 1821–1830. [CrossRef]
8. Zhang, C.; Su, H.; Baeyens, J.; Tan, T. Reviewing the anaerobic digestion of food waste for biogas production.Renew. Sustain. Energy Rev. 2014, 38, 383–392. [CrossRef]
9. Mosier, N. Features of promising technologies for pretreatment of lignocellulosic biomass. Bioresour. Technol.2005, 96, 673–686. [CrossRef]
10. Taherzadeh, M.; Karimi, K. Pretreatment of Lignocellulosic Wastes to Improve Ethanol and Biogas Production:A Review. Int. J. Mol. Sci. 2008, 9, 1621–1651. [CrossRef]
11. Barakat, A.; de Vries, H.; Rouau, X. Dry fractionation process as an important step in current and futurelignocellulose biorefineries: A review. Bioresour. Technol. 2013, 134, 362–373. [CrossRef]
12. Shrestha, S.; Fonoll, X.; Khanal, S.K.; Raskin, L. Biological strategies for enhanced hydrolysis of lignocellulosicbiomass during anaerobic digestion: Current status and future perspectives. Bioresour. Technol. 2017, 245,1245–1257. [CrossRef]
13. Paudel, S.R.; Banjara, S.P.; Choi, O.K.; Park, K.Y.; Kim, Y.M.; Lee, J.W. Pretreatment of agricultural biomassfor anaerobic digestion: Current state and challenges. Bioresour. Technol. 2017, 245, 1194–1205. [CrossRef][PubMed]
11
Molecules 2020, 25, 860
14. Mönch-Tegeder, M.; Lemmer, A.; Oechsner, H. Enhancement of methane production with horse manuresupplement and pretreatment in a full-scale biogas process. Energy 2014, 73, 523–530. [CrossRef]
15. Tsapekos, P.; Kougias, P.G.; Frison, A.; Raga, R.; Angelidaki, I. Improving methane production from digestedmanure biofibers by mechanical and thermal alkaline pretreatment. Bioresour. Technol. 2016, 216, 545–552.[CrossRef] [PubMed]
16. Lindmark, J.; Leksell, N.; Schnürer, A.; Thorin, E. Effects of mechanical pre-treatment on the biogas yieldfrom ley crop silage. Appl. Energy 2012, 97, 498–502. [CrossRef]
17. Neshat, S.A.; Mohammadi, M.; Najafpour, G.D.; Lahijani, P. Anaerobic co-digestion of animal manures andlignocellulosic residues as a potent approach for sustainable biogas production. Renew. Sustain. Energy Rev.2017, 79, 308–322. [CrossRef]
18. Zheng, Y.; Zhao, J.; Xu, F.; Li, Y. Pretreatment of lignocellulosic biomass for enhanced biogas production.Prog. Energy Combust. Sci. 2014, 42, 35–53. [CrossRef]
19. Hendriks, A.T.W.M.; Zeeman, G. Pretreatments to enhance the digestibility of lignocellulosic biomass.Bioresour. Technol. 2009, 100, 10–18. [CrossRef]
20. Schell, D.J.; Harwood, C. Milling of lignocellulosic biomass: Results of pilot-scale testing. Appl. Biochem.Biotechnol. 1994, 45–46, 159–168. [CrossRef]
21. Mönch-Tegeder, M.; Lemmer, A.; Jungbluth, T.; Oechsner, H. Effects of full-scale substrate pretreatment witha cross-flow grinder on biogas production. Agric. Eng. Int. CIGR J. 2014, 16, 138–147.
22. Lindner, J.; Zielonka, S.; Oechsner, H.; Lemmer, A. Effects of mechanical treatment of digestate after anaerobicdigestion on the degree of degradation. Bioresour. Technol. 2015, 178, 194–200. [CrossRef] [PubMed]
23. Dumas, C.; Silva Ghizzi Damasceno, G.; Barakat, A.; Carrère, H.; Steyer, J.-P.; Rouau, X. Effects of grindingprocesses on anaerobic digestion of wheat straw. Ind. Crops Prod. 2015, 74, 450–456. [CrossRef]
24. Kalamaras, S.D.; Kotsopoulos, T.A. Anaerobic co-digestion of cattle manure and alternative crops for thesubstitution of maize in South Europe. Bioresour. Technol. 2014, 172, 68–75. [CrossRef] [PubMed]
25. Herrmann, C.; Heiermann, M.; Idler, C.; Prochnow, A. Particle Size Reduction during Harvesting of CropFeedstock for Biogas Production I: Effects on Ensiling Process and Methane Yields. BioEnergy Res. 2012, 5,926–936. [CrossRef]
26. De la Rubia, M.A.; Fernández-Cegrí, V.; Raposo, F.; Borja, R. Influence of particle size and chemicalcomposition on the performance and kinetics of anaerobic digestion process of sunflower oil cake in batchmode. Biochem. Eng. J. 2011, 58–59, 162–167. [CrossRef]
27. Tsapekos, P.; Kougias, P.G.; Angelidaki, I. Biogas production from ensiled meadow grass; effect of mechanicalpretreatments and rapid determination of substrate biodegradability via physicochemical methods. Bioresour.Technol. 2015, 182, 329–335. [CrossRef]
28. Karimi, K.; Taherzadeh, M.J. A critical review on analysis in pretreatment of lignocelluloses: Degree ofpolymerization, adsorption/desorption, and accessibility. Bioresour. Technol. 2016, 203, 348–356. [CrossRef]
29. Cai, J.; He, Y.; Yu, X.; Banks, S.W.; Yang, Y.; Zhang, X.; Yu, Y.; Liu, R.; Bridgwater, A.V. Review ofphysicochemical properties and analytical characterization of lignocellulosic biomass. Renew. Sustain. EnergyRev. 2017, 76, 309–322. [CrossRef]
30. Raghavendra, S.N.; Ramachandra Swamy, S.R.; Rastogi, N.K.; Raghavarao, K.S.M.S.; Kumar, S.;Tharanathan, R.N. Grinding characteristics and hydration properties of coconut residue: A source ofdietary fiber. J. Food Eng. 2006, 72, 281–286. [CrossRef]
31. Williams, D.L.; Hodge, D.B. Impacts of delignification and hot water pretreatment on the water induced cellwall swelling behavior of grasses and its relation to cellulolytic enzyme hydrolysis and binding. Cellulose2014, 21, 221–235. [CrossRef]
32. Sanchez, A.; Hernández-Sánchez, P.; Puente, R. Hydration of lignocellulosic biomass. Modelling andexperimental validation. Ind. Crops Prod. 2019, 131, 70–77. [CrossRef]
33. Daniel, J. O’Neil: Rheology and Mass/Heat Transfer Aspects of Anaerobic Reactor Design. Biomass 1985, 8,205–216. [CrossRef]
34. Miryahyaei, S.; Olinga, K.; Abdul Muthalib, F.A.; Das, T.; Ab Aziz, M.S.; Othman, M.; Baudez, J.C.;Batstone, D.; Eshtiaghi, N. Impact of rheological properties of substrate on anaerobic digestion and digestatedewaterability: New insights through rheological and physico-chemical interaction. Water Res. 2019, 150,56–67. [CrossRef] [PubMed]
35. Björn, A.; Karlsson, A.; Ejlertsson, J.; Svensson, B.H. Rheological Characterization. Biogas 2012, 1, 63–76.
12
Molecules 2020, 25, 860
36. Mönch-Tegeder, M.; Lemmer, A.; Hinrichs, J.; Oechsner, H. Development of an in-line process viscometer forthe full-scale biogas process. Bioresour. Technol. 2015, 178, 278–284. [CrossRef]
37. Hreiz, R.; Adouani, N.; Fünfschilling, D.; Marchal, P.; Pons, M.-N. Rheological characterization of raw andanaerobically digested cow slurry. Chem. Eng. Res. Des. 2017, 119, 47–57. [CrossRef]
38. Tian, L.; Shen, F.; Yuan, H.; Zou, D.; Liu, Y.; Zhu, B.; Li, X. Reducing agitation energy-consumption byimproving rheological properties of corn stover substrate in anaerobic digestion. Bioresour. Technol. 2014,168, 86–91. [CrossRef]
39. Chen, Y.; Cheng, J.J.; Creamer, K.S. Inhibition of anaerobic digestion process: A review. Bioresour. Technol.2008, 99, 4044–4064. [CrossRef]
40. Dahunsi, S.O. Mechanical pretreatment of lignocelluloses for enhanced biogas production: Methane yieldprediction from biomass structural components. Bioresour. Technol. 2019, 280, 18–26. [CrossRef]
41. Moset, V.; Fontaine, D.; Møller, H.B. Co-digestion of cattle manure and grass harvested with differenttechnologies. Effect on methane yield, digestate composition and energy balance. Energy 2017, 141, 451–460.[CrossRef]
42. Zhang, Y.; Banks, C.J. Impact of different particle size distributions on anaerobic digestion of the organicfraction of municipal solid waste. Waste Manag. 2013, 33, 297–307. [CrossRef] [PubMed]
43. Palmowski, L.M.; Müller, J.A. Anaerobic degradation of organic materials—Significance of the substratesurface area. Water Sci. Technol. 2003, 47, 231–238. [CrossRef] [PubMed]
44. Sun, Y.; Cheng, J. Hydrolysis of lignocellulosic materials for ethanol production: A review. Bioresour. Technol.2002, 83, 1–11. [CrossRef]
45. Shinners, K.J. Engineering Principles of Silage Harvesting Equipment; American Society of Agronomy Inc.:Madison, WI, USA; Crop Science Society of America: Fitchburg, WI, USA, 2003; pp. 361–403.
46. Palmowski, L.M.; Müller, J.A. Influence of the size reduction of organic waste on their anaerobic digestion.Water Sci. Technol. 2000, 41, 155–162. [CrossRef]
47. Kim, I.S.; Kim, D.H.; Hyun, S.-H. Effect of particle size and sodium ion concentration on anaerobicthermophilic food waste digestion. Water Sci. Technol. 2000, 41, 67–73. [CrossRef]
48. Garcia-Bernet, D.; Loisel, D.; Guizard, G.; Buffière, P.; Steyer, J.P.; Escudié, R. Rapid measurement of the yieldstress of anaerobically-digested solid waste using slump tests. Waste Manag. 2011, 31, 631–635. [CrossRef]
49. Pommier, S.; Chenu, D.; Quintard, M.; Lefebvre, X. Modelling of moisture-dependent aerobic degradation ofsolid waste. Waste Manag. 2008, 28, 1188–1200. [CrossRef]
50. Ruys, V. Rhéologie des Résidus Agricoles Pour un Procédé Multi-Étapes de Méthanisation en Voie Sèche.Ph.D. Thesis, Grenoble Alpes University, Grenoble, France, 2017.
51. Wu, B. CFD simulation of mixing for high-solids anaerobic digestion. Biotechnol. Bioeng. 2012, 109, 2116–2126.[CrossRef]
52. Brambilla, M.; Romano, E.; Cutini, M.; Bisaglia, C.; Pari, L. Rheological Properties of Manure/BiomassMixtures and Pumping Strategies to Improve Ingestate Formulation: A Review. Trans. ASABE 2013, 56,1905–1920. [CrossRef]
53. Teixeira Franco, R.; Coarita, H.; Bayard, R.; Buffière, P. An improved procedure to assess the organicbiodegradability and the biomethane potential of organic wastes for anaerobic digestion. Waste Manag. Res.2019, 37, 746–754. [CrossRef] [PubMed]
54. Holliger, C.; Alves, M.; Andrade, D.; Angelidaki, I.; Astals, S.; Baier, U.; Bougrier, C.; Buffière, P.; Carballa, M.;de Wilde, V.; et al. Towards a standardization of biomethane potential tests. Water Sci. Technol. 2016, 74,2515–2522. [CrossRef] [PubMed]
55. Palmowski, L.; Müller, J.; Schwedes, J. Comminution of Organic Materials to Improve Their Bioavailability.Eng. Life Sci. 2001, 1, 121–125. [CrossRef]
56. Ratkovich, N.; Horn, W.; Helmus, F.P.; Rosenberger, S.; Naessens, W.; Nopens, I.; Bentzen, T.R. Activatedsludge rheology: A critical review on data collection and modelling. Water Res. 2013, 47, 463–482. [CrossRef][PubMed]
57. Pashias, N.; Boger, D.V.; Summers, J.; Glenister, D.J. A fifty cent rheometer for yield stress measurement. J.Rheol. 1996, 40, 1179–1189. [CrossRef]
58. Mokéddem, S. Contrôle de la rhéologie d’un béton et de son évolution lors du malaxage par des mesures enligne à l’aide de la sonde Viscoprobe. Ph.D. Thesis, Centrale Nantes University, Nantes, France, 2012.
13
Molecules 2020, 25, 860
59. Eshtiaghi, N.; Yap, S.D.; Markis, F.; Baudez, J.-C.; Slatter, P. Clear model fluids to emulate the rheologicalproperties of thickened digested sludge. Water Res. 2012, 46, 3014–3022. [CrossRef]
60. Robertson, J.A.; de Monredon, F.D.; Dysseler, P.; Guillon, F.; Amado, R.; Thibault, J.-F. Hydration Propertiesof Dietary Fibre and Resistant Starch: A European Collaborative Study. LWT Food Sci. Technol. 2000, 33,72–79. [CrossRef]
61. Raghavendra, S.N.; Rastogi, N.K.; Raghavarao, K.S.M.S.; Tharanathan, R.N. Dietary fiber from coconutresidue: Effects of different treatments and particle size on the hydration properties. Eur. Food Res. Technol.2004, 218, 563–567. [CrossRef]
Sample Availability: Samples of the untreated and pretreated manure are available from the authors. However,the storage conditions may have affected their physical or biochemical properties.
© 2020 by the authors. Licensee MDPI, Basel, Switzerland. This article is an open accessarticle distributed under the terms and conditions of the Creative Commons Attribution(CC BY) license (http://creativecommons.org/licenses/by/4.0/).
14
molecules
Article
High-Rate Anaerobic Digestion of Waste ActivatedSludge by Integration of Electro-Fenton Process
Emna Feki 1, Audrey Battimelli 2, Sami Sayadi 3,* , Abdelhafidh Dhouib 1 and Sonia Khoufi 1,*1 Laboratory of Environmental Bioprocesses, Centre of Biotechnology of Sfax, BP 1177, Sfax 3018, Tunisia;
[email protected] (E.F.); [email protected] (A.D.)2 INRAE, Université de Montpellier, Laboratoire de Biotechnologie de l’Environnement, 102 avenue des
Etangs, 11100 Narbonne, France; [email protected] Center for Sustainable Development, College of Arts and Sciences, Qatar University, Doha 2713, Qatar* Correspondence: [email protected] (S.S.); [email protected] or [email protected] (S.K.);
Tel.: +216-74-874-452 (S.K.)
Academic Editors: Ivet Ferrer, Cigdem Eskicioglu, Georgia Antonopoulou andAudrey BattimelliReceived: 24 October 2019; Accepted: 29 January 2020; Published: 31 January 2020
Abstract: Anaerobic digestion (AD), being the most effective treatment method of waste activatedsludge (WAS), allows for safe disposal. The present study deals with the electro-Fenton (EF)pretreatment for enhancing the WAS biogas potential with low-cost iron electrodes. The effectof pretreatment on the physicochemical characteristics of sludge was assessed. Following EFpretreatment, the pH, conductivity, soluble chemical oxygen demand (SCOD), and volatile fatty acids(VFA) increased to 7.5, 13.72 mS/cm, 4.1 g/L, and 925 mg/L, respectively. Capillary suction time (CST)analysis highlighted the dewaterability effect of EF on WAS, as demonstrated by the decrease in CSTfrom 429 to 180 s following 30 min of pretreatment. Batch digestion assays presented an increase inthe biogas yield to 0.135 L/g volatile solids (VS) after 60 min of EF pretreatment in comparison toraw sludge (0.08 L/g VS). Production of biogas was also found to improve during semi-continuousfermentation of EF-pretreated sludge conducted in a lab-scale reactor. In comparison to raw sludge,EF-pretreated sludge produced the highest biogas yield (0.81 L biogas/g VS) with a high COD removalrate, reaching 96.6% at an organic loading rate (OLR) of 2.5 g VS/L. d. Results revealed that theEF process could be an effective WAS disintegration method with maximum recovery of bioenergyduring AD.
Keywords: anaerobic digestion; biogas yield; waste activated sludge; electro-Fenton;disintegration; dewaterability
1. Introduction
Municipal wastewater treatment holds an important role in environmental concerns sincewastewater discharges have greatly evolved in quantity and quality during recent decades. Activatedsludge process is the main effective method used for treatment of municipal wastewater and thusleads to the production of large quantities of waste activated sludge (WAS). This residue, composed ofcellular biomass (20–40%), refractory organic matter (40–60%), and mineral matter (10–30%), containsvarious minerals, organic micropollutants, and pathogenic organisms which can be potentially harmfulfor the environment and present genuine management problems [1]. With such environmental andeconomic concerns, there is growing interest focusing on the reduction in volume and stabilizationof WAS [2].
Nowadays, thanks to its environmental and economic benefits, anaerobic digestion (AD) isconsidered to be the best option for managing WAS [3]. It is widely used as the most cost-effective
15
Molecules 2020, 25, 626
way for stabilization, pathogen removal, and energy recovery. In addition, AD favors the reduction ofsludge volume while producing clean energy in the form of biogas [4]. This biogas can be upgradedfor direct utilization as transport fuel or injection into the gas grid. It can also be utilized in combinedheat and power systems for providing electricity and heat to the wastewater treatment plant (WWTP)or for export in cases of overproduction. Any improvement in the AD efficiency should therefore leadto a further reduction in sludge volume for transport and disposal. It is likely that the biogas yield willincrease, hence producing a greater amount of renewable energy and resulting in higher environmentalperformance and savings for the plant [5]. AD comprises a series of reactions including hydrolysis,acidogenesis, acetogenesis, and methanogenesis. Hydrolysis is the rate-limiting step for the AD ofactivated sludge because most organic matter present in WAS is enclosed in cell walls and membranesthat protect the intracellular components [6]. The cells are shielded against osmotic lysis thanks to thesemi rigid structure of the cell envelope [7]. Sludge retention time (SRT) or hydraulic retention time(HRT) are believed to be key parameters in sludge AD [8]. Various studies focus on the effect of HRTon reactor performance such as biogas production and volatile solid destruction [9]. It has often beendemonstrated that a high HRT is necessary (20–30 days) to obtain a 30–50% degradation efficiencyof organic solids [10]. Cell lysis has been referred as a possible method for releasing intracellularorganics and increasing the rate and efficiency of the digestion process [6]. Indeed, this is possiblewhen extracellular polymeric substances (EPS) become more bioavailable [11].
Recently, different pretreatments have been examined for improving the physicochemicalcharacteristics of organic waste and consequently the performance of anaerobic digestion [12]. Duringseveral studies performed in half-scale and lab-scale plants, these methods, including chemical andthermal methods [12–14], as well as mechanical [15] and biological hydrolysis with enzymes [16,17],were investigated for sludge disintegration purposes. By increasing the digestion rate, biogas yieldswere maximized in smaller digesters while the HRTs decreased [11]. Currently, advanced oxidationprocesses (AOPs) are considered as valuable sludge pretreatments that might reduce hydraulic retentiontimes and increase methane production rates [18,19]. These innovative technologies are widely usedfor the treatment of polluted waters. They apply the concept of producing hydroxyl radicals (HO·)which are capable of decomposing a number of organic substances via oxidation. AOPs includea series of powerful technologies: photo-catalysis, Fenton reaction, photo-Fenton, etc. Recently,researchers have focused on the disintegration of WAS by electro-Fenton (EF), although few studieshave evaluated the performance of EF pretreatment on WAS anaerobic biodegradability as well as itsbiogas potential [19,20]. The electro-Fenton process is an advanced electrochemical oxidation processthat comprises several steps. It involves electrochemical reactions that generate the reagents usedfor the Fenton reaction in situ. The generated reagents depend on the solution and on the nature ofthe electrodes. Generally, with an inert electrode, oxidation occurs via the hydroxyl radicals formedduring the electrolysis of water [19].
Here, the EF process was investigated as a pretreatment step for improving the AD of activatedsludge and its biogas potential. Low-cost iron electrodes were employed during EF pretreatment forin situ generation of Fe2+. The effect of this pretreatment on the solubilization and dewaterabilityof flocs was investigated. Biochemical methane potential tests were conducted to optimize thepretreatment time in terms of maximum biogas yields. The performance of an anaerobic reactor fedwith EF-pretreated sludge and operated under semi-continuous conditions was also assessed.
2. Results
2.1. Disintegration of Activated Sludge by Electro-Fenton Process
2.1.1. Physicochemical Analysis
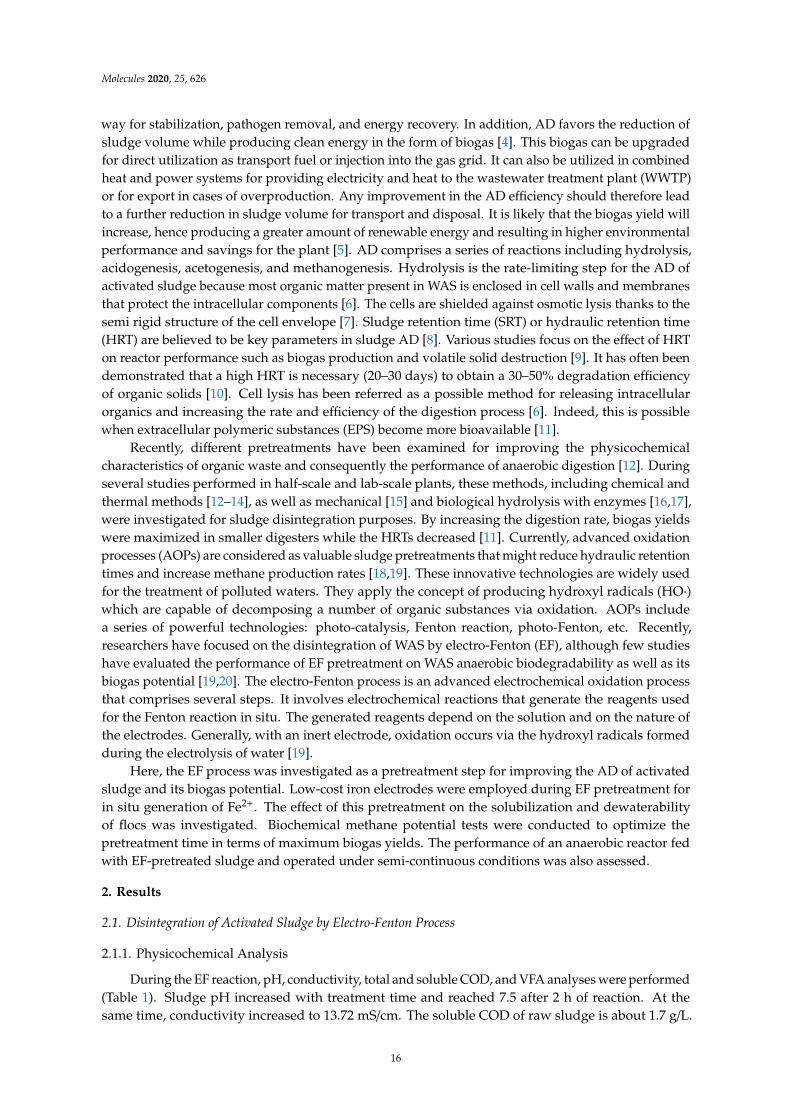
During the EF reaction, pH, conductivity, total and soluble COD, and VFA analyses were performed(Table 1). Sludge pH increased with treatment time and reached 7.5 after 2 h of reaction. At thesame time, conductivity increased to 13.72 mS/cm. The soluble COD of raw sludge is about 1.7 g/L.
16
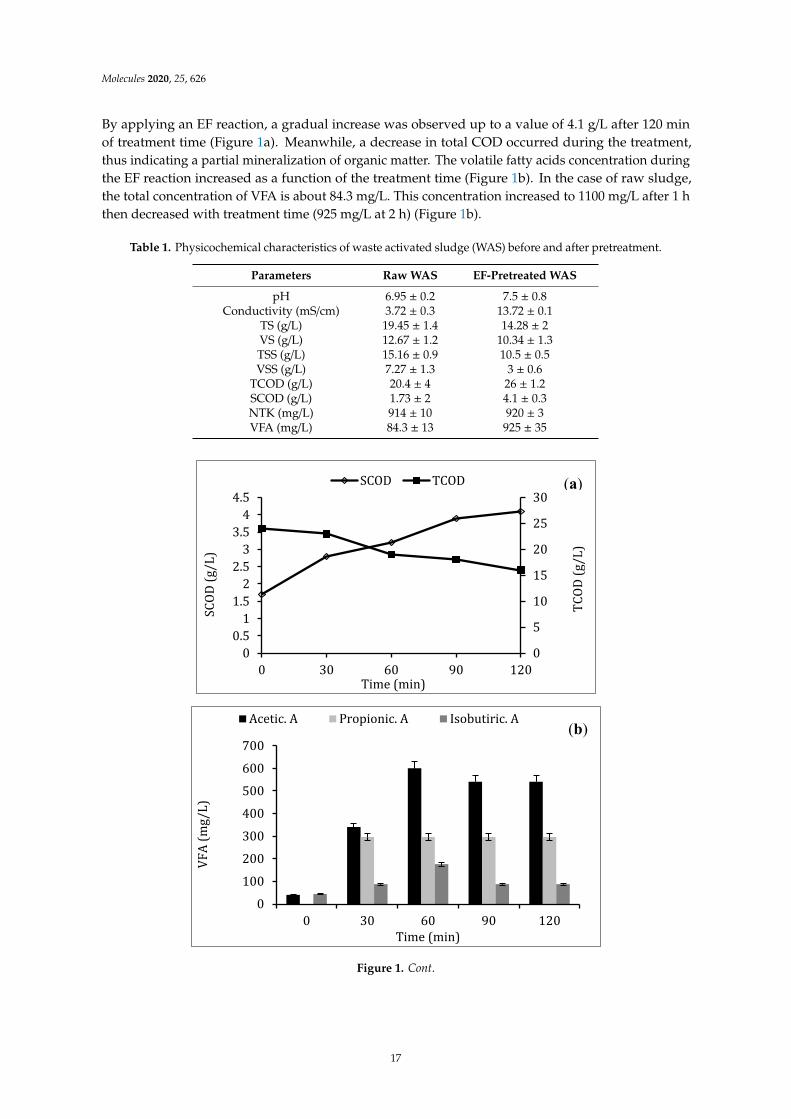
Molecules 2020, 25, 626
By applying an EF reaction, a gradual increase was observed up to a value of 4.1 g/L after 120 minof treatment time (Figure 1a). Meanwhile, a decrease in total COD occurred during the treatment,thus indicating a partial mineralization of organic matter. The volatile fatty acids concentration duringthe EF reaction increased as a function of the treatment time (Figure 1b). In the case of raw sludge,the total concentration of VFA is about 84.3 mg/L. This concentration increased to 1100 mg/L after 1 hthen decreased with treatment time (925 mg/L at 2 h) (Figure 1b).
Table 1. Physicochemical characteristics of waste activated sludge (WAS) before and after pretreatment.
Parameters Raw WAS EF-Pretreated WAS
pH 6.95 ± 0.2 7.5 ± 0.8Conductivity (mS/cm) 3.72 ± 0.3 13.72 ± 0.1
TS (g/L) 19.45 ± 1.4 14.28 ± 2VS (g/L) 12.67 ± 1.2 10.34 ± 1.3TSS (g/L) 15.16 ± 0.9 10.5 ± 0.5VSS (g/L) 7.27 ± 1.3 3 ± 0.6
TCOD (g/L) 20.4 ± 4 26 ± 1.2SCOD (g/L) 1.73 ± 2 4.1 ± 0.3NTK (mg/L) 914 ± 10 920 ± 3VFA (mg/L) 84.3 ± 13 925 ± 35
Molecules 2019, 24, x 3 of 14
At the same time, conductivity increased to 13.72 mS/cm. The soluble COD of raw sludge is about 1.7 g/L. By applying an EF reaction, a gradual increase was observed up to a value of 4.1 g/L after 120 min of treatment time (Figure 1a). Meanwhile, a decrease in total COD occurred during the treatment, thus indicating a partial mineralization of organic matter. The volatile fatty acids concentration during the EF reaction increased as a function of the treatment time (Figure 1b). In the case of raw sludge, the total concentration of VFA is about 84.3 mg/L. This concentration increased to 1100 mg/L after 1 h then decreased with treatment time (925 mg/L at 2 h) (Figure 1b).
Table 1. Physicochemical characteristics of waste activated sludge (WAS) before and after pretreatment.
Parameters Raw WAS EF-Pretreated WAS pH 6.95 ± 0.2 7.5 ± 0.8
Conductivity (mS/cm) 3.72 ± 0.3 13.72 ± 0.1 TS (g/L) 19.45 ± 1.4 14.28 ± 2 VS (g/L) 12.67 ± 1.2 10.34 ± 1.3 TSS (g/L) 15.16 ± 0.9 10.5 ± 0.5 VSS (g/L) 7.27 ± 1.3 3 ± 0.6
TCOD (g/L) 20.4 ± 4 26 ± 1.2 SCOD (g/L) 1.73 ± 2 4.1 ± 0.3 NTK (mg/L) 914 ± 10 920 ± 3 VFA (mg/L) 84.3 ± 13 925 ± 35
051015202530
00.511.522.533.544.5
0 30 60 90 120
TCOD (g/L)
SCOD (g/L)
Time (min)
SCOD TCOD
0100200300400500600700
0 30 60 90 120
VFA (mg/L)
Time (min)
Acetic. A Propionic. A Isobutiric. A(b)
(a)
Figure 1. Cont.
17
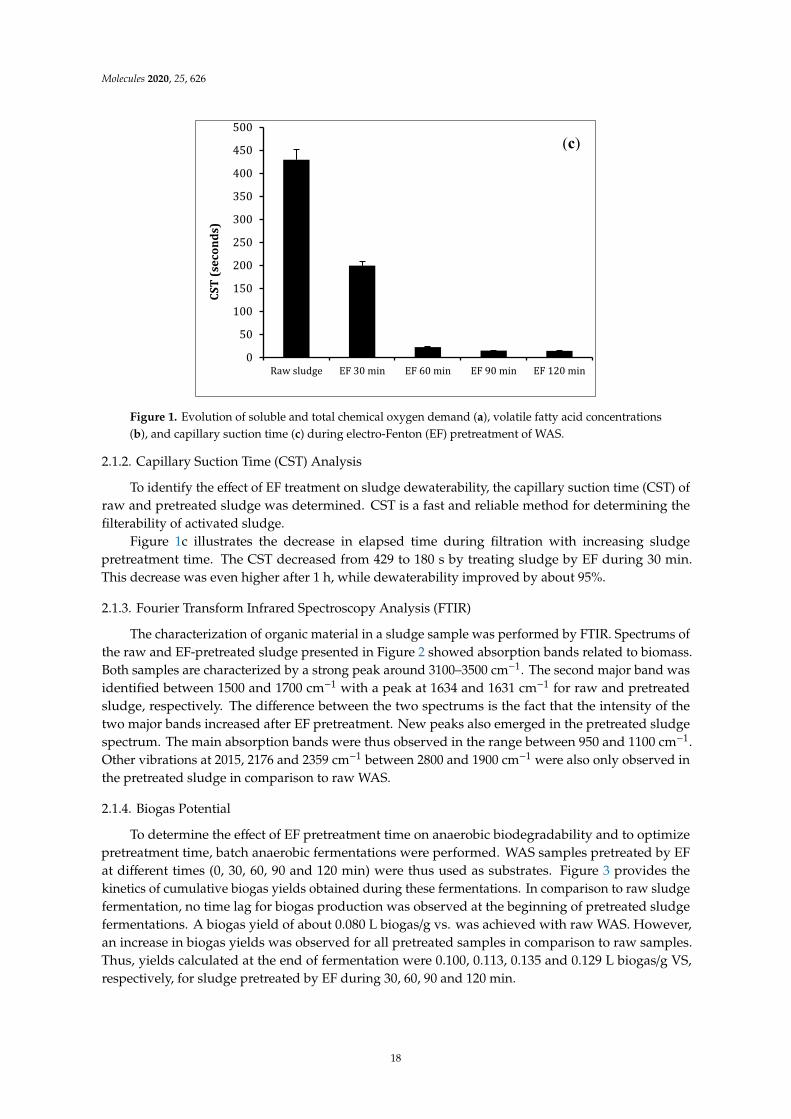
Molecules 2020, 25, 626
Molecules 2019, 24, x 4 of 14
Figure 1. Evolution of soluble and total chemical oxygen demand (a), volatile fatty acid concentrations (b), and capillary suction time (c) during electro-Fenton (EF) pretreatment of WAS.
2.1.2. Capillary Suction Time (CST) Analysis
To identify the effect of EF treatment on sludge dewaterability, the capillary suction time (CST) of raw and pretreated sludge was determined. CST is a fast and reliable method for determining the filterability of activated sludge.
Figure 1c illustrates the decrease in elapsed time during filtration with increasing sludge pretreatment time. The CST decreased from 429 to 180 s by treating sludge by EF during 30 min. This decrease was even higher after 1 h, while dewaterability improved by about 95%.
2.1.3. Fourier Transform Infrared Spectroscopy Analysis (FTIR)
The characterization of organic material in a sludge sample was performed by FTIR. Spectrums of the raw and EF-pretreated sludge presented in Figure 2 showed absorption bands related to biomass. Both samples are characterized by a strong peak around 3100–3500 cm−1. The second major band was identified between 1500 and 1700 cm−1 with a peak at 1634 and 1631 cm−1 for raw and pretreated sludge, respectively. The difference between the two spectrums is the fact that the intensity of the two major bands increased after EF pretreatment. New peaks also emerged in the pretreated sludge spectrum. The main absorption bands were thus observed in the range between 950 and 1100 cm−1. Other vibrations at 2015, 2176 and 2359 cm−1 between 2800 and 1900 cm−1 were also only observed in the pretreated sludge in comparison to raw WAS.
050100150200250300350400450500
Raw sludge EF 30 min EF 60 min EF 90 min EF 120 min
CST
(sec
onds
)
(c)
Figure 1. Evolution of soluble and total chemical oxygen demand (a), volatile fatty acid concentrations(b), and capillary suction time (c) during electro-Fenton (EF) pretreatment of WAS.
2.1.2. Capillary Suction Time (CST) Analysis
To identify the effect of EF treatment on sludge dewaterability, the capillary suction time (CST) ofraw and pretreated sludge was determined. CST is a fast and reliable method for determining thefilterability of activated sludge.
Figure 1c illustrates the decrease in elapsed time during filtration with increasing sludgepretreatment time. The CST decreased from 429 to 180 s by treating sludge by EF during 30 min.This decrease was even higher after 1 h, while dewaterability improved by about 95%.
2.1.3. Fourier Transform Infrared Spectroscopy Analysis (FTIR)
The characterization of organic material in a sludge sample was performed by FTIR. Spectrums ofthe raw and EF-pretreated sludge presented in Figure 2 showed absorption bands related to biomass.Both samples are characterized by a strong peak around 3100–3500 cm−1. The second major band wasidentified between 1500 and 1700 cm−1 with a peak at 1634 and 1631 cm−1 for raw and pretreatedsludge, respectively. The difference between the two spectrums is the fact that the intensity of thetwo major bands increased after EF pretreatment. New peaks also emerged in the pretreated sludgespectrum. The main absorption bands were thus observed in the range between 950 and 1100 cm−1.Other vibrations at 2015, 2176 and 2359 cm−1 between 2800 and 1900 cm−1 were also only observed inthe pretreated sludge in comparison to raw WAS.
2.1.4. Biogas Potential
To determine the effect of EF pretreatment time on anaerobic biodegradability and to optimizepretreatment time, batch anaerobic fermentations were performed. WAS samples pretreated by EFat different times (0, 30, 60, 90 and 120 min) were thus used as substrates. Figure 3 provides thekinetics of cumulative biogas yields obtained during these fermentations. In comparison to raw sludgefermentation, no time lag for biogas production was observed at the beginning of pretreated sludgefermentations. A biogas yield of about 0.080 L biogas/g vs. was achieved with raw WAS. However,an increase in biogas yields was observed for all pretreated samples in comparison to raw samples.Thus, yields calculated at the end of fermentation were 0.100, 0.113, 0.135 and 0.129 L biogas/g VS,respectively, for sludge pretreated by EF during 30, 60, 90 and 120 min.
18
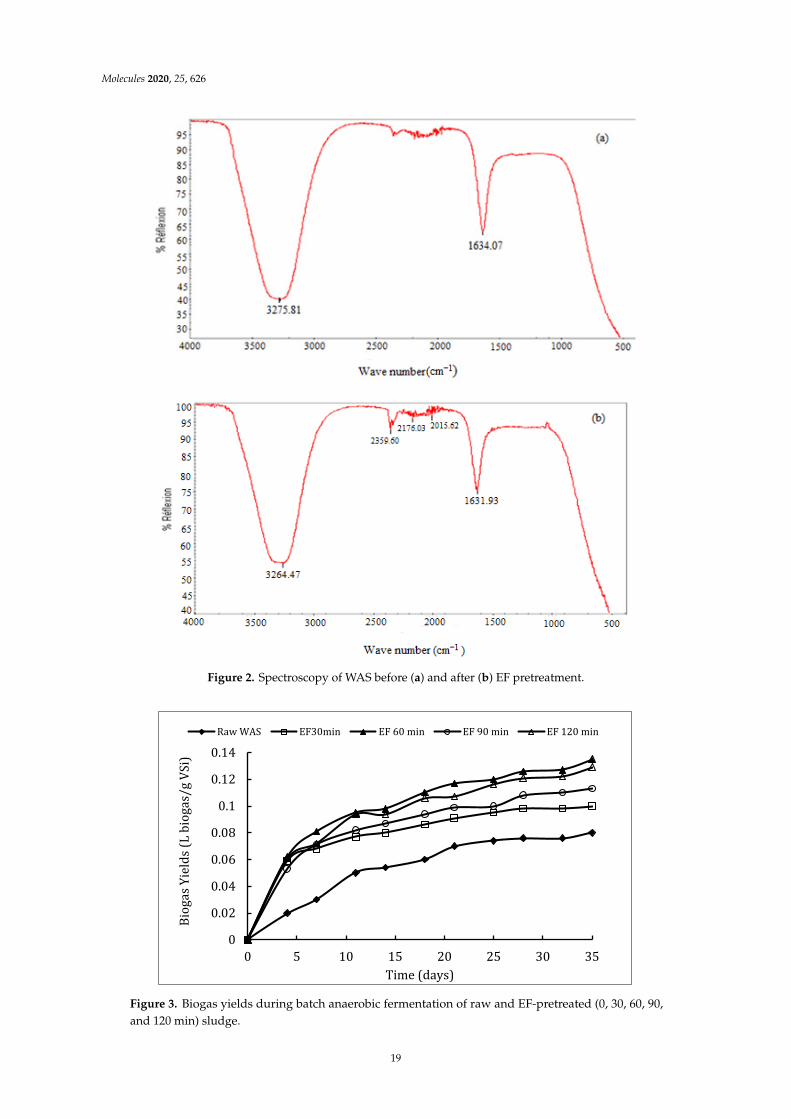
Molecules 2020, 25, 626Molecules 2019, 24, x 5 of 14
Figure 2. Spectroscopy of WAS before (a) and after (b) EF pretreatment.
2.1.4. Biogas Potential
To determine the effect of EF pretreatment time on anaerobic biodegradability and to optimize pretreatment time, batch anaerobic fermentations were performed. WAS samples pretreated by EF at different times (0, 30, 60, 90 and 120 min) were thus used as substrates. Figure 3 provides the kinetics of cumulative biogas yields obtained during these fermentations. In comparison to raw sludge fermentation, no time lag for biogas production was observed at the beginning of pretreated sludge fermentations. A biogas yield of about 0.080 L biogas/g vs. was achieved with raw WAS. However, an increase in biogas yields was observed for all pretreated samples in comparison to raw samples. Thus, yields calculated at the end of fermentation were 0.100, 0.113, 0.135 and 0.129 L biogas/g VS, respectively, for sludge pretreated by EF during 30, 60, 90 and 120 min.
Figure 2. Spectroscopy of WAS before (a) and after (b) EF pretreatment.Molecules 2019, 24, x 6 of 14
Figure 3. Biogas yields during batch anaerobic fermentation of raw and EF-pretreated (0, 30, 60, 90, and 120 min) sludge.
2.2. Semi-Continuous Fermentation of Raw and Pretreated WAS
In a first step of this study, the digester was fed with raw sludge at an organic loading rate (OLR) increasing from 0.17 g VS/L.d to 0.54 g VS/L.d (day 130). For the pretreated sludge, the first OLR applied to the reactor was 0.45 g VS/L.d. This parameter was then gradually increased to 2.5 g VS/L.d (Figure 4a). During these two fermentations, different HRTs (20, 14, 10 and 7 days) were applied which decreased with increasing OLR.
Figure 4. Evolution of organic loading rate (a) and biogas yield (b) during semi-continuous fermentation of raw and pretreated sludge in an up-flow anaerobic sludge blanket reactor.
00.020.040.060.080.10.120.14
0 5 10 15 20 25 30 35Biogas Yields
(L biogas/g VS
i)
Time (days)
Raw WAS EF30min EF 60 min EF 90 min EF 120 min
02000400060008000100001200014000
00.511.522.53
0 50 100 150 200 250
OLR raw OLR pretreated
Time (days)
OLR
(g V
S/L.d
)
Biog
as p
rodu
ctio
n (m
L/d)
00.20.40.60.81
0 50 100 150 200 250Biog
as y
ield
s (L
/g V
Si)
Time (days)
Raw WAS Pretreated WAS (b)
(a)
Figure 3. Biogas yields during batch anaerobic fermentation of raw and EF-pretreated (0, 30, 60, 90,and 120 min) sludge.
19
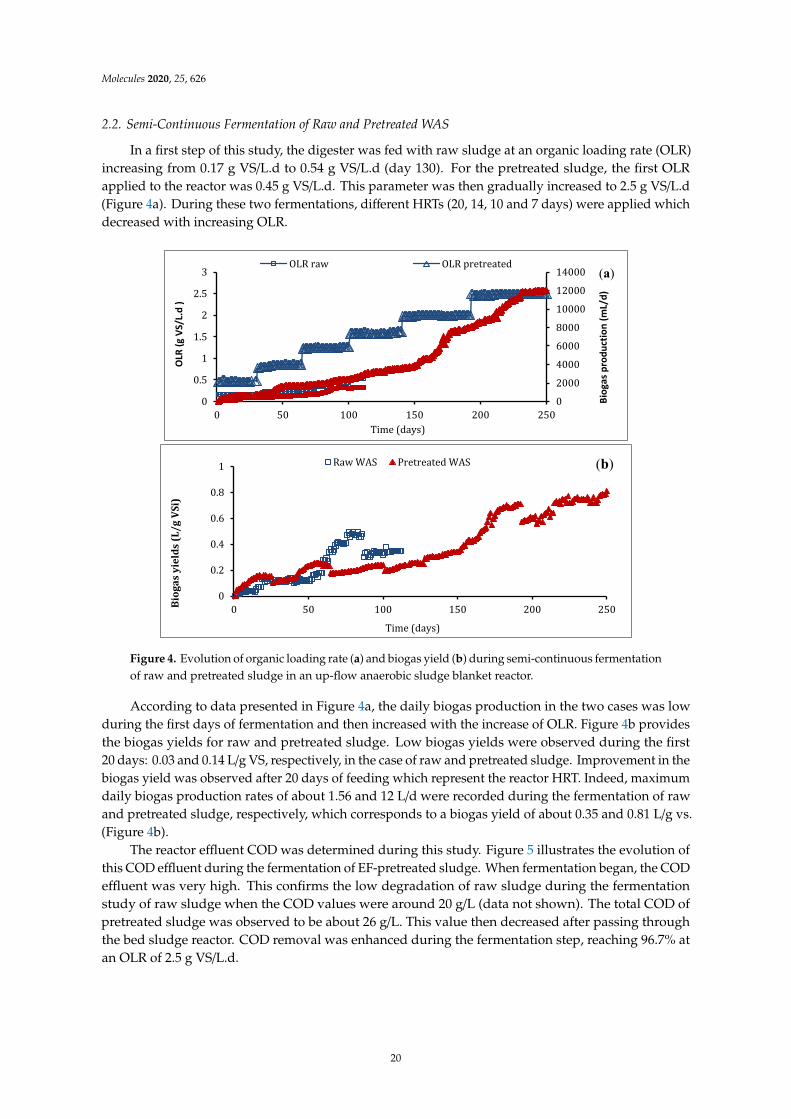
Molecules 2020, 25, 626
2.2. Semi-Continuous Fermentation of Raw and Pretreated WAS
In a first step of this study, the digester was fed with raw sludge at an organic loading rate (OLR)increasing from 0.17 g VS/L.d to 0.54 g VS/L.d (day 130). For the pretreated sludge, the first OLRapplied to the reactor was 0.45 g VS/L.d. This parameter was then gradually increased to 2.5 g VS/L.d(Figure 4a). During these two fermentations, different HRTs (20, 14, 10 and 7 days) were applied whichdecreased with increasing OLR.
Molecules 2019, 24, x 6 of 14
Figure 3. Biogas yields during batch anaerobic fermentation of raw and EF-pretreated (0, 30, 60, 90, and 120 min) sludge.
2.2. Semi-Continuous Fermentation of Raw and Pretreated WAS
In a first step of this study, the digester was fed with raw sludge at an organic loading rate (OLR) increasing from 0.17 g VS/L.d to 0.54 g VS/L.d (day 130). For the pretreated sludge, the first OLR applied to the reactor was 0.45 g VS/L.d. This parameter was then gradually increased to 2.5 g VS/L.d (Figure 4a). During these two fermentations, different HRTs (20, 14, 10 and 7 days) were applied which decreased with increasing OLR.
Figure 4. Evolution of organic loading rate (a) and biogas yield (b) during semi-continuous fermentation of raw and pretreated sludge in an up-flow anaerobic sludge blanket reactor.
00.020.040.060.080.10.120.14
0 5 10 15 20 25 30 35Biogas Yields
(L biogas/g VS
i)
Time (days)
Raw WAS EF30min EF 60 min EF 90 min EF 120 min
02000400060008000100001200014000
00.511.522.53
0 50 100 150 200 250
OLR raw OLR pretreated
Time (days)
OLR
(g V
S/L.d
)
Biog
as p
rodu
ctio
n (m
L/d)
00.20.40.60.81
0 50 100 150 200 250Biog
as y
ield
s (L
/g V
Si)
Time (days)
Raw WAS Pretreated WAS (b)
(a)
Figure 4. Evolution of organic loading rate (a) and biogas yield (b) during semi-continuous fermentationof raw and pretreated sludge in an up-flow anaerobic sludge blanket reactor.
According to data presented in Figure 4a, the daily biogas production in the two cases was lowduring the first days of fermentation and then increased with the increase of OLR. Figure 4b providesthe biogas yields for raw and pretreated sludge. Low biogas yields were observed during the first20 days: 0.03 and 0.14 L/g VS, respectively, in the case of raw and pretreated sludge. Improvement in thebiogas yield was observed after 20 days of feeding which represent the reactor HRT. Indeed, maximumdaily biogas production rates of about 1.56 and 12 L/d were recorded during the fermentation of rawand pretreated sludge, respectively, which corresponds to a biogas yield of about 0.35 and 0.81 L/g vs.(Figure 4b).
The reactor effluent COD was determined during this study. Figure 5 illustrates the evolution ofthis COD effluent during the fermentation of EF-pretreated sludge. When fermentation began, the CODeffluent was very high. This confirms the low degradation of raw sludge during the fermentationstudy of raw sludge when the COD values were around 20 g/L (data not shown). The total COD ofpretreated sludge was observed to be about 26 g/L. This value then decreased after passing throughthe bed sludge reactor. COD removal was enhanced during the fermentation step, reaching 96.7% atan OLR of 2.5 g VS/L.d.
20
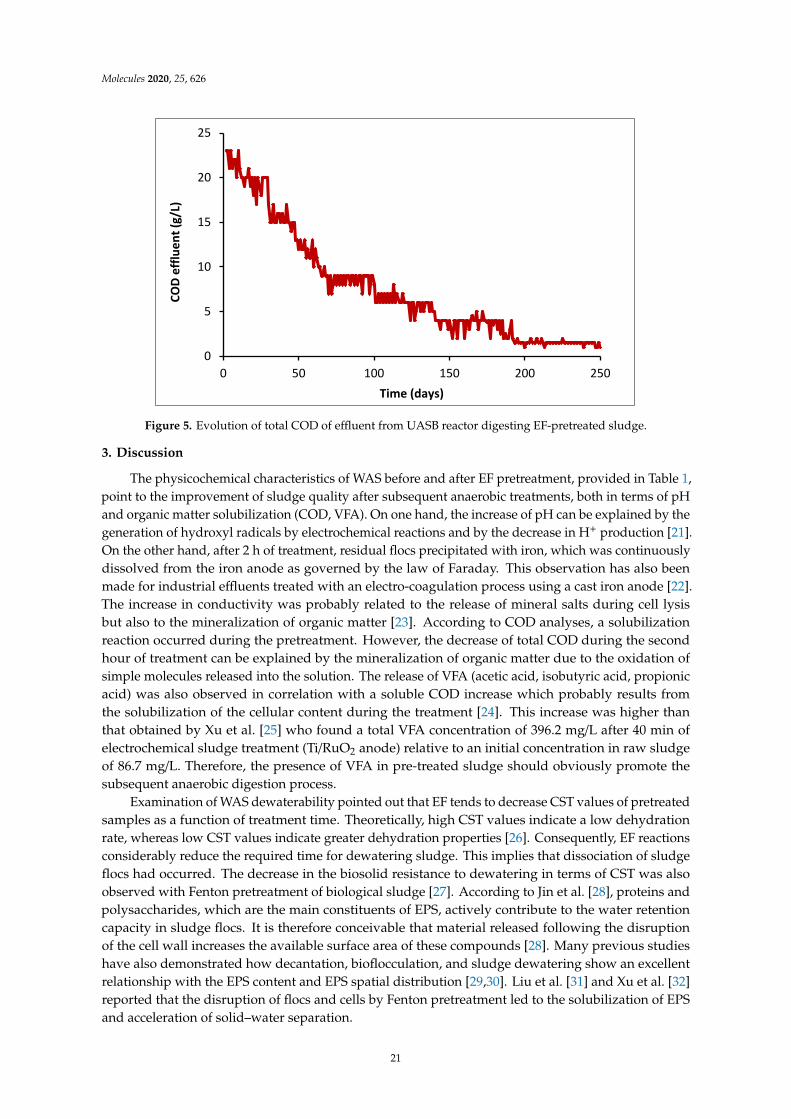
Molecules 2020, 25, 626
Molecules 2019, 24, x 7 of 14
According to data presented in Figure 4a, the daily biogas production in the two cases was low during the first days of fermentation and then increased with the increase of OLR. Figure 4b provides the biogas yields for raw and pretreated sludge. Low biogas yields were observed during the first 20 days: 0.03 and 0.14 L/g VS, respectively, in the case of raw and pretreated sludge. Improvement in the biogas yield was observed after 20 days of feeding which represent the reactor HRT. Indeed, maximum daily biogas production rates of about 1.56 and 12 L/d were recorded during the fermentation of raw and pretreated sludge, respectively, which corresponds to a biogas yield of about 0.35 and 0.81 L/g vs. (Figure 4b).
The reactor effluent COD was determined during this study. Figure 5 illustrates the evolution of this COD effluent during the fermentation of EF-pretreated sludge. When fermentation began, the COD effluent was very high. This confirms the low degradation of raw sludge during the fermentation study of raw sludge when the COD values were around 20 g/L (data not shown). The total COD of pretreated sludge was observed to be about 26 g/L. This value then decreased after passing through the bed sludge reactor. COD removal was enhanced during the fermentation step, reaching 96.7% at an OLR of 2.5 g VS/L.d.
Figure 5. Evolution of total COD of effluent from UASB reactor digesting EF-pretreated sludge.
3. Discussion
The physicochemical characteristics of WAS before and after EF pretreatment, provided in Table 1, point to the improvement of sludge quality after subsequent anaerobic treatments, both in terms of pH and organic matter solubilization (COD, VFA). On one hand, the increase of pH can be explained by the generation of hydroxyl radicals by electrochemical reactions and by the decrease in H+ production [21]. On the other hand, after 2 h of treatment, residual flocs precipitated with iron, which was continuously dissolved from the iron anode as governed by the law of Faraday. This observation has also been made for industrial effluents treated with an electro-coagulation process using a cast iron anode [22]. The increase in conductivity was probably related to the release of mineral salts during cell lysis but also to the mineralization of organic matter [23]. According to COD analyses, a solubilization reaction occurred during the pretreatment. However, the decrease of total COD during the second hour of treatment can be explained by the mineralization of organic matter due to the oxidation of simple molecules released into the solution. The release of VFA (acetic acid, isobutyric acid, propionic acid) was also observed in correlation with a soluble COD increase which probably results from the solubilization of the cellular content during the treatment [24]. This increase was higher than that obtained by Xu et al. [25] who found a total VFA concentration of 396.2 mg/L after 40 min of electrochemical sludge treatment (Ti/RuO2 anode) relative to an initial
0
5
10
15
20
25
0 50 100 150 200 250
COD
efflu
ent (
g/L)
Time (days)
Figure 5. Evolution of total COD of effluent from UASB reactor digesting EF-pretreated sludge.
3. Discussion
The physicochemical characteristics of WAS before and after EF pretreatment, provided in Table 1,point to the improvement of sludge quality after subsequent anaerobic treatments, both in terms of pHand organic matter solubilization (COD, VFA). On one hand, the increase of pH can be explained by thegeneration of hydroxyl radicals by electrochemical reactions and by the decrease in H+ production [21].On the other hand, after 2 h of treatment, residual flocs precipitated with iron, which was continuouslydissolved from the iron anode as governed by the law of Faraday. This observation has also beenmade for industrial effluents treated with an electro-coagulation process using a cast iron anode [22].The increase in conductivity was probably related to the release of mineral salts during cell lysisbut also to the mineralization of organic matter [23]. According to COD analyses, a solubilizationreaction occurred during the pretreatment. However, the decrease of total COD during the secondhour of treatment can be explained by the mineralization of organic matter due to the oxidation ofsimple molecules released into the solution. The release of VFA (acetic acid, isobutyric acid, propionicacid) was also observed in correlation with a soluble COD increase which probably results fromthe solubilization of the cellular content during the treatment [24]. This increase was higher thanthat obtained by Xu et al. [25] who found a total VFA concentration of 396.2 mg/L after 40 min ofelectrochemical sludge treatment (Ti/RuO2 anode) relative to an initial concentration in raw sludgeof 86.7 mg/L. Therefore, the presence of VFA in pre-treated sludge should obviously promote thesubsequent anaerobic digestion process.
Examination of WAS dewaterability pointed out that EF tends to decrease CST values of pretreatedsamples as a function of treatment time. Theoretically, high CST values indicate a low dehydrationrate, whereas low CST values indicate greater dehydration properties [26]. Consequently, EF reactionsconsiderably reduce the required time for dewatering sludge. This implies that dissociation of sludgeflocs had occurred. The decrease in the biosolid resistance to dewatering in terms of CST was alsoobserved with Fenton pretreatment of biological sludge [27]. According to Jin et al. [28], proteins andpolysaccharides, which are the main constituents of EPS, actively contribute to the water retentioncapacity in sludge flocs. It is therefore conceivable that material released following the disruptionof the cell wall increases the available surface area of these compounds [28]. Many previous studieshave also demonstrated how decantation, bioflocculation, and sludge dewatering show an excellentrelationship with the EPS content and EPS spatial distribution [29,30]. Liu et al. [31] and Xu et al. [32]reported that the disruption of flocs and cells by Fenton pretreatment led to the solubilization of EPSand acceleration of solid–water separation.
21
Molecules 2020, 25, 626
The FTIR method is based on the absorption of infrared radiation by the analyzed material.It allows for both the detection of the characteristic vibrations of the chemical bonds and the analysisof the chemical functions present in the material [31]. Infrared spectrophotometer analysis in the400–4000 cm−1 range is most often performed because this is where most of the frequencies of thefunctional groups are located [32]. Relevant peaks attributed to special functional groups according tothe literature are summarized in Table 2.
Table 2. Functional groups or compounds analyzed by Fourier transform infrared spectroscopy (FTIR)analysis in raw and EF-pretreated sludge.
Wave Number (cm−1) Vibration and Functional Groups
1634C=O carboxylic acids
C=C alkenesOH adsorbed water
3275O-H hydroxyl group and water
NH2 amine
According to the results, the FTIR spectrum of pretreated sludge presented a change in theintensity and shift of peaks in comparison to the raw sample. The strong peak around 3100–3500 cm−1
observed in the two spectrums corresponded to NH and OH stretching vibrations including hydrogenbonds. The increase in intensity and the shift towards a lower frequency of this band in the spectrumof the treated sample reflect an increase in hydrogen bonds which justifies the production of proteinswith amine functions (NH2). The rising intensity of the main bands after EF pretreatment can beexplained by the increase in reducing sugar (C=O carboxyl functions) and protein (NH2 aminefunctions) concentrations which are released into the supernatant after cell lysis. The appearanceof new peaks observed around 1100–950 cm−1 has been attributed to polysaccharides by Naumannet al. [33]. In the present case, these polysaccharides are released from exopolymers (EPS) dissociatedduring the disintegration of WAS. This can account for the improvement in dewaterability of pretreatedsamples. However, the apparent peak at 1030 cm−1 in the pretreated sludge spectrum is related tothe vibration of the Si–O–Si function [32], due to the release of silicon organic compounds (siloxanes,silanols) present in the waste activated sludge. Siloxanes are generally adsorbed to EPS flocs becauseof their low solubility in water. These compounds have been detected in biogas during the AD ofsludge, resulting from their release during organic matter degradation and the increase in temperaturewithin the anaerobic digester [34]. Indeed, their presence in the pretreated sludge can be explainedby EPS dissociation during the disintegration of sludge by EF reaction. The 2800–1900 cm−1 range isrelated to elongations of the triple bonds C≡C and C≡N (acetylene, cyanogen) and cumulative doublebonds X=Y=Z [32]. Compared with the raw WAS spectrum, this range presented vibrations at 2015,2176, and 2359 cm−1 in the case of pretreated sludge. This could be due to the effect of EF on thetransformation of certain molecules into molecules with triple or double bonds.
Batch anaerobic fermentations of raw and pretreated samples performed in similar conditionsled to an improvement in the biogas yield after EF pretreatment. The low biogas yield of raw WAScharacterizes its low biodegradability as well as the rate-limiting stages of anaerobic digestion ashydrolysis due to the strong protection of EPS and cell walls. Therefore, as demonstrated in the presentstudy with EF process application, a pretreatment step is crucial for biodegradability as well as theentire sludge AD performance to be enhanced [14]. Pretreated sample biogas yields have thus beenimproved in comparison with raw sludge. In addition, EF pretreatment allows for AD to be accelerated,since there is no more time lag for biogas production. Biogas improvement has been observed tocorrelate with treatment time. Indeed, a significant improvement in the biogas yield occurs after60 min of pretreatment compared with the other treatment times. An increase in the biogas potential ofabout 68% was obtained, coinciding with the highest VFA concentration released during the treatment
22
Molecules 2020, 25, 626
(Figure 1b). These results imply that EF pretreatment during 30 or 60 min has a positive effect on theanaerobic digestion process by increasing the biodegradability and biogas yield.
In order to comprehend the effect of EF pretreatment on the AD process, semi-continuousfermentations on raw and pretreated sludge were investigated in a lab-scale reactor. The low biogasyields observed during the first 20 days of both fermentations could be explained by the absence ofdegradable substrates in the upper part of the digester which concerns methanogens. Comparisonbetween results highlighted how the biogas yields improved when EF-pretreated sludge was used asfeed for the reactor, thus confirming the batch test results. A 2.3-fold increase in biogas yields wasachieved. Table 3 summarizes the results from both fermentations and also indicates the improvementin the methane percentage of biogas during the fermentation of EF-pretreated sludge that reached 68%against 56% in the case of raw sludge fermentation.
Table 3. Evolution of organic loading rate (OLR), biogas yield and methane percentage during anaerobicdigestion of raw and pretreated sludge in UASB reactor.
Feed Sample OLR(g VS/L.d)
Biogas Yield(mL/g VS) CH4 (%)
Raw0.25 ± 0.02 434 ± 0.017 48 ± 40.35 ± 0.01 480 ± 0.031 54 ± 20.50 ± 0.02 440 ± 0.024 56 ± 1
Pretreated
0.50 ± 0.016 400 ± 0.028 58 ± 31.60 ± 0.018 625 ± 0.030 66 ± 2
2 ± 0.027 735 ± 0.032 68 ± 12.50 ± 0.030 685 ± 0.029 67 ± 3
In addition, a strong COD removal rate (96.7%) was measured in the effluent even at low HRT(7 days) and at an OLR of 2.5 g VS/L.d. This improvement in COD removal could result from the increasein sludge biodegradability and from the purification performance of the Up-flow anaerobic sludgeblanket reactor (UASB).This performance is higher than those obtained by Xu et al. [35] and Li et al. [36]who reported a COD removal of about 49.2% and 12.5%, respectively. Yuan et al. [37] also demonstratedthat a combination of electrochemical and sodium hypochlorite pretreatments significantly enhancedthe biogas yields by about 1.83-fold the sludge anaerobic digestion and shortened the stabilizationperiod. According to Li et al. [38] and Chong et al. [13], the anaerobic UASB reactor is the most robustdigester for the sludge treatment. Indeed, this type of reactor contains microorganisms that formgranules through which, in an upward movement, the distributed effluent passes through the baseof the reactor [39]. Hence, the proposed sludge treatment system within the UASB can potentiallyimprove treatment efficiency. It can also reduce the discharge of pollutants into the environment aswell as reduce the sludge toxicity in aquatic environments [40,41].
All these results confirm the efficiency of EF sludge pretreatment for improving biogas production.This technique therefore allows for sludge to become more accessible to the anaerobic consortium,consequently enhancing the anaerobic process and biogas yield. In addition, the UASB system hasproven its effectiveness by significantly improving sludge anaerobic degradation, since the differentmicrobial communities presented in the digester are probably well balanced.
4. Materials and Methods
4.1. WAS and Anaerobic Inoculum
The WAS sample was obtained from a municipal wastewater treatment plant (WWTP) located inthe Sidi Mansour region (north of Sfax, Tunisia) with a capacity of 17,900 m3/d. Collected sampleswere stored at 4 C for subsequent experiments. The characteristics of the WAS sample are provided inTable 1. For anaerobic digestion experiments (batch and semi-continuous fermentations), the inoculumwas sampled from a semi-pilot anaerobic bioreactor installed in the laboratory.
23
Molecules 2020, 25, 626
4.2. Electro-Fenton Pretreatment
Electro-Fenton treatment was carried out under optimum conditions determined during a previousstudy [42]. The reaction took place in a 500 mL glass reactor using an ASF type 400/40.10 electricgenerator to apply a current density of 2.5 A/dm2. It comprised one pair of anodic and cathodicelectrodes (cast iron plates) which were positioned approximately 2 cm apart from each other and weredipped in the effluent. The total effective surface area of electrodes was 0.16 dm2. During this treatment,the main electrochemical reactions occurred at the anode with oxidation of iron and at the cathode withthe reduction of water. It was based on the principle of soluble iron anodes. Iron electrodes were usedfor in-situ generation of Fe2+. In each run, 300 mL of raw WAS were treated and operated in batchmode. The pH of the WAS sample was adjusted to 3 by adding an HCl solution (2N). The H2O2 (30%v/v) was added after adjustment of pH to the desired value; the pH of the solution was not controlledagain during the reaction. The aqueous solution of reactants was homogenized by magnetic agitationto avoid sedimentation of WAS particles and produced at room temperature.
4.3. Batch Anaerobic Digestion
Batch AD tests were conducted to determine the effect of EF pretreatment time on biogasproduction. WAS samples pretreated by EF at different times (0, 30, 60, 90 and 120 min) wereused as substrates. For each treatment time, three batch reactors with a capacity of 120 mL weretested in parallel. Batch reactors treating raw sludge were also conducted for comparison. In eachreactor, substrate and inoculum were introduced with a vs. substrate/VS inoculum ratio equal to 1.All batches were adjusted to 7.2 then purged with a gas mixture of 75% N2 and 25% CO2 for 3 minto maintain anaerobic conditions and finally incubated under mesophilic conditions (37 ± 1 C) for35 days. During fermentation, biogas production was measured using a gas displacement device.The Biochemical methane potential (BMP) experiments and the related analysis were performed by theBio2E platform [43].
4.4. Semi-Continuous Anaerobic Reactor
An up-flow anaerobic sludge blanket (UASB) reactor was used to study the semi-continuousfermentation of WAS before and after 1 h of EF pretreatment. The working volume of the digesterwas 7 L. For maintaining a constant temperature (37 C), it had a PVC double wall filled with heatedwater from a heated bath circulator. Before beginning the experiments, the bioreactor was inoculatedwith the anaerobic microbial consortium and fed with raw sludge (0.05 g VS/L.d) during 2 months.This preparation period ensured biomass enrichment and process stability. The hydraulic retentiontime (HRT) during fermentation of raw and pretreated sludge was set to 20 days during the first period.It was then reduced to 14, 10 and 7 days. Feeding and withdrawing were done once a day, using apump. The volume of biogas was measured by liquid displacement. During the experiments, the CODof influent and effluent, biogas production, pH, and VFA were monitored.
4.5. Analytical Methods
The pH was measured with a pH meter (Metrohm). Total and soluble COD were quantifiedwith a titration method after a total digestion with H2SO4 and potassium dichromate at 150 C for2 h [42]. BOD5 was determined by the manometric method with a respirometer (BSB-Controller Model620 T (WTW)). Total solids (TS) and Total suspended solids (TSS) were measured by weighing samplesbefore and after overnight drying at 105 C. Volatile solids (VS) and volatile suspended solids (VSS)were analyzed by loss on ignition at 600 C for 2 h. The total Kjeldahl nitrogen content (TKN) and theammoniacal nitrogen (N–NH4
+) were analyzed according to the Kjeldahl-N method.Conductivity was measured using a conductimeter (CONSORT). Total volatile fatty acids (VFA)
were analyzed by centrifuging the samples for 15 min at 8000 rpm and then filtering them on 0.45 µmpore size syringe filters. The resulting filtrates were acidified (pH 3) with HCl (0.1 N) before being
24

Molecules 2020, 25, 626
analyzed and quantified by high-performance liquid chromatography (HPLC: SHIMADZU 10 AVP).Fourier transform infrared spectroscopy (FTIR 380 Nicolet model) equipped with a He-Ne laser anda telluride, mercury, and cadmium detector (MCT) at a frequency of 400–4000 cm−1 was used toanalyze the organic functional groups present in raw and pretreated WAS. Before the FTIR analysis,sludge samples were centrifuged for 20 min at 4500 rpm and then filtered through a 0.45 µm pore sizemembrane filter.
The capillary suction time (CST) was measured with a CST analyzer (Triton Electronics Ltd.,United Kingdom) using a 7 × 9 cm2 size CST paper. All sludge samples were used in their initial statewithout centrifugation and filtration. A volume of 5 mL of sample was placed into a metal tube andthe ring time was recorded as CST.
5. Conclusions
The present study has highlighted the effect of EF pretreatment on the efficiency of disintegrationand AD of sludge. The pretreatment has shown to improve organic matter solubilization by increasingsoluble COD and volatile fatty acids. FTIR analysis also revealed the release of reducing sugars,polysaccharides, and proteins, thus confirming the dissociation of flocs. This result can account forthe improvement in sludge filterability indicated by low CST results of 22.4 and 14 s after 1 and 2 hof pretreatment, respectively. Results from batch and semi-continuous anaerobic fermentations haveconfirmed the positive effect of the EF process in enhancing the biogas potential and stability of theanaerobic system. The EF process therefore promises to be a more reliable and robust solution for theenhancement of WAS anaerobic treatment.
Author Contributions: S.K., S.S. and A.D. conceived and designed the study experiments; E.F. performed all theexperiments and wrote the original draft preparation. A.B., responsible for CST analysis, BMP experiments anddata. S.K., the corresponding author, designed the overall study and interpreted the results; S.K. and A.B. revisedand finalized the manuscript. All authors have read and approved the final manuscript.
Funding: This research was funded by the Tunisian Ministry of Higher Education and Scientific Research and theInternational Foundation for Science (Research Grant Agreement N W/5412-1).
Acknowledgments: The authors would like to thank Nidhal Baccar for his assistance in the FTIR analyses andthe Bio2E platform (DOI 10.15454/1.557234103446854E12) for experimental support.
Conflicts of Interest: The authors declare no conflict of interest.
Abbreviations
AD anaerobic digestionCOD chemical oxygen demandCST capillary suction timeEF electro-FentonFTIR Fourier transform infrared spectroscopyOLR organic loading rateVFA volatile fatty acidsWAS waste activated sludge
References and Note
1. Ennouri, H.; Miladi, B.; Diaz, S.Z.; Gûelfo, L.A.F.; Solera, R.; Hamdi, M.; Bouallagui, H. Effect of thermalpretreatment on the biogas production and microbial communities balance during anaerobic digestion ofurban and industrial waste activated sludge. Bioresour. Technol. 2016, 214, 184–191. [CrossRef] [PubMed]
2. Neczaj, E.; Grosser, A. Biogas production by thermal hydrolysis and thermophilic anaerobic digestion ofwaste-activated sludge. Ind. Munic. Sludge 2019, 741–781.
3. Akgul, D.; Cella, M.A.; Eskicioglu, C. Influences of low-energy input microwave and ultrasonic pretreatmentson single-stage and temperature-phased anaerobic digestion (TPAD) of municipal wastewater sludge. Energy2017, 123, 271–282. [CrossRef]
25
Molecules 2020, 25, 626
4. Kim, J.; Yu, Y.; Lee, C. Thermo-alkaline pretreatment of waste activated sludge at low-temperatures: Effectson sludge disintegration, methane production, and methanogen community structure. Bioresour. Technol.2013, 144, 194–201. [CrossRef] [PubMed]
5. Tong, H.; Tong, Y.W.; Peng, Y.H. A comparative life cycle assessment on mono- and co-digestion of foodwaste and sewage sludge. Energy Procedia 2019, 158, 4166–4171. [CrossRef]
6. Devlin, D.C.; Esteves, S.R.R.; Dinsdale, R.M.; Guwy, A.J. The effect of acid pretreatment on the anaerobicdigestion and dewatering of waste activated sludge. Bioresour. Technol. 2011, 102, 4076–4082. [CrossRef]
7. Müller, J.; Lehne, G.; Schwedes, J.; Battenberg, S.; Naveke, R.; Kopp, J.; Dichtl, N.; Scheminski, A.; Krull, R.;Hempel, D.C. Disintegration of sewage sludges and influence on anaerobic digestion. Water Sci. Technol.1998, 38, 425–433. [CrossRef]
8. Chen, Y.; Fu, B.; Wang, Y.; Jiang, Q.; Liu, H. Reactor performance and bacterial pathogen removal in responseto sludge retention time in a mesophilic anaerobic digester treating sewage sludge. Bioresour. Technol. 2012,106, 20–26. [CrossRef]
9. Nges, I.A.; Liu, J. Effects of solid retention time on anaerobic digestion of dewatered-sewage sludge inmesophilic and thermophilic conditions. Renew. Energy 2010, 35, 2200–2206. [CrossRef]
10. Appels, L.; Baeyens, J.; Degreve, J.; Dewil, R. Principles and potential of the anaerobic digestion ofwaste-activated sludge. Prog. Energy Combust. Sci. 2008, 34, 755–781. [CrossRef]
11. Gonzalez, A.; Hendriks, A.T.W.M.; Vanlier, J.B.; Kreuk, M. Pre-treatments to enhance the biodegradability ofwaste activated sludge: Elucidating the rate limiting step. Biotechnol. Adv. 2018, 36, 1431–1469. [CrossRef][PubMed]
12. Tulun, S.; Bilgin, M. Enhancement of anaerobic digestion of waste activated sludge by chemical pretreatment.Fuel 2019, 254, 115671. [CrossRef]
13. Li, X.; Zhao, J.; Wang, D.; Yang, Q.; Xu, Q.; Deng, Y.; Yang, W.; Zeng, G. An efficient and green pretreatmentto stimulate short chain fatty acids production from waste activated sludge anaerobic fermentation usingfree nitrous acid. Chemosphere 2016, 144, 160–167. [CrossRef] [PubMed]
14. González-Fernández, C.; Sialve, B.; Bernet, N.; Steyer, J.P. Thermal pretreatment to improve methaneproduction of Scenedesmus biomass. Biomass Bioenergy 2012, 40, 105–111. [CrossRef]
15. Ariunbaatar, J.; Panico, A.; Esposito, G.; Pirozzi, F.; Lens, P.N. Pretreatment methods to enhance anaerobicdigestion of organic solid waste. Appl. Energy 2014, 123, 143–156. [CrossRef]
16. Lee, K.; Chantrasakdakul, P.; Kim, D.; Kong, M.; Park, K.Y. Ultrasound pretreatment of filamentous algalbiomass for enhanced biogas production. Waste Manag. 2014, 34, 1035–1040. [CrossRef]
17. Ehimen, E.A.; Hom-Nielsen, J.B.; Poulsen, M.; Boelsmand, J.E. Influence of different pre-treatment routes onthe anaerobic digestion of a filamentous algae. Renew. Energy 2013, 50, 476–480. [CrossRef]
18. Luo, K.; Yang, Q.; Li, X.; Yang, G.; Liu, Y.; Wang, D.; Zheng, W.; Zeng, G. Hydrolysis kinetics in anaerobicdigestion of waste activated sludge enhanced by α-amylase. Biochem. Eng. J. 2012, 62, 17–21. [CrossRef]
19. Ana, R.R.; Olga, C.N.; Manuel, F.R.P.; Adrián, M.T.S. An overview on the advanced oxidation processesapplied for the treatment of water pollutants defined in the recently launched Directive 2013/39/EU.Environ. Int. 2015, 75, 33–51.
20. Anjum, M.; Al-Talhi, H.A.; Mohamed, S.A.; Kumar, R.; Barakat, M.A. Visible light photocatalytic disintegrationof waste activated sludge for enhancing biogas production. J. Environ. Manag. 2018, 216, 120–127. [CrossRef]
21. Chen, Y.; Chen, H.; Li, J.; Xiao, L. Rapid and efficient activated sludge treatment by electro- Fenton oxidation.Water Res. 2019, 152, 181–190. [CrossRef] [PubMed]
22. Khoufi, S.; Feki, F.; Sayadi, S. Detoxification of olive mill wastewater by electrocoagulation an sedimentationprocesses. J. Hazard. Mater. 2007, 142, 58–67. [CrossRef] [PubMed]
23. Israilides, C.J.; Vlyssides, A.G.; Mourafeti, V.N.; Kavouni, G. Olive oil wastewater treatment with the use ofan electrolysis system. Bioresour. Technol. 1997, 61, 163–170. [CrossRef]
24. Chen, W.; Gao, X.; Xu, H.; Cai, Y.; Cui, J. Influence of extracellular polymeric substances (EPS) treatedby combined ultrasound pretreatment and chemical re-flocculation on water treatment sludge settlingperformance. Chemosphere 2017, 170, 196–206. [CrossRef]
25. Xu, J.; Yuan, H.; Lin, J.; Yuan, W. Evaluation of thermal, thermal-alkaline, alkaline and electrochemicalpretreatments on sludge to enhance anaerobic biogas production. J. Taiwan Inst. Chem. Eng. 2014, 45,2531–2536. [CrossRef]
26
Molecules 2020, 25, 626
26. Jiang, Y.; Su, M.; Li, D.P. Removal of sulfide and production of methane from carbon dioxide in microbialfuel cells-microbial electrolysis cell (MFCs-MEC) coupled system. Appl. Biochem Biotechnol. 2014, 172, 11.[CrossRef]
27. Gulbin, E.; Filibeli, A. Improving anaerobic biodegradability of biological sludges by Fenton pre-treatment:Effects on single stage and two-stage anaerobic digestion. Desalination 2010, 251, 58–63.
28. Jin, B.; Wilén, B.-M.; Lant, P. Impacts of morphological, physical and chemical properties of sludge flocs ondewaterability of activated sludge. Chem. Eng. J. 2004, 98, 115–126. [CrossRef]
29. Hernando, A.; Hernando, R.; Plastino, A. Space–time correlations in urban sprawl. J. R. Soc. Interface 2014,11, 20130930. [CrossRef]
30. Peng, Z.; Fang, F.; Chen, Y.P.; Shen, Y.; Zhang, W.; Yang, J.X.; Li, C.H.; Guo, J.S.; Liu, S.Y.; Huang, Y.; et al.Composition of EPS fractions from suspended sludge and biofilm and their roles in microbial cell aggregation.Chemosphere 2014, 117, 59–65.
31. Zhang, L.; Vrieze, J.D.; Hendrickx, T.L.G.; Wei, W.; Temmink, H.; Rijnaarts, H.; Zeeman, G. Anaerobictreatment of raw domestic wastewater in a UASB-digester at 10 C and microbial community dynamics.Chem. Eng. J. 2018, 334, 2088–2097. [CrossRef]
32. Liu, H.; Yang, J.; Zhu, N.; Zhang, H.; Li, Y.; He, S.; Yang, C.; Yao, H. A comprehensive insight into the combinedeffects of Fenton’s reagent and skeleton builders on sludge deep dewatering performance. J. Hazard. Mater.2013, 258, 144–150. [CrossRef] [PubMed]
33. Xu, H.; Shen, K.; Ding, T.; Cui, J.; Ding, M.; Lu, C. Dewatering of drinking water treatment sludge using theFenton-like process induced by electro-osmosis. Chem. Eng. J. 2016, 293, 207–215. [CrossRef]
34. Wu, H.; Zhao, Y.; Long, Y.; Zhu, Y.; Wang, H.; Lu, W. Evaluation of the biological stability of waste duringlandfill stabilization by thermogravimetric analysis and Fourier transform infrared spectroscopy. Bioresour.Technol. 2011, 102, 9403–9408. [CrossRef] [PubMed]
35. Smidt, E.; Meissl, K. The applicability of Fourier transform infrared (FT-IR) spectroscopy in waste management.Waste Manag. 2007, 27, 268–276. [CrossRef]
36. Naumann, A.; Heine, G.; Rauber, R. Efficient discrimination of oat and pea roots by cluster analysis of Fouriertransform infrared (FTIR) spectra. Field Crop. Res. 2010, 119, 78–84. [CrossRef]
37. Dewil, R.; Appels, L.; Baeyens, J.; Buczynska, A.; Vaeck, L.V. The analysis of volatile siloxanes in wasteactivated sludge. Talanta 2007, 74, 14–19. [CrossRef]
38. Xu, S.; Zhang, L.; Huang, S.; Zeeman, G.; Rijnaarts, H.; Liu, Y. Improving the energy efficiency of a pilot-scaleUASB-digester for low temperature domestic wastewater treatment. Biochem. Eng. J. 2018, 135, 71–78.[CrossRef]
39. Chong, S.; Kanti Sen, T.; Kayaalp, A.; Ming Ang, H. The performance enhancements of upflow anaerobicsludge blanket (UASB) reactors for domestic sludge treatmentA State-of-the-art review. Water Res. 2012, 46,3434–3470. [CrossRef]
40. Abbasi, T.; Abbasi, S.A. Formation and impact of granules in fostering clean energy production andwastewater treatment in upflow anaerobic sludge blanket (UASB) reactors. Renew. Sustain. Energy Rev. 2012,16, 1696–1708. [CrossRef]
41. Nair, A.T.; Ahammed, M.M. The reuse of water treatment sludge as a coagulant for post-treatment of UASBreactor treating urban wastewater. J. Clean. Prod. 2015, 96, 272–281. [CrossRef]
42. Feki, E.; Khoufi, S.; Loukil, S.; Sayadi, S. Improvement of anaerobic digestion of waste activated sludgeby using H2O2 oxidation, electrolysis, electro-oxidation and thermo-alkaline pretreatments. Environ. Sci.Pollut. Res. 2015, 22, 12. [CrossRef] [PubMed]
43. Bio2E, INRA, 2019. Environemental Biotechnology and Biorefinery Platform.
Sample Availability: Not available.
© 2020 by the authors. Licensee MDPI, Basel, Switzerland. This article is an open accessarticle distributed under the terms and conditions of the Creative Commons Attribution(CC BY) license (http://creativecommons.org/licenses/by/4.0/).
27

molecules
Article
Impacts of Chemical-Assisted Thermal Pretreatmentson Methane Production from Fruit and VegetableHarvesting Wastes: Process Optimization
Ümmihan Günerhan 1, Ender Us 1, Lütfiye Dumlu 2, Vedat Yılmaz 3 , Hélène Carrère 4 andAltınay N. Perendeci 5,*
1 Istanbul Water and Sewerage Administration, Ataköy Advanced Biological Wastewater Treatment Plant,Sevketiye Street, Havaalanı Avenue, 34156 Istanbul, Turkey; [email protected] (U.G.);[email protected] (E.U.)
2 Ministry of Environment and Urbanization, General Directorate of Environmental Management,Department of Water and Soil Management, 06520 Ankara, Turkey; [email protected]
3 Environmental Engineering Department, Artvin Çoruh University, 08100 Artvin, Turkey;[email protected]
4 Univ Montpellier, INRAE, LBE, 102 Avenue des Etangs, 11100 Narbonne, France; [email protected] Department of Environmental Engineering, Akdeniz University, 07058 Antalya, Turkey* Correspondence: [email protected]; Tel.: +90-242-310-6334; Fax: 90-242-310-6306
Academic Editor: Ivet FerrerReceived: 7 December 2019; Accepted: 16 January 2020; Published: 23 January 2020
Abstract: The increasing population creates excess pressure on the plantation and production offruits and vegetables across the world. Consumption demand during the whole year has madeproduction compulsory in the covered production system (greenhouse). Production, harvesting,processing, transporting, and distribution chains of fruit and vegetables have resulted in a hugeamount of wastes as an alternative source to produce biofuels. In this study, optimization of twopretreatment processes (NaOH and HCl assisted thermal) was investigated to enhance methaneproduction from fruit and vegetable harvesting wastes (FVHW) that originate from greenhouses.NaOH concentration (0–6.5%), HCl concentration (0–5%), reaction temperature (60–100 C), solidcontent (1–5%), time of reaction (1–5 h), and mixing speed (0–500 rpm) were chosen in a wide range oflevels to optimize the process in a broad design boundary and to evaluate the positive and negativeimpacts of independent variables along with their ranges. Increasing NaOH and HCl concentrationsresulted in higher COD solubilization but decreased the concentration of soluble sugars that canbe converted directly into methane. Thus, the increasing concentrations of NaOH and HCl in thepretreatments have resulted in low methane production. The most important independent variablesimpacting COD and sugar solubilization were found to be chemical concentration (as NaOH andHCl), solid content and reaction temperature for the optimization of pretreatment processes. The highamount of methane productions in the range of 222–365 mL CH4 gVS−1 was obtained by the simplethermal application without using chemical agents as NaOH or HCl. Maximum enhancement ofmethane production was 47–68% compared to raw FVHW when 5% solid content, 1-hour reactiontime and 60–100 C reaction temperature were applied in pretreatments.
Keywords: biogas production; fruit and vegetable harvesting wastes; process optimization; thermochemical pretreatment
1. Introduction
The acceptance of the generated wastes as a resource within the scope of the circular economy,recovery, and reuse is the major condition for sustaining life on earth. The increasing population
29

Molecules 2020, 25, 500
coupled with economic development has resulted in huge agricultural production [1]. Based on theconsumption requirements, the plantation and production of fruits and vegetables have increasedacross the world and production reached 1960 million tons in 2017 [2]. The continuation of consumptiondemand during the whole year has made production compulsory in the covered production system(greenhouse).
China is placed in the first rank of the world with a 27000 km2 covered area for the production offruits and vegetables. South Korea, Spain, and Japan followed China in the ranking. Turkey, holdingapproximately 772 km2 of covered production area, occupies fifth place across the world for the massiveproduction of fresh fruit and vegetables from greenhouses. It is expected that the global commercialgreenhouse market will be 32.31 billion USD with an annual growth rate of 8.8% by 2021. Judging bythis enormous production, it is predictable that huge amounts of fruits and vegetables wastes havebeen generated during the production, harvesting, processing, transporting and distribution chain.Fruits and vegetable wastes are the main components of municipal solid waste. The conventionaldisposal methods of FVHW from greenhouses are the storage in forest area, uncontrolled burningand landfilling by farmers [3]. Moreover, processing, transporting and distribution chain wastes aredisposed of landfills by the municipalities. Although EU greenhouse gas emissions from landfills havealready declined due to the well-practiced MSW managements [4], the degradation of FVHW duringlandfilling causes the production of leachates and emissions of greenhouse gases all around the world.Furthermore, uncontrolled burning has also resulted in greenhouse gases and toxic compounds [5].
Maintaining high agricultural production capacities for Turkey, as well as for other countries,has three main objectives. These are increasing agricultural income and its contribution to nationalincome, meeting agricultural and food demand of nationals domestically, and keeping farmers on theirlands to secure agricultural production [6]. About 250 km2 of greenhouses have been located in Antalya,south of Turkey. It is around 47% of Turkey’s greenhouse production hold in Antalya. Eighty percentof fruit and vegetables, such as tomato, cucumber, pepper, eggplant, courgette, banana, strawberry andany other are grown in the greenhouses. Apart from all these positive contributions, the region hasbeen under heavy pressure in terms of FVHW to be managed. The production area urgently requiredthe implementation of relevant policies for managing the waste disposal and recovering energy fromrenewable and cost-free lignocellulosic wastes.
On the other side, fossil fuels have supplied over 80% of global energy needs. However, thesefuels are not renewable and lead to climate change by the production of CO2 and other greenhousegases [7]. Consequently, building a sustainable society requires reducing dependence on fossil fuels,minimizing the amount of waste produced, and increasing recycling. Generating renewable bioenergyfrom wastes makes it possible to realize these targets at the same time. The anaerobic digestion (AD)of FVHW combines these advantages, as it produces methane and simultaneously treats the wastes.AD is a trustful and approved technology with a long exercise for the degradation of organic wastesfrom industry, municipality, and agriculture over the decades. It is known that the predicted energygain/input ratio for AD was 28.8 MJ/MJ. This finding has been better compared to other technologiesfor energy production from biomass in energy efficiency [8–10].
However, the complex structure of agricultural residues is the major limitation, which makeslignocellulosic biomass refractory to anaerobic digestion and yields in low methane production [11,12].This restricts the hydrolysis of material in which enzymes fail to degrade complex structures.Commercial limitations of methane production from lignocellulosic residues should be solved by thepretreatment processes [12,13]. To solve this limitation, different kinds of pretreatment methods suchas mechanical, chemical (acidic, alkali, oxidative), thermal, biological, and combinations have beenapplied to the countless number of lignocellulosic feedstock [10].
On the other hand, FVHW, primarily non-commercial parts of plants such as leaves, bodies, stemsas well as unmerchantable fruits and vegetables, have a milder lignocellulosic structure than the otheragricultural residues and require less severe pretreatment conditions before AD. There have been
30
Molecules 2020, 25, 500
very limited studies investigating the methane production potentials of mixed FVHW combined withpretreatment methods in the literature [3,5,14–17].
In this study, it was proposed to combine the cost-effective integrated process of chemical-assistedthermal pretreatment and anaerobic digestion for the improvement of methane production from FVHW.The impacts of sodium hydroxide (NaOH) and hydrochloric acid (HCl) assisted thermal pretreatmenton methane production were investigated. In the first stage of the work, impacts of variables (reactiontemperature, time of reaction, amounts of chemical, solid content, mixing speed) on soluble chemicaloxygen demand (sCOD) and soluble sugars (sSugar) were determined with very detailed experimentalwork for NaOH- and HCl-assisted thermal pretreatments. In the second part of the work, processoptimizations were performed for both pretreatment processes; optimum conditions for methaneproduction were discussed and biochemical methane potential (BMP) tests were implemented underthe determined conditions. Finally, molecular bond characterization and surface properties of raw andpretreated FVHW were compared.
2. Materials and Methods
2.1. Sources of FVHW and Characterization Analysis
FVHW were obtained from Antalya region. The area of Kumluca has been well known for theextensive production of fruits and vegetables in greenhouses. Kumluca area makes a significantcontribution to the fruits and vegetables supplies of Turkey and its trade partners during the fourseasons. FVHW included leaves; stalks; stems; roots; and unmerchantable fruits from pepper,cucumber, tomato, courgette, and eggplant. FVHW were sun-dried and milled to 1 mm size for thecharacterization tests, while size-reduced (4–5 mm) fresh wastes were subjected to chemical-assistedthermal pretreatment experiments and BMP tests. The analyses of total solids (TS), volatile solids (VS)and total chemical oxygen demand (COD) were performed according to standard methods 2540Cand 5220B, respectively [18]. The contents of lignin, cellulose, hemicellulose, and soluble matterwere determined using procedures proposed by Van Soest (1963) [19] by Gerhard FBS6 (Gerhard,Königswinter, Germany). Carbohydrate and the soluble reducing sugar (sRedSugar) concentrationswere measured via the Anthrone method [20] and the Dinitrosalicylic acid (DNS) method [21],respectively. Protein concentration was done by the Lowry method [22]. Extractive matter and lipids ofthe wastes were measured by soxhlet extraction using petroleum ether [23]. Elemental composition ofthe wastes was determined by CHNS analyzer (LECO, CHNS-932, St. Joseph, MI, USA). The Kjeldahlnitrogen content of the FVHW was quantified by an analyzer (Büchi Digest Automat K-438, BüchiAuto Kjeldahl Unit K-370 and Radiometer TitraLab 840, Büchi, Flawil, Switzerland).
2.2. Chemical-Assisted Thermal Pretreatments Experiments
Fresh FVHW were pretreated in a 0.3 L stainless steel reactor (Parr series 5500 high-pressurereactor; Parr Instrument Company, Moline, IL, USA) equipped with a temperature controller andmagnetically-driven turbine agitator. NaOH and HCl were selected as chemical agents in thechemical-assisted thermal pretreatments experiments to enhance methane yield. Selected independentvariables and their ranges for NaOH- and HCl-assisted thermal pretreatment are presented in Table 1.For the specified conditions, chemically-assisted thermal pretreatment runs were performed in parallel.NaOH and HCl solutions were loaded into the reactor along with the computed amount of FVHW andheated to predefined reaction temperatures. When the predefined reaction temperature was sustained,the time of reaction was initiated. Later, completing the target reaction time, the reaction vessel wassoaked into water and an ice bath to cool down to 40 C in a short time. Evaluation of the pretreatmentperformance was made by sCOD, sRedSugar, and BMP. Samples were separated into a liquid and solidphase by centrifugation after cooling. sCOD and sRedSugar analyses were performed from the liquidphase. The analysis of sCOD was performed by a Hach-Lange DR5000 spectrophotometer (HachLange GmbH, Duesseldorf, Germany) and a Lange LT200 (Keison Products, Grasshut, Germany) with
31
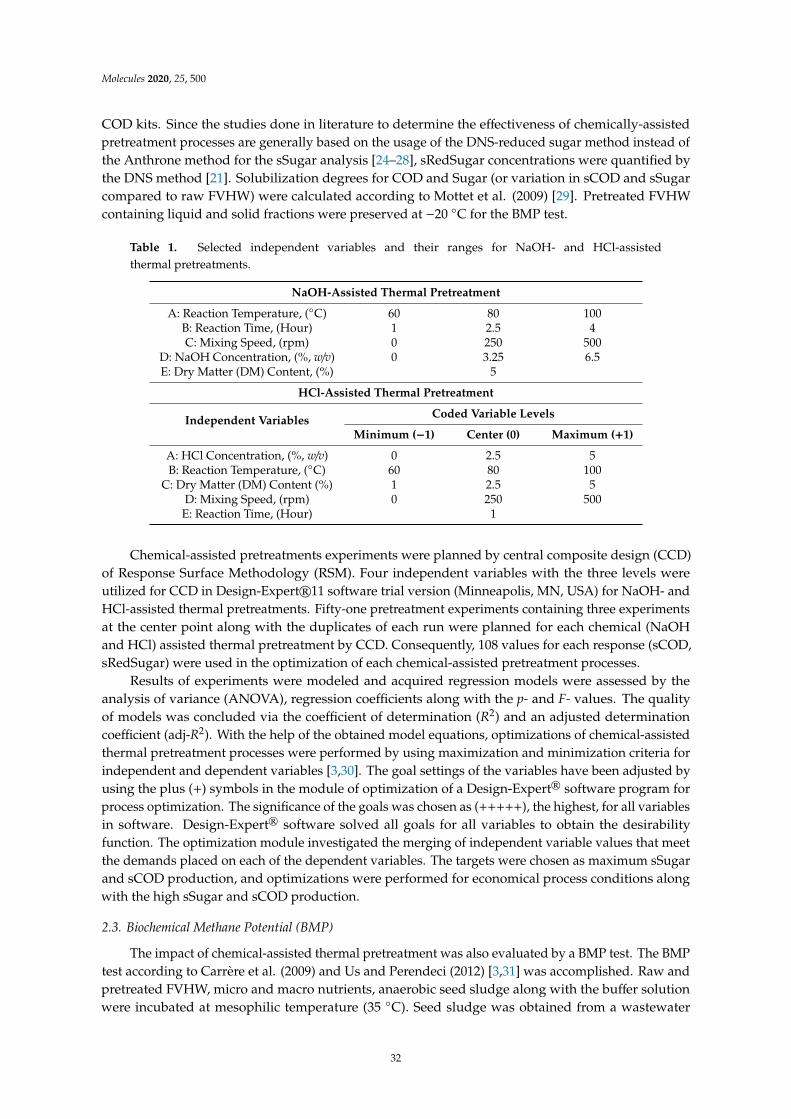
Molecules 2020, 25, 500
COD kits. Since the studies done in literature to determine the effectiveness of chemically-assistedpretreatment processes are generally based on the usage of the DNS-reduced sugar method instead ofthe Anthrone method for the sSugar analysis [24–28], sRedSugar concentrations were quantified bythe DNS method [21]. Solubilization degrees for COD and Sugar (or variation in sCOD and sSugarcompared to raw FVHW) were calculated according to Mottet et al. (2009) [29]. Pretreated FVHWcontaining liquid and solid fractions were preserved at −20 C for the BMP test.
Table 1. Selected independent variables and their ranges for NaOH- and HCl-assistedthermal pretreatments.
NaOH-Assisted Thermal Pretreatment
A: Reaction Temperature, (C) 60 80 100B: Reaction Time, (Hour) 1 2.5 4C: Mixing Speed, (rpm) 0 250 500
D: NaOH Concentration, (%, w/v) 0 3.25 6.5E: Dry Matter (DM) Content, (%) 5
HCl-Assisted Thermal Pretreatment
Independent Variables Coded Variable Levels
Minimum (−1) Center (0) Maximum (+1)
A: HCl Concentration, (%, w/v) 0 2.5 5B: Reaction Temperature, (C) 60 80 100
C: Dry Matter (DM) Content (%) 1 2.5 5D: Mixing Speed, (rpm) 0 250 500
E: Reaction Time, (Hour) 1
Chemical-assisted pretreatments experiments were planned by central composite design (CCD)of Response Surface Methodology (RSM). Four independent variables with the three levels wereutilized for CCD in Design-Expert®11 software trial version (Minneapolis, MN, USA) for NaOH- andHCl-assisted thermal pretreatments. Fifty-one pretreatment experiments containing three experimentsat the center point along with the duplicates of each run were planned for each chemical (NaOHand HCl) assisted thermal pretreatment by CCD. Consequently, 108 values for each response (sCOD,sRedSugar) were used in the optimization of each chemical-assisted pretreatment processes.
Results of experiments were modeled and acquired regression models were assessed by theanalysis of variance (ANOVA), regression coefficients along with the p- and F- values. The qualityof models was concluded via the coefficient of determination (R2) and an adjusted determinationcoefficient (adj-R2). With the help of the obtained model equations, optimizations of chemical-assistedthermal pretreatment processes were performed by using maximization and minimization criteria forindependent and dependent variables [3,30]. The goal settings of the variables have been adjusted byusing the plus (+) symbols in the module of optimization of a Design-Expert® software program forprocess optimization. The significance of the goals was chosen as (+++++), the highest, for all variablesin software. Design-Expert® software solved all goals for all variables to obtain the desirabilityfunction. The optimization module investigated the merging of independent variable values that meetthe demands placed on each of the dependent variables. The targets were chosen as maximum sSugarand sCOD production, and optimizations were performed for economical process conditions alongwith the high sSugar and sCOD production.
2.3. Biochemical Methane Potential (BMP)
The impact of chemical-assisted thermal pretreatment was also evaluated by a BMP test. The BMPtest according to Carrère et al. (2009) and Us and Perendeci (2012) [3,31] was accomplished. Raw andpretreated FVHW, micro and macro nutrients, anaerobic seed sludge along with the buffer solutionwere incubated at mesophilic temperature (35 C). Seed sludge was obtained from a wastewater
32
Molecules 2020, 25, 500
treatment plant’s anaerobic digester unit in Antalya, Turkey. The substrate-to-seed ratio in every reactorwas 0.5 (gVS/gVS for samples). After adding the sample, seed sludge, necessary nutrients, and buffersolution to the reactors, volume was set to 400 mL by adding deionized water. pH was set to neutral,and reactors were flushed with N2/CO2 (70%/30%) gas mixture to provide an anaerobic environment.Triplicate BMP tests were done for all pretreated samples, raw waste, and seed sludge control. BMP testsended after the 30 days. During fermentation, CH4 and CO2 components formed in the BMP reactorswere detected by Varian CP-4900 Micro-Gas Chromatography (Micro-GC) (Agilent Tech., Santa Clara,USA). Varian CP-4900 was supplied with a thermal conductivity detector (online-TCD) and a 10 mPPQ column. Injector and column temperatures in Micro-GC were 110 C and 70 C, respectively.High purity grade helium gas was used as a mobile phase with a flow rate of 25 mL/min. For measuringtotal gas volume, a gas-liquid displacement device was used filled with a saturated pH 1 acidic saltsolution prepared according to Standart Method 2720 [18]. The amount of methane produced fromseed sludge used for BMP tests was calculated as mLCH4/gVS and then this value was subtractedfrom the methane amount produced in reactors to normalize the produced methane amount.
2.4. Surface Properties and Bond Structure
Scanning electron microscopy (SEM) was utilized to evaluate microstructural changes on thesurface of wastes after the application of chemical-assisted thermal pretreatments. Raw and pretreatedFVHW were lyophilized and coated with gold-palladium for 120 seconds under 18 mA vacuum andsamples were examined by SEM with a Zeiss Leo 1430 electron microscope (ZEISS International,Oberkochen, Germany) at a voltage of 15 kV.
To investigate the impacts of thermochemical pretreatment on waste structure molecular-bondcharacterization, samples were examined by an FTIR-Varian 1000 Scimitar series FTIR spectrometer(Agilent Tech., Santa Clara, USA). Samples were lyophilized and pelletized with KBr before analyses.Measurements were performed in 500 cm−1 and 4000 cm−1 wavelength range with a spectral resolutionof 4 cm−1 and with 16 scans per sample.
3. Results and Discussion
3.1. Impacts of Chemical Assisted Thermal Pretreatments
High carbohydrate content as cellulose and hemicelluloses was obtained as 56.86% from the FVHW(Table 2). Carbon content (C%) of FVHW from the elemental analysis was found to be 34.16% (49.1% VSbasis). The analysis results suggested that FVHW is a suitable waste substrate for methane production.
33
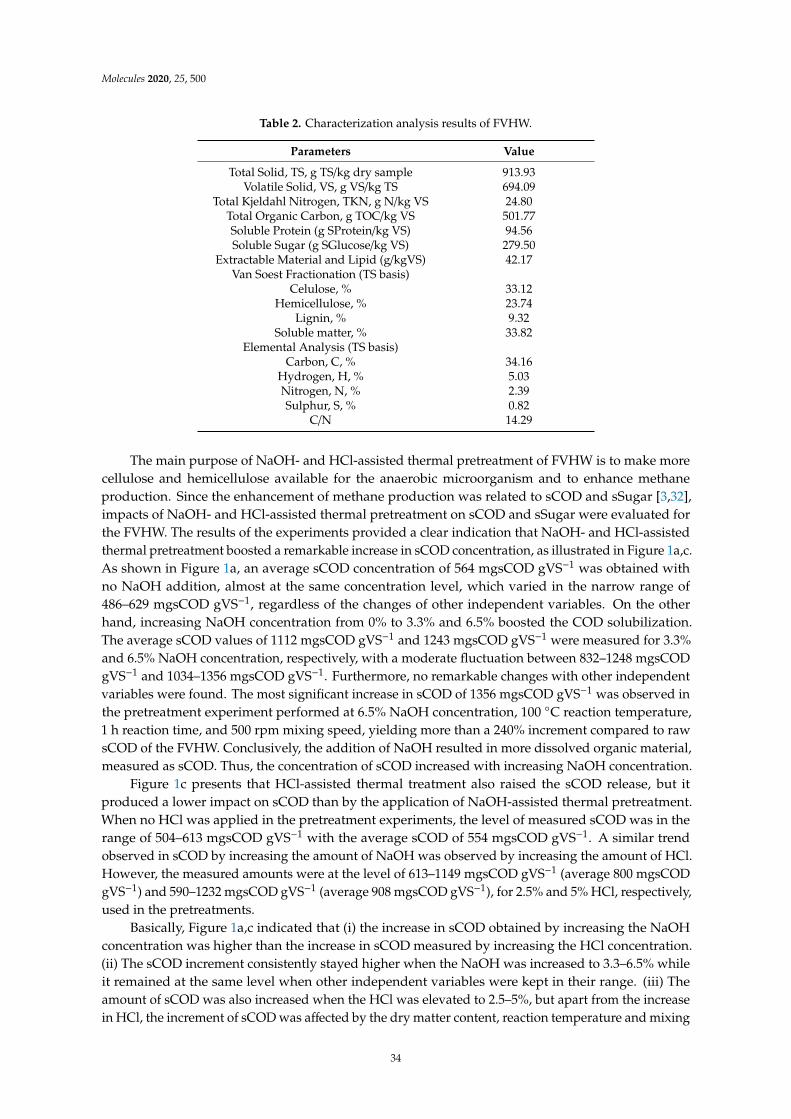
Molecules 2020, 25, 500
Table 2. Characterization analysis results of FVHW.
Parameters Value
Total Solid, TS, g TS/kg dry sample 913.93Volatile Solid, VS, g VS/kg TS 694.09
Total Kjeldahl Nitrogen, TKN, g N/kg VS 24.80Total Organic Carbon, g TOC/kg VS 501.77Soluble Protein (g SProtein/kg VS) 94.56Soluble Sugar (g SGlucose/kg VS) 279.50
Extractable Material and Lipid (g/kgVS) 42.17Van Soest Fractionation (TS basis)
Celulose, % 33.12Hemicellulose, % 23.74
Lignin, % 9.32Soluble matter, % 33.82
Elemental Analysis (TS basis)Carbon, C, % 34.16
Hydrogen, H, % 5.03Nitrogen, N, % 2.39Sulphur, S, % 0.82
C/N 14.29
The main purpose of NaOH- and HCl-assisted thermal pretreatment of FVHW is to make morecellulose and hemicellulose available for the anaerobic microorganism and to enhance methaneproduction. Since the enhancement of methane production was related to sCOD and sSugar [3,32],impacts of NaOH- and HCl-assisted thermal pretreatment on sCOD and sSugar were evaluated forthe FVHW. The results of the experiments provided a clear indication that NaOH- and HCl-assistedthermal pretreatment boosted a remarkable increase in sCOD concentration, as illustrated in Figure 1a,c.As shown in Figure 1a, an average sCOD concentration of 564 mgsCOD gVS−1 was obtained withno NaOH addition, almost at the same concentration level, which varied in the narrow range of486–629 mgsCOD gVS−1, regardless of the changes of other independent variables. On the otherhand, increasing NaOH concentration from 0% to 3.3% and 6.5% boosted the COD solubilization.The average sCOD values of 1112 mgsCOD gVS−1 and 1243 mgsCOD gVS−1 were measured for 3.3%and 6.5% NaOH concentration, respectively, with a moderate fluctuation between 832–1248 mgsCODgVS−1 and 1034–1356 mgsCOD gVS−1. Furthermore, no remarkable changes with other independentvariables were found. The most significant increase in sCOD of 1356 mgsCOD gVS−1 was observed inthe pretreatment experiment performed at 6.5% NaOH concentration, 100 C reaction temperature,1 h reaction time, and 500 rpm mixing speed, yielding more than a 240% increment compared to rawsCOD of the FVHW. Conclusively, the addition of NaOH resulted in more dissolved organic material,measured as sCOD. Thus, the concentration of sCOD increased with increasing NaOH concentration.
Figure 1c presents that HCl-assisted thermal treatment also raised the sCOD release, but itproduced a lower impact on sCOD than by the application of NaOH-assisted thermal pretreatment.When no HCl was applied in the pretreatment experiments, the level of measured sCOD was in therange of 504–613 mgsCOD gVS−1 with the average sCOD of 554 mgsCOD gVS−1. A similar trendobserved in sCOD by increasing the amount of NaOH was observed by increasing the amount of HCl.However, the measured amounts were at the level of 613–1149 mgsCOD gVS−1 (average 800 mgsCODgVS−1) and 590–1232 mgsCOD gVS−1 (average 908 mgsCOD gVS−1), for 2.5% and 5% HCl, respectively,used in the pretreatments.
Basically, Figure 1a,c indicated that (i) the increase in sCOD obtained by increasing the NaOHconcentration was higher than the increase in sCOD measured by increasing the HCl concentration.(ii) The sCOD increment consistently stayed higher when the NaOH was increased to 3.3–6.5% whileit remained at the same level when other independent variables were kept in their range. (iii) Theamount of sCOD was also increased when the HCl was elevated to 2.5–5%, but apart from the increasein HCl, the increment of sCOD was affected by the dry matter content, reaction temperature and mixing
34
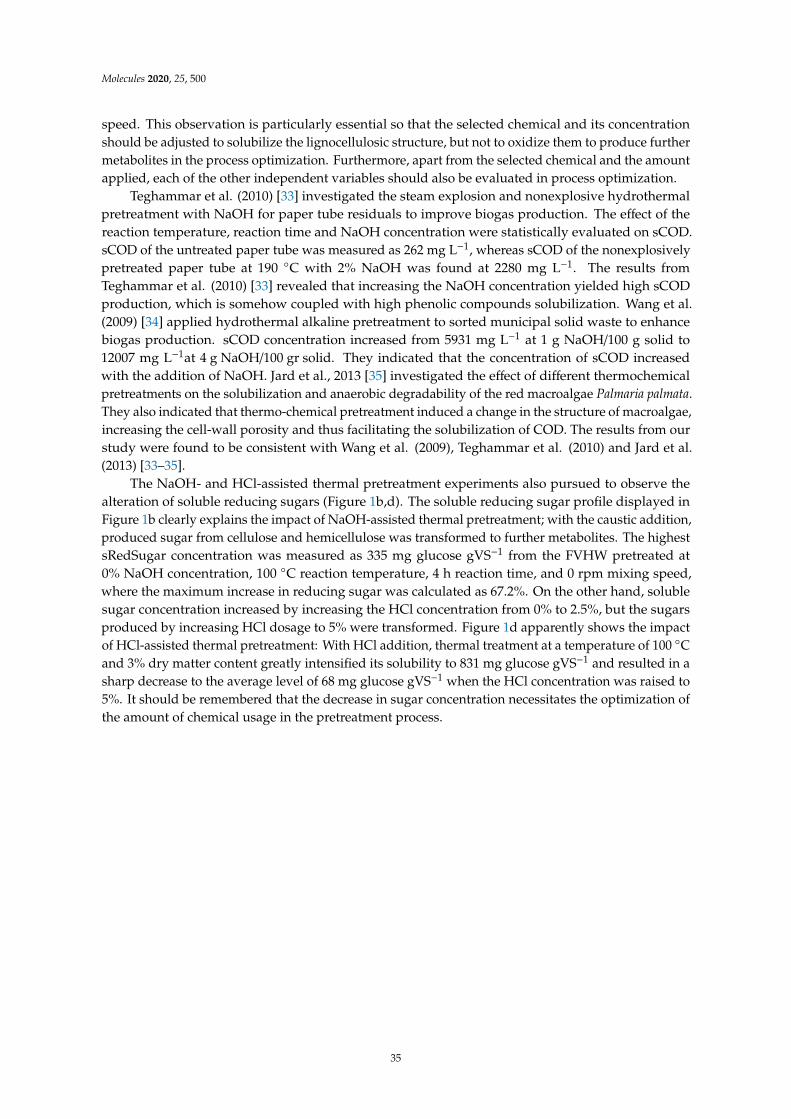
Molecules 2020, 25, 500
speed. This observation is particularly essential so that the selected chemical and its concentrationshould be adjusted to solubilize the lignocellulosic structure, but not to oxidize them to produce furthermetabolites in the process optimization. Furthermore, apart from the selected chemical and the amountapplied, each of the other independent variables should also be evaluated in process optimization.
Teghammar et al. (2010) [33] investigated the steam explosion and nonexplosive hydrothermalpretreatment with NaOH for paper tube residuals to improve biogas production. The effect of thereaction temperature, reaction time and NaOH concentration were statistically evaluated on sCOD.sCOD of the untreated paper tube was measured as 262 mg L−1, whereas sCOD of the nonexplosivelypretreated paper tube at 190 C with 2% NaOH was found at 2280 mg L−1. The results fromTeghammar et al. (2010) [33] revealed that increasing the NaOH concentration yielded high sCODproduction, which is somehow coupled with high phenolic compounds solubilization. Wang et al.(2009) [34] applied hydrothermal alkaline pretreatment to sorted municipal solid waste to enhancebiogas production. sCOD concentration increased from 5931 mg L−1 at 1 g NaOH/100 g solid to12007 mg L−1at 4 g NaOH/100 gr solid. They indicated that the concentration of sCOD increasedwith the addition of NaOH. Jard et al., 2013 [35] investigated the effect of different thermochemicalpretreatments on the solubilization and anaerobic degradability of the red macroalgae Palmaria palmata.They also indicated that thermo-chemical pretreatment induced a change in the structure of macroalgae,increasing the cell-wall porosity and thus facilitating the solubilization of COD. The results from ourstudy were found to be consistent with Wang et al. (2009), Teghammar et al. (2010) and Jard et al.(2013) [33–35].
The NaOH- and HCl-assisted thermal pretreatment experiments also pursued to observe thealteration of soluble reducing sugars (Figure 1b,d). The soluble reducing sugar profile displayed inFigure 1b clearly explains the impact of NaOH-assisted thermal pretreatment; with the caustic addition,produced sugar from cellulose and hemicellulose was transformed to further metabolites. The highestsRedSugar concentration was measured as 335 mg glucose gVS−1 from the FVHW pretreated at0% NaOH concentration, 100 C reaction temperature, 4 h reaction time, and 0 rpm mixing speed,where the maximum increase in reducing sugar was calculated as 67.2%. On the other hand, solublesugar concentration increased by increasing the HCl concentration from 0% to 2.5%, but the sugarsproduced by increasing HCl dosage to 5% were transformed. Figure 1d apparently shows the impactof HCl-assisted thermal pretreatment: With HCl addition, thermal treatment at a temperature of 100 Cand 3% dry matter content greatly intensified its solubility to 831 mg glucose gVS−1 and resulted in asharp decrease to the average level of 68 mg glucose gVS−1 when the HCl concentration was raised to5%. It should be remembered that the decrease in sugar concentration necessitates the optimization ofthe amount of chemical usage in the pretreatment process.
35
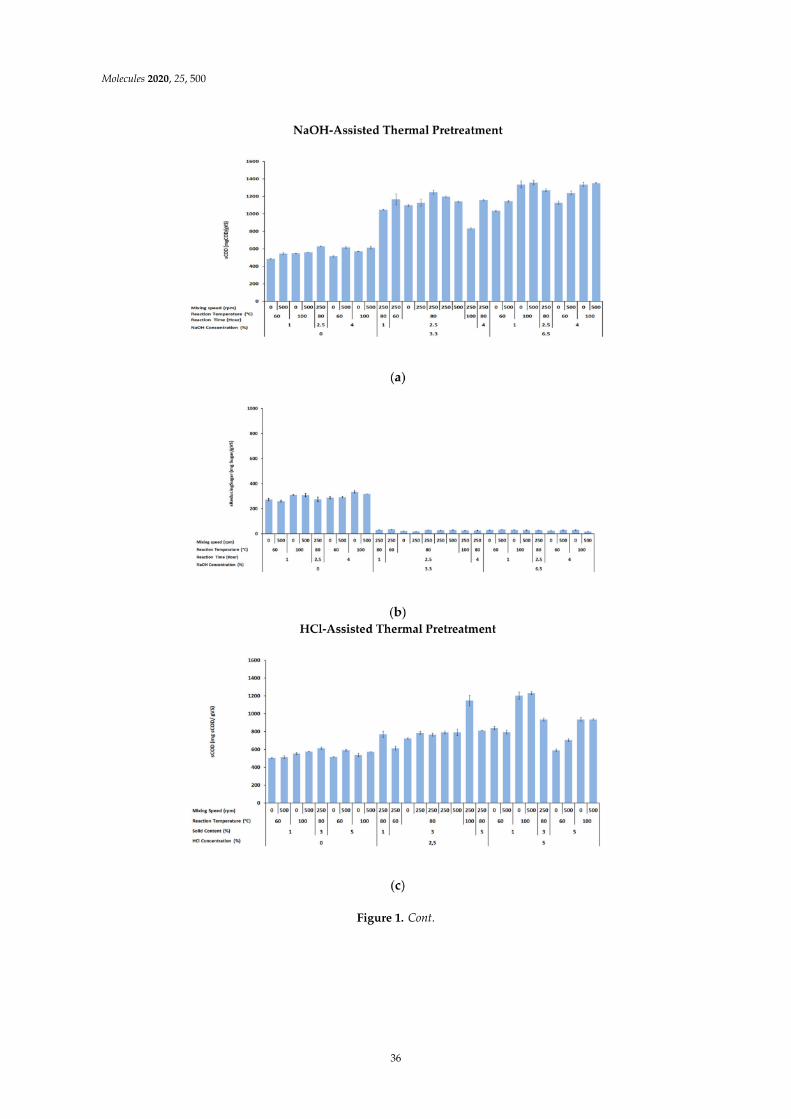
Molecules 2020, 25, 500
Figure 1. Cont.
36
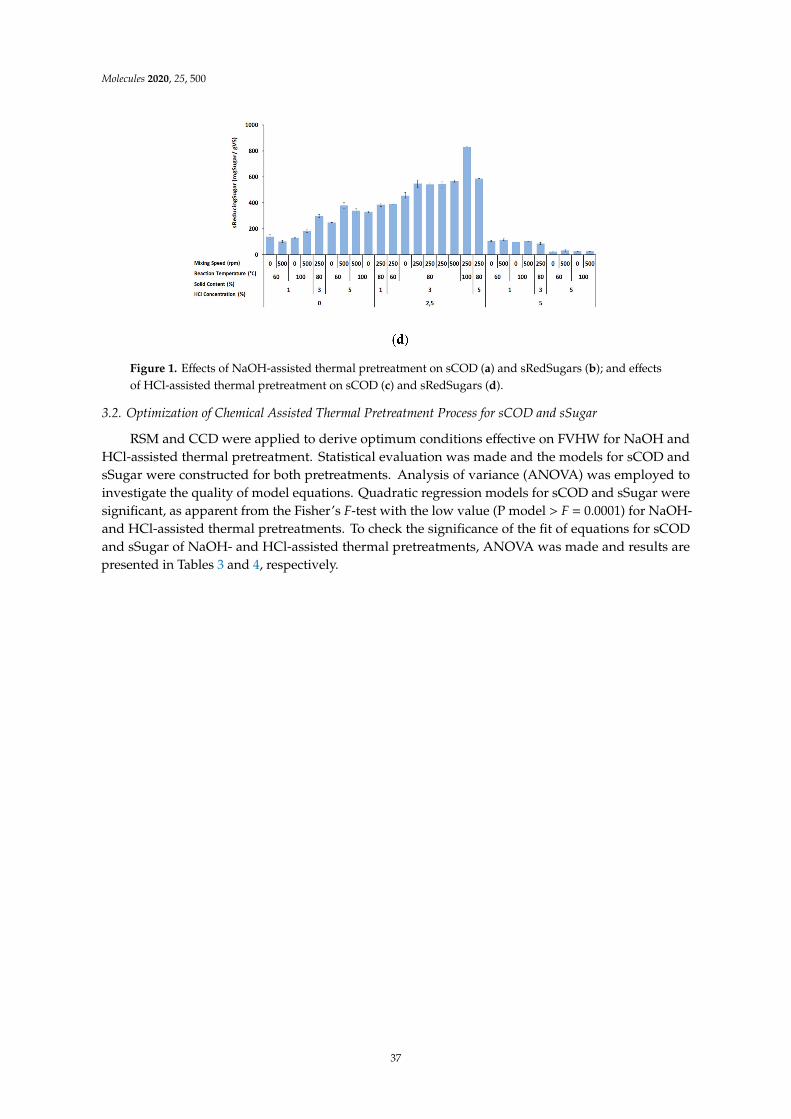
Molecules 2020, 25, 500
Figure 1. Effects of NaOH-assisted thermal pretreatment on sCOD (a) and sRedSugars (b); and effectsof HCl-assisted thermal pretreatment on sCOD (c) and sRedSugars (d).
3.2. Optimization of Chemical Assisted Thermal Pretreatment Process for sCOD and sSugar
RSM and CCD were applied to derive optimum conditions effective on FVHW for NaOH andHCl-assisted thermal pretreatment. Statistical evaluation was made and the models for sCOD andsSugar were constructed for both pretreatments. Analysis of variance (ANOVA) was employed toinvestigate the quality of model equations. Quadratic regression models for sCOD and sSugar weresignificant, as apparent from the Fisher’s F-test with the low value (P model > F = 0.0001) for NaOH-and HCl-assisted thermal pretreatments. To check the significance of the fit of equations for sCODand sSugar of NaOH- and HCl-assisted thermal pretreatments, ANOVA was made and results arepresented in Tables 3 and 4, respectively.
37
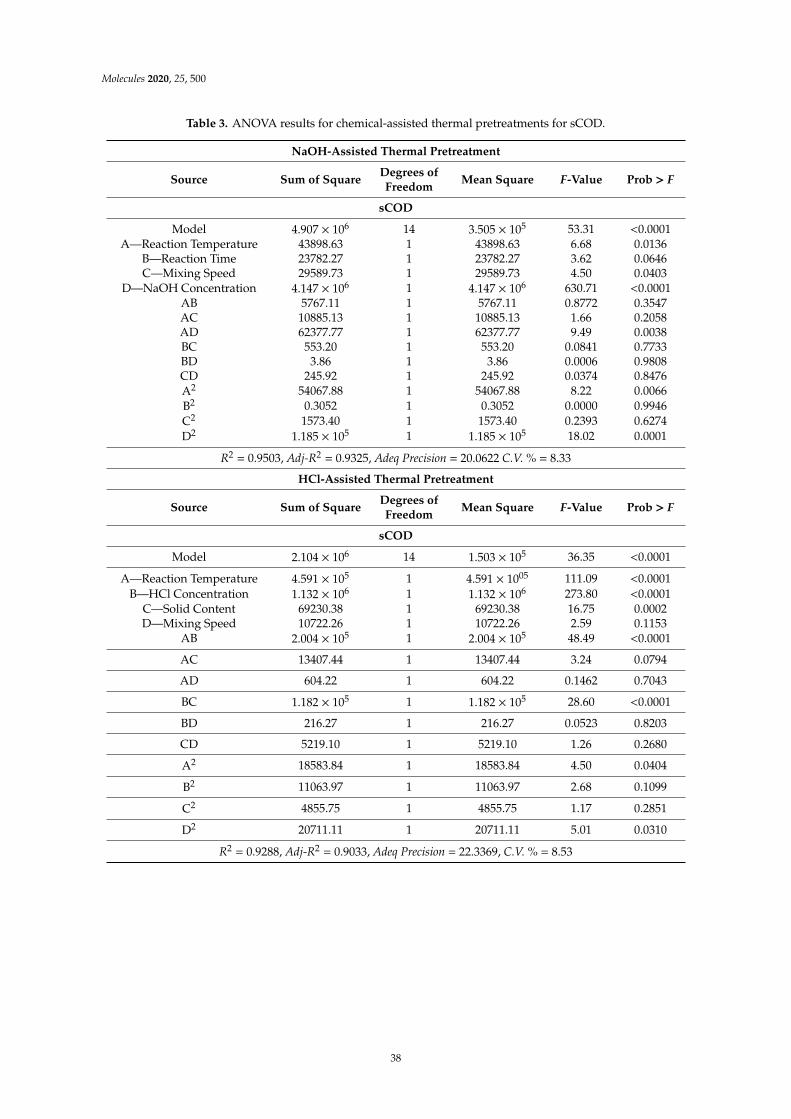
Molecules 2020, 25, 500
Table 3. ANOVA results for chemical-assisted thermal pretreatments for sCOD.
NaOH-Assisted Thermal Pretreatment
Source Sum of Square Degrees ofFreedom Mean Square F-Value Prob > F
sCOD
Model 4.907 × 10⁶ 14 3.505 × 10⁵ 53.31 <0.0001A—Reaction Temperature 43898.63 1 43898.63 6.68 0.0136
B—Reaction Time 23782.27 1 23782.27 3.62 0.0646C—Mixing Speed 29589.73 1 29589.73 4.50 0.0403
D—NaOH Concentration 4.147 × 10⁶ 1 4.147 × 10⁶ 630.71 <0.0001AB 5767.11 1 5767.11 0.8772 0.3547AC 10885.13 1 10885.13 1.66 0.2058AD 62377.77 1 62377.77 9.49 0.0038BC 553.20 1 553.20 0.0841 0.7733BD 3.86 1 3.86 0.0006 0.9808CD 245.92 1 245.92 0.0374 0.8476A2 54067.88 1 54067.88 8.22 0.0066B2 0.3052 1 0.3052 0.0000 0.9946C2 1573.40 1 1573.40 0.2393 0.6274D2 1.185 × 10⁵ 1 1.185 × 10⁵ 18.02 0.0001
R2 = 0.9503, Adj-R2 = 0.9325, Adeq Precision = 20.0622 C.V. % = 8.33
HCl-Assisted Thermal Pretreatment
Source Sum of Square Degrees ofFreedom Mean Square F-Value Prob > F
sCOD
Model 2.104 × 10⁶ 14 1.503 × 10⁵ 36.35 <0.0001
A—Reaction Temperature 4.591 × 10⁵ 1 4.591 × 1005 111.09 <0.0001B—HCl Concentration 1.132 × 10⁶ 1 1.132 × 10⁶ 273.80 <0.0001
C—Solid Content 69230.38 1 69230.38 16.75 0.0002D—Mixing Speed 10722.26 1 10722.26 2.59 0.1153
AB 2.004 × 10⁵ 1 2.004 × 10⁵ 48.49 <0.0001
AC 13407.44 1 13407.44 3.24 0.0794
AD 604.22 1 604.22 0.1462 0.7043
BC 1.182 × 10⁵ 1 1.182 × 10⁵ 28.60 <0.0001
BD 216.27 1 216.27 0.0523 0.8203
CD 5219.10 1 5219.10 1.26 0.2680
A2 18583.84 1 18583.84 4.50 0.0404
B2 11063.97 1 11063.97 2.68 0.1099
C2 4855.75 1 4855.75 1.17 0.2851
D2 20711.11 1 20711.11 5.01 0.0310
R2 = 0.9288, Adj-R2 = 0.9033, Adeq Precision = 22.3369, C.V. % = 8.53
38
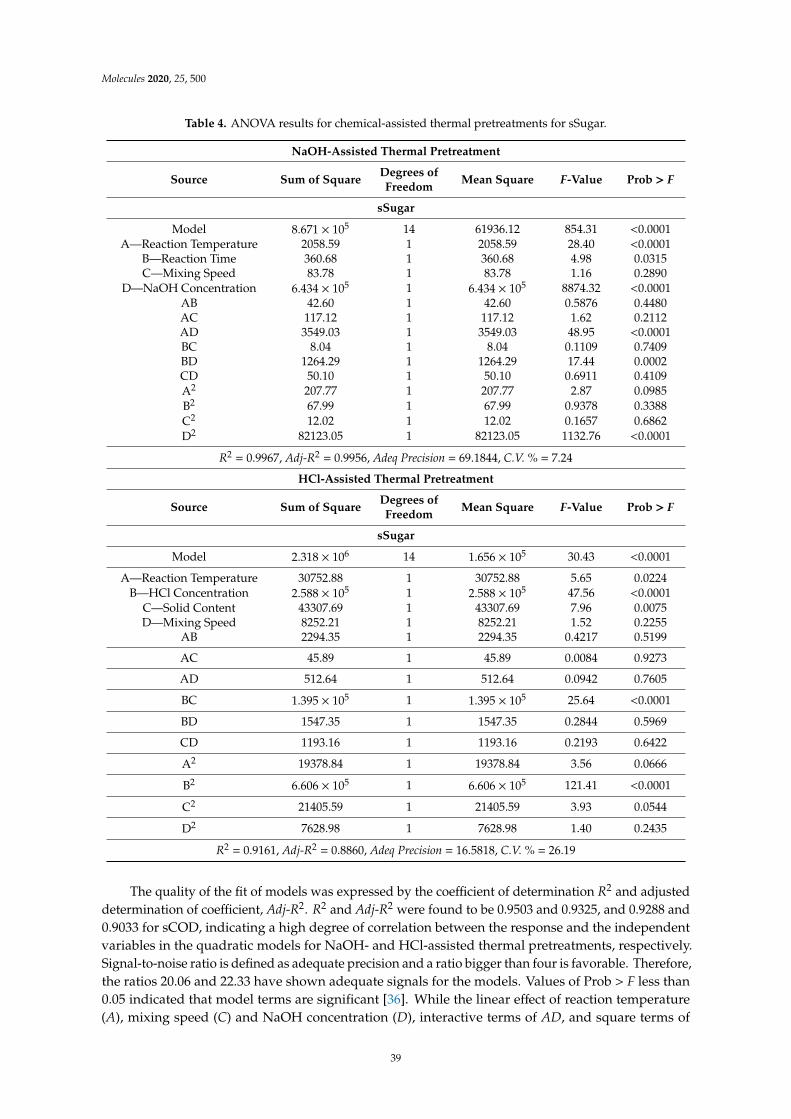
Molecules 2020, 25, 500
Table 4. ANOVA results for chemical-assisted thermal pretreatments for sSugar.
NaOH-Assisted Thermal Pretreatment
Source Sum of Square Degrees ofFreedom Mean Square F-Value Prob > F
sSugar
Model 8.671 × 10⁵ 14 61936.12 854.31 <0.0001A—Reaction Temperature 2058.59 1 2058.59 28.40 <0.0001
B—Reaction Time 360.68 1 360.68 4.98 0.0315C—Mixing Speed 83.78 1 83.78 1.16 0.2890
D—NaOH Concentration 6.434 × 10⁵ 1 6.434 × 10⁵ 8874.32 <0.0001AB 42.60 1 42.60 0.5876 0.4480AC 117.12 1 117.12 1.62 0.2112AD 3549.03 1 3549.03 48.95 <0.0001BC 8.04 1 8.04 0.1109 0.7409BD 1264.29 1 1264.29 17.44 0.0002CD 50.10 1 50.10 0.6911 0.4109A2 207.77 1 207.77 2.87 0.0985B2 67.99 1 67.99 0.9378 0.3388C2 12.02 1 12.02 0.1657 0.6862D2 82123.05 1 82123.05 1132.76 <0.0001
R2 = 0.9967, Adj-R2 = 0.9956, Adeq Precision = 69.1844, C.V. % = 7.24
HCl-Assisted Thermal Pretreatment
Source Sum of Square Degrees ofFreedom Mean Square F-Value Prob > F
sSugar
Model 2.318 × 10⁶ 14 1.656 × 10⁵ 30.43 <0.0001
A—Reaction Temperature 30752.88 1 30752.88 5.65 0.0224B—HCl Concentration 2.588 × 10⁵ 1 2.588 × 10⁵ 47.56 <0.0001
C—Solid Content 43307.69 1 43307.69 7.96 0.0075D—Mixing Speed 8252.21 1 8252.21 1.52 0.2255
AB 2294.35 1 2294.35 0.4217 0.5199
AC 45.89 1 45.89 0.0084 0.9273
AD 512.64 1 512.64 0.0942 0.7605
BC 1.395 × 10⁵ 1 1.395 × 10⁵ 25.64 <0.0001
BD 1547.35 1 1547.35 0.2844 0.5969
CD 1193.16 1 1193.16 0.2193 0.6422
A2 19378.84 1 19378.84 3.56 0.0666
B2 6.606 × 10⁵ 1 6.606 × 10⁵ 121.41 <0.0001
C2 21405.59 1 21405.59 3.93 0.0544
D2 7628.98 1 7628.98 1.40 0.2435
R2 = 0.9161, Adj-R2 = 0.8860, Adeq Precision = 16.5818, C.V. % = 26.19
The quality of the fit of models was expressed by the coefficient of determination R2 and adjusteddetermination of coefficient, Adj-R2. R2 and Adj-R2 were found to be 0.9503 and 0.9325, and 0.9288 and0.9033 for sCOD, indicating a high degree of correlation between the response and the independentvariables in the quadratic models for NaOH- and HCl-assisted thermal pretreatments, respectively.Signal-to-noise ratio is defined as adequate precision and a ratio bigger than four is favorable. Therefore,the ratios 20.06 and 22.33 have shown adequate signals for the models. Values of Prob > F less than0.05 indicated that model terms are significant [36]. While the linear effect of reaction temperature(A), mixing speed (C) and NaOH concentration (D), interactive terms of AD, and square terms of
39
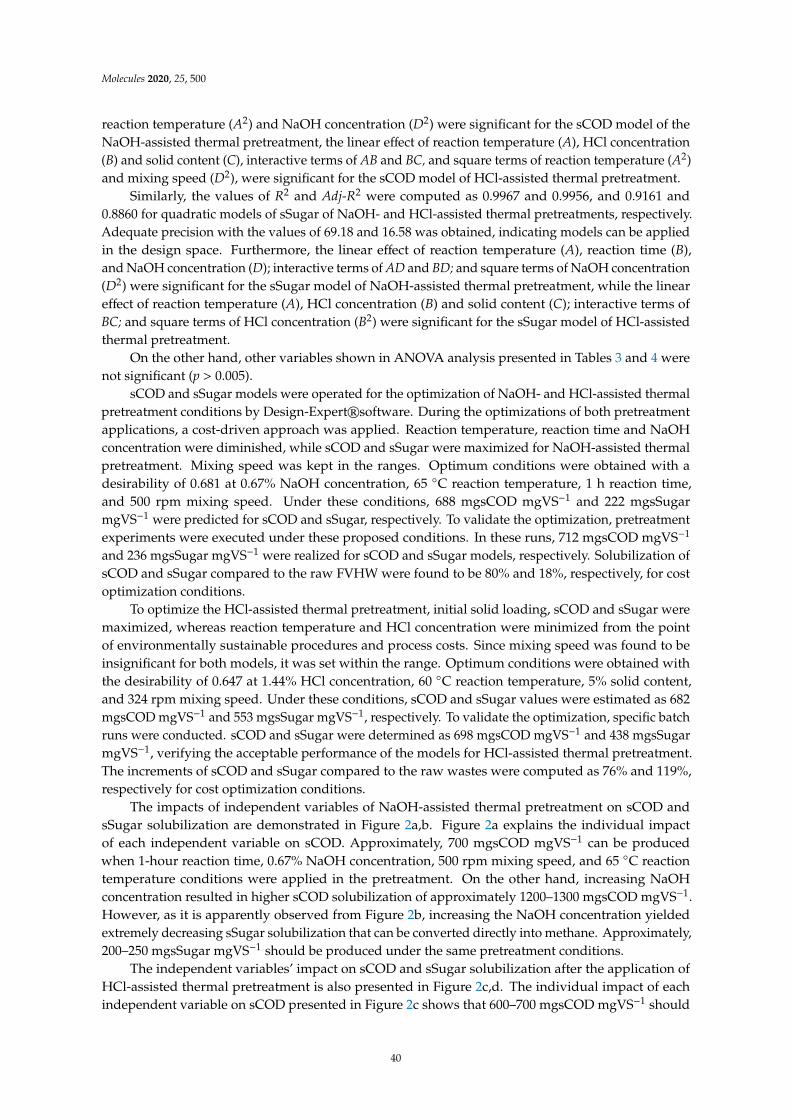
Molecules 2020, 25, 500
reaction temperature (A2) and NaOH concentration (D2) were significant for the sCOD model of theNaOH-assisted thermal pretreatment, the linear effect of reaction temperature (A), HCl concentration(B) and solid content (C), interactive terms of AB and BC, and square terms of reaction temperature (A2)and mixing speed (D2), were significant for the sCOD model of HCl-assisted thermal pretreatment.
Similarly, the values of R2 and Adj-R2 were computed as 0.9967 and 0.9956, and 0.9161 and0.8860 for quadratic models of sSugar of NaOH- and HCl-assisted thermal pretreatments, respectively.Adequate precision with the values of 69.18 and 16.58 was obtained, indicating models can be appliedin the design space. Furthermore, the linear effect of reaction temperature (A), reaction time (B),and NaOH concentration (D); interactive terms of AD and BD; and square terms of NaOH concentration(D2) were significant for the sSugar model of NaOH-assisted thermal pretreatment, while the lineareffect of reaction temperature (A), HCl concentration (B) and solid content (C); interactive terms ofBC; and square terms of HCl concentration (B2) were significant for the sSugar model of HCl-assistedthermal pretreatment.
On the other hand, other variables shown in ANOVA analysis presented in Tables 3 and 4 werenot significant (p > 0.005).
sCOD and sSugar models were operated for the optimization of NaOH- and HCl-assisted thermalpretreatment conditions by Design-Expert®software. During the optimizations of both pretreatmentapplications, a cost-driven approach was applied. Reaction temperature, reaction time and NaOHconcentration were diminished, while sCOD and sSugar were maximized for NaOH-assisted thermalpretreatment. Mixing speed was kept in the ranges. Optimum conditions were obtained with adesirability of 0.681 at 0.67% NaOH concentration, 65 C reaction temperature, 1 h reaction time,and 500 rpm mixing speed. Under these conditions, 688 mgsCOD mgVS−1 and 222 mgsSugarmgVS−1 were predicted for sCOD and sSugar, respectively. To validate the optimization, pretreatmentexperiments were executed under these proposed conditions. In these runs, 712 mgsCOD mgVS−1
and 236 mgsSugar mgVS−1 were realized for sCOD and sSugar models, respectively. Solubilization ofsCOD and sSugar compared to the raw FVHW were found to be 80% and 18%, respectively, for costoptimization conditions.
To optimize the HCl-assisted thermal pretreatment, initial solid loading, sCOD and sSugar weremaximized, whereas reaction temperature and HCl concentration were minimized from the pointof environmentally sustainable procedures and process costs. Since mixing speed was found to beinsignificant for both models, it was set within the range. Optimum conditions were obtained withthe desirability of 0.647 at 1.44% HCl concentration, 60 C reaction temperature, 5% solid content,and 324 rpm mixing speed. Under these conditions, sCOD and sSugar values were estimated as 682mgsCOD mgVS−1 and 553 mgsSugar mgVS−1, respectively. To validate the optimization, specific batchruns were conducted. sCOD and sSugar were determined as 698 mgsCOD mgVS−1 and 438 mgsSugarmgVS−1, verifying the acceptable performance of the models for HCl-assisted thermal pretreatment.The increments of sCOD and sSugar compared to the raw wastes were computed as 76% and 119%,respectively for cost optimization conditions.
The impacts of independent variables of NaOH-assisted thermal pretreatment on sCOD andsSugar solubilization are demonstrated in Figure 2a,b. Figure 2a explains the individual impactof each independent variable on sCOD. Approximately, 700 mgsCOD mgVS−1 can be producedwhen 1-hour reaction time, 0.67% NaOH concentration, 500 rpm mixing speed, and 65 C reactiontemperature conditions were applied in the pretreatment. On the other hand, increasing NaOHconcentration resulted in higher sCOD solubilization of approximately 1200–1300 mgsCOD mgVS−1.However, as it is apparently observed from Figure 2b, increasing the NaOH concentration yieldedextremely decreasing sSugar solubilization that can be converted directly into methane. Approximately,200–250 mgsSugar mgVS−1 should be produced under the same pretreatment conditions.
The independent variables’ impact on sCOD and sSugar solubilization after the application ofHCl-assisted thermal pretreatment is also presented in Figure 2c,d. The individual impact of eachindependent variable on sCOD presented in Figure 2c shows that 600–700 mgsCOD mgVS−1 should
40
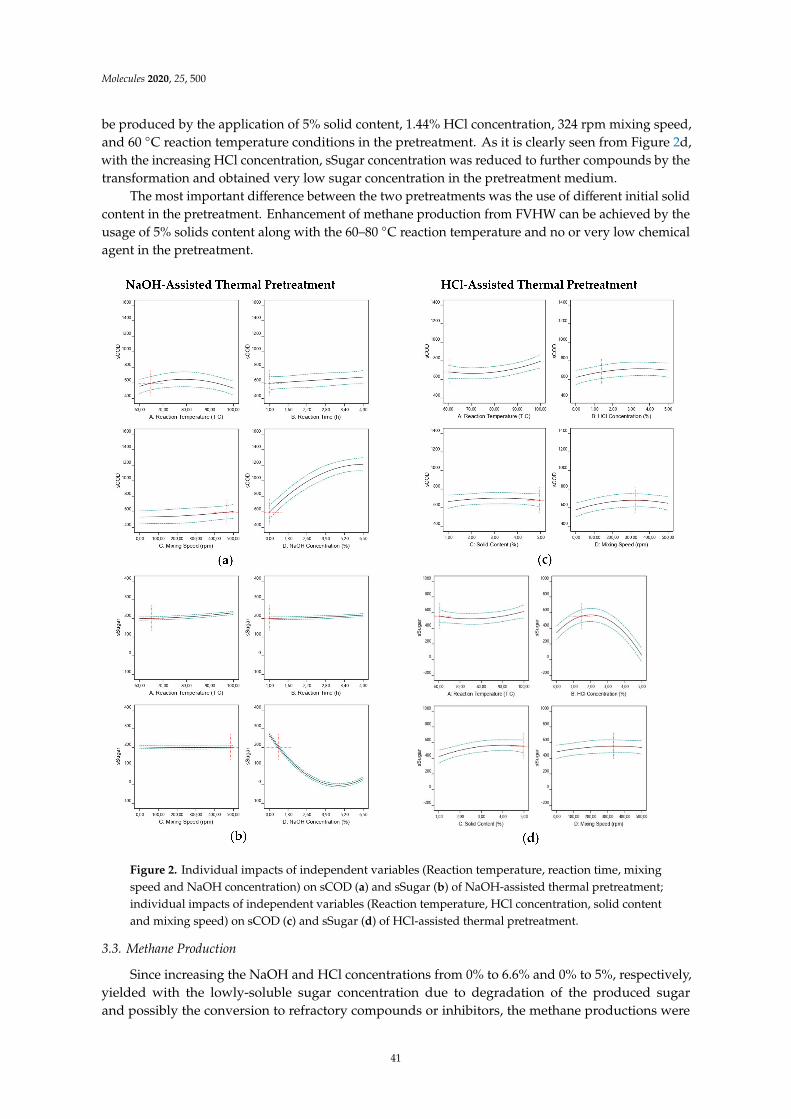
Molecules 2020, 25, 500
be produced by the application of 5% solid content, 1.44% HCl concentration, 324 rpm mixing speed,and 60 C reaction temperature conditions in the pretreatment. As it is clearly seen from Figure 2d,with the increasing HCl concentration, sSugar concentration was reduced to further compounds by thetransformation and obtained very low sugar concentration in the pretreatment medium.
The most important difference between the two pretreatments was the use of different initial solidcontent in the pretreatment. Enhancement of methane production from FVHW can be achieved by theusage of 5% solids content along with the 60–80 C reaction temperature and no or very low chemicalagent in the pretreatment.
Figure 2. Individual impacts of independent variables (Reaction temperature, reaction time, mixingspeed and NaOH concentration) on sCOD (a) and sSugar (b) of NaOH-assisted thermal pretreatment;individual impacts of independent variables (Reaction temperature, HCl concentration, solid contentand mixing speed) on sCOD (c) and sSugar (d) of HCl-assisted thermal pretreatment.
3.3. Methane Production
Since increasing the NaOH and HCl concentrations from 0% to 6.6% and 0% to 5%, respectively,yielded with the lowly-soluble sugar concentration due to degradation of the produced sugarand possibly the conversion to refractory compounds or inhibitors, the methane productions were
41
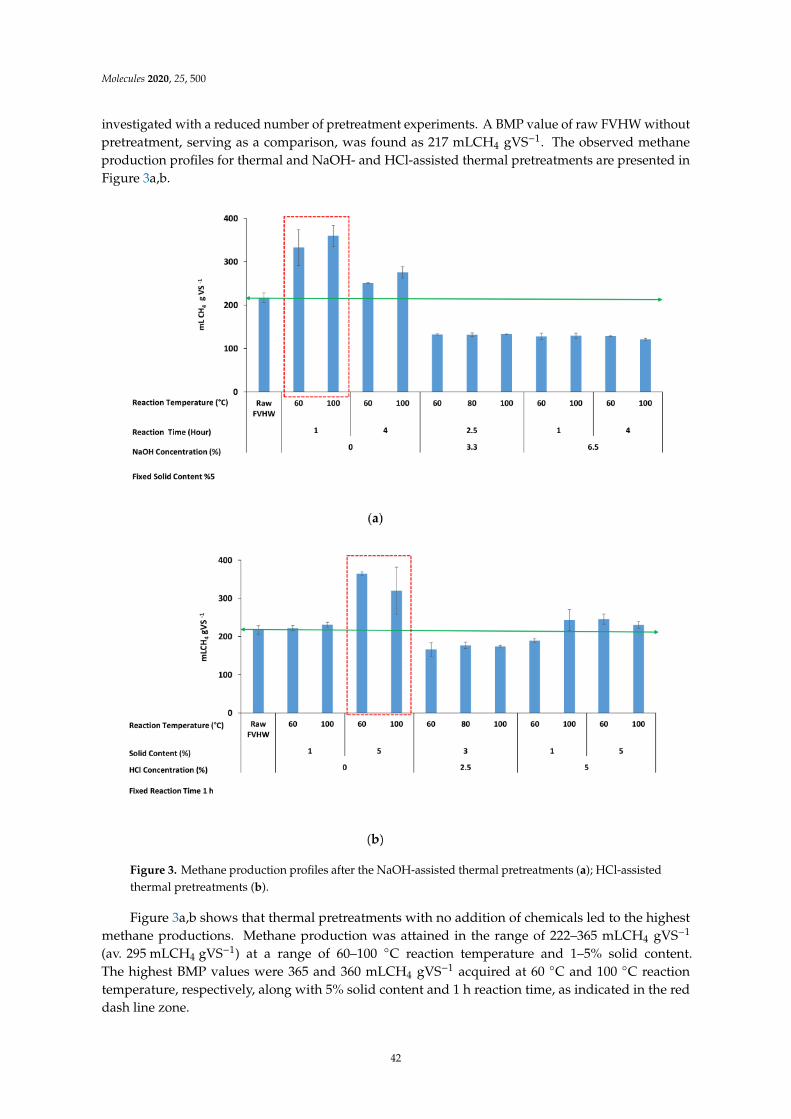
Molecules 2020, 25, 500
investigated with a reduced number of pretreatment experiments. A BMP value of raw FVHW withoutpretreatment, serving as a comparison, was found as 217 mLCH4 gVS−1. The observed methaneproduction profiles for thermal and NaOH- and HCl-assisted thermal pretreatments are presented inFigure 3a,b.
Figure 3. Methane production profiles after the NaOH-assisted thermal pretreatments (a); HCl-assistedthermal pretreatments (b).
Figure 3a,b shows that thermal pretreatments with no addition of chemicals led to the highestmethane productions. Methane production was attained in the range of 222–365 mLCH4 gVS−1
(av. 295 mLCH4 gVS−1) at a range of 60–100 C reaction temperature and 1–5% solid content.The highest BMP values were 365 and 360 mLCH4 gVS−1 acquired at 60 C and 100 C reactiontemperature, respectively, along with 5% solid content and 1 h reaction time, as indicated in the reddash line zone.
42

Molecules 2020, 25, 500
The lowest BMP value (121 mLCH4 gVS−1) was measured from the FVHW pretreated at a NaOHconcentration of 6.5%, a reaction temperature of 100 C, and a reaction time of 4 h. By adding NaOHas 3.3% and 6.5% concentrations, the production of methane decreased from 251–360 mLCH4 gVS−1
(av. 305 mLCH4 gVS−1) without NaOH to 132–133 mLCH4 gVS−1 (av. 133 mLCH4 gVS−1) at 3.3% andfurther dropped to 121–129 mLCH4 gVS−1 (av. 127 mLCH4 gVS−1) at 6.5%. As it is easily capturedfrom Figure 3a, pretreatment experiments without NaOH showed an average of 41% enhancement inmethane production; on the other hand, an average 40% decrease was observed in methane productionwith the increased NaOH concentration. The increased concentration of NaOH resulted in low methaneproduction due to degradation of the produced sugar and possible conversion to refractory compoundsor inhibitors [37–39] or increased concentration of Na+ itself or combined effects of both. In fact, for thesake of clarity, Na+ concentration was approximately 1.8 g Na+/L in the BMP reactor, it reached 2.5 gNa+/L with the supplied NaHCO3 as a buffer in the BMP reactor for the lowest BMP obtained as121 mLCH4 gVS−1. Despite the fact that slight inhibition concentrations for Na+ are in the range of3.5–5.5 g/L [40], it may be concluded that two effects (degradation of sugar to refractory compounds orinhibitors and Na+ concentration) caused inhibition.
As for HCl-assisted thermal pretreatment, minimum methane of 166 mLCH4 gVS−1 was producedfrom the wastes pretreated at 2.5% HCl concentration, 60 C reaction temperature, and 3% solid content.As it is clearly seen from Figure 3b, methane production decreased when the HCl concentration wasincreased. However, the decrease in methane production was not at the same level as the decrease inNaOH application. Methane production decreased to an average value of 172 mLCH4 gVS−1 when theamount of HCl was increased to 2.5% and the number of solids was decreased to 3%. On the contraryto this, methane production increased to an average value of 240 mLCH4 gVS−1 with increasingsolids content to 5% and in the range of 60–100 C reaction temperature. While an average of 31%enhancement was observed in methane production in the pretreatment experiments where HCl wasnot used, an average of 21% decrease occurred in methane production when 2.5% HCl was added.
Conclusively, (i) a higher amount of methane production was obtained by the thermal applicationwithout using the chemical agent of NaOH or HCl. (ii) Although the chemical usage contributes to thehydrolysis rate of the lignocellulosic structure, the selected high dose for NaOH (3.3–6.5%) and HCl(2.5–5%) should be the probable cause of low methane production. (iii) Maximum enhancement ofmethane production was 47–68% compared to raw FVHW when 5% solid content, 1 hour reaction timeand 60–100 C reaction temperature were used in pretreatments.
Song et al. (2014) [41] examined the impacts of seven chemical pretreatments on methaneproduction from corn straw. Four acid reagents (H2SO4, HCl, H2O2, and CH3COOH) at concentrationsof 1, 2, 3, and 4% and three alkali reagents (NaOH, Ca(OH)2 and NH3.H2O) at concentrations of4, 6, 8, and 10% were applied in the pretreatments at 25 C during the 7 days. Results revealedthat acid and alkaline treatments increased methane production by approximately 10.3% to 115.4%higher yield compared to raw. This phenomenon can be explained by the fact that alkaline and acidpretreatments promote organic solubilization and increase the surface area available for enzymaticaccessibility. Monlau et al., (2012) [42] applied five thermo-chemical pretreatments by using NaOH,H2O2, Ca(OH)2, HCl, FeCl3 at 4–10 gr/100gr TS concentration along with the 30–170 C reaction timeand 1–24 h reaction time to sunflowers stalks. They found that methane potentials of pretreatedsunflower with different chemicals increased to 3–35% compared to the raw sunflower. Although cornstraw and sunflower stalks do not seem to be similar to the FVHW at first glance, the cellulose andhemicellulose contents of the sunflower are close to FVHW used in this study to make a comparison.Furthermore, the enhancement of methane production results from this study was found to be coherentwith the literature and revealed that pretreatment conditions necessitate optimization and dependon the structure and composition of lignocellulosic wastes. As a result, the selection of a wide ofrange levels of the independent variables has riveting characteristics to optimize the process in a broaddesign boundary and to evaluate the positive and negative impacts of independent variables alongwith their ranges. The results obtained from optimization in the design space have resulted in the
43
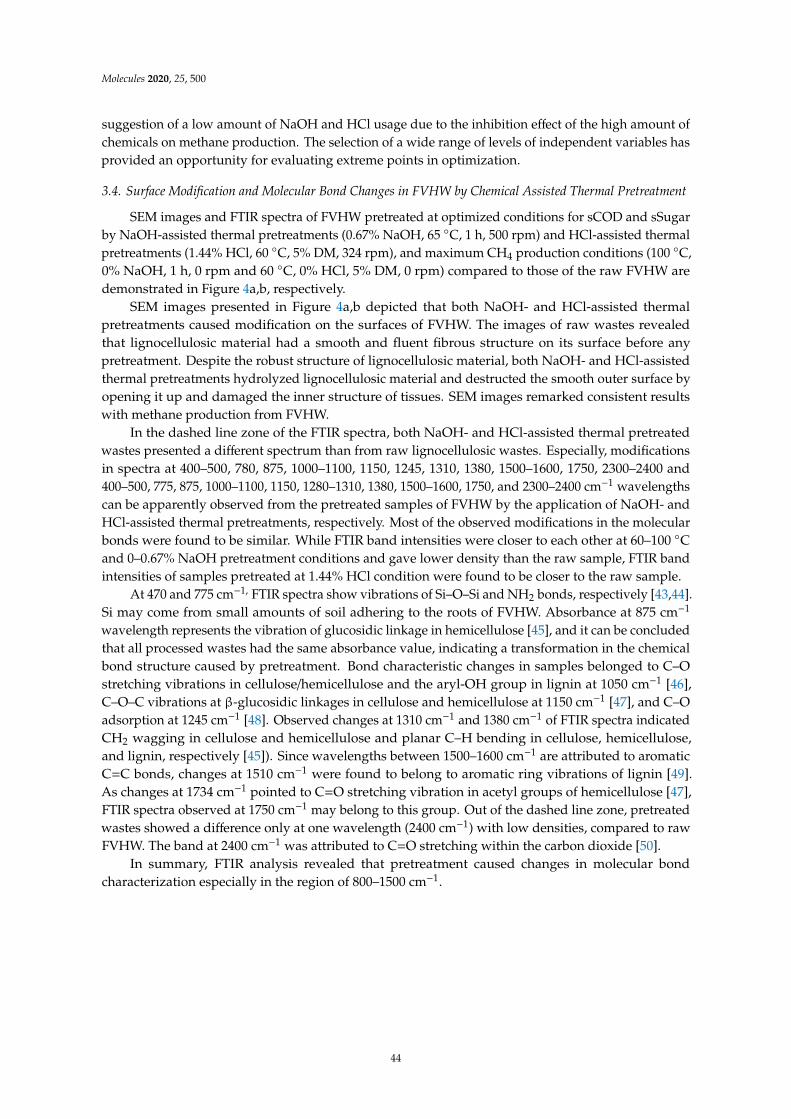
Molecules 2020, 25, 500
suggestion of a low amount of NaOH and HCl usage due to the inhibition effect of the high amount ofchemicals on methane production. The selection of a wide range of levels of independent variables hasprovided an opportunity for evaluating extreme points in optimization.
3.4. Surface Modification and Molecular Bond Changes in FVHW by Chemical Assisted Thermal Pretreatment
SEM images and FTIR spectra of FVHW pretreated at optimized conditions for sCOD and sSugarby NaOH-assisted thermal pretreatments (0.67% NaOH, 65 C, 1 h, 500 rpm) and HCl-assisted thermalpretreatments (1.44% HCl, 60 C, 5% DM, 324 rpm), and maximum CH4 production conditions (100 C,0% NaOH, 1 h, 0 rpm and 60 C, 0% HCl, 5% DM, 0 rpm) compared to those of the raw FVHW aredemonstrated in Figure 4a,b, respectively.
SEM images presented in Figure 4a,b depicted that both NaOH- and HCl-assisted thermalpretreatments caused modification on the surfaces of FVHW. The images of raw wastes revealedthat lignocellulosic material had a smooth and fluent fibrous structure on its surface before anypretreatment. Despite the robust structure of lignocellulosic material, both NaOH- and HCl-assistedthermal pretreatments hydrolyzed lignocellulosic material and destructed the smooth outer surface byopening it up and damaged the inner structure of tissues. SEM images remarked consistent resultswith methane production from FVHW.
In the dashed line zone of the FTIR spectra, both NaOH- and HCl-assisted thermal pretreatedwastes presented a different spectrum than from raw lignocellulosic wastes. Especially, modificationsin spectra at 400–500, 780, 875, 1000–1100, 1150, 1245, 1310, 1380, 1500–1600, 1750, 2300–2400 and400–500, 775, 875, 1000–1100, 1150, 1280–1310, 1380, 1500–1600, 1750, and 2300–2400 cm−1 wavelengthscan be apparently observed from the pretreated samples of FVHW by the application of NaOH- andHCl-assisted thermal pretreatments, respectively. Most of the observed modifications in the molecularbonds were found to be similar. While FTIR band intensities were closer to each other at 60–100 Cand 0–0.67% NaOH pretreatment conditions and gave lower density than the raw sample, FTIR bandintensities of samples pretreated at 1.44% HCl condition were found to be closer to the raw sample.
At 470 and 775 cm−1, FTIR spectra show vibrations of Si–O–Si and NH2 bonds, respectively [43,44].Si may come from small amounts of soil adhering to the roots of FVHW. Absorbance at 875 cm−1
wavelength represents the vibration of glucosidic linkage in hemicellulose [45], and it can be concludedthat all processed wastes had the same absorbance value, indicating a transformation in the chemicalbond structure caused by pretreatment. Bond characteristic changes in samples belonged to C–Ostretching vibrations in cellulose/hemicellulose and the aryl-OH group in lignin at 1050 cm−1 [46],C–O–C vibrations at β-glucosidic linkages in cellulose and hemicellulose at 1150 cm−1 [47], and C–Oadsorption at 1245 cm−1 [48]. Observed changes at 1310 cm−1 and 1380 cm−1 of FTIR spectra indicatedCH2 wagging in cellulose and hemicellulose and planar C–H bending in cellulose, hemicellulose,and lignin, respectively [45]). Since wavelengths between 1500–1600 cm−1 are attributed to aromaticC=C bonds, changes at 1510 cm−1 were found to belong to aromatic ring vibrations of lignin [49].As changes at 1734 cm−1 pointed to C=O stretching vibration in acetyl groups of hemicellulose [47],FTIR spectra observed at 1750 cm−1 may belong to this group. Out of the dashed line zone, pretreatedwastes showed a difference only at one wavelength (2400 cm−1) with low densities, compared to rawFVHW. The band at 2400 cm−1 was attributed to C=O stretching within the carbon dioxide [50].
In summary, FTIR analysis revealed that pretreatment caused changes in molecular bondcharacterization especially in the region of 800–1500 cm−1.
44
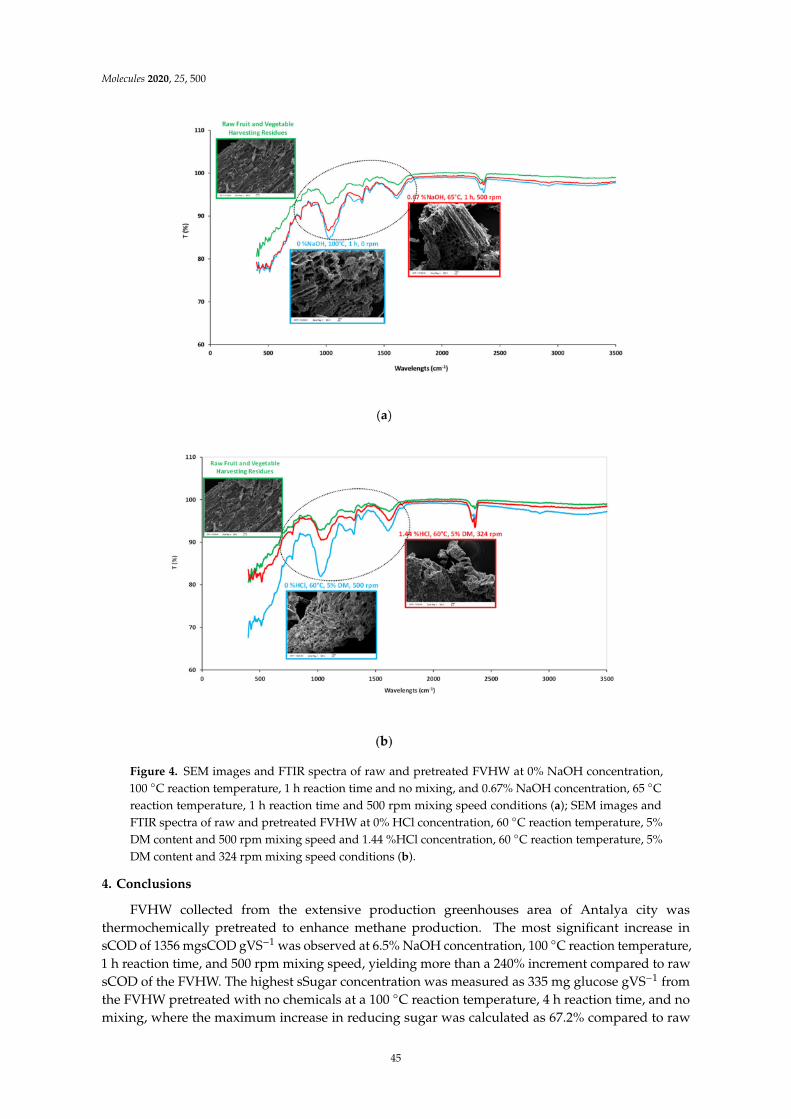
Molecules 2020, 25, 500
Figure 4. SEM images and FTIR spectra of raw and pretreated FVHW at 0% NaOH concentration,100 C reaction temperature, 1 h reaction time and no mixing, and 0.67% NaOH concentration, 65 Creaction temperature, 1 h reaction time and 500 rpm mixing speed conditions (a); SEM images andFTIR spectra of raw and pretreated FVHW at 0% HCl concentration, 60 C reaction temperature, 5%DM content and 500 rpm mixing speed and 1.44 %HCl concentration, 60 C reaction temperature, 5%DM content and 324 rpm mixing speed conditions (b).
4. Conclusions
FVHW collected from the extensive production greenhouses area of Antalya city wasthermochemically pretreated to enhance methane production. The most significant increase insCOD of 1356 mgsCOD gVS−1 was observed at 6.5% NaOH concentration, 100 C reaction temperature,1 h reaction time, and 500 rpm mixing speed, yielding more than a 240% increment compared to rawsCOD of the FVHW. The highest sSugar concentration was measured as 335 mg glucose gVS−1 fromthe FVHW pretreated with no chemicals at a 100 C reaction temperature, 4 h reaction time, and nomixing, where the maximum increase in reducing sugar was calculated as 67.2% compared to raw
45

Molecules 2020, 25, 500
FVHW. Increasing NaOH and HCl concentrations resulted in higher sCOD but extremely lower sSugarsolubilization. Results of sCOD and sSugar from the NaOH- and HCl-assisted thermal pretreatmentexperiments were modeled, and statistically significant regression models were developed. The mostimportant independent variables were found to be chemical concentration (as NaOH and HCl), solidcontent and reaction temperature for the pretreatment processes.
Two-hundred-and-twenty-two to 365 mLCH4 gVS−1 methane productions were obtained bythe simple thermal application without using NaOH or HCl. Maximum enhancement of methaneproduction was 47–68% compared to raw FVHW at 5% solid content, 1-hour reaction time and60–100 C reaction temperature.
The optimization of chemically-assisted thermal pretreatment processes should be done with themethane production results obtained from the BMP test. On the other hand, increasing the NaOHand HCl concentrations from 0% to 6.6% and 0% to 5%, respectively, resulted in low soluble sugarconcentrations. Furthermore, optimization in the design space suggested the use of low amounts ofNaOH and HCl due to the inhibition risk of the high amount of chemicals. In addition, BMP testsyielded to low methane production for the samples pretreated with high a amount of chemicals (NaOHand HCl). As a result, it was found that sSugar and methane production results were correlated andsSugar data can be used in optimization in a reliable way for this substrate.
Results from this comprehensive study have been encouraging that it serves information tobuild the potential application and to reduce the waste-related environmental pressure in theproduction-dense area. Gained optimization solution in the design space resulted in the suggestion ofno chemical usage due to the inhibition effect of the high amount of chemicals on methane production.The selection of a wide range of levels of independent variables provided an opportunity for evaluatingextreme points in optimization.
Author Contributions: Conceptualization, A.N.P. and H.C.; Methodology, Ü.G., L.D. and E.U.; Software, A.N.P.and E.U.; Formal Analysis, Ü.G., L.D. and E.U.; Investigation, A.N.P., H.C. Writing-Original Draft Preparation,A.N.P., and V.Y.; Writing-Review & Editing, A.N.P. and H.C. All authors have read and agreed to the publishedversion of the manuscript.
Funding: This research was funded by the Scientific and Technological Research Council of Turkey, (107Y145)under the Pia Bosphorus bilateral agreements signed by France and Turkey Governments. This study researchhas also been financed (Grant no: 2008.02.0121.024) by the Project Management Unit of Akdeniz Universityfrom Turkey.
Conflicts of Interest: The authors declare no conflict of interest.
References
1. Shanthi, M.; Rajesh, B.J.; Sivashanmugam, P. Synergistic effect of combined pretreatment in solubilizingfruits and vegetable residue for biogas production: Hydrolysis, energy assessment. Fuel 2019a, 250, 194–202.[CrossRef]
2. Available online: http://www.fao.org/faostat/en/#data/QC (accessed on 2 November 2019).3. Us, E.; Perendeci, A. Improvement of methane production from greenhouse residues: Optimization of thermal
and H2SO4 pretreatment process by experimental design. Chem. Eng. J. 2012, 181, 120–131. [CrossRef]4. Calabro, P.S.; Gori, M.; Lubello, C. European trends in greenhouses gases emissions from integrated solid
waste management. Environ. Technol. 2015, 36, 2125–2137. [CrossRef] [PubMed]5. Soltan, M.; Elsamadony, M.; Mostafa, A.; Awad, H.; Tawfik, A. Harvesting zero waste from co-digested fruit
and vegetable peels via integrated fermentation and pyrolysis processes. Environ. Sci. Pollut. Res. 2019, 26,10429–10438. [CrossRef]
6. Ceylan, R.F.; Sayin, C.; Yelboga, M.N.M.; Özalp, M.; Ilbasmis, E.; Sav, O. Land ownership and profitability ofgreenhouse production: Antalya Case. Turk. J. Agric. Food Sci. Technol. 2009, 6, 930–935. [CrossRef]
7. Dahunsi, S.O. Liquefaction of pineapple peel: Pretreatment and process optimization. Energy 2019, 185,1017–1031. [CrossRef]
46
Molecules 2020, 25, 500
8. Chandra, R.; Takeuchi, H.; Hasegaw, T. Methane production from lignocellulosic agricultural crop wastes: Areview in context to second generation of biofuel production. Renew. Sustain. Energy Rev. 2012, 16, 1462–1476.[CrossRef]
9. Chandra, R.; Takeuchi, H.; Hasegawa, T.; Kumar, R. Improving biodegradability and biogas production ofwheat straw substrates using sodium hydroxide and hydrothermal pretreatments. Energy 2012, 43, 273–282.[CrossRef]
10. Paudel, S.R.; Banjara, S.P.; Choi, O.K.; Park, K.Y.; Kim, Y.M.; Lee, J.W. Pretreatment of agricultural biomassfor anaerobic digestion: Current state and challenges. Bioresour. Technol. 2017, 245, 1194–1205. [CrossRef]
11. Sawatdeenarunat, C.; Nguyen, D.; Surendra, K.C.; Shrestha, S.; Rajendran, K.; Oechsner, H.; Xie, L.;Khanal, S.K. Anaerobic biorefinery: Current status, challenges, and opportunities. Bioresour. Technol. 2016,215, 304–313. [CrossRef]
12. Xu, N.; Liu, S.; Xin, F.; Zhou, J.; Jia, H.; Xu, J.; Jiang, M.; Dong, W. Biomethane Production from Lignocellulose:Biomass Recalcitrance and Its Impacts on Anaerobic Digestion. Front. Bioeng. Biotechnol. 2019, 7, 191.[CrossRef] [PubMed]
13. Himmel, M.E.; Ding, S.Y.; Johnson, D.K.; Adney, W.S.; Nimlos, M.R.; Brady, J.W.; Foust, T.D. Biomassrecalcitrance: Engineering plants and enzymes for biofuels production. Science 2007, 315, 804–807. [CrossRef][PubMed]
14. Shanthi, M.; Banu, J.R.; Sivashanmugam, P. Solubilization of fruits and vegetable dregs through surfactantmediated sonic disintegration: Impact on biomethane potential and energy ratio. Environ. Technol. 2019, 20,1–12. [CrossRef]
15. Perendeci, N.A.; Gökgöl, S.; Orhon, D. Impact of alkaline H2O2 pretreatment on methane generation potentialof greenhouse crop waste under anaerobic conditions. Molecules 2018, 23, 1794. [CrossRef] [PubMed]
16. Zeynali, R.; Khojastehpour, M.; Ebrahimi, -N.M. Effect of ultrasonic pre-treatment on biogas yield andspecific energy in anaerobic digestion of fruit and vegetable wholesale market wastes. Sustain. Environ. Res.2017, 27, 259–264. [CrossRef]
17. Li, Y.; Jin, Y.; Li, J.; Li, H.; Yu, Z. Effects of thermal pretreatment on the biomethane yield and hydrolysis rateof kitchen waste. Appl. Energy 2016, 172, 47–58. [CrossRef]
18. APHA. Standard Methods for the Examination of Water and Wastewater; American Public Health Association,American Water Works Association, Water Environment Federation: Washington, DC, USA, 2005.
19. Van Soest, P.J. Use of detergent in the analysis of fibrous feeds. A rapid method for the determination of fibreand lignin. J. Assoc. Off. Anal. Chem. 1963, 46, 829–835.
20. Dreywood, R. Qualitative test for carbohydrate material. Ind. Eng. Chem. Res. 1946, 18, 199. [CrossRef]21. Miller, G.L. Use of dinitrosalicylic acid reagent for determination of reducing sugar. Anal. Chem. 1959, 31,
426–428. [CrossRef]22. Lowry, O.H.; Rosebrough, N.J.; Fau, A.L.; Randall, R.J. Protein measurement with the Folin reagent. J. Biol.
Chem. 1951, 193, 265–275.23. Bridoux, G.; Dhulster, P.; Manem, J. Grease analysis on municipal wastewater treatment. Plants Tech.
Sci. Methodes 1994, 5, 257–262.24. Wang, Z.; Keshwani, D.R.; Redding, A.P.; Cheng, J.J. Sodium hydroxide pretreatment and enzymatic
hydrolysis of coastal Bermuda grass. Bioresour. Technol. 2010, 101, 3583–3585. [CrossRef] [PubMed]25. Hernández, S.J.M.; Villa, R.M.S.; Veloz, R.J.S.; Rivera, H.K.N.; González, C.R.A.; Plascencia, E.M.A.;
Trejo, E.S.R. Comparative hydrolysis and fermentation of sugarcane and agave bagasse. Bioresour. Technol.2009, 100, 1238–1245.
26. Sukumaran, R.K.; Singhania, R.R.; Mathew, G.M.; Pandey, A. Cellulase production using biomass feed stockand its application in lignocellulose saccharification for bio-ethanol production. Renew. Energy 2009, 34,421–424. [CrossRef]
27. Zhao, X.; Peng, F.; Cheng, K.; Liua, D. Enhancement of the enzymatic digestibility of sugarcane bagasse byalkali–peracetic acid pretreatment. Enzym. Microb. Technol. 2009, 44, 17–23. [CrossRef]
28. Darani, K.K.; Zoghi, A. Comparison of pretreatment strategies of sugarcane baggase: Experimental designfor citric acid production. Bioresour. Technol. 2008, 99, 9686–9993.
29. Mottet, A.; Steyer, J.P.; Deleris, S.; Vedrenne, F.; Chauzy, J.; Carrère, H. Kinetics of thermophilic batchanaerobic digestion of thermal hydrolysed waste activated sludge. Biochem. Eng. J. 2009, 46, 169–175.[CrossRef]
47
Molecules 2020, 25, 500
30. Ozay, Y.; Kokdemir, U.E.; Isik, Z.; Yılmaz, F.; Dizge, N.; Perendeci, N.A.; Mazmanci, M.A.; Yalvac, M.Optimization of electrocoagulation process and combination of anaerobic digestion for the treatment ofpistachio processing wastewater. J. Clean. Prod. 2018, 196, 42–50. [CrossRef]
31. Carrere, H.; Sialve, B.; Bernet, N. Improving pig manure conversion into biogas by thermal andthermo-chemical pretreatments. Bioresour. Technol. 2009, 100, 3690–3694. [CrossRef]
32. Bougrier, C.; Delgenes, J.P.; Carrere, H. Effects of thermal treatments on five different waste activated sludgesamples solubilization, physical properties and anaerobic digestion. Chem. Eng. J. 2008, 139, 236–244.[CrossRef]
33. Teghammar, A.; Yngvesson, J.; Lundin, M.; Taherzadeh, M.J.; Horvath, I.S. Pretreatment of paper tuberesidues for improved biogas production. Bioresour. Technol. 2010, 101, 1206–1212. [CrossRef] [PubMed]
34. Wang, H.; Wang, H.; Lu, W.; Zhao, Y. Digestibility improvement of sorted waste with alkaline hydrothermalpretreatment. Tsinghua Sci. Technol. 2009, 14, 378–382. [CrossRef]
35. Jard, G.; Dumas, C.; Delgenes, J.P.; Marfaing, H.; Sialvec, B.; Steyer, J.P.; Carrèrea, H. Effect of thermochemicalpretreatment on the solubilization and anaerobic biodegradability of the red macroalga Palmaria palmata.Biochem. Eng. J. 2013, 79, 253–258. [CrossRef]
36. Yılmaz, F.; Kökdemir, U.E.; Perendeci, N.A. Enhancement of methane production from banana harvestingresidues: Optimization of thermal-alkaline hydrogen peroxide pretreatment process by experimental design.Waste Biomass Valorization 2019, 10, 3071–3087.
37. Chen, H.; Zhang, C.; Rao, Y.; Jing, Y.; Luo, G.; Zhang, S. Methane potentials of wastewater generatedfrom hydrothermal liquefaction of rice straw: Focusing on the wastewater characteristics and microbialcommunity compositions. Biotechnol. Biofuels 2017, 10, 140. [CrossRef]
38. Pandey, A.; Larroche, C.; Dussap, C.G.; Gnansounou, E.; Khanal, S.K.; Ricke, S. Biofuels: Alternative Feedstocksand Conversion Processes for the Production of Liquid and Gaseous Biofuels, 2nd ed.; Elsevier: Amsterdam,The Netherlands, 2019.
39. Song, X.; Shi, Z.; Li, X.; Wang, X.; Ren, Y. Fate of proteins of waste activated sludge during thermal alkalipretreatment in terms of sludge protein recovery. Front. Environ. Sci. Eng. 2019, 13, 25. [CrossRef]
40. Speece, R.E. Anaerobic Biotechnology for Industrial Wastewaters; Archae Press: Nashville, TN, USA, 1996.41. Song, Z.; Yang, G.; Liu, X.; Yan, Z.; Yuan, Y.; Liao, Y. Comparison of seven chemical pretreatments of corn
straw for improving methane yield by anaerobic digestion. PLoS ONE 2014, 9, e93801. [CrossRef]42. Monlau, F.; Barakat, A.; Steyer, J.P.; Carrere, H. Comparison of seven types of thermos-chemical pretreatments
on the structural features and anaerobic digestion of sunflower stalks. Bioresour. Technol. 2012, 120, 241–247.[CrossRef]
43. Saikia, B.J.; Parthasarathy, G. Fourier Transform Infrared Spectroscopic Characterization of Kaolinite fromAssam and Meghalaya, Northeastern India. J. Mod. Phys. 2010, 01, 206–210. [CrossRef]
44. Sumayya, A.; Panicker, C.Y.; Varghese, H.T.; Harikumar, B. Vibrational spectroscopic studies and AB initioncalculations of l-glutamic acid 5-amide. Rjc Rasayanj. Chem. 2008, 1, 548–555.
45. Xu, F.; Yu, J.; Tesso, T.; Dowell, F.; Wang, D. Qualitative and quantitative analysis of lignocellulosic biomassusing infrared techniques: A mini review. Appl. Energy 2013, 104, 801–809. [CrossRef]
46. Ang, N.; Ngoh, G.C.; Seak, A.; Chua, M.; Lee, M.G. Elucidation of the effect of ionic liquid pretreatment onrice husk via structural analyses. Biotechnol. Biofuels 2012, 5, 1–10.
47. Xu, X.J.-K.; Sun, Y.-C.; Sun, R.-C. Structural and hydrolysis characteristics of cypress pretreated by ionicliquids in a microwave irradiation environment. Bioenergy Res. 2014, 7, 1305–1316. [CrossRef]
48. Fu, S.F.; Wang, F.; Yuan, X.Z.; Yanf, Z.M.; Luo, S.J.; Wang, C.S.; Guo, R.B. The thermophilic (55 C) microaerobicpretreatment of corn straw for anaerobic digestion. Bioresour. Technol. 2015, 175, 203–208. [CrossRef]
49. Sun, C.; Liu, R.; Cao, W.; Yin, R.; Mei, Y.; Zhang, L. Impacts of alkaline hydrogen peroxide pretreatment onchemical composition and biochemical methane potential of agricultural crop stalks. Energy Fuels 2015, 29,4966–4975. [CrossRef]
48

Molecules 2020, 25, 500
50. Gerakines, P.; Schutte, W.A.; Greenberg, J.M.; van Dishoeck, E.F. The infrared band strengths of H2O, COand CO2 in laboratory simulations of astrophysical ice mixtures. Astr. Astrophys. 1995, 2996, 810–818.
Sample availability: Samples of the compounds are not available from the authors.
© 2020 by the authors. Licensee MDPI, Basel, Switzerland. This article is an open accessarticle distributed under the terms and conditions of the Creative Commons Attribution(CC BY) license (http://creativecommons.org/licenses/by/4.0/).
49

molecules
Article
Occurrence of the Persistent Antimicrobial Triclosanin Microwave Pretreated and Anaerobically DigestedMunicipal Sludges under Various Process Conditions
Gokce Kor-Bicakci 1,2, Timothy Abbott 1, Emine Ubay-Cokgor 2 and Cigdem Eskicioglu 1,*1 UBC Bioreactor Technology Group, School of Engineering, University of British Columbia Okanagan
Campus, Kelowna, BC V1V 1V7, Canada; [email protected] (G.K.-B.); [email protected] (T.A.)2 Civil Engineering Faculty, Environmental Engineering Department, Istanbul Technical University, Maslak,
34469 Istanbul, Turkey; [email protected]* Correspondence: [email protected]; Tel.: +1-250-807-8544
Academic Editor: Derek J. McPheeReceived: 25 November 2019; Accepted: 10 January 2020; Published: 12 January 2020
Abstract: Treatment of emerging contaminants, such as antimicrobials, has become a priority topic forenvironmental protection. As a persistent, toxic, and bioaccumulative antimicrobial, the accumulationof triclosan (TCS) in wastewater sludge is creating a potential risk to human and ecosystem healthvia the agricultural use of biosolids. The impact of microwave (MW) pretreatment on TCS levels inmunicipal sludge is unknown. This study, for the first time, evaluated how MW pretreatment (80and 160 C) itself and together with anaerobic digestion (AD) under various sludge retention times(SRTs: 20, 12, and 6 days) and temperatures (35 and 55 C) can affect the levels of TCS in municipalsludge. TCS and its potential transformation products were analyzed with ultra-high-performanceliquid chromatography and tandem mass spectrometry. Significantly higher TCS concentrationswere detected in sludge sampled from the plant in colder compared to those in warmer temperatures.MW temperature did not have a discernible impact on TCS reduction from undigested sludge.However, AD studies indicated that compared to controls (no pretreatment), MW irradiation couldmake TCS more amenable to biodegradation (up to 46%), especially at the elevated pretreatmentand digester temperatures. At different SRTs studied, TCS levels in the thermophilic digesters wereconsiderably lower than that of in the mesophilic digesters.
Keywords: municipal sludge; anaerobic digestion; thermal pretreatment; microwave; contaminantsof emerging concern; personal care products; antimicrobial disinfectants; triclosan; ultra-highperformance liquid chromatography; tandem mass spectrometry
1. Introduction
The land application of biosolids is reported as the most sustainable, least expensive, andenvironmentally accepted disposal option for wastewater sludge management [1]. Wastewater sludgemust be stabilized before recycling to soil; for reducing environmental health risks, meeting the minimumbiosolids quality standards, and convincing public on its benefits and safety [2]. As a commonly usedsludge stabilization method, anaerobic digestion (AD) can generate stable organic residues (e.g., biosolids)from high-strength organic waste (e.g., municipal wastewater sludge) while providing economical andenvironment-friendly renewable energy resources [3]. However, the release of emerging contaminants(e.g., antimicrobials) into the environment via biosolids land application is creating potential ecologicaland human health risks. For this reason, the detection and reduction of these problematic chemicalsin sludge/biosolids has become a priority matter around the world. Although there are several studiesand surveys available in the literature regarding the occurrence, fate, and endocrine disruptive effects of
51
Molecules 2020, 25, 310
emerging contaminants in biosolids [4–6]; regulations for their occurrence in biosolids have not beenestablished yet [7,8]. The legal framework needs to be prepared and/or updated for limiting thesecompounds in biosolids/agricultural soils and preventing their transfer to the groundwater and thendrinking water bodies.
Triclosan (TCS) is a broad-spectrum antibacterial and antifungal agent that is effective against bothGram-positive and Gram-negative bacteria as well as yeasts and molds [9]. TCS is a polychlorinatedaromatic antimicrobial which is commonly used as an active ingredient in many personal care products(e.g., soaps, shower gels, shampoos, toothpastes, and cosmetics) as well as household and industrialproducts (e.g., detergents, plastics, carpets, textile products, toys, and furniture) [10]. Key physical andchemical properties of antimicrobial TCS are listed in Table 1.
Table 1. Key physical and chemical properties of triclosan.
Parameters Triclosan (TCS)
Chemical structure
Molecules 2020, 25, x 2 of 19
the world. Although there are several studies and surveys available in the literature regarding the occurrence, fate, and endocrine disruptive effects of emerging contaminants in biosolids [4–6]; regulations for their occurrence in biosolids have not been established yet [7,8]. The legal framework needs to be prepared and/or updated for limiting these compounds in biosolids/agricultural soils and preventing their transfer to the groundwater and then drinking water bodies.
Triclosan (TCS) is a broad-spectrum antibacterial and antifungal agent that is effective against both Gram-positive and Gram-negative bacteria as well as yeasts and molds [9]. TCS is a polychlorinated aromatic antimicrobial which is commonly used as an active ingredient in many personal care products (e.g., soaps, shower gels, shampoos, toothpastes, and cosmetics) as well as household and industrial products (e.g., detergents, plastics, carpets, textile products, toys, and furniture) [10]. Key physical and chemical properties of antimicrobial TCS are listed in Table 1.
Table 1. Key physical and chemical properties of triclosan.
Parameters Triclosan (TCS)
Chemical structure
Molecular formula C12H7Cl3O2 Molecular weight (g/mol) 289.536 CAS registration number 3380-34-5
IUPAC name 2,4,4′-trichloro-2′-hydroxydiphenyl ether or
5-chloro-2-(2,4-dichlorophenoxy)phenol Trade name Irgasan DP300 or CH 3565
Use Antiseptic and disinfectant Chlorine content (weight %) 33.7 a
Log Kow (at 25 °C, pH 7) 4.8 a Log Koc (at 25 °C, pH 7) 4.1 b
pKa (at 20 °C) 8.14 c
Melting point (°C) 54 – 57 c Boiling point (°C) 280–290 d
Water solubility (mg/L at 25 °C) 1.97–4.6 a Vapour pressure (mm Hg at 25 °C) 4.65 × 10⁻⁶ e
Some of potential transformation products f,g h,i,j
Methyl-triclosan 2,4-dichlorophenol
2,4,6-trichlorophenol 2,3,4-trichlorophenol
2,8-dichlorodibenzo-p-dioxin Triclosan O-β-D-glucuronide
Triclosan-O-Sulfate Tetra-III
Penta Chloroform
Log Kow: The logarithmic octanol-water partition coefficient, Log Koc: Organic carbon partition coefficient, pKa: Dissociation constant. a Halden and Paull [11], b Heidler and Halden [12], c Reiss et al. [13], d Dann and Hontela [14], e Ying et al. [15], f Tohidi and Cai [16], g Chen et al. [17], h Armstrong et al. [18], i Dann and Hontela [14], j Canosa et al. [19].
Municipal wastewater treatment plants (WWTPs) are generally designed to control easily/moderately biodegradable carbonaceous substances, nutrients and pathogens [20]; thus, emerging contaminants such as TCS may only be partially eliminated and/or transformed into its transformation products during treatment processes [21,22]. TCS has been widely detected in high
Molecular formula C12H7Cl3O2Molecular weight (g/mol) 289.536CAS registration number 3380-34-5
IUPAC name 2,4,4′-trichloro-2′-hydroxydiphenyl ether or5-chloro-2-(2,4-dichlorophenoxy)phenol
Trade name Irgasan DP300 or CH 3565Use Antiseptic and disinfectant
Chlorine content (weight %) 33.7 a
Log Kow (at 25 C, pH 7) 4.8 a
Log Koc (at 25 C, pH 7) 4.1 b
pKa (at 20 C) 8.14 c
Melting point (C) 54 – 57 c
Boiling point (C) 280–290 d
Water solubility (mg/L at 25 C) 1.97–4.6 a
Vapour pressure (mm Hg at 25 C) 4.65 × 10⁻⁶ e
Some of potential transformation products f,g h,i,j
Methyl-triclosan2,4-dichlorophenol
2,4,6-trichlorophenol2,3,4-trichlorophenol
2,8-dichlorodibenzo-p-dioxinTriclosan O-β-d-glucuronide
Triclosan-O-SulfateTetra-III
PentaChloroform
Log Kow: The logarithmic octanol-water partition coefficient, Log Koc: Organic carbon partition coefficient, pKa:Dissociation constant. a Halden and Paull [11], b Heidler and Halden [12], c Reiss et al. [13], d Dann and Hontela [14],e Ying et al. [15], f Tohidi and Cai [16], g Chen et al. [17], h Armstrong et al. [18], i Dann and Hontela [14], j Canosa et al. [19].
Municipal wastewater treatment plants (WWTPs) are generally designed to control easily/moderatelybiodegradable carbonaceous substances, nutrients and pathogens [20]; thus, emerging contaminantssuch as TCS may only be partially eliminated and/or transformed into its transformation productsduring treatment processes [21,22]. TCS has been widely detected in high levels (>1000 ng/g dry weight[ng/g-dry]) in municipal wastewater sludge (undigested), and has been shown to accumulate in digestedbiosolids and biosolids-amended agricultural soils [5,23–26] due to its physico-chemical characteristics,such as high lipophilicity and poor biodegradability. Among the 231 emerging contaminants analyzedin U.S. biosolids, TCS was identified as a priority chemical in terms of both its high occurrence andhigh bioaccumulation potential [5]. TCS was one of the most abundant contaminants with the mean
52
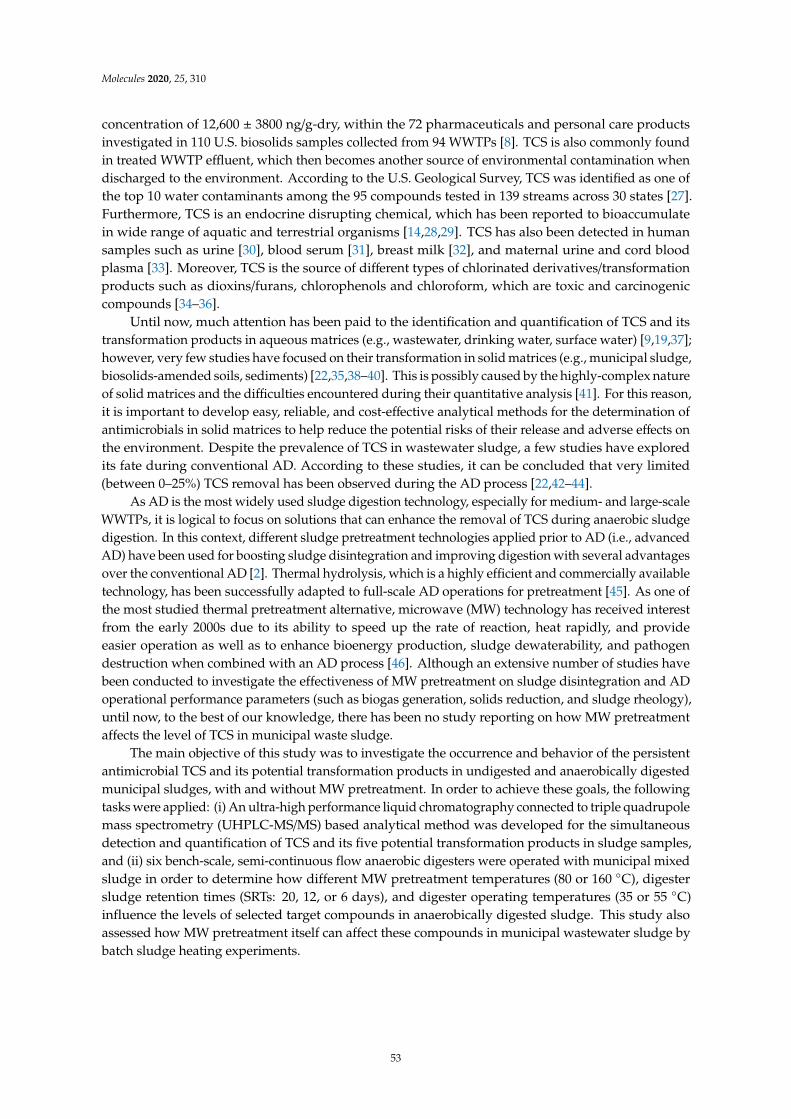
Molecules 2020, 25, 310
concentration of 12,600 ± 3800 ng/g-dry, within the 72 pharmaceuticals and personal care productsinvestigated in 110 U.S. biosolids samples collected from 94 WWTPs [8]. TCS is also commonly foundin treated WWTP effluent, which then becomes another source of environmental contamination whendischarged to the environment. According to the U.S. Geological Survey, TCS was identified as one ofthe top 10 water contaminants among the 95 compounds tested in 139 streams across 30 states [27].Furthermore, TCS is an endocrine disrupting chemical, which has been reported to bioaccumulatein wide range of aquatic and terrestrial organisms [14,28,29]. TCS has also been detected in humansamples such as urine [30], blood serum [31], breast milk [32], and maternal urine and cord bloodplasma [33]. Moreover, TCS is the source of different types of chlorinated derivatives/transformationproducts such as dioxins/furans, chlorophenols and chloroform, which are toxic and carcinogeniccompounds [34–36].
Until now, much attention has been paid to the identification and quantification of TCS and itstransformation products in aqueous matrices (e.g., wastewater, drinking water, surface water) [9,19,37];however, very few studies have focused on their transformation in solid matrices (e.g., municipal sludge,biosolids-amended soils, sediments) [22,35,38–40]. This is possibly caused by the highly-complex natureof solid matrices and the difficulties encountered during their quantitative analysis [41]. For this reason,it is important to develop easy, reliable, and cost-effective analytical methods for the determination ofantimicrobials in solid matrices to help reduce the potential risks of their release and adverse effects onthe environment. Despite the prevalence of TCS in wastewater sludge, a few studies have exploredits fate during conventional AD. According to these studies, it can be concluded that very limited(between 0–25%) TCS removal has been observed during the AD process [22,42–44].
As AD is the most widely used sludge digestion technology, especially for medium- and large-scaleWWTPs, it is logical to focus on solutions that can enhance the removal of TCS during anaerobic sludgedigestion. In this context, different sludge pretreatment technologies applied prior to AD (i.e., advancedAD) have been used for boosting sludge disintegration and improving digestion with several advantagesover the conventional AD [2]. Thermal hydrolysis, which is a highly efficient and commercially availabletechnology, has been successfully adapted to full-scale AD operations for pretreatment [45]. As one ofthe most studied thermal pretreatment alternative, microwave (MW) technology has received interestfrom the early 2000s due to its ability to speed up the rate of reaction, heat rapidly, and provideeasier operation as well as to enhance bioenergy production, sludge dewaterability, and pathogendestruction when combined with an AD process [46]. Although an extensive number of studies havebeen conducted to investigate the effectiveness of MW pretreatment on sludge disintegration and ADoperational performance parameters (such as biogas generation, solids reduction, and sludge rheology),until now, to the best of our knowledge, there has been no study reporting on how MW pretreatmentaffects the level of TCS in municipal waste sludge.
The main objective of this study was to investigate the occurrence and behavior of the persistentantimicrobial TCS and its potential transformation products in undigested and anaerobically digestedmunicipal sludges, with and without MW pretreatment. In order to achieve these goals, the followingtasks were applied: (i) An ultra-high performance liquid chromatography connected to triple quadrupolemass spectrometry (UHPLC-MS/MS) based analytical method was developed for the simultaneousdetection and quantification of TCS and its five potential transformation products in sludge samples,and (ii) six bench-scale, semi-continuous flow anaerobic digesters were operated with municipal mixedsludge in order to determine how different MW pretreatment temperatures (80 or 160 C), digestersludge retention times (SRTs: 20, 12, or 6 days), and digester operating temperatures (35 or 55 C)influence the levels of selected target compounds in anaerobically digested sludge. This study alsoassessed how MW pretreatment itself can affect these compounds in municipal wastewater sludge bybatch sludge heating experiments.
53
Molecules 2020, 25, 310
2. Results and Discussion
2.1. Environmental Occurrence of Triclosan in Municipal Sludge
The environmental (without spiking) concentration of TCS (parent compound) in municipalwastewater sludge (as a mixture of fermented primary sludge and thickened waste activated sludge(WAS)) was measured as 4450 ± 2750 ng/g-dry. However, none of the target transformation products(i.e., triclosan O-β-d-glucuronide, triclosan-O-Sulfate, tetra-III and penta, and 2,3,4-trichlorophenol)considered in this study could be detected in municipal sludge samples (below the instrument detectionlimits given in E-Supplementary Data). Throughout the different sampling periods, significant seasonalfluctuation in TCS concentrations of sludge samples was observed from winter to spring season (p-value= 0.011 < 0.05). As seen in Figure 1, TCS concentrations in the samples, which were collected from theWestside Regional WWTP during cold months (average weather and wastewater temperatures: −3and 14 C, respectively) of the year ranged from 6760 to 8240 ng/g-dry, whereas TCS concentrations inthe samples during warmer months (average weather and wastewater temperatures: 8 and >16 C,respectively) was in the range between 1700 and 3530 ng/g-dry. The sampling months shown in Figure 1for undigested mixed sludge (digester feed) correspond to times when bench-scale anaerobic digesterswere at the steady–state. These variations in the occurrence of TCS in sludge samples collected duringthe different seasonal temperatures might be related to the wastewater treatment processes applied atthe facility. Specifically, the lower TCS concentrations detected in the sludge at warmer temperaturesmay have been caused by the higher removal of TCS (via biotransformation) in the biological nutrientremoval process, utilized by the Westside Regional WWTP. As the microbial activity increased at highertemperatures compared to lower temperatures, TCS accumulation in the sludge (via sorption) mayhave decreased during biological process. This trend was also observed in previous studies [47–49].A study by Guerra et al. [48] compared seasonal differences of TCS concentrations in WAS samples(n = 9 with TCS detected in 100% samples) taken from Canadian WWTPs. The TCS concentrations inthe sludge were considerably higher in the samples collected in colder temperatures (4.2 ± 1.2 C) incomparison to those collected in warmer temperatures (23.4 ± 2.4 C). The levels of TCS were foundbetween 630–3700 ng/g-dry in the cold season whereas between 250–910 ng/g-dry in the warm season.Tohidi and Cai [22] reported that TCS elimination efficiency in a conventional activated sludge processwas significantly lower in cold sampling collection periods (34.8%) than warm periods (57%). Anotherstudy conducted by Trinh et al. [49] revealed that higher TCS removal was observed through a full-scalemembrane bioreactor plant during the summer sampling period (24 ± 1 C) compared to the wintersampling (15 ± 1 C). Lozano et al. [38] also revealed the nitrification and denitrification processes asthe most effective treatments for TCS removal (22.6%) compared to the conventional activated sludgeprocess (10.4%).
Levels of TCS obtained from municipal sludge in this study were similar to previously reported TCSconcentrations in Canadian sludge [48,50,51]. For example, TCS was found with median concentrationof 4090 ng/g-dry (between 3540–4150 ng/g-dry) and 9130 ng/g-dry (between 5340–36,800 ng/g-dry) inmixed sludge samples taken from the Saskatoon and the Red Deer’s WWTPs, respectively [50]. TCSconcentrations were reported from 5500 to 17,900 ng/g-dry (median: 11,550 ± 4265 ng/g-dry) in 12municipal raw sludge collected from cities across Canada [51]. According to a study by Guerra et al. [48],the concentration ranges for TCS (n = 6 with TCS detected in 100% samples taken from Canadian WWTPs)were between 6000–14,000 and 430–11,000 ng/g-dry in primary sludge and thickened WAS, respectively.
54
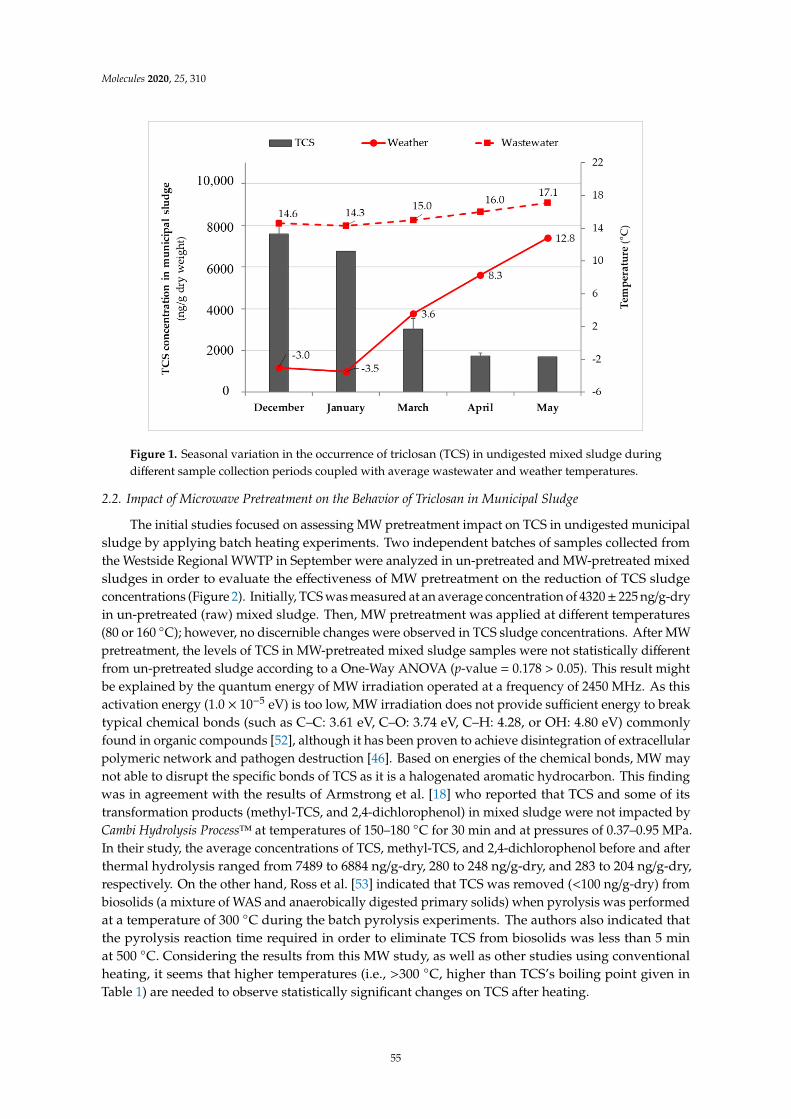
Molecules 2020, 25, 310Molecules 2020, 25, x 5 of 19
Figure 1. Seasonal variation in the occurrence of triclosan (TCS) in undigested mixed sludge during different sample collection periods coupled with average wastewater and weather temperatures.
2.2. Impact of Microwave Pretreatment on the Behavior of Triclosan in Municipal Sludge
The initial studies focused on assessing MW pretreatment impact on TCS in undigested municipal sludge by applying batch heating experiments. Two independent batches of samples collected from the Westside Regional WWTP in September were analyzed in un-pretreated and MW-pretreated mixed sludges in order to evaluate the effectiveness of MW pretreatment on the reduction of TCS sludge concentrations (Figure 2). Initially, TCS was measured at an average concentration of 4320 ± 225 ng/g-dry in un-pretreated (raw) mixed sludge. Then, MW pretreatment was applied at different temperatures (80 or 160 °C); however, no discernible changes were observed in TCS sludge concentrations. After MW pretreatment, the levels of TCS in MW-pretreated mixed sludge samples were not statistically different from un-pretreated sludge according to a One-Way ANOVA (p-value = 0.178 > 0.05). This result might be explained by the quantum energy of MW irradiation operated at a frequency of 2450 MHz. As this activation energy (1.0 × 10⁻⁵ eV) is too low, MW irradiation does not provide sufficient energy to break typical chemical bonds (such as C–C: 3.61 eV, C–O: 3.74 eV, C–H: 4.28, or OH: 4.80 eV) commonly found in organic compounds [52], although it has been proven to achieve disintegration of extracellular polymeric network and pathogen destruction [46]. Based on energies of the chemical bonds, MW may not able to disrupt the specific bonds of TCS as it is a halogenated aromatic hydrocarbon. This finding was in agreement with the results of Armstrong et al. [18] who reported that TCS and some of its transformation products (methyl-TCS, and 2,4-dichlorophenol) in mixed sludge were not impacted by Cambi Hydrolysis Process™ at temperatures of 150–180 °C for 30 min and at pressures of 0.37–0.95 MPa. In their study, the average concentrations of TCS, methyl-TCS, and 2,4-dichlorophenol before and after thermal hydrolysis ranged from 7489 to 6884 ng/g-dry, 280 to 248 ng/g-dry, and 283 to 204 ng/g-dry, respectively. On the other hand, Ross et al. [53] indicated that TCS was removed (<100 ng/g-dry) from biosolids (a mixture of WAS and anaerobically digested primary solids) when pyrolysis was performed at a temperature of 300 °C during the batch pyrolysis experiments. The authors also indicated that the pyrolysis reaction time required in order to eliminate TCS from biosolids was less than 5 min at 500 °C. Considering the results from this MW study, as well as other studies using conventional heating, it seems that higher temperatures (i.e., >300 °C, higher than TCS’s boiling point given in Table 1) are needed to observe statistically significant changes on TCS after heating.
Figure 1. Seasonal variation in the occurrence of triclosan (TCS) in undigested mixed sludge duringdifferent sample collection periods coupled with average wastewater and weather temperatures.
2.2. Impact of Microwave Pretreatment on the Behavior of Triclosan in Municipal Sludge
The initial studies focused on assessing MW pretreatment impact on TCS in undigested municipalsludge by applying batch heating experiments. Two independent batches of samples collected fromthe Westside Regional WWTP in September were analyzed in un-pretreated and MW-pretreated mixedsludges in order to evaluate the effectiveness of MW pretreatment on the reduction of TCS sludgeconcentrations (Figure 2). Initially, TCS was measured at an average concentration of 4320± 225 ng/g-dryin un-pretreated (raw) mixed sludge. Then, MW pretreatment was applied at different temperatures(80 or 160 C); however, no discernible changes were observed in TCS sludge concentrations. After MWpretreatment, the levels of TCS in MW-pretreated mixed sludge samples were not statistically differentfrom un-pretreated sludge according to a One-Way ANOVA (p-value = 0.178 > 0.05). This result mightbe explained by the quantum energy of MW irradiation operated at a frequency of 2450 MHz. As thisactivation energy (1.0 × 10⁻⁵ eV) is too low, MW irradiation does not provide sufficient energy to breaktypical chemical bonds (such as C–C: 3.61 eV, C–O: 3.74 eV, C–H: 4.28, or OH: 4.80 eV) commonlyfound in organic compounds [52], although it has been proven to achieve disintegration of extracellularpolymeric network and pathogen destruction [46]. Based on energies of the chemical bonds, MW maynot able to disrupt the specific bonds of TCS as it is a halogenated aromatic hydrocarbon. This findingwas in agreement with the results of Armstrong et al. [18] who reported that TCS and some of itstransformation products (methyl-TCS, and 2,4-dichlorophenol) in mixed sludge were not impacted byCambi Hydrolysis Process™ at temperatures of 150–180 C for 30 min and at pressures of 0.37–0.95 MPa.In their study, the average concentrations of TCS, methyl-TCS, and 2,4-dichlorophenol before and afterthermal hydrolysis ranged from 7489 to 6884 ng/g-dry, 280 to 248 ng/g-dry, and 283 to 204 ng/g-dry,respectively. On the other hand, Ross et al. [53] indicated that TCS was removed (<100 ng/g-dry) frombiosolids (a mixture of WAS and anaerobically digested primary solids) when pyrolysis was performedat a temperature of 300 C during the batch pyrolysis experiments. The authors also indicated thatthe pyrolysis reaction time required in order to eliminate TCS from biosolids was less than 5 minat 500 C. Considering the results from this MW study, as well as other studies using conventionalheating, it seems that higher temperatures (i.e., >300 C, higher than TCS’s boiling point given inTable 1) are needed to observe statistically significant changes on TCS after heating.
55
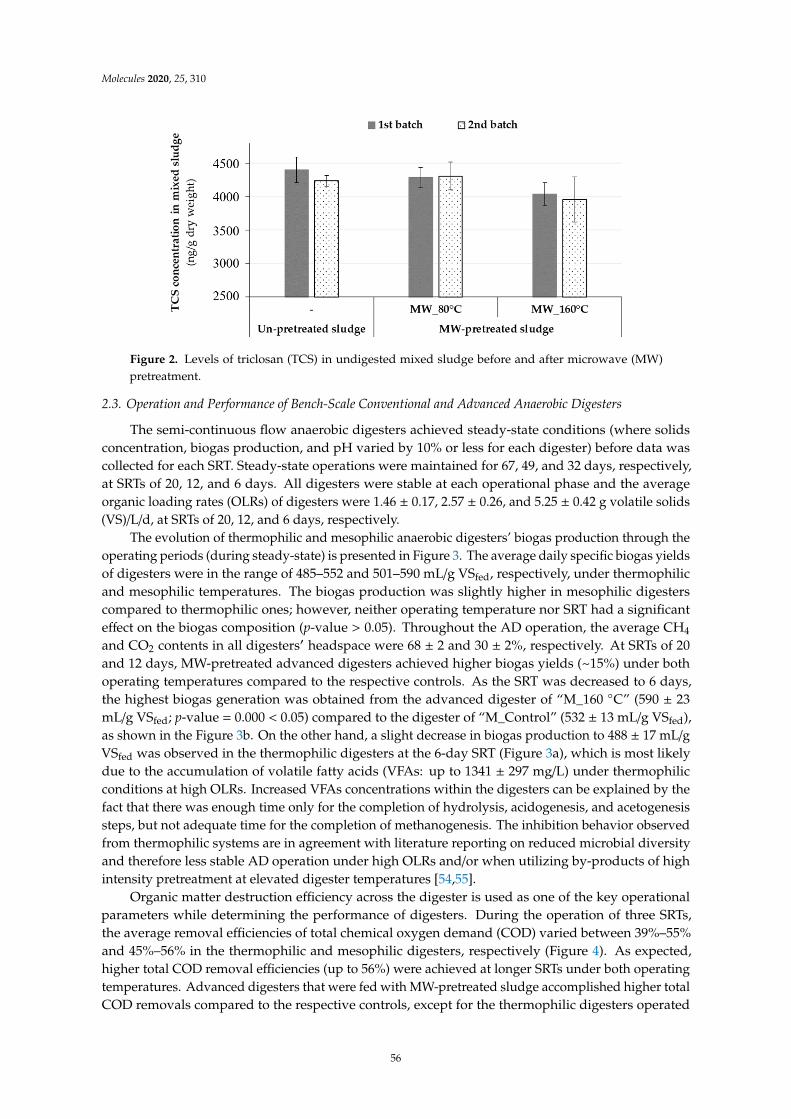
Molecules 2020, 25, 310Molecules 2020, 25, x 6 of 19
Figure 2. Levels of triclosan (TCS) in undigested mixed sludge before and after microwave (MW) pretreatment.
2.3. Operation and Performance of Bench-Scale Conventional and Advanced Anaerobic Digesters
The semi-continuous flow anaerobic digesters achieved steady-state conditions (where solids concentration, biogas production, and pH varied by 10% or less for each digester) before data was collected for each SRT. Steady-state operations were maintained for 67, 49, and 32 days, respectively, at SRTs of 20, 12, and 6 days. All digesters were stable at each operational phase and the average organic loading rates (OLRs) of digesters were 1.46 ± 0.17, 2.57 ± 0.26, and 5.25 ± 0.42 g volatile solids (VS)/L/d, at SRTs of 20, 12, and 6 days, respectively.
The evolution of thermophilic and mesophilic anaerobic digesters’ biogas production through the operating periods (during steady-state) is presented in Figure 3. The average daily specific biogas yields of digesters were in the range of 485–552 and 501–590 mL/g VSfed, respectively, under thermophilic and mesophilic temperatures. The biogas production was slightly higher in mesophilic digesters compared to thermophilic ones; however, neither operating temperature nor SRT had a significant effect on the biogas composition (p-value > 0.05). Throughout the AD operation, the average CH4 and CO2 contents in all digesters′ headspace were 68 ± 2 and 30 ± 2%, respectively. At SRTs of 20 and 12 days, MW-pretreated advanced digesters achieved higher biogas yields (~15%) under both operating temperatures compared to the respective controls. As the SRT was decreased to 6 days, the highest biogas generation was obtained from the advanced digester of “M_160 °C” (590 ± 23 mL/g VSfed; p-value = 0.000 < 0.05) compared to the digester of “M_Control” (532 ± 13 mL/g VSfed), as shown in the Figure 3b. On the other hand, a slight decrease in biogas production to 488 ± 17 mL/g VSfed was observed in the thermophilic digesters at the 6-day SRT (Figure 3a), which is most likely due to the accumulation of volatile fatty acids (VFAs: up to 1341 ± 297 mg/L) under thermophilic conditions at high OLRs. Increased VFAs concentrations within the digesters can be explained by the fact that there was enough time only for the completion of hydrolysis, acidogenesis, and acetogenesis steps, but not adequate time for the completion of methanogenesis. The inhibition behavior observed from thermophilic systems are in agreement with literature reporting on reduced microbial diversity and therefore less stable AD operation under high OLRs and/or when utilizing by-products of high intensity pretreatment at elevated digester temperatures [54,55].
Organic matter destruction efficiency across the digester is used as one of the key operational parameters while determining the performance of digesters. During the operation of three SRTs, the average removal efficiencies of total chemical oxygen demand (COD) varied between 39%–55% and 45%–56% in the thermophilic and mesophilic digesters, respectively (Figure 4). As expected, higher total COD removal efficiencies (up to 56%) were achieved at longer SRTs under both operating temperatures. Advanced digesters that were fed with MW-pretreated sludge accomplished higher total COD removals compared to the respective controls, except for the thermophilic digesters
Figure 2. Levels of triclosan (TCS) in undigested mixed sludge before and after microwave (MW)pretreatment.
2.3. Operation and Performance of Bench-Scale Conventional and Advanced Anaerobic Digesters
The semi-continuous flow anaerobic digesters achieved steady-state conditions (where solidsconcentration, biogas production, and pH varied by 10% or less for each digester) before data wascollected for each SRT. Steady-state operations were maintained for 67, 49, and 32 days, respectively,at SRTs of 20, 12, and 6 days. All digesters were stable at each operational phase and the averageorganic loading rates (OLRs) of digesters were 1.46 ± 0.17, 2.57 ± 0.26, and 5.25 ± 0.42 g volatile solids(VS)/L/d, at SRTs of 20, 12, and 6 days, respectively.
The evolution of thermophilic and mesophilic anaerobic digesters’ biogas production through theoperating periods (during steady-state) is presented in Figure 3. The average daily specific biogas yieldsof digesters were in the range of 485–552 and 501–590 mL/g VSfed, respectively, under thermophilicand mesophilic temperatures. The biogas production was slightly higher in mesophilic digesterscompared to thermophilic ones; however, neither operating temperature nor SRT had a significanteffect on the biogas composition (p-value > 0.05). Throughout the AD operation, the average CH4
and CO2 contents in all digesters′ headspace were 68 ± 2 and 30 ± 2%, respectively. At SRTs of 20and 12 days, MW-pretreated advanced digesters achieved higher biogas yields (~15%) under bothoperating temperatures compared to the respective controls. As the SRT was decreased to 6 days,the highest biogas generation was obtained from the advanced digester of “M_160 C” (590 ± 23mL/g VSfed; p-value = 0.000 < 0.05) compared to the digester of “M_Control” (532 ± 13 mL/g VSfed),as shown in the Figure 3b. On the other hand, a slight decrease in biogas production to 488 ± 17 mL/gVSfed was observed in the thermophilic digesters at the 6-day SRT (Figure 3a), which is most likelydue to the accumulation of volatile fatty acids (VFAs: up to 1341 ± 297 mg/L) under thermophilicconditions at high OLRs. Increased VFAs concentrations within the digesters can be explained by thefact that there was enough time only for the completion of hydrolysis, acidogenesis, and acetogenesissteps, but not adequate time for the completion of methanogenesis. The inhibition behavior observedfrom thermophilic systems are in agreement with literature reporting on reduced microbial diversityand therefore less stable AD operation under high OLRs and/or when utilizing by-products of highintensity pretreatment at elevated digester temperatures [54,55].
Organic matter destruction efficiency across the digester is used as one of the key operationalparameters while determining the performance of digesters. During the operation of three SRTs,the average removal efficiencies of total chemical oxygen demand (COD) varied between 39%–55%and 45%–56% in the thermophilic and mesophilic digesters, respectively (Figure 4). As expected,higher total COD removal efficiencies (up to 56%) were achieved at longer SRTs under both operatingtemperatures. Advanced digesters that were fed with MW-pretreated sludge accomplished higher totalCOD removals compared to the respective controls, except for the thermophilic digesters operated
56
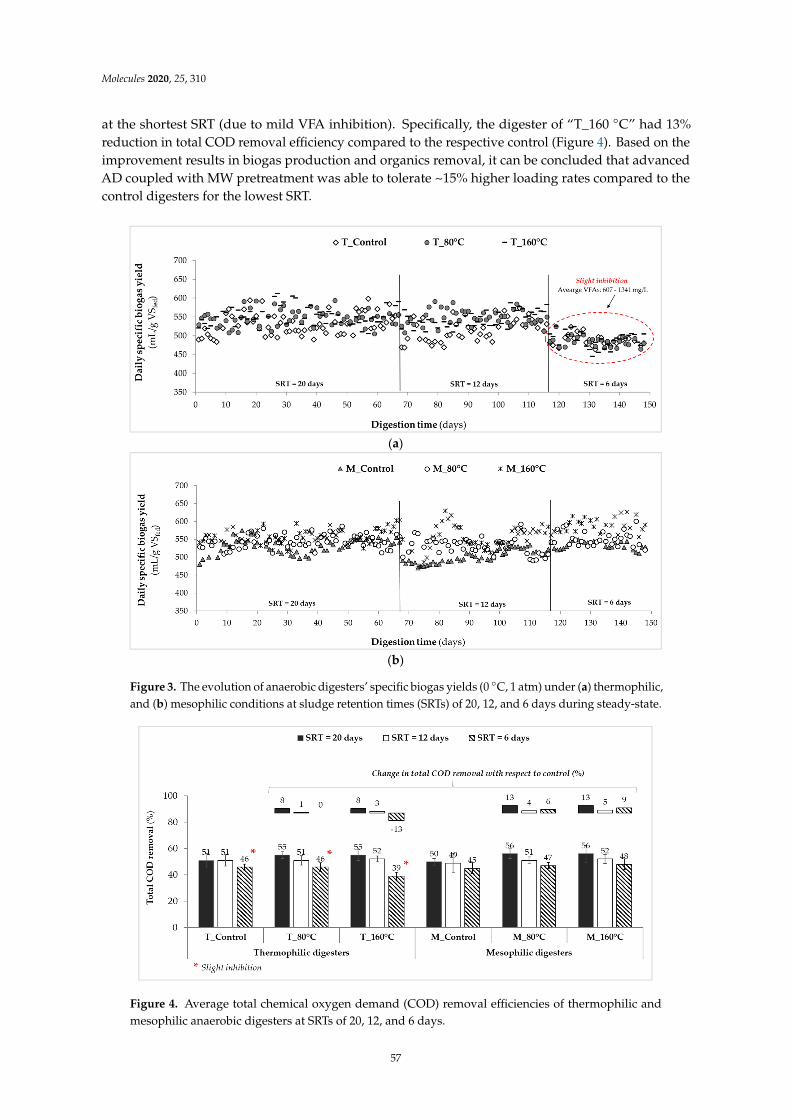
Molecules 2020, 25, 310
at the shortest SRT (due to mild VFA inhibition). Specifically, the digester of “T_160 C” had 13%reduction in total COD removal efficiency compared to the respective control (Figure 4). Based on theimprovement results in biogas production and organics removal, it can be concluded that advancedAD coupled with MW pretreatment was able to tolerate ~15% higher loading rates compared to thecontrol digesters for the lowest SRT.
Molecules 2020, 25, x 7 of 19
operated at the shortest SRT (due to mild VFA inhibition). Specifically, the digester of “T_160 °C” had 13% reduction in total COD removal efficiency compared to the respective control (Figure 4). Based on the improvement results in biogas production and organics removal, it can be concluded that advanced AD coupled with MW pretreatment was able to tolerate ~15% higher loading rates compared to the control digesters for the lowest SRT.
(a)
(b)
Figure 3. The evolution of anaerobic digesters’ specific biogas yields (0 °C, 1 atm) under (a) thermophilic, and (b) mesophilic conditions at sludge retention times (SRTs) of 20, 12, and 6 days during steady-state.
Figure 4. Average total chemical oxygen demand (COD) removal efficiencies of thermophilic and mesophilic anaerobic digesters at SRTs of 20, 12, and 6 days.
Figure 3. The evolution of anaerobic digesters’ specific biogas yields (0 C, 1 atm) under (a) thermophilic,and (b) mesophilic conditions at sludge retention times (SRTs) of 20, 12, and 6 days during steady-state.
Molecules 2020, 25, x 7 of 19
operated at the shortest SRT (due to mild VFA inhibition). Specifically, the digester of “T_160 °C” had 13% reduction in total COD removal efficiency compared to the respective control (Figure 4). Based on the improvement results in biogas production and organics removal, it can be concluded that advanced AD coupled with MW pretreatment was able to tolerate ~15% higher loading rates compared to the control digesters for the lowest SRT.
(a)
(b)
Figure 3. The evolution of anaerobic digesters’ specific biogas yields (0 °C, 1 atm) under (a) thermophilic, and (b) mesophilic conditions at sludge retention times (SRTs) of 20, 12, and 6 days during steady-state.
Figure 4. Average total chemical oxygen demand (COD) removal efficiencies of thermophilic and mesophilic anaerobic digesters at SRTs of 20, 12, and 6 days.
Figure 4. Average total chemical oxygen demand (COD) removal efficiencies of thermophilic andmesophilic anaerobic digesters at SRTs of 20, 12, and 6 days.
57
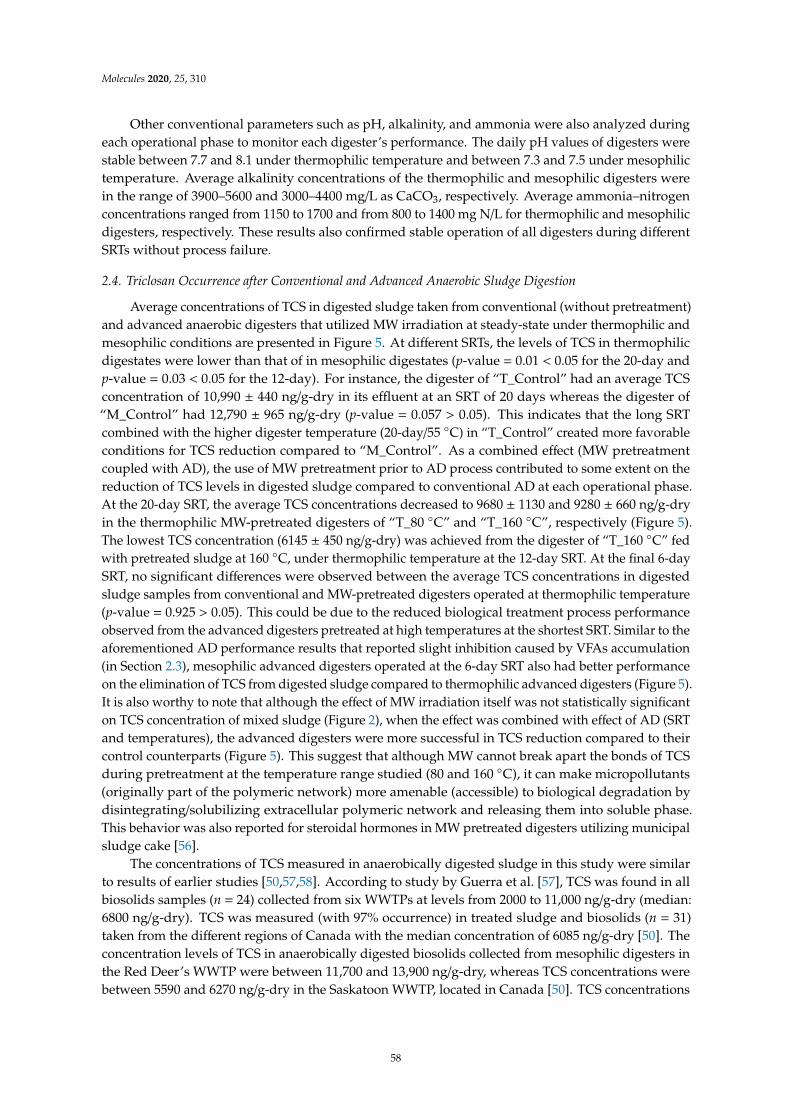
Molecules 2020, 25, 310
Other conventional parameters such as pH, alkalinity, and ammonia were also analyzed duringeach operational phase to monitor each digester’s performance. The daily pH values of digesters werestable between 7.7 and 8.1 under thermophilic temperature and between 7.3 and 7.5 under mesophilictemperature. Average alkalinity concentrations of the thermophilic and mesophilic digesters werein the range of 3900–5600 and 3000–4400 mg/L as CaCO3, respectively. Average ammonia–nitrogenconcentrations ranged from 1150 to 1700 and from 800 to 1400 mg N/L for thermophilic and mesophilicdigesters, respectively. These results also confirmed stable operation of all digesters during differentSRTs without process failure.
2.4. Triclosan Occurrence after Conventional and Advanced Anaerobic Sludge Digestion
Average concentrations of TCS in digested sludge taken from conventional (without pretreatment)and advanced anaerobic digesters that utilized MW irradiation at steady-state under thermophilic andmesophilic conditions are presented in Figure 5. At different SRTs, the levels of TCS in thermophilicdigestates were lower than that of in mesophilic digestates (p-value = 0.01 < 0.05 for the 20-day andp-value = 0.03 < 0.05 for the 12-day). For instance, the digester of “T_Control” had an average TCSconcentration of 10,990 ± 440 ng/g-dry in its effluent at an SRT of 20 days whereas the digester of“M_Control” had 12,790 ± 965 ng/g-dry (p-value = 0.057 > 0.05). This indicates that the long SRTcombined with the higher digester temperature (20-day/55 C) in “T_Control” created more favorableconditions for TCS reduction compared to “M_Control”. As a combined effect (MW pretreatmentcoupled with AD), the use of MW pretreatment prior to AD process contributed to some extent on thereduction of TCS levels in digested sludge compared to conventional AD at each operational phase.At the 20-day SRT, the average TCS concentrations decreased to 9680 ± 1130 and 9280 ± 660 ng/g-dryin the thermophilic MW-pretreated digesters of “T_80 C” and “T_160 C”, respectively (Figure 5).The lowest TCS concentration (6145 ± 450 ng/g-dry) was achieved from the digester of “T_160 C” fedwith pretreated sludge at 160 C, under thermophilic temperature at the 12-day SRT. At the final 6-daySRT, no significant differences were observed between the average TCS concentrations in digestedsludge samples from conventional and MW-pretreated digesters operated at thermophilic temperature(p-value = 0.925 > 0.05). This could be due to the reduced biological treatment process performanceobserved from the advanced digesters pretreated at high temperatures at the shortest SRT. Similar to theaforementioned AD performance results that reported slight inhibition caused by VFAs accumulation(in Section 2.3), mesophilic advanced digesters operated at the 6-day SRT also had better performanceon the elimination of TCS from digested sludge compared to thermophilic advanced digesters (Figure 5).It is also worthy to note that although the effect of MW irradiation itself was not statistically significanton TCS concentration of mixed sludge (Figure 2), when the effect was combined with effect of AD (SRTand temperatures), the advanced digesters were more successful in TCS reduction compared to theircontrol counterparts (Figure 5). This suggest that although MW cannot break apart the bonds of TCSduring pretreatment at the temperature range studied (80 and 160 C), it can make micropollutants(originally part of the polymeric network) more amenable (accessible) to biological degradation bydisintegrating/solubilizing extracellular polymeric network and releasing them into soluble phase.This behavior was also reported for steroidal hormones in MW pretreated digesters utilizing municipalsludge cake [56].
The concentrations of TCS measured in anaerobically digested sludge in this study were similarto results of earlier studies [50,57,58]. According to study by Guerra et al. [57], TCS was found in allbiosolids samples (n = 24) collected from six WWTPs at levels from 2000 to 11,000 ng/g-dry (median:6800 ng/g-dry). TCS was measured (with 97% occurrence) in treated sludge and biosolids (n = 31)taken from the different regions of Canada with the median concentration of 6085 ng/g-dry [50]. Theconcentration levels of TCS in anaerobically digested biosolids collected from mesophilic digesters inthe Red Deer’s WWTP were between 11,700 and 13,900 ng/g-dry, whereas TCS concentrations werebetween 5590 and 6270 ng/g-dry in the Saskatoon WWTP, located in Canada [50]. TCS concentrations
58
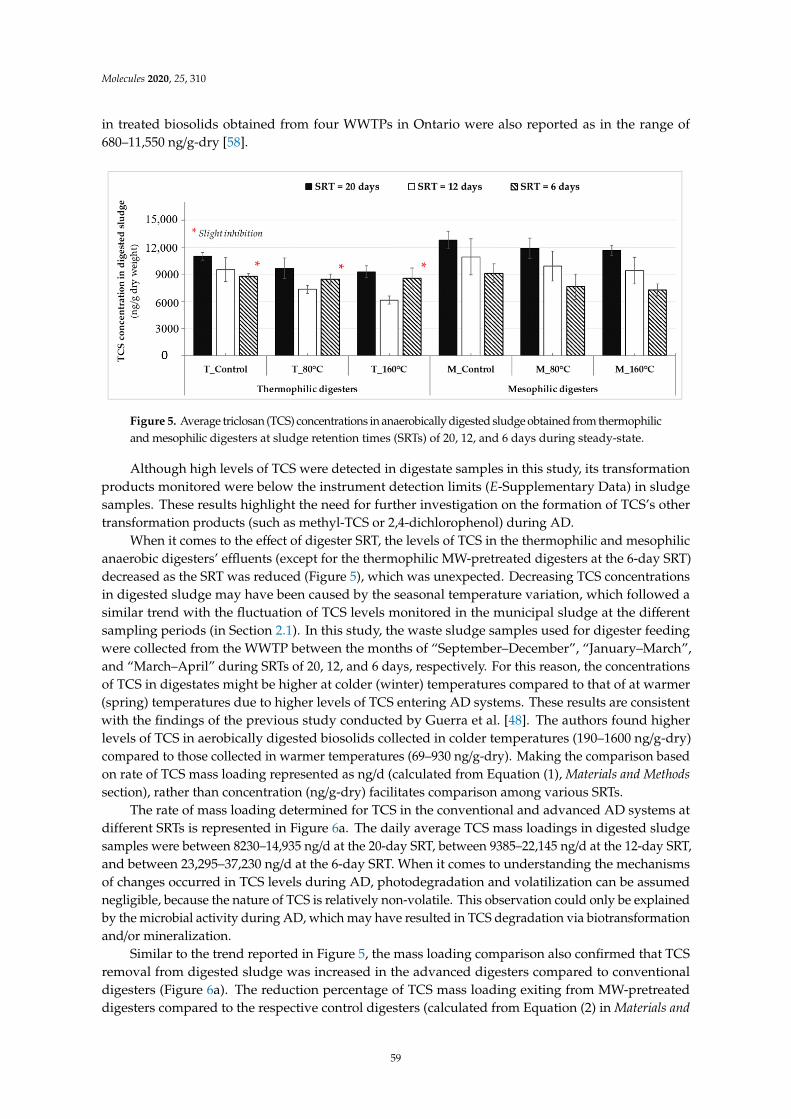
Molecules 2020, 25, 310
in treated biosolids obtained from four WWTPs in Ontario were also reported as in the range of680–11,550 ng/g-dry [58].Molecules 2020, 25, x 9 of 19
Figure 5. Average triclosan (TCS) concentrations in anaerobically digested sludge obtained from thermophilic and mesophilic digesters at sludge retention times (SRTs) of 20, 12, and 6 days during steady-state.
Although high levels of TCS were detected in digestate samples in this study, its transformation products monitored were below the instrument detection limits (E-Supplementary Data) in sludge samples. These results highlight the need for further investigation on the formation of TCS’s other transformation products (such as methyl-TCS or 2,4-dichlorophenol) during AD.
When it comes to the effect of digester SRT, the levels of TCS in the thermophilic and mesophilic anaerobic digesters’ effluents (except for the thermophilic MW-pretreated digesters at the 6-day SRT) decreased as the SRT was reduced (Figure 5), which was unexpected. Decreasing TCS concentrations in digested sludge may have been caused by the seasonal temperature variation, which followed a similar trend with the fluctuation of TCS levels monitored in the municipal sludge at the different sampling periods (in Section 2.1). In this study, the waste sludge samples used for digester feeding were collected from the WWTP between the months of “September–December”, “January–March”, and “March–April” during SRTs of 20, 12, and 6 days, respectively. For this reason, the concentrations of TCS in digestates might be higher at colder (winter) temperatures compared to that of at warmer (spring) temperatures due to higher levels of TCS entering AD systems. These results are consistent with the findings of the previous study conducted by Guerra et al. [48]. The authors found higher levels of TCS in aerobically digested biosolids collected in colder temperatures (190–1600 ng/g-dry) compared to those collected in warmer temperatures (69–930 ng/g-dry). Making the comparison based on rate of TCS mass loading represented as ng/d (calculated from Equation (1), Materials and Methods section), rather than concentration (ng/g-dry) facilitates comparison among various SRTs.
The rate of mass loading determined for TCS in the conventional and advanced AD systems at different SRTs is represented in Figure 6a. The daily average TCS mass loadings in digested sludge samples were between 8230–14,935 ng/d at the 20-day SRT, between 9385–22,145 ng/d at the 12-day SRT, and between 23,295–37,230 ng/d at the 6-day SRT. When it comes to understanding the mechanisms of changes occurred in TCS levels during AD, photodegradation and volatilization can be assumed negligible, because the nature of TCS is relatively non-volatile. This observation could only be explained by the microbial activity during AD, which may have resulted in TCS degradation via biotransformation and/or mineralization.
Similar to the trend reported in Figure 5, the mass loading comparison also confirmed that TCS removal from digested sludge was increased in the advanced digesters compared to conventional digesters (Figure 6a). The reduction percentage of TCS mass loading exiting from MW-pretreated digesters compared to the respective control digesters (calculated from Equation 2 in Materials and Methods section) is shown in Figure 6b. Digesters utilizing low-temperature microwaved sludge (80 °C) improved TCS reduction in digested sludge by 18%–33%, and 21%–29%, respectively under thermophilic and mesophilic operating temperatures at different SRTs, compared to controls. The levels of TCS reduction in the advanced digesters operated at thermophilic temperatures (except at
Figure 5. Average triclosan (TCS) concentrations in anaerobically digested sludge obtained from thermophilicand mesophilic digesters at sludge retention times (SRTs) of 20, 12, and 6 days during steady-state.
Although high levels of TCS were detected in digestate samples in this study, its transformationproducts monitored were below the instrument detection limits (E-Supplementary Data) in sludgesamples. These results highlight the need for further investigation on the formation of TCS’s othertransformation products (such as methyl-TCS or 2,4-dichlorophenol) during AD.
When it comes to the effect of digester SRT, the levels of TCS in the thermophilic and mesophilicanaerobic digesters’ effluents (except for the thermophilic MW-pretreated digesters at the 6-day SRT)decreased as the SRT was reduced (Figure 5), which was unexpected. Decreasing TCS concentrationsin digested sludge may have been caused by the seasonal temperature variation, which followed asimilar trend with the fluctuation of TCS levels monitored in the municipal sludge at the differentsampling periods (in Section 2.1). In this study, the waste sludge samples used for digester feedingwere collected from the WWTP between the months of “September–December”, “January–March”,and “March–April” during SRTs of 20, 12, and 6 days, respectively. For this reason, the concentrationsof TCS in digestates might be higher at colder (winter) temperatures compared to that of at warmer(spring) temperatures due to higher levels of TCS entering AD systems. These results are consistentwith the findings of the previous study conducted by Guerra et al. [48]. The authors found higherlevels of TCS in aerobically digested biosolids collected in colder temperatures (190–1600 ng/g-dry)compared to those collected in warmer temperatures (69–930 ng/g-dry). Making the comparison basedon rate of TCS mass loading represented as ng/d (calculated from Equation (1), Materials and Methodssection), rather than concentration (ng/g-dry) facilitates comparison among various SRTs.
The rate of mass loading determined for TCS in the conventional and advanced AD systems atdifferent SRTs is represented in Figure 6a. The daily average TCS mass loadings in digested sludgesamples were between 8230–14,935 ng/d at the 20-day SRT, between 9385–22,145 ng/d at the 12-day SRT,and between 23,295–37,230 ng/d at the 6-day SRT. When it comes to understanding the mechanismsof changes occurred in TCS levels during AD, photodegradation and volatilization can be assumednegligible, because the nature of TCS is relatively non-volatile. This observation could only be explainedby the microbial activity during AD, which may have resulted in TCS degradation via biotransformationand/or mineralization.
Similar to the trend reported in Figure 5, the mass loading comparison also confirmed that TCSremoval from digested sludge was increased in the advanced digesters compared to conventionaldigesters (Figure 6a). The reduction percentage of TCS mass loading exiting from MW-pretreateddigesters compared to the respective control digesters (calculated from Equation (2) in Materials and
59
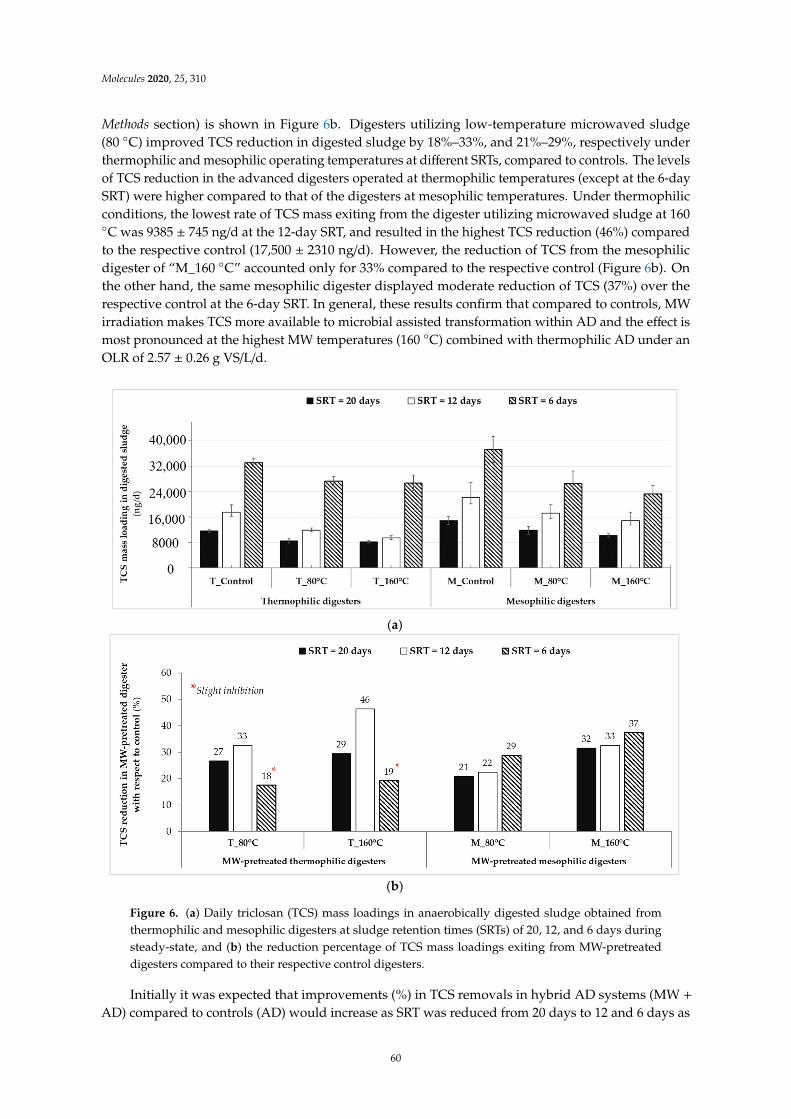
Molecules 2020, 25, 310
Methods section) is shown in Figure 6b. Digesters utilizing low-temperature microwaved sludge(80 C) improved TCS reduction in digested sludge by 18%–33%, and 21%–29%, respectively underthermophilic and mesophilic operating temperatures at different SRTs, compared to controls. The levelsof TCS reduction in the advanced digesters operated at thermophilic temperatures (except at the 6-daySRT) were higher compared to that of the digesters at mesophilic temperatures. Under thermophilicconditions, the lowest rate of TCS mass exiting from the digester utilizing microwaved sludge at 160C was 9385 ± 745 ng/d at the 12-day SRT, and resulted in the highest TCS reduction (46%) comparedto the respective control (17,500 ± 2310 ng/d). However, the reduction of TCS from the mesophilicdigester of “M_160 C” accounted only for 33% compared to the respective control (Figure 6b). Onthe other hand, the same mesophilic digester displayed moderate reduction of TCS (37%) over therespective control at the 6-day SRT. In general, these results confirm that compared to controls, MWirradiation makes TCS more available to microbial assisted transformation within AD and the effect ismost pronounced at the highest MW temperatures (160 C) combined with thermophilic AD under anOLR of 2.57 ± 0.26 g VS/L/d.
Molecules 2020, 25, x 10 of 19
the 6-day SRT) were higher compared to that of the digesters at mesophilic temperatures. Under thermophilic conditions, the lowest rate of TCS mass exiting from the digester utilizing microwaved sludge at 160 °C was 9385 ± 745 ng/d at the 12-day SRT, and resulted in the highest TCS reduction (46%) compared to the respective control (17,500 ± 2310 ng/d). However, the reduction of TCS from the mesophilic digester of “M_160 °C” accounted only for 33% compared to the respective control (Figure 6b). On the other hand, the same mesophilic digester displayed moderate reduction of TCS (37%) over the respective control at the 6-day SRT. In general, these results confirm that compared to controls, MW irradiation makes TCS more available to microbial assisted transformation within AD and the effect is most pronounced at the highest MW temperatures (160 °C) combined with thermophilic AD under an OLR of 2.57 ± 0.26 g VS/L/d.
(a)
(b)
Figure 6. (a) Daily triclosan (TCS) mass loadings in anaerobically digested sludge obtained from thermophilic and mesophilic digesters at sludge retention times (SRTs) of 20, 12, and 6 days during steady-state, and (b) the reduction percentage of TCS mass loadings exiting from MW-pretreated digesters compared to their respective control digesters.
Initially it was expected that improvements (%) in TCS removals in hybrid AD systems (MW + AD) compared to controls (AD) would increase as SRT was reduced from 20 days to 12 and 6 days as controls were expected to be challenged at shorter SRTs. However, in this study, when the SRT was reduced, TCS reduction obtained from the digesters increased at both mesophilic and thermophilic (except for “T_80 °C” and “T_160 °C” that experienced slight inhibition at the 6-day SRT) temperatures (Figure 6b). Aside from the MW irradiation affect, this can be explained by the higher accessibility of micropollutants in digested sludge matrix compared to digester feed sludge during extraction step of analytical analysis. In other words, micropollutants can be more accessible
Figure 6. (a) Daily triclosan (TCS) mass loadings in anaerobically digested sludge obtained fromthermophilic and mesophilic digesters at sludge retention times (SRTs) of 20, 12, and 6 days duringsteady-state, and (b) the reduction percentage of TCS mass loadings exiting from MW-pretreateddigesters compared to their respective control digesters.
Initially it was expected that improvements (%) in TCS removals in hybrid AD systems (MW +
AD) compared to controls (AD) would increase as SRT was reduced from 20 days to 12 and 6 days as
60
Molecules 2020, 25, 310
controls were expected to be challenged at shorter SRTs. However, in this study, when the SRT wasreduced, TCS reduction obtained from the digesters increased at both mesophilic and thermophilic(except for “T_80 C” and “T_160 C” that experienced slight inhibition at the 6-day SRT) temperatures(Figure 6b). Aside from the MW irradiation affect, this can be explained by the higher accessibilityof micropollutants in digested sludge matrix compared to digester feed sludge during extractionstep of analytical analysis. In other words, micropollutants can be more accessible to quantificationin digested sludge compared to that of in undigested sludge due to the alteration of organic matterquality and quantity during AD process (both in control and pretreated ADs). Consequently, as theextent (i.e., SRT) of digestion increased, concentrations of micropollutants (such as TCS levels in thisstudy) in effluents from AD would increase due to higher detectability/quantification compared tothat in effluents at shorter SRTs (i.e., 12 or 6 days), and resulting in reduced micropollutant reductionpercentages for long SRTs, as previously reported for pharmaceuticals in sludge digesters [59].
2.5. Feasibility of Technology at Full-Scale
Although the results from this study indicate that MW pretreatment was effective in decreasingTCS levels in anaerobically digested sludge when combined with AD, microwave systems at 2450 MHzwould not be feasible for full-scale implementation because of inefficient heating of wastewater sludgeleading to higher electricity requirements [54]. However, recent studies [60] indicate that optimizingheating frequency and pretreatment equipment design for sludge dielectric properties will increase netenergy production significantly at full-scale, while retaining process benefits of sludge pretreatment interms of digester operation and digestate quality.
3. Materials and Method
3.1. Municipal Wastewater Sludge
Fermented primary sludge and thickened WAS were taken every two weeks from the WestsideRegional WWTP (West Kelowna, B.C., Canada) which has a capacity of 16,800 m3/day. This facility employspreliminary, and primary treatment processes followed by secondary (biological nutrient removal througha three-phase modified Bardenpho process) and tertiary (filtration and UV disinfection) treatments.
3.2. Experimental Methodology
MW pretreatment of thickened WAS samples was carried out in a Milestone 2.45 GHz MW LabStation (ETHOS-EZ: maximum pressure of 35 bar, maximum temperature of 300 C, and maximumpower of 1200 W). At a constant ramp rate of 2.25 C/min, thickened WAS samples were irradiated todesired temperatures of 80 and 160 C which represented the low- and high-temperature pretreatmentconditions as below and above boiling point temperatures, respectively. Samples were held at thesetemperatures for 30 min, and then cooled until ambient room temperature. Microwaved thickened WASsamples were mixed with raw fermented primary sludge with a volume % ratio of 67:33, respectively,to provide MW-pretreated mixed sludge samples. Three different mixed sludge were prepared forfeeding the digesters: one un-pretreated and two pretreated samples. The basic characteristics of thedifferent sludge streams and mixed sludge samples are shown in Table 2.
Six side-armed Erlenmeyer flasks were used to construct bench-scale anaerobic digesters (fed oncea day, 7 days/week). Total and liquid volumes of the digesters were 2 and 1 L, respectively. The start-upof the digesters was done by taking mesophilic and thermophilic inocula from existing bench-scaledigesters which had been operating using similar mixed sludge for over one year. Digesters wereoperated at SRTs of 20, 12, and 6 days under thermophilic (55 ± 1 C) and mesophilic (35 ± 1 C)temperatures. The summary of experimental design used for MW pretreatment and anaerobic digestersis provided in Table 3. Further information about the experimental methodology of this study can befound in the previous publication of the authors [54].
61
Molecules 2020, 25, 310
Table 2. Basic characteristics of waste sludge streams and mixed sludge samples.
Waste Sludge Sample Parameter
pH (-) TS (% w/w) VS (% w/w) VS/TS (%)
Thickened waste activated sludge 6.15(0.20; 5) a
3.93(0.48; 12)
3.18(0.40; 12) 80.9
Fermented primary sludge 5.27(0.15; 5)
7.10(0.96; 12)
6.47(0.89; 12) 91.1
Mixed sludgeUn-pretreated 5.63
(0.13; 5)3.94
(0.24; 16)3.38
(0.20; 16) 86.0
PretreatedMW_80 C 5.64
(0.05; 5)3.40
(0.35; 16)2.90
(0.33; 16) 85.3
MW_160 C 5.52(0.20; 5)
3.37(0.25; 16)
2.87(0.24; 16) 85.2
TS: total solids, VS: volatile solids, MW: microwave. a Data displays the arithmetic mean of measurements (standarddeviation; number of data points).
Table 3. Summary of the experimental methodology used.
Microwave Pretreatment Mixed SludgeSample Name
Anaerobic Digestion
Temperature a
(C)Exposure Duration
(min) Digester Name Digester Type SRT (days)
- - Un-pretreated T_ControlM_Control
ThermophilicMesophilic 20, 12, and 6
80 30 MW_80 C T_80 C M_80 C ThermophilicMesophilic 20, 12, and 6
160 30 MW_160 C T_160 C M_160 C ThermophilicMesophilic 20, 12, and 6
SRT: sludge retention time, T: thermophilic, M: mesophilic, MW: microwave. a Samples were pretreated at a constantheating ramp rate of 2.25 C/min.
3.3. Analytical Methodology
Once steady-state conditions were reached during each operational phase (after a period correspondingto minimum three SRTs), anaerobically digested sludge samples (n = 3 or 4) were taken from thedigesters’ effluent streams for the simultaneous detection and quantification of target compounds(analytes: parent compound [TCS] and its five transformation products [triclosan O-β-d-glucuronide,triclosan-O-Sulfate, chlorophenoxyphenol derivatives (tetra-III and penta), and chlorophenol derivative(2,3,4-trichlorophenol)]), and characterization of digesters performance via conventional parameters.For quantification of the target compounds in control digester feed (mixed sludge), a total of 15independent undigested mixed sludge samples were analyzed (between the months of December toMay). For sample preparation, after sampling, thickened WAS and fermented primary sludge sampleswere first mixed in the laboratory at a volume % ratio of 67:33, respectively (based on the plant’soperation), then the mixed sample was processed for TCS quantification (Figure 1). Additionally, twoindependent batches of samples were taken from the plant during September to assess the effectiveness ofMW pretreatment itself on these target compounds’ concentrations. MW treated mixed sludge samples(4 samples in total) were prepared by mixing pretreated thickened WAS and raw fermented primarysludge samples at a volume % ratio of 67:33. Then TCS quantification was done for the pretreatedmixed sludge samples along with the unpretreated mixed sludge (prepared the same way describedabove) (Figure 2). Although other TCS transformation products have been detected in literature (i.e.,methyl-triclosan, 2,8-dichlorodibenzo-p-dioxin), the compounds selected for this study were based onthe availability of native standards and their suitability for UHPLC analysis.
62
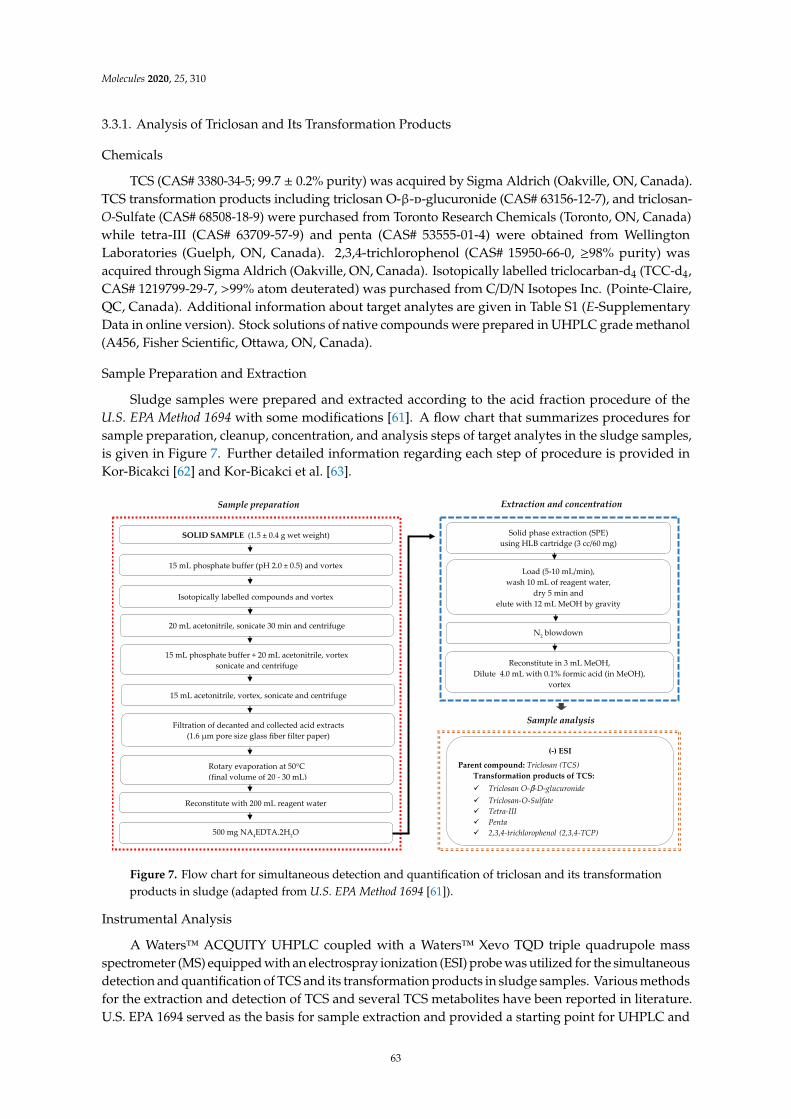
Molecules 2020, 25, 310
3.3.1. Analysis of Triclosan and Its Transformation Products
Chemicals
TCS (CAS# 3380-34-5; 99.7 ± 0.2% purity) was acquired by Sigma Aldrich (Oakville, ON, Canada).TCS transformation products including triclosan O-β-d-glucuronide (CAS# 63156-12-7), and triclosan-O-Sulfate (CAS# 68508-18-9) were purchased from Toronto Research Chemicals (Toronto, ON, Canada)while tetra-III (CAS# 63709-57-9) and penta (CAS# 53555-01-4) were obtained from WellingtonLaboratories (Guelph, ON, Canada). 2,3,4-trichlorophenol (CAS# 15950-66-0, ≥98% purity) wasacquired through Sigma Aldrich (Oakville, ON, Canada). Isotopically labelled triclocarban-d4 (TCC-d4,CAS# 1219799-29-7, >99% atom deuterated) was purchased from C/D/N Isotopes Inc. (Pointe-Claire,QC, Canada). Additional information about target analytes are given in Table S1 (E-SupplementaryData in online version). Stock solutions of native compounds were prepared in UHPLC grade methanol(A456, Fisher Scientific, Ottawa, ON, Canada).
Sample Preparation and Extraction
Sludge samples were prepared and extracted according to the acid fraction procedure of theU.S. EPA Method 1694 with some modifications [61]. A flow chart that summarizes procedures forsample preparation, cleanup, concentration, and analysis steps of target analytes in the sludge samples,is given in Figure 7. Further detailed information regarding each step of procedure is provided inKor-Bicakci [62] and Kor-Bicakci et al. [63].
Molecules 2020, 25, x 13 of 19
compounds selected for this study were based on the availability of native standards and their suitability for UHPLC analysis.
3.3.1. Analysis of Triclosan and Its Transformation Products
Chemicals
TCS (CAS# 3380-34-5; 99.7 ± 0.2% purity) was acquired by Sigma Aldrich (Oakville, ON, Canada). TCS transformation products including triclosan O-β-D-glucuronide (CAS# 63156-12-7), and triclosan-O-Sulfate (CAS# 68508-18-9) were purchased from Toronto Research Chemicals (Toronto, ON, Canada) while tetra-III (CAS# 63709-57-9) and penta (CAS# 53555-01-4) were obtained from Wellington Laboratories (Guelph, ON, Canada). 2,3,4-trichlorophenol (CAS# 15950-66-0, ≥98% purity) was acquired through Sigma Aldrich (Oakville, ON, Canada). Isotopically labelled triclocarban-d4 (TCC-d4, CAS# 1219799-29-7, >99% atom deuterated) was purchased from C/D/N Isotopes Inc. (Pointe-Claire, QC, Canada). Additional information about target analytes are given in Table S1 (E-Supplementary Data in online version). Stock solutions of native compounds were prepared in UHPLC grade methanol (A456, Fisher Scientific, Ottawa, ON, Canada).
Sample Preparation and Extraction
Sludge samples were prepared and extracted according to the acid fraction procedure of the U.S. EPA Method 1694 with some modifications [61]. A flow chart that summarizes procedures for sample preparation, cleanup, concentration, and analysis steps of target analytes in the sludge samples, is given in Figure 7. Further detailed information regarding each step of procedure is provided in Kor-Bicakci [62] and Kor-Bicakci et al. [63].
Figure 7. Flow chart for simultaneous detection and quantification of triclosan and its transformation products in sludge (adapted from U.S. EPA Method 1694 [61]).
Instrumental Analysis
A Waters™ ACQUITY UHPLC coupled with a Waters™ Xevo TQD triple quadrupole mass spectrometer (MS) equipped with an electrospray ionization (ESI) probe was utilized for the simultaneous detection and quantification of TCS and its transformation products in sludge samples.
SOLID SAMPLE (1.5 ± 0.4 g wet weight)
15 mL phosphate buffer (pH 2.0 ± 0.5) and vortex
Isotopically labelled compounds and vortex
20 mL acetonitrile, sonicate 30 min and centrifuge
15 mL phosphate buffer + 20 mL acetonitrile, vortex sonicate and centrifuge
15 mL acetonitrile, vortex, sonicate and centrifuge
Filtration of decanted and collected acid extracts (1.6 μm pore size glass fiber filter paper)
Rotary evaporation at 50°C (final volume of 20 - 30 mL)
Solid phase extraction (SPE) using HLB cartridge (3 cc/60 mg)
Load (5-10 mL/min), wash 10 mL of reagent water,
dry 5 min and elute with 12 mL MeOH by gravity
N2 blowdown
Reconstitute in 3 mL MeOH, Dilute 4.0 mL with 0.1% formic acid (in MeOH),
vortex
(-) ESI
Parent compound: Triclosan (TCS) Transformation products of TCS: Triclosan O-β-D-glucuronide Triclosan-O-Sulfate Tetra-III Penta 2,3,4-trichlorophenol (2,3,4-TCP)
Reconstitute with 200 mL reagent water
500 mg NA4EDTA.2H2O
Sample preparation Extraction and concentration
Sample analysis
Figure 7. Flow chart for simultaneous detection and quantification of triclosan and its transformationproducts in sludge (adapted from U.S. EPA Method 1694 [61]).
Instrumental Analysis
A Waters™ ACQUITY UHPLC coupled with a Waters™ Xevo TQD triple quadrupole massspectrometer (MS) equipped with an electrospray ionization (ESI) probe was utilized for the simultaneousdetection and quantification of TCS and its transformation products in sludge samples. Various methodsfor the extraction and detection of TCS and several TCS metabolites have been reported in literature.U.S. EPA 1694 served as the basis for sample extraction and provided a starting point for UHPLC and
63
Molecules 2020, 25, 310
MS/MS methods. Numerous trials of various aqueous phase additives, UHPLC gradients, mobile phasemodifiers, injection volumes, MS conditions etc. were performed to optimize the chromatography (peakshape and compound separation) and to maximize the sensitivity of the MS, while minimizing noise.However, environmental levels of TCS (non-spiked) and the limited biodegradability of TCS during ADresulted in even lower TCS metabolite levels that were challenging to quantify. Furthermore, the lowmass to charge ratio (m/z) of TCS fragment ions as well as the fragment ions of several TCS metabolitesmade ultra-low detection and quantification limits difficult in such a complex sludge matrix.
After multiple trials, the following analysis conditions were selected. The UHPLC was run usingan aqueous mobile phase of 5 mM of UHPLC grade ammonium acetate (AX1222-5, VWR, Mississauga,ON, Canada) solution and an organic phase of UHPLC grade methanol. Analytes were separated usinga Waters™ Ethylene Bridged Hybrid C18 (2.1 × 50 mm, 1.7 µm) column and matching guard column.MS acquisition was performed in multiple reaction monitoring (MRM) using the negative ion mode(ESI-) for each analyte. Retention times of analytes were within ±15 s of a native compound as per U.S.EPA Method 1694 [61]. Further details regarding optimized MS/MS conditions used for each analytequantification are provided in the Supplemental Information in Table S2 (E-Supplementary File).
Method Validation
A multi-point calibration curve was prepared from native compounds to quantify each analyte(minimum of 8 and maximum of 12 calibration points). Quantification was performed by an isotopedilution technique using isotopically labelled TCC-d4 as an internal standard. Good linearity wasyielded with a correlation coefficients (R2) ≥ 0.98 for all analytes. The instrument limit of detection(LOD) and limit of quantification (LOQ) were calculated using the signal-to-noise ratio of 3 and 10 orgreater in native standards or 9 in samples, respectively. Recoveries for most analytes were within theEPA recommended range of 70%–130% with some exceptions [61]. Compound-specific LODs, LOQs,reporting limits, and recoveries are provided in Table S3 (E-Supplementary Data).
Mass Loading Calculation for Triclosan
The daily rate of TCS mass exiting from the conventional and advanced AD system (as anaerobicallydigested sludge) was calculated with Equation (1):
Me f f = Qe f f × TSe f f × Ce f f (1)
Meff = Daily TCS mass loading in the effluent of the digester (ng/d),Qeff = Flow rate of anaerobically digested sludge (digestate) (mL/d),TSeff = Total solids concentration of anaerobically digested sludge (% by weight), andCeff = TCS concentration in anaerobically digested sludge (ng/g-dry).
The reduction percentage of TCS mass loading exiting from MW-pretreated digesters comparedto the respective control digesters was then calculated from Equation (2):
TCS reduction (%) =Mcontrol digester −Mmicrowave pretreated digester
Mcontrol digester× 100 (2)
Mcontrol digester = Daily TCS mass loading in the effluent of the control digester (ng/d), andMmicrowave pretreated digester = Daily TCS mass loading in the effluent of MW-pretreated digester (ng/d).
3.3.2. Conventional Parameters
Total solids, VS, COD, pH, alkalinity, and ammonia were analyzed according to StandardMethods [64] procedures 2540 B, 2540 E, 5250 D, 4500-H+B, 2320 B, and 4500-NH3D, respectively.Digester biogas was collected in Tedlar® bags and was measured daily by a U-Tube type manometer,
64
Molecules 2020, 25, 310
while its composition was analyzed by an Agilent 7820A Gas Chromatograph equipped with a thermalconductivity detector [65]. Total VFAs (sum of acetic, propionic and butyric acids) were measuredby an Agilent 7890A Gas Chromatograph with a flame ionization detector and Agilent 19091F-112capillary column [66].
3.4. Statistical Analysis
The experimental data were analyzed with an analysis of variance (ANOVA) considering a 95%confidence interval (α = 0.05), using Minitab™ 17 statistical software.
4. Conclusions
This study assessed the behavior of the antimicrobial TCS in MW-pretreated and anaerobically digestedmunicipal sludges under various process conditions by batch MW pretreatment and semi-continuousflow AD experiments, respectively. The combined effect of AD coupled with MW pretreatment onthe occurrence of TCS in wastewater sludge was studied for the first time. All digesters maintainedsteady-state operation during each of the three SRTs studied. Slight inhibition was observed in thethermophilic digesters operated at the 6-day SRT; nevertheless, these digesters continued producingdaily biogas with a typical methane content of 65%. Initial batch pretreatment studies indicated thatTCS levels in mixed sludge after MW pretreatment applied at 80 or 160 C did not significantly changein comparison to un-pretreated sludge. Compared to conventional AD, the combination of anaerobicsludge digestion with MW pretreatment moderately favored the reduction of TCS levels in digestedsludge. The advanced thermophilic digesters achieved up to 46% TCS reduction from digested sludgeover the respective controls. Compared to the thermophilic temperature, the mesophilic digestertemperature was less effective on decreasing TCS levels in digested sludge (up to 37%). Higher TCSconcentrations were observed in undigested and anaerobically digested municipal sludges duringcolder sludge sampling periods. This study confirmed the impacts of seasonal temperature variationson the levels of TCS in municipal wastewater sludge. Although TCS concentrations varied seasonally,MW pretreatment was effective in decreasing TCS levels in anaerobically digested sludge whencombined with AD.
Supplementary Materials: The following are available online, Table S1: Further information about triclosan andfive of its transformation products, Table S2: Optimized MS/MS conditions used for each analyte quantification,and Table S3: Validation of developed method for each analyte.
Author Contributions: Conceptualization, G.K.-B., E.U.-C. and C.E.; methodology, G.K.-B., T.A., E.U.-C. and C.E.;formal analysis, G.K.-B. and T.A.; investigation and writing—original draft preparation, G.K.-B.; writing—reviewand editing, T.A., E.U.-C., and C.E.; supervision, E.U.-C. and C.E.; funding acquisition, G.K.-B. and C.E. Allauthors have read and agreed to the published version of the manuscript.
Funding: This research was funded by “The Scientific and Technological Research Council of Turkey (TUBITAK)—International Research Fellowship Program (2214/A)” and “The Natural Sciences and Engineering ResearchCouncil (NSERC)—Collaborative Research and Development Grant (No: J462765-13)”.
Acknowledgments: The authors would like to thank TUBITAK and NSERC for their financial support.
Conflicts of Interest: The authors declare no conflict of interest. The funders had no role in the design of thestudy; in the collection, analyses, or interpretation of data; in the writing of the manuscript, or in the decision topublish the results.
References
1. Ex-Post Evaluation of Certain Waste Stream Directives—Final Report; EC—DG Environment European Commission:Neuilly-sur-Seine, France, 18 April 2014.
2. Kor-Bicakci, G.; Eskicioglu, C. Recent developments on thermal municipal sludge pretreatment technologiesfor enhanced anaerobic digestion. Renew. Sustain. Energy Rev. 2019, 110, 423–443. [CrossRef]
3. Appels, L.; Baeyens, J.; Degrève, J.; Dewil, R. Principles and potential of the anaerobic digestion ofwaste-activated sludge. Prog. Energy Combust. Sci. 2008, 34, 755–781. [CrossRef]
65
Molecules 2020, 25, 310
4. Venkatesan, A.K.; Done, H.Y.; Halden, R.U. United States National Sewage Sludge Repository at Arizona StateUniversity-a new resource and research tool for environmental scientists, engineers, and epidemiologists.Environ. Sci. Pollut. Res. 2015, 22, 1577–1586. [CrossRef] [PubMed]
5. Venkatesan, A.K.; Halden, R.U. Wastewater treatment plants as chemical observatories to forecast ecologicaland human health risks of manmade chemicals. Sci. Rep. 2014, 4, 3731. [CrossRef] [PubMed]
6. Clarke, B.O.; Smith, S.R. Review of ‘emerging’ organic contaminants in biosolids and assessment of internationalresearch priorities for the agricultural use of biosolids. Environ. Int. 2011, 37, 226–247. [CrossRef] [PubMed]
7. Verlicchi, P.; Zambello, E. Pharmaceuticals and personal care products in untreated and treated sewage sludge:Occurrence and environmental risk in the case of application on soil—A critical review. Sci. Total Environ.2015, 538, 750–767. [CrossRef]
8. McClellan, K.; Halden, R.U. Pharmaceuticals and personal care products in archived US biosolids from the2001 EPA national sewage sludge survey. Water Res. 2010, 44, 658–668. [CrossRef]
9. McAvoy, D.C.; Schatowitz, B.; Jacob, M.; Hauk, A.; Eckhoff, W.S. Measurement of triclosan in wastewatertreatment systems. Environ. Toxicol. Chem. 2002, 21, 1323–1329. [CrossRef]
10. Halden, R.U. On the need and speed of regulating triclosan and triclocarban in the United States. Environ.Sci. Technol. 2014, 48, 3603–3611. [CrossRef]
11. Halden, R.U.; Paull, D.H. Co-occurrence of triclocarban and triclosan in U.S. water resources. Environ. Sci.Technol. 2005, 39, 1420–1426. [CrossRef]
12. Heidler, J.; Halden, R.U. Meta-analysis of mass balances examining chemical fate during wastewatertreatment. Environ. Sci. Technol. 2008, 42, 6324–6332. [CrossRef] [PubMed]
13. Reiss, R.; Mackay, N.; Habig, C.; Griffin, J. An ecological risk assessment for triclosan in lotic systemsfollowing discharge from wastewater treatment plants in the United States. Environ. Toxicol. Chem. 2002, 21,2483–2492. [CrossRef] [PubMed]
14. Dann, A.B.; Hontela, A. Triclosan: Environmental exposure, toxicity and mechanisms of action. J. Appl.Toxicol. 2011, 31, 285–311. [CrossRef] [PubMed]
15. Ying, G.-G.; Yu, X.-Y.; Kookana, R.S. Biological degradation of triclocarban and triclosan in a soil underaerobic and anaerobic conditions and comparison with environmental fate modelling. Environ. Pollut.2007, 150, 300–305. [CrossRef]
16. Tohidi, F.; Cai, Z. GC/MS analysis of triclosan and its degradation by-products in wastewater and sludgesamples from different treatments. Environ. Sci. Pollut. Res. 2015, 22, 11387–11400. [CrossRef]
17. Chen, X.; Casas, M.E.; Nielsen, J.L.; Wimmer, R.; Bester, K. Identification of Triclosan-O-Sulfate and othertransformation products of Triclosan formed by activated sludge. Sci. Total Environ. 2015, 505, 39–46.[CrossRef]
18. Armstrong, D.L.; Rice, C.P.; Ramirez, M.; Torrents, A. Influence of thermal hydrolysis-anaerobic digestiontreatment of wastewater solids on concentrations of triclosan, triclocarban, and their transformation productsin biosolids. Chemosphere 2017, 171, 609–616. [CrossRef]
19. Canosa, P.; Morales, S.; Rodriguez, I.; Rubi, E.; Cela, R.; Gomez, M. Aquatic degradation of triclosan andformation of toxic chlorophenols in presence of low concentrations of free chlorine. Anal. Bioanal. Chem.2005, 383, 1119–1126. [CrossRef]
20. Verlicchi, P.; Al Aukidy, M.; Zambello, E. Occurrence of pharmaceutical compounds in urban wastewater:Removal, mass load and environmental risk after a secondary treatment-A review. Sci. Total Environ.2012, 429, 123–155. [CrossRef]
21. Pycke, B.F.G.; Roll, I.B.; Brownawell, B.J.; Kinney, C.A.; Furlong, E.T.; Kolpin, D.W.; Halden, R.U.Transformation Products and Human Metabolites of Triclocarban and Triclosan in Sewage Sludge Across theUnited States. Environ. Sci. Technol. 2014, 48, 7881–7890. [CrossRef]
22. Tohidi, F.; Cai, Z. Fate and mass balance of triclosan and its degradation products: Comparison of threedifferent types of wastewater treatments and aerobic/anaerobic sludge digestion. J. Hazard. Mater. 2017, 323Pt A, 329–340. [CrossRef]
23. Targeted National Sewage Sludge Survey Sampling and Analysis Technical Report; EPA, U.S. EnvironmentalProtection Agency: Washington, DC, USA, 2009.
24. Heidler, J.; Halden, R.U. Mass balance assessment of triclosan removal during conventional sewage treatment.Chemosphere 2007, 66, 362–369. [CrossRef] [PubMed]
66
Molecules 2020, 25, 310
25. Lozano, N.; Rice, C.P.; Ramirez, M.; Torrents, A. Fate of triclosan and methyltriclosan in soil from biosolidsapplication. Environ. Pollut. 2012, 160, 103–108. [CrossRef] [PubMed]
26. Heidler, J.; Halden, R.U. Fate of organohalogens in US wastewater treatment plants and estimated chemicalreleases to soils nationwide from biosolids recycling. J. Environ. Monitor. 2009, 11, 2207–2215. [CrossRef][PubMed]
27. Kolpin, D.W.; Furlong, E.T.; Meyer, M.T.; Thurman, E.M.; Zaugg, S.D.; Barber, L.B.; Buxton, H.T.Pharmaceuticals, hormones, and other organic wastewater contaminants in U.S. streams, 1999−2000:A National Reconnaissance. Environ. Sci. Technol. 2002, 36, 1202–1211. [CrossRef] [PubMed]
28. Dhillon, G.S.; Kaur, S.; Pulicharla, R.; Brar, S.K.; Cledon, M.; Verma, M.; Surampalli, R.Y. Triclosan: Currentstatus, occurrence, environmental risks and bioaccumulation potential. Int. J. Environ. Res. Public Health2015, 12, 5657–5684. [CrossRef]
29. Sherburne, J.J.; Anaya, A.M.; Fernie, K.J.; Forbey, J.S.; Furlong, E.T.; Kolpin, D.W.; Dufty, A.M.; Kinney, C.A.Occurrence of triclocarban and triclosan in an agro-ecosystem following application of biosolids. Environ. Sci.Technol. 2016, 50, 13206–13214. [CrossRef]
30. Calafat, A.M.; Ye, X.; Wong, L.Y.; Reidy, J.A.; Needham, L.L. Urinary concentrations of triclosan in the U.S.population: 2003–2004. Environ. Health Perspect. 2008, 116, 303–307. [CrossRef]
31. Allmyr, M.; Harden, F.; Toms, L.M.; Mueller, J.F.; McLachlan, M.S.; Adolfsson-Erici, M.; Sandborgh-Englund, G.The influence of age and gender on triclosan concentrations in Australian human blood serum. Sci. TotalEnviron. 2008, 393, 162–167. [CrossRef]
32. Dayan, A.D. Risk assessment of triclosan [Irgasan] in human breast milk. Food Chem. Toxicol. 2007, 45, 125–129.[CrossRef]
33. Pycke, B.F.; Geer, L.A.; Dalloul, M.; Abulafia, O.; Jenck, A.M.; Halden, R.U. Human fetal exposure to triclosanand triclocarban in an urban population from Brooklyn, New York. Environ. Sci. Technol. 2014, 48, 8831–8838.[CrossRef] [PubMed]
34. Halden, R.U.; Lindeman, A.E.; Aiello, A.E.; Andrews, D.; Arnold, W.A.; Fair, P.; Fuoco, R.E.; Geer, L.A.;Johnson, P.I.; Lohmann, R.; et al. The Florence Statement on Triclosan and Triclocarban. Environ. Health Perspect.2017, 125, 064501. [CrossRef] [PubMed]
35. Buth, J.M.; Steen, P.O.; Sueper, C.; Blumentritt, D.; Vikesland, P.J.; Arnold, W.A.; McNeill, K. Dioxinphotoproducts of triclosan and its chlorinated derivatives in sediment cores. Environ. Sci. Technol. 2010, 44,4545–4551. [CrossRef] [PubMed]
36. Fiss, E.M.; Rule, K.L.; Vikesland, P.J. Formation of chloroform and other chlorinated byproducts by chlorinationof triclosan-containing antibacterial products. Environ. Sci. Technol. 2007, 41, 2387–2394. [CrossRef] [PubMed]
37. Buth, J.M.; Grandbois, M.; Vikesland, P.J.; McNeill, K.; Arnold, W.A. Aquatic photochemistry of chlorinatedtriclosan derivatives: Potential source of polychlorodibenzo-p-dioxins. Environ. Toxicol. Chem. 2009, 28, 2555–2563.[CrossRef] [PubMed]
38. Lozano, N.; Rice, C.P.; Ramirez, M.; Torrents, A. Fate of triclocarban, triclosan and methyltriclosan duringwastewater and biosolids treatment processes. Water Res. 2013, 47, 4519–4527. [CrossRef]
39. Yu, B.; Zheng, G.; Wang, X.; Wang, M.; Chen, T. Biodegradation of triclosan and triclocarban in sewage sludgeduring composting under three ventilation strategies. Front. Environ. Sci. Eng. 2019, 13, 41. [CrossRef]
40. Zheng, G.; Yu, B.; Wang, Y.; Ma, C.; Chen, T. Removal of triclosan during wastewater treatment process andsewage sludge composting—A case study in the middle reaches of the Yellow River. Environ. Int. 2020, 134,105300. [CrossRef]
41. Zuloaga, O.; Navarro, P.; Bizkarguenaga, E.; Iparraguirre, A.; Vallejo, A.; Olivares, M.; Prieto, A. Overview ofextraction, clean-up and detection techniques for the determination of organic pollutants in sewage sludge:A review. Anal. Chim. Acta. 2012, 736, 7–29. [CrossRef]
42. Gonzalez-Gil, L.; Papa, M.; Feretti, D.; Ceretti, E.; Mazzoleni, G.; Steimberg, N.; Pedrazzani, R.; Bertanza, G.;Lema, J.M.; Carballa, M. Is anaerobic digestion effective for the removal of organic micropollutants andbiological activities from sewage sludge? Water Res. 2016, 102, 211–220. [CrossRef]
43. Narumiya, M.; Nakada, N.; Yamashita, N.; Tanaka, H. Phase distribution and removal of pharmaceuticals andpersonal care products during anaerobic sludge digestion. J. Hazard. Mater. 2013, 260, 305–312. [CrossRef][PubMed]
67
Molecules 2020, 25, 310
44. Samaras, V.G.; Stasinakis, A.S.; Mamais, D.; Thomaidis, N.S.; Lekkas, T.D. Fate of selected pharmaceuticalsand synthetic endocrine disrupting compounds during wastewater treatment and sludge anaerobic digestion.J. Hazard. Mater. 2013, 244, 259–267. [CrossRef] [PubMed]
45. Barber, W.P.F. Thermal hydrolysis for sewage treatment: A critical review. Water Res. 2016, 104, 53–71.[CrossRef] [PubMed]
46. Tyagi, V.K.; Lo, S.-L. Microwave irradiation: A sustainable way for sludge treatment and resource recovery.Renew. Sustain. Energy Rev. 2013, 18, 288–305. [CrossRef]
47. Cirja, M.; Ivashechkin, P.; Schäffer, A.; Corvini, P.F.X. Factors affecting the removal of organic micropollutantsfrom wastewater in conventional treatment plants (CTP) and membrane bioreactors (MBR). Rev. Environ.Sci. Biol. 2008, 7, 61–78. [CrossRef]
48. Guerra, P.; Kleywegt, S.; Payne, M.; Svoboda, M.L.; Lee, H.B.; Reiner, E.; Kolic, T.; Metcalfe, C.; Smyth, S.A.Occurrence and Fate of Trace Contaminants during Aerobic and Anaerobic Sludge Digestion and Dewatering.J. Environ. Qual. 2015, 44, 1193–1200. [CrossRef]
49. Trinh, T.; van den Akker, B.; Coleman, H.M.; Stuetz, R.M.; Drewes, J.E.; Le-Clech, P.; Khan, S.J. Seasonalvariations in fate and removal of trace organic chemical contaminants while operating a full-scale membranebioreactor. Sci. Total Environ. 2016, 550, 176–183. [CrossRef]
50. Hydromantis Inc. Emerging Substances of Concern in Biosolids: Concentrations and Effects of Treatment Processes;Final Report—Field Sampling Program, CCME Project #447-2009; Canadian Council of Ministers of theEnvironment: Winnipeg, MB, Canada, 2010.
51. Lee, H.B.; Peart, T.E. Organic contaminants in Canadian municipal sewage sludge. Part I. Toxic orendocrine-disrupting phenolic compounds. Water Qual Res J Can 2002, 37, 681–696. [CrossRef]
52. Nüchter, M.; Ondruschka, B.; Bonrath, W.; Gum, A. Microwave assisted synthesis—A critical technologyoverview. Green Chem. 2004, 6, 128–141. [CrossRef]
53. Ross, J.J.; Zitomer, D.H.; Miller, T.R.; Weirich, C.A.; McNamara, P.J. Emerging investigators series: Pyrolysisremoves common microconstituents triclocarban, triclosan, and nonylphenol from biosolids. Environ. Sci.Water Res. Technol. 2016, 2, 282–289. [CrossRef]
54. Kor-Bicakci, G.; Ubay-Cokgor, E.; Eskicioglu, C. Effect of dewatered sludge microwave pretreatmenttemperature and duration on net energy generation and biosolids quality from anaerobic digestion. Energy2019, 168, 782–795. [CrossRef]
55. Hosseini Koupaie, E.; Eskicioglu, C. Conventional heating vs. microwave sludge pretreatment comparisonunder identical heating/cooling profiles for thermophilic advanced anaerobic digestion. Waste Manag.2016, 53, 182–195. [CrossRef] [PubMed]
56. Hamid, H.; Eskicioglu, C. Effect of microwave hydrolysis on transformation of steroidal hormones duringanaerobic digestion of municipal sludge cake. Water Res. 2013, 47, 4966–4977. [CrossRef] [PubMed]
57. Guerra, P.; Kim, M.; Shah, A.; Alaee, M.; Smyth, S.A. Occurrence and fate of antibiotic, analgesic/anti-inflammatory, and antifungal compounds in five wastewater treatment processes. Sci. Total Environ.2014, 473, 235–243. [CrossRef] [PubMed]
58. Chu, S.G.; Metcalfe, C.D. Simultaneous determination of triclocarban and triclosan in municipal biosolidsby liquid chromatography tandem mass spectrometry. J. Chromatogr. A 2007, 1164, 212–218. [CrossRef][PubMed]
59. Ahmad, M.; Abbott, T.; Eskicioglu, C. Effectiveness of single-stage and sequential sludge digestion onremoval of recalcitrant pharmaceuticals and conventional pollutants. Bioresour. Technol. Rep. 2019, 8, 100326.[CrossRef]
60. Hosseini Koupaie, E.; Johnson, T.; Eskicioglu, C. Comparison of Different Electricity-Based ThermalPretreatment Methods for Enhanced Bioenergy Production from Municipal Sludge. Molecules 2018, 23, 2006.[CrossRef]
61. Pharmaceuticals and Personal Care Products in Water, Soil, Sediment, and Biosolids by HPLC/MS/MS,EPA-821-R-08-002; U.S. Environmental Protection Agency (USEPA): Washington, DC, USA, 2007.
62. Kor-Bicakci, G. Effect of Microwave Pretreatment on Fate of Antimicrobials and Conventional Pollutants duringAnaerobic Sludge Digestion and Biosolids Quality for Land Application. Ph.D. Thesis, Istanbul TechnicalUniversity, Graduate School of Science Engineering and Technology, Istanbul, Turkey, December 2018.
68
Molecules 2020, 25, 310
63. Kor-Bicakci, G.; Abbott, T.; Ubay-Cokgor, E.; Eskicioglu, C. Effect of microwave pretreatment on removal oftriclosan during anaerobic digestion of wastewater treatment sludge. In Proceedings of the Water EnvironmentFederation; WEFTEC: Alexandria, VA, USA, 2017.
64. Standard Methods, 20th ed.; Standard Methods for the Examination of Water and Wastewater; AmericanPublic Health Association/American Water Works Association/Water Environment Federation: Washington,DC, USA, 2005.
65. van Huyssteen, J.J. Gas chromatographic separation of anaerobic digester gases using porous polymers.Water Res. 1967, 1, 237–242. [CrossRef]
66. Ackman, R.G. Porous polymer bead packings and formic acid vapor in the GLC of volatile free fatty acids.J. Chromatogr. Sci. 1972, 10, 560–565. [CrossRef]
Sample Availability: Samples of the compounds are not available from the authors.
© 2020 by the authors. Licensee MDPI, Basel, Switzerland. This article is an open accessarticle distributed under the terms and conditions of the Creative Commons Attribution(CC BY) license (http://creativecommons.org/licenses/by/4.0/).
69

molecules
Article
Biogas Production from Physicochemically PretreatedGrass Lawn Waste: Comparison of DifferentProcess Schemes
Georgia Antonopoulou 1,*, Dimitrios Vayenas 1,2 and Gerasimos Lyberatos 1,3
1 Institute of Chemical Engineering Sciences, Stadiou, Platani, GR 26504 Patras, Greece;[email protected] (D.V.); [email protected] (G.L.)
2 Department of Chemical Engineering, University of Patras, GR 26500 Patras, Greece3 School of Chemical Engineering, National Technical University of Athens, GR 15780 Athens, Greece* Correspondence: [email protected]; Tel.: +30-26-1096-5318
Received: 8 December 2019; Accepted: 9 January 2020; Published: 11 January 2020
Abstract: Various pretreatment methods, such as thermal, alkaline and acid, were applied on grasslawn (GL) waste and the effect of each pretreatment method on the Biochemical Methane Potential wasevaluated for two options, namely using the whole slurry resulting from pretreatment or the separatesolid and liquid fractions obtained. In addition, the effect of each pretreatment on carbohydratesolubilization and lignocellulossic content fractionation (to cellulose, hemicellulose, lignin) was alsoevaluated. The experimental results showed that the methane yield was enhanced with alkalinepretreatment and, the higher the NaOH concentration (20 g/100 gTotal Solids (TS)), the higher was themethane yield observed (427.07 L CH4/kg Volatile Solids (VS), which was almost 25.7% higher than theBMP of the untreated GL). Comparing the BMP obtained under the two options, i.e., that of the wholepretreatment slurry with the sum of the BMPs of both fractions, it was found that direct anaerobicdigestion without separation of the pretreated biomass was favored, in almost all cases. A preliminaryenergy balance and economic assessment indicated that the process could be sustainable, leading to apositive net heat energy only when using a more concentrated pretreated slurry (i.e., 20% organicloading), or when applying NaOH pretreatment at a lower chemical loading.
Keywords: grass lawn waste; anaerobic digestion; biochemical methane potential; pretreatment;whole slurry; separated fractions; alkali; acid; energy balance; economical assessment
1. Introduction
Anaerobic digestion (AD) is a mature and well-established technology worldwide for producingbioenergy in the form of methane. In order to improve its efficiency and reduce the process cost,many efforts have been made on finding alternative feedstocks, based on their availability andrenewability [1]. Grass lawn (GL) waste coming from gardening or cuttings of sports fields, is nowadaysan abundant carbon source, accounting for a significant fraction of organic municipal solid waste(biowaste) [2,3] and is generated even on a daily basis throughout the developed countries. Currently,this waste stream is usually burned, discarded or disposed in landfills [4], depending on the solidwaste management strategy, which is followed by a specific country, causing environmental problems.
However, this type of waste is a valuable source of bioenergy, due to its high organic- andspecifically carbohydrate-content [5], which remains unexploitable. Thus the possibility of using GLwaste as alternative biomass feedstock for AD is quite appealing. Despite its potential use, the complexlignocellulosic structure of GL waste, limits the accessibility of microorganisms and enzymes, restrictingthus its digestion. For this reason, an appropriate pretreatment method should be applied in order toremove the structural and compositional barriers and to improve the AD yields [1]. For GL waste,
71
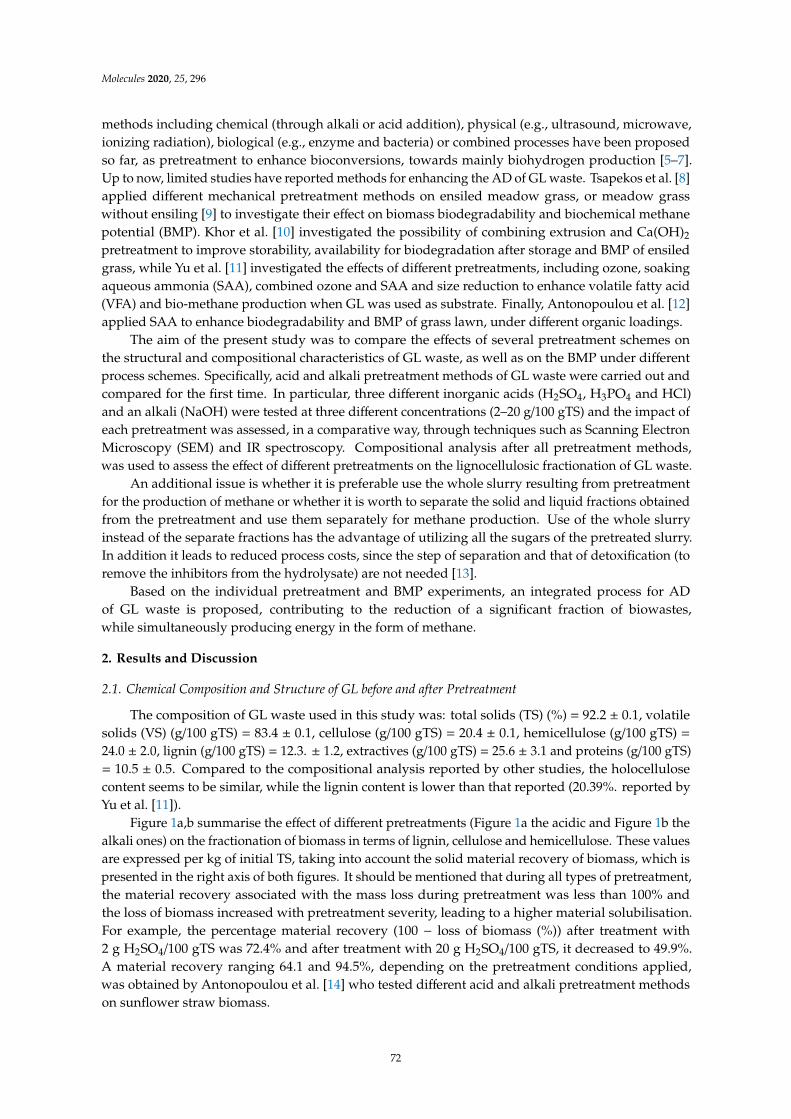
Molecules 2020, 25, 296
methods including chemical (through alkali or acid addition), physical (e.g., ultrasound, microwave,ionizing radiation), biological (e.g., enzyme and bacteria) or combined processes have been proposedso far, as pretreatment to enhance bioconversions, towards mainly biohydrogen production [5–7].Up to now, limited studies have reported methods for enhancing the AD of GL waste. Tsapekos et al. [8]applied different mechanical pretreatment methods on ensiled meadow grass, or meadow grasswithout ensiling [9] to investigate their effect on biomass biodegradability and biochemical methanepotential (BMP). Khor et al. [10] investigated the possibility of combining extrusion and Ca(OH)2
pretreatment to improve storability, availability for biodegradation after storage and BMP of ensiledgrass, while Yu et al. [11] investigated the effects of different pretreatments, including ozone, soakingaqueous ammonia (SAA), combined ozone and SAA and size reduction to enhance volatile fatty acid(VFA) and bio-methane production when GL was used as substrate. Finally, Antonopoulou et al. [12]applied SAA to enhance biodegradability and BMP of grass lawn, under different organic loadings.
The aim of the present study was to compare the effects of several pretreatment schemes onthe structural and compositional characteristics of GL waste, as well as on the BMP under differentprocess schemes. Specifically, acid and alkali pretreatment methods of GL waste were carried out andcompared for the first time. In particular, three different inorganic acids (H2SO4, H3PO4 and HCl)and an alkali (NaOH) were tested at three different concentrations (2–20 g/100 gTS) and the impact ofeach pretreatment was assessed, in a comparative way, through techniques such as Scanning ElectronMicroscopy (SEM) and IR spectroscopy. Compositional analysis after all pretreatment methods,was used to assess the effect of different pretreatments on the lignocellulosic fractionation of GL waste.
An additional issue is whether it is preferable use the whole slurry resulting from pretreatmentfor the production of methane or whether it is worth to separate the solid and liquid fractions obtainedfrom the pretreatment and use them separately for methane production. Use of the whole slurryinstead of the separate fractions has the advantage of utilizing all the sugars of the pretreated slurry.In addition it leads to reduced process costs, since the step of separation and that of detoxification (toremove the inhibitors from the hydrolysate) are not needed [13].
Based on the individual pretreatment and BMP experiments, an integrated process for ADof GL waste is proposed, contributing to the reduction of a significant fraction of biowastes,while simultaneously producing energy in the form of methane.
2. Results and Discussion
2.1. Chemical Composition and Structure of GL before and after Pretreatment
The composition of GL waste used in this study was: total solids (TS) (%) = 92.2 ± 0.1, volatilesolids (VS) (g/100 gTS) = 83.4 ± 0.1, cellulose (g/100 gTS) = 20.4 ± 0.1, hemicellulose (g/100 gTS) =
24.0 ± 2.0, lignin (g/100 gTS) = 12.3. ± 1.2, extractives (g/100 gTS) = 25.6 ± 3.1 and proteins (g/100 gTS)= 10.5 ± 0.5. Compared to the compositional analysis reported by other studies, the holocellulosecontent seems to be similar, while the lignin content is lower than that reported (20.39%. reported byYu et al. [11]).
Figure 1a,b summarise the effect of different pretreatments (Figure 1a the acidic and Figure 1b thealkali ones) on the fractionation of biomass in terms of lignin, cellulose and hemicellulose. These valuesare expressed per kg of initial TS, taking into account the solid material recovery of biomass, which ispresented in the right axis of both figures. It should be mentioned that during all types of pretreatment,the material recovery associated with the mass loss during pretreatment was less than 100% andthe loss of biomass increased with pretreatment severity, leading to a higher material solubilisation.For example, the percentage material recovery (100 − loss of biomass (%)) after treatment with2 g H2SO4/100 gTS was 72.4% and after treatment with 20 g H2SO4/100 gTS, it decreased to 49.9%.A material recovery ranging 64.1 and 94.5%, depending on the pretreatment conditions applied,was obtained by Antonopoulou et al. [14] who tested different acid and alkali pretreatment methodson sunflower straw biomass.
72
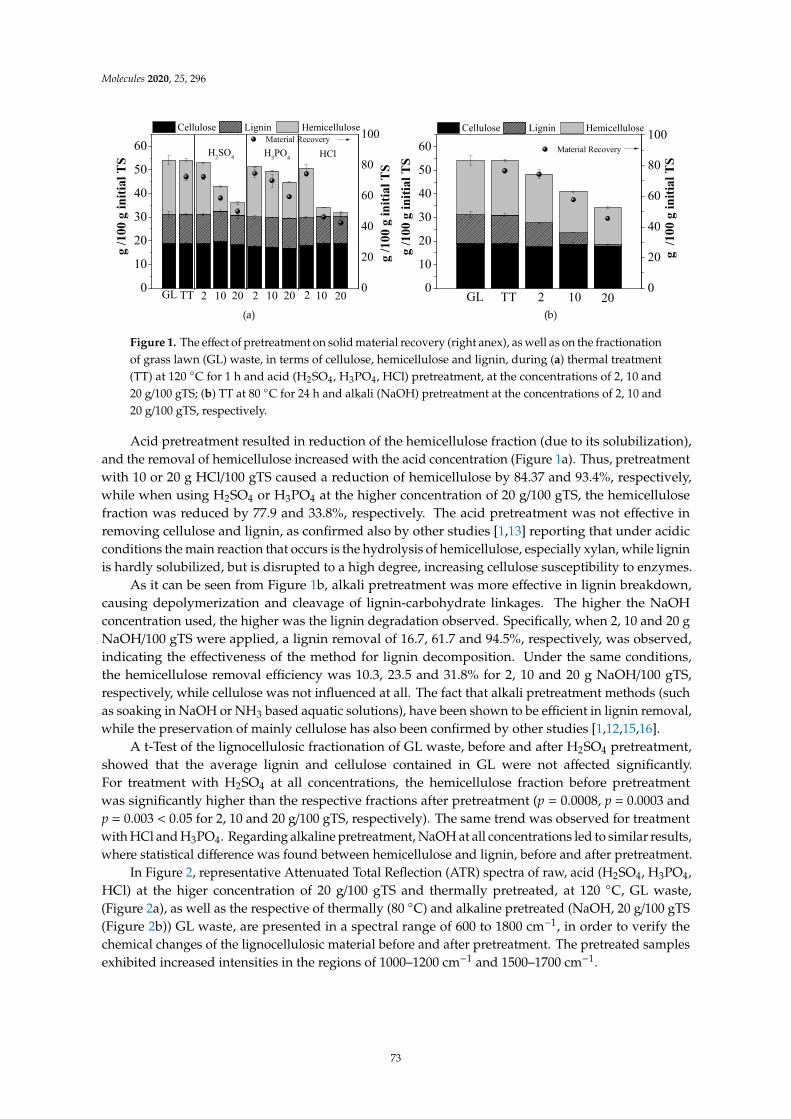
Molecules 2020, 25, 296
Molecules 2019, 24, x FOR PEER REVIEW 3 of 14
conditions applied, was obtained by Antonopoulou et al. [14] who tested different acid and alkali pretreatment methods on sunflower straw biomass.
Figure 1. The effect of pretreatment on solid material recovery (right anex), as well as on the fractionation of grass lawn (GL) waste, in terms of cellulose, hemicellulose and lignin, during (a) thermal treatment (TT) at 120 °C for 1 h and acid (H2SO4, H3PO4, HCl) pretreatment, at the concentrations of 2, 10 and 20 g/100 gTS; (b) TT at 80 °C for 24 h and alkali (NaOH) pretreatment at the concentrations of 2, 10 and 20 g/100 gTS, respectively.
Acid pretreatment resulted in reduction of the hemicellulose fraction (due to its solubilization), and the removal of hemicellulose increased with the acid concentration (Figure 1a). Thus, pretreatment with 10 or 20 g HCl/100 gTS caused a reduction of hemicellulose by 84.37 and 93.4%, respectively, while when using H2SO4 or H3PO4 at the higher concentration of 20 g/100 gTS, the hemicellulose fraction was reduced by 77.9 and 33.8%, respectively. The acid pretreatment was not effective in removing cellulose and lignin, as confirmed also by other studies [1,13] reporting that under acidic conditions the main reaction that occurs is the hydrolysis of hemicellulose, especially xylan, while lignin is hardly solubilized, but is disrupted to a high degree, increasing cellulose susceptibility to enzymes.
As it can be seen from Figure 1b, alkali pretreatment was more effective in lignin breakdown, causing depolymerization and cleavage of lignin-carbohydrate linkages. The higher the NaOH concentration used, the higher was the lignin degradation observed. Specifically, when 2, 10 and 20 g NaOH/100 gTS were applied, a lignin removal of 16.7, 61.7 and 94.5%, respectively, was observed, indicating the effectiveness of the method for lignin decomposition. Under the same conditions, the hemicellulose removal efficiency was 10.3, 23.5 and 31.8% for 2, 10 and 20 g NaOH/100 gTS, respectively, while cellulose was not influenced at all. The fact that alkali pretreatment methods (such as soaking in NaOH or NH3 based aquatic solutions), have been shown to be efficient in lignin removal, while the preservation of mainly cellulose has also been confirmed by other studies [1,12,15,16].
A t-Test of the lignocellulosic fractionation of GL waste, before and after H2SO4 pretreatment, showed that the average lignin and cellulose contained in GL were not affected significantly. For treatment with H2SO4 at all concentrations, the hemicellulose fraction before pretreatment was significantly higher than the respective fractions after pretreatment (p = 0.0008, p = 0.0003 and p = 0.003 < 0.05 for 2, 10 and 20 g/100 gTS, respectively). The same trend was observed for treatment with HCl and H3PO4. Regarding alkaline pretreatment, NaOH at all concentrations led to similar results, where statistical difference was found between hemicellulose and lignin, before and after pretreatment.
In Figure 2, representative Attenuated Total Reflection (ATR) spectra of raw, acid (H2SO4, H3PO4, HCl) at the higer concentration of 20 g/100 gTS and thermally pretreated, at 120 °C, GL waste, (Figure 2a), as well as the respective of thermally (80 °C) and alkaline pretreated (NaOH, 20 g/100 gTS (Figure 2b)) GL waste, are presented in a spectral range of 600 to 1800 cm−1, in order to verify the chemical
(a) (b)
0
10
20
30
40
50
60
20102TT
HClH3PO4
Cellulose Lignin Hemicellulose
g /1
00 g
initi
al T
S
H2SO4
GL 2 10 20 2 10 200
20
40
60
80
100 Material Recovery
g /1
00 g
initi
al T
S
0
10
20
30
40
50
60
g /1
00 g
initi
al T
S
20102TT
Cellulose Lignin Hemicellulose
g /1
00 g
initi
al T
S
GL0
20
40
60
80
100 Material Recovery
Figure 1. The effect of pretreatment on solid material recovery (right anex), as well as on the fractionationof grass lawn (GL) waste, in terms of cellulose, hemicellulose and lignin, during (a) thermal treatment(TT) at 120 C for 1 h and acid (H2SO4, H3PO4, HCl) pretreatment, at the concentrations of 2, 10 and20 g/100 gTS; (b) TT at 80 C for 24 h and alkali (NaOH) pretreatment at the concentrations of 2, 10 and20 g/100 gTS, respectively.
Acid pretreatment resulted in reduction of the hemicellulose fraction (due to its solubilization),and the removal of hemicellulose increased with the acid concentration (Figure 1a). Thus, pretreatmentwith 10 or 20 g HCl/100 gTS caused a reduction of hemicellulose by 84.37 and 93.4%, respectively,while when using H2SO4 or H3PO4 at the higher concentration of 20 g/100 gTS, the hemicellulosefraction was reduced by 77.9 and 33.8%, respectively. The acid pretreatment was not effective inremoving cellulose and lignin, as confirmed also by other studies [1,13] reporting that under acidicconditions the main reaction that occurs is the hydrolysis of hemicellulose, especially xylan, while ligninis hardly solubilized, but is disrupted to a high degree, increasing cellulose susceptibility to enzymes.
As it can be seen from Figure 1b, alkali pretreatment was more effective in lignin breakdown,causing depolymerization and cleavage of lignin-carbohydrate linkages. The higher the NaOHconcentration used, the higher was the lignin degradation observed. Specifically, when 2, 10 and 20 gNaOH/100 gTS were applied, a lignin removal of 16.7, 61.7 and 94.5%, respectively, was observed,indicating the effectiveness of the method for lignin decomposition. Under the same conditions,the hemicellulose removal efficiency was 10.3, 23.5 and 31.8% for 2, 10 and 20 g NaOH/100 gTS,respectively, while cellulose was not influenced at all. The fact that alkali pretreatment methods (suchas soaking in NaOH or NH3 based aquatic solutions), have been shown to be efficient in lignin removal,while the preservation of mainly cellulose has also been confirmed by other studies [1,12,15,16].
A t-Test of the lignocellulosic fractionation of GL waste, before and after H2SO4 pretreatment,showed that the average lignin and cellulose contained in GL were not affected significantly.For treatment with H2SO4 at all concentrations, the hemicellulose fraction before pretreatmentwas significantly higher than the respective fractions after pretreatment (p = 0.0008, p = 0.0003 andp = 0.003 < 0.05 for 2, 10 and 20 g/100 gTS, respectively). The same trend was observed for treatmentwith HCl and H3PO4. Regarding alkaline pretreatment, NaOH at all concentrations led to similar results,where statistical difference was found between hemicellulose and lignin, before and after pretreatment.
In Figure 2, representative Attenuated Total Reflection (ATR) spectra of raw, acid (H2SO4, H3PO4,HCl) at the higer concentration of 20 g/100 gTS and thermally pretreated, at 120 C, GL waste,(Figure 2a), as well as the respective of thermally (80 C) and alkaline pretreated (NaOH, 20 g/100 gTS(Figure 2b)) GL waste, are presented in a spectral range of 600 to 1800 cm−1, in order to verify thechemical changes of the lignocellulosic material before and after pretreatment. The pretreated samplesexhibited increased intensities in the regions of 1000–1200 cm−1 and 1500–1700 cm−1.
73
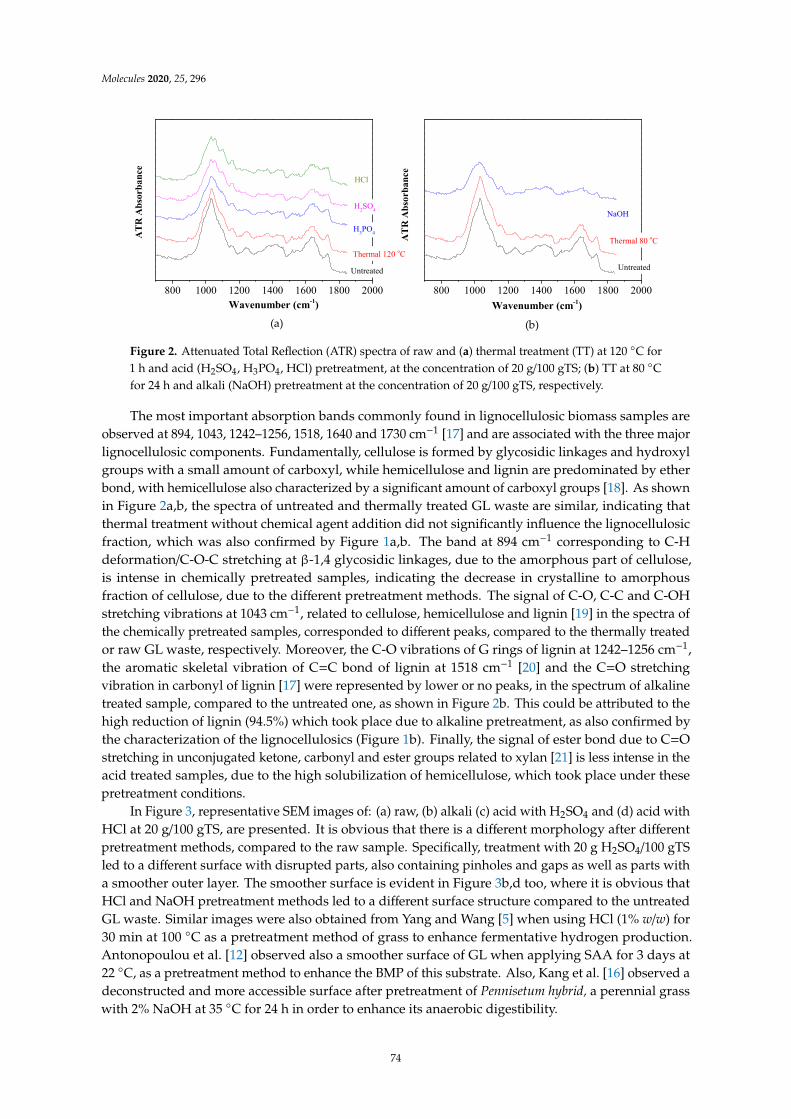
Molecules 2020, 25, 296
Molecules 2019, 24, x FOR PEER REVIEW 4 of 14
changes of the lignocellulosic material before and after pretreatment. The pretreated samples exhibited increased intensities in the regions of 1000–1200 cm−1 and 1500–1700 cm−1.
Figure 2. Attenuated Total Reflection (ATR) spectra of raw and (a) thermal treatment (TT) at 120 °C for 1 h and acid (H2SO4, H3PO4, HCl) pretreatment, at the concentration of 20 g/100 gTS; (b) TT at 80 °C for 24 h and alkali (NaOH) pretreatment at the concentration of 20 g/100 gTS, respectively.
The most important absorption bands commonly found in lignocellulosic biomass samples are observed at 894, 1043, 1242–1256, 1518, 1640 and 1730 cm−1 [17] and are associated with the three major lignocellulosic components. Fundamentally, cellulose is formed by glycosidic linkages and hydroxyl groups with a small amount of carboxyl, while hemicellulose and lignin are predominated by ether bond, with hemicellulose also characterized by a significant amount of carboxyl groups [18]. As shown in Figure 2a,b, the spectra of untreated and thermally treated GL waste are similar, indicating that thermal treatment without chemical agent addition did not significantly influence the lignocellulosic fraction, which was also confirmed by Figure 1a,b. The band at 894 cm−1 corresponding to C-H deformation/C-O-C stretching at β-1,4 glycosidic linkages, due to the amorphous part of cellulose, is intense in chemically pretreated samples, indicating the decrease in crystalline to amorphous fraction of cellulose, due to the different pretreatment methods. The signal of C-O, C-C and C-OH stretching vibrations at 1043 cm−1, related to cellulose, hemicellulose and lignin [19] in the spectra of the chemically pretreated samples, corresponded to different peaks, compared to the thermally treated or raw GL waste, respectively. Moreover, the C-O vibrations of G rings of lignin at 1242–1256 cm−1, the aromatic skeletal vibration of C=C bond of lignin at 1518 cm−1 [20] and the C=O stretching vibration in carbonyl of lignin [17] were represented by lower or no peaks, in the spectrum of alkaline treated sample, compared to the untreated one, as shown in Figure 2b. This could be attributed to the high reduction of lignin (94.5%) which took place due to alkaline pretreatment, as also confirmed by the characterization of the lignocellulosics (Figure 1b). Finally, the signal of ester bond due to C=O stretching in unconjugated ketone, carbonyl and ester groups related to xylan [21] is less intense in the acid treated samples, due to the high solubilization of hemicellulose, which took place under these pretreatment conditions.
In Figure 3, representative SEM images of: (a) raw, (b) alkali (c) acid with H2SO4 and (d) acid with HCl at 20 g/100 gTS, are presented. It is obvious that there is a different morphology after different pretreatment methods, compared to the raw sample. Specifically, treatment with 20 g H2SO4/100 gTS led to a different surface with disrupted parts, also containing pinholes and gaps as well as parts with a smoother outer layer. The smoother surface is evident in Figure 3b,d too, where it is obvious that HCl and NaOH pretreatment methods led to a different surface structure compared to the untreated GL waste. Similar images were also obtained from Yang and Wang [5] when using HCl (1% w/w) for 30 min at 100 °C as a pretreatment method of grass to enhance fermentative hydrogen production. Antonopoulou et al. [12] observed also a smoother surface of GL when applying SAA for 3 days at 22 °C, as a pretreatment method to enhance the BMP of this substrate. Also, Kang et al. [16] observed a deconstructed and more accessible surface after pretreatment of
800 1000 1200 1400 1600 1800 2000
HCl
H2SO4
Untreated
A
TR A
bsor
banc
e
Wavenumber (cm-1)
Thermal 120 oC
H3PO4
800 1000 1200 1400 1600 1800 2000
NaOH
Thermal 80 oC
Untreated
A
TR A
bsor
banc
e
Wavenumber (cm-1)(a) (b)
Figure 2. Attenuated Total Reflection (ATR) spectra of raw and (a) thermal treatment (TT) at 120 C for1 h and acid (H2SO4, H3PO4, HCl) pretreatment, at the concentration of 20 g/100 gTS; (b) TT at 80 Cfor 24 h and alkali (NaOH) pretreatment at the concentration of 20 g/100 gTS, respectively.
The most important absorption bands commonly found in lignocellulosic biomass samples areobserved at 894, 1043, 1242–1256, 1518, 1640 and 1730 cm−1 [17] and are associated with the three majorlignocellulosic components. Fundamentally, cellulose is formed by glycosidic linkages and hydroxylgroups with a small amount of carboxyl, while hemicellulose and lignin are predominated by etherbond, with hemicellulose also characterized by a significant amount of carboxyl groups [18]. As shownin Figure 2a,b, the spectra of untreated and thermally treated GL waste are similar, indicating thatthermal treatment without chemical agent addition did not significantly influence the lignocellulosicfraction, which was also confirmed by Figure 1a,b. The band at 894 cm−1 corresponding to C-Hdeformation/C-O-C stretching at β-1,4 glycosidic linkages, due to the amorphous part of cellulose,is intense in chemically pretreated samples, indicating the decrease in crystalline to amorphousfraction of cellulose, due to the different pretreatment methods. The signal of C-O, C-C and C-OHstretching vibrations at 1043 cm−1, related to cellulose, hemicellulose and lignin [19] in the spectra ofthe chemically pretreated samples, corresponded to different peaks, compared to the thermally treatedor raw GL waste, respectively. Moreover, the C-O vibrations of G rings of lignin at 1242–1256 cm−1,the aromatic skeletal vibration of C=C bond of lignin at 1518 cm−1 [20] and the C=O stretchingvibration in carbonyl of lignin [17] were represented by lower or no peaks, in the spectrum of alkalinetreated sample, compared to the untreated one, as shown in Figure 2b. This could be attributed to thehigh reduction of lignin (94.5%) which took place due to alkaline pretreatment, as also confirmed bythe characterization of the lignocellulosics (Figure 1b). Finally, the signal of ester bond due to C=Ostretching in unconjugated ketone, carbonyl and ester groups related to xylan [21] is less intense in theacid treated samples, due to the high solubilization of hemicellulose, which took place under thesepretreatment conditions.
In Figure 3, representative SEM images of: (a) raw, (b) alkali (c) acid with H2SO4 and (d) acid withHCl at 20 g/100 gTS, are presented. It is obvious that there is a different morphology after differentpretreatment methods, compared to the raw sample. Specifically, treatment with 20 g H2SO4/100 gTSled to a different surface with disrupted parts, also containing pinholes and gaps as well as parts witha smoother outer layer. The smoother surface is evident in Figure 3b,d too, where it is obvious thatHCl and NaOH pretreatment methods led to a different surface structure compared to the untreatedGL waste. Similar images were also obtained from Yang and Wang [5] when using HCl (1% w/w) for30 min at 100 C as a pretreatment method of grass to enhance fermentative hydrogen production.Antonopoulou et al. [12] observed also a smoother surface of GL when applying SAA for 3 days at22 C, as a pretreatment method to enhance the BMP of this substrate. Also, Kang et al. [16] observed adeconstructed and more accessible surface after pretreatment of Pennisetum hybrid, a perennial grasswith 2% NaOH at 35 C for 24 h in order to enhance its anaerobic digestibility.
74
Molecules 2020, 25, 296
Molecules 2019, 24, x FOR PEER REVIEW 5 of 14
Pennisetum hybrid, a perennial grass with 2% NaOH at 35 °C for 24 h in order to enhance its anaerobic digestibility.
Figure 3. SEM images of raw (a), alkali (NaOH) (b) acid (H2SO4) (c) and acid (HCl) (d) pretreatment, at the concentration of 20 g/100 gTS, respectively.
2.2. BMP of GL Waste before and after Pretreatment
2.2.1. BMP of Untreated GL
The calculated methane production, after subtraction of the methane produced from blank experiments was 62.44 ± 0.36 mL, corresponding to a BMP of 260.65 ± 0.04 L CH4/kg GL waste or 282.60 ± 0.04 L CH4/kg TS or 339.86 ± 0.05 L CH4/kg VS. The BMP of the GL waste used in the present study was comparable with that of ensiled meadow grass (372 ± 52 L CH4/kg) [8] and GL (402.5 L CH4/kg) [11], but higher than that of giant reed [22] or common reed [23] (188 L CH4/kg). In any case, the BMP of the untreated GL waste is higher than that of other lignocellulosic feedstocks and this could be attributed to the low lignin content, since the latter is negatively correlated to the BMP [24]. Apart from the low lignin content, GL waste has high holocellulose (sum of cellulose and hemicellulose) and high extractives, content, which are possible sources for high methane productions.
2.2.2. BMP of the Whole Pretreatment Slurry
BMP experiments were conducted for the untreated GL waste, the whole pretreatment slurry (mixture of liquid and solids obtained after all pretreatment methods) as well as the separate fractions i.e., at the liquid (hydrolysate) and the solid fractions obtained after acid and alkali pretreatment methods used. In Figure 4, the effect of all pretreatment methods on the BMP of the whole slurry is presented, expressed as mL methane per g of initial VS. It is obvious that the kinetics of the process were not enhanced by the pretreatment, since more than 80–90% of the total biomethane of all experiments (even of the control- with untreated GL waste) was produced within about 13 days. It is also obvious that all alkali pretreatment methods affected positively the methane yield and the higher the NaOH concentration, the higher was the methane yield. Thus, treatment with 2, 10 and 20 g
Figure 3. SEM images of raw (a), alkali (NaOH) (b) acid (H2SO4) (c) and acid (HCl) (d) pretreatment,at the concentration of 20 g/100 gTS, respectively.
2.2. BMP of GL Waste before and after Pretreatment
2.2.1. BMP of Untreated GL
The calculated methane production, after subtraction of the methane produced from blankexperiments was 62.44 ± 0.36 mL, corresponding to a BMP of 260.65 ± 0.04 L CH4/kg GL waste or282.60 ± 0.04 L CH4/kg TS or 339.86 ± 0.05 L CH4/kg VS. The BMP of the GL waste used in the presentstudy was comparable with that of ensiled meadow grass (372 ± 52 L CH4/kg) [8] and GL (402.5 LCH4/kg) [11], but higher than that of giant reed [22] or common reed [23] (188 L CH4/kg). In any case,the BMP of the untreated GL waste is higher than that of other lignocellulosic feedstocks and thiscould be attributed to the low lignin content, since the latter is negatively correlated to the BMP [24].Apart from the low lignin content, GL waste has high holocellulose (sum of cellulose and hemicellulose)and high extractives, content, which are possible sources for high methane productions.
2.2.2. BMP of the Whole Pretreatment Slurry
BMP experiments were conducted for the untreated GL waste, the whole pretreatment slurry(mixture of liquid and solids obtained after all pretreatment methods) as well as the separate fractionsi.e., at the liquid (hydrolysate) and the solid fractions obtained after acid and alkali pretreatmentmethods used. In Figure 4, the effect of all pretreatment methods on the BMP of the whole slurry ispresented, expressed as mL methane per g of initial VS. It is obvious that the kinetics of the process werenot enhanced by the pretreatment, since more than 80–90% of the total biomethane of all experiments(even of the control- with untreated GL waste) was produced within about 13 days. It is also obviousthat all alkali pretreatment methods affected positively the methane yield and the higher the NaOHconcentration, the higher was the methane yield. Thus, treatment with 2, 10 and 20 g NaOH/100 gTSled to 389.0 ± 7.0, 397.7± 12.2 and 414.8 ± 26.5 L CH4/kg VS, respectively, corresponded to a 14.74,17.01 and 22.05% BMP increase, compared to the BMP of untreated GL waste. The increase of BMPcan be attributed to the lignin reduction which occurred under alkaline pretreatment (Figure 1b) and
75
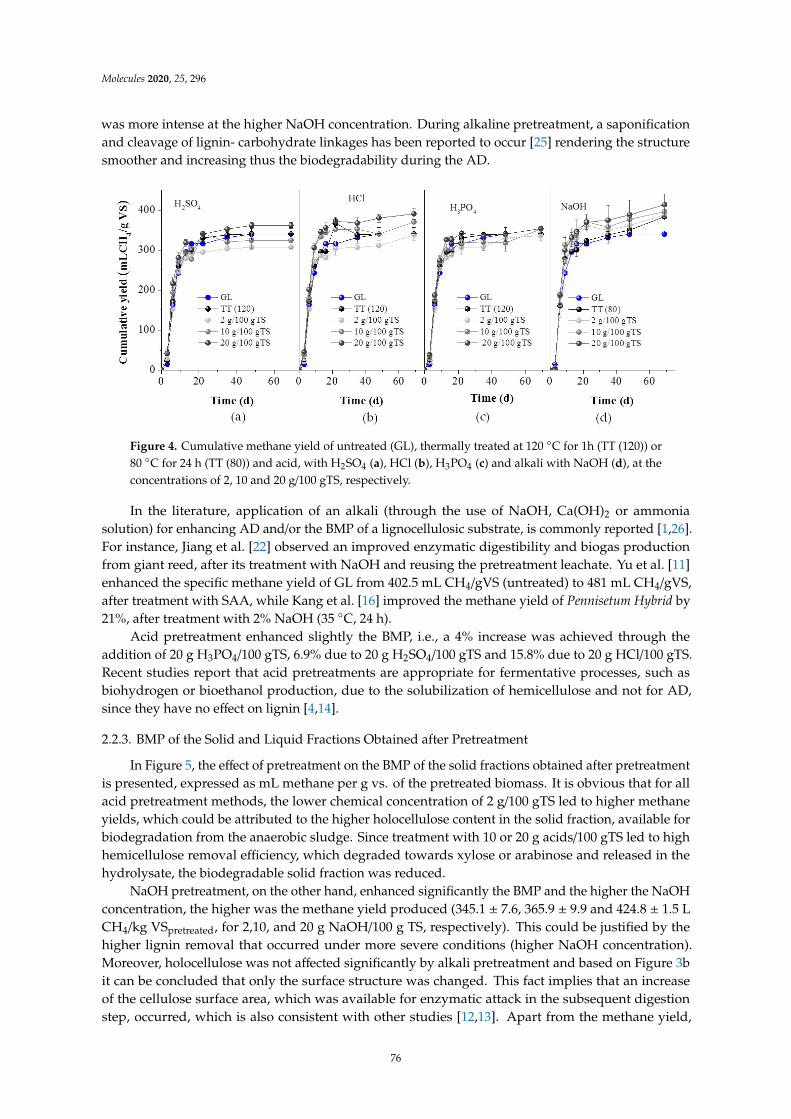
Molecules 2020, 25, 296
was more intense at the higher NaOH concentration. During alkaline pretreatment, a saponificationand cleavage of lignin- carbohydrate linkages has been reported to occur [25] rendering the structuresmoother and increasing thus the biodegradability during the AD.
Molecules 2019, 24, x FOR PEER REVIEW 6 of 14
NaOH/100 gTS led to 389.0 ± 7.0, 397.7± 12.2 and 414.8 ± 26.5 L CH4/kg VS, respectively, corresponded to a 14.74, 17.01 and 22.05% BMP increase, compared to the BMP of untreated GL waste. The increase of BMP can be attributed to the lignin reduction which occurred under alkaline pretreatment (Figure 1b) and was more intense at the higher NaOH concentration. During alkaline pretreatment, a saponification and cleavage of lignin- carbohydrate linkages has been reported to occur [25] rendering the structure smoother and increasing thus the biodegradability during the AD.
Figure 4. Cumulative methane yield of untreated (GL), thermally treated at 120 °C for 1h (TT (120)) or 80 °C for 24 h (TT (80)) and acid, with H2SO4 (a), HCl (b), H3PO4 (c) and alkali with NaOH (d), at the concentrations of 2, 10 and 20 g/100 gTS, respectively.
In the literature, application of an alkali (through the use of NaOH, Ca(OH)2 or ammonia solution) for enhancing AD and/or the BMP of a lignocellulosic substrate, is commonly reported [1,26]. For instance, Jiang et al. [22] observed an improved enzymatic digestibility and biogas production from giant reed, after its treatment with NaOH and reusing the pretreatment leachate. Yu et al. [11] enhanced the specific methane yield of GL from 402.5 mL CH4/gVS (untreated) to 481 mL CH4/gVS, after treatment with SAA, while Kang et al. [16] improved the methane yield of Pennisetum Hybrid by 21%, after treatment with 2% NaOH (35 °C, 24 h).
Acid pretreatment enhanced slightly the BMP, i.e., a 4% increase was achieved through the addition of 20 g H3PO4/100 gTS, 6.9% due to 20 g H2SO4/100 gTS and 15.8% due to 20 g HCl/100 gTS. Recent studies report that acid pretreatments are appropriate for fermentative processes, such as biohydrogen or bioethanol production, due to the solubilization of hemicellulose and not for AD, since they have no effect on lignin [4,14].
2.2.3. BMP of the Solid and Liquid Fractions Obtained after Pretreatment
In Figure 5, the effect of pretreatment on the BMP of the solid fractions obtained after pretreatment is presented, expressed as mL methane per g vs. of the pretreated biomass. It is obvious that for all acid pretreatment methods, the lower chemical concentration of 2 g/100 gTS led to higher methane yields, which could be attributed to the higher holocellulose content in the solid fraction, available for biodegradation from the anaerobic sludge. Since treatment with 10 or 20 g acids/100 gTS led to high hemicellulose removal efficiency, which degraded towards xylose or arabinose and released in the hydrolysate, the biodegradable solid fraction was reduced.
NaOH pretreatment, on the other hand, enhanced significantly the BMP and the higher the NaOH concentration, the higher was the methane yield produced (345.1 ± 7.6, 365.9 ± 9.9 and 424.8 ± 1.5 L CH4/kg VSpretreated, for 2,10, and 20 g NaOH/100 g TS, respectively). This could be justified by the higher lignin removal that occurred under more severe conditions (higher NaOH concentration). Moreover, holocellulose was not affected significantly by alkali pretreatment and based on Figure 3b it can be concluded that only the surface structure was changed. This fact implies that an increase of
Figure 4. Cumulative methane yield of untreated (GL), thermally treated at 120 C for 1h (TT (120)) or80 C for 24 h (TT (80)) and acid, with H2SO4 (a), HCl (b), H3PO4 (c) and alkali with NaOH (d), at theconcentrations of 2, 10 and 20 g/100 gTS, respectively.
In the literature, application of an alkali (through the use of NaOH, Ca(OH)2 or ammoniasolution) for enhancing AD and/or the BMP of a lignocellulosic substrate, is commonly reported [1,26].For instance, Jiang et al. [22] observed an improved enzymatic digestibility and biogas productionfrom giant reed, after its treatment with NaOH and reusing the pretreatment leachate. Yu et al. [11]enhanced the specific methane yield of GL from 402.5 mL CH4/gVS (untreated) to 481 mL CH4/gVS,after treatment with SAA, while Kang et al. [16] improved the methane yield of Pennisetum Hybrid by21%, after treatment with 2% NaOH (35 C, 24 h).
Acid pretreatment enhanced slightly the BMP, i.e., a 4% increase was achieved through theaddition of 20 g H3PO4/100 gTS, 6.9% due to 20 g H2SO4/100 gTS and 15.8% due to 20 g HCl/100 gTS.Recent studies report that acid pretreatments are appropriate for fermentative processes, such asbiohydrogen or bioethanol production, due to the solubilization of hemicellulose and not for AD,since they have no effect on lignin [4,14].
2.2.3. BMP of the Solid and Liquid Fractions Obtained after Pretreatment
In Figure 5, the effect of pretreatment on the BMP of the solid fractions obtained after pretreatmentis presented, expressed as mL methane per g vs. of the pretreated biomass. It is obvious that for allacid pretreatment methods, the lower chemical concentration of 2 g/100 gTS led to higher methaneyields, which could be attributed to the higher holocellulose content in the solid fraction, available forbiodegradation from the anaerobic sludge. Since treatment with 10 or 20 g acids/100 gTS led to highhemicellulose removal efficiency, which degraded towards xylose or arabinose and released in thehydrolysate, the biodegradable solid fraction was reduced.
NaOH pretreatment, on the other hand, enhanced significantly the BMP and the higher the NaOHconcentration, the higher was the methane yield produced (345.1 ± 7.6, 365.9 ± 9.9 and 424.8 ± 1.5 LCH4/kg VSpretreated, for 2,10, and 20 g NaOH/100 g TS, respectively). This could be justified by thehigher lignin removal that occurred under more severe conditions (higher NaOH concentration).Moreover, holocellulose was not affected significantly by alkali pretreatment and based on Figure 3bit can be concluded that only the surface structure was changed. This fact implies that an increaseof the cellulose surface area, which was available for enzymatic attack in the subsequent digestionstep, occurred, which is also consistent with other studies [12,13]. Apart from the methane yield,
76
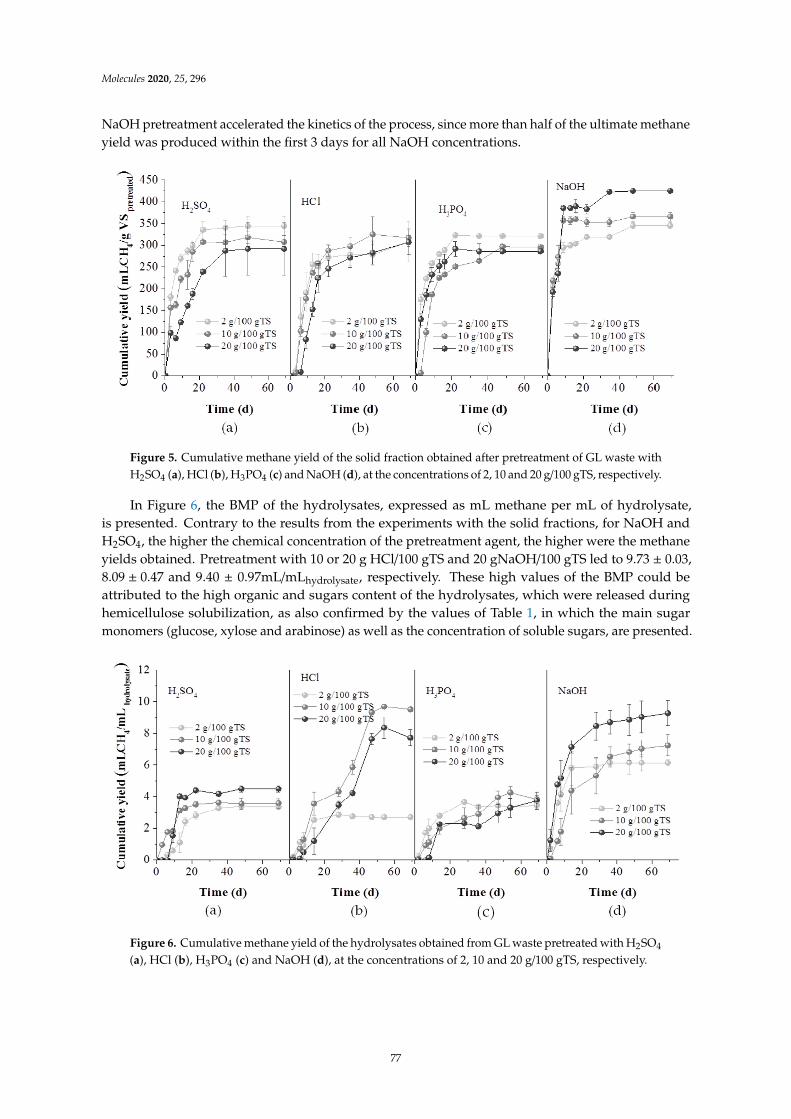
Molecules 2020, 25, 296
NaOH pretreatment accelerated the kinetics of the process, since more than half of the ultimate methaneyield was produced within the first 3 days for all NaOH concentrations.
Molecules 2019, 24, x FOR PEER REVIEW 7 of 14
the cellulose surface area, which was available for enzymatic attack in the subsequent digestion step, occurred, which is also consistent with other studies [12,13]. Apart from the methane yield, NaOH pretreatment accelerated the kinetics of the process, since more than half of the ultimate methane yield was produced within the first 3 days for all NaOH concentrations.
Figure 5. Cumulative methane yield of the solid fraction obtained after pretreatment of GL waste with H2SO4 (a), HCl (b), H3PO4 (c) and NaOH (d), at the concentrations of 2, 10 and 20 g/100 gTS, respectively.
In Figure 6, the BMP of the hydrolysates, expressed as mL methane per mL of hydrolysate, is presented. Contrary to the results from the experiments with the solid fractions, for NaOH and H2SO4
,the higher the chemical concentration of the pretreatment agent, the higher were the methane yields obtained. Pretreatment with 10 or 20 g HCl/100 gTS and 20 gNaOH/100 gTS led to 9.73 ± 0.03, 8.09 ± 0.47 and 9.40 ± 0.97mL/mLhydrolysate, respectively. These high values of the BMP could be attributed to the high organic and sugars content of the hydrolysates, which were released during hemicellulose solubilization, as also confirmed by the values of Table 1, in which the main sugar monomers (glucose, xylose and arabinose) as well as the concentration of soluble sugars, are presented.
Figure 5. Cumulative methane yield of the solid fraction obtained after pretreatment of GL waste withH2SO4 (a), HCl (b), H3PO4 (c) and NaOH (d), at the concentrations of 2, 10 and 20 g/100 gTS, respectively.
In Figure 6, the BMP of the hydrolysates, expressed as mL methane per mL of hydrolysate,is presented. Contrary to the results from the experiments with the solid fractions, for NaOH andH2SO4, the higher the chemical concentration of the pretreatment agent, the higher were the methaneyields obtained. Pretreatment with 10 or 20 g HCl/100 gTS and 20 gNaOH/100 gTS led to 9.73 ± 0.03,8.09 ± 0.47 and 9.40 ± 0.97mL/mLhydrolysate, respectively. These high values of the BMP could beattributed to the high organic and sugars content of the hydrolysates, which were released duringhemicellulose solubilization, as also confirmed by the values of Table 1, in which the main sugarmonomers (glucose, xylose and arabinose) as well as the concentration of soluble sugars, are presented.
Molecules 2019, 24, x FOR PEER REVIEW 7 of 14
the cellulose surface area, which was available for enzymatic attack in the subsequent digestion step, occurred, which is also consistent with other studies [12,13]. Apart from the methane yield, NaOH pretreatment accelerated the kinetics of the process, since more than half of the ultimate methane yield was produced within the first 3 days for all NaOH concentrations.
Figure 5. Cumulative methane yield of the solid fraction obtained after pretreatment of GL waste with H2SO4 (a), HCl (b), H3PO4 (c) and NaOH (d), at the concentrations of 2, 10 and 20 g/100 gTS, respectively.
In Figure 6, the BMP of the hydrolysates, expressed as mL methane per mL of hydrolysate, is presented. Contrary to the results from the experiments with the solid fractions, for NaOH and H2SO4
,the higher the chemical concentration of the pretreatment agent, the higher were the methane yields obtained. Pretreatment with 10 or 20 g HCl/100 gTS and 20 gNaOH/100 gTS led to 9.73 ± 0.03, 8.09 ± 0.47 and 9.40 ± 0.97mL/mLhydrolysate, respectively. These high values of the BMP could be attributed to the high organic and sugars content of the hydrolysates, which were released during hemicellulose solubilization, as also confirmed by the values of Table 1, in which the main sugar monomers (glucose, xylose and arabinose) as well as the concentration of soluble sugars, are presented.
Figure 6. Cumulative methane yield of the hydrolysates obtained from GL waste pretreated with H2SO4
(a), HCl (b), H3PO4 (c) and NaOH (d), at the concentrations of 2, 10 and 20 g/100 gTS, respectively.
77
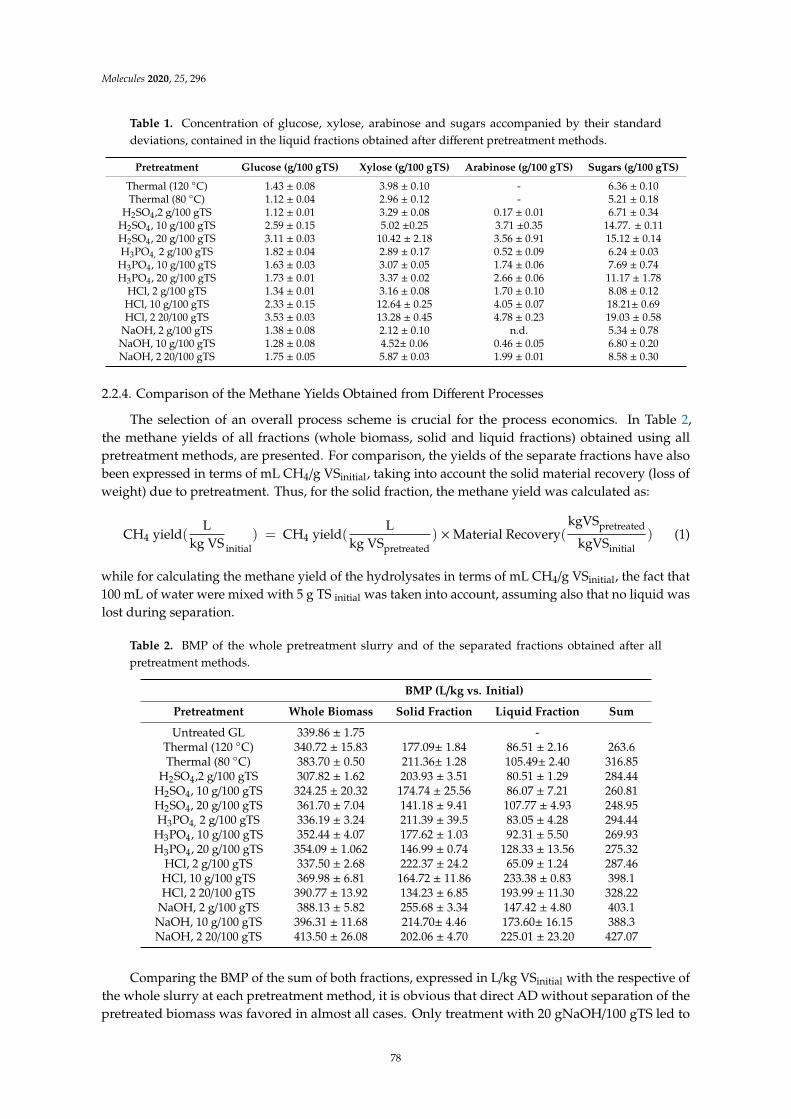
Molecules 2020, 25, 296
Table 1. Concentration of glucose, xylose, arabinose and sugars accompanied by their standarddeviations, contained in the liquid fractions obtained after different pretreatment methods.
Pretreatment Glucose (g/100 gTS) Xylose (g/100 gTS) Arabinose (g/100 gTS) Sugars (g/100 gTS)
Thermal (120 C) 1.43 ± 0.08 3.98 ± 0.10 - 6.36 ± 0.10Thermal (80 C) 1.12 ± 0.04 2.96 ± 0.12 - 5.21 ± 0.18
H2SO4,2 g/100 gTS 1.12 ± 0.01 3.29 ± 0.08 0.17 ± 0.01 6.71 ± 0.34H2SO4, 10 g/100 gTS 2.59 ± 0.15 5.02 ±0.25 3.71 ±0.35 14.77. ± 0.11H2SO4, 20 g/100 gTS 3.11 ± 0.03 10.42 ± 2.18 3.56 ± 0.91 15.12 ± 0.14H3PO4, 2 g/100 gTS 1.82 ± 0.04 2.89 ± 0.17 0.52 ± 0.09 6.24 ± 0.03
H3PO4, 10 g/100 gTS 1.63 ± 0.03 3.07 ± 0.05 1.74 ± 0.06 7.69 ± 0.74H3PO4, 20 g/100 gTS 1.73 ± 0.01 3.37 ± 0.02 2.66 ± 0.06 11.17 ± 1.78
HCl, 2 g/100 gTS 1.34 ± 0.01 3.16 ± 0.08 1.70 ± 0.10 8.08 ± 0.12HCl, 10 g/100 gTS 2.33 ± 0.15 12.64 ± 0.25 4.05 ± 0.07 18.21± 0.69HCl, 2 20/100 gTS 3.53 ± 0.03 13.28 ± 0.45 4.78 ± 0.23 19.03 ± 0.58
NaOH, 2 g/100 gTS 1.38 ± 0.08 2.12 ± 0.10 n.d. 5.34 ± 0.78NaOH, 10 g/100 gTS 1.28 ± 0.08 4.52± 0.06 0.46 ± 0.05 6.80 ± 0.20NaOH, 2 20/100 gTS 1.75 ± 0.05 5.87 ± 0.03 1.99 ± 0.01 8.58 ± 0.30
2.2.4. Comparison of the Methane Yields Obtained from Different Processes
The selection of an overall process scheme is crucial for the process economics. In Table 2,the methane yields of all fractions (whole biomass, solid and liquid fractions) obtained using allpretreatment methods, are presented. For comparison, the yields of the separate fractions have alsobeen expressed in terms of mL CH4/g VSinitial, taking into account the solid material recovery (loss ofweight) due to pretreatment. Thus, for the solid fraction, the methane yield was calculated as:
CH4 yield(L
kg VS initial) = CH4 yield(
Lkg VSpretreated
) ×Material Recovery(kgVSpretreated
kgVSinitial) (1)
while for calculating the methane yield of the hydrolysates in terms of mL CH4/g VSinitial, the fact that100 mL of water were mixed with 5 g TS initial was taken into account, assuming also that no liquid waslost during separation.
Table 2. BMP of the whole pretreatment slurry and of the separated fractions obtained after allpretreatment methods.
BMP (L/kg vs. Initial)
Pretreatment Whole Biomass Solid Fraction Liquid Fraction Sum
Untreated GL 339.86 ± 1.75 -Thermal (120 C) 340.72 ± 15.83 177.09± 1.84 86.51 ± 2.16 263.6Thermal (80 C) 383.70 ± 0.50 211.36± 1.28 105.49± 2.40 316.85
H2SO4,2 g/100 gTS 307.82 ± 1.62 203.93 ± 3.51 80.51 ± 1.29 284.44H2SO4, 10 g/100 gTS 324.25 ± 20.32 174.74 ± 25.56 86.07 ± 7.21 260.81H2SO4, 20 g/100 gTS 361.70 ± 7.04 141.18 ± 9.41 107.77 ± 4.93 248.95H3PO4, 2 g/100 gTS 336.19 ± 3.24 211.39 ± 39.5 83.05 ± 4.28 294.44
H3PO4, 10 g/100 gTS 352.44 ± 4.07 177.62 ± 1.03 92.31 ± 5.50 269.93H3PO4, 20 g/100 gTS 354.09 ± 1.062 146.99 ± 0.74 128.33 ± 13.56 275.32
HCl, 2 g/100 gTS 337.50 ± 2.68 222.37 ± 24.2 65.09 ± 1.24 287.46HCl, 10 g/100 gTS 369.98 ± 6.81 164.72 ± 11.86 233.38 ± 0.83 398.1HCl, 2 20/100 gTS 390.77 ± 13.92 134.23 ± 6.85 193.99 ± 11.30 328.22
NaOH, 2 g/100 gTS 388.13 ± 5.82 255.68 ± 3.34 147.42 ± 4.80 403.1NaOH, 10 g/100 gTS 396.31 ± 11.68 214.70± 4.46 173.60± 16.15 388.3NaOH, 2 20/100 gTS 413.50 ± 26.08 202.06 ± 4.70 225.01 ± 23.20 427.07
Comparing the BMP of the sum of both fractions, expressed in L/kg VSinitial with the respective ofthe whole slurry at each pretreatment method, it is obvious that direct AD without separation of thepretreated biomass was favored in almost all cases. Only treatment with 20 gNaOH/100 gTS led to
78
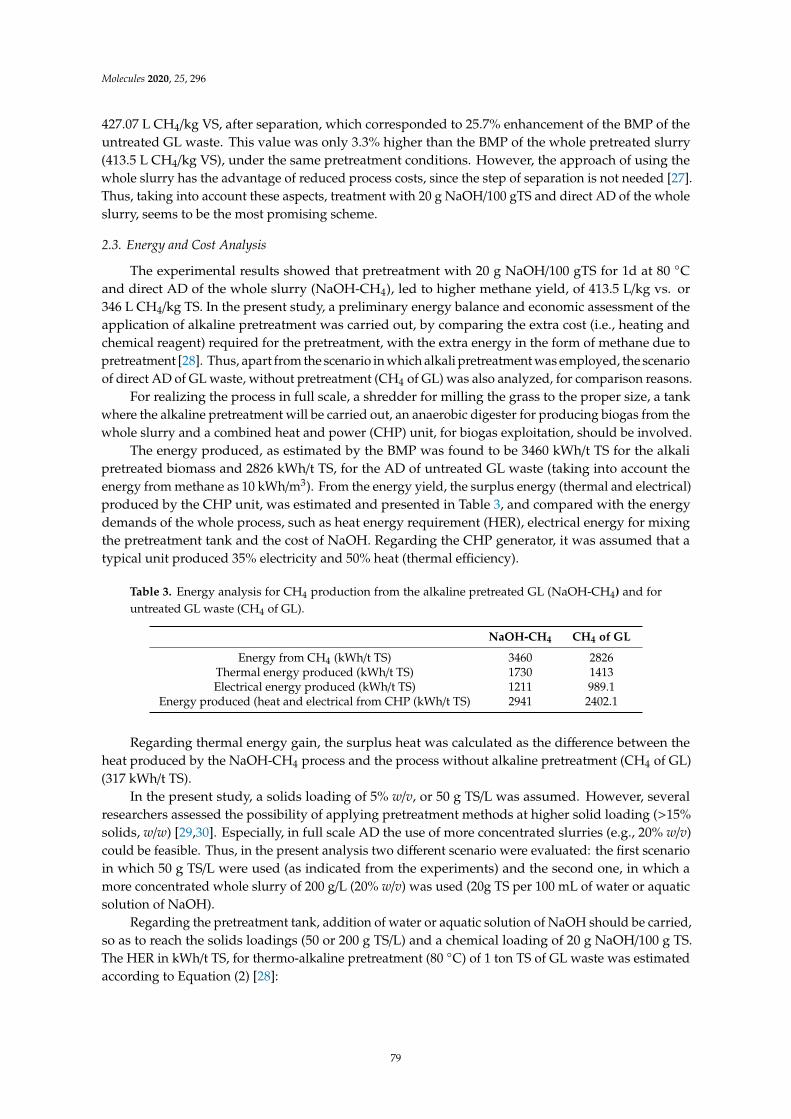
Molecules 2020, 25, 296
427.07 L CH4/kg VS, after separation, which corresponded to 25.7% enhancement of the BMP of theuntreated GL waste. This value was only 3.3% higher than the BMP of the whole pretreated slurry(413.5 L CH4/kg VS), under the same pretreatment conditions. However, the approach of using thewhole slurry has the advantage of reduced process costs, since the step of separation is not needed [27].Thus, taking into account these aspects, treatment with 20 g NaOH/100 gTS and direct AD of the wholeslurry, seems to be the most promising scheme.
2.3. Energy and Cost Analysis
The experimental results showed that pretreatment with 20 g NaOH/100 gTS for 1d at 80 Cand direct AD of the whole slurry (NaOH-CH4), led to higher methane yield, of 413.5 L/kg vs. or346 L CH4/kg TS. In the present study, a preliminary energy balance and economic assessment of theapplication of alkaline pretreatment was carried out, by comparing the extra cost (i.e., heating andchemical reagent) required for the pretreatment, with the extra energy in the form of methane due topretreatment [28]. Thus, apart from the scenario in which alkali pretreatment was employed, the scenarioof direct AD of GL waste, without pretreatment (CH4 of GL) was also analyzed, for comparison reasons.
For realizing the process in full scale, a shredder for milling the grass to the proper size, a tankwhere the alkaline pretreatment will be carried out, an anaerobic digester for producing biogas from thewhole slurry and a combined heat and power (CHP) unit, for biogas exploitation, should be involved.
The energy produced, as estimated by the BMP was found to be 3460 kWh/t TS for the alkalipretreated biomass and 2826 kWh/t TS, for the AD of untreated GL waste (taking into account theenergy from methane as 10 kWh/m3). From the energy yield, the surplus energy (thermal and electrical)produced by the CHP unit, was estimated and presented in Table 3, and compared with the energydemands of the whole process, such as heat energy requirement (HER), electrical energy for mixingthe pretreatment tank and the cost of NaOH. Regarding the CHP generator, it was assumed that atypical unit produced 35% electricity and 50% heat (thermal efficiency).
Table 3. Energy analysis for CH4 production from the alkaline pretreated GL (NaOH-CH4) and foruntreated GL waste (CH4 of GL).
NaOH-CH4 CH4 of GL
Energy from CH4 (kWh/t TS) 3460 2826Thermal energy produced (kWh/t TS) 1730 1413Electrical energy produced (kWh/t TS) 1211 989.1
Energy produced (heat and electrical from CHP (kWh/t TS) 2941 2402.1
Regarding thermal energy gain, the surplus heat was calculated as the difference between theheat produced by the NaOH-CH4 process and the process without alkaline pretreatment (CH4 of GL)(317 kWh/t TS).
In the present study, a solids loading of 5% w/v, or 50 g TS/L was assumed. However, severalresearchers assessed the possibility of applying pretreatment methods at higher solid loading (>15%solids, w/w) [29,30]. Especially, in full scale AD the use of more concentrated slurries (e.g., 20% w/v)could be feasible. Thus, in the present analysis two different scenario were evaluated: the first scenarioin which 50 g TS/L were used (as indicated from the experiments) and the second one, in which amore concentrated whole slurry of 200 g/L (20% w/v) was used (20g TS per 100 mL of water or aquaticsolution of NaOH).
Regarding the pretreatment tank, addition of water or aquatic solution of NaOH should be carried,so as to reach the solids loadings (50 or 200 g TS/L) and a chemical loading of 20 g NaOH/100 g TS.The HER in kWh/t TS, for thermo-alkaline pretreatment (80 C) of 1 ton TS of GL waste was estimatedaccording to Equation (2) [28]:
79
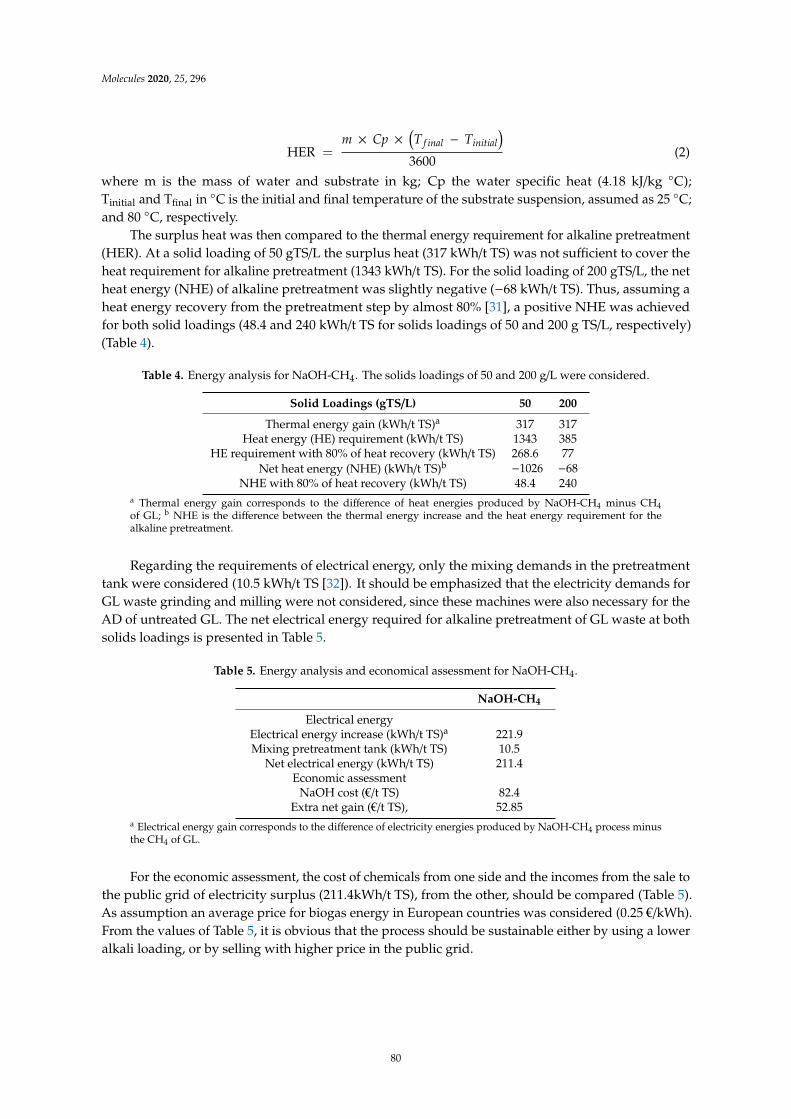
Molecules 2020, 25, 296
HER =m × Cp ×
(T f inal − Tinitial
)
3600(2)
where m is the mass of water and substrate in kg; Cp the water specific heat (4.18 kJ/kg C);Tinitial and Tfinal in C is the initial and final temperature of the substrate suspension, assumed as 25 C;and 80 C, respectively.
The surplus heat was then compared to the thermal energy requirement for alkaline pretreatment(HER). At a solid loading of 50 gTS/L the surplus heat (317 kWh/t TS) was not sufficient to cover theheat requirement for alkaline pretreatment (1343 kWh/t TS). For the solid loading of 200 gTS/L, the netheat energy (NHE) of alkaline pretreatment was slightly negative (−68 kWh/t TS). Thus, assuming aheat energy recovery from the pretreatment step by almost 80% [31], a positive NHE was achievedfor both solid loadings (48.4 and 240 kWh/t TS for solids loadings of 50 and 200 g TS/L, respectively)(Table 4).
Table 4. Energy analysis for NaOH-CH4. The solids loadings of 50 and 200 g/L were considered.
Solid Loadings (gTS/L) 50 200
Thermal energy gain (kWh/t TS)a 317 317Heat energy (HE) requirement (kWh/t TS) 1343 385
HE requirement with 80% of heat recovery (kWh/t TS) 268.6 77Net heat energy (NHE) (kWh/t TS)b −1026 −68
NHE with 80% of heat recovery (kWh/t TS) 48.4 240a Thermal energy gain corresponds to the difference of heat energies produced by NaOH-CH4 minus CH4of GL; b NHE is the difference between the thermal energy increase and the heat energy requirement for thealkaline pretreatment.
Regarding the requirements of electrical energy, only the mixing demands in the pretreatmenttank were considered (10.5 kWh/t TS [32]). It should be emphasized that the electricity demands forGL waste grinding and milling were not considered, since these machines were also necessary for theAD of untreated GL. The net electrical energy required for alkaline pretreatment of GL waste at bothsolids loadings is presented in Table 5.
Table 5. Energy analysis and economical assessment for NaOH-CH4.
NaOH-CH4
Electrical energyElectrical energy increase (kWh/t TS)a 221.9Mixing pretreatment tank (kWh/t TS) 10.5
Net electrical energy (kWh/t TS) 211.4Economic assessment
NaOH cost (€/t TS) 82.4Extra net gain (€/t TS), 52.85
a Electrical energy gain corresponds to the difference of electricity energies produced by NaOH-CH4 process minusthe CH4 of GL.
For the economic assessment, the cost of chemicals from one side and the incomes from the sale tothe public grid of electricity surplus (211.4kWh/t TS), from the other, should be compared (Table 5).As assumption an average price for biogas energy in European countries was considered (0.25 €/kWh).From the values of Table 5, it is obvious that the process should be sustainable either by using a loweralkali loading, or by selling with higher price in the public grid.
80
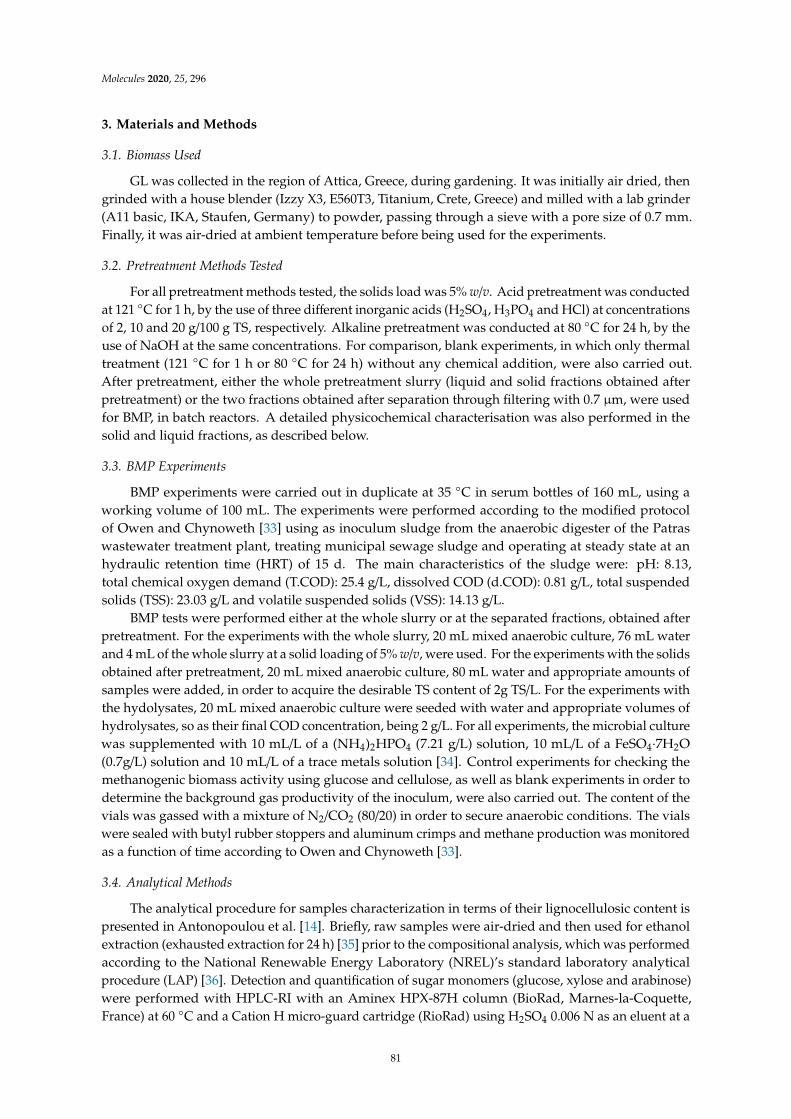
Molecules 2020, 25, 296
3. Materials and Methods
3.1. Biomass Used
GL was collected in the region of Attica, Greece, during gardening. It was initially air dried, thengrinded with a house blender (Izzy X3, E560T3, Titanium, Crete, Greece) and milled with a lab grinder(A11 basic, IKA, Staufen, Germany) to powder, passing through a sieve with a pore size of 0.7 mm.Finally, it was air-dried at ambient temperature before being used for the experiments.
3.2. Pretreatment Methods Tested
For all pretreatment methods tested, the solids load was 5% w/v. Acid pretreatment was conductedat 121 C for 1 h, by the use of three different inorganic acids (H2SO4, H3PO4 and HCl) at concentrationsof 2, 10 and 20 g/100 g TS, respectively. Alkaline pretreatment was conducted at 80 C for 24 h, by theuse of NaOH at the same concentrations. For comparison, blank experiments, in which only thermaltreatment (121 C for 1 h or 80 C for 24 h) without any chemical addition, were also carried out.After pretreatment, either the whole pretreatment slurry (liquid and solid fractions obtained afterpretreatment) or the two fractions obtained after separation through filtering with 0.7 µm, were usedfor BMP, in batch reactors. A detailed physicochemical characterisation was also performed in thesolid and liquid fractions, as described below.
3.3. BMP Experiments
BMP experiments were carried out in duplicate at 35 C in serum bottles of 160 mL, using aworking volume of 100 mL. The experiments were performed according to the modified protocolof Owen and Chynoweth [33] using as inoculum sludge from the anaerobic digester of the Patraswastewater treatment plant, treating municipal sewage sludge and operating at steady state at anhydraulic retention time (HRT) of 15 d. The main characteristics of the sludge were: pH: 8.13,total chemical oxygen demand (T.COD): 25.4 g/L, dissolved COD (d.COD): 0.81 g/L, total suspendedsolids (TSS): 23.03 g/L and volatile suspended solids (VSS): 14.13 g/L.
BMP tests were performed either at the whole slurry or at the separated fractions, obtained afterpretreatment. For the experiments with the whole slurry, 20 mL mixed anaerobic culture, 76 mL waterand 4 mL of the whole slurry at a solid loading of 5% w/v, were used. For the experiments with the solidsobtained after pretreatment, 20 mL mixed anaerobic culture, 80 mL water and appropriate amounts ofsamples were added, in order to acquire the desirable TS content of 2g TS/L. For the experiments withthe hydolysates, 20 mL mixed anaerobic culture were seeded with water and appropriate volumes ofhydrolysates, so as their final COD concentration, being 2 g/L. For all experiments, the microbial culturewas supplemented with 10 mL/L of a (NH4)2HPO4 (7.21 g/L) solution, 10 mL/L of a FeSO4·7H2O(0.7g/L) solution and 10 mL/L of a trace metals solution [34]. Control experiments for checking themethanogenic biomass activity using glucose and cellulose, as well as blank experiments in order todetermine the background gas productivity of the inoculum, were also carried out. The content of thevials was gassed with a mixture of N2/CO2 (80/20) in order to secure anaerobic conditions. The vialswere sealed with butyl rubber stoppers and aluminum crimps and methane production was monitoredas a function of time according to Owen and Chynoweth [33].
3.4. Analytical Methods
The analytical procedure for samples characterization in terms of their lignocellulosic content ispresented in Antonopoulou et al. [14]. Briefly, raw samples were air-dried and then used for ethanolextraction (exhausted extraction for 24 h) [35] prior to the compositional analysis, which was performedaccording to the National Renewable Energy Laboratory (NREL)’s standard laboratory analyticalprocedure (LAP) [36]. Detection and quantification of sugar monomers (glucose, xylose and arabinose)were performed with HPLC-RI with an Aminex HPX-87H column (BioRad, Marnes-la-Coquette,France) at 60 C and a Cation H micro-guard cartridge (RioRad) using H2SO4 0.006 N as an eluent at a
81
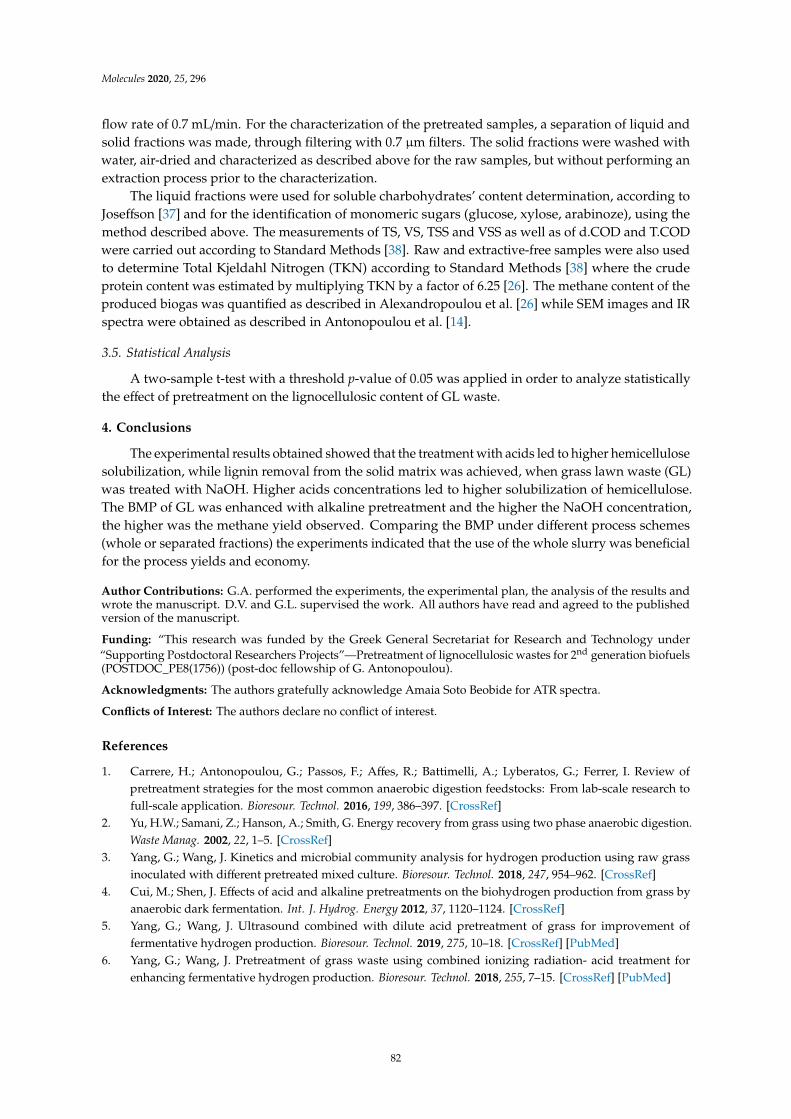
Molecules 2020, 25, 296
flow rate of 0.7 mL/min. For the characterization of the pretreated samples, a separation of liquid andsolid fractions was made, through filtering with 0.7 µm filters. The solid fractions were washed withwater, air-dried and characterized as described above for the raw samples, but without performing anextraction process prior to the characterization.
The liquid fractions were used for soluble charbohydrates’ content determination, according toJoseffson [37] and for the identification of monomeric sugars (glucose, xylose, arabinoze), using themethod described above. The measurements of TS, VS, TSS and VSS as well as of d.COD and T.CODwere carried out according to Standard Methods [38]. Raw and extractive-free samples were also usedto determine Total Kjeldahl Nitrogen (TKN) according to Standard Methods [38] where the crudeprotein content was estimated by multiplying TKN by a factor of 6.25 [26]. The methane content of theproduced biogas was quantified as described in Alexandropoulou et al. [26] while SEM images and IRspectra were obtained as described in Antonopoulou et al. [14].
3.5. Statistical Analysis
A two-sample t-test with a threshold p-value of 0.05 was applied in order to analyze statisticallythe effect of pretreatment on the lignocellulosic content of GL waste.
4. Conclusions
The experimental results obtained showed that the treatment with acids led to higher hemicellulosesolubilization, while lignin removal from the solid matrix was achieved, when grass lawn waste (GL)was treated with NaOH. Higher acids concentrations led to higher solubilization of hemicellulose.The BMP of GL was enhanced with alkaline pretreatment and the higher the NaOH concentration,the higher was the methane yield observed. Comparing the BMP under different process schemes(whole or separated fractions) the experiments indicated that the use of the whole slurry was beneficialfor the process yields and economy.
Author Contributions: G.A. performed the experiments, the experimental plan, the analysis of the results andwrote the manuscript. D.V. and G.L. supervised the work. All authors have read and agreed to the publishedversion of the manuscript.
Funding: “This research was funded by the Greek General Secretariat for Research and Technology under“Supporting Postdoctoral Researchers Projects”—Pretreatment of lignocellulosic wastes for 2nd generation biofuels(POSTDOC_PE8(1756)) (post-doc fellowship of G. Antonopoulou).
Acknowledgments: The authors gratefully acknowledge Amaia Soto Beobide for ATR spectra.
Conflicts of Interest: The authors declare no conflict of interest.
References
1. Carrere, H.; Antonopoulou, G.; Passos, F.; Affes, R.; Battimelli, A.; Lyberatos, G.; Ferrer, I. Review ofpretreatment strategies for the most common anaerobic digestion feedstocks: From lab-scale research tofull-scale application. Bioresour. Technol. 2016, 199, 386–397. [CrossRef]
2. Yu, H.W.; Samani, Z.; Hanson, A.; Smith, G. Energy recovery from grass using two phase anaerobic digestion.Waste Manag. 2002, 22, 1–5. [CrossRef]
3. Yang, G.; Wang, J. Kinetics and microbial community analysis for hydrogen production using raw grassinoculated with different pretreated mixed culture. Bioresour. Technol. 2018, 247, 954–962. [CrossRef]
4. Cui, M.; Shen, J. Effects of acid and alkaline pretreatments on the biohydrogen production from grass byanaerobic dark fermentation. Int. J. Hydrog. Energy 2012, 37, 1120–1124. [CrossRef]
5. Yang, G.; Wang, J. Ultrasound combined with dilute acid pretreatment of grass for improvement offermentative hydrogen production. Bioresour. Technol. 2019, 275, 10–18. [CrossRef] [PubMed]
6. Yang, G.; Wang, J. Pretreatment of grass waste using combined ionizing radiation- acid treatment forenhancing fermentative hydrogen production. Bioresour. Technol. 2018, 255, 7–15. [CrossRef] [PubMed]
82
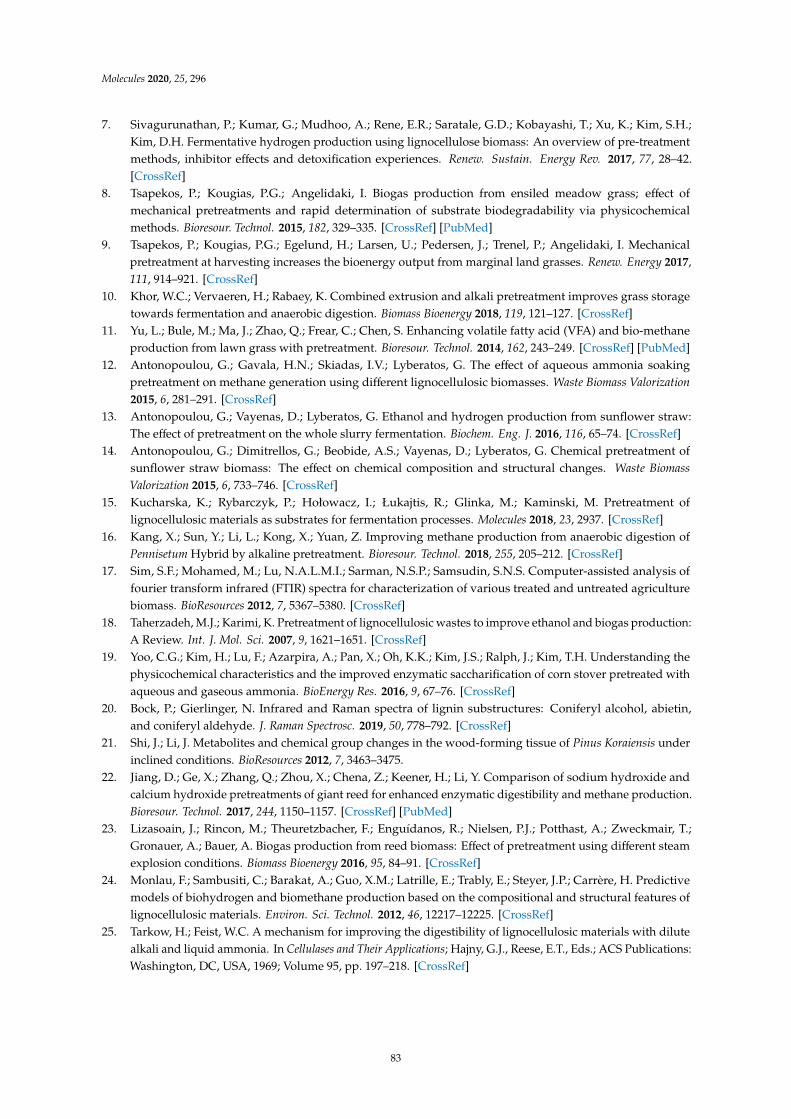
Molecules 2020, 25, 296
7. Sivagurunathan, P.; Kumar, G.; Mudhoo, A.; Rene, E.R.; Saratale, G.D.; Kobayashi, T.; Xu, K.; Kim, S.H.;Kim, D.H. Fermentative hydrogen production using lignocellulose biomass: An overview of pre-treatmentmethods, inhibitor effects and detoxification experiences. Renew. Sustain. Energy Rev. 2017, 77, 28–42.[CrossRef]
8. Tsapekos, P.; Kougias, P.G.; Angelidaki, I. Biogas production from ensiled meadow grass; effect ofmechanical pretreatments and rapid determination of substrate biodegradability via physicochemicalmethods. Bioresour. Technol. 2015, 182, 329–335. [CrossRef] [PubMed]
9. Tsapekos, P.; Kougias, P.G.; Egelund, H.; Larsen, U.; Pedersen, J.; Trenel, P.; Angelidaki, I. Mechanicalpretreatment at harvesting increases the bioenergy output from marginal land grasses. Renew. Energy 2017,111, 914–921. [CrossRef]
10. Khor, W.C.; Vervaeren, H.; Rabaey, K. Combined extrusion and alkali pretreatment improves grass storagetowards fermentation and anaerobic digestion. Biomass Bioenergy 2018, 119, 121–127. [CrossRef]
11. Yu, L.; Bule, M.; Ma, J.; Zhao, Q.; Frear, C.; Chen, S. Enhancing volatile fatty acid (VFA) and bio-methaneproduction from lawn grass with pretreatment. Bioresour. Technol. 2014, 162, 243–249. [CrossRef] [PubMed]
12. Antonopoulou, G.; Gavala, H.N.; Skiadas, I.V.; Lyberatos, G. The effect of aqueous ammonia soakingpretreatment on methane generation using different lignocellulosic biomasses. Waste Biomass Valorization2015, 6, 281–291. [CrossRef]
13. Antonopoulou, G.; Vayenas, D.; Lyberatos, G. Ethanol and hydrogen production from sunflower straw:The effect of pretreatment on the whole slurry fermentation. Biochem. Eng. J. 2016, 116, 65–74. [CrossRef]
14. Antonopoulou, G.; Dimitrellos, G.; Beobide, A.S.; Vayenas, D.; Lyberatos, G. Chemical pretreatment ofsunflower straw biomass: The effect on chemical composition and structural changes. Waste BiomassValorization 2015, 6, 733–746. [CrossRef]
15. Kucharska, K.; Rybarczyk, P.; Hołowacz, I.; Łukajtis, R.; Glinka, M.; Kaminski, M. Pretreatment oflignocellulosic materials as substrates for fermentation processes. Molecules 2018, 23, 2937. [CrossRef]
16. Kang, X.; Sun, Y.; Li, L.; Kong, X.; Yuan, Z. Improving methane production from anaerobic digestion ofPennisetum Hybrid by alkaline pretreatment. Bioresour. Technol. 2018, 255, 205–212. [CrossRef]
17. Sim, S.F.; Mohamed, M.; Lu, N.A.L.M.I.; Sarman, N.S.P.; Samsudin, S.N.S. Computer-assisted analysis offourier transform infrared (FTIR) spectra for characterization of various treated and untreated agriculturebiomass. BioResources 2012, 7, 5367–5380. [CrossRef]
18. Taherzadeh, M.J.; Karimi, K. Pretreatment of lignocellulosic wastes to improve ethanol and biogas production:A Review. Int. J. Mol. Sci. 2007, 9, 1621–1651. [CrossRef]
19. Yoo, C.G.; Kim, H.; Lu, F.; Azarpira, A.; Pan, X.; Oh, K.K.; Kim, J.S.; Ralph, J.; Kim, T.H. Understanding thephysicochemical characteristics and the improved enzymatic saccharification of corn stover pretreated withaqueous and gaseous ammonia. BioEnergy Res. 2016, 9, 67–76. [CrossRef]
20. Bock, P.; Gierlinger, N. Infrared and Raman spectra of lignin substructures: Coniferyl alcohol, abietin,and coniferyl aldehyde. J. Raman Spectrosc. 2019, 50, 778–792. [CrossRef]
21. Shi, J.; Li, J. Metabolites and chemical group changes in the wood-forming tissue of Pinus Koraiensis underinclined conditions. BioResources 2012, 7, 3463–3475.
22. Jiang, D.; Ge, X.; Zhang, Q.; Zhou, X.; Chena, Z.; Keener, H.; Li, Y. Comparison of sodium hydroxide andcalcium hydroxide pretreatments of giant reed for enhanced enzymatic digestibility and methane production.Bioresour. Technol. 2017, 244, 1150–1157. [CrossRef] [PubMed]
23. Lizasoain, J.; Rincon, M.; Theuretzbacher, F.; Enguídanos, R.; Nielsen, P.J.; Potthast, A.; Zweckmair, T.;Gronauer, A.; Bauer, A. Biogas production from reed biomass: Effect of pretreatment using different steamexplosion conditions. Biomass Bioenergy 2016, 95, 84–91. [CrossRef]
24. Monlau, F.; Sambusiti, C.; Barakat, A.; Guo, X.M.; Latrille, E.; Trably, E.; Steyer, J.P.; Carrère, H. Predictivemodels of biohydrogen and biomethane production based on the compositional and structural features oflignocellulosic materials. Environ. Sci. Technol. 2012, 46, 12217–12225. [CrossRef]
25. Tarkow, H.; Feist, W.C. A mechanism for improving the digestibility of lignocellulosic materials with dilutealkali and liquid ammonia. In Cellulases and Their Applications; Hajny, G.J., Reese, E.T., Eds.; ACS Publications:Washington, DC, USA, 1969; Volume 95, pp. 197–218. [CrossRef]
83
Molecules 2020, 25, 296
26. Alexandropoulou, M.; Antonopoulou, G.; Ntaikou, I.; Fragkou, E.; Lyberatos, G. Fungal pretreatment ofwillow sawdust and its combination with alkaline treatment for enhancing biogas production. J. Environ.Manag. 2017, 203, 704–713. [CrossRef]
27. Jung, Y.H.; Kim, I.J.; Kim, H.K.; Kim, K.H. Dilute acid pretreatment of lignocellulose for whole slurry ethanolfermentation. Bioresour. Technol. 2013, 132, 109–114.
28. Monlau, F.; Kaparaju, P.; Trably, E.; Steyer, J.-P.; Carrère, H. Alkaline pretreatment to enhance one-stageCH4 and two-stage H2/CH4 production from sunflower stalks: Mass, energy and economical balances.Chem. Eng. J. 2015, 260, 377–385. [CrossRef]
29. Modenbach, A.A.; Nokes, S.E. The use of high-solids loadings in biomass pretreatment: A review.Biotechnol. Bioeng. 2012, 109, 430–442. [CrossRef]
30. Schell, D.J.; Farmer, J.; Newman, M.; McMillan, J.D. Dilute-sulfuric acid pretreatment of corn stover inpilot-scale reactor: Investigation of yields, kinetics, and enzymatic digestibilities of solids. Appl. Biochem.Biotechnol. 2003, 105–108, 69–85. [CrossRef]
31. Dhar, B.R.; Nakhla, G.; Ray, M.B. Techno-economic evaluation of ultrasound and thermal pretreatmentsfor enhanced anaerobic digestion of municipal waste activated sludge. Waste Manag. 2012, 32, 542–549.[CrossRef]
32. Pavlostathis, S.G.; Gosset, G.M. Alkaline pretreatment of wheat straw for increasing anaerobicbiodegradability. Biotechnol. Bioeng. 1985, 27, 334–344. [CrossRef] [PubMed]
33. Owens, J.M.; Chynoweth, D.P. Biochemical methane potential of municipal solid waste (MSW) components.Wat. Sci. Technol. 1993, 27, 1–14. [CrossRef]
34. Skiadas, I.V.; Lyberatos, G. The periodic anaerobic baffled reactor. Water Sci. Technol. 1998, 38, 401–408.[CrossRef]
35. Sluiter, A.; Ruiz, R.; Scarlata, C.; Sluiter, J.; Templeton, D. Determination of Extractives in Biomass; LaboratoryAnalytical Procedure, National Renewable Energy Laboratory: Golden, CO, USA, 2008.
36. Sluiter, A.; Hames, B.; Ruiz, R.; Scarlata, C.; Sluiter, J.; Templeton, D.; Crocker, D. Determination of StructuralCarbohydrates and Lignin in Biomass; Laboratory Analytical Procedure, National Renewable Energy Laboratory:Golden, CO, USA, 2008.
37. Joseffson, B. Rapid spectrophotometric determination of total carbohydrates. In Methods of Seawater Analysis;Grasshoff, K., Ehrhardt, M., Kremling, K., Eds.; Verlag Chemie GmbH: Weinheim, Germany, 1983; pp. 340–342.
38. APHA; AWWA; WPCF. Standard Methods for the Examination of Water and Wastewater; Franson, M.A., Ed.;American Public Health Association: Washington, DC, USA, 1995.
© 2020 by the authors. Licensee MDPI, Basel, Switzerland. This article is an open accessarticle distributed under the terms and conditions of the Creative Commons Attribution(CC BY) license (http://creativecommons.org/licenses/by/4.0/).
84
molecules
Article
Biogas Production from Sunflower Head and StalkResidues: Effect of Alkaline Pretreatment
Marinela Zhurka †, Apostolos Spyridonidis, Ioanna A. Vasiliadou and Katerina Stamatelatou *
Department of Environmental Engineering, Democritus University of Thrace, 67100 Xanthi, Greece;[email protected] (M.Z.); [email protected] (A.S.); [email protected] (I.A.V.)* Correspondence: [email protected]; Tel.: +30-25410-79315† Current affiliation: Chemical and Materials Engineering Group, School of Engineering, University of
Aberdeen, Aberdeen AB24 3FX, UK.
Academic Editors: Ivet Ferrer, Cigdem Eskicioglu, Georgia Antonopoulou andAudrey BattimelliReceived: 5 December 2019; Accepted: 25 December 2019; Published: 31 December 2019
Abstract: Sunflower residues are considered a prominent renewable source for biogas productionduring anaerobic digestion (AD). However; the recalcitrant structure of this lignocellulosic substraterequires a pretreatment step for efficient biomass transformation and increased bioenergy output.The aim of the present study was to assess the effect of alkaline pretreatment of various parts of thesunflower residues (e.g., heads and stalks) on their methane yield. Experimental data showed thatpretreatment at mild conditions (55 C; 24 h; 4 g NaOH 100 g−1 total solids) caused an increase in thebiochemical methane potential (BMP) of both heads and stalks of the sunflower residues as determinedin batch tests. The highest methane production (268.35 ± 0.11 mL CH4 g−1 volatile solids) wasachieved from the pretreated sunflower head residues. Thereafter; the effect of alkaline pretreatmentof sunflower head residues was assessed in continuous mode; using continuous stirred-tank reactors(CSTRs) under two operational phases. During the first phase; the CSTRs were fed with the liquidfraction produced from the pretreatment of sunflower heads. During the second phase; the CSTRswere fed with the whole slurry resulting from the pretreatment of sunflower heads (i.e., both liquidand solid fractions). In both operating phases; it was observed that the alkaline pretreatment of thesunflower head residues had a negligible (phase I) or even a negative effect on biogas production;which was contradictory to the results of the BMP tests. It seems that; during alkaline pretreatment;this part of the sunflower residues (heads) may release inhibitory compounds; which induce anegative effect on biogas production in the long term (e.g., during continuously run digesters such asCSTR) but not in the short-term (e.g., batch tests) where the effect of the inoculum may not permit theinhibition to be established.
Keywords: anaerobic digestion; lignocellulosic biomass; NaOH pretreatment; bioreactor experiments;biochemical methane potential; inhibition
1. Introduction
Lignocellulosic substrates are considered important feedstocks for the production ofsecond-generation biofuels (e.g., H2, CH4). Agricultural residues comprise a renewable resourcewhich does not compete with plant cultivation for food, since they consist of the nonedible partsof the plants (leaves, stalks), which are usually burned on the fields creating environmental issuesrelated with biomass incineration in the open air [1]. This is also the case with sunflower residues(stalks, leaves, heads) which are produced in large quantities and left in the fields after seed harvesting.In the absence of any alternative reuse, sunflower residues may be a promising renewable resourcefor bioenergy production via anaerobic digestion [2]. However, the presence of lignin is apparently
85
Molecules 2020, 25, 164
the most important factor affecting the biodegradability of lignocellulosic materials. Therefore, therecalcitrant structure of lignocellulosic substrates consisting of holocelluloses (cellulose, hemicelluloses)that are embedded in the lignin network, requires the application of pretreatment, to increase theaccessibility of holocelluloses to bacteria during anaerobic digestion [3].
Pretreatment methods, such as mechanical, thermo-chemical, chemical, and biological, have beenapplied to improve biogas production from anaerobic digestion of lignocellulosic residues [4,5]. Amongthem, dilute-acid and alkaline chemical pretreatments are the most widely used for sunflower residues,being low-cost and effective processes [5–7]. Dilute-acid pretreatment, hydrolyzes hemicelluloses intomonomeric sugars, improving cellulose conversion and increasing enzyme accessibility [8]. By alkalinepretreatment, the cleavage of ester bonds mainly occurs in lignin/phenolics–carbohydrate complexes,resulting in partial lignin removal [3]. On the other hand, it should be emphasized, that applyingpretreatment on plant biomass, lignin derived compounds are released which may be inhibitory toanaerobic microorganisms [6]. Acid pretreatment causes the hydrolyzation of the hemicellulosic fractioninto furaldehydes [5-hydroxymethylfurfural (5-HMF) and furfural] and aliphatic acids (i.e., formicand acetic acid) [9]. Moreover, Antonopoulou et al. [7] reported that high NaOH concentrationduring pretreatment of sunflower straw biomass, resulted in a high concentration of phenolics. Thesecompounds might have an inhibitory or even toxic effect on anaerobic microorganisms and therefore,should be always taken into consideration. Monlau et al. [6,10] applied various chemical pretreatmentson sunflower straw studying their influence on lignin removal and evaluating the biochemical methanepotential (BMP). They reported that alkaline pretreatment at 55 C, for 24 h with 4 g NaOH 100 g−1
total solids, was the most suitable for enhancing the anaerobic digestion process and methane potential.Monlau et al. [2], applied this mild NaOH pretreatment in continuous experiments and noticed anincrease of 26% in methane yield. However, it is not well understood how the different parts of theresidues (i.e., stalks and heads) can respond to the pretreatment scheme at different modes of theanaerobic digestion process (batch and continuous).
The case study considered in this work was of the sunflower residues, abundant in Greece andespecially in the area of East Macedonia and Thrace. FAOSTAT recorded an area of 90,600 hectaresof sunflower seeds cultivated in Greece, with an estimated yield of 2433.8 kg/ha in 2017 [11]. Theseagricultural areas produce large quantities of sunflower residues; Searle and Malins [12] estimatedthat the ratio of residue to harvested grain is 1.77 for the case of sunflower crops. Therefore, theycould be used as feedstock in biogas plants which have been developed in Greece over the recentdecade. The biochemical methane potential of an organic material is usually evaluated through batchtests. On the other hand, experimental results coming from continuously run digesters are scarce butmore trustworthy since they simulate the conditions prevailing in real biogas plants (which operateon a continuous mode) and reveal the long-term response of the anaerobic biomass to a particularfeedstock. To this end, the effect of alkaline pretreatment on the biogas production from sunflowerresidues was studied in two different types of digesters (batch and continuous), focusing mostly on theheads. Consequently, the results of the presented study can be considered to be complementary tothose reported in Monlau et al. [2], which is the only reference (to our knowledge) focusing on thedigestion of sunflower stalks in continuous mode at mesophilic conditions, after alkaline pretreatmentunder the same conditions. These results show how an estimation based on the typical biomethanepotential tests can be proven wrong by experiments run in continuous mode.
2. Results and Discussion
2.1. Sunflower Heads and Stalks Characteristics
Heads and stalks, prior to any analysis, were dried in an oven resulting in a low humidity level ofca. 10% for both residues. The chemical oxygen demand (COD) concentration was higher for stalks by20.8% in comparison to heads, which is in agreement with the higher volatile solid (VS) content of
86

Molecules 2020, 25, 164
stalks (87.7% of total solids; TS for heads and 79.9% of TS for stalks). On the contrary, total Kjeldahlnitrogen (TKN) and lipids of heads were more than two times higher compared to stalks (Table 1).
Table 1. Composition of the sunflower heads and stalks (raw) as well as their solid and liquid fractions(SF and LF respectively) after alkaline pretreatment.
Raw SFPretreated
LFPretreated Raw SF
PretreatedLF
Pretreated
Humidity (%) 9.46 ± 0.4 1.3 ± 1.8 - 8.1 ± 0.4 2.5 ± 1.0 -
Total solids; TS(% WM) 90.5 ± 0.4 98.7 ± 17.6 - 91.9 ± 0.3 97.5 ± 1.0 -
Volatile solids; vs.(% WM) 72.4 ± 0.8 87.8 ± 10.4 - 80.6 ± 0.2 83.3 ± 11.5 -
VS (% TS) 79.9 ± 0.5 88.9 ± 0.5 - 87.7 ± 0.1 85.5 ± 0.3 -
Chemical oxygendemand; COD
(SF g kg−1TS or LF g L−1)890 ± 26 967 ± 28 8.3 ± 0.3 1075 ± 34 1067 ± 56 6.2 ± 0.1
TKN (g kg−1TS) 13.3 ± 0.3 13.8 ± 0.3 - 6.3 ± 0.0 5.6 ± 0.2 -
Lipids (g kg−1TS) 2.5 ± 0.1 - - 0.99 ± 0.06 - -
Phenols(mg Gallic Acid L−1) - - 214 ± 4 - - 112 ± 2
WM: wet matter, DM: dry matter.
The latter could be attributed to some seed residues in the heads, which are rich in lipids andproteins [13]. Klason lignin content of raw stalks reported here (20.36% VS, Table 2) was lowercompared to the results of Monlau et al. (29.7% VS) [6]. Klason lignin concentration of stalks (20.36%VS) was much higher in comparison to heads (10.48% VS, Table 2), providing a more rigid structure forstalks and reducing their biodegradability. Elemental analysis showed that both, heads and stalks,contained a significant amount of Ca, Mg, K, Si, and Fe (Table 3). Nevertheless, trace elements such asCo, Mo, Ni, and W which are considered to be essential for the process of anaerobic digestion [14],were either detected in small concentrations or were absent.
Table 2. Lignin content of raw and pretreated sunflower residues.
Klason Lignin
(% Raw VS)
Heads raw matter 10.48 ± 0.28Heads pretreated 7.19 ± 0.19Stalks raw matter 20.36 ± 0.66Stalks pretreated 18.74 ± 0.24
2.2. Pretreatment Effect on the Biochemical Methane Potential (BMP) of Sunflower Heads andStalks—Batch Experiments
The BMPs of all fractions were expressed as mL CH4 per g of vs. prior to pretreatment (calledas “raw”) for both pretreated and untreated sunflower heads and stalks, so that comparisons werepossible. Control tests were conducted with the untreated sunflower head or stalk (raw). In all cases,the methane volume produced from the blank tests was subtracted to exclude the contribution ofthe inoculum in the BMP. The alkaline pretreated sunflower head or stalk were separated into theirrespective liquid and solid fractions (LF and SF respectively). Each fraction was tested separately, butsince the BMP of each fraction was expressed per vs. of the raw material it came from, the BMPs ofboth LF and SF could be summed up and, therefore, express the total BPM of the pretreated head orstalk. The results are shown in Figure 1. In all cases, the LF yielded the lowest methane but at the
87
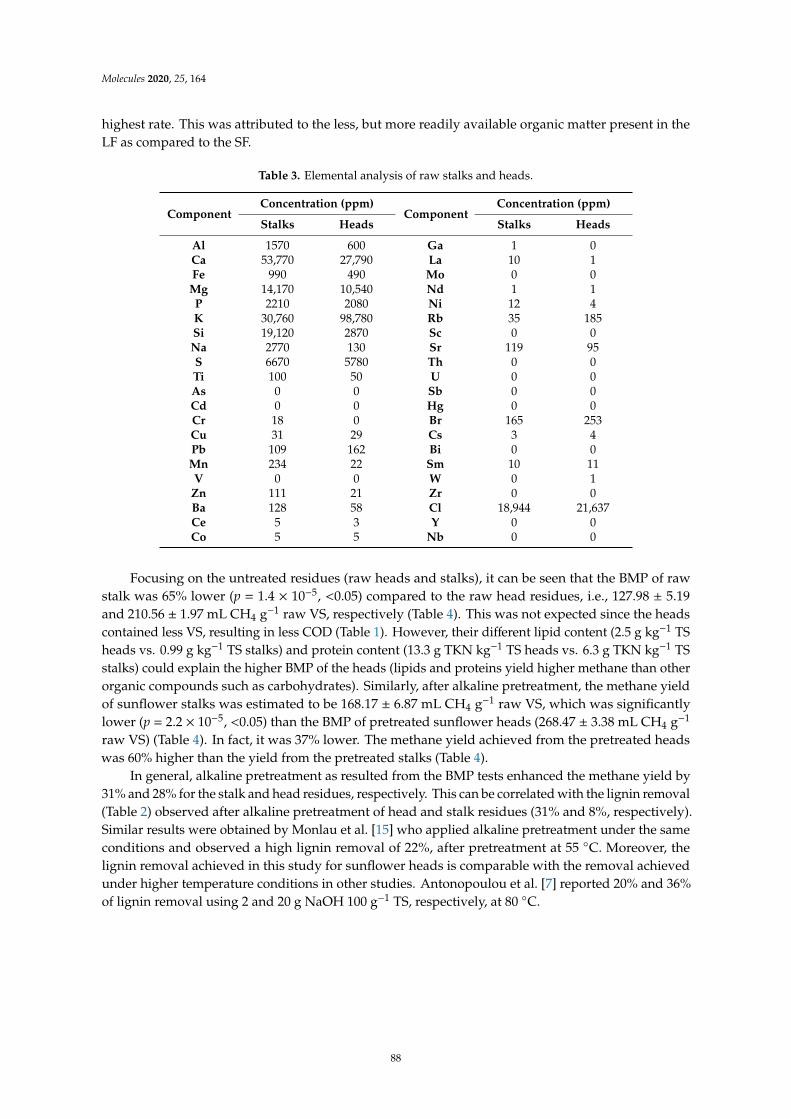
Molecules 2020, 25, 164
highest rate. This was attributed to the less, but more readily available organic matter present in theLF as compared to the SF.
Table 3. Elemental analysis of raw stalks and heads.
ComponentConcentration (ppm)
ComponentConcentration (ppm)
Stalks Heads Stalks Heads
Al 1570 600 Ga 1 0Ca 53,770 27,790 La 10 1Fe 990 490 Mo 0 0
Mg 14,170 10,540 Nd 1 1P 2210 2080 Ni 12 4K 30,760 98,780 Rb 35 185Si 19,120 2870 Sc 0 0Na 2770 130 Sr 119 95S 6670 5780 Th 0 0Ti 100 50 U 0 0As 0 0 Sb 0 0Cd 0 0 Hg 0 0Cr 18 0 Br 165 253Cu 31 29 Cs 3 4Pb 109 162 Bi 0 0Mn 234 22 Sm 10 11V 0 0 W 0 1Zn 111 21 Zr 0 0Ba 128 58 Cl 18,944 21,637Ce 5 3 Y 0 0Co 5 5 Nb 0 0
Focusing on the untreated residues (raw heads and stalks), it can be seen that the BMP of rawstalk was 65% lower (p = 1.4 × 10⁻⁵, <0.05) compared to the raw head residues, i.e., 127.98 ± 5.19and 210.56 ± 1.97 mL CH4 g−1 raw VS, respectively (Table 4). This was not expected since the headscontained less VS, resulting in less COD (Table 1). However, their different lipid content (2.5 g kg−1 TSheads vs. 0.99 g kg−1 TS stalks) and protein content (13.3 g TKN kg−1 TS heads vs. 6.3 g TKN kg−1 TSstalks) could explain the higher BMP of the heads (lipids and proteins yield higher methane than otherorganic compounds such as carbohydrates). Similarly, after alkaline pretreatment, the methane yieldof sunflower stalks was estimated to be 168.17 ± 6.87 mL CH4 g−1 raw VS, which was significantlylower (p = 2.2 × 10⁻⁵, <0.05) than the BMP of pretreated sunflower heads (268.47 ± 3.38 mL CH4 g−1
raw VS) (Table 4). In fact, it was 37% lower. The methane yield achieved from the pretreated headswas 60% higher than the yield from the pretreated stalks (Table 4).
In general, alkaline pretreatment as resulted from the BMP tests enhanced the methane yield by31% and 28% for the stalk and head residues, respectively. This can be correlated with the lignin removal(Table 2) observed after alkaline pretreatment of head and stalk residues (31% and 8%, respectively).Similar results were obtained by Monlau et al. [15] who applied alkaline pretreatment under the sameconditions and observed a high lignin removal of 22%, after pretreatment at 55 C. Moreover, thelignin removal achieved in this study for sunflower heads is comparable with the removal achievedunder higher temperature conditions in other studies. Antonopoulou et al. [7] reported 20% and 36%of lignin removal using 2 and 20 g NaOH 100 g−1 TS, respectively, at 80 C.
88
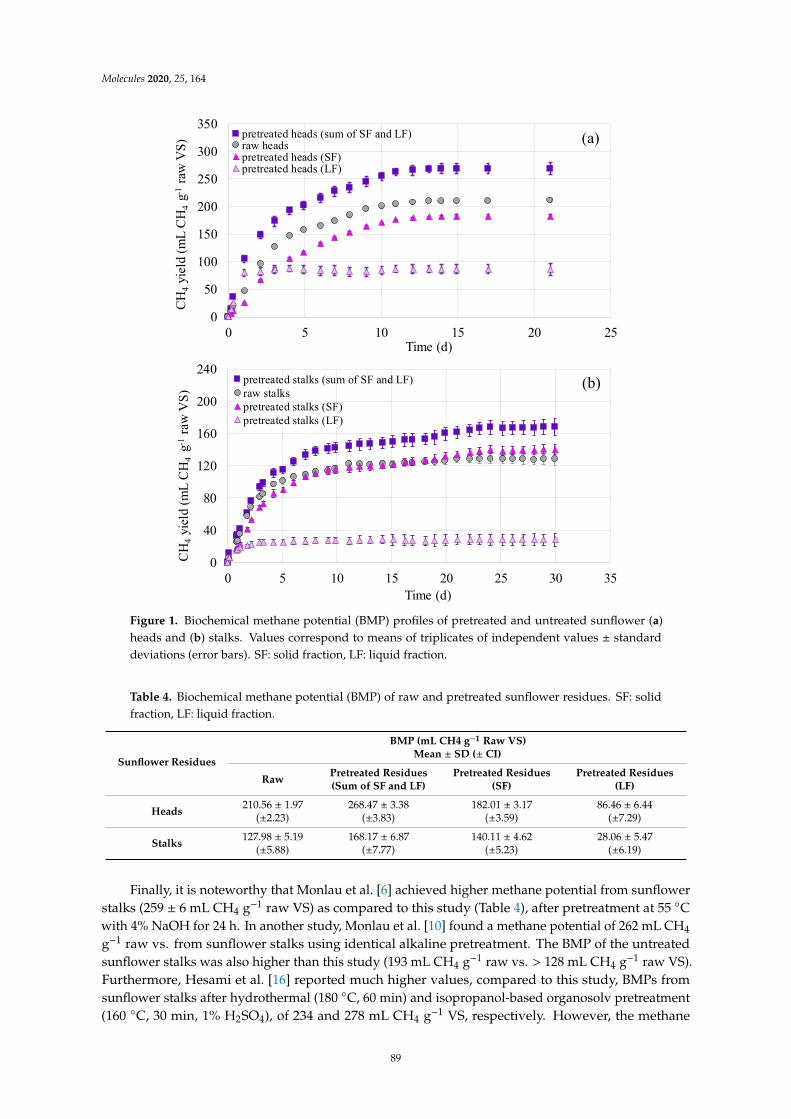
Molecules 2020, 25, 164
Molecules 2019, 24, x 5 of 14
this study. The differences in BMPs as reported in various research studies should be expected, due to the differences in the sunflower variety, the geographical area and the practices used to grow the crop [17]. This is in agreement with Monlau et al. [10], who reported that the alkaline pretreatment (55 °C, 24 h, 4 g NaOH 100 g−1 TS) of stalks of different sunflower varieties resulted in different lignin reduction, varying from 23.3% to 36.3% VS. Moreover, the time the residues were left in the field after harvesting and prior to collection is also a determining factor. In the case of the present study, the residues were collected approximately 2–3 weeks after harvesting.
Figure 1. Biochemical methane potential (BMP) profiles of pretreated and untreated sunflower (a) heads and (b) stalks. Values correspond to means of triplicates of independent values ± standard deviations (error bars). SF: solid fraction, LF: liquid fraction.
Table 4. Biochemical methane potential (BMP) of raw and pretreated sunflower residues. SF: solid fraction, LF: liquid fraction.
Sunflower Residues
BMP (mL CH4 g−1 Raw VS) Mean ± SD (± CI)
Raw Pretreated Residues (Sum of SF and LF)
Pretreated Residues (SF) Pretreated Residues (LF)
Heads 210.56 ± 1.97 (±2.23)
268.47 ± 3.38 (±3.83)
182.01 ± 3.17 (±3.59)
86.46 ± 6.44 (±7.29)
Stalks 127.98 ± 5.19
(±5.88) 168.17 ± 6.87
(±7.77) 140.11 ± 4.62
(±5.23) 28.06 ± 5.47
(±6.19)
2.3. Continuous Stirred Tank Reactors (CSTRs)–Continuous Experiments
0
50
100
150
200
250
300
350
0 5 10 15 20 25
CH4
yiel
d (m
L CH
4 g-1
raw
VS)
Time (d)
(a)pretreated heads (sum of SF and LF)raw headspretreated heads (SF)pretreated heads (LF)
0
40
80
120
160
200
240
0 5 10 15 20 25 30 35
CH4
yiel
d (m
L CH
4 g-1
raw
VS)
Time (d)
(b)pretreated stalks (sum of SF and LF)raw stalkspretreated stalks (SF)pretreated stalks (LF)
Figure 1. Biochemical methane potential (BMP) profiles of pretreated and untreated sunflower (a)heads and (b) stalks. Values correspond to means of triplicates of independent values ± standarddeviations (error bars). SF: solid fraction, LF: liquid fraction.
Table 4. Biochemical methane potential (BMP) of raw and pretreated sunflower residues. SF: solidfraction, LF: liquid fraction.
Sunflower Residues
BMP (mL CH4 g−1 Raw VS)Mean ± SD (± CI)
Raw Pretreated Residues(Sum of SF and LF)
Pretreated Residues(SF)
Pretreated Residues(LF)
Heads 210.56 ± 1.97(±2.23)
268.47 ± 3.38(±3.83)
182.01 ± 3.17(±3.59)
86.46 ± 6.44(±7.29)
Stalks 127.98 ± 5.19(±5.88)
168.17 ± 6.87(±7.77)
140.11 ± 4.62(±5.23)
28.06 ± 5.47(±6.19)
Finally, it is noteworthy that Monlau et al. [6] achieved higher methane potential from sunflowerstalks (259 ± 6 mL CH4 g−1 raw VS) as compared to this study (Table 4), after pretreatment at 55 Cwith 4% NaOH for 24 h. In another study, Monlau et al. [10] found a methane potential of 262 mL CH4
g−1 raw vs. from sunflower stalks using identical alkaline pretreatment. The BMP of the untreatedsunflower stalks was also higher than this study (193 mL CH4 g−1 raw vs. > 128 mL CH4 g−1 raw VS).Furthermore, Hesami et al. [16] reported much higher values, compared to this study, BMPs fromsunflower stalks after hydrothermal (180 C, 60 min) and isopropanol-based organosolv pretreatment(160 C, 30 min, 1% H2SO4), of 234 and 278 mL CH4 g−1 VS, respectively. However, the methane
89
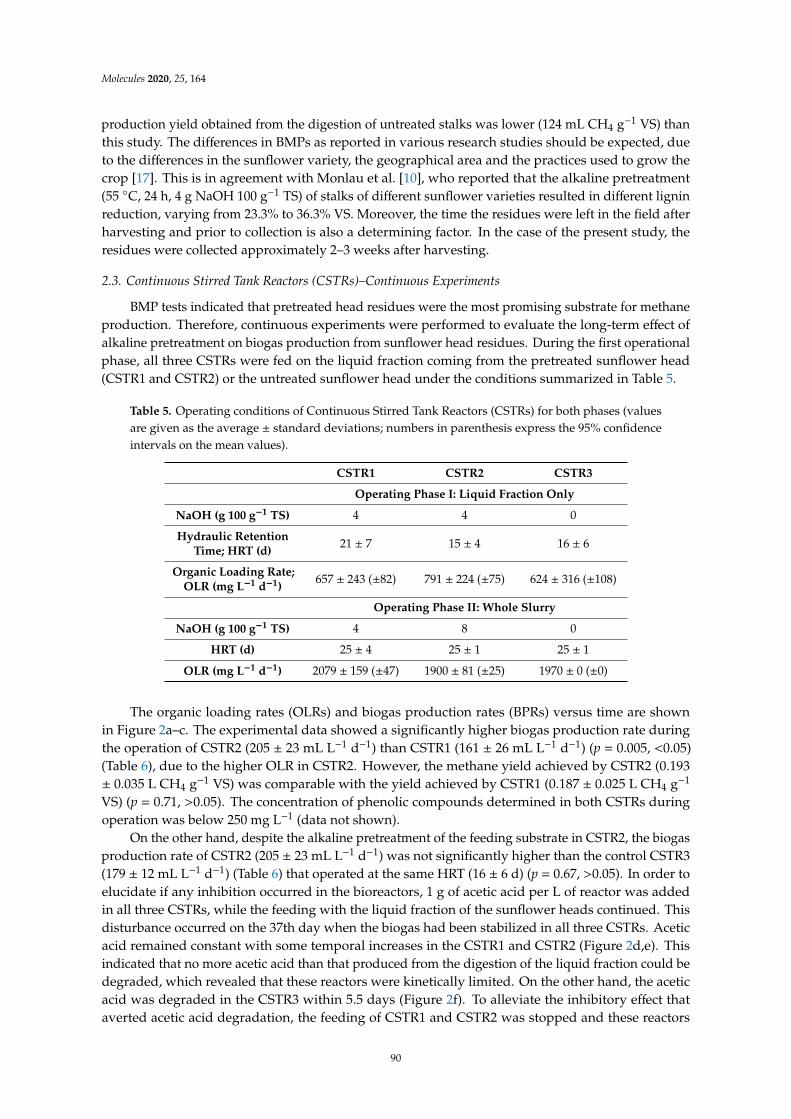
Molecules 2020, 25, 164
production yield obtained from the digestion of untreated stalks was lower (124 mL CH4 g−1 VS) thanthis study. The differences in BMPs as reported in various research studies should be expected, dueto the differences in the sunflower variety, the geographical area and the practices used to grow thecrop [17]. This is in agreement with Monlau et al. [10], who reported that the alkaline pretreatment(55 C, 24 h, 4 g NaOH 100 g−1 TS) of stalks of different sunflower varieties resulted in different ligninreduction, varying from 23.3% to 36.3% VS. Moreover, the time the residues were left in the field afterharvesting and prior to collection is also a determining factor. In the case of the present study, theresidues were collected approximately 2–3 weeks after harvesting.
2.3. Continuous Stirred Tank Reactors (CSTRs)–Continuous Experiments
BMP tests indicated that pretreated head residues were the most promising substrate for methaneproduction. Therefore, continuous experiments were performed to evaluate the long-term effect ofalkaline pretreatment on biogas production from sunflower head residues. During the first operationalphase, all three CSTRs were fed on the liquid fraction coming from the pretreated sunflower head(CSTR1 and CSTR2) or the untreated sunflower head under the conditions summarized in Table 5.
Table 5. Operating conditions of Continuous Stirred Tank Reactors (CSTRs) for both phases (valuesare given as the average ± standard deviations; numbers in parenthesis express the 95% confidenceintervals on the mean values).
CSTR1 CSTR2 CSTR3
Operating Phase I: Liquid Fraction Only
NaOH (g 100 g−1 TS) 4 4 0
Hydraulic RetentionTime; HRT (d) 21 ± 7 15 ± 4 16 ± 6
Organic Loading Rate;OLR (mg L−1 d−1) 657 ± 243 (±82) 791 ± 224 (±75) 624 ± 316 (±108)
Operating Phase II: Whole Slurry
NaOH (g 100 g−1 TS) 4 8 0
HRT (d) 25 ± 4 25 ± 1 25 ± 1
OLR (mg L−1 d−1) 2079 ± 159 (±47) 1900 ± 81 (±25) 1970 ± 0 (±0)
The organic loading rates (OLRs) and biogas production rates (BPRs) versus time are shownin Figure 2a–c. The experimental data showed a significantly higher biogas production rate duringthe operation of CSTR2 (205 ± 23 mL L−1 d−1) than CSTR1 (161 ± 26 mL L−1 d−1) (p = 0.005, <0.05)(Table 6), due to the higher OLR in CSTR2. However, the methane yield achieved by CSTR2 (0.193± 0.035 L CH4 g−1 VS) was comparable with the yield achieved by CSTR1 (0.187 ± 0.025 L CH4 g−1
VS) (p = 0.71, >0.05). The concentration of phenolic compounds determined in both CSTRs duringoperation was below 250 mg L−1 (data not shown).
On the other hand, despite the alkaline pretreatment of the feeding substrate in CSTR2, the biogasproduction rate of CSTR2 (205 ± 23 mL L−1 d−1) was not significantly higher than the control CSTR3(179 ± 12 mL L−1 d−1) (Table 6) that operated at the same HRT (16 ± 6 d) (p = 0.67, >0.05). In order toelucidate if any inhibition occurred in the bioreactors, 1 g of acetic acid per L of reactor was addedin all three CSTRs, while the feeding with the liquid fraction of the sunflower heads continued. Thisdisturbance occurred on the 37th day when the biogas had been stabilized in all three CSTRs. Aceticacid remained constant with some temporal increases in the CSTR1 and CSTR2 (Figure 2d,e). Thisindicated that no more acetic acid than that produced from the digestion of the liquid fraction could bedegraded, which revealed that these reactors were kinetically limited. On the other hand, the aceticacid was degraded in the CSTR3 within 5.5 days (Figure 2f). To alleviate the inhibitory effect thataverted acetic acid degradation, the feeding of CSTR1 and CSTR2 was stopped and these reactors
90
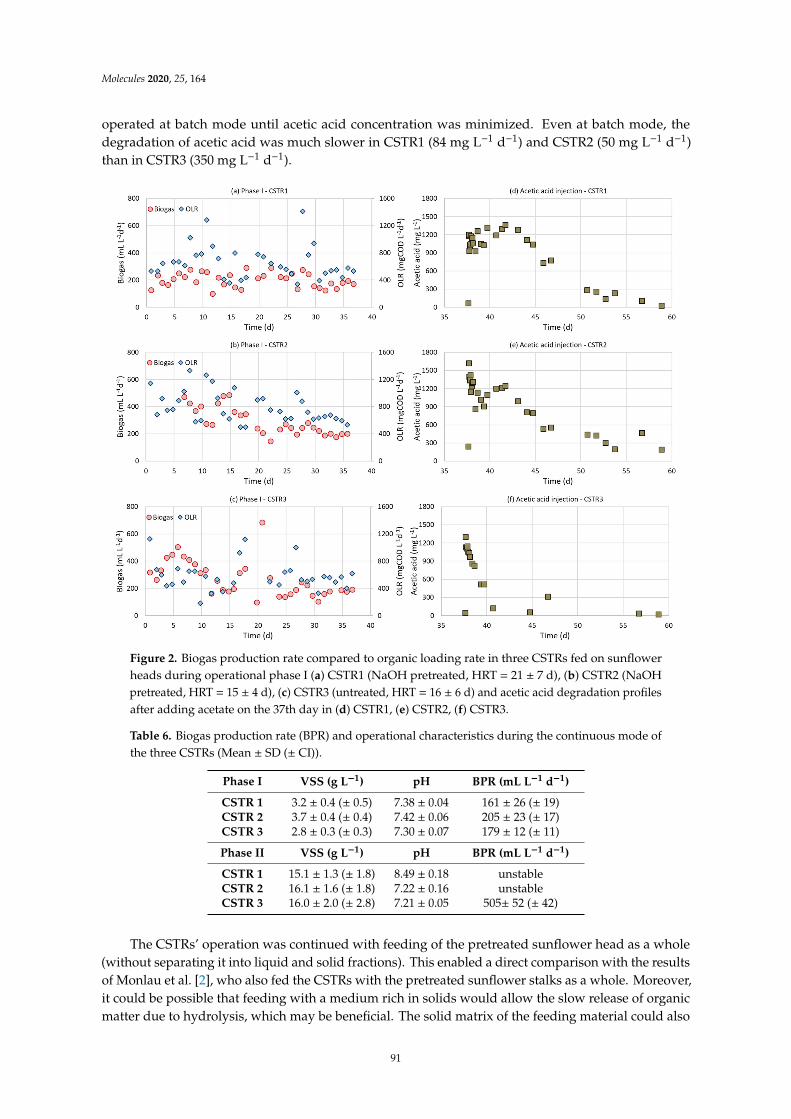
Molecules 2020, 25, 164
operated at batch mode until acetic acid concentration was minimized. Even at batch mode, thedegradation of acetic acid was much slower in CSTR1 (84 mg L−1 d−1) and CSTR2 (50 mg L−1 d−1)than in CSTR3 (350 mg L−1 d−1).Molecules 2019, 24, x 7 of 14
Figure 2. Biogas production rate compared to organic loading rate in three CSTRs fed on sunflower heads during operational phase I (a) CSTR1 (NaOH pretreated, HRT = 21 ± 7 d), (b) CSTR2 (NaOH pretreated, HRT = 15 ± 4 d), (c) CSTR3 (untreated, HRT = 16 ± 6 d) and acetic acid degradation profiles after adding acetate on the 37th day in (d) CSTR1, (e) CSTR2, (f) CSTR3.
Table 6. Biogas production rate (BPR) and operational characteristics during the continuous mode of the three CSTRs (Mean ± SD (± CI)).
Phase I VSS (g L−1) pH BPR (mL L−1 d−1) CSTR 1 3.2 ± 0.4 (± 0.5) 7.38 ± 0.04 161 ± 26 (± 19) CSTR 2 3.7 ± 0.4 (± 0.4) 7.42 ± 0.06 205 ± 23 (± 17) CSTR 3 2.8 ± 0.3 (± 0.3) 7.30 ± 0.07 179 ± 12 (± 11) Phase II VSS (g L−1) pH BPR (mL L−1 d−1) CSTR 1 15.1 ± 1.3 (± 1.8) 8.49 ± 0.18 unstable CSTR 2 16.1 ± 1.6 (± 1.8) 7.22 ± 0.16 unstable CSTR 3 16.0 ± 2.0 (± 2.8) 7.21 ± 0.05 505± 52 (± 42)
The CSTRs’ operation was continued with feeding of the pretreated sunflower head as a whole (without separating it into liquid and solid fractions). This enabled a direct comparison with the results of Monlau et al. [2], who also fed the CSTRs with the pretreated sunflower stalks as a whole. Moreover, it could be possible that feeding with a medium rich in solids would allow the slow release of organic matter due to hydrolysis, which may be beneficial. The solid matrix of the feeding material could also provide a more suitable microenvironment for the microorganism to cope with adverse conditions. Blika et al. [18] reported that the presence of solids in olive-mill wastewater was a crucial factor for the stability of the AD process, that might have resulted in adsorption of toxic hydrophobic compounds onto the solids, such as long-chain fatty acids. Therefore, during phase II, the three CSTRs were fed with an increased OLR of ac. 2000 mg L−1 d−1 (Table 5). All CSTRs were operated under an HRT of 25 days, while CSTR2 was fed on sunflower heads pretreated at a higher dose of NaOH (8 g
Figure 2. Biogas production rate compared to organic loading rate in three CSTRs fed on sunflowerheads during operational phase I (a) CSTR1 (NaOH pretreated, HRT = 21 ± 7 d), (b) CSTR2 (NaOHpretreated, HRT = 15 ± 4 d), (c) CSTR3 (untreated, HRT = 16 ± 6 d) and acetic acid degradation profilesafter adding acetate on the 37th day in (d) CSTR1, (e) CSTR2, (f) CSTR3.
Table 6. Biogas production rate (BPR) and operational characteristics during the continuous mode ofthe three CSTRs (Mean ± SD (± CI)).
Phase I VSS (g L−1) pH BPR (mL L−1 d−1)
CSTR 1 3.2 ± 0.4 (± 0.5) 7.38 ± 0.04 161 ± 26 (± 19)CSTR 2 3.7 ± 0.4 (± 0.4) 7.42 ± 0.06 205 ± 23 (± 17)CSTR 3 2.8 ± 0.3 (± 0.3) 7.30 ± 0.07 179 ± 12 (± 11)
Phase II VSS (g L−1) pH BPR (mL L−1 d−1)
CSTR 1 15.1 ± 1.3 (± 1.8) 8.49 ± 0.18 unstableCSTR 2 16.1 ± 1.6 (± 1.8) 7.22 ± 0.16 unstableCSTR 3 16.0 ± 2.0 (± 2.8) 7.21 ± 0.05 505± 52 (± 42)
The CSTRs’ operation was continued with feeding of the pretreated sunflower head as a whole(without separating it into liquid and solid fractions). This enabled a direct comparison with the resultsof Monlau et al. [2], who also fed the CSTRs with the pretreated sunflower stalks as a whole. Moreover,it could be possible that feeding with a medium rich in solids would allow the slow release of organicmatter due to hydrolysis, which may be beneficial. The solid matrix of the feeding material could also
91
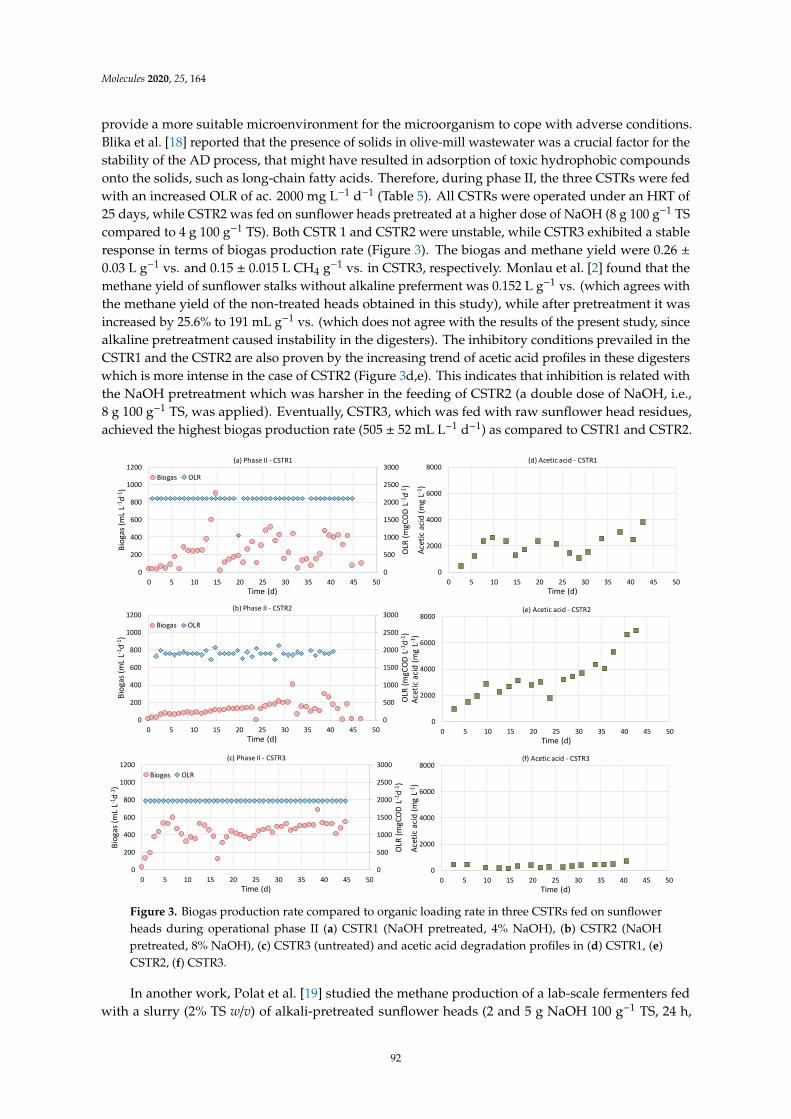
Molecules 2020, 25, 164
provide a more suitable microenvironment for the microorganism to cope with adverse conditions.Blika et al. [18] reported that the presence of solids in olive-mill wastewater was a crucial factor for thestability of the AD process, that might have resulted in adsorption of toxic hydrophobic compoundsonto the solids, such as long-chain fatty acids. Therefore, during phase II, the three CSTRs were fedwith an increased OLR of ac. 2000 mg L−1 d−1 (Table 5). All CSTRs were operated under an HRT of25 days, while CSTR2 was fed on sunflower heads pretreated at a higher dose of NaOH (8 g 100 g−1 TScompared to 4 g 100 g−1 TS). Both CSTR 1 and CSTR2 were unstable, while CSTR3 exhibited a stableresponse in terms of biogas production rate (Figure 3). The biogas and methane yield were 0.26 ±0.03 L g−1 vs. and 0.15 ± 0.015 L CH4 g−1 vs. in CSTR3, respectively. Monlau et al. [2] found that themethane yield of sunflower stalks without alkaline preferment was 0.152 L g−1 vs. (which agrees withthe methane yield of the non-treated heads obtained in this study), while after pretreatment it wasincreased by 25.6% to 191 mL g−1 vs. (which does not agree with the results of the present study, sincealkaline pretreatment caused instability in the digesters). The inhibitory conditions prevailed in theCSTR1 and the CSTR2 are also proven by the increasing trend of acetic acid profiles in these digesterswhich is more intense in the case of CSTR2 (Figure 3d,e). This indicates that inhibition is related withthe NaOH pretreatment which was harsher in the feeding of CSTR2 (a double dose of NaOH, i.e.,8 g 100 g−1 TS, was applied). Eventually, CSTR3, which was fed with raw sunflower head residues,achieved the highest biogas production rate (505 ± 52 mL L−1 d−1) as compared to CSTR1 and CSTR2.
Molecules 2019, 24, x 9 of 14
considered to cause moderate inhibition [23]. In the presented study, the sodium ion concentration entering the digesters was estimated to be 1058 and 2116 mg Na+ L−1 in the case of pretreatment with 4 g and 8 g NaOH per 100 g TS, respectively (4.6% TS was the influent concentration). Therefore, alkali pretreatment, at these NaOH doses applied in this work, does not seem to have caused inhibition through the sodium anion.
Finally, the contradictory results for the methane yields derived from batch and continuous experiments in the present study reveal that batch tests may not give representative results since they are affected by the activity of the inoculum. A highly active inoculum may achieve yield high ratios of methane produced per mass of substrate. On the contrary, under continuous operation, the inoculum is constantly exposed to the feeding conditions which increases the concentration of inhibitory compounds inside the reactor if these are recalcitrant and are not consumed. Therefore, alkaline pretreatment seems to have a positive effect due to organic matter solubilization and destruction of the lignocellulosic matrix, but also a negative effect due to inhibitory compounds probably released as lignin degrades [2]. The positive effect was prominent in the short term during the BMP tests, while the negative effect prevailed in the long term during continuous operation of the digesters.
Figure 3. Biogas production rate compared to organic loading rate in three CSTRs fed on sunflower heads during operational phase II (a) CSTR1 (NaOH pretreated, 4% NaOH), (b) CSTR2 (NaOH pretreated, 8% NaOH), (c) CSTR3 (untreated) and acetic acid degradation profiles in (d) CSTR1, (e) CSTR2, (f) CSTR3.
3. Materials and Methods
3.1. Sunflower Residues Collection and Pretreatment
Sunflower residues were collected, from a farm located in northern Greece (Xanthi city) after seed harvest. The residues were separated into stalks and heads after seed removal. The heads and
0
500
1000
1500
2000
2500
3000
0
200
400
600
800
1000
1200
0 5 10 15 20 25 30 35 40 45 50
OLR
(mgC
OD L
-1d-1
)
Biog
as (m
L L-1
d-1)
Time (d)
(c) Phase II - CSTR3
Biogas OLR
0
2000
4000
6000
8000
0 5 10 15 20 25 30 35 40 45 50
Acet
ic ac
id (m
g L-1
)
Time (d)
(e) Acetic acid - CSTR2
0
2000
4000
6000
8000
0 5 10 15 20 25 30 35 40 45 50
Acet
ic ac
id (m
g L-1
)
Time (d)
(f) Acetic acid - CSTR3
0
500
1000
1500
2000
2500
3000
0
200
400
600
800
1000
1200
0 5 10 15 20 25 30 35 40 45 50
OLR
(mgC
OD L
-1d-1
)
Biog
as (m
L L-1
d-1)
Time (d)
(a) Phase II - CSTR1
Biogas OLR
0
500
1000
1500
2000
2500
3000
0
200
400
600
800
1000
1200
0 5 10 15 20 25 30 35 40 45 50
OLR
(mgC
OD L
-1d-1
)
Biog
as (m
L L-1
d-1)
Time (d)
(b) Phase II - CSTR2
Biogas OLR
0
2000
4000
6000
8000
0 5 10 15 20 25 30 35 40 45 50
Acet
ic ac
id (m
g L-1
)
Time (d)
(d) Acetic acid - CSTR1
Figure 3. Biogas production rate compared to organic loading rate in three CSTRs fed on sunflowerheads during operational phase II (a) CSTR1 (NaOH pretreated, 4% NaOH), (b) CSTR2 (NaOHpretreated, 8% NaOH), (c) CSTR3 (untreated) and acetic acid degradation profiles in (d) CSTR1, (e)CSTR2, (f) CSTR3.
In another work, Polat et al. [19] studied the methane production of a lab-scale fermenters fedwith a slurry (2% TS w/v) of alkali-pretreated sunflower heads (2 and 5 g NaOH 100 g−1 TS, 24 h,
92
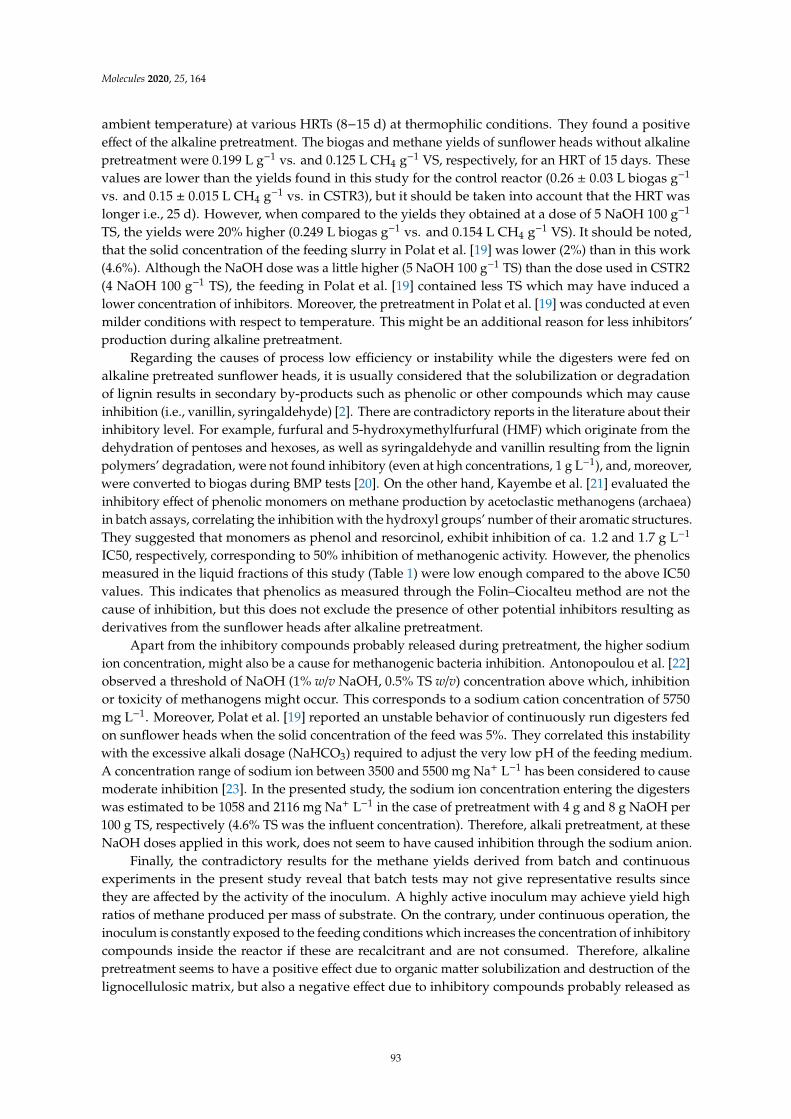
Molecules 2020, 25, 164
ambient temperature) at various HRTs (8−15 d) at thermophilic conditions. They found a positiveeffect of the alkaline pretreatment. The biogas and methane yields of sunflower heads without alkalinepretreatment were 0.199 L g−1 vs. and 0.125 L CH4 g−1 VS, respectively, for an HRT of 15 days. Thesevalues are lower than the yields found in this study for the control reactor (0.26 ± 0.03 L biogas g−1
vs. and 0.15 ± 0.015 L CH4 g−1 vs. in CSTR3), but it should be taken into account that the HRT waslonger i.e., 25 d). However, when compared to the yields they obtained at a dose of 5 NaOH 100 g−1
TS, the yields were 20% higher (0.249 L biogas g−1 vs. and 0.154 L CH4 g−1 VS). It should be noted,that the solid concentration of the feeding slurry in Polat et al. [19] was lower (2%) than in this work(4.6%). Although the NaOH dose was a little higher (5 NaOH 100 g−1 TS) than the dose used in CSTR2(4 NaOH 100 g−1 TS), the feeding in Polat et al. [19] contained less TS which may have induced alower concentration of inhibitors. Moreover, the pretreatment in Polat et al. [19] was conducted at evenmilder conditions with respect to temperature. This might be an additional reason for less inhibitors’production during alkaline pretreatment.
Regarding the causes of process low efficiency or instability while the digesters were fed onalkaline pretreated sunflower heads, it is usually considered that the solubilization or degradationof lignin results in secondary by-products such as phenolic or other compounds which may causeinhibition (i.e., vanillin, syringaldehyde) [2]. There are contradictory reports in the literature about theirinhibitory level. For example, furfural and 5-hydroxymethylfurfural (HMF) which originate from thedehydration of pentoses and hexoses, as well as syringaldehyde and vanillin resulting from the ligninpolymers’ degradation, were not found inhibitory (even at high concentrations, 1 g L−1), and, moreover,were converted to biogas during BMP tests [20]. On the other hand, Kayembe et al. [21] evaluated theinhibitory effect of phenolic monomers on methane production by acetoclastic methanogens (archaea)in batch assays, correlating the inhibition with the hydroxyl groups’ number of their aromatic structures.They suggested that monomers as phenol and resorcinol, exhibit inhibition of ca. 1.2 and 1.7 g L−1
IC50, respectively, corresponding to 50% inhibition of methanogenic activity. However, the phenolicsmeasured in the liquid fractions of this study (Table 1) were low enough compared to the above IC50values. This indicates that phenolics as measured through the Folin–Ciocalteu method are not thecause of inhibition, but this does not exclude the presence of other potential inhibitors resulting asderivatives from the sunflower heads after alkaline pretreatment.
Apart from the inhibitory compounds probably released during pretreatment, the higher sodiumion concentration, might also be a cause for methanogenic bacteria inhibition. Antonopoulou et al. [22]observed a threshold of NaOH (1% w/v NaOH, 0.5% TS w/v) concentration above which, inhibitionor toxicity of methanogens might occur. This corresponds to a sodium cation concentration of 5750mg L−1. Moreover, Polat et al. [19] reported an unstable behavior of continuously run digesters fedon sunflower heads when the solid concentration of the feed was 5%. They correlated this instabilitywith the excessive alkali dosage (NaHCO3) required to adjust the very low pH of the feeding medium.A concentration range of sodium ion between 3500 and 5500 mg Na+ L−1 has been considered to causemoderate inhibition [23]. In the presented study, the sodium ion concentration entering the digesterswas estimated to be 1058 and 2116 mg Na+ L−1 in the case of pretreatment with 4 g and 8 g NaOH per100 g TS, respectively (4.6% TS was the influent concentration). Therefore, alkali pretreatment, at theseNaOH doses applied in this work, does not seem to have caused inhibition through the sodium anion.
Finally, the contradictory results for the methane yields derived from batch and continuousexperiments in the present study reveal that batch tests may not give representative results sincethey are affected by the activity of the inoculum. A highly active inoculum may achieve yield highratios of methane produced per mass of substrate. On the contrary, under continuous operation, theinoculum is constantly exposed to the feeding conditions which increases the concentration of inhibitorycompounds inside the reactor if these are recalcitrant and are not consumed. Therefore, alkalinepretreatment seems to have a positive effect due to organic matter solubilization and destruction of thelignocellulosic matrix, but also a negative effect due to inhibitory compounds probably released as
93
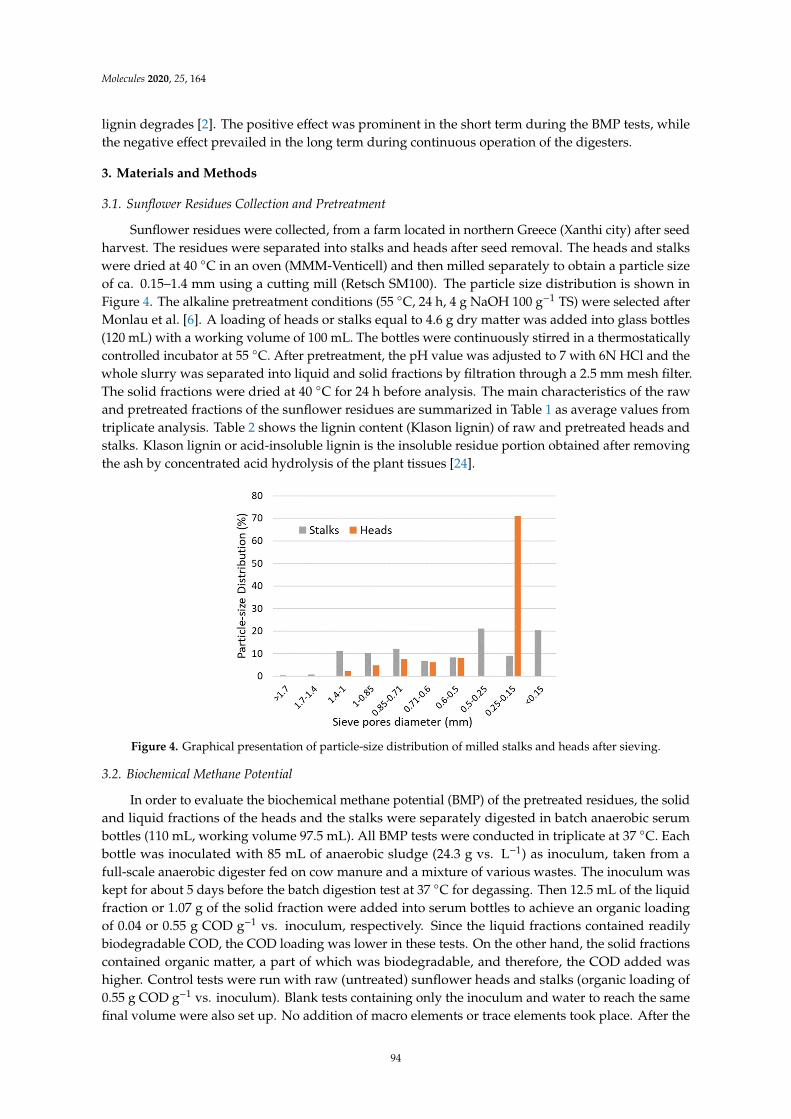
Molecules 2020, 25, 164
lignin degrades [2]. The positive effect was prominent in the short term during the BMP tests, whilethe negative effect prevailed in the long term during continuous operation of the digesters.
3. Materials and Methods
3.1. Sunflower Residues Collection and Pretreatment
Sunflower residues were collected, from a farm located in northern Greece (Xanthi city) after seedharvest. The residues were separated into stalks and heads after seed removal. The heads and stalkswere dried at 40 C in an oven (MMM-Venticell) and then milled separately to obtain a particle sizeof ca. 0.15–1.4 mm using a cutting mill (Retsch SM100). The particle size distribution is shown inFigure 4. The alkaline pretreatment conditions (55 C, 24 h, 4 g NaOH 100 g−1 TS) were selected afterMonlau et al. [6]. A loading of heads or stalks equal to 4.6 g dry matter was added into glass bottles(120 mL) with a working volume of 100 mL. The bottles were continuously stirred in a thermostaticallycontrolled incubator at 55 C. After pretreatment, the pH value was adjusted to 7 with 6N HCl and thewhole slurry was separated into liquid and solid fractions by filtration through a 2.5 mm mesh filter.The solid fractions were dried at 40 C for 24 h before analysis. The main characteristics of the rawand pretreated fractions of the sunflower residues are summarized in Table 1 as average values fromtriplicate analysis. Table 2 shows the lignin content (Klason lignin) of raw and pretreated heads andstalks. Klason lignin or acid-insoluble lignin is the insoluble residue portion obtained after removingthe ash by concentrated acid hydrolysis of the plant tissues [24].
Molecules 2019, 24, x 10 of 14
stalks were dried at 40 °C in an oven (MMM-Venticell) and then milled separately to obtain a particle size of ca. 0.15–1.4 mm using a cutting mill (Retsch SM100). The particle size distribution is shown in Figure 4. The alkaline pretreatment conditions (55 °C, 24 h, 4 g NaOH 100 g−1 TS) were selected after Monlau et al. [6]. A loading of heads or stalks equal to 4.6 g dry matter was added into glass bottles (120 mL) with a working volume of 100 mL. The bottles were continuously stirred in a thermostatically controlled incubator at 55 °C. After pretreatment, the pH value was adjusted to 7 with 6N HCl and the whole slurry was separated into liquid and solid fractions by filtration through a 2.5 mm mesh filter. The solid fractions were dried at 40 °C for 24 h before analysis. The main characteristics of the raw and pretreated fractions of the sunflower residues are summarized in Table 1 as average values from triplicate analysis. Table 2 shows the lignin content (Klason lignin) of raw and pretreated heads and stalks. Klason lignin or acid-insoluble lignin is the insoluble residue portion obtained after removing the ash by concentrated acid hydrolysis of the plant tissues [24].
Figure 4. Graphical presentation of particle-size distribution of milled stalks and heads after sieving.
3.2. Biochemical Methane Potential
In order to evaluate the biochemical methane potential (BMP) of the pretreated residues, the solid and liquid fractions of the heads and the stalks were separately digested in batch anaerobic serum bottles (110 mL, working volume 97.5 mL). All BMP tests were conducted in triplicate at 37 °C. Each bottle was inoculated with 85 mL of anaerobic sludge (24.3 g vs. L−1) as inoculum, taken from a full-scale anaerobic digester fed on cow manure and a mixture of various wastes. The inoculum was kept for about 5 days before the batch digestion test at 37 °C for degassing. Then 12.5 mL of the liquid fraction or 1.07 g of the solid fraction were added into serum bottles to achieve an organic loading of 0.04 or 0.55 g COD g−1 vs. inoculum, respectively. Since the liquid fractions contained readily biodegradable COD, the COD loading was lower in these tests. On the other hand, the solid fractions contained organic matter, a part of which was biodegradable, and therefore, the COD added was higher. Control tests were run with raw (untreated) sunflower heads and stalks (organic loading of 0.55 g COD g−1 vs. inoculum). Blank tests containing only the inoculum and water to reach the same final volume were also set up. No addition of macro elements or trace elements took place. After the preparation of serum bottles, degasification with N2/CO2 mixture (80/20) was carried out for 1 min to obtain anaerobic conditions and the bottles were sealed with rubber stoppers. The headspace of each bottle was connected with a NaOH (6N) displacement apparatus to trap CO2. Methane production was monitored via the volume displacement method and was expressed at standard conditions of temperature and pressure (STP).
3.3. Continuously Stirred Tank Reactors: Set-up and Operation
Experiments were conducted in three identical continuously stirred tank reactors (CSTRs) (Figure 5). Each CSTR had 3.2 L and 2.5 L total and working volume, respectively. All reactors were
Figure 4. Graphical presentation of particle-size distribution of milled stalks and heads after sieving.
3.2. Biochemical Methane Potential
In order to evaluate the biochemical methane potential (BMP) of the pretreated residues, the solidand liquid fractions of the heads and the stalks were separately digested in batch anaerobic serumbottles (110 mL, working volume 97.5 mL). All BMP tests were conducted in triplicate at 37 C. Eachbottle was inoculated with 85 mL of anaerobic sludge (24.3 g vs. L−1) as inoculum, taken from afull-scale anaerobic digester fed on cow manure and a mixture of various wastes. The inoculum waskept for about 5 days before the batch digestion test at 37 C for degassing. Then 12.5 mL of the liquidfraction or 1.07 g of the solid fraction were added into serum bottles to achieve an organic loadingof 0.04 or 0.55 g COD g−1 vs. inoculum, respectively. Since the liquid fractions contained readilybiodegradable COD, the COD loading was lower in these tests. On the other hand, the solid fractionscontained organic matter, a part of which was biodegradable, and therefore, the COD added washigher. Control tests were run with raw (untreated) sunflower heads and stalks (organic loading of0.55 g COD g−1 vs. inoculum). Blank tests containing only the inoculum and water to reach the samefinal volume were also set up. No addition of macro elements or trace elements took place. After the
94
Molecules 2020, 25, 164
preparation of serum bottles, degasification with N2/CO2 mixture (80/20) was carried out for 1 min toobtain anaerobic conditions and the bottles were sealed with rubber stoppers. The headspace of eachbottle was connected with a NaOH (6N) displacement apparatus to trap CO2. Methane productionwas monitored via the volume displacement method and was expressed at standard conditions oftemperature and pressure (STP).
3.3. Continuously Stirred Tank Reactors: Set-up and Operation
Experiments were conducted in three identical continuously stirred tank reactors (CSTRs) (Figure 5).Each CSTR had 3.2 L and 2.5 L total and working volume, respectively. All reactors were constructedfrom two Plexiglas cylinders concentrically configured to allow for the recirculation of hot waterwithin the in-between void space, thus maintaining the digester’s temperature at 35 ± 1 C through acontroller. The CSTRs were mixed at ca. 85 rpm by a mechanical stirrer attached onto the top of thereactors. The biogas and the effluent were removed from the same tube (which determined the level ofthe mixed liquor in the CSTR) into a flask and they were separated. This flask allowed the solids tosettle down while the supernatant overflowed through a port placed in the middle. The solids wereremoved daily from the bottom of the flask. Moreover, the biogas was released from the upper part ofthe flask and was led to a volumetric measurement device consisting of a U-tube filled with oil and a3-way valve solenoid. The valve was activated by a level sensor which allowed for the displacementof oil by the biogas entering the U-tube and the release of biogas after the oil reached a certain level(Figure 5). The biogas production rate (BPR) is reported at STP [25].
Molecules 2019, 24, x 11 of 14
constructed from two Plexiglas cylinders concentrically configured to allow for the recirculation of hot water within the in-between void space, thus maintaining the digester’s temperature at 35 ± 1 °C through a controller. The CSTRs were mixed at ca. 85 rpm by a mechanical stirrer attached onto the top of the reactors. The biogas and the effluent were removed from the same tube (which determined the level of the mixed liquor in the CSTR) into a flask and they were separated. This flask allowed the solids to settle down while the supernatant overflowed through a port placed in the middle. The solids were removed daily from the bottom of the flask. Moreover, the biogas was released from the upper part of the flask and was led to a volumetric measurement device consisting of a U-tube filled with oil and a 3-way valve solenoid. The valve was activated by a level sensor which allowed for the displacement of oil by the biogas entering the U-tube and the release of biogas after the oil reached a certain level (Figure 5). The biogas production rate (BPR) is reported at STP [25].
Figure 5. Experimental configuration used for the continuous tests.
The three CSTRs were inoculated with biomass taken from a full-scale anaerobic digester treating various animal wastes. The operation can be distinguished in two main phases. As shown in Table 5, during the first operating phase, all three CSTRs were fed on the liquid fraction obtained from the sunflower residues’ heads as described in section 2.1 in the presence of NaOH (mild alkaline pretreatment; CSTR 1 and CSTR 2) or in the absence of NaOH (control experiment; CSTR3). For the hydraulic retention time (HRT) it was attempted to maintain equality for CSTR2 and CSTR3, while the HRT was kept higher in the CSTR1 to study the effect of the feeding rate. Since feeding was conducted three times a day via peristaltic pumps set by timers, there was an inevitable variation in the feeding rate which was recorded daily. As a result of the different HRT and the liquid fraction’s characteristics (in the presence or absence of NaOH), the organic loading rate (OLR) was higher in the CSTR 2 (lower HRT) and lower in the CSTR3 (the absence of NaOH resulted in lower extraction of the organic matter in the liquid fraction) The liquid fraction was supplemented with 10 ml L−1 from nutrient and trace elements solutions consisting of 8.2 g L−1 K2HPO4 (solution A), 40.9 g L−1 NH4Cl (solution B), 33 g L−1 FeCl3.4H2O (solution C), and other trace elements (solution D; [25]) which were stored in a different bottle from Fe salt to avoid insoluble salt formation.
After the three CSTRs reached a quasi-steady biogas production rate under the operating conditions of phase I, an impulse disturbance of acetate was imposed, while the CSTRs continued to be fed with the sunflower substrate. Specifically, 1 g L−1 acetate was spiked simultaneously into all
Figure 5. Experimental configuration used for the continuous tests.
The three CSTRs were inoculated with biomass taken from a full-scale anaerobic digester treatingvarious animal wastes. The operation can be distinguished in two main phases. As shown in Table 5,during the first operating phase, all three CSTRs were fed on the liquid fraction obtained fromthe sunflower residues’ heads as described in Section 2.1 in the presence of NaOH (mild alkalinepretreatment; CSTR 1 and CSTR 2) or in the absence of NaOH (control experiment; CSTR3). For thehydraulic retention time (HRT) it was attempted to maintain equality for CSTR2 and CSTR3, while the
95
Molecules 2020, 25, 164
HRT was kept higher in the CSTR1 to study the effect of the feeding rate. Since feeding was conductedthree times a day via peristaltic pumps set by timers, there was an inevitable variation in the feedingrate which was recorded daily. As a result of the different HRT and the liquid fraction’s characteristics(in the presence or absence of NaOH), the organic loading rate (OLR) was higher in the CSTR 2 (lowerHRT) and lower in the CSTR3 (the absence of NaOH resulted in lower extraction of the organic matterin the liquid fraction) The liquid fraction was supplemented with 10 ml L−1 from nutrient and traceelements solutions consisting of 8.2 g L−1 K2HPO4 (solution A), 40.9 g L−1 NH4Cl (solution B), 33 g L−1
FeCl3.4H2O (solution C), and other trace elements (solution D; [25]) which were stored in a differentbottle from Fe salt to avoid insoluble salt formation.
After the three CSTRs reached a quasi-steady biogas production rate under the operating conditionsof phase I, an impulse disturbance of acetate was imposed, while the CSTRs continued to be fed withthe sunflower substrate. Specifically, 1 g L−1 acetate was spiked simultaneously into all three CSTRson the 37th day, increasing instantly the concentration of acetate inside the reactors. The aim of thisdisturbance was to study the response of the acetoclastic methanogens prevailing under the imposedoperating conditions.
After depletion of acetate, the second operating phase started to introduce the whole slurry biomass(without separating it into liquid and solid fractions) after alkaline pretreatment in two different NaOHdoses (CSTR1 and CSTR2) or without alkaline pretreatment (CSTR3; control experiment). Similarly, tothe first operating phase, nutrient and trace element solutions were added. The feeding was conductedmanually to avoid clogging problems due to the solids. The HRT resulting was 25 d for all three CSTRs.The organic loading rate (OLR) resulted as shown in Table 5. All feeding mixtures introduced into theCSTRs were adjusted to pH 7 with 6 N HCl.
3.4. Statistics
All data obtained were statistically analyzed to calculate average values (Equation (1)) andstandard deviations (Equation (2)).
Y =
∑ni=1 Yi
n(1)
SD =
√∑ni=1
(Yi −Y
)2
n− 1(2)
where Y is the average of the measured values, SD is the standard deviation, Yi are the experimentalvalues, and n is the number of data.
The 95% Confidence Interval (CI) on the mean was computed as follows (Equation (3)):
CI = Y±Z95· SD√n
(3)
where Z95 is the upper (1 − 0.95)/2 critical value for the standard normal distribution.An F-test was performed to determine the homogeneity of variances, followed by analysis of
variance method (two-sample t-test, p 0.05), to assess the effect of pretreatment of sunflower residueson anaerobic digestion performance using Microsoft Excel software.
3.5. Analytical Methods
The characterization of sunflower heads and stalks as well as the samples from all bioreactorswas performed in the laboratory of Wastewater Management and Treatment Technologies of theDepartment of Environmental Engineering at Democritus University of Thrace (DUTH, Greece).Chemical oxygen demand (COD), total Kjeldahl nitrogen (TKN), total solids (TS), volatile solids(VS) and lipids were determined according to Standard Methods [26]. The pH was measured witha pH meter (HANNA, HI 83141, HANNA INSTRUMENTS HELLAS, Athens, Greece). Phenols’
96
Molecules 2020, 25, 164
concentration was measured according to Cindric et al. [27]. Klason lignin content was determinedaccording to the Laboratory Analytical Procedure (LAP) [28]. The concentrations of volatile fattyacids (VFAs) were measured in a gas chromatograph (Perkin Elmer, Waltham, MA, US) equippedwith a capillary free fatty acid phase (FFAP) column, a flame ionization detector, and helium ascarrier gas, while the oven temperature program was 50 C to 200 C with 10 C min−1 rate. A gasanalyzer equipped with CO2 and CH4 infrared sensors (GasCard NG model of the Edinburgh Sensors)(Edinburgh Instruments Ltd, Livingston, UK) was used for determining biogas composition.
For the elemental analysis of stalks and heads, the samples were pelletized in the Atlas 25 tonManual Hydraulic Press (Specac, Kent, UK) with Atlas™ 40 mm Evacuable Pellet Die (Specac, Kent,UK) by using a 2 g subsample with boric acid as substrate (H3BO3 99.9%, Socachim, Belguim). Analysiswas conducted using a Wavelength dispersive X-ray fluorescence spectrometer (ZSX Primus II, RigakuCorporation, Tokyo, Japan), which was calibrated using the NIST standards: 1646a, 1648a, 2584,and 2710a.
4. Conclusions
Results presented herein showed that the sunflower head and stalk residues after alkalinepretreatment had a positive effect on the biogas production as evaluated during BMP tests. On theother hand, CSTR operation with pretreated sunflower heads, indicated the opposite. Experimentalobservations revealed that alkaline pretreatment obviously causes inhibitory conditions, which couldnot be detected in the batch tests where, mostly, the short-term response of the microorganisms isshown. This indicates, that BMP tests cannot always reveal the real effect of treatment conditions, sincethe microbial biomass is not continuously exposed to the positive or adverse effects of these conditions.Since sunflower heads, after alkaline pretreatment, cause instability to continuously operated anaerobicdigesters, they should be excluded from lignocellulosic mixtures which are subjected to alkalinepretreatment, even under mild conditions. On the contrary, if not pretreated, they seem to supportstability in the digesters (with a methane yield of 0.15 ± 0.015 L CH4 g−1 VS) and could be usedas feedstock.
Author Contributions: This work was carried out in collaboration between all authors. Authors M.Z. and A.S.performed the experimental investigation. Author I.A.V.; performed the data curation and the statistical analysisand wrote the first draft of the manuscript. Corresponding Author K.S.; designed the study, performed thesupervision, the writing—review and the editing. All authors have read and agreed to the published version ofthe manuscript.
Funding: This research was funded by the project “INVALOR” (MIS 50002495) which is implemented under theAction “Reinforcement of the Research and Innovation Infrastructure”, funded by the Operational Programme“Competitiveness, Entrepreneurship and Innovation” (NSRF 2014–2020) and co-financed by Greece and theEuropean Union (European Regional Development Fund).
Conflicts of Interest: The authors declare no conflict of interest.
References
1. Ren, N.; Wang, A.; Cao, G.; Xu, J.; Gao, L. Bioconversion of lignocellulosic biomass to hydrogen: Potentialand challenges. Biotechnol. Adv. 2009, 27, 1051–1060. [CrossRef] [PubMed]
2. Monlau, F.; Kaparaju, P.; Trably, E.; Steyer, J.P.; Carrere, H. Alkaline pretreatment to enhance one-stageCH4and two-stage H2/CH4 production from sunflower stalks: Mass, energy and economical balances. Chem.Eng. J. 2015, 260, 377–385. [CrossRef]
3. Monlau, F.; Barakat, A.; Trably, E.; Dumas, C.; Steyer, J.P.; Carrère, H. Lignocellulosic materials intobiohydrogen and biomethane: Impact of structural features and pretreatment. Crit. Rev. Environ. Sci. Technol.2013, 43, 260–322. [CrossRef]
4. Taherzadeh, M.J.; Karimi, K. Pretreatment of lignocellulosic wastes to improve ethanol and biogas production:A review. Int. J. Mol. Sci. 2008, 9, 1621–1651. [CrossRef] [PubMed]
5. Kainthola, J.; Kalamdhad, A.S.; Goud, V.V. A review on enhanced biogas production from anaerobic digestionof lignocellulosic biomass by different enhancement techniques. Process Biochem. 2019, 84, 81–90. [CrossRef]
97
Molecules 2020, 25, 164
6. Monlau, F.; Barakat, A.; Steyer, J.P.; Carrere, H. Comparison of seven types of thermo-chemical pretreatmentson the structural features and anaerobic digestion of sunflower stalks. Bioresour. Technol. 2012, 120, 241–247.[CrossRef]
7. Antonopoulou, G.; Dimitrellos, G.; Beobide, A.S.; Vayenas, D.; Lyberatos, G. Chemical Pretreatment ofSunflower Straw Biomass: The Effect on Chemical Composition and Structural Changes. Waste BiomassValorization 2015, 6, 733–746. [CrossRef]
8. Cao, S.; Pu, Y.; Studer, M.; Wyman, C.; Ragauskas, A.J. Chemical transformations of Populus trichocarpaduring dilute acid pretreatment. RSC Adv. 2012, 2, 10925–10936. [CrossRef]
9. Monlau, F.; Sambusiti, C.; Barakat, A.; Quéméneur, M.; Trably, E.; Steyer, J.P.; Carrère, H. Do furanic andphenolic compounds of lignocellulosic and algae biomass hydrolyzate inhibit anaerobic mixed cultures? Acomprehensive review. Biotechnol. Adv. 2014, 32, 934–951. [CrossRef]
10. Monlau, F.; Aemig, Q.; Barakat, A.; Steyer, J.P.; Carrère, H. Application of optimized alkaline pretreatment forenhancing the anaerobic digestion of different sunflower stalks varieties. Environ. Technol. (United Kingdom)2013, 34, 2155–2162. [CrossRef]
11. Faostat Food and Agriculture Organization of the United Nations Crop Statistics. Available online:http://www.fao.org/faostat/en/#data/QC (accessed on 1 December 2019).
12. Searle, S.; Malins, C. Availability of Cellulosic Residues and Wastes in the EU; International Council on CleanTransportation: Washington, DC, USA, 2013.
13. Gonzalez-Perez, S.; Vereijken, J.M. Review Sunflower proteins: Overview of their physicochemical, structuraland functional properties. J. Sci. Food Agric. 2007, 87, 2173–2191. [CrossRef]
14. Molaey, R.; Bayrakdar, A.; Sürmeli, R.Ö.; Çalli, B. Anaerobic digestion of chicken manure: Mitigating processinhibition at high ammonia concentrations by selenium supplementation. Biomass Bioenergy 2018, 108,439–446. [CrossRef]
15. Monlau, F.; Trably, E.; Barakat, A.; Hamelin, J.; Steyer, J.P.; Carrere, H. Two-stage alkaline-enzymaticpretreatments to enhance biohydrogen production from sunflower stalks. Environ. Sci. Technol. 2013, 47,12591–12599. [CrossRef] [PubMed]
16. Hesami, S.M.; Zilouei, H.; Karimi, K.; Asadinezhad, A. Enhanced biogas production from sunflower stalksusing hydrothermal and organosolv pretreatment. Ind. Crops Prod. 2015, 76, 449–455. [CrossRef]
17. Amon, T.; Amon, B.; Kryvoruchko, V.; Machmüller, A.; Hopfner-Sixt, K.; Bodiroza, V.; Hrbek, R.; Friedel, J.;Pötsch, E.; Wagentristl, H.; et al. Methane production through anaerobic digestion of various energy cropsgrown in sustainable crop rotations. Bioresour. Technol. 2007, 98, 3204–3212. [CrossRef]
18. Blika, P.S.; Stamatelatou, K.; Kornaros, M.; Lyberatos, G. Anaerobic digestion of olive mill wastewater. GlobalNest J. 2009, 11, 364–372.
19. Polat, H.; Selçuk, N.; Soyupak, S. Effect of pretreatments on the semicontinuous anaerobic digestion ofsunflower heads. Energy Sources 1992, 14, 391–403. [CrossRef]
20. Barakat, A.; Monlau, F.; Steyer, J.P.; Carrere, H. Effect of lignin-derived and furan compounds found inlignocellulosic hydrolysates on biomethane production. Bioresour. Technol. 2012, 104, 90–99. [CrossRef]
21. Kayembe, K. Inhibitory Effects of Phenolic Monomers on Methanogenesis in Anaerobic Digestion. Br.Microbiol. Res. J. 2013, 3, 32–41. [CrossRef]
22. Antonopoulou, G.; Lyberatos, G. Effect of pretreatment of sweet sorghum biomass on methane generation.Waste Biomass Valoriza. 2013, 4, 583–591. [CrossRef]
23. McCarty, P.L. Anaerobic Waste Treatment Fundamentals. Public Works 1964, 95, 91–94.24. Chen, H.; Chen, H. Lignocellulose biorefinery feedstock engineering. In Lignocellulose Biorefinery Engineering,
1st ed.; Woodhead Publishing: Cambridge, UK, 2015; pp. 37–86.25. Spyridonidis, A.; Skamagkis, T.; Lambropoulos, L.; Stamatelatou, K. Modeling of anaerobic digestion of
slaughterhouse wastes after thermal treatment using ADM1. J. Environ. Manag. 2018, 224, 49–57. [CrossRef][PubMed]
26. APHA; AWWA; WEF. Standard Methods for the Examination of Water and Wastewater, 20th ed.; American PublicHealth Association/American Water Works Association/Water Environment Federation: Washington, DC,USA, 1999.
27. Cindric, I.J.; Kunštic, M.; Zeiner, M.; Stingeder, G.; Rusak, G. Sample preparation methods for thedetermination of the antioxidative capacity of apple juices. Croatica Chem. Acta 2011, 84, 435–438. [CrossRef]
98

Molecules 2020, 25, 164
28. Sluiter, A.; Hames, B.; Ruiz, R.O.; Scarlata, C.; Sluiter, J.; Templeton, D.; Energy, D. Determination of StructuralCarbohydrates and Lignin in Biomass; Biomass Analysis Technology Team Laboratory Analytical Procedure:Golden, CO, USA, 2004; pp. 1–14.
Sample Availability: Samples of the compounds not available from the authors.
© 2019 by the authors. Licensee MDPI, Basel, Switzerland. This article is an open accessarticle distributed under the terms and conditions of the Creative Commons Attribution(CC BY) license (http://creativecommons.org/licenses/by/4.0/).
99

molecules
Article
Soft Microwave Pretreatment to ExtractP-Hydroxycinnamic Acids from Grass Stalks
Aurélie Bichot 1 , Mickaël Lerosty 1, Laureline Geirnaert 1, Valérie Méchin 2, Hélène Carrère 1 ,Nicolas Bernet 1, Jean-Philippe Delgenès 1 and Diana García-Bernet 1,*
1 Univ Montpellier, INRA, 102 Avenue des Etangs, CEDEX, 11100 Narbonne, France;[email protected] (A.B.); [email protected] (M.L.); [email protected] (L.G.);[email protected] (H.C.); [email protected] (N.B.); [email protected] (J.-P.D.)
2 INRA Institut Jean-Pierre Bourgin, CEDEX, 78026 Versailles, France; [email protected]* Correspondence: [email protected]
Academic Editor: Ivet FerrerReceived: 30 September 2019; Accepted: 25 October 2019; Published: 28 October 2019
Abstract: The aim of this article is to provide an analysis of microwave effects on ferulic andcoumaric acids (FA and CA, respectively) extraction from grass biomass (corn stalks and miscanthus).Microwave pretreatment using various solvents was first compared to conventional heating oncorn stalks. Then, microwave operational conditions were extended in terms of incident powerand treatment duration. Optimal conditions were chosen to increase p-hydroxycinnamic acidsrelease. Finally, these optimal conditions determined on corn stalks were tested on miscanthusstalks to underlie the substrate incidence on p-hydroxycinnamic acids release yields. The optimalconditions—a treatment duration of 405 s under 1000 W—allowed extracting 1.38% FA and 1.97% CAin corn stalks and 0.58% FA and 3.89% CA in miscanthus stalks. The different bioaccessibility of thesetwo molecules can explain the higher or lower yields between corn and miscanthus stalks.
Keywords: microwave pretreatment; grass biomass; p-hydroxycinnamic acids extraction
1. Introduction
Lignocellulosic biomass is a key resource for the sustainable development of the bioeconomy,and its effective implementation would allow a decisive matter and energy co-valorization. First, it isavailable on all continents in different forms and species. Second, the volumes of available resourcesare very large, represent an interesting carbon source, and come from numerous sustainable sourcesavoiding land-use conflicts: agricultural and agri-food wastes, wastes from land-use planning, forestwoody residues, perennial crops on polluted soils (miscanthus), algae, or municipal solid wastes [1].Nevertheless, the use of lignocellulosic biomass is curtailed because of high processing costs anddifficulties related to obtaining high extraction yields. Nowadays, many applications (food andchemical industry, materials) are being explored from agricultural residues and miscanthus, as theyrepresent an alternative source of many high-value molecules (sugars, ethanol, acetic acid, butyric acid,xylitol, propionic acid, oil, etc.) and fibers [2].
Among them, p-hydroxycinnamic acids are increasingly attracting the attention of scientistsand industry because of their interesting features. Indeed, due to their anti-oxidant properties,p-hydroxycinnamic compounds can be used as food preservatives and have a preventive role in sometypes of cancer [3]. Ferulic, coumaric, syringic, and caffeic acids are the most commonly found acids incereals, whether in grains or stems [4]. They are covalently bounded to cell walls and difficult to access.Indeed, p-coumaric acid is principally esterified on lignin S units, and ferulic acid is both etherified tolignin and esterified to hemicelluloses [5–7]. Figure 1 graphically represents the different chemicalbonds that form the complex three-dimensional biomass network.
101
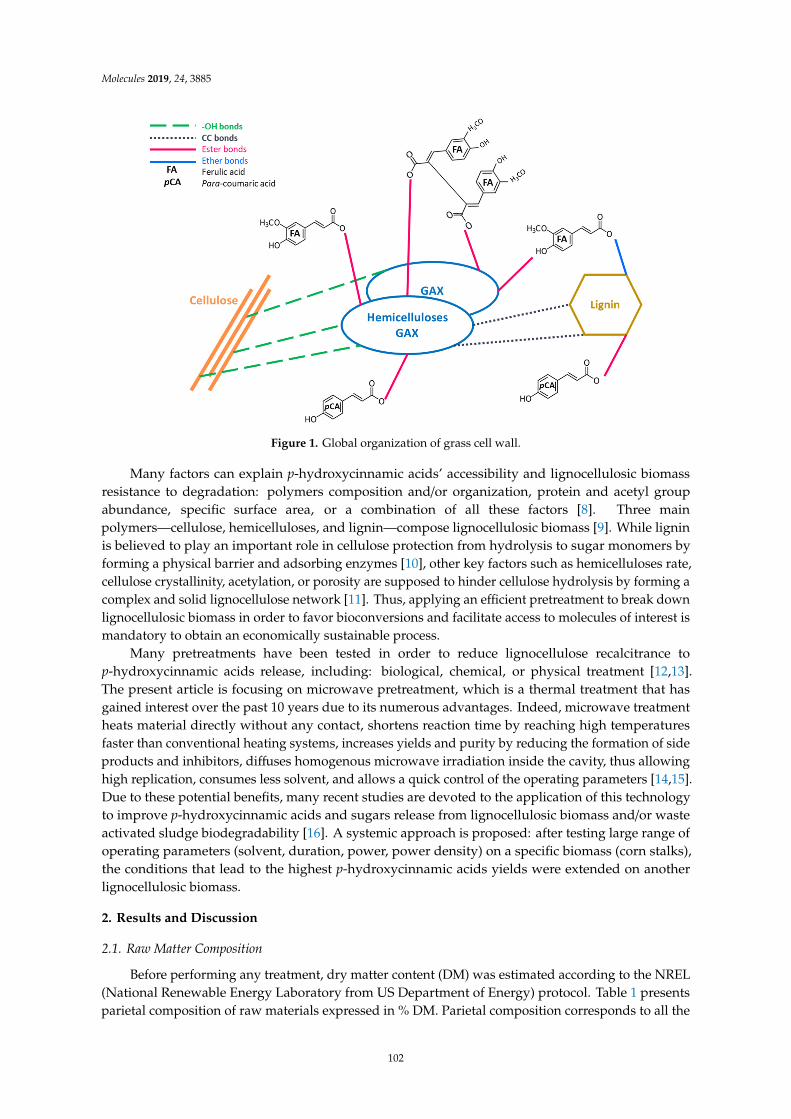
Molecules 2019, 24, 3885
Molecules 2019, 24, 3885 2 of 22
etherified to lignin and esterified to hemicelluloses [5–7]. Figure 1 graphically represents the different chemical bonds that form the complex three-dimensional biomass network.
Figure 1. Global organization of grass cell wall.
Many factors can explain p-hydroxycinnamic acids’ accessibility and lignocellulosic biomass resistance to degradation: polymers composition and/or organization, protein and acetyl group abundance, specific surface area, or a combination of all these factors [8]. Three main polymers—cellulose, hemicelluloses, and lignin—compose lignocellulosic biomass [9]. While lignin is believed to play an important role in cellulose protection from hydrolysis to sugar monomers by forming a physical barrier and adsorbing enzymes [10], other key factors such as hemicelluloses rate, cellulose crystallinity, acetylation, or porosity are supposed to hinder cellulose hydrolysis by forming a complex and solid lignocellulose network [11]. Thus, applying an efficient pretreatment to break down lignocellulosic biomass in order to favor bioconversions and facilitate access to molecules of interest is mandatory to obtain an economically sustainable process.
Many pretreatments have been tested in order to reduce lignocellulose recalcitrance to p-hydroxycinnamic acids release, including: biological, chemical, or physical treatment [12,13]. The present article is focusing on microwave pretreatment, which is a thermal treatment that has gained interest over the past 10 years due to its numerous advantages. Indeed, microwave treatment heats material directly without any contact, shortens reaction time by reaching high temperatures faster than conventional heating systems, increases yields and purity by reducing the formation of side products and inhibitors, diffuses homogenous microwave irradiation inside the cavity, thus allowing high replication, consumes less solvent, and allows a quick control of the operating parameters [14,15]. Due to these potential benefits, many recent studies are devoted to the application of this technology to improve p-hydroxycinnamic acids and sugars release from lignocellulosic biomass and/or waste activated sludge biodegradability [16]. A systemic approach is proposed: after testing large range of operating parameters (solvent, duration, power, power density) on a specific biomass (corn stalks), the conditions that lead to the highest p-hydroxycinnamic acids yields were extended on another lignocellulosic biomass.
Figure 1. Global organization of grass cell wall.
Many factors can explain p-hydroxycinnamic acids’ accessibility and lignocellulosic biomassresistance to degradation: polymers composition and/or organization, protein and acetyl groupabundance, specific surface area, or a combination of all these factors [8]. Three mainpolymers—cellulose, hemicelluloses, and lignin—compose lignocellulosic biomass [9]. While ligninis believed to play an important role in cellulose protection from hydrolysis to sugar monomers byforming a physical barrier and adsorbing enzymes [10], other key factors such as hemicelluloses rate,cellulose crystallinity, acetylation, or porosity are supposed to hinder cellulose hydrolysis by forming acomplex and solid lignocellulose network [11]. Thus, applying an efficient pretreatment to break downlignocellulosic biomass in order to favor bioconversions and facilitate access to molecules of interest ismandatory to obtain an economically sustainable process.
Many pretreatments have been tested in order to reduce lignocellulose recalcitrance top-hydroxycinnamic acids release, including: biological, chemical, or physical treatment [12,13].The present article is focusing on microwave pretreatment, which is a thermal treatment that hasgained interest over the past 10 years due to its numerous advantages. Indeed, microwave treatmentheats material directly without any contact, shortens reaction time by reaching high temperaturesfaster than conventional heating systems, increases yields and purity by reducing the formation of sideproducts and inhibitors, diffuses homogenous microwave irradiation inside the cavity, thus allowinghigh replication, consumes less solvent, and allows a quick control of the operating parameters [14,15].Due to these potential benefits, many recent studies are devoted to the application of this technologyto improve p-hydroxycinnamic acids and sugars release from lignocellulosic biomass and/or wasteactivated sludge biodegradability [16]. A systemic approach is proposed: after testing large range ofoperating parameters (solvent, duration, power, power density) on a specific biomass (corn stalks),the conditions that lead to the highest p-hydroxycinnamic acids yields were extended on anotherlignocellulosic biomass.
2. Results and Discussion
2.1. Raw Matter Composition
Before performing any treatment, dry matter content (DM) was estimated according to the NREL(National Renewable Energy Laboratory from US Department of Energy) protocol. Table 1 presentsparietal composition of raw materials expressed in % DM. Parietal composition corresponds to all the
102

Molecules 2019, 24, 3885
elements that are part of the biomass cell wall: hemicellulose, cellulose, lignin, and ash. Van Soestprotocol was used to determine hemicelluloses, cellulose, acid detergent lignin (ADL), and ash in agravimetrical way, and NREL protocol was used to determine Klason lignin. A clear difference can beseen in the composition of the two studied biomass samples, particularly in terms of wall proportion.Soluble content in miscanthus stalks is very low, and 95% DM of the mass consists of the cell wall,of which cellulose and lignin represent a significant part. Miscanthus is lignified to a greater extentthan corn stalks (twice as much), and its cellulose content is two times higher. It appears that thecompositions of the two biomasses differ significantly, which could explain the differences in behaviorfollowing microwave treatment.
Table 1. Raw matter characteristics: parietal composition analyzed by Van Soest method and Klasonlignin (mean of triplicate and standard error) and alkali extraction for ferulic acid (FA) and coumaricacids (CA) (mean of duplicate and standard error). ADL: acid detergent lignin, DM: dry matter.
Corn Stalks F98902 Miscanthus Stalks GIB Genotype
Soluble Content (%) 35.67 ± 1 4.81 ± 1
Parietal Compositionusing Van SoestMethod (%DM)
Cell wall 64.33 ± 1 95.19 ± 1
Cellulose 28.87 ± 0.5 55.75 ± 1.6
Hemicellulose 26.06 ± 1 21.75 ± 1.1
ADL 8.18 ± 1.7 16.86 ± 1.6
Ash 1.22 ± 0.3 0.83 ± 0.5
Klason Lignin (% DM) 15.00 ± 0.5 24.34 ±0.2
p- HydroxycinnamicAcids (mg/g DM)
Ferulic acid 4.2 ± 0.9 2.1 ± 0.5
Coumaric acid 13.1 ± 2.6 6.5 ± 2.3
Biomass composition (p-hydroxycinnamic acids, parietal polymers) was in agreement with valuesfound in the literature. Provan et al. [17] worked on phenolic compounds in maize straw (2 g CA/100 gDM, 0.6 g FA/100 g DM) or wheat straw (0.5 g CA/100 g DM, 0.01 g FA/100 g DM). In terms of parietalpolymers, the composition can vary significantly among species, but generally admitted values varybetween 27%–40% DM cellulose, 25%–34% DM hemicellulose, and 9%–15% DM lignin for corn stalks,and 28%–49% DM cellulose, 24%–32% DM hemicellulose, and 15%–28% DM lignin for miscanthusstalks [11].
2.2. Effect of Solvent and Treatment on p-Hydroxycinnamic Acids Release
Preliminary experiments were performed on corn stalks sample F98902 using one microwavecondition (500 W for 270 s) and different solvents, in order to select the best one for the pretreatmentof biomass with the microwave pilot. Indeed, solvent is one of the most important parameters inmicrowave pretreatments, as it affects the solubility of the target components, and it interacts differentlywith microwaves depending on its polarity. Polar solvents absorb microwaves, allowing reactionmedia to reach high temperatures quickly, and provoking cell disruption, thus facilitating the releaseof molecules of interest; while non-polar solvents are transparent to microwaves [15,18,19]. In theliterature, many solvents have been tested, including non-polar solvents that do not absorb wavesand allow waves to be concentrated on material. To our knowledge, no scientists have worked withnon-polar solvents in the microwave pretreatment of biomass studies, but hexane is commonly usedmixed with a polar solvent, such as water, for the treatment of polluted soils [20]. Concerning polarsolvents, water and ethanol mixtures are the most commonly used. With ethanol 50% (w:w) and 30 W,Carniel et al. [18] extracted 3.74 mg gallic acid equivalent/g Physalis angulate in less than a minute.Oufnac et al. [21] extracted with methanol up to 467 µg catechin equivalent/g wheat bran, which istwice as high as the extraction yield obtained using conventional heating.
103
Molecules 2019, 24, 3885
In this study, only polar solvents were tested, including water, alkaline water (NaOH), acidicwater (H2SO4), and water/ethanol mixture. The operating conditions were the following (Table 2):270 s of microwave treatment under 500 W (0.179 Wh/g), 360 s of conventional heating, or controlwithout any heating. pH was measured after one hour of soaking, just before treatment. No significantchange in pH was observed after the treatment (Table 2). The antioxidant activities were not studiedin this study and considered equivalent between samples, meaning that the biological activity wasassessed as not having a significant impact on the biomass during the treatments. The maximumtemperature was 99 C for microwave pretreatments in water, 80 C for microwave pretreatmentin ethanol, and between 66 C and 75 C for conventional pretreatments, depending on solvents.Therefore, conventional processing involved a much longer heating time, which is consistent with thebibliographic references: Del Rio et al. [22] realized a biomass thermal treatment for 20 min to reach120 C.
2.2.1. Composition Analysis of Pretreated Biomass
Biomass composition was characterized using Van Soest and Klason methods (Figure 2). Accordingto Figure 2A, parietal polymers contents are not statistically different between raw matter and pretreatedbiomass: standard deviations ranging from 0.1% to 2.3% intersect and do not lead to significantdifferences in parietal composition due to treatments (ANOVA results not shown). For all treatmentstested, ADL represents 7.6% DM, cellulose represents 29% DM, hemicellulose represents 26% DM, andtotal soluble content (from treatment and from NDF Van Soest first step) represents 36.7% DM. Cornstalks’ parietal composition is not significantly modified by the treatments tested.
The lignin content estimated by two different analytical methods is presented in Figure 2B. Fromstatistical analysis, the treatment or the solvent do not statistically affect lignins (ADL and Klason).Lignin is a very resistant polymer to be impacted by the tested soft microwaves conditions. By lookingin greater detail, Klason lignin content is almost always twice as high as ADL content [23], and thedifferences between the two calculation methods vary between 5.4% and 9.4% (excepted for ethanolmicrowave treatment, for which the difference is much smaller with 1.7%). As explained earlier, thisdifference could be interpreted as the part of the lignin linked by β-O-4 bonds and solubilized in 72%H2SO4. As this difference does not vary with the type of treatment employed, it means that β-O-4bonds are not affected by the treatments, and it can be assumed that the lignin internal structureremains the same.
The results differ from those obtained by Choudhary et al. [24]. When sorghum was pretreatedwith alkaline water up to 0.2 g NaOH/g DM in 20 mL water for 4 min and 1000 W, 58.9% ligninwas removed, and 54.9% of hemicellulose was removed, but the cellulose content never varied.In our study, the minor changes in biomass structure can be explained by the moderate temperaturereached, which never exceeded 100 C, by the low incident power during the tests (500 W). Moreover,in Choudhary et al. [24], the NaOH concentration was high compared to our study, and explains lignindegradation and hemicellulose solubilization.
The total mass recovered after treatments of 10 g was around 8 g (Figure 2A). Acid, alkaline, orethanol did not modify the solubility of components: in all cases tested, 2 g of raw matter (out of 10 gused) were solubilized during the treatment.
104
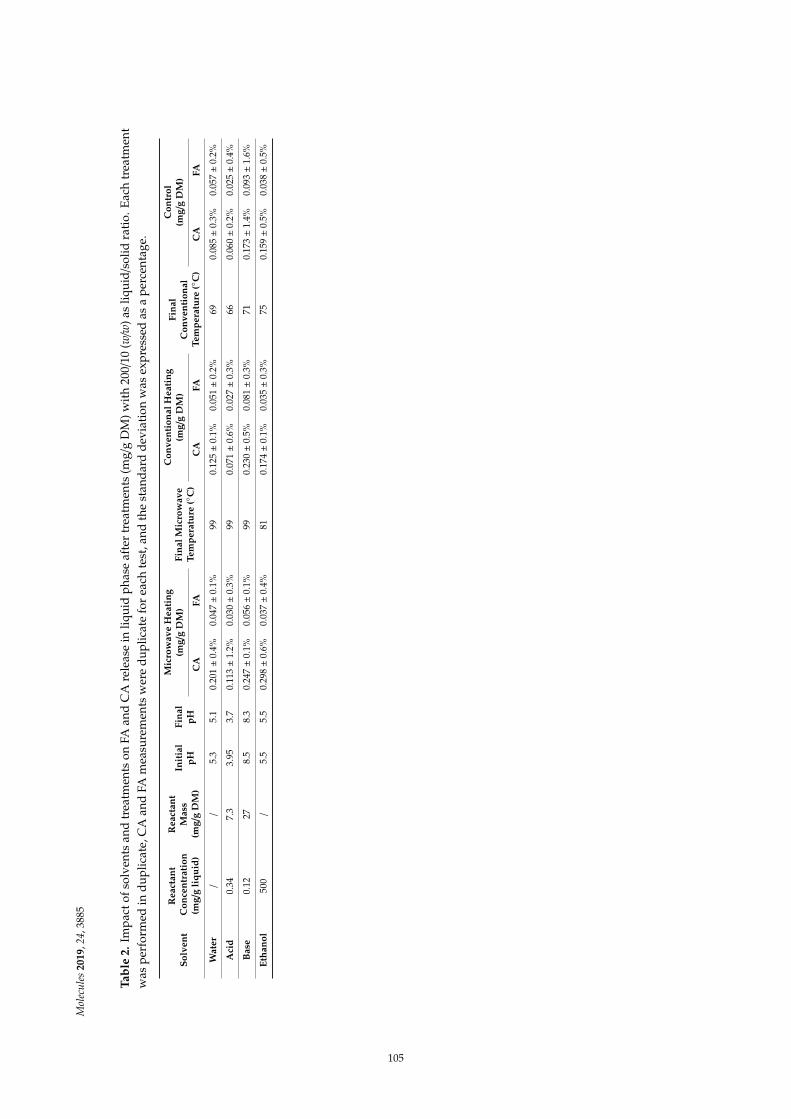
Mol
ecul
es20
19,2
4,38
85
Tabl
e2.
Impa
ctof
solv
ents
and
trea
tmen
tson
FAan
dC
Are
leas
ein
liqui
dph
ase
afte
rtr
eatm
ents
(mg/
gD
M)w
ith
200/
10(w
/w)a
sliq
uid/
solid
rati
o.Ea
chtr
eatm
ent
was
perf
orm
edin
dupl
icat
e,C
Aan
dFA
mea
sure
men
tsw
ere
dupl
icat
efo
rea
chte
st,a
ndth
est
anda
rdde
viat
ion
was
expr
esse
das
ape
rcen
tage
.
Solv
ent
Rea
ctan
tC
once
ntra
tion
(mg/
gli
quid
)
Rea
ctan
tM
ass
(mg/
gD
M)
Init
ial
pHFi
nal
pH
Mic
row
ave
Hea
ting
(mg/
gD
M)
Fina
lMic
row
ave
Tem
pera
ture
(C
)
Con
vent
iona
lHea
ting
(mg/
gD
M)
Fina
lC
onve
ntio
nal
Tem
pera
ture
(C
)
Con
trol
(mg/
gD
M)
CA
FAC
AFA
CA
FA
Wat
er/
/5.
35.
10.
201±0
.4%
0.04
7±0
.1%
990.
125±0
.1%
0.05
1±0
.2%
690.
085±0
.3%
0.05
7±0
.2%
Aci
d0.
347.
33.
953.
70.
113±1
.2%
0.03
0±0
.3%
990.
071±0
.6%
0.02
7±0
.3%
660.
060±0
.2%
0.02
5±0
.4%
Bas
e0.
1227
8.5
8.3
0.24
7±0
.1%
0.05
6±0
.1%
990.
230±0
.5%
0.08
1±0
.3%
710.
173±1
.4%
0.09
3±1
.6%
Etha
nol
500
/5.
55.
50.
298±0
.6%
0.03
7±0
.4%
810.
174±0
.1%
0.03
5±0
.3%
750.
159±0
.5%
0.03
8±0
.5%
105

Molecules 2019, 24, 3885Molecules 2019, 24, 3885 6 of 22
Molecules 2019, 24, 3885; doi:10.3390/molecules24213885 www.mdpi.com/journal/molecules
A
B
Figure 2. Biomass parietal composition depending on treatment (%DM) with Van Soest method (A). The figures in bold (A) are the percentages of insoluble content following the treatments (the mass of solid recovered after drying at 40 °C); the ash content is not represented. Comparison between Klason
Figure 2. Biomass parietal composition depending on treatment (%DM) with Van Soest method (A).The figures in bold (A) are the percentages of insoluble content following the treatments (the mass ofsolid recovered after drying at 40 C); the ash content is not represented. Comparison between Klasonlignin and ADL (B). The figures in bold (B) are the differences between the two lignins measurements.Means of triplicates.
106
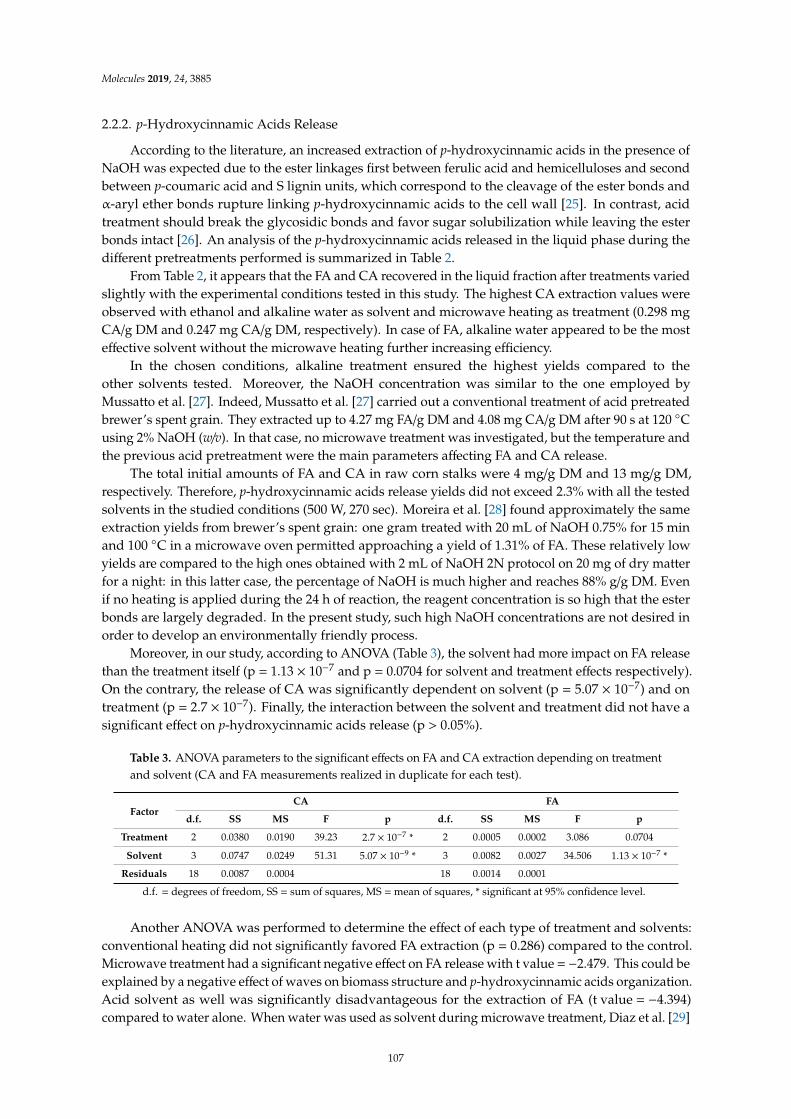
Molecules 2019, 24, 3885
2.2.2. p-Hydroxycinnamic Acids Release
According to the literature, an increased extraction of p-hydroxycinnamic acids in the presence ofNaOH was expected due to the ester linkages first between ferulic acid and hemicelluloses and secondbetween p-coumaric acid and S lignin units, which correspond to the cleavage of the ester bonds andα-aryl ether bonds rupture linking p-hydroxycinnamic acids to the cell wall [25]. In contrast, acidtreatment should break the glycosidic bonds and favor sugar solubilization while leaving the esterbonds intact [26]. An analysis of the p-hydroxycinnamic acids released in the liquid phase during thedifferent pretreatments performed is summarized in Table 2.
From Table 2, it appears that the FA and CA recovered in the liquid fraction after treatments variedslightly with the experimental conditions tested in this study. The highest CA extraction values wereobserved with ethanol and alkaline water as solvent and microwave heating as treatment (0.298 mgCA/g DM and 0.247 mg CA/g DM, respectively). In case of FA, alkaline water appeared to be the mosteffective solvent without the microwave heating further increasing efficiency.
In the chosen conditions, alkaline treatment ensured the highest yields compared to theother solvents tested. Moreover, the NaOH concentration was similar to the one employed byMussatto et al. [27]. Indeed, Mussatto et al. [27] carried out a conventional treatment of acid pretreatedbrewer’s spent grain. They extracted up to 4.27 mg FA/g DM and 4.08 mg CA/g DM after 90 s at 120 Cusing 2% NaOH (w/v). In that case, no microwave treatment was investigated, but the temperature andthe previous acid pretreatment were the main parameters affecting FA and CA release.
The total initial amounts of FA and CA in raw corn stalks were 4 mg/g DM and 13 mg/g DM,respectively. Therefore, p-hydroxycinnamic acids release yields did not exceed 2.3% with all the testedsolvents in the studied conditions (500 W, 270 sec). Moreira et al. [28] found approximately the sameextraction yields from brewer’s spent grain: one gram treated with 20 mL of NaOH 0.75% for 15 minand 100 C in a microwave oven permitted approaching a yield of 1.31% of FA. These relatively lowyields are compared to the high ones obtained with 2 mL of NaOH 2N protocol on 20 mg of dry matterfor a night: in this latter case, the percentage of NaOH is much higher and reaches 88% g/g DM. Evenif no heating is applied during the 24 h of reaction, the reagent concentration is so high that the esterbonds are largely degraded. In the present study, such high NaOH concentrations are not desired inorder to develop an environmentally friendly process.
Moreover, in our study, according to ANOVA (Table 3), the solvent had more impact on FA releasethan the treatment itself (p = 1.13 × 10⁻⁷ and p = 0.0704 for solvent and treatment effects respectively).On the contrary, the release of CA was significantly dependent on solvent (p = 5.07 × 10⁻⁷) and ontreatment (p = 2.7 × 10⁻⁷). Finally, the interaction between the solvent and treatment did not have asignificant effect on p-hydroxycinnamic acids release (p > 0.05%).
Table 3. ANOVA parameters to the significant effects on FA and CA extraction depending on treatmentand solvent (CA and FA measurements realized in duplicate for each test).
FactorCA FA
d.f. SS MS F p d.f. SS MS F p
Treatment 2 0.0380 0.0190 39.23 2.7 × 10−7 * 2 0.0005 0.0002 3.086 0.0704
Solvent 3 0.0747 0.0249 51.31 5.07 × 10−9 * 3 0.0082 0.0027 34.506 1.13 × 10⁻⁷ *
Residuals 18 0.0087 0.0004 18 0.0014 0.0001
d.f. = degrees of freedom, SS = sum of squares, MS = mean of squares, * significant at 95% confidence level.
Another ANOVA was performed to determine the effect of each type of treatment and solvents:conventional heating did not significantly favored FA extraction (p = 0.286) compared to the control.Microwave treatment had a significant negative effect on FA release with t value = −2.479. This could beexplained by a negative effect of waves on biomass structure and p-hydroxycinnamic acids organization.Acid solvent as well was significantly disadvantageous for the extraction of FA (t value = −4.394)compared to water alone. When water was used as solvent during microwave treatment, Diaz et al. [29]
107
Molecules 2019, 24, 3885
demonstrated that neither lignin nor cellulose were modified, and that only a small amount ofhemicellulose content was reduce; this may explain the negative effects on p-hydroxycinnamic acidrelease in our case with water. A similar or lower yield is naturally expected with acid as solvent.
From Table 2, for both FA and CA, the alkaline solvent allows an increase in acids release comparedto other solvents for the same treatment, because a break-up of ester bonds linking p-hydroxycinnamicacids to the cell wall is favored with alkali [26].
Concerning p-hydroxycinnamic acids release, microwave pretreatment efficiency is variableaccording to the literature: recovered molecules yields vary a lot depending on the solvent and rawmatter. In this way, Carniel et al. [18] demonstrated that to release a maximum amount of total phenoliccompounds (TPC), the most important parameter is the solvent and using ethanol 50% in volumeallowed to obtain 3.74 mg TPC/g DM after extraction from Physalis angulate seeds. Concerning maize,this substrate is often cited in the literature, but usually the microwave is used to degrade the cell walland gain access to polysaccharides, and only the evolution of parietal polymers composition is analyzed.Wheat bran was treated by microwave (500 W, 20 min 100 C) with methanol by Oufnac et al. [21],but even if the incident power and final temperature were the same as in this study, the results aredifficult to compare: treatment duration was more than four times longer, and efficiency is measuredby catechin equivalent release (467 µg catechin equivalent/g wheat bran). Catechin is part of theflavonoids molecules family and is responsible for the color of the plant. Since this molecule is notlinked to cell walls and is hydrolysable, it reacts to microwaves differently than p-hydroxycinnamicacids that are covalently linked to cell walls.
In order to better understand microwave effects on p-hydroxycinnamic acids release, it wasdecided to focus on water, which is considered as a suitable extraction solvent: Moreira et al. [28]found it to be the second best solvent to extract polyphenols behind NaOH at 150 C for 25 min.Moodley and Kana [30] demonstrated that NaOH concentration has more impact than microwaveduration on sugars release. Thus, by working with water, NaOH effects are constrained, which allowsbetter understanding the thermal and non-thermal microwave effects. Finally, using water as solventis environmentally friendly and appropriate from an industrial application point of view: water islow cost compared to other solvents, and wastewater management is much easier without chemicalreagent addition.
Therefore, the optimization of microwave treatment on corn stalks with water as solvent wasperformed using a response surface methodology (RSM). The best conditions were then appliedto miscanthus.
2.3. Response Surface Methodology (RSM) Analysis to Determine Better Microwave Parameters
RSM analysis was used to determine the optimal operating conditions in terms of FA and CArelease from corn stalks. Moreover, the lignocellulosic biomass structure was also analyzed throughthe Van Soest and Klason lignin methods.
2.3.1. Experimental Design
Using the conditions described in 3.9, values for the center points were highly repeatable witha standard deviation of 0.3% and 0.2% for CA and FA, respectively. This provided an idea of theexperimental error over the entire design of the experiments. Each p-hydroxycinnamic acid analysiswas performed in duplicate, and the results are shown in Figure 3 and Table 4. The polynomialequations for FA (Equation (1)) and CA (Equation (2)) are the following:
YFA = 9, 26− 1.17X1 − 0.36X2 + 1.17X1X2 + 0.03X21 + 1.89X2
2 R2 = 0.749; F− value = 58.521 (1)
YCA = 70.50 + 12.37X1 + 11.52X2 − 2.20X1X2 − 5.81X21 + 16.09X2
2 R2 = 0.995; F− value = 0.003 (2)
108
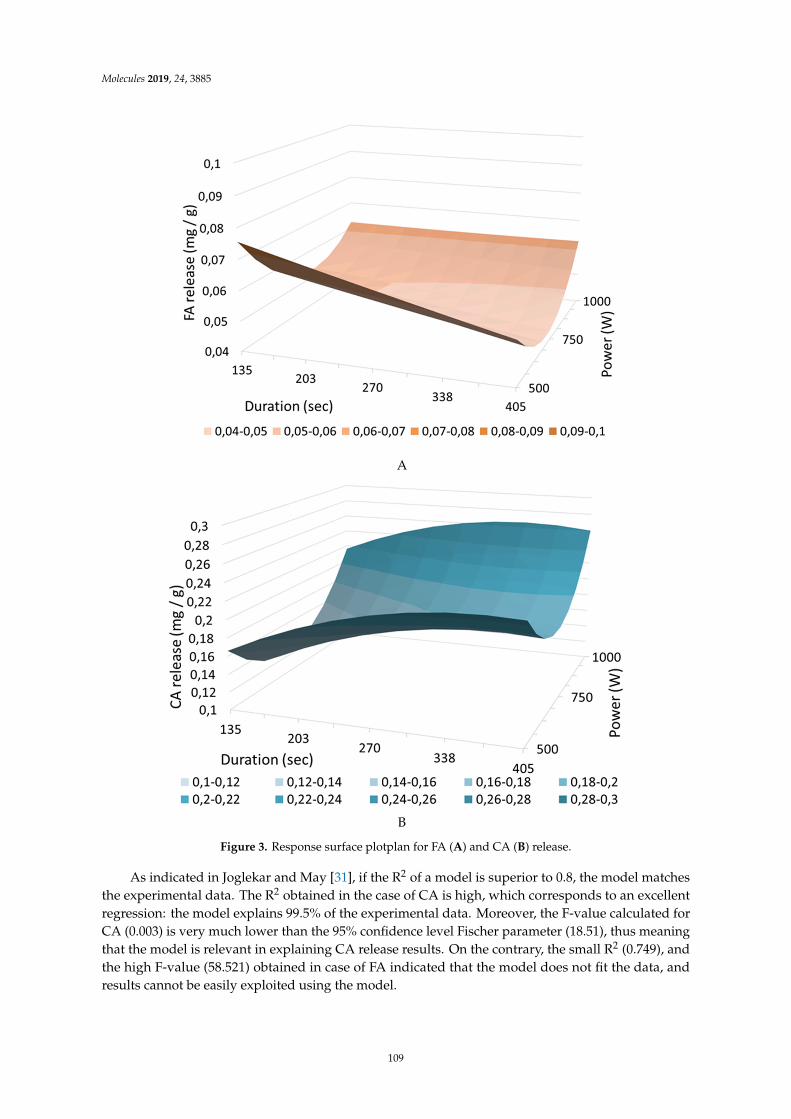
Molecules 2019, 24, 3885Molecules 2019, 24, 3885 9 of 22
A
B
Figure 3. Response surface plotplan for FA (A) and CA (B) release.
As indicated in Joglekar and May [31], if the R² of a model is superior to 0.8, the model matches the experimental data. The R² obtained in the case of CA is high, which corresponds to an excellent regression: the model explains 99.5% of the experimental data. Moreover, the F-value calculated for CA (0.003) is very much lower than the 95% confidence level Fischer parameter (18.51), thus meaning that the model is relevant in explaining CA release results. On the contrary, the small R² (0.749), and the high F-value (58.521) obtained in case of FA indicated that the model does not fit the data, and results cannot be easily exploited using the model.
Using Pareto charts, the effects of each individual term of the polynomial equations are presented on Figure 4 for FA release (Figure 4A) and CA release (Figure 4B). A term is considered to
Figure 3. Response surface plotplan for FA (A) and CA (B) release.
As indicated in Joglekar and May [31], if the R2 of a model is superior to 0.8, the model matchesthe experimental data. The R2 obtained in the case of CA is high, which corresponds to an excellentregression: the model explains 99.5% of the experimental data. Moreover, the F-value calculated forCA (0.003) is very much lower than the 95% confidence level Fischer parameter (18.51), thus meaningthat the model is relevant in explaining CA release results. On the contrary, the small R2 (0.749), andthe high F-value (58.521) obtained in case of FA indicated that the model does not fit the data, andresults cannot be easily exploited using the model.
109
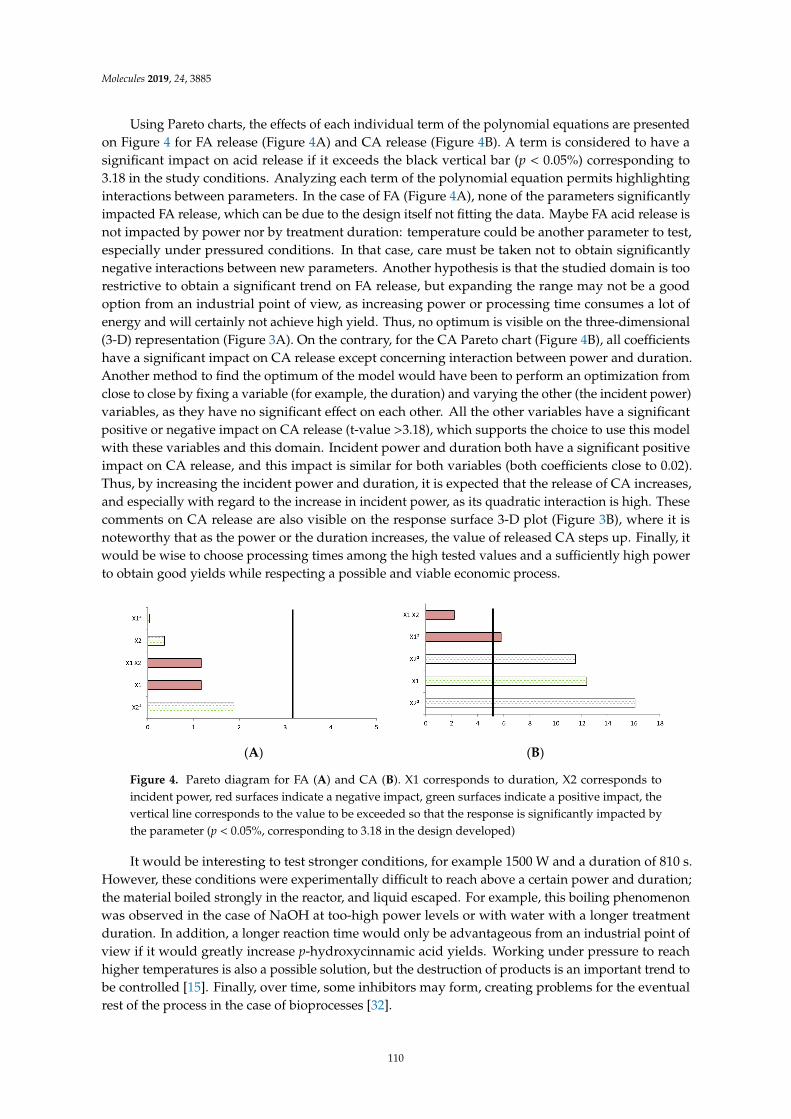
Molecules 2019, 24, 3885
Using Pareto charts, the effects of each individual term of the polynomial equations are presentedon Figure 4 for FA release (Figure 4A) and CA release (Figure 4B). A term is considered to have asignificant impact on acid release if it exceeds the black vertical bar (p < 0.05%) corresponding to3.18 in the study conditions. Analyzing each term of the polynomial equation permits highlightinginteractions between parameters. In the case of FA (Figure 4A), none of the parameters significantlyimpacted FA release, which can be due to the design itself not fitting the data. Maybe FA acid release isnot impacted by power nor by treatment duration: temperature could be another parameter to test,especially under pressured conditions. In that case, care must be taken not to obtain significantlynegative interactions between new parameters. Another hypothesis is that the studied domain is toorestrictive to obtain a significant trend on FA release, but expanding the range may not be a goodoption from an industrial point of view, as increasing power or processing time consumes a lot ofenergy and will certainly not achieve high yield. Thus, no optimum is visible on the three-dimensional(3-D) representation (Figure 3A). On the contrary, for the CA Pareto chart (Figure 4B), all coefficientshave a significant impact on CA release except concerning interaction between power and duration.Another method to find the optimum of the model would have been to perform an optimization fromclose to close by fixing a variable (for example, the duration) and varying the other (the incident power)variables, as they have no significant effect on each other. All the other variables have a significantpositive or negative impact on CA release (t-value >3.18), which supports the choice to use this modelwith these variables and this domain. Incident power and duration both have a significant positiveimpact on CA release, and this impact is similar for both variables (both coefficients close to 0.02).Thus, by increasing the incident power and duration, it is expected that the release of CA increases,and especially with regard to the increase in incident power, as its quadratic interaction is high. Thesecomments on CA release are also visible on the response surface 3-D plot (Figure 3B), where it isnoteworthy that as the power or the duration increases, the value of released CA steps up. Finally, itwould be wise to choose processing times among the high tested values and a sufficiently high powerto obtain good yields while respecting a possible and viable economic process.
Molecules 2019, 24, 3885 3 of 22
have a significant impact on acid release if it exceeds the black vertical bar (p < 0.05%) corresponding to 3.18 in the study conditions. Analyzing each term of the polynomial equation permits highlighting interactions between parameters. In the case of FA (Figure 4A), none of the parameters significantly impacted FA release, which can be due to the design itself not fitting the data. Maybe FA acid release is not impacted by power nor by treatment duration: temperature could be another parameter to test, especially under pressured conditions. In that case, care must be taken not to obtain significantly negative interactions between new parameters. Another hypothesis is that the studied domain is too restrictive to obtain a significant trend on FA release, but expanding the range may not be a good option from an industrial point of view, as increasing power or processing time consumes a lot of energy and will certainly not achieve high yield. Thus, no optimum is visible on the three-dimensional (3-D) representation (Figure 3A). On the contrary, for the CA Pareto chart (Figure 4B), all coefficients have a significant impact on CA release except concerning interaction between power and duration. Another method to find the optimum of the model would have been to perform an optimization from close to close by fixing a variable (for example, the duration) and varying the other (the incident power) variables, as they have no significant effect on each other. All the other variables have a significant positive or negative impact on CA release (t-value >3.18), which supports the choice to use this model with these variables and this domain. Incident power and duration both have a significant positive impact on CA release, and this impact is similar for both variables (both coefficients close to 0.02). Thus, by increasing the incident power and duration, it is expected that the release of CA increases, and especially with regard to the increase in incident power, as its quadratic interaction is high. These comments on CA release are also visible on the response surface 3-D plot (Figure 3B), where it is noteworthy that as the power or the duration increases, the value of released CA steps up. Finally, it would be wise to choose processing times among the high tested values and a sufficiently high power to obtain good yields while respecting a possible and viable economic process.
(A) (B)
Figure 4. Pareto diagram for FA (A) and CA (B). X1 corresponds to duration, X2 corresponds to incident power, red surfaces indicate a negative impact, green surfaces indicate a positive impact, the vertical line corresponds to the value to be exceeded so that the response is significantly impacted by the parameter (p < 0.05%, corresponding to 3.18 in the design developed)
It would be interesting to test stronger conditions, for example 1500 W and a duration of 810 s. However, these conditions were experimentally difficult to reach above a certain power and duration; the material boiled strongly in the reactor, and liquid escaped. For example, this boiling phenomenon was observed in the case of NaOH at too-high power levels or with water with a longer treatment duration. In addition, a longer reaction time would only be advantageous from an industrial point of view if it would greatly increase p-hydroxycinnamic acid yields. Working under pressure to reach higher temperatures is also a possible solution, but the destruction of products is an important trend to be controlled [15]. Finally, over time, some inhibitors may form, creating problems for the eventual rest of the process in the case of bioprocesses [32].
Figure 4. Pareto diagram for FA (A) and CA (B). X1 corresponds to duration, X2 corresponds toincident power, red surfaces indicate a negative impact, green surfaces indicate a positive impact, thevertical line corresponds to the value to be exceeded so that the response is significantly impacted bythe parameter (p < 0.05%, corresponding to 3.18 in the design developed)
It would be interesting to test stronger conditions, for example 1500 W and a duration of 810 s.However, these conditions were experimentally difficult to reach above a certain power and duration;the material boiled strongly in the reactor, and liquid escaped. For example, this boiling phenomenonwas observed in the case of NaOH at too-high power levels or with water with a longer treatmentduration. In addition, a longer reaction time would only be advantageous from an industrial point ofview if it would greatly increase p-hydroxycinnamic acid yields. Working under pressure to reachhigher temperatures is also a possible solution, but the destruction of products is an important trend tobe controlled [15]. Finally, over time, some inhibitors may form, creating problems for the eventualrest of the process in the case of bioprocesses [32].
110
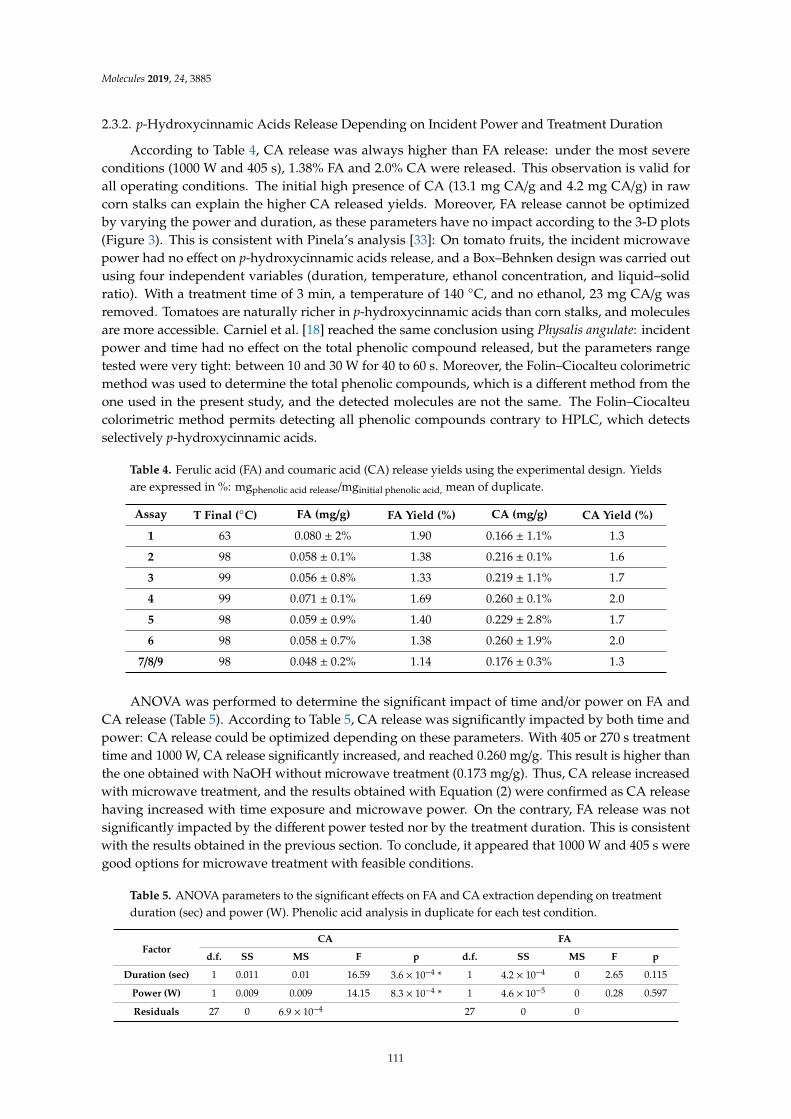
Molecules 2019, 24, 3885
2.3.2. p-Hydroxycinnamic Acids Release Depending on Incident Power and Treatment Duration
According to Table 4, CA release was always higher than FA release: under the most severeconditions (1000 W and 405 s), 1.38% FA and 2.0% CA were released. This observation is valid forall operating conditions. The initial high presence of CA (13.1 mg CA/g and 4.2 mg CA/g) in rawcorn stalks can explain the higher CA released yields. Moreover, FA release cannot be optimizedby varying the power and duration, as these parameters have no impact according to the 3-D plots(Figure 3). This is consistent with Pinela’s analysis [33]: On tomato fruits, the incident microwavepower had no effect on p-hydroxycinnamic acids release, and a Box–Behnken design was carried outusing four independent variables (duration, temperature, ethanol concentration, and liquid–solidratio). With a treatment time of 3 min, a temperature of 140 C, and no ethanol, 23 mg CA/g wasremoved. Tomatoes are naturally richer in p-hydroxycinnamic acids than corn stalks, and moleculesare more accessible. Carniel et al. [18] reached the same conclusion using Physalis angulate: incidentpower and time had no effect on the total phenolic compound released, but the parameters rangetested were very tight: between 10 and 30 W for 40 to 60 s. Moreover, the Folin–Ciocalteu colorimetricmethod was used to determine the total phenolic compounds, which is a different method from theone used in the present study, and the detected molecules are not the same. The Folin–Ciocalteucolorimetric method permits detecting all phenolic compounds contrary to HPLC, which detectsselectively p-hydroxycinnamic acids.
Table 4. Ferulic acid (FA) and coumaric acid (CA) release yields using the experimental design. Yieldsare expressed in %: mgphenolic acid release/mginitial phenolic acid, mean of duplicate.
Assay T Final (C) FA (mg/g) FA Yield (%) CA (mg/g) CA Yield (%)
1 63 0.080 ± 2% 1.90 0.166 ± 1.1% 1.3
2 98 0.058 ± 0.1% 1.38 0.216 ± 0.1% 1.6
3 99 0.056 ± 0.8% 1.33 0.219 ± 1.1% 1.7
4 99 0.071 ± 0.1% 1.69 0.260 ± 0.1% 2.0
5 98 0.059 ± 0.9% 1.40 0.229 ± 2.8% 1.7
6 98 0.058 ± 0.7% 1.38 0.260 ± 1.9% 2.0
7/8/9 98 0.048 ± 0.2% 1.14 0.176 ± 0.3% 1.3
ANOVA was performed to determine the significant impact of time and/or power on FA andCA release (Table 5). According to Table 5, CA release was significantly impacted by both time andpower: CA release could be optimized depending on these parameters. With 405 or 270 s treatmenttime and 1000 W, CA release significantly increased, and reached 0.260 mg/g. This result is higher thanthe one obtained with NaOH without microwave treatment (0.173 mg/g). Thus, CA release increasedwith microwave treatment, and the results obtained with Equation (2) were confirmed as CA releasehaving increased with time exposure and microwave power. On the contrary, FA release was notsignificantly impacted by the different power tested nor by the treatment duration. This is consistentwith the results obtained in the previous section. To conclude, it appeared that 1000 W and 405 s weregood options for microwave treatment with feasible conditions.
Table 5. ANOVA parameters to the significant effects on FA and CA extraction depending on treatmentduration (sec) and power (W). Phenolic acid analysis in duplicate for each test condition.
FactorCA FA
d.f. SS MS F p d.f. SS MS F p
Duration (sec) 1 0.011 0.01 16.59 3.6 × 10−4 * 1 4.2 × 10⁻⁴ 0 2.65 0.115
Power (W) 1 0.009 0.009 14.15 8.3 × 10−4 * 1 4.6 × 10⁻⁵ 0 0.28 0.597
Residuals 27 0 6.9 × 10⁻⁴ 27 0 0
111
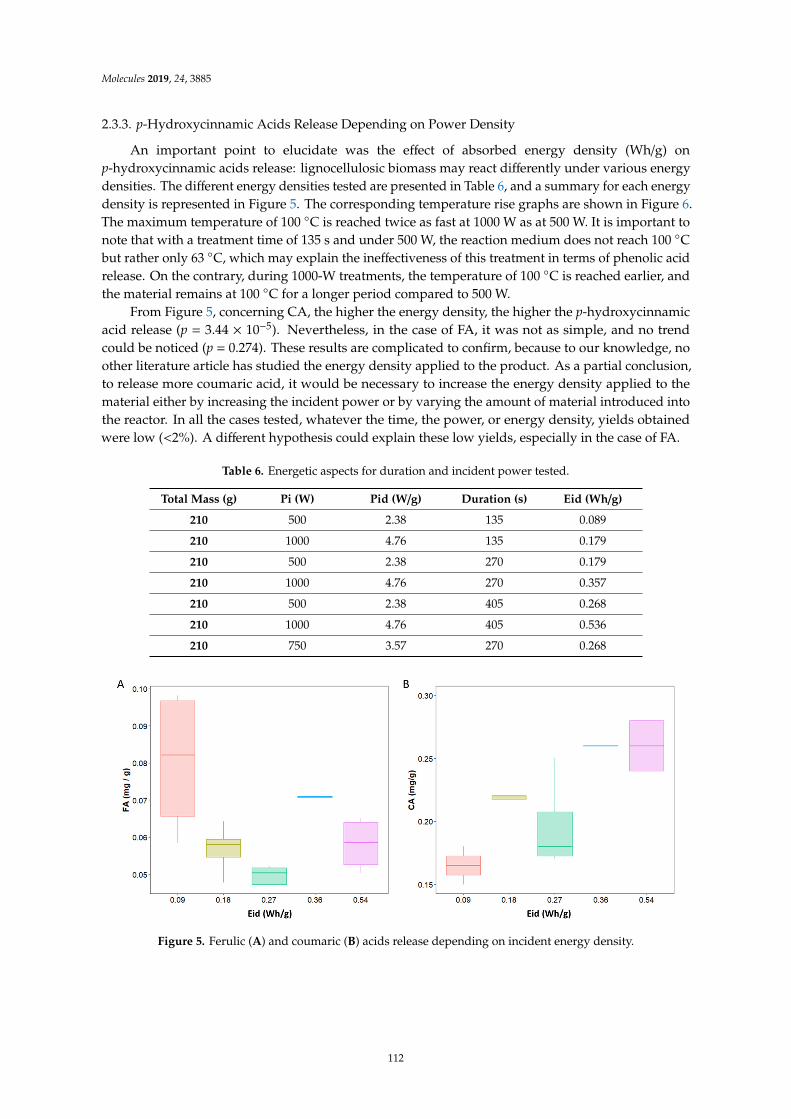
Molecules 2019, 24, 3885
2.3.3. p-Hydroxycinnamic Acids Release Depending on Power Density
An important point to elucidate was the effect of absorbed energy density (Wh/g) onp-hydroxycinnamic acids release: lignocellulosic biomass may react differently under various energydensities. The different energy densities tested are presented in Table 6, and a summary for each energydensity is represented in Figure 5. The corresponding temperature rise graphs are shown in Figure 6.The maximum temperature of 100 C is reached twice as fast at 1000 W as at 500 W. It is important tonote that with a treatment time of 135 s and under 500 W, the reaction medium does not reach 100 Cbut rather only 63 C, which may explain the ineffectiveness of this treatment in terms of phenolic acidrelease. On the contrary, during 1000-W treatments, the temperature of 100 C is reached earlier, andthe material remains at 100 C for a longer period compared to 500 W.
From Figure 5, concerning CA, the higher the energy density, the higher the p-hydroxycinnamicacid release (p = 3.44 × 10⁻⁵). Nevertheless, in the case of FA, it was not as simple, and no trendcould be noticed (p = 0.274). These results are complicated to confirm, because to our knowledge, noother literature article has studied the energy density applied to the product. As a partial conclusion,to release more coumaric acid, it would be necessary to increase the energy density applied to thematerial either by increasing the incident power or by varying the amount of material introduced intothe reactor. In all the cases tested, whatever the time, the power, or energy density, yields obtainedwere low (<2%). A different hypothesis could explain these low yields, especially in the case of FA.
Table 6. Energetic aspects for duration and incident power tested.
Total Mass (g) Pi (W) Pid (W/g) Duration (s) Eid (Wh/g)
210 500 2.38 135 0.089
210 1000 4.76 135 0.179
210 500 2.38 270 0.179
210 1000 4.76 270 0.357
210 500 2.38 405 0.268
210 1000 4.76 405 0.536
210 750 3.57 270 0.268
Molecules 2019, 24, 3885 5 of 22
2.3.3. p-Hydroxycinnamic Acids Release Depending on Power Density
An important point to elucidate was the effect of absorbed energy density (Wh/g) on p-hydroxycinnamic acids release: lignocellulosic biomass may react differently under various energy densities. The different energy densities tested are presented in Table 6, and a summary for each energy density is represented in Figure 5. The corresponding temperature rise graphs are shown in Figure 6. The maximum temperature of 100 °C is reached twice as fast at 1000 W as at 500 W. It is important to note that with a treatment time of 135 s and under 500 W, the reaction medium does not reach 100 °C but rather only 63 °C, which may explain the ineffectiveness of this treatment in terms of phenolic acid release. On the contrary, during 1000-W treatments, the temperature of 100 °C is reached earlier, and the material remains at 100 °C for a longer period compared to 500 W.
Table 6. Energetic aspects for duration and incident power tested.
Total Mass (g) Pi (W) Pid (W/g) Duration (s) Eid (Wh/g) 210 500 2.38 135 0.089 210 1000 4.76 135 0.179 210 500 2.38 270 0.179 210 1000 4.76 270 0.357 210 500 2.38 405 0.268 210 1000 4.76 405 0.536 210 750 3.57 270 0.268
Figure 5. Ferulic (A) and coumaric (B) acids release depending on incident energy density. Figure 5. Ferulic (A) and coumaric (B) acids release depending on incident energy density.
112
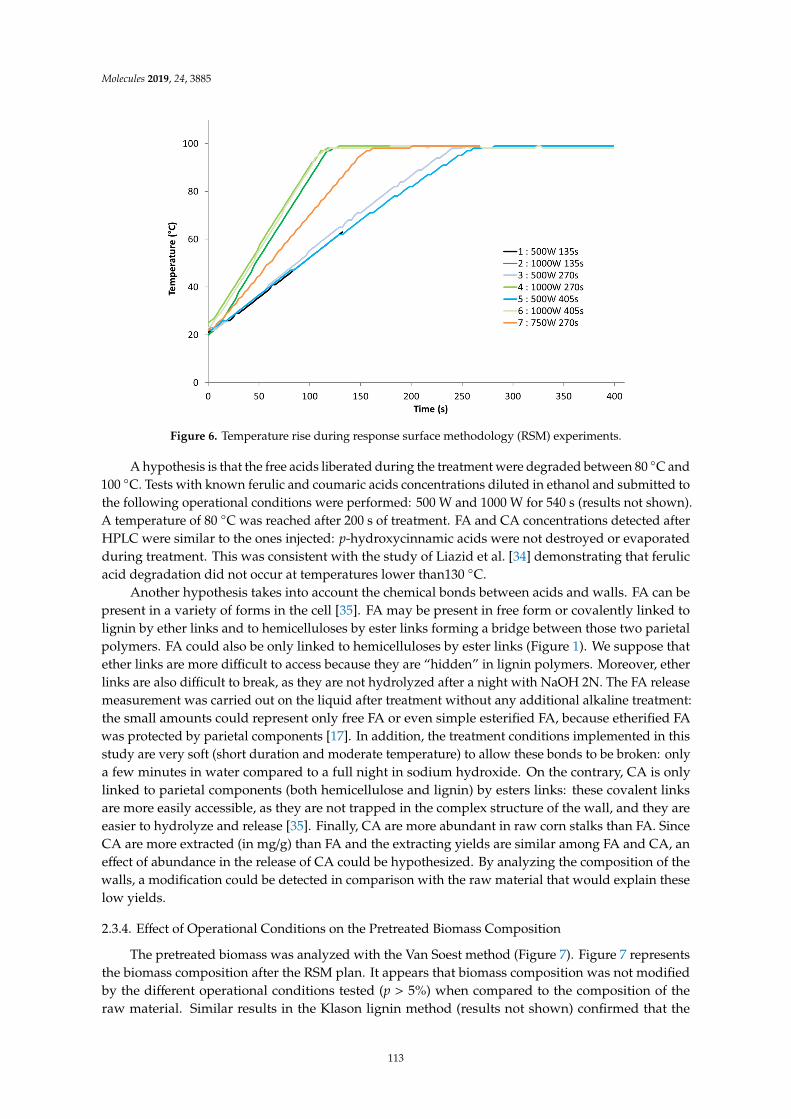
Molecules 2019, 24, 3885Molecules 2019, 24, 3885 6 of 22
Figure 6. Temperature rise during response surface methodology (RSM) experiments.
From Figure 5, concerning CA, the higher the energy density, the higher the p-hydroxycinnamic acid release (p = 3.44 × 10⁻⁵). Nevertheless, in the case of FA, it was not as simple, and no trend could be noticed (p = 0.274). These results are complicated to confirm, because to our knowledge, no other literature article has studied the energy density applied to the product. As a partial conclusion, to release more coumaric acid, it would be necessary to increase the energy density applied to the material either by increasing the incident power or by varying the amount of material introduced into the reactor. In all the cases tested, whatever the time, the power, or energy density, yields obtained were low (<2%). A different hypothesis could explain these low yields, especially in the case of FA.
A hypothesis is that the free acids liberated during the treatment were degraded between 80 °C and 100 °C. Tests with known ferulic and coumaric acids concentrations diluted in ethanol and submitted to the following operational conditions were performed: 500 W and 1000 W for 540 s (results not shown). A temperature of 80 °C was reached after 200 s of treatment. FA and CA concentrations detected after HPLC were similar to the ones injected: p-hydroxycinnamic acids were not destroyed or evaporated during treatment. This was consistent with the study of Liazid et al. [34] demonstrating that ferulic acid degradation did not occur at temperatures lower than130 °C.
Another hypothesis takes into account the chemical bonds between acids and walls. FA can be present in a variety of forms in the cell [35]. FA may be present in free form or covalently linked to lignin by ether links and to hemicelluloses by ester links forming a bridge between those two parietal polymers. FA could also be only linked to hemicelluloses by ester links (Figure 1). We suppose that ether links are more difficult to access because they are “hidden” in lignin polymers. Moreover, ether links are also difficult to break, as they are not hydrolyzed after a night with NaOH 2N. The FA release measurement was carried out on the liquid after treatment without any additional alkaline treatment: the small amounts could represent only free FA or even simple esterified FA, because etherified FA was protected by parietal components [17]. In addition, the treatment conditions implemented in this study are very soft (short duration and moderate temperature) to allow these bonds to be broken: only a few minutes in water compared to a full night in sodium hydroxide. On the contrary, CA is only linked to parietal components (both hemicellulose and lignin) by esters links: these covalent links are more easily accessible, as they are not trapped in the complex structure of the wall, and they are easier to hydrolyze and release [35]. Finally, CA are more abundant in raw corn stalks than FA. Since CA are more extracted (in mg/g) than FA and the extracting yields are similar
Figure 6. Temperature rise during response surface methodology (RSM) experiments.
A hypothesis is that the free acids liberated during the treatment were degraded between 80 C and100 C. Tests with known ferulic and coumaric acids concentrations diluted in ethanol and submitted tothe following operational conditions were performed: 500 W and 1000 W for 540 s (results not shown).A temperature of 80 C was reached after 200 s of treatment. FA and CA concentrations detected afterHPLC were similar to the ones injected: p-hydroxycinnamic acids were not destroyed or evaporatedduring treatment. This was consistent with the study of Liazid et al. [34] demonstrating that ferulicacid degradation did not occur at temperatures lower than130 C.
Another hypothesis takes into account the chemical bonds between acids and walls. FA can bepresent in a variety of forms in the cell [35]. FA may be present in free form or covalently linked tolignin by ether links and to hemicelluloses by ester links forming a bridge between those two parietalpolymers. FA could also be only linked to hemicelluloses by ester links (Figure 1). We suppose thatether links are more difficult to access because they are “hidden” in lignin polymers. Moreover, etherlinks are also difficult to break, as they are not hydrolyzed after a night with NaOH 2N. The FA releasemeasurement was carried out on the liquid after treatment without any additional alkaline treatment:the small amounts could represent only free FA or even simple esterified FA, because etherified FAwas protected by parietal components [17]. In addition, the treatment conditions implemented in thisstudy are very soft (short duration and moderate temperature) to allow these bonds to be broken: onlya few minutes in water compared to a full night in sodium hydroxide. On the contrary, CA is onlylinked to parietal components (both hemicellulose and lignin) by esters links: these covalent linksare more easily accessible, as they are not trapped in the complex structure of the wall, and they areeasier to hydrolyze and release [35]. Finally, CA are more abundant in raw corn stalks than FA. SinceCA are more extracted (in mg/g) than FA and the extracting yields are similar among FA and CA, aneffect of abundance in the release of CA could be hypothesized. By analyzing the composition of thewalls, a modification could be detected in comparison with the raw material that would explain theselow yields.
2.3.4. Effect of Operational Conditions on the Pretreated Biomass Composition
The pretreated biomass was analyzed with the Van Soest method (Figure 7). Figure 7 representsthe biomass composition after the RSM plan. It appears that biomass composition was not modifiedby the different operational conditions tested (p > 5%) when compared to the composition of theraw material. Similar results in the Klason lignin method (results not shown) confirmed that the
113
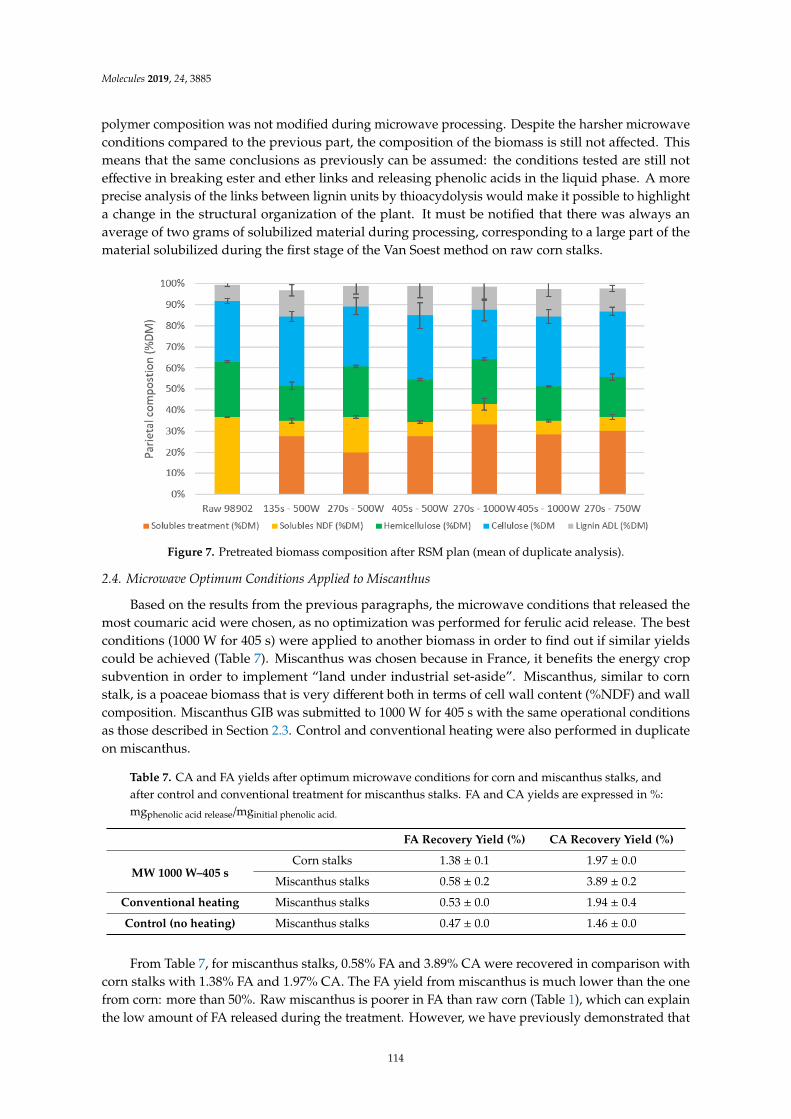
Molecules 2019, 24, 3885
polymer composition was not modified during microwave processing. Despite the harsher microwaveconditions compared to the previous part, the composition of the biomass is still not affected. Thismeans that the same conclusions as previously can be assumed: the conditions tested are still noteffective in breaking ester and ether links and releasing phenolic acids in the liquid phase. A moreprecise analysis of the links between lignin units by thioacydolysis would make it possible to highlighta change in the structural organization of the plant. It must be notified that there was always anaverage of two grams of solubilized material during processing, corresponding to a large part of thematerial solubilized during the first stage of the Van Soest method on raw corn stalks.
Molecules 2019, 24, 3885 7 of 22
among FA and CA, an effect of abundance in the release of CA could be hypothesized. By analyzing the composition of the walls, a modification could be detected in comparison with the raw material that would explain these low yields.
2.3.4. Effect of Operational Conditions on the Pretreated Biomass Composition
The pretreated biomass was analyzed with the Van Soest method (Figure 7). Figure 7 represents the biomass composition after the RSM plan. It appears that biomass composition was not modified by the different operational conditions tested (p > 5%) when compared to the composition of the raw material. Similar results in the Klason lignin method (results not shown) confirmed that the polymer composition was not modified during microwave processing. Despite the harsher microwave conditions compared to the previous part, the composition of the biomass is still not affected. This means that the same conclusions as previously can be assumed: the conditions tested are still not effective in breaking ester and ether links and releasing phenolic acids in the liquid phase. A more precise analysis of the links between lignin units by thioacydolysis would make it possible to highlight a change in the structural organization of the plant. It must be notified that there was always an average of two grams of solubilized material during processing, corresponding to a large part of the material solubilized during the first stage of the Van Soest method on raw corn stalks.
Figure 7. Pretreated biomass composition after RSM plan (mean of duplicate analysis).
2.4. Microwave Optimum Conditions Applied to Miscanthus
Based on the results from the previous paragraphs, the microwave conditions that released the most coumaric acid were chosen, as no optimization was performed for ferulic acid release. The best conditions (1000 W for 405 s) were applied to another biomass in order to find out if similar yields could be achieved (Table 7). Miscanthus was chosen because in France, it benefits the energy crop subvention in order to implement “land under industrial set-aside”. Miscanthus, similar to corn stalk, is a poaceae biomass that is very different both in terms of cell wall content (%NDF) and wall composition. Miscanthus GIB was submitted to 1000 W for 405 s with the same operational conditions as those described in Section 2.3. Control and conventional heating were also performed in duplicate on miscanthus.
Figure 7. Pretreated biomass composition after RSM plan (mean of duplicate analysis).
2.4. Microwave Optimum Conditions Applied to Miscanthus
Based on the results from the previous paragraphs, the microwave conditions that released themost coumaric acid were chosen, as no optimization was performed for ferulic acid release. The bestconditions (1000 W for 405 s) were applied to another biomass in order to find out if similar yieldscould be achieved (Table 7). Miscanthus was chosen because in France, it benefits the energy cropsubvention in order to implement “land under industrial set-aside”. Miscanthus, similar to cornstalk, is a poaceae biomass that is very different both in terms of cell wall content (%NDF) and wallcomposition. Miscanthus GIB was submitted to 1000 W for 405 s with the same operational conditionsas those described in Section 2.3. Control and conventional heating were also performed in duplicateon miscanthus.
Table 7. CA and FA yields after optimum microwave conditions for corn and miscanthus stalks, andafter control and conventional treatment for miscanthus stalks. FA and CA yields are expressed in %:mgphenolic acid release/mginitial phenolic acid.
FA Recovery Yield (%) CA Recovery Yield (%)
MW 1000 W–405 sCorn stalks 1.38 ± 0.1 1.97 ± 0.0
Miscanthus stalks 0.58 ± 0.2 3.89 ± 0.2
Conventional heating Miscanthus stalks 0.53 ± 0.0 1.94 ± 0.4
Control (no heating) Miscanthus stalks 0.47 ± 0.0 1.46 ± 0.0
From Table 7, for miscanthus stalks, 0.58% FA and 3.89% CA were recovered in comparison withcorn stalks with 1.38% FA and 1.97% CA. The FA yield from miscanthus is much lower than the onefrom corn: more than 50%. Raw miscanthus is poorer in FA than raw corn (Table 1), which can explainthe low amount of FA released during the treatment. However, we have previously demonstrated that
114
Molecules 2019, 24, 3885
microwave treatment, under the tested conditions, has only a limited impact on ferulic acid release,which limits the interpretation of this result.
On the contrary, CA yield in miscanthus is twice as high as in corn, in spite of the very low initialcontent of CA in raw matter (0.65 mg CA/g miscanthus). As explained earlier, these differences maybe explained by the chemical bonds impacted, and miscanthus CA must certainly be present in freeform in cells. Moreover, by comparing miscanthus microwave extraction yields with miscanthusconventional or control extraction yields, it appeared that the microwave treatment promoted the CAextraction, but the FA release remained unchanged, which was in agreement with the previous parts:CA being significantly released following the microwave treatment compared to FA.
In the tested conditions, only 0.8 g out of the 10 g of miscanthus were solubilized during thetreatment, contrary to corn (2 g), which can be explained by the high initial NDF percentage inmiscanthus stalks compared to NDF in corn stalks (95% DM and 65% DM, respectively). The finalmiscanthus composition was the following, according to the Van Soest method: 4.3% (±0.1%) solublecontent, 18% (±3%) hemicellulose, 53% (±3%) cellulose, and 15.9% (±0.8%) ADL, which was notsignificantly different from the initial composition. These results differed from Boonmanumsin et al. [36],who experimented with microwaves combined with NH4OH (1% w/v) on miscanthus for 15 minand 300 W. p-hydroxycinnamic acids were not analyzed; instead, they examined monomeric sugars.In optimum conditions, up to 25.6 g sugars/100g biomass were released (principally under xylose form).The extracting solvent, the final temperature, and the duration were the main differences between thetwo experiments. It is always difficult to compare results from different microwave studies as variousparameters may differ at the same time (duration, solvent, temperature, pressure, ratio, substrates) andmay affect microwave pretreatment efficiency. As a matter of fact, general statements cannot be madefor all plant materials because of their diversity in structure and composition. Processing conditionsmust be defined and optimized taking into account the lignocellulosic matrix and the sought-aftermolecules or applications [33]. Strictly speaking about p-hydroxycinnamic acids release, most ofthe studies are focusing on plant stalks, but rhizome cut in small pieces has also been investigatedin the case of Scirpus holoschoenus [37]. When 20 mL of acetone 56% was added to 1 g rhizomeand put under 600 W for 70 sec, up to 30 mg of gallic acid equivalent/g were extracted. Similarly,Galan et al. [38] extracted 162 mg gallic acid equivalent/g from sea buckthorn leaves after 450 s oftreatment. Finally, 62 µg FA/g was extracted from Soybeen seeds after 75-W treatment for 10 min. Theseresults highlight the importance of the raw material used during the treatments and the variability ofthe results obtained. The results of microwave processing are dependent on the matrix.
3. Materials and Methods
3.1. Raw Biomass
Corn stalks named F 98902 were supplied by INRA IJPB (Versailles-Grignon unit, Versailles Cedex,78026, France) and were harvested in September 2016.
Miscanthus stalks (M. x giganteus Britannique, noted GIB) were supplied by INRA AgroImpact(Estrées Mons esperimental unit, Péronne, 80203, France, 49_53 N, 3_00 E) [39] and were harvested inFebruary 2017.
Air-dried samples were coarsely crushed (Viking crusher model GE 220, STIHL, Stuttgart,Germany) and sent to the laboratory in Narbonne. Then, samples were finely ground to 1 mm using aFritsch Pulverisette 19 grinder and sieved to retain only particles between 200 and 1000 µm. Groundand sieved samples, called “raw substrates” in the following, were kept in closed boxes in ambient airbefore used.
3.2. Chemicals
All chemicals were purchased from Merck. High-purity water (Merck Millipore Quantum TEX)was used for all pretreatments and analyses.
115

Molecules 2019, 24, 3885
3.3. Microwave Pretreatment (MW)
Microwave pretreatments were performed with a Minilabotron 2000 microwave pilot (SAIREM,FRANCE), operating at atmospheric pressure, 2.45 GHz with a maximum power of 2 kW.All pretreatments were carried out at constant incident power level in open vessel.
According to the preliminary results (not shown), a total mass of 210 g was determined to beoptimal for waves absorption based on microwave pilot configuration. Ten grams of prepared rawmaterial with known dry matter content were transferred to a 500-mL glass reactor. Then, 200 g ofliquid was added. The tested liquids (solvents) were: water, acidic water (pH = 4 obtained by adding0.75 mmol H2SO4 to 200 mL water), alkaline water (pH = 8.5 obtained by adding 6.7 mmol NaOHto 200 mL water), or an ethanol/water mixture (50% w/w). This solid:liquid ratio (1:21 w:w) allowedcorrect magnetic stirring during treatments. Indeed, adequate stirring is essential for microwavetreatment [15]. Samples underwent 1 h of pre-soaking at ambient temperature before microwavetreatment. pH was measured at the end of this hour of contact.
Then, the reactor was closed using a glass cover connected to a refrigerant limiting solventevaporation. A fiber-optic temperature sensor was used to monitor the temperature of the reactionmedium: the maximum temperature could not exceed 100 C in the case of aqueous solvents and80 C in the case of ethanol treatment because of the boiling points of these solvents. All treatmentswere performed at constant power and at atmospheric pressure (open vessel), in order to avoid excesstemperature increase and the thermal degradation of molecules (in particular p-hydroxycinnamicacids) [39].
Pretreatments were performed in duplicate (excepted for the center point in the RSM planperformed in triplicate). After treatment, the reactor was air-cooled to room temperature for 15 minbefore weighing and pH measurement. Then, the reaction mixture was filtered through a 200-µmsieve. The solid was washed with 250 mL of deionized water to remove chemicals and by-productsinhibiting enzymatic hydrolysis. The solid fraction was placed at 40 C for seven days to dry. Then,dry matter content was measured to determine the amount of solubilized matter during processingand the solid recovery yield (% of g pretreated biomass/g raw matter). The supernatant was filteredthrough a cellulose filter (2.7 µm) and stored at −20 C until further analysis.
3.4. Energy Calculations
Incident power varied between 500 W, 750 W, and 1000 W for 135 s, 270 s, and 405 s (Table 6).Temperature, incident power, and reflected power were recorded every three seconds during thetreatment. Absorbed power was obtained using Equation (3). The total absorbed power was thesum of all the absorbed power recorded every three seconds; see Equation (4). Absorbed energy wascalculated from Equation (5) by multiplying the total Pa by 3, since it was only recorded every 3 s.
Absorbed Power (Pa) = Incident Power (Pi) - Reflected Power (Pr) in W (3)
Total Pa =∑
Pa in W (4)
Absorbed Energy density (Ead) = (∑
Pa.3)/(3600.Total mass) in Wh/g (5)
3.5. Conventional Heating Treatment (Conv)
A 500-mL Schott bottle containing the same reaction mixture as the microwave-treated samplewas immersed in a heat-stabilized oil bath at 100 C for 360 s, which is the reaction time necessary toreach a temperature close to 100 C. As the bottle was closed, pressure could slightly increase duringtreatment without exceeding 1.3 bars. This pressure, close to atmospheric pressure, was consideredto have no impact during conventional treatment. The separating protocol was the same as thatdescribed before. The conventional test allowed comparing conventional and microwave heatingmodes. The temperature and pH were recorded during processing.
116
Molecules 2019, 24, 3885
3.6. Control treatment (C)
A control treatment (soaked biomass sample without any heating) was also carried out. Liquid andsolid phases were separated after an hour of contact using the method described before. Pretreatmenteffects on biomass were evaluated by p-hydroxycinnamic acids release and biomass structure changes.
3.7. Ferulic and Coumaric Acids Analysis
Initial FA and CA amounts were determined by HPLC (method described below). A mild alkalineextraction for a night using 2 mL of NaOH 2N with 20 mg of raw matter permitted releasing esterifiedp-hydroxycinnamic acids [13,26,27]. These initial amounts (in mg/g) were used to calculate the releaseyields (Equation (6)).
Ferulic acid (FA) and p-coumaric acid (CA) released in the liquid phase after pretreatments werequantified in duplicate. P-hydroxycinnamic compounds were analyzed by HPLC using a HPLC-DADWaters system: autosampler 717, multisolvent delivery system 600, Diode Array Detector 2996. Then,p-hydroxycinnamic acids were detected at 320 nm, and the peak areas were calculated by Empower3software (Waters). The mobile phases consisted of ultrapure water/formic acid–95/5 (Solvent A) andacetonitrile/ultrapure water/formic acid–80/15/5 (Solvent B). The flow rate was 1 mL/min, and theinjection volume was 10 µl. Separation was performed at 30 C on a Waters Atlantis T3 Column,100 Å, 5 µm, 4.6 mm × 250 mm (C18) equipped with a C18–4 × 3 mm Security Guard Cartridge(Phenomenex, France).
Then, the results—which were obtained in mg/l—were transformed to g/g DM using the collectedliquid volume (l) after treatment (Equations (6) and (7)):
Collected liquid = Initial V − evaporation V − swelling V in L (6)
FA released = FA (mg/L) × Collected liquid/10gDM in mg/g (7)
Swelling was previously measured (results not shown) and corresponded to 1 mL/g DM and 0.9mL/g DM for corn stalks and miscanthus stalks, respectively. The evaporation volume was measuredby taking the mass difference between the beginning and the end of the treatment. The evaporatedvolume did not depend on the biomass used, but instead only on the power and duration of thetreatment, as well as on the solvent. On average, for water microwave treatments, the evaporatedvolume can be calculated with Equation (8) with R2 = 0.91:
f(duration × Incident power) = 7449.4 × evaporation V + 83002 (8)
For ethanol microwave treatments, the evaporation volume was twice that obtained in water underthe same conditions. For control and conventional heating, evaporation was considered negligible,as it was less than 10 mL. In any case, these mass changes in the microwave reactor over time were nottaken into account in the calculations of power or energy density.
FA extraction yield was calculated as the quotient of the liberated FA/CA mass released by thetotal FA/CA mass in the raw substrates (equation (9) for FA).
FA yield = FA released (mg/g)/FA initial (mg/g) in % (9)
3.8. Biomass Composition Analysis
The impact of the pretreatment on biomass structure was evaluated using the Van Soest method [40]and Klason lignin protocol [41].
The Van Soest protocol allowed evaluating the evolution in parietal polymers content aftertreatment. This method is based on the mass sequential partitioning of cell walls, from most extractibleto less extractible, with successive extractions using different solvents (water, neutral detergent solution,acid detergent solution, and acid 72%). After the first Van Soest step, a part of neutral detergent
117
Molecules 2019, 24, 3885
fiber (considered as parietal residue) was used to measure the Klason lignin content using the NRELprotocol. ADL (acid detergent lignin) lignin (%DM) is the lignin obtained with the Van Soest method,and corresponds to lignin insoluble in 72% H2SO4 after a first extraction step in an acid detergentsolution (ADS). Klason lignin is obtained from parietal residue and corresponds to lignin insoluble in72% and in 4% H2SO4; the result is then reported in dry matter percentage. As explained in Hatfieldand Fukushima [42], ADS can solubilize cellulose and the most accessible part of lignin (about 50%),explaining why Klason lignin is much higher than ADL, reaching twice its value. Moreover, someproteins could condense and increase the Klason lignin mass, even if this explanation is improbable inthe case of grass. Finally, it was determined on a maize cell wall that Klason lignin and ADL representtwo different lignin measurements: therefore, it is essential to always compare values from the sameanalysis [43]. The lignin part solubilized in ADS fraction was found to be correlated with β-O-4 ligninbonds. Thus, according to Zhang et al. [43], comparing Klason lignin and ADL lignin values couldreveal a variation in chemical bonds within lignin.
3.9. Statistical Analysis and Response Surface Methodology Method
All the statistical tests were performed using R software (version 3.4.0). Microwave effects onbiomass composition and on p-hydroxycinnamic acids release were analyzed with ANOVA andconsidered significant when p-value < 0.05 with residuals distributed according to a normal law.Biomass composition with Van Soest or Klason lignin were repeated twice for each sample obtainedfrom a pretreatment. In addition, p-hydroxycinnamic analysis was performed in duplicate from theliquid phase of each pretreatment.
RSM allows obtaining robust results with as few experiments as possible to understand theeffects of each variable on the response and find optimal conditions [44]. The plan chosen was a fullfactorial plan, combining mathematical and statistical techniques to model a problem and optimizethe response [45]. The experimental domain was determined based on the literature, the results fromexperimental assays, and taking into account the experimental limits of the Minilabotron microwavepilot. Since we chose to work in an open vessel and thus without pressure, temperature was not chosenas a parameter. The two chosen parameters (z = 2) were the reaction time (X1 in seconds) and theincident power (X2 in Watt). The number of experiments (N) was determined with Equation (10):
N = z2 + z + C = 22 + 2 + 3 = 9 (10)
where C represents the number of center points, which was repeated three times. The experimentalplan is summarized in Table 8.
Table 8. Pretreatment conditions for the experimental design and results (mean of two measures fromassays 1 to 6).
AssayParameter X1: Duration (sec) Parameter X2: Power (W)
Code Value Code Value
1 −1 135 −1 500
2 −1 135 1 1000
3 0 270 −1 500
4 0 270 1 1000
5 1 405 −1 500
6 1 405 1 1000
7/8/9 0 270 0 750
118
Molecules 2019, 24, 3885
Experimental data can be adjusted to a second-order model, following Equation (11):
Yi = b0 + b1 X1 + b2 X2 + b12 X1 X2 + b11 X12 + b22 X2
2 (11)
where Yi is the experimental response that corresponds to FA and CA release in the liquid phase (mg/g),Xi represents the studied parameters, b0 is the average response, bi represents the linear coefficients,b12 is the average effect of interaction factor, and bij represents the quadratic coefficients. The modelwas validated or not using a Fisher test for each studied response (FA and CA). For the calculation ofthe different coefficients, refer to Witek-Krowiak et al. [46]. The solution of the response equations wasperformed using a Microsoft Excel spreadsheet.
4. Conclusions
The present study was designed to determine the effects of microwave irradiation on grassstalks as a pretreatment for biomass deconstruction and p-hydroxycinnamic acids release. Differentmicrowave experimental conditions were set up for various incident powers, durations, and solvents.Experiments have shown that microwave power and duration had a low impact on biomass parietalcomposition and on FA release. CA release yields remained low, but by increasing power and duration,they could progress according to RSM. It would be interesting to implement an experimental designto understand grass biomass behavior under microwaves and to find out their real effect (radiationvs heat).
Author Contributions: Conceptualization, J.-P.D., V.M. and D.G.-B.; methodology, A.B., M.L. and L.G.; formalanalysis, A.B.; investigation, A.B., M.L. and L.G.; writing—original draft preparation, A.B.; writing—review andediting, J.-P.D., D.G.-B., V.M., N.B. and H.C.
Funding: This research received no external funding.
Acknowledgments: The authors would like to thank the NH Verre company (Nicolas Holfeltz) for its collaborationin designing the microwave reactor. The authors also thank Yannick Sire from INRA Pech Rouge forp-hydroxycinnamic acids analysis and Jordan Siera for his invaluable help in the exploitation of the RSMresults. The authors are gratefully acknowledged for the Ph.D. Grant allocated by the GAIA Ph.D. school toAurélie BICHOT.
Conflicts of Interest: The authors declare no conflict of interest.
References
1. Fatma, S.; Hameed, A.; Noman, M.; Ahmed, T.; Shahid, M.; Tariq, M.; Sohail, I.; Tabassum, R. LignocellulosicBiomass: A Sustainable Bioenergy Source for the Future. Protein Pept. Lett. 2018, 25, 148–163. [CrossRef]
2. Apprich, S.; Tirpanalan, Ö.; Hell, J.; Reisinger, M.; Böhmdorfer, S.; Siebenhandl-Ehn, S.; Novalin, S.; Kneifel, W.Wheat bran-based biorefinery 2: Valorization of products. LWT 2014, 56, 222–231. [CrossRef]
3. Naczk, M.; Shahidi, F. Extraction and analysis of phenolics in food. J. Chromatogr. A 2004, 1054, 95–111.[CrossRef]
4. Xing, Y.M.; White, P.J. Identification and function of antioxidants from oat greats and hulls. J. Am. Oil Chem.Soc. 1997, 74, 303–307. [CrossRef]
5. Grabber, J.H.; Quideau, S.; Ralph, J. p-coumaroylated syringyl units in maize lignin: Implications forbeta-ether cleavage by thioacidolysis. Phytochemistry 1996, 43, 1189–1194. [CrossRef]
6. Kondo, T.; Mizuno, K.; Kato, T. Cell wall-bound para-coumaric and ferulic acids in italian ryegrass. Can. J.Plant. Sci. 1990, 70, 495–499. [CrossRef]
7. Helm, R.F.; Ralph, J. Lignin hydroxycinnamyl model compounds related to forage cell-wall structure. 2.Ester-linked structures. J. Agric. Food Chem. 1993, 41, 570–576. [CrossRef]
8. Bichot, A.; Delgenès, J.-P.; Méchin, V.; Carrère, H.; Bernet, N.; García-Bernet, D. Understanding biomassrecalcitrance in grasses for their efficient utilization as biorefinery feedstock. Rev. Environ. Sci. 2018, 17,707–748. [CrossRef]
119
Molecules 2019, 24, 3885
9. Ragauskas, A.; Williams, C.K.; Davison, B.H.; Britovsek, G.; Cairney, J.; Eckert, C.A.; Frederick, W.J.; Hallett, J.;Leak, D.J.; Liotta, C.L.; et al. The Path Forward for Biofuels and Biomaterials. Science 2006, 311, 484–489.[CrossRef] [PubMed]
10. Chang, V.S.; Holtzapple, M.T. Fundamental Factors Affecting Biomass Enzymatic Reactivity. Twenty-FirstSymposium on Biotechnology for Fuels and Chemicals 2000, 6, 5–37.
11. Weijde, T.V.D.; Alvim Kamei, C.L.; Torres, A.F.; Vermerris, W.; Dolstra, O.; Visser, R.G.F.; Trindade, L.M.The potential of C4 grasses for cellulosic biofuel production. Frontiers in Plant Science 2013, 4, 107. [PubMed]
12. Dupoiron, S.; Lameloise, M.-L.; Bedu, M.; Lewandowski, R.; Fargues, C.; Allais, F.; Teixeira, A.R.S.;Rakotoarivonina, H.; Rémond, C. Recovering ferulic acid from wheat bran enzymatic hydrolysate by a noveland non-thermal process associating weak anion-exchange and electrodialysis. Sep. Purif. Technol. 2018, 200,75–83. [CrossRef]
13. Buranov, A.U.; Mazza, G. Extraction and purification of ferulic acid from flax shives, wheat and corn bran byalkaline hydrolysis and pressurized solvents. Food Chem. 2009, 115, 1542–1548. [CrossRef]
14. Bundhoo, Z.M. Microwave-assisted conversion of biomass and waste materials to biofuels. Renew. Sustain.Energy Rev. 2018, 82, 1149–1177. [CrossRef]
15. Zhang, H.-F.; Yang, X.-H.; Wang, Y. Microwave assisted extraction of secondary metabolites from plants:Current status and future directions. Trends Food Sci. Technol. 2011, 22, 672–688. [CrossRef]
16. Alqaralleh, R.M.; Kennedy, K.; Delatolla, R. Microwave vs. alkaline-microwave pretreatment for enhancingThickened Waste Activated Sludge and fat, oil, and grease solubilization, degradation and biogas production.J. Environ. Manag. 2019, 233, 378–392. [CrossRef] [PubMed]
17. Provan, G.J.; Scobbie, L.; Chesson, A. Determination of phenolic acids in plant cell walls by microwavedigestion. J. Sci. Food Agric. 1994, 64, 63–65. [CrossRef]
18. Carniel, N.; Dallago, R.M.; Dariva, C.; Bender, J.P.; Nunes, A.L.; Zanella, O.; Bilibio, D.; Luiz Priamo, W.Microwave-Assisted Extraction of Phenolic Acids and Flavonoids from Physalis angulata. J. Food ProcessEng. 2017, 40, e12433. [CrossRef]
19. Favretto, L. Basic Guidelines for Microwave Organic Chemistry Applications; Milestone: Bergamo, Italy, 2014.20. Eskilsson, C.S.; Björklund, E. Analytical-scale microwave-assisted extraction. J. Chromatogr. A 2000, 902,
227–250. [CrossRef]21. Oufnac, D.S.; Xu, Z.; Sun, T.; Sabliov, C.; Prinyawiwatkul, W.; Godber, J.S. Extraction of Antioxidants from
Wheat Bran Using Conventional Solvent and Microwave-Assisted Methods. Cereal Chem. J. 2007, 84, 125–129.[CrossRef]
22. Del Rio, A.V.; Palmeiro-Sanchez, T.; Figueroa, M.; Mosquera-Corral, A.; Campos, J.L.; Mendez, R. Anaerobicdigestion of aerobic granular biomass: effects of thermal pre-treatment and addition of primary sludge.J. Chem. Technol. Biotechnol. 2014, 89, 690–697. [CrossRef]
23. Jung, H.-J.G.; Varel, V.H.; Weimer, P.J.; Ralph, J. Accuracy of Klason Lignin and Acid Detergent LigninMethods As Assessed by Bomb Calorimetry. J. Agric. Food Chem. 1999, 47, 2005–2008. [CrossRef] [PubMed]
24. Choudhary, R.; Umagiliyage, A.L.; Liang, Y.; Siddaramu, T.; Haddock, J.; Markevicius, G. Microwavepretreatment for enzymatic saccharification of sweet sorghum bagasse. Biomass-Bioenergy 2012, 39, 218–226.[CrossRef]
25. Lam, T.B.T.; Iiyama, K.; Stone, B.A. Distribution of free and combined phenolic acids in wheat internodes.Phytochemistry 1990, 29, 429–433.
26. Mathew, S.; Abraham, T.E. Ferulic Acid: An Antioxidant Found Naturally in Plant Cell Walls and FeruloylEsterases Involved in its Release and Their Applications. Crit. Rev. Biotechnol. 2004, 24, 59–83. [CrossRef]
27. Mussatto, S.I.; Dragone, G.; Roberto, I.C. Ferulic and p-coumaric acids extraction by alkaline hydrolysis ofbrewer’s spent grain. Ind. Crop. Prod. 2007, 25, 231–237. [CrossRef]
28. Moreira, M.M.; Morais, S.; Barros, A.A.; Delerue-Matos, C.; Guido, L.F. A novel application ofmicrowave-assisted extraction of polyphenols from brewer’s spent grain with HPLC-DAD-MS analysis.Anal. Bioanal. Chem. 2012, 403, 1019–1029. [CrossRef]
29. Díaz, A.B.; Moretti, M.M.D.S.; Bezerra-Bussoli, C.; Nunes, C.D.C.C.; Blandino, A.; Da Silva, R.; Gomes, E.Evaluation of microwave-assisted pretreatment of lignocellulosic biomass immersed in alkaline glycerol forfermentable sugars production. Bioresour. Technol. 2015, 185, 316–323. [CrossRef]
120
Molecules 2019, 24, 3885
30. Moodley, P.; Kana, E.G. Development of a steam or microwave-assisted sequential salt-alkali pretreatmentfor lignocellulosic waste: Effect on delignification and enzymatic hydrolysis. Energy Convers. Manag. 2017,148, 801–808. [CrossRef]
31. Joglekar, A.M.; May, A.T. Product excellence through design of experiments. Cereal Foods World 1987, 32, 857.32. Carrión-Prieto, P.; Martín-Ramos, P.; Hernández-Navarro, S.; Sánchez-Sastre, L.F.; Marcos-Robles, J.L.;
Martín-Gil, J. Furfural, 5-HMF, acid-soluble lignin and sugar contents in C. ladanifer and E. arborealignocellulosic biomass hydrolysates obtained from microwave-assisted treatments in different solvents.Biomass-Bioenergy 2018, 119, 135–143. [CrossRef]
33. Pinela, J.; Prieto, M.A.; Carvalho, A.M.; Barreiro, M.F.; Oliveira, M.B.P.; Barros, L.; Ferreira, I.C.; Barreiro, F.Microwave-assisted extraction of phenolic acids and flavonoids and production of antioxidant ingredientsfrom tomato: A nutraceutical-oriented optimization study. Sep. Purif. Technol. 2016, 164, 114–124. [CrossRef]
34. Liazid, A.; Palma, M.; Brigui, J.; Barroso, C.G.; Lovillo, M.P. Investigation on phenolic compounds stabilityduring microwave-assisted extraction. J. Chromatogr. A 2007, 1140, 29–34. [CrossRef] [PubMed]
35. de Oliveira, D.M.; Finger-Teixeira, A.; Mota, T.R.; Salvador, V.H.; Moreira-Vilar, F.C.; Molinari, H.B.C.;Craig Mitchell, R.A.; Marchiosi, R.; Ferrarese-Filho, O.; Dantas dos Santos, W. Ferulic acid: A key componentin grass lignocellulose recalcitrance to hydrolysis. Plant Biotechnol. J. 2015, 13, 1224–1232. [CrossRef][PubMed]
36. Boonmanumsin, P.; Treeboobpha, S.; Jeamjumnunja, K.; Luengnaruemitchai, A.; Chaisuwan, T.;Wongkasemjit, S. Release of monomeric sugars from Miscanthus sinensis by microwave-assisted ammoniaand phosphoric acid treatments. Bioresour. Technol. 2012, 103, 425–431. [CrossRef]
37. Oussaid, S.; Madani, K.; Houali, K.; Rendueles, M.; Díaz, M. Optimized microwave-assisted extraction ofphenolic compounds from Scirpus holoschoenus and its antipseudomonal efficacy, alone or in combinationwith Thymus fontanesii essential oil and lactic acid. Food Bioprod. Process. 2018, 110, 85–95. [CrossRef]
38. Galan, A.-M.; Calinescu, I.; Trifan, A.; Winkworth-Smith, C.; Calvo-Carrascal, M.; Dodds, C.; Binner, E. Newinsights into the role of selective and volumetric heating during microwave extraction: Investigation of theextraction of polyphenolic compounds from sea buckthorn leaves using microwave-assisted extraction andconventional solvent extraction. Chem. Eng. Process. 2017, 116, 29–39. [CrossRef]
39. Thomas, H.L.; Pot, D.; Latrille, E.; Trouche, G.; Bonnal, L.; Bastianelli, D.; Carrère, H. Sorghum BiomethanePotential Varies with the Genotype and the Cultivation Site. Waste Biomass Valorization 2019, 10, 783–788.[CrossRef]
40. Goering, H.U.; Van Soest, P.J. Forage fiber analyses (apparatus, reagents, procedures, and some applications).In No. 379. US Agricultural Research Service; US government printing office: Washington, DC, USA, 1970.
41. Dence, C.W. The Determination of Lignin. In Methods in Lignin Chemistry; Springer: Berlin, Germany, 1992;pp. 33–61.
42. Hatfield, R.; Fukushima, R.S. Can lignin be accurately measured? Crop Sci. 2005, 45, 832–839. [CrossRef]43. Zhang, Y.; Culhaoglu, T.; Pollet, B.; Melin, C.; Denoue, D.; Barrière, Y.; Baumberger, S.; Méchin, V. Impact of
Lignin Structure and Cell Wall Reticulation on Maize Cell Wall Degradability. J. Agric. Food Chem. 2011, 59,10129–10135. [CrossRef]
44. Oliveira, J.; Alves, M.; Costa, J.; Alves, M. Optimization of biogas production from Sargassum sp. using adesign of experiments to assess the co-digestion with glycerol and waste frying oil. Bioresour. Technol. 2015,175, 480–485. [CrossRef] [PubMed]
45. Thomas, H.L.; Seira, J.; Escudie, R.; Carrere, H. Lime Pretreatment of Miscanthus: Impact on BMP and BatchDry Co-Digestion with Cattle Manure. Molecules 2018, 23, 13. [CrossRef] [PubMed]
46. Witek-Krowiak, A.; Chojnacka, K.; Podstawczyk, D.; Dawiec, A.; Pokomeda, K. Application of responsesurface methodology and artificial neural network methods in modelling and optimization of biosorptionprocess. Bioresour. Technol. 2014, 160, 150–160. [CrossRef] [PubMed]
Sample Availability: Samples of the compounds are not available from the authors.
© 2019 by the authors. Licensee MDPI, Basel, Switzerland. This article is an open accessarticle distributed under the terms and conditions of the Creative Commons Attribution(CC BY) license (http://creativecommons.org/licenses/by/4.0/).
121

molecules
Article
Matrix Discriminant Analysis EvidencedSurface-Lithium as an Important Factor to Increasethe Hydrolytic Saccharification of Sugarcane Bagasse
Ana Sílvia de Almeida Scarcella 1, Alexandre Favarin Somera 2,Christiane da Costa Carreira Nunes 3, Eleni Gomes 3, Ana Claudia Vici 2,Marcos Silveira Buckeridge 4 and Maria de Lourdes Teixeira de Moraes Polizeli 2,*
1 Departamento de Bioquímica e Imunologia, Faculdade de Medicina de Ribeirão Preto, Universidade de SãoPaulo. Bandeirantes Av., 3900, 14049-900 Ribeirão Preto, São Paulo, Brazil; [email protected]
2 Departamento de Biologia, Faculdade de Filosofia, Ciências e Letras de Ribeirão Preto, Universidade de SãoPaulo. Bandeirantes Av., 3900, 14040-901 Ribeirão Preto, São Paulo, Brazil; [email protected] (A.F.S.);[email protected] (A.C.V.)
3 Departamento de Biologia, Instituto de Biociências Letras e Ciências Exatas, Universidade Estadual PaulistaJúlio de Mesquita Filho. Cristovão Colombo Street, 2265, 15054000 São José do Rio Preto, São Paulo, Brazil;[email protected] (C.d.C.C.N.); [email protected] (E.G.)
4 Laboratório de Fisiologia Ecológica (LAFIECO), Departamento de Botânica, Instituto de Biociências,Universidade de São Paulo. Matão Street, 277, Cidade Universitária, 05508-090 São Paulo, Brazil;[email protected]
* Correspondence: [email protected]; Tel.: +55-16-3315-4680
Received: 15 August 2019; Accepted: 20 September 2019; Published: 8 October 2019
Abstract: Statistical evidence pointing to the very soft change in the ionic composition on the surfaceof the sugar cane bagasse is crucial to improve yields of sugars by hydrolytic saccharification. Removalof Li+ by pretreatments exposing -OH sites was the most important factor related to the increase ofsaccharification yields using enzyme cocktails. Steam Explosion and Microwave:H2SO4 pretreatmentsproduced unrelated structural changes, but similar ionic distribution patterns. Both increased thesaccharification yield 1.74-fold. NaOH produced structural changes related to Steam Explosion,but released surface-bounded Li+ obtaining 2.04-fold more reducing sugars than the control. In turn,the higher amounts in relative concentration and periodic structures of Li+ on the surface observedin the control or after the pretreatment with Ethanol:DMSO:Ammonium Oxalate, blocked -OH andO− available for ionic sputtering. These changes correlated to 1.90-fold decrease in saccharificationyields. Li+ was an activator in solution, but its presence and distribution pattern on the substrate wasprejudicial to the saccharification. Apparently, it acts as a phase-dependent modulator of enzymeactivity. Therefore, no correlations were found between structural changes and the efficiency of theenzymatic cocktail used. However, there were correlations between the Li+ distribution patterns andthe enzymatic activities that should to be shown.
Keywords: lithium; sugarcane bagasse; saccharification; glycosyl-hydrolase; ToF-SIMS; surface iondistribution; second-generation ethanol; pretreatment
1. Introduction
Demand for renewable fuels has considerably increased in recent years. Thus, there has been asignificant increase of interest in sugarcane.
The most widespread crop in Brazil is sugarcane, with 391,767 thousand tons coming from the2018/2019 harvest [1]. Sugarcane bagasse is composed of an elaborate arrangement of polysaccharides
123
Molecules 2019, 24, 3614
and proteins, combined with inorganic and organic ions acquired during different stages of culturingand processing [2]. Apart from these different sources of ions and the composition of the plantmaterial, the pretreatment of sugarcane bagasse has become extremely important for determiningthe ionic composition of the substrate for the enzymatic saccharification. The cost and success ofbioethanol production process from lignocellulosic biomass depends largely on the recalcitrant biomassitself, as well as on the repertoire of enzymes involved in the depolymerization of the constituentpolysaccharides in the cell wall [3].
The pretreatment of sugarcane is crucial to ensure the conversion of polysaccharides into sugarsfor bioethanol production, since their chemical composition and physical structure are altered [4,5].The different pretreatments can contribute to improving hydrolysis of the cell wall due to the ruptureof the lignin structure and the connection with the rest of the biomass; removal of hemicellulose;and reduction of crystallinity and degree of polymerization of cellulose [6]. Several organic chemicalchanges have been researched using ToF-SIMS with great success [7]. However, pretreatments havethe potential to alter the composition, relative concentration, and spatial distribution of alkaline andalkaline-earth metal ions on the substrate surface. This critical aspect possibly related to enzymefailure is still poorly researched. The mineral distribution on the surface of the substrate and the ionicproperties of the surface area are key properties related to enzyme action because they are responsiblefor the surface charge, acidity, phase transfer, and the availability of binding and walking sites forenzymes [8,9]. Metals, alkaline metals, and alkaline earth metal ions are known to interfere positivelyor negatively in the enzymatic activity [8]. Therefore, it is necessary to map these changes and evaluatewhich ones interfere in enzyme function.
The importance of substrate as an ionic carrier is stressed in complex substrates such as sugarcanebagasse used in the second-generation ethanol industry.
The aim of this study was to analyze pretreatments of sugarcane bagasse to be used prior toenzymatic hydrolysis and to understand the anatomical factors related to our yield using ION-TOF.Furthermore, this work evaluated the neglected effect of current pretreatments on the composition,concentration and distribution of metallic ions on the surface of the sugarcane bagasse. Here, it wasreported the extensive imaging analysis of different pretreatments of sugarcane bagasse used insecond-generation ethanol production and their correlation with enzyme cocktail activity.
2. Results
2.1. Control-Milled Sugarcane Bagasse in Natura
Milled sugarcane bagasse in natura was chosen as control and subjected to direct saccharification.That material was also the initial material subjected to pretreatments to obtain a more suitable substratefor saccharification.
Control presented a very compact and overlapped structure containing aromatics remnant oflignin, (CxHyOz)n from carbohydrates and an almost uniform distribution of CxHy from side groups.Sum images containing -OH and (CxHyOz)n + CxHy are shown in Figure 1. ToF-SIMS revealed a largenumber of impregnated ions in the structure including Na+, K+ and Mg2+, as well as Ca2+ covalentlybounded (Ca−C3H4
+) (Table 1). From those ions, Li+ covered 22.08% of -OH sites which were releasedtogether with Li+ sputtering (Table 2, Figure 2). Na+ and K+ spots were widespread on the surface(Table 1). Na+ presented clustered distribution forming small high-bulk density aggregates. Na+ wasco-located with Cl− and PO−, PO2
− and PO3− sites. However, only 48.7% of PO−, PO2
− and PO3− sites,
co-located with Na+, were sputtered from the surface of the sugarcane bagasse. All other elements hada random distribution. The density of H+ on the surface was very large. The negative mode sputtereroded ions at a mass range of 160–180 Da related to surface glucose, arabinose, and xylose units of theexposed cellulose and hemicellulose, respectively.
124
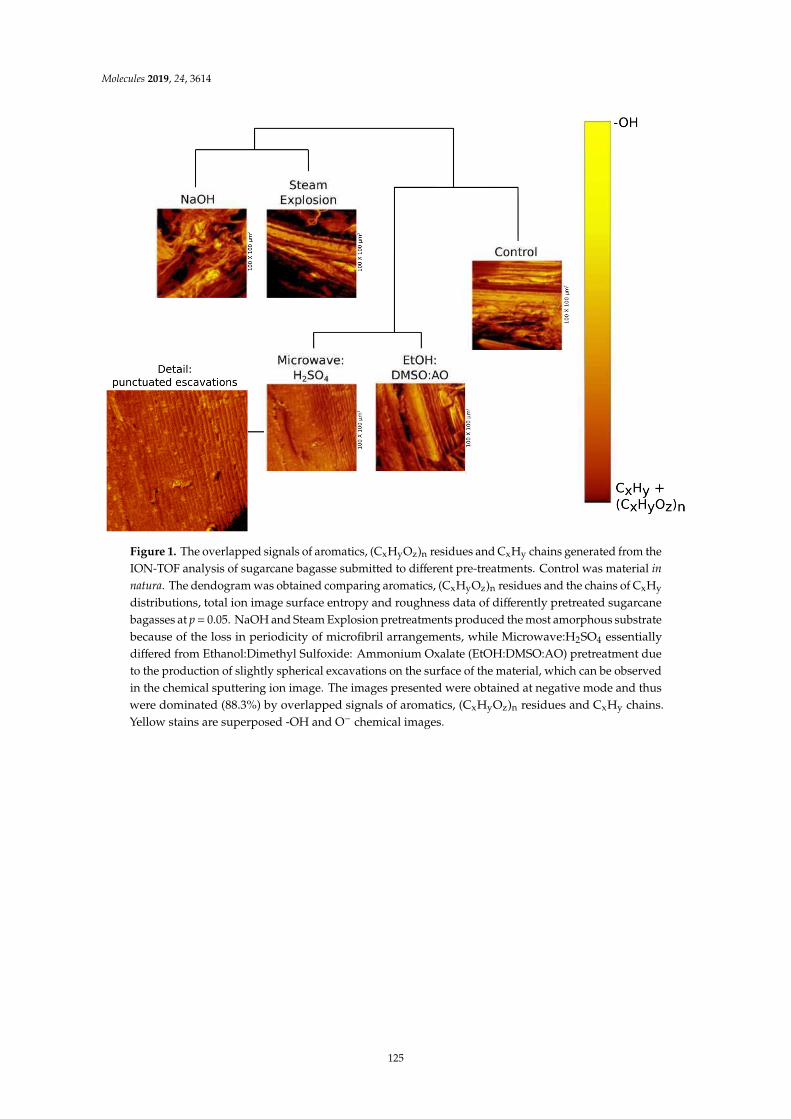
Molecules 2019, 24, 3614Molecules 2019, 24, x FOR PEER REVIEW 3 of 14
Figure 1. The overlapped signals of aromatics, (CxHyOz)n residues and CxHy chains generated from the ION-TOF analysis of sugarcane bagasse submitted to different pre-treatments. Control was material in natura. The dendogram was obtained comparing aromatics, (CxHyOz)n residues and the chains of CxHy distributions, total ion image surface entropy and roughness data of differently pretreated sugarcane bagasses at p = 0.05. NaOH and Steam Explosion pretreatments produced the most amorphous substrate because of the loss in periodicity of microfibril arrangements, while Microwave:H2SO4 essentially differed from Ethanol:Dimethyl Sulfoxide: Ammonium Oxalate (EtOH:DMSO:AO) pretreatment due to the production of slightly spherical excavations on the surface of the material, which can be observed in the chemical sputtering ion image. The images presented were obtained at negative mode and thus were dominated (88.3%) by overlapped signals of aromatics, (CxHyOz)n residues and CxHy chains. Yellow stains are superposed -OH and O⁻ chemical images.
Table 1. Ion particle analysis after automated color threshold.
Ion/ Compost
Control in Natura Steam Explosion
Pretreatment Microwave:H2SO4
Pretreatment
EtOH:DMSO:AO a Pretreatment
NaOH Pretreatment
Count
(N)
Area (μm2)
Average size (μm2)
Count
(N)
Area (μm2)
Average
size (μm2)
Count
(N)
Area (μm2)
Average size (μm2)
Count
(N)
Area (μm2)
Average size (μm2)
Count
(N)
Area (μm2)
Average size (μm2)
Li⁺ 353 53.857 0.150 88 0.054 0.027 63 0.027 0.027 320 30.879 0.097 16 4.569 0.286 Na⁺ 71 349.574 6.221 35 185.866 5.310 121 376.032 3.108 61 383.557 6.288 23 374.151 16.267 K⁺ 19 432.026 26.729 50 254.450 5.089 94 364.368 3.876 38 387.346 10.193 15 376.596 25.106
Mg2+ 144 249.479 2.058 107 116.690 1.091 777 124.457 0.160 570 105.242 0.185 119 178.072 1.496 Ca-
C3H4+ 44 407.019 11.957 122 231.607 1.898 28 487.885 17.424 83 393.608 4.742 42 316.961 7.547
F⁻ 197 278.208 4.107 209 167.511 0.801 778 168.263 0.216 299 244.991 0.819 46 386.540 8.403 Cl⁻ 62 369.058 7.128 135 164.850 1.221 65 457.812 7.043 224 234.241 1.046 53 367.540 6.935
DDAb
0 0.000 0.000 9 0.403 0.045 7 0.215 0.031 7 0.403 0.058 9 2.365 0.263
Figure 1. The overlapped signals of aromatics, (CxHyOz)n residues and CxHy chains generated from theION-TOF analysis of sugarcane bagasse submitted to different pre-treatments. Control was material innatura. The dendogram was obtained comparing aromatics, (CxHyOz)n residues and the chains of CxHy
distributions, total ion image surface entropy and roughness data of differently pretreated sugarcanebagasses at p = 0.05. NaOH and Steam Explosion pretreatments produced the most amorphous substratebecause of the loss in periodicity of microfibril arrangements, while Microwave:H2SO4 essentiallydiffered from Ethanol:Dimethyl Sulfoxide: Ammonium Oxalate (EtOH:DMSO:AO) pretreatment dueto the production of slightly spherical excavations on the surface of the material, which can be observedin the chemical sputtering ion image. The images presented were obtained at negative mode and thuswere dominated (88.3%) by overlapped signals of aromatics, (CxHyOz)n residues and CxHy chains.Yellow stains are superposed -OH and O− chemical images.
125
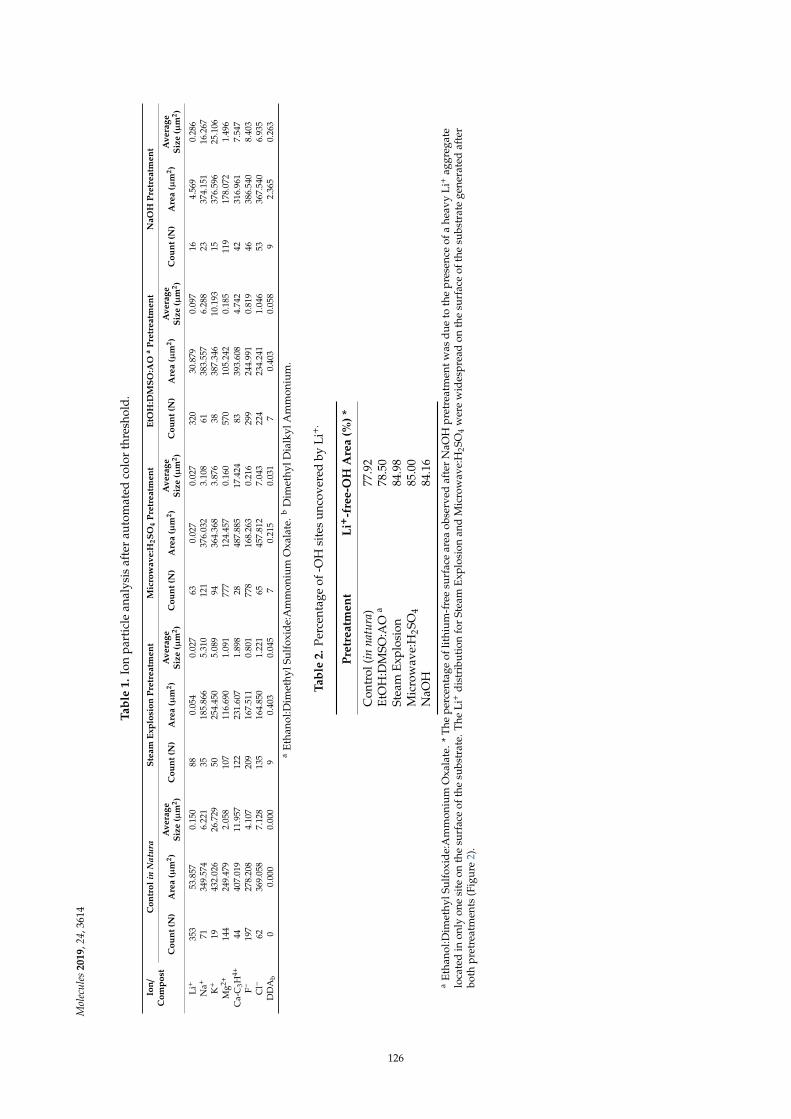
Mol
ecul
es20
19,2
4,36
14
Tabl
e1.
Ion
part
icle
anal
ysis
afte
rau
tom
ated
colo
rth
resh
old.
Ion/
Com
post
Con
trol
inN
atur
aSt
eam
Expl
osio
nPr
etre
atm
ent
Mic
row
ave:
H2S
O4
Pret
reat
men
tEt
OH
:DM
SO:A
Oa
Pret
reat
men
tN
aOH
Pret
reat
men
t
Cou
nt(N
)A
rea
(µm
2 )A
vera
geSi
ze(µ
m2 )
Cou
nt(N
)A
rea
(µm
2 )A
vera
geSi
ze(µ
m2 )
Cou
nt(N
)A
rea
(µm
2 )A
vera
geSi
ze(µ
m2 )
Cou
nt(N
)A
rea
(µm
2 )A
vera
geSi
ze(µ
m2 )
Cou
nt(N
)A
rea
(µm
2 )A
vera
geSi
ze(µ
m2 )
Li+
353
53.8
570.
150
880.
054
0.02
763
0.02
70.
027
320
30.8
790.
097
164.
569
0.28
6N
a+71
349.
574
6.22
135
185.
866
5.31
012
137
6.03
23.
108
6138
3.55
76.
288
2337
4.15
116
.267
K+
1943
2.02
626
.729
5025
4.45
05.
089
9436
4.36
83.
876
3838
7.34
610
.193
1537
6.59
625
.106
Mg2+
144
249.
479
2.05
810
711
6.69
01.
091
777
124.
457
0.16
057
010
5.24
20.
185
119
178.
072
1.49
6C
a-C
3H4+
4440
7.01
911
.957
122
231.
607
1.89
828
487.
885
17.4
2483
393.
608
4.74
242
316.
961
7.54
7F−
197
278.
208
4.10
720
916
7.51
10.
801
778
168.
263
0.21
629
924
4.99
10.
819
4638
6.54
08.
403
Cl−
6236
9.05
87.
128
135
164.
850
1.22
165
457.
812
7.04
322
423
4.24
11.
046
5336
7.54
06.
935
DD
Ab
00.
000
0.00
09
0.40
30.
045
70.
215
0.03
17
0.40
30.
058
92.
365
0.26
3a
Etha
nol:D
imet
hylS
ulfo
xide
:Am
mon
ium
Oxa
late
.bD
imet
hylD
ialk
ylA
mm
oniu
m.
Tabl
e2.
Perc
enta
geof
-OH
site
sun
cove
red
byLi
+.
Pret
reat
men
tLi+
-fre
e-O
HA
rea
(%)*
Con
trol
(inna
tura
)77
.92
EtO
H:D
MSO
:AO
a78
.50
Stea
mEx
plos
ion
84.9
8M
icro
wav
e:H
2SO
485
.00
NaO
H84
.16
aE
than
ol:D
imet
hylS
ulfo
xid
e:A
mm
oniu
mO
xala
te.*
The
perc
enta
geof
lithi
um-f
ree
surf
ace
area
obse
rved
afte
rN
aOH
pret
reat
men
twas
due
toth
epr
esen
ceof
ahe
avy
Li+
aggr
egat
elo
cate
din
only
one
site
onth
esu
rfac
eof
the
subs
trat
e.T
heLi
+di
stri
buti
onfo
rSt
eam
Expl
osio
nan
dM
icro
wav
e:H
2SO
4w
ere
wid
espr
ead
onth
esu
rfac
eof
the
subs
trat
ege
nera
ted
afte
rbo
thpr
etre
atm
ents
(Fig
ure
2).
126

Molecules 2019, 24, 3614
Molecules 2019, 24, x FOR PEER REVIEW 4 of 14
a Ethanol:Dimethyl Sulfoxide:Ammonium Oxalate. b Dimethyl Dialkyl Ammonium.
Table 2. Percentage of -OH sites uncovered by Li+.
Pretreatment Li+-free-OH area (%) *
Control (in natura) 77.92
EtOH:DMSO:AO a 78.50
Steam Explosion 84.98
Microwave:H2SO4 85.00
NaOH 84.16 a Ethanol:Dimethyl Sulfoxide:Ammonium Oxalate. * The percentage of lithium-free surface area observed after NaOH pretreatment was due to the presence of a heavy Li+ aggregate located in only one site on the surface of the substrate. The Li+ distribution for Steam Explosion and Microwave:H2SO4 were widespread on the surface of the substrate generated after both pretreatments (Figure 2).
Figure 2. Mixture Discriminant Analysis and distribution patterns of Li+ on the surface of sugarcane bagasse. Pretreatments are grouped into conjuncts. The normalized spatial concentration patterns for released Li+, Li+[O−]n and Li+[OH−]n from the surface of pretreated sugarcane bagasse is presented. Parallel ridges of Li+ records were observed on the surfaces of control materials, Steam Explosion and Ethanol: Dimethyl Sulfoxide: Ammonium Oxalate (EtOH:DMSO:AO) pretreatments. The periodic arrangements in fringe and lattice structures positively correlated with the positioning of fibrils only for control and EtOH:DMSO:AO pretreatments, once Steam Explosion destroyed that arrangement.
2.2. Steam Explosion Pretreatment
Figure 2. Mixture Discriminant Analysis and distribution patterns of Li+ on the surface of sugarcanebagasse. Pretreatments are grouped into conjuncts. The normalized spatial concentration patterns forreleased Li+, Li+[O−]n and Li+[OH−]n from the surface of pretreated sugarcane bagasse is presented.Parallel ridges of Li+ records were observed on the surfaces of control materials, Steam Explosion andEthanol: Dimethyl Sulfoxide: Ammonium Oxalate (EtOH:DMSO:AO) pretreatments. The periodicarrangements in fringe and lattice structures positively correlated with the positioning of fibrils onlyfor control and EtOH:DMSO:AO pretreatments, once Steam Explosion destroyed that arrangement.
2.2. Steam Explosion Pretreatment
At positive mode, the mass spectrometric analysis of sugarcane bagasse subjected to steamexplosion evidenced a decrease in the concentrations of metal and semi-metal ions (Table 1). The recordsfor O−, Cl− and -OH were enriched 3.1-fold. The resulting chemical image of the surface of thesubstrate evidenced the increase in the exposure of compounds at 279–280 Da (benzoate) and at 417 Da(syringaresinol) from lignin. The pretreatment also increased 2.47-fold the (CxHyOz)n at 160–180 Da(glucose and xylose from cellulose and hemicelluloses, respectively). The steam explosion produced2.80-fold higher dimethyl dialkyl ammonium (DDA) amounts at random distribution than otherpretreatments. In turn, Li+ was dramatically reduced (2.20-fold) compared to control and presentedrandom distribution (Figure 2). At negative mode, the exposure of anions and sites for an enzymaticattack such as -OH, O−, (CxHyOz)n and aromatics showed a 2.31-fold mean increase in signal intensity(Figure 1). Microscopic changes in fiber were evident by chemical image, presenting lattice deformationeven at micrometer scale but without complete fibrils dismemberment and their periodic fringeordering, whose remnants occupied 47% surface area.
2.3. Microwave:H2SO4 Pretreatment
Microwave:H2SO4 pretreatment decreased metal ions on the surface of the substrate (Table 1).At negative mode, the chemical image presented aromatics related to lignin superposed with CxHy
signals. The image showed 1.22-fold lower records for (CxHyOz)n on the surface than control, revealinghigher hindering of celluloses and hemicelluloses. It is worth mentioning the low abundance of ionsrandomly distributed on the surface, 11.8% lower than control, but 43.2% higher than Steam Explosion.The surface of that pretreated substrate had 2.60-fold less DDA than the Steam Explosion and 28.8%
127
Molecules 2019, 24, 3614
less Li+ than the control. The periodic structure of fibrils was 97.2% preserved rather than prior totreatment. Microwave:H2SO4 produced a singular effect: the substrate pretreated surface showed72 roughly circular excavations for 100 × 100 µm2 area. Excavations presented an average radius of0.72 µm and 2.45 nm depth, which were extremely rich in -OH and O− (Figure 1). These excavationspresented 68.4% of its surface covered by -OH and O−from cellulose and hemicelluloses, and weredevoid of Li+, Ca-C3H4
+, Mg2+, and -NH3+.
2.4. Ethanol:Dimethyl Sulfoxide:Ammonium Oxalate (EtOH:DMSO:AO) Pretreatment
The chemical image confirms the increase in the exposure of aromatic compounds and 1.21-foldincrement in the exposal of (CxHyOz)n at positive mode, followed by a 1.09-fold rise in the amounts of-NH3
+, -CN and -CNH groups overlapped with (CxHyOz)n on the substrate surface. These resultspointed to overlaps between proteins and carbohydrates at the substrate surface. The pretreatmentrandomly added DDA and produced a low ionic average count (Table 1). At negative mode,the (CxHyOz)n and aromatic exposure showed 1.30-fold higher signal intensity than the control becauseof the better exposure of fibrils’ after that pretreatment (Figure 1).
2.5. NaOH Pretreatment
The chemical image revealed the complete deformation of the lattice structures observed inthe control (Figure 1). Only 8.7% of the remnant parallel arrangements and lattice structures at thesubstrate surface were preserved in a 100 × 100 µm2 area. That pretreatment also produced the biggestenrichment in Na+ and F− recorded, equivalent to a 1.73-fold mean increase relative to the control(Table 1). The increase in F− and K+ was routed to impurities in the NaOH solution (data not shown),while Na+ enrichment can be a possible side effect of the pretreatment. In addition to the increasedexposure of (CxHyOz)n and CxHy, aromatics at 279—280 Da identified as benzoate and bi-phenolicresidues from lignin. Li+ was only observed in aggregates with DDA (Figure 2), but not on the remnantsurface. Despite the higher relative concentrations of Na+ and K+, all other ion concentrations reduced(Table 1). Ions were distributed in lower numbers of aggregates occupying a reduced surface of thesubstrate. Li+ presented a decrease of 1.41-fold in relation to the control (Table 1, Figure 2). That wasobserved with Microwave:H2SO4, but it was lower than those obtained with Steam Explosion andEtOH:DMSO:AO. Compared to the control, -OH and O−, increased 1.65-fold (Figure 1). That was thebiggest gain achieved with -OH exposition. Only the circular excavations verified in Microwave:H2SO4
pretreatment presented higher amounts of -OH exposed. However, circular excavations verified afterMicrowave:H2SO4 pretreatment occupied only 68.4% a 100 × 100 µm2 area, while the area occupied by-OH after NaOH pretreatment represented 97.4% of the surface analyzed.
2.6. Clustering Pretreatments Using Discriminant Analysis with Machine Learning—Anatomical Parameters
Figure 1 shows the comparison of surface anatomical parameters (p = 0.05) of sugarcane bagassedifferently pretreated. Aiming to compare all pretreatments, matrix discriminant analysis with machinelearning was used, due to the non-linearity of data and the very complex nested matrix of parametersobtained. The surface structure properties analyzed were the percentage of the area occupied byCxHy, (CxHyOz)n and aromatics (i.e., sugars and lignin) surface area covered by radicals (-OH andO−), which are related to hydroxyl groups used by glycosyl-hydrolases during their action; the surfacearea occupied by periodic, parallel, and lattice structures containing CxHy and (CxHyOz)n; and surfaceentropy, waviness, and roughness. These parameters were automatically collected using the free andopen-source softwares ImageJ and Gwyddion.
According to these parameters, NaOH and Steam Explosion pretreatments clustered together andproduced the most amorphous substrate. It happened due to the loss of periodicity of the carbohydratesurface arrangements. On the other hand, Microwave:H2SO4 differed from the pretreatment withEtOH:DMSO:AO, because of the production of slightly spherical excavations on the surface of thematerial. The fibrils and microfibrils, observed in the control, presented intense cover-up by organic
128
Molecules 2019, 24, 3614
matter, visible in the images as amorphous deposits containing -OH and (CxHyOz)n residues andchains of CxHy (Figure 1). The estimated differential entropy for the control surface was equal to−20.46 nats (natural units of information) with a deficit of 0.16266 nats, because of those roughlyamorphous deposits.
2.7. Clustering Pretreatments Using Discriminant Analysis with Machine Learning – Ionic Parameters
The matrix discriminant analysis of the ionic parameters from the surface of the substratesclustered the following samples: EtOH:DMSO:AO pretreatment and Control; Steam Explosion andMicrowave:H2SO4; and finally, isolated the NaOH pretreatment in a single group (Figure 2, Table 1).Using a jackknife procedure, deleting single ionic parameters before running the matrix discriminantanalysis with machine learning, the ionic parameters related to Li+ (Table 2) were identified asresponsible by 37,6% of these results. Figure 2 showed the results of the matrix discriminant analysiswith computerized images of Li+ obtained using the Gwyddion software.
Steam Explosion and Microwave:H2SO4 pretreatments produced lower counting of aggregates,the lowest total area occupied by Li+ and the lowest average size for Li+ aggregates. However,both differed in DDA, only present after the Steam Explosion pretreatment (Table 1), and -OH-enrichedexcavations presented only after Microwave:H2SO4 pretreatment (Figure 1).
The NaOH pretreatment produced higher counts, percentage area and average size of aggregatesof Li+, but all Li+ observed was not distributed accompanying fibrils of carbohydrates such as in SteamExplosion or control. In turn Li+ presented random distribution and a very low abundance on thesurface of the substrate, but one high bulk density aggregate of 13.79 µm2 in a 100 × 100 µm2 chemicalimage area.
2.8. Performance of the Enzyme Cocktail Versus Pretreatment-the Enzymatic View Versus the MatrixDiscriminant Analysis of Anatomical and Ionic Composition on the Surface of the Substrate
The best saccharification yield was obtained after NaOH pretreatment, which increased therelease of reducing sugars by enzymatic saccharification in 2.04-fold more than the control at 10 hintervals (Figure 3). The right side of Figure 3 shows a tree made using the results from the MDAanalysis of treatments used in each saccharification assay. The tree was placed next to the results ofthe saccharification assays to highlight the similarities between enzyme responses and MDA analysisresults. Analysis was done at p ≤ 0.05. It was noted the relevant events in the dendrogram, suchas the non-Michaelian branch related to milled material, the counts of lithium-ion clusters on thesurface of the materials, the qualitative richness of Sodium observed in NaOH treatment, the total areafree from metal ions less than 14,509 µm2, and the qualitative changes in lithium-ion concentrationon the surfaces analyzed. These raw data are in Table 1. Steam Explosion and Microwave:H2SO4
clustered in an intermediate subset during enzymatic hydrolysis increasing 1.74-fold the reducingsugars release at 10 h intervals compared to control. In turn, a 1.1-fold decrease in the productionrates of reducing sugars was identified after EtOH:DMSO:AO pretreatment when compared to control.EtOH:DMSO:AO and control also presented time-dependent decay for the release of reducing sugarsafter 10 h intervals.
129
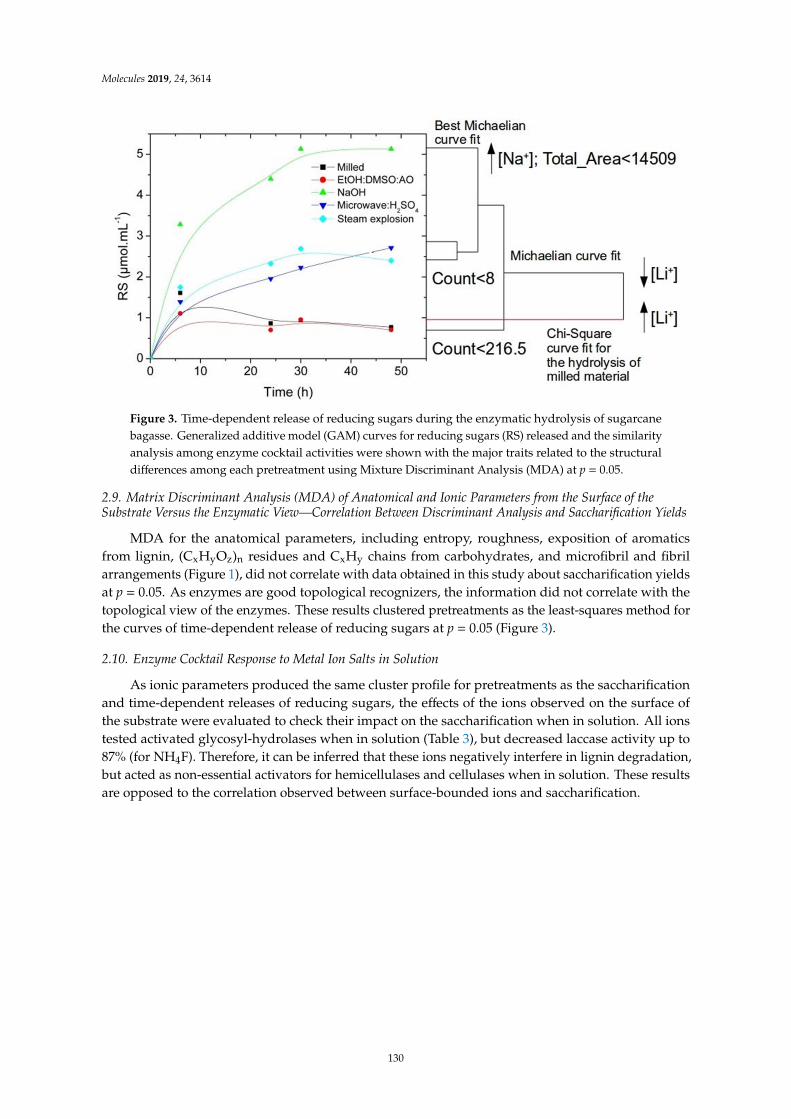
Molecules 2019, 24, 3614
Molecules 2019, 24, x FOR PEER REVIEW 7 of 14
results. Analysis was done at p ≤ 0.05. It was noted the relevant events in the dendrogram, such as the non-Michaelian branch related to milled material, the counts of lithium-ion clusters on the surface of the materials, the qualitative richness of Sodium observed in NaOH treatment, the total area free from metal ions less than 14,509 µm2, and the qualitative changes in lithium-ion concentration on the surfaces analyzed. These raw data are in Table 1. Steam Explosion and Microwave:H2SO4 clustered in an intermediate subset during enzymatic hydrolysis increasing 1.74-fold the reducing sugars release at 10 h intervals compared to control. In turn, a 1.1-fold decrease in the production rates of reducing sugars was identified after EtOH:DMSO:AO pretreatment when compared to control. EtOH:DMSO:AO and control also presented time-dependent decay for the release of reducing sugars after 10 h intervals.
Figure 3. Time-dependent release of reducing sugars during the enzymatic hydrolysis of sugarcane bagasse. Generalized additive model (GAM) curves for reducing sugars (RS) released and the similarity analysis among enzyme cocktail activities were shown with the major traits related to the structural differences among each pretreatment using Mixture Discriminant Analysis (MDA) at p = 0.05.
2.9. Matrix Discriminant Analysis (MDA) of Anatomical and Ionic Parameters from the Surface of the Substrate Versus the Enzymatic View—Correlation Between Discriminant Analysis and Saccharification Yields
MDA for the anatomical parameters, including entropy, roughness, exposition of aromatics from lignin, (CxHyOz)n residues and CxHy chains from carbohydrates, and microfibril and fibril arrangements (Figure 1), did not correlate with data obtained in this study about saccharification yields at p = 0.05. As enzymes are good topological recognizers, the information did not correlate with the topological view of the enzymes. These results clustered pretreatments as the least-squares method for the curves of time-dependent release of reducing sugars at p = 0.05 (Figure 3).
2.10. Enzyme Cocktail Response to Metal Ion Salts in Solution
Figure 3. Time-dependent release of reducing sugars during the enzymatic hydrolysis of sugarcanebagasse. Generalized additive model (GAM) curves for reducing sugars (RS) released and the similarityanalysis among enzyme cocktail activities were shown with the major traits related to the structuraldifferences among each pretreatment using Mixture Discriminant Analysis (MDA) at p = 0.05.
2.9. Matrix Discriminant Analysis (MDA) of Anatomical and Ionic Parameters from the Surface of theSubstrate Versus the Enzymatic View—Correlation Between Discriminant Analysis and Saccharification Yields
MDA for the anatomical parameters, including entropy, roughness, exposition of aromaticsfrom lignin, (CxHyOz)n residues and CxHy chains from carbohydrates, and microfibril and fibrilarrangements (Figure 1), did not correlate with data obtained in this study about saccharification yieldsat p = 0.05. As enzymes are good topological recognizers, the information did not correlate with thetopological view of the enzymes. These results clustered pretreatments as the least-squares method forthe curves of time-dependent release of reducing sugars at p = 0.05 (Figure 3).
2.10. Enzyme Cocktail Response to Metal Ion Salts in Solution
As ionic parameters produced the same cluster profile for pretreatments as the saccharificationand time-dependent releases of reducing sugars, the effects of the ions observed on the surface ofthe substrate were evaluated to check their impact on the saccharification when in solution. All ionstested activated glycosyl-hydrolases when in solution (Table 3), but decreased laccase activity up to87% (for NH4F). Therefore, it can be inferred that these ions negatively interfere in lignin degradation,but acted as non-essential activators for hemicellulases and cellulases when in solution. These resultsare opposed to the correlation observed between surface-bounded ions and saccharification.
130
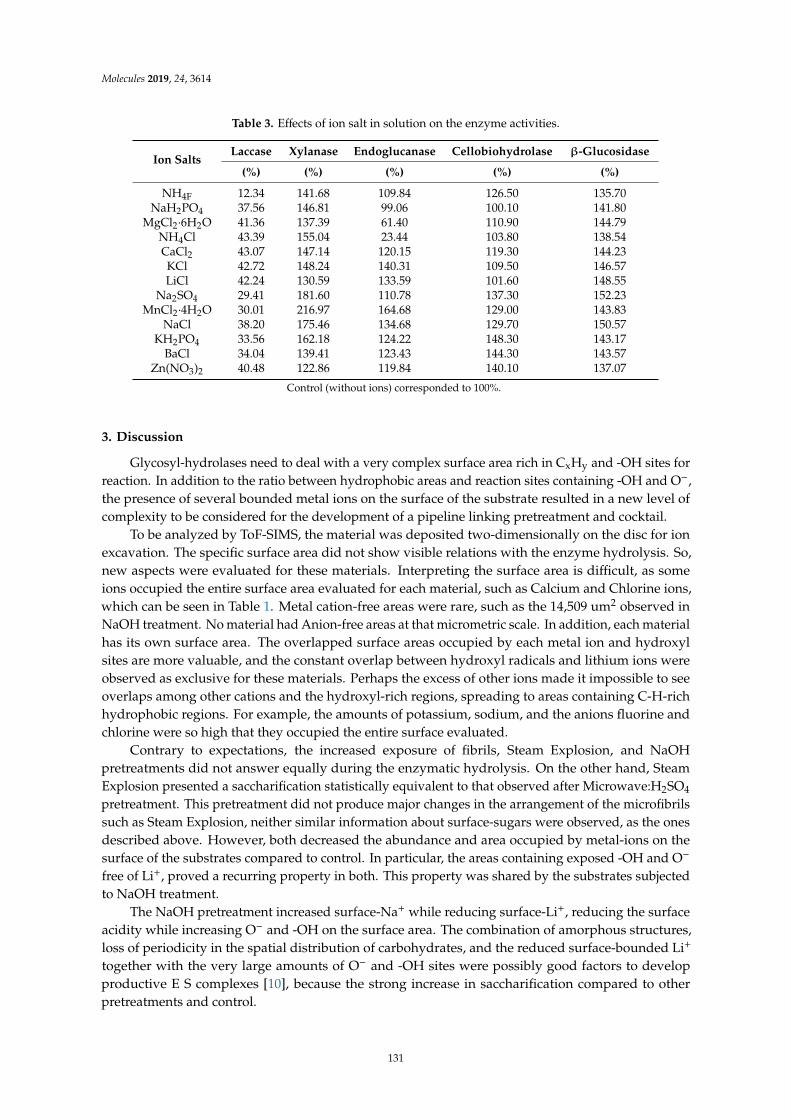
Molecules 2019, 24, 3614
Table 3. Effects of ion salt in solution on the enzyme activities.
Ion SaltsLaccase Xylanase Endoglucanase Cellobiohydrolase β-Glucosidase
(%) (%) (%) (%) (%)
NH4F 12.34 141.68 109.84 126.50 135.70NaH2PO4 37.56 146.81 99.06 100.10 141.80
MgCl2·6H2O 41.36 137.39 61.40 110.90 144.79NH4Cl 43.39 155.04 23.44 103.80 138.54CaCl2 43.07 147.14 120.15 119.30 144.23KCl 42.72 148.24 140.31 109.50 146.57LiCl 42.24 130.59 133.59 101.60 148.55
Na2SO4 29.41 181.60 110.78 137.30 152.23MnCl2·4H2O 30.01 216.97 164.68 129.00 143.83
NaCl 38.20 175.46 134.68 129.70 150.57KH2PO4 33.56 162.18 124.22 148.30 143.17
BaCl 34.04 139.41 123.43 144.30 143.57Zn(NO3)2 40.48 122.86 119.84 140.10 137.07
Control (without ions) corresponded to 100%.
3. Discussion
Glycosyl-hydrolases need to deal with a very complex surface area rich in CxHy and -OH sites forreaction. In addition to the ratio between hydrophobic areas and reaction sites containing -OH and O−,the presence of several bounded metal ions on the surface of the substrate resulted in a new level ofcomplexity to be considered for the development of a pipeline linking pretreatment and cocktail.
To be analyzed by ToF-SIMS, the material was deposited two-dimensionally on the disc for ionexcavation. The specific surface area did not show visible relations with the enzyme hydrolysis. So,new aspects were evaluated for these materials. Interpreting the surface area is difficult, as someions occupied the entire surface area evaluated for each material, such as Calcium and Chlorine ions,which can be seen in Table 1. Metal cation-free areas were rare, such as the 14,509 um2 observed inNaOH treatment. No material had Anion-free areas at that micrometric scale. In addition, each materialhas its own surface area. The overlapped surface areas occupied by each metal ion and hydroxylsites are more valuable, and the constant overlap between hydroxyl radicals and lithium ions wereobserved as exclusive for these materials. Perhaps the excess of other ions made it impossible to seeoverlaps among other cations and the hydroxyl-rich regions, spreading to areas containing C-H-richhydrophobic regions. For example, the amounts of potassium, sodium, and the anions fluorine andchlorine were so high that they occupied the entire surface evaluated.
Contrary to expectations, the increased exposure of fibrils, Steam Explosion, and NaOHpretreatments did not answer equally during the enzymatic hydrolysis. On the other hand, SteamExplosion presented a saccharification statistically equivalent to that observed after Microwave:H2SO4
pretreatment. This pretreatment did not produce major changes in the arrangement of the microfibrilssuch as Steam Explosion, neither similar information about surface-sugars were observed, as the onesdescribed above. However, both decreased the abundance and area occupied by metal-ions on thesurface of the substrates compared to control. In particular, the areas containing exposed -OH and O−free of Li+, proved a recurring property in both. This property was shared by the substrates subjectedto NaOH treatment.
The NaOH pretreatment increased surface-Na+ while reducing surface-Li+, reducing the surfaceacidity while increasing O− and -OH on the surface area. The combination of amorphous structures,loss of periodicity in the spatial distribution of carbohydrates, and the reduced surface-bounded Li+
together with the very large amounts of O− and -OH sites were possibly good factors to developproductive E S complexes [10], because the strong increase in saccharification compared to otherpretreatments and control.
131
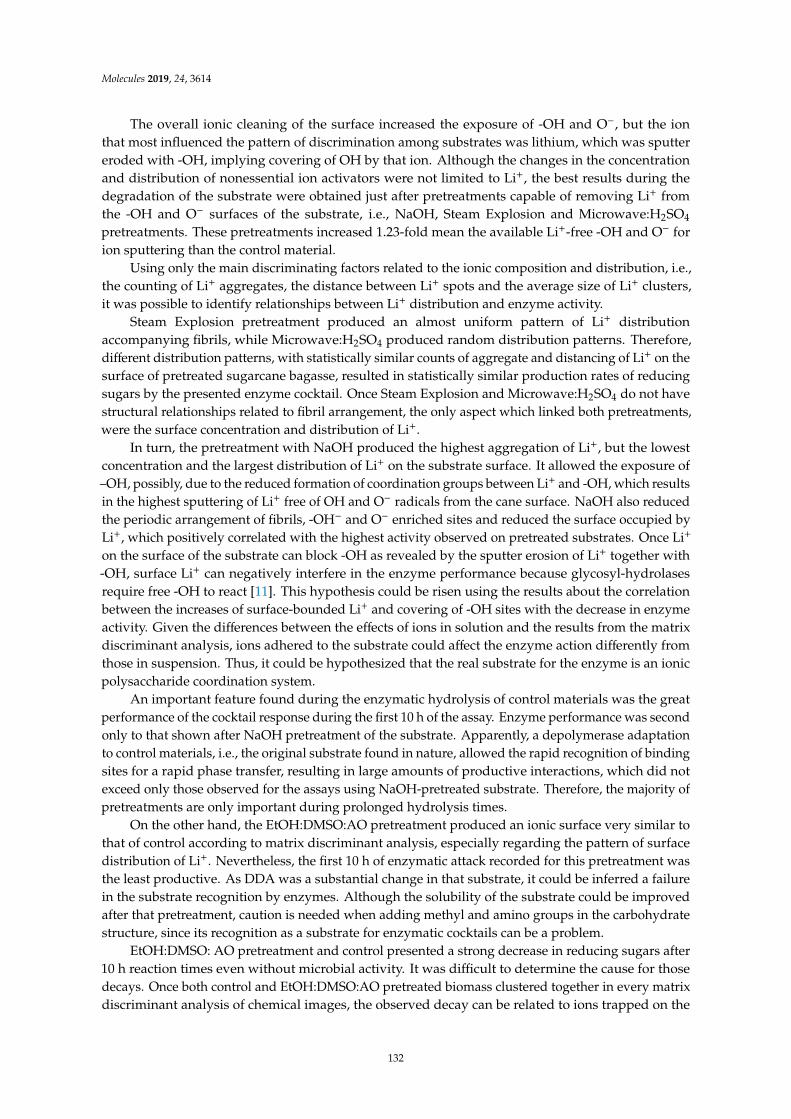
Molecules 2019, 24, 3614
The overall ionic cleaning of the surface increased the exposure of -OH and O−, but the ionthat most influenced the pattern of discrimination among substrates was lithium, which was sputtereroded with -OH, implying covering of OH by that ion. Although the changes in the concentrationand distribution of nonessential ion activators were not limited to Li+, the best results during thedegradation of the substrate were obtained just after pretreatments capable of removing Li+ fromthe -OH and O− surfaces of the substrate, i.e., NaOH, Steam Explosion and Microwave:H2SO4
pretreatments. These pretreatments increased 1.23-fold mean the available Li+-free -OH and O− forion sputtering than the control material.
Using only the main discriminating factors related to the ionic composition and distribution, i.e.,the counting of Li+ aggregates, the distance between Li+ spots and the average size of Li+ clusters,it was possible to identify relationships between Li+ distribution and enzyme activity.
Steam Explosion pretreatment produced an almost uniform pattern of Li+ distributionaccompanying fibrils, while Microwave:H2SO4 produced random distribution patterns. Therefore,different distribution patterns, with statistically similar counts of aggregate and distancing of Li+ on thesurface of pretreated sugarcane bagasse, resulted in statistically similar production rates of reducingsugars by the presented enzyme cocktail. Once Steam Explosion and Microwave:H2SO4 do not havestructural relationships related to fibril arrangement, the only aspect which linked both pretreatments,were the surface concentration and distribution of Li+.
In turn, the pretreatment with NaOH produced the highest aggregation of Li+, but the lowestconcentration and the largest distribution of Li+ on the substrate surface. It allowed the exposure of–OH, possibly, due to the reduced formation of coordination groups between Li+ and -OH, which resultsin the highest sputtering of Li+ free of OH and O− radicals from the cane surface. NaOH also reducedthe periodic arrangement of fibrils, -OH− and O− enriched sites and reduced the surface occupied byLi+, which positively correlated with the highest activity observed on pretreated substrates. Once Li+
on the surface of the substrate can block -OH as revealed by the sputter erosion of Li+ together with-OH, surface Li+ can negatively interfere in the enzyme performance because glycosyl-hydrolasesrequire free -OH to react [11]. This hypothesis could be risen using the results about the correlationbetween the increases of surface-bounded Li+ and covering of -OH sites with the decrease in enzymeactivity. Given the differences between the effects of ions in solution and the results from the matrixdiscriminant analysis, ions adhered to the substrate could affect the enzyme action differently fromthose in suspension. Thus, it could be hypothesized that the real substrate for the enzyme is an ionicpolysaccharide coordination system.
An important feature found during the enzymatic hydrolysis of control materials was the greatperformance of the cocktail response during the first 10 h of the assay. Enzyme performance was secondonly to that shown after NaOH pretreatment of the substrate. Apparently, a depolymerase adaptationto control materials, i.e., the original substrate found in nature, allowed the rapid recognition of bindingsites for a rapid phase transfer, resulting in large amounts of productive interactions, which did notexceed only those observed for the assays using NaOH-pretreated substrate. Therefore, the majority ofpretreatments are only important during prolonged hydrolysis times.
On the other hand, the EtOH:DMSO:AO pretreatment produced an ionic surface very similar tothat of control according to matrix discriminant analysis, especially regarding the pattern of surfacedistribution of Li+. Nevertheless, the first 10 h of enzymatic attack recorded for this pretreatment wasthe least productive. As DDA was a substantial change in that substrate, it could be inferred a failurein the substrate recognition by enzymes. Although the solubility of the substrate could be improvedafter that pretreatment, caution is needed when adding methyl and amino groups in the carbohydratestructure, since its recognition as a substrate for enzymatic cocktails can be a problem.
EtOH:DMSO: AO pretreatment and control presented a strong decrease in reducing sugars after10 h reaction times even without microbial activity. It was difficult to determine the cause for thosedecays. Once both control and EtOH:DMSO:AO pretreated biomass clustered together in every matrixdiscriminant analysis of chemical images, the observed decay can be related to ions trapped on the
132
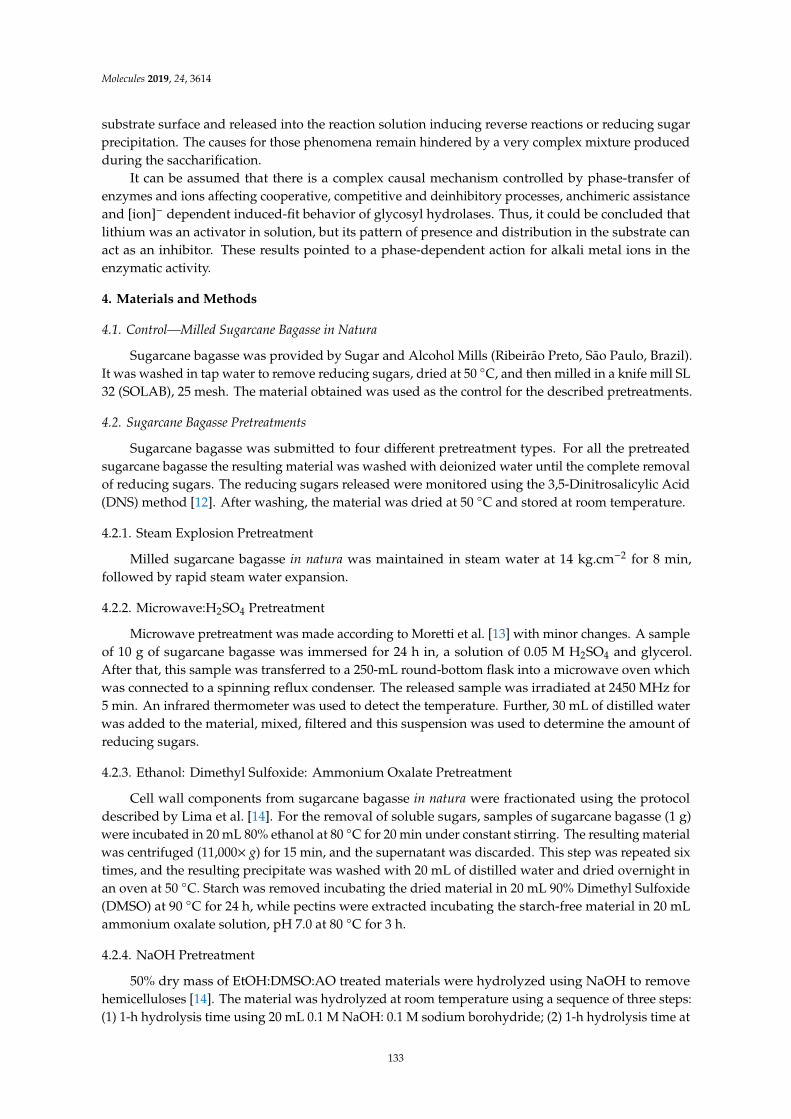
Molecules 2019, 24, 3614
substrate surface and released into the reaction solution inducing reverse reactions or reducing sugarprecipitation. The causes for those phenomena remain hindered by a very complex mixture producedduring the saccharification.
It can be assumed that there is a complex causal mechanism controlled by phase-transfer ofenzymes and ions affecting cooperative, competitive and deinhibitory processes, anchimeric assistanceand [ion]− dependent induced-fit behavior of glycosyl hydrolases. Thus, it could be concluded thatlithium was an activator in solution, but its pattern of presence and distribution in the substrate canact as an inhibitor. These results pointed to a phase-dependent action for alkali metal ions in theenzymatic activity.
4. Materials and Methods
4.1. Control—Milled Sugarcane Bagasse in Natura
Sugarcane bagasse was provided by Sugar and Alcohol Mills (Ribeirão Preto, São Paulo, Brazil).It was washed in tap water to remove reducing sugars, dried at 50 C, and then milled in a knife mill SL32 (SOLAB), 25 mesh. The material obtained was used as the control for the described pretreatments.
4.2. Sugarcane Bagasse Pretreatments
Sugarcane bagasse was submitted to four different pretreatment types. For all the pretreatedsugarcane bagasse the resulting material was washed with deionized water until the complete removalof reducing sugars. The reducing sugars released were monitored using the 3,5-Dinitrosalicylic Acid(DNS) method [12]. After washing, the material was dried at 50 C and stored at room temperature.
4.2.1. Steam Explosion Pretreatment
Milled sugarcane bagasse in natura was maintained in steam water at 14 kg.cm−2 for 8 min,followed by rapid steam water expansion.
4.2.2. Microwave:H2SO4 Pretreatment
Microwave pretreatment was made according to Moretti et al. [13] with minor changes. A sampleof 10 g of sugarcane bagasse was immersed for 24 h in, a solution of 0.05 M H2SO4 and glycerol.After that, this sample was transferred to a 250-mL round-bottom flask into a microwave oven whichwas connected to a spinning reflux condenser. The released sample was irradiated at 2450 MHz for5 min. An infrared thermometer was used to detect the temperature. Further, 30 mL of distilled waterwas added to the material, mixed, filtered and this suspension was used to determine the amount ofreducing sugars.
4.2.3. Ethanol: Dimethyl Sulfoxide: Ammonium Oxalate Pretreatment
Cell wall components from sugarcane bagasse in natura were fractionated using the protocoldescribed by Lima et al. [14]. For the removal of soluble sugars, samples of sugarcane bagasse (1 g)were incubated in 20 mL 80% ethanol at 80 C for 20 min under constant stirring. The resulting materialwas centrifuged (11,000× g) for 15 min, and the supernatant was discarded. This step was repeated sixtimes, and the resulting precipitate was washed with 20 mL of distilled water and dried overnight inan oven at 50 C. Starch was removed incubating the dried material in 20 mL 90% Dimethyl Sulfoxide(DMSO) at 90 C for 24 h, while pectins were extracted incubating the starch-free material in 20 mLammonium oxalate solution, pH 7.0 at 80 C for 3 h.
4.2.4. NaOH Pretreatment
50% dry mass of EtOH:DMSO:AO treated materials were hydrolyzed using NaOH to removehemicelluloses [14]. The material was hydrolyzed at room temperature using a sequence of three steps:(1) 1-h hydrolysis time using 20 mL 0.1 M NaOH: 0.1 M sodium borohydride; (2) 1-h hydrolysis time at
133
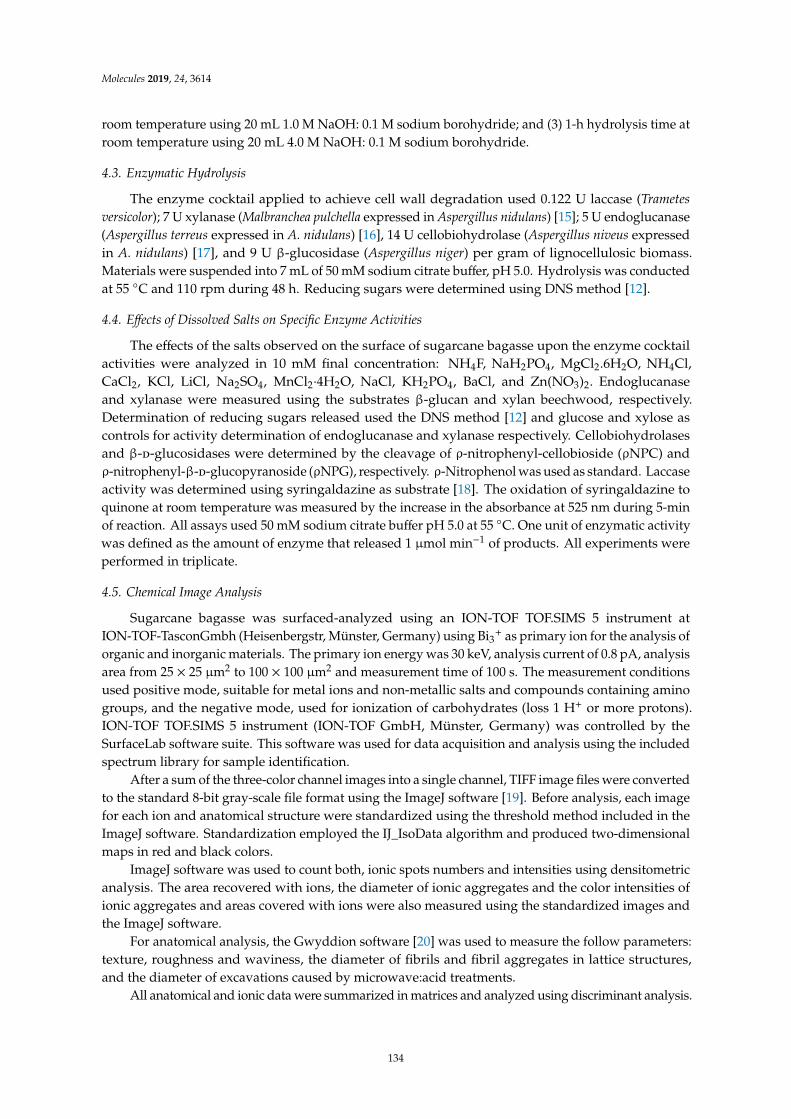
Molecules 2019, 24, 3614
room temperature using 20 mL 1.0 M NaOH: 0.1 M sodium borohydride; and (3) 1-h hydrolysis time atroom temperature using 20 mL 4.0 M NaOH: 0.1 M sodium borohydride.
4.3. Enzymatic Hydrolysis
The enzyme cocktail applied to achieve cell wall degradation used 0.122 U laccase (Trametesversicolor); 7 U xylanase (Malbranchea pulchella expressed in Aspergillus nidulans) [15]; 5 U endoglucanase(Aspergillus terreus expressed in A. nidulans) [16], 14 U cellobiohydrolase (Aspergillus niveus expressedin A. nidulans) [17], and 9 U β-glucosidase (Aspergillus niger) per gram of lignocellulosic biomass.Materials were suspended into 7 mL of 50 mM sodium citrate buffer, pH 5.0. Hydrolysis was conductedat 55 C and 110 rpm during 48 h. Reducing sugars were determined using DNS method [12].
4.4. Effects of Dissolved Salts on Specific Enzyme Activities
The effects of the salts observed on the surface of sugarcane bagasse upon the enzyme cocktailactivities were analyzed in 10 mM final concentration: NH4F, NaH2PO4, MgCl2.6H2O, NH4Cl,CaCl2, KCl, LiCl, Na2SO4, MnCl2·4H2O, NaCl, KH2PO4, BaCl, and Zn(NO3)2. Endoglucanaseand xylanase were measured using the substrates β-glucan and xylan beechwood, respectively.Determination of reducing sugars released used the DNS method [12] and glucose and xylose ascontrols for activity determination of endoglucanase and xylanase respectively. Cellobiohydrolasesand β-d-glucosidases were determined by the cleavage of ρ-nitrophenyl-cellobioside (ρNPC) andρ-nitrophenyl-β-d-glucopyranoside (ρNPG), respectively. ρ-Nitrophenol was used as standard. Laccaseactivity was determined using syringaldazine as substrate [18]. The oxidation of syringaldazine toquinone at room temperature was measured by the increase in the absorbance at 525 nm during 5-minof reaction. All assays used 50 mM sodium citrate buffer pH 5.0 at 55 C. One unit of enzymatic activitywas defined as the amount of enzyme that released 1 µmol min−1 of products. All experiments wereperformed in triplicate.
4.5. Chemical Image Analysis
Sugarcane bagasse was surfaced-analyzed using an ION-TOF TOF.SIMS 5 instrument atION-TOF-TasconGmbh (Heisenbergstr, Münster, Germany) using Bi3+ as primary ion for the analysis oforganic and inorganic materials. The primary ion energy was 30 keV, analysis current of 0.8 pA, analysisarea from 25 × 25 µm2 to 100 × 100 µm2 and measurement time of 100 s. The measurement conditionsused positive mode, suitable for metal ions and non-metallic salts and compounds containing aminogroups, and the negative mode, used for ionization of carbohydrates (loss 1 H+ or more protons).ION-TOF TOF.SIMS 5 instrument (ION-TOF GmbH, Münster, Germany) was controlled by theSurfaceLab software suite. This software was used for data acquisition and analysis using the includedspectrum library for sample identification.
After a sum of the three-color channel images into a single channel, TIFF image files were convertedto the standard 8-bit gray-scale file format using the ImageJ software [19]. Before analysis, each imagefor each ion and anatomical structure were standardized using the threshold method included in theImageJ software. Standardization employed the IJ_IsoData algorithm and produced two-dimensionalmaps in red and black colors.
ImageJ software was used to count both, ionic spots numbers and intensities using densitometricanalysis. The area recovered with ions, the diameter of ionic aggregates and the color intensities ofionic aggregates and areas covered with ions were also measured using the standardized images andthe ImageJ software.
For anatomical analysis, the Gwyddion software [20] was used to measure the follow parameters:texture, roughness and waviness, the diameter of fibrils and fibril aggregates in lattice structures,and the diameter of excavations caused by microwave:acid treatments.
All anatomical and ionic data were summarized in matrices and analyzed using discriminant analysis.
134
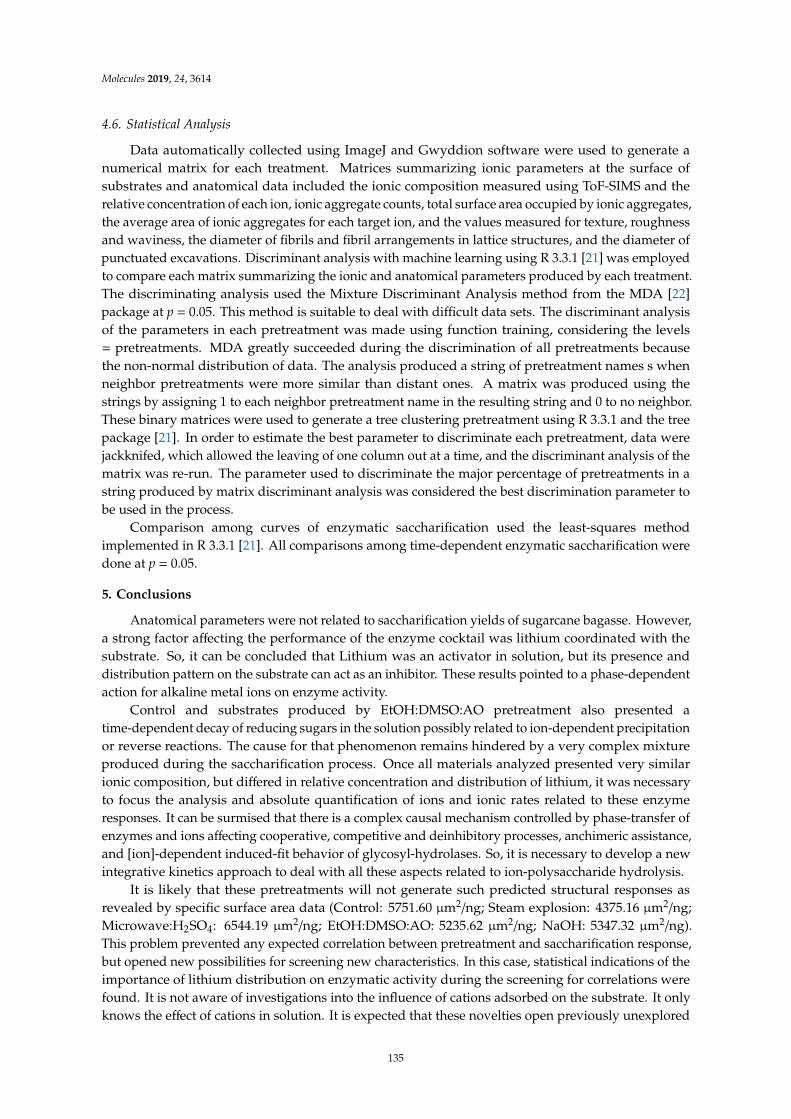
Molecules 2019, 24, 3614
4.6. Statistical Analysis
Data automatically collected using ImageJ and Gwyddion software were used to generate anumerical matrix for each treatment. Matrices summarizing ionic parameters at the surface ofsubstrates and anatomical data included the ionic composition measured using ToF-SIMS and therelative concentration of each ion, ionic aggregate counts, total surface area occupied by ionic aggregates,the average area of ionic aggregates for each target ion, and the values measured for texture, roughnessand waviness, the diameter of fibrils and fibril arrangements in lattice structures, and the diameter ofpunctuated excavations. Discriminant analysis with machine learning using R 3.3.1 [21] was employedto compare each matrix summarizing the ionic and anatomical parameters produced by each treatment.The discriminating analysis used the Mixture Discriminant Analysis method from the MDA [22]package at p = 0.05. This method is suitable to deal with difficult data sets. The discriminant analysisof the parameters in each pretreatment was made using function training, considering the levels= pretreatments. MDA greatly succeeded during the discrimination of all pretreatments becausethe non-normal distribution of data. The analysis produced a string of pretreatment names s whenneighbor pretreatments were more similar than distant ones. A matrix was produced using thestrings by assigning 1 to each neighbor pretreatment name in the resulting string and 0 to no neighbor.These binary matrices were used to generate a tree clustering pretreatment using R 3.3.1 and the treepackage [21]. In order to estimate the best parameter to discriminate each pretreatment, data werejackknifed, which allowed the leaving of one column out at a time, and the discriminant analysis of thematrix was re-run. The parameter used to discriminate the major percentage of pretreatments in astring produced by matrix discriminant analysis was considered the best discrimination parameter tobe used in the process.
Comparison among curves of enzymatic saccharification used the least-squares methodimplemented in R 3.3.1 [21]. All comparisons among time-dependent enzymatic saccharification weredone at p = 0.05.
5. Conclusions
Anatomical parameters were not related to saccharification yields of sugarcane bagasse. However,a strong factor affecting the performance of the enzyme cocktail was lithium coordinated with thesubstrate. So, it can be concluded that Lithium was an activator in solution, but its presence anddistribution pattern on the substrate can act as an inhibitor. These results pointed to a phase-dependentaction for alkaline metal ions on enzyme activity.
Control and substrates produced by EtOH:DMSO:AO pretreatment also presented atime-dependent decay of reducing sugars in the solution possibly related to ion-dependent precipitationor reverse reactions. The cause for that phenomenon remains hindered by a very complex mixtureproduced during the saccharification process. Once all materials analyzed presented very similarionic composition, but differed in relative concentration and distribution of lithium, it was necessaryto focus the analysis and absolute quantification of ions and ionic rates related to these enzymeresponses. It can be surmised that there is a complex causal mechanism controlled by phase-transfer ofenzymes and ions affecting cooperative, competitive and deinhibitory processes, anchimeric assistance,and [ion]-dependent induced-fit behavior of glycosyl-hydrolases. So, it is necessary to develop a newintegrative kinetics approach to deal with all these aspects related to ion-polysaccharide hydrolysis.
It is likely that these pretreatments will not generate such predicted structural responses asrevealed by specific surface area data (Control: 5751.60 µm2/ng; Steam explosion: 4375.16 µm2/ng;Microwave:H2SO4: 6544.19 µm2/ng; EtOH:DMSO:AO: 5235.62 µm2/ng; NaOH: 5347.32 µm2/ng).This problem prevented any expected correlation between pretreatment and saccharification response,but opened new possibilities for screening new characteristics. In this case, statistical indications of theimportance of lithium distribution on enzymatic activity during the screening for correlations werefound. It is not aware of investigations into the influence of cations adsorbed on the substrate. It onlyknows the effect of cations in solution. It is expected that these novelties open previously unexplored
135
Molecules 2019, 24, 3614
paths for the study of the influence of complexed or adsorbed cations on enzymatic activity assays,contributing to the development of more efficient enzymatic cocktails.
Author Contributions: A.S.d.A.S. conducted Ethanol:Dimethyl Sulfoxide:Ammonium Oxalate (EtOH:DMSO:AO)and NaOH pretreatments, saccharification and collaborated at redaction. A.F.S. analyzed, interpreted data andcollaborated at redaction. C.d.C.C.N. and E.G. conducted the Microwave:H2SO4 pretreatment. A.C.V. contributedto design the study and revised the manuscript. M.S.B. and M.d.L.T.d.M.P. contributed to design the study,analyzed data and revised the manuscript. All authors read and approved the final manuscript.
Funding: This work was supported by the National Institute of Science and Technology of Bioetanol (Fundaçãode Amparo à Pesquisa do Estado de São Paulo, FAPESP, process nº 2008/57908-6 and 2014/50884-5) and Conselhode Desenvolvimento Científico e Tecnológico (CNPq, process 465319/2014-9).
Acknowledgments: Coordenação de Aperfeiçoamento de Pessoal de Nível Superior - Brasil (CAPES – FinanceCode 001); Fundação de Amparo à Pesquisa do Estado de São Paulo (FAPESP processes 2010/12624-0;2013/23385-5).Figures corresponding to 1A, B were obtained from TOF.SIMS 5 - 100 instrument operation.We thank Dr. Reinhard Kersting and Dr. Adam Sears at TASCON GmbH, Münster, Germany, and Fellipy Ferreira,at dp UNION Instrumentação Analítica e Científica Ltd.a., São Paulo, Brazil for the efforts. We thank AbilioBorghi for the technical assistance with the English language and Ricardo Alarcon, Mariana Cereia and Mauriciode Oliveira for technical assistance.
Conflicts of Interest: The authors declare no conflict of interest.
References
1. UNICA. Avaliação Quinzenal da Safra 2018/2019 da Região Centro-Sul. 2018. Available online: http://www.unica.com.br/documentos/documentos/ (accessed on 15 December 2018).
2. Rossetto, R.; Santiago, A.D. Cana-De-Açúcar. Available online: http://www.agencia.cnptia.embrapa.br/gestor/cana-de-acucar/arvore/CONTAG01_1_711200516715.html (accessed on 15 December 2018).
3. Mohanram, S.; Amat, D.; Choudhary, J.; Arora, A.; Nain, L. Novel perspectives for evolving enzyme cocktailsfor lignocellulose hydrolysis in biorefineries. Sustan. Chem. Process. 2013, 1, 1–15. [CrossRef]
4. Goldbeck, R.; Damásio, A.R.L.; Gonçalves, T.A.; Machado, C.B.; Paixão, D.A.A.; Wolf, L.D.; Mandelli, F.;Rocha, G.J.M.; Ruller, R.; Squina, F.M. Development of hemicellulolytic enzyme mixtures for plant biomassdeconstruction on target biotechnological applications. Appl. Microbiol. Biotechnol. 2014, 98, 8513–8525.[CrossRef] [PubMed]
5. Buckeridge, M.S.; Grandis, A.; Tavares, E.Q. Disassembling the Glycomic Code of Sugarcane Cell Walls toImprove Second-Generation Bioethanol Production. In Bioethanol Production from Food Crops; Elsevier BV:Amsterdam, The Netherlands, 2019; pp. 31–43.
6. Van Dyk, J.; Pletschke, B.; Pletschke, B. A review of lignocellulose bioconversion using enzymatichydrolysis and synergistic cooperation between enzymes—Factors affecting enzymes, conversion andsynergy. Biotechnol. Adv. 2012, 30, 1458–1480. [CrossRef] [PubMed]
7. Mou, H.Y.; Wu, S.; Fardim, P. Applications of ToF-SIMS in surface chemistry analysis of lignocellulosicbiomass: A review. BioResources 2016, 11, 5581–5599.
8. Purich, D.L. Enzyme Kinetics: Catalysis & Control: A reference of theory and best-practice methods, 1st ed.; Elsevier:London, UK, 2010; pp. 1–920.
9. Segel, I.H. Enzyme Kinetics: Behavior and Analysis of Rapid Equilibrium and Steady-State Enzyme Systems, 1st ed.;John Wiley & Sons INC: New York, NY, USA, 1993; pp. 1–957.
10. Shoseyov, O.; Shani, Z.; Levy, I. Carbohydrate Binding Modules: Biochemical Properties and NovelApplications. Microbiol. Mol. Boil. Rev. 2006, 70, 283–295. [CrossRef] [PubMed]
11. De Vries, R.P.; Visser, J. Aspergillus Enzymes Involved in Degradation of Plant Cell Wall Polysaccharides.Microbiol. Mol. Boil. Rev. 2001, 65, 497–522. [CrossRef] [PubMed]
12. Miller, G.L. Use of Dinitrosalicylic Acid Reagent for Determination of Reducing Sugar. Anal. Chem. 1959, 31,426–428. [CrossRef]
13. Moretti, M.M.D.S.; Bocchini-Martins, D.A.; Nunes, C.D.C.C.; Villena, M.A.; Perrone, O.M.; Da Silva, R.;Boscolo, M.; Gomes, E. Pretreatment of sugarcane bagasse with microwaves irradiation and its effects on thestructure and on enzymatic hydrolysis. Appl. Energy 2014, 122, 189–195. [CrossRef]
136
Molecules 2019, 24, 3614
14. Lima, M.S.; Damasio, A.R.D.L.; Crnkovic, P.M.; Pinto, M.R.; Da Silva, A.M.; Da Silva, J.C.R.; Segato, F.;De Lucas, R.C.; Jorge, J.A.; Polizeli, M.D.L.T.D.M. Co-cultivation of Aspergillus nidulans RecombinantStrains Produces an Enzymatic Cocktail as Alternative to Alkaline Sugarcane Bagasse Pretreatment. Front.Microbiol. 2016, 7, 583. [CrossRef] [PubMed]
15. Ribeiro, L.F.; De Lucas, R.C.; Vitcosque, G.L.; Ribeiro, L.F.; Ward, R.J.; Rubio, M.V.; Damásio, A.R.;Squina, F.M.; Gregory, R.C.; Walton, P.H.; et al. A novel thermostable xylanase GH10 from Malbrancheapulchella expressed in Aspergillus nidulans with potential applications in biotechnology. Biotechnol. Biofuels2014, 7, 115. [CrossRef] [PubMed]
16. Segato, F.; Berto, G.L.; De Araújo, E.A.; Muniz, J.R.; Polikarpov, I. Expression, purification, crystallization andpreliminary X-ray diffraction analysis of Aspergillus terreus endo-β-1,4-glucanase from glycoside hydrolasefamily 12. Acta Crystallogr. Sect. F Struct. Boil. Commun. 2014, 70, 267–270. [CrossRef] [PubMed]
17. Segato, F.; Damasio, A.R.L.; Gonçalves, T.A.; Murakami, M.T.; Squina, F.M.; Polizeli, M.; Mort, A.J.; Prade, R.A.Two structurally discrete GH7-cellobiohydrolases compete for the same cellulosic substrate fiber. Biotechnol.Biofuels 2012, 5, 21. [CrossRef] [PubMed]
18. Szklarz, G.D.; Antibus, R.K.; Sinsabaugh, R.L.; Linkins, A.E. Production of Phenol Oxidases and Peroxidasesby Wood-Rotting Fungi. Mycologia 1989, 81, 234–240. [CrossRef]
19. Schneider, C.A.; Rasband, W.S.; Eliceiri, K.W. NIH Image to ImageJ: 25 years of Image Analysis. Nat. Methods2012, 9, 671–675. [CrossRef] [PubMed]
20. Necas, D.; Klapetek, P. Gwyddion: An open-source software for SPM data analysis. Open Phys. 2012, 10,181–188. [CrossRef]
21. RC Team. R: A Language and Environment for Statistical Computing; R Foundation for Statistical Computing:Vienna, Austria, 2008; Available online: https://www.R-project.org/ (accessed on 15 November 2018).
22. Leisch, F.; Hornik, K.; Ripley, B.D. mda: Mixture and Flexible Discriminant Analysis; R Package Version 0.4-9;Trevor Hastie & Robert Tibshirani: Stanford, CA, USA, 2016.
Sample Availability: Not available.
© 2019 by the authors. Licensee MDPI, Basel, Switzerland. This article is an open accessarticle distributed under the terms and conditions of the Creative Commons Attribution(CC BY) license (http://creativecommons.org/licenses/by/4.0/).
137

molecules
Article
Steam Explosion Conditions Highly Influence theBiogas Yield of Rice Straw
David Steinbach 1,2,* , Dominik Wüst 1, Simon Zielonka 3, Johannes Krümpel 3,Simon Munder 1 , Matthias Pagel 2 and Andrea Kruse 1
1 Institute of Agricultural Engineering, University of Hohenheim, Garbenstrasse 9, 70599 Stuttgart, Germany;[email protected] (D.W.); [email protected] (S.M.);[email protected] (A.K.)
2 Karlsruhe Institute of Technology (KIT), Institute for Catalysis Research and Technology,Hermann-von-Helmholtz-Platz 1, 76344 Eggenstein-Leopoldshafen, Germany; [email protected]
3 State Institute of Agricultural Engineering and Bioenergy, University of Hohenheim, Garbenstrasse 9,70599 Stuttgart, Germany; [email protected] (S.Z.); [email protected] (J.K.)
* Correspondence: [email protected]; Tel.: +49-7121-989724
Academic Editors: Ivet Ferrer, Cigdem Eskicioglu, Georgia Antonopoulou andAudrey BattimelliReceived: 1 September 2019; Accepted: 24 September 2019; Published: 26 September 2019
Abstract: Straws are agricultural residues that can be used to produce biomethane by anaerobicdigestion. The methane yield of rice straw is lower than other straws. Steam explosion wasinvestigated as a pretreatment to increase methane production. Pretreatment conditions with varyingreaction times (12–30 min) and maximum temperatures (162–240 C) were applied. The pretreatedmaterial was characterized for its composition and thermal and morphological properties. When thesteam explosion was performed with a moderate severity parameter of S0 = 4.1 min, the methaneyield was increased by 32% compared to untreated rice straw. This study shows that a harsherpretreatment at S0 > 4.3 min causes a drastic reduction of methane yield because inert condensationproducts are formed from hemicelluloses.
Keywords: steam treatment; pretreatment; lignocellulose; anaerobic digestion; biochemical methanepotential; biomethane
1. Introduction
Rice straw is one of the most abundant lignocellulosic agricultural residues worldwide andis produced mostly in Asia as a byproduct of rice production. Rice was in the third place of cropproduction in 2013 with a world annual production of 746 million tons [1]. The production of ricestraw as a byproduct can be estimated at about 1120 million tons using a straw-to-grain ratio of 1.5 [2].A part of this agricultural residue is used, for example, as cattle feed [3]. Unfortunately, open-fieldburning of straw, which increases air pollution, is a common practice in Asia [4–6].
Possible energetic utilization of rice straw is limited by its low bulk density, which makeslarge-scale, centralized conversion technologies uneconomical. Therefore, decentralized conversionrouts are of special interest. One such method is anaerobic digestion of lignocellulosic biomass, whichis a most efficient conversion technology regarding the energy output-to-input ratio [7–9].
However, the structure of lignocellulosic biomass generally causes a low digestibility duringanaerobic digestion because lignocellulose is a strongly connected composite of cellulose, hemicelluloses,and lignin. Cellulose is a linear polymer consisting of glucose building blocks linked together byglycosidic bonds. The intermolecular hydrogen bonds between adjacent cellulose chains result in ahighly ordered, water-insoluble configuration that makes cellulose crystalline [10]. Hemicelluloses are
139
Molecules 2019, 24, 3492
a group of amorphous heteropolymers that are significantly shorter than cellulose macromolecules.They are fixed in the lignocellulosic fiber structure because they provide a linkage between ligninand cellulose. Hemicelluloses are connected to lignin via covalent links and surround cellulose.Lignin is a complex, three-dimensional macromolecule constructed of phenylpropane units and isnon-biodegradable via anaerobic digestion [8].
Hydrolysis is the rate-limiting step in the biogas process when a solid feedstock, such aslignocellulose, is used [8]. A pretreatment is required to increase the availability of cellulose andhemicellulose for the hydrolysis step. Pretreatment generally aims at the disintegration and separationof biomass to release the different components [11]. A variety of pretreatment methods have been underinvestigation for enhancing the biogas production of lignocellulose [9,12,13]. Among these methods,steam pretreatment was rated with a high potential [12]. It is a relatively inexpensive pretreatment asit does not require the addition of an external catalyst [14]. Also, it has energetic advantages because itcan be carried out with approximately 1.5 kg of steam per kilogram of biomass, compared to 5–10 kgof hot water usually required for liquid phase pretreatments [15].
Steam explosion converts biomass at elevated pressures and temperatures in a steam atmosphere,followed by mechanical disruption of the biomass by discharging to atmospheric pressure. Steamhydrolysis is similar to the steam explosion process, except that it avoids the discharge of rapidpressure. Temperatures ranging from 140–240 C have been applied over a wide range of residencetimes [16]. Ferreira et al. [17] named an optimum for steam explosion conditions of 150–220 C and5–20 min. They pointed out that pretreatment conditions that are too severe are unfavorable due tothe formation of phenolic and heterocyclic compounds (e.g., furfural, hydroxymethylfurfural (HMF),and soluble phenolic compounds). These compounds could inhibit methane production, but themethane-producing microorganisms are, however, capable of adapting to such compounds at smallerconcentrations [12].
Thermally labile acetyl groups in hemicelluloses are cleaved during steam explosion, and aceticacid is formed [11]. The liberated organic acids catalyze hydrolysis reactions of hemicelluloses anddegradation reactions of a small part of lignin. The residue after steam explosion consists of cellulose,a chemically modified lignin, and residual hemicelluloses. The sum of hemicelluloses in the residue,as well as dissolved hemicellulose-derived sugars, declines with the severity of the pretreatmentbecause of (1) furfural formation by dehydration of pentoses and (2) secondary reactions of dissolvedcompounds leading to solid pseudolignin by condensation reactions [18].
Steam explosion has been performed with various kinds of lignocellulosic biomasses prior toanaerobic digestion including triticale [19], corn [20], wheat straw [17,21–26], hay [27], sugarcanebagasse [28,29], sugarcane straw [29], rape straw [30], bulrush [31,32], miscanthus [33], birch [34],willow [35,36], and cedar [37]. Steam explosion of rice straw for anaerobic digestion was investigatedin the study of Zhou et al. [38] who performed steam explosion under narrower parameter conditions(200–220 C, 1–4 min) and focused on the microbial communities during anaerobic digestion. Otherstudies have focused on steam explosion of rice straw as pretreatment for enzymatic hydrolysis toobtain fermentable sugars [39–41].
The steam explosion pretreatment generally increases the specific methane yields while alsoincreasing the speed of anaerobic degradation. However, the reported increase in methane yield rangedfrom 0%–5% [22,23] to 10%–30% [17,19–21,24,26–30,32] and up to 50%–345% [29,33,34,36–38] becauseof the differences in (1) steam explosion reactor setups and reaction conditions, (2) lignocellulosicplants species and (3) digestion procedures.
The aim of this work was to evaluate the influence of a previous steam explosion in a batch systemon the anaerobic digestion of rice straw. Therefore, the steam explosion of rice straw was performed atdifferent severities. The pretreated material was chemically characterized and, thereafter, subjected tobatch anaerobic digestion tests to determine the methane yield.
140
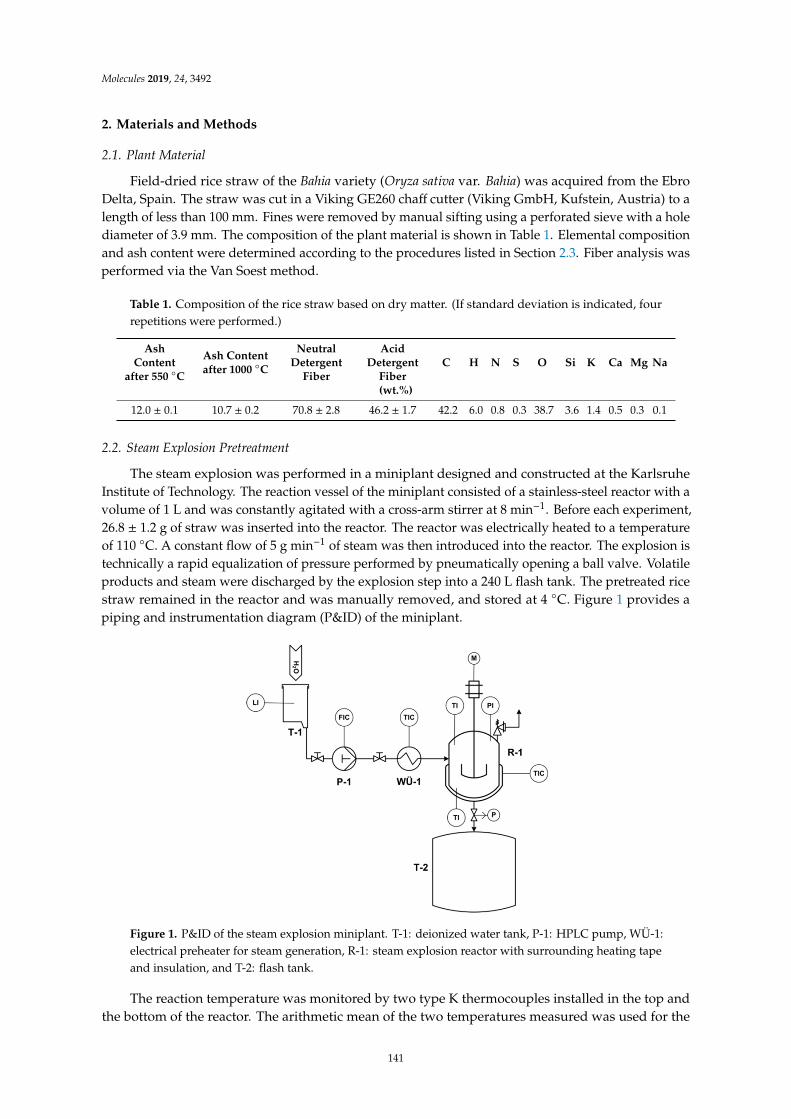
Molecules 2019, 24, 3492
2. Materials and Methods
2.1. Plant Material
Field-dried rice straw of the Bahia variety (Oryza sativa var. Bahia) was acquired from the EbroDelta, Spain. The straw was cut in a Viking GE260 chaff cutter (Viking GmbH, Kufstein, Austria) to alength of less than 100 mm. Fines were removed by manual sifting using a perforated sieve with a holediameter of 3.9 mm. The composition of the plant material is shown in Table 1. Elemental compositionand ash content were determined according to the procedures listed in Section 2.3. Fiber analysis wasperformed via the Van Soest method.
Table 1. Composition of the rice straw based on dry matter. (If standard deviation is indicated, fourrepetitions were performed.)
AshContent
after 550 C
Ash Contentafter 1000 C
NeutralDetergent
Fiber
AcidDetergent
FiberC H N S O Si K Ca Mg Na
(wt.%)
12.0 ± 0.1 10.7 ± 0.2 70.8 ± 2.8 46.2 ± 1.7 42.2 6.0 0.8 0.3 38.7 3.6 1.4 0.5 0.3 0.1
2.2. Steam Explosion Pretreatment
The steam explosion was performed in a miniplant designed and constructed at the KarlsruheInstitute of Technology. The reaction vessel of the miniplant consisted of a stainless-steel reactor with avolume of 1 L and was constantly agitated with a cross-arm stirrer at 8 min−1. Before each experiment,26.8 ± 1.2 g of straw was inserted into the reactor. The reactor was electrically heated to a temperatureof 110 C. A constant flow of 5 g min−1 of steam was then introduced into the reactor. The explosion istechnically a rapid equalization of pressure performed by pneumatically opening a ball valve. Volatileproducts and steam were discharged by the explosion step into a 240 L flash tank. The pretreated ricestraw remained in the reactor and was manually removed, and stored at 4 C. Figure 1 provides apiping and instrumentation diagram (P&ID) of the miniplant.
Molecules 2019, 24, x 3 of 14
Field-dried rice straw of the Bahia variety (Oryza sativa var. Bahia) was acquired from the Ebro Delta, Spain. The straw was cut in a Viking GE260 chaff cutter (Viking GmbH, Kufstein, Austria) to a length of less than 100 mm. Fines were removed by manual sifting using a perforated sieve with a hole diameter of 3.9 mm. The composition of the plant material is shown in Table 1. Elemental composition and ash content were determined according to the procedures listed in Section 2.3. Fiber analysis was performed via the Van Soest method.
Table 1. Composition of the rice straw based on dry matter. (If standard deviation is indicated, four repetitions were performed.)
Ash content after 550
°C
Ash content
after 1000 °C
Neutral detergent
fiber
Acid detergent
fiber C H N S O Si K Ca Mg Na
(wt.%) 12.0 ± 0.1 10.7 ± 0.2 70.8 ± 2.8 46.2 ± 1.7 42.2 6.0 0.8 0.3 38.7 3.6 1.4 0.5 0.3 0.1
2.2. Steam Explosion Pretreatment
The steam explosion was performed in a miniplant designed and constructed at the Karlsruhe Institute of Technology. The reaction vessel of the miniplant consisted of a stainless-steel reactor with a volume of 1 L and was constantly agitated with a cross-arm stirrer at 8 min−1. Before each experiment, 26.8 ± 1.2 g of straw was inserted into the reactor. The reactor was electrically heated to a temperature of 110 °C. A constant flow of 5 g min−1 of steam was then introduced into the reactor. The explosion is technically a rapid equalization of pressure performed by pneumatically opening a ball valve. Volatile products and steam were discharged by the explosion step into a 240 L flash tank. The pretreated rice straw remained in the reactor and was manually removed, and stored at 4 °C. Figure 1 provides a piping and instrumentation diagram (P&ID) of the miniplant.
Figure 1. P&ID of the steam explosion miniplant. T-1: deionized water tank, P-1: HPLC pump, WÜ-1: electrical preheater for steam generation, R-1: steam explosion reactor with surrounding heating tape and insulation, and T-2: flash tank.
The reaction temperature was monitored by two type K thermocouples installed in the top and the bottom of the reactor. The arithmetic mean of the two temperatures measured was used for the calculation of the severity parameter S0, combining time t and temperature T of the steam pretreatment in a single factor [18]. Equation 1 describes the time integral of S0, which was used to describe the non-isothermal character of the heating process [42].
Figure 1. P&ID of the steam explosion miniplant. T-1: deionized water tank, P-1: HPLC pump, WÜ-1:electrical preheater for steam generation, R-1: steam explosion reactor with surrounding heating tapeand insulation, and T-2: flash tank.
The reaction temperature was monitored by two type K thermocouples installed in the top andthe bottom of the reactor. The arithmetic mean of the two temperatures measured was used for the
141
Molecules 2019, 24, 3492
calculation of the severity parameter S0, combining time t and temperature T of the steam pretreatmentin a single factor [18]. Equation 1 describes the time integral of S0, which was used to describe thenon-isothermal character of the heating process [42].
S0 = log
t∫
0
exp(
T [C] − 100 C14.75
)dt (1)
Different pretreatment conditions with varying steam input times (12–30 min), steam input masses(60–150 g), and maximum temperatures (162–240 C) were tested. Table 2 provides an overview of theexperimental setup. The temperature profile during heat up is shown in the Supplementary Materials.
Table 2. Experimental setup for steam explosion of 27 g chipped rice straw.
Severity Parameter S0 (min) 3.05 3.54 4.10 4.20 4.32 4.48 5.29
Steam input time (min) 30 30 30 16 12 30 32Steam input mass (g) 150 150 150 78 60 150 60
Maximum reactor temperature (C) 1 162 174 206 222 229 222 240Maximum pressure (bar) 1 6.5 9.0 18.5 25.0 29.0 26.0 26.5
1 before explosion step (C)
2.3. Chemical Analysis of Untreated Rice Straw and Steam-Exploded Residue
The dry matter content of the untreated material was determined in triplicate by drying the ricestraw at 105 C for 16 h based on DIN EN 14774-1. The steam-exploded residue was dried at 40 C for87 h until its weight balanced to reduce evaporation of easily volatile reaction products of the steamexplosion. The ash content of the untreated material was determined in triplicate via incinerationin an electrically heated muffle oven at 550 C for 4 h based on DIN EN 14775. The ash content ofsteam-exploded residues was measured in single runs. The organic dry matter content, which is alsocalled volatile solids, was calculated from the difference between dry matter and ash content.
The stoichiometric carbon, hydrogen, nitrogen, and sulfur content (CHNS) was analyzedchromatically in a Vario EL cube (Elementar Analysesysteme GmbH, Langenselbold, Germany).The milled and dried samples of untreated straw and steam-exploded residue were analyzed intriplicate for CHNS. Sample milling to powder was performed in a freezer mill. The oxygen content ofrice straw was estimated, closing the gap between CHNS and ash content to 100 wt.%. Other elementsin the rice straw were analyzed after quantitative dissolution (HNO3, HCl, HF 6:2:1 v v−1) by ICP-OEStype 725 (Agilent, Santa Clara, CA, USA).
Thermogravimetric analysis was performed with milled and dried samples in single runs ata STA 449 F5 (Netzsch-Gerätebau GmbH, Selb, Germany) with a heating rate of 10 K min−1 andnitrogen as the inerting agent. The thermogram obtained was differentiated to obtain the differentialthermogravimetry curve (DTG).
The surface structures of dried untreated straw and steam-exploded residue were investigated viascanning electron microscopy (SEM) in a LEO 982 Gemini (Carl Zeiss AG, Jena, Germany) equippedwith a Schottky-type thermal field emission cathode, secondary electron detectors (Everhart-Thornley,inlens), and a backscattered electron detector.
The acid-insoluble lignin content (Klason lignin) and acid-insoluble ash content were determinedvia an “ASTM protocol” [43] in triplicate for the untreated straw and in single runs for thesteam-exploded residues.
Water-soluble components of rice straw and steam-exploded residues were extracted with hotwater. Therefore, about 0.9 g milled and dried sample was introduced in an extraction thimble, whichwas placed in a boiling water bath for 3 h. Water extraction was performed in triplicate for untreatedstraw and in single runs for steam-exploded residues. After extraction, the liquid was analyzedvia HPLC (Deutsche Metrohm GmbH, Filderstadt, Germany). Glucose and xylose were separated
142
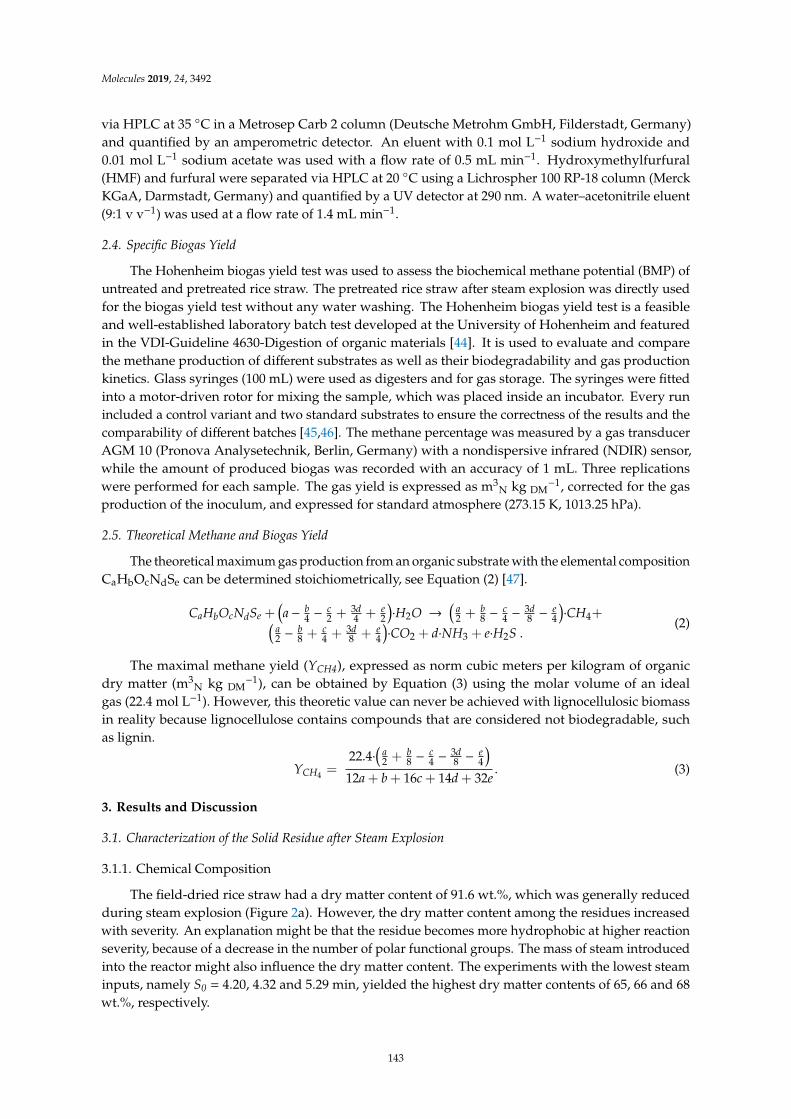
Molecules 2019, 24, 3492
via HPLC at 35 C in a Metrosep Carb 2 column (Deutsche Metrohm GmbH, Filderstadt, Germany)and quantified by an amperometric detector. An eluent with 0.1 mol L−1 sodium hydroxide and0.01 mol L−1 sodium acetate was used with a flow rate of 0.5 mL min−1. Hydroxymethylfurfural(HMF) and furfural were separated via HPLC at 20 C using a Lichrospher 100 RP-18 column (MerckKGaA, Darmstadt, Germany) and quantified by a UV detector at 290 nm. A water–acetonitrile eluent(9:1 v v−1) was used at a flow rate of 1.4 mL min−1.
2.4. Specific Biogas Yield
The Hohenheim biogas yield test was used to assess the biochemical methane potential (BMP) ofuntreated and pretreated rice straw. The pretreated rice straw after steam explosion was directly usedfor the biogas yield test without any water washing. The Hohenheim biogas yield test is a feasibleand well-established laboratory batch test developed at the University of Hohenheim and featuredin the VDI-Guideline 4630-Digestion of organic materials [44]. It is used to evaluate and comparethe methane production of different substrates as well as their biodegradability and gas productionkinetics. Glass syringes (100 mL) were used as digesters and for gas storage. The syringes were fittedinto a motor-driven rotor for mixing the sample, which was placed inside an incubator. Every runincluded a control variant and two standard substrates to ensure the correctness of the results and thecomparability of different batches [45,46]. The methane percentage was measured by a gas transducerAGM 10 (Pronova Analysetechnik, Berlin, Germany) with a nondispersive infrared (NDIR) sensor,while the amount of produced biogas was recorded with an accuracy of 1 mL. Three replicationswere performed for each sample. The gas yield is expressed as m3
N kg DM−1, corrected for the gas
production of the inoculum, and expressed for standard atmosphere (273.15 K, 1013.25 hPa).
2.5. Theoretical Methane and Biogas Yield
The theoretical maximum gas production from an organic substrate with the elemental compositionCaHbOcNdSe can be determined stoichiometrically, see Equation (2) [47].
CaHbOcNdSe +(a− b
4 − c2 + 3d
4 + e2
)·H2O →
(a2 + b
8 − c4 − 3d
8 − e4
)·CH4+(
a2 − b
8 + c4 + 3d
8 + e4
)·CO2 + d·NH3 + e·H2S .
(2)
The maximal methane yield (YCH4), expressed as norm cubic meters per kilogram of organicdry matter (m3
N kg DM−1), can be obtained by Equation (3) using the molar volume of an ideal
gas (22.4 mol L−1). However, this theoretic value can never be achieved with lignocellulosic biomassin reality because lignocellulose contains compounds that are considered not biodegradable, suchas lignin.
YCH4 =22.4·
(a2 + b
8 − c4 − 3d
8 − e4
)
12a + b + 16c + 14d + 32e. (3)
3. Results and Discussion
3.1. Characterization of the Solid Residue after Steam Explosion
3.1.1. Chemical Composition
The field-dried rice straw had a dry matter content of 91.6 wt.%, which was generally reducedduring steam explosion (Figure 2a). However, the dry matter content among the residues increasedwith severity. An explanation might be that the residue becomes more hydrophobic at higher reactionseverity, because of a decrease in the number of polar functional groups. The mass of steam introducedinto the reactor might also influence the dry matter content. The experiments with the lowest steaminputs, namely S0 = 4.20, 4.32 and 5.29 min, yielded the highest dry matter contents of 65, 66 and 68wt.%, respectively.
143

Molecules 2019, 24, 3492
The acid-insoluble lignin of water-free rice straw accounted for 14.7 wt.% and increased to28–42 wt.% after steam explosion (Figure 2b). This relative increase has two causes: (1) hemicelluloses,and partly cellulose, are converted during steam explosion to water-soluble or volatile compounds.Thereby, the content of the more inert lignin is increased in the solid residue. (2) Hemicellulosesdecompose and repolymerize to form a more stable solid that cannot be hydrolyzed to water-solublecomponents during the Klason method [11]. These repolymerization or condensation reactions involvenot only hemicellulose-derived byproducts but also lignin [16]. These repolymerized pseudolignincompounds are more stable and increase the acid-insoluble lignin content.
The acid-insoluble ash content at low severity parameters was similar to the untreated materialand accounts for 4.0 wt.%. The ash content increased at high severity (Figure 2c). This can alsobe attributed to the conversion of hemicelluloses, and partly cellulose, during steam explosion towater-soluble or volatile compounds. Thereby, the content of inert acid-insoluble ash increased inthe solid residue. This parameter could also be used to roughly estimate the weight loss of organicmaterial during steam explosion. This weight loss of organic material should be considered when thecascading of steam explosion and biogas production is evaluated.
Figure 2d shows the elemental composition of solid steam-exploded residues. The carbon contentin the solid residue rose at high severity. By contrast, the hydrogen content decreased. This canbe explained by the removal of hydrogen- and oxygen-rich volatile compounds during the steamexplosion; thus, a carbon-rich solid residue remained.
Molecules 2019, 24, x 6 of 14
involve not only hemicellulose-derived byproducts but also lignin [16]. These repolymerized pseudolignin compounds are more stable and increase the acid-insoluble lignin content.
The acid-insoluble ash content at low severity parameters was similar to the untreated material and accounts for 4.0 wt.%. The ash content increased at high severity (Figure 2c). This can also be attributed to the conversion of hemicelluloses, and partly cellulose, during steam explosion to water-soluble or volatile compounds. Thereby, the content of inert acid-insoluble ash increased in the solid residue. This parameter could also be used to roughly estimate the weight loss of organic material during steam explosion. This weight loss of organic material should be considered when the cascading of steam explosion and biogas production is evaluated.
Figure 2d shows the elemental composition of solid steam-exploded residues. The carbon content in the solid residue rose at high severity. By contrast, the hydrogen content decreased. This can be explained by the removal of hydrogen- and oxygen-rich volatile compounds during the steam explosion; thus, a carbon-rich solid residue remained.
(a)
(b)
(c)
(d)
Figure 2. Chemical composition of untreated and pretreated rice straw depending on the severity parameter S0 of the steam explosion, (a) dry matter content, (b) Klason lignin content, (c) acid-insoluble ash content, and (d) elemental composition.
3.1.2. Water-Extractable Components
After the hot water extraction of untreated rice straw, 80 mg g−1 glucose and 44 mg g−1 xylose were obtained in the liquid phase (Figure 3). Glucose was either present in the rice straw as free monosaccharide or originated from the degradation of polymers like starch or hemicelluloses [48]. In the latter case, the amorphous or rather labile hemicelluloses may partly hydrolyze during water extraction to yield glucose (but also xylose). No HMF was obtained after the water extraction of untreated rice straw; therefore, no dehydration of glucose occurred.
Figure 2. Chemical composition of untreated and pretreated rice straw depending on the severityparameter S0 of the steam explosion, (a) dry matter content, (b) Klason lignin content, (c) acid-insolubleash content, and (d) elemental composition.
144
Molecules 2019, 24, 3492
3.1.2. Water-Extractable Components
After the hot water extraction of untreated rice straw, 80 mg g−1 glucose and 44 mg g−1 xylosewere obtained in the liquid phase (Figure 3). Glucose was either present in the rice straw as freemonosaccharide or originated from the degradation of polymers like starch or hemicelluloses [48].In the latter case, the amorphous or rather labile hemicelluloses may partly hydrolyze during waterextraction to yield glucose (but also xylose). No HMF was obtained after the water extraction ofuntreated rice straw; therefore, no dehydration of glucose occurred.
Compared to untreated rice straw, water-extractable xylose increased at a low severity of steamexplosion. Xylose was no longer found in the extract at high severities (S0 > 4.1 min). A possibleexplanation is that hemicelluloses are hydrolyzed to release additional xylose at low severities. At highseverities, the released xylose is quickly decomposed to furfural [35]. Water-extractable HMF increasesstrongly with the severity factor. Thus, hexoses, such as glucose, are dehydrated at a higher severityto form HMF. The HMF is known as a fermentation inhibitor for anaerobic digestion [49]. However,reported values for inhibiting concentrations by HMF seem to be high, usually greater than 5 g L−1.Moreover, the intensity of the inhibition is affected by the operational conditions and design of theanaerobic system, as well as the presence of other inhibitors, such as furfural or phenols [49,50]. Bothinhibit the activity of acetate in utilizing methanogens.
Furfural was not detected after water-extraction of pretreated material. However, it was presentin the gas phase of the steam-explosion reactor (data not shown). A sample of the gas phase wasobtained via a relief valve, condensed afterwards, and analyzed for furfural. So, formed furfural wasmainly removed as a volatile during steam explosion. A small part of furfural may still be present onthe surface of the steam-exploded rice straw subjected to anaerobic digestion.
Molecules 2019, 24, x 7 of 14
extraction to yield glucose (but also xylose). No HMF was obtained after the water extraction of untreated rice straw; therefore, no dehydration of glucose occurred.
Compared to untreated rice straw, water-extractable xylose increased at a low severity of steam explosion. Xylose was no longer found in the extract at high severities (S0 > 4.1 min). A possible explanation is that hemicelluloses are hydrolyzed to release additional xylose at low severities. At high severities, the released xylose is quickly decomposed to furfural [35]. Water-extractable HMF increases strongly with the severity factor. Thus, hexoses, such as glucose, are dehydrated at a higher severity to form HMF. The HMF is known as a fermentation inhibitor for anaerobic digestion [49]. However, reported values for inhibiting concentrations by HMF seem to be high, usually greater than 5 g L−1. Moreover, the intensity of the inhibition is affected by the operational conditions and design of the anaerobic system, as well as the presence of other inhibitors, such as furfural or phenols [49,50]. Both inhibit the activity of acetate in utilizing methanogens.
Furfural was not detected after water-extraction of pretreated material. However, it was present in the gas phase of the steam-explosion reactor (data not shown). A sample of the gas phase was obtained via a relief valve, condensed afterwards, and analyzed for furfural. So, formed furfural was mainly removed as a volatile during steam explosion. A small part of furfural may still be present on the surface of the steam-exploded rice straw subjected to anaerobic digestion.
Figure 3. Water-soluble components (glucose, xylose, and hydroxymethylfurfural (HMF)) of untreated rice straw and pretreated residue depending on the severity parameter S0 of the steam explosion. Extraction in boiling water for 3 h.
3.1.3. Thermogravimetric Analysis
The main components of lignocellulosic biomass differ in thermal stability. Hemicelluloses and cellulose consist of glycosidic linkages, which decompose within a narrow temperature region. The amorphous hemicelluloses decomposed at a lower temperature compared to the crystalline cellulose [51,52]. Lignin consists of phenylpropanoid units interconnected by different chemical linkages that have different binding energies [53]. Therefore, the decomposition of lignin proceeded over a broad temperature range.
Figure 4 shows the DTG curves of rice straw. The untreated material showed a peak at around 320 °C, which corresponds to cellulose. Hemicellulose showed a shoulder at 280–300 °C, which is still present for the lowest-severity experiments S0 = 3.05 min and S0 = 3.54 min. At a higher severity, the hemicellulose shoulder disappeared completely, indicating a destruction or alteration of hemicelluloses. An increased mass loss at 380–480 °C was detected for the high-severity experiments (S0 = 4.49 min and S0 = 5.29 min), which could be assigned to more temperature-stable repolymerization products of hemicellulose.
Figure 3. Water-soluble components (glucose, xylose, and hydroxymethylfurfural (HMF)) of untreatedrice straw and pretreated residue depending on the severity parameter S0 of the steam explosion.Extraction in boiling water for 3 h.
3.1.3. Thermogravimetric Analysis
The main components of lignocellulosic biomass differ in thermal stability. Hemicellulosesand cellulose consist of glycosidic linkages, which decompose within a narrow temperature region.The amorphous hemicelluloses decomposed at a lower temperature compared to the crystallinecellulose [51,52]. Lignin consists of phenylpropanoid units interconnected by different chemicallinkages that have different binding energies [53]. Therefore, the decomposition of lignin proceededover a broad temperature range.
Figure 4 shows the DTG curves of rice straw. The untreated material showed a peak at around 320 C,which corresponds to cellulose. Hemicellulose showed a shoulder at 280–300 C, which is still present forthe lowest-severity experiments S0 = 3.05 min and S0 = 3.54 min. At a higher severity, the hemicellulose
145
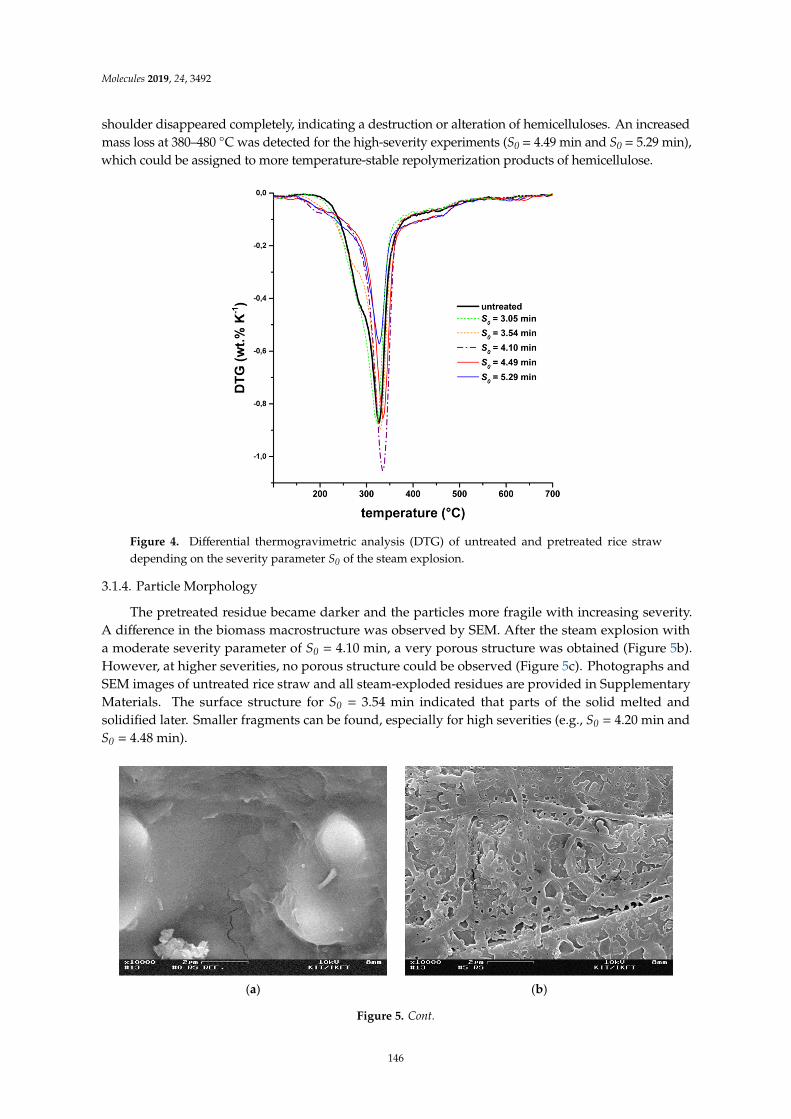
Molecules 2019, 24, 3492
shoulder disappeared completely, indicating a destruction or alteration of hemicelluloses. An increasedmass loss at 380–480 C was detected for the high-severity experiments (S0 = 4.49 min and S0 = 5.29 min),which could be assigned to more temperature-stable repolymerization products of hemicellulose.Molecules 2019, 24, x 8 of 14
Figure 4. Differential thermogravimetric analysis (DTG) of untreated and pretreated rice straw depending on the severity parameter S0 of the steam explosion.
3.1.4. Particle Morphology
The pretreated residue became darker and the particles more fragile with increasing severity. A difference in the biomass macrostructure was observed by SEM. After the steam explosion with a moderate severity parameter of S0 = 4.10 min, a very porous structure was obtained (Figure 5b). However, at higher severities, no porous structure could be observed (Figure 5c). Photographs and SEM images of untreated rice straw and all steam-exploded residues are provided in Supplementary Materials. The surface structure for S0 = 3.54 min indicated that parts of the solid melted and solidified later. Smaller fragments can be found, especially for high severities (e.g., S0 = 4.20 min and S0 = 4.48 min).
(a)
(b)
Figure 4. Differential thermogravimetric analysis (DTG) of untreated and pretreated rice strawdepending on the severity parameter S0 of the steam explosion.
3.1.4. Particle Morphology
The pretreated residue became darker and the particles more fragile with increasing severity.A difference in the biomass macrostructure was observed by SEM. After the steam explosion witha moderate severity parameter of S0 = 4.10 min, a very porous structure was obtained (Figure 5b).However, at higher severities, no porous structure could be observed (Figure 5c). Photographs andSEM images of untreated rice straw and all steam-exploded residues are provided in SupplementaryMaterials. The surface structure for S0 = 3.54 min indicated that parts of the solid melted andsolidified later. Smaller fragments can be found, especially for high severities (e.g., S0 = 4.20 min andS0 = 4.48 min).
Molecules 2019, 24, x 8 of 14
Figure 4. Differential thermogravimetric analysis (DTG) of untreated and pretreated rice straw depending on the severity parameter S0 of the steam explosion.
3.1.4. Particle Morphology
The pretreated residue became darker and the particles more fragile with increasing severity. A difference in the biomass macrostructure was observed by SEM. After the steam explosion with a moderate severity parameter of S0 = 4.10 min, a very porous structure was obtained (Figure 5b). However, at higher severities, no porous structure could be observed (Figure 5c). Photographs and SEM images of untreated rice straw and all steam-exploded residues are provided in Supplementary Materials. The surface structure for S0 = 3.54 min indicated that parts of the solid melted and solidified later. Smaller fragments can be found, especially for high severities (e.g., S0 = 4.20 min and S0 = 4.48 min).
(a)
(b)
Figure 5. Cont.
146
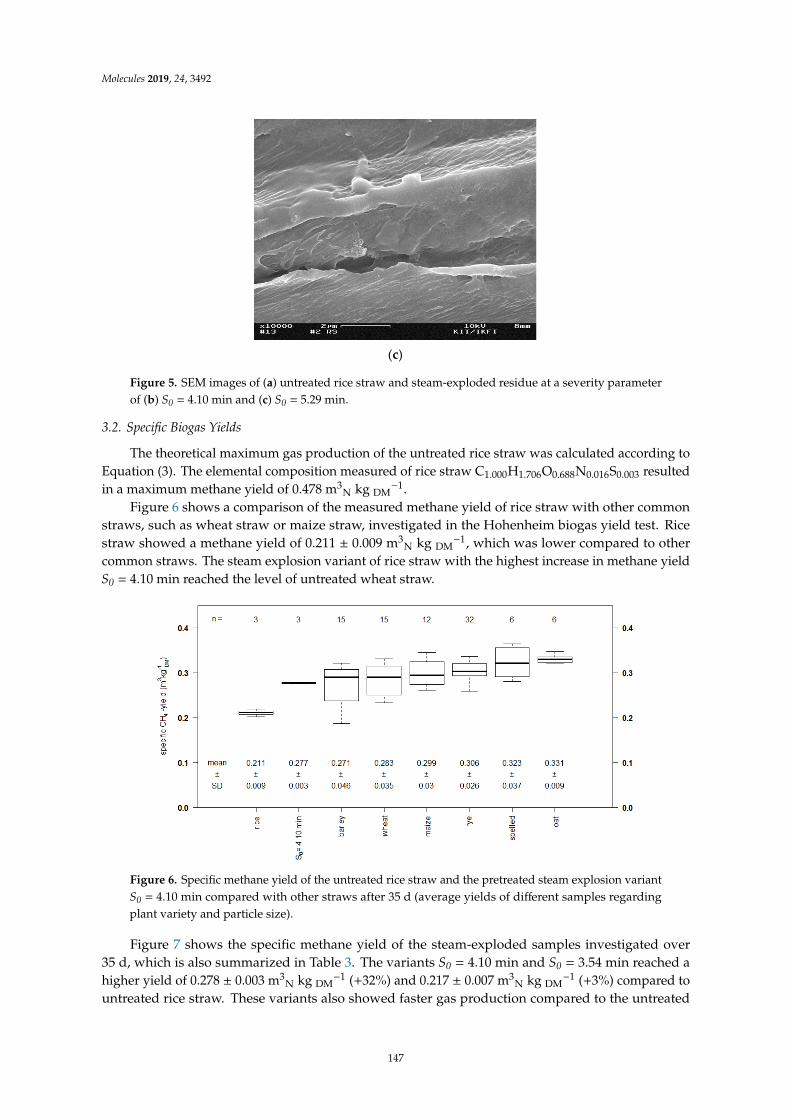
Molecules 2019, 24, 3492Molecules 2019, 24, x 9 of 14
(c)
Figure 5. SEM images of (a) untreated rice straw and steam-exploded residue at a severity parameter of (b) S0 = 4.10 min and (c) S0 = 5.29 min.
3.2. Specific Biogas Yields
The theoretical maximum gas production of the untreated rice straw was calculated according to Equation (3). The elemental composition measured of rice straw C1.000H1.706O0.688N0.016S0.003 resulted in a maximum methane yield of 0.478 m3N kg DM−1.
Figure 6 shows a comparison of the measured methane yield of rice straw with other common straws, such as wheat straw or maize straw, investigated in the Hohenheim biogas yield test. Rice straw showed a methane yield of 0.211 ± 0.009 m3N kg DM−1, which was lower compared to other common straws. The steam explosion variant of rice straw with the highest increase in methane yield S0 = 4.10 min reached the level of untreated wheat straw.
Figure 6. Specific methane yield of the untreated rice straw and the pretreated steam explosion variant S0 = 4.10 min compared with other straws after 35 d (average yields of different samples regarding plant variety and particle size).
Figure 7 shows the specific methane yield of the steam-exploded samples investigated over 35 d, which is also summarized in Table 3. The variants S0 = 4.10 min and S0 = 3.54 min reached a higher yield of 0.278 ± 0.003 m3N kg DM−1 (+32%) and 0.217 ± 0.007 m3N kg DM−1 (+3%) compared to untreated rice straw. These variants also showed faster gas production compared to the untreated straw. The
Figure 5. SEM images of (a) untreated rice straw and steam-exploded residue at a severity parameterof (b) S0 = 4.10 min and (c) S0 = 5.29 min.
3.2. Specific Biogas Yields
The theoretical maximum gas production of the untreated rice straw was calculated according toEquation (3). The elemental composition measured of rice straw C1.000H1.706O0.688N0.016S0.003 resultedin a maximum methane yield of 0.478 m3
N kg DM−1.
Figure 6 shows a comparison of the measured methane yield of rice straw with other commonstraws, such as wheat straw or maize straw, investigated in the Hohenheim biogas yield test. Ricestraw showed a methane yield of 0.211 ± 0.009 m3
N kg DM−1, which was lower compared to other
common straws. The steam explosion variant of rice straw with the highest increase in methane yieldS0 = 4.10 min reached the level of untreated wheat straw.
Molecules 2019, 24, x 9 of 14
(c)
Figure 5. SEM images of (a) untreated rice straw and steam-exploded residue at a severity parameter of (b) S0 = 4.10 min and (c) S0 = 5.29 min.
3.2. Specific Biogas Yields
The theoretical maximum gas production of the untreated rice straw was calculated according to Equation (3). The elemental composition measured of rice straw C1.000H1.706O0.688N0.016S0.003 resulted in a maximum methane yield of 0.478 m3N kg DM−1.
Figure 6 shows a comparison of the measured methane yield of rice straw with other common straws, such as wheat straw or maize straw, investigated in the Hohenheim biogas yield test. Rice straw showed a methane yield of 0.211 ± 0.009 m3N kg DM−1, which was lower compared to other common straws. The steam explosion variant of rice straw with the highest increase in methane yield S0 = 4.10 min reached the level of untreated wheat straw.
Figure 6. Specific methane yield of the untreated rice straw and the pretreated steam explosion variant S0 = 4.10 min compared with other straws after 35 d (average yields of different samples regarding plant variety and particle size).
Figure 7 shows the specific methane yield of the steam-exploded samples investigated over 35 d, which is also summarized in Table 3. The variants S0 = 4.10 min and S0 = 3.54 min reached a higher yield of 0.278 ± 0.003 m3N kg DM−1 (+32%) and 0.217 ± 0.007 m3N kg DM−1 (+3%) compared to untreated rice straw. These variants also showed faster gas production compared to the untreated straw. The
Figure 6. Specific methane yield of the untreated rice straw and the pretreated steam explosion variantS0 = 4.10 min compared with other straws after 35 d (average yields of different samples regardingplant variety and particle size).
Figure 7 shows the specific methane yield of the steam-exploded samples investigated over35 d, which is also summarized in Table 3. The variants S0 = 4.10 min and S0 = 3.54 min reached ahigher yield of 0.278 ± 0.003 m3
N kg DM−1 (+32%) and 0.217 ± 0.007 m3
N kg DM−1 (+3%) compared to
untreated rice straw. These variants also showed faster gas production compared to the untreated
147
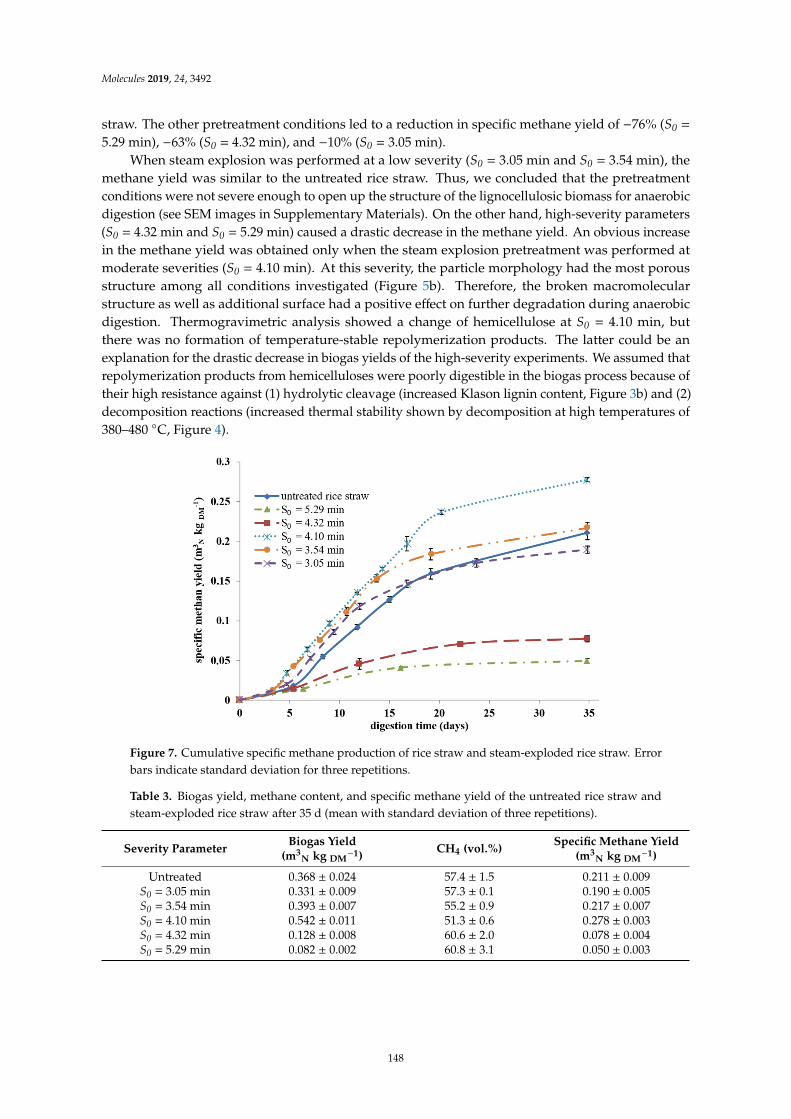
Molecules 2019, 24, 3492
straw. The other pretreatment conditions led to a reduction in specific methane yield of −76% (S0 =
5.29 min), −63% (S0 = 4.32 min), and −10% (S0 = 3.05 min).When steam explosion was performed at a low severity (S0 = 3.05 min and S0 = 3.54 min), the
methane yield was similar to the untreated rice straw. Thus, we concluded that the pretreatmentconditions were not severe enough to open up the structure of the lignocellulosic biomass for anaerobicdigestion (see SEM images in Supplementary Materials). On the other hand, high-severity parameters(S0 = 4.32 min and S0 = 5.29 min) caused a drastic decrease in the methane yield. An obvious increasein the methane yield was obtained only when the steam explosion pretreatment was performed atmoderate severities (S0 = 4.10 min). At this severity, the particle morphology had the most porousstructure among all conditions investigated (Figure 5b). Therefore, the broken macromolecularstructure as well as additional surface had a positive effect on further degradation during anaerobicdigestion. Thermogravimetric analysis showed a change of hemicellulose at S0 = 4.10 min, butthere was no formation of temperature-stable repolymerization products. The latter could be anexplanation for the drastic decrease in biogas yields of the high-severity experiments. We assumed thatrepolymerization products from hemicelluloses were poorly digestible in the biogas process because oftheir high resistance against (1) hydrolytic cleavage (increased Klason lignin content, Figure 3b) and (2)decomposition reactions (increased thermal stability shown by decomposition at high temperatures of380–480 C, Figure 4).
Molecules 2019, 24, x 10 of 14
other pretreatment conditions led to a reduction in specific methane yield of −76% (S0 = 5.29 min), −63% (S0 = 4.32 min), and −10% (S0 = 3.05 min).
When steam explosion was performed at a low severity (S0 = 3.05 min and S0 = 3.54 min), the methane yield was similar to the untreated rice straw. Thus, we concluded that the pretreatment conditions were not severe enough to open up the structure of the lignocellulosic biomass for anaerobic digestion (see SEM images in Supplementary Materials). On the other hand, high-severity parameters (S0 = 4.32 min and S0 = 5.29 min) caused a drastic decrease in the methane yield. An obvious increase in the methane yield was obtained only when the steam explosion pretreatment was performed at moderate severities (S0 = 4.10 min). At this severity, the particle morphology had the most porous structure among all conditions investigated (Figure 5b). Therefore, the broken macromolecular structure as well as additional surface had a positive effect on further degradation during anaerobic digestion. Thermogravimetric analysis showed a change of hemicellulose at S0 = 4.10 min, but there was no formation of temperature-stable repolymerization products. The latter could be an explanation for the drastic decrease in biogas yields of the high-severity experiments. We assumed that repolymerization products from hemicelluloses were poorly digestible in the biogas process because of their high resistance against (1) hydrolytic cleavage (increased Klason lignin content, Figure 3b) and (2) decomposition reactions (increased thermal stability shown by decomposition at high temperatures of 380–480 °C, Figure 4).
Figure 7. Cumulative specific methane production of rice straw and steam-exploded rice straw. Error bars indicate standard deviation for three repetitions.
Table 3. Biogas yield, methane content, and specific methane yield of the untreated rice straw and steam-exploded rice straw after 35 d (mean with standard deviation of three repetitions).
Severity parameter Biogas yield (m3N kg DM−1)
CH4 (vol.%)
Specific methane yield (m3N kg DM−1)
Untreated 0.368 ± 0.024 57.4 ± 1.5 0.211 ± 0.009 S0 = 3.05 min 0.331 ± 0.009 57.3 ± 0.1 0.190 ± 0.005 S0 = 3.54 min 0.393 ± 0.007 55.2 ± 0.9 0.217 ± 0.007 S0 = 4.10 min 0.542 ± 0.011 51.3 ± 0.6 0.278 ± 0.003 S0 = 4.32 min 0.128 ± 0.008 60.6 ± 2.0 0.078 ± 0.004 S0 = 5.29 min 0.082 ± 0.002 60.8 ± 3.1 0.050 ± 0.003
4. Conclusions
Steam explosion of rice straw was performed as a pretreatment for anaerobic digestion to obtain a methane-rich biogas. Steam explosion was investigated at different reaction conditions, which
Figure 7. Cumulative specific methane production of rice straw and steam-exploded rice straw. Errorbars indicate standard deviation for three repetitions.
Table 3. Biogas yield, methane content, and specific methane yield of the untreated rice straw andsteam-exploded rice straw after 35 d (mean with standard deviation of three repetitions).
Severity Parameter Biogas Yield(m3
N kg DM−1) CH4 (vol.%) Specific Methane Yield(m3
N kg DM−1)
Untreated 0.368 ± 0.024 57.4 ± 1.5 0.211 ± 0.009S0 = 3.05 min 0.331 ± 0.009 57.3 ± 0.1 0.190 ± 0.005S0 = 3.54 min 0.393 ± 0.007 55.2 ± 0.9 0.217 ± 0.007S0 = 4.10 min 0.542 ± 0.011 51.3 ± 0.6 0.278 ± 0.003S0 = 4.32 min 0.128 ± 0.008 60.6 ± 2.0 0.078 ± 0.004S0 = 5.29 min 0.082 ± 0.002 60.8 ± 3.1 0.050 ± 0.003
148
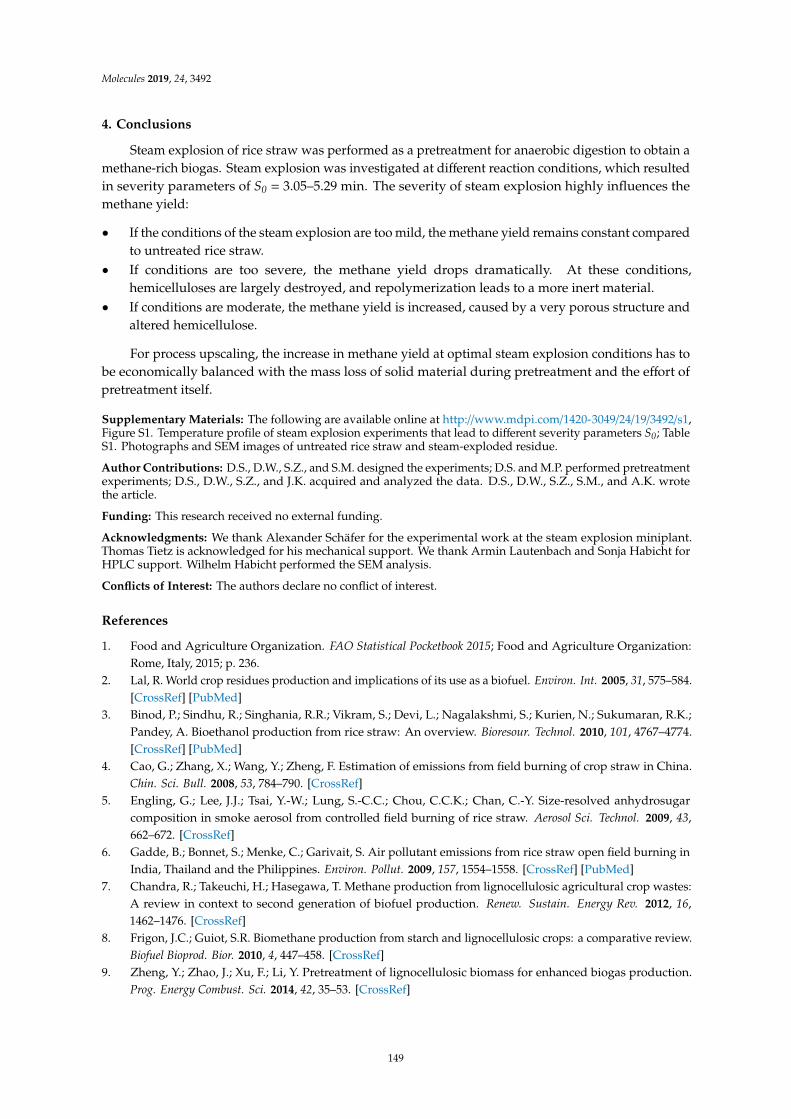
Molecules 2019, 24, 3492
4. Conclusions
Steam explosion of rice straw was performed as a pretreatment for anaerobic digestion to obtain amethane-rich biogas. Steam explosion was investigated at different reaction conditions, which resultedin severity parameters of S0 = 3.05–5.29 min. The severity of steam explosion highly influences themethane yield:
• If the conditions of the steam explosion are too mild, the methane yield remains constant comparedto untreated rice straw.
• If conditions are too severe, the methane yield drops dramatically. At these conditions,hemicelluloses are largely destroyed, and repolymerization leads to a more inert material.
• If conditions are moderate, the methane yield is increased, caused by a very porous structure andaltered hemicellulose.
For process upscaling, the increase in methane yield at optimal steam explosion conditions has tobe economically balanced with the mass loss of solid material during pretreatment and the effort ofpretreatment itself.
Supplementary Materials: The following are available online at http://www.mdpi.com/1420-3049/24/19/3492/s1,Figure S1. Temperature profile of steam explosion experiments that lead to different severity parameters S0; TableS1. Photographs and SEM images of untreated rice straw and steam-exploded residue.
Author Contributions: D.S., D.W., S.Z., and S.M. designed the experiments; D.S. and M.P. performed pretreatmentexperiments; D.S., D.W., S.Z., and J.K. acquired and analyzed the data. D.S., D.W., S.Z., S.M., and A.K. wrotethe article.
Funding: This research received no external funding.
Acknowledgments: We thank Alexander Schäfer for the experimental work at the steam explosion miniplant.Thomas Tietz is acknowledged for his mechanical support. We thank Armin Lautenbach and Sonja Habicht forHPLC support. Wilhelm Habicht performed the SEM analysis.
Conflicts of Interest: The authors declare no conflict of interest.
References
1. Food and Agriculture Organization. FAO Statistical Pocketbook 2015; Food and Agriculture Organization:Rome, Italy, 2015; p. 236.
2. Lal, R. World crop residues production and implications of its use as a biofuel. Environ. Int. 2005, 31, 575–584.[CrossRef] [PubMed]
3. Binod, P.; Sindhu, R.; Singhania, R.R.; Vikram, S.; Devi, L.; Nagalakshmi, S.; Kurien, N.; Sukumaran, R.K.;Pandey, A. Bioethanol production from rice straw: An overview. Bioresour. Technol. 2010, 101, 4767–4774.[CrossRef] [PubMed]
4. Cao, G.; Zhang, X.; Wang, Y.; Zheng, F. Estimation of emissions from field burning of crop straw in China.Chin. Sci. Bull. 2008, 53, 784–790. [CrossRef]
5. Engling, G.; Lee, J.J.; Tsai, Y.-W.; Lung, S.-C.C.; Chou, C.C.K.; Chan, C.-Y. Size-resolved anhydrosugarcomposition in smoke aerosol from controlled field burning of rice straw. Aerosol Sci. Technol. 2009, 43,662–672. [CrossRef]
6. Gadde, B.; Bonnet, S.; Menke, C.; Garivait, S. Air pollutant emissions from rice straw open field burning inIndia, Thailand and the Philippines. Environ. Pollut. 2009, 157, 1554–1558. [CrossRef] [PubMed]
7. Chandra, R.; Takeuchi, H.; Hasegawa, T. Methane production from lignocellulosic agricultural crop wastes:A review in context to second generation of biofuel production. Renew. Sustain. Energy Rev. 2012, 16,1462–1476. [CrossRef]
8. Frigon, J.C.; Guiot, S.R. Biomethane production from starch and lignocellulosic crops: a comparative review.Biofuel Bioprod. Bior. 2010, 4, 447–458. [CrossRef]
9. Zheng, Y.; Zhao, J.; Xu, F.; Li, Y. Pretreatment of lignocellulosic biomass for enhanced biogas production.Prog. Energy Combust. Sci. 2014, 42, 35–53. [CrossRef]
149
Molecules 2019, 24, 3492
10. Bobleter, O. Hydrothermal degradation of polymers derived from plants. Prog. Polym. Sci. 1994, 19, 797–841.[CrossRef]
11. Steinbach, D.; Kruse, A.; Sauer, J. Pretreatment technologies of lignocellulosic biomass in water in viewof furfural and 5-hydroxymethylfurfural production—A review. Biomass Convers. Biorefinery 2017, 1–28.[CrossRef]
12. Hendriks, A.T.W.M.; Zeeman, G. Pretreatments to enhance the digestibility of lignocellulosic biomass.Bioresour. Technol. 2009, 100, 10–18. [CrossRef] [PubMed]
13. Taherzadeh, J.M.; Karimi, K. Pretreatment of lignocellulosic wastes to improve ethanol and biogas production:a review. Int. J. Mol. Sci. 2008, 9. [CrossRef] [PubMed]
14. Schwald, W.; Breuil, C.; Brownell, H.H.; Chan, M.; Saddler, J.N. Assessment of pretreatment conditions toobtain fast complete hydrolysis on high substrate concentrations. Appl. Biochem. Biotech. 1989, 20–21, 29–44.[CrossRef]
15. Zimbardi, F.; Viola, E.; Nanna, F.; Larocca, E.; Cardinale, M.; Barisano, D. Acid impregnation and steamexplosion of corn stover in batch processes. Ind. Crop. Prod. 2007, 26, 195–206. [CrossRef]
16. Ramos, L.P. The chemistry involved in the steam treatment of lignocellulosic materials. Quim. Nova 2003, 26,863–871. [CrossRef]
17. Ferreira, L.C.; Nilsen, P.J.; Fdz-Polanco, F.; Pérez-Elvira, S.I. Biomethane potential of wheat straw: Influenceof particle size, water impregnation and thermal hydrolysis. Chem. Eng. J. 2014, 242, 254–259. [CrossRef]
18. Overend, R.P.; Chornet, E. Fractionation of lignocellulosics by steam-aqueous pretreatments. Philos. T. R. Soc.A 1987, 321, 523–536. [CrossRef]
19. Schumacher, B.; Oechsner, H.; Senn, T.; Jungbluth, T. Thermo-mechanical pre-treatment of ripe triticale forbiogas production. Landtechnik 2007, 62, 162–163, 190.
20. Schumacher, B. Untersuchungen zur Aufbereitung und Umwandlung von Energiepflanzen in Biogas und Bioethanol;Universität Hohenheim: Stuttgart, Germany, 2008.
21. Bauer, A.; Bösch, P.; Friedl, A.; Amon, T. Analysis of methane potentials of steam-exploded wheat straw andestimation of energy yields of combined ethanol and methane production. J. Biotechnol. 2009, 142, 50–55.[CrossRef]
22. Theuretzbacher, F.; Lizasoain, J.; Lefever, C.; Saylor, M.K.; Enguidanos, R.; Weran, N.; Gronauer, A.; Bauer, A.Steam explosion pretreatment of wheat straw to improve methane yields: Investigation of the degradationkinetics of structural compounds during anaerobic digestion. Bioresour. Technol. 2015, 179, 299–305.[CrossRef]
23. Risberg, K.; Sun, L.; Levén, L.; Horn, S.J.; Schnürer, A. Biogas production from wheat straw and manure—Impact of pretreatment and process operating parameters. Bioresour. Technol. 2013, 149, 232–237. [CrossRef][PubMed]
24. Sapci, Z.; Morken, J.; Linjordet, R. An investigation of the enhancement of biogas yields from lignocellulosicmaterial using two pretreatment methods: microwave irradiation and steam explosion. Bioresources 2013, 8,1976–1985. [CrossRef]
25. Lindorfer, J.; Steinmuller, H.; Jager, A.; Eder, A.; Hofer, B.; Nidetzky, B.; Loncar, E.; Auer, W. Research intothe production of bioethanol and biogas from Lignocellulose raw materials after pretreatment with steamexplosion and cellulases. Chem.-Ing.-Tech. 2010, 82, 1197–1202. [CrossRef]
26. Ferreira, L.C.; Donoso-Bravo, A.; Nilsen, P.J.; Fdz-Polanco, F.; Perez-Elvira, S.I. Influence of thermalpretreatment on the biochemical methane potential of wheat straw. Bioresour. Technol. 2013, 143, 251–257.[CrossRef] [PubMed]
27. Bauer, A.; Lizasoain, J.; Theuretzbacher, F.; Agger, J.W.; Rincón, M.; Menardo, S.; Saylor, M.K.; Enguídanos, R.;Nielsen, P.J.; Potthast, A.; et al. Steam explosion pretreatment for enhancing biogas production of lateharvested hay. Bioresour. Technol. 2014, 166, 403–410. [CrossRef] [PubMed]
28. Vivekanand, V.; Olsen, E.F.; Eijsink, V.G.H.; Horn, S.J. Methane potential and enzymatic saccharification ofsteam-exploded bagasse. Bioresources 2014, 9, 1311–1324. [CrossRef]
29. De Paoli, F.; Bauer, A.; Leonhartsberger, C.; Amon, B.; Amon, T. Utilization of by-products from ethanolproduction as substrate for biogas production. Bioresour. Technol. 2011, 102, 6621–6624. [CrossRef] [PubMed]
150
Molecules 2019, 24, 3492
30. Vivekanand, V.; Ryden, P.; Horn, S.J.; Tapp, H.S.; Wellner, N.; Eijsink, V.G.H.; Waldron, K.W. Impact of steamexplosion on biogas production from rape straw in relation to changes in chemical composition. Bioresour.Technol. 2012, 123, 608–615. [CrossRef]
31. Yue, Z.B.; Liu, R.H.; Yu, H.Q.; Chen, H.Z.; Yu, B.; Harada, H.; Li, Y.Y. Enhanced anaerobic ruminal degradationof bulrush through steam explosion pretreatment. Ind. Eng. Chem. Res. 2008, 47, 5899–5905. [CrossRef]
32. Wang, J.; Yue, Z.-B.; Chen, T.-H.; Peng, S.-C.; Yu, H.-Q.; Chen, H.-Z. Anaerobic digestibility and fibercomposition of bulrush in response to steam explosion. Bioresour. Technol. 2010, 101, 6610–6614. [CrossRef]
33. Menardo, S.; Bauer, A.; Theuretzbacher, F.; Piringer, G.; Nilsen, P.J.; Balsari, P.; Pavliska, O.; Amon, T. Biogasproduction from steam-exploded miscanthus and utilization of biogas energy and CO2 in greenhouses.Bioenerg. Res. 2013, 6, 620–630. [CrossRef]
34. Vivekanand, V.; Olsen, E.F.; Eijsink, V.G.H.; Horn, S.J. Effect of different steam explosion conditions onmethane potential and enzymatic saccharification of birch. Bioresour. Technol. 2013, 127, 343–349. [CrossRef][PubMed]
35. Horn, S.J.; Estevez, M.M.; Nielsen, H.K.; Linjordet, R.; Eijsink, V.G.H. Biogas production and saccharificationof Salix pretreated at different steam explosion conditions. Bioresour. Technol. 2011, 102, 7932–7936. [CrossRef][PubMed]
36. Estevez, M.M.; Linjordet, R.; Morken, J. Effects of steam explosion and co-digestion in the methane productionfrom Salix by mesophilic batch assays. Bioresour. Technol. 2012, 104, 749–756. [CrossRef]
37. Take, H.; Andou, Y.; Nakamura, Y.; Kobayashi, H.; Kurimoto, Y.; Kuwahara, M. Production of methane gasfrom Japanese cedar chips pretreated by various delignification methods. Biochem. Eng. J. 2006, 28, 30–35.[CrossRef]
38. Zhou, J.; Yan, B.H.; Wang, Y.; Yong, X.Y.; Yang, Z.H.; Jia, H.H.; Jiang, M.; Wei, P. Effect of steam explosionpretreatment on the anaerobic digestion of rice straw. Rsc. Adv. 2016, 6, 88417–88425. [CrossRef]
39. Wood, I.P.; Cao, H.-G.; Tran, L.; Cook, N.; Ryden, P.; Wilson, D.R.; Moates, G.K.; Collins, S.R.A.; Elliston, A.;Waldron, K.W. Comparison of saccharification and fermentation of steam exploded rice straw and rice husk.Biotechnol. Biofuels 2016, 9, 193. [CrossRef]
40. Moniruzzaman, M. Effect of steam explosion on the physicochemical properties and enzymatic saccharificationof rice straw. Appl. Biochem. Biotech. 1996, 59, 283–297. [CrossRef]
41. Taniguchi, M.; Takahashi, D.; Watanabe, D.; Sakai, K.; Hoshino, K.; Kouya, T.; Tanaka, T. Effect of steamexplosion pretreatment on treatment with Pleurotus ostreatus for the enzymatic hydrolysis of rice straw. J.Biosci. Bioeng. 2010, 110, 449–452. [CrossRef]
42. Montané, D.; Overend, R.P.; Chornet, E. Kinetic models for non-homogeneous complex systems with atime-dependent rate constant. Can. J. Chem. Eng. 1998, 76, 58–68. [CrossRef]
43. ASTM Standard. Standard test method for acid-insoluble lignin in wood; ASTM Standard: West Conshohocken,PA, USA, 2013; Vol. D1106 −96.
44. VDI. Fermentation of organic materials; VDI-Gesellschaft Energietechnik: Düsseldorf, Germany, 2006; Volume4630.
45. Helffrich, D.; Oechsner, H. Hohenheimer Biogasertragstest-Vergleich verschiedener Laborverfahren zurVergärung von Biomasse. Agrartech. Forsch. 2003, 9, 27–30.
46. Mittweg, G.; Oechsner, H.; Hahn, V.; Lemmer, A.; Reinhardt-Hanisch, A. Repeatability of a laboratory batchmethod to determine the specific biogas and methane yields. Eng. Life Sci. 2012, 12, 270–278. [CrossRef]
47. Boyle, W.C. Energy recovers from sanitary landfills – a review. In Microbial Energy Conversion; Schlegel, H.,Barnea, J., Eds.; Elsevier: Pergamon, Turkey, 1977; pp. 119–138.
48. Park, J.Y.; Seyama, T.; Shiroma, R.; Ike, M.; Srichuwong, S.; Nagata, K.; Arai-Sanoh, Y.; Kondo, M.; Tokuyasu, K.Efficient recovery of glucose and fructose via enzymatic saccharification of rice straw with soft carbohydrates.Biosci. Biotech. Bioch. 2009, 73, 1072–1077. [CrossRef] [PubMed]
49. Monlau, F.; Sambusiti, C.; Barakat, A.; Quéméneur, M.; Trably, E.; Steyer, J.P.; Carrère, H. Do furanic andphenolic compounds of lignocellulosic and algae biomass hydrolyzate inhibit anaerobic mixed cultures?A comprehensive review. Biotechnol. Adv. 2014, 32, 934–951. [CrossRef] [PubMed]
50. Levén, L.; Nyberg, K.; Schnürer, A. Conversion of phenols during anaerobic digestion of organic solidwaste—A review of important microorganisms and impact of temperature. J. Environ. Manag. 2012, 95,S99–S103. [CrossRef] [PubMed]
151

Molecules 2019, 24, 3492
51. Xiao, L.-P.; Sun, Z.-J.; Shi, Z.-J.; Xu, F.; Sun, R.-C. Impact of hot compressed water pretreatment on thestructural changes of woody biomass for bioethanol production. BioResources 2011, 6, 1576–1598.
52. Chen, W.H.; Ye, S.C.; Sheen, H.K. Hydrolysis characteristics of sugarcane bagasse pretreated by dilute acidsolution in a microwave irradiation environment. Appl. Energ. 2012, 93, 237–244. [CrossRef]
53. Zakzeski, J.; Bruijnincx, P.C.A.; Jongerius, A.L.; Weckhuysen, B.M. The catalytic valorization of lignin for theproduction of renewable chemicals. Chem. Rev. 2010, 110, 3552–3599. [CrossRef]
© 2019 by the authors. Licensee MDPI, Basel, Switzerland. This article is an open accessarticle distributed under the terms and conditions of the Creative Commons Attribution(CC BY) license (http://creativecommons.org/licenses/by/4.0/).
152
molecules
Article
Enhancement of Volatile Fatty Acids Production fromFood Waste by Mature Compost Addition
Yen-Keong Cheah 1, Joan Dosta 1,2,* and Joan Mata-Álvarez 1,2
1 Department of Chemical Engineering and Analytical Chemistry, University of Barcelona,08028 Barcelona, Spain
2 Water Research Institute, University of Barcelona, 08001 Barcelona, Spain* Correspondence: [email protected]
Academic Editor: Derek J. McPheeReceived: 17 June 2019; Accepted: 8 August 2019; Published: 17 August 2019
Abstract: Food waste (FW) collected from a university canteen was treated in acidogenic fermentersto produce volatile fatty acids (VFA) under biological pretreatment with mature compost. Batchassays working at pH 6 revealed an increment of 9.0%, 7.9%, and 4.1% (on COD basis) of VFAconcentration when adding 2.5%, 3.5%, and 4.5% w/w of mature compost, respectively, even thoughthe volatile solids (VS) concentration of food waste was lower in the tests with increasing dosesof mature compost. For batch tests at pH 7, this VFA generation improvement was lower, eventhough enhanced COD solubilization was recorded. Operating in semi-continuous conditions at35 C, pH of 6, and hydraulic retention time (HRT) of 3.5 days, the addition of 2.5% w/w of maturecompost led to a VFA concentration up to 51.2 ± 12.3% more (on VS basis) when compared to areference reactor without compost addition. Moreover, the percentage of butyric acid on VS basis inthe fermentation broth working at a pH of 6 increased from up to 12.2 ± 1.9% (0% compost addition)to up to 23.5 ± 2.7% (2.5% compost addition). The VFA production was not improved when a higherpercentage of mature compost was used (3.5% instead of 2.5% w/w), and it slightly decreased whenmature compost addition was lowered to 1.5% w/w. When working at a pH of 7 in the semi-continuousfermenters with the addition of 2.5% w/w mature compost at an HRT of 3.5 days, an improvementof 79% and 104% of the VFA concentration (on VS basis) were recorded as compared to fermentersworking at a pH of 6 with 2.5% and 0% w/w of mature compost addition, respectively. At a pH of 7,higher production of propionic and valeric acids was found with respect to the reactor working at apH of 6. The effect of pH on VFA generation was estimated to have greater contribution than that ofonly biological pretreatment using mature compost. At a pH of 7, the VFA yield was higher for thefermenter working with 2.5% w/w mature compost but at a pH of 7 and HRT of 5 days, the effectof mature compost on VFA production improvement was lower than that obtained at a pH of 6.Moreover, higher solubilization in terms of soluble chemical oxygen demand and total ammoniumwas detected when biological pretreatment using mature compost was applied at both a pH of 6 anda pH of 7, which indicates enhanced hydrolysis in both conditions.
Keywords: acetic acid; acidogenic fermentation; biorefinery; butyric acid; HRT; pH; propionic acid
1. Introduction
The raising concern about climate change and sustainability have led to an increasing awarenessof resource utilization [1] and, under this context, the demand for energy and materials is now a bigchallenge in this century [2]. Urban organic wastes are known to contain a great variety of fermentableand biodegradable materials, which include biodegradable organic compounds such as sewage sludge(primary and secondary), food waste (FW), and organic fraction of municipal solid waste (OFMSW),among others. The acidogenic fermentation of urban organic wastes is gaining attention due to their
153
Molecules 2019, 24, 2986
high accessibility and possible process improvement. In 2012, approximately 90 million tons of FWwas generated in all European countries [3]. This number indicates that a huge quantity of volatilefatty acids (VFA) could have been recovered through anaerobic acidogenic fermentation. VFA is a keycommodity to produce biomaterials, such as polyhydroxyalkanoates, and biodegradable bioplastics,which currently have a growing market [4–6]. Other than that, VFA could be used as external carbonsources for biological nutrient removal (nitrogen and phosphorus) in wastewater treatment plants orto produce bioenergy [7–9]. To improve the biomaterials utilization from FW, such as PHA, it is of theutmost importance to maximize the production of VFA and different strategies are possible [10].
Hydrolysis is usually the rate limiting step for VFA production [11–14]. Hence, developmentof treatment methods to improve hydrolysis and solubilization of complex organic compounds hasbeen investigated and it is still under research. Currently, there are a number of pre-treatmentmethods [15–18] to enhance the hydrolysis step, which is usually classified as physical, chemical,and biological. Physical pretreatments (thermal and mechanical) increase the disintegration of cellmembranes or the specific surface area, which can provide better contact between substrate andmicroorganisms [19–21]. In chemical pretreatments, the external addition of chemicals (acids, alkalis,ozonation, etc.) will somehow increase the solubilization of the substrate [17,18,22]. Biologicalpretreatments are getting more attention for acidogenic fermentation, since they do not require reagentadditions and do not imply high-energy demands. Among biological pretreatments, bioaugmentationis a promising approach to enhance VFA production instead of other organic compounds [10].The simplest use of bioaugmentation is to add to the fermentation medium, which is a pre-adaptedmixed culture. An example is the rumen addition that has been successfully used in anaerobicfermentation of corn stover [23] or anaerobic digestion of high lignocellulose grass silage [24]. Rumenaddition typically requires an immediate use of it, since these bacteria are very sensitive and couldbecome inactive after a few hours. Even so, the net positive output has attracted many researchers’interest. Another approach that would overcome this problem is the use of mature compost, whichis much more stable than rumen, but this biological pretreatment agent has been seldom reportedin literature.
This paper focuses on the VFA production by adding mature compost to FW in acidogenicfermentation, to assess quantitatively the improvement yields and composition of VFA at differentpHs and hydraulic retention time (HRT). To this end, batch and semi-continuous experiments werecarried out for an operation period of 200 days.
2. Results and Discussion
2.1. Effect of Mature Compost Addition at pH of 6
Several batch tests were performed at a pH of 6.0 using mixtures 1:1 on the volatile solid (VS)basis of food waste and acidogenic fermentation inoculum of a digester treating FW [15] with differentdoses of mature compost (namely, 0%, 2.5%, 3.5%, and 4.5% w/w). Table 1 summarizes the maincharacteristics of these batch tests and Figure 1 shows the VFA production with different doses ofmature compost. The results showed that, in a short-term period (10 days), an increment of 9.0%,7.9%, and 4.1% of VFA concentration (on the COD basis) was observed when 2.5%, 3.5%, and 4.5%w/w of mature compost was added, respectively, as compared to the batch without compost addition(it should be noted that the quantity of food waste added in each batch decreased when the percentageof compost increased).
154
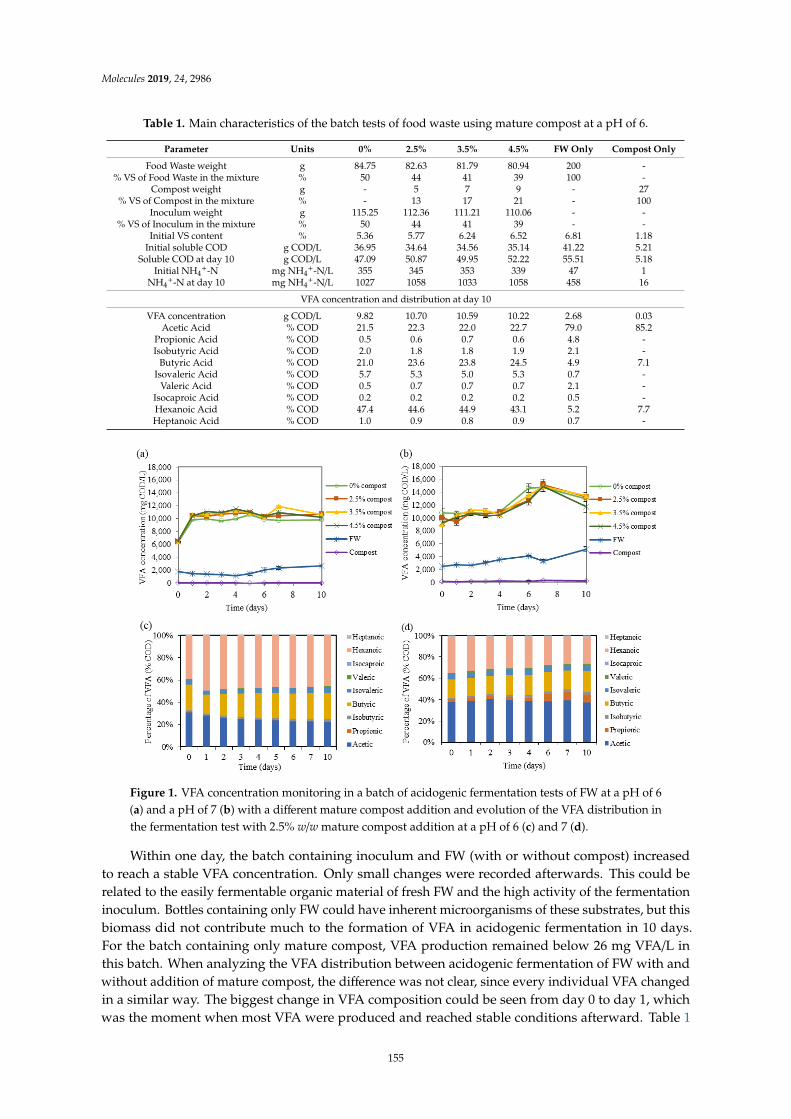
Molecules 2019, 24, 2986
Table 1. Main characteristics of the batch tests of food waste using mature compost at a pH of 6.
Parameter Units 0% 2.5% 3.5% 4.5% FW Only Compost Only
Food Waste weight g 84.75 82.63 81.79 80.94 200 -% VS of Food Waste in the mixture % 50 44 41 39 100 -
Compost weight g - 5 7 9 - 27% VS of Compost in the mixture % - 13 17 21 - 100
Inoculum weight g 115.25 112.36 111.21 110.06 - -% VS of Inoculum in the mixture % 50 44 41 39 - -
Initial VS content % 5.36 5.77 6.24 6.52 6.81 1.18Initial soluble COD g COD/L 36.95 34.64 34.56 35.14 41.22 5.21
Soluble COD at day 10 g COD/L 47.09 50.87 49.95 52.22 55.51 5.18Initial NH4
+-N mg NH4+-N/L 355 345 353 339 47 1
NH4+-N at day 10 mg NH4
+-N/L 1027 1058 1033 1058 458 16
VFA concentration and distribution at day 10
VFA concentration g COD/L 9.82 10.70 10.59 10.22 2.68 0.03Acetic Acid % COD 21.5 22.3 22.0 22.7 79.0 85.2
Propionic Acid % COD 0.5 0.6 0.7 0.6 4.8 -Isobutyric Acid % COD 2.0 1.8 1.8 1.9 2.1 -
Butyric Acid % COD 21.0 23.6 23.8 24.5 4.9 7.1Isovaleric Acid % COD 5.7 5.3 5.0 5.3 0.7 -
Valeric Acid % COD 0.5 0.7 0.7 0.7 2.1 -Isocaproic Acid % COD 0.2 0.2 0.2 0.2 0.5 -Hexanoic Acid % COD 47.4 44.6 44.9 43.1 5.2 7.7Heptanoic Acid % COD 1.0 0.9 0.8 0.9 0.7 -Molecules 2019, 24, x FOR PEER REVIEW 4 of 17
Figure 1. VFA concentration monitoring in a batch of acidogenic fermentation tests of FW at a pH of
6 (a) and a pH of 7 (b) with a different mature compost addition and evolution of the VFA distribution
in the fermentation test with 2.5% w/w mature compost addition at a pH of 6 (c) and 7 (d).
To study the effects in long-term conditions, three semi-continuous reactors (A, B, and C) were
put into operation at a pH of 6 without compost addition working under a retention time of 3.5 days.
After 15 days of operation with approximately the same specific VFA production in terms of g VFA/g
VS fed, several doses of mature compost were added to the digesters. Table 2 summarizes the
different periods of FW collection carried out where it is observed that fermenter A (fed with only
FW) remained as a reference reactor, fermenter B worked always with 2.5% (on dry weight) of mature
compost (mixed in the influent FW), and fermenter C worked under different conditions of mature
compost addition. Figure 2 monitors the VFA concentration profiles (in terms of mg CODVFA/L), the
VFA yield (expressed in terms of g VFA/g VSfed), and the Organic Loading Rate (OLR) applied (in
terms of g VS/(L day)) during Phase 1. On the other hand, Table 3 shows the main characteristics of
the effluent fermentation broth obtained in each period and Figure 3 shows the monitoring of the
individual VFA during the whole experimental period.
Table 2. Summary of the working conditions for the three semi-continuous mesophilic fermenters in
the periods tested.
Fermenter
Phase 1 2
Stage 1 2 3 4 1 2 3
Period (days) 0–14 15–34 35–84 85–114 115–146 147–168 168–198
A
pH 6 6 6 6 6 6 6
HRT (days) 3.5 3.5 3.5 3.5 3.5 3.5 3.5
Compost (% w/w) - - - - - - -
B
pH 6 6 6 6 6 6 7
HRT (days) 3.5 3.5 3.5 3.5 3.5 3.5 5
Compost (% w/w) - 2.5 2.5 2.5 2.5 2.5 -
C
pH 6 6 6 6 7 7 7
HRT (days) 3.5 3.5 3.5 3.5 3.5 5 5
Compost (% w/w) - - 3.5 1.5 2.5 2.5 2.5
Figure 1. VFA concentration monitoring in a batch of acidogenic fermentation tests of FW at a pH of 6(a) and a pH of 7 (b) with a different mature compost addition and evolution of the VFA distribution inthe fermentation test with 2.5% w/w mature compost addition at a pH of 6 (c) and 7 (d).
Within one day, the batch containing inoculum and FW (with or without compost) increasedto reach a stable VFA concentration. Only small changes were recorded afterwards. This could berelated to the easily fermentable organic material of fresh FW and the high activity of the fermentationinoculum. Bottles containing only FW could have inherent microorganisms of these substrates, but thisbiomass did not contribute much to the formation of VFA in acidogenic fermentation in 10 days.For the batch containing only mature compost, VFA production remained below 26 mg VFA/L inthis batch. When analyzing the VFA distribution between acidogenic fermentation of FW with andwithout addition of mature compost, the difference was not clear, since every individual VFA changedin a similar way. The biggest change in VFA composition could be seen from day 0 to day 1, whichwas the moment when most VFA were produced and reached stable conditions afterward. Table 1
155
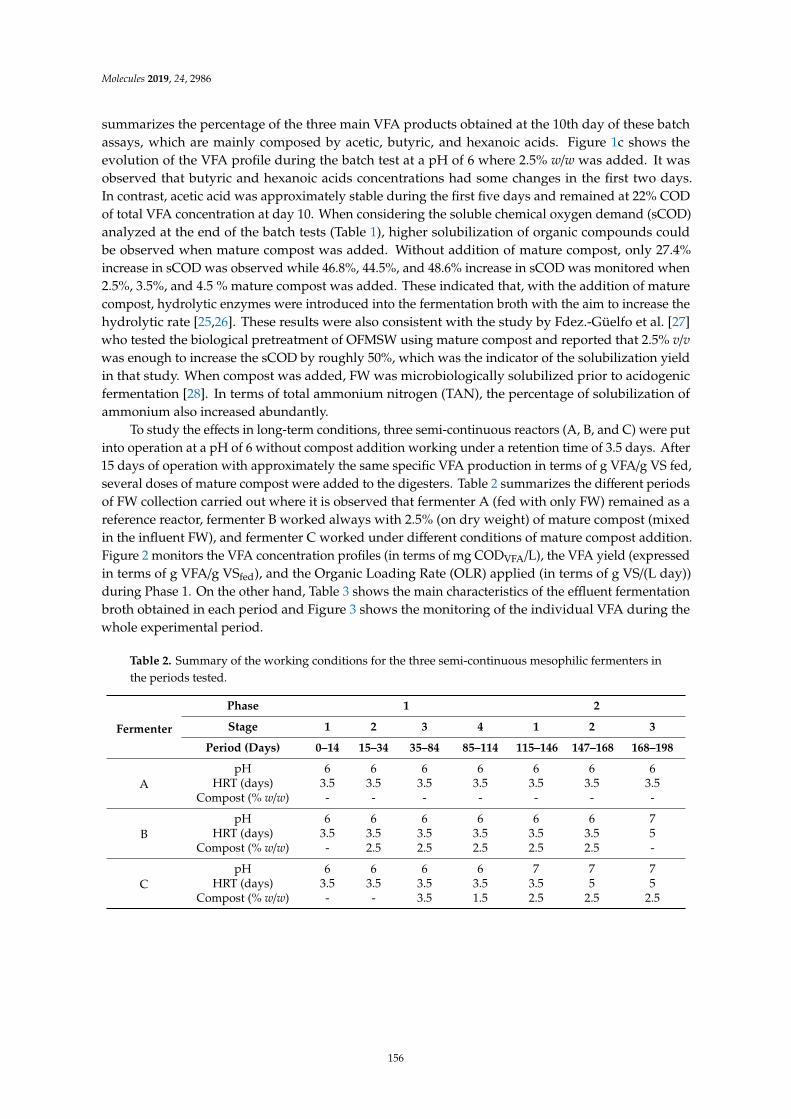
Molecules 2019, 24, 2986
summarizes the percentage of the three main VFA products obtained at the 10th day of these batchassays, which are mainly composed by acetic, butyric, and hexanoic acids. Figure 1c shows theevolution of the VFA profile during the batch test at a pH of 6 where 2.5% w/w was added. It wasobserved that butyric and hexanoic acids concentrations had some changes in the first two days.In contrast, acetic acid was approximately stable during the first five days and remained at 22% CODof total VFA concentration at day 10. When considering the soluble chemical oxygen demand (sCOD)analyzed at the end of the batch tests (Table 1), higher solubilization of organic compounds couldbe observed when mature compost was added. Without addition of mature compost, only 27.4%increase in sCOD was observed while 46.8%, 44.5%, and 48.6% increase in sCOD was monitored when2.5%, 3.5%, and 4.5 % mature compost was added. These indicated that, with the addition of maturecompost, hydrolytic enzymes were introduced into the fermentation broth with the aim to increase thehydrolytic rate [25,26]. These results were also consistent with the study by Fdez.-Güelfo et al. [27]who tested the biological pretreatment of OFMSW using mature compost and reported that 2.5% v/vwas enough to increase the sCOD by roughly 50%, which was the indicator of the solubilization yieldin that study. When compost was added, FW was microbiologically solubilized prior to acidogenicfermentation [28]. In terms of total ammonium nitrogen (TAN), the percentage of solubilization ofammonium also increased abundantly.
To study the effects in long-term conditions, three semi-continuous reactors (A, B, and C) were putinto operation at a pH of 6 without compost addition working under a retention time of 3.5 days. After15 days of operation with approximately the same specific VFA production in terms of g VFA/g VS fed,several doses of mature compost were added to the digesters. Table 2 summarizes the different periodsof FW collection carried out where it is observed that fermenter A (fed with only FW) remained as areference reactor, fermenter B worked always with 2.5% (on dry weight) of mature compost (mixedin the influent FW), and fermenter C worked under different conditions of mature compost addition.Figure 2 monitors the VFA concentration profiles (in terms of mg CODVFA/L), the VFA yield (expressedin terms of g VFA/g VSfed), and the Organic Loading Rate (OLR) applied (in terms of g VS/(L day))during Phase 1. On the other hand, Table 3 shows the main characteristics of the effluent fermentationbroth obtained in each period and Figure 3 shows the monitoring of the individual VFA during thewhole experimental period.
Table 2. Summary of the working conditions for the three semi-continuous mesophilic fermenters inthe periods tested.
Fermenter
Phase 1 2
Stage 1 2 3 4 1 2 3
Period (Days) 0–14 15–34 35–84 85–114 115–146 147–168 168–198
ApH 6 6 6 6 6 6 6
HRT (days) 3.5 3.5 3.5 3.5 3.5 3.5 3.5Compost (% w/w) - - - - - - -
BpH 6 6 6 6 6 6 7
HRT (days) 3.5 3.5 3.5 3.5 3.5 3.5 5Compost (% w/w) - 2.5 2.5 2.5 2.5 2.5 -
CpH 6 6 6 6 7 7 7
HRT (days) 3.5 3.5 3.5 3.5 3.5 5 5Compost (% w/w) - - 3.5 1.5 2.5 2.5 2.5
156
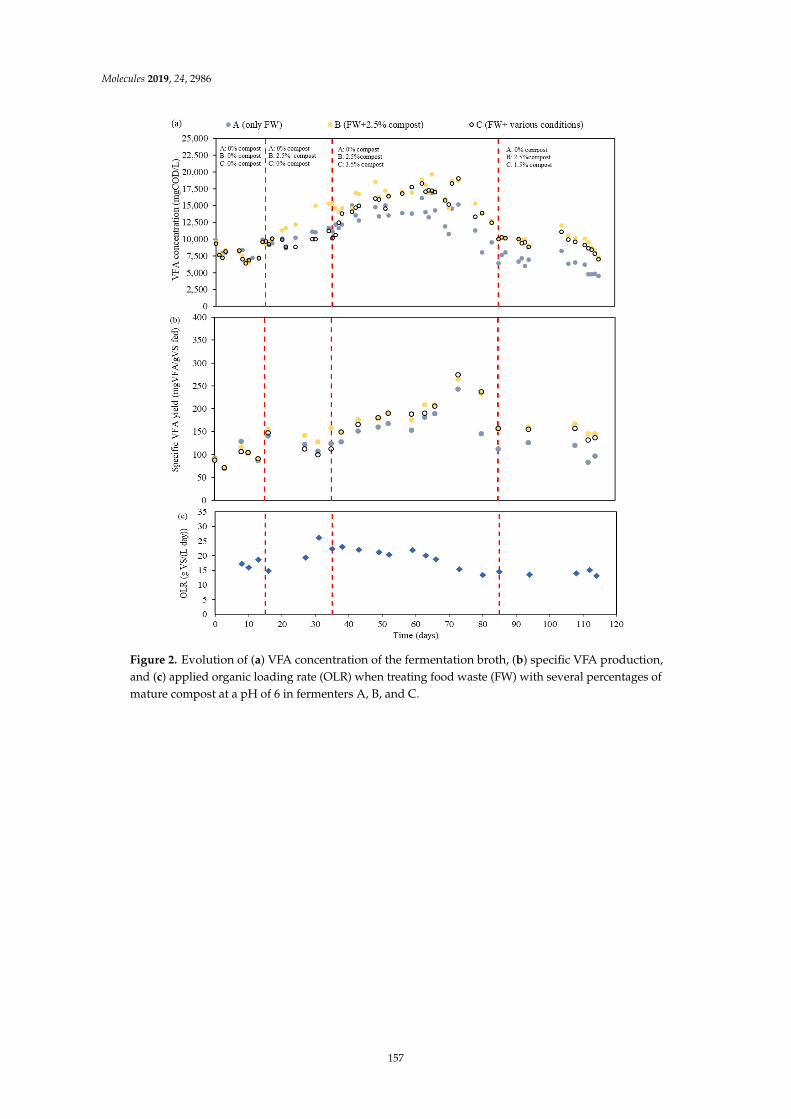
Molecules 2019, 24, 2986Molecules 2019, 24, x FOR PEER REVIEW 5 of 17
Figure 2. Evolution of (a) VFA concentration of the fermentation broth, (b) specific VFA production,
and (c) applied organic loading rate (OLR) when treating food waste (FW) with several percentages
of mature compost at a pH of 6 in fermenters A, B, and C.
Figure 2. Evolution of (a) VFA concentration of the fermentation broth, (b) specific VFA production,and (c) applied organic loading rate (OLR) when treating food waste (FW) with several percentages ofmature compost at a pH of 6 in fermenters A, B, and C.
157
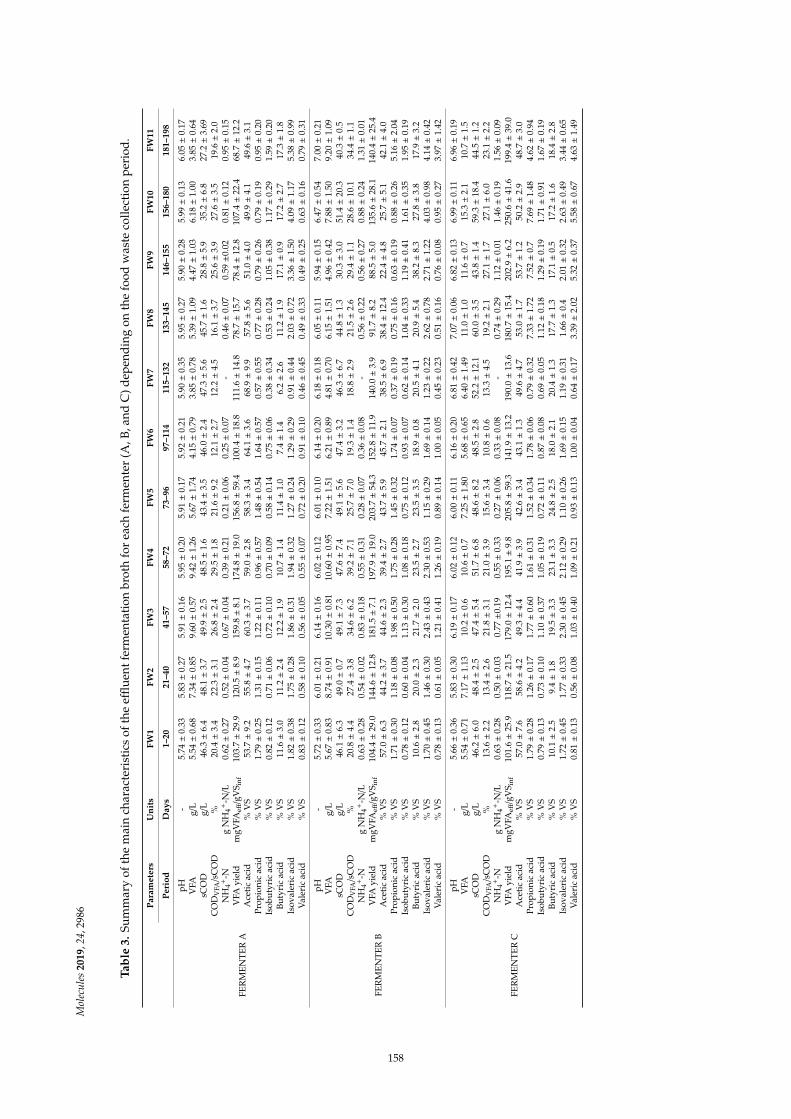
Mol
ecul
es20
19,2
4,29
86
Tabl
e3.
Sum
mar
yof
the
mai
nch
arac
teri
stic
sof
the
efflue
ntfe
rmen
tati
onbr
oth
for
each
ferm
ente
r(A
,B,a
ndC
)dep
endi
ngon
the
food
was
teco
llect
ion
peri
od.
Para
met
ers
Uni
tsFW
1FW
2FW
3FW
4FW
5FW
6FW
7FW
8FW
9FW
10FW
11
Peri
odD
ays
1–20
21–4
041
–57
58–7
273
–96
97–1
1411
5–13
213
3–14
514
6–15
515
6–18
018
1–19
8
FER
MEN
TER
A
pH-
5.74±
0.33
5.83±
0.27
5.91±
0.16
5.95±
0.20
5.91±
0.17
5.92±
0.21
5.90±
0.35
5.95±
0.27
5.90±
0.28
5.99±
0.13
6.05±
0.17
VFA
g/L
5.54±
0.68
7.34±
0.85
9.60±
0.57
9.42±
1.26
5.67±
1.74
4.15±
0.79
3.85±
0.78
5.39±
1.09
4.47±
1.03
6.18±
1.00
3.85±
0.64
sCO
Dg/
L46
.3±
6.4
48.1±
3.7
49.9±
2.5
48.5±
1.6
43.4±
3.5
46.0±
2.4
47.3±
5.6
45.7±
1.6
28.8±
5.9
35.2±
6.8
27.2±
3.69
CO
DV
FA/s
CO
D%
20.4±
3.4
22.3±
3.1
26.8±
2.4
29.5±
1.8
21.6±
9.2
12.1±
2.7
12.2±
4.5
16.1±
3.7
25.6±
3.9
27.6±
3.5
19.6±
2.0
NH
4+-N
gN
H4+
-N/L
0.62±
0.27
0.52±
0.04
0.67±
0.04
0.39±
0.21
0.21±
0.06
0.25±
0.07
-0.
46±
0.07
0.59±0
.02
0.81±
0.12
0.95±
0.15
VFA
yiel
dm
gVFA
eff/g
VS i
nf10
3.7±
29.9
120.
5±
8.9
159.
8±
8.1
174.
8±
19.0
156.
8±
59.4
100.
4±
18.8
111.
6±
14.8
78.7±
15.7
78.4±
12.8
107.
4±
22.4
68.7±
12.2
Ace
tic
acid
%V
S53
.7±
9.2
55.8±
4.7
60.3±
3.7
59.0±
2.8
58.3±
3.4
64.1±
3.6
68.9±
9.9
57.8±
5.6
51.0±
4.0
49.9±
4.1
49.6±
3.1
Prop
ioni
cac
id%
VS
1.79±
0.25
1.31±
0.15
1.22±
0.11
0.96±
0.57
1.48±
0.54
1.64±
0.57
0.57±
0.55
0.77±
0.28
0.79±
0.26
0.79±
0.19
0.95±
0.20
Isob
utyr
icac
id%
VS
0.82±
0.12
0.71±
0.06
0.72±
0.10
0.70±
0.09
0.58±
0.14
0.75±
0.06
0.38±
0.34
0.53±
0.24
1.05±
0.38
1.17±
0.29
1.59±
0.20
Buty
ric
acid
%V
S11
.6±
3.0
11.2±
2.4
12.2±
1.9
10.7±
1.4
11.4±
1.0
7.4±
1.4
6.2±
2.6
11.2±
1.9
17.1±
0.9
17.2±
2.7
17.3±
1.8
Isov
aler
icac
id%
VS
1.82±
0.38
1.75±
0.28
1.86±
0.31
1.94±
0.32
1.27±
0.24
1.29±
0.29
0.91±
0.44
2.03±
0.72
3.36±
1.50
4.09±
1.17
5.38±
0.99
Val
eric
acid
%V
S0.
83±
0.12
0.58±
0.10
0.56±
0.05
0.55±
0.07
0.72±
0.20
0.91±
0.10
0.46±
0.45
0.49±
0.33
0.49±
0.25
0.63±
0.16
0.79±
0.31
FER
MEN
TER
B
pH-
5.72±
0.33
6.01±
0.21
6.14±
0.16
6.02±
0.12
6.01±
0.10
6.14±
0.20
6.18±
0.18
6.05±
0.11
5.94±
0.15
6.47±
0.54
7.00±
0.21
VFA
g/L
5.67±
0.83
8.74±
0.91
10.3
0±
0.81
10.6
0±
0.95
7.22±
1.51
6.21±
0.89
4.81±
0.70
6.15±
1.51
4.96±
0.42
7.88±
1.50
9.20±
1.09
sCO
Dg/
L46
.1±
6.3
49.0±
0.7
49.1±
7.3
47.6±
7.4
49.1±
5.6
47.4±
3.2
46.3±
6.7
44.8±
1.3
30.3±
3.0
51.4±
20.3
40.3±
0.5
CO
DV
FA/s
CO
D%
20.8±
4.4
27.4±
3.8
34.6±
6.2
39.2±
7.1
25.7±
7.0
19.3±
1.4
18.8±
2.9
21.5±
2.6
29.4±
1.1
28.6±
10.1
34.4±
1.1
NH
4+-N
gN
H4+
-N/L
0.63±
0.28
0.54±
0.02
0.83±
0.18
0.55±
0.31
0.28±
0.07
0.36±
0.08
-0.
56±
0.22
0.56±
0.27
0.88±
0.24
1.31±
0.01
VFA
yiel
dm
gVFA
eff/g
VS i
nf10
4.4±
29.0
144.
6±
12.8
181.
5±
7.1
197.
9±
19.0
203.
7±
54.3
152.
8±
11.9
140.
0±
3.9
91.7±
8.2
88.5±
5.0
135.
6±
28.1
140.
4±
25.4
Ace
tic
acid
%V
S57
.0±
6.3
44.2±
3.7
44.6±
2.3
39.4±
2.7
43.7±
5.9
45.7±
2.1
38.5±
6.9
38.4±
12.4
22.4±
4.8
25.7±
5.1
42.1±
4.0
Prop
ioni
cac
id%
VS
1.71±
0.30
1.18±
0.08
1.98±
0.50
1.75±
0.28
1.45±
0.32
1.74±
0.07
0.37±
0.19
0.75±
0.16
0.63±
0.19
0.88±
0.26
5.16±
2.04
Isob
utyr
icac
id%
VS
0.78±
0.12
0.60±
0.04
1.13±
0.30
1.08±
0.18
0.75±
0.12
0.93±
0.07
0.62±
0.14
1.04±
0.33
1.19±
0.41
1.61±
0.35
1.95±
0.19
Buty
ric
acid
%V
S10
.6±
2.8
20.0±
2.3
21.7±
2.0
23.5±
2.7
23.5±
3.5
18.9±
0.8
20.5±
4.1
20.9±
5.4
38.2±
8.3
27.8±
3.8
17.9±
3.2
Isov
aler
icac
id%
VS
1.70±
0.45
1.46±
0.30
2.43±
0.43
2.30±
0.53
1.15±
0.29
1.69±
0.14
1.23±
0.22
2.62±
0.78
2.71±
1.22
4.03±
0.98
4.14±
0.42
Val
eric
acid
%V
S0.
78±
0.13
0.61±
0.05
1.21±
0.41
1.26±
0.19
0.89±
0.14
1.00±
0.05
0.45±
0.23
0.51±
0.16
0.76±
0.08
0.95±
0.27
3.97±
1.42
FER
MEN
TER
C
pH-
5.66±
0.36
5.83±
0.30
6.19±
0.17
6.02±
0.12
6.00±
0.11
6.16±
0.20
6.81±
0.42
7.07±
0.06
6.82±
0.13
6.99±
0.11
6.96±
0.19
VFA
g/L
5.54±
0.71
7.17±
1.13
10.2±
0.6
10.6±
0.7
7.25±
1.80
5.68±
0.65
6.40±
1.49
11.0±
1.0
11.6±
0.7
15.3±
2.1
10.7±
1.5
sCO
Dg/
L46
.2±
6.0
48.4±
2.5
47.4±
5.4
51.7±
6.8
48.6±
8.2
48.5±
2.8
52.2±
12.1
60.0±
3.5
43.8±
1.4
59.3±
18.4
44.5±
1.2
CO
DV
FA/s
CO
D%
13.6±
2.2
13.4±
2.6
21.8±
3.1
21.0±
3.9
15.6±
3.4
10.8±
0.6
13.3±
4.5
19.2±
2.1
27.1±
1.7
27.1±
6.0
23.1±
2.2
NH
4+-N
gN
H4+
-N/L
0.63±
0.28
0.50±
0.03
0.77±0
.19
0.55±
0.33
0.27±
0.06
0.33±
0.08
-0.
74±
0.29
1.12±
0.01
1.46±
0.19
1.56±
0.09
VFA
yiel
dm
gVFA
eff/g
VS i
nf10
1.6±
25.9
118.
7±
21.5
179.
0±
12.4
195.
1±
9.8
205.
8±
59.3
141.
9±
13.2
190.
0±
13.6
180.
7±
15.4
202.
9±
6.2
250.
6±
41.6
199.
4±
39.0
Ace
tic
acid
%V
S57
.0±
7.6
58.6±
4.2
49.3±
4.4
41.9±
3.9
42.6±
3.4
43.1±
1.3
49.6±
4.7
53.0±
1.7
53.7±
1.2
50.2±
2.9
48.7±
3.0
Prop
ioni
cac
id%
VS
1.79±
0.28
1.26±
0.17
1.77±
0.60
1.61±
0.31
1.52±
0.34
1.78±
0.06
0.79±
0.32
7.33±
1.72
7.52±
0.7
7.69±
1.48
4.62±
0.94
Isob
utyr
icac
id%
VS
0.79±
0.13
0.73±
0.10
1.10±
0.37
1.05±
0.19
0.72±
0.11
0.87±
0.08
0.69±
0.05
1.12±
0.18
1.29±
0.19
1.71±
0.91
1.67±
0.19
Buty
ric
acid
%V
S10
.1±
2.5
9.4±
1.8
19.5±
3.3
23.1±
3.3
24.8±
2.5
18.0±
2.1
20.4±
1.3
17.7±
1.3
17.1±
0.5
17.2±
1.6
18.4±
2.8
Isov
aler
icac
id%
VS
1.72±
0.45
1.77±
0.33
2.30±
0.45
2.12±
0.29
1.10±
0.26
1.69±
0.15
1.19±
0.31
1.66±
0.4
2.01±
0.32
2.63±
0.49
3.44±
0.65
Val
eric
acid
%V
S0.
81±
0.13
0.56±
0.08
1.03±
0.40
1.09±
0.21
0.93±
0.13
1.00±
0.04
0.64±
0.17
3.39±
2.02
5.32±
0.37
5.58±
0.67
4.63±
1.49
158
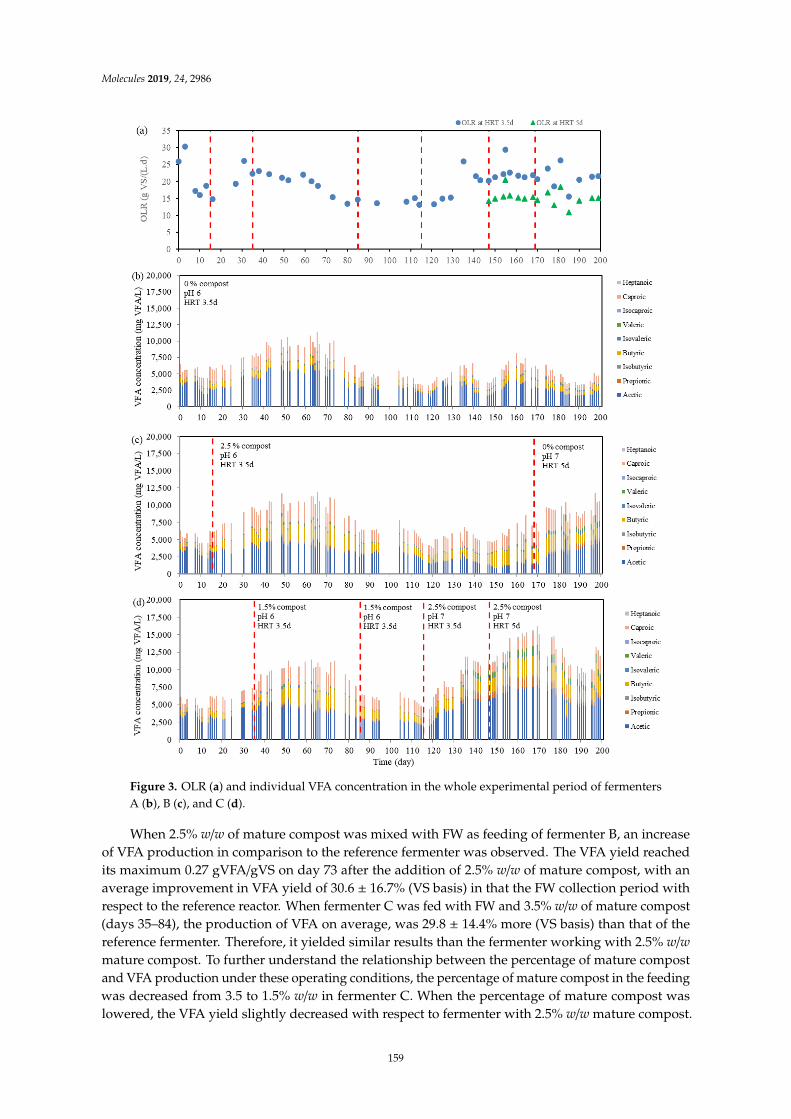
Molecules 2019, 24, 2986Molecules 2019, 24, x FOR PEER REVIEW 7 of 17
Figure 3. OLR (a) and individual VFA concentration in the whole experimental period of fermenters
A (b), B (c), and C (d).
When 2.5% w/w of mature compost was mixed with FW as feeding of fermenter B, an increase
of VFA production in comparison to the reference fermenter was observed. The VFA yield reached
its maximum 0.27 gVFA/gVS on day 73 after the addition of 2.5% w/w of mature compost, with an
average improvement in VFA yield of 30.6 ± 16.7% (VS basis) in that the FW collection period with
respect to the reference reactor. When fermenter C was fed with FW and 3.5% w/w of mature compost
(days 35–84), the production of VFA on average, was 29.8 ± 14.4% more (VS basis) than that of the
reference fermenter. Therefore, it yielded similar results than the fermenter working with 2.5% w/w
mature compost. To further understand the relationship between the percentage of mature compost
and VFA production under these operating conditions, the percentage of mature compost in the
feeding was decreased from 3.5 to 1.5% w/w in fermenter C. When the percentage of mature compost
was lowered, the VFA yield slightly decreased with respect to fermenter with 2.5% w/w mature
Figure 3. OLR (a) and individual VFA concentration in the whole experimental period of fermentersA (b), B (c), and C (d).
When 2.5% w/w of mature compost was mixed with FW as feeding of fermenter B, an increaseof VFA production in comparison to the reference fermenter was observed. The VFA yield reachedits maximum 0.27 gVFA/gVS on day 73 after the addition of 2.5% w/w of mature compost, with anaverage improvement in VFA yield of 30.6 ± 16.7% (VS basis) in that the FW collection period withrespect to the reference reactor. When fermenter C was fed with FW and 3.5% w/w of mature compost(days 35–84), the production of VFA on average, was 29.8 ± 14.4% more (VS basis) than that of thereference fermenter. Therefore, it yielded similar results than the fermenter working with 2.5% w/wmature compost. To further understand the relationship between the percentage of mature compostand VFA production under these operating conditions, the percentage of mature compost in the feedingwas decreased from 3.5 to 1.5% w/w in fermenter C. When the percentage of mature compost waslowered, the VFA yield slightly decreased with respect to fermenter with 2.5% w/w mature compost.
159
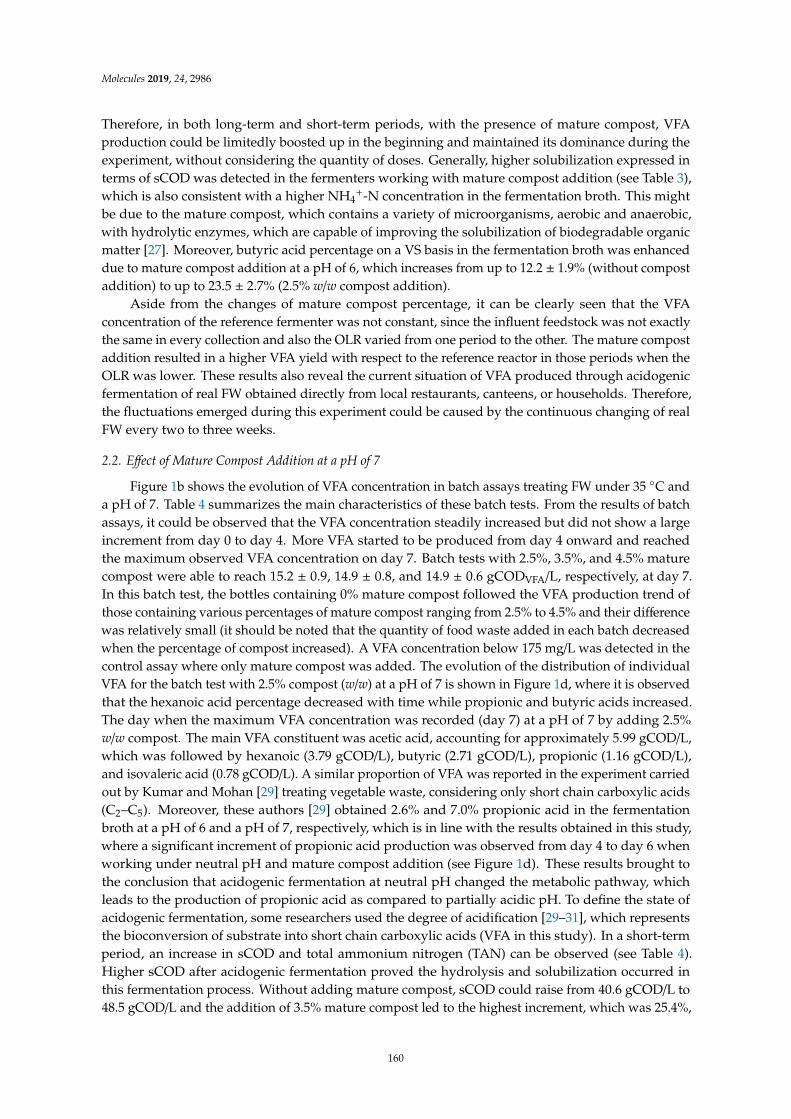
Molecules 2019, 24, 2986
Therefore, in both long-term and short-term periods, with the presence of mature compost, VFAproduction could be limitedly boosted up in the beginning and maintained its dominance during theexperiment, without considering the quantity of doses. Generally, higher solubilization expressed interms of sCOD was detected in the fermenters working with mature compost addition (see Table 3),which is also consistent with a higher NH4
+-N concentration in the fermentation broth. This mightbe due to the mature compost, which contains a variety of microorganisms, aerobic and anaerobic,with hydrolytic enzymes, which are capable of improving the solubilization of biodegradable organicmatter [27]. Moreover, butyric acid percentage on a VS basis in the fermentation broth was enhanceddue to mature compost addition at a pH of 6, which increases from up to 12.2 ± 1.9% (without compostaddition) to up to 23.5 ± 2.7% (2.5% w/w compost addition).
Aside from the changes of mature compost percentage, it can be clearly seen that the VFAconcentration of the reference fermenter was not constant, since the influent feedstock was not exactlythe same in every collection and also the OLR varied from one period to the other. The mature compostaddition resulted in a higher VFA yield with respect to the reference reactor in those periods when theOLR was lower. These results also reveal the current situation of VFA produced through acidogenicfermentation of real FW obtained directly from local restaurants, canteens, or households. Therefore,the fluctuations emerged during this experiment could be caused by the continuous changing of realFW every two to three weeks.
2.2. Effect of Mature Compost Addition at a pH of 7
Figure 1b shows the evolution of VFA concentration in batch assays treating FW under 35 C anda pH of 7. Table 4 summarizes the main characteristics of these batch tests. From the results of batchassays, it could be observed that the VFA concentration steadily increased but did not show a largeincrement from day 0 to day 4. More VFA started to be produced from day 4 onward and reachedthe maximum observed VFA concentration on day 7. Batch tests with 2.5%, 3.5%, and 4.5% maturecompost were able to reach 15.2 ± 0.9, 14.9 ± 0.8, and 14.9 ± 0.6 gCODVFA/L, respectively, at day 7.In this batch test, the bottles containing 0% mature compost followed the VFA production trend ofthose containing various percentages of mature compost ranging from 2.5% to 4.5% and their differencewas relatively small (it should be noted that the quantity of food waste added in each batch decreasedwhen the percentage of compost increased). A VFA concentration below 175 mg/L was detected in thecontrol assay where only mature compost was added. The evolution of the distribution of individualVFA for the batch test with 2.5% compost (w/w) at a pH of 7 is shown in Figure 1d, where it is observedthat the hexanoic acid percentage decreased with time while propionic and butyric acids increased.The day when the maximum VFA concentration was recorded (day 7) at a pH of 7 by adding 2.5%w/w compost. The main VFA constituent was acetic acid, accounting for approximately 5.99 gCOD/L,which was followed by hexanoic (3.79 gCOD/L), butyric (2.71 gCOD/L), propionic (1.16 gCOD/L),and isovaleric acid (0.78 gCOD/L). A similar proportion of VFA was reported in the experiment carriedout by Kumar and Mohan [29] treating vegetable waste, considering only short chain carboxylic acids(C2–C5). Moreover, these authors [29] obtained 2.6% and 7.0% propionic acid in the fermentationbroth at a pH of 6 and a pH of 7, respectively, which is in line with the results obtained in this study,where a significant increment of propionic acid production was observed from day 4 to day 6 whenworking under neutral pH and mature compost addition (see Figure 1d). These results brought tothe conclusion that acidogenic fermentation at neutral pH changed the metabolic pathway, whichleads to the production of propionic acid as compared to partially acidic pH. To define the state ofacidogenic fermentation, some researchers used the degree of acidification [29–31], which representsthe bioconversion of substrate into short chain carboxylic acids (VFA in this study). In a short-termperiod, an increase in sCOD and total ammonium nitrogen (TAN) can be observed (see Table 4).Higher sCOD after acidogenic fermentation proved the hydrolysis and solubilization occurred inthis fermentation process. Without adding mature compost, sCOD could raise from 40.6 gCOD/L to48.5 gCOD/L and the addition of 3.5% mature compost led to the highest increment, which was 25.4%,
160
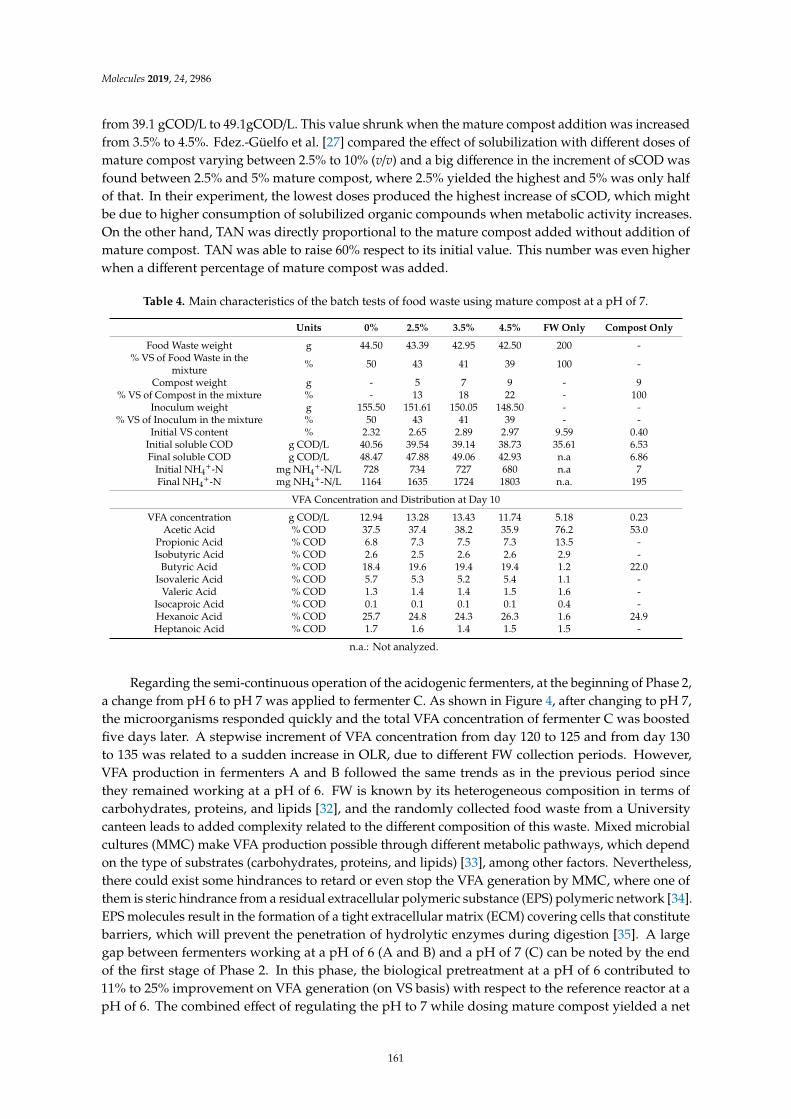
Molecules 2019, 24, 2986
from 39.1 gCOD/L to 49.1gCOD/L. This value shrunk when the mature compost addition was increasedfrom 3.5% to 4.5%. Fdez.-Güelfo et al. [27] compared the effect of solubilization with different doses ofmature compost varying between 2.5% to 10% (v/v) and a big difference in the increment of sCOD wasfound between 2.5% and 5% mature compost, where 2.5% yielded the highest and 5% was only halfof that. In their experiment, the lowest doses produced the highest increase of sCOD, which mightbe due to higher consumption of solubilized organic compounds when metabolic activity increases.On the other hand, TAN was directly proportional to the mature compost added without addition ofmature compost. TAN was able to raise 60% respect to its initial value. This number was even higherwhen a different percentage of mature compost was added.
Table 4. Main characteristics of the batch tests of food waste using mature compost at a pH of 7.
Units 0% 2.5% 3.5% 4.5% FW Only Compost Only
Food Waste weight g 44.50 43.39 42.95 42.50 200 -% VS of Food Waste in the
mixture % 50 43 41 39 100 -
Compost weight g - 5 7 9 - 9% VS of Compost in the mixture % - 13 18 22 - 100
Inoculum weight g 155.50 151.61 150.05 148.50 - -% VS of Inoculum in the mixture % 50 43 41 39 - -
Initial VS content % 2.32 2.65 2.89 2.97 9.59 0.40Initial soluble COD g COD/L 40.56 39.54 39.14 38.73 35.61 6.53Final soluble COD g COD/L 48.47 47.88 49.06 42.93 n.a 6.86
Initial NH4+-N mg NH4
+-N/L 728 734 727 680 n.a 7Final NH4
+-N mg NH4+-N/L 1164 1635 1724 1803 n.a. 195
VFA Concentration and Distribution at Day 10
VFA concentration g COD/L 12.94 13.28 13.43 11.74 5.18 0.23Acetic Acid % COD 37.5 37.4 38.2 35.9 76.2 53.0
Propionic Acid % COD 6.8 7.3 7.5 7.3 13.5 -Isobutyric Acid % COD 2.6 2.5 2.6 2.6 2.9 -
Butyric Acid % COD 18.4 19.6 19.4 19.4 1.2 22.0Isovaleric Acid % COD 5.7 5.3 5.2 5.4 1.1 -
Valeric Acid % COD 1.3 1.4 1.4 1.5 1.6 -Isocaproic Acid % COD 0.1 0.1 0.1 0.1 0.4 -Hexanoic Acid % COD 25.7 24.8 24.3 26.3 1.6 24.9Heptanoic Acid % COD 1.7 1.6 1.4 1.5 1.5 -
n.a.: Not analyzed.
Regarding the semi-continuous operation of the acidogenic fermenters, at the beginning of Phase 2,a change from pH 6 to pH 7 was applied to fermenter C. As shown in Figure 4, after changing to pH 7,the microorganisms responded quickly and the total VFA concentration of fermenter C was boostedfive days later. A stepwise increment of VFA concentration from day 120 to 125 and from day 130to 135 was related to a sudden increase in OLR, due to different FW collection periods. However,VFA production in fermenters A and B followed the same trends as in the previous period sincethey remained working at a pH of 6. FW is known by its heterogeneous composition in terms ofcarbohydrates, proteins, and lipids [32], and the randomly collected food waste from a Universitycanteen leads to added complexity related to the different composition of this waste. Mixed microbialcultures (MMC) make VFA production possible through different metabolic pathways, which dependon the type of substrates (carbohydrates, proteins, and lipids) [33], among other factors. Nevertheless,there could exist some hindrances to retard or even stop the VFA generation by MMC, where one ofthem is steric hindrance from a residual extracellular polymeric substance (EPS) polymeric network [34].EPS molecules result in the formation of a tight extracellular matrix (ECM) covering cells that constitutebarriers, which will prevent the penetration of hydrolytic enzymes during digestion [35]. A largegap between fermenters working at a pH of 6 (A and B) and a pH of 7 (C) can be noted by the endof the first stage of Phase 2. In this phase, the biological pretreatment at a pH of 6 contributed to11% to 25% improvement on VFA generation (on VS basis) with respect to the reference reactor at apH of 6. The combined effect of regulating the pH to 7 while dosing mature compost yielded a net
161
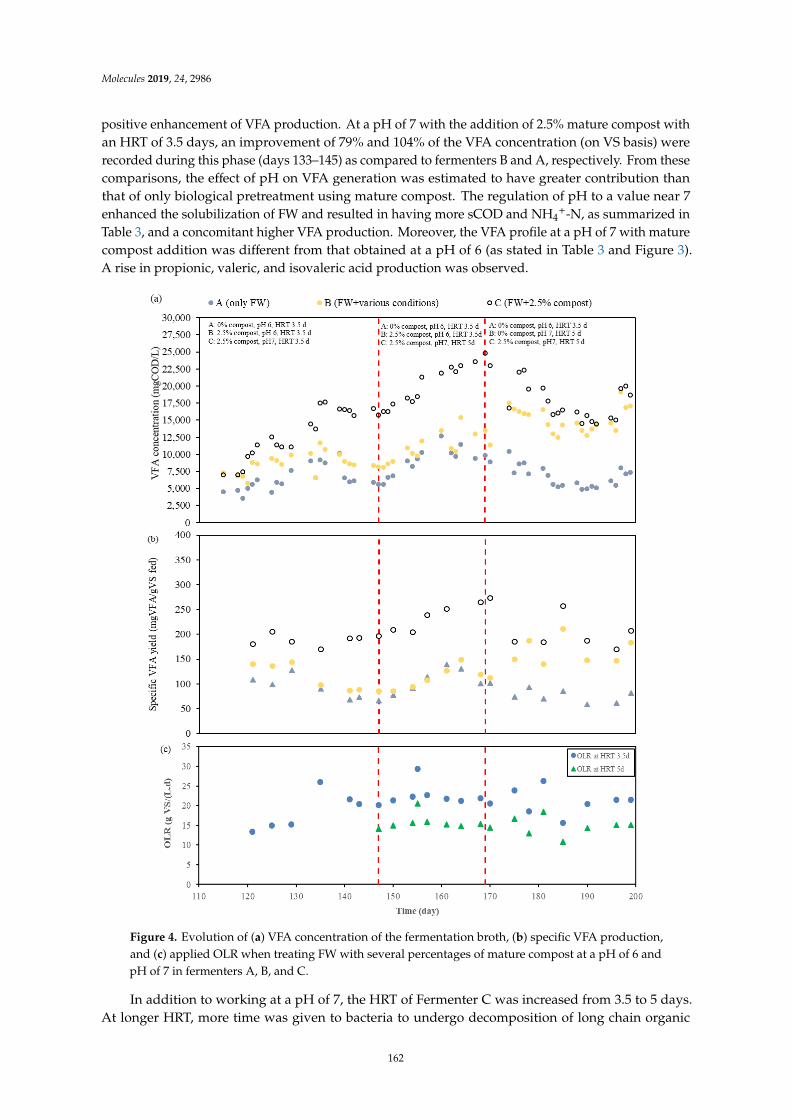
Molecules 2019, 24, 2986
positive enhancement of VFA production. At a pH of 7 with the addition of 2.5% mature compost withan HRT of 3.5 days, an improvement of 79% and 104% of the VFA concentration (on VS basis) wererecorded during this phase (days 133–145) as compared to fermenters B and A, respectively. From thesecomparisons, the effect of pH on VFA generation was estimated to have greater contribution thanthat of only biological pretreatment using mature compost. The regulation of pH to a value near 7enhanced the solubilization of FW and resulted in having more sCOD and NH4
+-N, as summarized inTable 3, and a concomitant higher VFA production. Moreover, the VFA profile at a pH of 7 with maturecompost addition was different from that obtained at a pH of 6 (as stated in Table 3 and Figure 3).A rise in propionic, valeric, and isovaleric acid production was observed.
Molecules 2019, 24, x FOR PEER REVIEW 10 of 17
concentration (on VS basis) were recorded during this phase (days 133–145) as compared to
fermenters B and A, respectively. From these comparisons, the effect of pH on VFA generation was
estimated to have greater contribution than that of only biological pretreatment using mature
compost. The regulation of pH to a value near 7 enhanced the solubilization of FW and resulted in
having more sCOD and NH4+-N, as summarized in Table 3, and a concomitant higher VFA
production. Moreover, the VFA profile at a pH of 7 with mature compost addition was different from
that obtained at a pH of 6 (as stated in Table 3 and Figure 3). A rise in propionic, valeric, and isovaleric
acid production was observed.
Figure 4. Evolution of (a) VFA concentration of the fermentation broth, (b) specific VFA production,
and (c) applied OLR when treating FW with several percentages of mature compost at a pH of 6 and
pH of 7 in fermenters A, B, and C.
Figure 4. Evolution of (a) VFA concentration of the fermentation broth, (b) specific VFA production,and (c) applied OLR when treating FW with several percentages of mature compost at a pH of 6 andpH of 7 in fermenters A, B, and C.
In addition to working at a pH of 7, the HRT of Fermenter C was increased from 3.5 to 5 days.At longer HRT, more time was given to bacteria to undergo decomposition of long chain organic
162
Molecules 2019, 24, 2986
molecules, especially the rate-limiting hydrolysis step. Although it could be possible to achieve higherVFA production, risk of interference of methanogenic activities should also be taken into account [32].Figures 3 and 4 show the VFA concentration of the semi-continuous operation of this fermenter.When HRT was increased to 5 days in fermenter C, VFA concentration in the fermentation brothincreased linearly from 15.8 gCOD/L to 24.8 gCOD/L and remained within these limits in the thirdstage, with changes related mainly to OLR and the collected FW. In this case, it was unclear whetherextending HRT from 3.5 days to 5 days had led to higher VFA yield, since, even though, the VFAyield increased during this period in Fermenter C, the VFA yield improvement with respect to thereference reactor (fermenter A) was in the same range. Kuruti et al. [36] performed some experimentsto examine the optimal HRT for acidogenic fermentation and found out that, irrespective of the pH,batch fermentation broths were stabilized on day 4, 7, and 5 when working with glucose, cattle manure,and poultry litter, respectively. Moretto et al. [37] also suggested to consider HRT of 6 days to achievebest performance of process yield and maximum VFA level through the results of their experimentswhen treating a mixture of squeezed OFMSW and thickened waste activated sludge at a pH of 9and mesophilic temperature (37 C). In this study, the mesophilic fermenter containing 2.5% maturecompost and operating at a pH of 7 produced the highest quantity of VFA when compared with theother two in operation.
Regarding the VFA profile (on VS basis) in this fermenter, acetic, propionic, butyric, isobutyric,valeric, and isovaleric acids accounted for the 48.7 ± 3.0%, 4.6 ± 0.9%, 18.4 ± 2.8%, 1.67 ± 0.19%,4.63 ± 1.49%, and 3.44 ± 0.65%, respectively, of the total amount of VFA produced during the laststage of the experiment in accordance to the last FW collection period. Furthermore, in the last stage,the working pH of Fermenter B was regulated to 7, the retention time was extended to 5 days, and themature compost addition was stopped. The net VFA production after making these modifications waspositive, and a pH regulation to 7, together with increasing HRT, had greater effects on VFA generation.Comparing VFA production from fermenter B and C, VFA yield was higher for the fermenter workingwith mature compost but it was not possible to conclude that, at a pH of 7 and HRT of 5 days, the effectof mature compost on VFA production was as significant as when working at a pH of 6 (Phase 1).However, COD solubilization and NH4
+-N release was higher when adding mature compost at a pHof 7 and HRT 5 days, which led to a lower ratio of VFA concentration with respect to soluble COD forthe fermenter with mature compost addition, as stated in Table 3.
3. Materials and Methods
3.1. Substrate and Inoculum
The FW was collected from a university canteen every two weeks, approximately. Although thecomposition changed between collection periods, it mainly contained pasta, potato, meat, rice, noodles,bread, vegetables, and fruit peels. Once collected, FW was shredded (Bosch, Spain, MMB66G5M) andmixed with deionized water in a proportion of approximately 1:2 by volume, to obtain a concentratedfeedstock of FW. This FW was stored in a refrigerator chamber at 4 C until its usage. When the feedstockwas needed for acidogenic fermentation, this substrate was diluted with deionized water to controlthe contents of total solids (TS, 4.45–7.57%) and volatile solids (VS, 3.78–6.43 %) so that their valueswere within a certain range during the experiments. The characterization of FW collected in differentperiods is shown in Table 5. The mature compost was collected from a full-scale mechanical-biologicaltreatment (MBT) plant in the metropolitan area of Barcelona and came from tunnel composting ofOFMSW and park and garden waste. The collected compost contained 52% of TS and 27% of VS.Once it was collected, compost was stored in a closed vessel to preserve its original moisture contents.Unlike FW, the mature compost was collected in one single time. Therefore, the characteristics ofthe mature compost were constant throughout the experiments. The inoculum used was effluent ofacidogenic fermenter treating FW at a pH of 6 and hydraulic retention time (HRT) of 3.5 days from aprevious work [15].
163
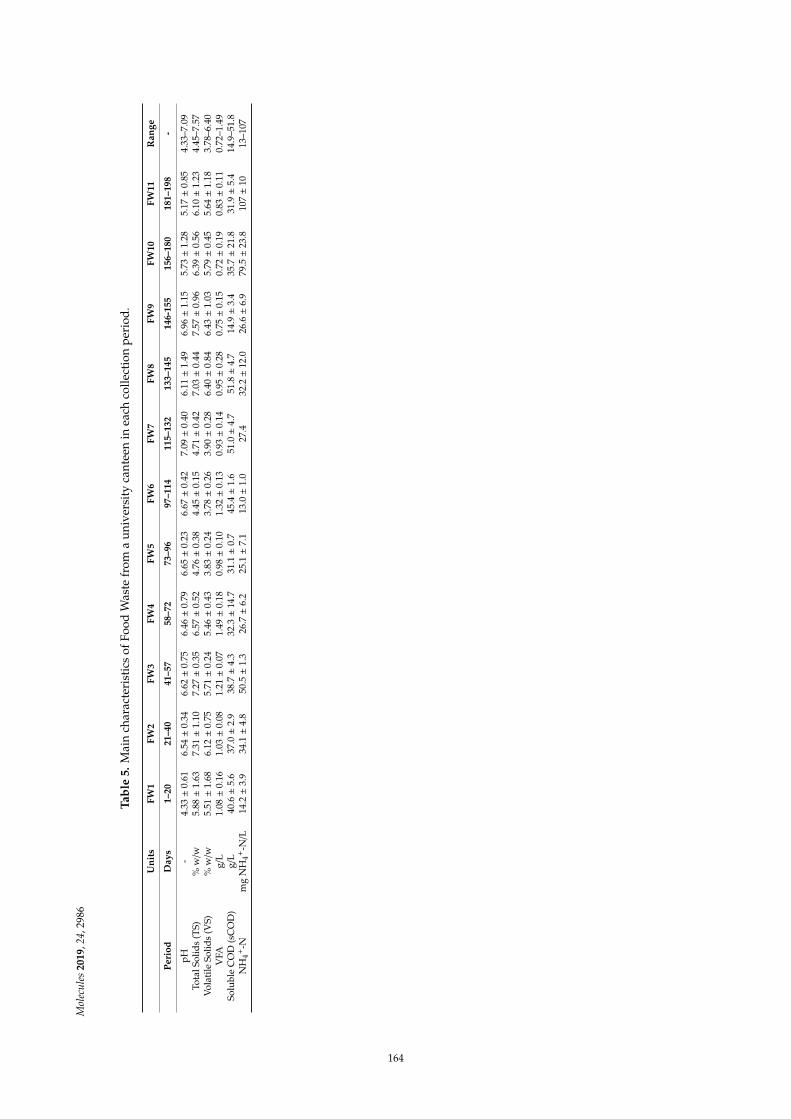
Mol
ecul
es20
19,2
4,29
86
Tabl
e5.
Mai
nch
arac
teri
stic
sof
Food
Was
tefr
oma
univ
ersi
tyca
ntee
nin
each
colle
ctio
npe
riod
.
Uni
tsFW
1FW
2FW
3FW
4FW
5FW
6FW
7FW
8FW
9FW
10FW
11R
ange
Peri
odD
ays
1–20
21–4
041
–57
58–7
273
–96
97–1
1411
5–13
213
3–14
514
6-15
515
6–18
018
1–19
8-
pH-
4.33±
0.61
6.54±
0.34
6.62±
0.75
6.46±
0.79
6.65±
0.23
6.67±
0.42
7.09±
0.40
6.11±
1.49
6.96±
1.15
5.73±
1.28
5.17±
0.85
4.33
–7.0
9To
talS
olid
s(T
S)%
w/w
5.88±
1.63
7.31±
1.10
7.27±
0.35
6.57±
0.52
4.76±
0.38
4.45±
0.15
4.71±
0.42
7.03±
0.44
7.57±
0.96
6.39±
0.56
6.10±
1.23
4.45
–7.5
7Vo
lati
leSo
lids
(VS)
%w
/w5.
51±
1.68
6.12±
0.75
5.71±
0.24
5.46±
0.43
3.83±
0.24
3.78±
0.26
3.90±
0.28
6.40±
0.84
6.43±
1.03
5.79±
0.45
5.64±
1.18
3.78
–6.4
0V
FAg/
L1.
08±
0.16
1.03±
0.08
1.21±
0.07
1.49±
0.18
0.98±
0.10
1.32±
0.13
0.93±
0.14
0.95±
0.28
0.75±
0.15
0.72±
0.19
0.83±
0.11
0.72
–1.4
9So
lubl
eC
OD
(sC
OD
)g/
L40
.6±
5.6
37.0±
2.9
38.7±
4.3
32.3±
14.7
31.1±
0.7
45.4±
1.6
51.0±
4.7
51.8±
4.7
14.9±
3.4
35.7±
21.8
31.9±
5.4
14.9
–51.
8N
H4+
-Nm
gN
H4+
-N/L
14.2±
3.9
34.1±
4.8
50.5±
1.3
26.7±
6.2
25.1±
7.1
13.0±
1.0
27.4
32.2±
12.0
26.6±
6.9
79.5±
23.8
107±
1013
–107
164
Molecules 2019, 24, 2986
3.2. Experimental Set-Up
3.2.1. Batch Assays: FW with Mature Compost
Discontinuous assays were performed in serum bottles of a 200-mL effective volume with differentmature compost doses (0, 2.5, 3.5, and 4.5% w/w) to study the effects of mature compost on VFAproduction and their individual VFA profile. Serum bottles were filled with inoculum and substrateaccording to their volatile solids content, to obtain an inoculum to substrate ratio (ISR) of 1:1 by weight.Corresponding mature compost doses (0, 2.5, 3.5, and 4.5% w/w) were then added. Blank samples wereprepared as a control, including inoculum, substrate, and mature compost (three times the weight for4.5% w/w and filling with deionized water). In different periods of time, two batches were carried outoperating at a pH of 6 and a pH of 7 by using sodium bicarbonate (NaHCO3) and hydrochloric acid(10 M HCl) for pH adjustment. Before the bottles were sealed with a stopper containing PTFE/Butylseptum, nitrogen gas was flushed through the headspace to remove residual air. These bottles werelocated inside an incubator (Memmert GmbH + Co. KG, Schwabach, Germany, Pass-through ovensUF750) working at a mesophilic temperature (35 C). Furthermore, 2.5 mL of the sample were takenand centrifuged at 4000 rpm for 15 min. The supernatant was filtered by a 0.45-µm syringe filter. Partof this filtered sample was used for soluble chemical oxygen demand (sCOD) and total ammoniumnitrogen (TAN) analysis in day 0 and day 7 while the other part of the filtered sample was prepared forVFA analysis where this operation was performed daily from day 0 to 7, and, on day 10, to check thestability of VFA production. The pH measurements were performed in the beginning (day 0) and theend of the batch test (day 10), and two selected days in between (day 3 and 7). In these days when themeasurement was carried out, pH was adjusted to their initial pre-set values in order to avoid differentbehaviors on VFA production due to pH fluctuation. Analyses were performed in duplicate for thestandard deviation calculation.
3.2.2. Semi Continuous Operation
For this study, three jacketed lab-scale reactors with an effective working volume of 4.5 L andmechanically stirred (using IKA-Werke, IKA Werke GmbH & Co. KG, Staufen, Germany, RW 16 basicfunctioning at approximately 150 rpm) were used as acidogenic fermenters at mesophilic conditions(35 C) working with FW. These fermenters were operated at HRT of 3.5 days and the equivalentquantity of substrate (FW) was fed manually once per day (fed-batch culture). During feeding anddraw-off operations, a minimum amount of nitrogen gas was flushed through the headspace offermenters to avoid entering air.
At the beginning of the experiment, the three fermenters (A, B, and C) were fed with FW for 15 days.At this moment, all fermenters were working at HRT of 3.5 days and a pH of 6, and NaHCO3 wasused to increase alkalinity of the fermentation broth and to adjust pH to the pre-set value. The wholeexperiment was carried out under mesophilic conditions (35 C). Fermenter A remained as the referencereactor and was always fed with FW without adding mature compost.
To analyze the long-term effect of biological pretreatment using mature compost on the acidogenicfermenter, fermenter B was fed with a mixture of FW and compost, which represented the 2.5% w/w.In fermenter C, different doses of mature compost were added to test the effect of the quantity ofmature compost addition. Later, in addition, to study the effects of biological pretreatment, pH andHRT were taken into consideration. Table 2 summarizes the compost addition, working pH, and HRTapplied in each acidogenic fermenter. As stated in this Table, to evaluate the fermenters’ performanceat a different pH and HRT conditions, the reference fermenter (A) worked at a pH of 6, HRT 3.5 days,and without mature compost addition and the other fermenters could work at a pH of 6 or 7, at differentHRT of 3.5 or 5 days, and at different mature compost dosages (up to 3.5% w/w) depending on theparameter to be studied. Samples were taken daily on weekdays for continuous assessment of VFAand effluent pH, and other characterizations were analyzed two to three times per week.
165
Molecules 2019, 24, 2986
3.3. Analytical Methods
The analysis of soluble COD, total solids (TS), and volatile solids (VS) were performed inaccordance to the Standards Methods for the Examination of Water and Wastewater [38]. For thedetermination of the total ammonium nitrogen (TAN) concentration, the sample was centrifuged at4000 rpm for 15 min, the supernatant was filtered through a 0.45 µm-pore size regenerated cellulosesyringe filter. Samples were properly diluted to have the TAN range between 1 to 100 ppm and wereanalyzed with an ammonium ion selective electrode (Thermo Scientific, Beverly, MA, USA, Orion9512HPBNWP). The pH was determined using a Crison pH electrode (pH series 52–04). Filteredsamples were acidified with 85% phosphoric acid for VFA concentration analysis. Individual VFAincluding acetic, propionic, isobutyric, butyric, isovaleric, valeric, isocaproic, caproic, and heptanoicacids were determined by gas chromatography (Shimadzu GC 2010 plus) (Shimadzu Corporation,Kyoto, Japan) equipped with a capillary column (Nukol™, 15 m × 0.53 mm × 0.5 µm) and flameionization detector (FID) (Shimadzu Corporation, Kyoto, Japan). The initial temperature of capillarycolumn was 80 C and increased at 10 C/min to 110 C, from 110 C to 145 C at 15 C/min, whichwas followed by an increment of 20 C/min to reach 190 C. The temperature was 280 C and 300 C tothe injector and detector, respectively. The carrier gas was helium, the fuel gas was hydrogen, and theoxidizing gas was synthetic air. Hence, individual VFA were detected by the programmed method forthis gas chromatograph.
4. Conclusions
In this study, FW collected from a university canteen was treated in acidogenic fermentersto produce volatile fatty acids (VFA) under biological pretreatment with mature compost. Batchassays working at a pH of 6 revealed an increment of 9.0%, 7.9%, and 4.1% (on COD basis) of VFAconcentration when adding 2.5%, 3.5%, and 4.5% w/w of mature compost, respectively, even thoughthe VS concentration of food waste was lower in the tests with increasing doses of mature compost.When increasing the operating pH to 7, batch tests also revealed higher COD solubilization due tomature compost addition, even though it did not significantly impact enhanced VFA concentration inthe fermentation effluent.
The addition of 2.5% w/w of mature compost to a semi-continuous acidogenic fermenter treatingFW at mesophilic conditions (35 C), pH of 6, and HRT of 3.5 days led to an improvement of thevolatile fatty acids (VFA) yield up to 51.2 ± 12.3% (on VFA basis) when compared to the referencereactor working without mature compost addition. The mature compost dosage at a pH of 6 resultedin a higher percentage of butyric acid on a VS basis in the fermentation broth, which increases from upto 12.2 ± 1.9% (0% compost addition) to up to 23.5 ± 2.7% (2.5% w/w compost addition). Moreover,a higher sCOD content and a higher NH4
+-N concentration was monitored in reactors working withmature compost, as a result of an enhanced hydrolytic activity. Considering the reactor working at apH of 6 with 2.5% w/w addition, a higher compost addition of 3.5% w/w did not lead to higher VFAyield, while a slightly lower VFA production was recorded when working with 1.5% w/w.
When pH was changed from a pH of 6 to a pH of 7, VFA production was boosted and a higherproduction of propionic and valeric acids was recorded with respect to the reactor working at a pH of6. In the semi-continuous fermenters with addition of 2.5% w/w mature compost at a pH of 7 withan HRT of 3.5 days, an improvement of 79% and 104% of the VFA concentration (on VS basis) wererecorded as compared to fermenters working at a pH of 6 with 2.5 and 0% w/w of mature compostaddition, respectively. Therefore, the effect of pH on VFA generation was estimated to have greatercontribution than that of only biological pretreatment using mature compost. At a pH of 7, the VFAyield was higher for the fermenter working with mature compost but it was not possible to concludethat at a pH of 7 and HRT of 5 days, the effect of mature compost on VFA production was as significantas in a pH of 6. However, COD solubilization and NH4
+-N release was higher when adding maturecompost at a pH of 7 and HRT 5 days, which led to a lower ratio of VFA concentration with respect tosoluble COD for the fermenter with mature compost addition.
166
Molecules 2019, 24, 2986
Author Contributions: Conceptualization, Y.K.C., J.D. and J.M.A.; Methodology, Y.K.C., J.D. and J.M.A.; Validation,J.D. and J.M.A.; Formal analysis, Y.K.C. and J.D.; Investigation, Y.K.C.; Resources, Y.K.C., J.D. and J.M.A.; Datacuration, Y.K.C.; Writing—original draft preparation, Y.K.C.; Writing—review and editing, Y.K.C., J.D. and J.M.A.;Visualization, Y.K.C. and J.D.; Supervision, J.D. and J.M.A.; Project administration, Y.K.C., J.D. and J.M.A.; Fundingacquisition, J.M.A.
Funding: The European Union (Programme Horizon 2020) for RES URBIS project, grant agreement No. 730349and the Spanish Ministerio de Economia y Competitividad (CTM2016-76275-R Project) funded this research.
Acknowledgments: The authors want to acknowledge the Institute of Water Research of University of Barcelona.
Conflicts of Interest: The authors declare no conflict of interest. The funders had no role in the design of thestudy; in the collection, analyses, or interpretation of data; in the writing of the manuscript, or in the decision topublish the results.
References
1. Fernández-Arévalo, T.; Lizarralde, I.; Fdz-Polanco, F.; Pérez-Elvira, S.; Garrido, J.; Puig, S.; Poch, M.; Grau, P.;Ayesa, E. Quantitative assessment of energy and resource recovery in wastewater treatment plants based onplant-wide simulations. Water Res. 2017, 118, 272–288. [CrossRef] [PubMed]
2. Yin, J.; Yu, X.; Wang, K.; Shen, D. Acidogenic fermentation of the main substrates of food waste to producevolatile fatty acids. Int. J. Hydrog. Energy 2016, 41, 21713–21720. [CrossRef]
3. Braguglia, C.M.; Gallipoli, A.; Gianico, A.; Pagliaccia, P. Anaerobic bioconversion of food waste into energy:A critical review. Bioresour. Technol. 2018, 248, 37–56. [CrossRef] [PubMed]
4. Bugnicourt, E.; Cinelli, P.; Lazzeri, A.; Alvarez, V. Polyhydroxyalkanoate (PHA): Review of synthesis,characteristics, processing and potential applications in packaging. Express Polym. Lett. 2014, 8, 791–808.[CrossRef]
5. Kourmentza, C.; Kornaros, M. Biotransformation of volatile fatty acids to polyhydroxyalkanoates byemploying mixed microbial consortia: The effect of pH and carbon source. Bioresour. Technol. 2016, 222,388–398. [CrossRef]
6. Singh, A.K.; Srivastava, J.K.; Chandel, A.K.; Sharma, L.; Mallick, N.; Singh, S.P. Biomedical applications ofmicrobially engineered polyhydroxyalkanoates: An insight into recent advances, bottlenecks, and solutions.Appl. Microbiol. Biotechnol. 2019, 103, 2007–2032. [CrossRef]
7. Tong, J.; Chen, Y. Recovery of nitrogen and phosphorus from alkaline fermentation liquid of waste activatedsludge and application of the fermentation liquid to promote biological municipal wastewater treatment.Water Res. 2009, 43, 2969–2976. [CrossRef]
8. Lim, S.-J.; Choi, D.W.; Lee, W.G.; Kwon, S.; Chang, H.N. Volatile fatty acids production from food wastes andits application to biological nutrient removal. Bioprocess Eng. 2000, 22, 543–545. [CrossRef]
9. Cavdar, P.; Yilmaz, E.; Tugtas, A.E.; Calli, B. Acidogenic fermentation of municipal solid waste and itsapplication to bio-electricity production via microbial fuel cells (MFCs). Water Sci. Technol. 2011, 64, 789–795.[CrossRef]
10. Atasoy, M.; Owusu-Agyeman, I.; Plaza, E.; Cetecioglu, Z. Bio-based volatile fatty acid production andrecovery from waste streams: Current status and future challenges. Bioresour. Technol. 2018, 268, 773–786.[CrossRef]
11. Lim, S.-J.; Kim, B.J.; Jeong, C.-M.; Choi, J.-D.-R.; Ahn, Y.H.; Chang, H.N. Anaerobic organic acid productionof food waste in once-a-day feeding and drawing-off bioreactor. Bioresour. Technol. 2008, 99, 7866–7874.[CrossRef] [PubMed]
12. Lee, W.S.; Chua, S.M.A.; Yeoh, H.K.; Ngoh, G.C. A review of the production and applications of waste-derivedvolatile fatty acids. Chem. Eng. J. 2014, 235, 83–99. [CrossRef]
13. Yin, B.; Liu, H.; Wang, Y.; Bai, J.; Liu, H.; Fu, B. Improving volatile fatty acids production by exploiting theresidual substrates in post-fermented sludge: Protease catalysis of refractory protein. Bioresour. Technol.2016, 203, 124–131. [CrossRef] [PubMed]
14. Cesaro, A.; Belgiorno, V. Sonolysis and ozonation as pretreatment for anaerobic digestion of solid organicwaste. Ultrason. Sonochem. 2013, 20, 931–936. [CrossRef] [PubMed]
15. Cheah, Y.K.; Vidal-Antich, C.; Dosta, J.; Mata-Álvarez, J. Volatile fatty acid production from mesophilicacidogenic fermentation of organic fraction of municipal solid waste and food waste under acidic andalkaline pH. Environ. Sci. Pollut. Res. 2019, 1–14. [CrossRef] [PubMed]
167
Molecules 2019, 24, 2986
16. Rughoonundun, H.; Granda, C.; Mohee, R.; Holtzapple, M.T. Effect of thermochemical pretreatment onsewage sludge and its impact on carboxylic acids production. Waste Manag. 2010, 30, 1614–1621. [CrossRef]
17. Hendriks, A.T.W.M.; Zeeman, G. Pretreatments to enhance the digestibility of lignocellulosic biomass.Bioresour. Technol. 2009, 100, 10–18. [CrossRef]
18. Carrère, H.; Dumas, C.; Battimelli, A.; Batstone, D.J.; Delgenès, J.P.; Steyer, J.P.; Ferrer, I. Pretreatment methodsto improve sludge anaerobic degradability: A review. J. Hazard. Mater. 2010, 183, 1–15. [CrossRef]
19. Ariunbaatar, J.; Panico, A.; Esposito, G.; Pirozzi, F.; Lens, P.N.L. Pretreatment methods to enhance anaerobicdigestion of organic solid waste. Appl. Energy 2014, 123, 143–156. [CrossRef]
20. Ma, J.; Duong, T.H.; Smits, M.; Verstraete, W.; Carballa, M. Enhanced biomethanation of kitchen waste bydifferent pre-treatments. Bioresour. Technol. 2011, 102, 592–599. [CrossRef]
21. Bolzonella, D.; Battista, F.; Cavinato, C.; Gottardo, M.; Micolucci, F.; Lyberatos, G.; Pavan, P. Recentdevelopments in biohythane production from household food wastes: A review. Bioresour. Technol. 2018, 257,311–319. [CrossRef]
22. Strazzera, G.; Battista, F.; Garcia, N.H.; Frison, N.; Bolzonella, D. Volatile fatty acids production from foodwastes for biorefinery platforms: A review. J. Environ. Manag. 2018, 226, 278–288. [CrossRef]
23. Hu, Z.H.; Yu, H.Q. Application of rumen microorganisms for enhanced anaerobic fermentation of cornstover. Process Biochem. 2005, 40, 2371–2377. [CrossRef]
24. Wall, D.M.; Straccialini, B.; Allen, E.; Nolan, P.; Herrmann, C.; O’Kiely, P.; Murphy, J.D. Investigation ofeffect of particle size and rumen fluid addition on specific methane yields of high lignocellulose grass silage.Bioresour. Technol. 2015, 192, 266–271. [CrossRef]
25. Fdez.-Güelfo, L.A.; Álvarez-Gallego, C.; Sales Márquez, D.; Romero García, L.I. Biological pretreatmentapplied to industrial organic fraction of municipal solid wastes (OFMSW): Effect on anaerobic digestion.Chem. Eng. J. 2011, 172, 321–325. [CrossRef]
26. Álvarez-Gallego, C.J.; Fdez-Güelfo, L.A.; de los Romero Aguilar, A.M.; García, L.I.R. Thermochemicalpretreatments of organic fraction of municipal solid waste from a mechanical-biological treatment plant.Int. J. Mol. Sci. 2015, 16, 3769–3782. [CrossRef]
27. Fdez.-Güelfo, L.A.; Álvarez-Gallego, C.; Sales, D.; Romero, L.I. The use of thermochemical and biologicalpretreatments to enhance organic matter hydrolysis and solubilization from organic fraction of municipalsolid waste (OFMSW). Chem. Eng. J. 2011, 168, 249–254. [CrossRef]
28. Gonzales, H.B.; Takyu, K.; Sakashita, H.; Nakano, Y.; Nishijima, W.; Okada, M. Biological solubilization andmineralization as novel approach for the pretreatment of food waste. Chemosphere 2005, 58, 57–63. [CrossRef]
29. Kumar, A.N.; Mohan, S.V. Acidogenic valorization of vegetable waste for short chain carboxylic acids andbiohydrogen production: Influence of pretreatment and pH. J. Clean. Prod. 2018, 203, 1055–1066. [CrossRef]
30. Dahiya, S.; Sarkar, O.; Swamy, Y.V.; Venkata Mohan, S. Acidogenic fermentation of food waste for volatilefatty acid production with co-generation of biohydrogen. Bioresour. Technol. 2015, 182, 103–113. [CrossRef]
31. Naresh Kumar, A.; Venkata Mohan, S. Acidogenesis of waste activated sludge—Biohydrogen productionwith simultaneous short chain carboxylic acids. J. Environ. Chem. Eng. 2018, 6, 2983–2991. [CrossRef]
32. Jankowska, E.; Chwiałkowska, J.; Stodolny, M.; Oleskowicz-Popiel, P. Effect of pH and retention time onvolatile fatty acids production during mixed culture fermentation. Bioresour. Technol. 2015, 190, 274–280.[CrossRef]
33. Garcia, N.H.; Strazzera, G.; Frison, N.; Bolzonella, D. Volatile fatty acids production from household foodwaste. Chem. Eng. Trans. 2018, 64, 103–108.
34. Ding, H.H.; Chang, S.; Liu, Y. Biological hydrolysis pretreatment on secondary sludge: Enhancement ofanaerobic digestion and mechanism study. Bioresour. Technol. 2017, 244, 989–995. [CrossRef]
35. Sun, J.; Guo, L.; Li, Q.; Zhao, Y.; Gao, M.; She, Z.; Wang, G. Structural and functional properties oforganic matters in extracellular polymeric substances (EPS) and dissolved organic matters (DOM) after heatpretreatment with waste sludge. Bioresour. Technol. J. 2016, 219, 614–623. [CrossRef]
36. Kuruti, K.; Nakkasunchi, S.; Begum, S.; Juntupally, S.; Arelli, V.; Anupoju, G.R. Rapid generation of volatilefatty acids (VFA) through anaerobic acidification of livestock organic waste at low hydraulic residence time(HRT). Bioresour. Technol. 2017, 238, 188–193. [CrossRef]
37. Moretto, G.; Valentino, F.; Pavan, P.; Majone, M.; Bolzonella, D. Optimization of urban waste fermentationfor volatile fatty acids production. Waste Manag. 2019, 92, 21–29. [CrossRef]
168

Molecules 2019, 24, 2986
38. APHA. Standard Methods for the Examination of Water and Wastewater, 22nd ed.; American Public HealthAssociation, American Water Works Association. Water Environment Federation: Washington, DC,USA, 2012.
Sample Availability: Samples of the compounds in this article are not available from the authors.
© 2019 by the authors. Licensee MDPI, Basel, Switzerland. This article is an open accessarticle distributed under the terms and conditions of the Creative Commons Attribution(CC BY) license (http://creativecommons.org/licenses/by/4.0/).
169

molecules
Article
On the Effect of Aqueous Ammonia SoakingPre-Treatment on Continuous Anaerobic Digestion ofDigested Swine Manure Fibers
Chrysoula Mirtsou-Xanthopoulou 1, Ioannis V. Skiadas 2 and Hariklia N. Gavala 2,*1 Aalborg University Copenhagen, Department of Chemistry and Bioscience, A C Meyers Vænge 15,
DK 2450 Copenhagen SV, Denmark2 Technical University of Denmark, Department of Chemical and Biochemical Engineering, Søltofts Plads 229,
2800 Kgs. Lyngby, Denmark* Correspondence: [email protected] or [email protected]; Tel.: +45-21171323
Academic Editors: Derek J. McPhee and Ivet FerrerReceived: 4 June 2019; Accepted: 2 July 2019; Published: 5 July 2019
Abstract: (1) Background: The continuously increasing demand for renewable energy sources rendersanaerobic digestion as one of the most promising technologies for renewable energy production. Dueto the animal production intensification, manure is being used as the primary feedstock for mostbiogas plants. Their economical profitable operation, however, relies on increasing the methane yieldfrom the solid fraction of manure, which is not so easily degradable. The solid fraction after anaerobicdigestion, the so-called digested fibers, consists mainly of hardly biodegradable material and comesat a lower mass per unit volume of manure compared to the solid fraction before anaerobic digestion.Therefore, investigation on how to increase the biodegradability of digested fibers is very relevant. Sofar, Aqueous Ammonia Soaking (AAS), has been successfully applied on digested fibers separatedfrom the effluent of a manure-fed, full-scale anaerobic digester to enhance their methane productivityin batch experiments. (2) Methods: In the present study, continuous experiments at a mesophilic(38 C) CSTR-type anaerobic digester fed with swine manure first and a mixture of manure withAAS-treated digested fibers in the sequel, were performed. Anaerobic Digestion Model 1 (ADM1)previously fitted on manure fed digester was used in order to assess the effect of the addition ofAAS-pre-treated digested manure fibers on the kinetics of anaerobic digestion process. (3) Resultsand Conclusions: The methane yield of AAS-treated digested fibers under continuous operation was49–68% higher than that calculated in batch experiments in the past. It was found that AAS treatmenthad a profound effect mainly on the disintegration/hydrolysis rate of particulate carbohydrates.Comparison of the data obtained in the present study with the data obtained with AAS-pre-treatedraw manure fibers in the past revealed that hydrolysis kinetics after AAS pre-treatment were similarfor both types of biomasses.
Keywords: ADM1; anaerobic digestion; aqueous ammonia soaking pre-treatment; continuous;digested manure fibers; modelling
1. Introduction
Anaerobic digestion is one of the most promising renewable energy technologies, as it provides asolution to both environmental and energy considerations. Some of the benefits of this technologyare that it reduces the odour, minimizes the size of the organic wastes, contributes to the reduction ofthe greenhouse gases emissions and produces a high value fertilizer as well as a renewable energygas. Anaerobic digestion of swine manure has been a wide matter of discussion and it has proveda promising approach for renewable energy production in the form of methane. Nowadays, due to
171
Molecules 2019, 24, 2469
the intensification of animal production, manure seems to be the largest available substrate for biogasplants, in Europe. According to the European parliament [1] 55% of the available biomass for biogasproduction comes exclusively from animal manure. In fact, 22 large-scale biogas plants are currentlyunder operation in Denmark using manure as primary feedstock, but their economical profitableoperation relies on increasing the methane yield from manure [2].
Although manure is undoubtedly an excellent carrier for biogas plants, it contains an organicfraction which is not easily degraded. Many different strategies have been developed so far to increasethe methane potential of the manure. New separation technologies that are being applied beforeanaerobic digestion have been tested over during the last few years [3]. The liquid fraction of themanure could be used as fertilizer in the farms while the solid fraction could be transported tocentralized biogas plants for methane production [4]. Additionally, several different pre-treatmenttechnologies have been applied to increase the methane yield of manure and manure fibers. Somerepresentative results are those of Hartmann et al., [5], where mechanical maceration was applied onfibers with a 25% increase on the methane yield, and also the study of Bruni et al., [6] who appliedhydrothermal, chemical, as well as enzymatic pretreatments on fibers, with a maximum increase of66%. One chemical pre-treatment, which has been initially investigated for bioethanol production isAqueous Ammonia Soaking (AAS). Ammonia is a proven delignification reagent, which is quite safeto handle, non-polluting and non-corrosive [7], and due to its high volatility, it can be easily recoveredand recycled [7], thus avoiding the need of any further chemical consumption. More recently, AASwas also applied on the treatment of the fibrous fraction of raw and digested manure fibers, underroom temperature [8,9]. In both studies, Aqueous Ammonia Soaking (AAS) treatment combined withsubsequent removal of ammonia (which also gives the possibility for being recycled in a full-scale plant)was applied effectively, resulting in a high increase of the methane yield. According to Jurado et al. [8]an increase of up to 78% was observed compared to the non-treated raw manure fibers (control), duringthe first 16 days of digestion while optimisation of the pre-treatment conditions for raw manure fibersresulted in an impressive 244% increase of the methane yield [10]. Similar results were observed inthe study of Mirtsou-Xanthopoulou et al. [9] where an increase of up to 110% was observed in themethane yield of digested manure fibers compared to the non-treated ones (control). Post-treatment ofdigested fibers focuses only on hardly biodegradable biomass in contrast to raw fibers where easilybiodegradable material is also present. Therefore, the mass of fibers to be treated is expected to besignificantly lower in case of digested fibers leading thus to a more economical process. The questionthat the present study addresses is whether models developed for digesters processing manure canactually be applied when the influent stream is supplemented with AAS-treated digested fibers andhow disintegration/hydrolysis kinetics compare to those of AAS-treated raw fibers.
In general, mathematical models are used in order to efficiently describe and predict the efficiencyof different biological processess. Different models for describing the anaerobic digestion processand predicting the methane production and effuent characteristics started to emerge as early as in1970 [11]. The Anaerobic Digestion Model 1 (ADM1) is a generic mathematical model, which wasdeveloped specifically for the anaerobic digestion process in 2002 by the IWA anaerobic digestion taskgroup [12]. ADM1 is a modeling platform that can be used for simulating the biogas process underdifferent substrates and operating conditions, taking into account the most important biological andphysicochemical processes of anaerobic digestion. Since ADM1’s publication, numerous studies havebeen published applying, fitting and tuning ADM1 to different feedstocks, reactors and operatingconditions [13]. Digesting manure with different substrates is a case that has also been lately applied inmodeling with ADM1 [14–19], although to a lesser extent considering that there are around 300 ADM1based studies and only 10% refer to manure as the main feedstock despite the fact that manure is oneof the basic and most well-known feedstocks of anaerobic digesters.
In the present study, continuous experiments at a mesophilic (38 C), CSTR-type, anaerobic digesterfed with swine manure first and a mixture of manure with AAS-treated digested fibers in the sequel,were performed in order to verify the experimental data obtained from batch experiments. A modified
172
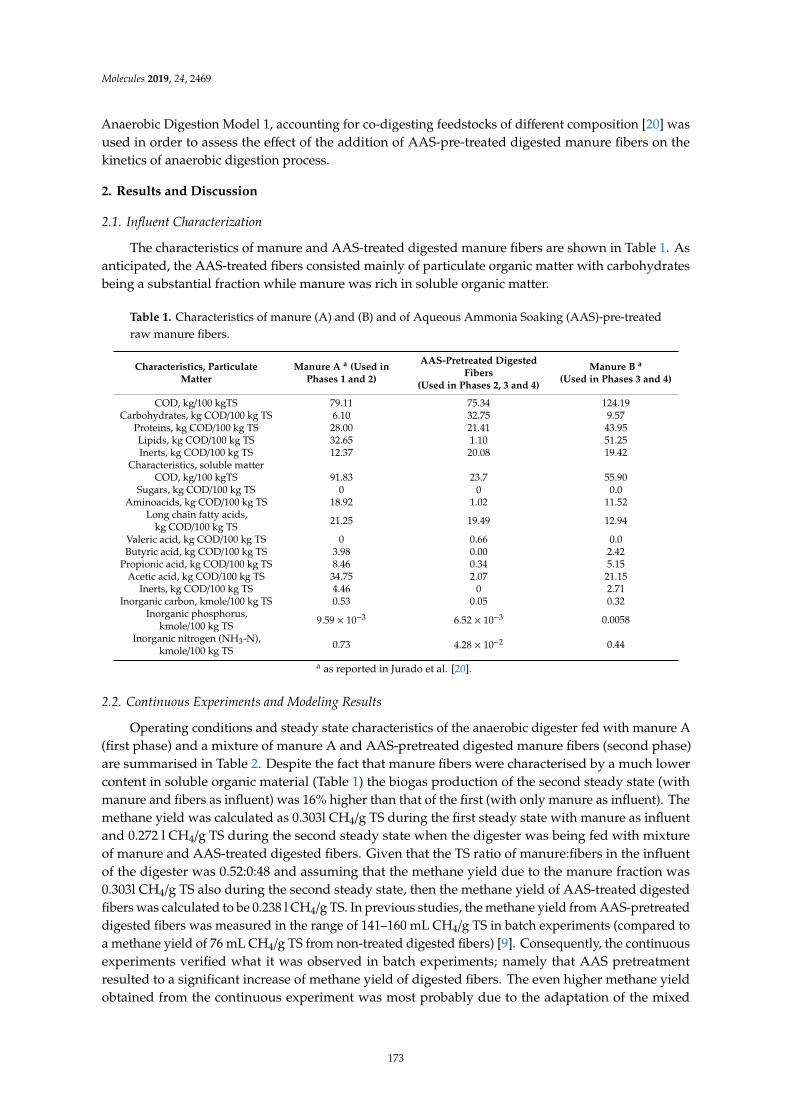
Molecules 2019, 24, 2469
Anaerobic Digestion Model 1, accounting for co-digesting feedstocks of different composition [20] wasused in order to assess the effect of the addition of AAS-pre-treated digested manure fibers on thekinetics of anaerobic digestion process.
2. Results and Discussion
2.1. Influent Characterization
The characteristics of manure and AAS-treated digested manure fibers are shown in Table 1. Asanticipated, the AAS-treated fibers consisted mainly of particulate organic matter with carbohydratesbeing a substantial fraction while manure was rich in soluble organic matter.
Table 1. Characteristics of manure (A) and (B) and of Aqueous Ammonia Soaking (AAS)-pre-treatedraw manure fibers.
Characteristics, ParticulateMatter
Manure A a (Used inPhases 1 and 2)
AAS-Pretreated DigestedFibers
(Used in Phases 2, 3 and 4)
Manure B a
(Used in Phases 3 and 4)
COD, kg/100 kgTS 79.11 75.34 124.19Carbohydrates, kg COD/100 kg TS 6.10 32.75 9.57
Proteins, kg COD/100 kg TS 28.00 21.41 43.95Lipids, kg COD/100 kg TS 32.65 1.10 51.25Inerts, kg COD/100 kg TS 12.37 20.08 19.42
Characteristics, soluble matterCOD, kg/100 kgTS 91.83 23.7 55.90
Sugars, kg COD/100 kg TS 0 0 0.0Aminoacids, kg COD/100 kg TS 18.92 1.02 11.52
Long chain fatty acids,kg COD/100 kg TS 21.25 19.49 12.94
Valeric acid, kg COD/100 kg TS 0 0.66 0.0Butyric acid, kg COD/100 kg TS 3.98 0.00 2.42
Propionic acid, kg COD/100 kg TS 8.46 0.34 5.15Acetic acid, kg COD/100 kg TS 34.75 2.07 21.15
Inerts, kg COD/100 kg TS 4.46 0 2.71Inorganic carbon, kmole/100 kg TS 0.53 0.05 0.32
Inorganic phosphorus,kmole/100 kg TS 9.59 × 10⁻³ 6.52 × 10⁻³ 0.0058
Inorganic nitrogen (NH3-N),kmole/100 kg TS 0.73 4.28 × 10⁻² 0.44
a as reported in Jurado et al. [20].
2.2. Continuous Experiments and Modeling Results
Operating conditions and steady state characteristics of the anaerobic digester fed with manure A(first phase) and a mixture of manure A and AAS-pretreated digested manure fibers (second phase)are summarised in Table 2. Despite the fact that manure fibers were characterised by a much lowercontent in soluble organic material (Table 1) the biogas production of the second steady state (withmanure and fibers as influent) was 16% higher than that of the first (with only manure as influent). Themethane yield was calculated as 0.303l CH4/g TS during the first steady state with manure as influentand 0.272 l CH4/g TS during the second steady state when the digester was being fed with mixtureof manure and AAS-treated digested fibers. Given that the TS ratio of manure:fibers in the influentof the digester was 0.52:0:48 and assuming that the methane yield due to the manure fraction was0.303l CH4/g TS also during the second steady state, then the methane yield of AAS-treated digestedfibers was calculated to be 0.238 l CH4/g TS. In previous studies, the methane yield from AAS-pretreateddigested fibers was measured in the range of 141–160 mL CH4/g TS in batch experiments (compared toa methane yield of 76 mL CH4/g TS from non-treated digested fibers) [9]. Consequently, the continuousexperiments verified what it was observed in batch experiments; namely that AAS pretreatmentresulted to a significant increase of methane yield of digested fibers. The even higher methane yieldobtained from the continuous experiment was most probably due to the adaptation of the mixed
173

Molecules 2019, 24, 2469
microbial culture on the different feedstock since the batch experiments were performed with inoculumwhich was adapted to manure only, where actually no hydrolysis had taken place [20].
Table 2. Operating conditions, experimental measurements and model predictions for the steady stateson manure and mixture of manure and AAS-treated digested fibers.
Operating Conditions Manure A (1st Phase) Mixture of Manure A and AAS-Treated DigestedFibers (2nd Phase)
HRT, d 24–25 24–25Flow rate, mL/d 114–134 117–125Organic loading rate(OLR), g COD/l/d 2.83–3.53 2.30–3.65
Soluble OLR, g solubleCOD/l/d 1.52–1.90 1.00–1.58
Steady statecharacteristics Manure A (1st phase) Mixture of manure and AAS-treated digested fibers
(2nd phase )
Experimental Model Experimental Model
Methane, % 67.6 ± 2.1 64.2 ± 8.3 66.6 ± 1.8 67.0 ± 7.6Biogas production, m3/d 2.32 × 10⁻³ ± 0.2 × 10⁻³ 2.65 × 10⁻³ ± 0.1 × 10⁻³ 2.70 × 10⁻³ ± 0.3 × 10⁻³ 2.9 × 10⁻³ ± 0.2 × 10⁻³
pH 8.2 8.1 8.1 8.0Acetic acid, kgCOD/m3 0.142 ± 0.025 0.087 ± 0.013 0.161 ± 0.084 0.081 ± 0.018Propionic acid,kgCOD/m3 0.023 ± 0.005 0.018 ± 0.002 0.012 ± 0.003 0.019 ± 0.002
Butyric acid, kgCOD/m3 0.026 ± 0.002 0.011 ± 0.001 0.007 ± 0.0001 0.012 ± 0.001
ADM1 as developed in Jurado et al. [20] was used to simulate the first phase where only manureA was being added in the reactor. During the second phase, where the digester was fed with themixture of manure A and AAS-pretreated digested fibers, fitting of the ADM1 to the experimental datawas performed. The only kinetic parameters, which were mostly affected, were those of carbohydratesand proteins hydrolysis. Hydrolytic kinetic constants for carbohydrates and proteins in manure hadbeen calculated as 0 and 2.8 × 10⁻⁴ d−1, respectively [20], while for the mixture were increased to6.8 × 10−2 and 7.0 × 10⁻³ d−1 and are in very good agreement with the hydrolysis constants estimatedfor AAS-pretreated raw manure fibers, 7.3 × 10⁻² and 7.1 × 10⁻³ d−1, respectively [20]. Hydrolysisconstants were remarkably lower compared to all soluble substrate consumption rates, includingvolatile fatty acids and therefore it can be assumed that hydrolysis is the rate-limiting step for theoverall anaerobic digestion process when adding manure fibers at the ratio tested hereby. Kinetics ofvolatile fatty acids uptake seemed to be unaffected as the behaviour of the digester under the pulsedisturbances was satisfactorily simulated by the model without any further change in the kineticparameters. The latter is very well depicted in Figures 1–3 where the experimental and predicted bythe model VFA concentrations during the pulse experiments are presented.
Molecules 2019, 24, x 5 of 12
change in the kinetic parameters. The latter is very well depicted in Figures 1, 2 and 3 where the experimental and predicted by the model VFA concentrations during the pulse experiments are presented.
Model predictions for the steady state on manure A are also shown in Table 2. It is noticeable that the model, which was developed in another digester fed with manure, was able to accurately predict the steady state reached in the present study. Table 2 also includes model predictions for the second phase, after fitting of the model had been performed. It is obvious that the model was able to adequately predict the steady state reached on the mixture of manure A and AAS-pretreated digested fibers after alteration of just the hydrolytic constants.
Figure 1. Experimental and predicted by the model acetic acid concentration during the experiment with mixture of manure and AAS-treated digested fibers as influent.
Figure 2. Experimental and predicted by the model propionic acid concentration during the experiment with mixture of manure and AAS-treated digested fibers as influent.
Figure 1. Experimental and predicted by the model acetic acid concentration during the experimentwith mixture of manure and AAS-treated digested fibers as influent.
174
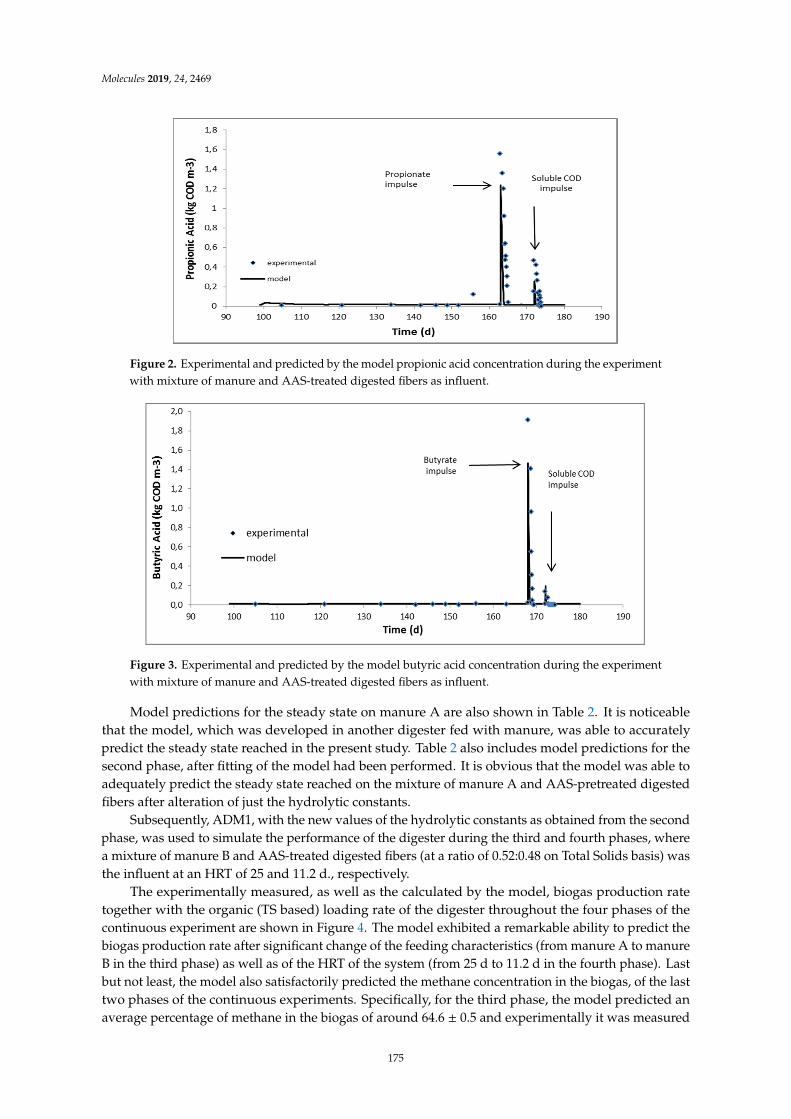
Molecules 2019, 24, 2469
Molecules 2019, 24, x 5 of 12
change in the kinetic parameters. The latter is very well depicted in Figures 1, 2 and 3 where the experimental and predicted by the model VFA concentrations during the pulse experiments are presented.
Model predictions for the steady state on manure A are also shown in Table 2. It is noticeable that the model, which was developed in another digester fed with manure, was able to accurately predict the steady state reached in the present study. Table 2 also includes model predictions for the second phase, after fitting of the model had been performed. It is obvious that the model was able to adequately predict the steady state reached on the mixture of manure A and AAS-pretreated digested fibers after alteration of just the hydrolytic constants.
Figure 1. Experimental and predicted by the model acetic acid concentration during the experiment with mixture of manure and AAS-treated digested fibers as influent.
Figure 2. Experimental and predicted by the model propionic acid concentration during the experiment with mixture of manure and AAS-treated digested fibers as influent.
Figure 2. Experimental and predicted by the model propionic acid concentration during the experimentwith mixture of manure and AAS-treated digested fibers as influent.
Molecules 2019, 24, x 6 of 12
Figure 3. Experimental and predicted by the model butyric acid concentration during the experiment with mixture of manure and AAS-treated digested fibers as influent.
Subsequently, ADM1, with the new values of the hydrolytic constants as obtained from the second phase, was used to simulate the performance of the digester during the third and fourth phases, where a mixture of manure B and AAS-treated digested fibers (at a ratio of 0.52:0.48 on Total Solids basis) was the influent at an HRT of 25 and 11.2 d., respectively.
The experimentally measured, as well as the calculated by the model, biogas production rate together with the organic (TS based) loading rate of the digester throughout the four phases of the continuous experiment are shown in Figure 4. The model exhibited a remarkable ability to predict the biogas production rate after significant change of the feeding characteristics (from manure A to manure B in the third phase) as well as of the HRT of the system (from 25 d to 11.2 d in the fourth phase). Last but not least, the model also satisfactorily predicted the methane concentration in the biogas, of the last two phases of the continuous experiments. Specifically, for the third phase, the model predicted an average percentage of methane in the biogas of around 64.6 ± 0.5 and experimentally it was measured as 63.2 ± 0.1. For the fourth phase, the methane percentages predicted from the model and measured experimentally were 68.2 ± 2.2 and 63.2 ± 0.4, respectively.
A
Figure 3. Experimental and predicted by the model butyric acid concentration during the experimentwith mixture of manure and AAS-treated digested fibers as influent.
Model predictions for the steady state on manure A are also shown in Table 2. It is noticeablethat the model, which was developed in another digester fed with manure, was able to accuratelypredict the steady state reached in the present study. Table 2 also includes model predictions for thesecond phase, after fitting of the model had been performed. It is obvious that the model was able toadequately predict the steady state reached on the mixture of manure A and AAS-pretreated digestedfibers after alteration of just the hydrolytic constants.
Subsequently, ADM1, with the new values of the hydrolytic constants as obtained from the secondphase, was used to simulate the performance of the digester during the third and fourth phases, wherea mixture of manure B and AAS-treated digested fibers (at a ratio of 0.52:0.48 on Total Solids basis) wasthe influent at an HRT of 25 and 11.2 d., respectively.
The experimentally measured, as well as the calculated by the model, biogas production ratetogether with the organic (TS based) loading rate of the digester throughout the four phases of thecontinuous experiment are shown in Figure 4. The model exhibited a remarkable ability to predict thebiogas production rate after significant change of the feeding characteristics (from manure A to manureB in the third phase) as well as of the HRT of the system (from 25 d to 11.2 d in the fourth phase). Lastbut not least, the model also satisfactorily predicted the methane concentration in the biogas, of the lasttwo phases of the continuous experiments. Specifically, for the third phase, the model predicted anaverage percentage of methane in the biogas of around 64.6 ± 0.5 and experimentally it was measured
175
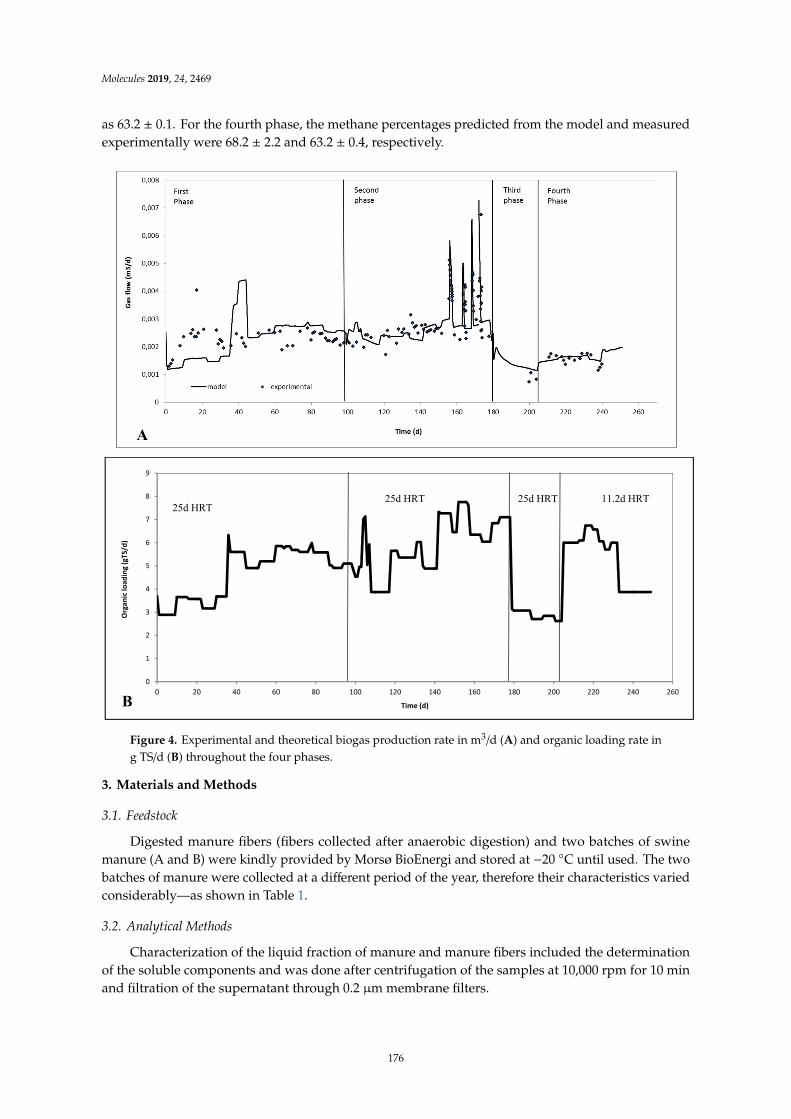
Molecules 2019, 24, 2469
as 63.2 ± 0.1. For the fourth phase, the methane percentages predicted from the model and measuredexperimentally were 68.2 ± 2.2 and 63.2 ± 0.4, respectively.
Molecules 2019, 24, x 6 of 12
Figure 3. Experimental and predicted by the model butyric acid concentration during the experiment with mixture of manure and AAS-treated digested fibers as influent.
Subsequently, ADM1, with the new values of the hydrolytic constants as obtained from the second phase, was used to simulate the performance of the digester during the third and fourth phases, where a mixture of manure B and AAS-treated digested fibers (at a ratio of 0.52:0.48 on Total Solids basis) was the influent at an HRT of 25 and 11.2 d., respectively.
The experimentally measured, as well as the calculated by the model, biogas production rate together with the organic (TS based) loading rate of the digester throughout the four phases of the continuous experiment are shown in Figure 4. The model exhibited a remarkable ability to predict the biogas production rate after significant change of the feeding characteristics (from manure A to manure B in the third phase) as well as of the HRT of the system (from 25 d to 11.2 d in the fourth phase). Last but not least, the model also satisfactorily predicted the methane concentration in the biogas, of the last two phases of the continuous experiments. Specifically, for the third phase, the model predicted an average percentage of methane in the biogas of around 64.6 ± 0.5 and experimentally it was measured as 63.2 ± 0.1. For the fourth phase, the methane percentages predicted from the model and measured experimentally were 68.2 ± 2.2 and 63.2 ± 0.4, respectively.
A Molecules 2019, 24, x 7 of 12
Figure 4. Experimental and theoretical biogas production rate in m3/d (A) and organic loading rate in g TS/d (B) throughout the four phases.
3. Materials and Methods
3.1. Feedstock
Digested manure fibers (fibers collected after anaerobic digestion) and two batches of swine manure (A and B) were kindly provided by Morsø BioEnergi and stored at −20 °C until used. The two batches of manure were collected at a different period of the year, therefore their characteristics varied considerably – as shown in Table 1.
3.2. Analytical Methods
Characterization of the liquid fraction of manure and manure fibers included the determination of the soluble components and was done after centrifugation of the samples at 10,000 rpm for 10 min and filtration of the supernatant through 0.2 μm membrane filters.
Total (TS) and volatile (VS) solids were measured according to standard methods [21]. Total and soluble Chemical Oxygen Demand (COD) was determined using Hach Lange kits LCK_914 (5−60 g L−1 range) and LCK_514 (100−2000 mg L−1 range), respectively.
For total phosphorus and total nitrogen determination the material was dried at 42 °C overnight and powdered, while for the soluble and inorganic measurements, the material was centrifuged at 10,000 rpm for 10 min and the supernatant was passed through 0.2 μm membrane filters. For the determination of the non-soluble and soluble organic phosphorus persulphate digestion was applied to the solid and liquid fraction, respectively, followed by ascorbic acid photometric determination of phosphate ions [21]. For the determination of non-soluble and soluble organic nitrogen, digestion with the micro-kjeldahl apparatus was applied to the solid and liquid fraction, respectively, followed by distillation and titration (titrimetric method) for ammonium ions determination (APHA, 2005). For the inorganic forms of phosphorus (PO4-3-P) and nitrogen (NH4-N) determination, analysis was carried out by applying ascorbic acid photometric determination [21] and by using the Hach Lange kit LCK_305 (1−12 mg L−1 range), respectively.
Two groups of carbohydrates were determined in the samples of manure and manure fibers: the first group was the total carbohydrates, including those bound in the lignocellulosic biomass and the second group was the simple sugars [22]. Analysis of the two groups of carbohydrates was carried out based on the NREL analytical procedures [23]. Detection and quantification of sugar monomers (glucose, xylose and arabinose) was made with HPLC-RI equipped with an Aminex HPX-87H column (BioRad, Hercules, CA, USA) at 60 °C. A solution of 4 mmol L−1 H2SO4 was used as eluent at a flow rate of 0.6 mL min−1. Samples for HPLC analysis were acidified with a 10% w/w solution of H2SO4, centrifuged at 10,000 rpm for 10 min and finally filtered through a 0.45μm
0
1
2
3
4
5
6
7
8
9
0 20 40 60 80 100 120 140 160 180 200 220 240 260
Orga
nic l
oadi
ng (g
TS/d
)
Time (d)
25d HRT 25d HRT 11.2d HRT
B
25d HRT
Figure 4. Experimental and theoretical biogas production rate in m3/d (A) and organic loading rate ing TS/d (B) throughout the four phases.
3. Materials and Methods
3.1. Feedstock
Digested manure fibers (fibers collected after anaerobic digestion) and two batches of swinemanure (A and B) were kindly provided by Morsø BioEnergi and stored at −20 C until used. The twobatches of manure were collected at a different period of the year, therefore their characteristics variedconsiderably—as shown in Table 1.
3.2. Analytical Methods
Characterization of the liquid fraction of manure and manure fibers included the determinationof the soluble components and was done after centrifugation of the samples at 10,000 rpm for 10 minand filtration of the supernatant through 0.2 µm membrane filters.
176
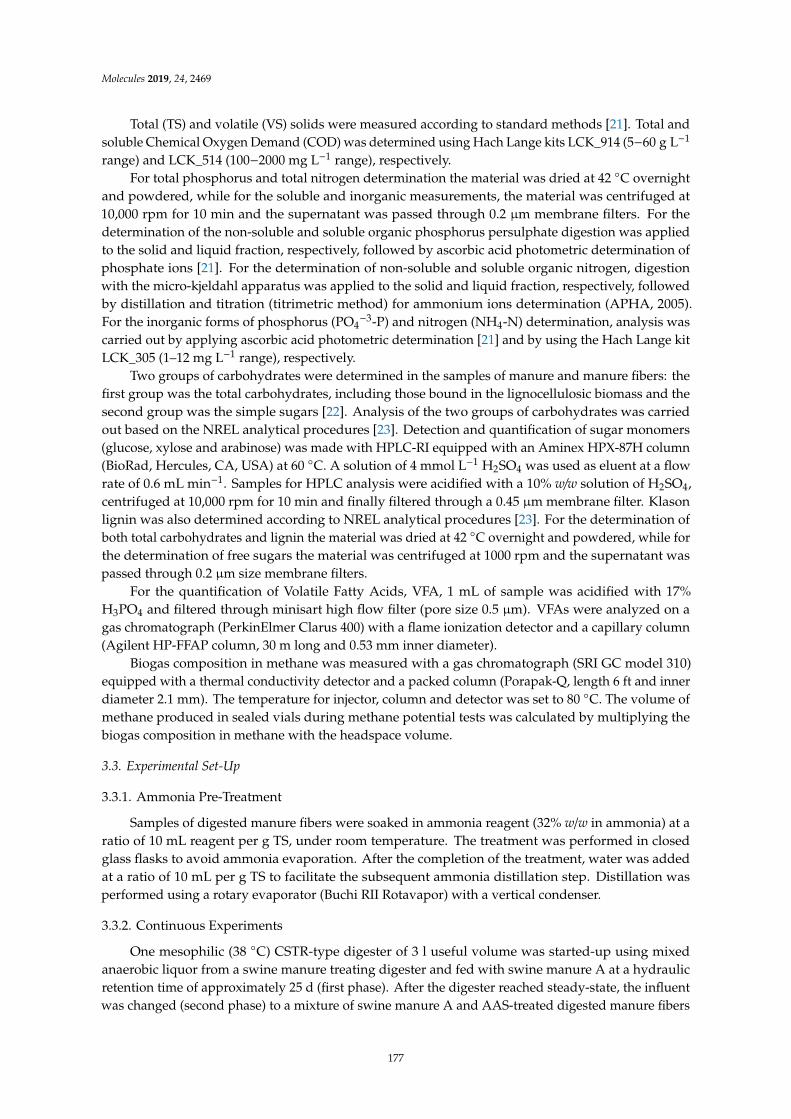
Molecules 2019, 24, 2469
Total (TS) and volatile (VS) solids were measured according to standard methods [21]. Total andsoluble Chemical Oxygen Demand (COD) was determined using Hach Lange kits LCK_914 (5−60 g L−1
range) and LCK_514 (100−2000 mg L−1 range), respectively.For total phosphorus and total nitrogen determination the material was dried at 42 C overnight
and powdered, while for the soluble and inorganic measurements, the material was centrifuged at10,000 rpm for 10 min and the supernatant was passed through 0.2 µm membrane filters. For thedetermination of the non-soluble and soluble organic phosphorus persulphate digestion was appliedto the solid and liquid fraction, respectively, followed by ascorbic acid photometric determination ofphosphate ions [21]. For the determination of non-soluble and soluble organic nitrogen, digestionwith the micro-kjeldahl apparatus was applied to the solid and liquid fraction, respectively, followedby distillation and titration (titrimetric method) for ammonium ions determination (APHA, 2005).For the inorganic forms of phosphorus (PO4
−3-P) and nitrogen (NH4-N) determination, analysis wascarried out by applying ascorbic acid photometric determination [21] and by using the Hach Lange kitLCK_305 (1–12 mg L−1 range), respectively.
Two groups of carbohydrates were determined in the samples of manure and manure fibers: thefirst group was the total carbohydrates, including those bound in the lignocellulosic biomass and thesecond group was the simple sugars [22]. Analysis of the two groups of carbohydrates was carriedout based on the NREL analytical procedures [23]. Detection and quantification of sugar monomers(glucose, xylose and arabinose) was made with HPLC-RI equipped with an Aminex HPX-87H column(BioRad, Hercules, CA, USA) at 60 C. A solution of 4 mmol L−1 H2SO4 was used as eluent at a flowrate of 0.6 mL min−1. Samples for HPLC analysis were acidified with a 10% w/w solution of H2SO4,centrifuged at 10,000 rpm for 10 min and finally filtered through a 0.45 µm membrane filter. Klasonlignin was also determined according to NREL analytical procedures [23]. For the determination ofboth total carbohydrates and lignin the material was dried at 42 C overnight and powdered, while forthe determination of free sugars the material was centrifuged at 1000 rpm and the supernatant waspassed through 0.2 µm size membrane filters.
For the quantification of Volatile Fatty Acids, VFA, 1 mL of sample was acidified with 17%H3PO4 and filtered through minisart high flow filter (pore size 0.5 µm). VFAs were analyzed on agas chromatograph (PerkinElmer Clarus 400) with a flame ionization detector and a capillary column(Agilent HP-FFAP column, 30 m long and 0.53 mm inner diameter).
Biogas composition in methane was measured with a gas chromatograph (SRI GC model 310)equipped with a thermal conductivity detector and a packed column (Porapak-Q, length 6 ft and innerdiameter 2.1 mm). The temperature for injector, column and detector was set to 80 C. The volume ofmethane produced in sealed vials during methane potential tests was calculated by multiplying thebiogas composition in methane with the headspace volume.
3.3. Experimental Set-Up
3.3.1. Ammonia Pre-Treatment
Samples of digested manure fibers were soaked in ammonia reagent (32% w/w in ammonia) at aratio of 10 mL reagent per g TS, under room temperature. The treatment was performed in closedglass flasks to avoid ammonia evaporation. After the completion of the treatment, water was addedat a ratio of 10 mL per g TS to facilitate the subsequent ammonia distillation step. Distillation wasperformed using a rotary evaporator (Buchi RII Rotavapor) with a vertical condenser.
3.3.2. Continuous Experiments
One mesophilic (38 C) CSTR-type digester of 3 l useful volume was started-up using mixedanaerobic liquor from a swine manure treating digester and fed with swine manure A at a hydraulicretention time of approximately 25 d (first phase). After the digester reached steady-state, the influentwas changed (second phase) to a mixture of swine manure A and AAS-treated digested manure fibers
177
Molecules 2019, 24, 2469
(at a ratio of 0.52:0.48 on Total Solids basis). The ratio has been chosen based on the maximum additionof fibers allowing for a smooth operation (no blockings of the flow of material in the pipes) of thelab-scale digesters and pumps. Subsequently and after the digester reached the second steady state,the manure provided by Morsø BioEnergi changed to a new batch of manure (B) with much lowerTS content (1.63 gTS/100 g manure) than the one used for the first and second phase (4.4 gTS/100 gmanure). The digester was allowed to reach steady state (third phase) with the new type of manureunder the same operating parameters applied for the second phase (TS ratio of manure: AAS treatedfibers and HRT). After the third steady state was reached, the HRT was reduced to 11.2 d (fourth phase).
Summarizing, the four phases involved are as following:
First Phase: manure A as influent at an HRT of 25 d.Second Phase: mixture of manure A and AAS-treated digested fibers (at a ratio of 0.52:0.48 on TotalSolids basis) as influent at an HRT of 25 d.Third Phase: mixture of manure B and AAS-treated digested fibers (at a ratio of 0.52:0.48 on TotalSolids basis) as influent at an HRT of 25 d.Fourth Phase: mixture of manure B and AAS-treated digested fibers (at a ratio of 0.52:0.48 on TotalSolids basis) as influent at an HRT of 11.2 d.
The feeding of the digester was intermittent and repeated once a day during all phases. Theoperation, however, can actually be considered as “continuous” due to the relatively long retentiontimes applied. Daily monitoring of the digester included biogas production and composition inmethane, pH, volatile fatty acids and soluble COD concentration. When the digester reached thesecond steady state while fed with the mixture of manure and fibers, complete characterisation wasperformed in terms of almost all measurable components of ADM1 (see paragraph 3.4.2). Subsequently,the digester was subjected to pulse disturbances of acetic, propionic and butyric acids and solubleinfluent fraction (obtained after centrifugation and filtration) in order to study the dynamics ofthe processes (those experiments are considered part of the second phase). Following this, 50 mLconcentrated solutions of acetic, propionic and butyric acids and a 600 mL sample consisting of thesoluble fraction of the mixture (manure and digested fibers), were consecutively injected into thedigester in order to increase the reactor concentration of the injected substrate to around 1600, 1200and 1600 mg COD/l for the acetic, propionic and butyric acids, respectively, and to around 400 mgCOD/l for the soluble fraction of the mixture [24]. The response of the bioreactor to these disturbanceswas monitored mainly through measurements of biogas production and composition in methane, pHand VFA concentration until all components approach their levels before the pulse.
3.4. Modeling
Anaerobic Digestion Model No1 (ADM1) was used to simulate the anaerobic digestion processand to assess the effect that the addition of AAS pretreated digested fibers had on the kinetic parameters.In the study by Jurado et al. [20], IWA anaerobic digestion model (ADM1) had been fitted to theexperimental data obtained from a swine manure-fed digester which was different than the one usedin this study and hydrolysis constants of carbohydrates (khydr_ch), proteins (khydr_pr) and lipids(khydr_li) and maximum uptake rates of long chain fatty acids (km_fa) and volatile fatty acids (km_c4,km_pro and km_ac for butyric, propionic and acetic acid, respectively) had been calculated as shown inTable 3. That model was used to simulate the first steady state of the reactor (with only swine manureas influent). Subsequently, the model was fitted to the experimental data obtained throughout thesecond phase, where a mixture of manure and fibers was introduced as influent and new hydrolysisconstants had been obtained. Finally, the experimental results obtained when the new batch of manure(B) was added as well as when the Hydraulic Retention time (HRT) was reduced to 11.2d (third andfourth phase, respectively) were used to validate the model fitted to the second phase. The softwareused was Aquasim 2.1 g and the secant method was applied for the parameters estimation.
178
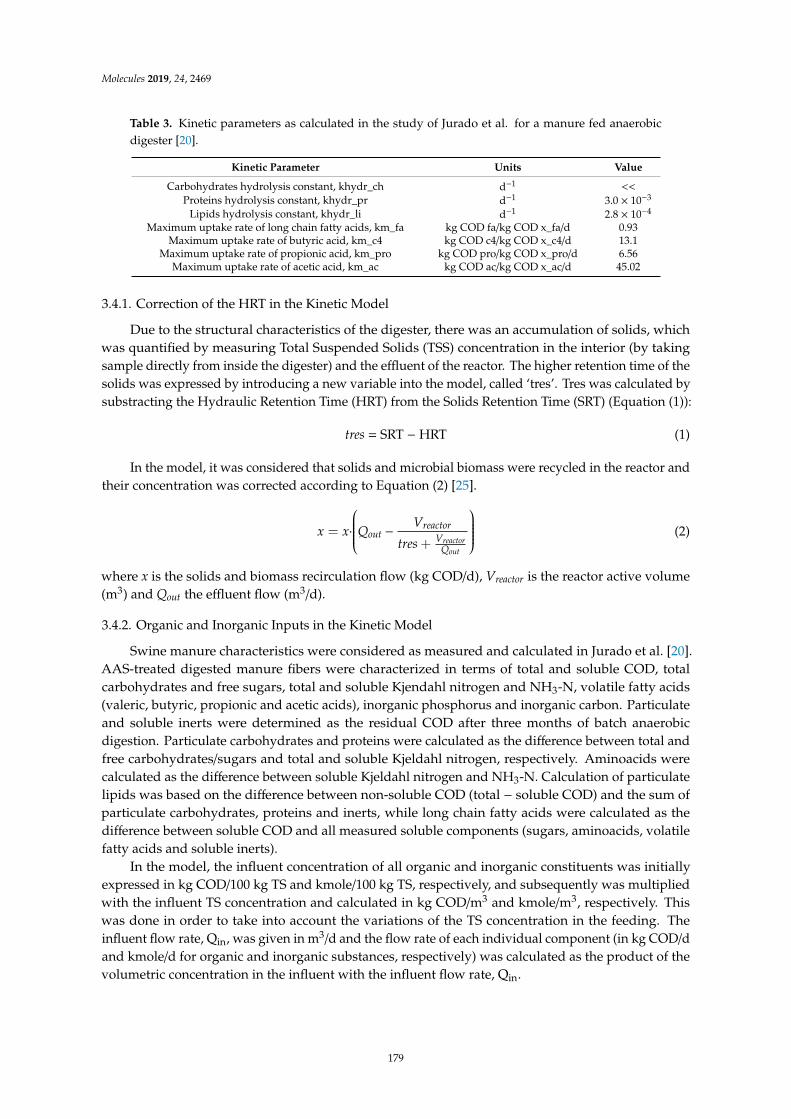
Molecules 2019, 24, 2469
Table 3. Kinetic parameters as calculated in the study of Jurado et al. for a manure fed anaerobicdigester [20].
Kinetic Parameter Units Value
Carbohydrates hydrolysis constant, khydr_ch d−1 <<
Proteins hydrolysis constant, khydr_pr d−1 3.0 × 10⁻³
Lipids hydrolysis constant, khydr_li d−1 2.8 × 10⁻⁴
Maximum uptake rate of long chain fatty acids, km_fa kg COD fa/kg COD x_fa/d 0.93Maximum uptake rate of butyric acid, km_c4 kg COD c4/kg COD x_c4/d 13.1
Maximum uptake rate of propionic acid, km_pro kg COD pro/kg COD x_pro/d 6.56Maximum uptake rate of acetic acid, km_ac kg COD ac/kg COD x_ac/d 45.02
3.4.1. Correction of the HRT in the Kinetic Model
Due to the structural characteristics of the digester, there was an accumulation of solids, whichwas quantified by measuring Total Suspended Solids (TSS) concentration in the interior (by takingsample directly from inside the digester) and the effluent of the reactor. The higher retention time of thesolids was expressed by introducing a new variable into the model, called ‘tres’. Tres was calculated bysubstracting the Hydraulic Retention Time (HRT) from the Solids Retention Time (SRT) (Equation (1)):
tres = SRT − HRT (1)
In the model, it was considered that solids and microbial biomass were recycled in the reactor andtheir concentration was corrected according to Equation (2) [25].
x = x·Qout − Vreactor
tres + VreactorQout
(2)
where x is the solids and biomass recirculation flow (kg COD/d), Vreactor is the reactor active volume(m3) and Qout the effluent flow (m3/d).
3.4.2. Organic and Inorganic Inputs in the Kinetic Model
Swine manure characteristics were considered as measured and calculated in Jurado et al. [20].AAS-treated digested manure fibers were characterized in terms of total and soluble COD, totalcarbohydrates and free sugars, total and soluble Kjendahl nitrogen and NH3-N, volatile fatty acids(valeric, butyric, propionic and acetic acids), inorganic phosphorus and inorganic carbon. Particulateand soluble inerts were determined as the residual COD after three months of batch anaerobicdigestion. Particulate carbohydrates and proteins were calculated as the difference between total andfree carbohydrates/sugars and total and soluble Kjeldahl nitrogen, respectively. Aminoacids werecalculated as the difference between soluble Kjeldahl nitrogen and NH3-N. Calculation of particulatelipids was based on the difference between non-soluble COD (total − soluble COD) and the sum ofparticulate carbohydrates, proteins and inerts, while long chain fatty acids were calculated as thedifference between soluble COD and all measured soluble components (sugars, aminoacids, volatilefatty acids and soluble inerts).
In the model, the influent concentration of all organic and inorganic constituents was initiallyexpressed in kg COD/100 kg TS and kmole/100 kg TS, respectively, and subsequently was multipliedwith the influent TS concentration and calculated in kg COD/m3 and kmole/m3, respectively. Thiswas done in order to take into account the variations of the TS concentration in the feeding. Theinfluent flow rate, Qin, was given in m3/d and the flow rate of each individual component (in kg COD/dand kmole/d for organic and inorganic substances, respectively) was calculated as the product of thevolumetric concentration in the influent with the influent flow rate, Qin.
179
Molecules 2019, 24, 2469
4. Conclusions
Continuous experiments at a mesophilic (38 C) CSTR-type anaerobic digester fed with swinemanure first and a mixture of manure with AAS-treated digested fibers in the sequel, were performed.The methane yield of AAS-treated digested fibers under continuous operation was 49–68% higher thanthat calculated in batch experiments in the past. Anaerobic Digestion Model 1 (ADM1) previouslyfitted on manure fed digester was used and simulated very satisfactorily the first experimental phase,proving thus the robustness of the model and process. Fitting of the second experimental phase,where the influent stream was supplemented with AAS-treated digested fibers (digested fibers referto manure fibers after anaerobic digestion), indicated that AAS treatment had a profound effectmainly on the hydrolysis rate of particulate carbohydrates and it is noticeable that the estimateddisintegration/hydrolysis constants were comparable to those obtained with AAS-treated raw manurefibers (raw fibers refer to manure fibers before anaerobic digestion). Last but not least, pulse experimentswith important intermediates of the process, i.e. acetic, propionic and butyric acids, indicated that theassociated kinetic constants were not affected by the addition of the AAS-treated digested fibers inthe influent.
Author Contributions: Conceptualization, H.N.G.; methodology, C.M.-X., I.V.S. and H.N.G.; validation, C.M.-X.;formal analysis, C.M.-X. and H.N.G.; investigation, C.M.-X.; writing—original draft preparation, C.M.-X.;writing—review and editing, H.N.G. and I.V.S.; visualization, C.M.-X. and H.N.G.; supervision, H.N.G. and I.V.S.;project administration, H.N.G. and I.V.S.; funding acquisition, I.V.S.
Funding: This research was funded by EUDP, Energistyrelsen, Copenhagen, grants RETROGAS and DEMONIAGAS.
Acknowledgments: The authors wish to thank the EUDP, Energistyrelsen, Copenhagen for the financial supportof this work under RETROGAS and DEMONIAGAS project.
Conflicts of Interest: The authors declare no conflict of interest.
References
1. Birkmose, T.; Foged, H.L.; Hinge, J. State of Biogas Plants in European Agriculture; Danish Agricultural AdvisoryService: Brussels, Belgium, 2007.
2. Angelidaki, I.; Ellegaard, L. Codigestion of manure and organic wastes in centralized biogas plants. Statusand Future Trends. Appl. Biochem. Biotechnol. 2003, 109, 95–105.
3. Maibritt Hjorth, K.V.; Christensen, M.L.; Christensen, S.G.S. Solid-liquid Separation of Animal Slurry inTheory and Practice. In Sustainable Agriculture Volume 2; Springer: Dordrecht, The Netherlands, 2017;pp. 553–568.
4. Jurado, E.; Gavala, H.N.; Rohold, L.; Skiadas, I. Cost-effective production of biogas from manure—Retrogasproject. In Proceedings of the WasteEng10, Beijing, China, 17–19 May 2010; p. 224.
5. Hartmann, H.; Angelidaki, I.; Ahring, B.K. Increase of anaerobic degradation of particulate organic matter infull-scale biogas plants by mechanical maceration. Water Sci. Technol. 2000, 41, 145–153.
6. Bruni, E.; Jensen, A.P.; Angelidaki, I. Comparative study of mechanical, hydrothermal, chemical andenzymatic treatments of digested biofibers to improve biogas production. Bioresour. Technol. 2010, 101,8713–8717.
7. Kim, T.H.; Gupta, R.; Lee, Y. Pretreatment of Biomass by Aqueous Ammonia for bioethanol production. InBiofuels: Methods and Protocols; Springer: Dordrecht, The Netherlands, 2009; pp. 79–91.
8. Jurado, E.; Skiadas, I.V.; Gavala, H.N. Enhanced methane productivity from manure fibers by aqueousammonia soaking pretreatment. Appl. Energy 2013, 109, 104–111.
9. Mirtsou-Xanthopoulou, C.; Jurado, E.; Skiadas, I.V.; Gavala, H.N. Effect of aqueous ammonia soaking on themethane yield and composition of digested manure fibers applying different ammonia concentrations andtreatment durations. Energies 2014, 7, 4157–4168.
10. Lymperatou, A.; Gavala, H.N.; Skiadas, I.V. Optimization of Aqueous Ammonia Soaking of manure fibers byResponse Surface Methodology for unlocking the methane potential of swine manure. Bioresour. Technol.2017, 244, 509–516.
180
Molecules 2019, 24, 2469
11. Gavala, H.; Angelidaki, I.; Ahring, B. Kinetics and modeling of anaerobic digestion process. In BiomethanationI; Springer: Dordrecht, The Netherlands, 2003; pp. 57–93.
12. Batstone, D.J.; Keller, J.; Angelidaki, I.; Kalyuzhnyi, S.V.; Pavlostathis, S.G.; Rozzi, A.; Sanders, W.T.M.;Siegrist, H.; Vavilin, V.A. The IWA Anaerobic Digestion Model No. 1 (ADM1). Water Sci. Technol. 2002, 45,65–73.
13. Batstone, D.J.; Keller, J.; Steyer, J.P. A review of ADM1 extensions, applications, and analysis: 2002–2005.Water Sci. Technol. 2006, 54, 1–10.
14. Astals, S.; Ariso, M.; Gali, A.; Mata-Alvarez, J. Co-digestion of pig manure and glycerine: Experimental andmodelling study. J. Environ. Manage. 2011, 92, 1091–1096.
15. Bulkowska, K.; Bialobrzewski, I.; Klimiuk, E.; Pokoj, T. Kinetic parameters of volatile fatty acids uptake inthe ADM1 as key factors for modeling co-digestion of silages with pig manure, thin stillage and glycerinephase. Renew. Energy 2018, 126, 163–176.
16. Gali, A.; Benabdallah, T.; Astals, S.; Mata-Alvarez, J. Modified version of ADM1 model for agro-wasteapplication. Bioresour. Technol. 2009, 100, 2783–2790.
17. Jablonski, S.J.; Biernacki, P.; Steinigeweg, S.; Lukaszewicz, M. Continuous mesophilic anaerobic digestion ofmanure and rape oilcake—Experimental and modelling study. Waste Manag. 2015, 35, 105–110.
18. Mata-Alvarez, J.; Dosta, J.; Mace, S.; Astals, S. Codigestion of solid wastes: A review of its uses andperspectives including modeling. Crit. Rev. Biotechnol. 2011, 31, 99–111.
19. Nordlander, E.; Thorin, E.; Yan, J. Investigating the possibility of applying an ADM1 based model to afull-scale co-digestion plant. Biochem. Eng. J. 2017, 120, 73–83.
20. Jurado, E.; Antonopoulou, G.; Lyberatos, G.; Gavala, H.N.; Skiadas, I.V. Continuous anaerobic digestionof swine manure: ADM1-based modelling and effect of addition of swine manure fibers pretreated withaqueous ammonia soaking. Appl. Energy 2016, 172, 190–198.
21. American Water Works Association; Water Environment Federation; American Public Health Association.Standard Methods for Examination of Water and Wastewater, 21st ed.; APHA: Washington, DC, USA, 2005.
22. Haagensen, F.; Skiadas, I.V.; Gavala, H.N.; Ahring, B.K. Pre-treatment and ethanol fermentation potential ofolive pulp at different dry matter concentrations. Biomass Bioenerg. 2009, 33, 1643–1651.
23. Sluite, A.; Hames, B.; Ruiz, R.; Scarlata, C.; Sluiter, J.; Templeton, D.; Crocker, D. Determination of StructuralCarbohydrates and Lignin in Biomass. National Renewable Energy Laboratory (NREL) Home Page. Availableonline: https://www.nrel.gov/ (accessed on 4 July 2019).
24. Kalfas, H.; Skiadas, I.V.; Gavala, H.N.; Stamatelatou, K.; Lyberatos, G. Application of ADM1 for the simulationof anaerobic digestion of olive pulp under mesophilic and thermophilic conditions. Water Sci. Technol. 2006,54, 149–156.
25. Antonopoulou, G.; Gavala, H.N.; Skiadas, I.V.; Lyberatos, G. Modeling of fermentative hydrogen productionfrom sweet sorghum extract based on modified ADM1. Int. J. Hydrogen Energy 2012, 37. [CrossRef]
Sample Availability: Not available.
© 2019 by the authors. Licensee MDPI, Basel, Switzerland. This article is an open accessarticle distributed under the terms and conditions of the Creative Commons Attribution(CC BY) license (http://creativecommons.org/licenses/by/4.0/).
181


molecules
Article
A Citrus Peel Waste Biorefinery for Ethanol andMethane Production
Maria Patsalou, Charis G. Samanides, Eleni Protopapa, Stella Stavrinou, Ioannis Vyrides andMichalis Koutinas *
Department of Environmental Science & Technology, Cyprus University of Technology,30 Archbishop Kyprianou Str., 3036 Limassol, Cyprus* Correspondence: [email protected]; Tel.: +357-2500-2067
Academic Editor: Derek J. McPheeReceived: 1 June 2019; Accepted: 3 July 2019; Published: 4 July 2019
Abstract: This paper deals with the development of a citrus peel waste (CPW) biorefinery thatemploys low environmental impact technologies for production of ethanol and methane. Three majoryeasts were compared for ethanol production in batch fermentations using CPW pretreated throughacid hydrolysis and a combination of acid and enzyme hydrolysis. The most efficient conditions forproduction of CPW-based hydrolyzates included processing at 116 C for 10 min. Pichia kudriavzeviiKVMP10 achieved the highest ethanol production that reached 30.7 g L−1 in fermentations conductedat elevated temperatures (42 C). A zero-waste biorefinery was introduced by using solid biorefineryresidues in repeated batch anaerobic digestion fermentations achieving methane formation of 342 mLgVS
−1 (volatile solids). Methane production applying untreated and dried CPW reached a similarlevel (339–356 mL gVS
−1) to the use of the side stream, demonstrating that the developed bioprocessconstitutes an advanced alternative to energy intensive methods for biofuel production.
Keywords: bioethanol; biomethane; citrus peel waste; biorefinery; biorefinery residues
1. Introduction
Vegetable and fruit waste account for 20–50% of household waste in various countries, while citruspeel waste (CPW) comprises a principal residue under the specific category [1]. Global citrus production(orange, lemon, lime, kinnow, sweet orange, etc.) constitutes over 121 × 106 t annually, while theindustrial juice manufacturing sector generates about 25 × 106 t of CPW [2]. CPW formed duringprocessing of the fruit consists mainly of peels and pressed pulp (seeds and segment membranes),accounting for 50% of the fruit’s weight [3,4].
Current management options for CPW include burying in landfills and application as animal feedafter drying. However, the thermal dehydration process of CPW to produce animal feeds is energyconsuming and not always cost-effective [5], while the final product consists of rather poor animalfeed, due to low protein content and high quantity of sugars [6]. Moreover, the waste includes elevatedorganic matter (approximately 95% of total solids) and water content (approximately 80–90%), as wellas low pH (3–4), making CPW inappropriate for landfilling based on the latest EU Waste FrameworkDirective 2008/98/EC [7].
Although the disposal of CPW is opposed to EU regulations, the waste could serve as a valuablefeedstock for the manufacture of biofuels and other commodities. Specifically, CPW comprises highlevels of pectin, cellulose, hemicellulose, and soluble sugars, while 0.5% g g−1 of essential oils areincluded on a wet basis [8,9]. D-limonene, constituting the main component of essential oils inCPW, is a terpenic compound with antimicrobial properties and applicability in food, cosmetics,and pharmaceutical industries [10]. Thus, citrus processing industries usually recover essential oilsfrom the waste streams produced as an added-value extractable component [11].
183
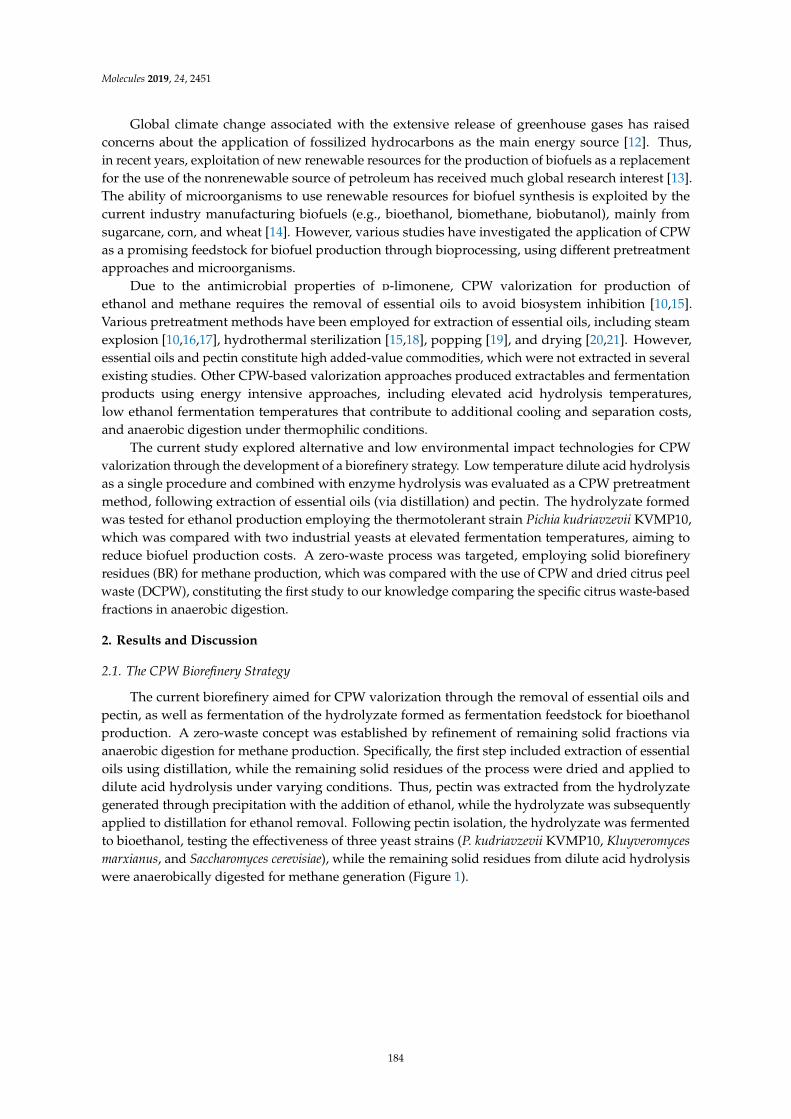
Molecules 2019, 24, 2451
Global climate change associated with the extensive release of greenhouse gases has raisedconcerns about the application of fossilized hydrocarbons as the main energy source [12]. Thus,in recent years, exploitation of new renewable resources for the production of biofuels as a replacementfor the use of the nonrenewable source of petroleum has received much global research interest [13].The ability of microorganisms to use renewable resources for biofuel synthesis is exploited by thecurrent industry manufacturing biofuels (e.g., bioethanol, biomethane, biobutanol), mainly fromsugarcane, corn, and wheat [14]. However, various studies have investigated the application of CPWas a promising feedstock for biofuel production through bioprocessing, using different pretreatmentapproaches and microorganisms.
Due to the antimicrobial properties of d-limonene, CPW valorization for production ofethanol and methane requires the removal of essential oils to avoid biosystem inhibition [10,15].Various pretreatment methods have been employed for extraction of essential oils, including steamexplosion [10,16,17], hydrothermal sterilization [15,18], popping [19], and drying [20,21]. However,essential oils and pectin constitute high added-value commodities, which were not extracted in severalexisting studies. Other CPW-based valorization approaches produced extractables and fermentationproducts using energy intensive approaches, including elevated acid hydrolysis temperatures,low ethanol fermentation temperatures that contribute to additional cooling and separation costs,and anaerobic digestion under thermophilic conditions.
The current study explored alternative and low environmental impact technologies for CPWvalorization through the development of a biorefinery strategy. Low temperature dilute acid hydrolysisas a single procedure and combined with enzyme hydrolysis was evaluated as a CPW pretreatmentmethod, following extraction of essential oils (via distillation) and pectin. The hydrolyzate formedwas tested for ethanol production employing the thermotolerant strain Pichia kudriavzevii KVMP10,which was compared with two industrial yeasts at elevated fermentation temperatures, aiming toreduce biofuel production costs. A zero-waste process was targeted, employing solid biorefineryresidues (BR) for methane production, which was compared with the use of CPW and dried citrus peelwaste (DCPW), constituting the first study to our knowledge comparing the specific citrus waste-basedfractions in anaerobic digestion.
2. Results and Discussion
2.1. The CPW Biorefinery Strategy
The current biorefinery aimed for CPW valorization through the removal of essential oils andpectin, as well as fermentation of the hydrolyzate formed as fermentation feedstock for bioethanolproduction. A zero-waste concept was established by refinement of remaining solid fractions viaanaerobic digestion for methane production. Specifically, the first step included extraction of essentialoils using distillation, while the remaining solid residues of the process were dried and applied todilute acid hydrolysis under varying conditions. Thus, pectin was extracted from the hydrolyzategenerated through precipitation with the addition of ethanol, while the hydrolyzate was subsequentlyapplied to distillation for ethanol removal. Following pectin isolation, the hydrolyzate was fermentedto bioethanol, testing the effectiveness of three yeast strains (P. kudriavzevii KVMP10, Kluyveromycesmarxianus, and Saccharomyces cerevisiae), while the remaining solid residues from dilute acid hydrolysiswere anaerobically digested for methane generation (Figure 1).
184
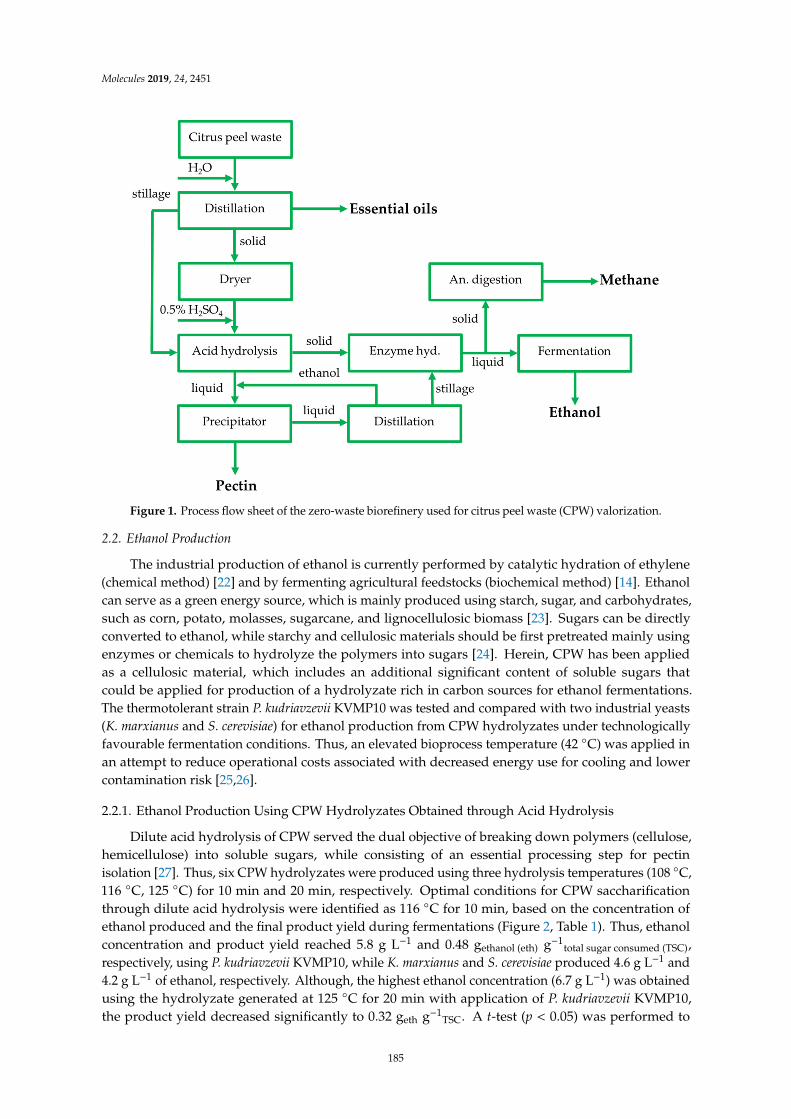
Molecules 2019, 24, 2451Molecules 2019, 24, x FOR PEER REVIEW 3 of 16
Figure 1. Process flow sheet of the zero-waste biorefinery used for citrus peel waste (CPW) valorization.
2.2. Ethanol Production
The industrial production of ethanol is currently performed by catalytic hydration of ethylene (chemical method) [22] and by fermenting agricultural feedstocks (biochemical method) [14]. Ethanol can serve as a green energy source, which is mainly produced using starch, sugar, and carbohydrates, such as corn, potato, molasses, sugarcane, and lignocellulosic biomass [23]. Sugars can be directly converted to ethanol, while starchy and cellulosic materials should be first pretreated mainly using enzymes or chemicals to hydrolyze the polymers into sugars [24]. Herein, CPW has been applied as a cellulosic material, which includes an additional significant content of soluble sugars that could be applied for production of a hydrolyzate rich in carbon sources for ethanol fermentations. The thermotolerant strain P. kudriavzevii KVMP10 was tested and compared with two industrial yeasts (K. marxianus and S. cerevisiae) for ethanol production from CPW hydrolyzates under technologically favourable fermentation conditions. Thus, an elevated bioprocess temperature (42 °C) was applied in an attempt to reduce operational costs associated with decreased energy use for cooling and lower contamination risk [25,26].
2.2.1. Ethanol Production Using CPW Hydrolyzates Obtained through Acid Hydrolysis
Dilute acid hydrolysis of CPW served the dual objective of breaking down polymers (cellulose, hemicellulose) into soluble sugars, while consisting of an essential processing step for pectin isolation [27]. Thus, six CPW hydrolyzates were produced using three hydrolysis temperatures (108 °C, 116 °C, 125 °C) for 10 min and 20 min, respectively. Optimal conditions for CPW saccharification through dilute acid hydrolysis were identified as 116 °C for 10 min, based on the concentration of ethanol produced and the final product yield during fermentations (Figure 2, Table 1). Thus, ethanol concentration and product yield reached 5.8 g L−1 and 0.48 gethanol (eth) g−1total sugar consumed (TSC), respectively, using P. kudriavzevii KVMP10, while K. marxianus and S. cerevisiae produced 4.6 g L−1 and 4.2 g L−1 of ethanol, respectively. Although, the highest ethanol concentration (6.7 g L−1) was obtained using the hydrolyzate generated at 125 °C for 20 min with application of P. kudriavzevii KVMP10, the product yield decreased significantly to 0.32 geth g−1TSC. A t-test (p < 0.05) was performed to statistically assess
Figure 1. Process flow sheet of the zero-waste biorefinery used for citrus peel waste (CPW) valorization.
2.2. Ethanol Production
The industrial production of ethanol is currently performed by catalytic hydration of ethylene(chemical method) [22] and by fermenting agricultural feedstocks (biochemical method) [14]. Ethanolcan serve as a green energy source, which is mainly produced using starch, sugar, and carbohydrates,such as corn, potato, molasses, sugarcane, and lignocellulosic biomass [23]. Sugars can be directlyconverted to ethanol, while starchy and cellulosic materials should be first pretreated mainly usingenzymes or chemicals to hydrolyze the polymers into sugars [24]. Herein, CPW has been appliedas a cellulosic material, which includes an additional significant content of soluble sugars thatcould be applied for production of a hydrolyzate rich in carbon sources for ethanol fermentations.The thermotolerant strain P. kudriavzevii KVMP10 was tested and compared with two industrial yeasts(K. marxianus and S. cerevisiae) for ethanol production from CPW hydrolyzates under technologicallyfavourable fermentation conditions. Thus, an elevated bioprocess temperature (42 C) was applied inan attempt to reduce operational costs associated with decreased energy use for cooling and lowercontamination risk [25,26].
2.2.1. Ethanol Production Using CPW Hydrolyzates Obtained through Acid Hydrolysis
Dilute acid hydrolysis of CPW served the dual objective of breaking down polymers (cellulose,hemicellulose) into soluble sugars, while consisting of an essential processing step for pectinisolation [27]. Thus, six CPW hydrolyzates were produced using three hydrolysis temperatures (108 C,116 C, 125 C) for 10 min and 20 min, respectively. Optimal conditions for CPW saccharificationthrough dilute acid hydrolysis were identified as 116 C for 10 min, based on the concentration ofethanol produced and the final product yield during fermentations (Figure 2, Table 1). Thus, ethanolconcentration and product yield reached 5.8 g L−1 and 0.48 gethanol (eth) g−1
total sugar consumed (TSC),respectively, using P. kudriavzevii KVMP10, while K. marxianus and S. cerevisiae produced 4.6 g L−1 and4.2 g L−1 of ethanol, respectively. Although, the highest ethanol concentration (6.7 g L−1) was obtainedusing the hydrolyzate generated at 125 C for 20 min with application of P. kudriavzevii KVMP10,the product yield decreased significantly to 0.32 geth g−1
TSC. A t-test (p < 0.05) was performed to
185
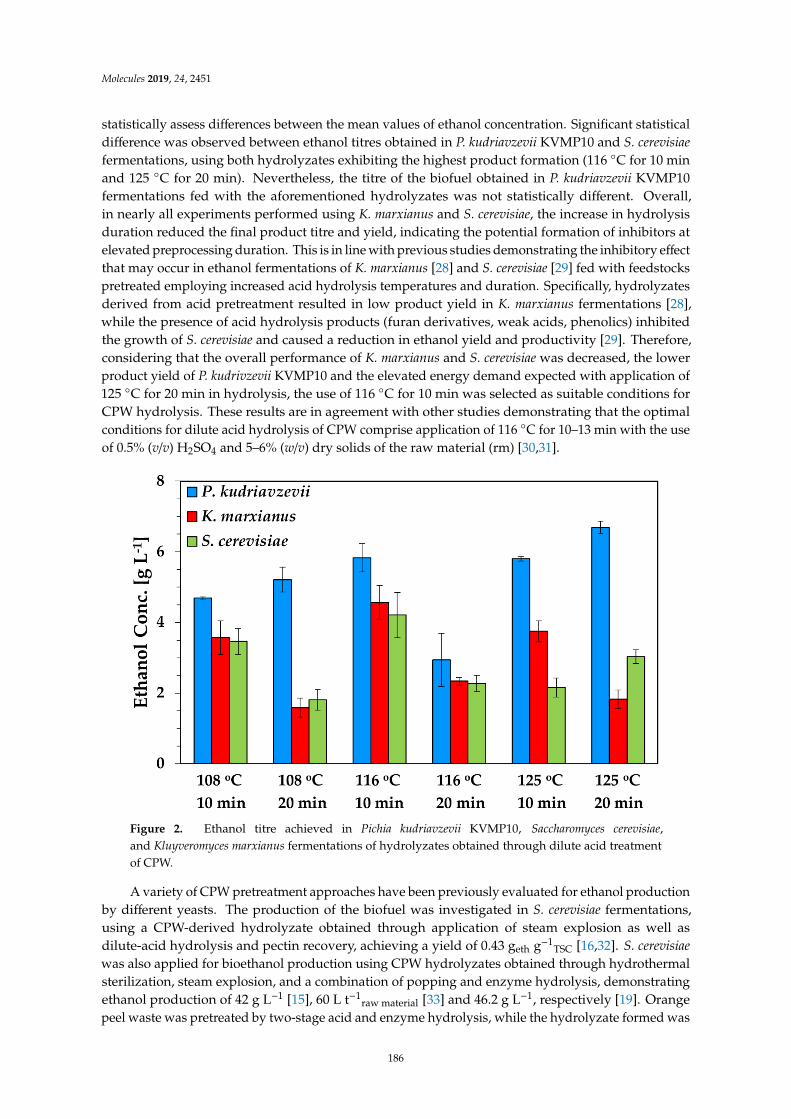
Molecules 2019, 24, 2451
statistically assess differences between the mean values of ethanol concentration. Significant statisticaldifference was observed between ethanol titres obtained in P. kudriavzevii KVMP10 and S. cerevisiaefermentations, using both hydrolyzates exhibiting the highest product formation (116 C for 10 minand 125 C for 20 min). Nevertheless, the titre of the biofuel obtained in P. kudriavzevii KVMP10fermentations fed with the aforementioned hydrolyzates was not statistically different. Overall,in nearly all experiments performed using K. marxianus and S. cerevisiae, the increase in hydrolysisduration reduced the final product titre and yield, indicating the potential formation of inhibitors atelevated preprocessing duration. This is in line with previous studies demonstrating the inhibitory effectthat may occur in ethanol fermentations of K. marxianus [28] and S. cerevisiae [29] fed with feedstockspretreated employing increased acid hydrolysis temperatures and duration. Specifically, hydrolyzatesderived from acid pretreatment resulted in low product yield in K. marxianus fermentations [28],while the presence of acid hydrolysis products (furan derivatives, weak acids, phenolics) inhibitedthe growth of S. cerevisiae and caused a reduction in ethanol yield and productivity [29]. Therefore,considering that the overall performance of K. marxianus and S. cerevisiae was decreased, the lowerproduct yield of P. kudrivzevii KVMP10 and the elevated energy demand expected with application of125 C for 20 min in hydrolysis, the use of 116 C for 10 min was selected as suitable conditions forCPW hydrolysis. These results are in agreement with other studies demonstrating that the optimalconditions for dilute acid hydrolysis of CPW comprise application of 116 C for 10–13 min with the useof 0.5% (v/v) H2SO4 and 5–6% (w/v) dry solids of the raw material (rm) [30,31].
Molecules 2019, 24, x FOR PEER REVIEW 4 of 16
differences between the mean values of ethanol concentration. Significant statistical difference was observed between ethanol titres obtained in P. kudriavzevii KVMP10 and S. cerevisiae fermentations, using both hydrolyzates exhibiting the highest product formation (116 °C for 10 min and 125 °C for 20 min). Nevertheless, the titre of the biofuel obtained in P. kudriavzevii KVMP10 fermentations fed with the aforementioned hydrolyzates was not statistically different. Overall, in nearly all experiments performed using K. marxianus and S. cerevisiae, the increase in hydrolysis duration reduced the final product titre and yield, indicating the potential formation of inhibitors at elevated preprocessing duration. This is in line with previous studies demonstrating the inhibitory effect that may occur in ethanol fermentations of K. marxianus [28] and S. cerevisiae [29] fed with feedstocks pretreated employing increased acid hydrolysis temperatures and duration. Specifically, hydrolyzates derived from acid pretreatment resulted in low product yield in K. marxianus fermentations [28], while the presence of acid hydrolysis products (furan derivatives, weak acids, phenolics) inhibited the growth of S. cerevisiae and caused a reduction in ethanol yield and productivity [29]. Therefore, considering that the overall performance of K. marxianus and S. cerevisiae was decreased, the lower product yield of P. kudrivzevii KVMP10 and the elevated energy demand expected with application of 125 °C for 20 min in hydrolysis, the use of 116 °C for 10 min was selected as suitable conditions for CPW hydrolysis. These results are in agreement with other studies demonstrating that the optimal conditions for dilute acid hydrolysis of CPW comprise application of 116 °C for 10–13 min with the use of 0.5% (v/v) H2SO4 and 5–6% (w/v) dry solids of the raw material (rm) [30,31].
Figure 2. Εthanol titre achieved in Pichia kudriavzevii KVMP10, Saccharomyces cerevisiae, and Kluyveromyces marxianus fermentations of hydrolyzates obtained through dilute acid treatment of CPW.
A variety of CPW pretreatment approaches have been previously evaluated for ethanol production by different yeasts. The production of the biofuel was investigated in S. cerevisiae fermentations, using a CPW-derived hydrolyzate obtained through application of steam explosion as well as dilute-acid hydrolysis and pectin recovery, achieving a yield of 0.43 geth g−1TSC [16,32]. S. cerevisiae was also applied for bioethanol production using CPW hydrolyzates obtained through hydrothermal sterilization, steam explosion, and a combination of popping and enzyme hydrolysis, demonstrating ethanol production of 42 g L−1 [15], 60 L t−1raw material [33] and 46.2 g L−1, respectively [19]. Orange peel waste was pretreated by two-stage acid and enzyme hydrolysis, while the hydrolyzate
Figure 2. Ethanol titre achieved in Pichia kudriavzevii KVMP10, Saccharomyces cerevisiae,and Kluyveromyces marxianus fermentations of hydrolyzates obtained through dilute acid treatmentof CPW.
A variety of CPW pretreatment approaches have been previously evaluated for ethanol productionby different yeasts. The production of the biofuel was investigated in S. cerevisiae fermentations,using a CPW-derived hydrolyzate obtained through application of steam explosion as well asdilute-acid hydrolysis and pectin recovery, achieving a yield of 0.43 geth g−1
TSC [16,32]. S. cerevisiaewas also applied for bioethanol production using CPW hydrolyzates obtained through hydrothermalsterilization, steam explosion, and a combination of popping and enzyme hydrolysis, demonstratingethanol production of 42 g L−1 [15], 60 L t−1
raw material [33] and 46.2 g L−1, respectively [19]. Orangepeel waste was pretreated by two-stage acid and enzyme hydrolysis, while the hydrolyzate formed was
186
Molecules 2019, 24, 2451
used as fermentation feedstock for bioethanol production by S. cerevisiae and Mucor indicus, achievingfinal product concentrations of 30.3 g L−1 and 15 g L−1 with a yield of 0.46 geth g−1
TSC and 0.39 geth
g−1TSC, respectively [21,34].
Table 1. Consumption of reducing sugars and final titre of ethanol in fermentations of acid hydrolyzates.
Experiment Reducing Sugars Consumed (g L−1) Final Ethanol Titre (g L−1)
P. kudriavzevii KVMP10
108 C, 10 min 11.0 4.7108 C, 20 min 17.9 5.2116 C, 10 min 12.1 5.8116 C, 20 min 30.9 2.9125 C, 10 min 15.5 5.8125 C, 20 min 20.5 6.7
K. marxianus
108 C, 10 min 9.8 3.6108 C, 20 min 3.1 1.6116 C, 10 min 17.2 4.6116 C, 20 min 10.9 2.3125 C, 10 min 7.5 3.8125 C, 20 min 18.6 1.8
S. cerevisiae
108 C, 10 min 6.9 3.5108 C, 20 min 5.4 1.8116 C, 10 min 8.6 4.2116 C, 20 min 6.0 2.7125 C, 10 min 8.1 2.2125 C, 20 min 5.9 3.0
2.2.2. Optimization of the Fermentation Process
The final ethanol titre achieved using the hydrolyzates obtained was low compared to therelevant literature. Therefore, a number of parameters were evaluated to improve ethanol productionthrough the biorefinery proposed. The effect of nitrogen source supplementation was initially tested toincrease biofuel production. However, although nitrogenous compounds can substantially enhance thefermentation rate of ethanol [35,36], the use of yeast extract as a nitrogen source did not demonstrateany noticeable effect on ethanol formation in all yeast fermentations conducted.
Acid and enzyme hydrolysis were combined as sequential pretreatments to enhance the productionof ethanol, due to potential increased release of fermentable sugars. The addition of the enzymaticpretreatment step in the biorefinery substantially enhanced the titre of bioethanol to 9.2 g L−1 in P.kudriavzevii KVMP10 fermentations, resulting in a product yield of 0.42 geth g−1
TSC. Pretreatmentprocesses that involve two steps can be more efficient in lignocellulosic biomass saccharification,releasing increased concentrations of simple sugars that enhance ethanol generation [19,21]. Thus,sequentially applied acid and enzyme hydrolysis of CPW was capable of producing substantiallyelevated sugar yields that reached 0.58 gtotal sugar g−1
dry raw material [30].Recycling of the remaining liquid stillage following essential oil extraction into the hydrolysis
process was applied in an attempt to further increase the concentration of monosaccharides in thehydrolyzate and ethanol formation, as well as to reuse the process water generated for plant application.Stillage water recycling contributed to a three-fold increase of ethanol concentration that reached30.7 g L−1 in P. kudriavzevii KVMP10 fermentations conducted at 42 C, while biofuel production wasalso enhanced in K. marxianus cultures reaching 26.3 g L−1. Nevertheless, ethanol production from S.cerevisiae remained at low levels with the reuse of the stillage, potentially due to the elevated processtemperature employed. The present findings demonstrate that P. kudriavzevii KVMP10 constitutes
187
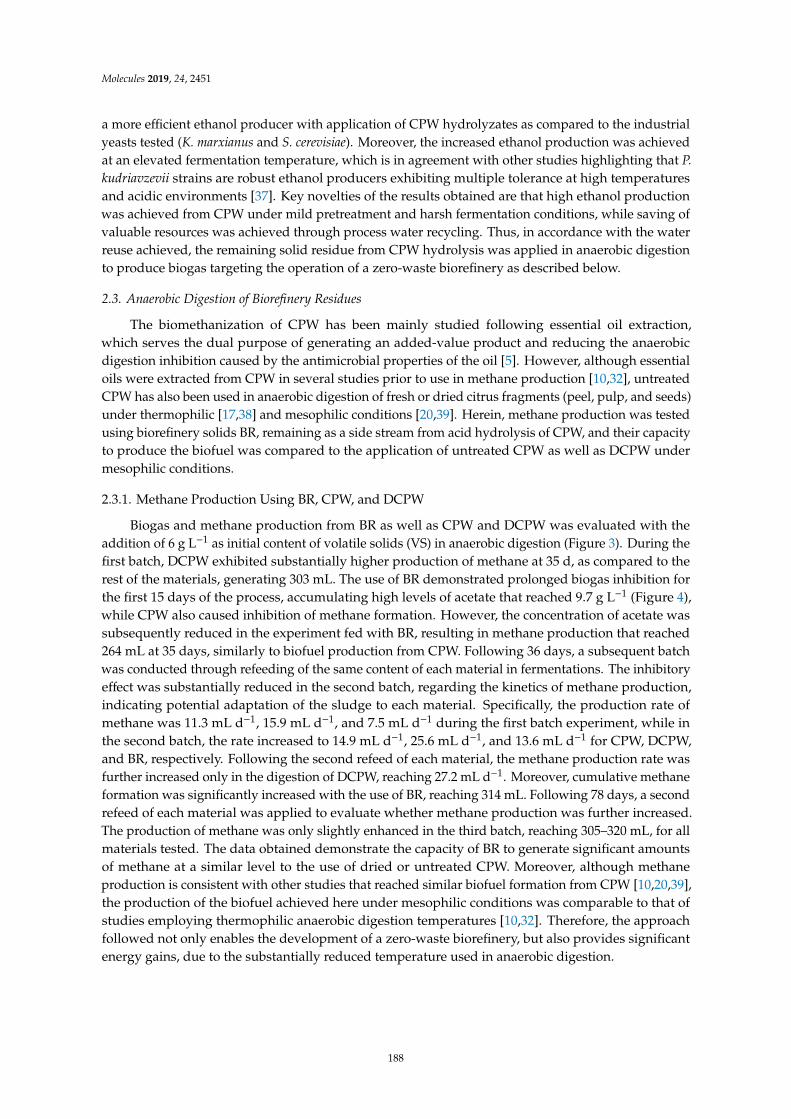
Molecules 2019, 24, 2451
a more efficient ethanol producer with application of CPW hydrolyzates as compared to the industrialyeasts tested (K. marxianus and S. cerevisiae). Moreover, the increased ethanol production was achievedat an elevated fermentation temperature, which is in agreement with other studies highlighting that P.kudriavzevii strains are robust ethanol producers exhibiting multiple tolerance at high temperaturesand acidic environments [37]. Key novelties of the results obtained are that high ethanol productionwas achieved from CPW under mild pretreatment and harsh fermentation conditions, while saving ofvaluable resources was achieved through process water recycling. Thus, in accordance with the waterreuse achieved, the remaining solid residue from CPW hydrolysis was applied in anaerobic digestionto produce biogas targeting the operation of a zero-waste biorefinery as described below.
2.3. Anaerobic Digestion of Biorefinery Residues
The biomethanization of CPW has been mainly studied following essential oil extraction,which serves the dual purpose of generating an added-value product and reducing the anaerobicdigestion inhibition caused by the antimicrobial properties of the oil [5]. However, although essentialoils were extracted from CPW in several studies prior to use in methane production [10,32], untreatedCPW has also been used in anaerobic digestion of fresh or dried citrus fragments (peel, pulp, and seeds)under thermophilic [17,38] and mesophilic conditions [20,39]. Herein, methane production was testedusing biorefinery solids BR, remaining as a side stream from acid hydrolysis of CPW, and their capacityto produce the biofuel was compared to the application of untreated CPW as well as DCPW undermesophilic conditions.
2.3.1. Methane Production Using BR, CPW, and DCPW
Biogas and methane production from BR as well as CPW and DCPW was evaluated with theaddition of 6 g L−1 as initial content of volatile solids (VS) in anaerobic digestion (Figure 3). During thefirst batch, DCPW exhibited substantially higher production of methane at 35 d, as compared to therest of the materials, generating 303 mL. The use of BR demonstrated prolonged biogas inhibition forthe first 15 days of the process, accumulating high levels of acetate that reached 9.7 g L−1 (Figure 4),while CPW also caused inhibition of methane formation. However, the concentration of acetate wassubsequently reduced in the experiment fed with BR, resulting in methane production that reached264 mL at 35 days, similarly to biofuel production from CPW. Following 36 days, a subsequent batchwas conducted through refeeding of the same content of each material in fermentations. The inhibitoryeffect was substantially reduced in the second batch, regarding the kinetics of methane production,indicating potential adaptation of the sludge to each material. Specifically, the production rate ofmethane was 11.3 mL d−1, 15.9 mL d−1, and 7.5 mL d−1 during the first batch experiment, while inthe second batch, the rate increased to 14.9 mL d−1, 25.6 mL d−1, and 13.6 mL d−1 for CPW, DCPW,and BR, respectively. Following the second refeed of each material, the methane production rate wasfurther increased only in the digestion of DCPW, reaching 27.2 mL d−1. Moreover, cumulative methaneformation was significantly increased with the use of BR, reaching 314 mL. Following 78 days, a secondrefeed of each material was applied to evaluate whether methane production was further increased.The production of methane was only slightly enhanced in the third batch, reaching 305–320 mL, for allmaterials tested. The data obtained demonstrate the capacity of BR to generate significant amountsof methane at a similar level to the use of dried or untreated CPW. Moreover, although methaneproduction is consistent with other studies that reached similar biofuel formation from CPW [10,20,39],the production of the biofuel achieved here under mesophilic conditions was comparable to that ofstudies employing thermophilic anaerobic digestion temperatures [10,32]. Therefore, the approachfollowed not only enables the development of a zero-waste biorefinery, but also provides significantenergy gains, due to the substantially reduced temperature used in anaerobic digestion.
188
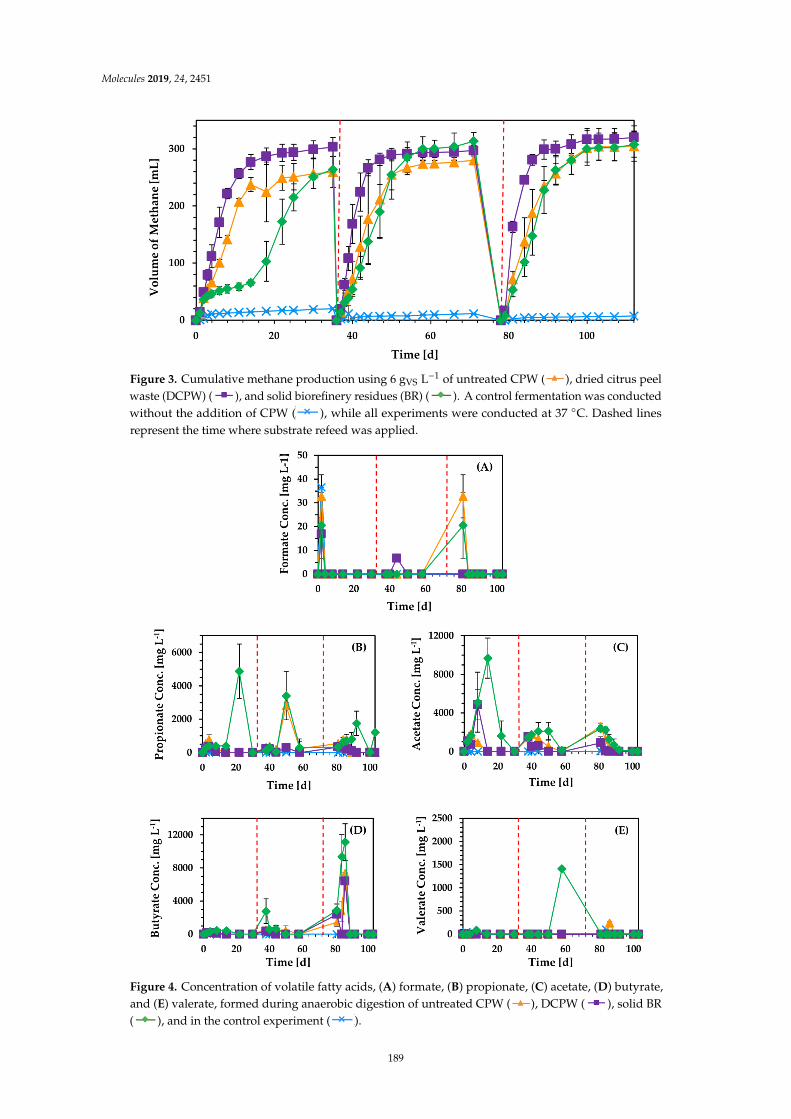
Molecules 2019, 24, 2451Molecules 2019, 24, x FOR PEER REVIEW 7 of 16
Figure 3. Cumulative methane production using 6 gVS L−1 of untreated CPW ( ), dried citrus peel waste (DCPW) ( ), and solid biorefinery residues (BR) ( ). A control fermentation was conducted without the addition of CPW ( ), while all experiments were conducted at 37 °C. Dashed lines represent the time where substrate refeed was applied.
Figure 3. Cumulative methane production using 6 gVS L−1 of untreated CPW (
Molecules 2019, 24, x FOR PEER REVIEW 7 of 16
Figure 3. Cumulative methane production using 6 gVS L−1 of untreated CPW ( ), dried citrus peel waste (DCPW) ( ), and solid biorefinery residues (BR) ( ). A control fermentation was conducted without the addition of CPW ( ), while all experiments were conducted at 37 °C. Dashed lines represent the time where substrate refeed was applied.
), dried citrus peelwaste (DCPW) (
Molecules 2019, 24, x FOR PEER REVIEW 7 of 16
Figure 3. Cumulative methane production using 6 gVS L−1 of untreated CPW ( ), dried citrus peel waste (DCPW) ( ), and solid biorefinery residues (BR) ( ). A control fermentation was conducted without the addition of CPW ( ), while all experiments were conducted at 37 °C. Dashed lines represent the time where substrate refeed was applied.
), and solid biorefinery residues (BR) (
Molecules 2019, 24, x FOR PEER REVIEW 7 of 16
Figure 3. Cumulative methane production using 6 gVS L−1 of untreated CPW ( ), dried citrus peel waste (DCPW) ( ), and solid biorefinery residues (BR) ( ). A control fermentation was conducted without the addition of CPW ( ), while all experiments were conducted at 37 °C. Dashed lines represent the time where substrate refeed was applied.
). A control fermentation was conductedwithout the addition of CPW (
Molecules 2019, 24, x FOR PEER REVIEW 7 of 16
Figure 3. Cumulative methane production using 6 gVS L−1 of untreated CPW ( ), dried citrus peel waste (DCPW) ( ), and solid biorefinery residues (BR) ( ). A control fermentation was conducted without the addition of CPW ( ), while all experiments were conducted at 37 °C. Dashed lines represent the time where substrate refeed was applied.
), while all experiments were conducted at 37 C. Dashed linesrepresent the time where substrate refeed was applied.
Molecules 2019, 24, x FOR PEER REVIEW 8 of 16
Figure 4. Concentration of volatile fatty acids, (A) formate, (B) propionate, (C) acetate, (D) butyrate, and (E) valerate, formed during anaerobic digestion of untreated CPW ( ), DCPW ( ), solid BR ( ), and in the control experiment ( ).
Although the use of DCPW in anaerobic digestion resulted in the highest production of methane in the first batch as compared to the application of CPW and BR, calculation of bioprocess yield showed that employing CPW in the system enhanced the overall waste-to-energy conversion (Figure 5). The methane yield, defined as mL of methane produced per g of raw material (rm) used, was substantially higher, with the application of untreated CPW ranging between 72 and 84 mLmethane g−1rm, respectively. However, employing DCPW and BR resulted in a similar and lower process yield that reached 42–51 mLmethane g−1rm for both materials. The enhanced methane yield performed with the use of CPW was expected, given the higher organic content remaining in the specific material for treatment in anaerobic digestion as compared to DCPW and BR, where volatile compounds and/or hydrolyzed carbohydrates have been removed. This conclusion was clarified by the t-test (p < 0.05) performed to identify statistically significant differences in the mean values obtained for the final methane production (mL) per g of rm with each feedstock in the first two batches. Furthermore, a statistically significant increase (p < 0.05) was observed in the volume of biogas produced per g of rm
Figure 4. Concentration of volatile fatty acids, (A) formate, (B) propionate, (C) acetate, (D) butyrate,and (E) valerate, formed during anaerobic digestion of untreated CPW (
Molecules 2019, 24, x FOR PEER REVIEW 7 of 16
Figure 3. Cumulative methane production using 6 gVS L−1 of untreated CPW ( ), dried citrus peel waste (DCPW) ( ), and solid biorefinery residues (BR) ( ). A control fermentation was conducted without the addition of CPW ( ), while all experiments were conducted at 37 °C. Dashed lines represent the time where substrate refeed was applied.
), DCPW (
Molecules 2019, 24, x FOR PEER REVIEW 7 of 16
Figure 3. Cumulative methane production using 6 gVS L−1 of untreated CPW ( ), dried citrus peel waste (DCPW) ( ), and solid biorefinery residues (BR) ( ). A control fermentation was conducted without the addition of CPW ( ), while all experiments were conducted at 37 °C. Dashed lines represent the time where substrate refeed was applied.
), solid BR(
Molecules 2019, 24, x FOR PEER REVIEW 7 of 16
Figure 3. Cumulative methane production using 6 gVS L−1 of untreated CPW ( ), dried citrus peel waste (DCPW) ( ), and solid biorefinery residues (BR) ( ). A control fermentation was conducted without the addition of CPW ( ), while all experiments were conducted at 37 °C. Dashed lines represent the time where substrate refeed was applied.
), and in the control experiment (
Molecules 2019, 24, x FOR PEER REVIEW 7 of 16
Figure 3. Cumulative methane production using 6 gVS L−1 of untreated CPW ( ), dried citrus peel waste (DCPW) ( ), and solid biorefinery residues (BR) ( ). A control fermentation was conducted without the addition of CPW ( ), while all experiments were conducted at 37 °C. Dashed lines represent the time where substrate refeed was applied.
).
189
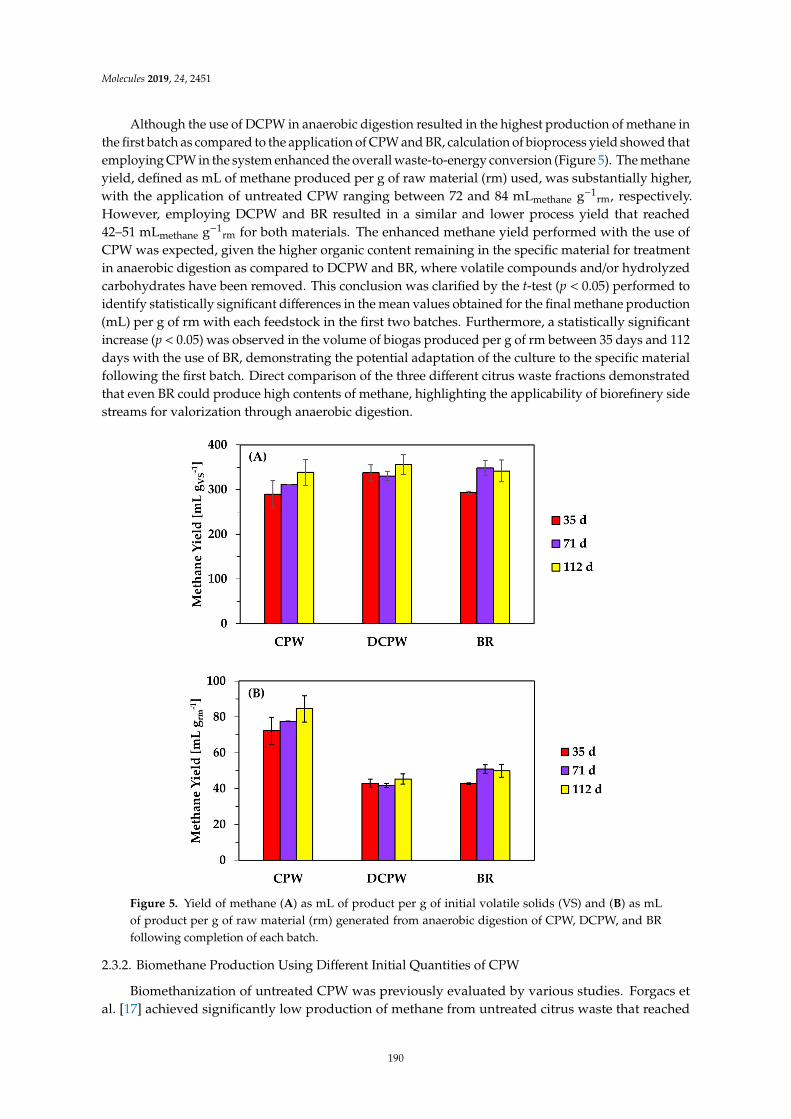
Molecules 2019, 24, 2451
Although the use of DCPW in anaerobic digestion resulted in the highest production of methane inthe first batch as compared to the application of CPW and BR, calculation of bioprocess yield showed thatemploying CPW in the system enhanced the overall waste-to-energy conversion (Figure 5). The methaneyield, defined as mL of methane produced per g of raw material (rm) used, was substantially higher,with the application of untreated CPW ranging between 72 and 84 mLmethane g−1
rm, respectively.However, employing DCPW and BR resulted in a similar and lower process yield that reached42–51 mLmethane g−1
rm for both materials. The enhanced methane yield performed with the use ofCPW was expected, given the higher organic content remaining in the specific material for treatmentin anaerobic digestion as compared to DCPW and BR, where volatile compounds and/or hydrolyzedcarbohydrates have been removed. This conclusion was clarified by the t-test (p < 0.05) performed toidentify statistically significant differences in the mean values obtained for the final methane production(mL) per g of rm with each feedstock in the first two batches. Furthermore, a statistically significantincrease (p < 0.05) was observed in the volume of biogas produced per g of rm between 35 days and 112days with the use of BR, demonstrating the potential adaptation of the culture to the specific materialfollowing the first batch. Direct comparison of the three different citrus waste fractions demonstratedthat even BR could produce high contents of methane, highlighting the applicability of biorefinery sidestreams for valorization through anaerobic digestion.
Molecules 2019, 24, x FOR PEER REVIEW 9 of 16
between 35 days and 112 days with the use of BR, demonstrating the potential adaptation of the culture to the specific material following the first batch. Direct comparison of the three different citrus waste fractions demonstrated that even BR could produce high contents of methane, highlighting the applicability of biorefinery side streams for valorization through anaerobic digestion.
Figure 5. Yield of methane (A) as mL of product per g of initial volatile solids (VS) and (B) as mL of product per g of raw material (rm) generated from anaerobic digestion of CPW, DCPW, and BR following completion of each batch.
2.3.2. Biomethane Production Using Different Initial Quantities of CPW
Biomethanization of untreated CPW was previously evaluated by various studies. Forgacs et al. [17] achieved significantly low production of methane from untreated citrus waste that reached 102 mL g−1VS, while Koppar and Pullammanappallil [38] generated 644 mL g−1VS from untreated CPW under thermophilic conditions. The use of peel, seeds, and pulp of fresh ripe orange as distinct feedstocks in anaerobic digestion under mesophilic conditions resulted in methane production that reached 72 mL g−1VS, 581 mL g−1VS, and 288 mL g−1VS, respectively [39]. Herein, different initial quantities of untreated CPW volatile solids (ranging between 3–24 g L−1) were applied in anaerobic digestion to evaluate the effect of increasing contents of organic material as well as essential oils in
Figure 5. Yield of methane (A) as mL of product per g of initial volatile solids (VS) and (B) as mLof product per g of raw material (rm) generated from anaerobic digestion of CPW, DCPW, and BRfollowing completion of each batch.
2.3.2. Biomethane Production Using Different Initial Quantities of CPW
Biomethanization of untreated CPW was previously evaluated by various studies. Forgacs etal. [17] achieved significantly low production of methane from untreated citrus waste that reached
190
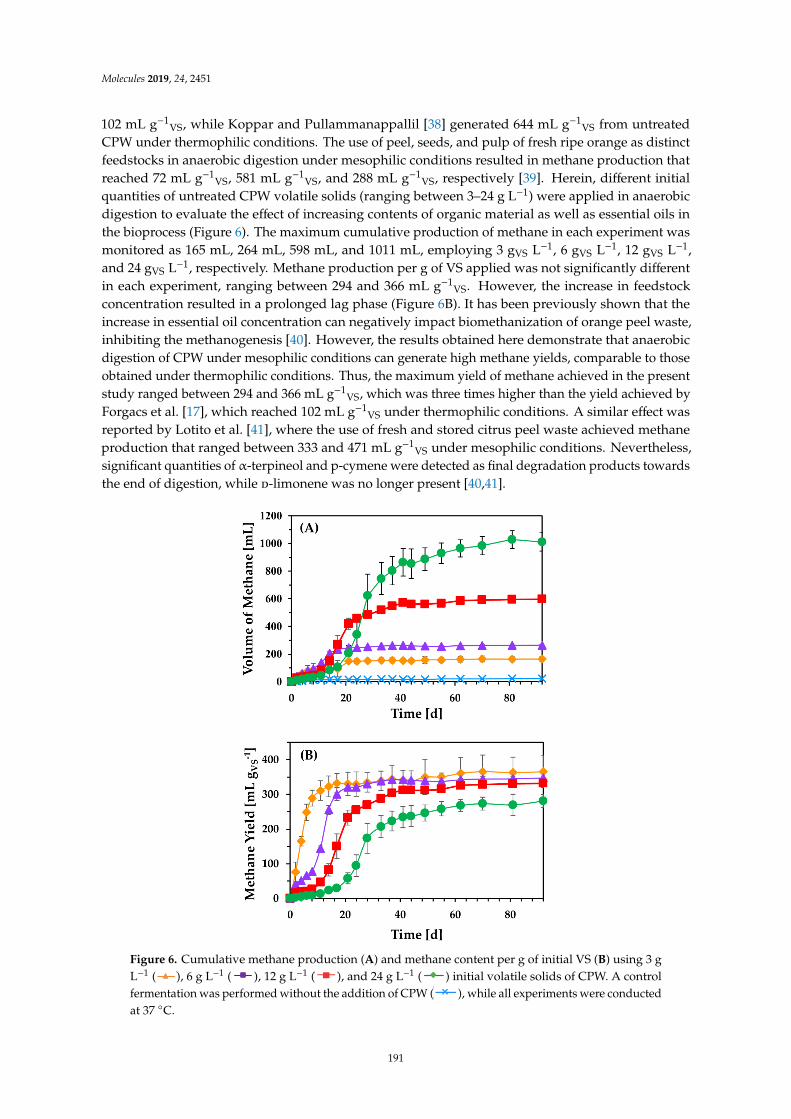
Molecules 2019, 24, 2451
102 mL g−1VS, while Koppar and Pullammanappallil [38] generated 644 mL g−1
VS from untreatedCPW under thermophilic conditions. The use of peel, seeds, and pulp of fresh ripe orange as distinctfeedstocks in anaerobic digestion under mesophilic conditions resulted in methane production thatreached 72 mL g−1
VS, 581 mL g−1VS, and 288 mL g−1
VS, respectively [39]. Herein, different initialquantities of untreated CPW volatile solids (ranging between 3–24 g L−1) were applied in anaerobicdigestion to evaluate the effect of increasing contents of organic material as well as essential oils inthe bioprocess (Figure 6). The maximum cumulative production of methane in each experiment wasmonitored as 165 mL, 264 mL, 598 mL, and 1011 mL, employing 3 gVS L−1, 6 gVS L−1, 12 gVS L−1,and 24 gVS L−1, respectively. Methane production per g of VS applied was not significantly differentin each experiment, ranging between 294 and 366 mL g−1
VS. However, the increase in feedstockconcentration resulted in a prolonged lag phase (Figure 6B). It has been previously shown that theincrease in essential oil concentration can negatively impact biomethanization of orange peel waste,inhibiting the methanogenesis [40]. However, the results obtained here demonstrate that anaerobicdigestion of CPW under mesophilic conditions can generate high methane yields, comparable to thoseobtained under thermophilic conditions. Thus, the maximum yield of methane achieved in the presentstudy ranged between 294 and 366 mL g−1
VS, which was three times higher than the yield achieved byForgacs et al. [17], which reached 102 mL g−1
VS under thermophilic conditions. A similar effect wasreported by Lotito et al. [41], where the use of fresh and stored citrus peel waste achieved methaneproduction that ranged between 333 and 471 mL g−1
VS under mesophilic conditions. Nevertheless,significant quantities of α-terpineol and p-cymene were detected as final degradation products towardsthe end of digestion, while d-limonene was no longer present [40,41].
Molecules 2019, 24, x FOR PEER REVIEW 10 of 16
the bioprocess (Figure 6). The maximum cumulative production of methane in each experiment was monitored as 165 mL, 264 mL, 598 mL, and 1011 mL, employing 3 gVS L−1, 6 gVS L−1, 12 gVS L−1, and 24 gVS L−1, respectively. Methane production per g of VS applied was not significantly different in each experiment, ranging between 294 and 366 mL g−1VS. However, the increase in feedstock concentration resulted in a prolonged lag phase (Figure 6B). It has been previously shown that the increase in essential oil concentration can negatively impact biomethanization of orange peel waste, inhibiting the methanogenesis [40]. However, the results obtained here demonstrate that anaerobic digestion of CPW under mesophilic conditions can generate high methane yields, comparable to those obtained under thermophilic conditions. Thus, the maximum yield of methane achieved in the present study ranged between 294 and 366 mL g−1VS, which was three times higher than the yield achieved by Forgacs et al. [17], which reached 102 mL g−1VS under thermophilic conditions. A similar effect was reported by Lotito et al. [41], where the use of fresh and stored citrus peel waste achieved methane production that ranged between 333 and 471 mL g−1VS under mesophilic conditions. Nevertheless, significant quantities of α-terpineol and p-cymene were detected as final degradation products towards the end of digestion, while D-limonene was no longer present [40,41].
Figure 6. Cumulative methane production (A) and methane content per g of initial VS (B) using 3 g L−1 ( ), 6 g L−1 ( ), 12 g L−1 ( ), and 24 g L−1 ( ) initial volatile solids of CPW. A control fermentation was performed without the addition of CPW ( ), while all experiments were conducted at 37 °C.
3. Materials and Methods
Figure 6. Cumulative methane production (A) and methane content per g of initial VS (B) using 3 gL−1 (
Molecules 2019, 24, x FOR PEER REVIEW 7 of 16
Figure 3. Cumulative methane production using 6 gVS L−1 of untreated CPW ( ), dried citrus peel waste (DCPW) ( ), and solid biorefinery residues (BR) ( ). A control fermentation was conducted without the addition of CPW ( ), while all experiments were conducted at 37 °C. Dashed lines represent the time where substrate refeed was applied.
), 6 g L−1 (
Molecules 2019, 24, x FOR PEER REVIEW 7 of 16
Figure 3. Cumulative methane production using 6 gVS L−1 of untreated CPW ( ), dried citrus peel waste (DCPW) ( ), and solid biorefinery residues (BR) ( ). A control fermentation was conducted without the addition of CPW ( ), while all experiments were conducted at 37 °C. Dashed lines represent the time where substrate refeed was applied.
), 12 g L−1 (
Molecules 2019, 24, x FOR PEER REVIEW 10 of 16
the bioprocess (Figure 6). The maximum cumulative production of methane in each experiment was monitored as 165 mL, 264 mL, 598 mL, and 1011 mL, employing 3 gVS L−1, 6 gVS L−1, 12 gVS L−1, and 24 gVS L−1, respectively. Methane production per g of VS applied was not significantly different in each experiment, ranging between 294 and 366 mL g−1VS. However, the increase in feedstock concentration resulted in a prolonged lag phase (Figure 6B). It has been previously shown that the increase in essential oil concentration can negatively impact biomethanization of orange peel waste, inhibiting the methanogenesis [40]. However, the results obtained here demonstrate that anaerobic digestion of CPW under mesophilic conditions can generate high methane yields, comparable to those obtained under thermophilic conditions. Thus, the maximum yield of methane achieved in the present study ranged between 294 and 366 mL g−1VS, which was three times higher than the yield achieved by Forgacs et al. [17], which reached 102 mL g−1VS under thermophilic conditions. A similar effect was reported by Lotito et al. [41], where the use of fresh and stored citrus peel waste achieved methane production that ranged between 333 and 471 mL g−1VS under mesophilic conditions. Nevertheless, significant quantities of α-terpineol and p-cymene were detected as final degradation products towards the end of digestion, while D-limonene was no longer present [40,41].
Figure 6. Cumulative methane production (A) and methane content per g of initial VS (B) using 3 g L−1 ( ), 6 g L−1 ( ), 12 g L−1 ( ), and 24 g L−1 ( ) initial volatile solids of CPW. A control fermentation was performed without the addition of CPW ( ), while all experiments were conducted at 37 °C.
3. Materials and Methods
), and 24 g L−1 (
Molecules 2019, 24, x FOR PEER REVIEW 7 of 16
Figure 3. Cumulative methane production using 6 gVS L−1 of untreated CPW ( ), dried citrus peel waste (DCPW) ( ), and solid biorefinery residues (BR) ( ). A control fermentation was conducted without the addition of CPW ( ), while all experiments were conducted at 37 °C. Dashed lines represent the time where substrate refeed was applied.
) initial volatile solids of CPW. A controlfermentation was performed without the addition of CPW (
Molecules 2019, 24, x FOR PEER REVIEW 7 of 16
Figure 3. Cumulative methane production using 6 gVS L−1 of untreated CPW ( ), dried citrus peel waste (DCPW) ( ), and solid biorefinery residues (BR) ( ). A control fermentation was conducted without the addition of CPW ( ), while all experiments were conducted at 37 °C. Dashed lines represent the time where substrate refeed was applied.
), while all experiments were conductedat 37 C.
191
Molecules 2019, 24, 2451
3. Materials and Methods
3.1. Citrus Peel Waste
The feedstock applied in the experiments of the present work constituted citrus residues (seeds,pulp, and segment membranes), which were collected from a local citrus processing industry (KEANSoft Drinks Ltd., Limassol, Cyprus) and maintained at −20 C until further use. CPW was thawedand ground to solids of less than 2 mm in diameter using a laboratory blender (Waring Commercial,San Antonio, TX, USA). The chemical composition of CPW has been previously determined as follows:22.00% cellulose, 11.09% hemicellulose, 2.19% lignin, 8.10% glucose, 12.00% fructose, 2.80% sucrose,25.00% pectin, 6.07% protein, and 3.78% limonene [32].
3.2. Pretreatment of Citrus Peel Waste
3.2.1. Extraction of Essential Oils and Pectin
The first step of CPW pretreatment employed distillation for extraction and collection of essentialoils as previously described [30], recovering 0.43% w/w of essential oils. Residues from essential oildistillation were dried at 70 C for 24 h [42] and dilute acid hydrolysis was performed in an autoclave(SANYO MLS-3781L, Panasonic, Tottori, Japan) at 108 C, 116 C, and 125 C for 10 min and 20 min,using 5% (w/v) of dry CPW with the addition of 0.5% (v/v) of sulfuric acid. Following dilute acidhydrolysis, centrifugation and filtration were employed to obtain the supernatant, which was mixedwith an equal volume of ethanol (96% v/v) to precipitate pectin at room temperature for 4 h [32].Subsequently, the mixture was centrifuged at 3000 rpm for 30 min. The precipitate was washed fivetimes with ethanol (45% v/v), followed by drying at 50 C to obtain pectin [43], isolating 23.25% w/wof the heteropolysaccharide, while the supernatant was applied in distillation at 80 C three times torecover and recycle ethanol for pectin precipitation.
3.2.2. Enzyme Hydrolysis
Enzyme hydrolysis was applied as additional pretreatment prior to bioethanol fermentations.The procedure was performed with the addition of solid residues from acid treatment in the hydrolyzateobtained following ethanol recovery. The pH of the mixture was adjusted to 4.8 with the use of1 M NaOH to ensure that process conditions were within the optimal pH range of 4.5–5.0 for theenzymes employed, while cellulases (Chem Cruz, Dallas, TX, USA) and β-glucosidases/pectinases(Oenozym FW, Lamothe-Abiet, Bordeaux, France) were added at 30 IU g−1
drm and 25 BGL g−1drm,
respectively [30]. Enzyme hydrolysis was performed at 50 C for 48 h in shake flasks stirred at 100 rpmin a water bath, while upon hydrolysis completion, enzymes were inactivated via heating in an oven at105 C for 15 min [44].
3.3. Ethanol Fermentations
P. kudriavzevii KVMP10 was previously isolated as a thermotolerant ethanologenic yeast withinour research group [45], while K. marxianus was obtained from the Leibniz Institute DSMZ—GermanCollection of Microorganisms and Cell Cultures (Braunschweig, Germany). Commercial pressedbaker’s yeast was used as a source of S. cerevisiae. All strains were maintained at −80 C in glycerolstock cultures.
P. kudriavzevii KVMP10 and S. cerevisiae were precultured in liquid media, simulating a Valenciaorange peel waste hydrolyzate [4], while the inoculum of K. marxianus was prepared using universalmedia for yeast strains (containing (g L−1) yeast extract 3, malt extract 3, peptone 5, and glucose 10)incubated at 30 C in shake flasks stirred at 100 rpm. Ethanol fermentations were performed in batchexperiments using 100 mL flasks with a working volume of 60 mL at 42 C and 100 rpm. The mixtureof reducing sugars obtained from CPW pretreatment (dilute acid hydrolysis only or combined acid andenzyme hydrolysis) was used as a carbon source for the experiments. The feedstock was supplemented
192
Molecules 2019, 24, 2451
with 10 g L−1 of yeast extract as a nitrogen source. Moreover, recycling of the remaining liquid stillagefollowing essential oil extraction into the hydrolysis process was tested to enhance the soluble sugarcontent in the hydrolyzate. All experiments were performed in duplicate, while three samples wereanalyzed for each replicate, constituting analyses of 6 samples at each time point.
3.4. Anaerobic Digestion Experiments
CPW, DCPW, and BR (remaining solids following acid hydrolysis of CPW) were used as feedstockin anaerobic digestion. Equal quantities of volatile solids (VS, 6 g L−1) were employed to produce biogasunder mesophilic conditions (37 C), while anaerobic digestion was performed in batch experimentsusing 250 mL flasks with a working volume of 150 mL. The nutrient medium was prepared accordingto the composition used in Angelidaki et al. [46]. Each bottle was supplemented with 6 g of granularsludge withdrawn from a full-scale UASB reactor (Charalambides Christis Ltd., Limassol, Cyprus) usedfor the treatment of dairy wastewater at pH 6.8–7.3. The content of sludge in lignin and N-compounds,cellulose, and hemicellulose was measured at 0.35%, 0.30%, and 1.40%, respectively. Granular sludgewas washed with distilled water and applied as active inoculum (4% w/v), while each bottle was flushedwith 100% CO2 gas to ensure anaerobic conditions. Experiments were performed in triplicate andmethane accumulation was determined for 121 days, aiming to evaluate the adaptation of anaerobicdigestion to CPW, DCPW, and BR. Following 36 days, a refeed of each material (6 gVS L−1) was appliedin each digestion and a subsequent refeed was also conducted at 78 days. The refeed of each materialwas performed through withdrawal of 50 mL of digested medium, which was replaced with an equalvolume of fresh media and substrate. Nevertheless, any remaining substrate and anaerobic sludgecould not be removed, while each bottle was subsequently flushed using 100% CO2 gas. Although theratio of biomass versus substrate might have been potentially different between each batch, digestionconditions as well as the procedure of the refeed was the same for all materials tested, enabling directcomparison between each flask. Furthermore, in order to test the effect of different initial VS contentsof CPW, 3, 6, 12, and 24 g L−1 were applied in triplicate anaerobic digestion experiments for 92 days,evaluating the effect of essential oils in the process. The sampling procedure included withdrawing1 mL of biogas with the use of a gas-tight syringe for determination of biogas composition as describedin Section 3.5.4., as well as obtaining biomedium samples for the detection of VFAs. During anaerobicdigestion, the volume of biogas, methane, carbon dioxide, oxygen, hydrogen, and nitrogen producedwas monitored.
3.5. Analyses
3.5.1. Ethanol Concentration
Gas Chromatography using a flame ionization detector was employed for the determination ofethanol concentration. A Shimadzu GC-2014 (Shimadzu, Milton Keynes, UK) and a 30 m long ZebronZB-5 capillary column (Phenomenex, Macclesfield, UK) with a 0.25 mm internal diameter was used.The stationary phase of the column was 5% phenyl- and 95% dimethylpolysiloxane, while the mobilephase applied was nitrogen. Samples obtained during ethanol fermentations were centrifuged for3 min at 13,000 rpm and the supernatant was filtered through 0.2 µm syringe filters. Ethanol wasextracted by vortexing 1 mL of the filtered sample with 2 mL of hexane for 1 min. Approximately 1 µLof the extract was injected and the temperature of the column was kept constant at 40 C for 3 min.Ethanol concentration was calculated, interpolating from a previously established calibration curveand the coefficient of variation for 3 samples was 1.47% at a concentration level of 4 g L−1. Furthermore,the respective LoB, LoD, and LoQ values were calculated at 0, 0.07, and 1.7 g L−1, respectively.
193
Molecules 2019, 24, 2451
3.5.2. Reducing Sugars
During ethanol fermentations the content of reducing sugars was analyzed by the phenol–sulfuricacid method [47]. The LoB, LoD, and LoQ values were calculated at 0, 1.48, and 11.18 mgL−1, respectively.
3.5.3. Total and Volatile Solids
The total solids (TS) and VS content of granular sludge, CPW, DCPW, and BR was determinedaccording to Standard Methods [48]. The LoB/LoD/LoQ values for the determination of formic acid,acetic acid, propionic acid, butyric acid, and valeric acid concentrations were calculated at 0/0.002/0.3 gL−1, 0/0.01/0.3 g L−1, 0/0.01/0.2 g L−1, 0/0.01/0.2 g L−1, and 0/0.003/0.2 g L−1, respectively.
3.5.4. Biogas Composition
Biogas composition (H2, O2, N2, CH4, and CO2) was analyzed using a gas chromatograph (AgilentTechnologies, 7820OA, Santa Clara, CA, USA) fitted with a ShinCarbon ST 50/80 (2 m length, 2.2 mmID) mesh column (Restek Corporation, Bellefonte, PA, USA) and thermal conductivity detector asdescribed by Vardanyan et al. [49]. The LoB/LoD/LoQ values for the determination of hydrogen,oxygen, nitrogen, methane, and carbon dioxide volumes were calculated at 0/0.4/8.4 mL, 0/0.4/3.4 mL,0/1.2/10.5 mL, 0/0.2/7.0 mL, and 0/0.3/1.1 mL, respectively.
3.5.5. Volatile Fatty Acids (VFAs)
The concentration of VFAs (acetate, formate, butyrate, propionate, and valerate) formed duringanaerobic digestion was measured through High Pressure Liquid Chromatography (HPLC). Culturesamples were centrifuged at 13,000 rpm for 3 min and filtered using 0.22 mm syringe filters. A ShimadzuLC-20AD liquid chromatograph (Shimadzu, Milton Keynes, UK) equipped with a Shimadzu SPD-20AUV/VIS detector, a Shimadzu SIL-20A HT auto sampler, and a CTO-10AS VP column oven was used.The column was eluted isocratically at a rate of 0.7 mL min−1 from an organic analysis column (RezexROA-Organic Acid column, Phenomenex, Torrance, CA, USA) with 5 mM H2SO4 at 55 C, while theinjection volume was 1 µL.
4. Conclusions
This paper has demonstrated the potential of a novel zero-waste biorefinery for the productionof renewable biofuels from CPW through low environmental impact technologies. It was confirmedthat the combination of sequential acid and enzyme hydrolysis for CPW pretreatment enhanced thefermentative production of ethanol. Moreover, the thermotolerant P. kudriavzevii KVMP10 was a moreefficient ethanol producer at elevated fermentation temperatures as compared to industrial yeasts(S. cerevisiae and K. marxianus). The use of BR in anaerobic digestion for methane generation resulted inincreased production of the biofuel. The study presents important operational parameters reducingthe energy requirements of the biorefinery.
Author Contributions: Conceptualization, M.K. and I.V.; Methodology, M.K., M.P., and I.V.; Validation, M.P.,C.G.S, E.P., and S.S.; Investigation, M.P., C.G.S, E.P., and S.S.; Writing—Original Draft Preparation, M.K., M.P.,and I.V.; Writing—Review and Editing, M.K., M.P., and I.V.; Supervision, M.K.
Funding: This research received no external funding.
Acknowledgments: We would like to thank KEAN Soft Drinks Ltd. for the provision of citrus peel waste.
Conflicts of Interest: The authors declare no conflict of interest.
References
1. Kosseva, M.R. Sources, characterization, and composition of food industry wastes. In Food Industry Wastes,1st ed.; Kosseva, M.R., Webb, C., Eds.; Elsevier Inc.: London, UK, 2013; pp. 37–60.
194
Molecules 2019, 24, 2451
2. FAO. Citrus Fruit Statistics 2015; FAO: Rome, Italy, 2016; p. 53.3. Marin, F.R.; Soler-Rivas, C.; Benavente-Garcia, O.; Castillo, J.; Perez-Alvarez, J.A. By-products from different
citrus processes as a source of customized functional fibres. Food Chem. 2007, 100, 736–741. [CrossRef]4. Wilkins, M.R. Effect of orange peel oil on ethanol production by Zymomonas mobilis. Biomass Bioenergy 2009,
33, 538–541. [CrossRef]5. Negro, V.; Bernardo, R.; Fino, D. Recovery of energy from orange peels through anaerobic digestion and
pyrolysis processes after D-limonene extraction. Waste Biomass Valoriz. 2018, 9, 1331–1337. [CrossRef]6. Mamma, D.; Christakopoulos, P. Biotransformation of citrus by-products into value added products. Waste
Biomass Valoriz. 2014, 5, 529–549. [CrossRef]7. Ruiz, B.; Flotats, X. Citrus essential oils and their influence on the anaerobic digestion process: An overview.
Waste Manag. 2014, 34, 2063–2079. [CrossRef] [PubMed]8. Lopez, J.A.S.; Li, Q.; Thompson, I.P. Biorefinery of waste orange peel. Crit. Rev. Biotechnol. 2010, 30, 63–69.
[CrossRef] [PubMed]9. Li, Q.; Siles, J.A.; Thompson, I.P. Succinic acid production from orange peel and wheat straw by batch
fermentations of Fibrobacter succinogenes S85. Appl. Microbiol. Biotechnol. 2010, 88, 671–678. [CrossRef]10. Martin, M.A.; Siles, J.A.; Chica, A.F.; Martin, A. Biomethanization of orange peel waste. Bioresour. Technol.
2010, 101, 8993–8999. [CrossRef]11. Siles, J.A.; Vargas, F.; Gutierrez, M.C.; Chica, A.F.; Martin, M.A. Integral valorisation of waste orange peel
using combustion, biomethanisation and co-composting technologies. Bioresour. Technol. 2016, 211, 173–182.[CrossRef]
12. Liao, J.C.; Mi, L.; Pontrelli, S.; Luo, S. Fuelling the future: Microbial engineering for the production ofsustainable biofuels. Nat. Rev. Microbiol. 2016, 14, 288–304. [CrossRef]
13. Jiang, Y.; Ding, D.; Zhao, S.; Zhu, H.; Kenttamma, H.I.; Abu-Omar, M.M. Renewable thermoset polymersbased on lignin and carbohydrate derived monomers. Green Chem. 2018, 20, 1131–1138. [CrossRef]
14. Mohanty, S.K.; Swain, M.R. Bioethanol production from corn and wheat: Food, fuel and future. In BioethanolProduction from Food Crops, 1st ed.; Ray, R.C., Ramachandran, C., Eds.; Elsevier Inc.: London, UK, 2019;pp. 45–49.
15. Oberoi, H.S.; Vadlani, P.V.; Nanjundaswamy, A.; Bansal, S.; Singh, S.; Kaur, S.; Babbar, N. Enhanced ethanolproduction from Kinnow mandarin (Citrus reticulata) waste via a statistically optimized simultaneoussaccharification and fermentation process. Bioresour. Technol. 2011, 102, 1593–1601. [CrossRef] [PubMed]
16. Wilkins, M.R.; Widmer, W.W.; Grohmann, K.; Cameron, R.G. Simultaneous saccharification and fermentationof citrus peel waste by Saccharomyces cerevisiae to produce ethanol. Process Biochem. 2007, 42, 1614–1619.[CrossRef]
17. Forgacs, G.; Pourbafrani, M.; Niklasson, C.; Taherzadeh, M.J.; Hovath, I.S. Methane production from citruswastes: Process development and cost estimation. J. Chem. Technol. Biotechnol. 2011, 87, 250–255. [CrossRef]
18. Sandhu, S.K.; Oberoi, H.S.; Dhaliwal, S.S.; Babbar, N.; Kaur, U.; Nanda, D.; Kumar, D. Ethanol productionfrom Kinnow mandarin (Citrus reticulata) peels via simultaneous saccharification and fermentation usingcrude enzyme produced by Aspergillus oryzae and the thermotolerant Pichia kudriavzevii strain. Ann. Microbiol.2012, 62, 655–666. [CrossRef]
19. Choi, I.S.; Kim, J.H.; Wi, S.G.; Kim, K.H.; Bae, H.J. Bioethanol production from mandarin (Citrus unshiu) peelwaste using popping treatment. Appl. Energy 2013, 102, 204–210. [CrossRef]
20. Gunaseelan, V.N. Biochemical methane potential of fruits and vegetable solid waste feedstocks. BiomassBioenergy 2004, 26, 389–399. [CrossRef]
21. Oberoi, H.S.; Vadlani, P.V.; Madl, R.L.; Saida, L.; Abeykoon, J.P. Ethanol production from orange peels:Two-stage hydrolysis and fermentation studies using optimized parameters through experimental design. J.Agric. Food Chem. 2010, 58, 3422–3429. [CrossRef] [PubMed]
22. Mohsenzadeh, A.; Zamani, A.; Taherzadeh, M.J. Bioethylene production from ethanol: A review andtechno-sconomical evaluation. ChemBioEng Rev. 2017, 2, 75–91. [CrossRef]
23. Lin, Y.; Tanaka, S. Ethanol fermentation from biomass resources: Current state and prospects. Appl. Microbiol.Biotechnol. 2006, 69, 627–642. [CrossRef] [PubMed]
24. Taghizadeh-Alisaraei, A.; Hosseini, S.H.; Ghobadian, B.; Motevali, A. Biofuel production from citrus wastes:A feasibility study in Iran. Renew. Sustain. Energy Rev. 2017, 69, 1100–1112. [CrossRef]
195
Molecules 2019, 24, 2451
25. Kyriakou, M.; Chatziiona, V.K.; Costa, C.N.; Kallis, M.; Koutsokeras, L.; Constantinides, G.; Koutinas, M.Biowaste-based biochar: A new strategy for fermentative bioethanol overproduction via whole-cellimmobilization. Appl. Energy 2019, 242, 480–491. [CrossRef]
26. Tavares, B.; de Almeida Felipe, M.G.; dos Santos, J.C.; Pereira, F.M.; Gomes, S.D.; Sene, L. An experimentaland modeling approach for ethanol production by Kluyveromyces marxianus in stirred tank bioreactor usingvacuum extraction as a strategy to overcome product inhibition. Renew. Energy 2019, 131, 261–267. [CrossRef]
27. Kaya, M.; Sousa, A.G.; Crepeau, M.J.; Sorensen, S.O.; Ralet, M.C. Characterization of citrus pectin samplesextracted under different conditions: Influence of acid type and pH of extraction. Ann. Bot. 2014, 114,1319–1326. [CrossRef] [PubMed]
28. Zhang, M.; Shukla, P.; Ayyachamy, M.; Permaul, K.; Singh, S. Improved bioethanol production throughsimultaneous saccharification and fermentation of lignocellulosic agricultural wastes by Kluyveromycesmarxianus 6556. World J. Microbiol. Biotechnol. 2010, 26, 1041–1046. [CrossRef]
29. Almeida, J.R.M.; Modig, T.; Petersson, A.; Hahn-Hagerdal, B.; Liden, G.; Gorwa-Grauslund, M.F. Increasedtolerance and conversion of inhibitors in lignocellulosic hydrolysates by Saccharomyces cerevisiae. J. Chem.Technol. Biotechnol. 2007, 82, 340–349. [CrossRef]
30. Patsalou, M.; Menikea, K.K.; Makri, E.; Vasquez, M.I.; Drouza, C.; Koutinas, M. Development of a citruspeel-based biorefinery strategy for the production of succinic acid. J. Clean. Prod. 2017, 166, 706–716.[CrossRef]
31. Talebnia, F.; Pourbafrani, M.; Lundin, M.; Taherzadeh, M.J. Optimization study of citrus wastes saccharificationby dilute-acid hydrolysis. Bioresources 2008, 3, 108–122.
32. Pourbafrani, M.; Forgacs, G.; Horvath, I.S.; Niklasson, C.; Taherzadeh, M.J. Production of biofuels, limoneneand pectin from citrus wastes. Bioresour. Technol. 2010, 101, 4246–4250. [CrossRef]
33. Boluda-Aguilar, M.; Garcia-Vidal, L.; Gonzalez-Castaneda, F.D.P.; Lopez-Gomez, A. Mandarin peel wastespretreatment with steam explosion for bioethanol production. Bioresour. Technol. 2010, 101, 3506–3513.[CrossRef]
34. Lennartsson, P.R.; Ylitervo, P.; Larsson, C.; Edebo, L.; Taherzadeh, M.J. Growth tolerance of Zygomycetes Mucorindicus in orange peel hydrolysate without detoxification. Process Biochem. 2012, 47, 836–842. [CrossRef]
35. Harun, R.; Danquah, M.K.; Forde, G.M. Microalgal biomass as a fermentation feedstock for bioethanolproduction. J. Chem. Technol. Biotechnol. 2010, 85, 199–203. [CrossRef]
36. Torija, M.J.; Beltran, G.; Novo, M.; Poblet, M.; Rozes, N.; Guillamon, J.M. Effect of the nitrogen source on thefatty acid composition of Saccharomyces cerevisiae. Food Microbiol. 2003, 20, 255–258. [CrossRef]
37. Seong, Y.J.; Lee, H.J.; Lee, J.E.; Kim, S.; Lee, D.Y.; Kim, K.H.; Park, Y.C. Physiological and metabolomic analysisof Issatchenkia orientalis MTY1 with multiple tolerance for cellulosic bioethanol production. Biotechnol. J.2017, 12, 1–11. [CrossRef] [PubMed]
38. Koppar, A.; Pullammanappallil, P. Anaerobic digestion of peel waste and wastewater for on site energygeneration in a citrus processing facility. Energy 2013, 60, 62–68. [CrossRef]
39. Sanjaya, A.P.; Cahyanto, M.N.; Millati, R. Mesophilic batch anaerobic digestion from fruit fragments. Renew.Energy 2016, 98, 135–141. [CrossRef]
40. Calabro, P.S.; Pontoni, L.; Porqueddu, I.; Greco, R.; Pirozzi, F.; Malpei, F. Effect of the concentration ofessential oil on orange peel waste biomethanization: Preliminary batch results. Waste Manag. 2016, 48,440–447. [CrossRef] [PubMed]
41. Lotito, A.M.; Sanctis, M.D.; Pastore, C.; Iaconi, C.D. Biomethanization of citrus waste: Effect of wastecharacteristics and of storage on treatability and evaluation of limonene degradation. J. Environ. Manag.2018, 215, 366–376. [CrossRef]
42. Wilkins, M.R.; Widmer, W.W.; Grohmann, K.; Cameron, R.G. Hydrolysis of grapefruit peel waste withcellulase and pectinase enzymes. Bioresour. Technol. 2007, 98, 1596–1601. [CrossRef]
43. Faravash, R.S.; Ashtiani, F.Z. The effect of pH, ethanol volume and acid washing time on the yield of pectinextraction from peach pomace. Int. J. Food Sci. Technol. 2007, 42, 1177–1187. [CrossRef]
44. Wilkins, M.R.; Widmer, W.W.; Cameron, R.G.; Grohmann, K. Effect of seasonal variation on enzymatichydrolysis of valencia orange peel waste. Proc. Fla. State Hortic. Soc. 2005, 118, 419–422.
45. Koutinas, M.; Patsalou, M.; Stavrinou, S.; Vyrides, I. High temperature alcoholic fermentation of orange peelby the newly isolated thermotolerant Pichia kudriavzevii KVMP10. Lett. Appl. Microbiol. 2015, 62, 75–83.[CrossRef] [PubMed]
196

Molecules 2019, 24, 2451
46. Angelidaki, I.; Alves, M.; Bolzonella, D.; Borzacconi, L.; Campos, J.L.; Guwy, A.J.; Kalyuzhnyi, S.; Jenicek, P.;Van Lier, J.B. Defining the biomethane potential (BMP) of solid organic wastes and energy crops: A proposedprotocol for batch assays. Water Sci. Technol. 2009, 59, 927–934. [CrossRef] [PubMed]
47. Dubois, M.; Gilles, K.A.; Hamilton, J.K. Colorimetric method for determination of sugars and relatedsubstances. Anal. Chem. 1956, 28, 350–356. [CrossRef]
48. Rice, E.W.; Baird, R.B.; Eaton, A.D.; Clesceri, L.S. Standard Methods for the Examination of Water and Wastewater,22nd ed.; American Public Health Association, Ameican Water Works Association, Water EnvironmentFederation: Denver, CO, USA, 2012; p. 541.
49. Vardanyan, A.; Kafa, N.; Konstantinidis, V.; Shin, S.G.; Vyrides, I. Phosphorus dissolution from dewateredanaerobic sludge: Effect of pHs, microorganisms, and sequential extraction. Bioresour. Technol. 2018, 249,464–472. [CrossRef] [PubMed]
Sample Availability: Samples of the compounds are available from the authors.
© 2019 by the authors. Licensee MDPI, Basel, Switzerland. This article is an open accessarticle distributed under the terms and conditions of the Creative Commons Attribution(CC BY) license (http://creativecommons.org/licenses/by/4.0/).
197

molecules
Article
Enhanced Enzymatic Hydrolysis of Pennisetumalopecuroides by Dilute Acid, Alkaline and FerricChloride Pretreatments
Shangyuan Tang 1,†, Chunming Xu 2,†, Linh Tran Khanh Vu 3 , Sicheng Liu 1, Peng Ye 1,Lingci Li 1, Yuxuan Wu 1, Mengyu Chen 1, Yao Xiao 1, Yue Wu 1, Yining Wang 1, Qiong Yan 1,*and Xiyu Cheng 1,*
1 College of Life Sciences and Bioengineering, School of Science, Beijing Jiaotong University, Beijing 100044,China; [email protected] (S.T.); [email protected] (S.L.); [email protected] (P.Y.);[email protected] (L.L.); [email protected] (Y.W.); [email protected] (M.C.);[email protected] (Y.X.); [email protected] (Y.W.); [email protected] (Y.W.)
2 Key Laboratory of Cleaner Production and Integrated Resource Utilization of China National Light Industry,Beijing Technology and Business University, Beijing 100048, China; [email protected]
3 Faculty of Chemical and Food Technology, Ho Chi Minh City University of Technology and Education,No. 1 Vo Van Ngan Street, Linh Chieu Ward, Thu Duc District, Ho Chi Minh City 71307, Viet Nam;[email protected]
* Correspondence: [email protected] (Q.Y.); [email protected] (X.C.); Tel.: +86-10-51684351-209 (X.C.)† These authors contributed equally.
Academic Editor: Ivet FerrerReceived: 8 April 2019; Accepted: 30 April 2019; Published: 2 May 2019
Abstract: In this study, effects of different pretreatment methods on the enzymatic digestibility ofPennisetum alopecuroides, a ubiquitous wild grass in China, were investigated to evaluate its potential asa feedstock for biofuel production. The stalk samples were separately pretreated with H2SO4, NaOHand FeCl3 solutions of different concentrations at 120 C for 30 min, after which enzymatic hydrolysiswas conducted to measure the digestibility of pretreated samples. Results demonstrated that differentpretreatments were effective at removing hemicellulose, among which ferric chloride pretreatment(FCP) gave the highest soluble sugar recovery (200.2 mg/g raw stalk) from the pretreatment stage.In comparison with FCP and dilute acid pretreatment (DAP), dilute alkaline pretreatment (DALP)induced much higher delignification and stronger morphological changes of the biomass, making itmore accessible to hydrolysis enzymes. As a result, DALP using 1.2% NaOH showed the highest totalsoluble sugar yield through the whole process from pretreatment to enzymatic hydrolysis (508.5 mg/graw stalk). The present work indicates that DALP and FCP have the potential to enhance the effectivebioconversion of lignocellulosic biomass like P. alopecuroides, hence making this material a valuableand promising energy plant.
Keywords: Pennisetum alopecuroides; dilute alkaline pretreatment; ferric chloride pretreatment;enzymatic hydrolysis
1. Introduction
With the growth of vehicles and an over-reliance on fossil fuels in industrial development, biofuelproduction from non-food crop feedstocks (e.g. agricultural residues, forest residues and industrialwastes) has drawn considerable attention [1–8]. In China, anaerobic digestion of organic wastes hasbeen successfully used for biogas production both domestically, as well as at a larger scale [2–6].Different biomass substrates, such as cornstalk, rice straw, wheat straw and pine foliage, have also beeninvestigated for the production of bioethanol [9–12]. In addition to these lignocellulosic biomass wastes,
199
Molecules 2019, 24, 1715
Pennisetum alopecuroides is a potential prolific renewable herbaceous plant that is widely distributedin many provinces of China. Some Pennisetum species are cultivated as an important feedstock forthe animal feed industry in north China, northeast China, southwest China and the middle-lowerYangtze Plain [8]. The annual dry matter yield of Pennisetum grass ranges from 40 to 50.2 t/ha, which ismuch higher than the yields of sugarcane and corn (13~21 t/ha) and comparable to that of miscanthus(27~38 t/ha) [9,10]. While Miscanthus species and some other energy plant candidates (e.g., switchgrass)have attracted widespread interest in the bio-energy field, studies on P. alopecuroides have been relativelylimited. Given its rapid growth, high yield, high adaptability, low cost and environmentally benignproduction, P, alopecuroides was selected as a substrate in the current study to evaluate its applicationprospects in biofuel production.
The recalcitrant structure of lignocellulosic biomass is the main constraint of its bioconversion [13–18].Varied pretreatment strategies such as chemical methods (e.g., acid, bases, salts and solvents),physico-chemical processes (e.g., steam explosion, liquid hot water (LHW) and ammonia fiber expansion(AFEX) and biological methods have been developed in attempts to remove hemicellulose and/orlignin from lignocellulosic wastes and reduce the crystallinity of cellulose [13,19–24]. It is widelyaccepted that efficient pretreatment should avoid the use of expensive chemicals, improve fiber reactivityand maximize the recovery/formation of fermentable sugars, avoid formation of enzyme inhibitorybyproducts, preserve cellulose and hemicellulose fractions that are easily accessible to hydrolysisenzymes and minimize energy requirements [11–14]. However, no single strategy could efficientlymeet all these criteria due to the variations in material characteristics. The chemical pretreatment oflignocellulosic materials has been widely employed in many pilot and large-scale cellulosic ethanolplants because it is ideal for low-lignin materials and has high reactivity at mild conditions [12–14].A chemical method is hence a suitable pretreatment strategy for P. alopecuroides, a low-lignin material.
Among several chemical methods, dilute acid pretreatment is most commonly used, due toits advantages in cost and process severity [13,14]. One major limitation of acid pretreatment is itsrequirement of corrosion-resistant reactors [13]. On the other hand, corrosion problems and sugardegradation are less severe in alkaline processes than in acid pretreatment. Alkaline pretreatment isalso effective in delignifying the biomass [7,20,22,24]. A mild alkali concentration (<4% w/w) favorsenzymatic hydrolysis especially for low-lignin materials [13,14]. Previous studies also showed thatpretreatment of lignocellulosic biomass using Lewis acids such as FeCl3 enhances digestibility ofbiomass, producing reusable solubilized hemicellulose [25–27]. Operating at milder temperatureconditions (120 C vs 160~260 C in steam explosion and LHW pretreatments) in the current studymeans that dilute acid pretreatment (DAP), dilute alkaline pretreatment (DALP) and ferric chloridepretreatment (FCP) reduce energy consumption and the formation of enzyme inhibitory byproducts [11].Up to date, DAP, DALP and FCP have been used on a wide range of low-lignin biomasses ranging fromwood (cedar, pine, hemlock) to agricultural residues (corn stover, wheat and barley straw, switchgrass,Miscanthus) [18–24]. To our best knowledge, the effects of these methods on the biodigestibility ofP. alopecuroides has not been systematically studied to identify the ideal pretreatment process or toevaluate the potential of P. alopecuroides biomass in the bioconversion industry. Moreover, someprevious studies have also shown that effective removal of lignin and/or hemicellulose in acid/alkalinepretreatments did not result in a significant increase in reducing sugar yields (only 91.4−92 mg/g) [19,21].These results indicate that the exact roles of different pretreatments in the improvement of hydrolysisefficiency were complicated, thereby necessitating further research to better understand the mechanism.
In the present study, three chemical pretreatments including DAP, DALP and FCP weresystematically investigated to develop an efficient pretreatment strategy for enhancing enzymatichydrolysis of P. alopecuroides biomass. The composition and microstructure of substrates in responseto these pretreatments were investigated to better understand the exact roles of each pretreatment inchanging biomass recalcitrance and subsequent enzymatic hydrolysis enhancement. The fermentablesugar production from the pretreated P. alopecuroides biomass was also studied to evaluate its applicationprospects for biofuel production.
200
Molecules 2019, 24, 1715
2. Results and Discussion
2.1. Effect of Different Pretreatments on Biomass Composition
The pretreatment process decreases the recalcitrance of lignocellulosic substrates by removinglignin and hemicellulose components, thereby exposing cellulose to the hydrolysis enzyme [28,29].The P. alopecuroides samples were subjected to different pretreatments, including DAP, DALP andFCP. The solid yield and compositional change of the stalk samples are important indices to evaluatethe effectiveness of their pretreatments. As shown in Table 1, the dry matter retained after differentpretreatments was about 53.3−58.2%. A P. alopecuroides sample pretreated by DALP had a higher solidyield as compared with those pretreated with DAP and FCP. The weight loss of P. alopecuroides biomasscould be attributed to the solubilization of its components into the aqueous solution. The higher solidyield (or lower weight loss) indicate that less lignocellulosic components were converted into solublesubstances. In comparison to DALP, DAP and FCP thereby gave higher soluble sugar concentrations(86.7 mg/g raw stalk (RS) vs 112.2 mg/g RS and 193.4 mg/g RS, respectively).
Table 1. Effect of DAP/DALP/FCP of Pennisetum alopecuroides biomass on its chemical composition.
DifferentPretreatment
SolidYield (%)
HemicelluloseContent (%)
CelluloseContent (%)
LigninContent (%)
Soluble Sugarfrom Pretreatment
(mg/g RS) 1
Control – 28.7 ± 0.4 41.8 ± 0.9 17.5 ± 0.6 20.0 ± 0.4DAP, 3% H2SO4 53.3 ± 1.7 15.0 ± 1.7 55.9 ± 2.3 17.1 ± 1.5 112.2 ± 2.0
DALP, 1.0%NaOH 58.2 ± 1.2 15.3 ± 0.1 64.1 ± 1.7 11.7 ± 0.6 86.7 ± 0.2FCP, 3.2% FeCl3 55.9 ± 1.8 11.9 ± 1.3 60.8 ± 1.3 16.4 ± 0.7 193.4 ± 8.7
1The soluble sugar yield in the pretreatment process was calculated based on per g raw stalk (RS). Values are means oftriplicate ± standard deviation.
Compositional analysis showed that the weight loss of the stalk samples was mainly due tohemicellulose hydrolysis by both DAP and FCP (Table 1). A previous study also reported that solublesugars predominantly originated from the hemicellulose fraction of lignocellulosic substrates [23].The dilute acid pretreatment and FeCl3 pretreatment can markedly solubilize hemicellulose intomonomeric sugars and soluble oligomers [23,27]. Results in Table 1 indicate that DALP significantlyremoved both lignin and hemicellulose, while DAP and FCP preferentially removed hemicellulose.Samples pretreated by DALP had the lowest lignin content of 11.7%. A similar delignification effectwas also observed in alkaline pretreatment and microwave-assisted alkaline pretreatment processesfor different stalk wastes [6,15,30,31].
2.2. Effect of Different Pretreatments on Cell Structure
Cell structure changes of the stalk samples pretreated by DAP, DALP and FCP were also studiedby a scanning electron microscopy (SEM) at the same magnification (× 500) (Figure 1).
As shown in Figure 1a, the untreated P. alopecuroides sample had a smooth and intact surface withan unchanged fibrous structure organization. On the other hand, the cell walls of the DAP sample wereobviously destroyed. It can be seen in Figure 1b that the rectangular cell wall boundaries became blurryto some extent, indicating that a portion of cellulosic components could have been removed by DAP.The cell surfaces of the FCP sample were also not smooth, and partly broken (Figure 1d). This clearlyverifies that the removal of lignocellulosic components such as hemicellulose by FCP resulted inmorphological surface modification. Stronger morphological changes were observed from the DALPsample. As can be seen in Figure 1c, the surfaces and cell walls of the DALP sample were significantlydestroyed and distorted. Enhanced destruction of plant cell wall was also found in previous studieswith microwave-assisted acid/alkaline pretreatments of lignocellulosic wastes [22,23,32]. The presentstudy suggests that the strong delignification effect and partial removal of hemicellulose by DALPremarkably enhances the destruction effect to cell wall structure (Table 1 and Figure 1). The formation
201
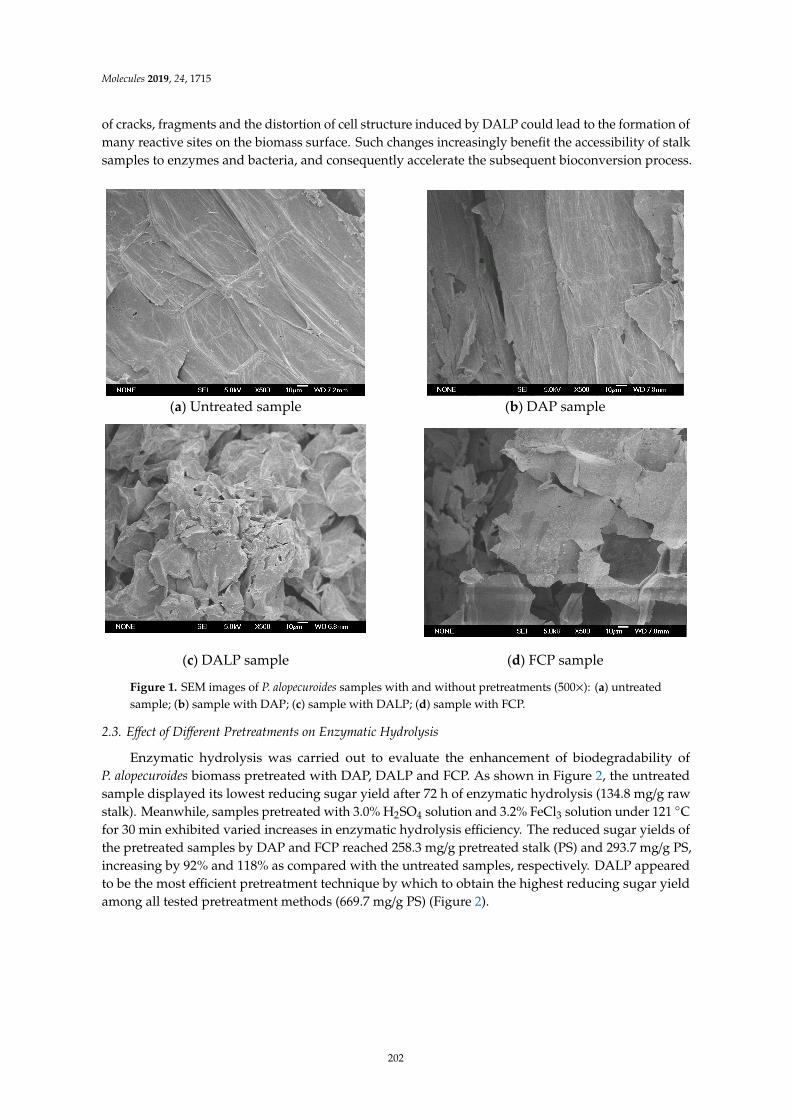
Molecules 2019, 24, 1715
of cracks, fragments and the distortion of cell structure induced by DALP could lead to the formation ofmany reactive sites on the biomass surface. Such changes increasingly benefit the accessibility of stalksamples to enzymes and bacteria, and consequently accelerate the subsequent bioconversion process.Molecules 2019, 24, x 4 of 15
(a) Untreated sample (b) DAP sample
(c) DALP sample (d) FCP sample
Figure 1. SEM images of P. alopecuroides samples with and without pretreatments (500×): (a) untreated sample; (b) sample with DAP; (c) sample with DALP; (d) sample with FCP.
As shown in Figure 1a, the untreated P. alopecuroides sample had a smooth and intact surface with an unchanged fibrous structure organization. On the other hand, the cell walls of the DAP sample were obviously destroyed. It can be seen in Figure 1b that the rectangular cell wall boundaries became blurry to some extent, indicating that a portion of cellulosic components could have been removed by DAP. The cell surfaces of the FCP sample were also not smooth, and partly broken (Figure 1d). This clearly verifies that the removal of lignocellulosic components such as hemicellulose by FCP resulted in morphological surface modification. Stronger morphological changes were observed from the DALP sample. As can be seen in Figure 1c, the surfaces and cell walls of the DALP sample were significantly destroyed and distorted. Enhanced destruction of plant cell wall was also found in previous studies with microwave-assisted acid/alkaline pretreatments of lignocellulosic wastes [22,23,32]. The present study suggests that the strong delignification effect and partial removal of hemicellulose by DALP remarkably enhances the destruction effect to cell wall structure (Table 1 and Figure 1). The formation of cracks, fragments and the distortion of cell structure induced by DALP could lead to the formation of many reactive sites on the biomass surface. Such changes increasingly benefit the accessibility of stalk samples to enzymes and bacteria, and consequently accelerate the subsequent bioconversion process.
2.3. Effect of Different Pretreatments on Enzymatic Hydrolysis
Enzymatic hydrolysis was carried out to evaluate the enhancement of biodegradability of P. alopecuroides biomass pretreated with DAP, DALP and FCP. As shown in Figure 2, the untreated sample displayed its lowest reducing sugar yield after 72 h of enzymatic hydrolysis (134.8 mg/g raw stalk). Meanwhile, samples pretreated with 3.0% H2SO4 solution and 3.2% FeCl3 solution under 121 °C for 30 min exhibited varied increases in enzymatic hydrolysis efficiency. The reduced sugar yields of the pretreated samples by DAP and FCP reached 258.3 mg/g pretreated stalk (PS) and 293.7
Figure 1. SEM images of P. alopecuroides samples with and without pretreatments (500×): (a) untreatedsample; (b) sample with DAP; (c) sample with DALP; (d) sample with FCP.
2.3. Effect of Different Pretreatments on Enzymatic Hydrolysis
Enzymatic hydrolysis was carried out to evaluate the enhancement of biodegradability ofP. alopecuroides biomass pretreated with DAP, DALP and FCP. As shown in Figure 2, the untreatedsample displayed its lowest reducing sugar yield after 72 h of enzymatic hydrolysis (134.8 mg/g rawstalk). Meanwhile, samples pretreated with 3.0% H2SO4 solution and 3.2% FeCl3 solution under 121 Cfor 30 min exhibited varied increases in enzymatic hydrolysis efficiency. The reduced sugar yields ofthe pretreated samples by DAP and FCP reached 258.3 mg/g pretreated stalk (PS) and 293.7 mg/g PS,increasing by 92% and 118% as compared with the untreated samples, respectively. DALP appearedto be the most efficient pretreatment technique by which to obtain the highest reducing sugar yieldamong all tested pretreatment methods (669.7 mg/g PS) (Figure 2).
202
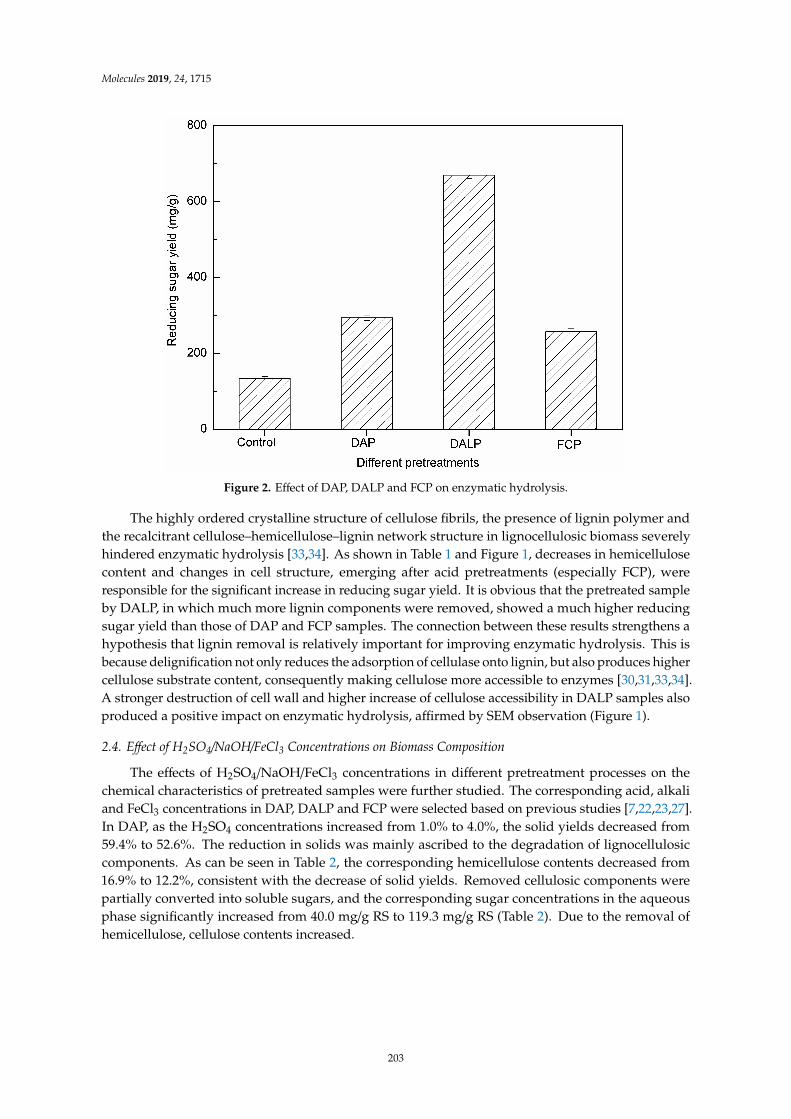
Molecules 2019, 24, 1715
Molecules 2019, 24, x 5 of 15
mg/g PS, increasing by 92% and 118% as compared with the untreated samples, respectively. DALP appeared to be the most efficient pretreatment technique by which to obtain the highest reducing sugar yield among all tested pretreatment methods (669.7 mg/g PS) (Figure 2).
Figure 2. Effect of DAP, DALP and FCP on enzymatic hydrolysis.
The highly ordered crystalline structure of cellulose fibrils, the presence of lignin polymer and the recalcitrant cellulose–hemicellulose–lignin network structure in lignocellulosic biomass severely hindered enzymatic hydrolysis [33,34]. As shown in Table 1 and Figure 1, decreases in hemicellulose content and changes in cell structure, emerging after acid pretreatments (especially FCP), were responsible for the significant increase in reducing sugar yield. It is obvious that the pretreated sample by DALP, in which much more lignin components were removed, showed a much higher reducing sugar yield than those of DAP and FCP samples. The connection between these results strengthens a hypothesis that lignin removal is relatively important for improving enzymatic hydrolysis. This is because delignification not only reduces the adsorption of cellulase onto lignin, but also produces higher cellulose substrate content, consequently making cellulose more accessible to enzymes [30,31,33,34]. A stronger destruction of cell wall and higher increase of cellulose accessibility in DALP samples also produced a positive impact on enzymatic hydrolysis, affirmed by SEM observation (Figure 1).
2.4. Effect of H2SO4/NaOH/FeCl3 Concentrations on Biomass Composition
The effects of H2SO4/NaOH/FeCl3 concentrations in different pretreatment processes on the chemical characteristics of pretreated samples were further studied. The corresponding acid, alkali and FeCl3 concentrations in DAP, DALP and FCP were selected based on previous studies [7,22,23,27]. In DAP, as the H2SO4 concentrations increased from 1.0% to 4.0%, the solid yields decreased from 59.4% to 52.6%. The reduction in solids was mainly ascribed to the degradation of lignocellulosic components. As can be seen in Table 2, the corresponding hemicellulose contents decreased from 16.9% to 12.2%, consistent with the decrease of solid yields. Removed cellulosic components were partially converted into soluble sugars, and the corresponding sugar concentrations in the aqueous phase significantly increased from 40.0 mg/g RS to 119.3 mg/g RS (Table 2). Due to the removal of hemicellulose, cellulose contents increased.
Figure 2. Effect of DAP, DALP and FCP on enzymatic hydrolysis.
The highly ordered crystalline structure of cellulose fibrils, the presence of lignin polymer andthe recalcitrant cellulose–hemicellulose–lignin network structure in lignocellulosic biomass severelyhindered enzymatic hydrolysis [33,34]. As shown in Table 1 and Figure 1, decreases in hemicellulosecontent and changes in cell structure, emerging after acid pretreatments (especially FCP), wereresponsible for the significant increase in reducing sugar yield. It is obvious that the pretreated sampleby DALP, in which much more lignin components were removed, showed a much higher reducingsugar yield than those of DAP and FCP samples. The connection between these results strengthens ahypothesis that lignin removal is relatively important for improving enzymatic hydrolysis. This isbecause delignification not only reduces the adsorption of cellulase onto lignin, but also produces highercellulose substrate content, consequently making cellulose more accessible to enzymes [30,31,33,34].A stronger destruction of cell wall and higher increase of cellulose accessibility in DALP samples alsoproduced a positive impact on enzymatic hydrolysis, affirmed by SEM observation (Figure 1).
2.4. Effect of H2SO4/NaOH/FeCl3 Concentrations on Biomass Composition
The effects of H2SO4/NaOH/FeCl3 concentrations in different pretreatment processes on thechemical characteristics of pretreated samples were further studied. The corresponding acid, alkaliand FeCl3 concentrations in DAP, DALP and FCP were selected based on previous studies [7,22,23,27].In DAP, as the H2SO4 concentrations increased from 1.0% to 4.0%, the solid yields decreased from59.4% to 52.6%. The reduction in solids was mainly ascribed to the degradation of lignocellulosiccomponents. As can be seen in Table 2, the corresponding hemicellulose contents decreased from16.9% to 12.2%, consistent with the decrease of solid yields. Removed cellulosic components werepartially converted into soluble sugars, and the corresponding sugar concentrations in the aqueousphase significantly increased from 40.0 mg/g RS to 119.3 mg/g RS (Table 2). Due to the removal ofhemicellulose, cellulose contents increased.
203

Molecules 2019, 24, 1715
Table 2. The effects of H2SO4/NaOH/FeCl3 concentrations during pretreatments of P. alopecuroides onits chemical composition.
DifferentPretreatment
H2SO4/NaOH/FeCl3Concentrations (%)
Solid Yield(%)
HemicelluloseContent (%)
CelluloseContent (%)
LigninContent (%)
Soluble Sugarfrom Pretreatment
(mg/g RS) 1
Control – – 28.7 ± 0.4 41.8 ± 0.9 17.5 ± 0.6 20.0 ± 0.4
DAP with H2SO4 1% 59.4 ± 1.0 16.9 ± 1.6 51.8 ± 1.9 15.7 ± 1.1 40.0 ± 1.32% 55.0 ± 0.9 15.5 ± 1.3 55.0 ± 0.5 16.8 ± 1.2 69.5 ± 1.23% 53.3 ± 1.7 15.0 ± 1.7 55.9 ± 2.3 17.1 ± 1.5 112.2 ± 2.04% 52.6 ± 2.1 12.2 ± 0.2 56.5 ± 1.6 17.3 ± 1.4 119.3 ± 0.7
DALP with NaOH 0.4% 74.6 ± 2.5 22.0 ± 0.9 53.3 ± 0.3 14.5 ± 0.4 50.5 ± 0.20.6% 64.7 ± 1.7 17.4 ± 0.9 59.0 ± 1.4 14.0 ± 0.1 63.4 ± 2.00.8% 59.4 ± 2.1 16.0 ± 0.2 63.2 ± 0.6 12.6 ± 0.1 83.5 ± 0.71.0% 58.2 ± 1.2 15.3 ± 0.1 64.1 ± 1.7 11.7 ± 0.6 86.7 ± 0.21.2% 53.9 ± 1.7 14.8 ± 0.3 68.0 ± 0.7 10.2 ± 0.8 107.3 ± 0.6
FCP with FeCl3 0.8% 68.8 ± 3.1 15.2 ± 1.7 56.9 ± 1.6 18.0 ± 1.6 90.2 ± 2.21.6% 60.8 ± 1.7 13.5 ± 1.5 60.7 ± 1.1 17.3 ± 0.1 163.6 ± 3.23.2% 55.9 ± 1.8 11.9 ± 1.3 60.8 ± 1.3 16.4 ± 0.7 193.4 ± 8.74.8% 53.1 ± 2.3 9.7 ± 1.7 62.7 ± 1.5 15.3 ± 1.5 200.2 ± 6.7
1 The soluble sugar yield in the pretreatment process was calculated based on per g raw stalk (RS). Values are means oftriplicate ± standard deviation. RS: raw stalk.
In the case of FCP, severe pretreatment conditions (3.2% and 4.8% FeCl3) also effectively removedcellulosic components, resulting in lower solid yields of 53.1~55.9% as compared with those of lessseverity conditions (0.8~1.6% FeCl3) (Table 2). The significant decrease in hemicellulose content and theslight increase in cellulose content suggest that hemicellulose was more easily degraded than celluloseduring FCP pretreatment [7,18]. The corresponding soluble sugar content in the aqueous phase alsoincreased from 90.2 mg/g RS to 200.2 mg/g RS (Table 2). Due to the acidic condition provided by H2SO4
and FeCl3 during DAP and FCP, the generated soluble sugars could be dehydrated to furfural and5-hydroxymethylfurfural (5-HMF) [23,27]. Although the solid yields obtained by DAP and FCP weresimilar, the soluble sugar concentrations in FCP samples were much higher than those observed inDAP samples (193.4~200.2 mg/g RS vs 112.2~119.3 mg/g RS), indicating that more generated solublesugars may have been further converted into other byproducts by H2SO4 [23,27].
The mass loss observed after acid pretreatments can be mainly attributed to the removal ofhemicellulose components [23,27]. Acid pretreatments such as DAP and FCP randomly breakglycosidic bonds, removing hemicellulose while improving the cellulose content of lignocellulosicbiomass and consequently increasing the accessibility of cellulose to hydrolytic enzymes [28,29].On the other hand, alkaline pretreatments produce nucleophilic attacks that break the lignin structure,solubilizing lignin fragments or hemicellulose from α-O-4 linkages [35–37]. Results in Table 2 showthat relatively higher solid yields of 53.9~74.6% were observed in DALP samples. As the NaOHconcentrations increased from 0.4% to 1.2%, the hemicellulose contents decreased from 22.0% to 14.8%,and cellulose contents significantly increased from 53.3% to 68.0%. The corresponding soluble sugarconcentrations also increased from 41.8 mg/g RS to 107.3 mg/g RS (Table 2). It should be noted thatDALP, with 1.0~1.2% NaOH, more significantly reduced the lignin contents of biomass to 10.2~11.7%as compared with those achieved by DAP and FCP (Table 2).
2.5. Effect of H2SO4/NaOH/FeCl3 Concentrations on Enzymatic Hydrolysis
The effects of different H2SO4/NaOH/FeCl3 concentrations on the enzymatic hydrolysis ofP. alopecuroides biomass were also investigated. As shown in Figure 3, samples pretreated with DAP,DALP and FCP had much higher reducing sugar yields after enzyme hydrolysis, 1.4~5.5 times higherthan that of the untreated sample (134.8 mg/g). In particular, the sample pretreated with 1.0% H2SO4
solution under 121 C for 30 min exhibited an obvious increase in enzymatic hydrolysis efficiency, andthe corresponding reducing sugar yield reached 258.1 mg/g PS. Increased acid concentrations showed abeneficial effect on cellulosic component removal and subsequent enzymatic hydrolysis. The reducing
204
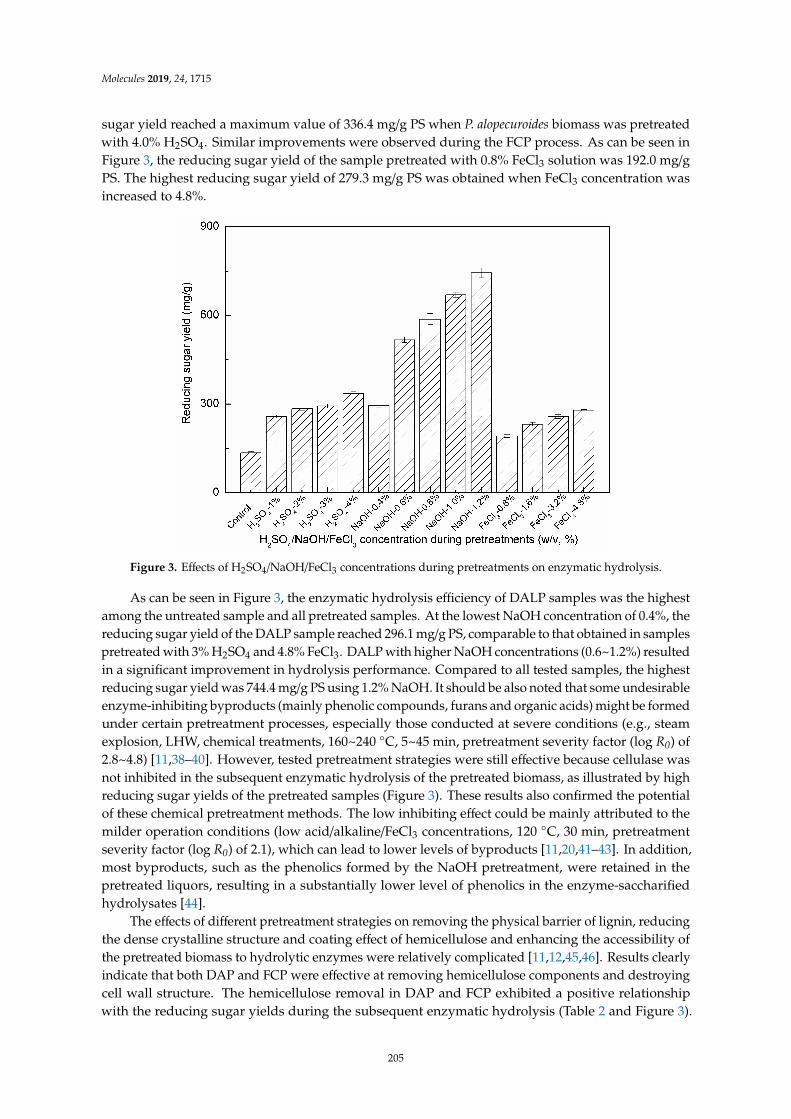
Molecules 2019, 24, 1715
sugar yield reached a maximum value of 336.4 mg/g PS when P. alopecuroides biomass was pretreatedwith 4.0% H2SO4. Similar improvements were observed during the FCP process. As can be seen inFigure 3, the reducing sugar yield of the sample pretreated with 0.8% FeCl3 solution was 192.0 mg/gPS. The highest reducing sugar yield of 279.3 mg/g PS was obtained when FeCl3 concentration wasincreased to 4.8%.
Molecules 2019, 24, x 7 of 15
DALP and FCP had much higher reducing sugar yields after enzyme hydrolysis, 1.4~5.5 times higher than that of the untreated sample (134.8 mg/g). In particular, the sample pretreated with 1.0% H2SO4 solution under 121 °C for 30 min exhibited an obvious increase in enzymatic hydrolysis efficiency, and the corresponding reducing sugar yield reached 258.1 mg/g PS. Increased acid concentrations showed a beneficial effect on cellulosic component removal and subsequent enzymatic hydrolysis. The reducing sugar yield reached a maximum value of 336.4 mg/g PS when P. alopecuroides biomass was pretreated with 4.0% H2SO4. Similar improvements were observed during the FCP process. As can be seen in Figure 3, the reducing sugar yield of the sample pretreated with 0.8% FeCl3 solution was 192.0 mg/g PS. The highest reducing sugar yield of 279.3 mg/g PS was obtained when FeCl3 concentration was increased to 4.8%.
Figure 3. Effects of H2SO4/NaOH/FeCl3 concentrations during pretreatments on enzymatic hydrolysis.
As can be seen in Figure 3, the enzymatic hydrolysis efficiency of DALP samples was the highest among the untreated sample and all pretreated samples. At the lowest NaOH concentration of 0.4%, the reducing sugar yield of the DALP sample reached 296.1 mg/g PS, comparable to that obtained in samples pretreated with 3% H2SO4 and 4.8% FeCl3. DALP with higher NaOH concentrations (0.6%~1.2%) resulted in a significant improvement in hydrolysis performance. Compared to all tested samples, the highest reducing sugar yield was 744.4 mg/g PS using 1.2% NaOH. It should be also noted that some undesirable enzyme-inhibiting byproducts (mainly phenolic compounds, furans and organic acids) might be formed under certain pretreatment processes, especially those conducted at severe conditions (e.g., steam explosion, LHW, chemical treatments, 160~240 °C, 5~45 min, pretreatment severity factor (log R0) of 2.8~4.8) [11,38–40]. However, tested pretreatment strategies were still effective because cellulase was not inhibited in the subsequent enzymatic hydrolysis of the pretreated biomass, as illustrated by high reducing sugar yields of the pretreated samples (Figure 3). These results also confirmed the potential of these chemical pretreatment methods. The low inhibiting effect could be mainly attributed to the milder operation conditions (low acid/alkaline/FeCl3 concentrations, 120 °C, 30 min, pretreatment severity factor (log R0) of 2.1), which can lead to lower levels of byproducts [11,20,41–43]. In addition, most byproducts, such as the phenolics formed by the NaOH pretreatment, were retained in the pretreated liquors, resulting in a substantially lower level of phenolics in the enzyme-saccharified hydrolysates [44].
Figure 3. Effects of H2SO4/NaOH/FeCl3 concentrations during pretreatments on enzymatic hydrolysis.
As can be seen in Figure 3, the enzymatic hydrolysis efficiency of DALP samples was the highestamong the untreated sample and all pretreated samples. At the lowest NaOH concentration of 0.4%, thereducing sugar yield of the DALP sample reached 296.1 mg/g PS, comparable to that obtained in samplespretreated with 3% H2SO4 and 4.8% FeCl3. DALP with higher NaOH concentrations (0.6~1.2%) resultedin a significant improvement in hydrolysis performance. Compared to all tested samples, the highestreducing sugar yield was 744.4 mg/g PS using 1.2% NaOH. It should be also noted that some undesirableenzyme-inhibiting byproducts (mainly phenolic compounds, furans and organic acids) might be formedunder certain pretreatment processes, especially those conducted at severe conditions (e.g., steamexplosion, LHW, chemical treatments, 160~240 C, 5~45 min, pretreatment severity factor (log R0) of2.8~4.8) [11,38–40]. However, tested pretreatment strategies were still effective because cellulase wasnot inhibited in the subsequent enzymatic hydrolysis of the pretreated biomass, as illustrated by highreducing sugar yields of the pretreated samples (Figure 3). These results also confirmed the potentialof these chemical pretreatment methods. The low inhibiting effect could be mainly attributed to themilder operation conditions (low acid/alkaline/FeCl3 concentrations, 120 C, 30 min, pretreatmentseverity factor (log R0) of 2.1), which can lead to lower levels of byproducts [11,20,41–43]. In addition,most byproducts, such as the phenolics formed by the NaOH pretreatment, were retained in thepretreated liquors, resulting in a substantially lower level of phenolics in the enzyme-saccharifiedhydrolysates [44].
The effects of different pretreatment strategies on removing the physical barrier of lignin, reducingthe dense crystalline structure and coating effect of hemicellulose and enhancing the accessibility ofthe pretreated biomass to hydrolytic enzymes were relatively complicated [11,12,45,46]. Results clearlyindicate that both DAP and FCP were effective at removing hemicellulose components and destroyingcell wall structure. The hemicellulose removal in DAP and FCP exhibited a positive relationshipwith the reducing sugar yields during the subsequent enzymatic hydrolysis (Table 2 and Figure 3).
205
Molecules 2019, 24, 1715
These results further support the observation that under acid/Lewis acid pretreatments, cellulosesaccharification is linearly proportional to the amount of hemicellulose (mainly xylan) removed,since hemicellulose removal helps increase cellulose accessibility [27,45]. The reducing sugar yields(279.3~336.4 mg/g PS) and conversion ratios (34.6~44.5%) by DAP and FCP were comparable tothose observed in the pretreated bamboo (77 mg/g PS), rice grass (457 mg/g PS) and pine foliage(588 mg/g PS) pretreated with 1~2% H2SO4 at 121 C for 60 min [19–21]. Notably, the simultaneousremovals of lignin and hemicellulose were also positively related with the reducing sugar yields ofthe DALP samples (Table 2 and Figure 3). Despite lower hemicellulose removal, DALP provideda much higher delignification (Table 2) and reducing sugar recovery as compared with DAP andFCP (744.4 mg/g PS vs 279.3~336.4 mg/g PS, respectively). In addition to the obvious impact ondelignification, significant enhancements on fermentable sugar releases were also observed in differentbiomass samples pretreated with NaOH under similar conditions, including bamboo, pine foliage,Pennisetum purpureum, wheat straw and Eucalyptus (324~629 mg/g PS) [17,20,34,44]. These resultsindicate that effective lignin removal, as well as cellulose swelling induced by DALP, appeared to bemore important factors in decreasing biomass recalcitrance and increasing enzymatic digestibility ascompared with hemicellulose removal in DAP and FCP.
2.6. Analysis of Mass Balance and Prospects for P. alopecuroides
A promising pretreatment method not only enables the ability to obtain readily digestiblesubstrates, but also maximizes the total yield of fermentable sugars. Table 3 shows the mass balanceof stalk samples under different pretreatments and subsequent enzymatic hydrolysis. The highestreducing sugar yields in the aqueous phases under the optimal DAP, DALP and FCP conditions were119.3 mg/g RS (DAP-4% H2SO4), 107.3 mg/g RS (DALP-1.2% NaOH) and 200.2 mg/g RS (FCP-4.8%FeCl3). The solid yields under the above conditions were 52.6%, 53.9% and 53.1%, respectively.The corresponding reducing sugar yields of enzymatic hydrolysis of the DAP, DALP and FCP sampleswere 336.4, 744.4 and 279.3 mg/g PS, respectively. Based the above data, the total soluble sugar yieldsfrom both pretreatment and enzymatic hydrolysis processes were 296.2, 508.5 and 348.6 mg/g RS,respectively. DAP had the lowest sugar recovery, partly because of its low enzymatic hydrolysisefficiency. Another reason was that cellulosic components, once removed, may be further convertedinto other byproducts, and thus the sugar yield from the aqueous phase during DAP was not highdespite of its high weight loss. Among experimental conditions tested, DALP yielded the highesttotal sugar recovery through the whole process from pretreatment to enzymatic hydrolysis, while FCPindicated the most efficient method to recover soluble sugars only at pretreatment stage.
Table 3. Mass balance of the untreated and pretreated stalks.
DifferentMethods
SolidYield (%)
Soluble Sugarfrom Pretreatment
(mg/g RS)
Soluble Sugarfrom Enzymatic
Hydrolysis (mg/g PS)
Soluble Sugarfrom Enzymatic
Hydrolysis (mg/g RS)
Total SolubleSugar Yield(mg/g RS) 1
Control – – – 134.8 134.8DAP 52.6 119.3 336.4 176.9 296.2
DALP 53.9 107.3 744.4 401.2 508.5FCP 53.1 200.2 279.3 148.4 348.6
1 The total soluble sugar yield through the whole process from pretreatment to enzymatic hydrolysis was calculated basedon per g raw stalk. RS: raw stalk; PS: pretreated stalk.
The fermentable sugar recovery from the P. alopecuroides sample pretreated by DALP wascomparable to those obtained in the enzymatic hydrolysis of different lignocellulosic biomasses,as well as Pennisetum grass species [9,17,19,20,34,46,47]. As shown in Table 4, the maximum releasedsugar yields of 362.3~629 mg/g PS were obtained by acid or alkaline pretreatments of various biomasswastes such as wild rice grass, pine foliage, Eucalyptus and bamboo [19,20,34,46]. The optimal reducingsugar yield was only 146.9 mg/g pretreated elephant grass (P. purpureum) pretreated with 1.5% NaOH at
206
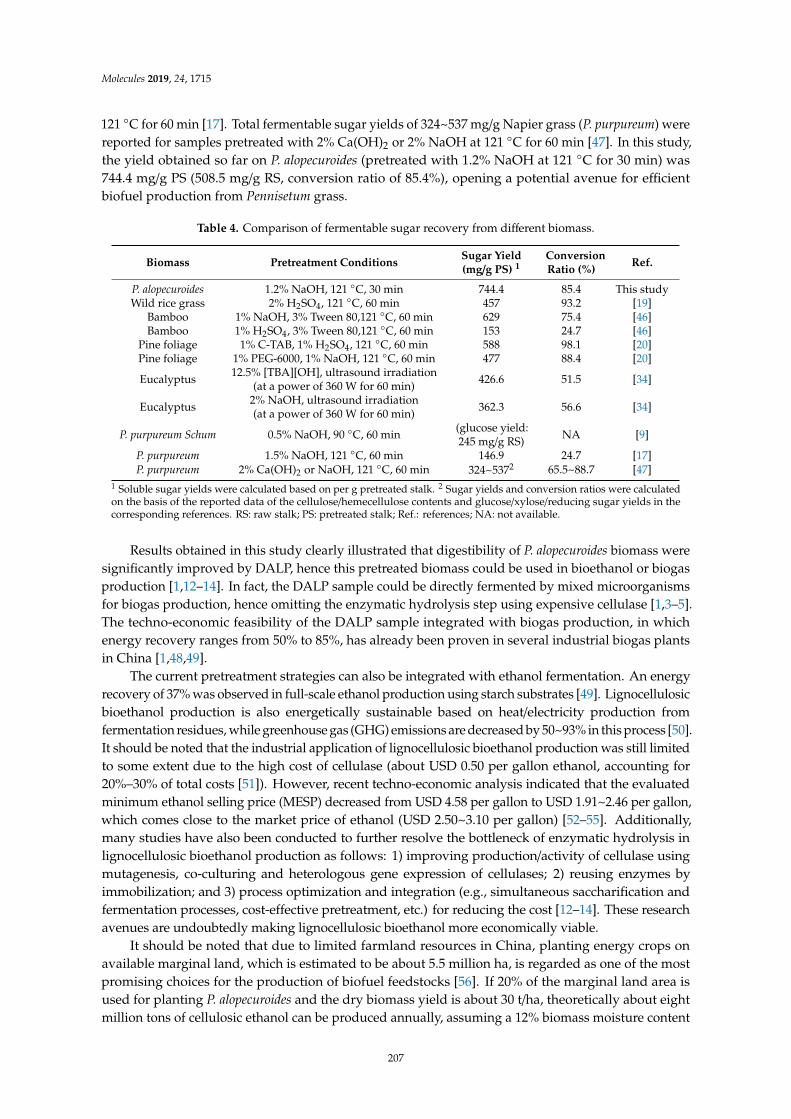
Molecules 2019, 24, 1715
121 C for 60 min [17]. Total fermentable sugar yields of 324~537 mg/g Napier grass (P. purpureum) werereported for samples pretreated with 2% Ca(OH)2 or 2% NaOH at 121 C for 60 min [47]. In this study,the yield obtained so far on P. alopecuroides (pretreated with 1.2% NaOH at 121 C for 30 min) was744.4 mg/g PS (508.5 mg/g RS, conversion ratio of 85.4%), opening a potential avenue for efficientbiofuel production from Pennisetum grass.
Table 4. Comparison of fermentable sugar recovery from different biomass.
Biomass Pretreatment Conditions Sugar Yield(mg/g PS) 1
ConversionRatio (%) Ref.
P. alopecuroides 1.2% NaOH, 121 C, 30 min 744.4 85.4 This studyWild rice grass 2% H2SO4, 121 C, 60 min 457 93.2 [19]
Bamboo 1% NaOH, 3% Tween 80,121 C, 60 min 629 75.4 [46]Bamboo 1% H2SO4, 3% Tween 80,121 C, 60 min 153 24.7 [46]
Pine foliage 1% C-TAB, 1% H2SO4, 121 C, 60 min 588 98.1 [20]Pine foliage 1% PEG-6000, 1% NaOH, 121 C, 60 min 477 88.4 [20]
Eucalyptus 12.5% [TBA][OH], ultrasound irradiation(at a power of 360 W for 60 min) 426.6 51.5 [34]
Eucalyptus 2% NaOH, ultrasound irradiation(at a power of 360 W for 60 min) 362.3 56.6 [34]
P. purpureum Schum 0.5% NaOH, 90 C, 60 min (glucose yield:245 mg/g RS) NA [9]
P. purpureum 1.5% NaOH, 121 C, 60 min 146.9 24.7 [17]P. purpureum 2% Ca(OH)2 or NaOH, 121 C, 60 min 324~5372 65.5~88.7 [47]
1 Soluble sugar yields were calculated based on per g pretreated stalk. 2 Sugar yields and conversion ratios were calculatedon the basis of the reported data of the cellulose/hemecellulose contents and glucose/xylose/reducing sugar yields in thecorresponding references. RS: raw stalk; PS: pretreated stalk; Ref.: references; NA: not available.
Results obtained in this study clearly illustrated that digestibility of P. alopecuroides biomass weresignificantly improved by DALP, hence this pretreated biomass could be used in bioethanol or biogasproduction [1,12–14]. In fact, the DALP sample could be directly fermented by mixed microorganismsfor biogas production, hence omitting the enzymatic hydrolysis step using expensive cellulase [1,3–5].The techno-economic feasibility of the DALP sample integrated with biogas production, in whichenergy recovery ranges from 50% to 85%, has already been proven in several industrial biogas plantsin China [1,48,49].
The current pretreatment strategies can also be integrated with ethanol fermentation. An energyrecovery of 37% was observed in full-scale ethanol production using starch substrates [49]. Lignocellulosicbioethanol production is also energetically sustainable based on heat/electricity production fromfermentation residues, while greenhouse gas (GHG) emissions are decreased by 50~93% in this process [50].It should be noted that the industrial application of lignocellulosic bioethanol production was still limitedto some extent due to the high cost of cellulase (about USD 0.50 per gallon ethanol, accounting for20%–30% of total costs [51]). However, recent techno-economic analysis indicated that the evaluatedminimum ethanol selling price (MESP) decreased from USD 4.58 per gallon to USD 1.91~2.46 per gallon,which comes close to the market price of ethanol (USD 2.50~3.10 per gallon) [52–55]. Additionally,many studies have also been conducted to further resolve the bottleneck of enzymatic hydrolysis inlignocellulosic bioethanol production as follows: 1) improving production/activity of cellulase usingmutagenesis, co-culturing and heterologous gene expression of cellulases; 2) reusing enzymes byimmobilization; and 3) process optimization and integration (e.g., simultaneous saccharification andfermentation processes, cost-effective pretreatment, etc.) for reducing the cost [12–14]. These researchavenues are undoubtedly making lignocellulosic bioethanol more economically viable.
It should be noted that due to limited farmland resources in China, planting energy crops onavailable marginal land, which is estimated to be about 5.5 million ha, is regarded as one of the mostpromising choices for the production of biofuel feedstocks [56]. If 20% of the marginal land area isused for planting P. alopecuroides and the dry biomass yield is about 30 t/ha, theoretically about eightmillion tons of cellulosic ethanol can be produced annually, assuming a 12% biomass moisture content
207
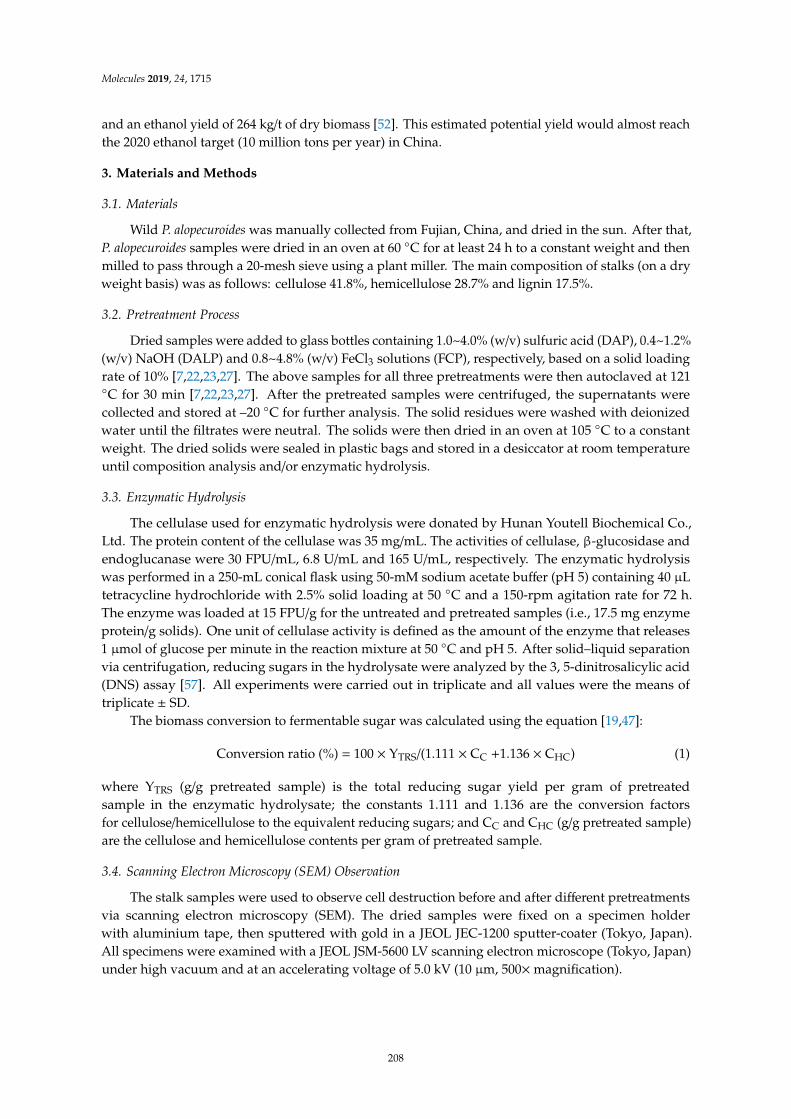
Molecules 2019, 24, 1715
and an ethanol yield of 264 kg/t of dry biomass [52]. This estimated potential yield would almost reachthe 2020 ethanol target (10 million tons per year) in China.
3. Materials and Methods
3.1. Materials
Wild P. alopecuroides was manually collected from Fujian, China, and dried in the sun. After that,P. alopecuroides samples were dried in an oven at 60 C for at least 24 h to a constant weight and thenmilled to pass through a 20-mesh sieve using a plant miller. The main composition of stalks (on a dryweight basis) was as follows: cellulose 41.8%, hemicellulose 28.7% and lignin 17.5%.
3.2. Pretreatment Process
Dried samples were added to glass bottles containing 1.0~4.0% (w/v) sulfuric acid (DAP), 0.4~1.2%(w/v) NaOH (DALP) and 0.8~4.8% (w/v) FeCl3 solutions (FCP), respectively, based on a solid loadingrate of 10% [7,22,23,27]. The above samples for all three pretreatments were then autoclaved at 121C for 30 min [7,22,23,27]. After the pretreated samples were centrifuged, the supernatants werecollected and stored at –20 C for further analysis. The solid residues were washed with deionizedwater until the filtrates were neutral. The solids were then dried in an oven at 105 C to a constantweight. The dried solids were sealed in plastic bags and stored in a desiccator at room temperatureuntil composition analysis and/or enzymatic hydrolysis.
3.3. Enzymatic Hydrolysis
The cellulase used for enzymatic hydrolysis were donated by Hunan Youtell Biochemical Co.,Ltd. The protein content of the cellulase was 35 mg/mL. The activities of cellulase, β-glucosidase andendoglucanase were 30 FPU/mL, 6.8 U/mL and 165 U/mL, respectively. The enzymatic hydrolysiswas performed in a 250-mL conical flask using 50-mM sodium acetate buffer (pH 5) containing 40 µLtetracycline hydrochloride with 2.5% solid loading at 50 C and a 150-rpm agitation rate for 72 h.The enzyme was loaded at 15 FPU/g for the untreated and pretreated samples (i.e., 17.5 mg enzymeprotein/g solids). One unit of cellulase activity is defined as the amount of the enzyme that releases1 µmol of glucose per minute in the reaction mixture at 50 C and pH 5. After solid–liquid separationvia centrifugation, reducing sugars in the hydrolysate were analyzed by the 3, 5-dinitrosalicylic acid(DNS) assay [57]. All experiments were carried out in triplicate and all values were the means oftriplicate ± SD.
The biomass conversion to fermentable sugar was calculated using the equation [19,47]:
Conversion ratio (%) = 100 × YTRS/(1.111 × CC +1.136 × CHC) (1)
where YTRS (g/g pretreated sample) is the total reducing sugar yield per gram of pretreatedsample in the enzymatic hydrolysate; the constants 1.111 and 1.136 are the conversion factorsfor cellulose/hemicellulose to the equivalent reducing sugars; and CC and CHC (g/g pretreated sample)are the cellulose and hemicellulose contents per gram of pretreated sample.
3.4. Scanning Electron Microscopy (SEM) Observation
The stalk samples were used to observe cell destruction before and after different pretreatmentsvia scanning electron microscopy (SEM). The dried samples were fixed on a specimen holderwith aluminium tape, then sputtered with gold in a JEOL JEC-1200 sputter-coater (Tokyo, Japan).All specimens were examined with a JEOL JSM-5600 LV scanning electron microscope (Tokyo, Japan)under high vacuum and at an accelerating voltage of 5.0 kV (10 µm, 500×magnification).
208
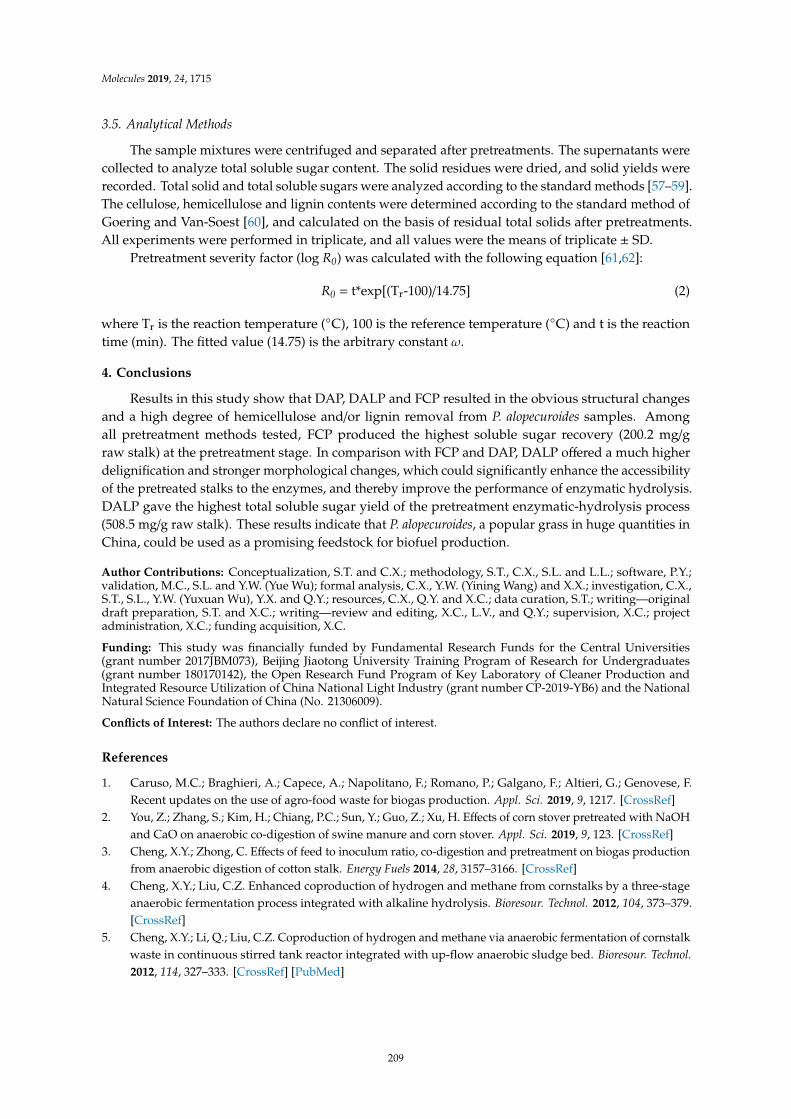
Molecules 2019, 24, 1715
3.5. Analytical Methods
The sample mixtures were centrifuged and separated after pretreatments. The supernatants werecollected to analyze total soluble sugar content. The solid residues were dried, and solid yields wererecorded. Total solid and total soluble sugars were analyzed according to the standard methods [57–59].The cellulose, hemicellulose and lignin contents were determined according to the standard method ofGoering and Van-Soest [60], and calculated on the basis of residual total solids after pretreatments.All experiments were performed in triplicate, and all values were the means of triplicate ± SD.
Pretreatment severity factor (log R0) was calculated with the following equation [61,62]:
R0 = t*exp[(Tr-100)/14.75] (2)
where Tr is the reaction temperature (C), 100 is the reference temperature (C) and t is the reactiontime (min). The fitted value (14.75) is the arbitrary constant ω.
4. Conclusions
Results in this study show that DAP, DALP and FCP resulted in the obvious structural changesand a high degree of hemicellulose and/or lignin removal from P. alopecuroides samples. Amongall pretreatment methods tested, FCP produced the highest soluble sugar recovery (200.2 mg/graw stalk) at the pretreatment stage. In comparison with FCP and DAP, DALP offered a much higherdelignification and stronger morphological changes, which could significantly enhance the accessibilityof the pretreated stalks to the enzymes, and thereby improve the performance of enzymatic hydrolysis.DALP gave the highest total soluble sugar yield of the pretreatment enzymatic-hydrolysis process(508.5 mg/g raw stalk). These results indicate that P. alopecuroides, a popular grass in huge quantities inChina, could be used as a promising feedstock for biofuel production.
Author Contributions: Conceptualization, S.T. and C.X.; methodology, S.T., C.X., S.L. and L.L.; software, P.Y.;validation, M.C., S.L. and Y.W. (Yue Wu); formal analysis, C.X., Y.W. (Yining Wang) and X.X.; investigation, C.X.,S.T., S.L., Y.W. (Yuxuan Wu), Y.X. and Q.Y.; resources, C.X., Q.Y. and X.C.; data curation, S.T.; writing—originaldraft preparation, S.T. and X.C.; writing—review and editing, X.C., L.V., and Q.Y.; supervision, X.C.; projectadministration, X.C.; funding acquisition, X.C.
Funding: This study was financially funded by Fundamental Research Funds for the Central Universities(grant number 2017JBM073), Beijing Jiaotong University Training Program of Research for Undergraduates(grant number 180170142), the Open Research Fund Program of Key Laboratory of Cleaner Production andIntegrated Resource Utilization of China National Light Industry (grant number CP-2019-YB6) and the NationalNatural Science Foundation of China (No. 21306009).
Conflicts of Interest: The authors declare no conflict of interest.
References
1. Caruso, M.C.; Braghieri, A.; Capece, A.; Napolitano, F.; Romano, P.; Galgano, F.; Altieri, G.; Genovese, F.Recent updates on the use of agro-food waste for biogas production. Appl. Sci. 2019, 9, 1217. [CrossRef]
2. You, Z.; Zhang, S.; Kim, H.; Chiang, P.C.; Sun, Y.; Guo, Z.; Xu, H. Effects of corn stover pretreated with NaOHand CaO on anaerobic co-digestion of swine manure and corn stover. Appl. Sci. 2019, 9, 123. [CrossRef]
3. Cheng, X.Y.; Zhong, C. Effects of feed to inoculum ratio, co-digestion and pretreatment on biogas productionfrom anaerobic digestion of cotton stalk. Energy Fuels 2014, 28, 3157–3166. [CrossRef]
4. Cheng, X.Y.; Liu, C.Z. Enhanced coproduction of hydrogen and methane from cornstalks by a three-stageanaerobic fermentation process integrated with alkaline hydrolysis. Bioresour. Technol. 2012, 104, 373–379.[CrossRef]
5. Cheng, X.Y.; Li, Q.; Liu, C.Z. Coproduction of hydrogen and methane via anaerobic fermentation of cornstalkwaste in continuous stirred tank reactor integrated with up-flow anaerobic sludge bed. Bioresour. Technol.2012, 114, 327–333. [CrossRef] [PubMed]
209
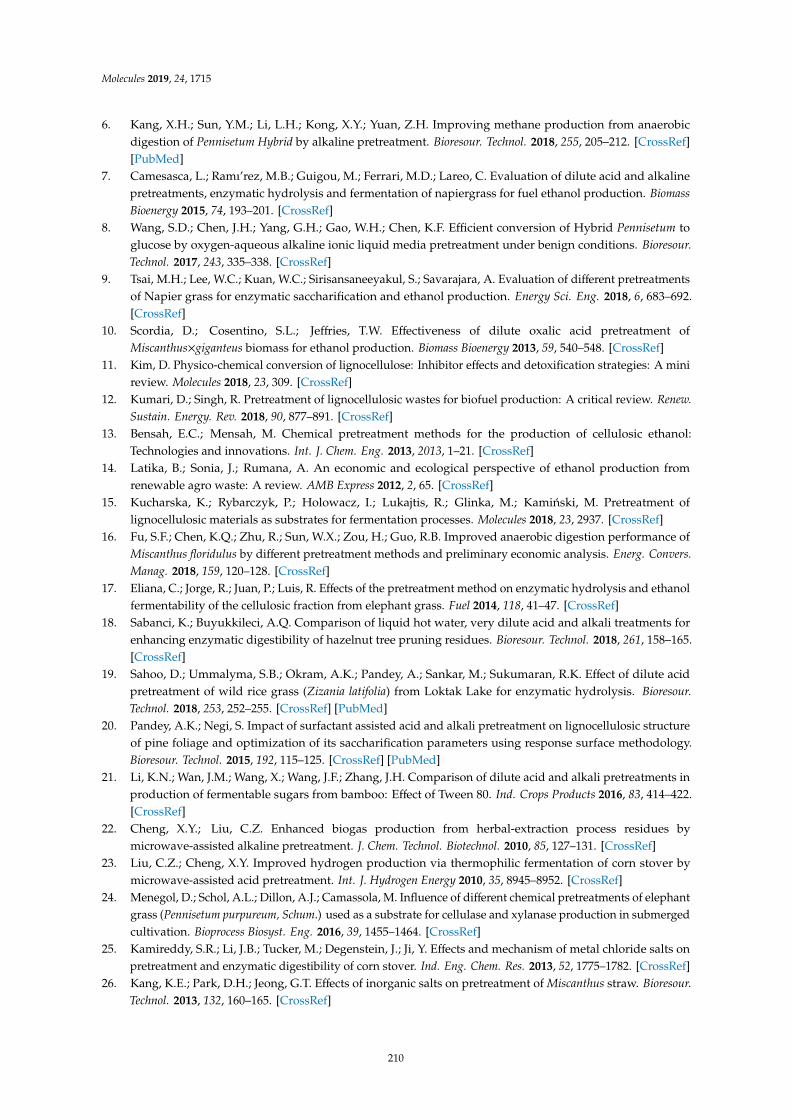
Molecules 2019, 24, 1715
6. Kang, X.H.; Sun, Y.M.; Li, L.H.; Kong, X.Y.; Yuan, Z.H. Improving methane production from anaerobicdigestion of Pennisetum Hybrid by alkaline pretreatment. Bioresour. Technol. 2018, 255, 205–212. [CrossRef][PubMed]
7. Camesasca, L.; Ramı’rez, M.B.; Guigou, M.; Ferrari, M.D.; Lareo, C. Evaluation of dilute acid and alkalinepretreatments, enzymatic hydrolysis and fermentation of napiergrass for fuel ethanol production. BiomassBioenergy 2015, 74, 193–201. [CrossRef]
8. Wang, S.D.; Chen, J.H.; Yang, G.H.; Gao, W.H.; Chen, K.F. Efficient conversion of Hybrid Pennisetum toglucose by oxygen-aqueous alkaline ionic liquid media pretreatment under benign conditions. Bioresour.Technol. 2017, 243, 335–338. [CrossRef]
9. Tsai, M.H.; Lee, W.C.; Kuan, W.C.; Sirisansaneeyakul, S.; Savarajara, A. Evaluation of different pretreatmentsof Napier grass for enzymatic saccharification and ethanol production. Energy Sci. Eng. 2018, 6, 683–692.[CrossRef]
10. Scordia, D.; Cosentino, S.L.; Jeffries, T.W. Effectiveness of dilute oxalic acid pretreatment ofMiscanthus×giganteus biomass for ethanol production. Biomass Bioenergy 2013, 59, 540–548. [CrossRef]
11. Kim, D. Physico-chemical conversion of lignocellulose: Inhibitor effects and detoxification strategies: A minireview. Molecules 2018, 23, 309. [CrossRef]
12. Kumari, D.; Singh, R. Pretreatment of lignocellulosic wastes for biofuel production: A critical review. Renew.Sustain. Energy. Rev. 2018, 90, 877–891. [CrossRef]
13. Bensah, E.C.; Mensah, M. Chemical pretreatment methods for the production of cellulosic ethanol:Technologies and innovations. Int. J. Chem. Eng. 2013, 2013, 1–21. [CrossRef]
14. Latika, B.; Sonia, J.; Rumana, A. An economic and ecological perspective of ethanol production fromrenewable agro waste: A review. AMB Express 2012, 2, 65. [CrossRef]
15. Kucharska, K.; Rybarczyk, P.; Holowacz, I.; Lukajtis, R.; Glinka, M.; Kaminski, M. Pretreatment oflignocellulosic materials as substrates for fermentation processes. Molecules 2018, 23, 2937. [CrossRef]
16. Fu, S.F.; Chen, K.Q.; Zhu, R.; Sun, W.X.; Zou, H.; Guo, R.B. Improved anaerobic digestion performance ofMiscanthus floridulus by different pretreatment methods and preliminary economic analysis. Energ. Convers.Manag. 2018, 159, 120–128. [CrossRef]
17. Eliana, C.; Jorge, R.; Juan, P.; Luis, R. Effects of the pretreatment method on enzymatic hydrolysis and ethanolfermentability of the cellulosic fraction from elephant grass. Fuel 2014, 118, 41–47. [CrossRef]
18. Sabanci, K.; Buyukkileci, A.Q. Comparison of liquid hot water, very dilute acid and alkali treatments forenhancing enzymatic digestibility of hazelnut tree pruning residues. Bioresour. Technol. 2018, 261, 158–165.[CrossRef]
19. Sahoo, D.; Ummalyma, S.B.; Okram, A.K.; Pandey, A.; Sankar, M.; Sukumaran, R.K. Effect of dilute acidpretreatment of wild rice grass (Zizania latifolia) from Loktak Lake for enzymatic hydrolysis. Bioresour.Technol. 2018, 253, 252–255. [CrossRef] [PubMed]
20. Pandey, A.K.; Negi, S. Impact of surfactant assisted acid and alkali pretreatment on lignocellulosic structureof pine foliage and optimization of its saccharification parameters using response surface methodology.Bioresour. Technol. 2015, 192, 115–125. [CrossRef] [PubMed]
21. Li, K.N.; Wan, J.M.; Wang, X.; Wang, J.F.; Zhang, J.H. Comparison of dilute acid and alkali pretreatments inproduction of fermentable sugars from bamboo: Effect of Tween 80. Ind. Crops Products 2016, 83, 414–422.[CrossRef]
22. Cheng, X.Y.; Liu, C.Z. Enhanced biogas production from herbal-extraction process residues bymicrowave-assisted alkaline pretreatment. J. Chem. Technol. Biotechnol. 2010, 85, 127–131. [CrossRef]
23. Liu, C.Z.; Cheng, X.Y. Improved hydrogen production via thermophilic fermentation of corn stover bymicrowave-assisted acid pretreatment. Int. J. Hydrogen Energy 2010, 35, 8945–8952. [CrossRef]
24. Menegol, D.; Schol, A.L.; Dillon, A.J.; Camassola, M. Influence of different chemical pretreatments of elephantgrass (Pennisetum purpureum, Schum.) used as a substrate for cellulase and xylanase production in submergedcultivation. Bioprocess Biosyst. Eng. 2016, 39, 1455–1464. [CrossRef]
25. Kamireddy, S.R.; Li, J.B.; Tucker, M.; Degenstein, J.; Ji, Y. Effects and mechanism of metal chloride salts onpretreatment and enzymatic digestibility of corn stover. Ind. Eng. Chem. Res. 2013, 52, 1775–1782. [CrossRef]
26. Kang, K.E.; Park, D.H.; Jeong, G.T. Effects of inorganic salts on pretreatment of Miscanthus straw. Bioresour.Technol. 2013, 132, 160–165. [CrossRef]
210
Molecules 2019, 24, 1715
27. Zhang, H.D.; Lyu, G.J.; Zhang, A.P.; Li, X.; Xie, J. Effects of ferric chloride pretreatment and surfactants onthe sugar production from sugarcane bagasse. Bioresour. Technol. 2018, 265, 93–101. [CrossRef]
28. Meng, X.; Foston, M.; Leisen, J.; Demartini, J.; Wyman, C.E.; Ragauskas, A.J. Determination of porosity oflignocellulosic biomass before and after pretreatment by using Simons’stain and NMR techniques. Bioresour.Technol. 2013, 144, 467–476. [CrossRef]
29. Brienzo, M.; Fikizolo, S.; Benjamin, Y.; Tyhoda, L.; Görgens, J. Influence of pretreatment severity on structuralchanges, lignin content and enzymatic hydrolysis of sugarcane bagasse samples. Renew. Energy 2017, 104,271–280. [CrossRef]
30. Wang, W.H.; Zhang, C.Y.; Tong, S.S.; Cui, Z.Y.; Liu, P. Enhanced enzymatic hydrolysis and structural featuresof corn stover by NaOH and ozone combined pretreatment. Molecules 2018, 23, 1300. [CrossRef]
31. Li, H.; Chen, X.; Wang, C.; Sun, S.; Sun, R. Evaluation of the two-step treatment with ionic liquids and alkalifor enhancing enzymatic hydrolysis of Eucalyptus: Chemical and anatomical changes. Biotechnol. Biofuels2016, 9, 166. [CrossRef]
32. Yan, Y.H.; Zhang, C.H.; Lin, Q.X.; Wang, X.H.; Cheng, B.G.; Li, H.L.; Ren, J.L. Microwave-assisted oxalicacid pretreatment for the enhancing of enzyme hydrolysis in the production of xylose and arabinose frombagasse. Molecules 2018, 23, 862. [CrossRef]
33. Jin, S.; Zhang, G.; Zhang, P.; Li, F.; Wang, S.; Fan, S.; Zhou, S. Microwave assisted alkaline pretreatment toenhance enzymatic saccharification of catalpa sawdust. Bioresour. Technol. 2016, 221, 26–30. [CrossRef]
34. Wang, Z.N.; Hou, X.F.; Sun, J.; Li, M.; Chen, Z.Y.; Gao, Z.Z. Comparison of ultrasound-assisted ionic liquidand alkaline pretreatment of Eucalyptus for enhancing enzymatic saccharification. Bioresour. Technol. 2018,254, 145–150. [CrossRef]
35. Shimizu, F.L.; Monteiro, P.Q.; Ghiraldi, P.H.C.; Melati, R.B.; Pagnocca, F.C.; Souza, W.; Sant’Anna, C.;Brienzo, M. Acid, alkali and peroxide pretreatments increase the cellulose accessibility and glucose yield ofbanana pseudostem. Ind. Crops Prod. 2018, 115, 62–68. [CrossRef]
36. Thomas, H.L.; Seira, J.; Escudi, R.; Carrère, H. Lime pretreatment of miscanthus: Impact on bmp and batchdry co-digestion with cattle manure. Molecules 2018, 23, 1608. [CrossRef]
37. Duque, A.; Manzanares, P.; González, A.; Ballesteros, M. Study of the application of alkaline extrusion to thepretreatment of Eucalyptus biomass as first step in a bioethanol production process. Energies 2018, 11, 2961.[CrossRef]
38. Ximenes, E.; Kim, Y.; Mosier, N.; Dien, B.; Ladisch, M. Deactivation of cellulases by phenols. Enzyme. Microb.Technol. 2011, 48, 54–60. [CrossRef]
39. Ximenes, E.; Kim, Y.; Mosier, N.; Dien, B.; Ladisch, M. Inhibition of cellulases by phenols. Enzyme. Microb.Technol. 2010, 46, 170–176. [CrossRef]
40. Michelin, M.; Ximenes, E.; de Lourdes Teixeira de Moraes Polizeli, M.; Ladisch, M.R. Effect of phenoliccompounds from pretreated sugarcane bagasse on cellulolytic and hemicellulolytic activities. Bioresour.Technol. 2016, 199, 275–278. [CrossRef]
41. Monlau, F.; Sambusiti, C.; Barakat, A.; Quéméneur, M.; Trably, E.; Steyer, J.P.; Carrère, H. Do furanic andphenolic compounds of lignocellulosic and algae biomass hydrolyzate inhibit anaerobic mixed cultures:A comprehensive review. Biotechnol. Adv. 2014, 32, 934–951. [CrossRef]
42. Imman, S.; Arnthong, J.; Burapatana, V.; Champred, V.; Laosiripojana, N. Effects of acid and alkali promoterson compressed liquid hot water pretreatment of rice straw. Bioresour. Technol. 2014, 171, 29–36. [CrossRef]
43. Rivera, O.M.P.; Moldes, A.B.; Torrado, A.M.; Domínguez, J.M. Lactic acid and biosurfactants productionfrom hydrolyzed distilled grape marc. Process Biochem. 2007, 42, 1010–1020. [CrossRef]
44. McIntosh, S.; Vancov, T. Optimisation of dilute alkaline pretreatment for enzymatic saccharification of wheatstraw. Biomass Bioenergy 2011, 35, 3094–3103. [CrossRef]
45. Meng, X.Z.; Wells, T.; Sun, Q.N.; Huang, F.; Ragauskas, A. Insights into the effect of dilute acid, hot water oralkaline pretreatment on the cellulose accessible surface area and the overall porosity of Populus. Green Chem.2015, 17, 4239–4246. [CrossRef]
46. Obeng, A.K.; Premjet, D.; Premjet, S. Fermentable sugar production from the peels of two durian (Duriozibethinus Murr.) cultivars by phosphoric acid pretreatment. Resources 2018, 7, 60. [CrossRef]
47. Phitsuwan, P.; Sakka, K.; Ratanakhanokchai, K. Structural changes and enzymatic response of Napier grass(Pennisetum purpureum) stem induced by alkaline pretreatment. Bioresour. Technol. 2016, 218, 247–256.[CrossRef]
211
Molecules 2019, 24, 1715
48. Jiao, X.X.; Jin, H.Y.; Wang, M.M. Research progress of straw pretreatment for anaerobic fermentation producing biogas in china. China Biogas 2011, 29, 29–39.
49. Yu, Y.; Zheng, P.; Chen, X.G.; Cai, J. Three typical fermentation utilization modes of biomass energy. Bull. Sci.Technol. 2009, 25, 854–859. (In Chinese) [CrossRef]
50. Moreno, J.; Dufour, J. Life cycle assessment of lignocellusosic bioethanol: Environmental impacts and energybalance. Renew. Sustain. Energy. Rev. 2015, 42, 1349–1361. [CrossRef]
51. Du, J. Novozymes accelerates cellulosic ethanol commercialized. China WTO Tribune 2010, 10, 81. (In Chinese)[CrossRef]
52. Duque, S.H.; Cardona, C.A.; Moncada, J. Techno-economic and environmental analysis of ethanol productionfrom agroindustrial residues in Colombia. Energy Fuels 2015, 29, 775–783. [CrossRef]
53. Chovau, S.; Degrauwe, D.; Van der Bruggen, B. Critical analysis of techno-economic estimates for theproduction cost of lignocellulosic bio-ethanol. Renew. Sustain. Energy Rev. 2013, 26, 307–321. [CrossRef]
54. Gubicza, K.; Nieves, I.U.; Sagues, W.J.; Barta, Z.; Shanmugam, K.T.; Ingram, L.O. Techno-economic analysisof ethanol production from sugarcane bagasse using a liquefaction plus simultaneous saccharification andco-fermentation process. Bioresour. Technol. 2016, 208, 42–48. [CrossRef]
55. Denis, B.; Mark, M.W.; Robert, B. More than ethanol: A techno-economic analysis of a corn stover-ethanolbiorefinery integrated with a hydrothermal liquefaction process to convert lignin into biochemicals. Biofuel.Bioprod. Bior. 2018, 12, 497–509. [CrossRef]
56. Chen, Y.Q.; Guo, X.D.; Liu, J.J.; Zhang, Z.J. Assessment of marginal land potential for energy plants in China.Land Develop. Eng. Res. 2017, 2, 1–7. (In Chinese)
57. Miller, G.L. Use of dinitrosalicylic acid reagent for determination of reducing sugar. Anal. Chem. 1959, 31,426–428. [CrossRef]
58. State Environmental Protection Administration of China (SEPAC). The Methods for Water and WastewaterMonitoring and Analysis, 4th ed.; China Environmental Science Press: Beijing, China, 2002.
59. APHA. Standard Methods for the Examination of Water and Wastewater, 20th ed.; American Public HealthAssociation: Washington, DC, USA, 1998.
60. Goering, H.K.; Van-Soest, P.J. Agricultural handbook No. 379. Forage fiber analyses, apparatus, reagents, proceduresand some applications; U.S. Department of Agriculture: Washington, DC, USA, 1970.
61. Overend, R.P.; Chornet, E.; Gascoigne, J.A. Fractionation of lignocellulosics by steam-aqueous pretreatments[and discussion]. Philos. Trans. R. Soc. Lond. A 1987, 321, 523–536. [CrossRef]
62. Pedersen, M.; Meyer, A.S. Lignocellulose pretreatment severity-relating pH to biomatrix opening.New Biotechnol. 2010, 27, 739–750. [CrossRef]
Sample Availability: Samples of the chemical compounds used in this study are available from the authors.
© 2019 by the authors. Licensee MDPI, Basel, Switzerland. This article is an open accessarticle distributed under the terms and conditions of the Creative Commons Attribution(CC BY) license (http://creativecommons.org/licenses/by/4.0/).
212
molecules
Article
Comparison of Two Process Schemes CombiningHydrothermal Treatment and AcidogenicFermentation of Source-Separated Organics
Long Lin 1, Ehssan Hosseini Koupaie 2, Armineh Azizi 2, Amir Abbas Bazyar Lakeh 2,Bipro R. Dhar 1, Hisham Hafez 2,3 and Elsayed Elbeshbishy 2,*
1 Department of Civil and Environmental Engineering, University of Alberta, 116 Street NW,Edmonton, AB T6G 1H9, Canada; [email protected] (L.L.); [email protected] (B.R.D.)
2 Environmental Research Group for Resource Recovery, Department of Civil Engineering,Faculty of Engineering, Architecture and Science, Ryerson University, 350 Victoria Street,Toronto, ON M5B 2K3, Canada; [email protected] (E.H.K.); [email protected] (A.A.);[email protected] (A.A.B.L.); [email protected] (H.H.)
3 Greenfield Global, 275 Bloomfield Road, Chatham, ON N7M 0N6, Canada* Correspondence: [email protected]; Tel.: +1-4169-79-5000 (ext. 7618); Fax: +1-4169-79-5122
Academic Editor: Ivet FerrerReceived: 14 March 2019; Accepted: 6 April 2019; Published: 13 April 2019
Abstract: This study compares the effects of pre- and post-hydrothermal treatment of source- separatedorganics (SSO) on solubilization of particulate organics and acidogenic fermentation for volatile fattyacids (VFAs) production. The overall COD solubilization and solids removal efficiencies from bothschemes were comparable. However, the pre-hydrolysis of SSO followed by acidogenic fermentationresulted in a relatively higher VFA yield of 433 mg/g VSS, which was 18% higher than that of a processscheme with a post-hydrolysis of dewatered solids from the fermentation process. Regarding thecomposition of VFA, the dominance of acetate and butyrate was comparable in both process schemes,while propionate concentration considerably increased in the process with pre-hydrolysis of SSO. Themicrobial community results showed that the relative abundance of Firmicutes increased substantiallyin the fermentation of pretreated SSO, indicating that there might be different metabolic pathways forproduction of VFAs in fermentation process operated with pre-treated SSO. The possible reason mightbe that the abundance of soluble organic matters due to pre-hydrolysis might stimulate the growth ofmore kinetically efficient fermentative bacteria as indicated by the increase in Firmicutes percentage.
Keywords: acidogenic fermentation; hydrothermal treatment; source separated organics; volatilefatty acids; particulate organics solubilization; microbial community analysis
1. Introduction
In the world, about 1.2 billion tonnes of food are wasted every year through the food supply chain,accounting for one-third of the food production [1]. In Canada, more than 27 million tonnes of foodwaste are disposed of annually [2]. If not adequately managed, the large amount of organic waste maycause significant social, environmental, and economic challenges. Source separated collection has beenan effective management strategy to separate organic waste from other waste streams at the source,thereby minimizing the contamination of organic waste for the downstream process. Source-separatedorganics (SSO) is the term used to describe the organic waste stream collected at the source [3]. Besidesfood waste, SSO also contains other organic components, including yard trimmings (grass, leaves, etc.),fibres (paper towels, napkins, tea bags, etc.) and wood waste [4].
The bioconversion of SSO to various value-added products (e.g., CH4, H2, volatile fatty acids), andthereby reduce waste for ultimate disposal has attracted increasing attention. Specifically, waste-derived
Molecules 2019, 24, 1466; doi:10.3390/molecules24081466 www.mdpi.com/journal/molecules213
Molecules 2019, 24, 1466
volatile fatty acids (VFA) production has been emerging due to the diverse application of VFAs [5].The biological steps involved in VFA production are hydrolysis and acidogenesis. Hydrolysis, in whichbacteria use enzymes to break down particulate matters or macromolecule into soluble compoundsor monomers, is usually considered as the rate-limiting step. Pre-treatment of organic waste can beused to enhance the hydrolysis of particulate matters [6]. Among various pre-treatment methods,hydrothermal pre-treatment is considered environmentally friendly because no chemical addition isneeded. The hydrothermal pre-treatment uses high temperature and pressure to increase the ionizedproducts of water, which facilitate the hydrolysis of particulate matters into the soluble phase [7]. Also,the associated thermal energy can potentially be recovered at the end of the process, thereby reducingenergy demand [8]. Moreover, various types of waste heat from boiler steam or flue gas can be utilizedfor the hydrothermal process at no additional cost [9].
Previous studies have reported positive impacts of hydrothermal pre-treatment of food waste onfermentative VFA production. For instance, a study showed hydrothermal pre-treatment of food wasteat 160 C for 30 min, and achieved 43% increase in SCOD and 55% increase in VFA after fermentationfor 15 days [10]. Yin et al. [10] also reported that hydrothermal temperature higher than 170 C ledto the formation of some toxic and non-biodegradable products despite higher COD dissolution.Similarly, another study also examined the effect of hydrothermal pre-treatment of kitchen waste andobtained 1.3 times higher VFA production after fermentation for 21 days [11]. The compositions of SSOvary considerably from food waste, which could profoundly affect the hydrothermal pre-treatmentand subsequent fermentation performance. However, most of these studies focused on food waste anddid not identify detailed information on microbial composition during fermentation of pre-treatedsubstrates. The differences between microbial communities involved in fermentation of SSO andpretreated SSO remained to be determined. Furthermore, as the hydrothermal process mainly enhancesthe solubilization of particulates, it may instead be used as post-treatment after fermentation to targetonly the solid fraction of fermented effluent, which has rarely been investigated. Thus, it is stillunknown whether the order of applying the hydrothermal process affects solubilization of particulateorganics and VFA production when combining with acidogenic fermentation.
Therefore, the objective of this study was to compare the performance of the hydrothermal processused as pre-treatment and post-treatment on solubilization of particulate organics as well as VFAproduction from SSO. The main parameters evaluated were solubilization of particulate matters, solidsreduction, and VFAs production and composition. The microbial communities were also examinedin the fermented effluent with/without hydrothermal pre-treatment to elucidate the possible VFAproduction pathways. Lastly, the implications of this study were also discussed comparing to literature.This study first compared the two process schemes combining hydrothermal treatment and acidogenicfermentation of SSO and provided new information into microbiome that drives fermentation withpretreated SSO. The findings may help advance understanding of fermentation process and operationintegrating with hydrothermal treatment.
2. Results and Discussion
2.1. Solubilization of Particulate Matters
Figure 1 shows the concentrations and reduction efficiencies of suspended solids in raw, treated,and fermented SSO samples. The initial TSS and VSS concentrations in raw SSO were 62,000 mg/Land 45,400 mg/L, respectively. In system-1, raw SSO was fermented followed by post-hydrolysis ofdewatered solids from the fermentation process. Conversely, in system-2, raw SSO was subjected tohydrothermal pre-treatment followed by fermentation. Both systems showed a step-wise decrease in TSSand VSS concentrations after each step of treatment. Moreover, each step in system-2 showed a superiorperformance in suspended solids reduction than the corresponding step in system-1. After fermentation(system-1), the TSS and VSS concentrations decreased to 52,500 mg/L and 35,700 mg/L respectively.The subsequent hydrothermal post-treatment further decreased the TSS and VSS concentrations
214
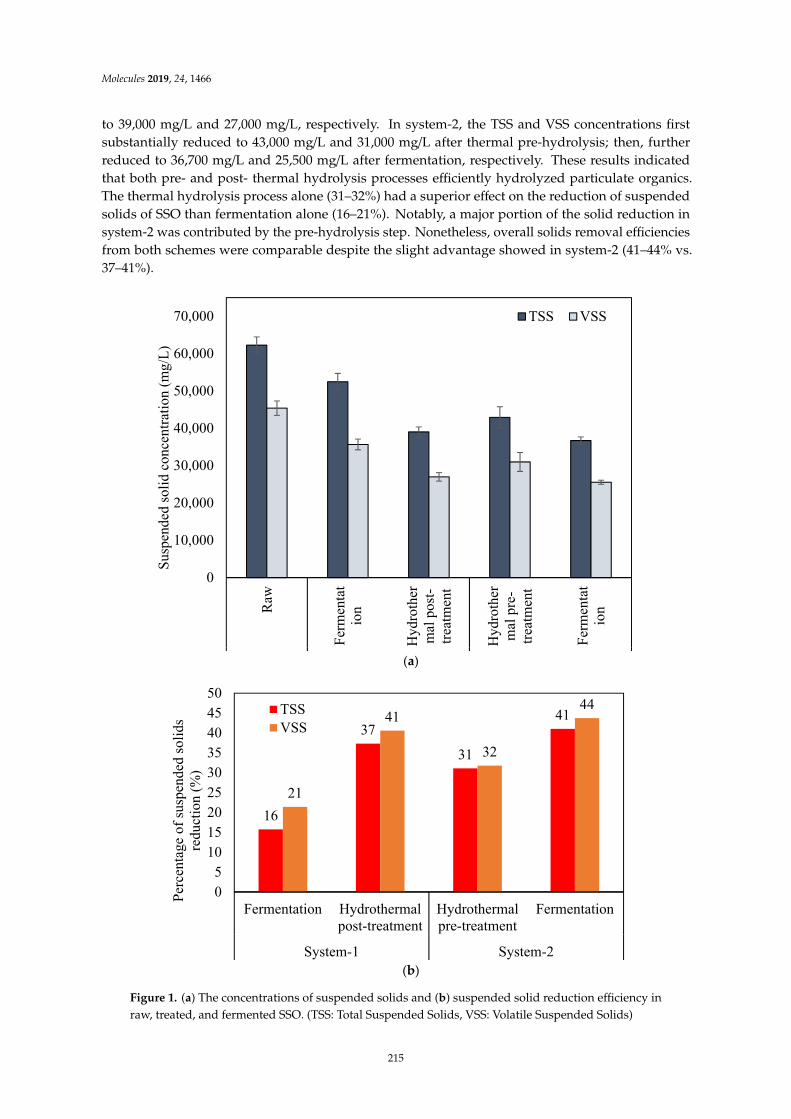
Molecules 2019, 24, 1466
to 39,000 mg/L and 27,000 mg/L, respectively. In system-2, the TSS and VSS concentrations firstsubstantially reduced to 43,000 mg/L and 31,000 mg/L after thermal pre-hydrolysis; then, furtherreduced to 36,700 mg/L and 25,500 mg/L after fermentation, respectively. These results indicatedthat both pre- and post- thermal hydrolysis processes efficiently hydrolyzed particulate organics.The thermal hydrolysis process alone (31–32%) had a superior effect on the reduction of suspendedsolids of SSO than fermentation alone (16–21%). Notably, a major portion of the solid reduction insystem-2 was contributed by the pre-hydrolysis step. Nonetheless, overall solids removal efficienciesfrom both schemes were comparable despite the slight advantage showed in system-2 (41–44% vs.37–41%).
Molecules 2019, 23, x FOR PEER REVIEW 3 of 14
respectively. The subsequent hydrothermal post-treatment further decreased the TSS and VSS concentrations to 39,000 mg/L and 27,000 mg/L, respectively. In system-2, the TSS and VSS concentrations first substantially reduced to 43,000 mg/L and 31,000 mg/L after thermal pre-hydrolysis; then, further reduced to 36,700 mg/L and 25,500 mg/L after fermentation, respectively. These results indicated that both pre- and post- thermal hydrolysis processes efficiently hydrolyzed particulate organics. The thermal hydrolysis process alone (31–32%) had a superior effect on the reduction of suspended solids of SSO than fermentation alone (16–21%). Notably, a major portion of the solid reduction in system-2 was contributed by the pre-hydrolysis step. Nonetheless, overall solids removal efficiencies from both schemes were comparable despite the slight advantage showed in system-2 (41–44% vs 37–41%).
(a)
(b)
Figure 1. (a) The concentrations of suspended solids and (b) suspended solid reduction efficiency in raw, treated, and fermented SSO. (TSS: Total Suspended Solids, VSS: Volatile Suspended Solids)
0
10,000
20,000
30,000
40,000
50,000
60,000
70,000
Raw
Ferm
enta
tio
n
Hyd
roth
erm
al p
ost-
treat
men
t
Hyd
roth
erm
al p
re-
treat
men
t
Ferm
enta
tio
n
Susp
ende
d so
lid c
once
ntra
tion
(mg/
L)
TSS VSS
16
37
31
41
21
41
32
44
05
101520253035404550
Fermentation Hydrothermalpost-treatment
Hydrothermalpre-treatment
Fermentation
System-1 System-2
Perc
enta
ge o
f sus
pend
ed so
lids
redu
ctio
n (%
)
TSSVSS
Figure 1. (a) The concentrations of suspended solids and (b) suspended solid reduction efficiency inraw, treated, and fermented SSO. (TSS: Total Suspended Solids, VSS: Volatile Suspended Solids)
215
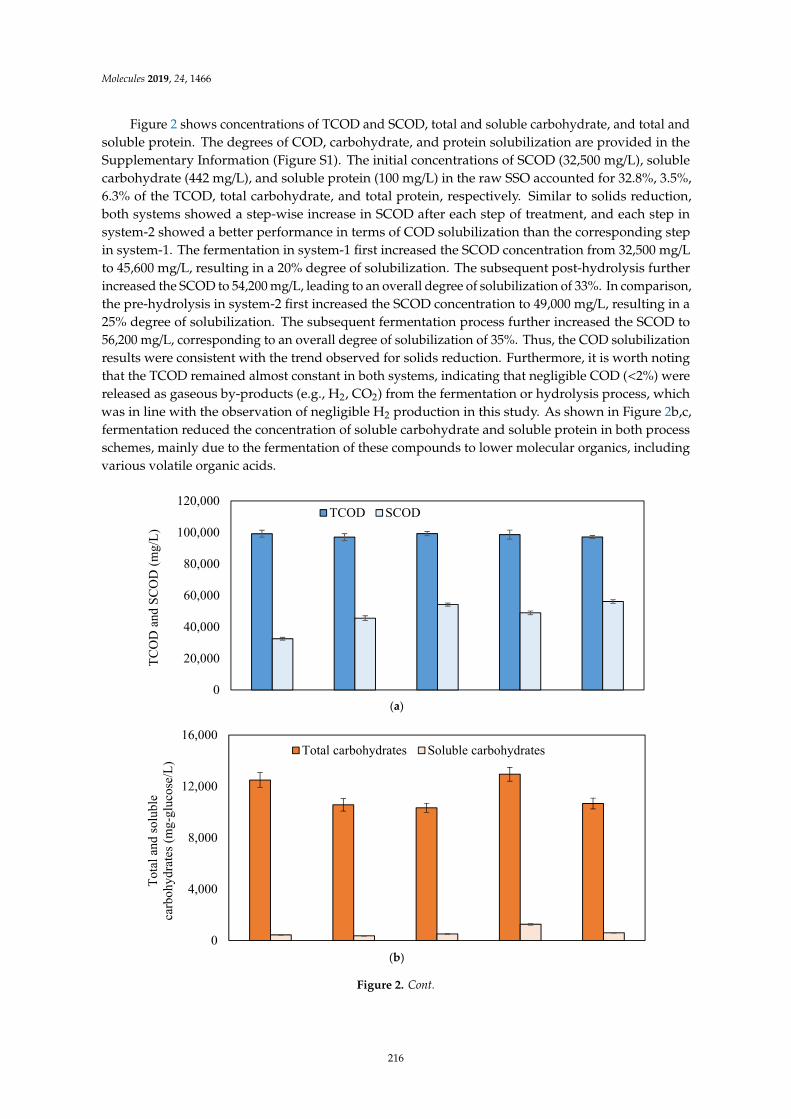
Molecules 2019, 24, 1466
Figure 2 shows concentrations of TCOD and SCOD, total and soluble carbohydrate, and total andsoluble protein. The degrees of COD, carbohydrate, and protein solubilization are provided in theSupplementary Information (Figure S1). The initial concentrations of SCOD (32,500 mg/L), solublecarbohydrate (442 mg/L), and soluble protein (100 mg/L) in the raw SSO accounted for 32.8%, 3.5%,6.3% of the TCOD, total carbohydrate, and total protein, respectively. Similar to solids reduction,both systems showed a step-wise increase in SCOD after each step of treatment, and each step insystem-2 showed a better performance in terms of COD solubilization than the corresponding stepin system-1. The fermentation in system-1 first increased the SCOD concentration from 32,500 mg/Lto 45,600 mg/L, resulting in a 20% degree of solubilization. The subsequent post-hydrolysis furtherincreased the SCOD to 54,200 mg/L, leading to an overall degree of solubilization of 33%. In comparison,the pre-hydrolysis in system-2 first increased the SCOD concentration to 49,000 mg/L, resulting in a25% degree of solubilization. The subsequent fermentation process further increased the SCOD to56,200 mg/L, corresponding to an overall degree of solubilization of 35%. Thus, the COD solubilizationresults were consistent with the trend observed for solids reduction. Furthermore, it is worth notingthat the TCOD remained almost constant in both systems, indicating that negligible COD (<2%) werereleased as gaseous by-products (e.g., H2, CO2) from the fermentation or hydrolysis process, whichwas in line with the observation of negligible H2 production in this study. As shown in Figure 2b,c,fermentation reduced the concentration of soluble carbohydrate and soluble protein in both processschemes, mainly due to the fermentation of these compounds to lower molecular organics, includingvarious volatile organic acids.
Molecules 2019, 23, x FOR PEER REVIEW 4 of 14
Figure 2 shows concentrations of TCOD and SCOD, total and soluble carbohydrate, and total and soluble protein. The degrees of COD, carbohydrate, and protein solubilization are provided in the Supplementary Information (Figure S1). The initial concentrations of SCOD (32,500 mg/L), soluble carbohydrate (442 mg/L), and soluble protein (100 mg/L) in the raw SSO accounted for 32.8%, 3.5%, 6.3% of the TCOD, total carbohydrate, and total protein, respectively. Similar to solids reduction, both systems showed a step-wise increase in SCOD after each step of treatment, and each step in system-2 showed a better performance in terms of COD solubilization than the corresponding step in system-1. The fermentation in system-1 first increased the SCOD concentration from 32,500 mg/L to 45,600 mg/L, resulting in a 20% degree of solubilization. The subsequent post-hydrolysis further increased the SCOD to 54,200 mg/L, leading to an overall degree of solubilization of 33%. In comparison, the pre-hydrolysis in system-2 first increased the SCOD concentration to 49,000 mg/L, resulting in a 25% degree of solubilization. The subsequent fermentation process further increased the SCOD to 56,200 mg/L, corresponding to an overall degree of solubilization of 35%. Thus, the COD solubilization results were consistent with the trend observed for solids reduction. Furthermore, it is worth noting that the TCOD remained almost constant in both systems, indicating that negligible COD (<2%) were released as gaseous by-products (e.g., H2, CO2) from the fermentation or hydrolysis process, which was in line with the observation of negligible H2 production in this study. As shown in Figure 2b,c, fermentation reduced the concentration of soluble carbohydrate and soluble protein in both process schemes, mainly due to the fermentation of these compounds to lower molecular organics, including various volatile organic acids.
(a)
(b)
0
20,000
40,000
60,000
80,000
100,000
120,000
TCO
D a
nd S
COD
(mg/
L)
TCOD SCOD
0
4,000
8,000
12,000
16,000
Tota
l and
solu
ble
ca
rboh
ydra
tes (
mg-
gluc
ose/
L)
Total carbohydrates Soluble carbohydrates
Figure 2. Cont.
216
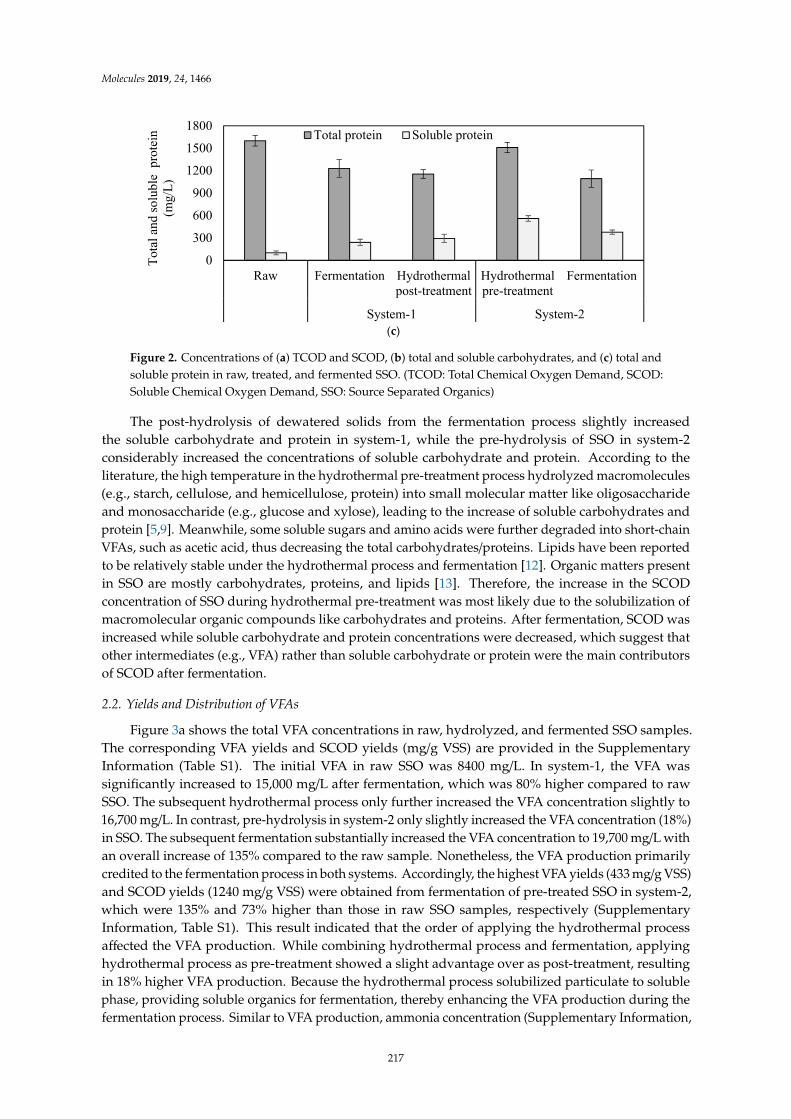
Molecules 2019, 24, 1466Molecules 2019, 23, x FOR PEER REVIEW 5 of 14
(c)
Figure 2. Concentrations of (a) TCOD and SCOD, (b) total and soluble carbohydrates, and (c) total and soluble protein in raw, treated, and fermented SSO. (TCOD: Total Chemical Oxygen Demand, SCOD: Soluble Chemical Oxygen Demand, SSO: Source Separated Organics)
The post-hydrolysis of dewatered solids from the fermentation process slightly increased the soluble carbohydrate and protein in system-1, while the pre-hydrolysis of SSO in system-2 considerably increased the concentrations of soluble carbohydrate and protein. According to the literature, the high temperature in the hydrothermal pre-treatment process hydrolyzed macromolecules (e.g., starch, cellulose, and hemicellulose, protein) into small molecular matter like oligosaccharide and monosaccharide (e.g., glucose and xylose), leading to the increase of soluble carbohydrates and protein [5,9]. Meanwhile, some soluble sugars and amino acids were further degraded into short-chain VFAs, such as acetic acid, thus decreasing the total carbohydrates/proteins. Lipids have been reported to be relatively stable under the hydrothermal process and fermentation [12]. Organic matters present in SSO are mostly carbohydrates, proteins, and lipids [13]. Therefore, the increase in the SCOD concentration of SSO during hydrothermal pre-treatment was most likely due to the solubilization of macromolecular organic compounds like carbohydrates and proteins. After fermentation, SCOD was increased while soluble carbohydrate and protein concentrations were decreased, which suggest that other intermediates (e.g., VFA) rather than soluble carbohydrate or protein were the main contributors of SCOD after fermentation.
2.2. Yields and Distribution of VFAs
Figure 3a shows the total VFA concentrations in raw, hydrolyzed, and fermented SSO samples. The corresponding VFA yields and SCOD yields (mg/g VSS) are provided in the Supplementary Information (Table S1). The initial VFA in raw SSO was 8400 mg/L. In system-1, the VFA was significantly increased to 15,000 mg/L after fermentation, which was 80% higher compared to raw SSO. The subsequent hydrothermal process only further increased the VFA concentration slightly to 16,700 mg/L. In contrast, pre-hydrolysis in system-2 only slightly increased the VFA concentration (18%) in SSO. The subsequent fermentation substantially increased the VFA concentration to 19,700 mg/L with an overall increase of 135% compared to the raw sample. Nonetheless, the VFA production primarily credited to the fermentation process in both systems. Accordingly, the highest VFA yields (433 mg/g VSS) and SCOD yields (1240 mg/g VSS) were obtained from fermentation of pre-treated SSO in system-2, which were 135% and 73% higher than those in raw SSO samples, respectively (Supplementary Information, Table S1). This result indicated that the order of applying the hydrothermal process affected the VFA production. While combining hydrothermal process and fermentation, applying hydrothermal process as pre-treatment showed a slight advantage over as post-treatment, resulting in 18% higher VFA production. Because the hydrothermal process solubilized particulate to soluble phase, providing soluble organics for fermentation, thereby
0
300
600
900
1200
1500
1800
Raw Fermentation Hydrothermalpost-treatment
Hydrothermalpre-treatment
Fermentation
System-1 System-2
Tota
l and
solu
ble
pro
tein
(m
g/L)
Total protein Soluble protein
Figure 2. Concentrations of (a) TCOD and SCOD, (b) total and soluble carbohydrates, and (c) total andsoluble protein in raw, treated, and fermented SSO. (TCOD: Total Chemical Oxygen Demand, SCOD:Soluble Chemical Oxygen Demand, SSO: Source Separated Organics)
The post-hydrolysis of dewatered solids from the fermentation process slightly increasedthe soluble carbohydrate and protein in system-1, while the pre-hydrolysis of SSO in system-2considerably increased the concentrations of soluble carbohydrate and protein. According to theliterature, the high temperature in the hydrothermal pre-treatment process hydrolyzed macromolecules(e.g., starch, cellulose, and hemicellulose, protein) into small molecular matter like oligosaccharideand monosaccharide (e.g., glucose and xylose), leading to the increase of soluble carbohydrates andprotein [5,9]. Meanwhile, some soluble sugars and amino acids were further degraded into short-chainVFAs, such as acetic acid, thus decreasing the total carbohydrates/proteins. Lipids have been reportedto be relatively stable under the hydrothermal process and fermentation [12]. Organic matters presentin SSO are mostly carbohydrates, proteins, and lipids [13]. Therefore, the increase in the SCODconcentration of SSO during hydrothermal pre-treatment was most likely due to the solubilization ofmacromolecular organic compounds like carbohydrates and proteins. After fermentation, SCOD wasincreased while soluble carbohydrate and protein concentrations were decreased, which suggest thatother intermediates (e.g., VFA) rather than soluble carbohydrate or protein were the main contributorsof SCOD after fermentation.
2.2. Yields and Distribution of VFAs
Figure 3a shows the total VFA concentrations in raw, hydrolyzed, and fermented SSO samples.The corresponding VFA yields and SCOD yields (mg/g VSS) are provided in the SupplementaryInformation (Table S1). The initial VFA in raw SSO was 8400 mg/L. In system-1, the VFA wassignificantly increased to 15,000 mg/L after fermentation, which was 80% higher compared to rawSSO. The subsequent hydrothermal process only further increased the VFA concentration slightly to16,700 mg/L. In contrast, pre-hydrolysis in system-2 only slightly increased the VFA concentration (18%)in SSO. The subsequent fermentation substantially increased the VFA concentration to 19,700 mg/L withan overall increase of 135% compared to the raw sample. Nonetheless, the VFA production primarilycredited to the fermentation process in both systems. Accordingly, the highest VFA yields (433 mg/g VSS)and SCOD yields (1240 mg/g VSS) were obtained from fermentation of pre-treated SSO in system-2,which were 135% and 73% higher than those in raw SSO samples, respectively (SupplementaryInformation, Table S1). This result indicated that the order of applying the hydrothermal processaffected the VFA production. While combining hydrothermal process and fermentation, applyinghydrothermal process as pre-treatment showed a slight advantage over as post-treatment, resultingin 18% higher VFA production. Because the hydrothermal process solubilized particulate to solublephase, providing soluble organics for fermentation, thereby enhancing the VFA production during thefermentation process. Similar to VFA production, ammonia concentration (Supplementary Information,
217

Molecules 2019, 24, 1466
Figure S2) was substantially increased after fermentation, indicating the effective degradation oforganic nitrogen (protein) during fermentation.
Molecules 2019, 23, x FOR PEER REVIEW 6 of 14
(a)
(b)
(c)
Figure 3. (a) The concentration of VFA, (b) distribution of SCOD component in raw, treated, and fermented SSO samples, and (c) composition of VFA in fermented SSO samples. (SCOD: Soluble Chemical Oxygen Demand, VFA: Volatile Fatty Acids, SSO: Source Separated Organics)
0
5,000
10,000
15,000
20,000
25,000
Raw Fermentation Hydrothermalpost-treatment
Hydrothermalpre-treatment
Fermentation
System-1 System-2
Tota
l VFA
con
cent
ratio
n (m
g/L)
0%
20%
40%
60%
80%
100%
Raw Fermentation Hydrothermalpost-treatment
Hydrothermalpre-treatment
Fermentation
System-1 System-2
Dist
ribut
ion
of S
COD
(%)
Other SCOD Soluble protein Soluble carbohydrate VFA
0%
20%
40%
60%
80%
100%
System-1 System-2
VFA
com
posit
ion
(%)
ValericIsovalericButyricIsobutyricPropionic
Figure 3. (a) The concentration of VFA, (b) distribution of SCOD component in raw, treated, andfermented SSO samples, and (c) composition of VFA in fermented SSO samples. (SCOD: SolubleChemical Oxygen Demand, VFA: Volatile Fatty Acids, SSO: Source Separated Organics)
The highest VFA yield (433 mg/g VSS) attained in this study was further compared to thoseobtained in other studies. As shown in Table 1, VFA yields varied with operating conditions, such
218
Molecules 2019, 24, 1466
as hydrothermal temperature and holding time, and fermentation temperature and retention time.The substrate sources also had large impacts on VFA yields. Nonetheless, the VFA yield in this studyis comparable to that reported by Ding et al., [12], but higher than that achieved by Li and Jin [14]and lower than those obtained by Yin et al., [10] and Yu et al., [11]. However, the VFA yield of SSOcould be further improved by optimising other factors, such as HRT of fermentation, which should beinvestigated in future research.
Figure 3b shows the distribution of SCOD component in the raw, hydrolyzed, and fermented SSOsamples based on the organic compounds, including VFA, soluble carbohydrate, and soluble protein.Among the soluble end products, VFA was the major contributor (56%) of SCOD after fermentation inboth process schemes. In contrast, other SCOD rather than VFA was the main contributor (67%) ofSCOD after pre-hydrolysis in system-2. In addition to soluble carbohydrates and soluble protein, othersoluble SCOD may include alcohols, other organic acids, poly-phenols, furfural, etc. [9,15].
Figure 3c shows the composition of VFA in the fermented SSO samples from system-1 and system-2.In system-1, acetate (35%) and butyrate (30%) were the main products with a small production ofpropionate (12%). In system-2, besides the dominance of acetate (26%) and butyrate (22%), propionate(30%) was substantially increased compared to that in system-1. The difference in VFA compositionsindicated that there might be different metabolic pathways for VFA production after pre-hydrolysisin system-2. According to the literature, acetate and butyrate were mainly produced from glucosefermentation [16]. Each glucose unit could be converted into either two acetate units and fourhydrogen units via the acetate pathway or into one butyrate unit and two hydrogen via the butyratepathway [17]. In contrast, propionate was mainly produced from the fermentation of amino acids [18]or various H2-consumption pathways [19]. Thus, the higher propionate fraction in system-2 might beproduced by amino acid fermentation bacteria or by H2-consumption propionate producing bacteria.The dominance of propionate in VFAs has also been previously reported after the fermentation ofthermally pretreated kitchen waste [14]. Meanwhile, previous studies have also shown that VFAcomposition in fermentation was highly dependent on the type of waste [12]. SSO characteristicsmarkedly varied given the differences in origin, dietary customs, and collecting sites and seasons [20].Therefore, the composition of VFAs in this study could be influenced by SSO characteristics.
Table 1. Comparison of VFA yield in this study to literature.
SubstrateHydrothermal
ProcessCondition
HydrothermalProcess
Severity Index
FermentationCondition VFA Yield Increase in
VFA Reference
Food wastefrom canteen 160 C, 30 min 3.2 Batch, 30 C,
15 days 910 mg/g VSremoved 55% [10]
Restaurant,canteen, dininghall food waste
160 C, 20 min 3.1 Batch, Fermentation:35 C, 48 h 450 mg/g vs. 240% [12]
Food wastefrom canteen 160 C, 30 min 3.2 Batch, 30 C,
21 days740 mg/g
VSSremoved130% [11]
Kitchen wastefrom canteen 120 C, 50 min 2.3 Batch, 35 C,
21 days 32 mg/g vs. No increase [14]
Kitchen wastefrom canteen
160 C, 120 min 3.8 -280 mmol/L
120% [21]1.6 mmol/gVSS
SSO 170 C, 30 min 3.5Semi-continuous,
fed once a day,38 C, HRT = 3 days
433 mg/gVSS135% This study
570 mg/gVSSremoved
Note: Severity Index = log exp[(T − 100)/14.75] × t , where T is the pretreatment temperature (C), and t is theholding time (min) [13].
2.3. Microbial Community
Bacterial community at the phylum level and genus level is shown in Figure 4. At the phylumlevel, Firmicutes was the most dominant one in both samples, but was considerably higher in relativeabundance in the sample from system-2 (54% vs. 70%) (Figure 4a). Firmicutes contains various
219
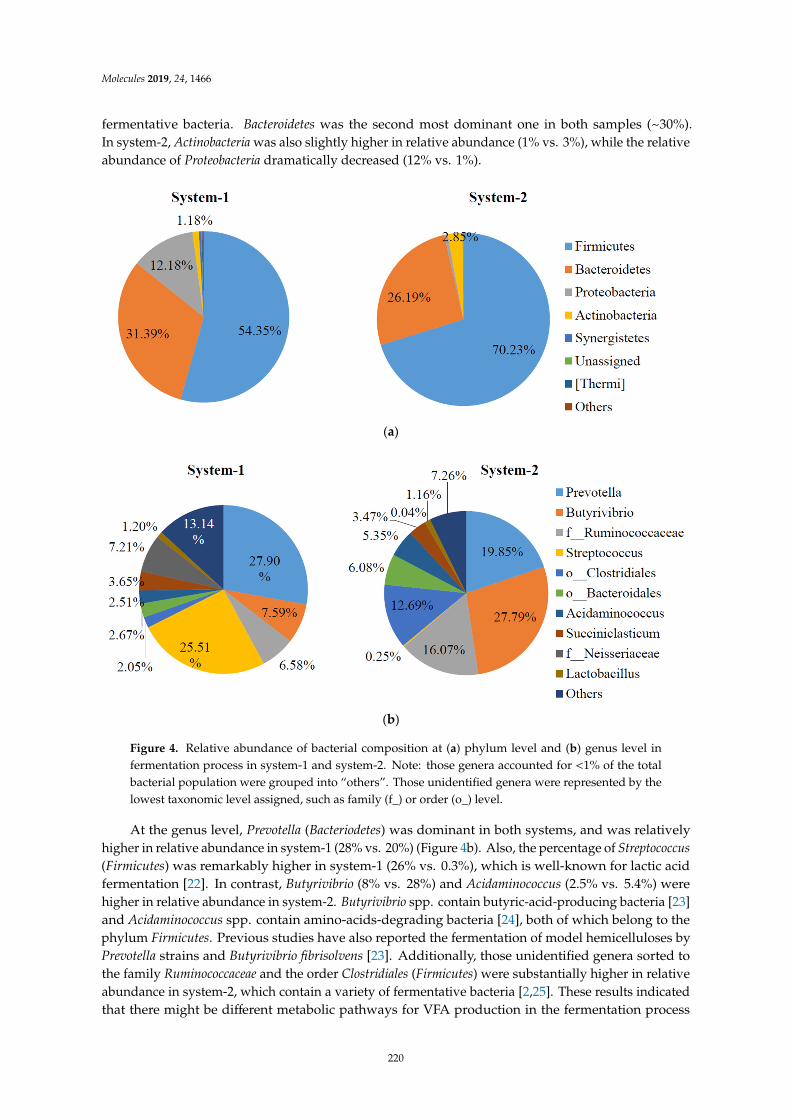
Molecules 2019, 24, 1466
fermentative bacteria. Bacteroidetes was the second most dominant one in both samples (~30%).In system-2, Actinobacteria was also slightly higher in relative abundance (1% vs. 3%), while the relativeabundance of Proteobacteria dramatically decreased (12% vs. 1%).
Molecules 2019, 23, x FOR PEER REVIEW 8 of 14
Semi-continuous,
fed once a day, 38 °C, HRT = 3
days
570 mg/gVSSremoved
This study
Note: Severity Index = log exp[(T − 100)/14.75] × t , where T is the pretreatment temperature (°C), and t is the holding time (min) [13].
2.3. Microbial Community
Bacterial community at the phylum level and genus level is shown in Figure 4. At the phylum level, Firmicutes was the most dominant one in both samples, but was considerably higher in relative abundance in the sample from system-2 (54% vs. 70%) (Figure 4a). Firmicutes contains various fermentative bacteria. Bacteroidetes was the second most dominant one in both samples (~30%). In system-2, Actinobacteria was also slightly higher in relative abundance (1% vs. 3%), while the relative abundance of Proteobacteria dramatically decreased (12% vs. 1%).
(a)
(b)
Figure 4. Relative abundance of bacterial composition at (a) phylum level and (b) genus level in fermentation process in system-1 and system-2. Note: those genera accounted for <1% of the total bacterial population were grouped into “others”. Those unidentified genera were represented by the lowest taxonomic level assigned, such as family (f_) or order (o_) level.
Figure 4. Relative abundance of bacterial composition at (a) phylum level and (b) genus level infermentation process in system-1 and system-2. Note: those genera accounted for <1% of the totalbacterial population were grouped into “others”. Those unidentified genera were represented by thelowest taxonomic level assigned, such as family (f_) or order (o_) level.
At the genus level, Prevotella (Bacteriodetes) was dominant in both systems, and was relativelyhigher in relative abundance in system-1 (28% vs. 20%) (Figure 4b). Also, the percentage of Streptococcus(Firmicutes) was remarkably higher in system-1 (26% vs. 0.3%), which is well-known for lactic acidfermentation [22]. In contrast, Butyrivibrio (8% vs. 28%) and Acidaminococcus (2.5% vs. 5.4%) werehigher in relative abundance in system-2. Butyrivibrio spp. contain butyric-acid-producing bacteria [23]and Acidaminococcus spp. contain amino-acids-degrading bacteria [24], both of which belong to thephylum Firmicutes. Previous studies have also reported the fermentation of model hemicelluloses byPrevotella strains and Butyrivibrio fibrisolvens [23]. Additionally, those unidentified genera sorted tothe family Ruminococcaceae and the order Clostridiales (Firmicutes) were substantially higher in relativeabundance in system-2, which contain a variety of fermentative bacteria [2,25]. These results indicatedthat there might be different metabolic pathways for VFA production in the fermentation process
220
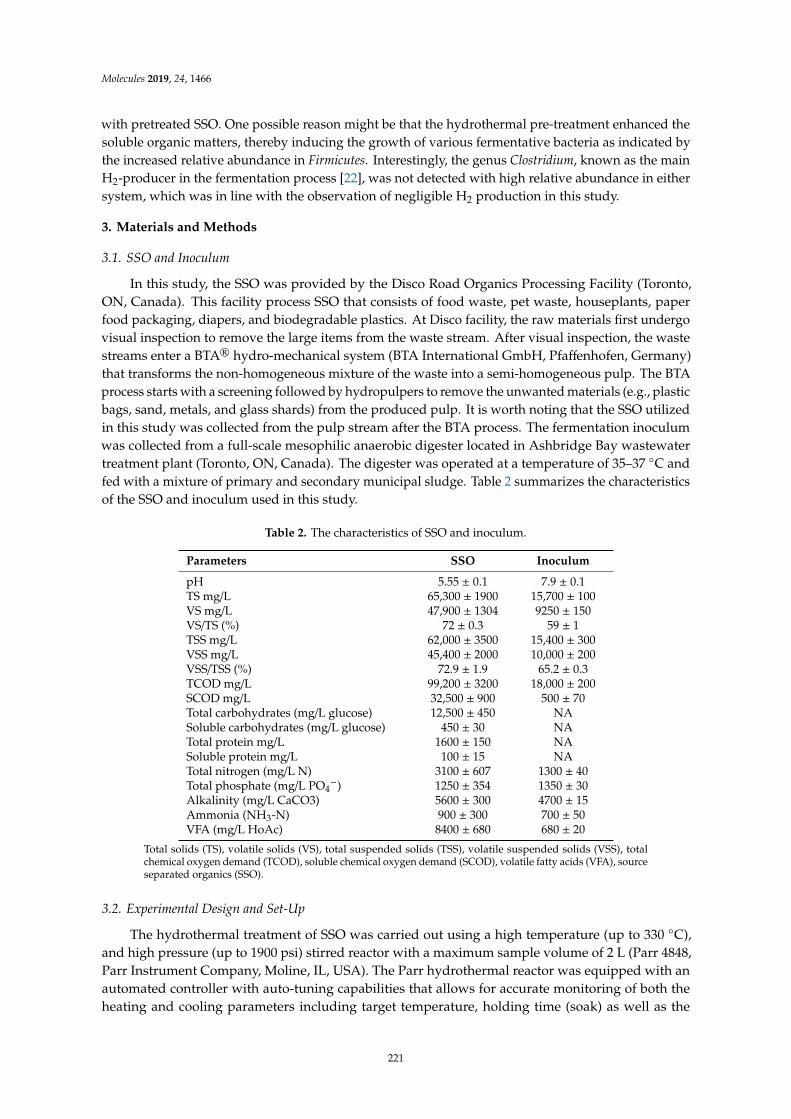
Molecules 2019, 24, 1466
with pretreated SSO. One possible reason might be that the hydrothermal pre-treatment enhanced thesoluble organic matters, thereby inducing the growth of various fermentative bacteria as indicated bythe increased relative abundance in Firmicutes. Interestingly, the genus Clostridium, known as the mainH2-producer in the fermentation process [22], was not detected with high relative abundance in eithersystem, which was in line with the observation of negligible H2 production in this study.
3. Materials and Methods
3.1. SSO and Inoculum
In this study, the SSO was provided by the Disco Road Organics Processing Facility (Toronto,ON, Canada). This facility process SSO that consists of food waste, pet waste, houseplants, paperfood packaging, diapers, and biodegradable plastics. At Disco facility, the raw materials first undergovisual inspection to remove the large items from the waste stream. After visual inspection, the wastestreams enter a BTA® hydro-mechanical system (BTA International GmbH, Pfaffenhofen, Germany)that transforms the non-homogeneous mixture of the waste into a semi-homogeneous pulp. The BTAprocess starts with a screening followed by hydropulpers to remove the unwanted materials (e.g., plasticbags, sand, metals, and glass shards) from the produced pulp. It is worth noting that the SSO utilizedin this study was collected from the pulp stream after the BTA process. The fermentation inoculumwas collected from a full-scale mesophilic anaerobic digester located in Ashbridge Bay wastewatertreatment plant (Toronto, ON, Canada). The digester was operated at a temperature of 35–37 C andfed with a mixture of primary and secondary municipal sludge. Table 2 summarizes the characteristicsof the SSO and inoculum used in this study.
Table 2. The characteristics of SSO and inoculum.
Parameters SSO Inoculum
pH 5.55 ± 0.1 7.9 ± 0.1TS mg/L 65,300 ± 1900 15,700 ± 100VS mg/L 47,900 ± 1304 9250 ± 150VS/TS (%) 72 ± 0.3 59 ± 1TSS mg/L 62,000 ± 3500 15,400 ± 300VSS mg/L 45,400 ± 2000 10,000 ± 200VSS/TSS (%) 72.9 ± 1.9 65.2 ± 0.3TCOD mg/L 99,200 ± 3200 18,000 ± 200SCOD mg/L 32,500 ± 900 500 ± 70Total carbohydrates (mg/L glucose) 12,500 ± 450 NASoluble carbohydrates (mg/L glucose) 450 ± 30 NATotal protein mg/L 1600 ± 150 NASoluble protein mg/L 100 ± 15 NATotal nitrogen (mg/L N) 3100 ± 607 1300 ± 40Total phosphate (mg/L PO4
−) 1250 ± 354 1350 ± 30Alkalinity (mg/L CaCO3) 5600 ± 300 4700 ± 15Ammonia (NH3-N) 900 ± 300 700 ± 50VFA (mg/L HoAc) 8400 ± 680 680 ± 20
Total solids (TS), volatile solids (VS), total suspended solids (TSS), volatile suspended solids (VSS), totalchemical oxygen demand (TCOD), soluble chemical oxygen demand (SCOD), volatile fatty acids (VFA), sourceseparated organics (SSO).
3.2. Experimental Design and Set-Up
The hydrothermal treatment of SSO was carried out using a high temperature (up to 330 C),and high pressure (up to 1900 psi) stirred reactor with a maximum sample volume of 2 L (Parr 4848,Parr Instrument Company, Moline, IL, USA). The Parr hydrothermal reactor was equipped with anautomated controller with auto-tuning capabilities that allows for accurate monitoring of both theheating and cooling parameters including target temperature, holding time (soak) as well as the
221
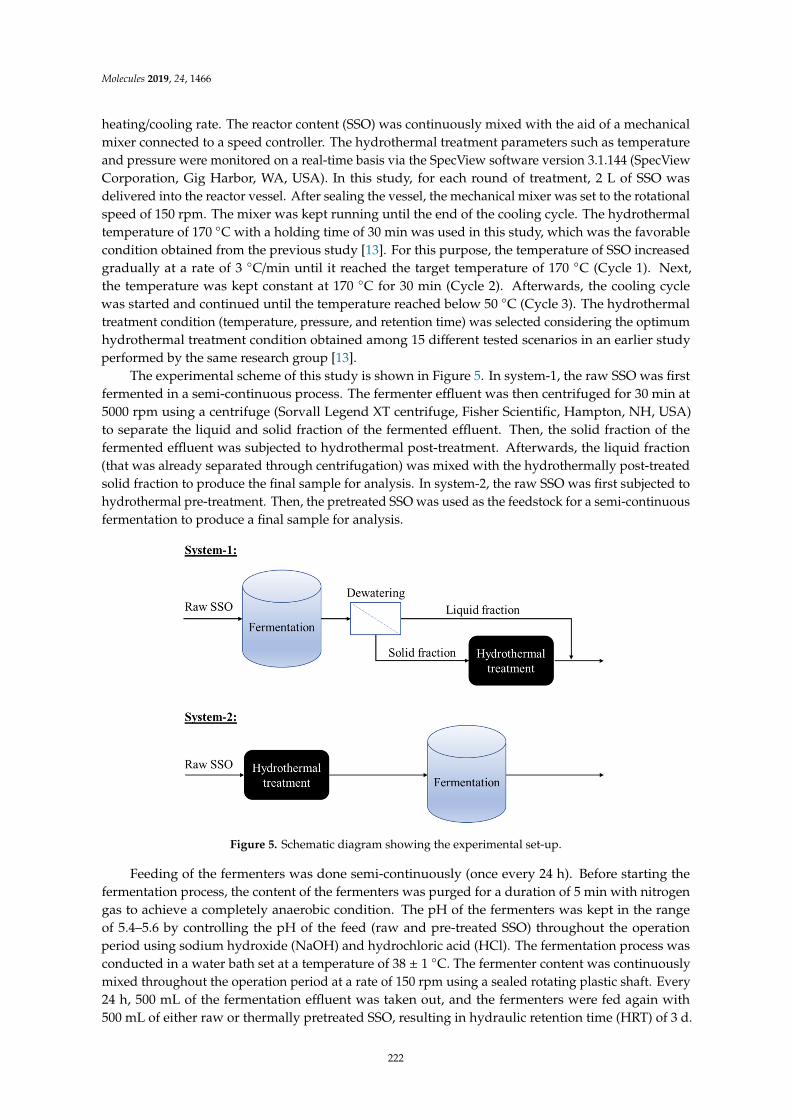
Molecules 2019, 24, 1466
heating/cooling rate. The reactor content (SSO) was continuously mixed with the aid of a mechanicalmixer connected to a speed controller. The hydrothermal treatment parameters such as temperatureand pressure were monitored on a real-time basis via the SpecView software version 3.1.144 (SpecViewCorporation, Gig Harbor, WA, USA). In this study, for each round of treatment, 2 L of SSO wasdelivered into the reactor vessel. After sealing the vessel, the mechanical mixer was set to the rotationalspeed of 150 rpm. The mixer was kept running until the end of the cooling cycle. The hydrothermaltemperature of 170 C with a holding time of 30 min was used in this study, which was the favorablecondition obtained from the previous study [13]. For this purpose, the temperature of SSO increasedgradually at a rate of 3 C/min until it reached the target temperature of 170 C (Cycle 1). Next,the temperature was kept constant at 170 C for 30 min (Cycle 2). Afterwards, the cooling cyclewas started and continued until the temperature reached below 50 C (Cycle 3). The hydrothermaltreatment condition (temperature, pressure, and retention time) was selected considering the optimumhydrothermal treatment condition obtained among 15 different tested scenarios in an earlier studyperformed by the same research group [13].
The experimental scheme of this study is shown in Figure 5. In system-1, the raw SSO was firstfermented in a semi-continuous process. The fermenter effluent was then centrifuged for 30 min at5000 rpm using a centrifuge (Sorvall Legend XT centrifuge, Fisher Scientific, Hampton, NH, USA)to separate the liquid and solid fraction of the fermented effluent. Then, the solid fraction of thefermented effluent was subjected to hydrothermal post-treatment. Afterwards, the liquid fraction(that was already separated through centrifugation) was mixed with the hydrothermally post-treatedsolid fraction to produce the final sample for analysis. In system-2, the raw SSO was first subjected tohydrothermal pre-treatment. Then, the pretreated SSO was used as the feedstock for a semi-continuousfermentation to produce a final sample for analysis.Molecules 2019, 23, x FOR PEER REVIEW 11 of 14
Figure 5. Schematic diagram showing the experimental set-up.
Feeding of the fermenters was done semi-continuously (once every 24 h). Before starting the fermentation process, the content of the fermenters was purged for a duration of 5 min with nitrogen gas to achieve a completely anaerobic condition. The pH of the fermenters was kept in the range of 5.4–5.6 by controlling the pH of the feed (raw and pre-treated SSO) throughout the operation period using sodium hydroxide (NaOH) and hydrochloric acid (HCl). The fermentation process was conducted in a water bath set at a temperature of 38 ± 1 °C. The fermenter content was continuously mixed throughout the operation period at a rate of 150 rpm using a sealed rotating plastic shaft. Every 24 h, 500 mL of the fermentation effluent was taken out, and the fermenters were fed again with 500 mL of either raw or thermally pretreated SSO, resulting in hydraulic retention time (HRT) of 3 d. The feeding and decanting of the fermenters were done manually using a 500 mL aluminum syringe. Both the raw and thermally pretreated fermenters were operated for an initial period of 20 days to reach a steady-state condition and then the operation was continued for an additional 30 days. Eight samples (twice a week) were taken for analyses during the steady-state period.
3.3. Analytical Methods
The measurement of the samples solid content in terms of total solids (TS), volatile solids (VS), total suspended solids (TSS), and volatile suspended solids (VSS) was performed according to the Standard Methods [26]. The analysis of chemical oxygen demand (COD) was done through the closed reflux colorimetric method outlined by the Standard Methods. The carbohydrates and protein determination was conducted according to the colorimetric methods developed by Dubios et al. [27] and Frolund et al. [28]. The absorbance measurement of the samples was done using a spectrophotometer (DR 3900, HACH, Loveland, CO, USA) with the wavelengths of 600, 595, 490, 560, 650, 394, and 542 nm for the analysis of COD, protein, carbohydrates, ammonia, alkalinity, total nitrogen, and total phosphate, respectively. The COD, protein, and carbohydrate analyses were performed on both the total and soluble phases of the samples. To collect the soluble fraction for analysis, the samples were first centrifuged at 9000 rpm for 30 min using a Sorvall Legend XT centrifuge. Next, the liquid fraction (supernatant) of the centrifuged samples were filtered through 0.45 µm microfiber filters. The concentration of the total VFAs was determined calorimetrically using the TNT 872 kit (HACH). The VFAs composition was determined using a gas chromatograph (Varian 8500, Varian Inc., Toronto, ON, Canada) equipped with a fused silica column (30 m × 0.32 mm) and a flame ionization detector. Helium was used at a constant flow rate of 5 mL/min as the carrier gas. The temperatures of the detector and column were set at 250 and 110 °C, respectively.
3.4. Microbial Community Analysis
Figure 5. Schematic diagram showing the experimental set-up.
Feeding of the fermenters was done semi-continuously (once every 24 h). Before starting thefermentation process, the content of the fermenters was purged for a duration of 5 min with nitrogengas to achieve a completely anaerobic condition. The pH of the fermenters was kept in the rangeof 5.4–5.6 by controlling the pH of the feed (raw and pre-treated SSO) throughout the operationperiod using sodium hydroxide (NaOH) and hydrochloric acid (HCl). The fermentation process wasconducted in a water bath set at a temperature of 38 ± 1 C. The fermenter content was continuouslymixed throughout the operation period at a rate of 150 rpm using a sealed rotating plastic shaft. Every24 h, 500 mL of the fermentation effluent was taken out, and the fermenters were fed again with500 mL of either raw or thermally pretreated SSO, resulting in hydraulic retention time (HRT) of 3 d.
222
Molecules 2019, 24, 1466
The feeding and decanting of the fermenters were done manually using a 500 mL aluminum syringe.Both the raw and thermally pretreated fermenters were operated for an initial period of 20 days toreach a steady-state condition and then the operation was continued for an additional 30 days. Eightsamples (twice a week) were taken for analyses during the steady-state period.
3.3. Analytical Methods
The measurement of the samples solid content in terms of total solids (TS), volatile solids (VS),total suspended solids (TSS), and volatile suspended solids (VSS) was performed according to theStandard Methods [26]. The analysis of chemical oxygen demand (COD) was done through theclosed reflux colorimetric method outlined by the Standard Methods. The carbohydrates and proteindetermination was conducted according to the colorimetric methods developed by Dubios et al. [27] andFrolund et al. [28]. The absorbance measurement of the samples was done using a spectrophotometer(DR 3900, HACH, Loveland, CO, USA) with the wavelengths of 600, 595, 490, 560, 650, 394, and542 nm for the analysis of COD, protein, carbohydrates, ammonia, alkalinity, total nitrogen, andtotal phosphate, respectively. The COD, protein, and carbohydrate analyses were performed on boththe total and soluble phases of the samples. To collect the soluble fraction for analysis, the sampleswere first centrifuged at 9000 rpm for 30 min using a Sorvall Legend XT centrifuge. Next, the liquidfraction (supernatant) of the centrifuged samples were filtered through 0.45 µm microfiber filters.The concentration of the total VFAs was determined calorimetrically using the TNT 872 kit (HACH).The VFAs composition was determined using a gas chromatograph (Varian 8500, Varian Inc., Toronto,ON, Canada) equipped with a fused silica column (30 m × 0.32 mm) and a flame ionization detector.Helium was used at a constant flow rate of 5 mL/min as the carrier gas. The temperatures of thedetector and column were set at 250 and 110 C, respectively.
3.4. Microbial Community Analysis
Microbial communities of the fermented effluent from both schemes were analyzed with highthroughput 16S rDNA sequencing. The genomic DNA of the biomass samples were extracted usingthe PowerSoil® DNA Isolation Kit (MoBio Laboratories, Carlsbad, CA, USA). The extracted DNAconcentrations were quantified using a spectrophotometer (NanoDrop 2000C, Thermo Fisher Scientific,Waltham, MA, USA). The extracted DNA samples were stored immediately at−70 C prior to performingIllumina Miseq sequencing at the Research and Testing Laboratory (Lubbock, TX, USA) using thebacterial primer set 357Wf: CCTACGGGNGGCWGCAG and 785R: GACTACHVGGGTATCTAATCCto target the 16S rDNA. The demultiplexed sequencing data were processed and analyzed using theQuantitative Insights Into Microbial Ecology (QIIME v2) software [29]. The sequences were denoised(dada2 method) to remove and/or correct noisy reads, remove chimeric sequences and singletons, andjoin denoised paired-end reads [30]. The denoised sequences were assigned to species-equivalentoperational taxonomic units (OTUs) at a 97% sequence similarity level using the open-reference OTUpicking method (vsearch method against 2013-08 Greengenes database) [31].
3.5. Calculations
The degree of solubilization of carbohydrate, protein, and COD were calculated to assess thehydrolysis efficiency (Equation (1)):
Degree of solubilization = (St − S0)/(T0 − S0) × 100% (1)
where, St is the concentration of soluble organic materials (carbohydrate, protein, or COD) in thetreated SSO (mg/L), S0 is the initial concentration of soluble organic materials in the raw SSO (mg/L),and T0 is the initial concentration of total organic materials in the raw SSO (mg/L).
223
Molecules 2019, 24, 1466
The yields of SCOD and VFA were calculated (Equation (2)):
Yield = St/VSS0, expressed as mg/g − VSS (2)
where, St is the final concentration of SCOD or VFA in the treated SSO (mg/L), and VSS0 is the initialconcentration of volatile suspended solids in the raw SSO (mg/L).
The conversion factors used for the calculation of COD of the carbohydrate (1.19 gCOD/g), protein(1.42 gCOD/g), acetate (1.07 gCOD/g), propionate (1.51 gCOD/g), butyrate (1.82 gCOD/g), and valerate(2.04 gCOD/g) were determined as previously described in the literature [32].
3.6. Statistical Analysis
The statistically significant effects of the independent variables (i.e., pretreatment temperature,pressure, and retention time) were tested by multi-factor analysis of variance (ANOVA) at a 95%confidence level (α = 0.05) using Minitab Software 17 (Minitab, LLC, State College, PA, USA).The ANOVA analysis was conducted by considering 2-level interaction effects of the independentvariables. The Fisher’s least significant difference analysis was used to compare all pairs of means.
4. Conclusions
The process schemes of pre- and post-hydrothermal treatment of SSO were successfully performedand compared for solids removal and VFA yields. Results showed that solubilization of organic mattersthrough pre-hydrolysis could boost subsequent acidogenic fermentation, resulting in an 18% increasein overall VFA yield over post-hydrolysis of fermented SSO. Both acetate and butyrate were dominantin both process schemes, while propionate was higher in the process with pre-hydrolysis. Meanwhile,various fermentative bacteria belonging to Firmicutes were higher in relative abundance in the processwith pre-hydrolysis of SSO, suggesting different metabolic pathways for VFA productions in bothprocess schemes.
Supplementary Materials: The following are available online. Table S1. Soluble chemical oxygen demand(SCOD) and volatile fatty acid (VFA) yields. Figure S1. (a) Suspended solid reduction efficiency and (b) degree ofsolubilization of COD, carbohydrate, and protein in system-1 and system-2. (TSS: Total Suspended Solids, VSS:Volatile Suspended Solids, COD: Chemical Oxygen Demand). Figure S2. Ammonia concentration of raw, treated,and fermented source separated organics (SSO) samples.
Author Contributions: Data curation, E.H.K.; Formal analysis, L.L., A.A. and A.A.B.L.; Funding acquisition,H.H.; Investigation, A.A. and A.A.B.L.; Resources, H.H.; Supervision, B.R.D. and E.E.; Validation, B.R.D. and E.E.;Writing—original draft, L.L.; Writing—review & editing, E.H.K.
Funding: This research was funded by Southern Ontario Water Consortium (SOWC), grant number SUB02523.
Acknowledgments: The authors would like to thank the Disco Road Organics Facility for providing theSSO samples.
Conflicts of Interest: The authors declare no conflict of interest. The funders had no role in the design of thestudy; in the collection, analyses, or interpretation of data; in the writing of the manuscript, or in the decision topublish the results.
References
1. Xu, F.; Li, Y.; Ge, X.; Yang, L.; Li, Y. Anaerobic digestion of food waste–challenges and opportunities.Bioresour. Technol. 2018, 247, 1047–1058. [CrossRef] [PubMed]
2. Paritosh, K.; Kushwaha, S.K.; Yadav, M.; Pareek, N.; Chawade, A.; Vivekanand, V. Food waste to energy:An overview of sustainable approaches for food waste management and nutrient recycling. Biomed. Res. Int.2017, 2017, 1–19. [CrossRef] [PubMed]
3. Luk, G.K.; Bekmuradov, V. Energy products from source-separated organic waste. WIT Trans. Ecol. Environ.2014, 180, 469–478.
224
Molecules 2019, 24, 1466
4. Hosseini Koupaie, E.; Azizi, A.; Bazyar Lakeh, A.A.; Hafez, H.; Elbeshbishy, E. Comparison of liquid anddewatered digestate as inoculum for anaerobic digestion of organic solid wastes. Waste Manag. 2019, 87,228–236.
5. Lee, W.S.; Chua, A.S.M.; Yeoh, H.K.; Ngoh, G.C. A review of the production and applications of waste-derivedvolatile fatty acids. Chem. Eng. J. 2014, 235, 83–99. [CrossRef]
6. Cesaro, A.; Belgiorno, V. Pretreatment methods to improve anaerobic biodegradability of organic municipalsolid waste fractions. Chem. Eng. J. 2014, 240, 24–37. [CrossRef]
7. Zheng, Y.; Zhao, J.; Xu, F.; Li, Y. Pretreatment of lignocellulosic biomass for enhanced biogas production.Prog. Energy Combust. Sci. 2014, 42, 35–53. [CrossRef]
8. Dhar, B.R.; Nakhla, G.; Ray, M.B. Techno-economic evaluation of ultrasound and thermal pretreatmentsfor enhanced anaerobic digestion of municipal waste activated sludge. Waste Manag. 2012, 32, 542–549.[CrossRef] [PubMed]
9. Ariunbaatar, J.; Panico, A.; Esposito, G.; Pirozzi, F.; Lens, P.N.L. Pretreatment methods to enhance anaerobicdigestion of organic solid waste. Appl. Energy 2014, 123, 143–156. [CrossRef]
10. Yin, J.; Wang, K.; Yang, Y.; Shen, D.; Wang, M.; Mo, H. Improving production of volatile fatty acids from foodwaste fermentation by hydrothermal pretreatment. Bioresour. Technol. 2014, 171, 323–329. [CrossRef]
11. Yu, X.; Yin, J.; Wang, K.; Shen, D.; Long, Y.; Chen, T. Enhancing Food Waste Hydrolysis and the ProductionRate of Volatile Fatty Acids by Prefermentation and Hydrothermal Pretreatments. Energy Fuels 2016, 30,4002–4008.
12. Ding, L.; Cheng, J.; Qiao, D.; Yue, L.; Li, Y.Y.; Zhou, J.; Cen, K. Investigating hydrothermal pretreatment offood waste for two-stage fermentative hydrogen and methane co-production. Bioresour. Technol. 2017, 241,491–499. [CrossRef] [PubMed]
13. Razavi, A.S.; Hosseini Koupaie, E.; Azizi, A.; Hafez, H.; Elbeshbishy, E. Hydrothermal pretreatment ofsource separated organics for enhanced solubilization and biomethane recovery. Bioresour. Technol. 2018, 274,502–511. [CrossRef] [PubMed]
14. Li, Y.; Jin, Y. Effects of thermal pretreatment on acidification phase during two-phase batch anaerobicdigestion of kitchen waste. Renew. Energy 2015, 77, 550–557. [CrossRef]
15. Dhar, B.R.; Elbeshbishy, E.; Hafez, H.; Lee, H.S. Hydrogen production from sugar beet juice using anintegrated biohydrogen process of dark fermentation and microbial electrolysis cell. Bioresour. Technol. 2015,198, 223–230. [CrossRef] [PubMed]
16. Xia, A.; Cheng, J.; Murphy, J.D. Innovation in biological production and upgrading of methane and hydrogenfor use as gaseous transport biofuel. Biotechnol. Adv. 2016, 34, 451–472. [CrossRef] [PubMed]
17. Elbeshbishy, E.; Hafez, H.; Dhar, B.R.; Nakhla, G. Single and combined effect of various pretreatment methodsfor biohydrogen production from food waste. Int. J. Hydrogen Energy 2011, 36, 11379–11387. [CrossRef]
18. Cheng, J.; Ding, L.; Xia, A.; Lin, R.; Li, Y.; Zhou, J.; Cen, K. Hydrogen production using amino acids obtainedby protein degradation in waste biomass by combined dark- and photo-fermentation. Bioresour. Technol.2015, 179, 13–19. [CrossRef]
19. Gonzalez-garcia, R.A.; Mccubbin, T.; Navone, L.; Stowers, C.; Nielsen, L.K.; Marcellin, E. Microbial PropionicAcid Production. Fermentation 2017, 3, 21. [CrossRef]
20. Sundberg, C.; Franke-Whittle, I.H.; Kauppi, S.; Yu, D.; Romantschuk, M.; Insam, H.; Jönsson, H.Characterisation of source-separated household waste intended for composting. Bioresour. Technol. 2011, 102,2859–2867. [CrossRef]
21. Jin, Y.; Li, Y.; Li, J. Influence of thermal pretreatment on physical and chemical properties of kitchen wasteand the efficiency of anaerobic digestion. J. Environ. Manag. 2016, 180, 291–300. [CrossRef] [PubMed]
22. Lee, H.S.; Krajmalinik-Brown, R.; Zhang, H.; Rittmann, B.E. An electron-flow model can predict complexredox reactions in mixed-culture fermentative BioH2: Microbial ecology evidence. Biotechnol. Bioeng. 2009,104, 687–697. [CrossRef] [PubMed]
23. Emerson, E.L.; Weimer, P.J. Fermentation of model hemicelluloses by Prevotella strains and Butyrivibriofibrisolvens in pure culture and in ruminal enrichment cultures. Appl. Microbiol. Biotechnol. 2017, 101,4269–4278. [CrossRef] [PubMed]
24. Rogosa, M. Acidaminococcus gen. n., Acidaminococcus fermentans sp. n., anaerobic gram-negativediplococci using amino acids as the sole energy source for growth. J. Bacteriol. 1969, 98, 756–766.
225

Molecules 2019, 24, 1466
25. Cabrol, L.; Marone, A.; Tapia-Venegas, E.; Steyer, J.; Ruiz-Filippi, G.; Trably, E. Microbial ecology offermentative hydrogen producing bioprocesses: useful insights for driving the ecosystem function.FEMS Microbiol. Rev. 2017, 41, 158–181. [CrossRef]
26. APHA. Standard Methods for the Examination of Water and Wastewater, 21st ed.; American Public HealthAssociation: Washington, DC, USA, 2005.
27. DuBois, M.; Gilles, K.A.; Hamilton, J.K.; Rebers, P.A.; Smith, F. Colorimetric Method for Determination ofSugars and Related Substances. Anal. Chem. 1956, 28, 350–356. [CrossRef]
28. Frolund, B.; Griebe, T.; Nielsen, P.H. Enzymatic activity in the activated-sludge floc matrix.Appl. Microbiol. Biotechnol. 1995, 43, 755–761. [CrossRef]
29. Caporaso, J.G.; Kuczynski, J.; Stombaugh, J.; Bittinger, K.; Bushman, F.D.; Costello, E.K.; Fierer, N.; Peña, A.G.;Goodrich, J.K.; Gordon, J.I.; et al. QIIME allows analysis of high-throughput community sequencing data.Nat. Methods 2010, 7, 335–336. [CrossRef]
30. Callahan, B.J.; McMurdie, P.J.; Rosen, M.J.; Han, A.W.; Johnson, A.J.A.; Holmes, S.P. DADA2: high-resolutionsample inference from Illumina amplicon data. Nat. Methods 2016, 13, 581–583. [CrossRef]
31. Rideout, J.R.; He, Y.; Navas-Molina, J.A.; Walters, W.A.; Ursell, L.K.; Gibbons, S.M.; Chase, J.; McDonald, D.;Gonzalez, A.; Robbins-Pianka, A.; et al. Subsampled open-reference clustering creates consistent,comprehensive OTU definitions and scales to billions of sequences. PeerJ. 2014, 2. [CrossRef]
32. Angelidaki, I.; Sanders, W. Assessment of the anaerobic biodegradability of macropollutants. Rev. Environ.Sci. Bio/Technology 2004, 3, 117–129. [CrossRef]
Sample Availability: Samples of the compounds are not available from the authors.
© 2019 by the authors. Licensee MDPI, Basel, Switzerland. This article is an open accessarticle distributed under the terms and conditions of the Creative Commons Attribution(CC BY) license (http://creativecommons.org/licenses/by/4.0/).
226
molecules
Article
The Effect of the Chemical Character of Ionic Liquidson Biomass Pre-Treatment and PosteriorEnzymatic Hydrolysis
Joana R. Bernardo, Francisco M. Gírio and Rafał M. Łukasik *
Unidade de Bioenergia, Laboratório Nacional de Energia e Geologia, I.P., Estrada do Paço do Lumiar 22,1649-038 Lisboa, Portugal; [email protected] (J.R.B.); [email protected] (F.M.G.)* Correspondence: [email protected]
Academic Editors: Ivet Ferrer, Cigdem Eskicioglu, Georgia Antonopoulou andAudrey BattimelliReceived: 3 February 2019; Accepted: 20 February 2019; Published: 23 February 2019
Abstract: Ionic liquids have been recognised as interesting solvents applicable in efficient lignocellulosicbiomass valorisation, especially in biomass fractionation into individual polymeric components ordirect hydrolysis of some biomass fractions. Considering the chemical character of ionic liquids, twodifferent approaches paved the way for the fractionation of biomass. The first strategy integrateda pre-treatment, hydrolysis and conversion of biomass through the employment of hydrogen-bondacidic 1-ethyl-3-methyimidazolim hydrogen sulphate ionic liquid. The second strategy relied onthe use of a three-step fractionation process with hydrogen-bond basic 1-ethyl-3-methylimidazoliumacetate to produce high purity cellulose, hemicellulose and lignin fractions. The proposed approacheswere scrutinised for wheat straw and eucalyptus residues. These different biomasses enabled anunderstanding that enzymatic hydrolysis yields are dependent on the crystallinity of the pre-treatedbiomass. The use of acetate based ionic liquid allowed crystalline cellulose I to change to cellulose II andconsequently enhanced the glucan to glucose yield to 93.1 ± 4.1 mol% and 82.9 ± 1.2 mol% for wheatstraw and eucalyptus, respectively. However, for hydrogen sulphate ionic liquid, the same enzymatichydrolysis yields were 61.6 ± 0.2 mol% for wheat straw and only 7.9 ± 0.3 mol% for eucalyptus residues.These results demonstrate the importance of both ionic liquid character and biomass type for efficientbiomass processing.
Keywords: biomass; valorisation; ionic liquid; crystallinity; enzymatic hydrolysis; pre-treatment
1. Introduction
Lignocellulosic biomass is a renewable, sustainable, abundant, and CO2 neutral alternative tofossil feedstock for a portfolio of fuels, chemicals and materials. Composed of crystalline cellulosenanofibrils embedded in an amorphous matrix of cross-linked lignin and hemicelluloses, lignocelluloseshows a natural recalcitrance that impedes enzyme and microbial accessibility, resulting in the relativelylow digestibility of raw lignocellulosic materials [1]. Thus, an efficient pre-treatment, and consequentlya deconstruction of the lignocellulosic biomass, makes these fractions susceptible for more favourabletransformation to value-added products [2,3]. However, many pre-treatment methods require harshconditions, especially temperature and/or pressure that often result in undesired by-products, whichdecrease the sugar yields and inhibit enzymatic hydrolysis and further bioconversion [2].
In recent years, ionic liquids (ILs) have gained increasing interest for biomass processing due totheir capacity to dissolve lignocellulosic biomass by an effective disruption of the complex networkof noncovalent interactions between carbohydrates and lignin [4–6]. A main function of IL inlignocellulosic biomass pre-treatment is the modification the fibrillary structure of cell walls in order
227
Molecules 2019, 24, 808
to: (i) decrease cellulose crystallinity, (ii) increase cellulose surface accessibility by the removal of ligninand/or hemicellulose, and (iii) promotion of a swelling effect of the biomass [7]. Imidazolium-basedILs are among the most extensively studied ILs and have demonstrated that either a cation or ananion is of considerable importance in biomass processing [8,9]. Swatloski et al. showed that ahigh concentration of chloride anions is effective in breaking down the hydrogen-bond network ofcellulose [10]. A similar effect was reported for the acetate ([OAc]) anion, which was demonstrated tobe efficient in the dissolution of lignocellulosic biomass [11]. It was reported that a key reason for thiswas the high hydrogen bond acceptor capacity (β) of the [OAc] anion (β = 1.201) in comparison topreviously mentioned chloride anion (β = 0.83) [12]. Due to this, 1-ethyl-3-methylimidazolium acetateIL is confirmed to be one of the best and is one of the most commonly used [13] ILs, able to dissolvea large variety of lignocellulosic biomass and to fractionate it into cellulose- and hemicellulose-richfractions, as well as to produce high pure lignin [9,14,15].
An alternative approach to biomass processing with ILs is the employment of ILs as both solventand catalyst. In these processes, ILs hydrolyse mainly polysaccharide fractions without the presenceof other catalysts [5,16,17]. Therefore, ILs with an acidic character have demonstrated an ability toselectively hydrolyse hemicellulose [18,19], both cellulose and hemicellulose [20], or lignin [21]. Someof the most commonly used ILs in such approaches are those based on hydrogen sulphate ([HSO4]).They are able to catalyse a selective hemicellulose hydrolysis [17–19]. Furthermore, [HSO4]-basedILs have been increasingly used because of their acidic properties and due to their low cost whencompared to other ILs [22]. The use of acidic IL, e.g., 1-butyl-3-methylimidazolium hydrogen sulphate,[bmim][HSO4], allowed achievement of up to 90% fermentable glucose after enzymatic saccharificationof the cellulose-rich Miscanthus pulp [18]. The same IL was also reported as being able to hydrolyseand to convert the hemicellulose fraction of wheat straw with no additional catalyst used [17].The pre-treatment with this IL produced a liquor enriched in hemicellulosic sugars, furans andorganic acids, and a solid fraction constituted mainly of cellulose and lignin. Furthermore, water wasconfirmed to have an influence on the equilibrium of the hemicellulose hydrolysis. The increase of thewater content close to 10% (w/w) in the reaction system disfavoured xylose dehydration, and thusallowed the production of hemicellulose-derived monosaccharides to increase significantly [19].
Building on previous works about the processing of biomass with hydrogen-bond basic([emim][OAc]) [11] and hydrogen-bond acidic ([emim][HSO4]) [17,19] ILs, this work aimed todemonstrate the importance of biomass type on the efficiency of the biomass pre-treatment, as wellas on the efficiency of subsequent enzymatic hydrolysis. This was examined using two very distincttypes of biomasses, namely, herbaceous (wheat straw) and hardwood Eucalyptus globulus, allowing theelucidation of changes observed in the chemical structure of the biomass, cellulose crystallinity andconsequently the effects of these on the cellulose-rich pulp hydrolysability.
2. Results and Discussion
2.1. Hydrogen-Bond Acidic IL
2.1.1. Biomass Pre-Treatment with [emim][HSO4]
The first methodology used focused on the biomass pre-treatment with [emim][HSO4]. As statedabove, this approach allowed the integration of biomass pre-treatment, hydrolysis and conversion in asingle-step process. The acidic character of the [HSO4] anion of IL, promoted a selective hydrolysis ofthe hemicellulose fraction, and the resulting products (mainly pentoses and furfural) were kept in theliquid phase. Both biomasses, wheat straw and eucalyptus residues, were subject to processing with[emim][HSO4] IL at 140 C for 90 min at varied [emim][HSO4]/H2O mass ratio and with fixed 10 wt.%of dry biomass in the reaction mixture.
The pentose and furfural yields obtained in these trials are depicted in Figure 1.
228
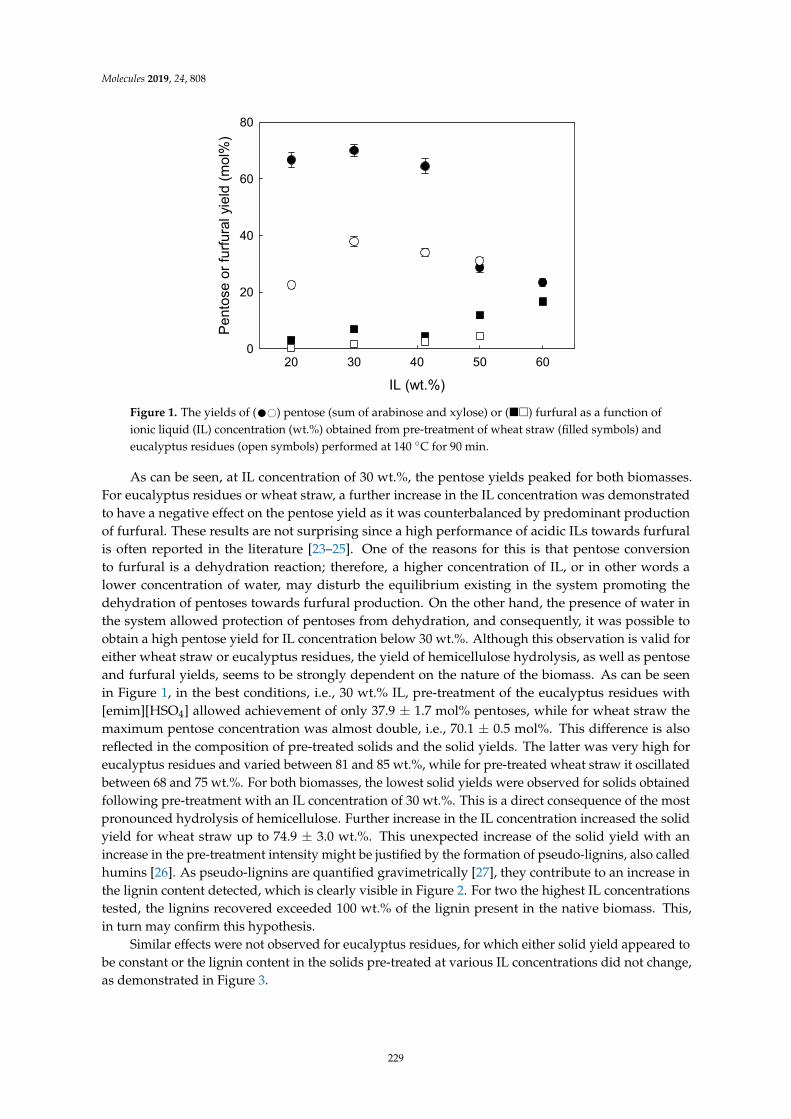
Molecules 2019, 24, 808Molecules 2019, 24, x 3 of 17
Figure 1. The yields of () pentose (sum of arabinose and xylose) or () furfural as a function of ionic liquid (IL) concentration (wt.%) obtained from pre-treatment of wheat straw (filled symbols) and eucalyptus residues (open symbols) performed at 140 °C for 90 min.
As can be seen, at IL concentration of 30 wt.%, the pentose yields peaked for both biomasses. For eucalyptus residues or wheat straw, a further increase in the IL concentration was demonstrated to have a negative effect on the pentose yield as it was counterbalanced by predominant production of furfural. These results are not surprising since a high performance of acidic ILs towards furfural is often reported in the literature [23–25]. One of the reasons for this is that pentose conversion to furfural is a dehydration reaction; therefore, a higher concentration of IL, or in other words a lower concentration of water, may disturb the equilibrium existing in the system promoting the dehydration of pentoses towards furfural production. On the other hand, the presence of water in the system allowed protection of pentoses from dehydration, and consequently, it was possible to obtain a high pentose yield for IL concentration below 30 wt.%. Although this observation is valid for either wheat straw or eucalyptus residues, the yield of hemicellulose hydrolysis, as well as pentose and furfural yields, seems to be strongly dependent on the nature of the biomass. As can be seen in Figure 1, in the best conditions, i.e., 30 wt.% IL, pre-treatment of the eucalyptus residues with [emim][HSO4] allowed achievement of only 37.9 ± 1.7 mol% pentoses, while for wheat straw the maximum pentose concentration was almost double, i.e., 70.1 ± 0.5 mol%. This difference is also reflected in the composition of pre-treated solids and the solid yields. The latter was very high for eucalyptus residues and varied between 81 and 85 wt.%, while for pre-treated wheat straw it oscillated between 68 and 75 wt.%. For both biomasses, the lowest solid yields were observed for solids obtained following pre-treatment with an IL concentration of 30 wt.%. This is a direct consequence of the most pronounced hydrolysis of hemicellulose. Further increase in the IL concentration increased the solid yield for wheat straw up to 74.9 ± 3.0 wt.%. This unexpected increase of the solid yield with an increase in the pre-treatment intensity might be justified by the formation of pseudo-lignins, also called humins [26]. As pseudo-lignins are quantified gravimetrically [27], they contribute to an increase in the lignin content detected, which is clearly visible in Figure 2. For two the highest IL concentrations tested, the lignins recovered exceeded 100 wt.% of the lignin present in the native biomass. This, in turn may confirm this hypothesis.
Similar effects were not observed for eucalyptus residues, for which either solid yield appeared to be constant or the lignin content in the solids pre-treated at various IL concentrations did not change, as demonstrated in Figure 3.
IL (wt.%)20 30 40 50 60
Pent
ose
or fu
rfura
l yie
ld (m
ol%
)
0
20
40
60
80
Figure 1. The yields of (•#) pentose (sum of arabinose and xylose) or () furfural as a function ofionic liquid (IL) concentration (wt.%) obtained from pre-treatment of wheat straw (filled symbols) andeucalyptus residues (open symbols) performed at 140 C for 90 min.
As can be seen, at IL concentration of 30 wt.%, the pentose yields peaked for both biomasses.For eucalyptus residues or wheat straw, a further increase in the IL concentration was demonstratedto have a negative effect on the pentose yield as it was counterbalanced by predominant productionof furfural. These results are not surprising since a high performance of acidic ILs towards furfuralis often reported in the literature [23–25]. One of the reasons for this is that pentose conversionto furfural is a dehydration reaction; therefore, a higher concentration of IL, or in other words alower concentration of water, may disturb the equilibrium existing in the system promoting thedehydration of pentoses towards furfural production. On the other hand, the presence of water inthe system allowed protection of pentoses from dehydration, and consequently, it was possible toobtain a high pentose yield for IL concentration below 30 wt.%. Although this observation is valid foreither wheat straw or eucalyptus residues, the yield of hemicellulose hydrolysis, as well as pentoseand furfural yields, seems to be strongly dependent on the nature of the biomass. As can be seenin Figure 1, in the best conditions, i.e., 30 wt.% IL, pre-treatment of the eucalyptus residues with[emim][HSO4] allowed achievement of only 37.9 ± 1.7 mol% pentoses, while for wheat straw themaximum pentose concentration was almost double, i.e., 70.1 ± 0.5 mol%. This difference is alsoreflected in the composition of pre-treated solids and the solid yields. The latter was very high foreucalyptus residues and varied between 81 and 85 wt.%, while for pre-treated wheat straw it oscillatedbetween 68 and 75 wt.%. For both biomasses, the lowest solid yields were observed for solids obtainedfollowing pre-treatment with an IL concentration of 30 wt.%. This is a direct consequence of the mostpronounced hydrolysis of hemicellulose. Further increase in the IL concentration increased the solidyield for wheat straw up to 74.9 ± 3.0 wt.%. This unexpected increase of the solid yield with anincrease in the pre-treatment intensity might be justified by the formation of pseudo-lignins, also calledhumins [26]. As pseudo-lignins are quantified gravimetrically [27], they contribute to an increase inthe lignin content detected, which is clearly visible in Figure 2. For two the highest IL concentrationstested, the lignins recovered exceeded 100 wt.% of the lignin present in the native biomass. This,in turn may confirm this hypothesis.
Similar effects were not observed for eucalyptus residues, for which either solid yield appeared tobe constant or the lignin content in the solids pre-treated at various IL concentrations did not change,as demonstrated in Figure 3.
229
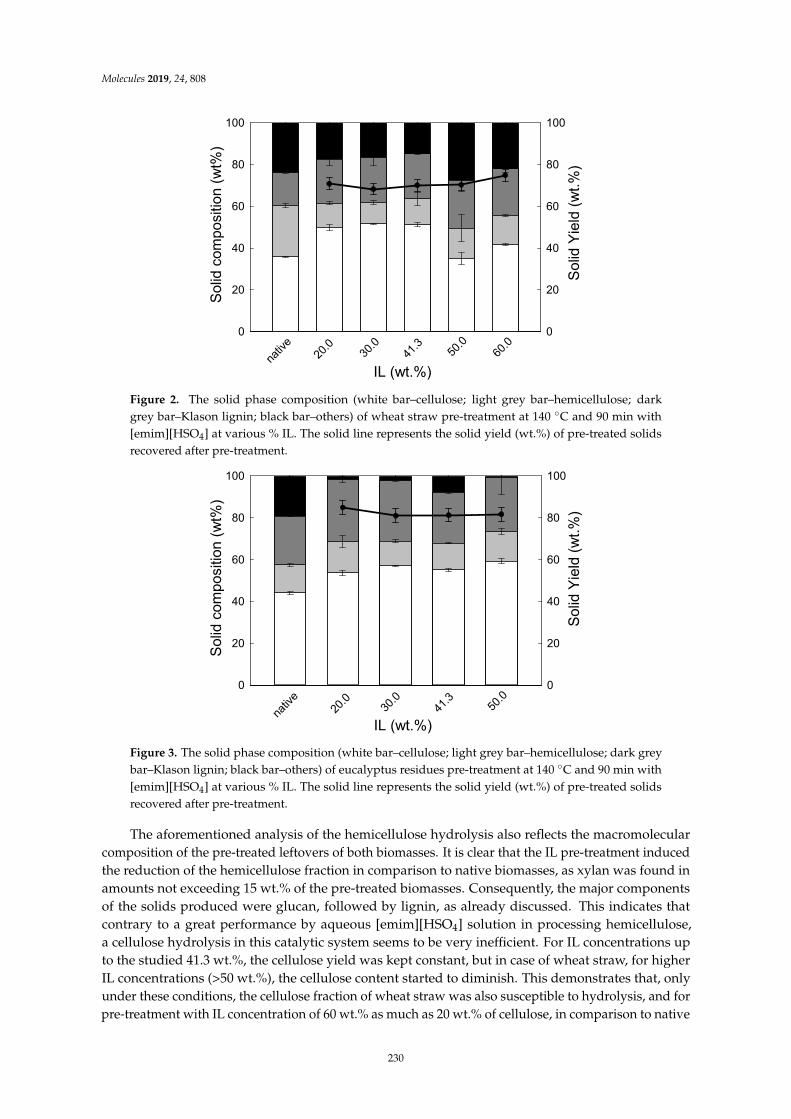
Molecules 2019, 24, 808Molecules 2019, 24, x 4 of 17
Figure 2. The solid phase composition (white bar–cellulose; light grey bar–hemicellulose; dark grey bar–Klason lignin; black bar–others) of wheat straw pre-treatment at 140 °C and 90 min with [emim][HSO4] at various % IL. The solid line represents the solid yield (wt.%) of pre-treated solids recovered after pre-treatment.
Figure 3. The solid phase composition (white bar–cellulose; light grey bar–hemicellulose; dark grey bar–Klason lignin; black bar–others) of eucalyptus residues pre-treatment at 140 °C and 90 min with [emim][HSO4] at various % IL. The solid line represents the solid yield (wt.%) of pre-treated solids recovered after pre-treatment.
The aforementioned analysis of the hemicellulose hydrolysis also reflects the macromolecular composition of the pre-treated leftovers of both biomasses. It is clear that the IL pre-treatment induced the reduction of the hemicellulose fraction in comparison to native biomasses, as xylan was found in amounts not exceeding 15 wt.% of the pre-treated biomasses. Consequently, the major components of the solids produced were glucan, followed by lignin, as already discussed. This indicates that contrary to a great performance by aqueous [emim][HSO4] solution in processing hemicellulose, a cellulose hydrolysis in this catalytic system seems to be very inefficient. For IL concentrations up to the studied 41.3 wt.%, the cellulose yield was kept constant, but in case of wheat straw, for higher IL concentrations (>50 wt.%), the cellulose content started to diminish. This demonstrates that, only under these conditions, the cellulose fraction of wheat straw was also
0
20
40
60
80
100
0
20
40
60
80
100
Solid
com
posi
tion
(wt%
)
IL (wt.%)na
tive
20.0 30
.041
.3 50.0
60.0
Solid
Yie
ld (w
t.%)
0
20
40
60
80
100
0
20
40
60
80
100
Solid
com
posi
tion
(wt%
)
IL (wt.%)na
tive
20.0 30
.041
.3 50.0
Solid
Yie
ld (w
t.%)
Figure 2. The solid phase composition (white bar–cellulose; light grey bar–hemicellulose; darkgrey bar–Klason lignin; black bar–others) of wheat straw pre-treatment at 140 C and 90 min with[emim][HSO4] at various % IL. The solid line represents the solid yield (wt.%) of pre-treated solidsrecovered after pre-treatment.
Molecules 2019, 24, x 4 of 17
Figure 2. The solid phase composition (white bar–cellulose; light grey bar–hemicellulose; dark grey bar–Klason lignin; black bar–others) of wheat straw pre-treatment at 140 °C and 90 min with [emim][HSO4] at various % IL. The solid line represents the solid yield (wt.%) of pre-treated solids recovered after pre-treatment.
Figure 3. The solid phase composition (white bar–cellulose; light grey bar–hemicellulose; dark grey bar–Klason lignin; black bar–others) of eucalyptus residues pre-treatment at 140 °C and 90 min with [emim][HSO4] at various % IL. The solid line represents the solid yield (wt.%) of pre-treated solids recovered after pre-treatment.
The aforementioned analysis of the hemicellulose hydrolysis also reflects the macromolecular composition of the pre-treated leftovers of both biomasses. It is clear that the IL pre-treatment induced the reduction of the hemicellulose fraction in comparison to native biomasses, as xylan was found in amounts not exceeding 15 wt.% of the pre-treated biomasses. Consequently, the major components of the solids produced were glucan, followed by lignin, as already discussed. This indicates that contrary to a great performance by aqueous [emim][HSO4] solution in processing hemicellulose, a cellulose hydrolysis in this catalytic system seems to be very inefficient. For IL concentrations up to the studied 41.3 wt.%, the cellulose yield was kept constant, but in case of wheat straw, for higher IL concentrations (>50 wt.%), the cellulose content started to diminish. This demonstrates that, only under these conditions, the cellulose fraction of wheat straw was also
0
20
40
60
80
100
0
20
40
60
80
100
Solid
com
posi
tion
(wt%
)
IL (wt.%)na
tive
20.0 30
.041
.3 50.0
60.0
Solid
Yie
ld (w
t.%)
0
20
40
60
80
100
0
20
40
60
80
100
Solid
com
posi
tion
(wt%
)
IL (wt.%)na
tive
20.0 30
.041
.3 50.0
Solid
Yie
ld (w
t.%)
Figure 3. The solid phase composition (white bar–cellulose; light grey bar–hemicellulose; dark greybar–Klason lignin; black bar–others) of eucalyptus residues pre-treatment at 140 C and 90 min with[emim][HSO4] at various % IL. The solid line represents the solid yield (wt.%) of pre-treated solidsrecovered after pre-treatment.
The aforementioned analysis of the hemicellulose hydrolysis also reflects the macromolecularcomposition of the pre-treated leftovers of both biomasses. It is clear that the IL pre-treatment inducedthe reduction of the hemicellulose fraction in comparison to native biomasses, as xylan was found inamounts not exceeding 15 wt.% of the pre-treated biomasses. Consequently, the major componentsof the solids produced were glucan, followed by lignin, as already discussed. This indicates thatcontrary to a great performance by aqueous [emim][HSO4] solution in processing hemicellulose,a cellulose hydrolysis in this catalytic system seems to be very inefficient. For IL concentrations upto the studied 41.3 wt.%, the cellulose yield was kept constant, but in case of wheat straw, for higherIL concentrations (>50 wt.%), the cellulose content started to diminish. This demonstrates that, onlyunder these conditions, the cellulose fraction of wheat straw was also susceptible to hydrolysis, and forpre-treatment with IL concentration of 60 wt.% as much as 20 wt.% of cellulose, in comparison to native
230
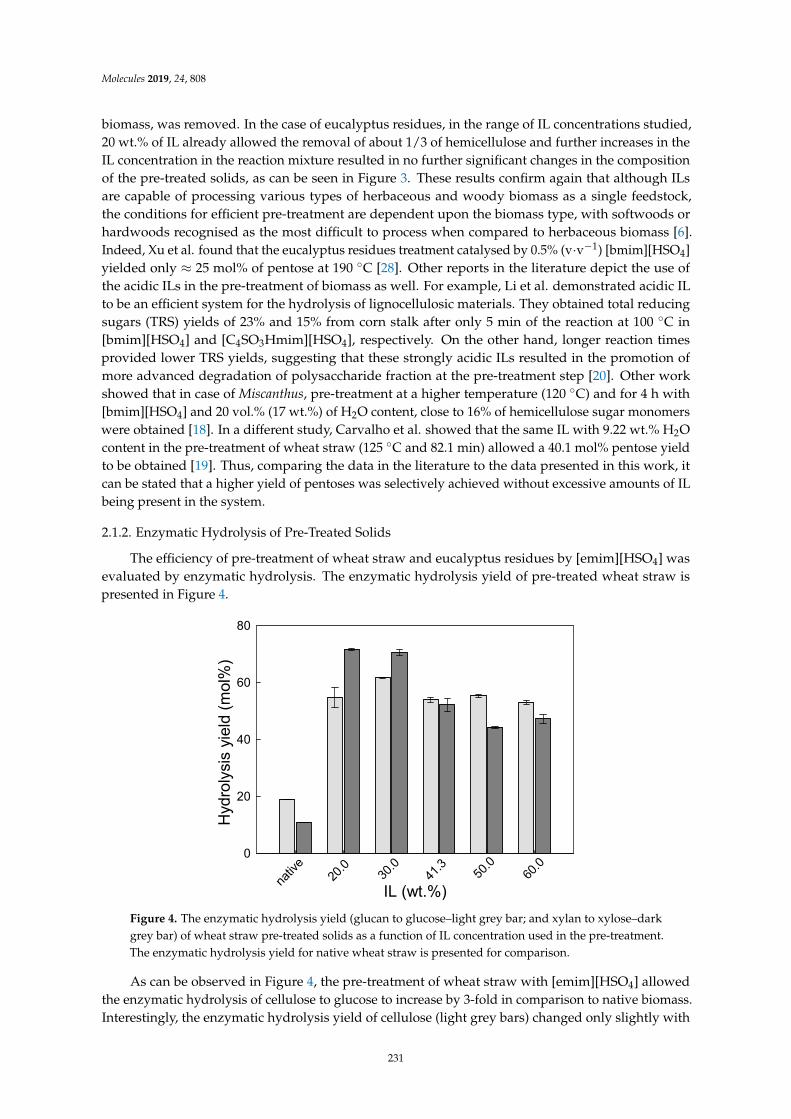
Molecules 2019, 24, 808
biomass, was removed. In the case of eucalyptus residues, in the range of IL concentrations studied,20 wt.% of IL already allowed the removal of about 1/3 of hemicellulose and further increases in theIL concentration in the reaction mixture resulted in no further significant changes in the compositionof the pre-treated solids, as can be seen in Figure 3. These results confirm again that although ILsare capable of processing various types of herbaceous and woody biomass as a single feedstock,the conditions for efficient pre-treatment are dependent upon the biomass type, with softwoods orhardwoods recognised as the most difficult to process when compared to herbaceous biomass [6].Indeed, Xu et al. found that the eucalyptus residues treatment catalysed by 0.5% (v·v−1) [bmim][HSO4]yielded only ≈ 25 mol% of pentose at 190 C [28]. Other reports in the literature depict the use ofthe acidic ILs in the pre-treatment of biomass as well. For example, Li et al. demonstrated acidic ILto be an efficient system for the hydrolysis of lignocellulosic materials. They obtained total reducingsugars (TRS) yields of 23% and 15% from corn stalk after only 5 min of the reaction at 100 C in[bmim][HSO4] and [C4SO3Hmim][HSO4], respectively. On the other hand, longer reaction timesprovided lower TRS yields, suggesting that these strongly acidic ILs resulted in the promotion ofmore advanced degradation of polysaccharide fraction at the pre-treatment step [20]. Other workshowed that in case of Miscanthus, pre-treatment at a higher temperature (120 C) and for 4 h with[bmim][HSO4] and 20 vol.% (17 wt.%) of H2O content, close to 16% of hemicellulose sugar monomerswere obtained [18]. In a different study, Carvalho et al. showed that the same IL with 9.22 wt.% H2Ocontent in the pre-treatment of wheat straw (125 C and 82.1 min) allowed a 40.1 mol% pentose yieldto be obtained [19]. Thus, comparing the data in the literature to the data presented in this work, itcan be stated that a higher yield of pentoses was selectively achieved without excessive amounts of ILbeing present in the system.
2.1.2. Enzymatic Hydrolysis of Pre-Treated Solids
The efficiency of pre-treatment of wheat straw and eucalyptus residues by [emim][HSO4] wasevaluated by enzymatic hydrolysis. The enzymatic hydrolysis yield of pre-treated wheat straw ispresented in Figure 4.
Molecules 2019, 24, x 5 of 17
susceptible to hydrolysis, and for pre-treatment with IL concentration of 60 wt.% as much as 20 wt.% of cellulose, in comparison to native biomass, was removed. In the case of eucalyptus residues, in the range of IL concentrations studied, 20 wt.% of IL already allowed the removal of about 1/3 of hemicellulose and further increases in the IL concentration in the reaction mixture resulted in no further significant changes in the composition of the pre-treated solids, as can be seen in Figure 3. These results confirm again that although ILs are capable of processing various types of herbaceous and woody biomass as a single feedstock, the conditions for efficient pre-treatment are dependent upon the biomass type, with softwoods or hardwoods recognised as the most difficult to process when compared to herbaceous biomass [6]. Indeed, Xu et al. found that the eucalyptus residues treatment catalysed by 0.5% (v⋅v−1) [bmim][HSO4] yielded only ≈ 25 mol% of pentose at 190 °C [28]. Other reports in the literature depict the use of the acidic ILs in the pre-treatment of biomass as well. For example, Li et al. demonstrated acidic IL to be an efficient system for the hydrolysis of lignocellulosic materials. They obtained total reducing sugars (TRS) yields of 23% and 15% from corn stalk after only 5 min of the reaction at 100 °C in [bmim][HSO4] and [C4SO3Hmim][HSO4], respectively. On the other hand, longer reaction times provided lower TRS yields, suggesting that these strongly acidic ILs resulted in the promotion of more advanced degradation of polysaccharide fraction at the pre-treatment step [20]. Other work showed that in case of Miscanthus, pre-treatment at a higher temperature (120 °C) and for 4 h with [bmim][HSO4] and 20 vol.% (17 wt.%) of H2O content, close to 16% of hemicellulose sugar monomers were obtained [18]. In a different study, Carvalho et al. showed that the same IL with 9.22 wt.% H2O content in the pre-treatment of wheat straw (125 °C and 82.1 min) allowed a 40.1 mol% pentose yield to be obtained [19]. Thus, comparing the data in the literature to the data presented in this work, it can be stated that a higher yield of pentoses was selectively achieved without excessive amounts of IL being present in the system.
2.1.2. Enzymatic Hydrolysis of Pre-Treated Solids
The efficiency of pre-treatment of wheat straw and eucalyptus residues by [emim][HSO4] was evaluated by enzymatic hydrolysis. The enzymatic hydrolysis yield of pre-treated wheat straw is presented in Figure 4.
Figure 4. The enzymatic hydrolysis yield (glucan to glucose–light grey bar; and xylan to xylose–dark grey bar) of wheat straw pre-treated solids as a function of IL concentration used in the pre-treatment. The enzymatic hydrolysis yield for native wheat straw is presented for comparison.
As can be observed in Figure 4, the pre-treatment of wheat straw with [emim][HSO4] allowed the enzymatic hydrolysis of cellulose to glucose to increase by 3-fold in comparison to native biomass.
IL (wt.%)
Hyd
roly
sis
yiel
d (m
ol%
)
0
20
40
60
80
nativ
e20
.0 30.0
41.3 50
.060
.0
Figure 4. The enzymatic hydrolysis yield (glucan to glucose–light grey bar; and xylan to xylose–darkgrey bar) of wheat straw pre-treated solids as a function of IL concentration used in the pre-treatment.The enzymatic hydrolysis yield for native wheat straw is presented for comparison.
As can be observed in Figure 4, the pre-treatment of wheat straw with [emim][HSO4] allowedthe enzymatic hydrolysis of cellulose to glucose to increase by 3-fold in comparison to native biomass.Interestingly, the enzymatic hydrolysis yield of cellulose (light grey bars) changed only slightly with
231
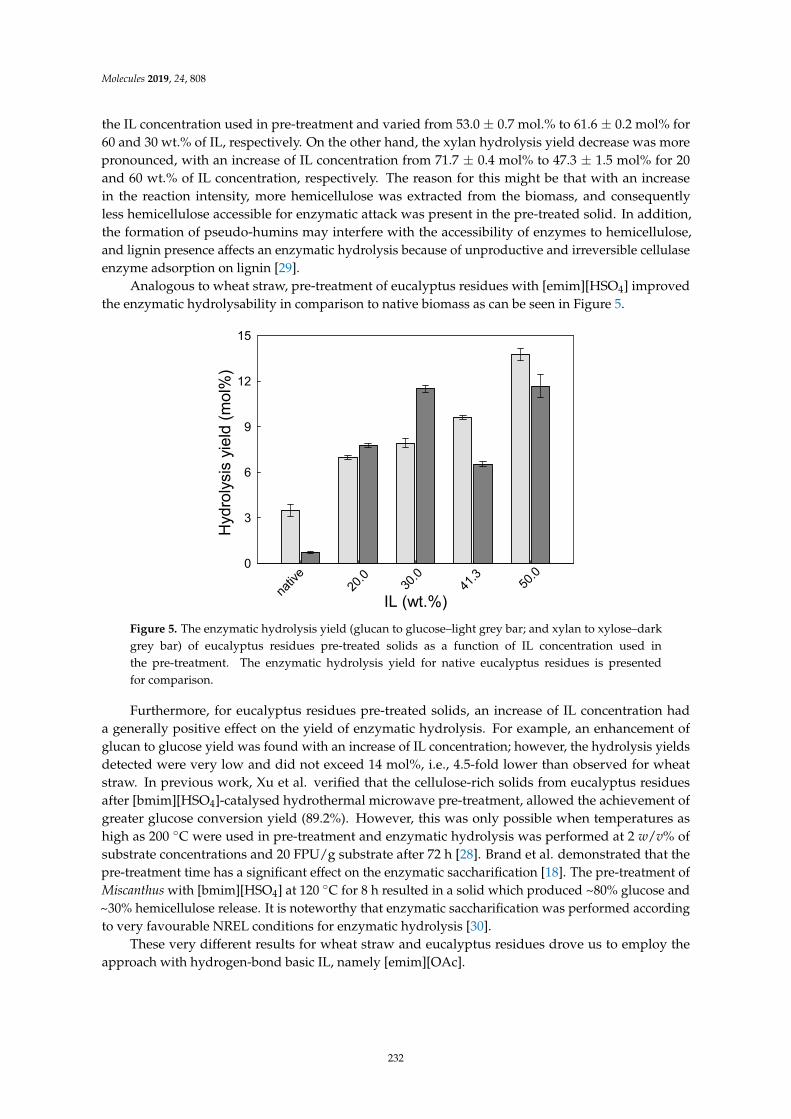
Molecules 2019, 24, 808
the IL concentration used in pre-treatment and varied from 53.0 ± 0.7 mol.% to 61.6 ± 0.2 mol% for60 and 30 wt.% of IL, respectively. On the other hand, the xylan hydrolysis yield decrease was morepronounced, with an increase of IL concentration from 71.7 ± 0.4 mol% to 47.3 ± 1.5 mol% for 20and 60 wt.% of IL concentration, respectively. The reason for this might be that with an increasein the reaction intensity, more hemicellulose was extracted from the biomass, and consequentlyless hemicellulose accessible for enzymatic attack was present in the pre-treated solid. In addition,the formation of pseudo-humins may interfere with the accessibility of enzymes to hemicellulose,and lignin presence affects an enzymatic hydrolysis because of unproductive and irreversible cellulaseenzyme adsorption on lignin [29].
Analogous to wheat straw, pre-treatment of eucalyptus residues with [emim][HSO4] improvedthe enzymatic hydrolysability in comparison to native biomass as can be seen in Figure 5.
Molecules 2019, 24, x 6 of 17
Interestingly, the enzymatic hydrolysis yield of cellulose (light grey bars) changed only slightly with the IL concentration used in pre-treatment and varied from 53.0 ± 0.7 mol.% to 61.6 ± 0.2 mol% for 60 and 30 wt.% of IL, respectively. On the other hand, the xylan hydrolysis yield decrease was more pronounced, with an increase of IL concentration from 71.7 ± 0.4 mol% to 47.3 ± 1.5 mol% for 20 and 60 wt.% of IL concentration, respectively. The reason for this might be that with an increase in the reaction intensity, more hemicellulose was extracted from the biomass, and consequently less hemicellulose accessible for enzymatic attack was present in the pre-treated solid. In addition, the formation of pseudo-humins may interfere with the accessibility of enzymes to hemicellulose, and lignin presence affects an enzymatic hydrolysis because of unproductive and irreversible cellulase enzyme adsorption on lignin [29].
Analogous to wheat straw, pre-treatment of eucalyptus residues with [emim][HSO4] improved the enzymatic hydrolysability in comparison to native biomass as can be seen in Figure 5.
Figure 5. The enzymatic hydrolysis yield (glucan to glucose–light grey bar; and xylan to xylose–dark grey bar) of eucalyptus residues pre-treated solids as a function of IL concentration used in the pre-treatment. The enzymatic hydrolysis yield for native eucalyptus residues is presented for comparison.
Furthermore, for eucalyptus residues pre-treated solids, an increase of IL concentration had a generally positive effect on the yield of enzymatic hydrolysis. For example, an enhancement of glucan to glucose yield was found with an increase of IL concentration; however, the hydrolysis yields detected were very low and did not exceed 14 mol%, i.e., 4.5-fold lower than observed for wheat straw. In previous work, Xu et al. verified that the cellulose-rich solids from eucalyptus residues after [bmim][HSO4]-catalysed hydrothermal microwave pre-treatment, allowed the achievement of greater glucose conversion yield (89.2%). However, this was only possible when temperatures as high as 200 °C were used in pre-treatment and enzymatic hydrolysis was performed at 2 w/v% of substrate concentrations and 20 FPU/g substrate after 72 h [28]. Brand et al. demonstrated that the pre-treatment time has a significant effect on the enzymatic saccharification [18]. The pre-treatment of Miscanthus with [bmim][HSO4] at 120 °C for 8 h resulted in a solid which produced ~80% glucose and ~30% hemicellulose release. It is noteworthy that enzymatic saccharification was performed according to very favourable NREL conditions for enzymatic hydrolysis [30].
These very different results for wheat straw and eucalyptus residues drove us to employ the approach with hydrogen-bond basic IL, namely [emim][OAc].
2.2. Hydrogen-Bond Basic IL
IL (wt.%)
Hyd
roly
sis
yiel
d (m
ol%
)
0
3
6
9
12
15
nativ
e20
.0 30.0
41.3 50
.0
Figure 5. The enzymatic hydrolysis yield (glucan to glucose–light grey bar; and xylan to xylose–darkgrey bar) of eucalyptus residues pre-treated solids as a function of IL concentration used inthe pre-treatment. The enzymatic hydrolysis yield for native eucalyptus residues is presentedfor comparison.
Furthermore, for eucalyptus residues pre-treated solids, an increase of IL concentration hada generally positive effect on the yield of enzymatic hydrolysis. For example, an enhancement ofglucan to glucose yield was found with an increase of IL concentration; however, the hydrolysis yieldsdetected were very low and did not exceed 14 mol%, i.e., 4.5-fold lower than observed for wheatstraw. In previous work, Xu et al. verified that the cellulose-rich solids from eucalyptus residuesafter [bmim][HSO4]-catalysed hydrothermal microwave pre-treatment, allowed the achievement ofgreater glucose conversion yield (89.2%). However, this was only possible when temperatures ashigh as 200 C were used in pre-treatment and enzymatic hydrolysis was performed at 2 w/v% ofsubstrate concentrations and 20 FPU/g substrate after 72 h [28]. Brand et al. demonstrated that thepre-treatment time has a significant effect on the enzymatic saccharification [18]. The pre-treatment ofMiscanthus with [bmim][HSO4] at 120 C for 8 h resulted in a solid which produced ~80% glucose and~30% hemicellulose release. It is noteworthy that enzymatic saccharification was performed accordingto very favourable NREL conditions for enzymatic hydrolysis [30].
These very different results for wheat straw and eucalyptus residues drove us to employ theapproach with hydrogen-bond basic IL, namely [emim][OAc].
232
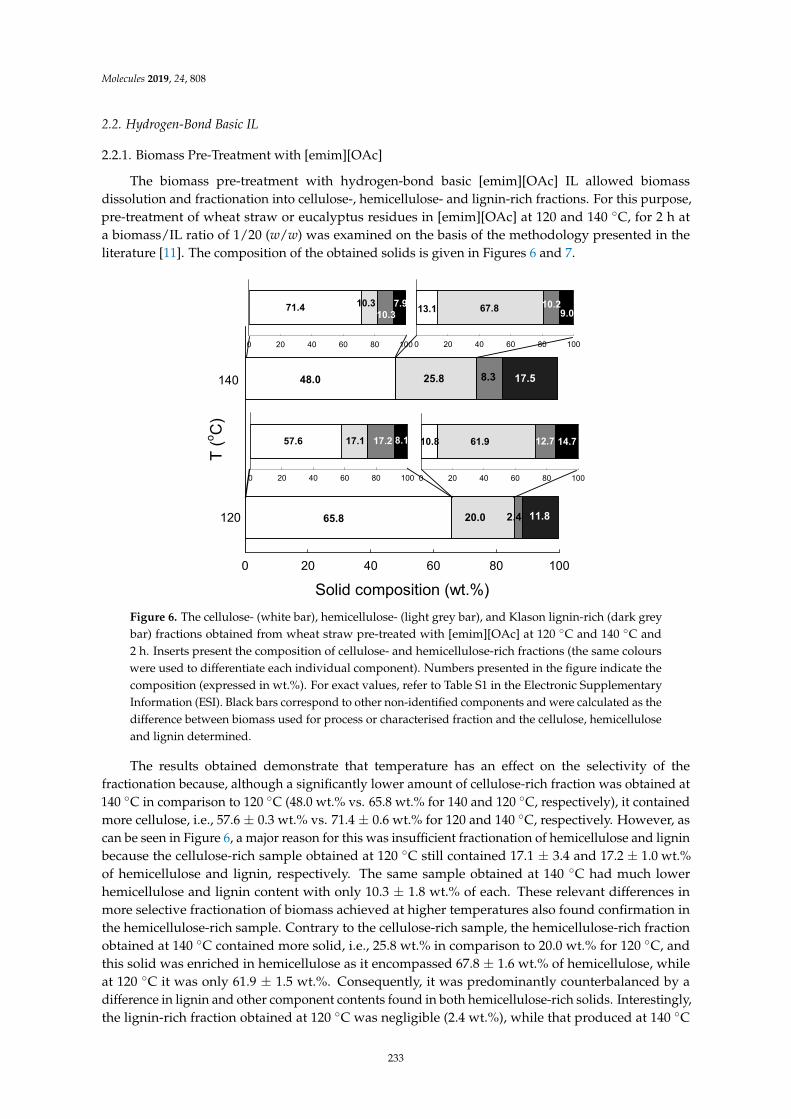
Molecules 2019, 24, 808
2.2. Hydrogen-Bond Basic IL
2.2.1. Biomass Pre-Treatment with [emim][OAc]
The biomass pre-treatment with hydrogen-bond basic [emim][OAc] IL allowed biomassdissolution and fractionation into cellulose-, hemicellulose- and lignin-rich fractions. For this purpose,pre-treatment of wheat straw or eucalyptus residues in [emim][OAc] at 120 and 140 C, for 2 h ata biomass/IL ratio of 1/20 (w/w) was examined on the basis of the methodology presented in theliterature [11]. The composition of the obtained solids is given in Figures 6 and 7.
Molecules 2019, 24, x 7 of 17
2.2.1. Biomass Pre-Treatment with [emim][OAc]
The biomass pre-treatment with hydrogen-bond basic [emim][OAc] IL allowed biomass dissolution and fractionation into cellulose-, hemicellulose- and lignin-rich fractions. For this purpose, pre-treatment of wheat straw or eucalyptus residues in [emim][OAc] at 120 and 140 °C, for 2 h at a biomass/IL ratio of 1/20 (w/w) was examined on the basis of the methodology presented in the literature [11]. The composition of the obtained solids is given in Figures 6 and 7.
Figure 6. The cellulose- (white bar), hemicellulose- (light grey bar), and Klason lignin-rich (dark grey bar) fractions obtained from wheat straw pre-treated with [emim][OAc] at 120 °C and 140 °C and 2 h. Inserts present the composition of cellulose- and hemicellulose-rich fractions (the same colours were used to differentiate each individual component). Numbers presented in the figure indicate the composition (expressed in wt.%). For exact values, refer to Table S1 in the Electronic Supplementary Information (ESI). Black bars correspond to other non-identified components and were calculated as the difference between biomass used for process or characterised fraction and the cellulose, hemicellulose and lignin determined.
The results obtained demonstrate that temperature has an effect on the selectivity of the fractionation because, although a significantly lower amount of cellulose-rich fraction was obtained at 140 °C in comparison to 120 °C (48.0 wt.% vs. 65.8 wt.% for 140 and 120 °C, respectively), it contained more cellulose, i.e., 57.6 ± 0.3 wt.% vs. 71.4 ± 0.6 wt.% for 120 and 140 °C, respectively. However, as can be seen in Figure 6, a major reason for this was insufficient fractionation of hemicellulose and lignin because the cellulose-rich sample obtained at 120 °C still contained 17.1 ± 3.4 and 17.2 ± 1.0 wt.% of hemicellulose and lignin, respectively. The same sample obtained at 140 °C had much lower hemicellulose and lignin content with only 10.3 ± 1.8 wt.% of each. These relevant differences in more selective fractionation of biomass achieved at higher temperatures also found confirmation in the hemicellulose-rich sample. Contrary to the cellulose-rich sample, the hemicellulose-rich fraction obtained at 140 °C contained more solid, i.e., 25.8 wt.% in comparison to 20.0 wt.% for 120 °C, and this solid was enriched in hemicellulose as it encompassed 67.8 ± 1.6 wt.% of hemicellulose, while at 120 °C it was only 61.9 ± 1.5 wt.%. Consequently, it was predominantly counterbalanced by a difference in lignin and other component contents found in both hemicellulose-rich solids. Interestingly, the lignin-rich fraction obtained at 120 °C was negligible (2.4 wt.%), while that produced at 140 °C was more than three times higher and was equal to 8.3 wt.%. This again clearly indicates that a higher temperature was more effective in the fractionation of wheat straw and
Solid composition (wt.%)0 20 40 60 80 100
T (o C
)
120
140
0 20 40 60 80 100 0 20 40 60 80 100
0 20 40 60 80 1000 20 40 60 80 100
65.8 20.0 2.4 11.8
48.0 25.8 8.3 17.5
57.6 17.1 17.2 8.1 10.8 61.9 12.7 14.7
71.4 10.310.3
7.9 13.1 67.8 10.29.0
Figure 6. The cellulose- (white bar), hemicellulose- (light grey bar), and Klason lignin-rich (dark greybar) fractions obtained from wheat straw pre-treated with [emim][OAc] at 120 C and 140 C and2 h. Inserts present the composition of cellulose- and hemicellulose-rich fractions (the same colourswere used to differentiate each individual component). Numbers presented in the figure indicate thecomposition (expressed in wt.%). For exact values, refer to Table S1 in the Electronic SupplementaryInformation (ESI). Black bars correspond to other non-identified components and were calculated as thedifference between biomass used for process or characterised fraction and the cellulose, hemicelluloseand lignin determined.
The results obtained demonstrate that temperature has an effect on the selectivity of thefractionation because, although a significantly lower amount of cellulose-rich fraction was obtained at140 C in comparison to 120 C (48.0 wt.% vs. 65.8 wt.% for 140 and 120 C, respectively), it containedmore cellulose, i.e., 57.6 ± 0.3 wt.% vs. 71.4 ± 0.6 wt.% for 120 and 140 C, respectively. However, ascan be seen in Figure 6, a major reason for this was insufficient fractionation of hemicellulose and ligninbecause the cellulose-rich sample obtained at 120 C still contained 17.1 ± 3.4 and 17.2 ± 1.0 wt.%of hemicellulose and lignin, respectively. The same sample obtained at 140 C had much lowerhemicellulose and lignin content with only 10.3 ± 1.8 wt.% of each. These relevant differences inmore selective fractionation of biomass achieved at higher temperatures also found confirmation inthe hemicellulose-rich sample. Contrary to the cellulose-rich sample, the hemicellulose-rich fractionobtained at 140 C contained more solid, i.e., 25.8 wt.% in comparison to 20.0 wt.% for 120 C, andthis solid was enriched in hemicellulose as it encompassed 67.8 ± 1.6 wt.% of hemicellulose, whileat 120 C it was only 61.9 ± 1.5 wt.%. Consequently, it was predominantly counterbalanced by adifference in lignin and other component contents found in both hemicellulose-rich solids. Interestingly,the lignin-rich fraction obtained at 120 C was negligible (2.4 wt.%), while that produced at 140 C
233
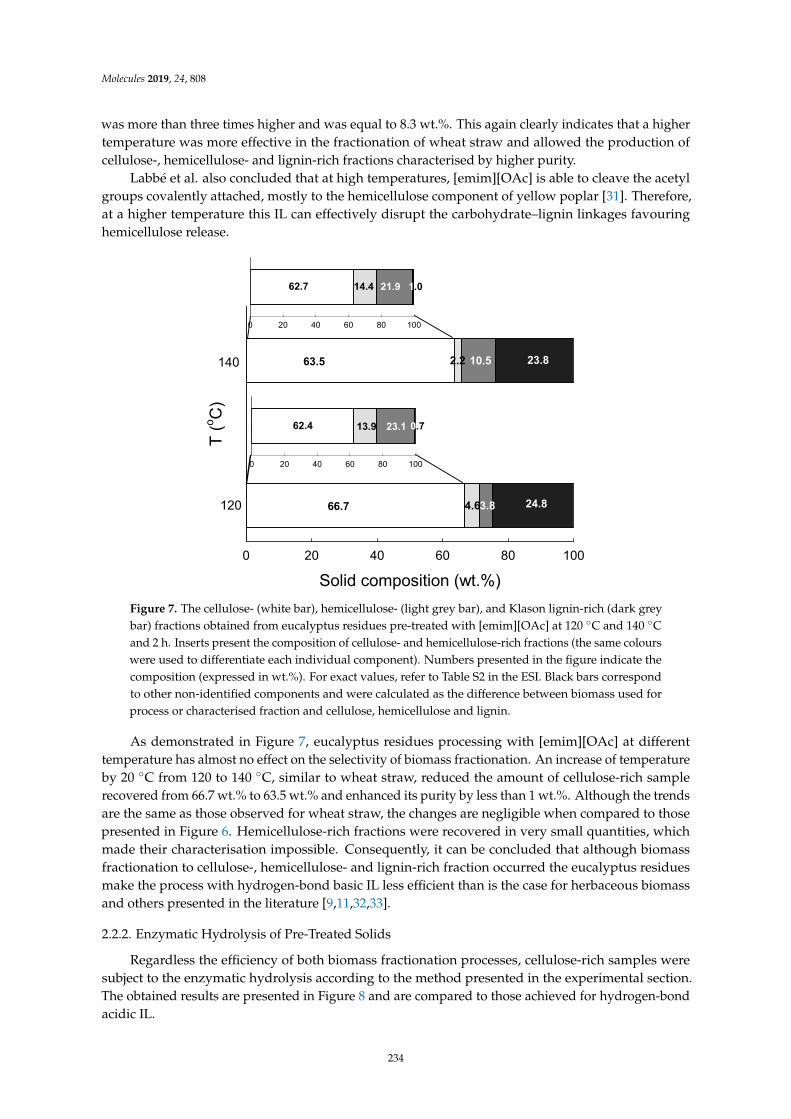
Molecules 2019, 24, 808
was more than three times higher and was equal to 8.3 wt.%. This again clearly indicates that a highertemperature was more effective in the fractionation of wheat straw and allowed the production ofcellulose-, hemicellulose- and lignin-rich fractions characterised by higher purity.
Labbé et al. also concluded that at high temperatures, [emim][OAc] is able to cleave the acetylgroups covalently attached, mostly to the hemicellulose component of yellow poplar [31]. Therefore,at a higher temperature this IL can effectively disrupt the carbohydrate–lignin linkages favouringhemicellulose release.
Molecules 2019, 24, x 8 of 17
allowed the production of cellulose-, hemicellulose- and lignin-rich fractions characterised by higher purity.
Labbé et al. also concluded that at high temperatures, [emim][OAc] is able to cleave the acetyl groups covalently attached, mostly to the hemicellulose component of yellow poplar [31]. Therefore, at a higher temperature this IL can effectively disrupt the carbohydrate–lignin linkages favouring hemicellulose release.
Figure 7. The cellulose- (white bar), hemicellulose- (light grey bar), and Klason lignin-rich (dark grey bar) fractions obtained from eucalyptus residues pre-treated with [emim][OAc] at 120 °C and 140 °C and 2 h. Inserts present the composition of cellulose- and hemicellulose-rich fractions (the same colours were used to differentiate each individual component). Numbers presented in the figure indicate the composition (expressed in wt.%). For exact values, refer to Table S2 in the ESI. Black bars correspond to other non-identified components and were calculated as the difference between biomass used for process or characterised fraction and cellulose, hemicellulose and lignin.
As demonstrated in Figure 7, eucalyptus residues processing with [emim][OAc] at different temperature has almost no effect on the selectivity of biomass fractionation. An increase of temperature by 20 °C from 120 to 140 °C, similar to wheat straw, reduced the amount of cellulose-rich sample recovered from 66.7 wt.% to 63.5 wt.% and enhanced its purity by less than 1 wt.%. Although the trends are the same as those observed for wheat straw, the changes are negligible when compared to those presented in Figure 6. Hemicellulose-rich fractions were recovered in very small quantities, which made their characterisation impossible. Consequently, it can be concluded that although biomass fractionation to cellulose-, hemicellulose- and lignin-rich fraction occurred the eucalyptus residues make the process with hydrogen-bond basic IL less efficient than is the case for herbaceous biomass and others presented in the literature [9,11,32,33].
2.2.2. Enzymatic Hydrolysis of Pre-Treated Solids
Regardless the efficiency of both biomass fractionation processes, cellulose-rich samples were subject to the enzymatic hydrolysis according to the method presented in the experimental section. The obtained results are presented in Figure 8 and are compared to those achieved for hydrogen-bond acidic IL.
Solid composition (wt.%)0 20 40 60 80 100
T (o C
)
120
140
0 20 40 60 80 100
0 20 40 60 80 100
66.7 4.63.8 24.8
63.5 2.2 10.5 23.8
62.4 13.9 23.1
62.7 14.4 21.9 1.0
0.7
Figure 7. The cellulose- (white bar), hemicellulose- (light grey bar), and Klason lignin-rich (dark greybar) fractions obtained from eucalyptus residues pre-treated with [emim][OAc] at 120 C and 140 Cand 2 h. Inserts present the composition of cellulose- and hemicellulose-rich fractions (the same colourswere used to differentiate each individual component). Numbers presented in the figure indicate thecomposition (expressed in wt.%). For exact values, refer to Table S2 in the ESI. Black bars correspondto other non-identified components and were calculated as the difference between biomass used forprocess or characterised fraction and cellulose, hemicellulose and lignin.
As demonstrated in Figure 7, eucalyptus residues processing with [emim][OAc] at differenttemperature has almost no effect on the selectivity of biomass fractionation. An increase of temperatureby 20 C from 120 to 140 C, similar to wheat straw, reduced the amount of cellulose-rich samplerecovered from 66.7 wt.% to 63.5 wt.% and enhanced its purity by less than 1 wt.%. Although the trendsare the same as those observed for wheat straw, the changes are negligible when compared to thosepresented in Figure 6. Hemicellulose-rich fractions were recovered in very small quantities, whichmade their characterisation impossible. Consequently, it can be concluded that although biomassfractionation to cellulose-, hemicellulose- and lignin-rich fraction occurred the eucalyptus residuesmake the process with hydrogen-bond basic IL less efficient than is the case for herbaceous biomassand others presented in the literature [9,11,32,33].
2.2.2. Enzymatic Hydrolysis of Pre-Treated Solids
Regardless the efficiency of both biomass fractionation processes, cellulose-rich samples weresubject to the enzymatic hydrolysis according to the method presented in the experimental section.The obtained results are presented in Figure 8 and are compared to those achieved for hydrogen-bondacidic IL.
234
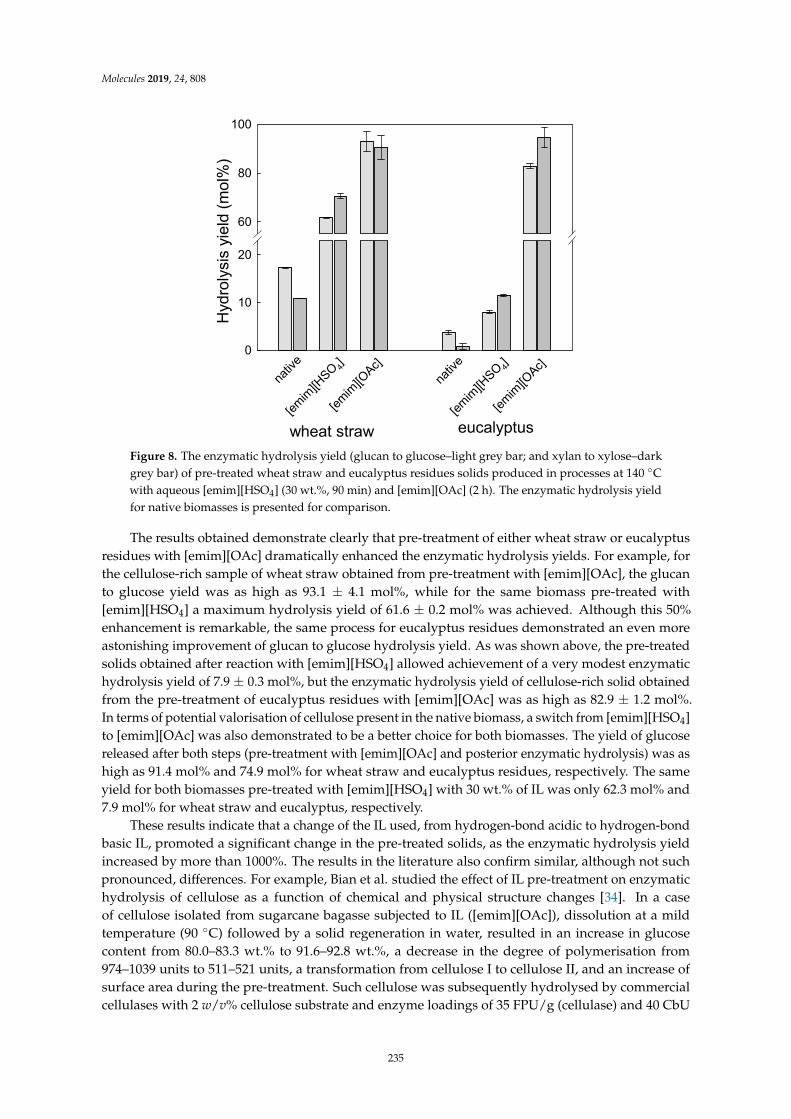
Molecules 2019, 24, 808Molecules 2019, 24, x 9 of 17
Figure 8. The enzymatic hydrolysis yield (glucan to glucose–light grey bar; and xylan to xylose–dark grey bar) of pre-treated wheat straw and eucalyptus residues solids produced in processes at 140 °C with aqueous [emim][HSO4] (30 wt.%, 90 min) and [emim][OAc] (2 h). The enzymatic hydrolysis yield for native biomasses is presented for comparison.
The results obtained demonstrate clearly that pre-treatment of either wheat straw or eucalyptus residues with [emim][OAc] dramatically enhanced the enzymatic hydrolysis yields. For example, for the cellulose-rich sample of wheat straw obtained from pre-treatment with [emim][OAc], the glucan to glucose yield was as high as 93.1 ± 4.1 mol%, while for the same biomass pre-treated with [emim][HSO4] a maximum hydrolysis yield of 61.6 ± 0.2 mol% was achieved. Although this 50% enhancement is remarkable, the same process for eucalyptus residues demonstrated an even more astonishing improvement of glucan to glucose hydrolysis yield. As was shown above, the pre-treated solids obtained after reaction with [emim][HSO4] allowed achievement of a very modest enzymatic hydrolysis yield of 7.9 ± 0.3 mol%, but the enzymatic hydrolysis yield of cellulose-rich solid obtained from the pre-treatment of eucalyptus residues with [emim][OAc] was as high as 82.9 ± 1.2 mol%. In terms of potential valorisation of cellulose present in the native biomass, a switch from [emim][HSO4] to [emim][OAc] was also demonstrated to be a better choice for both biomasses. The yield of glucose released after both steps (pre-treatment with [emim][OAc] and posterior enzymatic hydrolysis) was as high as 91.4 mol% and 74.9 mol% for wheat straw and eucalyptus residues, respectively. The same yield for both biomasses pre-treated with [emim][HSO4] with 30 wt.% of IL was only 62.3 mol% and 7.9 mol% for wheat straw and eucalyptus, respectively.
These results indicate that a change of the IL used, from hydrogen-bond acidic to hydrogen-bond basic IL, promoted a significant change in the pre-treated solids, as the enzymatic hydrolysis yield increased by more than 1000%. The results in the literature also confirm similar, although not such pronounced, differences. For example, Bian et al. studied the effect of IL pre-treatment on enzymatic hydrolysis of cellulose as a function of chemical and physical structure changes [34]. In a case of cellulose isolated from sugarcane bagasse subjected to IL ([emim][OAc]), dissolution at a mild temperature (90 °C) followed by a solid regeneration in water, resulted in an increase in glucose content from 80.0–83.3 wt.% to 91.6–92.8 wt.%, a decrease in the degree of polymerisation from 974–1039 units to 511–521 units, a transformation from cellulose I to cellulose II, and an increase of surface area during the pre-treatment. Such cellulose was subsequently hydrolysed by commercial cellulases with 2 w/v% cellulose substrate and enzyme loadings of 35 FPU/g (cellulase) and 40 CbU (β-glucosidase) in relation to the dry weight of cellulose substrates, and allowed achievement of a high
Hyd
roly
sis
yiel
d (m
ol%
)
0
10
20
60
80
100
nativ
e
[emim
][HSO 4]
[emim
][OAc]
nativ
e
wheat straw eucalyptus[em
im][H
SO 4]
[emim
][OAc]
Figure 8. The enzymatic hydrolysis yield (glucan to glucose–light grey bar; and xylan to xylose–darkgrey bar) of pre-treated wheat straw and eucalyptus residues solids produced in processes at 140 Cwith aqueous [emim][HSO4] (30 wt.%, 90 min) and [emim][OAc] (2 h). The enzymatic hydrolysis yieldfor native biomasses is presented for comparison.
The results obtained demonstrate clearly that pre-treatment of either wheat straw or eucalyptusresidues with [emim][OAc] dramatically enhanced the enzymatic hydrolysis yields. For example, forthe cellulose-rich sample of wheat straw obtained from pre-treatment with [emim][OAc], the glucanto glucose yield was as high as 93.1 ± 4.1 mol%, while for the same biomass pre-treated with[emim][HSO4] a maximum hydrolysis yield of 61.6 ± 0.2 mol% was achieved. Although this 50%enhancement is remarkable, the same process for eucalyptus residues demonstrated an even moreastonishing improvement of glucan to glucose hydrolysis yield. As was shown above, the pre-treatedsolids obtained after reaction with [emim][HSO4] allowed achievement of a very modest enzymatichydrolysis yield of 7.9 ± 0.3 mol%, but the enzymatic hydrolysis yield of cellulose-rich solid obtainedfrom the pre-treatment of eucalyptus residues with [emim][OAc] was as high as 82.9 ± 1.2 mol%.In terms of potential valorisation of cellulose present in the native biomass, a switch from [emim][HSO4]to [emim][OAc] was also demonstrated to be a better choice for both biomasses. The yield of glucosereleased after both steps (pre-treatment with [emim][OAc] and posterior enzymatic hydrolysis) was ashigh as 91.4 mol% and 74.9 mol% for wheat straw and eucalyptus residues, respectively. The sameyield for both biomasses pre-treated with [emim][HSO4] with 30 wt.% of IL was only 62.3 mol% and7.9 mol% for wheat straw and eucalyptus, respectively.
These results indicate that a change of the IL used, from hydrogen-bond acidic to hydrogen-bondbasic IL, promoted a significant change in the pre-treated solids, as the enzymatic hydrolysis yieldincreased by more than 1000%. The results in the literature also confirm similar, although not suchpronounced, differences. For example, Bian et al. studied the effect of IL pre-treatment on enzymatichydrolysis of cellulose as a function of chemical and physical structure changes [34]. In a caseof cellulose isolated from sugarcane bagasse subjected to IL ([emim][OAc]), dissolution at a mildtemperature (90 C) followed by a solid regeneration in water, resulted in an increase in glucosecontent from 80.0–83.3 wt.% to 91.6–92.8 wt.%, a decrease in the degree of polymerisation from974–1039 units to 511–521 units, a transformation from cellulose I to cellulose II, and an increase ofsurface area during the pre-treatment. Such cellulose was subsequently hydrolysed by commercialcellulases with 2 w/v% cellulose substrate and enzyme loadings of 35 FPU/g (cellulase) and 40 CbU
235
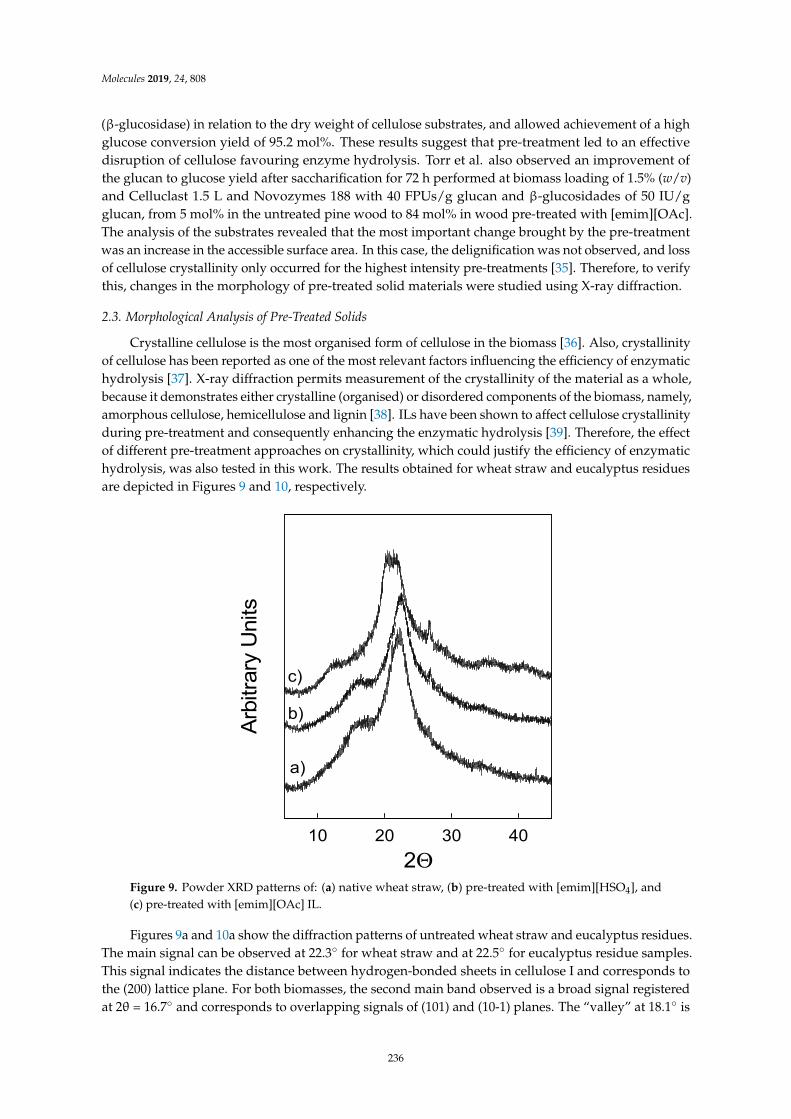
Molecules 2019, 24, 808
(β-glucosidase) in relation to the dry weight of cellulose substrates, and allowed achievement of a highglucose conversion yield of 95.2 mol%. These results suggest that pre-treatment led to an effectivedisruption of cellulose favouring enzyme hydrolysis. Torr et al. also observed an improvement ofthe glucan to glucose yield after saccharification for 72 h performed at biomass loading of 1.5% (w/v)and Celluclast 1.5 L and Novozymes 188 with 40 FPUs/g glucan and β-glucosidades of 50 IU/gglucan, from 5 mol% in the untreated pine wood to 84 mol% in wood pre-treated with [emim][OAc].The analysis of the substrates revealed that the most important change brought by the pre-treatmentwas an increase in the accessible surface area. In this case, the delignification was not observed, and lossof cellulose crystallinity only occurred for the highest intensity pre-treatments [35]. Therefore, to verifythis, changes in the morphology of pre-treated solid materials were studied using X-ray diffraction.
2.3. Morphological Analysis of Pre-Treated Solids
Crystalline cellulose is the most organised form of cellulose in the biomass [36]. Also, crystallinityof cellulose has been reported as one of the most relevant factors influencing the efficiency of enzymatichydrolysis [37]. X-ray diffraction permits measurement of the crystallinity of the material as a whole,because it demonstrates either crystalline (organised) or disordered components of the biomass, namely,amorphous cellulose, hemicellulose and lignin [38]. ILs have been shown to affect cellulose crystallinityduring pre-treatment and consequently enhancing the enzymatic hydrolysis [39]. Therefore, the effectof different pre-treatment approaches on crystallinity, which could justify the efficiency of enzymatichydrolysis, was also tested in this work. The results obtained for wheat straw and eucalyptus residuesare depicted in Figures 9 and 10, respectively.
Molecules 2019, 24, x 10 of 17
glucose conversion yield of 95.2 mol%. These results suggest that pre-treatment led to an effective disruption of cellulose favouring enzyme hydrolysis. Torr et al. also observed an improvement of the glucan to glucose yield after saccharification for 72 h performed at biomass loading of 1.5% (w/v) and Celluclast 1.5 L and Novozymes 188 with 40 FPUs/g glucan and β-glucosidades of 50 IU/g glucan, from 5 mol% in the untreated pine wood to 84 mol% in wood pre-treated with [emim][OAc]. The analysis of the substrates revealed that the most important change brought by the pre-treatment was an increase in the accessible surface area. In this case, the delignification was not observed, and loss of cellulose crystallinity only occurred for the highest intensity pre-treatments [35]. Therefore, to verify this, changes in the morphology of pre-treated solid materials were studied using X-ray diffraction.
2.3. Morphological Analysis of Pre-Treated Solids
Crystalline cellulose is the most organised form of cellulose in the biomass [36]. Also, crystallinity of cellulose has been reported as one of the most relevant factors influencing the efficiency of enzymatic hydrolysis [37]. X-ray diffraction permits measurement of the crystallinity of the material as a whole, because it demonstrates either crystalline (organised) or disordered components of the biomass, namely, amorphous cellulose, hemicellulose and lignin [38]. ILs have been shown to affect cellulose crystallinity during pre-treatment and consequently enhancing the enzymatic hydrolysis [39]. Therefore, the effect of different pre-treatment approaches on crystallinity, which could justify the efficiency of enzymatic hydrolysis, was also tested in this work. The results obtained for wheat straw and eucalyptus residues are depicted in Figures 9 and 10, respectively.
Figure 9. Powder XRD patterns of: (a) native wheat straw, (b) pre-treated with [emim][HSO4], and (c) pre-treated with [emim][OAc] IL.
Figures 9a and 10a show the diffraction patterns of untreated wheat straw and eucalyptus residues. The main signal can be observed at 22.3° for wheat straw and at 22.5° for eucalyptus residue samples. This signal indicates the distance between hydrogen-bonded sheets in cellulose I and corresponds to the (200) lattice plane. For both biomasses, the second main band observed is a broad signal registered at 2θ = 16.7° and corresponds to overlapping signals of (101) and (10-1) planes. The “valley” at 18.1° is associated with an amorphous region in the biomass and includes
2Θ10 20 30 40
Arbi
trary
Uni
ts
a)
b)
c)
Figure 9. Powder XRD patterns of: (a) native wheat straw, (b) pre-treated with [emim][HSO4], and(c) pre-treated with [emim][OAc] IL.
Figures 9a and 10a show the diffraction patterns of untreated wheat straw and eucalyptus residues.The main signal can be observed at 22.3 for wheat straw and at 22.5 for eucalyptus residue samples.This signal indicates the distance between hydrogen-bonded sheets in cellulose I and corresponds tothe (200) lattice plane. For both biomasses, the second main band observed is a broad signal registeredat 2θ = 16.7 and corresponds to overlapping signals of (101) and (10-1) planes. The “valley” at 18.1 is
236
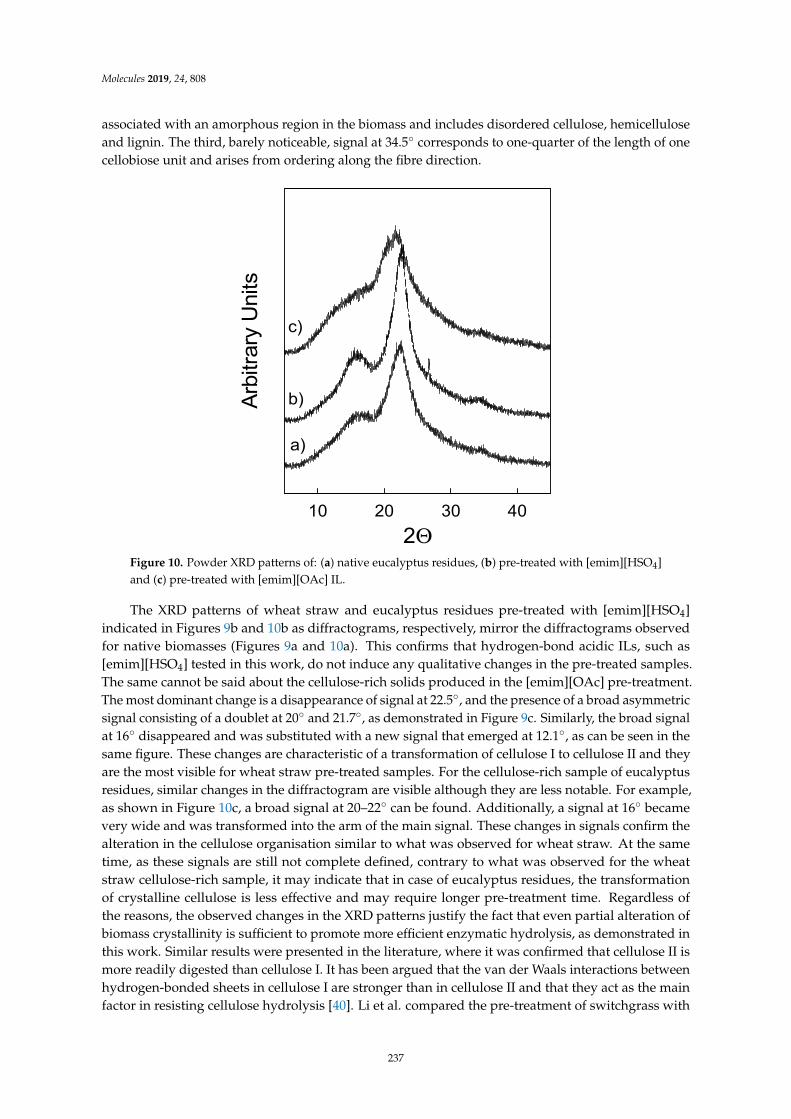
Molecules 2019, 24, 808
associated with an amorphous region in the biomass and includes disordered cellulose, hemicelluloseand lignin. The third, barely noticeable, signal at 34.5 corresponds to one-quarter of the length of onecellobiose unit and arises from ordering along the fibre direction.
Molecules 2019, 24, x 11 of 17
disordered cellulose, hemicellulose and lignin. The third, barely noticeable, signal at 34.5° corresponds to one-quarter of the length of one cellobiose unit and arises from ordering along the fibre direction.
Figure 10. Powder XRD patterns of: (a) native eucalyptus residues, (b) pre-treated with [emim][HSO4] and (c) pre-treated with [emim][OAc] IL.
The XRD patterns of wheat straw and eucalyptus residues pre-treated with [emim][HSO4] indicated in Figures 9b and 10b as diffractograms, respectively, mirror the diffractograms observed for native biomasses (Figures 9a and 10a). This confirms that hydrogen-bond acidic ILs, such as [emim][HSO4] tested in this work, do not induce any qualitative changes in the pre-treated samples. The same cannot be said about the cellulose-rich solids produced in the [emim][OAc] pre-treatment. The most dominant change is a disappearance of signal at 22.5°, and the presence of a broad asymmetric signal consisting of a doublet at 20° and 21.7°, as demonstrated in Figure 9c. Similarly, the broad signal at 16° disappeared and was substituted with a new signal that emerged at 12.1°, as can be seen in the same figure. These changes are characteristic of a transformation of cellulose I to cellulose II and they are the most visible for wheat straw pre-treated samples. For the cellulose-rich sample of eucalyptus residues, similar changes in the diffractogram are visible although they are less notable. For example, as shown in Figure 10c, a broad signal at 20–22° can be found. Additionally, a signal at 16° became very wide and was transformed into the arm of the main signal. These changes in signals confirm the alteration in the cellulose organisation similar to what was observed for wheat straw. At the same time, as these signals are still not complete defined, contrary to what was observed for the wheat straw cellulose-rich sample, it may indicate that in case of eucalyptus residues, the transformation of crystalline cellulose is less effective and may require longer pre-treatment time. Regardless of the reasons, the observed changes in the XRD patterns justify the fact that even partial alteration of biomass crystallinity is sufficient to promote more efficient enzymatic hydrolysis, as demonstrated in this work. Similar results were presented in the literature, where it was confirmed that cellulose II is more readily digested than cellulose I. It has been argued that the van der Waals interactions between hydrogen-bonded sheets in cellulose I are stronger than in cellulose II and that they act as the main factor in resisting cellulose hydrolysis [40]. Li et al. compared the pre-treatment of switchgrass with [emim][OAc] and with a 1.2% (w/w) dilute sulphuric acid [41]. For both untreated
2Θ10 20 30 40
Arbi
trary
Uni
ts
a)
b)
c)
Figure 10. Powder XRD patterns of: (a) native eucalyptus residues, (b) pre-treated with [emim][HSO4]and (c) pre-treated with [emim][OAc] IL.
The XRD patterns of wheat straw and eucalyptus residues pre-treated with [emim][HSO4]indicated in Figures 9b and 10b as diffractograms, respectively, mirror the diffractograms observedfor native biomasses (Figures 9a and 10a). This confirms that hydrogen-bond acidic ILs, such as[emim][HSO4] tested in this work, do not induce any qualitative changes in the pre-treated samples.The same cannot be said about the cellulose-rich solids produced in the [emim][OAc] pre-treatment.The most dominant change is a disappearance of signal at 22.5, and the presence of a broad asymmetricsignal consisting of a doublet at 20 and 21.7, as demonstrated in Figure 9c. Similarly, the broad signalat 16 disappeared and was substituted with a new signal that emerged at 12.1, as can be seen in thesame figure. These changes are characteristic of a transformation of cellulose I to cellulose II and theyare the most visible for wheat straw pre-treated samples. For the cellulose-rich sample of eucalyptusresidues, similar changes in the diffractogram are visible although they are less notable. For example,as shown in Figure 10c, a broad signal at 20–22 can be found. Additionally, a signal at 16 becamevery wide and was transformed into the arm of the main signal. These changes in signals confirm thealteration in the cellulose organisation similar to what was observed for wheat straw. At the sametime, as these signals are still not complete defined, contrary to what was observed for the wheatstraw cellulose-rich sample, it may indicate that in case of eucalyptus residues, the transformationof crystalline cellulose is less effective and may require longer pre-treatment time. Regardless ofthe reasons, the observed changes in the XRD patterns justify the fact that even partial alteration ofbiomass crystallinity is sufficient to promote more efficient enzymatic hydrolysis, as demonstrated inthis work. Similar results were presented in the literature, where it was confirmed that cellulose II ismore readily digested than cellulose I. It has been argued that the van der Waals interactions betweenhydrogen-bonded sheets in cellulose I are stronger than in cellulose II and that they act as the mainfactor in resisting cellulose hydrolysis [40]. Li et al. compared the pre-treatment of switchgrass with
237
Molecules 2019, 24, 808
[emim][OAc] and with a 1.2% (w/w) dilute sulphuric acid [41]. For both untreated and dilute acidpre-treated switchgrass samples, little or no change in cellulose crystallinity was observed, but for thesample obtained after pre-treatment with [emim][OAc] the crystallinity was altered significantly, witha structural transformation from cellulose I to cellulose II observed. This, in turn, promoted betterperformance of enzymatic hydrolysis.
3. Materials and Methods
3.1. Materials
The wheat straw sample was delivered by ECN (Energy Research Centre of the Netherlands,),from Petten, the Netherlands. The eucalyptus residues were kindly provided by The NavigatorCompany from their paper mill in Cacia, Portugal. The wheat straw and eucalyptus residues moisturecontent was found to be 9.8 and 8.4% (w/w), respectively and was determined using an AMB-50moisture analyser.
Both feedstocks were ground with a knife mill IKA® WERKE, MF 10 basic (Staufen, Germany) toparticles smaller than 0.5 mm, homogenised in a defined lot, and stored in plastic containers at roomtemperature prior to further use.
The [emim][HSO4] IL (99 wt.% of purity) was purchased from Iolitec GmBH—Heilbronn,Germany and was used in reactions without any previous purification. The water content in ILwas determined by a volumetric Karl-Fischer titration and was 3796 ppm. The [emim][OAc] withstated purity >95% was purchased from Iolitec GmbH—Heilbronn, Germany. Prior to use in thepre-treatment, this IL was subject to drying under vacuum (0.1 Pa) at room temperature for at least24 h. The water content in this IL was 2800 ppm, determined by a volumetric Karl-Fischer titration asfor the other IL.
In pre-treatment experiments, the following reagents were used: 0.1 M and 3% (w/w)NaOH aqueous solutions prepared from NaOH pellets (99% purity) supplied by Eka chemicals/Akzonobel–Bohus, Sweden. The aqueous solutions of 1 M and 4 M HCl were prepared from fumingHCl 37% (w/w) with a purity grade for analysis (Merck—Darmstadt, Germany). Ethanol 96% (v/v) andacetonitrile of HPLC-gradient purity for analysis (Carlo Erba Group—Arese, Italy) and acetone (98%purity) were supplied by Valente & Ribeiro, Lda.—Belas, Portugal. For the preparation of NaOH andHCl solutions, distilled water (17 M Ω cm−1) and ultrapure water (18.2 MΩ cm−1) both produced bythe PURELAB Classic of Elga system were used.
For filtration, paper and glass microfibre filters (Whatman GE Healthcare Bio-SciencesCorp.—Piscataway, NJ, USA) and nylon filters, 0.45 lm HNPW (Merck Millipore—Billerica, MA,USA) were used.
Glucose (≥98 wt.%, Merck—Darmstadt, Germany), xylose (≥98 wt.%, Merck, Germany), arabinose(≥98 wt.%, Merck, Germany), furfural (furan-2-carbaldehyde) (99 wt.%, Sigma-Aldrich—Steinheim,Germany), 5-hydroxymethylfurfural (5-(hydroxymethyl)-2-furaldehyde) (99 wt.%, Sigma-Aldrich,Germany) and acetic acid (glacial, 99.8 wt.% Merck—Darmstadt, Germany) were used for thequalitative and quantitative HPLC analyses of the obtained liquids and solids. Sulphuric acid (96 wt.%,Panreac—Castellar del Vallès, Spain) was used to prepare mobile phase for HPLC analyses (5 mMsulphuric acid).
For the enzymatic hydrolysis assays, 0.1 M sodium citrate buffer (pH 4.8) prepared from citric acidmonohydrate (99.7% purity) and tris-sodium citrate (>99% purity) both from VWR InternationalLtd.—Leicester, England and a 2 wt.% sodium azide solution were used. Celli®CTec2 enzymesolution kindly provided by Novozymes A/S Europe—Bagsvaerd, Denmark was employed in theenzymatic reaction.
238
Molecules 2019, 24, 808
3.2. Biomass and Pre-Treated Solid Characterisation
Both biomasses and pre-treated solids were characterised to determine the total moisture [42],total lignin and polysaccharide contents [27]. Acid-insoluble lignin was determined gravimetrically,while acid-soluble lignin was established using UV spectrophotometry. The content of glucan andhemicelluloses (xylan, arabinan, and acetyl groups) was determined using high performance liquidchromatography (HPLC) equipment. Furthermore, for native biomasses, total extractives, ash andprotein contents were determined according to standard methods, namely: NREL/TP-510-42619 [43],NREL/TP-510-42622 [44] and ISO 8968-1:2014 [45], respectively.
The composition of both biomasses is presented in Table 1.
Table 1. Wheat straw and eucalyptus residues macromolecular composition.
Components (Dry Weight %) Wheat Straw Eucalyptus Residues
Glucan 35.9 ± 0.3 44.1 ± 0.9Hemicellulose 26.7 19.6
Xylan 22.1 ± 0.6 15.7 ± 0.2Arabinosyl group 2.0 ± 0.7 0.5 ± 0.1
Acetyl group 2.6 ± 0.9 3.4 ± 0.9Lignin 16.7 33.8
Acid-insoluble 15.5 ± 0.4 26.4 ± 0.1Acid-soluble 1.2 ± 0.1 7.4 ± 0.1
Ash 11.4 ± 0.1 1.0 ± 0.1Extractives
Water 9.4 ± 1.3 3.3 ± 0.4Water (not ash) 5.1 ± 0.5 0.2 ± 0.0
Ethanol 1.4 ± 0.1 1.5 ± 0.1
3.3. Biomass Processing
3.3.1. Pre-Treatment of Biomass with [emim][HSO4]
All reactions were performed with a 10 wt.% of dry biomass in the reaction mixture. For thispurpose, 0.5 g of dry biomass and 4.5 g of aqueous IL solution with different [emim][HSO4]/H2Oratios, were placed into a 15 mL glass vial (Supelco/Sigma-Aldrich, Bellefonte, PA, USA). Next, a vialwas placed into the oil bath pre-heated to the desired temperature (140 C), and reactions were carriedout for 90 min, under continuous magnetic stirring. The reaction condition was selected on the basisof previously published work [17]. After reaction, the mixture was cooled to room temperatureand approximately 5.0 mL of ultrapure H2O was added to precipitate non-hydrolysed fractions.The resulting mixture was filtered under vacuum using 0.45 µm nylon membrane filters. The liquidphase was collected and stored in a freezer for posterior analysis by HPLC, while recovered solidbiomass was washed with 100 mL of ultrapure H2O (in 10 mL portions) to guarantee removal of ILfrom the precipitated solid. Next, the obtained solid was placed in the oven at 60 C for 24 h andafterwards was stored at room temperature for 1 h to analyse the dry mass content. The compositionof the solid was analysed as presented in Section 2.2.
3.3.2. Pre-Treatment of Biomass with [emim][OAc]
The pre-treatment was performed according to a method presented in the literature [11]. Reactionswere performed at two different temperatures (120 or 140 C) for 2 h with a 5% (w/w) biomass/ILratio in a 15 mL vial. Following the aforementioned procedure presented in the literature, three solidfractions, rich in cellulose, hemicellulose and lignin were obtained. All of them were characterisedaccording to methods presented in Section 2.2.
239
Molecules 2019, 24, 808
3.4. Enzymatic Hydrolysis of Solids
The digestibility of pre-treated solids obtained with [emim][HSO4] or [emim][OAc] was evaluatedby enzymatic hydrolysis. The assays were performed using 5% (w/v) solids (dry weight basis)concentration in 50 mL vials with 5 mL of 0.05 M sodium citrate buffer (pH 5), prepared from citricacid monohydrate and tris-sodium citrate and 100 µL of a 2 wt.% sodium azide solution to preventundesired growth of microorganisms. Distilled water was added to reach 5.0 mL taking into accountthe volume of enzyme added last. The enzyme dosage used was 10% (w/w cellulose) of Celli®CTec2(199.9 FPU·mL−1). The enzymatic hydrolyses were performed in a shaking incubator (Optic Ivymensystem—Madrid, Spain) at 180 rpm and 50 C for 72 h. After hydrolysis, enzymes were inactivatedby freezing the samples. To measure monosaccharide content, the hydrolysates were filtered undervacuum using nylon filters (pore size of 0.45 µm) and analysed by HPLC. The glucose and xylose yieldswere calculated considering the glucan and xylan contents and factors of (162/180) and (132/150) fordehydration, respectively.
3.5. Chemical Analysis
3.5.1. HPLC Analysis
The liquid phases obtained from the pre-treatment of biomass with [emim][HSO4] and enzymatichydrolyses, as well as from native or pre-treated biomass characterisation were analysed using Agilent110 series equipment with a Bio-Rad Aminex HPX-87H column (Hercules, CA, USA). Analyses wereperformed at 65 C with 5 mmol·L−1 H2SO4 used as the mobile phase at a flow rate of 0.6 mL·min−1.The detection was performed using RID (refractive index detector) for monosaccharides (glucose,xylose and arabinose) and acetic acid and DAD (diode array detector) at 280 nm wavelength forfurans (furfural and 5-HMF ≡ 5-hydroxymethylfurfural). The quantitative analyses were performedby external calibration using standard solutions.
3.5.2. XRD Measurements
The crystallinity analyses of untreated biomasses and pre-treated materials were performed byX-ray powder diffraction (XRD). For this purpose, a Rigaku Geigerflex D/MAX-III C X-ray powderdiffractometer with vertical goniometer, Bragg-Brentano geometry and graphite monochromator wasused. The CuKα radiation (λ = 1.5418 Å) at 45 kV and 20 mA was used. The samples were analysed inthe range of 2θ from 5 to 50 with increments of 0.02.
3.6. Experimental Uncertainty
Each weighing was made with a standard uncertainty (u) u(m) of 0.1 mg. All pretreatmentexperiments were performed with a u(T) of 2 C. All enzymatic hydrolysis experiments were performedwith a u(T) of 0.1 C. All other experimental errors related to measurements depended on the calibrationtechnique used to quantify the concentrations of products. All reactions (pre-treatments and enzymatichydrolyses) and analyses were performed in duplicate and results are given as mean values with thecorresponding standard deviation.
4. Conclusions
The present work takes a major step towards providing a comparative framework between twoIL-type pre-treatments coupled with enzymatic saccharification, in terms of their performance onconverting wheat straw and eucalyptus residues to fermentable sugars. The first strategy reliedon the processing of biomass with hydrogen-bond acidic IL. This approach allowed integration ofbiomass pre-treatment, hydrolysis and conversion of biomass in a single-step process. The acidiccharacter of the [HSO4] anion of IL promoted a selective processing of hemicellulose fraction and theresulting products (mainly pentoses and furfural) were kept in a liquid phase. The solids produced
240
Molecules 2019, 24, 808
were mainly constituted of cellulose and lignin. The second approach with hydrogen-bond basic IL,allowed biomass dissolution and fractionation into cellulose-, hemicellulose- and lignin-rich fractions.In this case, the recalcitrance of the lignocellulosic matrix was overcome by alteration of the strongnetwork of intra- and intermolecular bonds existing in the biomass. Consequently, a loss of nativecellulose crystalline I structure was observed, and the cellulose II form was obtained, which was notobserved for solids produced by [emim][HSO4]. This, in turn allowed a significant improvement inthe enzymatic hydrolysis yields to be obtained.
Supplementary Materials: The following are available online: Table S1. Composition of cellulose- andhemicellulose-rich fractions obtained from wheat straw pre-treated with [emim][OAc] at 120 and 140 C and 2 h;Table S2. Composition of cellulose-rich fractions obtained from eucalyptus pre-treated with [emim][OAc] at 120and 140 C and 2 h.
Author Contributions: Conceptualisation and Methodology, J.R.B. and R.M.Ł.; Writing—Original DraftPreparation, J.R.B.; Writing—Review & Editing, R.M.Ł.; Funding Acquisition, F.M.G. and R.M.Ł.
Funding: This research was funded under the AMBITION (Advanced biofuel production with energy systemintegration work) project funded by the European H2020-programme under the LCE-33 2016 European CommonResearch and Innovation Agendas (ECRIAs) in support of the implementation of the SET Action Plan, GrantAgreement 731263. This work was also supported by the Fundação para a Ciência e a Tecnologia (FCT, Portugal)through BBRI - Biomass and Bioenergy Research Infrastructure (ROTEIRO/0189/2013) and grant IF/00471/2015(RML). The authors also wish to thank Teresa Diamantino and Isabel Figueira (LRM, UER, LNEG) for XRDmeasurements. Finally, the authors also wish to thank Susana Marques (UB, LNEG) for conceptualisation of theenzymatic hydrolysis assays as well as Maria do Céu Penedo (UB, LNEG) for assistance in the HPLC analyses.
Conflicts of Interest: The authors declare no conflict of interest.
References
1. Sun, S.; Sun, S.; Cao, X.; Sun, R. The role of pretreatment in improving the enzymatic hydrolysis oflignocellulosic materials. Bioresour. Technol. 2016, 199, 49–58. [CrossRef] [PubMed]
2. Silveira, M.H.L.; Morais, A.R.C.; da Costa Lopes, A.M.; Olekszyszen, D.N.; Bogel-Lukasik, R.; Andreaus, J.;Ramos, L.P. Current Pretreatment Technologies for the Development of Cellulosic Ethanol and Biorefineries.ChemSusChem 2015, 8, 3366–3390. [CrossRef] [PubMed]
3. Girio, F.M.; Fonseca, C.; Carvalheiro, F.; Duarte, L.C.; Marques, S.; Bogel-Lukasik, R. Hemicelluloses for fuelethanol: A review. Bioresour. Technol. 2010, 101, 4775–4800. [CrossRef] [PubMed]
4. Anugwom, I.; Eta, V.; Virtanen, P.; Maki-Arvela, P.; Hedenstrom, M.; Hummel, M.; Sixta, H.; Mikkola, J.P.Switchable ionic liquids as delignification solvents for lignocellulosic materials. ChemSusChem 2014, 7,1170–1176. [CrossRef] [PubMed]
5. Da Costa Lopes, A.M.; Bogel-Lukasik, R. Acidic Ionic Liquids as Sustainable Approach of Celluloseand Lignocellulosic Biomass Conversion without Additional Catalysts. ChemSusChem 2015, 8, 947–965.[CrossRef] [PubMed]
6. Brandt, A.; Grasvik, J.; Hallett, J.P.; Welton, T. Deconstruction of lignocellulosic biomass with ionic liquids.Green Chem. 2013, 15, 550–583. [CrossRef]
7. Putro, J.N.; Soetaredjo, F.E.; Lin, S.-Y.; Ju, Y.-H.; Ismadji, S. Pretreatment and conversion of lignocellulosebiomass into valuable chemicals. RSC Adv. 2016, 6, 46834–46852. [CrossRef]
8. Janesko, B.G. Modeling interactions between lignocellulose and ionic liquids using DFT-D. Phys. Chem.Chem. Phys. 2011, 13, 11393–11401. [CrossRef] [PubMed]
9. Da Costa Lopes, A.M.; João, K.G.; Bogel-Lukasik, E.; Roseiro, L.B.; Bogel-Lukasik, R. Pretreatment andFractionation of Wheat Straw Using Various Ionic Liquids. J. Agric. Food Chem. 2013, 61, 7874–7882.[CrossRef] [PubMed]
10. Swatloski, R.P.; Spear, S.K.; Holbrey, J.D.; Rogers, R.D. Dissolution of cellulose [correction of cellose] withionic liquids. J. Am. Chem. Soc. 2002, 124, 4974–4975. [CrossRef] [PubMed]
11. Magalhães da Silva, S.P.; da Costa Lopes, A.M.; Roseiro, L.B.; Bogel-Lukasik, R. Novel pre-treatmentand fractionation method for lignocellulosic biomass using ionic liquids. RSC Adv. 2013, 3, 16040–16050.[CrossRef]
12. Brandt, A.; Hallett, J.P.; Leak, D.J.; Murphy, R.J.; Welton, T. The effect of the ionic liquid anion in thepretreatment of pine wood chips. Green Chem. 2010, 12, 672–679. [CrossRef]
241
Molecules 2019, 24, 808
13. Zakrzewska, M.E.; Bogel-Lukasik, E.; Bogel-Lukasik, R. Solubility of Carbohydrates in Ionic Liquids.Energ. Fuel 2010, 24, 737–745. [CrossRef]
14. Gillet, S.; Aguedo, M.; Petitjean, L.; Morais, A.; da Costa Lopes, A.; Łukasik, R.; Anastas, P. Lignintransformations for high value applications: Towards targeted modifications using green chemistry.Green Chem. 2017, 19, 4200–4233. [CrossRef]
15. Anugwom, I.; Maki-Arvela, P.; Virtanen, P.; Willfor, S.; Sjoholm, R.; Mikkola, J.P. Selective extraction ofhemicelluloses from spruce using switchable ionic liquids. Carbohydr. Polym. 2012, 87, 2005–2011. [CrossRef]
16. Verdia, P.; Brandt, A.; Hallett, J.P.; Ray, M.J.; Welton, T. Fractionation of lignocellulosic biomass with the ionicliquid 1-butylimidazolium hydrogen sulfate. Green Chem. 2014, 16, 1617–1627. [CrossRef]
17. Da Costa Lopes, A.M.; Lins, R.M.G.; Rebelo, R.A.; Lukasik, R.M. Biorefinery approach for lignocellulosicbiomass valorisation with acidic ionic liquid. Green Chem. 2018, 20, 4043–4057. [CrossRef]
18. Brandt, A.; Ray, M.J.; To, T.Q.; Leak, D.J.; Murphy, R.J.; Welton, T. Ionic liquid pretreatment of lignocellulosicbiomass with ionic liquid–water mixtures. Green Chem. 2011, 13, 2489–2499. [CrossRef]
19. Carvalho, A.V.; da Costa Lopes, A.M.; Bogel-Lukasik, R. Relevance of the acidic 1-butyl-3-methylimidazoliumhydrogen sulphate ionic liquid in the selective catalysis of biomass hemicellulose fraction. RSC Adv. 2015, 5,47153–47164. [CrossRef]
20. Li, C.Z.; Wang, Q.; Zhao, Z.K. Acid in ionic liquid: An efficient system for hydrolysis of lignocellulose. GreenChem. 2008, 10, 177–182. [CrossRef]
21. Cox, B.J.; Ekerdt, J.G. Depolymerization of oak wood lignin under mild conditions using the acidic ionicliquid 1-H-3-methylimidazolium chloride as both solvent and catalyst. Bioresour. Technol. 2012, 118, 584–588.[CrossRef] [PubMed]
22. Chen, L.; Sharifzadeh, M.; Mac Dowell, N.; Welton, T.; Shah, N.; Hallett, J.P. Inexpensive ionicliquids:[HSO4]−-based solvent production at bulk scale. Green Chem. 2014, 16, 3098–3106. [CrossRef]
23. Peleteiro, S.; Garrote, G.; Santos, V.; Parajó, J.C. Conversion of hexoses and pentoses into furans in an ionicliquid. Afinidad 2014, 71, 202–206.
24. Peleteiro, S.; Rivas, S.; Alonso, J.L.; Santos, V.; Parajó, J.C. Furfural production using ionic liquids: A review.Bioresour. Technol. 2016, 202, 181–191. [CrossRef] [PubMed]
25. Peleteiro, S.; da Costa Lopes, A.M.; Garrote, G.; Parajó, J.C.; Bogel-Łukasik, R. Simple and Efficient FurfuralProduction from Xylose in Media Containing 1-Butyl-3-Methylimidazolium Hydrogen Sulfate. Ind. Eng.Chem. Res. 2015, 54, 8368–8373. [CrossRef]
26. Patil, S.K.; Lund, C.R. Formation and growth of humins via aldol addition and condensation duringacid-catalyzed conversion of 5-hydroxymethylfurfural. Energy Fuels 2011, 25, 4745–4755. [CrossRef]
27. Sluiter, A.; Hames, B.; Ruiz, R.; Scarlata, C.; Sluiter, J.; Templeton, D.; Crocker, D. Determination of StructuralCarbohydrates and Lignin in Biomass—Laboratory Analytical Procedure (LAP); National Renewable EnergyLaboratory: Golden, CO, USA, 2011.
28. Xu, J.-K.; Chen, J.-H.; Sun, R.-C. Hydrothermal microwave valorization of eucalyptus using acidic ionicliquid as catalyst toward a green biorefinery scenario. Bioresour. Technol. 2015, 193, 119–127. [CrossRef][PubMed]
29. Rahikainen, J.L.; Evans, J.D.; Mikander, S.; Kalliola, A.; Puranen, T.; Tamminen, T.; Marjamaa, K.; Kruus, K.Cellulase–lignin interactions—The role of carbohydrate-binding module and pH in non-productive binding.Enzyme Microb. Technol. 2013, 53, 315–321. [CrossRef] [PubMed]
30. Selig, M.; Weiss, N.; Ji, Y. Enzymatic Saccharification of Lignocellulosic Biomass: Laboratory Analytical Procedure(LAP); National Renewable Energy Laboratory—NREL: Golden, CO, USA, 2008; pp. 80401–83393.
31. Labbe, N.; Kline, L.M.; Moens, L.; Kim, K.; Kim, P.C.; Hayes, D.G. Activation of lignocellulosic biomass byionic liquid for biorefinery fractionation. Bioresour. Technol. 2012, 104, 701–707. [CrossRef] [PubMed]
32. Da Costa Lopes, A.M.; Joao, K.G.; Rubik, D.F.; Bogel-Lukasik, E.; Duarte, L.C.; Andreaus, J.; Bogel-Lukasik, R.Pre-treatment of lignocellulosic biomass using ionic liquids: Wheat straw fractionation. Bioresour. Technol.2013, 142, 198–208. [CrossRef] [PubMed]
33. Sun, N.; Rahman, M.; Qin, Y.; Maxim, M.L.; Rodriguez, H.; Rogers, R.D. Complete dissolution and partialdelignification of wood in the ionic liquid 1-ethyl-3-methylimidazolium acetate. Green Chem. 2009, 11,646–655. [CrossRef]
242
Molecules 2019, 24, 808
34. Bian, J.; Peng, F.; Peng, X.P.; Xiao, X.; Peng, P.; Xu, F.; Sun, R.C. Effect of [Emim]Ac pretreatment on thestructure and enzymatic hydrolysis of sugarcane bagasse cellulose. Carbohydr. Polym. 2014, 100, 211–217.[CrossRef] [PubMed]
35. Torr, K.M.; Love, K.T.; Simmons, B.A.; Hill, S.J. Structural features affecting the enzymatic digestibility ofpine wood pretreated with ionic liquids. Biotechnol. Bioeng. 2016, 113, 540–549. [CrossRef] [PubMed]
36. Atalla, R.H.; VanderHart, D.L. Native cellulose: A composite of two distinct crystalline forms. Science 1984,223, 283–286. [CrossRef] [PubMed]
37. Karimi, K.; Taherzadeh, M.J. A critical review of analytical methods in pretreatment of lignocelluloses:Composition, imaging, and crystallinity. Bioresour. Technol. 2016, 200, 1008–1018. [CrossRef] [PubMed]
38. Morais, A.R.C.; Vaz Pinto, J.; Nunes, D.; Roseiro, L.B.; Oliveira, M.C.; Fortunato, E.; Bogel-Lukasik, R.Imidazole: Prospect Solvent for Lignocellulosic Biomass Fractionation and Delignification. ACS Sustain.Chem. Eng. 2016, 4, 1643–1652. [CrossRef]
39. Cheng, G.; Varanasi, P.; Arora, R.; Stavila, V.; Simmons, B.A.; Kent, M.S.; Singh, S. Impact of Ionic LiquidPretreatment Conditions on Cellulose Crystalline Structure Using 1-Ethyl-3-methylimidazolium Acetate.J. Phys. Chem. B 2012, 116, 10049–10054. [CrossRef] [PubMed]
40. Wada, M.; Ike, M.; Tokuyasu, K. Enzymatic hydrolysis of cellulose I is greatly accelerated via its conversionto the cellulose II hydrate form. Polym. Degrad. Stab. 2010, 95, 543–548. [CrossRef]
41. Li, C.; Knierim, B.; Manisseri, C.; Arora, R.; Scheller, H.V.; Auer, M.; Vogel, K.P.; Simmons, B.A.; Singh, S.Comparison of dilute acid and ionic liquid pretreatment of switchgrass: Biomass recalcitrance, delignificationand enzymatic saccharification. Bioresour. Technol. 2010, 101, 4900–4906. [CrossRef] [PubMed]
42. Sluiter, A.; Hames, B.; Hyman, D.; Payne, C.; Ruiz, R.; Scarlata, C.; Sluiter, J.; Templeton, D.; Wolfe, J.Determination of Total Solids in Biomass and Total Dissolved Solids in Liquid Process Samples; National RenewableEnergy Laboratory: Golden, CO, USA, 2008.
43. Sluiter, A.; Ruiz, R.; Scarlata, C.; Sluiter, J.; Templeton, D. Determination of Extractives in Biomass; NationalRenewable Energy Laboratory: Golden, CO, USA, 2008.
44. Sluiter, A.; Hames, B.; Ruiz, R.; Scarlata, C.; Sluiter, J.; Templeton, D. Determination of Ash in Biomass; NationalRenewable Energy Laboratory: Golden, CO, USA, 2008.
45. Milk and Milk Products—Determination of Nitrogen Content—Part 1: Kjeldahl Principle and Crude ProteinCalculation; ISO 8968-1:2014; International Organization for Standarization: Geneve, Switzerland, 2014.
Sample Availability: Samples of the compounds are not available from the authors.
© 2019 by the authors. Licensee MDPI, Basel, Switzerland. This article is an open accessarticle distributed under the terms and conditions of the Creative Commons Attribution(CC BY) license (http://creativecommons.org/licenses/by/4.0/).
243

MDPISt. Alban-Anlage 66
4052 BaselSwitzerland
Tel. +41 61 683 77 34Fax +41 61 302 89 18
www.mdpi.com
Molecules Editorial OfficeE-mail: [email protected]
www.mdpi.com/journal/molecules

MDPI St. Alban-Anlage 66 4052 Basel Switzerland
Tel: +41 61 683 77 34 Fax: +41 61 302 89 18
www.mdpi.com ISBN 978-3-0365-1793-3
Related Documents