EFFICIENT EVACUATION OF TALL BUILDINGS IN FIRES USING LIFTS A thesis submitted to the University of Manchester for the degree of Master of Philosophy in the Faculty of Engineering and Physical Sciences. Ian Hall School of Mechanical, Aerospace and Civil Engineering 2010

Welcome message from author
This document is posted to help you gain knowledge. Please leave a comment to let me know what you think about it! Share it to your friends and learn new things together.
Transcript

EFFICIENT EVACUATION OF TALL BUILDINGS IN FIRES USING LIFTS
A thesis submitted to the University of Manchester for the degree of Master of
Philosophy in the Faculty of Engineering and Physical Sciences.
Ian Hall
School of Mechanical, Aerospace and Civil Engineering
2010
2
CONTENTS
1.0 CHAPTER 1 - INTRODUCTION ..................................................................................... 15
1.1 Code Compliant Means of Escape ................................................... 15
1.2 Use of Lifts for Evacuation ............................................................ 17
1.3 Research Objectives .................................................................... 19
1.4 Theoretical Building ..................................................................... 20
1.5 Thesis Layout .............................................................................. 21
2.0 CHAPTER 2 - LITERATURE REVIEW ............................................................................. 23
2.1 Impact of the World Trade Centre Attacks (2001) ............................ 23
2.2 Evacuation of Disabled Persons ..................................................... 24
2.3 Existing Lift Evacuation Systems ................................................... 26
2.3.1 Eureka Place Tower, Melbourne .................................................................... 26
2.3.2 Stratosphere Tower, Las Vegas ...................................................................... 26
2.3.3 Petronas Twin Towers, Kuala Lumpur ........................................................... 28
2.3.4 Summary ........................................................................................................ 30
2.4 Concern of the Use of Lifts for the Evacuation of Building Occupants .. 30
2.5 Protection of Refuge Area’s ........................................................... 32
2.5.1 Fire Resisting Construction ............................................................................ 33
2.5.2 Ventilation ...................................................................................................... 33
2.5.3 Provision of Refuges ....................................................................................... 34
2.5.4 Summary ........................................................................................................ 35
2.6 Lift Technology ............................................................................ 35
2.6.1 Lift Controls .................................................................................................... 36
2.6.2 Lift Speeds ...................................................................................................... 38
2.6.3 Lift Acceleration ............................................................................................. 39
2.6.4 Multiple Deck Lifts ......................................................................................... 39
2.6.5 Summary of Lift Performance Values ............................................................ 41
2.7 Occupant Behaviour ..................................................................... 42
2.7.1 Escape via Entry Route ................................................................................... 42
2.7.2 Waiting Times ................................................................................................ 43
2.7.3 Panic Behaviour.............................................................................................. 44
2.7.4 Summary of Information ................................................................................ 45
2.8 Summary ................................................................................... 46
3.0 CHAPTER 3 - METHODS OF ANALYSIS ........................................................................ 47
3.1 Introduction ................................................................................ 47
3.2 Calculation of Evacuation Time Using Stairs .................................... 47

3
3.2.1 Method detailed by Nelson and Mowrer ...................................................... 49
3.2.2 Method by Pauls ............................................................................................ 50
3.2.3 Method Based on Approved Document B ..................................................... 52
3.2.4 STEPS Assessment of Stair Conditions ........................................................... 53
3.2.5 Occupant Fatigue ........................................................................................... 55
3.2.6 Summary ........................................................................................................ 57
3.3 Calculation of Evacuation Time Using Lifts ...................................... 58
3.3.1 Introduction ................................................................................................... 58
3.3.2 Calculation Developed By Siikonen ................................................................ 59
3.3.3 Calculation Procedure Developed By Japanese Researchers ........................ 61
3.3.4 STEPS .............................................................................................................. 66
3.3.5 ELVAC ............................................................................................................. 70
3.3.6 ELEVATE ......................................................................................................... 84
3.4 Summary of Methods of Analysis ................................................... 85
4.0 CHAPTER 4 - PREVIOUS SIMULATIONS ...................................................................... 87
4.1 Bazjanac V. (1977) ...................................................................... 87
4.1.1 Summary of Study .......................................................................................... 87
4.1.2 Summary ........................................................................................................ 88
4.2 Pauls (1977) ............................................................................... 89
4.2.1 Summary of study .......................................................................................... 90
4.2.2 Results of Simulation ..................................................................................... 91
4.2.3 Summary ........................................................................................................ 92
4.3 Siikonen (2003) .......................................................................... 93
4.3.1 Summary of Comparative Assessment .......................................................... 93
4.3.2 Summary of Studies ....................................................................................... 95
4.3.3 Summary ........................................................................................................ 97
4.4 Wong et al (2005) ....................................................................... 98
4.4.1 Summary of Study .......................................................................................... 98
4.4.2 Results of Simulations .................................................................................... 98
4.4.3 Summary ...................................................................................................... 101
4.5 BRE Research ........................................................................... 102
4.5.1 Introduction ................................................................................................. 102
4.5.2 Summary of Study ........................................................................................ 103
4.6 Summary ................................................................................. 105
5.0 CHAPTER 5 - CALCULATION VARIABLES ................................................................... 106
5.1 Introduction .............................................................................. 106

4
5.2 Lift Specification ........................................................................ 106
5.2.1 Lift Speed ..................................................................................................... 106
5.2.2 Lift Acceleration ........................................................................................... 107
5.2.3 Door Opening and Closing Time .................................................................. 107
5.2.4 Lift Car Capacity ........................................................................................... 107
5.3 ELVAC Inefficiencies ................................................................... 107
5.4 STEPS Variables ........................................................................ 108
5.4.1 Dwell Time ................................................................................................... 109
5.4.2 Motor Delay ................................................................................................. 109
5.4.3 Summary ...................................................................................................... 109
5.5 Refuge Floor Location ................................................................. 110
5.6 Stair/Lift Evacuation Ratio .......................................................... 110
5.7 Occupancies ............................................................................. 111
5.8 Summary ................................................................................. 112
6.0 CHAPTER 6 - STEPS MODELLING .............................................................................. 114
6.1 Introduction .............................................................................. 114
6.2 Sensitivity Study ....................................................................... 114
6.2.1 Cell Grid Size ................................................................................................. 115
6.2.2 Walking Speed .............................................................................................. 117
6.2.3 Patience ........................................................................................................ 118
6.2.4 Summary ...................................................................................................... 121
6.3 Results ..................................................................................... 121
6.3.1 Comparison of Phased and Simultaneous Evacuation ................................. 122
6.3.2 Space per Person .......................................................................................... 123
6.3.3 Number of Occupants Evacuated ................................................................ 124
6.3.4 Stair Flow Rate ............................................................................................. 126
6.3.5 Lift Waiting Times ........................................................................................ 128
6.3.6 Effects of Reduced Occupancy ..................................................................... 128
6.3.7 Summary ...................................................................................................... 129
7.0 CHAPTER 7 - ANALYSIS OF RESULTS ......................................................................... 130
7.1 Code Compliant Evacuation ........................................................ 130
7.2 Evacuation via Lifts Only ............................................................ 132
7.2.1 Refuge Floor ................................................................................................. 132
7.2.2 Evacuation Zone ........................................................................................... 136
7.3 Evacuation via Stairs and Lifts (75% Lift Usage) ............................ 142
7.3.1 Introduction ................................................................................................. 142

5
7.3.2 Refuge Floor ................................................................................................. 143
7.3.3 Evacuation Zone ........................................................................................... 146
7.4 Evacuation via Stairs and Lifts (50% Lift Usage) ............................ 151
7.4.1 Refuge Floor ................................................................................................. 152
7.4.2 Evacuation Zone ........................................................................................... 157
7.5 Analysis of Combined Lift Performance Values ............................... 163
7.6 Comparison of Calculation Methods and Lift Variables on the Evacuation
Time 165
7.6.1 Refuge Floors ............................................................................................... 165
7.6.2 Evacuation Zone ........................................................................................... 166
7.6.3 Summary ...................................................................................................... 167
7.7 Analysis of Results ..................................................................... 167
8.0 CHAPTER 8 - CONCLUSIONS AND RECOMMENDATIONS ......................................... 169
8.1 Comparison of Refuge Floors and Evacuation Zones ....................... 169
8.2 Calculation Methods ................................................................... 171
8.2.1 Stair Evacuation ........................................................................................... 171
8.2.2 Lift Evacuation .............................................................................................. 172
8.3 Application of Lift Evacuation Strategy ......................................... 173
8.4 Conclusion ................................................................................ 174
9.0 REFERENCES ............................................................................................................. 177
10.0 APPENDIX........................................................................................................181
Word Count: 45,497
6
List of Figures
Figure 1.2 (a) – Evacuation of occupants from floor of origin 18
Figure 1.2 (b) – Evacuation from a refuge floor 19
Figure 1.4 – Plan of upper floor level of theoretical building 21
Figure 2.3.2 – Stratosphere Tower 27
Figure 2.3.2 (a) – Lower refuge floor level of Stratosphere Tower 28
Figure 2.6.4 – Simulated evacuation times with Single Deck, Double Deck and
Triple Deck lift systems 41
Figure 2.7.2 – Comparison of occupant traces 44
Figure 3.2.1 - Effective Width and Clear Width 49
Figure 3.2.3 – Predicted and observed total evacuation times for tall office buildings 51
Figure 3.2.3 (a) – Predicted and observed total evacuation times from tall office 52
Buildings
Figure 3.2.4 - Occupant flow rate during simultaneous evacuation 54
Figure 3.2.4 (a) - Occupant flow rate during phased evacuation 54
Figure 3.2.5 – Comparison of time for evacuation using fatigue sub-model 57
Figure 3.3.3 – Graphical representation of single lift trip 62
Figure 3.3.3.1 – Section of building used in Sekizawa’s calculations 65
Figure 3.3.5.3 – Velocity of lift reaching normal operating velocity 76
Figure 4.2 – Trace of occupant movement for a 15 storey building 90
Figure 4.2.2 – Occupant trace for lift evacuation of 40 storey office building 91
Figure 4.3.1.3 – Evacuation time for scenarios 1, 2 and 3 95
Figure 4.3.2 – Egress times with stairs and lifts 97
Figure 4.4.2 – Cumulative percentage of occupants evacuated 99
Figure 4.4.2 (a) – Number of occupants evacuated 100
Figure 4.4.2 (b) – Percentage of occupants contained on refuge floor at
high level 100
Figure 4.4.2 (c) – Percentage of occupants contained on refuge floor at mid level 101
Figure 4.5.2 – People inside building at set time 103
Figure 6.2.1 – STEPS stair flow rates based on different grid sizes 117
Figure 6.2.2 – Evacuation times based on walking speeds 118
Figure 6.2.3 – Number of occupants evacuated via Stair 1 119
Figure 6.2.3 (a) – Number of occupants evacuated via Stair 2 120
Figure 6.2.3 (b) – Time for evacuation based on patience level 120

7
Figure 6.3.1 – Comparison of simultaneous and phased evacuation 122
Figure 6.3.3 – Evacuation time lines 125
Figure 6.3.4 – Stair flow rate serving 10th
floor level 127
Figure 6.3.6 – Flow rate in stair serving 30th
refuge floor 128
Figure 7.1 – Time for evacuation using stairs only 131
Figure 7.2.1.2 – Summary of lift and stair evacuation times 134
Figure 7.2.1.2 (a) – Evacuation from refuge floors at 10 storey intervals
compared to code compliant evacuation time 134
Figure 7.2.1.2 (b) – Evacuation from refuge floors at 15 storey intervals
compared to code compliant evacuation time 135
Figure 7.2.1.2 (c) – Evacuation from refuge floors at 20 storey intervals
compared to code compliant evacuation time 136
Figure 7.2.2.1 – Indicative diagram of stair evacuation times for comparison to
evacuation zone lift times 137
Figure 7.2.2.2 – Summary of evacuation from evacuation zones at 10
storey intervals 140
Figure 7.2.2.2(a) – Summary of evacuation from evacuation zones at 15 storey intervals 141
Figure 7.3.2.2 – Evacuation from refuge floors at 10 storey intervals compared
to code compliant evacuation time 144
Figure 7.3.2.2 (a) – Evacuation from refuge floors at 15 storey intervals
compared to code compliant evacuation time 144
Figure 7.3.2.2 (b) – Evacuation from refuge floors at 20 storey intervals
compared to code compliant evacuation time 146
Figure 7.3.3.2 – Comparison of code compliant stair evacuation time with lift
evacuation from 10 storey evacuation zones 148
Figure 7.3.3.2 (a) – Comparison of code compliant stair evacuation time with lift
evacuation from 15 storey evacuation zones 149
Figure 7.3.3.2 (b) – Comparison of code compliant stair evacuation time with lift
evacuation from 20 storey evacuation zones 150
Figure 7.4.1.2 – Comparison of lift evacuation time with stair evacuation times 154
Figure 7.4.1.2 (a) – Comparison of code compliant evacuation time with lift
evacuation at 10 storey intervals 154
Figure 7.4.1.2 (b) – Comparison of code compliant evacuation time with lift
evacuation at 15 storey intervals 155
Figure 7.4.1.2 (c) – Comparison of code compliant evacuation time with lift

8
evacuation at 20 storey intervals 156
Figure 7.4.1.2 (d) – Comparison of code compliant evacuation time with lift
evacuation at 25 storey intervals 156
Figure 7.4.2.2 – Comparison of lift and stair evacuation from 10 storey
evacuation zones 159
Figure 7.4.2.2 (a) – Comparison of code compliant evacuation time with lift
evacuation at 10 storey intervals 159
Figure 7.4.2.2 (b) – Comparison of stair evacuation time with lift
evacuation at 15 storey intervals 160
Figure 7.4.2.2 (c) – Comparison of code compliant evacuation time with lift
evacuation at 15 storey intervals 161
Figure 7.4.2.2 (d) – Comparison of stair evacuation time with lift evacuation
at 20 storey intervals 161
Figure 7.4.2.2 (e) – Comparison of code compliant evacuation time with lift
evacuation at 25 storey intervals 162

9
List of Tables
Table 2.2 – Estimated percentage of building occupants unable to evacuate via stairs 25
Table 3.2.1 - Maximum Specific Flow 51
Table 3.2.5 – Summary of fatigued stair evacuation times 57
Table 3.3.3.1 – Lift details 66
Table 3.3.3.1 (a) – Comparison of Evacuation Times 66
Table 3.3.5.3 – Door operating time and transfer inefficiency 75
Table 3.3.5.4 – Lift trip and evacuation time calculated by ELVAC computer program 79
Table 3.3.5.4 (a) – Summary of lift evacuation times using STEPS programme 81
Table 3.3.5.5 – Impact of variable inefficiency factors from a refuge floor 83
Table 3.3.5.5 (a) – Impact of variable inefficiency factors from an evacuation zone 83
Table 3.3.5.5 (b) – Result of people transfer time on value of start-up time 84
Table 3.4 – Summary of Calculation Methods 86
Table 4.5.2 – Clearance time for each storey 104
Table 5.8 – List of input values 112
Table 7.2.1.1 – Time for evacuation by stairs from refuge floor based on AD-B 132
flow rates
Table 7.2.2.1 (a) - Time for evacuation by stairs from 10 storey evacuation zone 137
Table 7.2.2.1 (b) - Time for evacuation by stairs from 15 storey evacuation zone 137
Table 7.2.2.1 (c) - Time for evacuation by stairs from 20 storey evacuation zone 138
Table 7.2.2.1 (d) - Time for evacuation by stairs from 25 storey evacuation zone 138
Table 7.3.2.1 – Time for evacuation by stairs from refuge floor (AD-B) 143
Table 7.3.3.1 (a) - Time for evacuation by stairs from 10 storey evacuation zone 147
Table 7.3.3.1 (b) - Time for evacuation by stairs from 15 storey evacuation zone 147
Table 7.3.3.1 (c) - Time for evacuation by stairs from 20 storey evacuation zone 147
Table 7.3.3.1 (d) - Time for evacuation by stairs from 25 storey evacuation zone 147
Table 7.4.1.1 - Time for evacuation by stairs from refuge floor (AD-B) 152
Table 7.4.2.1 (a) - Time for evacuation by stairs from 10 storey refuge zone 157
Table 7.4.2.1 (b) - Time for evacuation by stairs from 15 storey refuge zone 157
Table 7.4.2.1 (c) - Time for evacuation by stairs from 20 storey refuge zone 157
Table 7.4.2.1 (d) - Time for evacuation by stairs from 25 storey refuge zone 157
Table 7.5 - Comparison of evacuation times based on the use of refuge floors 164
Table 7.5 (a) - Comparison of evacuation times based on the use of evacuation
zones 164

10
UNIVERSITY OF MANCHESTER
ABSTRACT OF THESIS submitted by: Ian Hall
For the Degree of: Masters of Philosophy
And entitled: Efficient Evacuation of Tall Buildings in Fires Using Lifts
Date of submission: September 2010
The objective of this thesis is a study into the feasibility of lift evacuation within
high-rise buildings during a fire, in particular, those buildings used as office
accommodation. Lift evacuation has been debated theoretically by a number of
researchers. A summary of the main methods of evacuation discussed can be
summarised as follows:
• Evacuation from a dedicated refuge floor
• Evacuation from an occupied floor, which is within a zone of floors provided
with lift evacuation.
Whilst some researchers have sought to assess the suitability of these methods by
conducting simulations and devising calculations to determine the evacuation time
from a building, there is limited information available with regards to the
assumptions made in these assessments to allow the reader to determine its
applicability. Furthermore, the assessments noted above focus on a single method
of evacuation and do not compare the different evacuation strategies available.
The aim of this thesis is to compare evacuation times achieved in a theoretic
building which is designed in accordance with current design codes (i.e. Approved
Document B), with those achieved when the building is provided with either of the
lift evacuation methods discussed above. This will allow the most efficient
evacuation time to be determined.
Based on the simulations conducted as part of this thesis it can be demonstrated
that the simultaneous evacuation of a high rise office building may be achieved in
less time when occupants escape via code compliant stairs designed for phased
evacuation rather than using lifts provided in accordance with current design
guidance to evacuate. However, these simulations also demonstrate that once the
percentage of occupants using the lifts for evacuation decreases, or the lift
performance values are increased, the evacuation time from a number of refuge
floors or evacuation zones is less than the evacuation time achieved using code
complaint stairs.
Based on the findings of this assessment, it was considered necessary to develop a
programme for preliminary design which is capable of determining if the use of lifts
for evacuation is more efficient than a code compliant design, and which
evacuation strategy is the most effective.

11
Declaration
No portion of the work referred to in this thesis has been submitted in support of an
application for another degree or qualification of this or any other university or other
institute of learning.
Copyright Statement
The author of this thesis (including any appendices and/or schedules to this thesis) owns
certain copyright or related rights in it (the “Copyright”) and s/he has given The University
of Manchester certain rights to use such Copyright, including for administrative purposes.
Copies of this thesis, either in full or in extracts and whether in hard or electronic copy, may
be made only in accordance with the Copyright, Designs and Patents Act 1988 (as
amended) and regulations issued under it or, where appropriate, in accordance with
licensing agreements which the University has from time to time. This page must form part
of any such copies made.
The ownership of certain Copyright, patents, designs, trade marks and other intellectual
property (the “Intellectual Property”) and any reproductions of copyright works in the
thesis, for example graphs and tables (“Reproductions”), which may be described in this
thesis, may not be owned by the author and may be owned by third parties. Such
Intellectual Property and Reproductions cannot and must not be made available for use
without the prior written permission of the owner(s) of the relevant Intellectual Property
and/or Reproductions.
Further information on the conditions under which disclosure, publication and
commercialisation of this thesis, the Copyright and any Intellectual Property and/or
Reproductions described in it may take place is available in the University IP Policy (see
http://www.campus.manchester.ac.uk/medialibrary/policies/intellectual-property.pdf), in
any relevant Thesis restriction declarations deposited in the University Library, The
University Library’s regulations (see
http://www.manchester.ac.uk/library/aboutus/regulations) and in The University’s policy
on presentation of Theses.

12
Acknowledgements
In writing this thesis, I have received great support from many friends and colleagues.
However, I feel that there are certain people that should be acknowledged for the great
support they have provided during the course of my studies. Without these people, and
their direct input it would have not been possible for me to complete this thesis.
I would like to thank my colleagues at Hoare Lea Fire for their support and endless
knowledge on all things fire related, including Leo Girling for answering my never ending
questions with regards to Visual Basic.
I would also like to thank my supervisor Professor Yong Wang for his support and guidance
during our numerous meetings.

13
Nomenclature
a = constant = 0.266
D = density in persons/m2
f = mean evacuation flow (persons/second/metre effective stair width)
Hij = vertical distance between ith floor and jth floor (m)
j = number of lifts
k = constant = 1.08
L = vertical distance for the lift movement (m)
m = is the number of round trips
Ndw = the number of people entering the lift during the dwell time
Nelv = flow factor of lift doors (persons/m/s)
p = actual evacuation population per metre of effective stair width
Pfi = number of occupants on the ith floor
Pstri = number of evacuees by stairs on the ith floor
S = speed along line of travel
T = minimum time in minutes
T1 = acceleration time (s)
T2 = constant velocity time (s)
T3 = deceleration time (s)
ta = lift start up time
Tcl is the closing time of lift doors (s)
td = time for the doors to open and close once
Te = time for evacuees to get on and off a lift (s)
ti = time for people to enter the lift
tio = the average time for one person to enter the lift
Tm is the lift transfer time (s)
to = the travel time from the lift lobby to the outside or to another safe location
Top = opening time of the lift doors (s)
tr,j = time for round trip j
ts = standing time
tT = the travel time for the lift car to go from the furthest floor to the discharge floor
tu = the time for passengers to leave the lift
Velv = lift velocity (m/s)
Vmax = maximum lift velocity (m/s)

14
Welv = available lift door width (m)
α = basic transfer inefficiency (generally 0.1)
α = lift acceleration (m/s2)
β = lift deceleration (m/s2)
γ = other inefficiencies in people transfer into or out of lifts
ε = door inefficiency
η = trip inefficiency
µ = is the total transfer inefficiency
ρ is the evacuation population (persons per metre effective stair width)

15
1.0 CHAPTER 1 - INTRODUCTION
The means of escape in new buildings in England and Wales should be designed in
accordance with Approved Document B[1]
of the Building Regulations. This Approved
Document defines a very tall building as any with a top floor level more than 45m in height.
It is proposed to review all code compliant means of escape assessments in accordance
with the guidance of Approved Document B[1]
(AD-B), which is applicable in England and
Wales. Where necessary to support this study, additional reference will be made to the
building codes of other countries.
Whilst there are numerous buildings within England and Wales that exceed this limit, the
number of super-tall buildings is limited. The tallest building in the UK is currently 1 Canada
Square, which is approximately 235m in height and provided with 50 storeys. However, due
to the development of a number of city skylines in the UK this height will be exceeded in
the near future.
1.1 Code Compliant Means of Escape
High rise buildings often contain thousands of persons over many floor levels. However,
due to the limited plan area of these buildings, high rise buildings often contain only a few
stairs. Whilst it is noted that the occupancy of a stair increases with the number of storeys
it serves, due to the additional ‘stacking capacity’ within the stair, the number of occupants
entering the stair generally significantly exceeds this additional ‘stacking capacity’.
For example, based on the theoretical building used as part of this study (as described in
Section 1.4), and assuming an entire stair is discounted due to fire fighting operations in
accordance with Section 4.27 of AD-B, each stair is required to be 3100mm wide based on
the guidance of Section 4.25 of Approved Document B to provide sufficient escape and
stacking capacity within the notional evacuation period.
However, to allow a reduction in the required escape width of the stairs, current guidance
in the UK[1]
recommends that a high rise building is provided with phased evacuation and
compartment floors separating each storey, as well as the provision of sprinklers
throughout.

16
Phasing the evacuation of a high-rise building allows only a handful of storeys to evacuate
at any one time. Therefore, the escape routes, such as stairs and doorways, can be
designed based on the relatively low number of occupants using them compared to those
during the simultaneous evacuation of the building, reducing the required width.
Phased evacuation generally requires the floor of fire origin to evacuate upon detection,
then after a set time delay, usually of two and a half minutes, the next two floors above will
evacuate. Once the floors above the floor of fire origin evacuate, those below commence
evacuation. However, based on a two and a half minute interval of the evacuation of floor
levels, and a fire on the 20th
floor level of the theoretical building used as part of this study,
the time for the final floor of the building to evacuate is 62.5 minutes (i.e. final stage of
phased evacuation occurs after 62.5 minutes).
In addition to the time taken for evacuation to commence, it is also necessary to include
the additional time required to descend the stairs.
For example, based on a 4m floor to floor height, the fiftieth floor is approximately 200m
above Ground floor level. Based on a riser dimension of 182mm and a going dimension of
270mm, the total horizontal travel distance is approximately 297m (270mm x 22 steps per
floor x 50 storeys) while the total vertical travel distance is approximately 200m (182mm x
22 steps per floor x 50 storeys). Therefore, the hypotenuse (travel distance down the
centre line of the stair) can be calculated as 358m. If it is assumed that occupants will travel
350mm from the central handrail[2]
an additional 1.4m is added for every level to account
for the travel distance on the landings. On this basis, the total travel distance down the
stairs is approximately 428m.
Based on a speed of 0.95 m/s for travel down a stair[3]
, the time taken to descend the
centreline of the stair is equal to 451 seconds, or approximately seven and a half minutes.
However, this speed is for a person with an un-impeded flow. However, in reality, there will
be multiple merging flows of occupants within in the stair, as well as fatigue of the
occupants descending the stair, which will increase the evacuation time.
Nevertheless, based on the provision of good internal Fire Service access and passive fire
protection, it is likely that the fire will be confined to a single floor and will not require the
simultaneous evacuation of the buildings occupants. Kinsey et al[4]
notes that ‘since the

17
wide scale adoption of sprinkler systems in high rise buildings, there has been an
expectation that there would rarely, if ever, be a need to undertake full building
evacuations’. Whilst this may be a concern in the event of a bomb threat, the risk of a fire
in a high-rise building, which requires the simultaneous evacuation of the whole building, is
unlikely.
However, there has been an increased interest in the simultaneous evacuation of high-rise
buildings since the World Trade Centre attacks in 2001[4]
. Lane et al[5]
states that “many
people are now unwilling to stay in a building on fire even if it is remote from their location
and want to be reassured that they can evacuate in a timely fashion.”
1.2 Use of Lifts for Evacuation
Notwithstanding the above, it is necessary to provide a suitable means of escape for
building occupants located at high level. The physical effort for some of the occupants to
evacuate from the 50th
storey may be too strenuous. This is recognised by design guidance
in Hong Kong[6]
, which requires refuge floors to be provided a minimum of every 25 storeys
from any other refuge floor, or above street level, to provide occupants with a place to rest
in relative safety. The provision of these refuge floor may be supplemented with lift
evacuation to assist those occupants from the upper storeys evacuate within a reasonable
time and without undue stress.
The use of lifts and stairs for evacuation of a high rise buildings is supported by experiences
from the World Trade Centre attacks[7]
in 2001, which have shown that occupants of a high
rise building are prepared to use the lift for evacuation irrespective of the risk posed from a
fire on a floor level below.
The use of lifts for evacuation has been reviewed by a number of researchers since the
1960’s, using a number of different operation modes, which can generally be summarised
as follows:
• Evacuation from the floor of origin, within an evacuation zone (Figure 1.2(a))
• Evacuation from a dedicated refuge floor (Figure 1.2 (b))

18
The evacuation from the floor of origin is considered to be the most simplistic evacuation
to manage, on the basis that occupants are required to assemble in the lift lobby of their
floor of origin and exit via a route they used to enter the building, and are, therefore,
familiar with. This will allow a relatively small protected lobby to be provided at each floor
level, based on the requirement to accommodate the occupants of that floor level only,
rather than dedicating a whole floor as a refuge floor level to accommodate the occupants
of multiple floor levels, as required for evacuation from a refuge floor. However, this
method of evacuation is considered to require a greater overall evacuation time, based on
the increased distance the lift is required to travel to evacuate the higher floors within the
zone it serves.
Discharge
floor
Lift moving up
shaft from floor
of fire origin
Figure 1.2 (a) – Evacuation of occupants from floor of origin
Evacuation from a refuge floor requires occupants to descend the stairs to a dedicated
floor, which is served by evacuation lifts. Whilst this may require a larger floor area to be
provided as a protected refuge, this is considered to be a more efficient evacuation method
based on the lower overall travel distance of the lifts, and a lower number of partially full
round trips.

19
Figure 1.2 (b) – Evacuation from a refuge floor
1.3 Research Objectives
Whilst these evacuation strategies have been discussed by previous researchers, none of
the previous research studies has directly compared the evacuation times of a building
using both of these evacuation strategies to identify the most suitable method, or to
determine the effectiveness against a code compliant escape time.
The purpose of this thesis is to review the information available with regards to the use of
lifts for evacuation, including previous research on lift evacuation strategies, to determine
the most effective of both possible methods of providing lift evacuation. This will be
conducted using existing calculation methods to determine the evacuation time of each
method from a theoretical building and by comparing the results of the lift evacuation
simulations and with those achieved when escape is provided via the code compliant
method (i.e. escape stairs). The evacuation time of the escape stairs assumes that all
occupants seek to simultaneously escape, as may be accommodated by lift evacuation, in a
building designed to accommodate phased evacuation.
In addition to assessing the overall building evacuation times for comparison to the
equivalent stair evacuation times, comparison will be made to ascertain whether the

20
conditions within the building during the means of escape would be feasible for building
occupants to use lifts for evacuation. Details of this assessment are provided in Chapter 6.
In addition, this thesis will review the information available with regards to human
behaviour in fire and how it relates to the use of lifts for evacuation as well as the design
and performance of the lift system required to achieve a reduction in the code compliant
evacuation time.
Based on the results and findings of this thesis, a computer programme will be created to
calculate the most effective evacuation strategy for a conceptual building based on various
lift performance values and occupant ratio, using Microsoft Excel and Visual Basic. This will
allow the user to determine the effectiveness of lift evacuation compared to the code
compliant evacuation time and therefore, determine which strategy to implement.
1.4 Theoretical Building
The calculations will be performed for a theoretical building with the following details:
• The building is provided with 51 storeys of accommodation (i.e. Ground – Fiftieth).
Based on a floor to floor height of 4m, the top floor is 200m above the discharge
level.
• The occupancy of each floor level (with the exception of Ground) is equal to 150
persons. On this basis, the total building occupancy is equal to 7500 persons.
However, refuge floor are assumed to not contain a permanent occupancy.
• In accordance with Table 3 of Approved Document B, it is necessary to provide a
minimum of two storey exits for a storey level with an occupancy greater than 60
persons, and less than 600 persons. Therefore, the building is provided with two
stairs serving each floor level.
• In accordance with Section 4.27 of Approved Document B, it is assumed that a
single stair is discounted due to fire fighter operations as a conservative
assumption. Therefore, the occupancy of each floor level is required to escape via a
single stair. In accordance with Table 8 of Approved Document B, each stair is
provided with a clear width of 1400mm.

21
1400mm wide stair
1400mm wide stair
Maximum of 8
lifts arranged in a
central core
Occupancy per floor equal to 150 persons
Figure 1.4 – Plan of upper floor level of theoretical building
1.5 Thesis Layout
Chapter 1 is a brief introduction to the issues of evacuation from high rise buildings for fire
and non fire events.
Chapter 2 is a literature review with regards to lift performance values and concerns with
using lifts for evacuation, disabled evacuation, existing lift evacuation systems and
occupant behaviour during evacuation, in particular, panic behaviour and occupant
queuing times, which are considered to be most relevant to this study.
Chapter 3 is a review of the methods of analysis which assess the analytical and simulation
assessments used as part of this study and includes validation studies, for the simulation
programmes used as part of this study, including STEPS and ELVAC, and assesses how these
may be accurately applied to this study.
Chapter 4 provides the reader with a brief overview of previous studies into lift evacuation,
from the initial simulations of Bazjanac and Pauls in the late 1970’s, through to the most
recent studies by the BRE. The chapter highlights the relevant parts of these studies to this
research.

22
Chapter 5 details the variables used in the calculations conducted for this study and the
sources these have been selected from.
Chapter 6 details the results of the STEPS modelling assessment and compares these values
with previous assessment detailed in the Literature Review.
Chapter 7 contains an analysis of the results and compares the lift evacuation times with
the associated stair evacuation times and code compliant stair evacuation times.
Chapter 8 contains the Conclusions and Recommendations based on the analysis of the
results, as listed in Chapter 7.

23
2.0 CHAPTER 2 - LITERATURE REVIEW
2.1 Impact of the World Trade Centre Attacks (2001)
The 2001 attacks of the World Trade Centre provided an insight into the complications
involved in the simultaneous evacuation of a high rise building. Media reports showed
crowded conditions within the stairs, as some occupants reportedly queued for hours to
evacuate. Whilst it is acknowledged that the conflicting flow of fire fighters up the stairs
reduced the flow rate, it is noted that the limited escape capacity of the stairs, which had
been designed to accommodate a much smaller flow of occupants, was significantly under
sized to accommodate the simultaneous evacuation of the building.
Based on the recommendations of Approved Document B[1]
, it is likely that the evacuation
of the World Trade Centre towers would have been phased to limit the required width of
the escape stairs. However, due to the impact of a passenger airliner, multiple floor levels
were involved in the fire, which is not considered in Approved Document B for a building
provided with phased evacuation. Whilst a 1400mm wide stair may accommodate
additional occupants to those that evacuate during the initial phase, who may queue on
the stair, the escape width provided in a phased building is considered unlikely to provide
sufficient escape width for those occupants of the affected floors (i.e. impact floors and
above) to simultaneously evacuate the building, therefore, leading to substantial crowding
within the stairs.
Galea et al[8]
, estimates that there was a total building population of between 10,000 –
14,000 persons, occupying the towers at the time of impact. Based 110 occupied floors,
this equates to between 90 and 127 persons per floor level. However, the maximum
building occupancy is considered to be equal to 25,000 persons.
Following a review of a large number of survivors of the 2001 attacks of the World Trade
Centre Fahy and Proulx, as quoted by Murphy[7]
noted that a number of occupants used
lifts as their only means of escape, or to supplement their escape, once conditions in the
staircases deteriorated. Of the occupants who evacuated using just stairs, the time to exit
the building ranged from 20 to 53 minutes depending on the location of the occupant.

24
However, evacuation of the occupants using the lifts took between 14 and 24 minutes to
reach a place of safety remote from the building from their floor of origin.
Further evidence of the enhanced escape capacity of a building supplemented with lift
evacuation is provided in BRE research[9]
, which notes that ‘in the 16 minutes before the
impact of the aircraft, 27% of those who evacuated used the lifts for part of their escape
route. In addition, the investigation found some evidence that the flow rate from WTC2
during those 16 minutes was approximately twice that for WTC1 (where only stairs were
available for evacuation).’
Based on the above references one can only assume that the use of lifts to supplement
evacuation reduces the overall evacuation time. However, in this scenario, the lifts were
used by a limited number of persons and did not result in the optimum reduction of the
evacuation time via the stairs. Therefore, as well as comparing the evacuation times of the
theoretical building using stairs and lifts, it is necessary to assess the impact on the overall
evacuation time using a combination of stairs and lifts.
2.2 Evacuation of Disabled Persons
It is a functional requirement of the Building Regulations that adequate means of escape
are provided, which includes provisions of disabled persons, without the requirement for
Fire Service assistance. This may be achieved using a number of methods, which includes
the provision of evacuation lifts. In low rise buildings the provision of evacuation lifts are
designed to accommodate non-ambulant occupants only. However, the lift evacuation
system in a high-rise building will also be required to accommodate ambulant patients. On
this basis, it is necessary to assess the impact to the lift system when evacuating disabled
occupants with ambulant occupants. Disabilities are defined by Proulx[10]
as people who
have limitations in the following:
• Mobility
• Agility
• Intellectual
• Hearing
• Seeing
• Speaking

25
People who have hearing or speaking limitations are not included in the group known as
disabled occupants, as these occupants may escape via conventional means using simple
management procedures. However, occupants with other limitations will require the
evacuation strategy to be adjusted according to their needs. For example, a blind occupant
will be able to evacuate in a lift, which is fully occupied, where as an occupant using a large
wheel chair may fully occupy a single lift.
The evacuation of a building should include provisions for disabled occupants. These
occupants are quoted as consisting of different percentages of the building occupancy,
which vary between 1% and 15%. Whilst it is noted that these occupants may have
difficulties walking multiple flights of stairs, the number of occupants who may require
additional space within the lift, such as wheelchair users, is less than the quoted
percentage of occupants considered to be disabled.
Researcher Percentage of occupants
Lane et al[5]
15%
Charters et al[9]
11%
Pauls[11]
6%
Pauls[12]
3%
Smith[13]
1%
Table 2.2 – Estimated percentage of building occupants unable to evacuate via stairs
It is recommended that disabled occupants are given priority to escape. This will ensure
that should occupants be required to evacuate via the stairs, the maximum flow rate will be
achieved in the stair, based on the use of the stairs by able bodied occupants only.
If the evacuation is from a refuge floor it is unlikely that any disabled occupants will be the
first to arrive at the refuge floor. Therefore, to ensure that the evacuation time of these
occupants is minimised it is recommended that disabled occupants should be located as
close to the refuge floor as possible to reduce the travel time required to reach the lifts.
Based on the number of wheelchair based occupants contained within a building, it may be
necessary to include a single round trip for each occupant to account for the additional
space occupied by this person in a lift.

26
2.3 Existing Lift Evacuation Systems
Lift evacuation is currently used in a small number of buildings worldwide for the
evacuation of a building. Three notable examples are described below:
2.3.1 Eureka Place Tower, Melbourne
The Eureka Place tower is an 88 storey building located in Melbourne, Australia. Details of
the lift evacuation strategy are provided by Kuligowski[[14]
.
‘The Eureka Place Tower is separated, according to the lift arrangement, into vertical
evacuation zones. The plan states that occupants within the vertical zone that indicates the
fire floor would evacuate via the stairs until they reach the next transfer floor. At the
transfer floors, which are located on levels 24 and 52 of the Eureka Place tower, the
occupants would then take the express lift to the Ground floor. The express lifts will be
located in separate shafts in order to avoid water and smoke damage, and will be
accompanied by the other lifts provided for fire fighter access.’
It is noted that the Eureka Place Tower uses the transfer floor or refuge floor method of lift
evacuation, first proposed by Pauls[12]
, despite having a relatively low occupancy compared
to an office building of the same height. Whilst it is not stated within the reference, this is
assumed to be the result of a requirement for a high efficiency evacuation system as a
result of the relatively low number of lifts generally provided in a residential building, such
that a suitable lift evacuation time is achieved, which does not require the lifts pick up
small numbers of occupants on different floor levels.
2.3.2 Stratosphere Tower, Las Vegas
The Stratosphere Tower is located in Las Vegas in the United States of America and is
essentially an eleven storey building sited atop a 250m tower. Details of the lift evacuation
strategy for the building is provided by Quiter[15]
as summarised below.

27
Figure 2.3.2 – Stratosphere Tower
Some floors of the building may include an occupancy of more than 500 persons. Strict
compliance with the building codes at the time would require the provision of three
remotely located escape stairs. However, based on the restricted plan area of the tower it
was not considered possible to meet this requirement.
The primary evacuation method for this building is the use of stairs for the occupied floors,
which discharge into an area of refuge on the lowest two floors of the pod. These two areas
of refuge are used for no other purpose and are completely non-combustible. A diagram of
a refuge floor level is shown below.
From the area of refuge, a single stair leads down through the shaft of the tower to Ground
floor level. However, the primary evacuation route from the area of refuge involves the use
of lifts. These lifts are double deck lifts which travel at 1800 feet per minute (approximately
9m/s) and can discharge either within the main casino (at podium level) or at two specially
designed discharge levels at the roof of the podium building. These discharge levels are
enclosed in two hour, fire rated, construction in accordance with NFPA 5000, from the roof
to grade, and are separated from all other areas by two hour, fire rated, construction.

28
Figure 2.3.2 (a) – Lower refuge floor level of Stratosphere Tower
The high level accommodation is provided with the two lowest floors as refuge floor levels.
This is based on the use of double deck lifts to evacuate the upper storeys of
accommodation within a reasonable time. However, to ensure that lift evacuation is
economically feasible it is necessary to limit the area of refuge floor required within a
building. Therefore, it is necessary to determine the level of lift performance required to
ensure that only a single level of refuge floor accommodation is required to accommodate
occupants waiting for the lifts to arrive.
2.3.3 Petronas Twin Towers, Kuala Lumpur
The Petronas Twin Towers were originally designed to accommodate evacuation by
stairways only. However, following the attacks on the World Trade Centre, the evacuation
strategy of the building was modified to accommodate lift evacuation[16]
.
During Stage 1 of the previous evacuation strategy occupants of the fire floor and a single
floor above and below were required to evacuate their floor and re-enter 3 floors lower.
Occupants of the two floors above and below the affected floor would have been put on
alert. If the Stage 1 event could not be contained (i.e. fire and smoke spread to multiple

29
floors), the Stage 2 evacuation would be implemented, which necessitated the
simultaneous evacuation of the whole building via the following procedure:
• Low Zone (Level G to 37) – Down the stairs to Concourse and exit building
• Middle Zone (Level 40 to 60) - Down the staircase to Level 41, cross over sky bridge
to adjoining tower, use shuttle lifts to Ground and exit building.
• High Zone (Level 61 to 77) – Down the staircase to Level 42, cross over sky bridge
to adjoining tower, use shuttle lifts to Mezzanine and exit building.
• Top Zone (Level 78 to 86) – As similar to High Zone evacuation
This was amended such that in the event of both towers being affected, each tower would
be provided with independent means of escape, as follows [16]
:
• Low Zone (Level G to 37) – Down the stairs to Concourse and exit building
• Middle Zone (Level 40 to 60) - Down the staircase to Level 41, use the designated
shuttle lifts in the same tower to Ground and exit building.
• High Zone (Level 61 to 77) – Down the staircase to Level 42, use the designated
shuttle of the same tower lifts to Mezzanine and exit building.
• Top Zone (Level 78 to 86) – As similar to High Zone evacuation
A fire drill was conducted to assess the implementation of lift evacuation. The total building
evacuation time was equal to 32 minutes. Based on the information available, it is not
possible to determine the exact reduction in the evacuation time as a result of the
provision of lift evacuation. However, this is considered to be a significant reduction in the
‘several hours’ quoted by Bukowski [17]
prior to the implementation of the amended
strategy.
Occupants of the ‘Top Zone’ are required to travel 44 floors to reach the refuge floor level.
This is considered to be an excessive travel distance for occupants of the Top Zone and is

30
likely to require large refuge floors to accommodate the occupants of 44 storeys waiting for
the lift.
2.3.4 Summary
Lifts are currently in use as a means of escape route from a few high rise buildings in
different countries worldwide. Case studies of these buildings have shown that the number
of floor levels, or number of occupants per floor level, may exceed those used in this study
based on the provision of lifts with a higher performance value than those stated in
Chapter 5.
2.4 Concern of the Use of Lifts for the Evacuation of Building Occupants
Occupants of buildings throughout the world have previously been told to not use the lifts
in the event of a fire.
“The danger of lift failure, the need for the emergency personnel to get to the area in
danger without delay, and the opinion that existing lift configurations cannot evacuate
people fast enough are reasons given most frequently for the elimination of lift service.”[18]
A number of situations, which could render a lift evacuation system inoperable are
considered by Klote et al[19]
. Additional issues were raised by Klote et al[20]
at a later date. A
summary of these concerns and possible solutions are listed below:
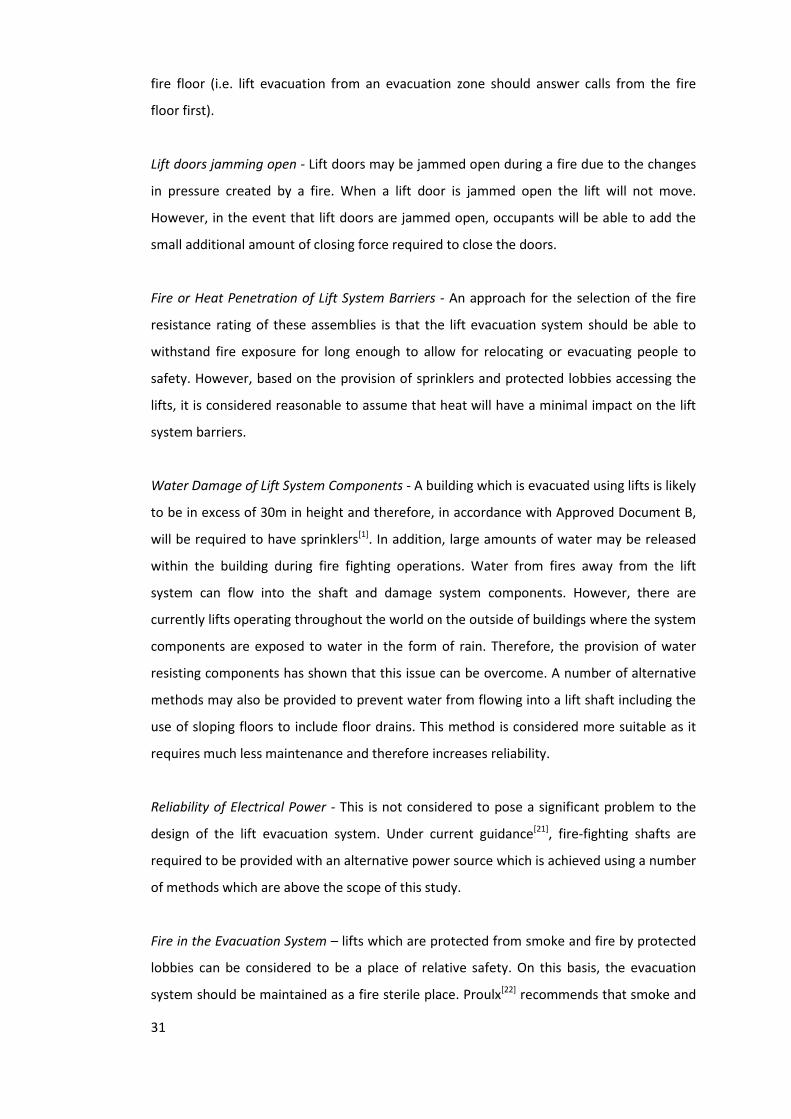
Doors Opening into the Fire - One of the main causes of fatalities when using lifts in a fire is
due to the lift doors opening onto a fire floor due to the call button being activated due to
the high levels of heat. However, this is considered to be a result of the lift doors opening
directly onto the floor plate, and therefore, not being provided the protection of a
dedicated lobby. The recommended method of preventing lift doors from warping due to
exposure to high temperatures is to provide access to the lift doors via a protected lobby
with compartment construction.
Lift System Activation - Identification of the fire location is important for lift evacuation
from an evacuation zone to the extent that the lift system must respond differently to the
31
fire floor (i.e. lift evacuation from an evacuation zone should answer calls from the fire
floor first).
Lift doors jamming open - Lift doors may be jammed open during a fire due to the changes
in pressure created by a fire. When a lift door is jammed open the lift will not move.
However, in the event that lift doors are jammed open, occupants will be able to add the
small additional amount of closing force required to close the doors.
Fire or Heat Penetration of Lift System Barriers - An approach for the selection of the fire
resistance rating of these assemblies is that the lift evacuation system should be able to
withstand fire exposure for long enough to allow for relocating or evacuating people to
safety. However, based on the provision of sprinklers and protected lobbies accessing the
lifts, it is considered reasonable to assume that heat will have a minimal impact on the lift
system barriers.
Water Damage of Lift System Components - A building which is evacuated using lifts is likely
to be in excess of 30m in height and therefore, in accordance with Approved Document B,
will be required to have sprinklers[1]
. In addition, large amounts of water may be released
within the building during fire fighting operations. Water from fires away from the lift
system can flow into the shaft and damage system components. However, there are
currently lifts operating throughout the world on the outside of buildings where the system
components are exposed to water in the form of rain. Therefore, the provision of water
resisting components has shown that this issue can be overcome. A number of alternative
methods may also be provided to prevent water from flowing into a lift shaft including the
use of sloping floors to include floor drains. This method is considered more suitable as it
requires much less maintenance and therefore increases reliability.
Reliability of Electrical Power - This is not considered to pose a significant problem to the
design of the lift evacuation system. Under current guidance[21]
, fire-fighting shafts are
required to be provided with an alternative power source which is achieved using a number
of methods which are above the scope of this study.
Fire in the Evacuation System – lifts which are protected from smoke and fire by protected
lobbies can be considered to be a place of relative safety. On this basis, the evacuation
system should be maintained as a fire sterile place. Proulx[22]
recommends that smoke and

32
heat detectors are provided in the lift lobby. Once the detectors have been activated a
recorded message could be played telling occupants that the lift will not stop at that floor
and to move to the appropriate floor below.
Smoke in the Evacuation System - The main reason that it is recommended that occupants
do not escape via lifts in the event of a fire is the risk of fire and smoke causing
malfunctions in the lift motor room which can trap people in a potentially smoke filled lift
shaft. Lift systems should not operate when significant levels of smoke are in a lift lobby,
hoistway or machinery room.
Trapped Lifts - Under the guidance of BS EN 81 73[23]
in the U.K, lifts are required to return
to the discharge floor once the alarm has sounded. This allows the Fire and Rescue Service
to identify the locations of all the lifts and prevents people from becoming trapped in a lift
during the evacuation. Nevertheless, it is considered reasonable to keep the lifts in
operation if the lifts are protected against the effects of a fire as mentioned above.
Myth of Panic - Klote[20]
states that “panic behaviour is rare even among people aware of
an ongoing fire, and he indicates that the most frequent mode of behaviour during fire
emergencies is deliberate and purposeful”. Further review of occupant behaviour has
shown that people act in a calm and deliberate manner during a fire evacuation.
Fire Spread Via Lift Shafts - There is large concern based on past experiences of fire spread
via lift shafts and of fire fighter and civilian deaths in lifts over the use of lifts for
evacuation. However, these have generally been in buildings without protection to the lift
shafts (i.e. protected lobbies etc).
Although the concerns are many, they can be considered to be minor technical issues,
which may be overcome in a correctly designed building. Therefore, there is no reason why
lift evacuation should not be used.
2.5 Protection of Refuge Area’s
Whilst early studies into lift evacuation assessed the use of unprotected lifts, in relatively
low rise buildings, during the early stages of a fire evacuate the floors immediately affected
by the fire. This study assumes that, due to the longer times associated with evacuating

33
multiple floor levels, occupants may be required to wait for a significantly greater time
before boarding a lift. Therefore, the lift evacuation simulations conducted as part of this
thesis assumes that the following level of protection is provided to the areas of refuge
where occupants are assumed to wait for a lift to arrive.
2.5.1 Fire Resisting Construction
The refuge area should be maintained as a place of relative safety during the period of
evacuation. To ensure that the refuge area is maintained as a tenable space for occupants
to wait for the lift car to arrive, it is considered necessary to provide the refuge area with
fire resisting construction.
Bukowski [17]
recommends that the level of fire resistance provided to the structure forming
the escape route is equal to twice of that required for occupants to escape the building.
Based on the evacuation times achieved as part of this study, this would require in excess
of 120 minutes fire resistance to be provided.
2.5.2 Ventilation
It is noted from the STEPS assessment detailed later within this study that occupants
located on refuge floors may be required to wait on a refuge floor for between four and a
half minutes to ten minutes for a lift to arrive. Whilst the occupants waiting in these places
of relative safety are protected from the immediate effects of a fire, they may become
exposed to high concentrations of smoke. This may be via a number of different scenarios
such as smoke flow into the refuge area during the escape phase. Based on this prolonged
time within the refuge, it is considered necessary to prevent the ingress of smoke into the
refuge. This may be achieved using one of the methods listed below:
• Provide extract ventilation to the refuge area
• Provide ventilated lobbies between the refuge area and adjacent accommodation,
• Pressurise the lift shaft and/or refuge area to prevent smoke movement into the
refuge.
Stroup[24]
details experiments carried out by Tamura and Klote at the NRCC on lift
operations during a building fire, which concluded that without mechanical pressurization,

34
lethal concentrations of carbon monoxide were reached on all levels of the building 45
minutes after ignition. With lift shaft pressurization, the lift shaft was free from smoke;
however, the lift lobbies were still above the critical level 15 minutes after ignition. On this
basis, it is noted that the best results were obtained with both lift shaft and lobby
pressurization.
2.5.3 Provision of Refuges
The design of the refuge area is considered to be a critical component of the evacuation lift
system design. The refuge is required to be suitably large enough to accommodate the
number of occupants required to wait for the lift in relative comfort, but also be of a
sufficient size to be accommodated within the building floor plan without significantly
affecting the cost. Building designers and owners are unlikely to implement lift evacuation
if this will affect the rentable space of the building.
The refuge occupancy will increase based on the arrival of passengers at the refuge floor
who cannot be transported down by the express lifts at the same time as they arrive, such
that congestion will occur on the refuge floor.
The results of this study have shown that the refuge floor is required to accommodate a
large percentage of occupants during the evacuation. It is noted that the refuge floor will
not be required to accommodate all of the zones occupants, as some of the will be
required to travel from their floor of origin to the refuge floor (i.e. occupants will be
‘stacked’ in the stair), while some will have exited the building.
As the first occupants reach the refuge floor they will be immediately evacuated by the lift.
However, the refuge floor should be sized to accommodate the occupants that may be
required to wait there due to the higher flow rate of stairs on to the refuge floor compared
to that of occupants escaping via lifts. Based on the work by Wong et al[50]
and the results
of this study, it is considered necessary for a refuge floor to be able to accommodate
approximately 70% of the occupants it serves. A lift lobby in an evacuation zone is required
to accommodate all the occupants of the floor level it serves.
In an article in the Fire Prevention and Fire Engineers Journal[25]
, Taylor recommends a floor
space factor in lift refuges of between 0.6m2/person and 0.7m
2/person based on research

35
and the Fruin levels of service. However, Lay[26]
recommends that this may be reduced to
0.5m2 per person, which is the same floor space factor recommended for a bar.
Lay[26]
states that the use of a floor space factor of 0.5m2 allows conditions to be achieved
in the refuge area which will allow occupants to move in the refuge area and allow fire
fighters to exit through the lobby if required.
The conditions on the refuge floor are considered to be a significant factor in the comfort
of occupants waiting for the lifts to arrive and therefore the percentage of occupants who
may use the stairs as an alternative means of escape. Suitable floor space factors have
been suggested in the latest BRE design guidance[9]
similar to the area within 2m of a
crowded bar[1]
. However, this is considered to create unsuitable conditions for occupants to
wait for relatively prolonged periods of time for the lift to arrive. On this basis, it is
considered that 0.5m2/person is the lowest limit for a refuge floor.
2.5.4 Summary
It has been demonstrated from the event of the World Trade Centre attacks that stairs
designed for phased evacuation become congested when occupants attempt to
simultaneously evacuate. Whilst lift evacuation may help to reduce this congestion it is
important that the lift system is designed to accommodate the building occupants likely to
use the system in comfort. This include adequate provisions for the likely numbers of
disabled persons that will use the system, as well as enough space to hold the occupants
required to wait for the lift before evacuating.
2.6 Lift Technology
The simulations conducted as part of this assessment use default values as a base case,
which are based on current design guidance[27]
. Sections 2.6.1 to 2.6.4 below discuss the
selection of these values.
36
2.6.1 Lift Controls
In the event that the lifts are required to be used for evacuation, the activation of the lifts
may be automatic (i.e. on activation of the fire alarm), or manually by the Fire Service, as
discussed below[28]
.
Manual Control is to have persons in a command centre direct lifts to where they are most
immediately needed. The co-ordinators would communicate with and direct these
operators.
Automated control with human oversight is to use a computer programme to set priorities,
send lifts to the appropriate floor and determine which floors should be evacuating into the
stairwells. Depending on how the evacuation decision rules, additional input could be
provided by co-ordinators. Whilst Groner and Levin[28]
note that monitors would not be
assigned to operate lifts, to ensure an acceptably high level of reliability it is assumed that
some sort of human oversight over the computer programme will be needed.
Barlund[29]
recommends that if evacuation time is critical then an automatic evacuation
mode of the group controller is necessary. Manual dispatching, as in a fireman’s drive
mode can never compete with the efficiency of automatic dispatching.
Charters and Fraser-Mitchell[9]
note that peak down mode is used at the end of the working
day in office buildings to facilitate the efficient egress of most occupants over a relatively
short period of time. This mode may provide a good starting point for the development of a
lift operating mode for emergency evacuation. However, peak down mode still allows
occupants to access the building from the ground floor travel up the building and move
between floors. Therefore, Charters and Fraser-Mitchell recommend the peak down mode
should be modified for emergency evacuation. Examples of the modified modes of
operation are as follows.
• Ignore up calls
• Top call first
• Non-stopping on the way down, and/or
• Non-stopping at the fire floor

37
2.6.1.1 Ignore all up calls
Ignore all up calls means that the evacuation lifts will not respond to any up calls. This
should increase the quality and quantity of service for floors with a down call. It may mean
that if someone places an up call only, they may be waiting for a lift that will not arrive. This
can be addressed through training and/or programming the lift to respond, but only travel
down to ground floor once the occupant has entered.
2.6.1.2 Top call first
Top call first means that the lifts will prioritise lift calls from the top floors. When a floor
has been evacuated, the lifts will then prioritise the next top call and so on. This method of
operation is similar to that used in the BRE studies[9]
. This is a very efficient way of reducing
the evacuation time for those at the top of the building, but may lead to;
• Extended waiting times for those on lower floors using lifts and/or
• Lack of service for all floors, except the top floor.
This may be improved by having the one lift from each bank serve adjacent floor levels, in
the same manner as the STEPS lift operation mode. However, this is considered to be
effective only if the occupancy on each floor level is approximately equal. An unequal
occupancy on different floor levels will require some lifts to make a greater number of
round trip times, therefore, increasing the time taken to evacuate a floor level which may
not have access to a lift that has completed the evacuation of the floor levels it serves
2.6.1.3 Non stopping on the way down
Non-stopping on the way down can be a way of avoiding delays due to the lifts stopping at
additional floors until it is full. This may improve the quantity of service because lift door
opening and closing times can form a significant proportion of a lifts journey time.
However, this may also mean that on the last call for a floor, the lift may travel to the
ground floor with only a partial load of occupants, therefore, increasing the inefficiency
factor of the lift.

38
Whilst this is not considered an issue for evacuation from a refuge floor, due to the limited
number of inefficient trips, this significantly increase the time to evacuate from an
evacuation zone due to the increased number of inefficient round trips required.
2.6.1.4 Non stopping at the fire floor
If lifts are used for means of escape from fire, they may be programmed not to travel to
any floor where the fire alarm system has operated. This should mean that the lift will not
stop at a fire floor and so will prevent occupants being exposed to fire hazards. It may also
mean that people on the fire floor are waiting in a lift lobby for a lift that will not arrive.
This also applies to people on other floors where smoke leakage is sufficient to activate
detectors or where occupants see smoke and operate a manual call point. This can be
addressed through training, and programming the lift to avoid only those floors where
automatic detectors have been activated.
Whilst it is not possible to specify a method of operation in the computer simulation
programmes or the analytical calculations, it is noted[40]
that the lift efficiency during
evacuation may be improved on compared to the times calculated as part of this
assessment.
2.6.2 Lift Speeds
Guidance provided in CIBSE Guide D “Transportation Systems in Buildings”[27]
recommends
a rated speed of 6m/s and an acceleration rate of 1.2m/s2 for a lift car in a shaft that is
120m or more in height.
However, the lifts used for the evacuation of the Stratosphere Tower in Las Vegas are
provided with a rated speed of 1800 feet per minute[15]
, which is approximately equal to
9.1m/s.
The fastest lifts in the world are provided in the Taipai 101 building and are provided with a
rated speed of approximately 17m/s[30]]
. However, these lifts were specially designed for
use in this building and included may additional features, including a pressurised and
aerodynamically shaped lift car. For lifts to be a more feasible means of evacuation it is
considered necessary to assess the evacuation based on commercially available lifts.

39
Fortune[31]
states that a lift with a descent speed which exceeds 7m/s or the vertical travel
distance which exceeds 300m will cause passenger discomfort if the lift is not pressurised.
Therefore, it is proposed to assess the evacuation times based on the maximum speed
recommended by CIBSE Guide D, Fortune[31]
, and 16m/s to approximately represent the
fastest lift in the world. A sensitivity study will also be conducted using a lift with a lower
speed of 5m/s.
2.6.3 Lift Acceleration
Whilst it is proposed to carry out the study using a number of different lift speed to find the
most efficient scenario it is recognised that the maximum lift speed is governed by the
acceleration of the lift and the number of floors the lift car is required to travel before
achieving maximum velocity.
The guidance contained in Table 3.5 of Guide D[27]
recommends that a lift serving a building
of 120m should be provided with a lift speed of 6m/s and an acceleration rate of 1.2m/s2.
However, the guidance provided in CIBSE Guide D[27]
recommends that passengers are
uncomfortable when subjected to values of acceleration greater than about one sixth of
the acceleration due to gravity (approximately equal to 1.5m/s2).
On this basis, the evacuation times will be assessed based on an acceleration and
deceleration value of the 1.2m/s2 and 1.5m/s
2 to determine the impact on the evacuation
time.
2.6.4 Multiple Deck Lifts
The most effective method of increasing the lift capacity without increasing shaft area is to
provide double deck lifts. There are a number of buildings throughout the world that utilise
double deck lifts which serve as shuttle lifts between an access floor and sky lobbies.
This concept may also be applied to evacuation where occupants are expected to evacuate
to the refuge floor or floors, where they can board a double deck lift to ground floor.

40
The benefits of using double deck lifts is discussed by Fortune[32]
and includes:
• Reduction in the number of lifts required compared to single deck lifts which will
save expensive lettable space within the building.
• Double deck lift arrangements save approximate 30% of the core space compared
to a single deck lift group.
• Individual lift cars may be provided with a reduced capacity in a double deck lift
system due to the stacking of cars within a single shaft.
However, when used as express lifts in an evacuation, double deck lifts require two levels
of entry and exit.
This may be accommodated by providing an increased floor to ceiling height, which allows
both lifts to discharge into the same zone, which is provided with a mezzanine level for the
top lift car.
Whilst it is recognised that the size of these refuge levels will be smaller when compared to
a single refuge level it is considered unlikely that this method will be adopted due to the
reduction in the amount of lettable space over two levels when compared to a single level
for a building provided with single deck lifts. However, this may be effective for evacuation
from the floor of fire origin, based on a limited floor to floor height, such that two lifts may
serve two separate floors.
It is currently not possible to accurately calculate the evacuation time using any of the
computer simulation programmes or analytical calculations discussed in this paper.
However, an approximate comparison is provided by Siikonen et al[33]
using the Building
Traffic Simulator (BTS) programme, which demonstrates that the times required for a
building to be evacuated using single, double and triple deck lifts, as shown in Figure 2.6.4.

41
Figure 2.6.4 – Simulated evacuation times with Single Deck, Double Deck and Triple Deck
lift systems
According to Figure 2.6.4 the evacuation time with double deck lifts are 50% to 60% of the
time taken using single deck lifts while the time for a triple deck lift is about 40% of the
time of double deck lifts.
2.6.5 Summary of Lift Performance Values
The highest rated speed currently recommended in design guidance is 6m/s[27]
. However,
these speeds have been exceeded in certain buildings throughout the world, particularly
those where lifts are used to supplement evacuation. On this basis, it is proposed to use
this speed as the base case during the simulations, as well as conduct additional
assessments using alternative lift speeds to assess the impact on the total building
evacuation time.
The assessments of the lift acceleration value will be conducted using the value of 1.2m/s2
recommended by CIBSE Guide D[27]
as the base case. An additional assessment will also be
undertaken for the maximum tolerable lift acceleration value of 1.5m/s2 for an
unpressurised lift.
Whilst it is noted in Section 2.6.4 that a double deck lift will reduce the evacuation time, it
is not proposed to include for the provision of these lifts in the simulations due to the
inability to accurately simulate the movement of these lifts.

42
2.7 Occupant Behaviour
There are multiple signs within modern buildings of all heights warning occupants not to
use lifts in the event of a fire. Therefore, based on an occupant’s behaviour to avoid the
lifts when evacuating, it is considered necessary to assess the likely human behaviour when
occupants are required to wait for the lift to evacuate, as discussed below.
2.7.1 Escape via Entry Route
There are a number of documented cases, where occupants have tried to escape via the
route which they entered the building despite documented cases of occupants passing a
number of well signed alternative exits. This has caused a number of fatalities due to
crushing of large numbers of people trying to escape via a single exit, or, via smoke
inhalation caused by an increased evacuation time.
Johnson[34]
notes that “this reluctance to follow emergency signage and instead retrace the
path back to an initial entrance is a common feature in many accidents. It does not
represent ‘irrational’ behaviour given that many fire exits can be blocked or alarmed.
Arguably, individuals exhibit a preference to follow what they believe to be a ‘sure route’ to
safety rather than take a chance on following fire exit signs in a direction they are not
familiar with.
This theory is supported by Smith[13]
who states that people “will do this even if this route is
smoke filled or other alternatives and safe routes are available.”
However, based on the use of the general circulation lifts as evacuation lifts, which are
therefore provided with additional protection, it is considered reasonable to assume that
occupants will be familiar with the escape route, when compared to escape stairs, which is
considered to reduce occupant anxiety during means of escape, and reduce the need to
provide distributed lifts throughout a building, therefore allowing a greater grouping of
lifts, and improving the performance of the lift evacuation system.

43
2.7.2 Waiting Times
As a result of lift evacuation, building occupants will be required to wait for a lift to arrive in
a protected lobby or refuge floor. This lack of movement is considered to cause agitation
with the awaiting occupants.
There is currently no guidance on the acceptable waiting times in protected lobbies or
refuge floors. In the study carried out by Lane et al[5]
a waiting time of eight minutes is
proposed based on the time taken to evacuate a stadium as it is assumed that this will
meet the patience levels of the occupants.
However, it is not considered unreasonable to provide a longer waiting time if the
occupants are located in a place of relative safety and provided with a continuous update
of the evacuation procedure. Whilst the work by Charters and Fraser-Mitchell[9]
also notes
that there is very little research in this area, some high rise office occupants have been
noted to wait for up to 30 minutes or more for an evacuation lift during evacuation
exercises.
Notwithstanding the above, Heyes[35]
notes that an implicit assumption [of lift evacuation
strategies] is that occupants will be willing to wait indefinitely for a lift until it arrives, which
may not reflect the actual behaviour of people in such situations.
Research by Heyes[35]
, shows that between approximately 5% to 15% of occupants will seek
to find an alternative means of escape after waiting five minutes for a lift. It is considered
worth noting that these results were collected by research from a number of participants
for a hypothetical building. Therefore, these values are not considered to be the results of
actual occupant waiting times but rather a perception of a number of occupant groups with
regards to how long they feel they will be willing to wait for a lift before seeking an
alternative.
The research of Pauls[2]
recognises that occupants may be required to wait at a certain floor
level for longer than required when using stair evacuation. However, as noted in Figure
2.7.2 the overall lift evacuation time is less than that via stairs despite a prolonged waiting
time. Whilst this information may be known to the building designers and fire safety
managers, this will not be available to the general building occupants. Therefore, to reduce

44
occupant stress while waiting for the lift it is recommended that information is provided to
the refuge floor occupants with regards to the lift location, such that a decision can be
made to wait for the lift to arrive or seek an alternative escape route via the protected
escape stairs.
Figure 2.7.2 – Comparison of occupant traces
Based on the above, it is considered necessary to calculate the lift waiting times for the
most onerous situations and assess the likely impact this will have on occupant behaviour
during the evacuation.
2.7.3 Panic Behaviour
It is widely believed that panic is the most common response to an emergency situation,
but studies by social scientists argue that panic behaviour in a fire is rare. This is supported
by Fahy[36]
who notes that “today, it is largely unknown that in the face of the extreme
stress of a disaster, there is an absence of widespread, irrational antisocial and
dysfunctional behaviour that has often been described as panic”. Thus, the false but
common belief that people will panic in disaster situations is a myth. In human behaviour
fire research, it is found that panic behaviour is extremely rare.

45
This is supported by Groner and Levin[28]
who state that:
“studies of behaviour during actual fire emergency situations have shown that social norms
are not generally abandoned, and people do care and assist one another. However, fear
and the desire to avoid pain, injury and death are great motivators and will affect the
decisions of the occupants. Normally, people will follow a fire plan only if they believe that it
will provide them with personal safety….Therefore, we would anticipate that occupants will
willingly wait their turn to use the lift or stairs if they believe that they still would be able to
safely evacuate and the delay permits an orderly evacuation for all and a more rapid
evacuation for those closer to the fire.”
Based on observations within the Post War Building Studies[37]
, which recommends that a
“crowd which is not in immediate danger, especially a disciplined crowd, may not show any
great urgency in the use of exit” it is assumed that all code compliant means of escape
provisions are designed based on the assumption that occupants do not behave in an
irrational manner.
On this basis, it is assumed that occupants will behave in an orderly fashion during
evacuation and lift boarding will occur with minimum delays. This is considered to be an
important assumption as door opening and closing times make up a large percentage of the
round trip time. Therefore, an increase in this time is considered to significantly increase
the overall evacuation time.
This is considered to support the recommendations of the BRE research, which considers
occupants are willing to wait approximately 30 minutes for a lift to arrive.
2.7.4 Summary of Information
Based on the above research, the assumption that occupants may be required to wait on a
refuge floor for approximately 30 minutes is not considered to be unreasonable based on
known occupant behaviour research with regards to evacuation.
Based on occupants escaping via the route they entered the building, and waiting for the
lift in an area which is not in immediate danger, it is considered that occupants will not
suffer increased anxiety and make irrational decisions.

46
Nevertheless, it is recognised that prolonged waiting times increases the discomfort
amongst passengers wanting to evacuate. Therefore, based on previous research it is
recommended that the lift waiting time does not exceed 30 minutes.
2.8 Summary
Based on the accounts of a number of survivors of the World Trade Centre attacks in 2001,
it has been demonstrated that the use of a combination of stairs and lifts, can significantly
reduce the overall evacuation time. However, as demonstrated by the review of the
evacuation strategy for the Petronas Twin Towers[16]
, the proposed evacuation strategy
should contain some redundancy in the system to allow for the safe evacuation in the
event of certain lifts or staircases becoming unsafe.
The provision of building specific lift evacuation strategies has been included in a small
number of tall buildings worldwide. It is noted that the two buildings with a high density of
occupants are provided with lift performance values which exceed the design guidance
used as the basis of this thesis, to ensure that the round trip time is sufficiently low enough
to evacuate the building before conditions become untenable. On this basis, additional
simulations have been conducted using higher lifts speeds of 7m/s and 16m/s to assess the
impact on the total building evacuation time.
Each of the existing buildings utilising lifts for evacuation are provided with refuges that are
constructed from high levels of fire resisting construction and maintained as a place of
relative safety. On this basis, lift evacuation is provided to serve all of the floors within the
zone of fire origin, rather than those floor levels immediately affected by the fire, as
discussed by early researchers.
Therefore, the simulations conducted as part of this assessment are based on the
assumption that occupants will be provided with an area of relative safety where they may
wait for the lift to arrive. This refuge area will be provided with a number of active and
passive fire protection systems that will ensure tenable conditions are maintained in the
refuge area, allowing occupants to wait for up to 30 minutes before boarding a lift.
It is also assumed that occupants will be provided with access to the protected escape stair
from this refuge area.

47
3.0 CHAPTER 3 - METHODS OF ANALYSIS
3.1 Introduction
Evacuation in the UK is provided in accordance with the guidance contained in Approved
Document B (AD-B), based on a notional two and a half minute evacuation time. This
requires exit routes to be provided with a sufficient width to allow the occupants located
on any floor to flow through the available escape routes to a place of relative safety within
this evacuation period. However, the place of relative safety may be the enclosure of an
escape stair. Therefore, the total evacuation time (i.e. the time to travel the flight of stairs)
will exceed the notional evacuation time of two and a half minutes.
Therefore, this study assesses the total evacuation time from the theoretical building
discussed in Section 1.4, based on the assumption that occupants use stairs, lifts or a
combination of both to escape.
A number of methods exist to calculate total evacuation time. This chapter will review
these methods in order to identify the most suitable ones.
3.2 Calculation of Evacuation Time Using Stairs
The calculation of the evacuation time via stair is based on a number of different
components which can be briefly summarised as follows:
• Fire alarm sounds and evacuation commences.
• Occupants exit their floor of origin via storey exits into a protected staircase. The
rate at which occupants enter the staircase is dependent on the width of the stair.
• Occupants descending in the stair merge with occupants from the lower levels
simultaneously entering the stair. The speed at which the merged crowd of
occupants descends the stair is based on the occupant density in the stair which is
itself controlled by the width of the stair.

48
• Once the occupant density decreases to a certain level within the stair, the flow of
occupants within the stair stops. The escape capacity in the stair is limited to the
standing area within the stair, also known as the ‘stacking capacity’.
• Occupants from the lowest floor levels will continue to evacuate due to the higher
density of the floor levels immediately adjacent to the final exit. Once those
occupants of the lowest floor levels have evacuated the density of occupants in the
stair above these floor levels slowly decreases allowing the flow rate of occupants
to increase.
• Once the density within the stair exceeds approximately 1.85 m2/person occupants
will move at their own pace and the optimum stair flow rate will be achieved.
Advanced guidance on calculating the evacuation time of a building is provided in BS 7974-
6[38]
, which makes reference two articles contained in the SFPE Handbook[3, 10]
when
calculating the total evacuation time of a whole building.
Based on the results of the evacuation time calculations using these two calculation
methods, it is proposed to assess the lift evacuation times against those calculated in
accordance with the flow rate of Approved Document B.
Based on the provision of lift evacuation in a building in the UK, it is considered necessary
to demonstrate a reasonable evacuation time when compared to the times achieved using
the flow rates in Approved Document B. Therefore, to ensure that a suitable strategy is
selected, the lift evacuation times will be assessed against the stair evacuation times from
the relevant building code.
Additionally, the assessment of the stair evacuation times using flow rates from Approved
Document B is considered to provide a conservative escape time for comparison to the lift
evacuation times, as a result of the faster evacuation time, when compared to the stair
evacuation times calculated in accordance Nelson and Mowrer, such that the stair
evacuation times will be lower based on the use of this flow rate.

49
3.2.1 Method detailed by Nelson and Mowrer
In the article by Nelson and Mowrer[3]
the time to evacuate a building may be calculated
using one of two methods, a first order assumption and a more detailed analysis. For the
purpose of this study it is considered reasonable to apply the calculation procedure of the
first order assumption to calculate the approximate evacuation time by stairs. This is
reasonable on the basis of a simple building layout, which will provide an overall time for
the total building evacuation time rather than detailed evacuation times for each level.
Estimate the flow capacity of the stairway
The effective width (We) of the stair is taken as the clear width of the stair minus the
boundary layer of that stair, as shown in Figure 3.2.1. Therefore, the effective width of the
1400mm wide stair in the theoretical building is considered to be 1160mm (i.e. 1400 – 150-
90)).
Figure 3.2.1 - Effective Width and Clear Width
Calculate the Specific Flow
The specific flow is the flow of evacuating persons past a point in the exit route per unit of
time per unit of effective width. The Maximum Specific Flow is tabulated[3]
for different
stair tread dimensions, as shown in Table 3.2.1.

50
Based on an assumed tread dimension of 11 inches, the maximum specific flow may be
taken as 1.01 persons/second/metre of effective width. Therefore, the notional maximum
specific flow may be calculated as 1.172 persons/second (i.e. 1.01 x 1.16).
Table 3.2.1 - Maximum Specific Flow
Building evacuation time
Based on the assumption that the occupancy of the building is required to evacuate via a
single stair as required by AD-B, each stair is required to accommodate approximately 7500
persons (150 persons x 50 storeys). Based on a flow rate of 1.17 persons/second, the total
evacuation of the building takes approximately 6410 seconds. Therefore, the total
evacuation time can be calculated as 1 hour and 47 minutes.
3.2.2 Method by Pauls
After carrying out a number of studies of simultaneous evacuations of office buildings in
Canada, Pauls[10]
noticed that the mean evacuation flow of the effective stair width
approach (per metre of effective stair width) varies in a non-linear fashion with evacuation
population. This regression equation is represented by Equation 1 and can be used to
calculate the mean flow rate based on the density of occupants per metre of escape width.
27.0206.0 ρ=f Equation 1
Where: f is the mean evacuation flow (persons/second/metre effective stair width)
ρ is the evacuation population (persons per metre effective stair width)

51
However the calculation above is valid for occupancies of no more than 800 persons/m of
effective stair width. Based on the requirement for 7500 persons to use the stair, this
validity limit is significantly exceeded.
However, two prediction equations are presented by Pauls which calculate the total
evacuation time and are shown in the figure below compared to a number of results
obtained by Pauls for a number of observed evacuations.
Figure 3.2.3 – Predicted and observed total evacuation times for tall office buildings
For buildings with more than 800 persons per metre of effective stair width the following
equation is presented by Pauls which is stated as “providing a good basis for predicting
times for uncontrolled total evacuations in tall office buildings”. [10]
pT 0133.07.0 += Equation 2
Where: p is the actual evacuation population per metre of effective stair width
Therefore, based on an effective stair width of 1160mm, the total simultaneous evacuation
time for the examplar building used in this study may be considered to be 1 hour and 25
minutes.
To assess the accuracy of Equation 2, the results obtained from using this equation were
plotted and compared to other calculation procedures by Pauls, as shown in Figure 3.2.3 (a)

52
below. The cross hatched area of the graph shows the observed times, as shown in Figure
3.2.3 above. It can be seen from these results that this equation produces results that are
similar to those observed in actual building evacuations.
Figure 3.2.3 (a) – Predicted and observed total evacuation times from tall office buildings
In a case study of simultaneous evacuation of an office building Pauls included for an
increase to the total evacuation time based on the roughness of the walls and the effect
this has on reducing the flow as well as including for a number of occupants wearing coats
during the evacuation. However, Pauls also included a reduction in the evacuation time due
to the familiarity of building occupants with evacuation drills.
Based a weighted percentage increase or reduction to the total evacuation time a net
adjustment of - 8% was calculated for the above factors. Based on this reduction to the
total evacuation time, the calculated evacuation time was within 4% of the observed
evacuations.
3.2.3 Method Based on Approved Document B
Based on a notional evacuation time of two and a half minutes the flow rate in accordance
with Approved Document B can be calculated from the values in Table 7 as 1.33
persons/metre/second.
For example an 1800mm wide stair is capable of accommodating 360 persons over a single
level (the additional occupancy of a stair serving additional levels is due to the ‘stacking

53
capacity’). Based on a notional evacuation period of two and a half minutes, the flow rate
may be calculated as follows:
• 360 persons / 1.8m wide stair = 200 persons per metre
• 200 persons per metre / 150 seconds = 1.33 persons/metre/second
This flow rate is higher than that of Nelson and Mowrer[3]
as it does not include for a
boundary layer. Therefore, based on a stair width of 1400mm the flow rate from the stair is
assumed to be equal to 1.862 persons/second. On this basis, the total evacuation time is
equal to 1 hour and 7 minutes.
3.2.4 STEPS Assessment of Stair Conditions
Whilst it is noted that the calculation methods above provide a total evacuation time, it is
not possible to assess intermediate conditions within the stair during evacuation.
Therefore, the simultaneous and phased evacuation of the 50 storey building used as part
of the study has been assessed using the STEPS computer evacuation model, as shown
below, based on the 1400mm wide stairs required for a code compliant building. Figure
3.2.4 shows the flow rate of the occupants in the stair at the 20th
floor level during the
simultaneous evacuation of the building, which is averaged over a 30 second interval.
Whilst the flow rate of the final exit is considered to remain constant at 1.862 persons per
second, as assumed in the analytical calculation methods detailed above, the flow rate
within the upper levels of the stair is severely reduced due to the number of merging flows
within the undersized stair enclosure. As can be seen from the graph, the flow rate within
the stair reaches the maximum flow rate of 1.862 persons per second approximately one
minute after evacuation commences. However, the flow rate within the stair rapidly
decreases to zero approximately two minutes after evacuation, suggesting that a large
amount of crowding is occurring in the stair, before slowly increasing to the optimum flow
rate at sixteen and a half minutes after evacuation commences.
This reduction in the flow rate is considered to significantly increase the overall evacuation
time of the occupants within the building, as well as increase anxiety amongst occupants
queuing in the stair.

54
0
0.2
0.4
0.6
0.8
1
1.2
1.4
1.6
1.8
2
00
:00
:00
00
:02
:50
00
:05
:40
00
:08
:30
00
:11
:20
00
:14
:10
00
:17
:00
00
:19
:50
00
:22
:40
00
:25
:30
00
:28
:20
00
:31
:10
00
:34
:00
00
:36
:50
00
:39
:40
00
:42
:30
00
:45
:20
00
:48
:10
00
:51
:00
00
:53
:50
00
:56
:40
00
:59
:30
01
:02
:20
01
:05
:10
Flo
w R
ate
(p
/s)
Time (hr:min:sec)
Figure 3.2.4 – Occupant flow rate during simultaneous evacuation
Figure 3.2.4 (a) below shows the mass flow rate at the same location within the stair during
the phased evacuation of the building. This evacuation method requires the occupants of
the floor of fire origin to evacuate first. Then after a two and a half minute interval the
floors above the floor of fire origin also evacuate, and so on. Once the floors above the
floor of fire origin evacuate the floor levels below commence evacuation. However, this
also creates merging flows within the stairs.
0
0.2
0.4
0.6
0.8
1
1.2
1.4
1.6
1.8
2
00
:00
:00
00
:03
:20
00
:06
:40
00
:10
:00
00
:13
:20
00
:16
:40
00
:20
:00
00
:23
:20
00
:26
:40
00
:30
:00
00
:33
:20
00
:36
:40
00
:40
:00
00
:43
:20
00
:46
:40
00
:50
:00
00
:53
:20
00
:56
:40
01
:00
:00
01
:03
:20
01
:06
:40
01
:10
:00
01
:13
:20
01
:16
:40
Flo
w R
ate
(p
/s)
Time (hr:min:sec)
Figure 3.2.4 (a) – Occupant flow rate during phased evacuation

55
The benefits of phased evacuation can be seen in the Figure above. Due to the lower
numbers of occupants seeking to escape during the initial stages of evacuation the flow
rate does not significantly decrease as expected during simultaneous evacuation. The
periodical drop in flow rate is considered to be a result of the lag between the assumed
floor of fire origin evacuating and those floors immediately above this level evacuating,
such that the number of occupants passing the measuring point within the stair at this time
is less than the optimum flow rate of the stair.
The reduction in the flow rate at approximately 40 minutes after evacuation commences is
due to the location of the fire floor and the order of evacuation of floors above and below
the fire floor.
The fire is assumed to be located on the 20th
floor level. On this basis, the floors above the
fire floor evacuate at two and a half minutes intervals. Once the floors above the fire floor
evacuate, those floors below commence evacuation. This creates a merging of flows in the
stair of occupants from the upper floor levels with those from the lower levels, such that
the optimum flow rate is achieved for a portion of the evacuation due to the additional
occupants in the stair below this level. However, due to the uneven division of the building,
above and below the fire floor, once all the floors from below the fire floor evacuate there
is still ten upper storeys which are required to evacuate. Therefore, due to no occupants of
the lower floor merging with these occupants, the flow rate is much lower due to the
number of occupants passing this point in the stair being less than the optimum flow rate.
3.2.5 Occupant Fatigue
The evacuation times calculated above are based on calculation procedures for relatively
low rise buildings and do not take into account fatigue as occupants are required to walk
down multiple floor levels. It is assumed that this will provide a significant increase in the
time required to walk down a large number of stairs and therefore the time to evacuate
the building using only stairs.
Later in this thesis, the evacuation simulation software STEPS will be used. In this software,
occupants are assumed to travel with a constant speed of 0.95 m/s[3]
. Whilst this is not
unreasonable over a relatively low rise building it is unreasonable to assume that an
average person may maintain this speed over many floors.

56
In a study carried out by Galea et al[8]
of the evacuation of the World Trade Centre it is
acknowledged that the simulation model used in the study didn’t include for the fatigue of
occupants as they travelled down many flights of stairs. Indeed, Galea et al[8]
recommend
that the results of this simulation could be argued to be between 50 – 100% faster than
what would be expected for a lone individual descending some 100 floors.
The total time taken for an occupant to travel down a flight of stairs due to fatigue can be
calculated using the following equation[9]
:
2
1008.1)(
+= vvv
ttfatiguet Equation 3
Where: tv is the vertical movement time predicted using evacuation models that do not
take fatigue into account
The unit of time for the above equation is not stated. Initial assessments with the units in
minutes showed an approximate 2% linear increase in the evacuation time from each floor
level. However, based on the use of the time in seconds, the time for evacuation using the
fatigue sub-model shows an exponential difference between the fatigue sub-model and the
base value, as expected.
The time for evacuation via stairs for each calculation procedure, as well as the time taken
using the fatigue sub model, is shown in Figure 3.2.5 below, for comparison.

57
Figure 3.2.5 – Comparison of time for evacuation using fatigue sub-model
As can be seen from the graph, the stair evacuation times are significantly increased when
taking into account occupant fatigue. Whilst it is proposed to assess the lift evacuation
times with those based on the Approved Document B flow rates, it is noted that this time
can be significantly increased when taking into account occupant fatigue. The difference
between the calculated stair evacuation time and the ‘fatigued’ stair evacuation time is
shown below.
Calculation Method Stair Evacuation
Time
Fatigued Evacuation
Time
Factor of
Difference
Nelson and Mowrer 6410 13806 2.15
Pauls 4317 7671 1.78
AD-B 4027 6948 1.73
Table 3.2.5 – Summary of fatigued stair evacuation times
3.2.6 Summary
Based on the minimal difference between the Approved Document B evacuation times and
those calculated using the Pauls method, which have been shown to have a close
0.0
2000.0
4000.0
6000.0
8000.0
10000.0
12000.0
14000.0
16000.0
1 6 11 16 21 26 31 36 41 46
Floor Level
Tim
e (seconds)
Nelson & Mowrer
Nelson & Mowrer
(inc fatigue)
Approved
Document B
Approved
Document B (inc
fatigue)Pauls
Pauls (inc fatigue)

58
correlation to the results of actual evacuation drills, it is proposed to use the Approved
Document B method to calculate the stair evacuation times for comparison to the lift
evacuation times.
All stair evacuation calculation times are based on the assumption that one of the stairs
within the theoretical building is discounted in accordance with Approved Document B,
therefore, all of the occupants are assumed to escape via the remaining stair.
Whilst the stair evacuation times will provide a conservative result for comparison to the
lift evacuation times, it is noted that in reality these times are likely to be significantly
increased when taking into account the fatigue of occupants when descending from the
upper storeys of a high rise building. However, it is not proposed to use the ‘fatigued’ stair
evacuation times for comparison due to the limited information and validation available for
this calculation method.
3.3 Calculation of Evacuation Time Using Lifts
3.3.1 Introduction
In normal service the number, the size and speed of passenger lifts in most buildings are
designed to be able to move approximately 10% of the total population of the total
population of the building from random floors to the level of exit discharge in 5 minutes.
This means that any building of any height can be totally evacuated by lift in one hour or
less without increasing the number, size, or speed of the lifts normally provided[39]
.
However, this is based on the assumption that lifts used for evacuation will serve the same
floor levels as during ordinary service. In order to allow maximum flexibility in the design of
the lift system for evacuation it is considered necessary to assess the building evacuation
time for two possible evacuation strategies; evacuation from refuge floors and evacuation
from a refuge zone.

59
3.3.2 Calculation Developed By Siikonen
In the work published by Siikonen[40]
, it is claimed that it is possible to calculate the
evacuation time from the lift zone to the discharge floor using one of two calculation
methods, depending on the information known.
If the handling capacity of the lifts is known and people are not required to use more than
one lift for evacuation (i.e. not required to transfer to lifts at sky lobbies) the egress time
may be calculated using the equation below.
6.1/5/5100 HCTliftegress ×= Equation 4
Where: 5HC = Percentage of the building occupants handled by the lift in five minutes
It is possible to use a value for the handling capacity of the lift (5HC) based on information
provided in lift design guides.
The value of 1.6 used in the equation is the efficiency factor of the control system, which
according to Siikonen[40]
“can typically be assumed to be 1.6”. This efficiency factor is
assumed to take into account the reduction of the lift evacuation time based on the use of
the lifts in down-peak mode, on the basis that it is only required to stop at two floors (i.e.
the destination and discharge floors). No further guidance is provided by Siikonen with
regards to selecting an alternative value. However, it is noted that CIBSE Guide D suggests a
value of 1.6 for calculating the down peak travel time.
The value of 100 is considered to be the total percentage of the building occupants, while
the value of 5 represents the time period the handling capacity of the lifts are assessed by.
Based on a value of 15% for the handling capacity in five minutes, as recommended in
CIBSE Guide D[27]
, the evacuation time of a lift operating in down-peak mode is
approximately equal to 20.8 minutes. However, as discussed in Section 3.3.6, this requires
lifts with very high performance values.
On this basis, it is not considered appropriate to apply the above calculation method to
buildings which utilise lifts for evacuation that are not used in general evacuation mode.

60
However, Siikonen also provides an alternative and slightly more detailed calculation
procedure for use when the handling capacity percentage of the lift is unknown, which is
also discussed in work by Hakonen[41]
, that may be applied to lifts that are required to
accommodate a greater occupancy than designed to accommodate, such as in an
evacuation scenario.
The round trip times for each floor can be calculated when we know the distance from the
rescue floor to the destination floor Hi and back, and divide it by the rated speed v.
Additional guidance[41]
states that tv is the time to travel one floor with contract speed and
Hi is the reversal floor index (i.e. the distance between floors).
Based on the procedure detailed by Siikonen it is the authors belief that the value of tv is
equal to the time to travel 1m at the rated speed of the lift based on the value of Hi being
the distance from the refuge floor to the discharge floor in metres.
In addition to the time to travel the distance between floor levels, the additional times for
stops has to be added to the round trip time. Stop times includes, door delays, lift
acceleration and deceleration delays (ts) associated with each stop (v/acceleration), and
delays for the M passengers to transfer in and out from the car (tm typically 1 second per
person) during down trip i.
A diagrammatic representation of lift motion for a single trip is provided by Klote[19]
, and is
reproduced in 3.3.5.3.
The sum of all round trip times may be expressed by:
( )∑=
++=RTN
i
misvi tMttHRTT1
222 Equation 5
This value for the round trip time is for a single lift car and for a group of N lifts the time
may be calculated by dividing the RTT value by the number of lifts available.
Due to the method of calculation, a constant default value of 10 seconds was used in the
calculation for the delay (for a single round trip) due to acceleration and deceleration. This
is considered to be reasonable for the lifts at lower speeds, where the difference between

61
a lift travelling the whole distance at a constant speed and a lift which is required to
accelerate and decelerate is approximately equal to this value, when including the
additional time to open or close the doors.
However, a more accurate method of calculating the delays associated with acceleration
and deceleration has been included in the evacuation calculation spreadsheet, as discussed
in Appendix A.
3.3.3 Calculation Procedure Developed By Japanese Researchers
A number of Japanese studies have been carried out[42, 43]
to study the feasibility of using
lifts as a method of evacuation.
The first of these methods by Sekizawa et al[42]
used a very simplified equation to calculate
the lift times for the evacuation of a Hiroshima apartment block based on research
conducted after a serious fire in the building and is a revised model from the original,
developed circa 1998. The study was carried out as a result of the large number of elderly
persons in the building used the lifts as a means of escape, even though the lift system was
not designed as a means of escape route. The lift system used in the building is a skip-floor
type (i.e. the lift stops only on even number floors from the 2nd
to the 20th
floors).
The formula developed by Sekizawa et al[42]
is shown below and requires the transfer time
by lift and time for evacuees to enter and exit a lift to be calculated separately and then
combined to get an overall evacuation time.
Transfer time by lift
αelv
elv
ij
m
V
V
HT += Equation 6
Where: Tm is the lift transfer time (s)
Hij is the vertical distance between ith floor and jth floor (m)
Velv is the lift velocity (m/s)
α is the lift acceleration (m/s2)

62
Time for evacuees to get on and off a lift
( )clop
elvelv
strifi
e TTWN
PPT ++
×−
=)(
)( Equation 7
Where: Te is the time for evacuees to get on and off a lift (s)
Pfi is the number of occupants on the ith floor
Pstri is the number of evacuees by stairs on the ith floor
Nelv is the flow factor of lift doors (persons/m/s)
Welv is the available lift door width (m)
Top is the opening time of the lift doors (s)
Tcl is the closing time of lift doors (s)
An alternative calculation method was later published by Sekizawa et al[43]
, based on similar
time-velocity graphs as those used by Klote[19, 44]
as shown in 3.3.3.
Figure 3.3.3 – Graphical representation of single lift trip
For a lift which has a stage of constant velocity, the vertical distance for the lift movement
may be calculated from the following equations:
2
32max
2
12
1
2
1TTVTL βα ++= Equation 8
31max TTV βα == Equation 9

63
Where: L is the vertical distance for the lift movement (m)
α is the lift acceleration (m/s2)
β is the lift deceleration (m/s2)
Vmax is the maximum lift velocity (m/s)
T1 is the acceleration time (s)
T2 is the constant velocity time (s)
T3 is the deceleration time (s)
From these equations Sekizawa et al derived the following equations:
αmax
1
VT = Equation 10
−−
=
βα
2
max
2
maxmax
2
1
VVLV
T Equation 11
βmax
3
VT = Equation 12
On this basis, the total time for a single trip can be calculated as follows.
321 TTTTtotal ++= Equation 13
ββα
αmax
2
max
2
max
max
max 1 V
VVLV
VTtotal +
−−
+= Equation 14
Therefore, the round trip time is equal to Ttotal multiplied by two to include for the lift trip
to the discharge floor and back.
However, it is believed that the equation for T2 has been incorrectly derived from the
original equation. This is on the basis that as the distance between floors increases, the
denominator decreases, and the resulting evacuation time decreases. However, it is
considered reasonable to assume that as the distance between floor levels increases the

64
time for evacuation should also increase. On this basis, it is believed that the original
equation should be derived as follows to determine T2:
2
32max
2
12
1
2
1TTVTL βα ++= Equation 15
Where
αmax
1
VT = and
βmax
3
VT = Equation 16
Then
−
−=2
max
2
max2max
2
1
2
1
ββ
αα VV
LTV Equation 17
−
−=
2
2
max
2
2
max2max
2
1
2
1
ββ
αα VV
LTV Equation 18
max
2
max
2
max
2
2
1
2
1
V
VVL
T
−
−
=βα
Equation 19
Which can be simplified as follows:
2
max
2
max
2
max
2
22
V
VVL
Tβα
−−= Equation 20
Based on the initial results achieved using the equation provided by Sekizawa et al it is
proposed to assess the lift evacuation time using the modified equation for T2 stated
above.
3.3.3.1 Example Calculation
The evacuation of a 53 storey office building was calculated as part of the study by
Sekizawa et al[43]
using stairs as well as the evacuation of the building using only lifts.

65
The standard building floor area measured 2629m2 while the floor to floor height was
3.65m.
The centre core of the building contained four banks of lifts (A to D) which each served a
dedicated lift zone as follows:
• A bank - 1st
to 14th
• B bank – 15th
to 27th
• C bank – 28th
to 40th
• D bank - 41st
to 53rd
Each bank contained eight lifts. Therefore, the building was provided with 32 lifts in total.
However, as part of the study it was assumed, as the most onerous scenario, that the
occupants were unable to use D bank and were instead required to escape via two
emergency lifts. A diagrammatic section of the building is shown in the figure below.
Figure 3.3.3.1 – Section of building used in Sekizawa’s calculations
The evacuation of the building was then studied using the three remaining banks of lifts
contained within the building, plus the two evacuation lifts. The results of which may be
seen in Table 3.3.3.1(a).

66
Unit A bank B bank C bank D bank Emergency
lift
Service floor Floor 1-14 1, 15-27 1, 28-40 1, 41-53 1-53
Number of
lifts
8 8 8 8 2
Capacity Persons 22 22 22 22 22
Constant
speed
m/s 4 5 6 7 3
Acceleration m/s2 0.7 0.7 0.7 0.7 0.7
Deceleration m/s2 -0.7 -0.7 -0.7 -0.7 -0.7
Door width m 1.1 1.1 1.1 1.1 1.1
Occupant
load
persons 2520 2520 2520 2520 -
Table 3.3.3.1 –Lift details
The evacuation times listed within the paper are shown below as well as the evacuation
time for the same building using the modified formula discussed above.
Lift Bank Stated Time[43]
(s) Modified Equation (s)
A 967 314
B 1268 513
C 1483 694
D 6122 2862
Table 3.3.3.1 (a) – Comparison of Evacuation Times
Based on the uncertainty between results, it is not proposed to include the evacuation
times by Sekizawa et al in the assessment. Results using the modified equation will be
provided for comparison where appropriate.
3.3.4 STEPS
The STEPS evacuation simulation programme, developed by Mott McDonald, is a
commercially available movement/partial behavioural simulation programme, which may
be used to simulate the evacuation of a building, and contains controls for describing[45]
:

67
• Pre-movement abilities,
• Occupant characteristic,
• Patience factor,
• Family behaviour,
The most detailed information available is presented by Kugligowski[45]
:
“The model views the occupants individually and allows the user to give individual traits to
each person or groups of people in the simulation. The occupants also have an individual
view of the building, because the user can specify each occupants “target” or checkpoint
(exit), allowing for the user to aid in the mapping of a defined route for certain groups of
people.”
Also, for each target, each occupant group is assigned an awareness factor between 0 and
1, specifying the fraction of that group which knows about the exit. If a 0 is specified for the
occupant group and target, that denotes that no one in the group knows about the target
exit, and the label of 1 would specify that everyone in the group knows about the target or
exit. The occupants choose the exit that they travel to according to the score assigned to
each exit. This score is based on the following four factors:
1) The shortest distance to the exit,
2) Familiarity with the exit,
3) The number of occupants around the exit,
4) The number of exit lanes.
Three interconnecting components in the model are considered: the plane and path
network, the description of the human characteristics, and the movement of the people
within the system. The algorithm for a person to select the travel path is based on a
combination of decisions and network-based models. Planes that represent the actual floor
space consist of a grid configuration on which people can walk, the spacing of which is
dependent on the maximum specified population density. Alternatively, predefined paths
or planes are used to represent stairways, upon which deviations of the walking directions
are not possible until another path or plane is reached.
68
As well as the potential to calculate the lift evacuation time, STEPS can also provide
additional information on conditions in the building during evacuation, including stair flow
rates, lift waiting times and floor space per person on refuge floors.
The programme is provided with a number of pre-programmed values with regards to
walking speed, and flow rates. However, these are generally based on NFPA values
commonly used in the USA. Nevertheless, the user may input customised values for each
variable. To allow a comparison to be made between models, each variable will be
specified, rather than using the default values.
The programme is commercially sensitive; therefore, it is not considered possible to access
the computer code for the programme to validate the model. However, it is proposed to
note the work of others who have been able to validate and verify the accuracy of the
programme, as well as conduct sensitivity studies into the accuracy of the model.
3.3.4.1 Validation
This model has been validated[46, 47]
against code compliant evacuation times and has been
shown to generally provide an accurate result of the overall evacuation time. Results which
do not closely match the code compliant evacuation times are considered to be
conservative results which exceed the code compliant evacuation times[45]
. Details of the
validation studies are provided below.
Wall and Waterson
The accuracy of the software was validated[46]
by comparing the results for the evacuation
of two example train stations detailed in NFPA 130 ‘Standard for Fixed Guideway Transit
and Passenger Rail Systems’ with the results of the hand calculations detailed in the
aforementioned standard.
The STEPS results of both examples give longer and more conservative evacuation times
than the figures obtained from NFPA 130 hand calculations (between 0.9% to 11.4%). This
is considered to be the result of the assumption within the NFPA calculations that
occupants will evenly distribute amongst the available exits. However, based on the STEPS

69
calculation methodology of calculating an exit ‘score’, occupants are noted to queue for
exits that are in use, whilst others are empty.
Whilst it is noted that the validation has been conducted using the calculation procedure of
NFPA 130, Wall and Waterson state that ‘by changing the variables for exit flow rates, and
passenger travelling speeds, STEPS may be made compatible with other similar standards’,
such as Approved Document B, BS 7974-6, SFPE Handbook. On this basis, it is acceptable to
use this programme with the relevant values from English building codes.
Lord et al
Additional validation of the STEPS programme was conducted by Lord et al[47]
by comparing
the evacuation times from three buildings calculated with STEPS with those obtained from
actual evacuation drills and the simulated times using the EXIT89 programme.
Simulations were conducted of three buildings of varying height and occupancy. Two of the
buildings were simulated using the known values for the occupant data, as well as
additional simulations with uncertainty analysis data. The third building was assessed using
the average value of an uncertainty analysis conducted as part of the study.
A summary of the results for each building is listed below:
London Building
• STEPS predicted the same evacuation time as the actual evacuation time when the
occupant load data for the building was known.
• STEPS over predicted the evacuation by approximately 6% when the average value
from the uncertainty analysis was used.
Calgary Building
• STEPS predicted a value that was approximately 6% less than the actual evacuation
time when the occupant load data was known.

70
• STEPS over predicted the evacuation time by 211% when the average uncertainty
analysis data was used.
Ottawa Building
• STEPS over predicted the evacuation time by 202% when the average uncertainty
analysis data was used.
The reason for the large difference between the actual evacuation time and the average
uncertainty analysis data for the Ottawa building is noted by Lord et al as ‘relating to the
number of people that were actually in the building and the number in the model. The total
number of people in the model varied between 1293 and 3738 occupants based on office
occupant load factors found in literature and building codes. The low end of this range is
more than twice the actual number of people in the office building, which could account
for the average evacuation time of the STEPS model being approximately twice the actual
evacuation time’.
Nevertheless, based on the results of this assessment, Lord et al[47]
concluded that “STEPS
may over predict the total evacuation time for a building if prior knowledge of the occupant
load is not provided”.
STEPS is sensitive to grid-size. Changing the grid from 0.3 metres to 0.6 metres can have a
significant impact on the results of the model. Efforts should be taken when using STEPS to
use an appropriate grid size and to perform some sensitivity analysis.
3.3.5 ELVAC
3.3.5.1 Introduction
The ELVAC simulation programme, developed by Klote et al[19]
, may be used to calculate
the evacuation time for one group of lifts. For a building containing more than one group of
lifts the programme is required to be used a number of times to calculate the evacuation
time for each group. The programme is written in Quick BASIC and will only display the
output in numerical form.

71
There is a limited amount of information available with regards to the results of evacuation
studies completed using ELVAC to verify the programme. Limited information on the
programme is available based on the example evacuation assessment carried out by Klote
et al[19]
, as shown in Table 3.3.5.4, as well as the description given by Kuligowski[16, 45]
3.3.5.2 Model Description
Kuligowski[14]
states that “ELVAC is a model dedicated to the simulation of building
evacuation by lift only (and) only gives the gross evacuation time of the building, and along
with its assumptions, may cause the model to lose accuracy in calculation, especially when
compared to a complete simulation model.”
“The ELVAC model works on the two stop evacuation approach meaning that the car
travels from the lobby to a specific floor and then back down to the lobby, independent of
the number of tenants in the car”[14], similar to the non-stopping on the way down
method discussed in Section 2.6.1.3.
Kuligowski[14]
recommends that changes should be made to the ELVAC model to allow the
model to recognise when the lift car is provided with spare capacity and to pick up more
occupants on the way down”. However, as discussed in Section 2.6.1.3, this may not
decrease the overall evacuation time due to the additional delays associated with the door
opening and closing times.
Kuligowski[14]
states that “in an actual fire evacuation, it is most likely that the cars will move
to the fire floor (and floors above and below) to evacuate those occupants first.” However,
this is only true for a certain method of evacuation and does not hold true for evacuation
between two floors, such as that from a refuge floor.
Based on the same method of operation in the STEPS model, as that in ELVAC, it is
considered reasonable to use ELVAC to assess the evacuation time for a lift that serves
dedicated refuge floors only as well as lifts that serve evacuation zones containing multiple
floor levels.

72
3.3.5.3 Calculation of Evacuation Time
A number of variables within lift evacuation may be calculated using the equations given by
Klote[11, 44]
for use in the computer simulation programme ELVAC. The default values have
been used for the input into this simulation programme. On this basis, it is proposed to
assess the sensitivity of the results to these values in Section 3.3.5.5.
The calculation procedures detailed by Klote[19, 44]
are intended to calculate the evacuation
time for one group of lifts. The time to evacuate a building can be calculated using the
equation below:
( )∑
=
+++=m
j
jroae tJ
ttt1
,
1 η Equation 21
Where: tr,j = time for round trip j
m = is the number of round trips
j = number of lifts
η = trip inefficiency
ta = lift start up time
to = the travel time from the lift lobby to the outside or to another safe location
The number of round trips may be calculated by dividing the occupancy by the handling
capacity of the lifts (i.e. number of lifts x capacity of lifts).
The value for the trip inefficiency is a default value of 0.1 within the programme and
represents trips to empty floors and trips to pick up only a few occupants.
Start Up Time
“For automatic lift operation during evacuation, a simple approach is to start lift evacuation
after all of the lifts have been moved to the discharge floor. For this approach, the start up
time (ta) consists of the time for lifts to go to the discharge floor plus the time for the
passengers to leave the lifts. This can be expressed as:
)1)(( µ+++= duTa tttt Equation 22

73
Where: tT = the travel time for the lift car to go from the furthest floor to the discharge
floor
tu = the time for passengers to leave the lift
td = is the time for the doors to open and close once
µ = is the total transfer inefficiency
The default value within the programme for people to leave the lift is given as 0.6 seconds.
A sensitivity study of the time taken for people to transfer out of the lift is provided in
Section 3.3.5.5 and demonstrates that this has minimal impact on the total evacuation
time.
The time for the doors to open or close is shown in Table 3.3.5.3 below, and may be varied
depending on the door width and opening arrangement. The simulations conducted as part
of this thesis use a door opening time of 5.33 seconds for an assumed 1200m wide, centre
opening door.
The calculation method of the total transfer inefficiency is discussed below for the standing
time.
Round Trip Time
The round trip time starts at the discharge floor and consists of the following sequence:
• Lift doors close
• Car travels to another floor
• Lift doors open
• Passengers enter the lift car
• Doors close
• Lift car travels to discharge floor
• Doors open
• The passengers leave the lift car
The round trip time can be expressed by

74
sTr ttt += 2 Equation 23
Where: ts is the standing time
tT is the travel time for one way of the round trip
This is based on assumption that the lift only stops at one floor to pick up passengers.
Therefore, this programme is only considered to be suitable for evacuation simulations of
'non-stopping’ on the descent, as discussed in Section 2.6.1. It is not possible to assess
different lift operation modes using this programme.
Standing Time
The standing time is the sum of the time to open and close the lift doors twice, the time for
people to enter the lift and the time for people to leave the lift. Considering the transfer
inefficiencies, the standing time can be expressed as:
)1)(2( µ+++= duis tttt Equation 24
Where: µ = α+ε+γ
α = basic transfer inefficiency (generally 0.1)
ε = door inefficiency
γ = other inefficiencies in people transfer into or out of lifts
td = time for doors to open and close
ti = time for people to enter the lift
tu = the time for passengers to leave the lift
The door inefficiency (ε) is used to adjust for any increase in transfer time over that of a
1200mm wide, centre opening, door. For this simulation a 1200mm wide, centre opening,
door has been assumed and, therefore, the value for the door transfer inefficiency is equal
to zero. To allow an accurate comparison to be made between models the STEPS
simulations also use a door opening time of 5.3 seconds. The value of the door opening
times may be adjusted within the model from pre-programmed times, which vary between
4.1 seconds and 9.9 seconds.

75
The values of ε are shown in Table 3.3.5.3, which is taken direct from Klote’s work.
Table 3.3.5.3 – Door operating time and transfer inefficiency
The inefficiency (γ) is used to account for any other inefficiencies as people transfer into or
out of lifts, such as increased movement times within a lift car due to an unusual lift car
shape or limited physical capabilities. For example, a value of 0.05 is recommended for
hospital lifts and 0 in office buildings. However, Klote does not explain how these values
have been determined, such that it is not possible to calculate alternative values.
Notwithstanding, it is noted that a value of only 0.05 is applied for lifts in a hospital
building, where the transfer inefficiency is assumed to be the highest. On this basis, it is
assumed that this factor has a minimal impact on the total evacuation time, when
compared to the value for a building with a large number of able bodied occupants.
Therefore, it is proposed to apply the default value to all simulations.
As discussed previously, it is not proposed to include for the increased inefficiencies
associated with using lifts for the evacuation of wheel chair bound persons.
The time for people to enter the lift depends on the number (N) of people entering and on
the door operation. The time for (N > 2) people to enter the lift can be expressed as:
)( dwiodwi NNttt −+= Equation 25

76
Where: Ndw = the number of people entering the lift during the dwell time
tio = the average time for one person to enter the lift
The default value for a person to enter the lift is equal to 1 second, while the time for a
person to exit the lift is 0.6 seconds.
Travel Time
Travel time can be represented graphically for motion which reaches normal operating
velocity, as shown in Figure 3.3.5.3.
Figure 3.3.5.3 – Velocity of lift reaching normal operating velocity
The travel time (tT) is required to calculate the value of the start up time during the
sensitivity study. Based on the provision of a lift that reaches normal operating velocity,
this may be calculated as follows.
The time to complete constant acceleration motion (t1) is
a
Vt 11 = Equation 26
Where V1 is the velocity at the end of constant acceleration. This value is dependent on the
velocity of the lift and the rate of acceleration.

77
The distance travelled during constant acceleration is:
a
VS
2
2
11 = Equation 27
The time to reach the end of transitional velocity is approximated by assuming that the
product of velocity and acceleration are constant and can be expressed as:
1
1
2
1
2
22
taV
VVt m +
−= Equation 28
The distance travelled by the end of transitional acceleration is:
1
2
1
1
3
23
1SV
V
V
aS m +
−= Equation 29
Therefore, the one way travel time may be calculated as follows:
m
T
V
SStt 225
22
−+= Equation 30
Usually lifts do not stop exactly at the desired floor at the end of deceleration, so the lift
must be moved slowly up or down to get it nearly level with the floor. The levelling time
must be added to the above time to get the total travel time for a one way trip. The default
levelling time is 0.5 seconds.
3.3.5.4 Validation
Direct validation of either STEPS or ELVAC is not possible because of the difficulty to obtain
experimental data for using lifts in fire evacuation. To give confidence in the use of these
two simulation methods, a comparison will be made between the results of these two
different simulation methods. For this purpose, a 21 storey examplar building discussed by
Klote[19]
in the associated ELVAC literature has also been simulated using the STEPS
programme.

78
Building Description
The building used by Klote et al[19]
in the exemplary calculation has 21 storeys (i.e. Ground
plus 20). The upper 11 storeys are required to evacuate via lift while the remaining 10
storeys are required to evacuate via stairs. However, it is assumed that 3% of the occupants
of these lower floors were also required to evacuate via lifts due to an inability to travel
down the stairs. Each floor is provided with an occupancy of 90 persons. On this basis, the
lifts are required to evacuate 3 persons from each of the lower floors.
The evacuation was carried out using a group of six lifts. However, as a safety factor, one of
the lifts in the calculation is assumed to be out of operation due to maintenance.
Therefore, the evacuation is carried out using five of the lifts. The lift performance is listed
below.
• Capacity - 16 persons,
• Door width - 1200mm wide, centre-opening door,
• Door opening time – 5.3 seconds,
• Operating velocity - 3m/s
• Rate of acceleration and deceleration - 1.2m/s2
• Dwell time - 4 seconds.
Results of ELVAC Assessment
The results of the ELVAC assessment provided by Klote is shown in Table 3.3.5.4 below. The
value for the time for evacuation per floor is not equal to the number of round trips
multiplied by the round trip time. This is on the basis that, during the final round trip to a
floor, the lift is not fully occupied and therefore, the round trip time is less than that of a
full lift car. Whilst this is taken into account by the ELVAC programme when calculating the
evacuation time per floor, the time for this final trip is not displayed within the outputs.
The number of people on a floor, plus the percentage of those occupants evacuated by
lifts, and the time to leave the building are notional values used in the assessment by Klote.
The number of round trips is calculated based on the number of lifts and the occupancy
capacity per lift required to evacuate those occupants requiring lift evacuation.

79
The total round trip time is the sum value of all the evacuation times per floor. This value is
equal to the sum of the evacuation times per floor on the basis that the lifts are operating
in down-peak mode, as discussed in Section 2.6.1, such that the lifts serve the top floor
level until it is completely evacuated before moving to the next floor level below. On this
basis, the lowest floor level will not be evacuated until the floor levels above are
completely evacuated. Therefore, the total round trip time is equal to the sum of the
evacuation times per floor. The start up time may be calculated using equation 22. The
evacuation time
Floor Height One
way
trip
time
(s)
Round
trip
time (s)
People
on floor
Percentage
evacuated
by lift
Number
of round
trips
Time
per
floor
20 64 24.4 89.1 90 100 6 524.1
19 60.8 23.4 87.0 90 100 6 511.3
18 57.6 22.3 84.8 90 100 6 498.5
17 54.4 21.2 82.7 90 100 6 485.7
16 51.2 20.2 80.6 90 100 6 472.9
15 48.0 19.1 78.4 90 100 6 460.1
14 44.8 10.2 76.3 90 100 6 447.3
13 41.6 17.0 74.2 90 100 6 434.5
12 38.4 15.9 72.0 90 100 6 421.7
11 35.2 14.2 69.9 90 100 6 408.9
10 32.0 13.8 67.8 90 3 1 396.1
9 28.8 12.7 45.8 90 3 1 45.8
8 25.6 11.6 43.7 90 3 1 43.7
7 22.4 10.6 41.6 90 3 1 41.6
6 19.2 9.5 39.4 90 3 1 39.4
5 16.0 8.4 37.3 90 3 1 37.3
4 12.8 7.4 35.2 90 3 1 35.2
3 9.6 6.3 33.0 90 3 1 33.0
2 6.4 5.2 30.8 90 3 1 30.8
1 3.2 3.8 28.0 90 3 1 28.0
Ground - - - - - - -
Total
round trip
time
5395.6
Start up
time
41.3
Time to
leave
building
30.0
Evacuation
time
1258.3
Table 3.3.5.4 – Lift trip and evacuation time calculated by ELVAC computer program

80
Results of STEPS Assessment
The STEPS programme provides numerical outputs in Microsoft Excel format, compared to
the MS DOS outputs created by ELEVATE. On this basis, the results at the key time steps
within the STEPS simulation have been determined from the Excel spreadsheet of outputs
and are summarised in the figure below.
The one way trip time and round trip time values have been determined from the values
for the lift position during the simulation at two second intervals. On this basis, the round
trip time value is considered to be accurate within +/- two seconds. The round trip time for
a lift which is not fully occupied has also been included within Table 3.3.5.4 (a) to enable
the calculation of the evacuation time per floor.
To ensure that an accurate comparison can be made against the results of the ELVAC
assessment it is considered necessary to calculate the evacuation time using the same
calculation methodology discussed above. Therefore, the value for the time to outside is
also equal to 30 seconds.
The time for people to exit the lift (Tu) is not an input within the STEPS model. However,
this may be determined from the results of the number of persons in a lift, as discussed
below.
The output file of the number of persons within the lift shows the occupancy of a lift at one
second intervals during the simulation. On this basis, it is possible to calculate the time for
occupants to exit a lift based on the time taken for the lift occupancy to change from full
occupancy (16 persons) to empty (displayed as zero persons). Occupants enter and leave
the lift in the STEPS programme in four seconds (0.25 seconds per person).
On this basis, the evacuation time using the STEPS programme may be calculated by
substituting the relevant values into Table 3.3.5.4, as shown in Table 3.3.5.4 (a) below,
which also includes the final round trip time to pick up the last few remaining occupants.

81
Floor Height One
way
trip
time
(s)
Round
trip
time (s)
Shorter
Round
trip
time (s)
People on
floor
Percentage
evacuated
by lift
Time
per
floor
20 64 26 80 72 90 100 472
19 60.8 24 76 72 90 100 452
18 57.6 22 74 68 90 100 438
17 54.4 22 72 66 90 100 426
16 51.2 20 70 64 90 100 414
15 48.0 20 68 60 90 100 400
14 44.8 20 66 58 90 100 388
13 41.6 18 64 56 90 100 376
12 38.4 18 62 54 90 100 364
11 35.2 18 62 52 90 100 362
10 32.0 14 58 50 90 3 340
9 28.8 14 40 0 90 3 40
8 25.6 12 38 0 90 3 38
7 22.4 12 36 0 90 3 36
6 19.2 10 34 0 90 3 34
5 16.0 8 32 0 90 3 32
4 12.8 8 30 0 90 3 30
3 9.6 6 28 0 90 3 28
2 6.4 6 26 0 90 3 26
1 3.2 6 24 0 90 3 24
Ground - - - - - - -
Total
round trip
time
4720
Start up
time
42.06
Time to
leave
building
30
Evacuation
time
1110.5
Table 3.3.5.4 (a) – Summary of lift evacuation times using STEPS programme
Comparison of Results
The ELVAC evacuation time is equal to 1258 seconds. However, the evacuation time using
the STEPS simulation programme is equal to 1110 seconds. This is 148 seconds less than
the value of the ELVAC assessment, which is a reduction of approximately 11.8%.
Considering that there are many uncertainties in input values used in these two simulation
methods, such a close agreement indicates that both simulation methods have
incorporated the essential features of lift evacuation in a consistent way and their
simulation results may be considered acceptable.

82
3.3.5.5 Sensitivity Study
The ELVAC simulation programme requires a number of input variable to be provided to
determine the value for the evacuation time, other than the default values, discussed in
Chapter 5..
Whilst it is noted that a default value for these inputs is provided by Klote[19, 44]
, it is
proposed to conduct a sensitivity study, using the theoretical building detailed in Section
1.4, to assess the sensitivity of the evacuation time, based on varying some of the input
values, to determine the sensitivity of the final value to these inputs. The results of this
assessment are detailed below.
Trip Inefficiency
The trip inefficiency accounts for trips to empty floors and trips to pick up a few stragglers.
The default value is equal to 0.1.
It is noted as part of this thesis that the difference between evacuation times from a refuge
floor and from within an evacuation zone is a result of the additional numbers of inefficient
round trips to pick up the few remaining occupants of each floor from within an evacuation
zone, compared to just one trip from an evacuation floor.
It is noted that in the example calculation given by Klote[44]
, that evacuation is provided
from each floor level (i.e. an evacuation zone) and that the value of the trip inefficiency is
0.1. Therefore, it is considered reasonable to assume that for a more efficient evacuation
system, such as from a refuge floor, the value will be lower.
On this basis, a calculation of the evacuation time for the theoretical building detailed in
Section 1.4 has been conducted using the standard default values for speed, acceleration,
capacity and number of lifts with the default value for the trip inefficiency factor (i.e. 0.1),
as well as a lower value of 0.01 to represent the additional efficiency of evacuation from a
refuge floor, for refuge floor and evacuation zone intervals at 10 stories. The results of the
assessment are shown in the table below along with the percentage difference.

83
Refuge Floor Level
Inefficiency – 0.1
Inefficiency – 0.01
Difference
10 30.6 28.1 8.2%
20 37.6 34.6 8.0%
30 44.6 41.0 8.1%
40 51.6 47.5 7.9%
Table 3.3.5.5 – Impact of variable inefficiency factors from a refuge floor
Lowest floor in zone
Inefficiency – 0.1
Inefficiency – 0.01
Difference
10 38.3 35.2 8.1%
20 46.4 42.6 8.2%
30 54.4 50.0 8.1%
40 69.1 63.5 8.1%
Table 3.3.5.5 (a) – Impact of variable inefficiency factors from an evacuation zone
Based on the results of the assessment above, it is noted that by reducing the value for the
trip inefficiency by a factor of ten reduces the total evacuation time by a maximum of 8%.
On this basis, it is assumed that the increase in time is approximately linear with the
increase in the inefficiency factor.
It is also noted that the same reduction occurs with the results of the evacuation time from
an evacuation zone. This is considered to be the result of the calculation assuming a lower
number of round trips required for either simulation, such that the reduction in evacuation
time is linear, irrespective of the method of evacuation.
People Transfer Time
It is noted that in ELVAC, a default value of 0.6 seconds is used for the time taken for a
person to leave a lift (tu). However, from the STEPS assessment detailed in 3.3.5.4 above, it
is noted that it takes approximately half of this time for occupants to exit the lift.
Based on a value of 0.3 seconds for a person to leave the lift, the value of the start up time
may be calculated using equation 22, based on a value of t5 determined using equations 26
to 30, while the value of the standing time may be calculated using equation 24. The result
of varying the people transfer time on the start up time, for evacuation from refuge floor
levels at 10 storey intervals, is shown in the table below.

84
Refuge Floor Level
tu – 0.6
tu – 0.3
Difference
10 24.66 24.33 1.33%
20 31.33 31.00 1.05%
30 38.00 37.67 0.87%
40 44.66 44.33 0.74%
Table 3.3.5.5 (b) – Result of people transfer time on value of start-up time
Based on the results of Table 3.3.5.5 (b), the value of the people transfer time is considered
to have a negligible impact on the total evacuation time, particularly as the overall
evacuation time increases as a result of the greater round trip time, and therefore will have
minimal impact at the higher floor levels at which lift evacuation will be valid at.
3.3.6 ELEVATE
The lift performance specification for the theoretical building used in the study of this
thesis has been calculated using the ELEVATE programme, as discussed below. It is noted
from this assessment that the required lift specification to meet current design
recommendations significantly exceeds that of the default lift performance values used.
On this basis, it is assumed that dedicated lift evacuation systems may be included within
buildings without requiring an increase in the lift specification used for general vertical
transport.
ELEVATE is a lift industry standard programme that can be used to conduct lift traffic
analysis of proposed lift designs within new buildings for specific lift arrangements by
specifying lift group, car, passenger loading and building data[48]
.
The results of an ELEVATE assessment for the theoretical 51 storey high rise office
building[49]
, have shown that, the lift specification required within the building to meet
design guidance[27]
requires the building to be provided with a transfer floor. The
specification of the lift serving each zone can be summarised as follows:

85
Upper Lift Zone (Level 35 - 50)
• 6 x 26 person double deck lifts
• 10 m/s
• Hall allocation system
Lower Lift Zone (Ground – Level 34)
• 8 x 26 person double deck lifts
• 6m/s
• Hall allocation system
Whilst it is noted that the ELVAC requirements significantly exceed the lift performance
values proposed as part of this assessment, this is considered to be reasonable based on
the requirement to reduce occupant waiting times for general circulation to significantly
lower levels than those necessary for evacuation. Therefore, it is proposed to assess the
building based on the lift performance values listed in Chapter 5.
3.4 Summary of Methods of Analysis
Based on the results of the validation assessment for the evacuation calculator created as
part of this thesis, as detailed in Appendix A, and the results of the simulation assessments
contained in Appendices B to F, it is noted that the lift evacuation times calculated using
the Siikonen and modified Siikonen calculation method under predict the lift evacuation
times. Therefore, it is not proposed to use either, the original or modified Siikonen
equation for comparison to the stair evacuation times.
Based on the validation work of independent researchers[45, 46]
and availability of the
calculation process for the ELVAC simulation programme, it is proposed to use this method
for calculating the lift evacuation times for comparison with the stair evacuation times.
This is considered to be reasonable based on the conservative values of the ELVAC lift
evacuation times for both methods of evacuation, using different refuge floor and
evacuation zone sizes and ratio of occupants escaping via the lifts, as shown in Appendix B
to F.

86
It is noted that some of the methods listed above are capable of providing limited
information with regards to the building evacuation. This can be summarised as follows:
Calculation
Method
Calculation of
delays
Assumptions Limitations Validation Application Accuracy
Siikonen Delays in the
round trip
time due to
acceleration
and
deceleration
delays and
occupants
entering and
exiting lift
Occupants
arrive at lift
immediately. No
delays included
for lift returning
to dispatch floor
Calculates the
round trip
time only
May be used
in a spread
sheet to
calculate the
lift evacuation
time for
comparison to
the stair
evacuation
time as this
method does
not include
delays in the
arrival of
occupants
Slight variance
between these
results and
ELVAC values
considered to
be the result of
a standard
acceleration
delay
Sekizawa Delays in the
round trip
time due to
acceleration
and
deceleration
delays and
occupants
entering and
exiting lift
Occupants
arrive at lift
immediately. No
delays included
for lift returning
to dispatch floor
Calculates the
round trip
time only
May be used
in a spread
sheet to
calculate the
lift evacuation
time for
comparison to
the stair
evacuation
time as this
method does
not include
delays in the
arrival of
occupants
Large
difference in
evacuation
times for each
variable.
STEPS Calculates
multiple
delays
including lift
waiting times
Lift operation
assumes that
lifts are
dispatched from
ground floor
level as
occupants enter
the refuge floor,
rather than as a
group as ELVAC
is considered to
do.
Can be used
to calculate
lift travel
times
between two
floors only
without
additional
operating
license.
Kugligowski[45]
Wall &
Waterson[46]
Can be used to
calculate
conditions
within the
stairs and
refuge floors
as a result of
the variation
in refuge floor
separation
and lift
specification
Compared to
code complaint
flow rates and
evacuation
times and other
evacuation
simulations. No
information
available with
regards to the
validation of lift
movement
ELVAC Calculates
delays due to
lift returning
to Ground
floor before
commencing
evacuation
only,
occupants
entering lift
and delays
due to
acceleration
and
deceleration
No assumptions
are considered
to be included
within the
calculation
process. Each
value within the
calculation is
entered by the
user.
Provides
values with
regards to the
round trip
time only.
Difficult to
obtain
different
input data for
a lot of terms
Klote [19]
Can be used to
accurately
calculate the
round trip
time based on
varying each
of the values
listed in
Chapter 5
Table 3.4 – Summary of Calculation Methods

87
4.0 CHAPTER 4 - PREVIOUS SIMULATIONS
Since the 1970’s there has been a large amount of research carried out on the use of lifts
for the evacuation of occupants in tall buildings.
Although a number of simulations have been carried out since those of Bazjanac[18]
and
Pauls[12]
in 1977, namely Klote[19]
, Siikonen[40]
and Wong[50]
, these simulations have a limited
amount of quantitive data available which can be used when designing the lifts to be used
for evacuation. A brief summary of each study is provided below.
4.1 Bazjanac V. (1977)
4.1.1 Summary of Study
In 1977 Bazjanac[18]
attempted to simulate lift evacuation, based on the methodology
described by George Strakosch[51]
for a lift in ‘down peak mode’, to assess its effectiveness
for partial or total evacuation.
Down peak mode describes the operation of a lift which is sent to the highest floor on the
first trip, and in the subsequent trips only responds to calls from the second highest floor
once no more calls are received from the previous highest floor, and so on.
The main focus of this study was on using lifts to evacuate occupants of a three floor fire
zone (i.e. floor of fire origin plus a single floor above and below), known as the evacuation
zone, out of immediate danger, such that those occupants may then use the stairs or
different lifts at the lower floor level to evacuate to Ground floor level. Occupants outside
of the fire zone were not assumed to evacuate.
Multiple simulations were undertaken for a number of three floor zones to determine
which zone took the longest amount of time to evacuate completely. Based on this
strategy, the obvious conclusion was made that the zone that required the longest period
of time to be evacuated was the highest zone. This is considered to be a result of the
greater distance the lift is required to travel for each round trip, compared to the lower
zones, when evacuation is provided via lifts that are not designed for evacuation (i.e. are
not provided with the handling capacity required during simultaneous evacuation).

88
The study also assessed the impacts of the lifts discharging at Ground floor level, rather
than the floor immediately below the evacuation zone to reduce the travel distance, and
found that this had a minimal impact on the overall evacuation time. Bazjanac does not
state the reason for the small reduction in the evacuation time within the paper. However,
this is considered to be the result of a minimum number of round trips required to
evacuate the zone, such that the lift evacuation factor is more dependent on other
variables such as door opening and closing times or rate of acceleration.
The study also reviews the total evacuation of building occupants from their floor of origin
only, but does not assess evacuation from a refuge floor. However, this total building
assessment is of a 22 storey office building, which is quoted as being evacuated in
approximately nine minutes. Based on limited information available with regards to this
assessment, this evacuation time is considered to be of limited use to this study.
The conclusion of the report simply notes that for a building with lift provisions for normal
up and down peak travel, evacuation may be achieved in approximately 30 minutes. It is
noted that this may reduced to 10 minutes if the building is provided with an ‘efficient’ lift
system.
4.1.2 Summary
Very little information regarding the simulation programme or variables used to calculate
the evacuation times are provided within the reference. On this basis, the study by
Bazjanac is considered to provide a minimal amount of useful information to this study. The
findings and recommendations of Bazjanac’s paper can be summarised as follows:
• The study identified the problems caused by using lifts as a method of evacuation,
such as the congestion of the lift system and the difficulty faced by emergency
personnel to reach the floor of danger.
• It also recognised the potential of lifts to get people away from the area most at
risk from a fire, considered as the evacuation zone.

89
• It noted the variance between real life evacuation times and the simulation times
are a result of the difference in the extent of control exercised in the evacuation
procedure. However, based on the research conducted into human behaviour, it is
assumed that minimal control will be required for efficient evacuation to occur.
• The report concluded that it is considered necessary to assess the control of the lift
calls during the evacuation and how these are handled.
• The worst case assumption was noted as being 100% of the buildings occupants
within the affected zone would use the lifts to evacuate as a worst case scenario.
• A building with normal up and down peak lifts may be simultaneously evacuated in
less than 30 minutes.
The main focus of this work is primarily on the evacuation of the three storey ‘evacuation
zone’ of a relatively low density office building. Whilst this is not considered to apply to this
study, it is worth noting the conclusion that the whole building may be simultaneously
evacuated by lifts operating under normal conditions in less than 30 minutes based on
down peak travel, which is also noted by Siikonen et al[40]
.
4.2 Pauls (1977)
This work reviewed three possible methods of evacuation from a high-rise building
including:
• Simultaneous evacuation via stairs (referred to as ‘total evacuation’ in the text)
• Phased evacuation via stairs,
• Lift evacuation.
Pauls proposed the use of refuge floors for the simultaneous evacuation of the whole
building via lifts. However, this required occupants to walk down stairs to the nearest
refuge floor below their floor of origin, which is a contrast to the work of Bazjanac, who
recommended that occupants are evacuated from their floor of origin.
A trace of the occupant’s movements for the simultaneous evacuation of a 15 storey
building using only stairs is shown in Figure 4.2. The gradient of the line indicates speed of

90
movement. On this basis, Pauls demonstrates that the higher an occupant is located in a
building, the greater the time to evacuate. This can be compared to the occupant trace for
a high rise office building provided with lifts, as shown in Figure 4.2.2 below.
Figure 4.2 – Trace of occupant movement for a 15 storey building
4.2.1 Summary of study
Pauls[12]
compares the three evacuation methods and comments on the suitability of each
using a theoretical building of 40 storeys, which is provided with two stairs and a total
building occupancy of 4,500 persons (~113 persons per floor level).
When assessing simultaneous evacuation, Pauls notes that the time for completion of
evacuation via the two stairs requires approximately 40 minutes. Pauls also calculated that
the last occupant to leave the upper floor is required to queue on their floor of origin for
approximately 27 minutes before beginning the descent, as shown by the dashed line in
Figure 4.2.2.
On this basis, Pauls[12]
recommends that the most suitable method of providing lift
evacuation is to have the occupants of a certain number of floors escape to a refuge floor
where they can wait for a lift to take them direct to ground floor.
As a measure of safety, Pauls[12]
recommends that for a period of up to approximately 15
minutes after the alarm has been raised and evacuation has commenced, the lifts would be
returned to the ground floor and ‘checked’ by the Fire Service before being used for

91
evacuation. This is considered to significantly increase the total lift evacuation time, such
that the majority of occupants are likely to seek to escape via the stairs. However, based on
the requirement for lifts to return to ground floor level in the event of a fire, this time may
be reduced by having an automated message play inside the lift car, in addition to the
sounding of the alarm, to ensure that occupants leave the lift. On this basis, the most
effective lift start up time may be considered to be approximately equal to that assumed in
the ELVAC programme[19]
, which is based on the time for lifts to go to the discharge floor
from the most onerous floor level plus the time for any passengers within the lift to exit.
4.2.2 Results of Simulation
An approximate calculation of the time taken to evacuate a building using lifts is presented
by Pauls[12]
for the exemplary 40 storey building, discussed above, using the calculation
procedures given by Strakosch[51]
for down peak mode, which is also used by Bazjanac. It is
claimed that the four lifts in the group serving the highest refuge floor (32nd
floor) would be
required to make 14 trips, which would require 20 minutes to evacuate 1000 persons, as
shown in Figure 4.2.2 below.
Figure 4.2.2 – Occupant trace for lift evacuation of 40 storey office building
The lift evacuation time shown within the figure includes a 15 minute period for checking
of the lifts. On this basis lift evacuation from the top zone is approximately 7% to 8% faster
than stair evacuation zone. However, when excluding the time to check the lifts, this
92
increases to approximately 47%. This is a significant reduction in the building evacuation
time.
In this paper Pauls[12]
also makes note of the possibility of reducing the evacuation time
from 20 minutes to 14 minutes by having approximately one third of the occupants of the
refuge floor evacuate via stairs. The reduction in evacuation time is commensurate with the
evacuation times shown in Appendix B and Appendix C, when approximately 25% of the
building occupants evacuate via stairs. This corresponds to an approximate reduction of the
stair only evacuation time of approximately 63%. On this basis, it has been demonstrated
that lifts designed specifically for evacuation may provide an efficient means of escape
from the upper floor levels of high buildings, particularly when supplemented with stair
evacuation.
Based on the above, it is noted that the total evacuation time of the building is less than 30
minutes, when excluding the time period occupants are required to wait while the lifts are
‘checked’ by the Fire Service. This provides a significant reduction in the evacuation time
compared to the use of stairs only.
4.2.3 Summary
The lift evacuation times stated by Pauls as part of the theoretical evacuation from the
building are also based on the lift performance data published by Strakosch[51]
. Therefore, it
is considered reasonable to compare the relative lift evacuation times of Pauls with other
lift evacuation studies which assume the lifts operate in down peak mode.
The studies were conducted on a theoretical 40 storey building served by four groups of
four lifts with a variety of speeds from 4m/s to 6.1m/s. The building occupancy is equal to
4500 persons (113 persons per floor level). This is less than the 150 person per floor level
occupancy of the theoretical building occupancy used in this study (~25%).
On this basis, the times quoted by Pauls are expected to be less than those calculated for
the default values used in this study. However, this information is considered useful to
highlight the impact of a reduced occupancy on the building evacuation times.
93
The evacuation times quoted by Pauls from the individual refuge floors, is considered to be
the result of using lifts which are designed for general circulation (i.e. evacuation time is
not assessed as a result of the handling capacity of the lift). On this basis, the evacuation
times are considered to be shorter from the lower refuge floor levels than those from the
upper refuge floor. This assumption is commensurate with the results of this study based
on lift specifications which are independent of the general circulation requirements, as
discussed in section 3.3.6.
4.3 Siikonen (2003)
Two papers were published by Marja-Liisa Siikonen et al in 2003[33, 40]
, which studied lift
evacuation.
The first paper by Siikonen, Barlund and Kontturi[40]
, titled Transportation Design for
Building Evacuation, attempts to derive a simple formula for calculating the round trip time
for a single lift, as detailed below, which gives an approximate value for the evacuation
time for a lift operating in the more efficient down peak mode of travel used in the
previous simulations by Bazjanac and Pauls.
The second paper by Siikonen and Hakonen[33]
, titled ‘Efficient evacuation methods in tall
buildings’, provides a brief summary of the findings of the first paper as well as reviewing
the impact of the number of occupants per floor and the total number of floors served by
the lift, when operating in down peak mode, as utilised for the evacuation simulations used
in this thesis.
4.3.1 Summary of Comparative Assessment
A brief comparative assessment of evacuation from an 88 storey building, with a total
population of 10,700 persons is contained in Transportation Design for Building
Evacuation[40]
. A summary of each assessment is provided below:
4.3.1.1 Simulation 1
It is stated by Siikonen et al that in the first simulation of the building “people use only lifts
when going down”. However, this does not clearly state that the lifts are used to serve a
94
full lift zone or a refuge floor. However, as the second simulation is clearly indicated as
having occupants depart from refuge floors it is assumed that this simulation is of
evacuation from an evacuation zone.
4.3.1.2 Simulation 2
The second simulation assumes that occupants travel to a refuge floor where they are
taken to ground floor level by express lifts. This method is stated by Siikonen et al to take
approximately 1.5 – 2 times longer than the first evacuation simulation. However, this
conclusion is not in accordance with the findings of this study in which evacuation from
refuge floors provides lower evacuation times than those from an evacuation zone.
However, further work carried out by Siikonen and Hakonen in Efficient evacuation
methods in tall buildings[33]
on a simulated 20 storey building, with 60 persons per floor,
showed very little difference in the time taken to evacuate the building using methods very
similar to those discussed in Simulation 1 and 2 above as well as an additional method
where occupants were required to evacuate the building from every third floor within the
building. On this basis, Siikonen et al[33]
note that “in office buildings the egress time by the
stairs is shorter for a building with 50 floors or less, and fewer than 50 persons per floor.
For 100 persons per floor, the evacuation time by lifts is faster for 25 floors or more”. This
conclusion is considered to be consummate with the findings of this study.
4.3.1.3 Simulation 3
The third evacuation simulation of the building was carried out to assess the time taken for
the occupants to escape using only the stairs. It is stated by Siikonen et al that ‘people have
to wait at upper floors for a long time before they can enter the shaft’, which is
consummate with the conclusion by Pauls[12]
.
In accordance with Approved Document B[1]
of the Building Regulations 2000, the
occupants of the upper floors should have escaped from their floor of origin within the two
and a half minute notional evacuation time. This queuing on the upper floor levels is
considered to be the result of insufficient escape capacity within the stair for simultaneous
evacuation.

95
Nevertheless, it is quoted that this method of evacuation takes approximately five times
more than that of the two previous methods. The theoretical time taken for the evacuation
of the mega-high rise building using the three methods discussed above is shown in Figure
4.3.1.3, which is taken from the work of Siikonen et al[40]
.
Figure 4.3.1.3 – Evacuation time for scenarios 1, 2 and 3
4.3.2 Summary of Studies
It is claimed by Siikonen et al[40]
that the fastest way to evacuate a building if the population
is below 2500 – 3000 persons is by using at least two stairs. However, it is claimed that if
the building contains a population of more than 3500 – 4000 people two staircases do not
fulfil the requirements. This is considered to be the result of the occupancy exceeding the
stacking capacity available in the available stairs and is therefore also highly dependent on
the number of storeys in the building.
It is claimed that in these situations, in high-rise office buildings with well planned lifts, that
the entire population may be evacuated in 20-30 minutes. This is commensurate with the
conclusion of Bazjanac, based on the provision of lifts operating throughout the whole
building in down peak mode. However, Bukowski[39]
states that this will require 60 minutes
or less based on a 5 minutes handling capacity of 10% of the building population. While this
value is lower than the design standard used in the U.K, this validates the conclusions of
Bazjanac, Pauls and Siikonen.

96
Both papers[33, 40]
state that the evacuation time of a building may be reduced by
approximately half if the occupants escape using both stairs and lifts, which is
commensurate with the findings of this assessment and those by Pauls.
In the simulations carried out using a 30 storey building with 100 persons per floor[33]
the
evacuation time is 22 minutes using just lifts, 26 minute using only stairs and approximately
13 minutes using a combination of stairs and lifts for evacuation, where approximately 50%
of the building occupants escape via the stairs and the remaining 50% escape via the lifts.
The evacuation using a combination of stairs and lifts is approximately 50% less than the
evacuation time using stairs only, when the occupancy is reduced by the same percentage,
and approximately 40% less than the evacuation time using lifts only.
Figure 4.3.2 is taken from the work by Siikonen et al[40]
and shows the time taken to
evacuate a given population using a number of methods. The varying values of the handling
capacity in five minutes (5HC) are dependent on the use of the building, with the different
values shown on the graph. However, this graph does not take into account the time taken
for occupants to arrive at the lifts and is therefore considered applicable to evacuation
from a dedicated evacuation zone only. Nevertheless, this may be adjusted based on a
calculation of the time taken for the first occupants to arrive at the lift.
Figure 4.3.2 – Egress times with stairs and lifts
The egress times for the lifts in this graph are constant as these are assumed to be
designed to ensure that the required handling capacity is provided for a certain percentage
of the population. Therefore, as the population increases so will the handling capacity of

97
the lifts, allowing the same percentage of the buildings occupants to be evacuated in the
same time.
The evacuation time by stairs increases linearly with the occupancy as the stair is based on
a set flow rate, which does not increase with the building occupancy compared to the lift
performance values, which increase with the building population, such that the handling
capacity requirement is achieved and the evacuation time remains constant.
Siikonen et al[33]
conclude that ‘lifts can transport about 1.5 times more passengers in
down-peak than in up peak. Therefore, as an example, if a group of lifts is designed to
transport 15% of the population in up peak, the same lifts can transport 22.5% of the
population is five minutes in down peak on the basis that the lifts will have fewer calls in
down peak.’
4.3.3 Summary
The results for lift evacuation times[33, 40]
stated in the work by Siikonen are produced using
the computer simulation programme Building Traffic Simulator (BTS), which is produced by
Kone lift designers and manufacturers. On this basis, the results shown in the papers can
not be directly compared with those results by Bazjanac, Pauls, Wong or those contained
within the appendices, on the basis that the calculation method is unknown.
Brief comparative assessments between evacuation from a refuge floor and from an
evacuation zone were conducted in both papers. The conclusion of the paper assessing the
taller 88 storey building[40]
stated that evacuation from a refuge floor is between 1.5 – 2
times longer than from an evacuation zone. This could be the result of a number of factors
including the occupancy per floor level, lift capacity and refuge floor locations. However,
the conclusion of the assessment of the smaller building[33]
states that the egress times of
the three different scenarios are very similar. Therefore, it is proposed to determine the
difference between both evacuation methods as part of this study, based on the whole
building evacuation time.

98
4.4 Wong et al (2005)
The evacuation of a theoretical high-rise office building from dedicated refuge floors using
shuttle lifts has also been studied by Kelvin Wong et al[50]
.
The assessment was conducted using the STEPS simulation programme for evacuation from
refuge floors only. Whilst it is not stated within the STEPS supporting documentation, it is
not believed that the lift movement within the programme is in accordance with the
calculation procedure of Strakosch. On this basis, it is not considered possible to directly
compare the results from the assessment by Wong et al with those by Pauls and Bazjanac.
4.4.1 Summary of Study
The assessment carried out by Wong et al[50]
is of a 100 storey building with a top finished
floor level of 500m. This is 2.5 times the height of the theoretical building used as part of
this study. The total occupancy of the building was 21,000 people, which is equal to 210
persons per floor level when assuming that the occupants are evenly distributed on each
floor level, which is very similar to the occupancy of the World Trade Centre at full capacity.
This exceeds the 150 person occupancy assumed for each floor level of the theoretical
building used as part of this study.
The maximum separation distance between refuge floor levels is equal to 24 storeys (i.e. 25
storeys including the refuge floor), which is equal to the maximum separation distance
used in this study between refuge floor levels, based on the guidance used in Hong Kong[6]
.
Whilst the lift evacuation times quoted by Wong et al are generally assumed to be higher
than those from the theoretical building described in Section 1.4, this information is
considered to be useful with regards to the validation of the refuge floor separation
distances.
4.4.2 Results of Simulations
Wong notes that “the main advantage of using shuttle lifts (compared to evacuation from
the floor of origin in an evacuation zone) is that they can eliminate the requirement for
complicated control and management required to pick up occupants on different levels“.

99
Wong et al also recommends that a combination of lifts and stairs are used as part of the
overall evacuation strategy, rather than using only lifts for evacuation.
Figure 4.4.2 below shows the cumulative percentage of occupants evacuated against time,
for a mixture of stair and lifts as well as stairs only. It is noted from the graph that a
combination of lifts and stairs provides a significantly greater rate of evacuation.
Figure 4.4.2 – Cumulative percentage of occupants evacuated
The time to complete the evacuation took 70 minutes using a mixture of lifts and stairs,
while the evacuation took approximately 110 minutes using just stairs. This is an increase of
approximately 36% compared to the time when using a mixture of stairs and lifts for
evacuation. The difference between methods is approximately equal to that noted by
Siikonen et al[33]
and Pauls[12]
for a combination of stairs and lifts. The difference between
references is considered to be the difference in the percentage of occupants assumed to
escape via the stairs.
Figure 4.4.2 (a), also taken from work by Wong et al[50]
, shows the number of occupants
evacuated at each minute of the building evacuation.

100
Figure 4.4.2 (a) – Number of occupants evacuated
The observed change of gradient at around 50 minutes for the lift and stair evacuation
indicates that not all evacuation lifts are fully utilised at that time. This is considered to be a
result of lower refuge floors being completely evacuated, therefore, decreasing the
occupant flow rate from the building. On this basis, it is assumed that the simulations by
Wong et al were not specifically designed to simultaneously evacuate the building in
accordance with general design guidance.
Wong et al[50]
also studied the percentage of occupants on the refuge floor at any instant,
compared to the total number of occupants that are required to evacuate via the specific
refuge floor. The results of which can be seen in Figure 4.4.2 (b) for the high level refuge
floor and Figure 4.4.2 (c) for the mid level refuge floor.
Figure 4.4.2 (b) – Percentage of occupants contained on refuge floor at high level

101
Figure 4.4.2 (c) – Percentage of occupants contained on refuge floor at mid level
As noted by Wong et al[50]
the plateau of the curves which represent scenario a) on both
graphs indicate that the staircases below the refuge floors are fully occupied, occupants on
the refuge floors need to wait until occupants on the lower floors are discharged and the
space inside the staircases is freed up. This observation is commensurate with those in the
theoretical building used as part of this study.
4.4.3 Summary
The results of this assessment demonstrate that most of the occupants are required to wait
for a section of the evacuation phase on the refuge floors, irrespective of their method of
evacuation. However, it is noted that there are more occupants required to wait on the
refuge floors when evacuation is provided by a mixture of lifts and stairs (maximum 65% of
occupants).
This is considered to be a result of the number of occupants waiting for the lift to evacuate,
rather than pausing to rest during descent. This is not considered to be the result of an
ineffective evacuation system, which is supported by the time for the lift and stair
evacuation to be completed compared to the stair only evacuation.
The results of the simulations have shown that the total evacuation time of a building,
twice the height of the theoretical building used as part of this study, with an increased
occupancy of 28.5% may be achieved in 110 minutes when using only the stairs. However,
the total evacuation time may be reduced by approximately 36% when occupants also use
the lifts to evacuate. Whilst the percentage of occupants assumed to escape via the stairs is

102
noted stated within the paper[50]
for the combined evacuation, it is assumed from the
results of the simulations conducted as part of this thesis, and previous studies, that the
reduction in occupancy is approximately equal to the reduction in the evacuation time.
The results of the stair evacuation times quoted by Wong et al, for a building twice the
height of that used as part of this study, are not double that calculated for the theoretical
building. This is a result of the assessment by Wong et al being conducted based on the
provision of three 1200mm wide stairs (total stair flow rate of 4.788 p/s), compared to the
single 1400mm wide stair assumed to be available as part of this study (total stair flow rate
of 1.862 p/s). On this basis, it is not considered possible to directly compare studies.
4.5 BRE Research
4.5.1 Introduction
In October 2007, the BRE held a conference titled ‘Use of lifts and escalators for evacuation
from buildings’. This included a number of presentations by members of the BRE and guest
speakers on the issue of lift and escalator evacuation, and provided the background
information to BD 2466 ‘Guidance on the use of lifts or escalators for evacuation and fire
and rescue service operations.’[9]
The most relevant of the presentation to this study was that given by Fraser-Mitchell[52]
,
based on the studies carried out by the BRE on the use of lifts for evacuation, using the
CRISP simulation software, which studied the evacuation of a number of different building
types including:
• High rise office (16 storeys in height)
• Medium rise office (8 storeys in height)
• Hotel (16 storeys in height)
• Shopping Centre
• Underground station
The evacuation of the office building was studied using the following scenarios:
• Baseline – phased evacuation using stairs and lifts (base)

103
• Baseline without lifts available (variation 3)
• Baseline but lift does not call at fire floor (variation 4)
• Baseline but only disabled people may use lift (variation 5)
• Baseline but lift does not go to fire floor or above (variation 6)
• Baseline but lift may stop on other floors until full (variation 7)
• 50% of lifts available (variation 8)
• 8 floors, fire on floor 4 (variation 9)
• 50% population (variation 10)
Based on the results of the simulations within the presentation, it is considered reasonable
to assume that the BRE research assessed the lift evacuation times using only the
evacuation zone method.
4.5.2 Summary of Study
The majority of the assessments for the high-rise office building assumed a fire on the 8th
floor of the building (i.e. half way up the building). The base case, which the results are
assessed against, is based on 3007 occupants evacuating via the six lifts and two stairs in
the central core. As a sensitivity study, the building was reduced to 8 storeys in height and
was assumed to have a fire on the 4th
floor.
The results from the study were presented in graphical form. Figure 4.5.2 shows the
number of people inside the building against time.
Figure 4.5.2 – People inside building at set time

104
The most notable feature of this graph is the lack of plateaus in the occupant traces. It is
assumed that this is a result of occupants being able to use the stairs and therefore a
relatively constant discharge rate is achieved. This idea is supported by small increases in
the discharge rate when a lift discharges occupants in addition to the stairs.
Whilst this is considered to show good conditions during evacuation, this graph does not
show the flow rate in the upper levels of the stair where occupants are considered likely to
be queuing. However, the exact time of each floor to evacuate is shown in Table 4.5.2. This
highlights the impractical nature of the assessment as occupants of Level 1 are assumed to
be waiting for 31.1 minutes for a lift to arrive even though they are 4m above discharge
level, which is significantly greater than the time required using stairs.
Table 4.5.2 – Clearance time for each storey
Whilst it is noted that a number of alterative variations were studied, the simulations
included within this study are considered to only calculate the evacuation times using the
evacuation zone method (i.e. occupants are evacuated from their floor of origin).
Therefore, it is not considered possible to compare the evacuation times from the building
using both methods of evacuation. This is considered to be the result of the relatively low
height of the building used in the study, which contains 16 storeys and is therefore, not
suitable for evacuation from a refuge floor, due to the relatively small number of floors
served by a refuge floor.
However, it is considered worth noting the difference in evacuation times of the studies
conducted using the evacuation zone method, which are compared against the baseline
study of phased evacuation using stairs and lifts. Whilst it is unclear which line represents
the scenarios listed above, it is noted that there is minimal different between evacuation

105
times, with the exception of two case’s which have a lower time and are believed to be
those with 50% of the base case population, and that with eight storeys, and one which
significantly exceeds the base case evacuation time, which is assumed to be the simulation
in which half of the lifts are available compared to the base case scenario.
4.6 Summary
The work of Bazjanac on lift evacuation is considered to be of limited use to this thesis on
the basis that the main lift evacuation strategy studied is based on the fire affected floor
floor, plus one floor above and below this floor, evacuating via the lifts. Therefore, this
study provides a minimal amount of useful information with regards to lift evacuation.
However, based on Bazjanac’s summary of the time difference between a discharge floor
immediately below the fire affected zone and at Ground floor level, it is proposed that the
evacuation simulations used in this thesis will be based on all evacuation lifts discharging at
ground floor level.
The above papers generally only consider one method of lift evacuation (i.e. refuge floors
or evacuation zone). Therefore, whilst it is noted that the evacuation of a building is
generally considered to be faster from a refuge floor, the difference in total evacuation
times between these methods is currently unknown.
Whilst the recommendations of the above papers vary on recommended lift evacuation
strategies, a number of papers recognise the benefit of supplementing lift evacuation with
stair evacuation. Therefore, it is also proposed to assess the impact on the lift evacuation
times when a certain percentage of the buildings occupants escape via stairs.
There is limited information available in the papers discussed above with regards to the lift
evacuation times when compared to the evacuation times via a code compliant protected
escape stair. On this basis, this research will focus on the comparison of overall evacuation
times from a theoretical building using the two different lift evacuation strategies discussed
in Section 1.2 and compare these to the evacuation times using stairs.

106
5.0 CHAPTER 5 - CALCULATION VARIABLES
5.1 Introduction
It is proposed to use the ELVAC simulation programme to generate lift evacuation times for
each of the lift evacuation methods discussed in Section 1.2 for different refuge floor and
evacuation zone separation distances as well as different ratios of occupants escaping via
the lifts.
It is also proposed to use the STEPS simulation programme to assess the conditions within
the building during a code compliant evacuation and for a number of different lift
evacuation scenarios. To ensure that the outputs of these simulation programmes are
accurate, it is necessary to consider the value of the inputs used in each of these
programmes and the impact this might have on the final value.
5.2 Lift Specification
The purpose of this study is to compare the lift evacuation times of a theoretical 50 storey
office building using two different lift evacuation strategies, and lift performance values.
The values used in the assessment are discussed below.
5.2.1 Lift Speed
Based on the recommended maximum lift speed for lifts serving floors more than 120m[27]
the default lift speed is 6 m/s. However, sensitivity studies have been carried out using
rated speeds of 5m/s and 7m/s, based on Fortune’s[31]
recommendation for the maximum
speed on a non-pressurised lift, as well as 16m/s based on the approximate lift speed used
in Taipai 101.
Whilst it is noted that a number of floors in the study will be less than 120m in height, the
use of this value is considered to be reasonable on the basis that the lift will be
continuously accelerating until it reaches its target floor, therefore ensuring that the
evacuation time from the lower floor levels is as low as possible.

107
5.2.2 Lift Acceleration
Based on the recommendations of CIBSE Guide D[27]
for a lift serving a floor level more than
120m in height, a default acceleration, and therefore deceleration, value of 1.2m/s2 has
been used. However, an additional sensitivity study has been carried out based on the work
of Fortune[31]
using a lift acceleration value of 1.5m/s2.
5.2.3 Door Opening and Closing Time
The lift doors have been assumed as 1200mm wide centre opening doors. Based on the
default value in the ELVAC programme, the time to opening is considered to be 5.3
seconds. This provides a conservative evacuation time as CIBSE Guide D[27]
requires a
combined opening and closing time of 4.5 seconds for an 1100mm wide centre opening
door.
Based on the use of this conservative value in each calculation, no additional validity
assessments have been carried out on the impact of different door opening and closing
times.
5.2.4 Lift Car Capacity
A lift car capacity of 10, 12 and 16 persons has been used based on the values taken from
Strakosch’s work[51]
. Based on these values, an additional validity study have been carried
out using a lift capacities of 21 persons (similar to the capacity of the lifts used in Taipai
101)[30]
. This value is also provided to allow a comparison with an increased number of lift
shafts.
5.3 ELVAC Inefficiencies
The ELVAC programme includes for a number of inefficiencies which are not directly
included within the values listed in Chapter 5. The values used in the ELVAC simulations,
and the source of these values is discussed below.

108
The ELAVC programme assumes a dwell time of 4 seconds. The basis for the use of this
figure is unknown, based on the associated literature provided with the programme[19]
. It is
not possible to amend this value in the programme.
The Standing Time and Start Up Time include a value for transfer inefficiencies (μ), which
consists of three variables, as follows:
Basic transfer inefficiency (α)- allows for rounding off of probable stops, door operating
time, door starting and stopping time, and the unpredictability of people. Typically a value
of 0.10 is used for the basic transfer inefficiency for commonly accepted arrangements of
elevator groups. This value can be manually entered within ELVAC programme, however,
the reference does not include recommendations for the basis of this value and how to
calculate alternative values.
Door inefficiency (ε) - is used to adjust for any increase in transfer time over that of a 1200
mm wide centre opening door. Values are provided within a table in the reference
document[19]
, as reproduced in Table 3.3.5.3. However, it is not possible to calculate this
value for lift door arrangements that are not included in this table.
Inefficiency (γ) - is used to account for any other inefficiencies in people transfer into or out
of the lift, such as increased movement times within a lift due to an unusual elevator car
shape or limited physical capability of passengers. This value is often chosen to be 0.05 for
hospital elevators and 0 for office buildings. The ELVAC assessment is based on a value of 0
and includes for able bodied and non-able bodied occupants. The use of the 0.05 value is
considered to represent significant ineffiencies such as occupants in beds etc, therefore, it
is not proposed to apply this value to include for any disabled occupants in an office
building, based on the speed at which these may enter the a lift when supervised during an
evacuation.
5.4 STEPS Variables
The STEPS programmes requires additional input variables to be provided to those listed in
Section 5.2 and Section 5.3.

109
5.4.1 Dwell Time
As discussed above, the dwell time is provided as a fixed value of 4 seconds in the ELVAC
programme. However, it is considered necessary to input this value in the STEPS
programme.
The model used to compare the evacuation times of the theoretical building described by
Klote[19]
, as discussed in Section 3.3.5.4, also uses a value of 4 seconds for this factor, so
that a direct comparison can be made between the two methods.
All other STEPS models use a value of 2 seconds for the lift dwell time. This is considered to
be reasonable when including the motor delay time, which is also not included in the
ELVAC assessment, such that a notional delay is provided between the methods. This is
considered to provide a minimal variance between the evacuation times.
5.4.2 Motor Delay
The Motor Delay value is required in the STEPS simulations to include for how long it takes
for the lift motor to start. This delay is not included in the ELVAC assessment, therefore,
this value has not been included in the STEP programme used to compare the values of the
notional building discussed by Klote[19]
, as discussed in Section 3.3.5.4.
However, a notional value of 1 second has been used for all other STEPS assessments, such
that the total delay for lift motion to commence is equal to 3 seconds, compared to 4
seconds in the ELVAC simulations. This is considered to provide a minimal variance
between the evacuation times.
5.4.3 Summary
Whilst it is considered that these delays will have minimal impact of the values of the STEPS
output used in the study of this assessment, it is noted that these delays will increase the
total evacuation time for the evacuation zones, particularly with the larger evacuation
zones. However, this is assumed to be reasonable on the basis that this will increase the lift
evacuation time, creating a more conservative evacuation result for comparison to the stair
evacuation times.

110
5.5 Refuge Floor Location
There is little guidance available with regards to the maximum separation distance
between refuge floors. The evacuation of the Petronas Twin Towers requires the occupants
of the highest floor to travel 44 storeys by stairs before reaching express lifts to discharge
level[16]
. However, this is considered to be an excessive travel distance that will require a
prolonged period of time for occupants to reach the refuge floor.
Work by Lay[26]
recommends a refuge floor interval of approximately 35 storeys to be
reasonable. However, the Hong Kong Building Code[6]
recommends that any non-industrial
building, exceeding 25 storeys in height should be provided with protected lobbies at a
maximum spacing of 25 storeys between refuge floors or the ground floor to allow a space
for escape occupants to rest if required to do so.
So et al [53]
suggest a more conservative figure of providing refuge floors every fifteen to
twenty floors in modern high rise buildings.
Nevertheless, whilst it is appreciated that lifts may be able to evacuate the occupants of a
zone, which contains more than 25 storeys, the limiting factor in the location of the refuge
floors in the simulation will be the time taken for the occupants to reach the refuge floor
and the associated effort.
Therefore, the results of this assessment will be conducted for a maximum spacing
between refuge floors of no more than 25 storeys, while the minimum spacing will be 10
storeys, which is based on the findings of previous simulations where 100% of the building
occupants use the lifts to evacuate.
5.6 Stair/Lift Evacuation Ratio
To reduce the lift evacuation time it is proposed to simulate evacuation via stairs and lifts.
Therefore, each simulation will assume a certain percentage of occupants will escape via
the stairs from each zone.
Charters and Fraser-Mitchell[9]
note that a limited number of evacuation drills and
experiments indicate that in tall office buildings approximately 50% (+/- 10%) of building

111
occupants choose to use the lifts for vertical evacuation. This is supported by Siikonen and
Hakonen[33]
who found that the evacuation time of a building when using lifts and stairs is
approximately 40% that using lifts only when half of the building population escape using
the lifts.
Previous work carried out by Klote et al[19]
suggests that, for buildings of a larger height, the
optimum percentage of occupants evacuating by lifts is approximately 65%.
Due to the lack of guidance on lift evacuation it is not known what percentage of occupants
will evacuate via lifts or stairs. On this basis, it is proposed to assess the evacuation times
for the building based on a more onerous lift occupancy of 75% of the building occupancy,
as well as the least onerous value of 50% of the building occupancy.
5.7 Occupancies
The occupancy of each floor level is equal to 150 persons. Whilst it is noted that this
creates a total building occupancy of 7500 persons, when including fire sterile refuge floors,
this is considered to provide a comparable value for comparison against other lift
evacuation studies and stair evacuation times, which can be summarised for comparison as
follows:.
• Wong – 21,000 persons over 100 storeys. Approximately equal to 210 persons per
floor level when not discounting any floors reserved as refuge floors.
• Siikonen et al[33]
– Assess the impact of varying the occupancy between 50 persons
to 200 persons per floor level.
• Klote – 90 persons per floor level.
• Pauls – Between 70 and 120 persons per floor level.
Galea et al[54]
reviewed the occupancy of the World Trade Centre Tower 1 at the time of
impact during the 2001 terrorist attacks and note that the occupancy level per floor was
approximately 127 persons. Based on an occupancy similar to the theoretical building used

112
as part of this study, it is assumed that conditions within the limited area of the escape
stairs will be similar to those within the World Trade Centre during an evacuation.
Nevertheless, Galea et al[54]
also noted that the building was not occupied to full capacity
(25,500 persons), which would produce an occupancy of approximately 274 persons per
occupied floor level. This significantly exceeds the number of occupants provided within
the simulations used as part of this study and would significantly increase the evacuation
time.
5.8 Summary
Each of the calculation methods discussed in Chapter 3 are based on the input values listed
in Table 5.8 below. Whilst it is noted that the majority of the inputs are the same for each
method, the STEPS programme requires additional inputs to be provided for the dwell time
and the motor delay time.
Variable Values used Reference
Refuge floor separation 10, 15, 20, 25 storeys [6], [23]
Floor to floor height 4m -
Lift speeds 5, 6, 7, 16 m/s [27], [31]
Lift acceleration 1.2, 1.5 m/s2 [27], [31]
Door opening and closing times 5.3 seconds [19]
Lift capacity 10, 12, 16, 21 persons [30], [51]
Time to exit the building 10 sec (ELVAC) -
Trip inefficiency 0.1 (ELVAC) [19]
Dwell time 4 seconds [19]
Motor delay 1 second (STEPS) -
Delay due to
acceleration/deceleration
10 seconds (Siikonen) -
People transfer time 0.6 sec(ELVAC), 0.3 sec
(STEPS), 1 sec (Siikonen)
[19]
Table 5.8 – List of input values
The Siikonen calculation method uses a default value of 10 seconds for the delay associated
with acceleration and deceleration, however, the impact of this is discussed in Section
3.3.2.
The default values used in ELVAC, as discussed previously are not listed below, unless these
are variable when inputting the values in the calculation.

113
The use of a 10 second delay for occupants to exit the building in the ELVAC programme is
considered to have a negligible impact on the total evacuation time. Whilst it is noted that
the analytical methods do not include this delay, the additional time is only considered to
have an impact on the final round trip of the lift, therefore, based on the total building
evacuation time at the time of the last round trip, the provision of an additional 10 seconds
(0.16 minute) to the total evacuation time is considered to have a negligible impact on the
overall value of the building evacuation time.
It is not possible to specify a value for the time for occupants to leave the building in the
STEPS model. This is a result of the distance to the nearest exit and the walking speed.
However, the use of a 10 second delay in the ELVAC model is considered to provide a
reasonable approximation with the STEPS model.

114
6.0 CHAPTER 6 - STEPS MODELLING
6.1 Introduction
Before presenting the STEPS simulation results to identify the optimum method of
evacuation using lifts, this chapter will present the results of a preliminary study to further
elaborate on the input parametres used in STEPS simulations and also to examine some of
the detailed output results from STEPS to further assess the correctness of this simulation
package.
6.2 Sensitivity Study
The STEPS programme may be used to calculate the lift and stair evacuation times as well
as conditions within the escape routes during the evacuation. Whilst the results of the
STEPS assessment have been verified against those produced from the ELVAC programme,
it is also considered necessary to conduct a sensitivity study to assess the impact of the
variables on the outcome of the simulations.
Lord et al[47]
states:
“A sensitivity analysis of a model is a study of how changes in model parametres affect the
results generated by the model. Model predictions may be sensitive to uncertainties in input
data, to the level of rigor employed in the modelling of occupant movement, and to the
accuracy of numerical treatments. The purpose of conducting a sensitivity analysis is to
assess the extent to which uncertainty in model inputs is manifested to become uncertainty
in the results of interest from the model. This information can be used to:
• Determine the dominant variables in the models,
• Quantify the sensitivity of output variables to variations in input data, and
• Inform and caution any potential users about the degree and level of care to be
taken in selecting input and running the model.”
Even deterministic models rely on inputs often based on experimental measurements,
empirical correlations, or estimates made by engineering judgment. Uncertainties in the
model inputs can lead to corresponding uncertainties in the model outputs. Sensitivity

115
analysis is used to quantify these uncertainties in the model outputs based upon known or
estimated uncertainties in model inputs. Sensitivity studies can be grouped into three
categories:
• Scenario Specific Data – Such as the geometry of the building or space, occupant
flow rate through exits or other building components, and if the model is grid-
based, the grid size chosen to model the scenario.
• Occupancy Specific Data – Such as the total number of occupants, the
demographics of the population, size of occupants, walking speeds (stair walking
speed), pre-movement times, occupant patience factors, and other similar
variables.
• Model Specific Data – Which can include various coefficients and other factors
specific to the model being studied, such as the patience factor.
On this basis, a sensitivity study will be undertaken to assess the impact of the grid size,
occupant walking speed and occupant patience factor on the results of the STEPS
assessment, as discussed below.
6.2.1 Cell Grid Size
Lord et al notes that: “STEPS is generally sensitive to grid-size. Changing the grid from 0.3
metres to 0.6 metres can have a significant impact on the results of the model. Efforts
should be taken when using STEPS to use an appropriate grid size and to perform some
sensitivity analysis.”
Therefore, a sensitivity analysis has been undertaken to determine the impact of the grid
size on the results of a simulation. The grid sizes used in the sensitivity study were as
follows:
• 0.3m2
• 0.5m2
• 0.6m2

116
Figure 6.2.1 shows the average stair flow rates in the stair on the 20th floor of the
theoretical building during the simultaneous evacuation of the building by stairs only. As
can be seen from the chart, the grid size used has a large impact on the output provided by
the model.
There is a quantative difference between using the 0.3m2 grid size and the 0.5m
2 and 0.6m
2
grid sizes. For the 0.3m2 grid size, the flow rate initially increases slightly and the high flow
rate is maintained. But for the 0.5m2 and 0.6m
2 grid sizes, the flow rate drops drastically
after a short period of time.
After consultation with the creators of the STEPS programme[55]
it was confirmed that a
grid size of the 0.3m2 is not a very realistic grid cell size to use, on the basis that there are
more cells available in the staircase, which means that you can fit more people in the
staircase than with a wider grid. On this basis, the upper floors can be evacuated in a lower
time than with the larger grid cell size.
The reason the flow rate decreases with a wider grid size is because people entering the
stairs in the floors below the 20th floor (level flow rate is measured at) reduce the walking
speed of the people in the stairs on the floors above, which causes the stair flow rate to
decrease on those upper floors. The reason that the flow rate initially increases is due to
the fact that, at the start of the simulation, the stairs are empty, and therefore, people are
free to walk at their maximum speed, before it is reduced when merging with occupants on
the lower floor level.
Once the occupants of the upper floors have entered the stair, the exit flow rate (i.e. 1.33
p/s/m multiplied by a stair width of 1.4m equals 1.8p/s) controls the flow rate of the
staircase, rather than the rate at which people enter the stair. In the case of a larger grid
size, there are fewer cells available, therefore the staircase capacity is lower and as a result
it takes longer to evacuate the floors.
The difference between the flow rate in the 0.5m2 grid cell model and the 0.6m
2 grid size
model is a result of the number of occupants able to queue at the exit, such that the flow
rate of the exit exceeds the number of occupants able to move towards the exit.

117
Despite the different grid sizes, the initial peak flow rate ties well with the value of 1.33
person/second/metre which is the flow rate currently used in Approved Document B.
STEPS assumes that all people are the same size as the grid cell that they occupy. The STEPS
model uses a default grid size of 0.5m2, which is approximately consummate with the unit
exit width principle detailed within the Post War Building Studies[37]
. Based on the results of
the sensitivity study, each STEPS simulation programme has been conducted using the
default grid cell size of 0.5m2.
0
0.2
0.4
0.6
0.8
1
1.2
1.4
1.6
1.8
2
00
:00
:00
00
:03
:40
00
:07
:20
00
:11
:00
00
:14
:40
00
:18
:20
00
:22
:00
00
:25
:40
00
:29
:20
00
:33
:00
00
:36
:40
00
:40
:20
00
:44
:00
00
:47
:40
00
:51
:20
00
:55
:00
00
:58
:40
01
:02
:20
01
:06
:00
Flo
w R
ate
(p
/s)
Time (hr:min:sec)
0.3m2
0.5m2
0.6m2
Figure 6.2.1 – STEPS stair flow rates based on different grid sizes
6.2.2 Walking Speed
The lift walking speed has been varied based on the guidance of Nelson and Mowrer[3]
for
travel down the diagonal of a stair. The values used in the assessment are:
• 0.85m/s
• 0.95m/s
• 1.05m/s
The values of ‘the number of persons that left’ the simulation are shown in the graph
below. As can be seen from the graph, the difference in the number of persons that leave
the model is not dependent on the walking speed in the model. Due to the congestion

118
within the stair this factor is considered to be a result of the queuing of people in the stair,
which reduces walking speed to approximately zero. Therefore, the occupant walking
speed is not considered to be a controlling factor in this simulation.
On this basis, it is considered reasonable to use the value of 0.95m/s, based on the riser
and going dimensions[3]
, and the resulting stair angle.
0
1000
2000
3000
4000
5000
6000
7000
8000
00:00:00
00:04:50
00:09:40
00:14:30
00:19:20
00:24:10
00:29:00
00:33:50
00:38:40
00:43:30
00:48:20
00:53:10
00:58:00
01:02:50
01:07:40
Time (hr:min:sec)
Number of Occupants Evacuated
0.85m/s
0.95m/s
1.05m/s
Figure 6.2.2 – Evacuation times based on walking speeds
6.2.3 Patience
In a queuing situation, some people are more patient than others. The less patient people
will seek alternative routes and the more patient people will stay in place. In STEPS, an
adjustment factor is used to change the queuing time based on the occupants’ patience
level. This adjustment factor is calculated using the following equation:
( )( )5.0
5.01
PatienceCC
patience
eadjustqueu
−×+= Equation 31
Where: Patience is the value being varied (between 0 (impatient) and 1 (patient))

119
Cpatience is a co-efficient entered in the Edit Decision Process dialog box
The value of Cpatience is maintained as 1 for each assessment.
The patience factor is considered to be a model specific variable. A sensitivity study has
been undertaken to determine the impact of the patience factor on the results of the
model. The following patience factor values have been used in the assessment:
• Patient (0.9)
• Mid-point Value (0.5)
• Impatient (0.1)
In this application of STEPS simulation, the alternative to queuing is to access an alternative
exit via the refuge floor. Using lifts is not allowed. The results of the sensitivity study are
shown below based on the theoretical building detailed in Section 1.4, which contains 50
storeys above Ground and assumes occupants escape via one of the two available stairs,
due to a single stair being discounted in accordance with Approved Document B[2]
.
Figure 6.2.3 – Number of occupants evacuated via Stair 1

120
Figure 6.2.3 (a) – Number of occupants evacuated via Stair 2
Figure 6.2.3 (b) – Time for evacuation based on patience level
As can be seen from Figure 6.2.3 and 6.2.3 (a) above, the occupants with the lower value of
patience factor (impatient) are more likely to seek to escape via the alternative means of
escape (i.e. Stair 2 as shown in Figure 1.4). This is demonstrated by the number of
occupants of the ‘impatient‘ model escaping via the alternative exit.

121
Whilst this increases the time for occupants to escape via the alternative means of escape
(i.e. Stair 2), the reduction in the number of persons escaping via the more congested Stair
1 reduces the overall evacuation time. The difference in the overall evacuation time
between the patient and impatient occupants is 6 minutes and 50 seconds (Figure 6.2.3).
Therefore, the evacuation time of the impatient occupants is approximately 15% less.
On this basis, the patience factor is considered to be an important variable where
alternative means of escape are available. Since the purpose of this simulation is mearely
to demonstrate behaviour of the simulation results, the mid-point value, which is
considered to represent the different levels of patience within a large group, will be used in
further studies.
6.2.4 Summary
Whilst the results of the sensitivity study cannot be directly applied to the lift evacuation
studies used for comparison with the code compliant stair evacuation times, this
assessment provides confidence to the user that the results provided by the STEPS
programme are accurate.
The results of each of the three assessments in Section 6.2 provide the expected results
and have minimum deviation from the expected trend.
6.3 Results
The STEPS computer simulation programme was used as part of the study to provide
additional details about the occupant conditions within the building during the evacuation.
These generally included the time required for occupants to leave the building, number of
persons located on a refuge floor and space per person on the refuge floors.
This allowed the author to assess the conditions of the evacuation system in more detail
compared to those results provided by the ELVAC programme or the analytical calculation
methods provided by Siikonen[40]
and Sekizawa[42]
, such that suitable conclusions can be
made with regards to the appropriate evacuation strategy and comparison with stair
evacuation.

122
6.3.1 Comparison of Phased and Simultaneous Evacuation
Current guidance in the UK would recommend that a high rise building be provided with
phased evacuation. Phased evacuation generally requires the floor of fire origin to
evacuate upon detection, then after a set time delay, usually of two and a half minutes, the
next two floors above will evacuate and so on.
Phasing the evacuation of a high-rise building allows only a handful of storeys to evacuate
at anyone time. Therefore, the means of escape routes, such as stairs and doorways, can
be designed based on the relatively low number of occupants from a few floors, rather
than the more onerous occupancy during simultaneous evacuation.
However, in the event that the whole building is required to evacuate, occupants will be
required to escape via a staircase which has not been designed to accommodate the large
number of occupants required to use it. This will result in crowding on the stairs, which will
reduce and possibly stop the flow of occupants in the upper levels of the stairs.
0
1000
2000
3000
4000
5000
6000
7000
8000
00:00:00
00:06:00
00:12:00
00:18:00
00:24:00
00:30:00
00:36:00
00:42:00
00:48:00
00:54:00
01:00:00
01:06:00
01:12:00
Time (hr:min:sec)
Number of persons evacuated
Simultaneous
Phased
Figure 6.3.1 – Comparison of simultaneous and phased evacuation
It is noted from Figure 6.3.1 above the number of occupants who have left the building
during the simultaneous evacuation, exceeds that during phased evacuation. The
difference between the evacuation times is considered to be based on the time taken for
the first occupants of the phased evacuation simulation to reach the final exit of the stair
compared to simultaneous evacuation. During simultaneous evacuation, the first occupants

123
arrive at the final exit within a short period of time due to the short travel distance from
the floor nearest to the final exit, compared to that during phased evacuation, which may
be much higher within the building.
Whilst simultaneous evacuation does provide quicker evacuation times, it is noted from the
stair flow rate results in Section 6.2.1, that the flow rate within the stair during
simultaneous evacuation is very low, and therefore it is assumed that occupants of floors
immediately affected by the fire may not be able to enter the stair due to overcrowding.
Therefore, based on the higher flow rate within the stair, throughout the whole of the
phased evacuation period, the provision of a phased evacuation strategy allows people to
evacuate the fire floor quicker.
6.3.2 Space per Person
Whilst the main purpose of providing a building with lift evacuation is to reduce the total
evacuation time to less than that when providing code compliant stairs, designed to
accommodate phased evacuation, it is also to provide improved conditions within the
escape route. Accounts of evacuation of the World Trade Centre’s noted that the stairs
were blocked due to the merging flows of many floor levels into a stair of limited width and
the counter flow of fire fighters attempting to access the upper floor levels.
However, it is noted that based on the provision of a refuge floor serving 25 storeys,
approximately 3600 people will access the lifts via the refuge floor. Whilst these occupants
will not simultaneously occupy the refuge floor, due to the delay in occupants from the
upper floor levels reaching the refuge floor, it is noted that the flow rate onto the refuge
floor may exceed that of the lift evacuation system, such that occupants queue on the
refuge floor. On this basis, an assessment of the space per person provides an overview of
the conditions on the refuge floor, which may be compared with those in the stair.
Based on the provision of lift evacuation from an evacuation zone, it is not considered
necessary to assess the space available per occupant. This is on the basis that occupants do
not move between floors to board a lift. Therefore the floor space factor is considered to
be no worse than during normal occupancy. On this basis, it is only considered necessary to
assess the floor space factor per person for evacuation from refuge floors.

124
Each refuge floor is approximately 1850m2. Based on a 10 storey interval between refuge
floors, the most onerous floor space factor value is equal to 1.73m2/person, at the 40
th
refuge floor level. The most onerous value at the 10th
refuge floor level is equal to
2.83m2/person. The lower value at the 40
th floor is considered to be the result of the
increased distance between the refuge floor and the discharge floor which increases the lift
round trip time such that the net flow rate of occupants on to the refuge floor between
round trips is greater than the floor levels below.
As expected, the space per person increases within a shorter time of evacuation
commencing from the lower floor levels, than that of the upper floor levels. This is
considered to be the result of the lower lift evacuation time from this floor level.
The space per person reduces to a minimum value of 0.77 m2/person based on a 25 storey
interval between floor levels.
Whilst it is noted that this space per person is in excess of the lowest values discussed in
Section 2.5.3 for each scenario, the results of the simulation demonstrated that occupants
are provided with a low area per person (<1m2/person) for approximately 27 minutes
during the most onerous scenario. These conditions are considered to be similar to the
crowded conditions within the stair during a code compliant evacuation, which lift
evacuation attempts to overcome. Therefore, it is considered necessary to reduce the lift
waiting time if refuge floors are provided at the maximum recommended spacing or ensure
the refuge floors serve floor levels with low numbers of occupants (i.e. < 150 persons).
However, this will require an increase in the lift performance values.
6.3.3 Number of Occupants Evacuated
Based on the number of occupants who exit the STEPS simulation from the lift discharge
floor it is considered possible to calculate a lift ‘flow rate’ for the following three scenarios:
• Evacuation from refuge floors at 10 storey intervals
• Evacuation from refuge floors at 15 storey intervals
• Evacuation from refuge floors at 25 storey intervals

125
Each graph follows the same trend such that the number of persons that exit the model
increases at a steady rate. However, the gradient of the graph then decreases once the
occupants of the lower floor levels have exited the building via the stairs (i.e. flow rate is
equal to that of the lift discharge rate only).
A comparison of the number of occupants evacuated is shown in Figure 6.3.3, for
evacuation from a refuge floor.
Figure 6.3.3 – Evacuation time lines
As can be seen from the graph the most efficient lift evacuation strategy is based on the
provision of refuge floors at 10 storey intervals. The results of the graph show that at any
given time, the flow rate from a building provided with refuge floors at 10 storey intervals
exceeds that evacuated by refuge floors at greater intervals.
It is noted from the Figure above that the gradient of the line for the 25 storey interval
simulation is greater than that of the 15 storey simulation until approximately 30 minutes
after evacuation commences. The rate at which occupants exit the building in the 25 storey
simulation then reduces significantly, such that the rate at which occupants exit the
building is much higher for the 15 storey model. This is considered to be the result that up
to approximately 30 minutes after evacuation commences, more occupants of the 25
storey model are evacuating via the higher flow rate stairs (25 storeys), compared to those
0
1000
2000
3000
4000
5000
6000
7000
8000
00:00:00
00:09:00
00:18:00
00:27:00
00:36:00
00:45:00
00:54:00
01:03:00
01:12:00
01:21:00
01:30:00
01:39:00
01:48:00
01:57:00
Time (hr:min:sec)
Number of occupants evacuated
10 Storeys
15 Storeys
25 Storeys

126
in the 15 storey simulation (5 storeys evacuate via stairs). The reduction in the number of
occupants exiting in the 25 storey simulation after approximately 30 minutes is considered
to be the result of the remaining occupants of the 25 storey model being forced to
evacuate via the lifts, which have a lower flow rate of occupants that the stairs. The rate
people exit the 15 storey model remains relatively high based on the provision of multiple
groups of lifts, serving smaller zones, such that the flow rate of the lift system is maintained
at a higher level in the 15 storey model than the 25 storey model.
It is noted from Figure 6.3.3 that the number of occupants evacuated is different for each
of the three scenarios above. This is a result of the number of refuge floors provided in
each model. Based on the assumption that each refuge floor is a non-occupied, fire sterile
floor, the occupancy of the models with more refuge floors will be less than those with
fewer floors.
Based on a 10 storey interval between floors the average flow rate from the building (i.e.
the flow rate over the full evacuation period) using lifts is equal to 1.85 persons/second.
This decreases to 1.36 persons/second for a 15 storey interval between floor levels and
0.97 persons/second for a 25 storey interval between refuge floor levels.
However, based on the provision of lifts with a rated speed of 16m/s serving refuge floors
at 10 storey intervals the flow rate increases to 2.18 persons/second (15.1% increase).
Likewise, based on the provision of 8 lifts serving refuge floors at 15 storey intervals, the
flow rate increases to approximately 2.64 persons/second (48.5% increase).
6.3.4 Stair Flow Rate
The use of evacuation via lifts increases the flow rate within the stairs as a result of the
lower number of persons required to use the stairs.
This may be demonstrated based on the provision of refuge floors at 10 storey intervals,
where the stair width required for occupants to reach their refuge floor is less than that for
the simultaneous evacuation of the building.
Whilst the stair size required remains in excess of that required for the phased evacuation
for the smallest refuge floor evacuation distance, it is noted that the flow rate in the stair is
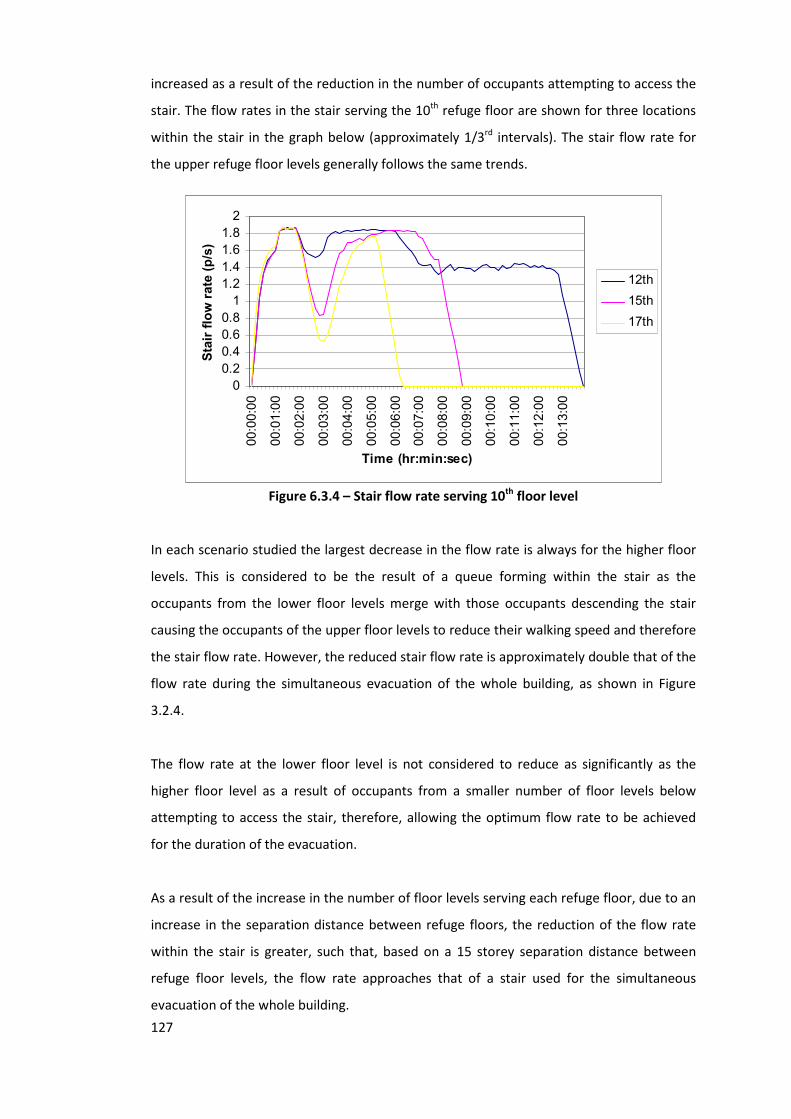
127
increased as a result of the reduction in the number of occupants attempting to access the
stair. The flow rates in the stair serving the 10th
refuge floor are shown for three locations
within the stair in the graph below (approximately 1/3rd
intervals). The stair flow rate for
the upper refuge floor levels generally follows the same trends.
Figure 6.3.4 – Stair flow rate serving 10th
floor level
In each scenario studied the largest decrease in the flow rate is always for the higher floor
levels. This is considered to be the result of a queue forming within the stair as the
occupants from the lower floor levels merge with those occupants descending the stair
causing the occupants of the upper floor levels to reduce their walking speed and therefore
the stair flow rate. However, the reduced stair flow rate is approximately double that of the
flow rate during the simultaneous evacuation of the whole building, as shown in Figure
3.2.4.
The flow rate at the lower floor level is not considered to reduce as significantly as the
higher floor level as a result of occupants from a smaller number of floor levels below
attempting to access the stair, therefore, allowing the optimum flow rate to be achieved
for the duration of the evacuation.
As a result of the increase in the number of floor levels serving each refuge floor, due to an
increase in the separation distance between refuge floors, the reduction of the flow rate
within the stair is greater, such that, based on a 15 storey separation distance between
refuge floor levels, the flow rate approaches that of a stair used for the simultaneous
evacuation of the whole building.
0
0.2
0.4
0.6
0.8
1
1.2
1.4
1.6
1.8
2
00:00:00
00:01:00
00:02:00
00:03:00
00:04:00
00:05:00
00:06:00
00:07:00
00:08:00
00:09:00
00:10:00
00:11:00
00:12:00
00:13:00
Time (hr:min:sec)
Stair flow rate (p/s)
12th
15th
17th

128
6.3.5 Lift Waiting Times
As expected the lowest lift waiting times are those for a 10 storey interval between refuge
floors. On this basis, the maximum lift waiting time is equal to 267 seconds (approximately
four and a half minutes), which is significantly lower than the eight minutes recommended
by Lane[5]
.
The STEPS assessment has shown that the maximum lift waiting time for the default values
is for a 25 storey interval between floor levels, which is equal to 600 seconds (~10
minutes).
Whilst it is noted that this waiting time exceeds the recommended eight minutes[5]
, this is
considered to be reasonable on the basis that this recommended time is based on a
notional evacuation time based on evacuation from sports stadia, plus the additional time
is less than the 30 minutes occupants have been observed to wait for a lift to arrive[9]
.
6.3.6 Effects of Reduced Occupancy
The use of the lifts for evacuation by half of the buildings occupants increases the space per
person on each refuge floor to approximately twice that when the whole building
occupancy escapes via lifts. In addition, the stair evacuation time is less than that during
the simultaneous evacuation of the building.
As the graph below shows, the flow rate in the stair decreases such that occupants are
required to stand and wait in the stair for approximately 90 seconds in the upper floor
levels of a stair serving a refuge floor. However, a similar effect is noted for every refuge
floor separation distance studied with a reduced occupancy. The rapid increase in the stair
flow rate is considered to be the result of a reduction in the number of occupants escaping
via the stair such that the flow rate reaches the optimum flow rate throughout the stair
value within a relatively short time period of evacuation commencing.

129
Figure 6.3.6 – Flow rate in stair serving 30th
refuge floor
The flow rate within the stairs also follows the same trend based on a greater refuge floor
separation distance, such that the flow rate in the upper levels of a stair reaches its
optimum flow rate after those floor levels below. The flow rate at the upper floor levels
ends prior to those floor levels below based on all of the occupants of the zone having
passed that measurement point prior to the end of the simulation.
6.3.7 Summary
The results of the STEPS assessment have provided additional information other than the
total evacuation time, which will allow designers to provide optimum lift evacuation
procedures to be implemented as well as investigate the conditions within a building once
a lift evacuation strategy is agreed.
For example, it is simple to note from the STEPS assessment that the space per person on a
refuge floor remains above the recommended floor space factor when refuge floors are
provided at the greater interval, and that the flow rate throughout the stair is maintained
at a higher level than a code compliant solution.
Whilst this information is not essential when trying to determine the quickest lift
evacuation strategy, it will provide designers with additional information that will allow
them to provide the optimum lift evacuation strategy which is unique to the specific
building being studied, rather than using predetermined values.
0
0.2
0.4
0.6
0.8
1
1.2
1.4
1.6
1.8
2
00:00:00
00:01:30
00:03:00
00:04:30
00:06:00
00:07:30
00:09:00
00:10:30
00:12:00
00:13:30
00:15:00
00:16:30
00:18:00
00:19:30
00:21:00
Time (hr:min:sec)
Flow rate (p/s)
32nd
35th
37th

130
7.0 CHAPTER 7 - ANALYSIS OF RESULTS
The results of the time required to evacuate the theoretical building using the calculation
procedures detailed by Siikonen[40]
and Sekizawa[43]
as well as those obtained using the
ELVAC computer programme have been compared with the stair evacuation time from an
equivalent floor level, which has been calculated using the Approved Document B flow
rates, to determine the most efficient evacuation method.
The results of the assessment are contained in the appendices, while a discussion of the
results is provided below, which includes the following information:
a) A comparison of the lift evacuation times using different lift performance values
with the code compliant stair evacuation time.
b) A comparison of the lift evacuation times using different lift performance values
with the associated stair evacuation times when provided with a combination of lift
and stair evacuation.
c) A comparison of the lift and stair results in point b) with the code compliant
evacuation times.
The results of this comparative assessment will demonstrate the most efficient evacuation
strategy, which may be used to support the results of the evacuation calculator contained
in Appendix A. It will also verify the lift performance values listed in Chapter 5 are suitable
for use with lift evacuation, and therefore, demonstrate that lifts provided for general
circulation use within tall buildings (i.e. not designed for evacuation of zones or refuge
floors only) may be used to evacuate buildings in less time than a code compliant method
of evacuation (i.e. stairs sized for phased evacuation).
7.1 Code Compliant Evacuation
The evacuation time using stairs has been calculated using the method detailed by Pauls[10]
,
as discussed in Section 3.2.3 and the Approved Document B flow rates[2]
, as discussed in
Section 3.2.2. The results of this assessment are shown in Figure 7.1 below.

131
It is not proposed to use the calculation method of Nelson and Mowrer due to the variation
between the results calculated using this method and those of Approved Document B,
which have been shown to have a close correlation with the results of evacuation drills
conducted by Pauls[10]
.
0.0
10.0
20.0
30.0
40.0
50.0
60.0
70.0
80.01 5 9
13
17
21
25
29
33
37
41
45
49
Floor Level
Tim
e (mins)
Approved
Document B
Pauls
Figure 7.1 – Time for evacuation using stairs only
The time taken for each floor level to evacuate is based on the assumption that the
occupants of the floor levels below are also evacuating. Therefore, the stair is full to
capacity.
As can be seen from the graph above, the difference between the method described by
Pauls, and the evacuation time based on the AD-B flow rate is small (approximately 6.7%
difference). This gives confidence in the assumptions of AD-B for calculating the code
compliant stair evacuation time for comparison to the lift evacuation times. It is not
proposed to compare the stair evacuation times, using the method detailed by Pauls, with
the lift evacuation times. On this basis, it is proposed to compare the lift evacuation times
with the stair evacuation times calculated using the AD-B flow rates only, based on the use
of this document in England and Wales.
Based on the simultaneous evacuation of the building, the total evacuation time is equal to
66 minutes, based on the flow rates used in Approved Document B. Therefore, all lift

132
evacuation times which are greater than 66 minutes are considered to be more onerous
than a code compliant design.
7.2 Evacuation via Lifts Only
An assessment of the time to evacuate the full building occupancy using only lifts has been
made for each of the proposed lift evacuation strategies. The results of the assessment are
contained in the Appendices.
7.2.1 Refuge Floor
7.2.1.1 Stair evacuation calculations
The time for evacuation from each refuge floor using stairs has been calculated for
comparison against the lift evacuation times, as shown in Table 7.2.1.1 below.
Refuge Floor Level Time (mins)
5 5.6
10 12.3
20 25.8
25 32.5
30 39.2
35 45.9
40 52.6
Table 7.2.1.1 – Time for evacuation by stairs from refuge floor based on AD-B flow rates
However, these stair evacuation times have been calculated from the same level as the
refuge floor and therefore cannot be directly compared to the code compliant stair
evacuation times or the evacuation zone times. Therefore, to allow a comparison of the
code compliant stair evacuation time with the lift evacuation time from a refuge floor, it is
also necessary to compare the lift evacuation times with the code compliant stair
evacuation time, which takes into account the additional occupants of the floor levels
above the refuge floor.
On this basis, it is also proposed to assess the lift evacuation times with the stair evacuation
times listed in Section 7.2.2.1 below, which takes into account the evacuation time for the
whole building.

133
7.2.1.2 Results of calculations
Based on a 10 storey interval between refuge floors the whole building evacuation time
(i.e. evacuation time from highest refuge floor) is approximately equal to the time taken
using stairs only (lift evacuation is 60 seconds faster), when using the default lift values. The
impact of the variable lift performance values is discussed below.
• Based on a lift velocity of 16m/s the whole building evacuation is approximately 10
minutes faster than the time required using stairs. The time for evacuation from
the 30th
refuge floor level using lifts is equal to the time required using stairs from
the same level (39.2 minutes). The time for evacuation from the lower refuge floor
levels using stairs is less than that required using lifts.
• An increase in the lift acceleration is considered to have a negligible impact on the
whole building evacuation time when applied to a lift with the default values.
• The whole building evacuation time is generally less than the stair evacuation time
when the lifts are provided with an increased capacity compared to the default
value. The exception to the above is considered to be the evacuation time from the
10th
and 20th
refuge floor levels, which is faster by stairs when the lift capacity is
equal to 16 persons or less. The evacuation time from the 20th
floor level is
approximately equal to the time required using stairs, when the lift capacity is
equal to 21 persons (lifts are 12 seconds faster).
• Based on the use of the default lift performance values, the lift evacuation time is
faster from the 20th
(lift evacuation is 1% less) to the 40th
refuge floor levels (lift
evacuation is 28% less), when compared to the code compliant stair evacuation
time. Evacuation is faster from every refuge floor level based on the provision of 21
person capacity lifts, or more than 6 lifts serving each refuge floor level. A summary
of the lift evacuation times compared with the code compliant stair evacuation
times is shown in Figure 7.2.1.2 (a) below.

134
0
10
20
30
40
50
60
10 20 30 40
Tim
e (
min
s)
Floor Level
Stair Evacuation Time
Default Lift
Performance Values
16 m/s
21 Persons
Figure 7.2.1.2 – Summary of lift and stair evacuation times from a refuge floor
0
10
20
30
40
50
60
70
10 20 30 40
Tim
e (
min
s)
Floor Level
Code Compliant Stair
Evacuation Time
Default Lift
Performance Values
16 m/s
21 Persons
8 Lifts
6 Lifts
Figure 7.2.1.2 (a) – Evacuation from refuge floors at 10 storey intervals compared to code
compliant evacuation time
Once the refuge floor interval is increased to 15 storeys the lift evacuation times increase
significantly, such that stair evacuation is generally quicker for the whole building
evacuation from the same floor level. This is due to an increase in the occupants required
to evacuate from each floor level without an increase in the lift performance values used
for the evacuation from refuge floors at 10 storey intervals to accommodate these
additional occupants. With the exception of the following:

135
• The whole building evacuation requires less time than stair evacuation for a 15
storey interval between refuge floors when 8 lifts are provided to serve each floor
level. However, the evacuation time from the lower refuge floor levels (5th
and 20th
)
using stairs is less than that required using lift evacuation.
• The whole building lift evacuation is faster than the code compliant stair
evacuation time when lifts are provided with a rated speed of 16m/s. However,
evacuation from the 5th
and 20th
refuge floor levels is faster by stairs. Nevertheless,
evacuation is faster from the 20th
floor level by lifts with a 21 person capacity, or 6
lifts serving each refuge floor. Evacuation is faster by lifts from each floor level
based on the provision of 8 lifts serving each floor level (lift evacuation is 14.8%
faster from the lowest refuge floor). A summary of the lift evacuation times
compared with the code compliant stair evacuation times is shown in Figure 7.2.1.2
(b) below.
0
10
20
30
40
50
60
70
5 20 35
Tim
e (
min
s)
Floor Level
Code Compliant Stair
Evacuation Time
21 Persons
6 Lifts
8 Lifts
16 m/s
Figure 7.2.1.2 (b) – Evacuation from refuge floors at 15 storey intervals compared to code
compliant evacuation time
Once the interval between refuge floors exceeds 15 storeys the whole building evacuation
time using lifts significantly exceeds that required using stairs from the same floor level.
Whilst evacuation via lifts is slower than stairs from an equivalent floor at a separation
distance of more than 15 storeys, lift evacuation remains faster than the code compliant
stair evacuation times based on increased lift performance values up to a 20 storey
separation distance between refuge floors. However, evacuation from the lower refuge

136
floor is generally faster via code compliant stairs, with the exception of 8 lifts serving each
refuge floor.
A comparison of the lift evacuation times, compared to the code compliant stair evacuation
time is shown in the figure below.
0
10
20
30
40
50
60
70
10 30
Tim
e (
min
s)
Floor Level
Code Compliant Stair
Evacuation Time
6 Lifts
8 Lifts
21 Persons
Figure 7.2.1.2 (c) – Evacuation from refuge floors at 20 storey intervals compared to code
compliant evacuation time
Once the separation distance between refuge floors increases to 25 storeys the code
compliant stair evacuation time is also faster than the stair evacuation time.
7.2.2 Evacuation Zone
7.2.2.1 Stair evacuation calculations
The time to evacuate using stairs for each evacuation zone (i.e. a zone of floors served by a
group of lifts, rather than a single refuge floor) has also been calculated for comparison to
the lift evacuation times. The time for evacuation from an evacuation zone, includes for
occupants of an evacuation zone (i.e. occupants of a certain floor level within the zone,
plus those on floor levels below the evacuation zone), as discussed above. On this basis, the
stair evacuation time used for comparison to the lift evacuation times in an evacuation
zone is equal to the code compliant stair evacuation times. Therefore, it is not proposed to
compare these evacuation times separately. An indicative diagram of the stair evacuation

137
calculation method is provided in Figure 7.2.2.1 below, while the stair evacuation times are
provided in Tables 7.2.2.1 (a) to 7.2.2.1 (d).
Stories within an
evacuation zone
Additional floor levels
below also required to
evacuate.
Figure 7.2.2.1 – Indicative diagram of stair evacuation times for comparison to evacuation
zone lift times
Lowest floor in zone
Time (mins)
10 25.8
20 39.2
30 52.6
40 66
Table 7.2.2.1 (a) - Time for evacuation by stairs from 10 storey evacuation zone
Lowest floor in zone
Time (mins)
5 25.8
20 45.9
35 66
Table 7.2.2.1 (b) - Time for evacuation by stairs from 15 storey evacuation zone

138
Lowest floor in zone
Time (mins)
10 39.2
30 66
Table 7.2.2.1 (c) - Time for evacuation by stairs from 20 storey evacuation zone
Lowest floor in zone
Time (mins)
25 66
Table 7.2.2.1(d) - Time for evacuation by stairs from 25 storey evacuation zone
It is noted that the stair evacuation times are not consistent for each evacuation zone,
depending on the size of the evacuation zone. This is based on the method of calculation of
the stair evacuation time.
For example, the stair evacuation time from the refuge zone from 10th
to 20th
floor level of
a building provided with 10 storey evacuation zones has been calculated based on the
assumption that 150 persons from each of the nine floor levels in the refuge zone, as well
as the occupants of the 10 floors below are seeking to simultaneously escape via the
remaining protected stair. However, the stair evacuation from the same floor level in a
building provided with 20 storey evacuation zones includes the occupants of the 19 floor
levels above this floor level (evacuation zone is labelled by lowest floor in the zone), plus
the occupants of the 10 storeys below this zone.
Due to the numbering of evacuation zones it is not possible to directly compare the stair
evacuation times for difference sized evacuation zones. However, this is not considered to
affect the accuracy of these results. For example, whilst the evacuation time from the 10th
storey evacuation zone is equal to 25.8 minutes for a building provided with 10 storey
evacuation zones, it is noted that the evacuation time from the 5th
refuge floor in a building
provided with a 15 storey evacuation zone (both zones which end at the 19th
storey) is
equal to 25.8 minutes.
7.2.2.2 Results of calculations
Based on a 10 storey evacuation zone, the evacuation time using lifts only is slightly in
excess of the evacuation time for stairs when using the default values. However, based on

139
an increase in the default lift performance values, the whole building evacuation time using
lifts is less than the time using stairs only. The results of this lift evacuation assessment are
contained in Appendix C. However, an overview of the results is provided below:
• The whole building evacuation time is approximately equal to the evacuation time
when using stairs only, based on a lift velocity of 7m/s (lifts are 2.3% faster).
However, the occupants on the three lower refuge zones are provided with a lower
evacuation time based on evacuation via stairs only.
• Evacuation time from the upper two refuge zones is less than the evacuation time
via stairs only based on a lift velocity of 16m/s or more.
• The whole building evacuation time using lifts is approximately equal to the stair
evacuation time using an acceleration of 1.5m/s2
(stairs are 2.5% faster).
• Based on the provision of a 16 or 21 person lift capacity, the whole building
evacuation time is less than the stair evacuation time. The lift evacuation time from
each refuge zone is less than the time required using stairs, based on a 21 person
lift, with the exception of the lowest zone, where lift evacuation requires an
additional 4.3 minutes (15%).
• The whole building evacuation is less than the stair evacuation time by
approximately 19.6 minutes (30%), based on the provision of 6 lifts serving the
evacuation zone. The evacuation time via stairs from the lowest evacuation zone is
approximately 84 seconds less (5.4%) than the evacuation time using lifts only.
Based on the provision of 8 lifts the evacuation time from each zone is less than the
stair evacuation time.

140
0
10
20
30
40
50
60
70
80
10 20 30 40
Tim
e (
min
s)
Lowest Floor Level in Zone
Code Compliant Stair
Evacuation Time
Default Values
7 m/s
16 m/s
21 Persons
6 Lifts
Figure 7.2.2.2 – Summary of evacuation from evacuation zones at 10 storey intervals
Based on the provision of 15 storey evacuation zones the lift evacuation time from the
building is significantly in excess of the stair evacuation time for most variables, with the
following exceptions.
• The whole building evacuation time is approximately equal for stair and lift
evacuation based on the provision of 6 lifts (lifts are 1.7% faster). The stair
evacuation times from the lower evacuation zones is less than the evacuation time
required for lifts.
• The lift evacuation time for the whole building is significantly less (17.1 minutes)
than the stair evacuation times based on the provision of 8 lifts serving each
evacuation zone. The evacuation times from the mid refuge zone are also less than
the stair evacuation time. However, the stair evacuation time from the lowest
evacuation zone is approximately 3 minutes less than the lift evacuation time (11%
difference).

141
0
10
20
30
40
50
60
70
5 20 35
Tim
e (
min
s)
Lowest Floor Level in Zone
Code Compliant Stair
Evacuation Time
6 Lifts
8 Lifts
Figure 7.2.2.2 (a) – Summary of evacuation from evacuation zones at 15 storey intervals
Once the interval between refuge floors exceeds 15 storeys the whole building evacuation
time using lifts generally exceeds that required using stairs only, with the exception of the
following:
• Based on the provision of a 20 storey evacuation zone, the lift evacuation time is
approximately 6% less than the code compliant stair evacuation time.
Once the evacuation zone is increased to 25 storeys, the lift evacuation time significantly
exceeds the stair evacuation time.
7.2.2.3 Comparison of results
It is noted that the evacuation time from an evacuation zone does not require occupants to
travel via stairs to reach the lift departure level, as required by evacuation from a refuge
floor, which increases the evacuation time. Nevertheless, this travel time is considered to
provide a nominal increase in the evacuation time, as occupants of the floor level closest to
a refuge floor are considered to commence evacuation as soon as they enter the refuge
floor. Therefore, the time difference between each method, as a result of the stair travel
time, is only equal to the time taken for occupants of the floor level immediately above the
refuge floor to descend a single flight of stairs to the refuge floor. Based on the calculation
method described by Nelson and Mowrer[3]
, this may be calculated as approximately 17
seconds.

142
Based on the comparison of results for the two strategies, using the default values
discussed in Chapter 5, the whole building evacuation time for the evacuation zone
strategy (i.e. lifts serve multiple floors within a zone) requires an additional 17.5 minutes
(approximately 25% difference), based on a 10 storey evacuation zone.
The time difference between the two strategies increases by an additional 5.2 minutes
(approximately 23.4% difference) for the whole building evacuation time, when the
evacuation zone increases to 15 storeys.
The percentage difference between the default values increases to 24.1% and 26.2% when
the evacuation zone increases to 20 storeys and 25 storeys respectively.
7.2.2.4 Summary
The whole building evacuation time is considered to be less than the stair evacuation time
for the default lift performance values for evacuation from refuge floors at 10 storey
intervals. However, the lift evacuation time from the lower floor levels exceeds the stair
evacuation time.
The lift evacuation time slightly exceeds the stair evacuation times for evacuation from a
refuge zone at the default values.
For the lowest floor levels to have approximately equal to, or better than, the stair
evacuation time, it is necessary to provide a minimum of 8 lifts.
Once the interval between refuge floors exceeds 20 storeys, the whole building evacuation
time using lifts exceeds that required using stairs only.
7.3 Evacuation via Stairs and Lifts (75% Lift Usage)
7.3.1 Introduction
The combined use of stairs and lifts to evacuate a building is considered to provide a more
efficient evacuation time. However, the overall evacuation time of the building is
determined by the slowest of either method, which in this case is considered to be the lift

143
evacuation time. On this basis, the resulting stair evacuation time will always be
significantly lower than the associated lift evacuation time, as noted from the Graphs in the
Appendices.
7.3.2 Refuge Floor
7.3.2.1 Stair evacuation calculations
The stair evacuation times have been calculated based on the percentage of the building
occupants assumed to escape via the stairs.
The time for occupants to reach the refuge floor is identical irrespective of the final method
of evacuation. Therefore, the stair evacuation times used in the refuge floor level
assessment have been calculated from the refuge floor level only. The stair evacuation time
only includes for occupants in the stair below the refuge floor level, based on the flow rate
contained in Approved Document B.
Refuge Floor Level Time (mins)
5 1.6
10 3.3
20 6.6
25 8.3
30 10.0
35 11.7
40 13.3
Table 7.3.2.1 – Time for evacuation by stairs from refuge floor in accordance with AD-B
Based on approximately 25% of the building occupancy using the stairs to evacuate, the
stair evacuation times will be approximately 25% of those calculated in Section 7.2.1.1.
However, the lifts are required to accommodate the remaining 75% of the building
occupancy. As noted from the graphs contained within the Appendices, the lift evacuation
times always exceed the associated stair evacuation time. On this basis, the limiting factor
on the total evacuation time will be the lift evacuation time. Therefore, it is proposed to
compare the lift evacuation times (as the most onerous evacuation time) with the code

144
compliant stair evacuation times (i.e. 100% of the occupancy uses the stairs to evacuate)
only.
The code compliant stair evacuation times are the same as those listed in Table 7.2.2.1 (a)
to 7.2.2.1 (d).
7.3.2.2 Results of calculations
Based on a 10 storey interval between refuge floors the whole building evacuation time
(i.e. evacuation time from highest refuge floor), plus those from the 20th
and 30th
floor
levels is less than the time taken using stairs only, when using the default lift values. The
impact of the variable lift performance values is discussed below.
• Evacuation is also faster by lift from the 10th
refuge floor level based on a lift
acceleration of 1.5m/s2, 16 and 21 person lift capacity, as well as 6 and 8 lifts.
0
10
20
30
40
50
60
70
10 20 30 40
Tik
e (
min
s)
Floor Level
Code Compliant Stair
Evacuation Time
Default Values
1.5 m/s2
16 Persons
6 Lifts
Figure 7.3.2.2 – Evacuation from refuge floors at 10 storey intervals compared to code
compliant evacuation time
Due to the lower number of occupants escaping via the lifts, the whole building evacuation
time is less than the code compliant stair evacuation time when assessing the default value
for a 15 storey evacuation zone. However, the lift evacuation time from the 5th
and 20th
refuge floor levels is in excess of the stair evacuation time, with the exception of the
following:
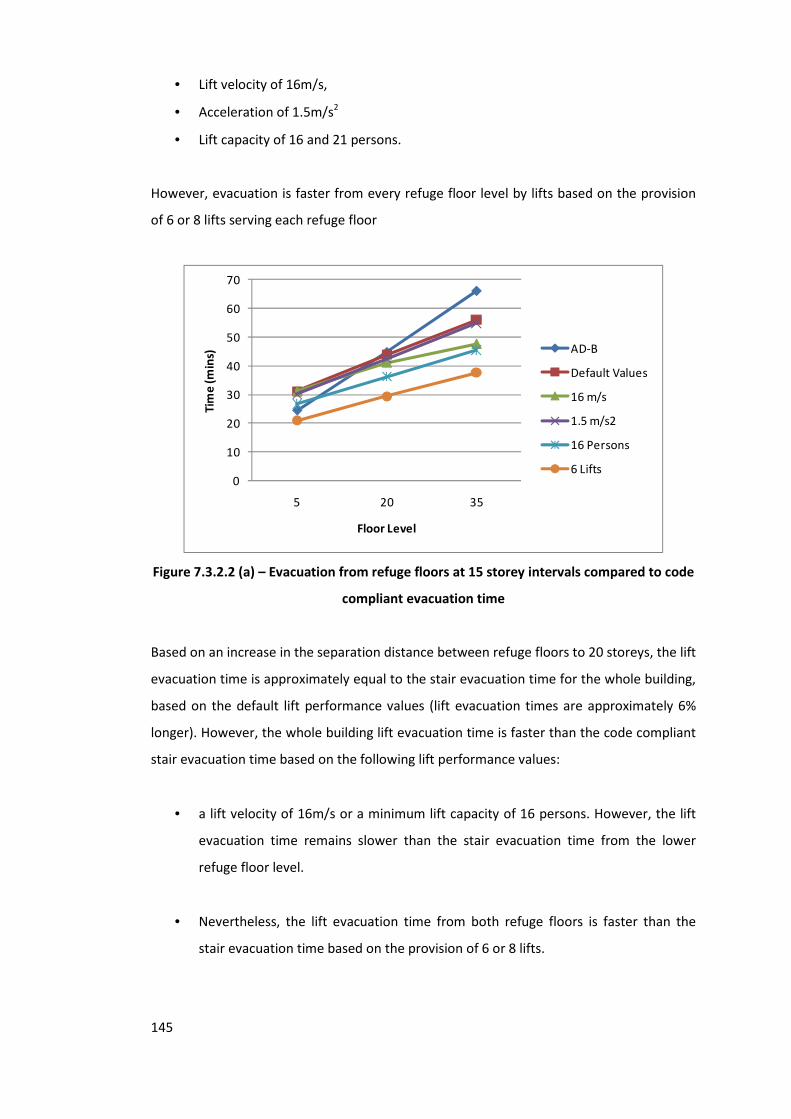
145
• Lift velocity of 16m/s,
• Acceleration of 1.5m/s2
• Lift capacity of 16 and 21 persons.
However, evacuation is faster from every refuge floor level by lifts based on the provision
of 6 or 8 lifts serving each refuge floor
0
10
20
30
40
50
60
70
5 20 35
Tim
e (
min
s)
Floor Level
AD-B
Default Values
16 m/s
1.5 m/s2
16 Persons
6 Lifts
Figure 7.3.2.2 (a) – Evacuation from refuge floors at 15 storey intervals compared to code
compliant evacuation time
Based on an increase in the separation distance between refuge floors to 20 storeys, the lift
evacuation time is approximately equal to the stair evacuation time for the whole building,
based on the default lift performance values (lift evacuation times are approximately 6%
longer). However, the whole building lift evacuation time is faster than the code compliant
stair evacuation time based on the following lift performance values:
• a lift velocity of 16m/s or a minimum lift capacity of 16 persons. However, the lift
evacuation time remains slower than the stair evacuation time from the lower
refuge floor level.
• Nevertheless, the lift evacuation time from both refuge floors is faster than the
stair evacuation time based on the provision of 6 or 8 lifts.

146
0
10
20
30
40
50
60
70
10 30
Tim
e (
min
s)
Floor Level
AD-B
16 m/s
16 Persons
6 Lifts
Figure 7.3.2.2 (b) – Evacuation from refuge floors at 20 storey intervals compared to code
compliant evacuation time
Based on a further increase in the refuge floor separation distance to 25 storeys, the whole
building evacuation time is greater than the code compliant stair evacuation time when
using the default values. However, lift evacuation provides a reduction in the code
compliant evacuation time based on the following lift performance values:
• The evacuation time is equal to the code compliant stair evacuation time when 16
person lifts are provided.
• The lift evacuation time (and therefore, whole building evacuation time) is faster
than the stair evacuation time based on the provision of 21 person lifts or a
minimum of 6 lifts.
7.3.3 Evacuation Zone
7.3.3.1 Stair evacuation calculations
The time for evacuation from an evacuation zone is based on the occupants of that zone
seeking to simultaneously seeking to escape via the escape stairs as well as any occupants
of the refuge zones below. Therefore, the time for evacuation from each refuge zone varies
depending on the number of occupants in the refuge zone as well as the number of

147
occupants on the floor levels below the evacuation zone. The time for evacuation of 25% of
the theoretical buildings occupants is shown in Table 7.3.3.1 (a) to 7.3.3.1 (d), below.
Lowest floor in zone
Time (mins)
10 6.3
20 9.7
30 13
40 16.7
Table 7.3.3.1 (a) - Time for evacuation by stairs from 10 storey evacuation zone
Lowest floor in zone
Time (mins)
5 6.3
20 11.3
35 16.7
Table 7.3.3.1 (b) - Time for evacuation by stairs from 15 storey evacuation zone
Lowest floor in zone
Time (mins)
10 9.7
30 16.7
Table 7.3.3.1 (c) - Time for evacuation by stairs from 20 storey evacuation zone
Lowest floor in zone
Time (mins)
25 16.7
Table 7.3.3.1 (d) - Time for evacuation by stairs from 25 storey evacuation zone
The lift evacuation times have also been compared with the code compliant stair
evacuation times, as listed in Tables 7.2.2.1 (a) to 7.2.2.1 (d).
7.3.3.2 Results of calculations
Based on the assumption that approximately 75% of the buildings occupants escape via lifts
the whole building evacuation time is considered to be faster than the code compliant

148
evacuation time when using the default values for a 10 storey evacuation zone. However,
evacuation is generally faster from the lowest refuge floor levels by stairs, with the
following exceptions:
• Lift capacity of 21 persons or a minimum of 6 lifts.
0
10
20
30
40
50
60
70
10 20 30 40
Tim
e (
min
s)
Lowest Floor Level in Evacuation Zone
Code Compliant Stair
Evacuation Time
Default Values
21 Persons
6 Lifts
Figure 7.3.3.2 – Comparison of code compliant stair evacuation time with lift evacuation
from 10 storey evacuation zones
Based on an increase in the evacuation zone to 15 storeys, the whole building evacuation
time by stairs is faster than that using lifts, when approximately 75% of the building
occupancy escape via lifts, with the following exceptions.
• The whole building evacuation time using lifts is less than that using stairs based on
a lift velocity of 16m/s, a lift capacity of 16 persons, or the provision of 6 lifts.
However, the evacuation time from the lower evacuation zones is faster by stairs.
• Nevertheless, evacuation from each evacuation zone is faster than stair evacuation
based on the provision of 8 lifts (12 person capacity) serving each zone.

149
0
10
20
30
40
50
60
70
80
5 20 35
Tim
e (
min
s)
Lowest Floor Level in Evacuation Zone
Code Compliant Stair
Evacuation Time
Default Value
16 m/s
16 Persons
6 Lifts
8 Lifts
Figure 7.3.3.2 (a) – Comparison of code compliant stair evacuation time with lift
evacuation from 15 storey evacuation zones
Based on a 20 storey evacuation zone the whole building evacuation is less based on the
use of code compliant stairs. However, lift evacuation provides a reduction in this time
based on the following performance values.
• The whole building evacuation time using lifts is less (lifts evacuation time 4.2%
less) than the stair evacuation time, based on the provision of 6 lifts. However, the
evacuation time from the lower refuge floor is less based on the use of stairs for
evacuation.
• The lift evacuation time from both zones is less than the stair evacuation time
based on the provision of eight lifts.

150
0
10
20
30
40
50
60
70
10 30
Tim
e (
min
s)
Lowest Floor in Evacuation zone
Code Compliant Stair
Evacuation Time
6 Lifts
8 Lifts
Figure 7.3.3.2 (b) – Comparison of code compliant stair evacuation time with lift
evacuation from 20 storey evacuation zones
Once the evacuation zone increases to 25 storeys, the whole building evacuation time is
less using code compliant escape stairs, with the exception of the lift evacuation times
when 8 lifts are provided.
7.3.3.3 Comparison of results
Based on the evacuation of 75% of the building occupants via lifts, the lift evacuation time
is considerably in excess of the associated stair evacuation time (which is required to
evacuate only 25% of the buildings occupants).
Whilst it is noted that this will cause some occupants waiting for the lift to arrive to suffer
from anxiety if they know other persons have commenced evacuating the building by using
the stairs, it is considered that this ratio may be a suitable method if large numbers of
persons are unable to descend the stairs due to physical health.
Whilst this difference between the evacuation times for this ratio are noted, it is
considered worth noting the reduction in the overall evacuation time when compared to
the code complaint evacuation time (i.e. 100% of the occupants escapes via lift). On this
basis, lift evacuation from evacuation zones containing up to 25 storeys may be provided
based on 8 lifts serving each zone.

151
Based on a comparison of results for the two strategies, using the default values discussed
in Chapter 5, the whole building evacuation time for the evacuation zone strategy (i.e. lifts
serve multiple floors within a zone) requires between 24.8% and 27.9% longer than via a
refuge floor.
As previously discussed the evacuation time from an evacuation zone does not require
occupants to travel via stairs to reach the lift departure level, as required by evacuation
from a refuge floor, which increases the evacuation time. However, this additional travel
time is considered to provide a nominal increase in the evacuation time, as occupants of
the floor level closest to a refuge floor are considered to commence evacuation as soon as
they enter the refuge floor. Therefore, the time difference between each method is only
equal to the time taken for occupants of the floor level immediately above the refuge floor
to descend a single flight of stairs to the refuge floor.
7.3.3.4 Summary
Based on a 25% reduction in the number of building occupants seeking to escape via lifts
the lift evacuation time also reduces by approximately 25%. However, the time to evacuate
using lifts is significantly in excess of the evacuation time of the remaining occupants via
stairs.
Nevertheless, based on the slowest evacuation time (i.e. lift evacuation time), the whole
building evacuation is generally less than the time required for the whole building
evacuation via stairs only, for the small evacuation zone/refuge floor separation distance.
Nevertheless, this assessment has shown that based on a reduction in the number of
occupants using the lifts by a quarter, allows for evacuation zones and refuge floors to be
incorporated at a maximum of 25 storey intervals, without the requirement for unfeasible
numbers of lifts shafts or lift car capacities.
7.4 Evacuation via Stairs and Lifts (50% Lift Usage)
Based on an equal distribution of the buildings occupants between lift and stair evacuation
it is noted that the difference in evacuation times between the two methods is significantly
less than those discussed in Section 7.3 above.

152
However, whilst it is proposed to compared the evacuation times achieved for both
methods based on a reduced occupancy, as detailed within the appendix, it is also
proposed to assess the most onerous of these evacuation times with the code compliant
stair evacuation time (taken as the stair evacuation time for 100% occupancy).
7.4.1 Refuge Floor
7.4.1.1 Stair evacuation times
The stair evacuation times have been calculated based on the percentage of the building
occupants assumed to escape via the stairs only. Due to the even distribution of occupants
between the lifts and stairs, such that the differences between evacuation times will be
significantly less than those discussed in Section 7.3, it is proposed to assess the lift
evacuation times with the stair evacuation times when utilised by 50% of the building
occupancy and with the code compliant stair evacuation times.
The stair evacuation times used in the refuge floor level assessment have been calculated
to compare the time taken once occupants of a certain floor level have reached their
designated refuge floor level. Therefore, the stair evacuation times have been calculated
based on the assumption that the stair is full to capacity below the refuge floor level only,
and does not include for any occupants above this floor level. The equivalent lift evacuation
time includes the occupants served by the relevant refuge floor only.
The most onerous of the evacuation times (i.e. lift or stair evacuation time) for each
scenario have also been compared to the code complaint stair evacuation times as listed in
Section 9.2.1.1.
Refuge Floor Level
Time (mins)
5 2.9
10 6.3
20 13.0
25 16.4
30 19.7
35 23.0
40 26.4
Table 7.4.1.1 – Stair evacuation time for 50% of building occupancy based on AD-B

153
It is also proposed to assess the lift evacuation times with the code compliant stair
evacuation times listed in Section 7.2.2.1, which takes into account the evacuation time for
the whole building.
7.4.1.2 Results of calculations
Based on a 10 storey separation distance between refuge floors, the lift evacuation time is
slightly in excess of the stair evacuation time when using the default values (stairs are 0.4%
faster). Based on an increase in these values, the whole building evacuation time using lifts
is generally less than the time using stairs only. The impact of the variable lift performance
values on the evacuation times is discussed below:
• Based on a lift velocity of 16m/s the whole building evacuation time is less than the
associated stair evacuation time. However, the evacuation time from the lower
refuge floor levels exceeds the stair evacuation time.
• The whole building evacuation time is less than the associated stair evacuation
time when the lifts are provided with an increased capacity in relation to the
default value. However, the evacuation time from the 10th
and 20th
refuge floor
levels remains less by stairs.
• Based on the provision of 6 lifts to each group, the whole building evacuation is
approximately 8.4 minutes (31.8%) faster than the associated stair evacuation
time. The lift evacuation time is less than the stair evacuation time from the 20th
-
40th
refuge floor levels. Based on the provision of 8 lifts in each group, the
evacuation time using lifts is considered to be less than that using stairs from the
20th
to 40th
floor levels. Stair evacuation from the 10th
floor level is approximately
108 seconds (22%) faster.
• Based on the use of the default values, the combined evacuation time (i.e. via stair
and lifts) is faster than the code compliant stair evacuation time from each refuge
floor level, as shown in Figure 7.4.1.2 (a) below.

154
0
5
10
15
20
25
30
10 20 30 40
Tim
e (
min
s)
Refuge Floor Level
Stair Evacuation Time
Default Values
16 m/s
21 Persons
8 Lifts
Figure 7.4.1.2 – Comparison of lift evacuation time with stair evacuation times
0
10
20
30
40
50
60
70
10 20 30 40
Tim
e (
min
s)
Floor Level
Code Compliant Stair
Evacuation Time
Default Values
21 Persons
6 Lifts
8 Lifts
Figure 7.4.1.2 (a) – Comparison of code compliant evacuation time with lift evacuation at
10 storey intervals
Based on a 15 storey separation distance between refuge floor levels, the lift evacuation
time is generally longer than the associated stair evacuation time at 50% occupancy. This is
considered to be a result of the reduced occupant capacity in the stair, such that a higher
flow rate is maintained throughout the stair, without increasing the lift specification.
The only exception to the above observation is when 8 lifts are provided to serve each floor
level, such that the whole building evacuation time using lifts is less than the equivalent
stair evacuation time. However, the evacuation time from the lower refuge floor levels (5th

155
and 20th
) using stairs remains lower than that required using lifts. Once the interval
between refuge floors exceeds 15 storeys the whole building evacuation time using lifts
significantly exceeds the associated stair evacuation time.
However, whilst the lift evacuation time exceeds that of the associated stairs, this
evacuation strategy provides a lower total building evacuation time than the code
compliant stair evacuation time. The lift evacuation time is also lower than the code
compliant stair evacuation time from the lower refuge floor levels, as shown in Figure
7.4.1.2 (b).
0
10
20
30
40
50
60
70
5 20 35
Tim
e (
min
s)
Floor Level
Code Compliant Stair
Evacuation time
Default Values
6 Lifts
8 Lifts
16 Persons
21 Persons
Figure 7.4.1.2 (b) – Comparison of code compliant evacuation time with lift evacuation at
15 storey intervals
Based on a 20 storey separation distance, the lift evacuation time from both refuge floor
levels is less than the code compliant stair evacuation time based on the use of the default
values. Lift evacuation is approximately 28.9% less than stair evacuation for the whole
building.

156
0
10
20
30
40
50
60
70
10 30
Tim
e (
min
s)
Floor Level
Code Compliant Stair
Evacuation Time
Default Values
Figure 7.4.1.2 (c) – Comparison of code compliant evacuation time with lift evacuation at
20 storey intervals
Evacuation from the 25th
refuge floor level may also be completed in less time than that
required when using code compliant escape stairs to evacuate, based on the use of lifts
with the default lift performance values (lifts are approximately 17.7% faster than stairs).
However, the lift evacuation time may be reduced to 41.8% of the code compliant stair
evacuation time, based on the provision of 8 lifts serving the refuge floor, as shown in
Figure 7.4.1.2 (d) below.
0
10
20
30
40
50
60
70
Code Compliant Stair
Evacuation Time
Default Lift Values 8 Lifts
Tim
e (
min
s)
Method of Evacuation
Figure 7.4.1.2 (d) – Comparison of code compliant evacuation time with lift evacuation at
25 storey intervals

157
7.4.2 Evacuation Zone
7.4.2.1 Stair evacuation times
The time for evacuation from an evacuation zone is based on the occupants of that zone
seeking to simultaneously seeking to escape via the escape stairs as well as any occupants
of the refuge zones below. Therefore, the time for evacuation from each refuge zone varies
depending on the number of occupants in the refuge zone as well as the number of
occupants on the floor levels below the evacuation zone. The time for evacuation of 50% of
the theoretical buildings occupants is shown in Table 7.3.3.1 (a) to 7.3.3.1 (d), below.
The most onerous of the evacuation times for each separation distance have been
compared to the code compliant stair evacuation times, as listed in Section 7.2.2.1.
Lowest floor in zone
Time (mins)
10 12.3
20 19.1
30 25.8
40 33.2
Table 7.4.2.1 (a) - Time for evacuation by stairs from 10 storey evacuation zone
Lowest floor in zone
Time (mins)
5 12.3
20 22.4
35 33.2
Table 7.4.2.1 (b) - Time for evacuation by stairs from 15 storey evacuation zone
Lowest floor in zone
Time (mins)
10 19.1
30 33.2
Table 7.4.2.1 (c) - Time for evacuation by stairs from 20 storey evacuation zone

158
Lowest floor in zone
Time (mins)
25 33.2
Table 7.4.2.1 (d) - Time for evacuation by stairs from 25 storey evacuation zone
7.4.2.2 Results of calculations
Based on a 10 storey evacuation zone, the lift evacuation time is slightly in excess of the
evacuation time for stairs when using the default values. However, based on an increase in
these values, the whole building evacuation time using lifts is less than the time using stairs
only, for the following situations:
• Evacuation time from the upper two evacuation zones is less than the evacuation
time via stairs only based on a lift velocity of 16m/s.
• Based on the provision of a 21 person lift capacity, the lift evacuation time from the
three highest evacuation zones is less than the time required using stairs. However,
the evacuation time from the lowest zone is less by stairs, where lift evacuation
requires an additional 2.4 minutes (16.3%).
• The lift evacuation time from the 20th
– 40th
evacuation zones is less than the stair
evacuation time, based on the provision of 6 lifts serving the evacuation zone.
However, the evacuation time via stairs from the lowest evacuation zone is
approximately 1.7 minutes (12.1% difference) less than the evacuation time using
lifts.
• Based on the provision of 8 lifts, the evacuation time from each zone is less than
the stair evacuation time.

159
0
5
10
15
20
25
30
35
10 20 30 40
Tim
e (
min
s)
Lowest Floor Level in Zone
Stair Evacuation Time
16 m/s
21 Persons
6 Lifts
8 Lifts
Figure 7.4.2.2 – Comparison of lift and stair evacuation from 10 storey evacuation zones
• Based on the use of the default values, the combined evacuation time (i.e. via stair
and lifts) is faster than the code compliant stair evacuation time each refuge floor
level, as shown in Figure 7.4.2.2 (a) below.
0
10
20
30
40
50
60
70
10 20 30 40
Tim
e (
min
s)
AD-B
Default Values
Figure 7.4.2.2 (a) – Comparison of code compliant evacuation time with lift evacuation at
10 storey intervals
Based on the provision of a 15 storey evacuation zone, the lift evacuation time from the
building is significantly in excess of the equivalent stair evacuation time for most variables,
with the following exceptions.
• Based on a lift capacity of 21 persons the whole building evacuation time is
approximately equal for stair and lift evacuation (stairs are 3.2% faster). In

160
addition, the evacuation times from the lower evacuation zones are less based on
stair evacuation.
• The whole building evacuation time is approximately equal for stair and lift
evacuation based on the provision of 6 lifts (stairs are 5.1% faster).
• The lift evacuation time for the whole building is 6.7 minutes (approximately
20.2%) less than the stair evacuation times, based on the provision of 8 lifts serving
each evacuation zone. The evacuation times from the mid refuge zone is also less
than the stair evacuation time. However, the lift evacuation time from the lowest
evacuation zone is approximately 2.5 minutes less (stairs are 16.9% quicker) than
the lift evacuation time.
0
5
10
15
20
25
30
35
40
5 20 35
Tim
e (
min
s)
Lowest Floor Level in Zone
Stair Evacuation Time
21 Persons
6 Lifts
8 Lifts
Figure 7.4.2.2 (b) – Comparison of stair evacuation time with lift evacuation at 15 storey
intervals
The lift evacuation time is less than the code complaint evacuation time from the 20th
and
35th
evacuation zones based on the use of the default values. However, evacuation is faster
from the lower zone via code complaint stairs, with the exception of 6 or more lifts, or a lift
capacity of 21 persons.

161
0
10
20
30
40
50
60
70
5 20 35
Tim
e (
min
s)
Lowest Floor Level in Zone
Code Compliant Stair
Evacuation Time
Default Values
6 Lifts
Figure 7.4.2.2 (c) – Comparison of code compliant evacuation time with lift evacuation at
15 storey intervals
Once the interval between evacuation zones exceeds 15 storeys the evacuation time using
lifts generally significantly exceeds the associated stair evacuation time. The only exception
is for a 20 storey evacuation zone where the evacuation time with 8 lifts is less than the
associated stair evacuation time from the 20th
and 35th
evacuation zones.
0
10
20
30
40
50
60
5 20 35
Tim
e (
min
s)
Lowest Floor Level in Zone
Stair Evacuation Time
Default Values
8 Lifts
Figure 7.4.2.2 (d) – Comparison of stair evacuation time with lift evacuation at 20 storey
intervals
Nevertheless, the lift evacuation times is less than the code complaint stair evacuation time
when using the default lift performance values up to a maximum evacuation zone size of 20

162
storeys. Once the evacuation zone exceeds 20 storeys the whole building evacuation is
faster via code compliant stairs.
However, the lift evacuation zone may increase up to 25 storeys and maintain lift
evacuation times which are less than the code compliant evacuation times based on the
provision of the following lift performance values:
• Lift speed of 16m/s
• 6 or more lifts
• Capacity of 16 persons or greater
0
10
20
30
40
50
60
70
Code
Compliant
Stair
Evacuation
Time
16 m/s 16 Persons 21 Persons 6 Lifts 8 Lifts
Tim
e (
min
s)
Lift Performance Value
Figure 7.4.2.2 (e) – Comparison of code compliant evacuation time with lift evacuation at
25 storey intervals
7.4.2.3 Comparison of results
Based on a 50% reduction in the number of building occupants seeking to escape via lifts
the lift evacuation time also reduces by approximately 50%. However, it is noted that the
lift evacuation time generally exceeds the evacuation time of the remaining 50% of
occupants escaping via the associated stairs, particularly from the lower levels.
Based on a comparison of results for the two strategies, using the default values discussed
in Chapter 5, the whole building evacuation time for the evacuation zone strategy (i.e. lifts
serve multiple floors within a zone) requires between 27.6% and 30.7% longer than that
using the refuge floor strategy.

163
As previously discussed, the evacuation time from an evacuation zone may be considered
as the total evacuation time compared to that from a refuge floor. The evacuation time
from a refuge floor does not take into account the time for occupants to reach the refuge
floor. However, based on the small additional increase in the overall evacuation time from
a refuge floor based on the requirements for occupants to travel via stairs to the refuge
floor, it is considered reasonable to directly compare.
7.4.2.4 Summary
Based on the slowest whole building evacuation time (i.e. lift or stair evacuation), the
whole building evacuation is generally less than the code compliant stair evacuation time.
This assessment has demonstrated that based on a reduction in the number of occupants
using the lifts by half, allows for refuge floors to and evacuation zone to be provided which
serve 25 storeys, without the requirement for unfeasible number of lifts shafts or lift car
capacities.
7.5 Analysis of Combined Lift Performance Values
The lift evacuation times listed in Section 7.2 to Section 7.4 are based on varying a single lift
performance value, to determine its impact on the evacuation time. However, it is noted
that a lift used for the evacuation of a building is likely to be provided with a number of
increased performance values. For example, the lifts used in the evacuation of Taipai 101
are provided with a constant speed of approximately 17 m/s and a capacity of 24
persons[30]]
.
On this basis, it is assumed that the actual lift evacuation times may be significantly less
than those calculated as part of the assessment above, and therefore, greater numbers of
occupants may be able to escape via the lifts, allowing a greater refuge floor separation
distance or evacuation zone. On this basis, it is proposed to calculate the evacuation times
for a combination of two of the lift performance values, for both methods of evacuation,
based on the assumption that all of the occupants escape via the lifts. The evacuation times
will be assessed based on the following combination of lift performance values:
• Speed of 16 m/s and lift capacity of 21 persons
• Speed of 7m/s and acceleration of 1.5m/s2

164
• 8 lifts with a capacity of 21 persons each
The details of the assessment are provided in the tables below for comparison
Refuge floor
separation
distance
Refuge
floor level
Default
evacuation
time
Code
compliant
evacuation
time
16 m/s
& 21
persons
7 m/s
& 1.5
m/s2
8 lifts &
21
persons
10 10 30.6 24.4 22.4 29.2 11.6
20 37.6 37.9 25.3 35.2 13.7
30 44.6 51.3 27.6 41.2 15.8
40 51.6 66 29.5 47.2 17.9
15 5 41.1 24.4 31.1 39.7 14.5
20 57.9 44.6 38.7 54.2 20.8
35 74.1 66 43.7 68.1 25.5
20 10 63.7 37.9 46.3 60.9 23.7
30 93 66 57 86 32.2
25 25 107.9 66 69 100.4 37.8
Table 7.5 - Comparison of evacuation times based on the use of refuge floors
Evacuation zone
size
Refuge
floor
level
Default
evacuation
time
Code
compliant
evacuation
time
16 m/s
& 21
persons
7 m/s
& 1.5
m/s2
8 lifts &
21
persons
10 10 38.3 24.4 27.9 36.2 14.7
20 46.4 37.9 31.1 43.1 17.3
30 54.4 51.3 33.7 50.0 19.9
40 69.1 66 39.6 62.9 24.3
15 5 54.1 24.4 39.9 53.2 20.8
20 72.2 44.6 47.2 66.9 26.5
35 96.8 66 56.2 88.3 34.4
20 10 84 37.9 58.2 78.7 31.2
30 122.5 66 72.3 112.1 43.5
25 25 146.3 66 87.8 134.1 52
Table 7.5 (a) - Comparison of evacuation times based on the use of evacuation zones
Based on the provision of 8 lifts with a capacity of 21 persons, it is possible to evacuate the
whole building faster than the code compliant evacuation time for either evacuation
method up to the maximum separation distance of 25 storeys.
Whilst it is noted that this will require a large amount of the building plan area to be taken
up by lift shafts, this method will save on floor space as it will allow the construction of a
building with fewer number of refuge floors, or group of lifts, depending on the evacuation
method used.

165
7.6 Comparison of Calculation Methods and Lift Variables on the Evacuation Time
The calculation methods described in Section 3.3 provide different values for the lift
evacuation time. However, it is considered necessary to compare the differences between
each calculation method and the impact each variable has on the resulting output.
7.6.1 Refuge Floors
Based on the evacuation of the buildings occupants from a refuge floor the differences
between the lift evacuation times as a result of the different lift performance variable are
as follows:
7.6.1.1 Variable Speed
• The difference between the ELVAC evacuation time and the analytical methods
increases with an increase in speed. However, the evacuation time from the lowest
refuge floor level is approximately equal for each lift velocity. This is considered to
be limited by the acceleration required to reach maximum speed over the shorter
distance to this refuge floor, which is taken into account by each method, such that
the maximum speed is not achieved prior to the lift arriving at the refuge floor,
irrespective of the lift speed.
• The difference between the lift evacuation times calculated by the Siikonen and
Sekizawa methods decreases when the lift speed is increased.
7.6.1.2 Variable Acceleration
• The difference between the lift evacuation times calculated by ELVAC and the
Sekizawa method are equal for both acceleration values.
7.6.1.3 Variable Capacity
• The difference between evacuation times based on the ELVAC and Siikonen
calculation procedures is approximately equal for each value of the lift capacity.

166
The average of the difference between the values at each refuge floor level for the
10 person capacity lift and the 21 person capacity lift is equal to 7.9%.
• The difference between the evacuation times calculated using the methodologies
determined by Siikonen and Sekizawa increases with the lift capacity.
7.6.1.4 Variable Lifts
• The difference in evacuation times between the ELVAC and Siikonen calculation
methodologies is approximately equal for each grouping of lifts. The average value
of the difference between the two methods decreases by 1.3% when the number
of lifts doubles from 4 to 8.
• The difference between the evacuation times calculated using the methodologies
discussed by Siikonen and Sekizawa decreases by 0.3% for the same scenario.
7.6.2 Evacuation Zone
Based on the evacuation of the buildings occupants from an evacuation zone the
differences between the lift evacuation times as a result of the different lift performance
variable are as follows:
7.6.2.1 Variable Speed
• At lower lift speeds the evacuation time calculated using the method developed by
Siikonen is in excess of the time calculated using ELVAC. However, at 16m/s the
evacuation time in accordance with Siikonen is less than the evacuation time
calculated using the ELVAC method. The average difference between the two
calculation methodologies for each evacuation zone at 10 storey intervals is 26%
based on a lift speed of 16m/s.
• The difference between the evacuation times calculated using the ELVAC and
Siikonen methodologies with those calculated using the Sekizawa method decrease
as a result of an increase in the lift speed.

167
7.6.2.2 Variable Acceleration
• The difference between the lift evacuation times calculated by ELVAC and the
Sekizawa method are approximately equal for both acceleration values for each
evacuation zone size.
7.6.2.3 Variable Capacity
• The difference between the evacuation times calculated using the ELVAC and
Siikonen methodologies as a result of an increase in the lift capacity is greater than
that from refuge floor levels.
7.6.2.4 Variable Lifts
• The difference between the evacuation times calculated in accordance with the
ELVAC and Siikonen methodologies is minimal for each variable number of lifts in a
group.
7.6.3 Summary
As demonstrated above, the evacuation time is dependent on the method of calculation
and the lift performance values used. Based on the above, the greatest variance between
results is provided between the variable lift speed assessments. This is considered to be the
result of the calculation of the travel time within each method, such that the difference in
results is greatest when high values are used for the lift speed.
7.7 Analysis of Results
Based on the results of the evacuation simulations discussed above, it has been
demonstrated that lift evacuation can evacuate the entire occupancy of a building in less
time than that required when using code compliant stairs required to facilitate phased
evacuation. As demonstrated by the results in this section, lift evacuation may be
facilitated for the entire occupancy of the buildings using the default values discussed in
Chapter 5. However, this will require a small separation distance between refuge floors or
evacuation zones.

168
To allow the provision of lift evacuation to be economically feasible it is noted that the
refuge floor separation distance should be as great as possible. Therefore, to allow an
increase in refuge floor or evacuation zone separation distance, it is necessary to
supplement lift evacuation with stair evacuation. Based on an equal distribution between
the lift and the stair, it is possible to provide lift evacuation which is 17.7% less than the
code compliant stair evacuation time for the whole building, when using the default lift
performance values in a building provided with refuge floor evacuation.
Whilst it is possible to provide lift evacuation in less time than the code compliant stair
evacuation time in a building provided without a refuge floor (i.e. from evacuation zones),
this requires an increase in the default lift performance specification required for the
refuge floor model.
On this basis, the optimum lift evacuation method is considered to be via refuge floors.
Due to the limited number of stops in a building provided with lift evacuation from a refuge
floor, the lift speed and acceleration are considered to have minimal impact on the total
building evacuation time. The most significant decrease in the lift evacuation times is
related to the number of lifts, which is dependent on the combined capacity of these lifts,
such that the total number of round trips is significantly reduced. The reduction in the
evacuation time associated with the reduced number of round trips significantly exceeds
that associated with a reduction in the round trip time achieved by an increased speed or
acceleration value.

169
8.0 CHAPTER 8 - CONCLUSIONS AND RECOMMENDATIONS
8.1 Comparison of Refuge Floors and Evacuation Zones
The results of the evacuation simulations have shown that, based on a relatively high floor
occupancy, all of the occupants of a high rise building in the U.K may be simultaneously
evacuated using lifts, faster than the time required using the number of stairs required to
meet the Building Regulations.
However, depending on the number and width of stairs required, the use of lifts as a means
of evacuation may provide a minimal reduction compared to the code compliant
evacuation (i.e. via stairs).
For example, in the theoretical building, 50 storeys may be evacuated in 67 minutes when
using the stairs (i.e. 7500 people / (1.4m wide stair x 1.33 p/m/s flow rate)). However, the
stair evacuation time may be reduced to less than the lift evacuation time by simply
increasing the width of the stair by an additional 200mm. Nevertheless, the resulting
evacuation time still requires occupants to queue for a prolonged time on their floor of
origin and within the stair.
Based on a relatively large occupancy of 150 persons per floor, as used in this study, a
maximum separation distance of 15 storeys between refuge floors is considered to be the
limit for the evacuation of the whole building occupancy, without increasing the lift
performance values to outside of those used in this study.
In order to permit a greater separation distance between refuge floor levels it is considered
necessary for a percentage of the occupants to evacuate via the stairs. However, the
assessment has shown that while the use of the lifts for evacuation by 75% of the building
occupancy reduces the overall evacuation time, there is a significant difference between
the evacuation times of those occupants using stairs with those using lifts, which may cause
increased anxiety in those occupants waiting for the lift to arrive.
However, based on the evacuation of approximately half of the buildings occupants by lifts
and half by stairs, it is noted that the whole building evacuation time is significantly
reduced. On this basis, it is considered reasonable to provide a maximum interval between

170
refuge floors and evacuation zones of 25 storeys based on the lift performance values used
as part of this study.
It is noted that during a number of simulations the occupants of the lowest floor level are
provided with a lift evacuation time that is in excess of those occupants using stairs. As can
be seen from the charts, the time at which lift evacuation becomes more effective than
evacuation by stairs may be taken at the point at which the lines intersect. It is noted that
some of the lines do not intersect within the boundaries of the assessment. On this basis it
is assumed that these intervals between refuge floors are not as effective as evacuation via
stairs only or, would require an extremely tall building before this method of evacuation
becomes effective.
To ensure that the most efficient strategy is implemented it is necessary to increase the
separation distance between the discharge floor and the lowest evacuated floor, such that
the occupants of the lowest floor do not queue for longer than the equivalent code
compliant evacuation time.
The evacuation of occupants from an evacuation zone (i.e. where occupants are evacuated
from their own floor level) requires additional time compared to that from a refuge floor.
This is considered to the result of a number of factors, which includes:
• Increase in the travel distance to higher floors within the refuge zone,
• Increase in the number of trips without a full occupancy
The travel distance of a lift serving an evacuation zone is considered to effect the total
evacuation time on the basis that the total distance travelled by the lift is in excess of that
of a lift serving a refuge floor, due to the incremental increase in the height of the floors
served in the evacuation zone, which increases the time for evacuation, compared to
evacuation from a refuge floor.
The use of a lift to evacuate a single floor level, before moving up to serve the next floor,
creates an increase in the number of trips which are not full to capacity and therefore,
increase the total number of round trips required to evacuate the building, compared to a
lift serving a refuge floor, which is required to make one trip which is not at full capacity
(i.e. final trip).

171
However, it is noted that work carried out by Siikonen and Hakonen[33]
on a simulated 20
storey building, with a significantly lower occupancy (60 persons per floor), showed very
little difference in the time taken to evacuate the building using the refuge floor and
evacuation zone methods. However, this difference is considered to be the result of the
small amount of time taken for the evacuation due to the lower number of occupants per
floor, and the number of floors, such that the number of round trips and maximum travel
distances between methods is significantly less.
It is not considered unreasonable to directly compare the evacuation times from a refuge
floor with those of an evacuation zone in this study, based on an identical separation
distance. Whilst the refuge floor level is at the lowest floor level of the zone of floors it
serves, it is considered reasonable to directly compare the evacuation time to that of an
evacuation zone on the basis that this method of evacuation serves a similar number of
occupants, with the exception that the refuge floor method does not include occupants on
the refuge floor.
The evacuation time from an evacuation zone may be considered as the total evacuation
time, compared to that from a refuge floor, which does not take into account the time for
occupants to reach the refuge floor. However, based on the small additional increase in the
overall evacuation time from a refuge floor, due to the requirements for the first occupants
to reach the refuge floor to travel a single flight of stairs, it is considered reasonable to
directly compare the evacuation strategies.
8.2 Calculation Methods
8.2.1 Stair Evacuation
The results of the stair evacuation calculations demonstrate that evacuation times
calculated using the method by Pauls[38]
and the stair flow rates used in Approved
Document B are very similar.
However, this is considered to be a result that neither the method detail by Pauls or the
Approved Document B flow rates take into account the effective width of the stair, as
required when calculating the evacuation times using the method described by Nelson and
Mowrer[3]
. Therefore, based on a reduced stair width (approximately 17% smaller) to take

172
into account the effective width and a lower building flow rate, the difference in the
evacuation time between these methods and Nelson and Mowrer is significant.
Whilst it is not proposed to review the basis of the flow rates and calculation procedures
for each method as part of this study, the correlation of the evacuation times using Pauls
method with empirical results is considered to provide suitable validation of the results,
when compared to the Approved Document B evacuation times.
Based on the close correlation of the Pauls method with those achieved in accordance with
Approved Document B, it is considered reasonable to compare the lift evacuation times to
the stair evacuation times determined on the stair flow rate of Approved Document B only.
8.2.2 Lift Evacuation
The evacuation times calculated using the Siikonen and ELVAC method are very similar
based on a 10 storey separation distance between refuge floors.
The difference between these methods increases significantly based on an increase in the
lift velocity and the separation distance between floor levels, such that the lift evacuation
time from the 25th
refuge floor level by a lift with a rated speed of 16m/s using the ELVAC
calculation procedure is 40% longer than the evacuation time calculated using the Siikonen
methodology. This is considered to be a result of the calculation for the delays due to
acceleration and deceleration, within the Siikonen method.
Whilst the approximate value of 10 seconds for the delays associated with acceleration and
deceleration is considered to be reasonable for the lower lift speeds, the delays associated
with a lift with a rated speed of 16m/s and a rate of acceleration equal to 1.2m/s2 increases
significantly, such that the calculated evacuation time is significantly lower for the Siikonen
method. However, the additional time associated with this delay has been included for
within the evacuation calculator discussed in Appendix A to the nearest second, such that
the evacuation time using the adapted Siikonen method is considered to be more
conservative.
The difference between the lift evacuation times calculated using the calculation method
detailed by Sekizawa and that by Siikonen also decreases based on an increase in the lift
173
speed and lift capacity. This is considered to be the result of the Sekizawa calculation taking
into account the delays associated with acceleration and deceleration. However, due to the
large variance in evacuation times remaining between these methods, it is not proposed to
use this method of calculation.
8.3 Application of Lift Evacuation Strategy
Whilst the above assessment has shown that the evacuation time from a building may be
reduced based on the provision of lift evacuation or combined lift and stair evacuation, it is
considered necessary to assess how the most effective lift evacuation strategy will be
applied.
Based on the findings of this study, the most important factor is considered to be the
method of determining which occupants are expected to use the stair and which occupants
are expected to evacuate via the lifts. An important factor in determining the number of
occupants able to escape via the lifts without significantly increasing the evacuation time is
considered to be the lift specification. For example, the evacuation calculations have shown
that, based on the use of the default values, occupants of the lower refuge floor are
generally able to evacuate in a shorter time by using the stairs.
Therefore, the most effective evacuation strategy may be considered to be only those
occupants of the lowest refuge floor level, who are not able to negotiate stairs, evacuate
via lifts while the remaining occupants evacuate via the stairs.
However, this uneven use of the stairs for evacuation could reduce the stair flow rate due
to the increased numbers of occupants at the lower floor levels merging with the
occupants of the upper floor levels descending the stairs and therefore, actually increase
the stair evacuation time, slightly.
Nevertheless, based on a decrease in the number of occupants evacuating from the lower
refuge floor level it may be reasonable to provide fewer lift cars serving this floor level and
therefore, increase the number of cars serving the upper refuge floors. On this basis, the
decrease in the stair flow rate is considered to have less of an impact on the evacuation
time on the basis that more occupants of the upper floor level may evacuate via the lifts.
However, an enhanced scenario such as this would require additional assessment to

174
determine the impact of the additional number of occupants of the lower floor level using
the undersized stairs.
It is considered that the method of evacuation of building occupants would be determined
as part of the design strategy. However, this may be altered by the fire safety manager as
required. The most effective strategy is considered to locate those occupants who require
the lift to evacuate, such as those occupants in wheelchairs, on lower floors levels, where
the number of occupants using the lifts is likely to be less than those levels above and
therefore, are unlikely to increase the overall lift evacuation time by increasing the number
of round trips required.
8.4 Conclusion
Based on the above observations, the following summary can be made with regards to lift
evacuation:
1) Evacuation from refuge floors is approximately 25% quicker than that from an
evacuation zone.
2) Based on a refuge floor interval of 10 storeys, the evacuation time from the whole
building is approximately equal for lift and stair evacuation (time for lift evacuation
is 2% faster), when using the default values. Once the number of storeys between
refuge floor levels increases, the evacuation time by stairs is significantly less than
via lifts, with evacuation from the lower refuge floors being significantly quicker by
stairs. However, evacuation using eight, 12 person lift cars, or four 21 person lift
cars is more efficient than stairs. On this basis, it is considered necessary to provide
refuge floors at small intervals based on an approximate occupancy of 150 persons
per floor level, where all of the building occupants are assumed to evacuate via the
lifts. Refuge floor separation distances and evacuation zone sizes may be increased
based on a lower occupancy or increased lift performance values.
3) The most effective evacuation time is for an increased number of lift shafts. This is
considered to be a result of the number of round trips required for eight lift cars
with a capacity of 12 persons (29 round trips per lift) compared to that of four lifts
with a capacity of 21 persons (32 round trips per lift).
175
4) Based on a reduction in the number of occupants using the lifts by half, allows
refuge floors and evacuation zone to be provided which serve 25 storeys, without
the requirement for unfeasible numbers of lifts shafts or lift car capacities.
5) A reduction in the number of occupants using the lifts, results in an approximate
reduction of the overall evacuation time by an equal percentage. In the event that
25% of the building occupants use the stairs, the evacuation time is considered to
be faster for those occupants using the stairs, irrespective of the increased lift
performance values used as part of the study. This is considered to be a result of
the disproportionate numbers of occupants using the lifts compared to those using
the stairs. However, based on the occupants evenly distributing between the stairs
and the lifts, the lift and associated stair evacuation times are approximately equal
(stairs are 0.4% faster) for the default lift performance values at a 10 storey
separation distance. The reduction in the lift evacuation times follows the same
trends as those when 100% of the occupants use the lifts to escape.
6) Based on the application of evacuation zones, the associated stair evacuation time
is approximately 4.5% less than the lift evacuation time, for 10 storey evacuation
zones, when the default values are applied. The difference in times is considered to
be the result of greater lift evacuation times due to the increased distance travelled
serving each floor within the evacuation zone. The difference in evacuation times
between these methods increases with refuge floor and evacuation zone
separation distances.
7) Based on a comparison of the lift evacuation times with the code compliant stair
evacuation times, it is has been demonstrated that it is possible to provide lift
evacuation up to 25 storey intervals in less time than the code complaint stair
evacuation time, based on the use of the default values provided in Chapter 5.
8) The assessment detailed in Chapter 7 is considered to provide a conservative
assessment as this does not take into account the increase in stair evacuation times
associated with occupant fatigue as they descend multiple flights of stairs.
Therefore, the stair evacuation times are considered to be lower than those likely
to be achieved in real life evacuations.

176
9) Based on the review and results contained within this thesis, it is recommended
that any further research into lift evacuation reviews the impact of inefficient
round trips on the evacuation time, for evacuation from a refuge floor and an
evacuation zone, to determine the effect of disabled occupants and poor
management of the lift loading, on the total evacuation time for the building.

177
9.0 REFERENCES
[1] Approved Document B 2006, Communities and Local Government.
[2] Pauls J, Lifts and stairs for evacuation: comparisons and combinations, ASME
Conference, 2003.
[3] Nelson and Mowrer, Emergency Movement, The SPFE Handbook of Fire Protection
Engineering, 2nd
ed, SFPE.
[4] Kinsey M.J, Galea E.R, Lawrence P.J, Investigating the use of lifts for high rise building
evacuation through computer simulation, Proceedings of Human behaviour in fire
symposium, 2009, pp 85-96.
[5] Lane B, Lamont S, Arup Fire’s presentation regarding tall buildings and the events of
9/11, London, 2005.
[6] Code of Practise For the Provision of Means of Escape in Case of Fire, Building Authority,
1996, Hong Kong.
[7] Murphy S, The human factor, NFPA Journal, pp 54-60, Sept/Oct 2002, NFPA, USA.
[8] Galea E.R, Lawrence P.J, Blake S.J, Gwynne S, Westeng H, A preliminary investigation of
the evacuation of the WTC North Tower using computer simulation, 3rd
International
Symposium on Human Behaviour in Fire, Belfast, 2004, Interscience Communications.
[9] Charters D, Fraser-Mitchell J, Guidance on the use of lifts or escalators for evacuation
and fire and rescue service operations, BD 2466, 2009.
[10] Proulx, G, Movement of people; The evacuation timing, SFPE Handbook, 3rd
Ed, Society
of Fire Protection Engineers.
[11] Pauls J, Suggestions on evacuation models and research questions, 3rd
International
Symposium on Human Behaviour in Fire, Belfast, 2004, Interscience Communications.
[12] Pauls J, Management and movement of building occupants in emergencies,
Conference on designing to survive severe hazards, 1977.
[13] Smith D, Lifts could be used for evacuation during emergencies! Fact or Fiction, ASME
Conference, 2003.
[14]Kuligowski E, Elevators for occupant evacuation and fire department access,
Proceedings of the CIB-CTBUH International Conference on Tall Buildings, 2003.
[15] Quiter, J.R, An application of performance based concepts at the Stratosphere Tower,
Fire Risk and Hazard Assessment Symposium. Research and Practice: Bridging the Gap.
Proceedings. National Fire Protection Research Foundation, 1996, pp 118-126.
[16] Ariff A, Review of the evacuation procedures for the Petronas Twin Towers,
Proceedings of the CIB-CTBUH International Conference on Tall Buildings, 2003.

178
[17] Bukowski R, Getting out quickly, Building Control Journal, April 2008.
[18] Bazjanac V, Simulation of lift performance in high-rise buildings under conditions of
emergency, Human Response to Tall Buildings, pp 316-328, 1977.
[19] Klote J H, Alvord D.M, Levin B.M, Groner N.E, Feasibility and design considerations of
emergency evacuation by lifts, NISTR 4870, 1992.
[20] Klote J.H, Levin B.M, Groner N.E, Emergency lift evacuation systems, Lifts, Fire and
Accessibility, Proceedings of the 2nd
symposium, Pp 131-149, ASME, 1995.
[21] BS 5588 Part 5, Fire precautions in the design, construction and use of buildings — Part
5: Access and facilities for fire-fighting, 2004, BSI, London.
[22] Proulx G, Evacuation by lifts: Who goes first?, NIST/ASME conference “On the use of
lifts in fires and other emergencies”, 2004.
[23] BS EN 81 73, Safety rules for the construction and installation of lifts — Particular
applications for passenger and goods passenger lifts — Part 73: Behaviour of lifts in the
event of fire, 2005, BSI, London.
[24] Stroup D.W, Literature review on enclosure of lift lobbies, NISTIR 6973, NIST, 2003.
[25] Taylor R, Belle Tower, Fire Prevention and Fire Engineers Journal, pp 25 – 28, March
2007.
[26] Lay S, Alternative evacuation design solutions for high rise buildings, CTBUH 8th
World
Congress, 2008.
[27] Bashford J, CIBSE Guide D, Transportation systems in buildings, CIBSE.
[28] Groner N.E, Levin B.M, Human factors considerations in the potential for using lifts in
building emergency evacuation plans, NIST-GCR-92-615, National Institute of Standards and
Technology, 1992.
[29] Barlund K, Kattaninen A, Makela M, Siikonen M, Evacuation mode for total building
evacuation, CTBUH 8th
World Congress, 2008.
[30]Mizuguchi H, Nakagawa T, Fujita Y, Breaking the 1000MPM barrier, Lift World,
September 2005.
[31] Fortune J W, Mega high rise lifts, Lift World, 7 January 1995.
[32] Fortune J W, Modern double deck lift applications, pp 63 – 69, Lift World, August 1996.
[33] Siikonen M. L and Hakonen H, Efficient evacuation methods in tall buildings, Lift World,
July 2003, pp 78-83.
[34] Johnson C.W, Lessons from the evacuation of the Word Trade Centre, September 11th
2001 for the development of computer based simulations, Glasgow accident analysis
group, University of Glasgow.

179
[35] Heyes E, The use of lifts for egress discussion panel, Proceedings of Human behaviour
in fire symposium, 2009, pp 97-110.
[36] Fahy R F, Proulx G, Federal Building and Fire Safety Investigation of the World Trade
Centre Disaster, Analysis of published accounts of the World Trade Centre Evacuation, NIST
NCSTAR 1-7A, NIST, 2005.
[37] Post War Building Studies No. 29, Fire Grading of Buildings, Part III – Personal Safety,
HMSO, 1952.
[38] PD 7974-6, The application of fire safety engineering principles to fire safety design of
buildings —Part 6: Human factors: Life safety strategies — Occupant evacuation, behaviour
and condition, 2004, BSI, London.
[39] Bukowski R W, Emergency egress from ultra tall buildings, CTBUH 8th
World Congress,
2008.
[40] Siikonen M L, Barlund K, Kontturi R, Transportation design for building evacuation,
ASME 2003.
[41] Hakonen H, Susi T, Siikonen M. L, Evacuation simulation of tall buildings, Proceedings
of the CIB-CTBUH International Conference on Tall Buildings, 20 – 23 Oct 2003, pp 219 –
226.
[42] Sekizawa A, Nakahama S, Notake H, Ebihara M, Ikehata Y, Study on feasibility of
evacuation by lifts in a high rise building: Case study for the evacuation in the Hiroshima
Motomachi High-rise apartments, Second International Symposium on Human Behaviour in
fire: Understanding human behaviour for better fire safety design, 2001.
[43] Sekizawa A, Nakahama S, Notake H, Ebihara M, Ikehata Y, Study on feasibility of
evacuation using lifts in a high rise building: Is use of lift in evacuation really effective for
general people?, American Society of Mechanical Engineers, 2003.
[44] Klote J. H, A method for calculation of lift evacuation time, Journal of Fire Protection
Engineering, 5(3), 1993, pp 83 – 95.
[45] Kugligowski E. D, The evaluation of a performance based design process for a hotel
building: the comparison of two egress models, Master of Science Thesis, University of
Maryland, 2003.
[46] Wall J.M, Waterson N.P, STEPS validation with NFPA 130, Mott MacDonald.
[47] Lord J, Meacham B, Moore A, Fahy R, Proulx G, Guide for evaluating the predictive
capabilities of computer egress models, NIST GCR 06-886, National Institute of Standards
and Technology, 2005.
[48] Caporale R.S, ELEVATE traffic analysis software (eliminating the quesswork), Lift World,
June 2000, 118-21.

180
[49] Personal correspondence, Mike O’Leary, Hoare Lea Vertical Transport, 23 July 2009.
[50] Wong K.H.L, Hui M.C, Guo, D.G, Luo, M.C, A refined concept on emergency evacuation
by lifts, Fire Safety science, Proceedings of the 8th
International symposium, 2005.
[51] Strakosch G, Vertical transportation: lifts and escalators, Chapter 2, 1967 ed, John
Wiley.
[52] Fraser-Mitchell J, Evaluation of evacuation using lifts and escalators, BRE Conference
2007.
[53] So A.T.P,Lai T.T.M, Yu J.K.L, On the development of emergency escape lifts,
Proceedings of ELEVCON 2002, Milan.
[54] Galea E R, Sharp G, Lawrence P J, Holden R, Approximating the evacuation of the
World Trade Centre North Tower using computer simulation, Journal of Fire Protection
Engineering, Vol 18, 2008, SFPE.
[55] Personal correspondence, Eric Pellissier, Mott MacDonald, 14 July 2010.

181
APPENDIX A - EVACUATION CALCULATOR
As discussed in this study, it is not considered possible to determine at what point the use
of lifts for evacuation is more efficient than the use of stairs, without conducting multiple
iterations of the calculations listed in Section 3.2 and 3.3.
Therefore, Visual Basic has been used to create a spreadsheet that allows the user to assess
the evacuation of a building using lifts for both methods assessed in this study (i.e. refuge
floors and evacuation zones), with the code compliant stair evacuation time.
This comparative method of assessment allows the user to determine if the proposed
design provides an escape time which is no worse than a code compliant design.
Stair Evacuation Time
The stair evacuation times are calculated based on the code compliant 1.33
persons/metre/second flow rate used in Approved Document B[1]
. This allows the user to
compare the lift evacuation times against the code complaint evacuation time (i.e. use of
stairs only).
Lift Evacuation Time
Whilst it is noted that the lift evacuation times which are considered to be most accurate
are those generated by the ELVAC programme, it is not considered possible to integrate the
results from this programme into the spread sheet. Therefore, based on the similarity of
results between this method and the method described by Siikonen, the lift evacuation
time has been calculated using the Siikonen method, as listed in Section 3.3.2.
However, based on the use of Visual Basic, the calculation has been modified to include an
accurate value for the delay associated with acceleration and deceleration, to within the
nearest second, to allow a more accurate comparison between results.
For example, a lift which is travelling at a speed of 6m/s with a deceleration value of
1.2m/s2 will require 5 seconds to decelerate and will have travelled a total distance of 12m
during deceleration. However, a lift travelling at constant speed will have travelled this

182
distance in 2 seconds. Therefore, the difference between the two methods is equal to 10
seconds. Based on the assumption that the lift is required to accelerate and decelerate
once for each one way trip twice for each round trip, the total delay due to acceleration
and deceleration for each round trip is equal to 40 seconds.
Based on the inclusion of these delays in the revised calculation method of the evacuation
round trip, it is considered that more accurate evacuation times will be calculated, which
closely follow the results produced using the ELVAC programme, compared to those used
in this study.
Spread Sheet Inputs
The spread sheet requires the following values to be provided to allow a comparison to be
made between lift and stair evacuation.
• Number of floor levels above Ground
• Occupancy per floor level
• Floor to floor height (m)
• Number of stairs
• Width of stairs (m)
• Number of lifts
• Capacity of lifts (persons)
• Lift speed (m/s)
• Lift acceleration (m/s2)
• Evacuation method (refuge floor or evacuation zone)
• Number of storeys per zone
• Highest refuge floor level (m)
Spread Sheet Output
Based on the provision of the above inputs the spreadsheet will display the evacuation
time from each floor level (for evacuation zone) or the evacuation time from each refuge
floor level, as well as provide the information in graphs for comparison.
A screen shot of the spread sheet is shown in the Figure below.

183
Figure A.1 - Screen snapshot of evacuation calculation spreadsheet
Validation
The revised Siikonen calculation process includes a more accurate calculation of the delays
associated with acceleration and deceleration rather than the default value of 10 seconds
assumed within the assessment detailed in Chapter 7.
On this basis, it is proposed to assess the difference using both methods and compare the
evacuation times for each of the studied lift speeds, at each separation distance, for both
evacuation methods. The results of the assessment are shown in the Table below, along
with the percentage difference between the modified calculation and that using the default
delay value of 10 seconds.

184
Evacuation
zone size
Refuge
floor
level
Refuge floors Evacuation Zone
Default
value
Modified
calculation
%
difference
Default
value
Modified
calculation
%
difference
10 10 24.2 23.2 -4.13 38.1 36.8 -3.41
20 31.9 30.9 -3.13 48.8 47.5 -2.66
30 39.6 38.7 -2.27 59.5 58.1 -2.35
40 47.4 46.4 -2.1 77.7 76.3 -1.8
15 5 30.8 29.3 -4.87 53.2 51.2 -3.76
20 48.4 46.9 -3.1 77.2 75.2 -2.59
35 66 64.5 -2.27 108.8 106.7 -1.93
20 10 50 48 -4 86.9 84.3 -2.99
30 82 80 -2.4 137.2 134.4 -2.04
25 25 92.5 90 -2.7 162.9 160 -1.78
Table A.1 – Comparative assessment of Siikonen calculation methods @ 5 m/s
Evacuation
zone size
Refuge
floor
level
Refuge floors Evacuation Zone
Default
value
Modified
calculation
%
difference
Default
value
Modified
calculation
%
difference
10 10 22.9 21.9 4.37 35.6 34.2 -3.93
20 29.3 28.4 3.07 44.4 43.1 -2.93
30 35.8 34.8 2.79 53.3 52 -2.44
40 42.2 41.2 2.37 68.9 67.5 -2.03
15 5 29.8 28.4 4.7 50 48 -4
20 44.5 43 3.37 70 68 -2.86
35 59.2 57.7 2.53 96.7 94.6 -2.17
20 10 47.3 45.3 4.23 80 77.3 -3.38
30 74 72 2.7 122.3 119.5 -2.29
25 25 84.2 81.7 2.97 145.6 142.1 -2.4
Table A.2 – Comparative assessment of Siikonen calculation methods @ 6 m/s

185
Evacuation
zone size
Refuge
floor
level
Refuge floors Evacuation Zone
Default
value
Modified
calculation
%
difference
Default
value
Modified
calculation
%
difference
10 10 22 22.9 4.09 33.7 35 3.86
20 27.5 28.4 3.27 41.3 42.7 3.39
30 33 34 3.03 49 50.3 2.65
40 38.5 39.5 2.6 62.6 64.1 2.4
15 5 29.1 30.6 5.15 47.7 49.7 4.19
20 41.7 43.2 3.6 64.9 66.9 3.08
35 54.3 55.7 2.58 88.1 90.2 2.38
20 10 45.4 47.4 4.4 75 77.7 3.6
30 68.3 70.3 2.93 111.6 114.4 2.5
25 25 78.2 80.7 3.2 133.2 136.7 2.63
Table A.3 – Comparative assessment of Siikonen calculation methods @ 7 m/s
Evacuation
zone size
Refuge
floor
level
Refuge floors Evacuation Zone
Default
value
Modified
calculation
%
difference
Default
value
Modified
calculation
%
difference
10 10 18.9 29.5 56.08 27.5 42.2 53.45
20 21.3 31.9 49.77 30.8 45.5 47.47
30 23.7 34.3 44.7 34.2 48.8 42.69
40 26.1 36.7 52.1 41.4 57.6 39.13
15 5 26.8 42.9 60 40 62 55
20 32.3 48.4 49.84 47.5 69.5 46.32
35 37.8 53.9 42.59 58.9 82.4 39.9
20 10 39 61 56.4 58.3 87.7 50.43
30 49 71 44.9 75.6 106.4 40.74
25 25 58.1 85.6 47.3 91.4 129.6 41.73
Table A.4 – Comparative assessment of Siikonen calculation methods @ 16 m/s
Summary
It is noted from Table A.1 to A.3 that the calculated evacuation time is +/- 5% of that when
using the default delay value of 10 seconds for lift speeds within the recommended limits
of CIBSE Guide D[27]
and
Fortune[31]
. Based on the conservative nature of these lift
evacuation times when compared to the equivalent evacuation time via stairs, it is
considered reasonable to apply the values of this assessment for lift evacuation studies to
proposed lift evacuation systems within the limits recommended in CIBSE Guide D[27]
and
Fortune[31]
.

186
However, it is noted that once the lift speed exceeds those values recommended within
CIBSE Guide D and Fortune[31]
, the percentage difference between the evacuation times is
significantly greater (39% - 53% greater).
Nevertheless, this is considered to be reasonable for evacuation from a refuge floor on the
basis that the resulting evacuation times are less than those calculated using the more
accurate ELVAC model and are therefore considered to be slightly more onerous. However,
caution is recommended for the use of this programme when calculating the evacuation
times for evacuation from within an evacuation zone, as these times slightly exceed the
values calculated using ELVAC.
A comparison of the evacuation times for a lift with a speed of 16 m/s, calculated using the
modified Siikonen equation are shown in comparison to the evacuation times calculated
using ELVAC.
Evacuation
zone size
Refuge
floor
level
Refuge floors Evacuation Zone
ELVAC Modified
calculation
%
difference
ELVAC Modified
calculation
%
difference
10 10 24.9 29.5 18.47 37.1 42.2 13.75
20 35.3 31.9 -9.63 42.2 45.5 7.82
30 39.2 34.3 -12.5 46.3 48.8 5.4
40 42.5 36.7 -13.65 55.1 57.6 5.54
15 5 41.1 42.9 4.38 52.7 62 17.64
20 54.3 48.4 -10.87 64.5 69.5 7.75
35 63 53.9 -14.44 78.3 82.4 5.24
20 10 63.4 61 -3.79 78.5 87.7 11.72
30 88.7 71 -19.95 100.6 106.4 5.77
25 25 98 85.6 -12.65 121.9 129.6 6.32
Table A.5 – Comparison of evacuation times using modified Siikonen equation and ELVAC
for lifts with a speed of 16 m/s
Based on the difference in evacuation times from the higher evacuation zones
(approximately 5%), which is the determining factor in the total building evacuation time,
this is considered to be reasonable for an initial assessment tool. However, once the

187
evacuation method and lift performance values are determined more detailed analysis
should be undertaken using a more accurate simulation tool such as ELVAC or STEPS.

188
APPENDIX B – EVACUATION TIME USING REFUGE FLOORS (100% LIFT USAGE)

189
10 Storey Intervals – Variable Speed
Evacuation Time (5m/s)
0
20
40
60
80
100
10 20 30 40
Refuge floor Level
Tim
e (mins)
ELVAC
Siikonen
Sekizawa
Nelson +Mowrer
AD-B
Pauls
Evacuation Time (6m/s)
0
20
40
60
80
100
10 20 30 40
Refuge Floor Level
Tim
e (mins)
ELVAC
Siikonen
Sekizawa
Nelson +Mowrer
AD-B
Pauls
Evacuation Time (7m/s)
0
20
40
60
80
100
10 20 30 40
Refuge Floor Level
Tim
e (mins)
ELVAC
Siikonen
Sekizawa
Nelson +Mowrer
AD-B
Pauls
Evacuation Time (16m/s)
0
20
40
60
80
100
10 20 30 40
Refuge Floor Level
Tim
e (mins)
ELVAC
Siikonen
Sekizawa
Nelson + Mowrer
AD-B
Pauls

190
10 Storey Intervals – Variable Acceleration
10 Storey Intervals – Variable Capacity
Evacuation Time (1.2m/s2)
0
20
40
60
80
100
1 2 3 4
Refuge Floor Level
Tim
e (mins)
ELVAC
Sekizawa
Nelson + Mowrer
AD-B
Pauls
Evacuation Time (1.5m/s2)
0
20
40
60
80
100
1 2 3 4
Refuge Floor Leve;
Tim
e (mins)
ELVAC
Sekizawa
Nelson +Mowrer
AD-B
Pauls
Evacuation Time (12 persons)
0
20
40
60
80
100
10 20 30 40
Refuge Floor Level
Tim
e (mins)
ELVAC
Siikonen
Sekizawa
Nelson + Mowrer
AD-B
Pauls
Evacuation Time (10 persons)
0
20
40
60
80
100
10 20 30 40
Refuge Floor Level
Tim
e (mins)
ELVAC
Siikonen
Sekizawa
Nelson + Mowrer
AD-B
Pauls

191
10 Storey Intervals – Variable Lifts
Evacuation Time (16 persons)
0
20
40
60
80
100
10 20 30 40
Refuge Floor Level
Tim
e (mins)
ELVAC
Siikonen
Sekizawa
Nelson + Mowrer
AD-B
Pauls
Evacuation Time (21 persons)
0
20
40
60
80
100
10 20 30 40
Refuge Floor Level
Tim
e (mins)
ELVAC
Siikonen
Sekizawa
Nelson + Mowrer
AD-B
Pauls
Evacuation Time (4 Lifts)
0
20
40
60
80
100
10 20 30 40
Refuge Floor Level
Tim
e (mins)
ELVAC
Siikonen
Sekizawa
Nelson +Mowrer
AD-B
Pauls
Evacuation Time (6 Lifts)
0
20
40
60
80
100
10 20 30 40
Refuge Floor Level
Tim
e (mins)
ELVAC
Siikonen
Sekizawa
Nelson +Mowrer
AD-B
Pauls

192
15 Storey Intervals – Variable Speed
Evacuation Time (8 Lifts)
0
20
40
60
80
100
10 20 30 40
Refuge Floor Level
Tim
e (mins)
ELVAC
Siikonen
Sekizawa
Nelson +Mowrer
AD-B
Pauls
Evacuation Time (5m/s)
0
20
40
60
80
100
5 20 35
Refuge Floor Level
Tim
e (mins)
ELVAC
Siikonen
Sekazawa
Nelson + Mowrer
AD-B
Pauls
Evacuation Time (6m/s)
0
20
40
60
80
5 20 35
Refuge Floor Level
Tim
e (mins)
ELVAC
Siikonen
Sekazawa
Nelson + Mowrer
AD-B
Pauls

193
15 Storey Intervals – Variable Acceleration
Evacuation Time (7m/s)
0
20
40
60
80
5 20 35
Refuge Floor Level
Tim
e (mins)
ELVAC
Siikonen
Sekazawa
Nelson + Mowrer
AD-B
Pauls
Evacuation Time (16m/s)
0
20
40
60
80
5 20 35
Refuge Floor Level
Tim
e (mins)
ELVAC
Siikonen
Sekazawa
Nelson + Mowrer
AD-B
Pauls
Evacuation Time (1.2m/s2)
0
20
40
60
80
5 20 35
Refuge Floor Level
Tim
e (mins)
ELVAC
Sekazawa
Nelson + Mowrer
AD-B
Pauls
Evacuation Time (1.5m/s2)
0
20
40
60
80
5 20 35
Refuge Floor Level
Tim
e (mins)
ELVAC
Sekazawa
Nelson + Mowrer
AD-B
Pauls

194
15 Storey Intervals – Variable Capacity
Evacuation Time (10 persons)
0
20
40
60
80
100
5 20 35
Refuge Floor Level
Tim
e (mins)
ELVAC
Siikonen
Sekazawa
Nelson + Mowrer
AD-B
Pauls
Evacuation Time (12 persons)
0
20
40
60
80
5 20 35
Refuge Floor Level
Tim
e (mins)
ELVAC
Siikonen
Sekazawa
Nelson + Mowrer
AD-B
Pauls
Evacuation Time (21 persons)
0
20
40
60
80
5 20 35
Refuge Floor Level
Tim
e (mins)
ELVAC
Siikonen
Sekazawa
Nelson + Mowrer
AD-B
Pauls
Evacuation Time (16 persons)
0
20
40
60
80
5 20 35
Refuge Floor Level
Tim
e (mins)
ELVAC
Siikonen
Sekazawa
Nelson +Mowrer
AD-B
Pauls

195
15 Storey Intervals – Variable Lifts
Evacuation Time (4 Lifts)
0
20
40
60
80
5 20 35
Refuge Floor Level
Tim
e (mins)
ELVAC
Siikonen
Sekazawa
Nelson + Mowrer
AD-B
Pauls
Evacuation Time (6 Lifts)
0
20
40
60
80
5 20 35
Refuge Floor Level
Tim
e (mins)
ELVAC
Siikonen
Sekazawa
Nelson + Mowrer
AD-B
Pauls
Evacuation Time (8 Lifts)
0
20
40
60
80
5 20 35
Refuge Floor Level
Tim
e (mins)
ELVAC
Siikonen
Sekazawa
Nelson + Mowrer
AD-B
Pauls

196
20 Storey Intervals – Variable Speed
Evacuation Time (5m/s)
0
20
40
60
80
100
120
10 30
Refuge Floor Level
Tim
e (mins)
ELVAC
Siikonen
Sekazawa
Nelson + Mowrer
AD-B
Pauls
Evacuation Time (6m/s)
0
20
40
60
80
100
10 30
Refuge Floor Level
Tim
e (mins)
ELVAC
Siikonen
Sekazawa
Nelson + Mowrer
AD-B
Pauls
Evacuation Time (7m/s)
0
20
40
60
80
100
10 30
Refuge Floor Level
Tim
e (mins)
ELVAC
Siikonen
Sekazawa
Nelson + Mowrer
AD-B
Pauls
Evacuation Time (16m/s)
0
20
40
60
80
100
10 30
Refuge Floor Level
Tim
e (mins)
ELVAC
Siikonen
Sekazawa
Nelson + Mowrer
AD-B
Pauls

197
20 Storey Intervals – Variable Acceleration
20 Storey Intervals – Variable Capacity
Evacuation Time (12 persons)
0
20
40
60
80
100
10 30
Refuge Floor Level
Tim
e (mins)
ELVAC
Siikonen
Sekazawa
Nelson + Mowrer
AD-B
Pauls
Evacuation Time (1.2m/s2)
0
20
40
60
80
100
10 30
Refuge Floor Level
Tim
e (mins)
ELVAC
Sekazawa
Nelson +Mowrer
AD-B
Pauls
Evacuation Time (1.5m/s2)
0
20
40
60
80
100
10 30
Refuge Floor Level
Tim
e (mins)
ELVAC
Sekazawa
Nelson +Mowrer
AD-B
Pauls
Evacuation Time (10 persons)
0
20
40
60
80
100
120
10 30
Refuge Floor Level
Tim
e (mins)
ELVAC
Siikonen
Sekazawa
Nelson + Mowrer
AD-B
Pauls

198
20 Storey Intervals – Variable Capacity
Evacuation Time (16 persons)
0
20
40
60
80
10 30
Refuge Floor Level
Tim
e (mins)
ELVAC
Siikonen
Sekazawa
Nelson +Mowrer
AD-B
Pauls
Evacuation Time (21 persons)
0
10
20
30
40
50
60
70
10 30
Refuge Floor Level
Tim
e (mins)
ELVAC
Siikonen
Sekazawa
Nelson + Mowrer
AD-B
Pauls
Evacuation Time (4 Lifts)
0
20
40
60
80
100
10 30
Refuge Floor Level
Tim
e (mins)
ELVAC
Siikonen
Sekazawa
Nelson +Mowrer
AD-B
Pauls
Evacuation Time (6 Lifts)
0
10
20
30
40
50
60
70
10 30
Refuge Floor Level
Tim
e (mins)
ELVAC
Siikonen
Sekazawa
Nelson +Mowrer
AD-B
Pauls

199
25 Storey Intervals – Variable Speed
Evacuation Time (8 Lifts)
0
10
20
30
40
50
60
70
10 30
Refuge Floor Level
Tim
e (mins)
ELVAC
Siikonen
Sekazawa
Nelson +Mowrer
AD-B
Pauls
Evacuation Time (5m/s)
114.792.5
60.4 51.532.5 34.9
020406080100120140
ELVAC
Siikonen
Sekizawa
Nelson +
Mowrer
AD-B
Pauls
Calculation Method
Tim
e (mins)
Evacuation Time (6m/s)
107.9
84.2
54.2 51.532.5 34.9
0204060
80100120
ELVAC
Siikonen
Sekizawa
Nelson +
Mowrer
AD-B
Pauls
Calculation Method
Tim
e (mins)
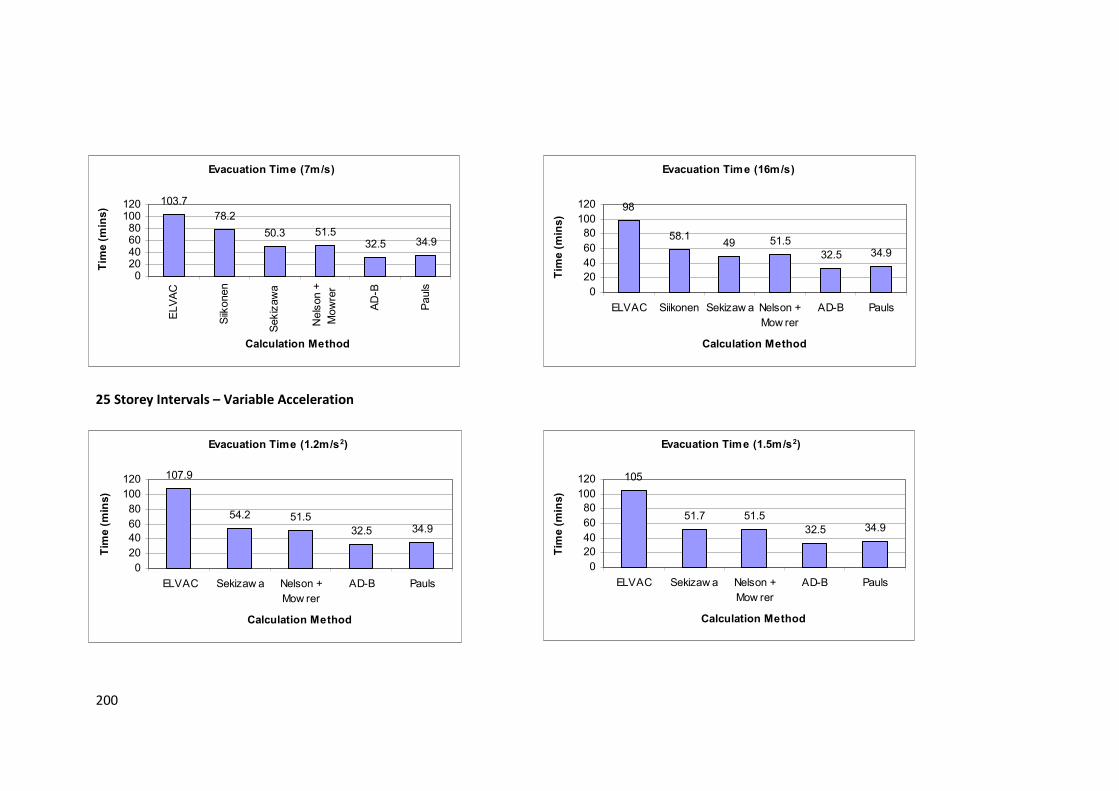
200
25 Storey Intervals – Variable Acceleration
Evacuation Time (7m/s)
103.7
78.2
50.3 51.532.5 34.9
020406080100120
ELVAC
Siikonen
Sekizawa
Nelson +
Mowrer
AD-B
Pauls
Calculation Method
Tim
e (mins)
Evacuation Time (16m/s)
98
58.149 51.5
32.5 34.9
0
20
40
60
80
100
120
ELVAC Siikonen Sekizaw a Nelson +
Mow rer
AD-B Pauls
Calculation Method
Tim
e (mins)
Evacuation Time (1.2m/s2)
107.9
54.2 51.5
32.5 34.9
0
20
40
60
80
100
120
ELVAC Sekizaw a Nelson +
Mow rer
AD-B Pauls
Calculation Method
Tim
e (mins)
Evacuation Time (1.5m/s2)
105
51.7 51.5
32.5 34.9
0
20
40
60
80
100
120
ELVAC Sekizaw a Nelson +
Mow rer
AD-B Pauls
Calculation Method
Tim
e (mins)

201
25 Storey Intervals – Variable Capacity
Evacuation Time (10 persons)
123.5
95
6551.5
32.5 34.9
020406080100120140
ELVAC
Siikonen
Sekizawa
Nelson +
Mowrer
AD-B
Pauls
Calculation Method
Tim
e (mins)
Evacuation Time (12 persons)
107.9
84.2
54.2 51.532.5 34.9
020406080100120
ELVAC
Siikonen
Sekizawa
Nelson +
Mowrer
AD-B
Pauls
Calculation Method
Tim
e (mins)
Evacuation Time (16 persons)
88.4
71.6
41.251.5
32.5 34.9
0
20
40
60
80
100
ELVAC Siikonen Sekizaw a Nelson +
Mow rer
AD-B Pauls
Calculation Method
Tim
e (mins)
Evacuation Time (21 persons)
74.7
61.2
31.3
51.5
32.5 34.9
0
20
40
60
80
ELVAC Siikonen Sekizaw a Nelson +
Mow rer
AD-B Pauls
Calculation Method
Tim
e (mins)

202
25 Storey Interval – Variable Lifts
Evacuation Time (4 Lifts)
107.9
84.2
54.2 51.532.5 34.9
020
4060
80100
120
ELVAC
Siikonen
Sekizawa
Nelson +
Mowrer
AD-B
Pauls
Calculation Method
Tim
e (mins)
Evacuation Time (6 Lifts)
72.2
56.1
36.1
51.5
32.5 34.9
0
20
40
60
80
ELVAC
Siikonen
Sekizawa
Nelson +
Mowrer
AD-B
Pauls
Calculation Method
Tim
e (mins)
Evacuation Time (8 Lifts)
54.3
36.3
27.4
51.5
32.5 34.9
0
10
20
30
40
50
60
ELVAC Siikonen Sekizaw a Nelson +
Mow rer
AD-B Pauls
Calculation Method
Tim
e (mins)

203
APPENDIX B – EVACUATION TIME USING REFUGE FLOORS (75% LIFT USAGE)

204
10 Storey Interval – Variable Speed
Evacuation Time (5m/s)
0
10
20
30
40
50
10 20 30 40
Refuge Floor level
Tim
e (mins)
ELVAC
Siikonen
Sekizawa
Nelson +Mowrer
AD-B
Pauls
Evacuation Time (6m/s)
0
10
20
30
40
50
10 20 30 40
Refuge Floor Level
Tim
e (mins)
ELVAC
Siikonen
Sekizawa
Nelson +Mowrer
AD-B
Pauls
Evacuation Time (7m/s)
0
10
20
30
40
10 20 30 40
Refuge Floor Level
Tim
e (mins)
ELVAC
Siikonen
Sekizawa
Nelson +Mowrer
AD-B
Pauls
Evacuation Time (16m/s)
0
5
10
15
20
25
30
35
10 20 30 40
Refuge Floor
Tim
e (mins)
ELVAC
Siikonen
Sekizawa
Nelson + Mowrer
AD-B
Pauls

205
10 Storey Interval – Variable Acceleration
10 Storey Interval – Variable Capacity
Evacuation Time (1.2m/s2)
0
10
20
30
40
50
10 20 30 40
Refuge Floor Level
Tim
e (mins)
ELVAC
Sekizawa
Nelson + Mowrer
AD-B
Pauls
Evacuation Time (1.5m/s2)
0
10
20
30
40
50
10 20 30 40
Refuge Floor Level
Tim
e (mins)
ELVAC
Sekizawa
Nelson + Mowrer
AD-B
Pauls
Evacuation Time (10 persons)
0
10
20
30
40
50
10 20 30 40
Refuge Floor Level
Tim
e (mins)
ELVAC
Siikonen
Sekizawa
Nelson + Mowrer
AD-B
Pauls
Evacuation Time (12 persons)
0
10
20
30
40
50
10 20 30 40
Refuge Floor Level
Tim
e (mins)
ELVAC
Siikonen
Sekizawa
Nelson + Mowrer
AD-B
Pauls

206
10 Storey Interval – Variable Lifts
Evacuation Time (16 persons)
0
5
10
15
20
25
30
35
10 20 30 40
Refuge Floor Level
Tim
e (mins)
ELVAC
Siikonen
Sekizawa
Nelson + Mowrer
AD-B
Pauls
Evacuation Time (21 persons)
0
5
10
15
20
25
30
10 20 30 40
Refuge Floor Level
Tim
e (mins)
ELVAC
Siikonen
Sekizawa
Nelson + Mowrer
AD-B
Pauls
Evacuation Time (4 Lifts)
0
10
20
30
40
50
10 20 30 40
Refuge Floor Level
Tim
e (mins)
ELVAC
Siikonen
Sekizawa
Nelson +Mowrer
AD-B
Pauls
Evacuation Time (6 Lifts)
0
5
10
15
20
25
30
10 20 30 40
Refuge Floor Level
Tim
e (mins)
ELVAC
Siikonen
Sekizawa
Nelson +Mowrer
AD-B
Pauls

207
15 Storey Interval – Variable Speed
Evacuation Time (8 Lifts)
0
5
10
15
20
25
10 20 30 40
Refuge Floor Level
Tim
e (mins)
ELVAC
Siikonen
Sekizawa
Nelson +Mowrer
AD-B
Pauls
Evacuation Time (5m/s)
0
10
20
30
40
50
60
70
5 20 35
Refuge Floor Level
Tim
e (mins)
ELVAC
Siikonen
Sekazawa
Nelson + Mowrer
AD-B
Pauls
Evacuation Time (6m/s)
0
10
20
30
40
50
60
5 20 35
Refuge Floor Level
Tim
e (mins)
ELVAC
Siikonen
Sekazawa
Nelson + Mowrer
AD-B
Pauls
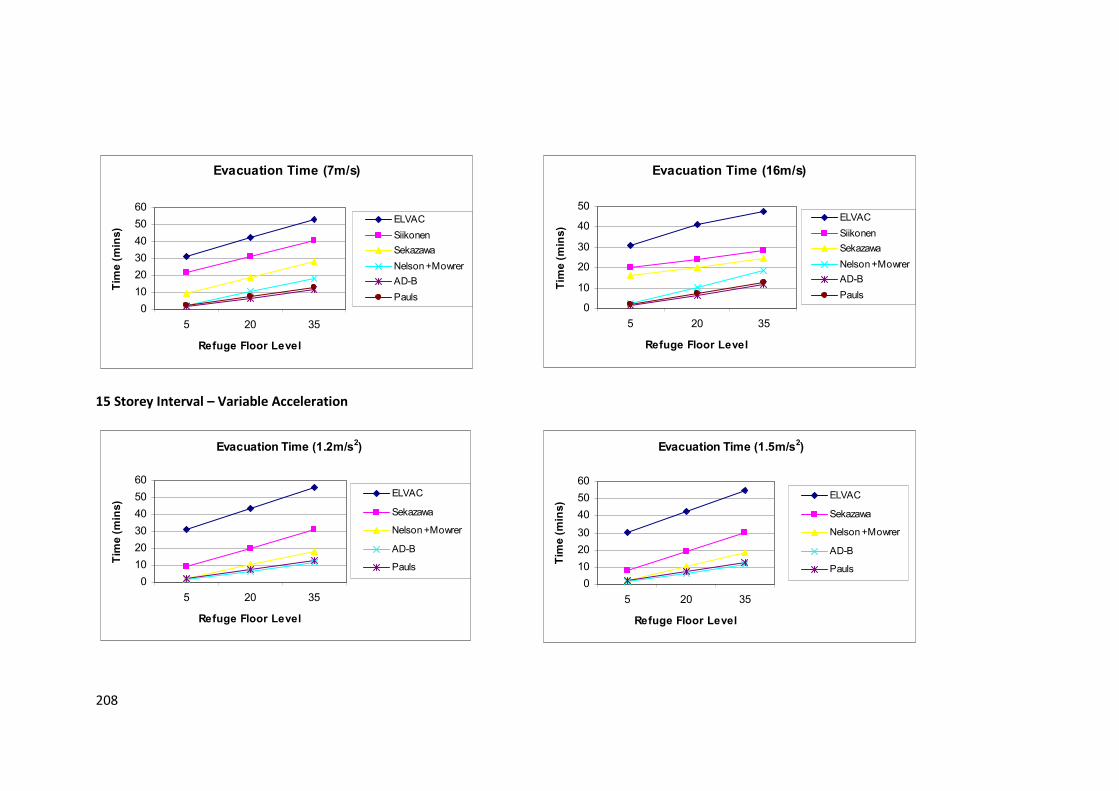
208
15 Storey Interval – Variable Acceleration
Evacuation Time (7m/s)
0
10
20
30
40
50
60
5 20 35
Refuge Floor Level
Tim
e (mins)
ELVAC
Siikonen
Sekazawa
Nelson + Mowrer
AD-B
Pauls
Evacuation Time (16m/s)
0
10
20
30
40
50
5 20 35
Refuge Floor Level
Tim
e (mins)
ELVAC
Siikonen
Sekazawa
Nelson + Mowrer
AD-B
Pauls
Evacuation Time (1.2m/s2)
0
10
20
30
40
50
60
5 20 35
Refuge Floor Level
Tim
e (mins)
ELVAC
Sekazawa
Nelson + Mowrer
AD-B
Pauls
Evacuation Time (1.5m/s2)
0
10
20
30
40
50
60
5 20 35
Refuge Floor Level
Tim
e (mins)
ELVAC
Sekazawa
Nelson + Mowrer
AD-B
Pauls

209
15 Storey Interval – Variable Capacity
Evacuation Time (10 persons)
0
10
20
30
40
50
60
70
5 20 35
Refuge Floor Level
Tim
e (mins)
ELVAC
Siikonen
Sekazawa
Nelson + Mowrer
AD-B
Pauls
Evacuation Time (12 persons)
0
10
20
30
40
50
60
5 20 35
Refuge Floor Level
Tim
e (mins)
ELVAC
Siikonen
Sekazawa
Nelson + Mowrer
AD-B
Pauls
Evacuation Time (16 persons)
0
10
20
30
40
50
5 20 35
Refuge Floor Level
Tim
e (mins)
ELVAC
Siikonen
Sekazawa
Nelson +Mowrer
AD-B
Pauls
Evacuation Time (21 persons)
0
10
20
30
40
5 20 35
Refuge Floor Level
Tim
e (mins)
ELVAC
Siikonen
Sekazawa
Nelson + Mowrer
AD-B
Pauls

210
15 Storey Interval – Variable Lifts
Evacuation Time (4 Lifts)
0
10
20
30
40
50
60
5 20 35
Refuge Floor Level
Tim
e (mins)
ELVAC
Siikonen
Sekazawa
Nelson + Mowrer
AD-B
Pauls
Evacuation Time (6 Lifts)
0
10
20
30
40
5 20 35
Refuge Floor Level
Tim
e (mins)
ELVAC
Siikonen
Sekazawa
Nelson + Mowrer
AD-B
Pauls
Evacuation Time (8 Lifts)
0
5
10
15
20
25
30
5 20 35
Refuge Floor Level
Tim
e (mins)
ELVAC
Siikonen
Sekazawa
Nelson + Mowrer
AD-B
Pauls

211
20 Storey Interval – Variable Speed
Evacuation Time (5m/s)
0
20
40
60
80
10 30
Refuge Floor Level
Tim
e (mins)
ELVAC
Siikonen
Sekazawa
Nelson + Mowrer
AD-B
Pauls
Evacuation Time (6m/s)
0
20
40
60
80
10 30
Refuge Floor Level
Tim
e (mins)
ELVAC
Siikonen
Sekazawa
Nelson + Mowrer
AD-B
Pauls
Evacuation Time (7m/s)
0
20
40
60
80
10 30
Refuge Floor Level
Tim
e (mins)
ELVAC
Siikonen
Sekazawa
Nelson + Mowrer
AD-B
Pauls
Evacuation Time (16m/s)
0
10
20
30
40
50
60
70
10 30
Refuge Floor Level
Tim
e (mins)
ELVAC
Siikonen
Sekazawa
Nelson + Mowrer
AD-B
Pauls

212
20 Storey Interval – Variable Acceleration
20 Storey Interval – Variable Capacity
Evacuation Time (1.2m/s2)
0
20
40
60
80
1 2
Refuge Floor Level
Tim
e (mins)
ELVAC
Sekazawa
Nelson +Mowrer
AD-B
Pauls
Evacuation Time (1.5m/s2)
0
20
40
60
80
10 30
Refuge Floor Level
Tim
e (mins)
ELVAC
Sekazawa
Nelson +Mowrer
AD-B
Pauls
Evacuation Time (10 persons)
0
20
40
60
80
100
10 30
Refuge Floor Level
Tim
e (mins)
ELVAC
Siikonen
Sekazawa
Nelson + Mowrer
AD-B
Pauls
Evacuation Time (12 persons)
0
20
40
60
80
10 30
Refuge Floor Level
Tim
e (mins)
ELVAC
Siikonen
Sekazawa
Nelson +Mowrer
AD-B
Pauls

213
20 Storey Interval – Variable Lifts
Evacuation Time (16 persons)
0
10
20
30
40
50
60
10 30
Refuge Floor Level
Tim
e (mins)
ELVAC
Siikonen
Sekazawa
Nelson +Mowrer
AD-B
Pauls
Evacuation Time (21 persons)
0
10
20
30
40
50
60
10 30
Refuge Floor Level
Tim
e (mins)
ELVAC
Siikonen
Sekazawa
Nelson + Mowrer
AD-B
Pauls
Evacuation Time (4 Lifts)
0
20
40
60
80
10 30
Refuge Floor Level
Tim
e (mins)
ELVAC
Siikonen
Sekazawa
Nelson +Mowrer
AD-B
Pauls
Evacuation Time (6 Lifts)
0
10
20
30
40
50
10 30
Refuge Floor Level
Tim
e (mins)
ELVAC
Siikonen
Sekazawa
Nelson +Mowrer
AD-B
Pauls

214
25 Storey Interval – Variable Speed
Evacuation Time (8 Lifts)
0
10
20
30
40
10 30
Refuge Floor Level
Tim
e (mins)
ELVAC
Siikonen
Sekazawa
Nelson +Mowrer
AD-B
Pauls
Evacuation Time (5m/s)
86.370.3
45.9
13.1 8.3 9.3
0
20
40
60
80
100
ELVAC
Siikonen
Sekizawa
Nelson +
Mowrer
AD-B
Pauls
Calculation Method
Tim
e (mins)
Evacuation Time (6m/s)
81.164
41.2
13.1 8.3 9.3
0
20
40
60
80
100
ELVAC
Siikonen
Sekizawa
Nelson +
Mowrer
AD-B
Pauls
Calculation Method
Tim
e (mins)

215
25 Storey Interval – Variable Acceleration
Evacuation Time (7m/s)
78
59.4
38.2
13.1 8.3 9.3
0
20
40
60
80
100
ELVAC
Siikonen
Sekizawa
Nelson +
Mowrer
AD-B
Pauls
Calculation Method
Tim
e (mins)
Evacuation Time (16m/s)
73.7
44.237.2
13.18.3 9.3
0
20
40
60
80
ELVAC Siikonen Sekizaw a Nelson +
Mow rer
AD-B Pauls
Calculation Method
Tim
e (mins)
Evacuation Time (1.2m/s2)
81.1
41.2
13.1 8.3 9.3
0
20
40
60
80
100
ELVAC Sekizaw a Nelson +
Mow rer
AD-B Pauls
Calculation Method
Tim
e (mins)
Evacuation Time (1.5m/s2)
79
39.3
13.1 8.3 9.3
0
20
40
60
80
100
ELVAC Sekizaw a Nelson +
Mow rer
AD-B Pauls
Calculation Method
Tim
e (mins)

216
25 Storey Interval – Variable Capacity
Evacuation Time (10 persons)
92.8
71.8
49.1
13.1 8.3 9.3
0
20
40
60
80
100
ELVAC
Siikonen
Sekizawa
Nelson +
Mowrer
AD-B
Pauls
Calculation Method
Tim
e (mins)
Evacuation Time (12 persons)
81.1
64
41.2
13.1 8.3 9.3
0
20
40
60
80
100
ELVAC
Siikonen
Sekizawa
Nelson +
Mowrer
AD-B
Pauls
Calculation Method
Tim
e (mins)
Evacuation Time (16 persons)
66.6
54
31.1
13.18.3 9.3
0
10
20
3040
50
60
70
ELVAC Siikonen Sekizaw a Nelson +
Mow rer
AD-B Pauls
Calculation Method
Tim
e (mins)
Evacuation Time (21 persons)
56.2
46.9
23.8
13.18.3 9.3
0
10
20
30
40
50
60
ELVAC Siikonen Sekizaw a Nelson +
Mow rer
AD-B Pauls
Calculation Method
Tim
e (mins)

217
25 Storey Interval – Variable Lifts
Evacuation Time (4 Lifts)
81.164
41.2
13.1 8.3 9.3
0
20
40
60
80
100
ELVAC
Siikonen
Sekizawa
Nelson +
Mowrer
AD-B
Pauls
Calculation Method
Tim
e (mins)
Evacuation Time (6 Lifts)
54.3
42.6
27.4
13.18.3 9.3
010
203040
5060
ELVAC
Siikonen
Sekizawa
Nelson +
Mowrer
AD-B
Pauls
Calculation Method
Tim
e (mins)
Evacuation Time (8 Lifts)
40.9
32.5
20.9
13.18.3 9.3
0
10
20
30
40
50
ELVAC Siikonen Sekizaw a Nelson +
Mow rer
AD-B Pauls
Calculation Method
Tim
e (mins)

218
APPENDIX C - EVACUATION TIME USING REFUGE FLOORS (50% LIFT USAGE)

219
10 Storey Interval – Variable Speed
Evacuation Time (5m/s)
0
10
20
30
40
50
10 20 30 40
Refuge Floor Level
Tim
e (mins)
ELVAC
Siikonen
Sekizawa
Nelson +Mowrer
AD-B
Pauls
Evacuation Time (6m/s)
0
10
20
30
40
50
10 20 30 40
Refuge Floor Level
Tim
e (mins)
ELVAC
Siikonen
Sekizawa
Nelson +Mowrer
AD-B
Pauls
Evacuation Time (7m/s)
0
10
20
30
40
50
10 20 30 40
Refuge Floor Level
Tim
e (mins)
ELVAC
Siikonen
Sekizawa
Nelson +Mowrer
AD-B
Pauls
Evacuation Time (16m/s)
0
10
20
30
40
50
10 20 30 40
Refuge Floor Level
Tim
e (mins)
ELVAC
Siikonen
Sekizawa
Nelson + Mowrer
AD-B
Pauls

220
10 Storey Interval – Variable Acceleration
10 Storey Interval – Variable Capacity
Evacuation Time (1.2m/s2)
0
10
20
30
40
50
10 20 30 40
Refuge Floor Level
Tim
e (mins)
ELVAC
Sekizawa
Nelson + Mowrer
AD-B
Pauls
Evacuation Time (1.5m/s2)
0
10
20
30
40
50
1 2 3 4
Refuge Floor Level
Tim
e (mins)
ELVAC
Sekizawa
Nelson +Mowrer
AD-B
Pauls
Evacuation Time (10 persons)
0
10
20
30
40
50
10 20 30 40
Refuge Floor Level
Tim
e (mins)
ELVAC
Siikonen
Sekizawa
Nelson + Mowrer
AD-B
Pauls
Evacuation Time (12 persons)
0
10
20
30
40
50
10 20 30 40
Refuge Floor Level
Tim
e (mins)
ELVAC
Siikonen
Sekizawa
Nelson + Mowrer
AD-B
Pauls

221
10 Storey Interval – Variable Lifts
Evacuation Time (16 persons)
0
10
20
30
40
50
10 20 30 40
Refuge Floor Level
Tim
e (mins)
ELVAC
Siikonen
Sekizawa
Nelson + Mowrer
AD-B
Pauls
Evacuation Time (21 persons)
0
10
20
30
40
50
10 20 30 40
Refuge Floor Level
Tim
e (mins)
ELVAC
Siikonen
Sekizawa
Nelson + Mowrer
AD-B
Pauls
Evacuation Time (4 Lifts)
0
10
20
30
40
50
10 20 30 40
Refuge Floor Level
Tim
e (mins)
ELVAC
Siikonen
Sekizawa
Nelson +Mowrer
AD-B
Pauls
Evacuation Time (6 Lifts)
0
10
20
30
40
50
10 20 30 40
Refuge Floor Level
Tim
e (mins)
ELVAC
Siikonen
Sekizawa
Nelson +Mowrer
AD-B
Pauls

222
15 Storey Interval – Variable Speed
Evacuation Time (5m/s)
0
10
20
30
40
50
5 20 35
Refuge Floor Level
Tim
e (mins)
ELVAC
Siikonen
Sekazawa
Nelson + Mowrer
AD-B
Pauls
Evacuation Time (6m/s)
0
10
20
30
40
5 20 35
Refuge Floor Level
Tim
e (mins)
ELVAC
Siikonen
Sekazawa
Nelson + Mowrer
AD-B
Pauls
Evacuation Time (8 Lifts)
0
10
20
30
40
50
1 2 3 4
Refuge Floor Level
Tim
e (mins)
ELVAC
Siikonen
Sekizawa
Nelson +Mowrer
AD-B
Pauls

223
15 Storey Interval – Variable Acceleration
Evacuation Time (7m/s)
0
10
20
30
40
5 20 35
Refuge Floor Level
Tim
e (mins)
ELVAC
Siikonen
Sekazawa
Nelson + Mowrer
AD-B
Pauls
Evacuation Time (16m/s)
0
10
20
30
40
5 20 35
Refuge Floor Level
Tim
e (mins)
ELVAC
Siikonen
Sekazawa
Nelson + Mowrer
AD-B
Pauls
Evacuation Time (1.2m/s2)
0
10
20
30
40
1 2 3
Refuge Floor Level
Tim
e (mins)
ELVAC
Sekazawa
Nelson + Mowrer
AD-B
Pauls
Evacuation Time (1.5m/s2)
0
10
20
30
40
5 20 35
Refuge Floor Level
Tim
e (mins)
ELVAC
Sekazawa
Nelson + Mowrer
AD-B
Pauls
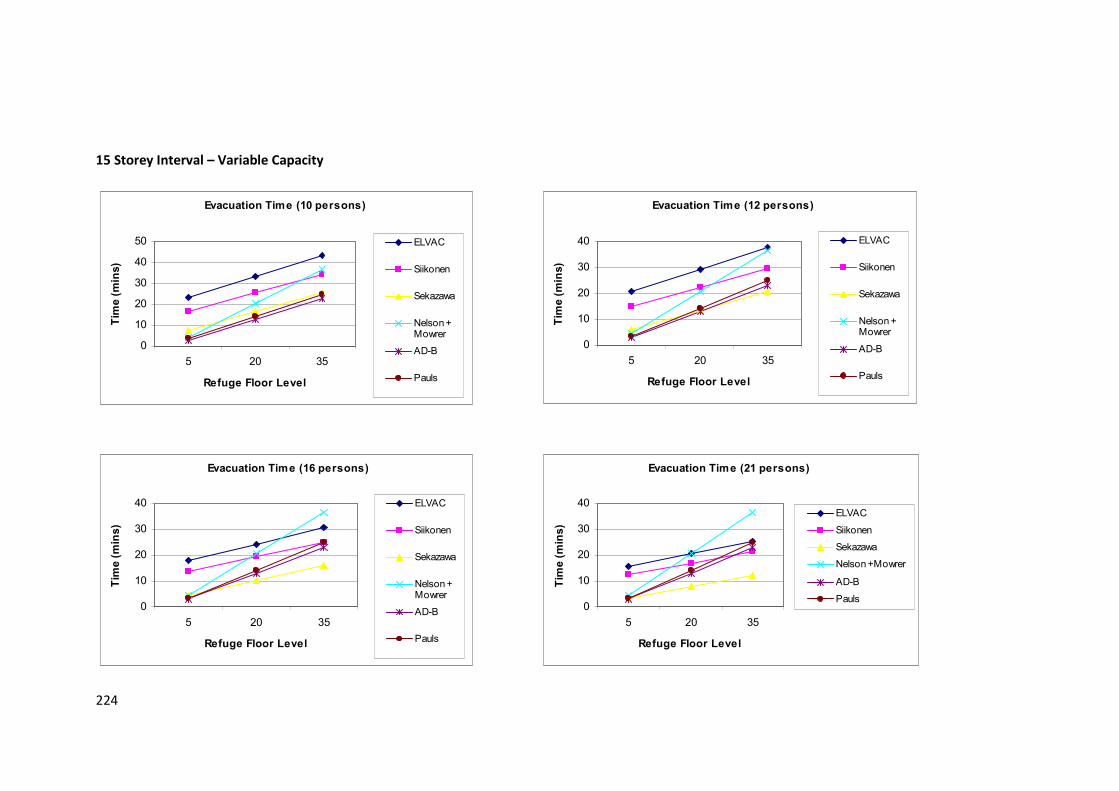
224
15 Storey Interval – Variable Capacity
Evacuation Time (10 persons)
0
10
20
30
40
50
5 20 35
Refuge Floor Level
Tim
e (mins)
ELVAC
Siikonen
Sekazawa
Nelson +Mowrer
AD-B
Pauls
Evacuation Time (12 persons)
0
10
20
30
40
5 20 35
Refuge Floor Level
Tim
e (mins)
ELVAC
Siikonen
Sekazawa
Nelson +Mowrer
AD-B
Pauls
Evacuation Time (16 persons)
0
10
20
30
40
5 20 35
Refuge Floor Level
Tim
e (mins)
ELVAC
Siikonen
Sekazawa
Nelson +Mowrer
AD-B
Pauls
Evacuation Time (21 persons)
0
10
20
30
40
5 20 35
Refuge Floor Level
Tim
e (mins)
ELVAC
Siikonen
Sekazawa
Nelson + Mowrer
AD-B
Pauls

225
15 Storey Interval – Variable Lifts
Evacuation Time (4 Lifts)
0
10
20
30
40
5 20 35
Refuge Floor Level
Tim
e (mins)
ELVAC
Siikonen
Sekazawa
Nelson + Mowrer
AD-B
Pauls
Evacuation Time (6 Lifts)
0
10
20
30
40
5 20 35
Refuge Floor Level
Tim
e (mins)
ELVAC
Siikonen
Sekazawa
Nelson + Mowrer
AD-B
Pauls
Evacuation Time (8 Lifts)
0
10
20
30
40
5 20 35
Refuge Floor Level
Tim
e (mins)
ELVAC
Siikonen
Sekazawa
Nelson + Mowrer
AD-B
Pauls

226
20 Storey Interval – Variable Speed
Evacuation Time (5m/s)
0
10
20
30
40
50
60
10 30
Refuge Floor Level
Tim
e (mins)
ELVAC
Siikonen
Sekazawa
Nelson + Mowrer
AD-B
Pauls
Evacuation Time (6m/s)
0
10
20
30
40
50
10 30
Refuge Floor Level
Tim
e (mins)
ELVAC
Siikonen
Sekazawa
Nelson + Mowrer
AD-B
Pauls
Evacuation Time (7m/s)
0
10
20
30
40
50
10 30
Refuge Floor Level
Tim
e (mins)
ELVAC
Siikonen
Sekazawa
Nelson + Mowrer
AD-B
Pauls
Evacuation Time (16m/s)
0
10
20
30
40
50
10 30
Refuge Floor Level
Tim
e (mins)
ELVAC
Siikonen
Sekazawa
Nelson + Mowrer
AD-B
Pauls

227
20 Storey Interval – Variable Acceleration
20 Storey Interval – Variable Capacity
Evacuation Time (1.2m/s2)
0
10
20
30
40
50
10 30
Refuge Floor Level
Tim
e (mins)
ELVAC
Sekazawa
Nelson +Mowrer
AD-B
Pauls
Evacuation Time (1.5m/s2)
0
10
20
30
40
50
1 2
Refuge Floor Level
Tim
e (mins)
ELVAC
Sekazawa
Nelson +Mowrer
AD-B
Pauls
Evacuation Time (10 persons)
0
10
20
30
40
50
60
10 30
Refuge Floor Level
Tim
e (mins)
ELVAC
Siikonen
Sekazawa
Nelson +Mowrer
AD-B
Pauls
Evacuation Time (12 persons)
0
10
20
30
40
50
10 30
Refuge Floor Level
Tim
e (mins)
ELVAC
Siikonen
Sekazawa
Nelson +Mowrer
AD-B
Pauls

228
20 Storey Interval – Variable Lifts
Evacuation Time (16 persons)
0
10
20
30
40
50
10 30
Refuge Floor Level
Tim
e (mins)
ELVAC
Siikonen
Sekazawa
Nelson +Mowrer
AD-B
Pauls
Evacuation Time (21 persons)
0
5
10
15
20
25
30
35
10 30
Refuge Floor Level
Tim
e (mins)
ELVAC
Siikonen
Sekazawa
Nelson + Mowrer
AD-B
Pauls
Evacuation Time (4 Lifts)
0
10
20
30
40
50
10 30
Refuge Floor Level
Tim
e (mins)
ELVAC
Siikonen
Sekazawa
Nelson +Mowrer
AD-B
Pauls
Evacuation Time (6 Lifts)
0
5
10
15
20
25
30
35
10 30
Refuge Floor Level
Tim
e (mins)
ELVAC
Siikonen
Sekazawa
Nelson +Mowrer
AD-B
Pauls

229
25 Storey Interval – Variable Speed
Evacuation Time (8 Lifts)
0
5
10
15
20
25
30
35
10 30
Refuge Floor Level
Tim
e (mins)
ELVAC
Siikonen
Sekazawa
Nelson +Mowrer
AD-B
Pauls
Evacuation Time (5m/s)
57.846.9
30.6 25.916.4 17.8
010203040506070
ELVAC
Siikonen
Sekizawa
Nelson +
Mowrer
AD-B
Pauls
Calculation Method
Tim
e (mins)
Evacuation Time (6m/s)
54.3
42.6
27.4 25.916.4 17.8
0102030
405060
ELVAC
Siikonen
Sekizawa
Nelson +
Mowrer
AD-B
Pauls
Calculation Method
Tim
e (mins)

230
25 Storey Interval – Variable Acceleration
Evacuation Time (7m/s)
52.2
39.6
25.5 25.916.4 17.8
0102030
405060
ELVAC
Siikonen
Sekizawa
Nelson +
Mowrer
AD-B
Pauls
Calculation Method
Tim
e (mins)
Evacuation Time (16m/s)
49.4
29.524.8 25.9
16.4 17.8
0
10
20
30
40
50
60
ELVAC Siikonen Sekizaw a Nelson +
Mow rer
AD-B Pauls
Calculation Method
Tim
e (mins)
Evacuation Time (1.2m/s2)
54.3
27.4 25.9
16.4 17.8
0
10
20
30
40
50
60
ELVAC Sekizaw a Nelson +
Mow rer
AD-B Pauls
Calculation Method
Tim
e (mins)
Evacuation Time (1.5m/s2)
52.9
26.2 25.9
16.4 17.8
0
10
20
30
40
50
60
ELVAC Sekizaw a Nelson +
Mow rer
AD-B Pauls
Calculation Method
Tim
e (mins)

231
25 Storey Interval – Variable Capacity
Evacuation Time (10 persons)
62.1
47.5
32.525.9
16.4 17.8
0
1020
30
40
5060
70
ELVAC Siikonen Sekizaw a Nelson +
Mow rer
AD-B Pauls
Calculation Method
Tim
e (mins)
Evacuation Time (12 persons)
54.3
42.6
27.4 25.9
16.4 17.8
0
10
20
30
40
50
60
ELVAC Siikonen Sekizaw a Nelson +
Mow rer
AD-B Pauls
Calculation Method
Tim
e (mins)
Evacuation Time (16 persons)
44.8
36.4
20.925.9
16.4 17.8
0
10
20
30
40
50
ELVAC Siikonen Sekizaw a Nelson +
Mow rer
AD-B Pauls
Calculation Method
Tim
e (mins)
Evacuation Time (21 persons)
37.8
31.3
15.9
25.9
16.4 17.8
0
10
20
30
40
ELVAC Siikonen Sekizaw a Nelson +
Mow rer
AD-B Pauls
Calculation Method
Tim
e (mins)

232
25 Storey Interval – Variable Lifts
Evacuation Time (4 Lifts)
54.3
42.6
27.4 25.916.4 17.8
0102030
405060
ELVAC
Siikonen
Sekizawa
Nelson +
Mowrer
AD-B
Pauls
Calculation Method
Tim
e (mins)
Evacuation Time (6 Lifts)
36.5
28.1
18.1
25.9
16.4 17.8
0
10
20
30
40
ELVAC
Siikonen
Sekizawa
Nelson +
Mowrer
AD-B
Pauls
Calculation Method
Tim
e (mins)
Evacuation Time (8 Lifts)
27.6
21.3
13.7
25.9
16.4 17.8
0
5
10
15
20
25
30
ELVAC Siikonen Sekizaw a Nelson +
Mow rer
AD-B Pauls
Calculation Method
Tim
e (mins)

233
APPENDIX D – EVACUATION FROM EVACUATION ZONE (100% LIFT USAGE)

234
10 Storey Interval – Variable Speed
Evacuation Time (5m/s)
0
20
40
60
80
100
120
10 20 30 40
Refuge Floor level
Tim
e (mins)
ELVAC
Siikonen
Sekizawa
Nelson +Mowrer
AD-B
Pauls
Evacuation Time (6m/s)
0
20
40
60
80
100
120
10 20 30 40
Refuge Floor Level
Tim
e (mins)
ELVAC
Siikonen
Sekizawa
Nelson +Mowrer
AD-B
Pauls
Evacuation Time (7m/s)
0
20
40
60
80
100
120
10 20 30 40
Refuge Floor Level
Tim
e (mins)
ELVAC
Siikonen
Sekizawa
Nelson +Mowrer
AD-B
Pauls
Evacuation Time (16m/s)
0
20
40
60
80
100
120
10 20 30 40
Refuge Floor
Tim
e (mins)
ELVAC
Siikonen
Sekizawa
Nelson + Mowrer
AD-B
Pauls

235
10 Storey Interval – Variable Acceleration
10 Storey Interval – Variable Capacity
Evacuation Time (1.5m/s2)
0
20
40
60
80
100
120
10 20 30 40
Refuge Floor Level
Tim
e (mins)
ELVAC
Sekizawa
Nelson +Mowrer
AD-B
Pauls
Evacuation Time (10 persons)
0
20
40
60
80
100
120
10 20 30 40
Refuge Floor Level
Tim
e (mins)
ELVAC
Siikonen
Sekizawa
Nelson + Mowrer
AD-B
Pauls
Evacuation Time (1.2m/s2)
0
20
40
60
80
100
120
10 20 30 40
Refuge Floor Level
Tim
e (mins)
ELVAC
Sekizawa
Nelson + Mowrer
AD-B
Pauls
Evacuation Time (12 persons)
0
20
40
60
80
100
120
10 20 30 40
Refuge Floor Level
Tim
e (mins)
ELVAC
Siikonen
Sekizawa
Nelson + Mowrer
AD-B
Pauls

236
Variable Lifts
Evacuation Time (16 persons)
0
20
40
60
80
100
120
10 20 30 40
Refuge Floor Level
Tim
e (mins)
ELVAC
Siikonen
Sekizawa
Nelson + Mowrer
AD-B
Pauls
Evacuation Time (21 persons)
0
20
40
60
80
100
120
10 20 30 40
Refuge Floor Level
Tim
e (mins)
ELVAC
Siikonen
Sekizawa
Nelson + Mowrer
AD-B
Pauls
Evacuation Time (4 Lifts)
0
20
40
60
80
100
120
10 20 30 40
Refuge Floor Level
Tim
e (mins)
ELVAC
Siikonen
Sekizawa
Nelson +Mowrer
AD-B
Pauls
Evacuation Time (6 Lifts)
0
20
40
60
80
100
120
10 20 30 40
Refuge Floor Level
Tim
e (mins)
ELVAC
Siikonen
Sekizawa
Nelson +Mowrer
AD-B
Pauls

237
Evacuation Time (8 Lifts)
0
20
40
60
80
100
120
10 20 30 40
Refuge Floor Level
Tim
e (mins)
ELVAC
Siikonen
Sekizawa
Nelson +Mowrer
AD-B
Pauls
15 Storey Interval – Variable Speed
Evacuation Time (5m/s)
0
20
40
60
80
100
120
5 20 35
Refuge Floor Level
Tim
e (mins)
ELVAC
Siikonen
Sekazawa
Nelson + Mowrer
AD-B
Pauls
Evacuation Time (6m/s)
0
20
40
60
80
100
120
5 20 35
Refuge Floor Level
Tim
e (mins)
ELVAC
Siikonen
Sekazawa
Nelson + Mowrer
AD-B
Pauls

238
15 Storey Interval – Variable Acceleration
Evacuation Time (7m/s)
0
20
40
60
80
100
120
5 20 35
Refuge Floor Level
Tim
e (mins)
ELVAC
Siikonen
Sekazawa
Nelson + Mowrer
AD-B
Pauls
Evacuation Time (16m/s)
0
20
40
60
80
100
120
5 20 35
Refuge Floor Level
Tim
e (mins)
ELVAC
Siikonen
Sekazawa
Nelson + Mowrer
AD-B
Pauls
Evacuation Time (1.2m/s2)
0
20
40
60
80
100
120
5 20 35
Refuge Floor Level
Tim
e (mins)
ELVAC
Sekazawa
Nelson + Mowrer
AD-B
Pauls
Evacuation Time (1.5m/s2)
0
20
40
60
80
100
120
5 20 35
Refuge Floor Level
Tim
e (mins)
ELVAC
Sekazawa
Nelson + Mowrer
AD-B
Pauls

239
15 Storey Interval – Variable Capacity
Evacuation Time (10 persons)
0
20
40
60
80
100
120
5 20 35
Refuge Floor Level
Tim
e (mins)
ELVAC
Siikonen
Sekazawa
Nelson + Mowrer
AD-B
Pauls
Evacuation Time (12 persons)
0
20
40
60
80
100
120
5 20 35
Refuge Floor Level
Tim
e (mins)
ELVAC
Siikonen
Sekazawa
Nelson + Mowrer
AD-B
Pauls
Evacuation Time (16 persons)
0
20
40
60
80
100
120
5 20 35
Refuge Floor Level
Tim
e (mins)
ELVAC
Siikonen
Sekazawa
Nelson +Mowrer
AD-B
Pauls
Evacuation Time (21 persons)
0
20
40
60
80
100
120
5 20 35
Refuge Floor Level
Tim
e (mins)
ELVAC
Siikonen
Sekazawa
Nelson + Mowrer
AD-B
Pauls

240
15 Storey Interval – Variable Lifts
Evacuation Time (4 Lifts)
0
20
40
60
80
100
120
5 20 35
Refuge Floor Level
Tim
e (mins)
ELVAC
Siikonen
Sekazawa
Nelson + Mowrer
AD-B
Pauls
Evacuation Time (6 Lifts)
0
20
40
60
80
100
120
5 20 35
Refuge Floor Level
Tim
e (mins)
ELVAC
Siikonen
Sekazawa
Nelson + Mowrer
AD-B
Pauls
Evacuation Time (8 Lifts)
0
20
40
60
80
100
120
5 20 35
Refuge Floor Level
Tim
e (mins)
ELVAC
Siikonen
Sekazawa
Nelson + Mowrer
AD-B
Pauls
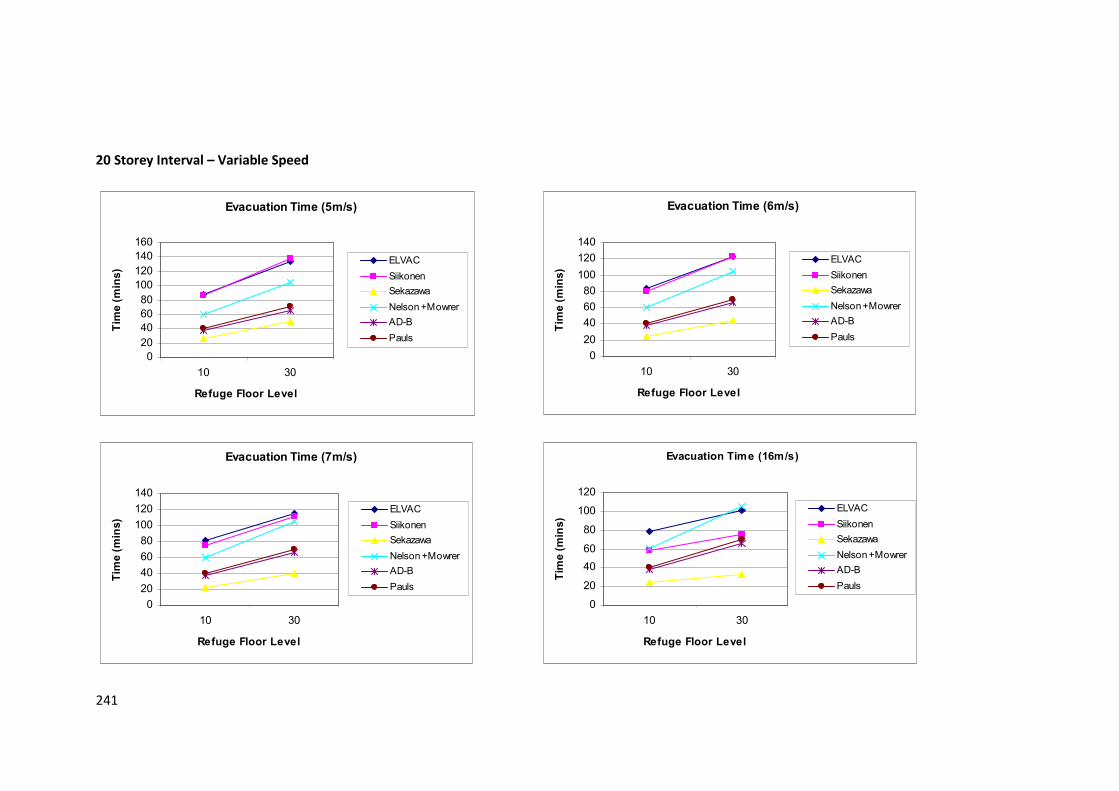
241
20 Storey Interval – Variable Speed
Evacuation Time (5m/s)
0
20
40
60
80
100
120
140
160
10 30
Refuge Floor Level
Tim
e (mins)
ELVAC
Siikonen
Sekazawa
Nelson + Mowrer
AD-B
Pauls
Evacuation Time (6m/s)
0
20
40
60
80
100
120
140
10 30
Refuge Floor Level
Tim
e (mins)
ELVAC
Siikonen
Sekazawa
Nelson + Mowrer
AD-B
Pauls
Evacuation Time (7m/s)
0
20
40
60
80
100
120
140
10 30
Refuge Floor Level
Tim
e (mins)
ELVAC
Siikonen
Sekazawa
Nelson + Mowrer
AD-B
Pauls
Evacuation Time (16m/s)
0
20
40
60
80
100
120
10 30
Refuge Floor Level
Tim
e (mins)
ELVAC
Siikonen
Sekazawa
Nelson + Mowrer
AD-B
Pauls

242
20 Storey Interval – Variable Speed
20 Storey Interval – Variable Capacity
Evacuation Time (1.2m/s2)
0
20
40
60
80
100
120
140
10 30
Refuge Floor Level
Tim
e (mins)
ELVAC
Sekazawa
Nelson +Mowrer
AD-B
Pauls
Evacuation Time (1.5m/s2)
0
20
40
60
80
100
120
140
10 30
Refuge Floor Level
Tim
e (mins)
ELVAC
Sekazawa
Nelson +Mowrer
AD-B
Pauls
Evacuation Time (10 persons)
0
20
40
60
80
100
120
140
160
10 30
Refuge Floor Level
Tim
e (mins)
ELVAC
Siikonen
Sekazawa
Nelson + Mowrer
AD-B
Pauls
Evacuation Time (12 persons)
0
20
40
60
80
100
120
140
10 30
Refuge Floor Level
Tim
e (mins)
ELVAC
Siikonen
Sekazawa
Nelson + Mowrer
AD-B
Pauls

243
20 Storey Interval – Variable Capacity
Evacuation Time (16 persons)
0
20
40
60
80
100
120
140
10 30
Refuge Floor Level
Tim
e (mins)
ELVAC
Siikonen
Sekazawa
Nelson +Mowrer
AD-B
Pauls
Evacuation Time (21 persons)
0
20
40
60
80
100
120
10 30
Refuge Floor Level
Tim
e (mins)
ELVAC
Siikonen
Sekazawa
Nelson + Mowrer
AD-B
Pauls
Evacuation Time (4 Lifts)
0
20
40
60
80
100
120
140
10 30
Refuge Floor Level
Tim
e (mins)
ELVAC
Siikonen
Sekazawa
Nelson +Mowrer
AD-B
Pauls
Evacuation Time (6 Lifts)
0
20
40
60
80
100
120
10 30
Refuge Floor Level
Tim
e (mins)
ELVAC
Siikonen
Sekazawa
Nelson +Mowrer
AD-B
Pauls

244
25 Storey Interval – Variable Speed
Evacuation Time (8 Lifts)
0
20
40
60
80
100
120
10 30
Refuge Floor Level
Tim
e (mins)
ELVAC
Siikonen
Sekazawa
Nelson +Mowrer
AD-B
Pauls
Evacuation Time (5m/s)
159.2 162.9
59.2
105
66 70.5
0
50
100
150
200
ELVAC
Siikonen
Sekizawa
Nelson +
Mowrer
AD-B
Pauls
Calculation Method
Tim
e (mins)
Evacuation Time (6m/s)
146.3 145.6
52
105
66 70.5
020406080100120140160
ELVAC
Siikonen
Sekizawa
Nelson +
Mowrer
AD-B
Pauls
Calculation Method
Tim
e (mins)

245
25 Storey Interval – Variable Acceleration
Evacuation Time (7m/s)
137.9 133.2
47.3
105
66 70.5
0
50
100
150
ELVAC
Siikonen
Sekizawa
Nelson +
Mowrer
AD-B
Pauls
Calculation Method
Tim
e (mins)
Evacuation Time (16m/s)
121.9
91.4
39.4
105
66 70.5
0
20
40
60
80
100
120
140
ELVAC Siikonen Sekizaw a Nelson +
Mow rer
AD-B Pauls
Calculation Method
Tim
e (mins)
Evacuation Time (1.2m/s2)
146.3 149.3
52
105
66 70.5
0
50
100
150
200
ELVAC Siikonen Sekizaw a Nelson +
Mow rer
AD-B Pauls
Calculation Method
Tim
e (mins)
Evacuation Time (1.5m/s2)
143.1 150.8
50.3
105
66 70.5
0
50
100
150
200
ELVAC Siikonen Sekizaw a Nelson +
Mow rer
AD-B Pauls
Calculation Method
Tim
e (mins)

246
25 Storey Interval – Variable Capacity
Evacuation Time (10 persons)
163.8138.7
52
105
66 70.5
0
50
100
150
200
ELVAC
Siikonen
Sekizawa
Nelson +
Mowrer
AD-B
Pauls
Calculation Method
Tim
e (mins)
Evacuation Time (12 persons)
0
50
100
150
200
ELVAC
Siikonen
Sekizawa
Nelson +
Mowrer
AD-B
Pauls
Calculation Method
Tim
e (mins)
Evacuation Time (16 persons)
120.1 119.6
39
105
66 70.5
0
20
40
60
80
100
120
140
ELVAC Siikonen Sekizaw a Nelson +
Mow rer
AD-B Pauls
Calculation Method
Tim
e (mins)
Evacuation Time (21 persons)
102.988.4
26
105
66 70.5
0
20
40
60
80
100
120
ELVAC Siikonen Sekizaw a Nelson +
Mow rer
AD-B Pauls
Calculation Method
Tim
e (mins)

247
25 Storey Interval – Variable Lifts
Evacuation Time (4 Lifts)
146.3 145.6
52
105
66 70.5
0
50
100
150
200
ELVAC
Siikonen
Sekizawa
Nelson +
Mowrer
AD-B
Pauls
Calculation Method
Tim
e (mins)
Evacuation Time (6 Lifts)
97.9109.2
39
105
66 70.5
0
20
40
60
80
100
120
ELVAC
Siikonen
Sekizawa
Nelson +
Mowrer
AD-B
Pauls
Calculation Method
Tim
e (mins)
Evacuation Time (8 Lifts)
73.7 72.8
26
105
66 70.5
0
20
40
60
80
100
120
ELVAC Siikonen Sekizaw a Nelson +
Mow rer
AD-B Pauls
Calculation Method
Tim
e (mins)

248
APPENDIX E – EVACUATION FROM EVACUATION ZONE (75% LIFT USAGE)

249
10 Storey Interval – Variable Speed
Evacuation Time (5m/s)
0
10
20
30
40
50
60
70
10 20 30 40
Refuge Floor Level
Tim
e (mins)
ELVAC
Siikonen
Sekizawa
Nelson +Mowrer
AD-B
Pauls
Evacuation Time (6m/s)
0
10
20
30
40
50
60
10 20 30 40
Refuge Floor Level
Tim
e (mins)
ELVAC
Siikonen
Sekizawa
Nelson +Mowrer
AD-B
Pauls
Evacuation Time (7m/s)
0
10
20
30
40
50
60
10 20 30 40
Refuge Floor Level
Tim
e (mins)
ELVAC
Siikonen
Sekizawa
Nelson +Mowrer
AD-B
Pauls
Evacuation Time (16m/s)
0
10
20
30
40
50
10 20 30 40
Refuge Floor Level
Tim
e (mins)
ELVAC
Siikonen
Sekizawa
Nelson + Mowrer
AD-B
Pauls

250
10 Storey Interval – Variable Acceleration
10 Storey Interval – Variable Capacity
Evacuation Time (1.2m/s2)
0
10
20
30
40
50
60
10 20 30 40
Refuge Floor Level
Tim
e (mins)
ELVAC
Sekizawa
Nelson + Mowrer
AD-B
Pauls
Evacuation Time (1.5m/s2)
0
10
20
30
40
50
60
10 20 30 40
Refuge Floor Level
Tim
e (mins)
ELVAC
Sekizawa
Nelson + Mowrer
AD-B
Pauls
Evacuation Time (10 persons)
0
10
20
30
40
50
60
70
10 20 30 40
Refuge Floor Level
Tim
e (mins)
ELVAC
Siikonen
Sekizawa
Nelson + Mowrer
AD-B
Pauls
Evacuation Time (12 persons)
0
10
20
30
40
50
60
10 20 30 40
Refuge Floor Level
Tim
e (mins)
ELVAC
Siikonen
Sekizawa
Nelson + Mowrer
AD-B
Pauls

251
10 Storey Interval – Variable Lifts
Evacuation Time (16 persons)
0
10
20
30
40
50
10 20 30 40
Refuge Floor Level
Tim
e (mins)
ELVAC
Siikonen
Sekizawa
Nelson + Mowrer
AD-B
Pauls
Evacuation Time (21 persons)
0
10
20
30
40
50
10 20 30 40
Refuge Floor Level
Tim
e (mins)
ELVAC
Siikonen
Sekizawa
Nelson + Mowrer
AD-B
Pauls
Evacuation Time (4 Lifts)
0
10
20
30
40
50
60
10 20 30 40
Refuge Floor Level
Tim
e (mins)
ELVAC
Siikonen
Sekizawa
Nelson +Mowrer
AD-B
Pauls
Evacuation Time (6 Lifts)
0
5
10
15
20
25
30
35
40
10 20 30 40
Refuge Floor Level
Tim
e (mins)
ELVAC
Siikonen
Sekizawa
Nelson +Mowrer
AD-B
Pauls
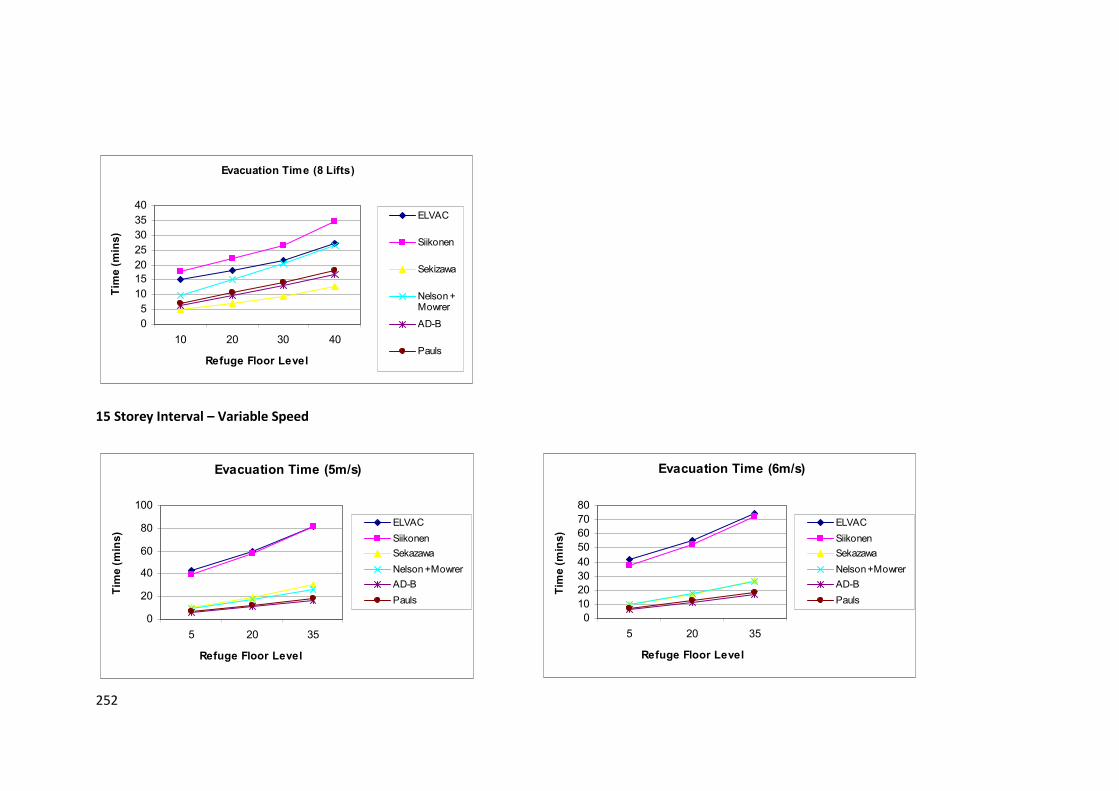
252
15 Storey Interval – Variable Speed
Evacuation Time (8 Lifts)
0
5
10
15
20
25
30
35
40
10 20 30 40
Refuge Floor Level
Tim
e (mins)
ELVAC
Siikonen
Sekizawa
Nelson +Mowrer
AD-B
Pauls
Evacuation Time (5m/s)
0
20
40
60
80
100
5 20 35
Refuge Floor Level
Tim
e (mins)
ELVAC
Siikonen
Sekazawa
Nelson + Mowrer
AD-B
Pauls
Evacuation Time (6m/s)
0
10
20
30
40
50
60
70
80
5 20 35
Refuge Floor Level
Tim
e (mins)
ELVAC
Siikonen
Sekazawa
Nelson + Mowrer
AD-B
Pauls

253
15 Storey Interval – Variable Acceleration
Evacuation Time (7m/s)
0
10
20
30
40
50
60
70
80
5 20 35
Refuge Floor Level
Tim
e (mins)
ELVAC
Siikonen
Sekazawa
Nelson + Mowrer
AD-B
Pauls
Evacuation Time (16m/s)
0
10
20
30
40
50
60
70
5 20 35
Refuge Floor Level
Tim
e (mins)
ELVAC
Siikonen
Sekazawa
Nelson + Mowrer
AD-B
Pauls
Evacuation Time (1.2m/s2)
0
10
20
30
40
50
60
70
80
5 20 35
Refuge Floor Level
Tim
e (mins)
ELVAC
Sekazawa
Nelson + Mowrer
AD-B
Pauls
Evacuation Time (1.5m/s2)
0
10
20
30
40
50
60
70
80
5 20 35
Refuge Floor Level
Tim
e (mins)
ELVAC
Sekazawa
Nelson + Mowrer
AD-B
Pauls

254
15 Storey Interval – Variable Capacity
Evacuation Time (16 persons)
0
10
20
30
40
50
60
70
5 20 35
Refuge Floor Level
Tim
e (mins)
ELVAC
Siikonen
Sekazawa
Nelson +Mowrer
AD-B
Pauls
Evacuation Time (21 persons)
0
10
20
30
40
50
60
70
5 20 35
Refuge Floor Level
Tim
e (mins)
ELVAC
Siikonen
Sekazawa
Nelson + Mowrer
AD-B
Pauls
Evacuation Time (10 persons)
0
20
40
60
80
100
5 20 35
Refuge Floor Level
Tim
e (mins)
ELVAC
Siikonen
Sekazawa
Nelson + Mowrer
AD-B
Pauls
Evacuation Time (12 persons)
0
10
20
30
40
50
60
70
80
5 20 35
Refuge Floor Level
Tim
e (mins)
ELVAC
Siikonen
Sekazawa
Nelson + Mowrer
AD-B
Pauls

255
15 Storey Interval – Variable Lifts
Evacuation Time (4 Lifts)
0
10
20
30
40
50
60
70
80
5 20 35
Refuge Floor Level
Tim
e (mins)
ELVAC
Siikonen
Sekazawa
Nelson + Mowrer
AD-B
Pauls
Evacuation Time (6 Lifts)
0
10
20
30
40
50
60
5 20 35
Refuge Floor Level
Tim
e (mins)
ELVAC
Siikonen
Sekazawa
Nelson + Mowrer
AD-B
Pauls
Evacuation Time (8 Lifts)
0
10
20
30
40
50
60
5 20 35
Refuge Floor Level
Tim
e (mins)
ELVAC
Siikonen
Sekazawa
Nelson + Mowrer
AD-B
Pauls

256
20 Storey Interval – Variable Speed
Evacuation Time (5m/s)
0
20
40
60
80
100
120
10 30
Refuge Floor Level
Tim
e (mins)
ELVAC
Siikonen
Sekazawa
Nelson + Mowrer
AD-B
Pauls
Evacuation Time (6m/s)
0
20
40
60
80
100
10 30
Refuge Floor Level
Tim
e (mins)
ELVAC
Siikonen
Sekazawa
Nelson + Mowrer
AD-B
Pauls
Evacuation Time (7m/s)
0
20
40
60
80
100
10 30
Refuge Floor Level
Tim
e (mins)
ELVAC
Siikonen
Sekazawa
Nelson + Mowrer
AD-B
Pauls
Evacuation Time (16m/s)
0
20
40
60
80
100
10 30
Refuge Floor Level
Tim
e (mins)
ELVAC
Siikonen
Sekazawa
Nelson + Mowrer
AD-B
Pauls

257
20 Storey Interval – Variable Acceleration
20 Storey Interval – Variable Capacity
Evacuation Time (1.2m/s2)
0
20
40
60
80
100
10 30
Refuge Floor Level
Tim
e (mins)
ELVAC
Sekazawa
Nelson +Mowrer
AD-B
Pauls
Evacuation Time (1.5m/s2)
0
20
40
60
80
100
10 30
Refuge Floor Level
Tim
e (mins)
ELVAC
Sekazawa
Nelson +Mowrer
AD-B
Pauls
Evacuation Time (10 persons)
0
20
40
60
80
100
120
10 30
Refuge Floor Level
Tim
e (mins)
ELVAC
Siikonen
Sekazawa
Nelson + Mowrer
AD-B
Pauls
Evacuation Time (12 persons)
0
20
40
60
80
100
10 30
Refuge Floor Level
Tim
e (mins)
ELVAC
Siikonen
Sekazawa
Nelson +Mowrer
AD-B
Pauls

258
20 Storey Interval – Variable Lifts
Evacuation Time (16 persons)
0
20
40
60
80
100
10 30
Refuge Floor Level
Tim
e (mins)
ELVAC
Siikonen
Sekazawa
Nelson +Mowrer
AD-B
Pauls
Evacuation Time (21 persons)
0
10
20
30
40
50
60
70
80
10 30
Refuge Floor Level
Tim
e (mins)
ELVAC
Siikonen
Sekazawa
Nelson + Mowrer
AD-B
Pauls
Evacuation Time (4 Lifts)
0
20
40
60
80
100
10 30
Refuge Floor Level
Tim
e (mins)
ELVAC
Siikonen
Sekazawa
Nelson +Mowrer
AD-B
Pauls
Evacuation Time (6 Lifts)
0
10
20
30
40
50
60
70
10 30
Refuge Floor Level
Tim
e (mins)
ELVAC
Siikonen
Sekazawa
Nelson +Mowrer
AD-B
Pauls

259
25 Storey Interval – Variable Speed
Evacuation Time (8 Lifts)
0
10
20
30
40
50
60
70
10 30
Refuge Floor Level
Tim
e (mins)
ELVAC
Siikonen
Sekazawa
Nelson +Mowrer
AD-B
Pauls
Evacuation Time (5m/s)
122.5 122.2
44.426.4
16.7 18.2
020406080100120140
ELVAC
Siikonen
Sekizawa
Nelson +
Mowrer
AD-B
Pauls
Calculation Method
Tim
e (mins)
Evacuation Time (6m/s)
112.5 109.2
3926.4
16.7 18.2
0
20
40
60
80
100
120
ELVAC
Siikonen
Sekizawa
Nelson +
Mowrer
AD-B
Pauls
Calculation Method
Tim
e (mins)

260
25 Storey Interval – Variable Acceleration
Evacuation Time (7m/s)
106 99.9
35.426.4
16.7 18.2
0
20
40
60
80
100
120ELVAC
Siikonen
Sekizawa
Nelson +
Mowrer
AD-B
Pauls
Calculation Method
Tim
e (mins)
Evacuation Time (16m/s)
93.7
68.6
29.5 26.416.7 18.2
0
20
40
60
80
100
ELVAC Siikonen Sekizaw a Nelson +
Mow rer
AD-B Pauls
Calculation Method
Tim
e (mins)
Evacuation Time (1.2m/s2)
112.5
81.6
26.416.7 18.2
0
20
40
60
80
100
120
ELVAC Sekizaw a Nelson +
Mow rer
AD-B Pauls
Calculation Method
Tim
e (mins)
Evacuation Time (1.5m/s2)
110
77.8
26.416.7 18.2
0
20
40
60
80
100
120
ELVAC Sekizaw a Nelson +
Mow rer
AD-B Pauls
Calculation Method
Tim
e (mins)

261
25 Storey Interval – Variable Capacity
Evacuation Time (10 persons)
130.1
104
3926.4 16.7 18.2
020406080100120140
ELVAC
Siikonen
Sekizawa
Nelson +
Mowrer
AD-B
Pauls
Calculation Method
Tim
e (mins)
Evacuation Time (12 persons)
112.5 109.2
3926.4
16.7 18.2
0
20
40
60
80
100
120
ELVAC
Siikonen
Sekizawa
Nelson +
Mowrer
AD-B
Pauls
Calculation Method
Tim
e (mins)
Evacuation Time (16 persons)
95.379.7
26 26.416.7 18.2
0
20
40
60
80
100
120
ELVAC Siikonen Sekizaw a Nelson +
Mow rer
AD-B Pauls
Calculation Method
Tim
e (mins)
Evacuation Time (21 persons)
77.688.4
26 26.416.7 18.2
0
20
40
60
80
100
ELVAC Siikonen Sekizaw a Nelson +
Mow rer
AD-B Pauls
Calculation Method
Tim
e (mins)

262
25 Storey Interval – Variable Lifts
Evacuation Time (4 Lifts)
112.5 109.2
3926.4
16.7 18.2
0
20
40
60
80
100
120
ELVAC
Siikonen
Sekizawa
Nelson +
Mowrer
AD-B
Pauls
Calculation Method
Tim
e (mins)
Evacuation Time (6 Lifts)
75.3 72.8
26 26.416.7 18.2
0
20
40
60
80
ELVAC
Siikonen
Sekizawa
Nelson +
Mowrer
AD-B
Pauls
Calculation Method
Tim
e (mins)
Evacuation Time (8 Lifts)
40.9
72.8
26 26.416.7 18.2
0
20
40
60
80
ELVAC Siikonen Sekizaw a Nelson +
Mow rer
AD-B Pauls
Calculation Method
Tim
e (mins)

263
APPENDIX F - EVACUATION FROM EVACUATION ZONE (50% LIFT USAGE)

264
10 Storey Interval – Variable Speed
Evacuation Time (5m/s)
0
10
20
30
40
50
60
10 20 30 40
Refuge floor level
Tim
e (mins)
ELVAC
Siikonen
Sekizawa
Nelson +Mowrer
AD-B
Pauls
Evacuation Time (6m/s)
0
10
20
30
40
50
60
10 20 30 40
Refuge Floor Level
Tim
e (mins)
ELVAC
Siikonen
Sekizawa
Nelson +Mowrer
AD-B
Pauls
Evacuation Time (7m/s)
0
10
20
30
40
50
60
10 20 30 40
Refuge Floor Level
Tim
e (mins)
ELVAC
Siikonen
Sekizawa
Nelson +Mowrer
AD-B
Pauls
Evacuation Time (16m/s)
0
10
20
30
40
50
60
10 20 30 40
Refuge Floor Level
Tim
e (mins)
ELVAC
Siikonen
Sekizawa
Nelson + Mowrer
AD-B
Pauls

265
10 Storey Interval – Variable Acceleration
10 Storey Interval – Variable Capacity
Evacuation Time (1.2m/s2)
0
10
20
30
40
50
60
10 20 30 40
Refuge Floor Level
Tim
e (mins)
ELVAC
Sekizawa
Nelson + Mowrer
AD-B
Pauls
Evacuation Time (1.5m/s2)
0
10
20
30
40
50
60
10 20 30 40
Refuge Floor Level
Tim
e (mins)
ELVAC
Sekizawa
Nelson +Mowrer
AD-B
Pauls
Evacuation Time (10 persons)
0
10
20
30
40
50
60
10 20 30 40
Refuge Floor Level
Tim
e (mins)
ELVAC
Siikonen
Sekizawa
Nelson + Mowrer
AD-B
Pauls
Evacuation Time (12 persons)
0
10
20
30
40
50
60
10 20 30 40
Refuge Floor Level
Tim
e (mins)
ELVAC
Siikonen
Sekizawa
Nelson + Mowrer
AD-B
Pauls

266
10 Storey Interval – Variable Lifts
Evacuation Time (16 persons)
0
10
20
30
40
50
60
10 20 30 40
Refuge Floor Level
Tim
e (mins)
ELVAC
Siikonen
Sekizawa
Nelson + Mowrer
AD-B
Pauls
Evacuation Time (21 persons)
0
10
20
30
40
50
60
10 20 30 40
Refuge Floor Level
Tim
e (mins)
ELVAC
Siikonen
Sekizawa
Nelson + Mowrer
AD-B
Pauls
Evacuation Time (4 Lifts)
0
10
20
30
40
50
60
10 20 30 40
Refuge Floor Level
Tim
e (mins)
ELVAC
Siikonen
Sekizawa
Nelson +Mowrer
AD-B
Pauls
Evacuation Time (6 Lifts)
0
10
20
30
40
50
60
10 20 30 40
Refuge Floor Level
Tim
e (mins)
ELVAC
Siikonen
Sekizawa
Nelson +Mowrer
AD-B
Pauls

267
15 Storey Interval – Variable Speed
Evacuation Time (8 Lifts)
0
10
20
30
40
50
60
10 20 30 40
Refuge Floor Level
Tim
e (mins)
ELVAC
Siikonen
Sekizawa
Nelson +Mowrer
AD-B
Pauls
Evacuation Time (5m/s)
0
10
20
30
40
50
60
5 20 35
Refuge Floor Level
Tim
e (mins)
ELVAC
Siikonen
Sekazawa
Nelson + Mowrer
AD-B
Pauls
Evacuation Time (6m/s)
0
10
20
30
40
50
60
5 20 35
Refuge Floor Level
Tim
e (mins)
ELVAC
Siikonen
Sekazawa
Nelson + Mowrer
AD-B
Pauls

268
15 Storey Interval – Variable Acceleration
Evacuation Time (7m/s)
0
10
20
30
40
50
60
5 20 35
Refuge Floor Level
Tim
e (mins)
ELVAC
Siikonen
Sekazawa
Nelson + Mowrer
AD-B
Pauls
Evacuation Time (16m/s)
0
10
20
30
40
50
60
5 20 35
Refuge Floor Level
Tim
e (mins)
ELVAC
Siikonen
Sekazawa
Nelson + Mowrer
AD-B
Pauls
Evacuation Time (1.2m/s2)
0
10
20
30
40
50
60
5 20 35
Refuge Floor
Tim
e (mins)
ELVAC
Sekazawa
Nelson + Mowrer
AD-B
Pauls
Evacuation Time (1.5m/s2)
0
10
20
30
40
50
60
5 20 35
Refuge Floor
Tim
e (mins)
ELVAC
Sekazawa
Nelson + Mowrer
AD-B
Pauls

269
15 Storey Interval – Variable Capacity
Evacuation Time (12 persons)
0
10
20
30
40
50
60
5 20 35
Refuge Floor Level
Tim
e (mins)
ELVAC
Siikonen
Sekazawa
Nelson +Mowrer
AD-B
Pauls
Evacuation Time (10 persons)
0
10
20
30
40
50
60
70
5 20 35
Refuge Floor Level
Tim
e (mins)
ELVAC
Siikonen
Sekazawa
Nelson +Mowrer
AD-B
Pauls
Evacuation Time (16 persons)
0
10
20
30
40
50
60
5 20 35
Refuge Floor Level
Tim
e (mins)
ELVAC
Siikonen
Sekazawa
Nelson +Mowrer
AD-B
Pauls
Evacuation Time (21 persons)
0
10
20
30
40
50
60
5 20 35
Refuge Floor Level
Tim
e (mins)
ELVAC
Siikonen
Sekazawa
Nelson + Mowrer
AD-B
Pauls

270
15 Storey Interval – Variable Lifts
Evacuation Time (4 Lifts)
0
10
20
30
40
50
60
5 20 35
Refuge Floor Level
Tim
e (mins)
ELVAC
Siikonen
Sekazawa
Nelson + Mowrer
AD-B
Pauls
Evacuation Time (6 Lifts)
0
10
20
30
40
50
60
5 20 35
Refuge Floor Level
Tim
e (mins)
ELVAC
Siikonen
Sekazawa
Nelson + Mowrer
AD-B
Pauls
Evacuation Time (8 Lifts)
0
10
20
30
40
50
60
5 20 35
Refuge Floor Level
Tim
e (mins)
ELVAC
Siikonen
Sekazawa
Nelson + Mowrer
AD-B
Pauls

271
20 Storey Interval – Variable Speed
Evacuation Time (5m/s)
0
10
20
30
40
50
60
70
80
10 30
Refuge Floor Level
Tim
e (mins)
ELVAC
Siikonen
Sekazawa
Nelson + Mowrer
AD-B
Pauls
Evacuation Time (6m/s)
0
10
20
30
40
50
60
70
10 30
Refuge Floor Level
Tim
e (mins)
ELVAC
Siikonen
Sekazawa
Nelson + Mowrer
AD-B
Pauls
Evacuation Time (7m/s)
0
10
20
30
40
50
60
70
10 30
Refuge Floor Level
Tim
e (mins)
ELVAC
Siikonen
Sekazawa
Nelson + Mowrer
AD-B
Pauls
Evacuation Time (16m/s)
0
10
20
30
40
50
60
10 30
Refuge Floor Level
Tim
e (mins)
ELVAC
Siikonen
Sekazawa
Nelson + Mowrer
AD-B
Pauls

272
20 Storey Interval – Variable Acceleration
20 Storey Interval – Variable Capacity
Evacuation Time (1.2m/s2)
0
10
20
30
40
50
60
70
10 30
Refuge Floor Level
Tim
e (mins)
ELVAC
Siikonen
Sekazawa
Nelson +Mowrer
AD-B
Pauls
Evacuation Time (1.5m/s2)
0
20
40
60
80
10 30
Refuge Floor Level
Tim
e (mins)
ELVAC
Siikonen
Sekazawa
Nelson +Mowrer
AD-B
Pauls
Evacuation Time (10 persons)
0
10
20
30
40
50
60
70
80
10 30
Refuge Floor Level
Tim
e (mins)
ELVAC
Siikonen
Sekazawa
Nelson +Mowrer
AD-B
Pauls
Evacuation Time (12 persons)
0
10
20
30
40
50
60
70
10 30
Refuge Floor Level
Tim
e (mins)
ELVAC
Siikonen
Sekazawa
Nelson +Mowrer
AD-B
Pauls

273
20 Storey Interval – Variable Lifts
Evacuation Time (16 persons)
0
10
20
30
40
50
60
70
80
10 30
Refuge Floor Level
Tim
e (mins)
ELVAC
Siikonen
Sekazawa
Nelson +Mowrer
AD-B
Pauls
Evacuation Time (21 persons)
0
10
20
30
40
50
60
10 30
Refuge Floor Level
Tim
e (mins)
ELVAC
Siikonen
Sekazawa
Nelson + Mowrer
AD-B
Pauls
Evacuation Time (4 Lifts)
0
10
20
30
40
50
60
70
10 30
Refuge Floor Level
Tim
e (mins)
ELVAC
Siikonen
Sekazawa
Nelson +Mowrer
AD-B
Pauls
Evacuation Time (6 Lifts)
0
10
20
30
40
50
60
70
10 30
Refuge Floor Level
Tim
e (mins)
ELVAC
Siikonen
Sekazawa
Nelson +Mowrer
AD-B
Pauls

274
25 Storey Interval – Variable Speed
Evacuation Time (8 Lifts)
0
10
20
30
40
50
60
10 30
Refuge Floor Level
Tim
e (mins)
ELVAC
Siikonen
Sekazawa
Nelson +Mowrer
AD-B
Pauls
Evacuation Time (5m/s)
85.3 81.5
59.2 52.6
33.2 35.6
0
20
40
60
80
100
ELVAC
Siikonen
Sekizawa
Nelson +
Mowrer
AD-B
Pauls
Calculation Method
Tim
e (mins)
Evacuation Time (6m/s)
78.3 72.8
52 52.6
33.2 35.6
0
20
40
60
80
100
ELVAC
Siikonen
Sekizawa
Nelson +
Mowrer
AD-B
Pauls
Calculation Method
Tim
e (mins)
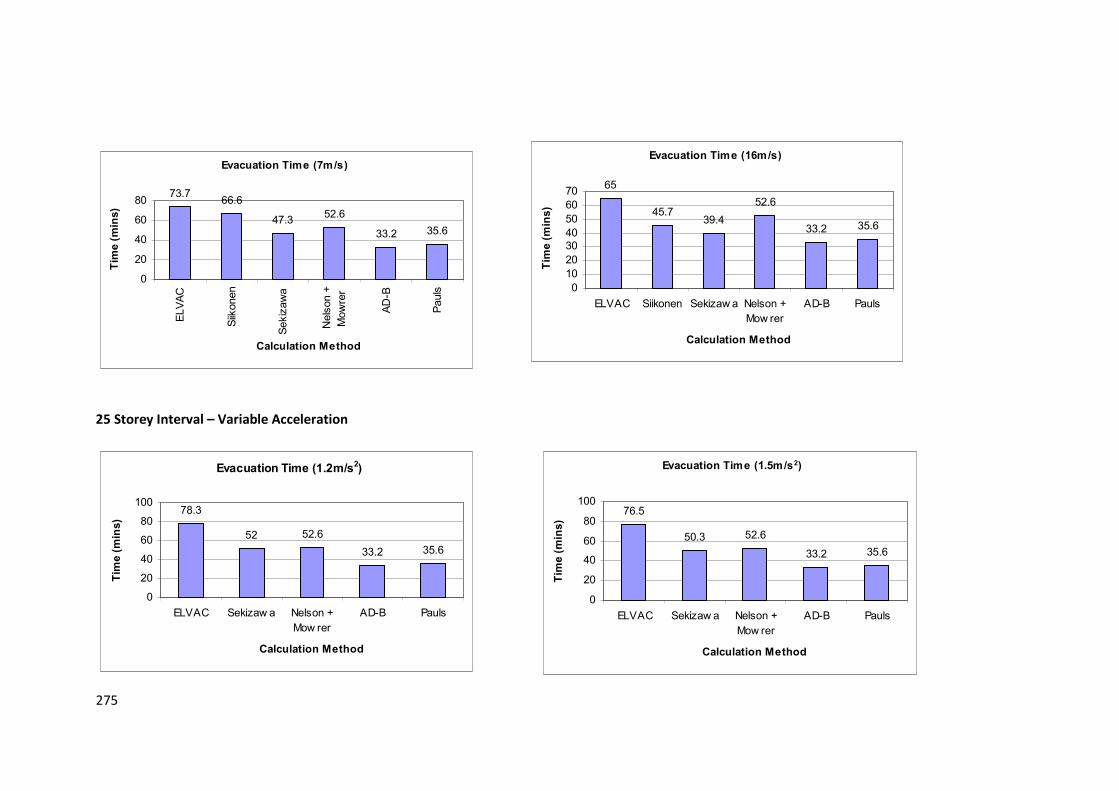
275
25 Storey Interval – Variable Acceleration
Evacuation Time (7m/s)
73.766.6
47.352.6
33.2 35.6
0
20
40
60
80
ELVAC
Siikonen
Sekizawa
Nelson +
Mowrer
AD-B
Pauls
Calculation Method
Tim
e (mins)
Evacuation Time (16m/s)
65
45.739.4
52.6
33.2 35.6
0
10
20
30
40
50
60
70
ELVAC Siikonen Sekizaw a Nelson +
Mow rer
AD-B Pauls
Calculation Method
Tim
e (mins)
Evacuation Time (1.2m/s2)
78.3
52 52.6
33.2 35.6
0
20
40
60
80
100
ELVAC Sekizaw a Nelson +
Mow rer
AD-B Pauls
Calculation Method
Tim
e (mins)
Evacuation Time (1.5m/s2)
76.5
50.3 52.6
33.2 35.6
0
20
40
60
80
100
ELVAC Sekizaw a Nelson +
Mow rer
AD-B Pauls
Calculation Method
Tim
e (mins)

276
25 Storey Interval – Variable Capacity
Evacuation Time (10 persons)
86.9
69.3
52 52.6
33.2 35.6
0
20
40
60
80
100
ELVAC
Siikonen
Sekizawa
Nelson +
Mowrer
AD-B
Pauls
Calculation Method
Tim
e (mins)
Evacuation Time (12 persons)
78.3 72.8
52 52.6
33.2 35.6
0
20
40
60
80
100
ELVAC
Siikonen
Sekizawa
Nelson +
Mowrer
AD-B
Pauls
Calculation Method
Tim
e (mins)
Evacuation Time (16 persons)
60.6
79.7
39
52.6
33.2 35.6
0
20
40
60
80
100
ELVAC Siikonen Sekizaw a Nelson +
Mow rer
AD-B Pauls
Calculation Method
Tim
e (mins)
Evacuation Time (21 persons)
51.9
44.2
26
52.6
33.2 35.6
0
10
20
30
40
50
60
ELVAC Siikonen Sekizaw a Nelson +
Mow rer
AD-B Pauls
Calculation Method
Tim
e (mins)

277
25 Storey Interval – Variable Lifts
Evacuation Time (4 Lifts)
72.8
52 52.6
33.2 35.6
0
20
40
60
80
Siikonen
Sekizawa
Nelson +
Mowrer
AD-B
Pauls
Calculation Method
Tim
e (mins)
Evacuation Time (6 Lifts)
52.5
72.8
33.3
52.6
33.2 35.6
0
20
40
60
80
ELVAC
Siikonen
Sekizawa
Nelson +
Mowrer
AD-B
Pauls
Calculation Method
Tim
e (mins)
Evacuation Time (8 Lifts)
39.736.4
26
52.6
33.2 35.6
0
10
20
30
40
50
60
ELVAC Siikonen Sekizaw a Nelson +
Mow rer
AD-B Pauls
Calculation Method
Tim
e (mins)
Related Documents