1492 IEEE TRANSACTIONS ON BIOMEDICAL ENGINEERING, VOL. 64, NO. 7, JULY 2017 Efficient Descriptor-Based Segmentation of Parotid Glands With Nonlocal Means Christian Wachinger ∗ , Matthew Brennan, Greg C. Sharp, and Polina Golland Abstract—Objective: We introduce descriptor-based seg- mentation that extends existing patch-based methods by combining intensities, features, and location information. Since it is unclear which image features are best suited for patch selection, we perform a broad empirical study on a multitude of different features. Methods: We extend nonlocal means segmentation by including image features and location information. We search larger windows with an efficient nearest neighbor search based on kd-trees. We compare a large number of image features. Results: The best results were obtained for entropy image features, which have not yet been used for patch-based segmenta- tion. We further show that searching larger image regions with an approximate nearest neighbor search and location information yields a significant improvement over the bounded nearest neighbor search traditionally employed in patch-based segmentation methods. Conclusion: Features and location information significantly increase the segmen- tation accuracy. The best features highlight boundaries in the image. Significance: Our detailed analysis of several aspects of nonlocal means-based segmentation yields new insights about patch and neighborhood sizes together with the inclusion of location information. The presented approach advances the state-of-the-art in the segmentation of parotid glands for radiation therapy planning. Index Terms—Features, location, parotid glands, patches, segmentation. I. INTRODUCTION T HE automatic segmentation of parotid glands in head and neck CT images supports intensity-modulated radiation therapy planning. Atlas-based segmentation methods often use Manuscript received June 21, 2016; revised July 28, 2016; accepted August 18, 2016. Date of publication September 16, 2016; date of current version June 15, 2017. This work was supported in part by the Humboldt foundation, the National Alliance for Medical Image Computing (NIH NIBIB NAMIC U54-EB005149) and the NeuroImaging Analysis Center (NIH NIBIB NAC P41-EB-015902). Asterisk indicates corresponding author. ∗ C. Wachinger is with the Computer Science and Artificial In- telligence Lab, Massachusetts Institute of Technology, Cambridge, MA 02139 USA, and with the Department of Child and Ado- lescent Psychiatry, Psychosomatic and Psychotherapy, Ludwig- Maximilian-University Munich, Munich 80539, Germany, and also with the Department of Neurology, Massachusetts General Hos- pital, Harvard Medical School, Cambridge, MA 02115 USA (e-mail: [email protected]). M. Brennan and P. Golland are with the Computer Science and Artificial Intelligence Lab, Massachusetts Institute of Technology. G. C. Sharp is with the Department of Radiation Oncology, Mas- sachusetts General Hospital, Harvard Medical School. This paper has supplementary downloadable material available at http://ieeexplore.ieee.org. Digital Object Identifier 10.1109/TBME.2016.2603119 deformable image registration to associate each voxel in a test image with a set of voxels in training images, and apply a label propagation scheme to segment the test image [1]–[5]. Instead of registering whole images, patch-based segmentation com- pares patches of intensity values to establish correspondences between test and training voxels of similar local image content [6]–[9]. However, intensity values are just one possible descrip- tion of image content. We present a natural generalization of patch-based segmentation to descriptor-based segmentation by including image features and location information as well as patches of intensity values in descriptor vectors representing local image content. Our results show that the additional dis- criminative information in the descriptor improves segmentation accuracy. Our method is based on the nonlocal means (NLM) frame- work introduced in [10], which produces state-of-the-art results for patch-based segmentation [6], [7]. The principal idea behind NLM is to compare patches across the entire image domain and to base the comparison solely on patch intensity values with- out taking their locations in the image domain into account. In the actual implementation of NLM for image denoising [10], the search window is reduced from the entire image domain to neighborhoods of 21 × 21 pixels to address computational concerns. Similarly, [6] and [7] restrict the search window to range from 9 × 9 × 9 to 15 × 15 × 15 voxels to improve com- putational efficiency, assuming an initial affine alignment of the images. In our study, we employ an efficient approximate nearest neighbor (ANN) search allowing us to work with larger search windows that contain the entire parotid gland, which bet- ter reflects the original idea of NLM to consider the entire im- age domain. Counterintuitively, our experimental results show that larger search windows lead to less accurate segmentation results. This suggests that the spatial information implicitly in- corporated by restricting the search to small windows not only improves computational efficiency but also has a direct influ- ence on segmentation accuracy. However, spatially biasing the result by restricting search windows has two disadvantages: (1) it imposes a hard spatial cutoff and therefore a discontinuous rather than a soft bias; and (2) it does not provide spatial context within the search window. Contrary to the idea behind NLM, we explicitly incorporate location information in the comparison of patches, introducing a soft bias toward spatially closer patches. With the explicit inclusion of location information, we extend the search window from small neighborhoods to regions con- taining the entire target structure. The computational concerns accompanying these large search regions are addressed with 0018-9294 © 2016 IEEE. Personal use is permitted, but republication/redistribution requires IEEE permission. See http://www.ieee.org/publications standards/publications/rights/index.html for more information.

Welcome message from author
This document is posted to help you gain knowledge. Please leave a comment to let me know what you think about it! Share it to your friends and learn new things together.
Transcript

1492 IEEE TRANSACTIONS ON BIOMEDICAL ENGINEERING, VOL. 64, NO. 7, JULY 2017
Efficient Descriptor-Based Segmentation ofParotid Glands With Nonlocal Means
Christian Wachinger∗, Matthew Brennan, Greg C. Sharp, and Polina Golland
Abstract—Objective: We introduce descriptor-based seg-mentation that extends existing patch-based methods bycombining intensities, features, and location information.Since it is unclear which image features are best suitedfor patch selection, we perform a broad empirical studyon a multitude of different features. Methods: We extendnonlocal means segmentation by including image featuresand location information. We search larger windows withan efficient nearest neighbor search based on kd-trees.We compare a large number of image features. Results:The best results were obtained for entropy image features,which have not yet been used for patch-based segmenta-tion. We further show that searching larger image regionswith an approximate nearest neighbor search and locationinformation yields a significant improvement over thebounded nearest neighbor search traditionally employed inpatch-based segmentation methods. Conclusion: Featuresand location information significantly increase the segmen-tation accuracy. The best features highlight boundaries inthe image. Significance: Our detailed analysis of severalaspects of nonlocal means-based segmentation yieldsnew insights about patch and neighborhood sizes togetherwith the inclusion of location information. The presentedapproach advances the state-of-the-art in the segmentationof parotid glands for radiation therapy planning.
Index Terms—Features, location, parotid glands,patches, segmentation.
I. INTRODUCTION
THE automatic segmentation of parotid glands in head andneck CT images supports intensity-modulated radiation
therapy planning. Atlas-based segmentation methods often use
Manuscript received June 21, 2016; revised July 28, 2016; acceptedAugust 18, 2016. Date of publication September 16, 2016; date of currentversion June 15, 2017. This work was supported in part by the Humboldtfoundation, the National Alliance for Medical Image Computing (NIHNIBIB NAMIC U54-EB005149) and the NeuroImaging Analysis Center(NIH NIBIB NAC P41-EB-015902). Asterisk indicates correspondingauthor.
∗C. Wachinger is with the Computer Science and Artificial In-telligence Lab, Massachusetts Institute of Technology, Cambridge,MA 02139 USA, and with the Department of Child and Ado-lescent Psychiatry, Psychosomatic and Psychotherapy, Ludwig-Maximilian-University Munich, Munich 80539, Germany, and alsowith the Department of Neurology, Massachusetts General Hos-pital, Harvard Medical School, Cambridge, MA 02115 USA(e-mail: [email protected]).
M. Brennan and P. Golland are with the Computer Science and ArtificialIntelligence Lab, Massachusetts Institute of Technology.
G. C. Sharp is with the Department of Radiation Oncology, Mas-sachusetts General Hospital, Harvard Medical School.
This paper has supplementary downloadable material available athttp://ieeexplore.ieee.org.
Digital Object Identifier 10.1109/TBME.2016.2603119
deformable image registration to associate each voxel in a testimage with a set of voxels in training images, and apply a labelpropagation scheme to segment the test image [1]–[5]. Insteadof registering whole images, patch-based segmentation com-pares patches of intensity values to establish correspondencesbetween test and training voxels of similar local image content[6]–[9]. However, intensity values are just one possible descrip-tion of image content. We present a natural generalization ofpatch-based segmentation to descriptor-based segmentation byincluding image features and location information as well aspatches of intensity values in descriptor vectors representinglocal image content. Our results show that the additional dis-criminative information in the descriptor improves segmentationaccuracy.
Our method is based on the nonlocal means (NLM) frame-work introduced in [10], which produces state-of-the-art resultsfor patch-based segmentation [6], [7]. The principal idea behindNLM is to compare patches across the entire image domain andto base the comparison solely on patch intensity values with-out taking their locations in the image domain into account. Inthe actual implementation of NLM for image denoising [10],the search window is reduced from the entire image domainto neighborhoods of 21 × 21 pixels to address computationalconcerns. Similarly, [6] and [7] restrict the search window torange from 9 × 9 × 9 to 15 × 15 × 15 voxels to improve com-putational efficiency, assuming an initial affine alignment ofthe images. In our study, we employ an efficient approximatenearest neighbor (ANN) search allowing us to work with largersearch windows that contain the entire parotid gland, which bet-ter reflects the original idea of NLM to consider the entire im-age domain. Counterintuitively, our experimental results showthat larger search windows lead to less accurate segmentationresults. This suggests that the spatial information implicitly in-corporated by restricting the search to small windows not onlyimproves computational efficiency but also has a direct influ-ence on segmentation accuracy. However, spatially biasing theresult by restricting search windows has two disadvantages: (1)it imposes a hard spatial cutoff and therefore a discontinuousrather than a soft bias; and (2) it does not provide spatial contextwithin the search window. Contrary to the idea behind NLM, weexplicitly incorporate location information in the comparison ofpatches, introducing a soft bias toward spatially closer patches.With the explicit inclusion of location information, we extendthe search window from small neighborhoods to regions con-taining the entire target structure. The computational concernsaccompanying these large search regions are addressed with
0018-9294 © 2016 IEEE. Personal use is permitted, but republication/redistribution requires IEEE permission.See http://www.ieee.org/publications standards/publications/rights/index.html for more information.

WACHINGER et al.: EFfiCIENT DESCRIPTOR-BASED SEGMENTATION OF PAROTID GLANDS WITH NONLOCAL MEANS 1493
an ANN search. We find that this approach yields a significantimprovement in segmentation accuracy over an exact nearestneighbor search within a restricted search window.
In addition to location information, we incorporate imagefeatures into the descriptor. A large number of image featureshave been proposed in the computer vision literature and apriori it is unclear which of these features best complementpatch intensity values for segmenting medical images. Inthis study, we empirically evaluate the performance of fifteenfeatures. Some of these features were initially proposed fortwo-dimensional (2-D) images—we discuss and evaluate 3-Dextensions of these features. We investigate the parametersinvolved in descriptor-based segmentation, e.g., patch sizes,feature and location weights, the composition of the descriptor,and the number of nearest neighbors. This comprehensiveanalysis leads to new insights into the behavior of NLM seg-mentation methods in general. Notably, we find that decouplingthe size of the intensity patch and the size of the label patchin the multipoint (MP) label propagation method improvessegmentation accuracy. We also introduce multiscale patchesthat combine the intensity information from multiple scalesand therefore provide additional context.
We evaluate our descriptor-based framework by applying it tothe segmentation of parotid glands of patients undergoing radi-ation therapy. In intensity-modulated radiation therapy, expertsdelineate the most critical structures, also known as organs atrisk, and use the generated segmentations to reduce the irradi-ation of healthy tissue and potential side effects. The parotidglands are critical salivary glands. Irradiation of the parotidglands in patients with head and neck cancer leads to xeros-tomia, a condition that interferes with mastication, deglutition,and speech in patients. The automatic segmentation of parotidglands is particularly challenging due to the low soft tissue con-trast in CT images and the high anatomical variability of theglands among patients.
A. Related Work
Atlas-based segmentation of parotid glands with deformableregistration has been previously investigated [11], [12]. In [13],an active shape model of parotid glands was constructed with theatlas images. The refinement of head and neck segmentationsbased on patch classification with features was proposed in [14].The approach in [15] applied label fusion to initialize a segmen-tation pipeline that employs statistical appearance models andgeodesic active contours.
Patch-based segmentation approaches as described within theNLM framework were proposed in [6] and[7]. Recently, thePatchMatch algorithm [16] was applied for NLM-based seg-mentation [17]. In contrast to our work, features and explicitlocation information were not included. For the segmentationof the hippocampus, the application of ball trees in combina-tion with location was proposed [18]. In previous work, weused a patch-based method to segment the parotid glands us-ing the NLM framework and a random forest classifier [8], [9].We refined the initial segmentations based on image contourswith Gaussian process regression. Sparse coding is a related
extension of patch-based segmentation that was combined withthe Haar-wavelet, histogram of oriented gradients (HoG), andlocal binary patterns (LBP) image features [19]. In [20], threespecific features (intensity, gradient, context) were evaluatedfor the segmentation of cardiac MRI. To summarize, our ap-proach is different from existing work as it combines intensity,patches, and location; compares a much larger number of dif-ferent features; and contrasts bounded search techniques withthe explicit integration of location information. A preliminaryversion of this work was presented at a workshop [21] and hasbeen substantially extended.
II. METHOD
A. Review of NLM Segmentation
Given an atlas A = (I,S) that contains images I ={I1 , . . . , In} and their corresponding segmentations S ={S1 , . . . , Sn} over a common image domain Ω, our objective isto compute the segmentation S of a new image I . Patch-basedmethods are based on the rationale that locations with similarimage content should have similar segmentations, where localimage content is represented by the intensity values in a patchcentered at each voxel. For a patchP (x) from the test image I ata location x ∈ Ω and the collection of all patches in the trainingimages P , we seek the closest patch Patlas(x) in the training set
Patlas(x) = arg minP ∈P
‖P (x) − P‖2 . (1)
Associated with the image patch Patlas(x) is the segmentationpatch Sx , which is used to infer the segmentation S(x) inthe test image around location x. Beyond the nearest neigh-bor Patlas(x) = P 1
atlas(x), we can identify a set of k-nearestneighbor patches from the atlas P 1
atlas(x), . . . , P katlas(x). Two
methods of label propagation are commonly used: (1) point-wise (PW) estimation that only considers the center location ofthe patch Sx [x]; and (2) MP estimation [7] that considers theentire segmentation patch Sx . The label map L is computedunder the two approaches as
LPW(x) =∑k
i=1 w(P (x), P iatlas(x)) · Six [x]
∑ki=1 w(P (x), P i
atlas(x))(2)
LMP(x) =
∑y∈Nx
∑ki=1 w(P (y), P i
atlas(y)) · Siy [x]∑
y∈Nx
∑ki=1 w(P (y), P i
atlas(y))(3)
where Nx is the patch neighborhood around x and Sy [x] is thelabel on the location x of the segmentation patch Sy centered aty. The weight w between patches is defined as
w(P, P ′) = exp
(
−‖P − P ′‖22
2σ2
)
(4)
where σ2 is the variance of the intensity values estimated fromthe entire training set. We also consider an unweighted version ofthe label propagation withw ∝ 1. To obtain the segmentation Sof the test image I , each voxel is assigned to the parotid glandsor the background, depending on which of the labels receive themost votes.

1494 IEEE TRANSACTIONS ON BIOMEDICAL ENGINEERING, VOL. 64, NO. 7, JULY 2017
Fig. 1. Overview of the descriptor-based segmentation algorithm: (1) descriptors consisting of patch intensity values, features, and locationinformation are extracted from the training and test images; labels are extracted from the training images; (2) a k-nearest neighbor (k-NN) searchis performed over the descriptors from the training images for each descriptor from the test image; and (3) the labels of the nearest neighbors areused in label propagation to segment the test image. We compare the performance of a variety of features in (1), of bounded and approximate k-NNsearches in (2), and of PW and multipoint label propagation methods in (3).
B. Descriptor-Based Segmentation
We extend patch-based segmentation to descriptor-based seg-mentation by including image features and location informationas descriptors of image content. Image features capture addi-tional information about contours, gradients, and texture in theimage. The specific features used in this work are described inSection III. We also include location information in the descrip-tor by adding the xyz-coordinates of the center voxel in thepatch, where we assume a rough spatial alignment of the im-ages. Outside of the head, the spatial normalization may be morechallenging so that distances to anatomical landmarks may besuitable alternative for the location information. Location infor-mation imposes a soft spatial constraint on the nearest neighborsearch. This bias is especially important when working withlarge search windows, as described in Section II-C. The de-scriptor vector D(x) is the concatenation of a patch P (x), animage feature F (x), and location information L(x)
D(x) =
⎛
⎜⎜⎝
1σP ·|P (x)|1 / 2 P (x)
f 1 / 2
σF ·|F (x)|1 / 2 F (x)�1 / 2
σL ·|L(x)|1 / 2 L(x)
⎞
⎟⎟⎠ (5)
where f and � are positive weights and each subvector is nor-malized by dividing by the square root of the number of en-tries | · |1/2 and the corresponding standard deviation (STD) σ.These standard deviations are estimated for each subvector fromthe training set. The normalization ensures that the expectedcontributions of each descriptor type to the squared distances‖D −D′‖2
2 is independent of descriptor-specific magnitudesand depends only on the weights f and �. The patch weight in(4) becomes a descriptor weight
w(D,D′) = exp
(
− ‖D −D′‖22
2(1 + f + �)
)
(6)
where the denominator 2(1 + f + �) normalizes the expectedvalue of the exponent to −1. This can be seen by noting that if Pand P ′ are assumed to be independent then the expected valueof ‖P − P ′‖2
2 is 2σ2P ; combining this with symmetric results
for F and L gives that the expected value is −1. We use this
updated definition of the weight for the label propagation in (2)and (3) when working with patch descriptors.
Fig. 1 presents an overview of the descriptor-based segmen-tation algorithm. In the first step, the patch intensity valuesP (x), image features F (x), and location information L(x) areextracted and combined to form the descriptor D(x) for eachvoxel x in both the training and test images. The segmentationpatches Sx are extracted from the training images. In the secondstep, a search is performed over all training image descriptors tofind k nearest neighbors to descriptors in the test image. In thethird step, one of the label propagation methods in (2) and (3)is used to segment the test image using the label information ofthe k nearest neighbors.
C. Nearest Neighbor Search
We evaluate two approaches to performing the k-nearestneighbor search in (1): A bounded and an approximate k-nearestneighbor search. The bounded nearest neighbor (BNN) methodsearches over all locations y within a cubic search window ofside length r centered at x (‖y − x‖1 <
r2 ). This replicates the
search method used in [6] and [7], where the search is restrictedto boxes of sizes between 9 × 9 × 9 and 15 × 15 × 15 voxelsto reduce computation time. To achieve a similar behavior, werestrict the search window to 11 × 11 × 11 by setting r = 11.
A disadvantage of BNN is the hard spatial cutoff it imposesduring search. Increasing the size of the search window rectifiesthe problem at additional cost of computational complexity. Asa compromise, we consider an unbounded ANN search. We usethe randomized kd-tree algorithm implemented in FLANN [22].The kd-tree algorithm is frequently used for ANN. While themethod’s performance generally decreases on high-dimensionaldata, it has been shown that kd-trees perform well on high-dimensional data from image patches, likely due to strong corre-lations in images [22]. The randomized kd-tree algorithm splitsdata along a dimension randomly chosen among the dimensionsof highest variance, rather than that of highest variance as in theclassic kd-tree algorithm. Searching over multiple randomizedkd-trees improves the performance of the algorithm. The ran-domized kd-tree algorithm commonly provides more than 95%

WACHINGER et al.: EFfiCIENT DESCRIPTOR-BASED SEGMENTATION OF PAROTID GLANDS WITH NONLOCAL MEANS 1495
Fig. 2. Feature images computed from the intensity image shown in (a) with the corresponding manual segmentation (b). Mean, median, Gaussian,variance, and STD images are computed using 5 × 5 × 3 windows. Entropy is computed over 5 × 5 × 5 patches. Two different filter orientations areshown for Sobel and Haar; one orientation is shown for the Gabor wavelet. Two of the eight bins of HoG are shown along with the sum of all eightbins. Feature images for Laplacian filter, GradM features, mPb, and LBP are also shown.
of the correct neighbors and is two or more orders of magnitudefaster than the exact search [22].
III. IMAGE FEATURES
In this section, we describe a large variety of features thatwe evaluate as candidates for the descriptor-based segmenta-tion. Next to basic features, we include advanced features thatare popular in computer vision. The features are illustrated inFig. 2. For most of the image features considered, we first pro-cess the entire image to produce a feature image and then extracta patch from the feature image. For example, in filtering the fea-ture F (x) is the patch of the filtered image around x. The sizeof the patches for which F (x) is extracted varies according tothe feature and is specified later in this section. The featuresF (x) are combined with the intensity patches P (x). We evalu-ate our method on intensity patch sizes ranging from 3 × 3 × 1to 9 × 9 × 5 voxels, which includes patch sizes that have been
previously proposed for patch-based segmentation [3], [4], [6]–[9].Small patch sizes yield localized features, which is desirableto support segmentation. But at the same time, small patchesonly provide few samples for the reliable estimation in the pres-ence of noise. Consequently, the selection of the patch size is atradeoff and it is a priori not clear, which patch sizes are bestsuited for which feature. We state the used patch ranges in thefollowing sections; the best patch sizes are listed in the sec-tion about optimal parameter settings.Next to isotropic patches,we particularly consider for larger patch sizes also anisotropicpatches to account for the anisotropy of the voxels of head andneck CT scans.
1) Multiscale Patches: Patch-based approaches contain lim-ited spatial context information, leading to undesirable pair-ings in the nearest neighbor search. Extracting intensity valuesfrom larger patches increases the context considered but leads tohigher memory consumption and computation times. Increasingthe patch size also leads to a sharp decrease in the influence of

1496 IEEE TRANSACTIONS ON BIOMEDICAL ENGINEERING, VOL. 64, NO. 7, JULY 2017
voxels close to the center voxel on the distances ‖D −D′‖22 rel-
ative to that of peripheral voxels. For example, using a 5 × 5 × 5patch instead of a 3 × 3 × 3 patch results in more than a four-fold increase in the number of voxels, causing the added 98outer voxels to dominate the distances ‖D −D′‖2 in compari-son to the original 27 inner voxels. Another natural approach toexpanding the limited spatial context is to employ a multiscaleapproach, creating a Gaussian pyramid and downsampling theimages and segmentations. However, downsampling the seg-mentations is nontrivial along the boundary of the organ wheredownsampled voxels correspond to both organ and backgroundin the original resolution of the image.
We introduce multiscale patches that com-bine high resolution at their center and lowresolution in the surrounding area (see figureon the right for a 2-D illustration). In additionto the standard intensity patch P (x) in the center, we considera 3 × 3 × 3 grid of blocks of the same size as P (x) centeredat x. The multiscale patch consists of P (x) and a summarystatistic for each of the 27 blocks, which we take to be the meanintensity value. The multi-scale patch spatially covers a volume27 times as large as the intensity patch while increasing thelength of the descriptor D(x) by only 27 entries. Going back toour 2-D example, the intensity patch P is a 3 × 3 patch and thefeature F contains nine mean values, each computed in a blockof size 3 × 3. Since the resolution considered by the multiscalepatch decreases significantly outside of P (x), peripheral voxelsin this region do not dominate the distances ‖D −D′‖2
2 . Thisdesign is motivated by the human visual system, where spatialacuity peaks at the central fovea and diminishes with distance.In this study, we consider only two scales; however, this featurehas a natural extension to additional scale levels. We computemultiscale patch features using intensity patch sizes from 3 ×3 × 1 to 9 × 9 × 5.
2) Filter-Based Features: A variety of image features can beobtained by filtering. We consider mean, median, Gaussian, vari-ance, STD, Sobel [23], gradient magnitude (GradM), Laplacianand Gabor wavelet [24], [25] filter features. We extract featuresfrom neighborhoods of size 1 × 1 × 1, 3 × 3 × 3 and 5 × 5 × 5from each of the filtered images.
The mean, median, Gaussian, variance and STD filtered im-ages are computed using masks of size 5 × 5 × 3 and 9 × 9 × 5.Of the feasible mask sizes, 5 × 5 × 3 best captures image char-acteristics around the parotid glands as shown in Fig. 2. A masksize of 9 × 9 × 5 is also tested for comparison. The covariancematrix of the Gaussian filters applied is set to be a diagonal ma-trix with diagonal entries m = 1
32 log 2 · [5 5 3]T . This choice ofcovariance matrix ensures that the full width at half maximumis equal to half of the mask size. Variance and STD images arecomputed using a uniform weighting over the mask.
Sobel image features are computed using two methods: (1)standard 2-D Sobel kernel in the two planar orientations alongeach axial direction to produce six feature images; and (2) 3-DSobel kernel along each axial direction to produce three fea-ture images. GradM features are computed as the magnitude ofthe vector at each voxel consisting of three or six Sobel val-ues, respectively. Laplacian features are computed by applyinga 3-D Laplacian filter of size 3 × 3 × 3. Gabor wavelet fea-
tures are computed with 11 × 11 × 11 filters with bandwidth4, ψ = 0 and λ = 2.5 in 16 directions (θ, φ) = (iπ/4, jπ/4) fori, j = 0, 1, 2, 3, yielding 16 feature images. These parameterssetting were manually varied and determined to be reasonablegiven the image domain. As shown in Fig. 2, filtering with theseparameters captures effectively image characteristics around theparotid glands and in the remainder of the image domain.
3) Entropy Image: Entropy images have been first developedfor multimodal image registration [26]. The information contentof a patch is measured with the Shannon entropy, which is com-puted and stored at the center voxel of the patch. Repeating thiscalculation for all voxels in the image yields the entropy image,which represents the structural information in the image. En-tropy image features measure statistical dispersion in a similarway to variance filters and bear similarities to GradM features.However, unlike variance filters and many gradient features, theentropy image is independent of the magnitude of intensity val-ues and intensity differences. The entropy image also faithfullycaptures the information in complex setups such as triple junc-tions. We compute the entropy of patches of size 5 × 5 × 5 and9 × 9 × 5 voxels and while using 64 bins for density estimation.We extract patches of size 1, 3, and 5 from the entropy imageas features.
4) Histogram of Oriented Gradients: To compute HoG fea-tures, we construct 3-D image gradients in each patch of theimage [27]. These gradients are used to produce a histogramover gradient orientations, where the contribution of each gradi-ent to the histogram is equal to its magnitude. Gradients createdfrom image noise therefore have a lower impact than strong gra-dients at image boundaries. The histograms produced have eightbins corresponding to the eight octants that the 3-D vector canlie in. For applications in computer vision, gradient strengths arelocally normalized to account for changes in illumination [27].Since we work with CT scans, where intensities are measuredin Hounsfield units, we do not apply such a normalization. Weevaluate the neighborhood size for histogram of gradients com-putation from 3 × 3 × 3 to 9 × 9 × 5.
5) Multiscale Probability of Boundary: We compute the mPbas defined in [28]. In the first step, we estimate image and tex-ture gradients per slice with the oriented gradient signal. Thismethod calculates the χ2 distance between the histograms oftwo half-discs at each location for various orientations and atmultiple scales. Textons are computed to quantify the texture byconvolving the image with 17 Gaussian derivative and center-surround filters and by subsequently clustering with k-meansinto 64 classes [29]. Image and texture gradients of multi-ple scales are added to yield the mPb. Features are extractedin 1 × 1 × 1, 3 × 3 × 3, and 5 × 5 × 5 neighborhood from themPb image.
6) Local Binary Patterns: LBP [30] measure the co-occurrence relations between a voxel and its neighbors, en-coding these relations into a binary word and quantifying thetexture in a local region. LBP is primarily used for 2-D images.We work with a 2-D implementation applied on all xy, xz, andyz planar slices1 in the volume. The concurrence statistics for
1http://www.mathworks.com/matlabcentral/fileexchange/36484-local-binary-patterns

WACHINGER et al.: EFfiCIENT DESCRIPTOR-BASED SEGMENTATION OF PAROTID GLANDS WITH NONLOCAL MEANS 1497
Fig. 3. Comparison of Dice volume overlap and modified Hausdorff distances for PW, weighted multipoint (W-MP), unweighted multipoint (U-MP),and the inclusion of location information (+Loc) for the left parotid gland. The red line indicates the median, the boxes extend to the 25th and 75thpercentiles, and the whiskers reach the most extreme values not considered outliers (red crosses). *, **, and *** indicate statistical significancelevels of 0.05, 0.01, and 0.001, respectively.
Fig. 4. Comparison of segmentation results for left parotid gland in apatient with dental artifacts and corresponding Dice scores. We eval-uated (a) MP with location (MP+Loc), (b) PW with location (PW+Loc),(d) MP, and (e) PW. The expert segmentation is shown in (c). The CTslice in (f) illustrates the strong impact of the dental artifact.
these three planes are concatenated. Features are extracted from1 × 1 × 1, 3 × 3 × 3, and 5 × 5 × 5 patches of the feature im-age computed using 3 × 3 and 5 × 5 LBP masks.
7) Haar-Like Features: Haar-like features [31] are computedby considering adjacent rectangular regions at a specific loca-tion in a detection window, summing the pixel intensities ineach region and evaluating the difference between these sums.The key advantage of Haar-like features over most other fea-tures is their low computation time. Integral images enable rapidfeature calculation at many scales. Haar-like features bear a cer-tain similarity to Haar basis functions but also consider patternsthat are more complex than Haar filters. Haar-like features arecomputed using 106 2-D integral kernels approximating hori-zontal and vertical derivatives, second-order partial derivatives,and Gaussian second-order partial derivatives. Since 106 fil-tered images are created in this step, we extract voxels rather
than patches from each of the filtered images to be part of thedescriptor.
IV. EXPERIMENTS
We evaluate each of the methods described in Section II andeach of the features introduced in Section III on a dataset of 18CT scans of patients with head and neck cancer. Each imagewas labeled by a trained anatomist for treatment planning. Theimages contain between 80 and 200 axial slices with a slicethickness of 2.5 mm. We resampled all 18 images to the samein-plane resolution, since we compare voxels and they shouldrepresent the same physical space. The in-plane resolution se-lected was the most commonly encountered in-plane spacing,which was 0.976 mm. In case of substantial variations in imageresolution, which was not the case on our image corpus, moreattention has to be paid to the re-sampling, where particularlyup-sampling is not advised. All images have the left parotid la-beled. The right parotid gland was consumed by a tumor in onepatient. Three of the 18 patients have dental artifacts that modifythe image intensity values in regions around the parotid glands.We segment the left and right parotid glands in each image ina leave-one-out procedure, using the remaining 17 subjects astraining images. To limit the number of patches, we only con-sider every other patch in the training set in a way similar to [7].We measure segmentation quality by calculating the Dice vol-ume overlap score [32] and modified Hausdorff distance [33]between the automatic and manual segmentations. We identifya bounding box around the parotid glands by template matchingthe mandible bone, which is adjacent to the parotid glands. Thisbounding box acts as the common image domain Ω used by thesegmentation method as described in Section II-A.
Below is an outline of our experiments in the followingsections.IV-A. Comparison of PW and multipoint methods in combi-
nation with location information.IV-B. Comparison of bounded and ANN search in combina-
tion with entropy features.

1498 IEEE TRANSACTIONS ON BIOMEDICAL ENGINEERING, VOL. 64, NO. 7, JULY 2017
IV-C. Evaluation of descriptor composition (intensity, loca-tion, and feature) for varying patch and multipoint sizes.
IV-D. Comparison of 15 features in combination with intensi-ties and location.
IV-E. Evaluation of optimal feature parameters.IV-F. Evaluation of the multiscale patch.
In the experiments, we use the following settings if not speci-fied otherwise: 9 × 9 × 5 patches and k = 10 nearest neighbors.To perform the ANN search, we employ the kd-tree algorithmwith 8 trees and 64 checks, specifying that at most 64 leavescan be visited in a single search. We threshold the image at−100 and 150 Hounsfield units, which roughly corresponds tothe range of intensity values in the parotid glands, to lessenthe effects of dental artifacts and image noise on the computeddistances between descriptors. Images are thresholded beforefeature extraction.
A. Evaluation of Location and Label PropagationMethods
In this section, we evaluate the inclusion of location informa-tion in the descriptor and compare PW and MP label propaga-tion methods. We also compare the weighted and unweightedvariants of the MP method. Fig. 3 reports the segmentation re-sults for these methods applied to the left parotid gland, resultsfor the right parotid are shown in the supplementary material.We use paired t-tests to evaluate the statistical significance ofthe differences between the results for each of the methods.We observe a significant improvement using MP label prop-agation over PW label propagation, which is consistent withthe results in [7]. We further observe a significant improvementwhen including location information (Loc) in the descriptor withboth PW and MP label propagation methods. Fig. 3 shows thatthere is no significant difference between the segmentation re-sults obtained using the unweighted and weighted variants ofMP label propagation. We apply the unweighted MP variant inthe remainder of our experiments, since it involves a simplervoting scheme.
As shown in Fig. 3, there are three outlier Dice scores in theresults of the PW and MP labeling for the left parotid. Theseoutliers correspond to patients with dental artifacts. Fig. 4 pro-vides a visualization of qualitative segmentation results for oneof the subjects with dental artifacts together with the corre-sponding Dice scores. The input CT slice demonstrates thestrong impact of the dental artifact on the image. Includinglocation information yields a clear improvement in the gen-erated segmentation as illustrated by Fig. 4 and the Dice in-crease by about 0.7. In this case, location information spa-tially regulates the segmentation, discouraging the selection ofpatches from distant locations in the training images, whichhave a similar intensity profile but correspond to a differentanatomical structure. Furthermore, the MP method smoothesthe generated segmentation along the boundary of the parotidgland and yields a single connected component. Based onthe results in this section, we apply the unweighted MP la-bel propagation method with location information in all furtherexperiments.
B. Evaluation of Nearest Neighbor Methods
In this section, we compare the segmentation results obtainedby applying the bounded k-nearest neighbor search (BNN),which restricts to a 11 × 11 × 11 search window, and the ap-proximate k-nearest neighbor search with location informa-tion (ANN+Loc). We also evaluate the inclusion of featuresin the descriptor by adding entropy features, which we find inSection IV-D are the optimal image features for this task, to thecomparison using the approximate search with location infor-mation (ANN+Loc+Ent). Fig. 5 reports the segmentation resultsfor these three methods. As shown, there is an improvement inboth Dice scores and modified Hausdorff distances on applyingANN with location over BNN. Paired t-tests show that thereis a significant improvement in Dice scores when using ANNwith location. Adding entropy image features to the descriptorfurther improves the Dice scores and Hausdorff distances overBNN. This suggests that entropy image features significantlyimprove the quality of the generated segmentation along itsboundary. In both cases, the proposed methods yield significantimprovements over the traditional bounded search.
To further examine the improvement of ANN with location in-formation over BNN, we compare the spatial distances betweenthe nearest neighbors selected by the two methods. About onefourth of the nearest neighbors found using ANN with loca-tion information are outside the 11 × 11 × 11 search windowof BNN. This implies that BNN excludes a substantial frac-tion of the nearest neighbors found using ANN with location.Since ANN with location significantly outperforms BNN, thissupports the argument made in Section I that the hard cutoffimposed by the restricted search window in BNN leads to lessaccurate segmentations than the soft bias imposed by locationinformation on using ANN. Note that the additional effect ofthe location information in favoring more central patches withinthe search window is not covered by this analysis.
C. Descriptor Composition
While Section IV-A highlighted the importance of includinglocation information in the descriptor, it is unclear whether us-ing only image features or image features in combination withintensity patches leads to the best performance. In this section,we evaluate these different compositions of the descriptor andthe influence of the size of the intensity patch and the size of theMP neighborhood. We use entropy images as a representativefeature in this evaluation.
Fig. 6 reports segmentation results for each of the three com-positions of the descriptor that include location information: (1)patch intensity values, location information, and entropy imagefeatures; (2) patch intensity values and location information;and (3) location information and entropy image features. Weplot the resulting mean Dice scores while varying (a) the size ofthe intensity patch P (x); and (b) the size of the neighborhoodNx used in MP label propagation as described in Section II-A.In the first plot, the size of patch P (x) varies while the sizeof Nx is held constant at 9 × 9 × 5, and in the second plot,the size of Nx varies while the size of P (x) is held constantat 9 × 9 × 5. The experiments depicted in Fig. 6 decouple the

WACHINGER et al.: EFfiCIENT DESCRIPTOR-BASED SEGMENTATION OF PAROTID GLANDS WITH NONLOCAL MEANS 1499
Fig. 5. Comparison of Dice volume overlap and modified Hausdorff distances on the left parotid when using BNN, ANN with location information(ANN+Loc), and ANN with location information and entropy image features (ANN+Loc+Ent). The red line indicates the median, the boxes extendto the 25th and 75th percentiles, and the whiskers reach the most extreme values not considered outliers (red crosses). *, **, and *** indicatesignificance levels at 0.05, 0.01, and 0.001, respectively.
Fig. 6. Mean Dice volume overlap for segmentations of the left parotidsuch that the descriptor contains: (1) patch intensity values, location in-formation, and entropy image features; (2) patch intensity values andlocation information; and (3) location information and entropy image fea-tures. The first subfigure plots the mean Dice scores for each of thesethree compositions against different sizes of the intensity patch P (x).The second subfigure plots these Dice scores against different sizes ofthe MP label propagation neighborhood Nx . The size that is not variedis set to 9 × 9 × 5. Note that the intensity patch size has no influence onthe entropy features, yielding a constant curve with slight variations onlyto the randomness of the ANN search.
sizes of the intensity patch P (x) and neighborhood Nx , whichare typically taken to be equal [7]. We observe that the bestresults are achieved with smaller intensity patches of 5 × 5 × 3to 7 × 7 × 3 voxels. In contrast, comparatively larger neighbor-hoods of 11 × 11 × 7 and 13 × 13 × 7 voxels are required tomaximize segmentation accuracy. As discussed in Section III,peripheral voxels tend to dominate the distances ‖D −D′‖2used by ANN as the patch size increases, potentially leading toless desirable matches. This effect may explain the less accuratesegmentations observed at larger patch sizes. Selecting larger
MP neighborhood sizes transfers larger local patterns from thetraining to the test image. The increased regularization imposedby summing over larger neighborhoods Nx in (3) may be thereason for the improved segmentation results—it causes thegenerated segmentations to account for the presence of strongspatial correlations in CT scans of the parotid glands.
Fig. 6 also implies that patch intensities with location gen-erally improve over entropy image features with location whilethe combination of all three consistently yields the best seg-mentation results. The results for patch intensities and locationfall below that of entropy and location for patch sizes above11 × 11 × 5. Because entropy image features are independentof patch size, the mean Dice scores shown in the first sub-plot in Fig. 6 are approximately constant, with slight variationcaused by the randomness of the ANN search. Furthermore, thecombination of patch intensity values, entropy features, and lo-cation does not exhibit the previously described preference forsmall patch and large neighborhood sizes. Instead, this combi-nation achieves its best performance at medium neighborhoodand patch sizes of 9 × 9 × 5 voxels. Based on these results, weuse intensity patch and MP neighborhood sizes of 9 × 9 × 5voxels when evaluating other image features below.
D. Comparison of Features
In this section, we present the results of an empirical studythat seeks optimal feature selection. As motivated in the previoussections, we apply the unweighted MP method for label prop-agation and use approximate neighbor search. Further, basedon the results of Section IV-C, we use features in combinationwith intensity and location information. The presented resultsin this section are therefore not for using the feature in isolation,but always in combination with intensities and location. Fig. 7compares the segmentation results for the left and right parotidglands achieved using each of the features described in SectionIII to compute the descriptorD(x). For both parotid glands, en-tropy image features perform considerably better than any otherimage features. The next three highest performing features are

1500 IEEE TRANSACTIONS ON BIOMEDICAL ENGINEERING, VOL. 64, NO. 7, JULY 2017
Fig. 7. Comparison of Dice scores for the left and right parotid glands by feature. The top two plots show results for the left parotid gland; thebottom two plots show results for the right parotid gland. In the box-and-whisker diagrams, the red line indicates the median, the boxes extend tothe 25th and 75th percentiles, and the whiskers reach the most extreme values not considered outliers (red crosses). The bar plots show the meanDice scores obtained by each feature. Features in the plots are ordered by median Dice and mean Dice, respectively. Note that different scales onthey-axis are used in these plots.
GradM, HoG, and STD for both the left and right parotid glands.These features are followed by Sobel, multiscale probability ofboundary, and variance image features. The only feature that per-forms slightly worse than including no additional image featuresin the descriptor is the mean image. Details on the parametersfor each image feature are listed in the supplementary material.
A major difference between the results for the left and rightparotid glands is that LBP are one of the medium performingfeatures for the left parotid but one of the worst performing fea-tures for the right parotid, dropping from 8th to 13th place inrelative feature rankings. Gabor wavelet image features exhibita similar decrease in relative feature rankings from the right toleft parotid glands, from 9th to 14th place. Other than these dif-ferences, the relative order of the performances of each featureis fairly consistent from the left to right parotid glands. The bestperforming features measure contours in the image (entropy,GradM, HoG, STD, Sobel, mPb, and variance). It seems reason-able that adding contour information to the descriptor improvesperformance since this captures the change from foreground tobackground in patches. Instead of only matching patches thathave an overall similar appearance, adding gradient-based fea-tures ensures that the matched patches contain similar contours.In contrast, smoothing filter features such as mean, median, orGauss features provide less information complementary to theintensity patch and do not yield a large improvement over patchintensity values alone.
E. Optimal Feature Parameters
This section discusses the optimal weights f and � for eachfeature and the optimal feature-specific parameters and imple-mentations outlined in Section III. The weights f and � deter-mine the influence of the feature and location component in thedescriptor, cf. (5). Table I reports the range of feature weights f
and location weights � that achieved the mean Dice scores within0.002 of the highest mean Dice for each feature in the results forthe left parotid and within 0.003 of the highest mean Dice in theresults for the right parotid. Different thresholds were chosen toaccount for the difference in the ranges of mean Dice scores forthe left and right parotids. We evaluated weights f and � in therange from 0.01 to 5.0. As shown in the table, the optimal lo-cation weights � were between 0.2 and 1.0. The optimal featureweights f varied significantly between different features. Thefeatures with the highest segmentation accuracy such as entropyimage features and gradient image features generally performedwell with higher feature weights. The features with the lowestsegmentation accuracy yielded similar Dice scores with bothlow feature weights of at most 0.1 and high feature weights of atleast 1.0. Features such as the mean image exhibited this trend,which may reflect the limited additional discriminative abilityconferred by smoothed intensity values over patch intensity val-ues alone.
The optimal composition of the descriptor is patch intensityvalues, location information, and entropy image features. Thepatch sizes should be selected between 7 × 7 × 3 and 9 × 9 × 5;the location weights between � = 0.3 and � = 0.6; and the fea-ture weights between f = 1.0 and f = 2.0. Segmenting a singletest subject using the other 17 image-segmentation pairs as anatlas ran in about three minutes in MATLAB. We believe thatfurther optimization could improve this runtime considerably.
F. Multiscale Patch
As shown in Fig. 6, more accurate segmentation results aregenerally obtained when the MP neighborhood size Nx ex-ceeds the size of the intensity patch. However, using a largerMP neighborhood size causes voxels outside the patch size,which were not considered in computing the distances, to be

WACHINGER et al.: EFfiCIENT DESCRIPTOR-BASED SEGMENTATION OF PAROTID GLANDS WITH NONLOCAL MEANS 1501
TABLE IMEAN DICE AND RANGES OF OPTIMAL FEATURE WEIGHTS f AND LOCATION WEIGHTS � FOR EACH FEATURE FOR THE LEFT PAROTID
Left Parotid
Feature Entropy Grad HoG STD Sobel mPb Var LBP Haar Median Multi Gauss Laplace Gabor None Mean
Mean Dice 0.8756 0.8687 0.8685 0.8670 0.8666 0.8633 0.8616 0.8615 0.8597 0.8588 0.8577 0.8569 0.8563 0.8556 0.8537 0.8533Optimal f 1.0–2.0 0.2–0.5 0.05–0.2 0.05–0.5 0.5–2.0 0.2–0.5 0.05–0.2 0.2–0.2 0.2–5.0 1.0–5.0 0.05–0.2 1.0–5.0 0.01–1.0 0.01–1.0 NA 0.01–2.0Optimal � 0.2–0.4 0.2–1.0 0.2–1.0 0.2–0.9 0.6–2.0 0.3–0.6 0.2–0.9 0.2–0.8 0.4–5.0 0.6–1.0 0.3–1.0 0.4–1.0 0.2–0.6 0.2–0.4 0.2–0.6 0.2–1.0
Fig. 8. Comparison of mean Dice overlap scores for segmentationsof the left parotid such that the descriptor contains: (1) multiscale patchintensity values and location information; and (2) patch intensity valuesand location information. The differences are not statistically significant.The MP neighborhood size is set equal to the total extent of the multiscalepatch, which is three times the intensity patch size along each dimension,in (1). The MP neighborhood size is set equal to the patch size in (2).
used for label propagation. This effect can lead to poor pairingsin the ANN search that could have been avoided by consideringadditional context within the image. The multiscale patch over-comes this issue by considering additional context while usinga smaller core set of patch intensity values. Fig. 8 shows theimprovement on using (1) multiscale patch intensity values andlocation information over (2) patch intensity values and loca-tion information. In (1), the MP neighborhood size is set equalto the total extent of the multiscale patch, which is three timesthe intensity patch size along each dimension. For instance, apatch size of 7 × 7 × 3 yields to a multiscale patch that coversa region of 21 × 21 × 9 voxels, which is also MP size. In (2),the MP neighborhood size is set equal to the patch size. Themultiscale patch presents an interesting new patch design thatprovides wider context without having peripheral voxels domi-nate distances computed in the nearest neighbor search. In thisstudy, we compute mean intensity values as summary statisticsin generating the multiscale patch. A future research directionis to instead generate the multiscale patch with image featuresother than intensity values and to consider a summary statisticdifferent from the mean.
V. DISCUSSION
Our results indicate that including patch intensity values, lo-cation information, and image features in the descriptor yields
the highest segmentation accuracy. The first conclusion that canbe drawn from our results is the importance of location informa-tion. As mentioned in Section I, including location informationin the descriptor diverges from the location-independent com-parisons used in NLM [10]. However, the high performance ofNLM segmentation methods [6], [7] can be attributed to theimplicit inclusion of location as a descriptor by restricting thesearch to small local windows. Our results demonstrate thatthe explicit integration of location information into the descrip-tor yields better segmentation results than the hard spatial cut-off imposed by small search windows. This effect results fromthe potential to simultaneously select distant patches as nearestneighbors and impose spatial constraints on the nearest neighborsearch. This additional flexibility is important when segment-ing structures with large shape variations in the training set andwhen the initial alignment is of limited accuracy. In our method,the location weight parameter permits direct control over theinfluence of location information on the distances used in theANN search. The spatial regularization imposed by location isespecially important when the training set or test image containsimage distortions that lead to the propagation of incorrect labelswhen considering image information only. In the segmentationof parotid glands, this effect is most commonly seen in segment-ing images of patients with dental implants, which can createstrong artifacts in the image.
Our second conclusion is that features improve the perfor-mance of intensity values. Other than at very large patch sizes,including only image features in the descriptor leads to worsesegmentation results than those obtained using only patch in-tensity values. Features should therefore not replace patch in-tensities but rather augment them with additional informationin order to obtain more accurate segmentations. From this per-spective, features that provide information complementary topatch intensities can be expected to yield the best results. Thehigh Dice scores achieved by entropy, HoG, and Sobel im-age features suggest that image gradients and contours providecomplementary information to patch intensities for the purposeof image segmentation. In contrast, smoothing filters do notadd much additional information to the patch description of animage.
A general note for NLM segmentation is that a rough initialalignment of the structures of interest is required. Otherwise,the definition of local search windows is not meaningful. Sim-ilarly for our descriptor-based approach, we need rough cor-respondences between images to obtain comparable locationinformation. For domains where it is complicated to obtain analignment of the structures of interest with affine registration,
1502 IEEE TRANSACTIONS ON BIOMEDICAL ENGINEERING, VOL. 64, NO. 7, JULY 2017
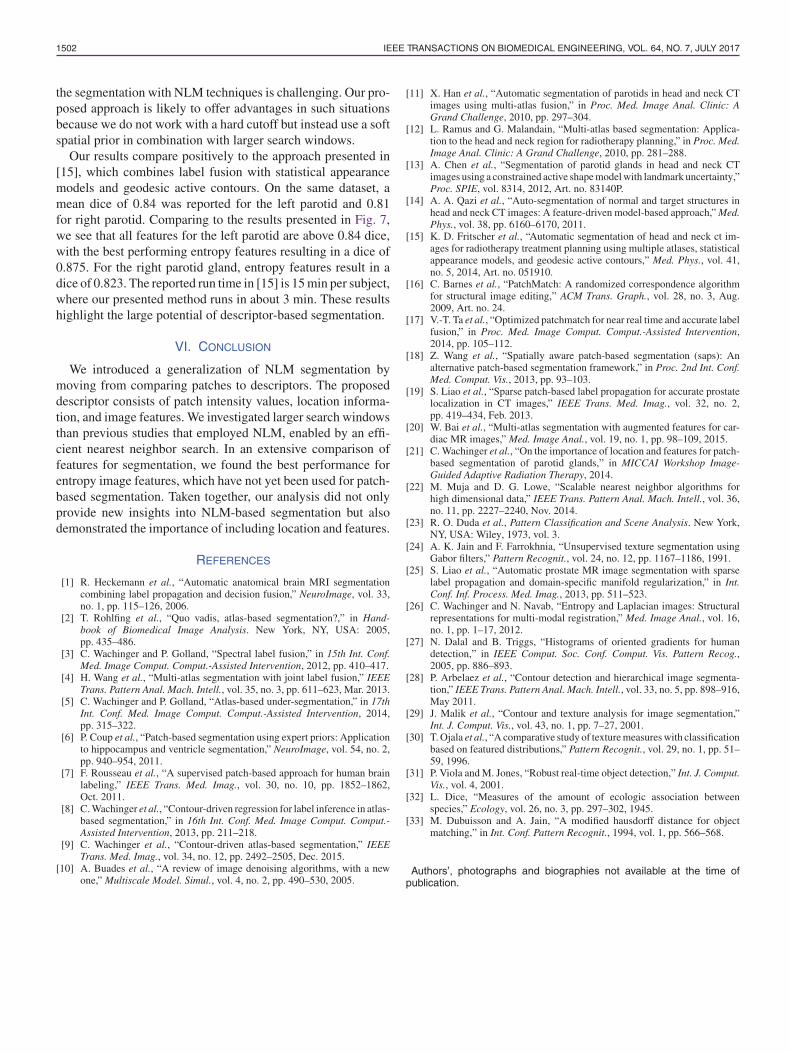
the segmentation with NLM techniques is challenging. Our pro-posed approach is likely to offer advantages in such situationsbecause we do not work with a hard cutoff but instead use a softspatial prior in combination with larger search windows.
Our results compare positively to the approach presented in[15], which combines label fusion with statistical appearancemodels and geodesic active contours. On the same dataset, amean dice of 0.84 was reported for the left parotid and 0.81for right parotid. Comparing to the results presented in Fig. 7,we see that all features for the left parotid are above 0.84 dice,with the best performing entropy features resulting in a dice of0.875. For the right parotid gland, entropy features result in adice of 0.823. The reported run time in [15] is 15 min per subject,where our presented method runs in about 3 min. These resultshighlight the large potential of descriptor-based segmentation.
VI. CONCLUSION
We introduced a generalization of NLM segmentation bymoving from comparing patches to descriptors. The proposeddescriptor consists of patch intensity values, location informa-tion, and image features. We investigated larger search windowsthan previous studies that employed NLM, enabled by an effi-cient nearest neighbor search. In an extensive comparison offeatures for segmentation, we found the best performance forentropy image features, which have not yet been used for patch-based segmentation. Taken together, our analysis did not onlyprovide new insights into NLM-based segmentation but alsodemonstrated the importance of including location and features.
REFERENCES
[1] R. Heckemann et al., “Automatic anatomical brain MRI segmentationcombining label propagation and decision fusion,” NeuroImage, vol. 33,no. 1, pp. 115–126, 2006.
[2] T. Rohlfing et al., “Quo vadis, atlas-based segmentation?,” in Hand-book of Biomedical Image Analysis. New York, NY, USA: 2005,pp. 435–486.
[3] C. Wachinger and P. Golland, “Spectral label fusion,” in 15th Int. Conf.Med. Image Comput. Comput.-Assisted Intervention, 2012, pp. 410–417.
[4] H. Wang et al., “Multi-atlas segmentation with joint label fusion,” IEEETrans. Pattern Anal. Mach. Intell., vol. 35, no. 3, pp. 611–623, Mar. 2013.
[5] C. Wachinger and P. Golland, “Atlas-based under-segmentation,” in 17thInt. Conf. Med. Image Comput. Comput.-Assisted Intervention, 2014,pp. 315–322.
[6] P. Coup et al., “Patch-based segmentation using expert priors: Applicationto hippocampus and ventricle segmentation,” NeuroImage, vol. 54, no. 2,pp. 940–954, 2011.
[7] F. Rousseau et al., “A supervised patch-based approach for human brainlabeling,” IEEE Trans. Med. Imag., vol. 30, no. 10, pp. 1852–1862,Oct. 2011.
[8] C. Wachinger et al., “Contour-driven regression for label inference in atlas-based segmentation,” in 16th Int. Conf. Med. Image Comput. Comput.-Assisted Intervention, 2013, pp. 211–218.
[9] C. Wachinger et al., “Contour-driven atlas-based segmentation,” IEEETrans. Med. Imag., vol. 34, no. 12, pp. 2492–2505, Dec. 2015.
[10] A. Buades et al., “A review of image denoising algorithms, with a newone,” Multiscale Model. Simul., vol. 4, no. 2, pp. 490–530, 2005.
[11] X. Han et al., “Automatic segmentation of parotids in head and neck CTimages using multi-atlas fusion,” in Proc. Med. Image Anal. Clinic: AGrand Challenge, 2010, pp. 297–304.
[12] L. Ramus and G. Malandain, “Multi-atlas based segmentation: Applica-tion to the head and neck region for radiotherapy planning,” in Proc. Med.Image Anal. Clinic: A Grand Challenge, 2010, pp. 281–288.
[13] A. Chen et al., “Segmentation of parotid glands in head and neck CTimages using a constrained active shape model with landmark uncertainty,”Proc. SPIE, vol. 8314, 2012, Art. no. 83140P.
[14] A. A. Qazi et al., “Auto-segmentation of normal and target structures inhead and neck CT images: A feature-driven model-based approach,” Med.Phys., vol. 38, pp. 6160–6170, 2011.
[15] K. D. Fritscher et al., “Automatic segmentation of head and neck ct im-ages for radiotherapy treatment planning using multiple atlases, statisticalappearance models, and geodesic active contours,” Med. Phys., vol. 41,no. 5, 2014, Art. no. 051910.
[16] C. Barnes et al., “PatchMatch: A randomized correspondence algorithmfor structural image editing,” ACM Trans. Graph., vol. 28, no. 3, Aug.2009, Art. no. 24.
[17] V.-T. Ta et al., “Optimized patchmatch for near real time and accurate labelfusion,” in Proc. Med. Image Comput. Comput.-Assisted Intervention,2014, pp. 105–112.
[18] Z. Wang et al., “Spatially aware patch-based segmentation (saps): Analternative patch-based segmentation framework,” in Proc. 2nd Int. Conf.Med. Comput. Vis., 2013, pp. 93–103.
[19] S. Liao et al., “Sparse patch-based label propagation for accurate prostatelocalization in CT images,” IEEE Trans. Med. Imag., vol. 32, no. 2,pp. 419–434, Feb. 2013.
[20] W. Bai et al., “Multi-atlas segmentation with augmented features for car-diac MR images,” Med. Image Anal., vol. 19, no. 1, pp. 98–109, 2015.
[21] C. Wachinger et al., “On the importance of location and features for patch-based segmentation of parotid glands,” in MICCAI Workshop Image-Guided Adaptive Radiation Therapy, 2014.
[22] M. Muja and D. G. Lowe, “Scalable nearest neighbor algorithms forhigh dimensional data,” IEEE Trans. Pattern Anal. Mach. Intell., vol. 36,no. 11, pp. 2227–2240, Nov. 2014.
[23] R. O. Duda et al., Pattern Classification and Scene Analysis. New York,NY, USA: Wiley, 1973, vol. 3.
[24] A. K. Jain and F. Farrokhnia, “Unsupervised texture segmentation usingGabor filters,” Pattern Recognit., vol. 24, no. 12, pp. 1167–1186, 1991.
[25] S. Liao et al., “Automatic prostate MR image segmentation with sparselabel propagation and domain-specific manifold regularization,” in Int.Conf. Inf. Process. Med. Imag., 2013, pp. 511–523.
[26] C. Wachinger and N. Navab, “Entropy and Laplacian images: Structuralrepresentations for multi-modal registration,” Med. Image Anal., vol. 16,no. 1, pp. 1–17, 2012.
[27] N. Dalal and B. Triggs, “Histograms of oriented gradients for humandetection,” in IEEE Comput. Soc. Conf. Comput. Vis. Pattern Recog.,2005, pp. 886–893.
[28] P. Arbelaez et al., “Contour detection and hierarchical image segmenta-tion,” IEEE Trans. Pattern Anal. Mach. Intell., vol. 33, no. 5, pp. 898–916,May 2011.
[29] J. Malik et al., “Contour and texture analysis for image segmentation,”Int. J. Comput. Vis., vol. 43, no. 1, pp. 7–27, 2001.
[30] T. Ojala et al., “A comparative study of texture measures with classificationbased on featured distributions,” Pattern Recognit., vol. 29, no. 1, pp. 51–59, 1996.
[31] P. Viola and M. Jones, “Robust real-time object detection,” Int. J. Comput.Vis., vol. 4, 2001.
[32] L. Dice, “Measures of the amount of ecologic association betweenspecies,” Ecology, vol. 26, no. 3, pp. 297–302, 1945.
[33] M. Dubuisson and A. Jain, “A modified hausdorff distance for objectmatching,” in Int. Conf. Pattern Recognit., 1994, vol. 1, pp. 566–568.
Authors’, photographs and biographies not available at the time ofpublication.
Related Documents