applied sciences Article Efficiency of the Vehicle Cabin Air Filters for Removing Black Carbon Particles and BTEX from the Air Intake Tak W. Chan 1,2, *, Marie Lee 3 , Gary Mallach 4 and David Buote 2 Citation: Chan, T.W.; Lee, M.; Mallach, G.; Buote, D. Efficiency of the Vehicle Cabin Air Filters for Removing Black Carbon Particles and BTEX from the Air Intake. Appl. Sci. 2021, 11, 9048. https://doi.org/ 10.3390/app11199048 Academic Editor: Elza Bontempi Received: 9 September 2021 Accepted: 24 September 2021 Published: 28 September 2021 Publisher’s Note: MDPI stays neutral with regard to jurisdictional claims in published maps and institutional affil- iations. Copyright: © 2021 by the authors. Licensee MDPI, Basel, Switzerland. This article is an open access article distributed under the terms and conditions of the Creative Commons Attribution (CC BY) license (https:// creativecommons.org/licenses/by/ 4.0/). 1 Climate Chemistry Measurements and Research, Climate Research Division, Environment and Climate Change Canada, 4905 Dufferin Street, Toronto, ON M3H 5T4, Canada 2 Emissions Research and Measurement Section, Air Quality Research Division, Environment and Climate Change Canada, 335 River Road South, Ottawa, ON K1A 0H3, Canada; [email protected] 3 Analysis and Air Quality Section, Air Quality Research Division, Environment and Climate Change Canada, 335 River Road South, Ottawa, ON K1A 0H3, Canada; [email protected] 4 Water and Air Quality Bureau, Health Canada, 269 Laurier Ave West, Ottawa, ON K1A 0K9, Canada; [email protected] * Correspondence: [email protected] Abstract: A laboratory study was conducted to evaluate 11 vehicular cabin filters (including electro- static filters) in removing fine particles. Two filters with charcoal were also evaluated to understand their usefulness in removing five common volatile organic compounds, including benzene, toluene, ethylbenzene, and xylene isomers (BTEX). Filters were found to show considerably different particle filtration efficiencies (FE). Electrostatic filters were found to provide 20–60% better FE across all particle diameters (6–520 nm). For 6 nm particles, FE from 78 to 94% were observed (from the worst to the best filters), while at 520 nm, FE varied from 35 to 60%. The best group of filters provided 44–46% FE for capturing the most penetrating particles (100–300 nm), while the worst group of filters provided only 10–11% FE. The filtration behavior of nominal filters was typically stable (with respect to particle number, black carbon, and particulate matter mass) over the course of 1–2 years of usage. The benefits of the electrostatic filters were significant, but such advantages were observed to gradu- ally dissipate over the course of about 1 year; by then, the electrostatic filter becomes no different compared to a nominal filter in terms of filtration behavior. Charcoal filters showed variabilities in removing BTEX, and removal efficiencies varied from 11 to 41%. Keywords: in-cabin air quality; PM; black carbon; VOC; BTEX; filter efficiency 1. Introduction Toxicological and epidemiological studies showed that the short- and long-term exposure of various levels of particulate matter (PM) and black carbon (BC) is linked to acute respiratory system responses (e.g., allergy, asthma, and inflammation) and even mortality [1–5]. In addition, various volatile organic compounds (VOCs), such as benzene, are known human carcinogens [6,7]. Diesel and gasoline vehicles are known sources of PM, BC, and VOCs, and they contribute significantly to air quality and climate issues in urban areas as well as regions downwind of urban areas [8,9]. Canadians spend approximately 4–7% of their daily time in, on, or near-road locations, which is mainly associated with being in a vehicle [10]. Commuters who are riding on public transportation, driving in personal vehicles, or even walking or cycling in the vicinity of urban areas are exposed to various degrees of pollutants [11–13]. In-cabin exposure to particles and gaseous pollutants is a concern, particularly during rush hours on congested freeway or local roads. A fibrous filter is a cost-effective means for removing airborne PM. Cabin filters in modern vehicles are typically designed to reduce concentrations of any incoming sub- stances, such as pollen, mold spores, and road dust, preventing them from entering the heating ventilation air conditioning (HVAC) system of the vehicles. Studies showed that Appl. Sci. 2021, 11, 9048. https://doi.org/10.3390/app11199048 https://www.mdpi.com/journal/applsci

Welcome message from author
This document is posted to help you gain knowledge. Please leave a comment to let me know what you think about it! Share it to your friends and learn new things together.
Transcript
applied sciences
Article
Efficiency of the Vehicle Cabin Air Filters for Removing BlackCarbon Particles and BTEX from the Air Intake
Tak W. Chan 1,2,*, Marie Lee 3, Gary Mallach 4 and David Buote 2
�����������������
Citation: Chan, T.W.; Lee, M.;
Mallach, G.; Buote, D. Efficiency of
the Vehicle Cabin Air Filters for
Removing Black Carbon Particles and
BTEX from the Air Intake. Appl. Sci.
2021, 11, 9048. https://doi.org/
10.3390/app11199048
Academic Editor: Elza Bontempi
Received: 9 September 2021
Accepted: 24 September 2021
Published: 28 September 2021
Publisher’s Note: MDPI stays neutral
with regard to jurisdictional claims in
published maps and institutional affil-
iations.
Copyright: © 2021 by the authors.
Licensee MDPI, Basel, Switzerland.
This article is an open access article
distributed under the terms and
conditions of the Creative Commons
Attribution (CC BY) license (https://
creativecommons.org/licenses/by/
4.0/).
1 Climate Chemistry Measurements and Research, Climate Research Division, Environment and ClimateChange Canada, 4905 Dufferin Street, Toronto, ON M3H 5T4, Canada
2 Emissions Research and Measurement Section, Air Quality Research Division, Environment and ClimateChange Canada, 335 River Road South, Ottawa, ON K1A 0H3, Canada; [email protected]
3 Analysis and Air Quality Section, Air Quality Research Division, Environment and Climate Change Canada,335 River Road South, Ottawa, ON K1A 0H3, Canada; [email protected]
4 Water and Air Quality Bureau, Health Canada, 269 Laurier Ave West, Ottawa, ON K1A 0K9, Canada;[email protected]
* Correspondence: [email protected]
Abstract: A laboratory study was conducted to evaluate 11 vehicular cabin filters (including electro-static filters) in removing fine particles. Two filters with charcoal were also evaluated to understandtheir usefulness in removing five common volatile organic compounds, including benzene, toluene,ethylbenzene, and xylene isomers (BTEX). Filters were found to show considerably different particlefiltration efficiencies (FE). Electrostatic filters were found to provide 20–60% better FE across allparticle diameters (6–520 nm). For 6 nm particles, FE from 78 to 94% were observed (from the worstto the best filters), while at 520 nm, FE varied from 35 to 60%. The best group of filters provided44–46% FE for capturing the most penetrating particles (100–300 nm), while the worst group of filtersprovided only 10–11% FE. The filtration behavior of nominal filters was typically stable (with respectto particle number, black carbon, and particulate matter mass) over the course of 1–2 years of usage.The benefits of the electrostatic filters were significant, but such advantages were observed to gradu-ally dissipate over the course of about 1 year; by then, the electrostatic filter becomes no differentcompared to a nominal filter in terms of filtration behavior. Charcoal filters showed variabilities inremoving BTEX, and removal efficiencies varied from 11 to 41%.
Keywords: in-cabin air quality; PM; black carbon; VOC; BTEX; filter efficiency
1. Introduction
Toxicological and epidemiological studies showed that the short- and long-termexposure of various levels of particulate matter (PM) and black carbon (BC) is linked toacute respiratory system responses (e.g., allergy, asthma, and inflammation) and evenmortality [1–5]. In addition, various volatile organic compounds (VOCs), such as benzene,are known human carcinogens [6,7]. Diesel and gasoline vehicles are known sources of PM,BC, and VOCs, and they contribute significantly to air quality and climate issues in urbanareas as well as regions downwind of urban areas [8,9]. Canadians spend approximately4–7% of their daily time in, on, or near-road locations, which is mainly associated withbeing in a vehicle [10]. Commuters who are riding on public transportation, driving inpersonal vehicles, or even walking or cycling in the vicinity of urban areas are exposed tovarious degrees of pollutants [11–13]. In-cabin exposure to particles and gaseous pollutantsis a concern, particularly during rush hours on congested freeway or local roads.
A fibrous filter is a cost-effective means for removing airborne PM. Cabin filters inmodern vehicles are typically designed to reduce concentrations of any incoming sub-stances, such as pollen, mold spores, and road dust, preventing them from entering theheating ventilation air conditioning (HVAC) system of the vehicles. Studies showed that
Appl. Sci. 2021, 11, 9048. https://doi.org/10.3390/app11199048 https://www.mdpi.com/journal/applsci
Appl. Sci. 2021, 11, 9048 2 of 19
cabin filters are also effective for removing smaller particles by applying the vehicle recir-culation ventilation setting [14–17]. At the filter, solid materials, such as PM and BC, can beremoved by different filtration mechanisms depending on the size of the particles. Particlessmaller than 0.1 µm are light enough that they do not follow air streamline when traveling.Instead, these particles undergo different degrees of random Brownian motion due to thethermal energy they process. The Brownian motion of these small particles is referred toas diffusion. When these particles pass through a filter, their random movements causethem to be removed by the filter fiber through interception. Particles larger than 1 µmare removed by impaction or interception because these particles are heavy enough thatthe momentum of the particles does not allow them to follow the air streamline throughsharp turns [18,19]. Particles with diameter from 0.1 to 1 µm are too large to be efficientlyremoved by diffusion and too small to be effectively removed by impaction. These particleseasily follow the air streamlines and are the most difficult to be removed by fibrous filtersunder most typical operating conditions, particularly for particles with 0.1–0.3 µm diameter.These particles are generally referred to as the most penetrating particles [20], and the filterFE are typically referred to the FE for removing these challenging particles.
While a typical cabin filter was expected to be ineffective for inorganic gases, re-search showed that activated charcoal filters are useful for removing various inorganicgases and hydrocarbons, which are often linked to symptoms and discomfort caused bydiesel exhaust [14,21]. During recirculation mode, cabin air is forced through the vehiclecabin filter, while outdoor air intake is minimized. Although recirculation ventilation iseffective in reducing in-cabin PM concentration, it quickly leads to an accumulation ofpassenger-exhaled carbon dioxide (CO2) in the vehicle cabin. Current occupational expo-sure limits set for North American workplaces (e.g., ACGIH or NIOSH) for an 8 h weightedaverage is 5000 ppm. Meanwhile, the American Society of Heating, Refrigerating andAir-Conditioning Engineers (ASHRAE) standard on ventilation for acceptable indoor airquality recommends indoor CO2 levels should not be greater than the ambient CO2 level by700 ppm, suggesting that the CO2 level should be kept below 1000 ppm [22,23]. Dependingon the in-cabin volume, fan speed, and number of passengers, in-cabin CO2 concentrationcan easily build up to half of the current occupational exposure limit (i.e., 2500 ppm) in just20–40 min under recirculation mode [24,25]. Therefore, while the maximum PM reductioninside a vehicle can be achieved by air recirculation, passengers cannot fully benefit fromthis in reality.
The filtration efficiency (FE) of the cabin filter changes over time depending on thenature of the filter and the loading amount captured by the filter. Theory predicts that theFE of a filter could increase over time due to the formation of dendrites [26,27]. When thefirst particle deposits on a filter fiber, there is an increased probability that other particleswill impact this attached particle and be captured. This process eventually builds a chain-like structure called dendrites. The formation of dendrites changes the microstructure ofthe fibers, extending the fiber structure, and it provides an additional capture mechanismand thus improves the FE over time. Even though loaded filters could have a better FE thana new filter, eventually, continuously loading materials to a filter leads to filter clogging,increases the pressure drop across the filter, and reduces FE.
Other factors that influence filter FE include particle size and composition, and thefilter nature. Emissions from diesel vehicles or the new direct injection gasoline vehiclescontain a significant amount of BC particles, and these fine particles are in aggregate form.Depending on the operating condition of the vehicle, combustion particles could vary from10 to 100 nm, but majority of the BC particles are about 60–80 nm [28–34]. Particles that areproduced during a combustion process could pick up charges that are generated duringthe combustion process and become electrically charged when they are released into theatmosphere [35–37].
Electrically active cabin fibrous filters are becoming more common than the traditionalnon-electrostatic cabin filters. These filters are embedded with fibers that carry a perma-nent electric charge, providing an additional electrostatic filtration mechanism for both
Appl. Sci. 2021, 11, 9048 3 of 19
neutral and charged particles and offering improved filtration efficiency in the clean statewithout the increase in pressure drop compared to similar filters without the electrostaticfibers [19,38–40].
In this study, a combustion burner was used to generate particles that simulate ve-hicular emission particles, and laboratory experiments were performed to evaluate theeffectiveness of various vehicle cabin filters, including those embedded with electrostaticfibers, in filtering ultrafine BC particles. The laboratory evaluation simulated an extendedperiod of filter usage approximating a real-life scenario. In addition, charcoal cabin fil-ters were also evaluated to determine its effectiveness for removing the five commonvolatile organic compounds (VOCs), including benzene, toluene, ethylbenzene, and xyleneisomers (BTEX).
2. Methodology2.1. Vehicle Selection and Laboratory Setup
The cabin filter system in the Dodge Grand Caravan was selected in this study forevaluation based on the vehicle popularity and planned for use in a commuter health study.
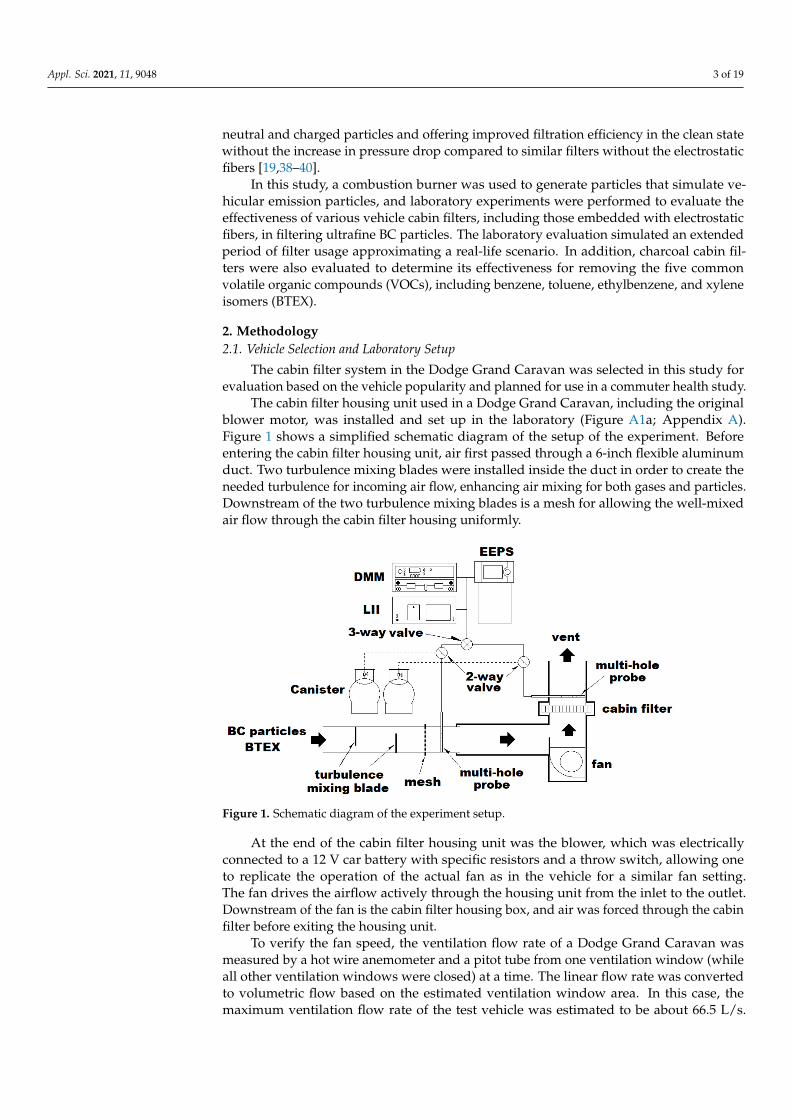
The cabin filter housing unit used in a Dodge Grand Caravan, including the originalblower motor, was installed and set up in the laboratory (Figure A1a; Appendix A).Figure 1 shows a simplified schematic diagram of the setup of the experiment. Beforeentering the cabin filter housing unit, air first passed through a 6-inch flexible aluminumduct. Two turbulence mixing blades were installed inside the duct in order to create theneeded turbulence for incoming air flow, enhancing air mixing for both gases and particles.Downstream of the two turbulence mixing blades is a mesh for allowing the well-mixedair flow through the cabin filter housing uniformly.
Figure 1. Schematic diagram of the experiment setup.
At the end of the cabin filter housing unit was the blower, which was electricallyconnected to a 12 V car battery with specific resistors and a throw switch, allowing oneto replicate the operation of the actual fan as in the vehicle for a similar fan setting.The fan drives the airflow actively through the housing unit from the inlet to the outlet.Downstream of the fan is the cabin filter housing box, and air was forced through the cabinfilter before exiting the housing unit.
To verify the fan speed, the ventilation flow rate of a Dodge Grand Caravan wasmeasured by a hot wire anemometer and a pitot tube from one ventilation window (whileall other ventilation windows were closed) at a time. The linear flow rate was convertedto volumetric flow based on the estimated ventilation window area. In this case, themaximum ventilation flow rate of the test vehicle was estimated to be about 66.5 L/s.
Appl. Sci. 2021, 11, 9048 4 of 19
During the experiment, the blower was set to about 38.4 L/s, which is close to a settingthat would be used during driving.
Two multi-hole sampling probes were installed: one located at the entrance of thecabin filter housing unit and the other located behind the cabin filter. Multi-hole probeswere used to ensure a more representative sampling for both gases and particles fromthe tunnel.
2.2. Automotive Cabin Filters
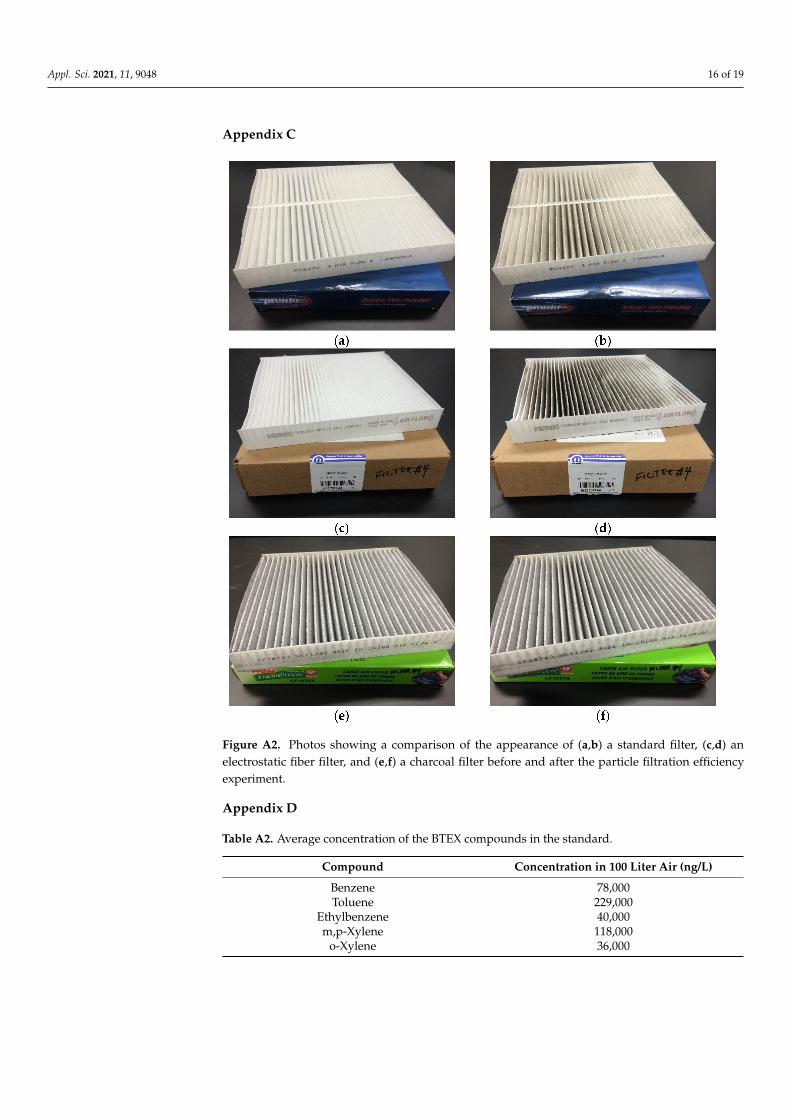
A total of 11 cabin filters, including the original equipment manufacturer (OEM) cabinfilter, were evaluated in this study (Table A1 in Appendix B). There are three categoriesof cabin filters, including 6 standard filters, 3 electrostatic fiber filters, and 2 charcoal non-electrostatic filters. The standard filters typically have a white appearance and paper-liketexture, similar to the typical high-efficiency particulate air (HEPA) filter (Figure A2a;Appendix C). The charcoal filters have a similar surface texture compared to the standardfilter but are grayish in color (Figure A2e; Appendix C). Some of the filters are advertisedin the package to contain electrostatic fibers to improve the filtration efficiency of the filter.It is not possible to differentiate between the electrostatic and standard filters by theirappearance alone (Figure A2c; Appendix C).
2.3. Generation and Measurement of BC Particles
The BC particle standards were generated by a miniature combustion aerosol standard(miniCAST) burner [41,42]. The miniCAST uses a co-flow diffusion flame of hydrocarbonto produce BC particles. The flame is quenched with dry nitrogen, which freezes thecombustion process and stabilizes the BC particles produced during the combustion process.The diameter and concentration of the BC particles can be adjusted by changing the flowrate of the fuel (propane), oxidant (compressed air), and quenching gas (nitrogen).
During the experiment, the miniCAST was adjusted to produce 70 nm particles,approximating the diameter of observed vehicular BC particle emissions [28,33]. Theseparticles were introduced into the flexible aluminum duct containing two turbulencemixing blades, which generated the necessary turbulence mixing. Then, particles passedthrough a mesh to produce a uniform particle concentration airflow before entering thecabin filter housing unit. Particles were alternatively sampled from either the pre- orpost-filter locations through two multi-hole probes, which directed sampled air to thevarious particle instruments. Particle number size distributions (6–523 nm) were measuredby the TSI Engine Exhaust Particle Sizer (EEPS) [43]. Real-time BC mass was measuredby the Artium LII300 laser-induced incandescence (LII) [44,45], while particle mass wasestimated using the Dekati mass monitor (DMM) [46]. In this study, each particle filtrationexperiment was done once on each filter.
The ambient concentration of BC and ultrafine particles observed from three Canadiancities (Toronto, Montreal, and Vancouver) during traffic rush hours was reported fromthe Urban Transportation Exposure Study (UTES) [47,48]. Median values of variouspollutants, including the ultrafine particles, BC, and PM, observed at Toronto were usedas target exposure concentration references (27,869 particles/cm3 UFP, 1.4 µg/m3 BC,8.7 µg/m3 PM2.5, and 12.6 µg/m3 BTEX).
2.4. BTEX Standard and VOC Analysis
In this study, 100 L standards of benzene, toluene, ethylbenzene, and xylene isomers(BTEX) were prepared and stored in a 15 L pressurized Summa stainless steel canister(Figure A1b; Appendix A). Table A2 (Appendix C) summarized the concentrations of theBTEX standards. These concentrations were chosen based on the exposure measurementsobtained from Montreal during The Urban Transportation Exposure Study (UTES) [47,48]and were adjusted higher by a factor of 2 in order to simulate the concentration expectedduring rush hour on highly congested roads.
Appl. Sci. 2021, 11, 9048 5 of 19
Before the experiment, the canister of BTEX standards was placed upstream of thealuminum duct, and the BTEX standard was released at 100 accm (actual cm3 per min)using a mass flow controller through a 60 cm long 1/8-inch diameter stainless steel tubing.Then, the standards passed through two turbulence blades to ensure they well mixedbefore entering into the cabin filter housing unit, without any filter installed. The BTEXstandard was evaluated twice prior to the actual BTEX experiment. During the experiment,one of the three cabin filters (two charcoal filters and the OEM filter) was installed. Then,samples were extracted from two multi-hole probes that were positioned before and afterthe cabin filter simultaneously into two separated pre-vacuumed Summa stainless steelcanisters, and the flow rate was restricted by a pre-calibrated needle valve. The absolutepressure inside the canister increased slowly over time as the BTEX was collected. Whenthe absolute pressure inside the sample canister reached about 600 torr, the valve on thecanister was shut and capped. Then, the canister was returned to the laboratory for VOCanalysis. In this study, the BTEX experiment was done twice on each charcoal filter.
In this study, an in-house method similar to the U.S. Environmental Protection Agency(EPA) TO15 method was used to characterize the BTEX compounds, which is an automatedcryogenic concentration technique [49]. In brief, an aliquot of air was first drawn from theSumma canister into a cryogenic pre-concentrator. Then, the trapped sample was releasedstepwise through a series of different temperature-controlled traps to separate the targetVOCs from other air components (e.g., water, carbon dioxide, argon, methane), whichwere also present in significant amounts. The procedure concentrates the samples andimproves the signal to noise ratio, allowing the ambient level VOCs to be detected with alow detection limit. The concentrated BTEX compounds were analyzed by capillary gaschromatography using low-resolution mass spectrometric detection.
3. Results and Discussion3.1. Particle Standard Generation
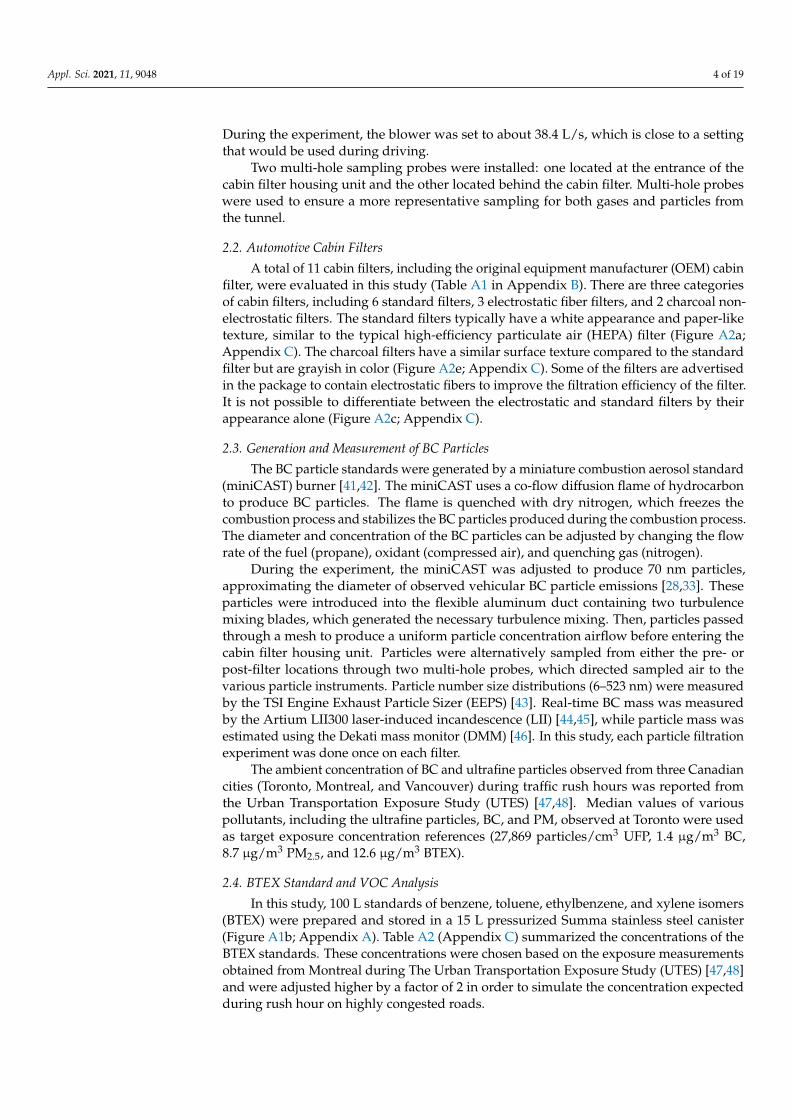
The concentration and the size of the particles produced from the miniCAST werereasonably stable during the course of the experiment, and Figure 2 provides a typicaltime series of the particle number concentration, BC, and PM mass observed during onetypical experiment. When switching between the pre- and post-filter locations, the particlenumber, BC, and PM mass concentrations all changed accordingly. Zeros on the EEPSand DMM were checked by sampling through HEPA filters periodically during which theparticle number and mass both dropped to zero (top and bottom panels in Figure 2). Thisshows no drifting in the electronics over time, ensuring measurements were correct andconsistent throughout the experiment.
Figure 2. Example of the particle number concentration, black carbon (BC), and particulate matter (PM) mass time seriesfrom a typical experiment.
Appl. Sci. 2021, 11, 9048 6 of 19
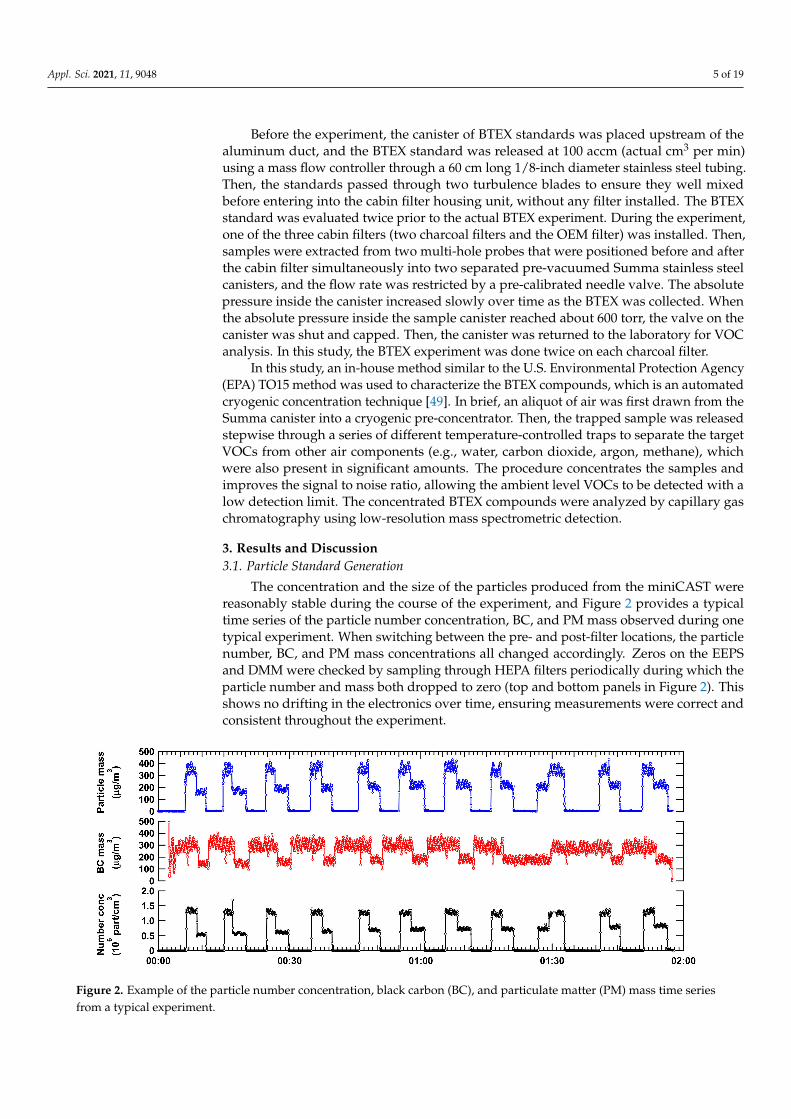
Experiments were performed on all 11 filters, and data were validated by reviewingall measurements thoroughly. Then, all data within each steady-state period were averaged.Figure 3a,b summarize the averaged particle number size distributions measured at thepre- and post-filter locations at various steady-state periods during one typical experiment.Figure 3a shows that the concentration and the size of the particles at the pre-filter locationwere relatively stable over the course of the experiment, which typically lasted between1 and 2 h. The size of the particles measured at the post-filter location was consistent,but the particle number concentration pattern varied from experiment to experiment. Insome cases, the particle number concentration was stable; however, in other cases, therewas a progressive increase in the number concentrations over time (Figure 3b), indicatinga loss of particle FE over time. Research on the loading behaviors of electrically activematerials have observed that particle penetration through a filter may increase over time(i.e., decrease in FE) from a new state as material is loaded before filtration efficiency beginsto improve [19,39]. More discussions on this will be given in Section 3.4.
Figure 3. Example of the particle number size distribution measured at the (a) pre- and (b) post-cabin filter locations duringa typical experiment.
3.2. Estimation of BC and PM Mass
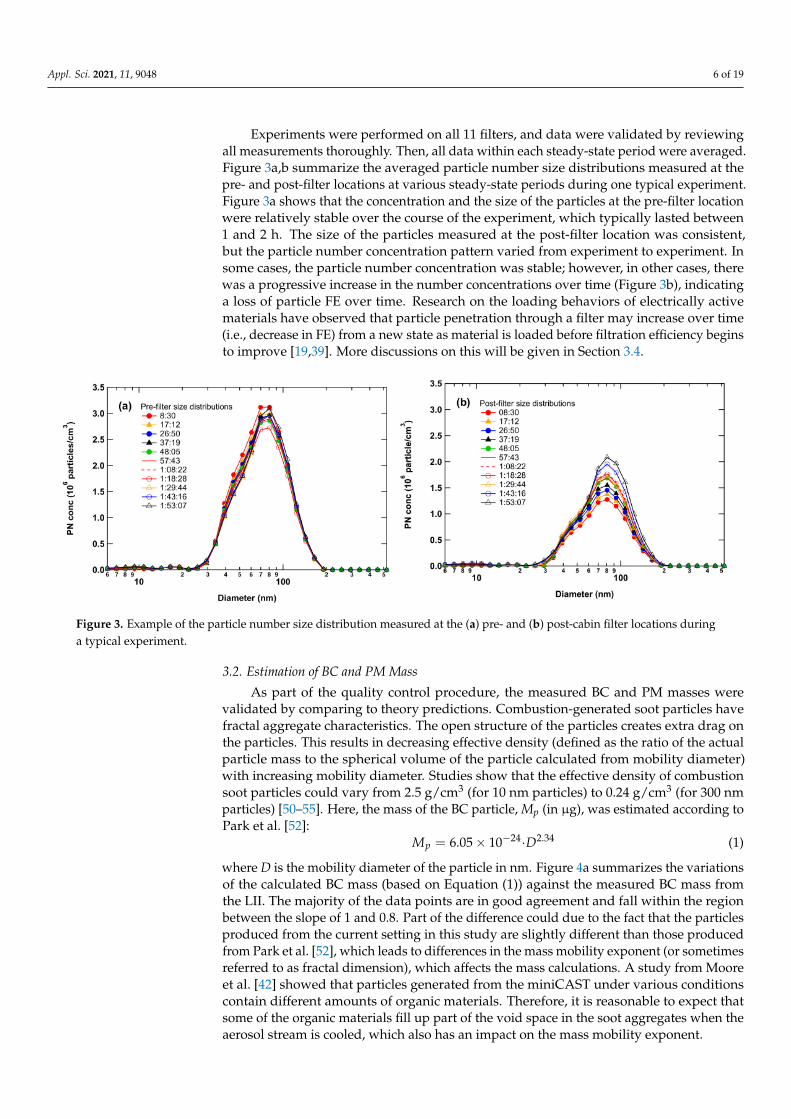
As part of the quality control procedure, the measured BC and PM masses werevalidated by comparing to theory predictions. Combustion-generated soot particles havefractal aggregate characteristics. The open structure of the particles creates extra drag onthe particles. This results in decreasing effective density (defined as the ratio of the actualparticle mass to the spherical volume of the particle calculated from mobility diameter)with increasing mobility diameter. Studies show that the effective density of combustionsoot particles could vary from 2.5 g/cm3 (for 10 nm particles) to 0.24 g/cm3 (for 300 nmparticles) [50–55]. Here, the mass of the BC particle, Mp (in µg), was estimated according toPark et al. [52]:
Mp = 6.05 × 10⁻²⁴·D2.34 (1)
where D is the mobility diameter of the particle in nm. Figure 4a summarizes the variationsof the calculated BC mass (based on Equation (1)) against the measured BC mass fromthe LII. The majority of the data points are in good agreement and fall within the regionbetween the slope of 1 and 0.8. Part of the difference could due to the fact that the particlesproduced from the current setting in this study are slightly different than those producedfrom Park et al. [52], which leads to differences in the mass mobility exponent (or sometimesreferred to as fractal dimension), which affects the mass calculations. A study from Mooreet al. [42] showed that particles generated from the miniCAST under various conditionscontain different amounts of organic materials. Therefore, it is reasonable to expect thatsome of the organic materials fill up part of the void space in the soot aggregates when theaerosol stream is cooled, which also has an impact on the mass mobility exponent.
Appl. Sci. 2021, 11, 9048 7 of 19
Particle mass was estimated here using the assumption of spherical particle and unitydensity (1 g/cm3), and the results are presented in Figure 4b. Observations in Figure 4bshow that the spherical particle assumption overestimates the particle mass by as much as50% while a majority of the data points were overestimating by 20% due to the aggregatenature of the BC particles.
Figure 4. Comparison of the calculated (a) BC mass and (b) PM mass with the measured masses.
3.3. Particle Filtration Efficiency as a Function of Size
To determine the particle FE as a function of diameter, each individual averagednumber size distribution observed at pre- and post-filter locations (i.e., Figure 3) werefirst fitted by a log-normal distribution to reduce measurement noise. Then, the pre- andpost-filter fitted log-normal distribution measured at the two closest time periods werecompared to determine the particle number (PN) FE over various diameters, FE(D), whichis defined as
FE(D) =Npre,Di − Npost,Di
Npre,Di× 100%, (2)
where Npre,Di and Npost,Di are the number concentrations at diameter Di measured at thepre- and post-filter locations, respectively.
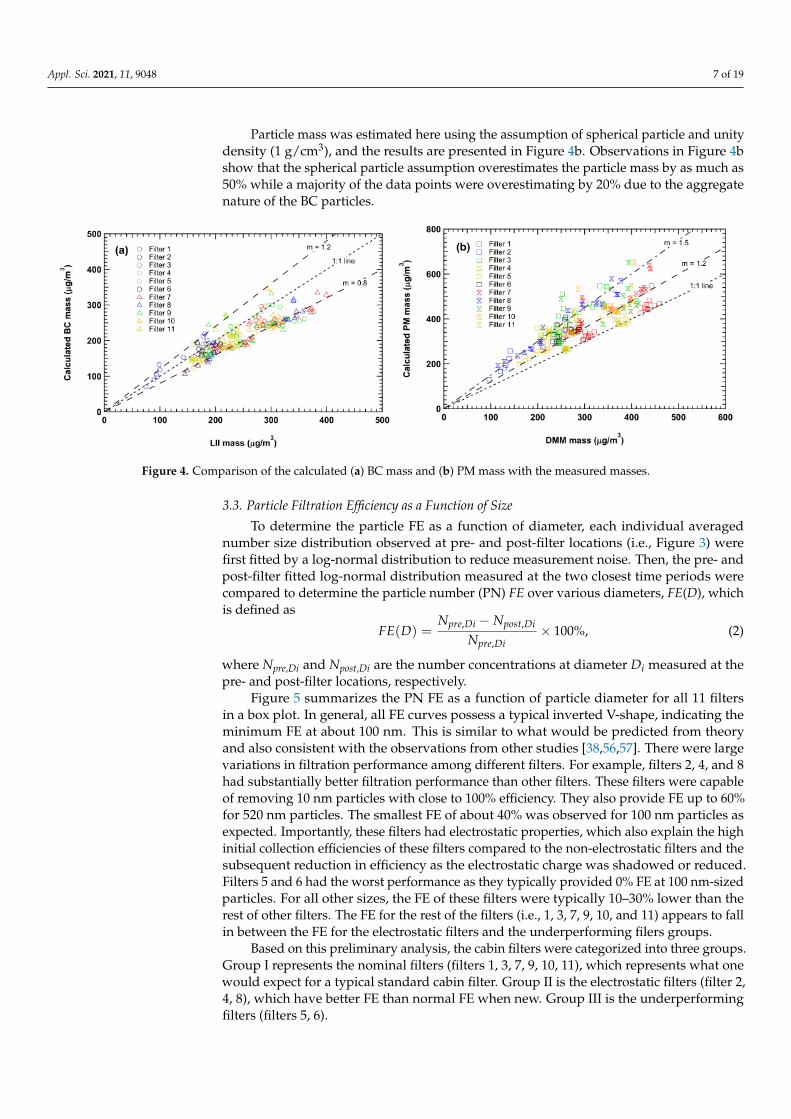
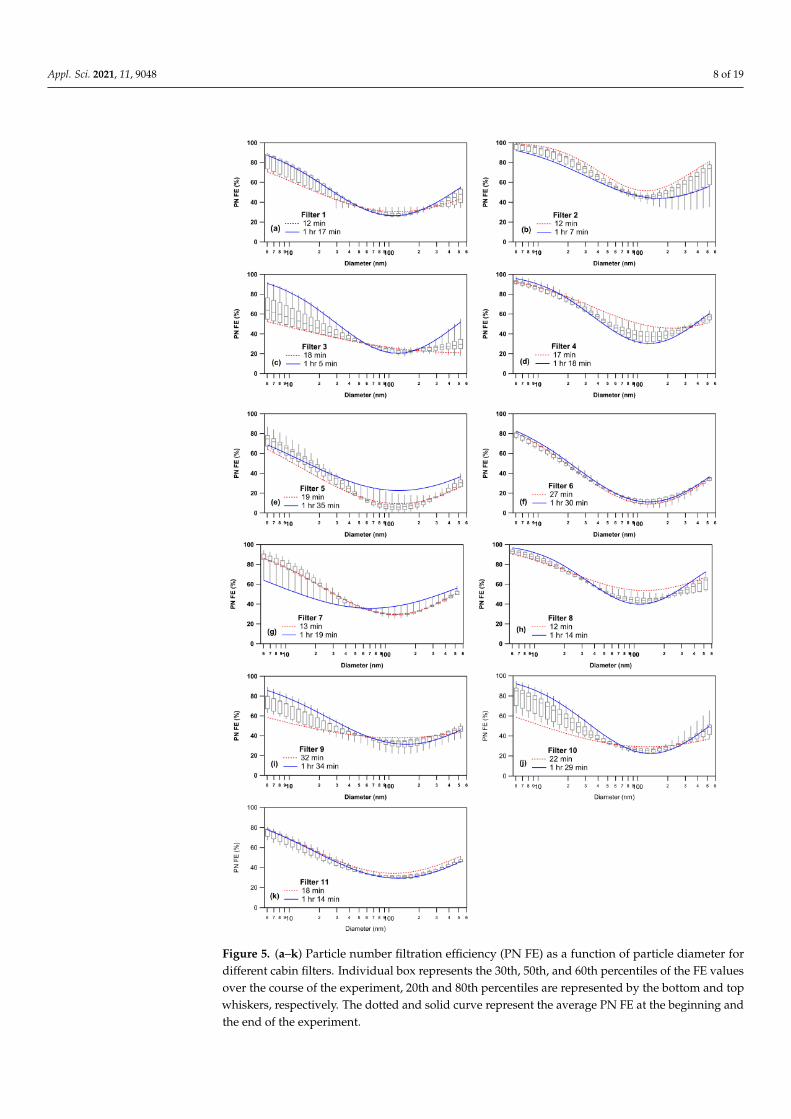
Figure 5 summarizes the PN FE as a function of particle diameter for all 11 filtersin a box plot. In general, all FE curves possess a typical inverted V-shape, indicating theminimum FE at about 100 nm. This is similar to what would be predicted from theoryand also consistent with the observations from other studies [38,56,57]. There were largevariations in filtration performance among different filters. For example, filters 2, 4, and 8had substantially better filtration performance than other filters. These filters were capableof removing 10 nm particles with close to 100% efficiency. They also provide FE up to 60%for 520 nm particles. The smallest FE of about 40% was observed for 100 nm particles asexpected. Importantly, these filters had electrostatic properties, which also explain the highinitial collection efficiencies of these filters compared to the non-electrostatic filters and thesubsequent reduction in efficiency as the electrostatic charge was shadowed or reduced.Filters 5 and 6 had the worst performance as they typically provided 0% FE at 100 nm-sizedparticles. For all other sizes, the FE of these filters were typically 10–30% lower than therest of other filters. The FE for the rest of the filters (i.e., 1, 3, 7, 9, 10, and 11) appears to fallin between the FE for the electrostatic filters and the underperforming filers groups.
Based on this preliminary analysis, the cabin filters were categorized into three groups.Group I represents the nominal filters (filters 1, 3, 7, 9, 10, 11), which represents what onewould expect for a typical standard cabin filter. Group II is the electrostatic filters (filter 2,4, 8), which have better FE than normal FE when new. Group III is the underperformingfilters (filters 5, 6).
Appl. Sci. 2021, 11, 9048 8 of 19
Figure 5. (a–k) Particle number filtration efficiency (PN FE) as a function of particle diameter fordifferent cabin filters. Individual box represents the 30th, 50th, and 60th percentiles of the FE valuesover the course of the experiment, 20th and 80th percentiles are represented by the bottom and topwhiskers, respectively. The dotted and solid curve represent the average PN FE at the beginning andthe end of the experiment.
Appl. Sci. 2021, 11, 9048 9 of 19
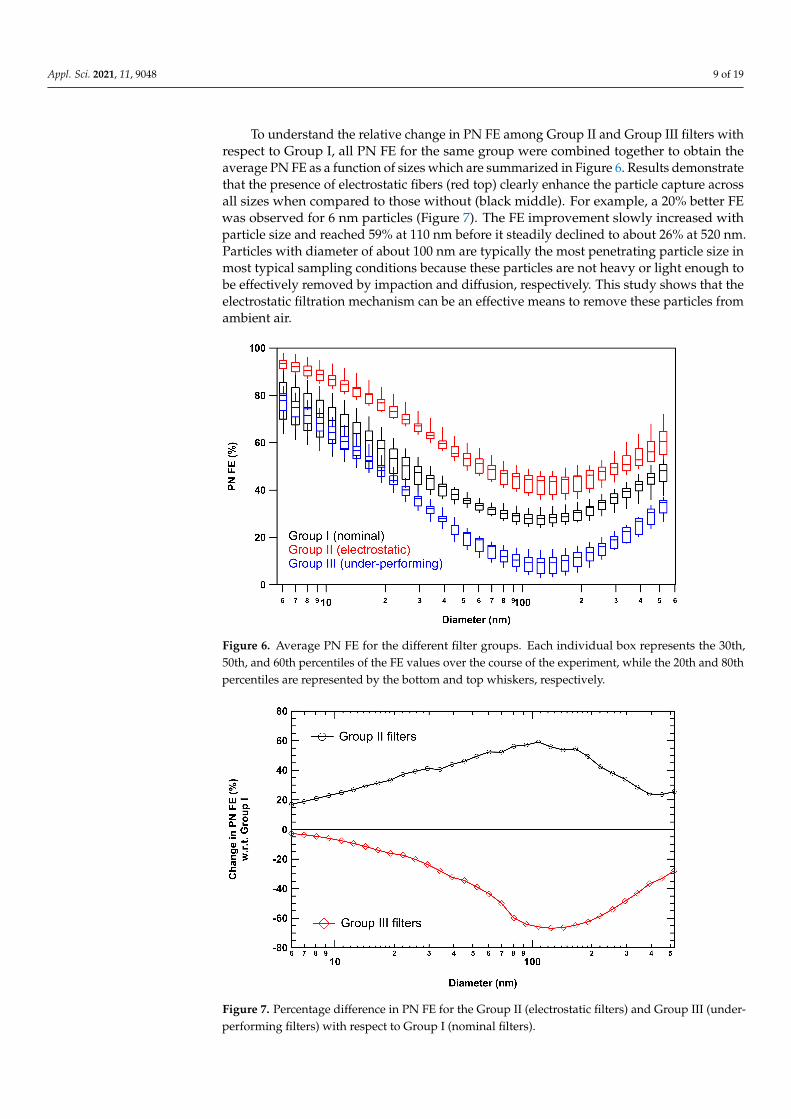
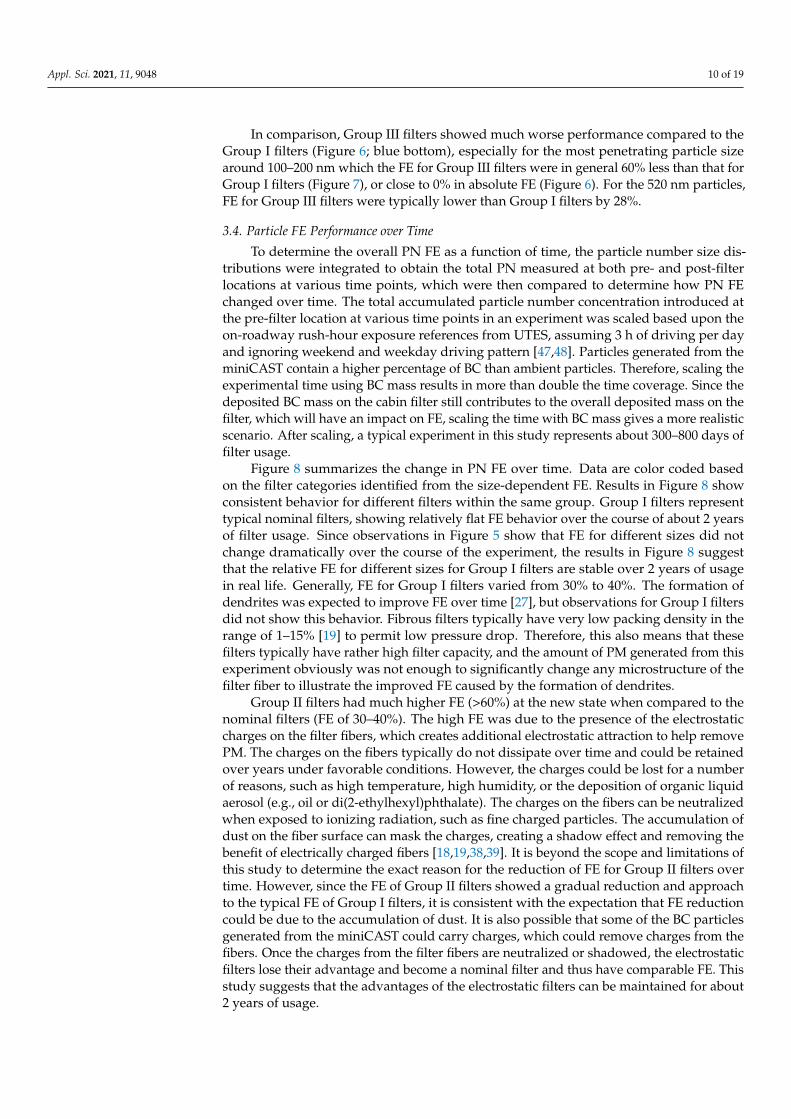
To understand the relative change in PN FE among Group II and Group III filters withrespect to Group I, all PN FE for the same group were combined together to obtain theaverage PN FE as a function of sizes which are summarized in Figure 6. Results demonstratethat the presence of electrostatic fibers (red top) clearly enhance the particle capture acrossall sizes when compared to those without (black middle). For example, a 20% better FEwas observed for 6 nm particles (Figure 7). The FE improvement slowly increased withparticle size and reached 59% at 110 nm before it steadily declined to about 26% at 520 nm.Particles with diameter of about 100 nm are typically the most penetrating particle size inmost typical sampling conditions because these particles are not heavy or light enough tobe effectively removed by impaction and diffusion, respectively. This study shows that theelectrostatic filtration mechanism can be an effective means to remove these particles fromambient air.
Figure 6. Average PN FE for the different filter groups. Each individual box represents the 30th,50th, and 60th percentiles of the FE values over the course of the experiment, while the 20th and 80thpercentiles are represented by the bottom and top whiskers, respectively.
Figure 7. Percentage difference in PN FE for the Group II (electrostatic filters) and Group III (under-performing filters) with respect to Group I (nominal filters).
Appl. Sci. 2021, 11, 9048 10 of 19
In comparison, Group III filters showed much worse performance compared to theGroup I filters (Figure 6; blue bottom), especially for the most penetrating particle sizearound 100–200 nm which the FE for Group III filters were in general 60% less than that forGroup I filters (Figure 7), or close to 0% in absolute FE (Figure 6). For the 520 nm particles,FE for Group III filters were typically lower than Group I filters by 28%.
3.4. Particle FE Performance over Time
To determine the overall PN FE as a function of time, the particle number size dis-tributions were integrated to obtain the total PN measured at both pre- and post-filterlocations at various time points, which were then compared to determine how PN FEchanged over time. The total accumulated particle number concentration introduced atthe pre-filter location at various time points in an experiment was scaled based upon theon-roadway rush-hour exposure references from UTES, assuming 3 h of driving per dayand ignoring weekend and weekday driving pattern [47,48]. Particles generated from theminiCAST contain a higher percentage of BC than ambient particles. Therefore, scaling theexperimental time using BC mass results in more than double the time coverage. Since thedeposited BC mass on the cabin filter still contributes to the overall deposited mass on thefilter, which will have an impact on FE, scaling the time with BC mass gives a more realisticscenario. After scaling, a typical experiment in this study represents about 300–800 days offilter usage.
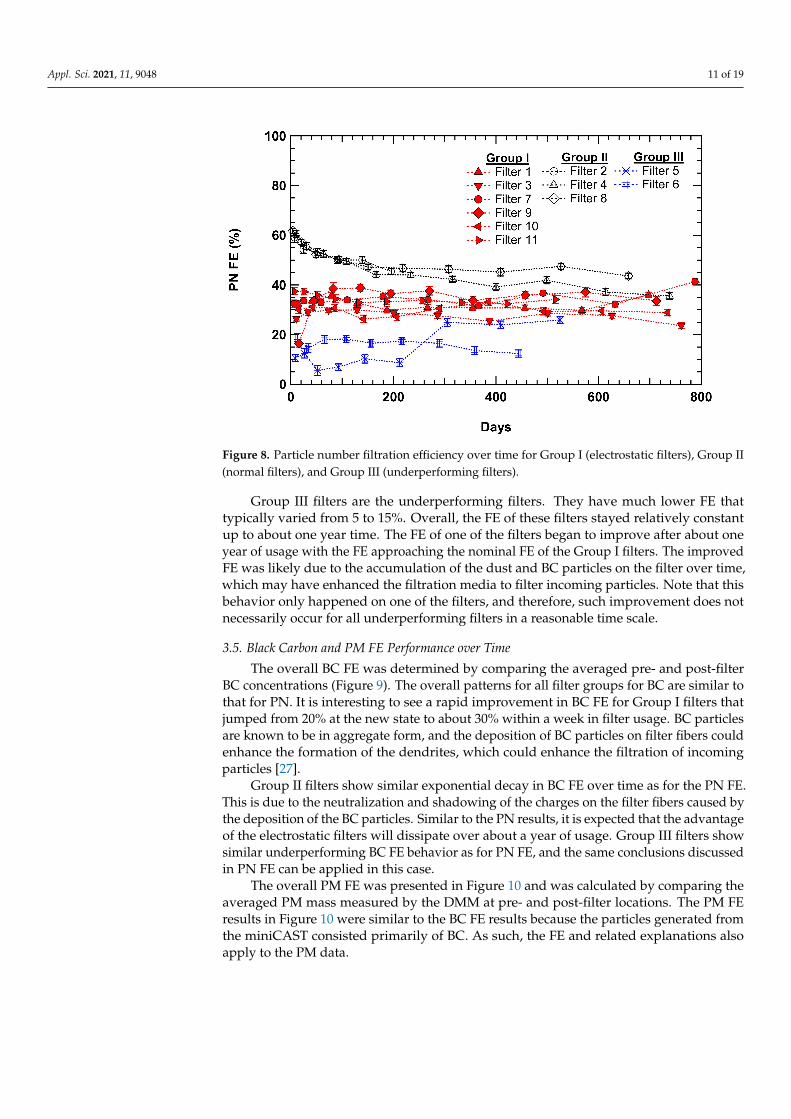
Figure 8 summarizes the change in PN FE over time. Data are color coded basedon the filter categories identified from the size-dependent FE. Results in Figure 8 showconsistent behavior for different filters within the same group. Group I filters representtypical nominal filters, showing relatively flat FE behavior over the course of about 2 yearsof filter usage. Since observations in Figure 5 show that FE for different sizes did notchange dramatically over the course of the experiment, the results in Figure 8 suggestthat the relative FE for different sizes for Group I filters are stable over 2 years of usagein real life. Generally, FE for Group I filters varied from 30% to 40%. The formation ofdendrites was expected to improve FE over time [27], but observations for Group I filtersdid not show this behavior. Fibrous filters typically have very low packing density in therange of 1–15% [19] to permit low pressure drop. Therefore, this also means that thesefilters typically have rather high filter capacity, and the amount of PM generated from thisexperiment obviously was not enough to significantly change any microstructure of thefilter fiber to illustrate the improved FE caused by the formation of dendrites.
Group II filters had much higher FE (>60%) at the new state when compared to thenominal filters (FE of 30–40%). The high FE was due to the presence of the electrostaticcharges on the filter fibers, which creates additional electrostatic attraction to help removePM. The charges on the fibers typically do not dissipate over time and could be retainedover years under favorable conditions. However, the charges could be lost for a numberof reasons, such as high temperature, high humidity, or the deposition of organic liquidaerosol (e.g., oil or di(2-ethylhexyl)phthalate). The charges on the fibers can be neutralizedwhen exposed to ionizing radiation, such as fine charged particles. The accumulation ofdust on the fiber surface can mask the charges, creating a shadow effect and removing thebenefit of electrically charged fibers [18,19,38,39]. It is beyond the scope and limitations ofthis study to determine the exact reason for the reduction of FE for Group II filters overtime. However, since the FE of Group II filters showed a gradual reduction and approachto the typical FE of Group I filters, it is consistent with the expectation that FE reductioncould be due to the accumulation of dust. It is also possible that some of the BC particlesgenerated from the miniCAST could carry charges, which could remove charges from thefibers. Once the charges from the filter fibers are neutralized or shadowed, the electrostaticfilters lose their advantage and become a nominal filter and thus have comparable FE. Thisstudy suggests that the advantages of the electrostatic filters can be maintained for about2 years of usage.
Appl. Sci. 2021, 11, 9048 11 of 19
Figure 8. Particle number filtration efficiency over time for Group I (electrostatic filters), Group II(normal filters), and Group III (underperforming filters).
Group III filters are the underperforming filters. They have much lower FE thattypically varied from 5 to 15%. Overall, the FE of these filters stayed relatively constantup to about one year time. The FE of one of the filters began to improve after about oneyear of usage with the FE approaching the nominal FE of the Group I filters. The improvedFE was likely due to the accumulation of the dust and BC particles on the filter over time,which may have enhanced the filtration media to filter incoming particles. Note that thisbehavior only happened on one of the filters, and therefore, such improvement does notnecessarily occur for all underperforming filters in a reasonable time scale.
3.5. Black Carbon and PM FE Performance over Time
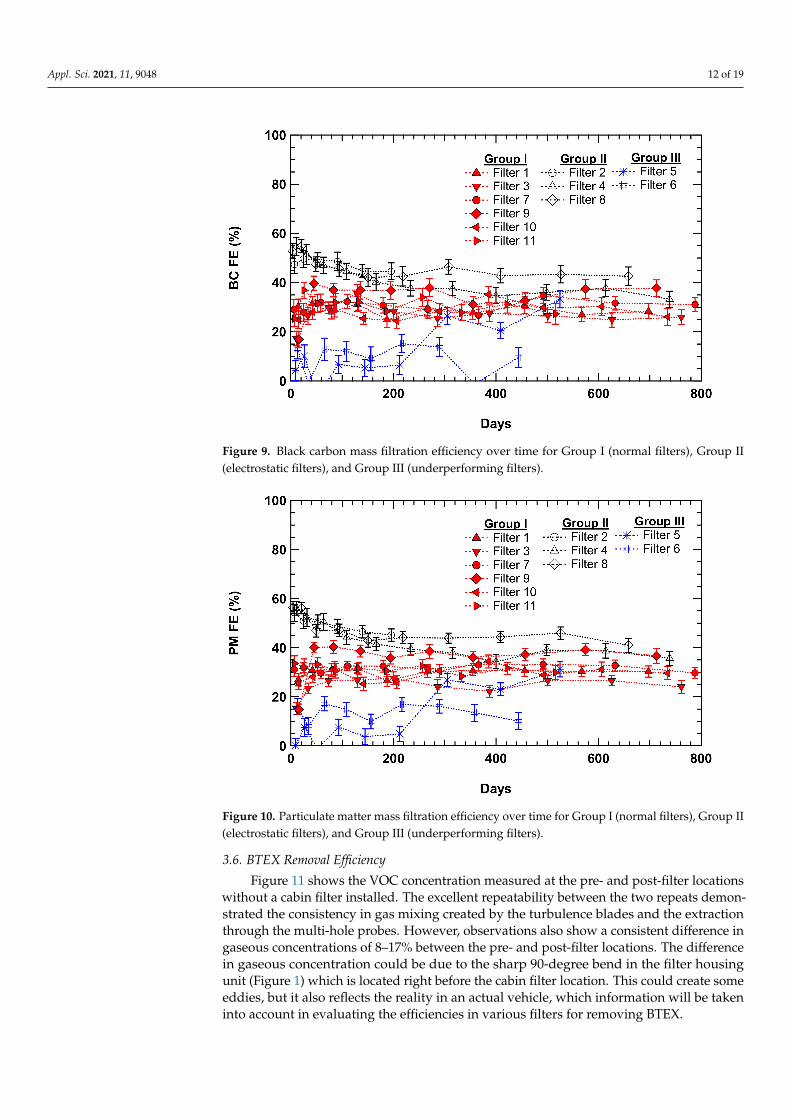
The overall BC FE was determined by comparing the averaged pre- and post-filterBC concentrations (Figure 9). The overall patterns for all filter groups for BC are similar tothat for PN. It is interesting to see a rapid improvement in BC FE for Group I filters thatjumped from 20% at the new state to about 30% within a week in filter usage. BC particlesare known to be in aggregate form, and the deposition of BC particles on filter fibers couldenhance the formation of the dendrites, which could enhance the filtration of incomingparticles [27].
Group II filters show similar exponential decay in BC FE over time as for the PN FE.This is due to the neutralization and shadowing of the charges on the filter fibers caused bythe deposition of the BC particles. Similar to the PN results, it is expected that the advantageof the electrostatic filters will dissipate over about a year of usage. Group III filters showsimilar underperforming BC FE behavior as for PN FE, and the same conclusions discussedin PN FE can be applied in this case.
The overall PM FE was presented in Figure 10 and was calculated by comparing theaveraged PM mass measured by the DMM at pre- and post-filter locations. The PM FEresults in Figure 10 were similar to the BC FE results because the particles generated fromthe miniCAST consisted primarily of BC. As such, the FE and related explanations alsoapply to the PM data.
Appl. Sci. 2021, 11, 9048 12 of 19
Figure 9. Black carbon mass filtration efficiency over time for Group I (normal filters), Group II(electrostatic filters), and Group III (underperforming filters).
Figure 10. Particulate matter mass filtration efficiency over time for Group I (normal filters), Group II(electrostatic filters), and Group III (underperforming filters).
3.6. BTEX Removal Efficiency
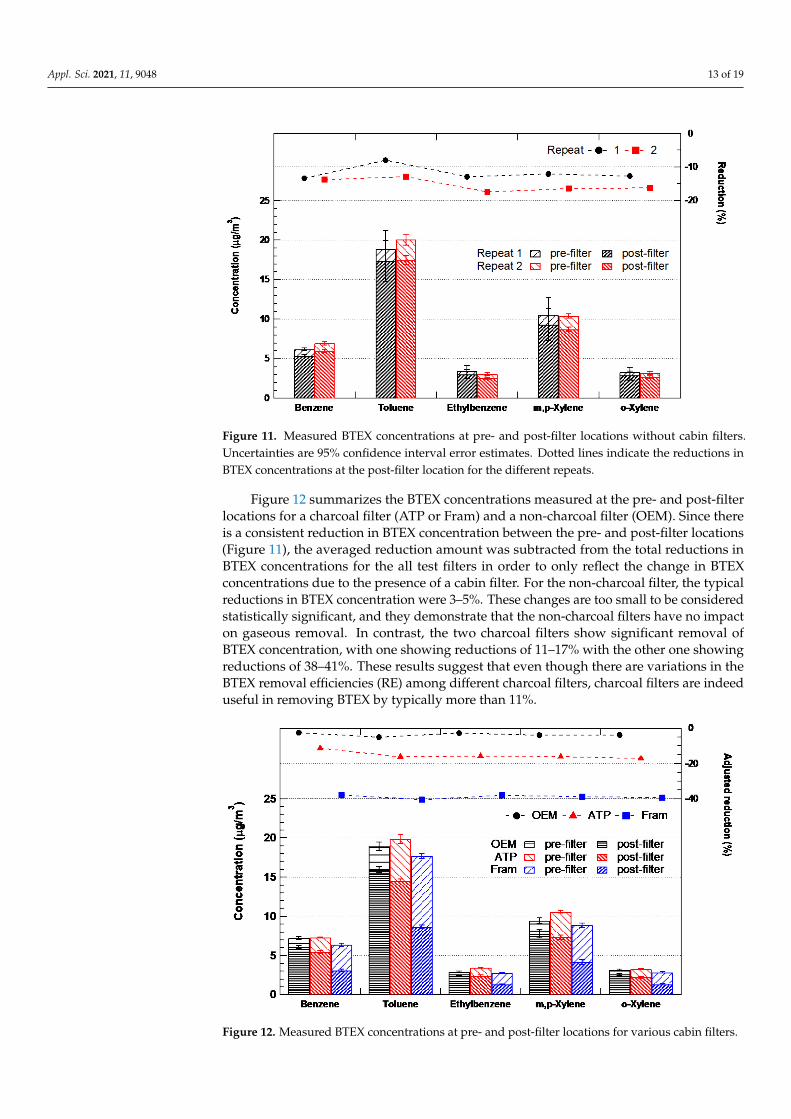
Figure 11 shows the VOC concentration measured at the pre- and post-filter locationswithout a cabin filter installed. The excellent repeatability between the two repeats demon-strated the consistency in gas mixing created by the turbulence blades and the extractionthrough the multi-hole probes. However, observations also show a consistent difference ingaseous concentrations of 8–17% between the pre- and post-filter locations. The differencein gaseous concentration could be due to the sharp 90-degree bend in the filter housingunit (Figure 1) which is located right before the cabin filter location. This could create someeddies, but it also reflects the reality in an actual vehicle, which information will be takeninto account in evaluating the efficiencies in various filters for removing BTEX.
Appl. Sci. 2021, 11, 9048 13 of 19
Figure 11. Measured BTEX concentrations at pre- and post-filter locations without cabin filters.Uncertainties are 95% confidence interval error estimates. Dotted lines indicate the reductions inBTEX concentrations at the post-filter location for the different repeats.
Figure 12 summarizes the BTEX concentrations measured at the pre- and post-filterlocations for a charcoal filter (ATP or Fram) and a non-charcoal filter (OEM). Since thereis a consistent reduction in BTEX concentration between the pre- and post-filter locations(Figure 11), the averaged reduction amount was subtracted from the total reductions inBTEX concentrations for the all test filters in order to only reflect the change in BTEXconcentrations due to the presence of a cabin filter. For the non-charcoal filter, the typicalreductions in BTEX concentration were 3–5%. These changes are too small to be consideredstatistically significant, and they demonstrate that the non-charcoal filters have no impacton gaseous removal. In contrast, the two charcoal filters show significant removal ofBTEX concentration, with one showing reductions of 11–17% with the other one showingreductions of 38–41%. These results suggest that even though there are variations in theBTEX removal efficiencies (RE) among different charcoal filters, charcoal filters are indeeduseful in removing BTEX by typically more than 11%.
Figure 12. Measured BTEX concentrations at pre- and post-filter locations for various cabin filters.
Appl. Sci. 2021, 11, 9048 14 of 19
4. Conclusions
Eleven vehicle cabin filters were evaluated to understand their FE in removing PM andBC from vehicular exhaust. All tested filters exhibit an inverted V-shape of FE with sizes(6–520 nm), and the most penetrating particle size was found to be 100–200 nm. Nominalfilters generally offer 28–30% FE for 100–200 nm particles, 80% FE for 6 nm particles, and48% for 520 nm particles. Electrostatic filters provide better FE across all tested sizes,showing 44–46% FE for 100–200 nm particles, 94% for 6 nm particles, and 60% for 520 nmparticles. Two filters were found to underperform, showing only 78% for 6 nm particlesand 35% for 520 nm particles. These filters only show 10–11% FE for 100–200 nm particles.The FE characteristics of all nominal filters did not change considerably, and the FE (withrespect to PN, BC, and PM) remained relatively stable (at 30–40% overall) within the courseof the experiment, which can be translated to about 1–2 years of typical filter usage time.Electrostatic filters offer a significant improvement in overall FE with 60% at new state. TheFE gradually declined over time and reaches the FE of nominal filters in about 1–2 years.The reduction in FE over time is attributed to the accumulation of dust and BC particlesover time, which could shadow the charges on the fibers. The underperforming filtersonly offer less than 20% FE during the course of its usage, and in one case, the FE slightlyimproved after one year of usage likely due to the accumulation of dust and BC particles.
Experiments were also conducted to evaluate two charcoal cabin filters to understandtheir effect on removing BTEX. Observations demonstrated that charcoal filters were usefulin removing BTEX compared to non-charcoal filters. One filter showed 11–17% of removalefficiency for BTEX, while the second filter showed 38–41%. Although not performed, it isexpected that similar removal efficiencies could occur for similar VOCs. This study showedthat the presence of charcoal extends the function of a cabin filter to provide additionalgaseous removal ability in addition to PM removal.
Author Contributions: T.W.C. designed the experiment, constructed the laboratory setup, conductedthe experiment, collect all gaseous and particle measurements, and analyzed the particle data andmanuscript preparation. M.L. prepared the BTEX standard and led the laboratory VOC analysis.G.M. contributed to the study design and provided the cabin filters. D.B. constructed all the electricalconnections. All authors have read and agreed to the published version of the manuscript.
Funding: This work was funded by the Emissions Research and Measurement Section of Environ-ment and Climate Change Canada.
Data Availability Statement: The data presented in this study are available on request from thecor-responding author.
Acknowledgments: The authors would like to acknowledge Peter Barton, Mark McCurdy, andMichel Souligny from Emissions Research and Measurement Section for providing technical sug-gestions to this study; Danny Wang from Analysis and Air Quality Section for providing scientificcomments and suggestions to the VOC experiment; Chantale Dassylva from Departmental ProjectManagement Office Division for providing access to a Dodge Grand Caravan for used in this project.The analysis, results and conclusion presented are those of the authors alone. The conclusions andviews expressed do not necessarily, and should not be taken to, any endorsement from ECCC.
Conflicts of Interest: The authors declare no conflict of interest.
Appl. Sci. 2021, 11, 9048 15 of 19
Appendix A
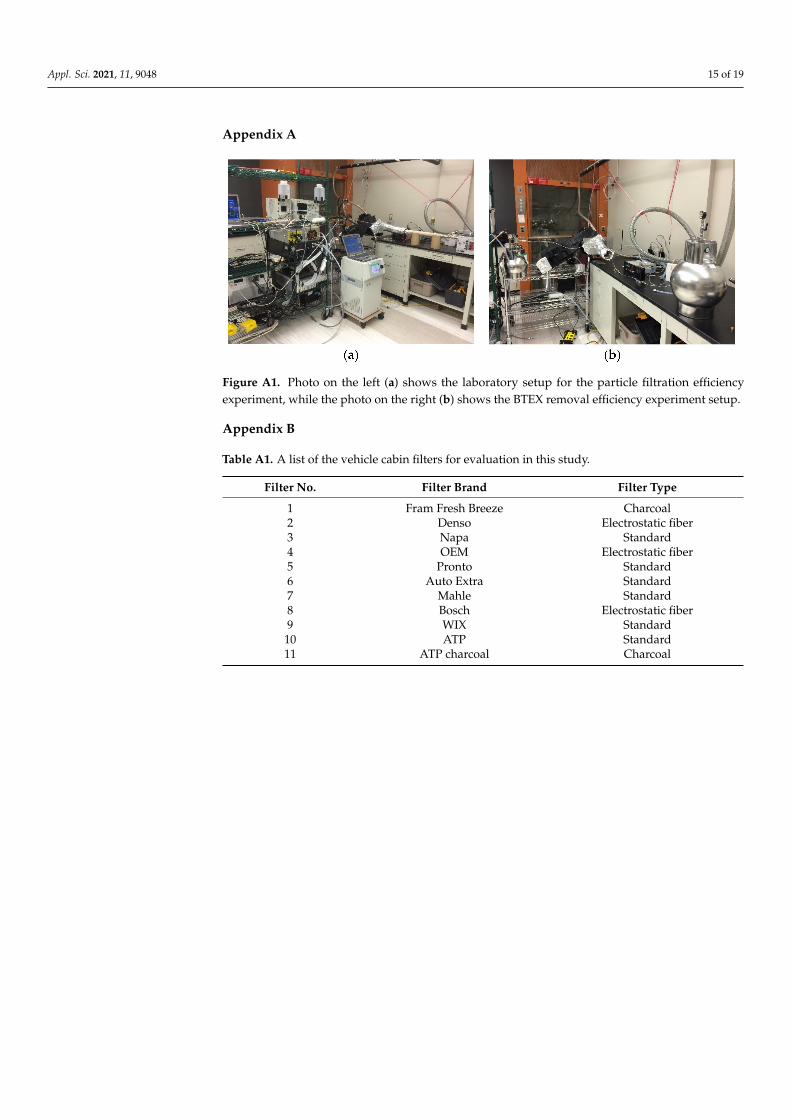
Figure A1. Photo on the left (a) shows the laboratory setup for the particle filtration efficiencyexperiment, while the photo on the right (b) shows the BTEX removal efficiency experiment setup.
Appendix B
Table A1. A list of the vehicle cabin filters for evaluation in this study.
Filter No. Filter Brand Filter Type
1 Fram Fresh Breeze Charcoal2 Denso Electrostatic fiber3 Napa Standard4 OEM Electrostatic fiber5 Pronto Standard6 Auto Extra Standard7 Mahle Standard8 Bosch Electrostatic fiber9 WIX Standard10 ATP Standard11 ATP charcoal Charcoal
Appl. Sci. 2021, 11, 9048 16 of 19
Appendix C
Figure A2. Photos showing a comparison of the appearance of (a,b) a standard filter, (c,d) anelectrostatic fiber filter, and (e,f) a charcoal filter before and after the particle filtration efficiencyexperiment.
Appendix D
Table A2. Average concentration of the BTEX compounds in the standard.
Compound Concentration in 100 Liter Air (ng/L)
Benzene 78,000Toluene 229,000
Ethylbenzene 40,000m,p-Xylene 118,000
o-Xylene 36,000
Appl. Sci. 2021, 11, 9048 17 of 19
References1. Peters, A.; Skorkovsky, J.; Kotesovec, F.; Brynda, J.; Spix, C.; Wichmann, H.E.; Heinrich, J. Associations between mortality and air
pollution in Central Europe. Environ. Health Perspect. 2000, 108, 283–287. [CrossRef] [PubMed]2. Suglia, S.F.; Gryparis, A.; Schwartz, J.; Wright, R.J. Association between traffic-related black carbon exposure and lung function
among urban women. Environ. Health Perspect. 2008, 116, 1333–1337. [CrossRef] [PubMed]3. Ning, Z.; Sioutas, C. Atmospheric processes influencing aerosols generated by combustion and the inference of their impact on
public exposure: A review. Aerosol Air Qual. Res. 2010, 10, 43–58. [CrossRef]4. Wilker, E.H.; Baccarelli, A.; Suh, H.; Vokonas, P.; Wright, R.O.; Schwartz, J. Black carbon exposures, blood pressure, and
interactions with single nucleotide polymorphisms in MicroRNA processing genes. Environ. Health Perspect. 2010, 118, 943–948.[CrossRef]
5. Thurston, G.D.; Burnett, R.T.; Turner, M.C.; Shi, Y.; Krewski, D.; Lall, R.; Ito, K.; Jerrett, M.; Gapstur, S.M.; Diver, W.R.; et al.Ischemic heart disease mortality and long-term exposure to source-related components of U.S. fine particle air pollution. Environ.Health Perspect. 2016, 124, 785–794. [CrossRef]
6. Knox, E.G. Childhood cancers and atmospheric carcinogens. J. Epidemiol. Commun. Health 2005, 59, 101–105. [CrossRef]7. Wickliffe, J.K.; Stock, T.H.; Howard, J.L.; Frahm, E.; Simon-Friedt, B.R.; Montgomery, K.; Wilson, M.J.; Lichtveld, M.Y.; Harville, E.
Increased long-term health risks attributable to select volatile organic compounds in residential indoor air in southeast Louisiana.Sci. Rep. 2020, 10, 21649. [CrossRef]
8. Malm, W.C. Atmospheric haze: Its sources and effects on visibility in rural areas of the continental United States. Environ. Monit.Assess. 1989, 12, 203–225. [CrossRef]
9. Bond, T.C.; Doherty, S.J.; Fahey, D.W.; Forster, P.M.; Bemtsen, T.; DeAngelo, B.J.; Flanner, M.G.; Ghan, S.; Kärcher, B.; Koch, D.;et al. Bounding the role of black carbon in the climate system: A scientific assessment. J. Geophys. Res. Atmos. 2013, 118, 5380–5552.[CrossRef]
10. Matz, C.J.; Stieb, D.M.; Egyed, M.; Brion, O.; Johnson, M. Evaluation of daily time spent in transportation and traffic-influencedmicroenvironments by urban Canadian. Air Qual. Atmos. Health 2018, 11, 209–220. [CrossRef]
11. Duffy, B.L.; Nelson, P.F. Exposure to emissions of 1,3-butadiene and benzene in the cabins of moving motor vehicles an dbuses inSydney, Australia. Atmos. Environ. 1997, 31, 3877–3885. [CrossRef]
12. Lee, K.; Sohn, H.; Putti, K. In-vehicle exposures to particulate matter and black carbon. J. Air Waste Manag. Assoc. 2010, 60,130–136. [CrossRef] [PubMed]
13. Hudda, N.; Kostenidou, E.; Sioutas, C.; Delfino, R.J.; Fruin, S.A. Vehicle and driving characteristics that influence in-cabin particlenumber concentration. Environ. Sci. Technol. 2011, 45, 8691–8697. [CrossRef]
14. Rudell, B.; Wass, U.; Hörstedt, P.; Levin, J.O.; Lindahl, R.; Rannug, U.; Sunesson, A.L.; Östberg, Y.; Sandström, T. Efficiency ofautomotive cabin filters to reduce acute health effects of diesel exhaust in human subjects. Occup. Environ. Med. 1999, 56, 222–231.[CrossRef]
15. Zhu, Y.; Eiguren-Fernandez, A.; Hinds, W.C.; Miguel, A.H. In-cabin commuter exposure to ultrafine particles on Los Angelesfreeways. Environ. Sci. Technol. 2007, 41, 2138–2145. [CrossRef]
16. Pui, D.Y.H.; Qi, C.; Stanley, N.; Oberdörster, G.; Maynard, A. Recirculating air filtration significantly reduces exposure to airbornenanoparticles. Environ. Health Perspect. 2008, 116, 863–866. [CrossRef] [PubMed]
17. Lee, E.S.; Zhu, Y. Application of a high-efficiency cabin air filter for simultaneous mitigation of ultrafine particle and carbondioxide exposures inside passenger vehicles. Environ. Sci. Technol. 2014, 48, 2328–2335. [CrossRef]
18. Hinds, W.C. Filtration. In Aerosol Technology: Properties, Behaviour, and Measurement of Airborne Particles, 2nd ed.; John Wiley &Sons, Inc.: Hoboken, NJ, USA, 1999; Chapter 9; pp. 182–205.
19. Wang, C.S. Electrostatic forces in fibrous filter—A review. Power Technol. 2001, 118, 166–170. [CrossRef]20. Lee, K.W.; Liu, B.Y.H. On the minimum efficiency and the most penetrating particle size for fibrous filters. J. Air Pollut. Control
Assoc. 1980, 30, 377–381. [CrossRef]21. Muala, A.; Sehlstedt, M.; Bion, A.; Österlund, C.; Bosson, J.A.; Behndig, A.F.; Pourazar, J.; Bucht, A.; Boman, C.; Mudway, I.S.;
et al. Assessment of the capacity of vehicle cabin air inlet filters to reduce diesel exhaust-induced symptoms in human volunteers.Environ. Health 2014, 13, 16. [CrossRef]
22. ASHRAE. Ventilation for Acceptable Indoor Air Quality, ANSI/ASHRAE Standard 62.1. American National Standards Instituteand American Society of Heating, Refrigerating and Air-Conditioning Engineers. 2016. Available online: https://www.ashrae.org/technical-resources/standards-and-guidelines/read-only-versions-of-ashrae-standards (accessed on 26 July 2021).
23. Health Canada. Residential Indoor Air Quality Guidelines for Carbon Dioxide—for Public Consultation. 2020. Availableonline: https://www.canada.ca/en/health-canada/programs/consultation-residential-indoor-air-quality-guidelines-carbon-dioxide/document.html (accessed on 26 July 2021).
24. Grady, M.L.; Jung, H.; Kim, Y.C.; Park, J.K.; Lee, B.C. Vehicle cabin air quality with fractional air recirculation. SAE Tech. Pap.2013. [CrossRef]
25. Tartakovsky, L.; Baibikov, V.; Czerwinski, J.; Gutman, M.; Kasper, M.; Popescu, D.; Veinblat, M.; Zvirin, Y. In-vehicle particle airpollution and its mitigation. Atmos. Environ. 2013, 64, 320–328. [CrossRef]
26. Brown, R.C. Electrically charged air filterst. KONA Powder Part. J. 1991, 9, 174–186. [CrossRef]
Appl. Sci. 2021, 11, 9048 18 of 19
27. Ardkapan, S.R.; Johnson, M.S.; Yazdi, S.; Afshari, A.; Bergsøe, N.C. Filtration efficiency of an electrostatic fibrous filter: Studyingfiltration dependency on ultrafine particle exposure and composition. J. Aerosol Sci. 2014, 72, 14–20. [CrossRef]
28. Maricq, M.M.; Podsiadlik, D.H.; Chase, R.E. Gasoline vehicle particle size distributions: Comparison of steady state, FTP, andUS06 measurements. Environ. Sci. Technol. 1999, 33, 2007–2015. [CrossRef]
29. Harris, S.J.; Maricq, M.M. Signature size distributions for diesel and gasoline engine exhaust particulate matter. J. Aerosol Sci.2001, 32, 749–764. [CrossRef]
30. Kittelson, D.B.; Watt, W.F.; Johnson, J.P. On-road and laboratory evaluation of combustion aerosols-part 1: Summary of dieselengine results. J. Aerosol Sci. 2006, 37, 913–930. [CrossRef]
31. Kittelson, D.B.; Watt, W.F.; Johnson, J.P.; Schauer, J.J.; Lawson, D.R. On-road and laboratory evaluation of combustion aerosols-part2: Summary of spark ignition engine results. J. Aerosol Sci. 2006, 37, 931–949. [CrossRef]
32. Chan, T.W.; Meloche, E.; Kubsh, J.; Rosenblatt, D.; Brezny, R.; Rideout, G. Evaluation of a gasoline particulate filter to reduceparticle emissions from a gasoline direct injection vehicle. SAE Int. J. Fuels Lubr. 2012, 5, 1277–1290. [CrossRef]
33. Chan, T.W.; Meloche, E.; Kubsh, J.; Brezny, R. Black carbon emissions in gasoline exhaust and a reduction alternative with agasoline particulate filter. Environ. Sci. Technol. 2014, 48, 6027–6034. [CrossRef]
34. Saffaripour, M.; Chan, T.W.; Liu, F.; Thomson, K.A.; Smallwood, G.J.; Kubsh, J.; Brezny, R. Effect of drive cycle and gasolineparticulate filter on the size and morphology of soot particles emitted from a gasoline-direct-injection vehicle. Environ. Sci.Technol. 2015, 49, 11950–11958. [CrossRef] [PubMed]
35. Calcote, H.F. Mechanisms of soot nucleation in flames—A critical review. Combust. Flame 1981, 42, 215–242. [CrossRef]36. Onischuk, A.A.; di Stasio, S.; Karasev, V.V.; Strunin, V.P.; Baklanov, A.M.; Panfilov, V.N. Evidence for long-range Coulomb effects
during formation of nanoparticle agglomerates from pyrolysis and combustion routes. J. Phys. Chem. A 2000, 104, 10426–10434.[CrossRef]
37. Onischuk, A.A.; di Stasio, S.; Karasev, V.V.; Baklanov, A.M.; Makhov, G.A.; Vlasenko, A.L.; Sadykova, A.R.; Shipovalov, A.V.;Panfilov, V.N. Evolution of structure and charge of soot aggregates during and after formation in a propane/air diffusion flame.J. Aerosol Sci. 2003, 34, 383–403. [CrossRef]
38. Baumgartner, H.P.; Löffler, F. The collection performance of electret filters in the particle size range 10 nm–10 µm. J. Aerosol Sci.1986, 17, 438–445. [CrossRef]
39. Walsh, D.C.; Stenhouse, J.I.T. The effect of particle size, charge, and composition on the loading characteristics of an electricallyactive fibrous filter material. J. Aerosol Sci. 1997, 28, 307–321. [CrossRef]
40. Walsh, D.C.; Stenhouse, J.I.T. Parameters affecting the loading behavior and degradation of electrically active filter materials.Aerosol Sci. Technol. 1998, 29, 419–432. [CrossRef]
41. Jing, L. Standard combustion aerosol generator (SCAG) for calibration purposes. In Proceedings of the 3rd ETH Workshop“Nanoparticle Measurement”, Zurich, Switzerland, 9–10 August 1999.
42. Moore, R.H.; Ziemba, L.D.; Dutcher, D.; Beyersdorf, A.J.; Chan, K.; Crumeyrolle, S.; Raymond, T.M.; Thornhill, K.L.; Winstead,E.L.; Anderson, B.E. Mapping the operation of the Miniature Combustion Aerosol Standard (Mini-CAST) soot generator. AerosolSci. Technol. 2014, 48, 467–479. [CrossRef]
43. Johnson, T.; Caldow, R.; Pocher, A.; Mirme, A.; Kittelson, D. A new electrical mobility particle sizer spectrometer for engineexhaust particle measurements. SAE Tech. Pap. 2004. [CrossRef]
44. Snelling, D.R.; Smallwood, G.J.; Sawchuk, R.A.; Neill, W.S.; Gareau, D.; Clavel, D.J.; Chippior, W.L.; Liu, F.; Gülder, Ö.L.; Bachalo,W.D. In-situ real-time characterization of particulate emissions from a diesel engine exhaust by laser-induced incandescence.SAE Tech. Pap. 2000. [CrossRef]
45. Snelling, D.R.; Smallwood, G.J.; Liu, F.; Gülder, Ö.L.; Bachalo, W.D. A calibration-independent laser-induced incandescencetechnique for soot measurement by detecting absolute light intensity. Appl. Opt. 2005, 44, 6773–6785. [CrossRef] [PubMed]
46. Lehmann, U.; Niemelä, V.; Mohr, M. New method for time-resolved diesel engine exhaust particle mass measurement. Environ.Sci. Technol. 2004, 38, 5704–5711. [CrossRef]
47. Weichenthal, S.; Van Ryswyk, K.; Kulka, R.; Sun, L.; Wallace, L.; Joseph, L. In-vehicle exposures to particulate air pollution inCanadian metropolitan area: The urban transportation exposure study. Environ. Sci. Technol. 2015, 49, 597–605. [CrossRef][PubMed]
48. Van Ryswyk, K.; Anastasopolos, A.T.; Evans, G.; Sun, L.; Sabaliauskas, K.; Kulka, R.; Wallace, L.; Weichenthal, S. Metro commuterexposures to particulate air pollution and PM2.5-associated elements in three Canadian cities: The Urban Transportation ExposureStudy. Environ. Sci. Technol. 2017, 51, 5713–5720. [CrossRef] [PubMed]
49. Austin, C.C.; Wang, D.; Ecobichon, D.J.; Dussault, G. Characterization of volatile organic compounds in smoke at municipalstructural fires. J. Toxicol. Environ. Health A 2001, 63, 437–458. [CrossRef] [PubMed]
50. Kittelson, D.B.; Dolan, D.F.; Verrant, J.A. Investigation of a diesel exhaust aerosol. SAE Tech. Pap. 1978, 780109. [CrossRef]51. McMurry, P.H.; Wang, X.; Park, K.; Ehara, K. The relationship between mass and mobility for atmospheric particles: A new
technique for measuring particle density. Aerosol Sci. Technol. 2002, 36, 227–238. [CrossRef]52. Park, K.; Cao, F.; Kittelson, D.B.; McMurry, P.H. Relationship between particle mass and mobility for diesel exhaust particles.
Environ. Sci. Technol. 2003, 37, 577–583. [CrossRef]53. Maricq, M.M.; Xu, N. The effective density and fractal dimension of soot particles from premixed flames and motor vehicle
exhaust. J. Aerosol Sci. 2004, 35, 1251–1274. [CrossRef]
Appl. Sci. 2021, 11, 9048 19 of 19
54. Symonds, J.P.R.; Reavell, K.S.T.J.; Olfert, J.S.; Campbell, B.W.; Swift, S.J. Diesel soot mass calculation in real-time with a differentialmobility spectrometer. J. Aerosol Sci. 2007, 38, 52–68. [CrossRef]
55. Quiros, D.C.; Hu, S.; Hu, S.; Lee, E.S.; Sardar, S.; Wang, X.; Olfert, J.S.; Jung, H.S.; Zhu, Y.; Huai, T. Particle effective density andmass during steady-state operation of GDI, PFI, and diesel passenger cars. J. Aerosol Sci. 2015, 83, 39–54. [CrossRef]
56. Stafford, R.G.; Ettinger, H.J. Filter efficiency as a function of particle size and velocity. Atmos. Environ. 1972, 6, 353–362. [CrossRef]57. Hanley, J.T.; Ensor, D.S.; Smith, D.D.; Sparks, L.E. Fractional aerosol filtration efficiency of in-duct ventilation air cleaners.
Indoor Air 1994, 4, 169–178. [CrossRef]
Related Documents