Anastasiia Koroleva EFFICIENCY OF HEAT RECOVERY UNITS IN VENTILATION Bachelor’s Thesis Building Services Engineering December 2012 brought to you by CORE View metadata, citation and similar papers at core.ac.uk provided by Theseus

Welcome message from author
This document is posted to help you gain knowledge. Please leave a comment to let me know what you think about it! Share it to your friends and learn new things together.
Transcript
Anastasiia Koroleva
EFFICIENCY OF HEAT RECOVERY UNITS IN VENTILATION
Bachelor’s Thesis Building Services Engineering
December 2012
brought to you by COREView metadata, citation and similar papers at core.ac.uk
provided by Theseus
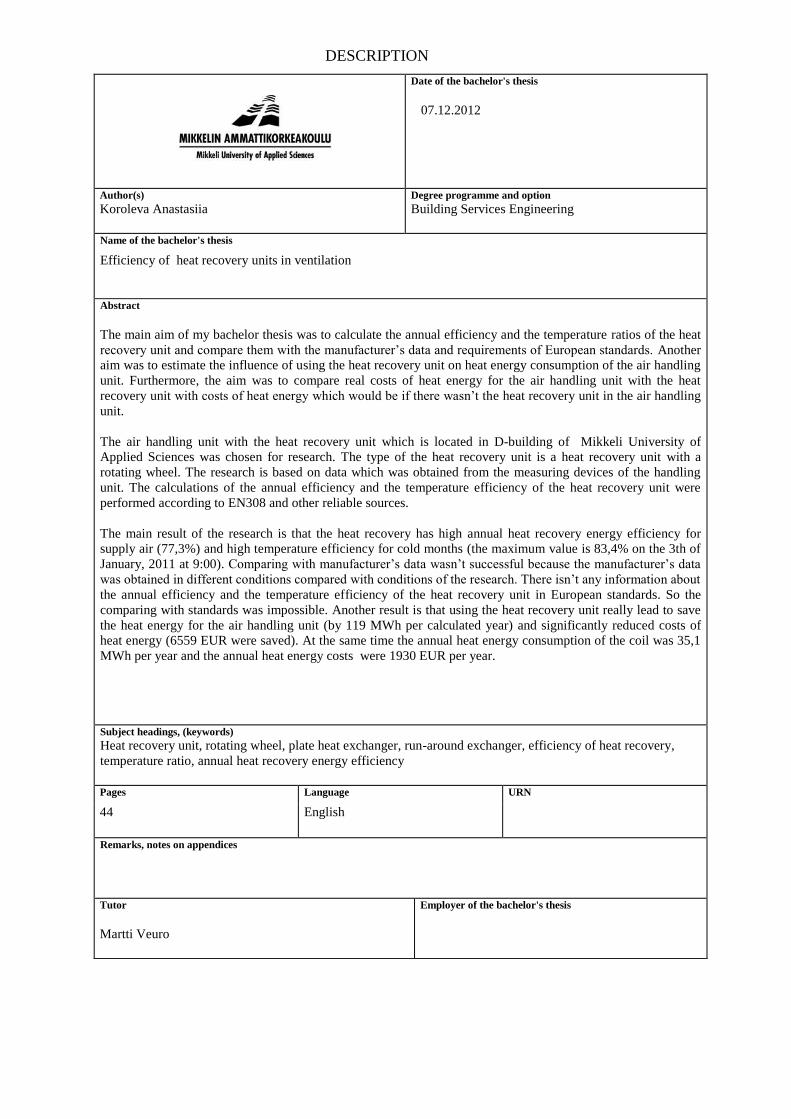
DESCRIPTION
Date of the bachelor's thesis
07.12.2012
Author(s)
Koroleva Anastasiia
Degree programme and option
Building Services Engineering
Name of the bachelor's thesis
Efficiency of heat recovery units in ventilation
Abstract
The main aim of my bachelor thesis was to calculate the annual efficiency and the temperature ratios of the heat
recovery unit and compare them with the manufacturer’s data and requirements of European standards. Another
aim was to estimate the influence of using the heat recovery unit on heat energy consumption of the air handling
unit. Furthermore, the aim was to compare real costs of heat energy for the air handling unit with the heat
recovery unit with costs of heat energy which would be if there wasn’t the heat recovery unit in the air handling
unit.
The air handling unit with the heat recovery unit which is located in D-building of Mikkeli University of
Applied Sciences was chosen for research. The type of the heat recovery unit is a heat recovery unit with a
rotating wheel. The research is based on data which was obtained from the measuring devices of the handling
unit. The calculations of the annual efficiency and the temperature efficiency of the heat recovery unit were
performed according to EN308 and other reliable sources.
The main result of the research is that the heat recovery has high annual heat recovery energy efficiency for
supply air (77,3%) and high temperature efficiency for cold months (the maximum value is 83,4% on the 3th of
January, 2011 at 9:00). Comparing with manufacturer’s data wasn’t successful because the manufacturer’s data
was obtained in different conditions compared with conditions of the research. There isn’t any information about
the annual efficiency and the temperature efficiency of the heat recovery unit in European standards. So the
comparing with standards was impossible. Another result is that using the heat recovery unit really lead to save
the heat energy for the air handling unit (by 119 MWh per calculated year) and significantly reduced costs of
heat energy (6559 EUR were saved). At the same time the annual heat energy consumption of the coil was 35,1
MWh per year and the annual heat energy costs were 1930 EUR per year.
Subject headings, (keywords)
Heat recovery unit, rotating wheel, plate heat exchanger, run-around exchanger, efficiency of heat recovery,
temperature ratio, annual heat recovery energy efficiency
Pages Language URN
44
English
Remarks, notes on appendices
Tutor
Martti Veuro
Employer of the bachelor's thesis
CONTENTS
1 INTRODUCTION ...................................................................................................... 1
2 AIMS .......................................................................................................................... 3
3 METHODS ................................................................................................................. 3
4 HEAT RECOVERY UNITS ...................................................................................... 5
4.1 Heat recovery ....................................................................................................... 5
4.2 A plate heat exchanger ........................................................................................ 5
4.3 A heat recovery unit with intermediate heat-transfer agent (Run-around coil heat
exchangers) ................................................................................................................. 8
4.4 A rotating wheel ................................................................................................... 9
5 CALCULATION OF HEAT RECOVERY EFFICIENCY ..................................... 11
6 LEGISLATION ........................................................................................................ 12
7 STUDY CASE .......................................................................................................... 20
7.1 Description of the building and its ventilation system ....................................... 20
7.2 Characteristics of air handling unit chosen for research .................................... 20
7.3 Ignored data and adopted values ........................................................................ 22
7.4 Example of calculation of efficiency.................................................................. 24
7.5 Results ................................................................................................................ 29
8.DISCUSSION ............................................................................................................ 37
BIBLIOGRAPHY ........................................................................................................ 39
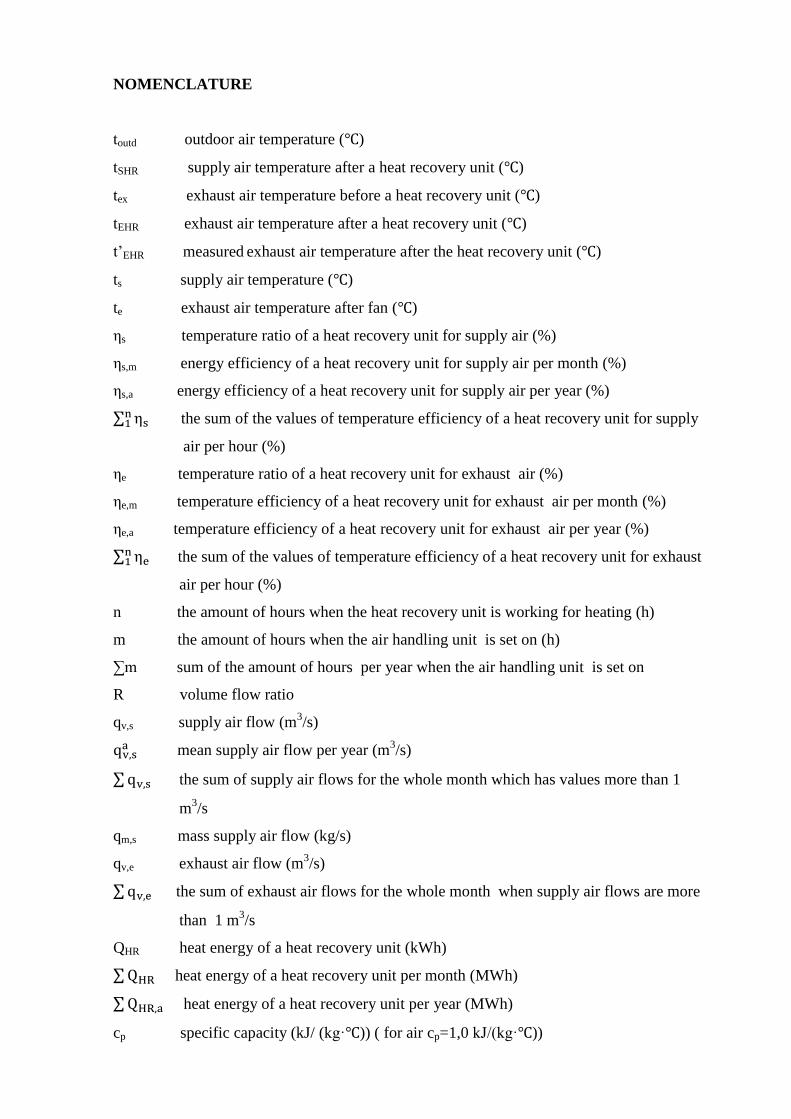
NOMENCLATURE
toutd outdoor air temperature ( )
tSHR supply air temperature after a heat recovery unit ( )
tex exhaust air temperature before a heat recovery unit ( )
tEHR exhaust air temperature after a heat recovery unit ( )
t’EHR measured exhaust air temperature after the heat recovery unit ( )
ts supply air temperature ( )
te exhaust air temperature after fan ( )
ηs temperature ratio of a heat recovery unit for supply air (%)
ηs,m energy efficiency of a heat recovery unit for supply air per month (%)
ηs,a energy efficiency of a heat recovery unit for supply air per year (%)
∑ the sum of the values of temperature efficiency of a heat recovery unit for supply
air per hour (%)
ηe temperature ratio of a heat recovery unit for exhaust air (%)
ηe,m temperature efficiency of a heat recovery unit for exhaust air per month (%)
ηe,a temperature efficiency of a heat recovery unit for exhaust air per year (%)
∑ the sum of the values of temperature efficiency of a heat recovery unit for exhaust
air per hour (%)
n the amount of hours when the heat recovery unit is working for heating (h)
m the amount of hours when the air handling unit is set on (h)
∑m sum of the amount of hours per year when the air handling unit is set on
R volume flow ratio
qv,s supply air flow (m3/s)
mean supply air flow per year (m
3/s)
∑ the sum of supply air flows for the whole month which has values more than 1
m3/s
qm,s mass supply air flow (kg/s)
qv,e exhaust air flow (m3/s)
∑ the sum of exhaust air flows for the whole month when supply air flows are more
than 1 m3/s
QHR heat energy of a heat recovery unit (kWh)
∑ heat energy of a heat recovery unit per month (MWh)
∑ heat energy of a heat recovery unit per year (MWh)
cp specific capacity (kJ/ (kg· )) ( for air cp=1,0 kJ/(kg· ))
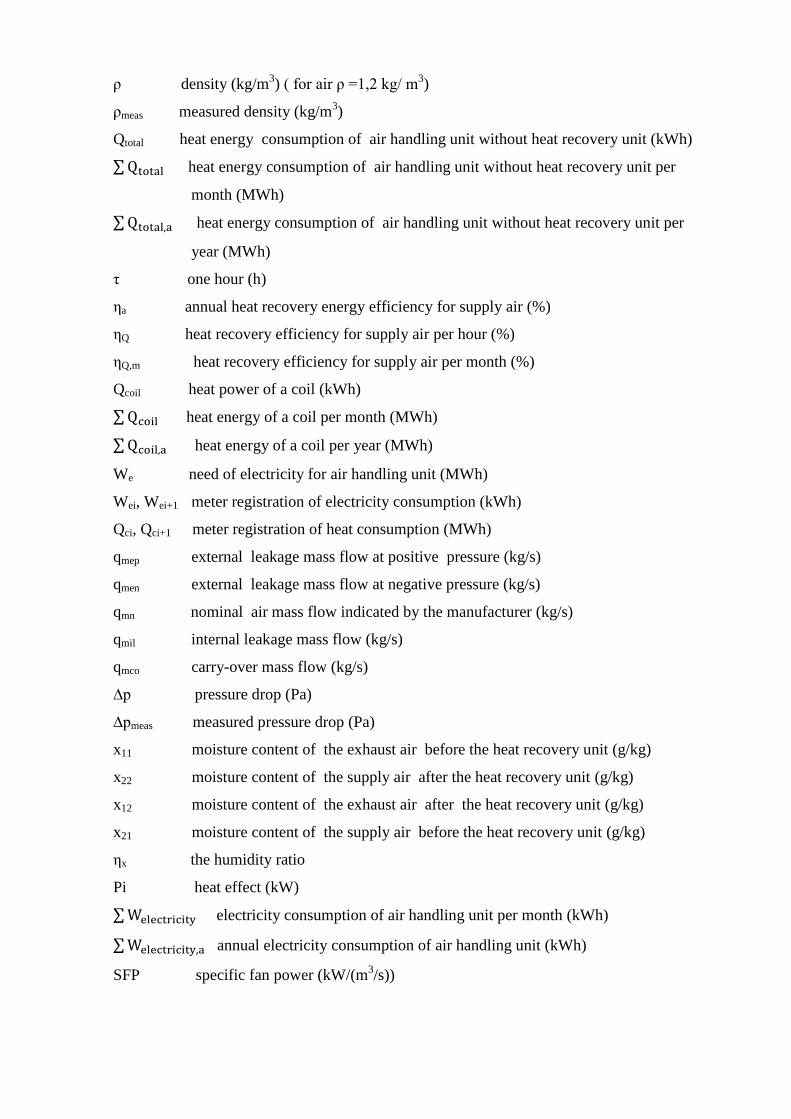
ρ density (kg/m3) ( for air ρ =1,2 kg/ m
3)
ρmeas measured density (kg/m3)
Qtotal heat energy consumption of air handling unit without heat recovery unit (kWh)
∑ heat energy consumption of air handling unit without heat recovery unit per
month (MWh)
∑ heat energy consumption of air handling unit without heat recovery unit per
year (MWh)
τ one hour (h)
ηa annual heat recovery energy efficiency for supply air (%)
ηQ heat recovery efficiency for supply air per hour (%)
ηQ,m heat recovery efficiency for supply air per month (%)
Qcoil heat power of a coil (kWh)
∑ heat energy of a coil per month (MWh)
∑ heat energy of a coil per year (MWh)
We need of electricity for air handling unit (MWh)
Wei, Wei+1 meter registration of electricity consumption (kWh)
Qci, Qci+1 meter registration of heat consumption (MWh)
qmep external leakage mass flow at positive pressure (kg/s)
qmen external leakage mass flow at negative pressure (kg/s)
qmn nominal air mass flow indicated by the manufacturer (kg/s)
qmil internal leakage mass flow (kg/s)
qmco carry-over mass flow (kg/s)
∆p pressure drop (Pa)
∆pmeas measured pressure drop (Pa)
x11 moisture content of the exhaust air before the heat recovery unit (g/kg)
x22 moisture content of the supply air after the heat recovery unit (g/kg)
x12 moisture content of the exhaust air after the heat recovery unit (g/kg)
x21 moisture content of the supply air before the heat recovery unit (g/kg)
ηx the humidity ratio
Pi heat effect (kW)
∑ electricity consumption of air handling unit per month (kWh)
∑ annual electricity consumption of air handling unit (kWh)
SFP specific fan power (kW/(m3/s))
1
1 INTRODUCTION
Energy conservation is an actual topic in our world. All countries try to save energy. There
are many ways and technologies to reduce the energy consumption. In buildings HVAC
systems are one of the main fields where energy conservation measures are necessary due to
high energy costs. It is known that the improvement of HVAC systems leads to decrease
building energy costs by 30-60%. In ventilation using heat recovery units is the one method
of many others energy saving measures.
Nowadays heat recovery units are common in ventilation, especially in countries with cold
climate. These devices make it possible to reduce energy consumption of the air handling
unit. When we use heat recovery unit we use energy less to heating coils and use natural
processes without using electricity or other types of energy which we can get only when we
use energy resources. Heat recovery units can also be installed directly in the room and are a
part of decentralized ventilation system. These systems are used for providing necessary air
exchange complicated due to using multiple glass panes. If heat recovery units are used in
systems like these, heat losses of room/building reduce by the value of heat losses through
ventilation. It means that heat demand of the heating system of the building decreases as well
and a smaller size of a heat source is needed for heating needs due to reduction of energy and
power consumption.
Therefore, the advantage of using heat recovery units is energy saving, and as a result,
savings on costs for the operation of the ventilation system. Disadvantage is a necessary
additional initial investments to install a heat recovery unit.
The topic of this bachelor thesis is efficiency of heat recovery units. The main aims are to
find out heat recovery units have the efficiency which manufacturers promise to consumers or
not, what the efficiency of them is in practice and it corresponds to requrements of European
standards or not. Furthermore, the aim is to calculate how much heat energy consumption of
the air handling unit is reduced due to using the heat recovery unit.
At first, there is a theoretical background about heat recovery processes and methods of
efficiency calculations in this thesis. Then there is a description of research, i.e. what exactly
were calculated and what methods were used for this aim.

2
After this, there is an example of efficiency calculations of the heat recovery unit with a
rotating wheel located in D-building of Mikkeli University of Applied Sciences. This heat
recovery unit is a component of the air handling unit. The calculations are made on the basis
of data which was obtained from the building automation system. Measuring equipment is
installed in the air-handling unit of D-building. The data is from a period of more than one
year. Data collecting has begun since the end of 2010.
Finally, there are results of all research in the form of summary tables and charts. All obtained
data were analyzed comparing them with manufacturer’s data and European standards and a
conclusion about efficiency of using heat recovery in practice was drawn.
3
2 AIMS
The main aim of my bachelor thesis is to find out the annual energy efficiency and the
temperature ratios of the heat recovery unit with a rotating wheel which is the component of
the air-handling unit located in D-building. D-building is one of the buildings of Mikkeli
University of Applied Sciences.
Another aim is to calculate the electricity and heat energy consumption of the air handling
unit with the heat recovery unit and without it. The benefit of using the heat recovery should
be calculated as well.
Furthermore, the results of calculations of the temperature ratios of the heat recovery unit will
be compared with manufacturer’s data about this equipment. The aim is to check how
obtained data corresponds to manufacturer’s data.
These results of calculations of the temperature ratios and annual efficiency of the heat
recovery unit will also be compared with Finnish National Building Codes and other
European standards.
3 METHODS
To achieve aims collecting the initial data is done. The initial data is the data obtained from
the measuring devices which are installed in the air handling unit chosen for research. They
are outdoor air temperature, supply air temperature after the heat recovery unit, exhaust air
temperature before the heat recovery unit, exhaust air temperature after the heat recovery
unit, supply air flow, exhaust air flow, electricity (for fans), heat power (for coil). All initial
data is per hour. Collection of the initial data had been started since September, 2010. It is still
going on. All initial data are in the form of reports for every month. The reports have .xml
extention. Therefore, they can be opened in Microsoft Excel.
After the collecting data the calculations of temperature ratio of the heat recovery unit with
different ways, electricity per hour for fans, heat power for coil, heat power for the heat
recovery unit, heat power for the air handling unit without the heat recovery unit are made.
4
Also, temperature efficiency of the heat recovery unit per month, electricity per month for
fans, energy per month for coil, energy per month for heat recovery unit, energy per month
for the air handling unit without the heat recovery unit are calculated. Annual values of these
parameters are obtained as well. All calculations are made in Microsoft Excel according to
EN 308.
Then obtained values are analyzed and compared with manufacturer’s data. The main results
are tabled. The charts of electricity and energy consumption of the air handling unit for whole
year (2/2011 – 1/2012) are drawn. Furthermore, the charts of electricity and energy costs for
2/2011 – 1/2012 are drawn.
Also, the comparing method is used to check compliance of results of calculations with
Finnish National Building Codes and other European standards. Based on this, the conclusion
about performance quality of the air-handling unit was done.
5
4 HEAT RECOVERY UNITS
In this chapter the definition of heat recovery is given. Furthermore, the different types of
heat recovery units which are used in ventilation systems are considered. The main
advantages and disadvantages of them are shown.
4.1 Heat recovery
Heat recovery units are used in air-handling units in order to save energy. The principle of
operation is to heat the supply air with the exhaust air heat in cold season and to cool the
supply air with the energy of the exhaust air in a warm season(if there is an air conditioning
system in selected room/building).
There are two types of heat recovery mechanisms. Both of them have their advantages and
disadvantages and values of efficiency. But using either of them leads to decrease energy
consumption of air-handling unit, so saves money.
The first one is a recuperative heat exchange. It means that heat transfer happens through a
surface. This mechanism is used in two kinds of heat recovery units: a plate heat exchanger
and a heat recovery unit with intermediate heat-transfer agent. /1./
The second one is a regenerative heat exchange. The principle of this process is that one
heat-transfer agent delivers heat to a surface and then another heat-transfer agent goes to
this surface and take this heat. It means that heat-transfer agents streams this surface by
turns. A rotating wheel is a kind of heat recovery units which uses this mechanism. /1./
4.2 A plate heat exchanger
Plate heat exchangers are the most common heat recovery units. Supply and exhaust air flows
cross each other in a plate heat exchanger. Air flows aren’t mixed because they are separated
by plates. Due to it only sensible heat is transferred and humidity ratio of air flows doesn’t
change. Various materials can be used in producing flat plates, e.g. plastic, aluminum, etc. /2,
p.1./
6
There are many advantages of using a plate heat exchanger as a heat recovery unit. First of
all, it has high efficiency. Besides, installation and operation a system with such device
cause low costs. These units have low pressure drops and using them is effective action for
noise-damping purposes. A cross flow plate heat exchanger hasn’t moving parts, so it doesn’t
require mechanical maintenance. As a result, this equipment is very reliable. If there are dust
or contaminating substances in air, it is necessary to provide suitable filters upstream of the
heat exchanger. So it’s easy to clean these devices./3./
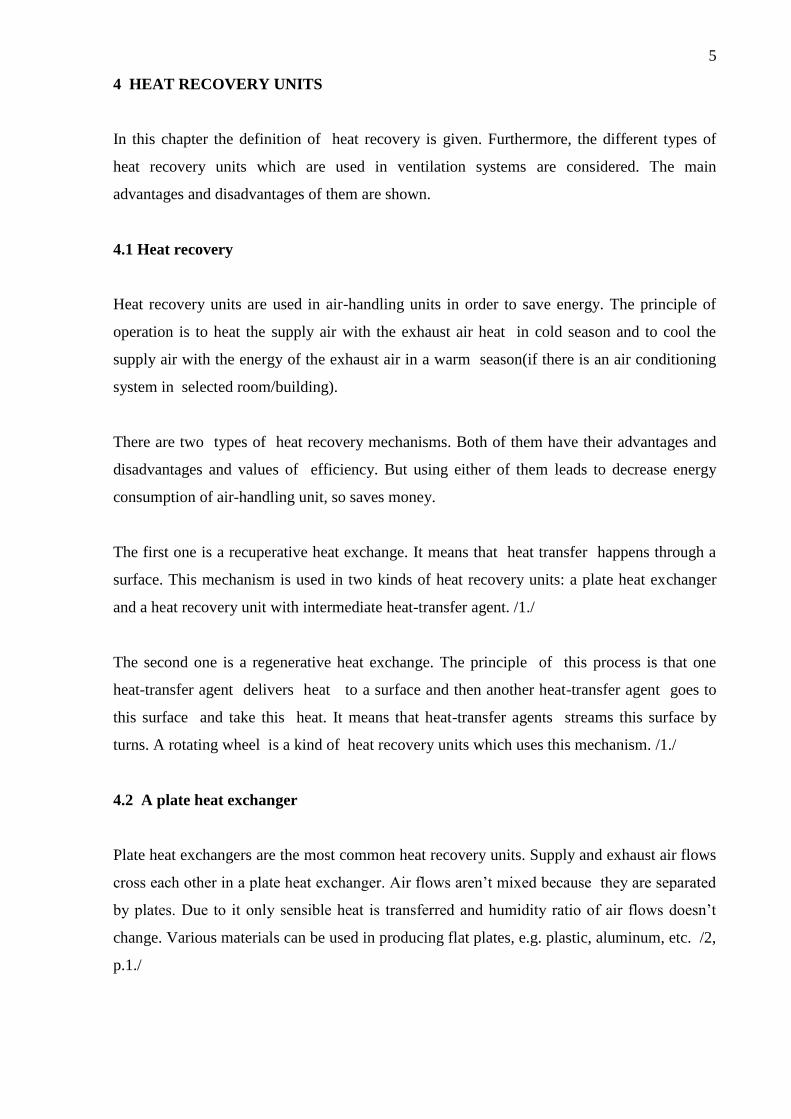
The example of a cross-flow plate heat exchanger is shown in Figure 1.
FIGURE 1. The example of plate heat exchanger /2, p.1/
There is one main disadvantage of this equipment. If a temperature of exhaust air which
gives its heat to supply air becomes lower than a dew point temperature, water vapour from
this air will condensate on a surface of flat plate. It can lead to icing and formation of hoar
frost on internal equipment surfaces (if a temperature of plates surface is 0 or has a
negative value) and to condensate accumulation (if a temperature of plates surface has a
positive value). A dew point temperature of the exhaust air depends on its relative humidity
and temperature. The more the moisture content of air the higher a dew point temperature.
Pressure drop in a heat recovery unit increases due to freezing, so air flows through this
device decreases and efficiency of the unit decreases as well./2, p.2-4./
7
Therefore, if we use a plate heat exchanger we should take into account condensation. A heat
recovery unit should be oriented so that water due to condensation can easily flow downgrade
out of the unit. Also the condensate shouldn’t leaks into the supply air flow. To ensure it,
the pressure of the supply air flow should be higher than the pressure of the exhaust air
flow.
Sometimes to avoid freezing and condensation the efficiency of a heat recovery unit should be
decreased. The high efficiency means that the heat exchanger transfers more heat to the
supply air flow from the exhaust air flow, therefore, the temperature of exhaust air flow
becomes low and it causes condensation and freezing. If efficiency is lower the temperature of
exhaust air is higher and condensation and freezing don’t occur.
There are many other ways to prevent a heat recovery unit from freezing. But all these
methods don’t help to solve this problem completely. If the device is totally frozen, it is
recommended to stop its work or reduce the supply air flow while the warm exhaust air flow
will provide defrosting of the device. Furthermore, there is a method which is called “Full
Bypass”. It is that the cold supply air goes around the exchanger through a bypass when its
temperature is less than a certain temperature (temperature of a “frost limit” for surface of a
heat recovery unit). This process leads to heating the device by warm exhaust air. Another
method is called “Face-and-Bypass”. When an automation system indicates that freezing has
begun, a part of supply air flow goes through the heat recovery unit and another part goes
into bypass line. It means that supply air flow decreases to certain amount due to which the
temperature of exhaust air flow doesn’t achieve a dew point temperature, therefore, freezing
doesn’t occur. “Cold Corner Bypass” is a method of defrosting as well. It is that the air
channels are blocked mechanically in a part of the device, so the cold air flow reduces in the
cold corner of the unit. Also, “Traversing Frost Control” is known as another way of
defrosting. It is that the portions of the supply air channels are blocked temporarily, so it is
given time to defrosting these ones. Last known method is called “Pre-Heat”. It is used in
very cold conditions. The supply air is preheated before it goes through the heat recovery
unit./2, p.4-5./
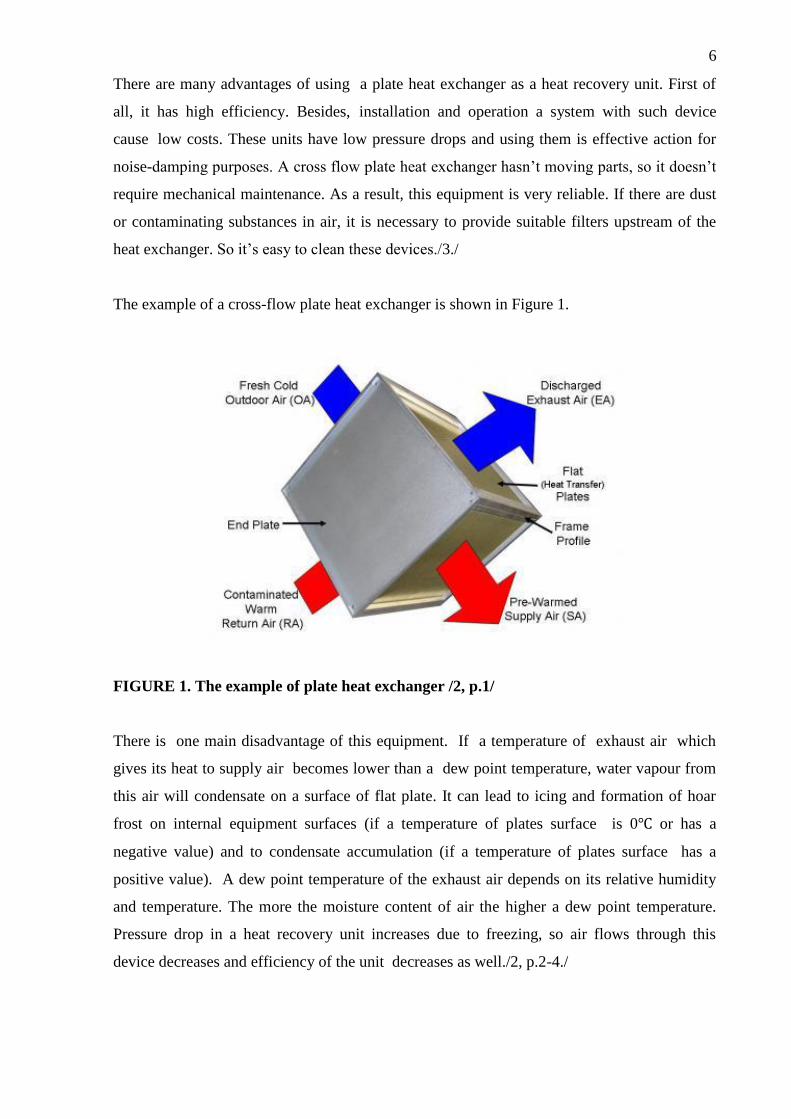
A heat recovery unit can consist of some plate heat exchangers. There are some
configurations of plate heat exchangers which are in Figure 2.
8
FIGURE 2. The example of plate heat exchangers’ configurations /4/
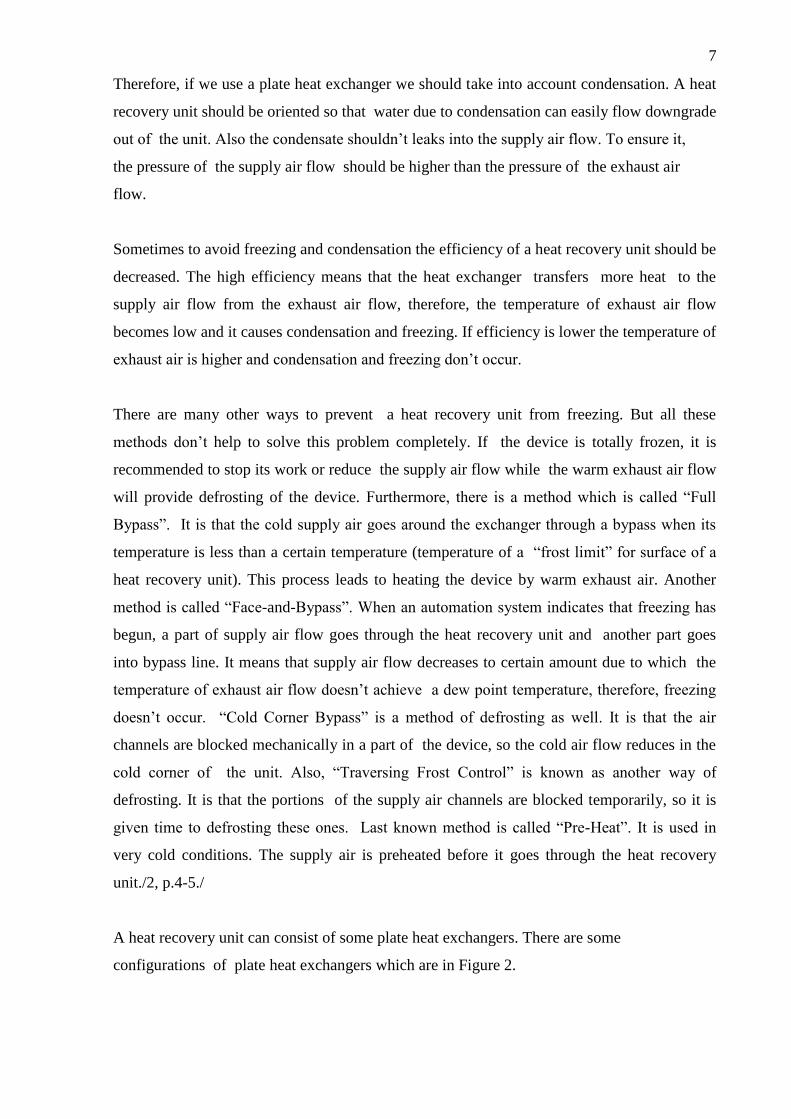
4.3 A heat recovery unit with intermediate heat-transfer agent (Run-around coil heat
exchangers)
A heat recovery unit with intermediate heat-transfer agent consists of two detached coils. The
supply air flow goes through one of them, the exhaust air flow goes through another one.
These coils are connected with pipes. There is waterglycol or water as a heat-transfer agent
inside these pipes. The principle of operation is that heat from the exhaust air flow is
transfered to glycol through the surface of the one coil and this heat is transfers from glycol
to the supply air flow through the surface of the another coil. /5, p.48./ Figure 3 shows a
scheme of a heat recovery unit with intermediate heat-transfer agent.
FIGURE 3. Run-around coil heat exchanger – functional scheme
9
A three-way valve is used in this heat recovery unit. It is needed for protection the exhaust
coil from freezing. This valve provides a value of a heat-transfer agent temperature 5 or
above. Also using of this valve ensures that the temperature of supply air flow has a certain
value. /5, p.48./
Because the supply and exhaust air flows aren’t in contact with each other, the coils can be
separate from each other. This fact leads to the reason that the coils are suitable for
renovation. Another advantage is that water glycol or water loop doesn’t transfer humidity
between the supply and exhaust airflows. Therefore, seal leakages between both flows are
impossible. /5, p.48./
The main disadvantage of this type of a heat recovery unit is that the circulation pump
consumes a lot of energy. This fact reduces the efficiency of heat recovery and sometimes it
is unreasonable to use heat recovery in the system. Another important thing that it is
necessary to maintain this unit to significant extent due to a large number of valves and
fittings and a pump. Also there isn’t humidity exchange between the supply and the exhaust
air flows. It shouldn’t be acceptable for buildings where humidity is one of a determining
factor/6, p.92./
The efficiency of a heat recovery unit with intermediate heat-transfer agent is changed if the
flow of waterglycol or water in the loop is reduced or shunted/7, p.336/.
4.4 A rotating wheel
A heat recovery unit with a rotating wheel (a thermal wheel) is a device which consists of a
wheel through which the supply and exhaust air flows go in turns. It means that at first the
exhaust air flow transfers the heat to an upper part of the wheel then it rotates and this
heated part moves downward, the supply air flows through this one and becomes warmer. An
electromotor provides rotation of the wheel.
Rotating wheels transfer both moisture and heat between two air flows. It is important in
systems which should provide thermal comfort and indoor air quality conditions in buildings
where humidity is a key variable. Rotating wheels are over half of all new air-to-air heat
exchangers installed in buildings./8./ They are the most effective of heat recovery units.
Depending on application type these devices have efficiency from 50 to 85 percent/9/.
10
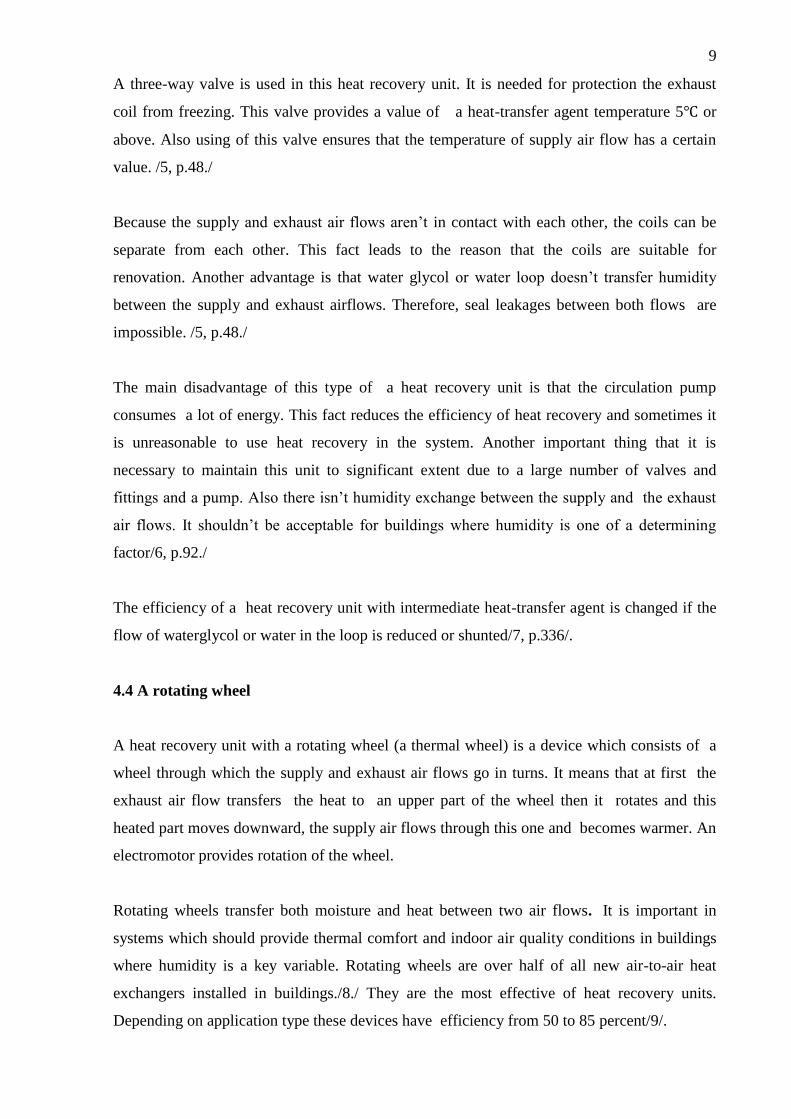
Figure 4 shows a scheme of a heat recovery unit with a rotating wheel.
FIGURE 4. Heat recovery unit with a rotating wheel/10, p.9/
There are two types of rotating wheels. The first type is a sensible heat wheels.They transfer
only sensible heat. It means that only temperature of supply and exhaust air is changed.
Humidity is not transferred in this type of rotating wheels. This equipment is often used in
office buildings and other types of buildings where humidity isn’t a critical factor. The
second type of rotating wheels is a total energy wheel, also known as enthalpy wheels. A
desiccant(or absorbent) is used for humidity transfer. It can be a material such as molecular
sieve or silica gel. The air flow with a higher moisture content transfers a portion of the
humidity to a flow of lower humidity. The ideal amount of humidity should be taken into
account in the air properties of designing calculations. The ventilation systems with enthalpy
wheels should be used in schools, hospitals and other environments where it is important to
maintain comfortable humidity. /9, p.1-2./
The efficiency of a rotating wheel can be changed by adjustment of the speed of the rotor
/7, p.336/.
The main disadvantages of this type of heat recovery units are that, firstly, the using them is
possible if the ducts of supply and exhaust air are closed to each other, secondly, the using
these devices leads to electricity extra consumption which needs for the electromotor, thirdly,
polluted air partially can be carried to supply air flow. Pollution can be reduced by using
special constructive measures (e.g. purge zone), but they can’t ensure complete treatment of
air./10, p.92./ Therefore, a rotating wheel isn’t allowed to use in ventilation systems of
cleanrooms. Also, if the exhaust air from a bathroom exhaust system contains odors or it is
11
toxic using a wheel isn’t acceptable. To add a purge section into the wheel is a good solution
from polluted air. A purge uses a small quantity of supply air which is bypassed through the
purge section before the main supply air flow goes through the wheel. The wheel with the
purge section uses more energy for the fan, but this decision is effective for eliminating
unhealthy exhaust air./9, p.2./
Condensation and frosting are problems that can occur when a rotating wheel is used. The
reason and solutions of these problems are the same as for a plate heat exchangers. However,
total rotating wheels are much less susceptible to freezing and condensation than other
sensible heat exchangers due to change of moisture and temperature of flows. It means when
exhaust air flow transfers its heat it also gives moisture to the supply air flow, so it is dried.
Therefore, the temperature of exhaust air is less likely to achieve a dew point temperature./8./
5 CALCULATION OF HEAT RECOVERY EFFICIENCY
The efficiency of heat recovery depends on factors like the type of heat exchanger, the size
of the heat exchanging surfaces and the heat transferring properties of these surfaces. The
efficiency can be evaluated by using results of calculations of temperature ratio for supply and
exhaust air .
The temperature ratio of a heat recovery unit for supply air can be calculated using the
equation 1 /11, p.7/.
(1)
The temperature ratio of a heat recovery unit for supply air is about 50-60% for run-around
coil heat exchangers. It is about 70-80% for plate heat exchangers and about 70% for rotating
wheels./7, p.335./
The temperature ratio of a heat recovery unit for exhaust air can be calculated using the
equation 2
(2)
In practice can be calculated with the equation 3
(3)
Where R is equal to the equation 4
(4)
12
Also it can be obtained with equation 5:
(5)
Annual heat recovery energy efficiency can be calculated with the equation 6
∑
∑ (6)
where ∑ - the sum of energy of a heat recovery unit in each month of year, where the
heat energy of a heat recovery unit per month is the sum of heat energy of a heat recovery
unit per hour;
∑ - energy of air handling unit without heat recovery unit for whole year which is the
sum of energy of air handling unit without heat recovery unit in each month of year, where
energy of air handling unit without heat recovery unit per month is the sum of heat energy of
air handling unit without heat recovery unit per hour;
per hour can be found with the equation 7
( ) (7)
per hour can be found with the equation 8
( ) (8)
6 LEGISLATION
There are many requirements to ventilation system with heat recovery units in Finnish
Building Code D2. A heat recovery unit shouldn’t be used in systems if the exhaust air is
polluted and it prevents the operation of the heat recovery unit or the temperature of exhaust
air is lower than +15 during the heating season. A significant value exhaust air shouldn’t
be transferred to supply air in heat recovery unit. Therefore, construction and pressures of the
device should be such as to provide this requirement. /12, p.27./
A pressure difference between supply and exhaust air flows or a direction of a leakage air
flow in a heat recovery unit depends on the class of exhaust air flow which goes through the
unit. Classes of exhaust air are presented in Table 1.
13
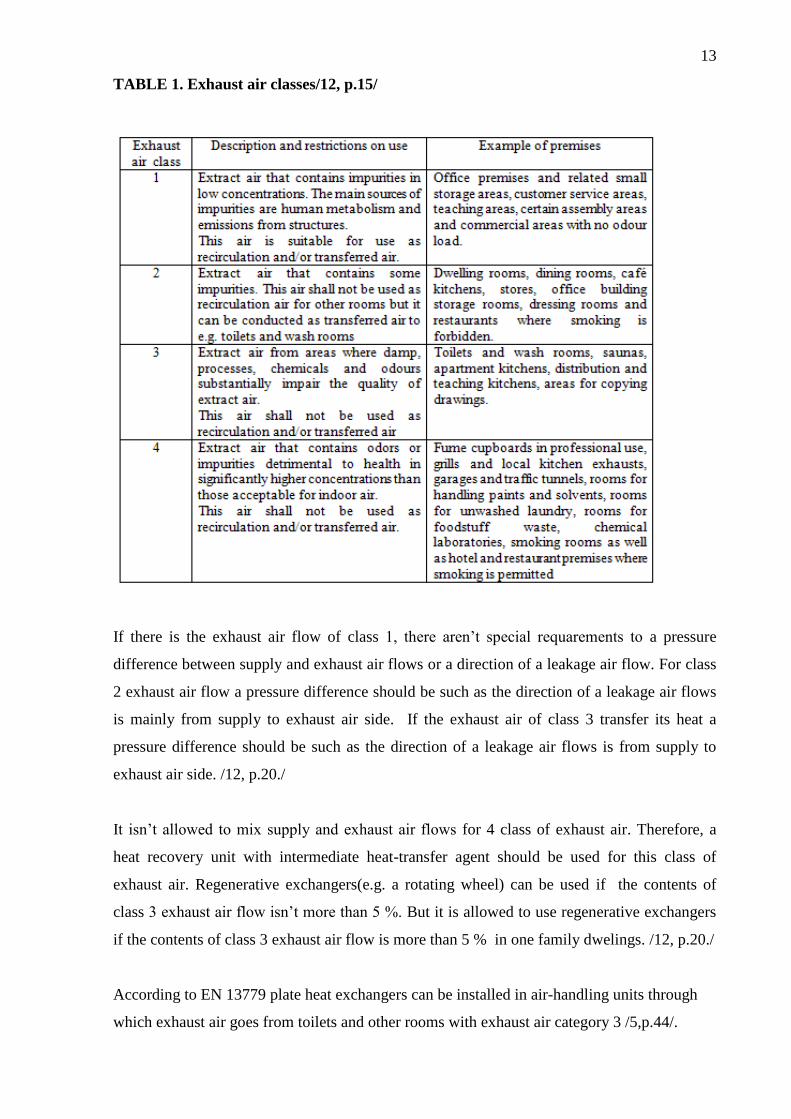
TABLE 1. Exhaust air classes/12, p.15/
If there is the exhaust air flow of class 1, there aren’t special requarements to a pressure
difference between supply and exhaust air flows or a direction of a leakage air flow. For class
2 exhaust air flow a pressure difference should be such as the direction of a leakage air flows
is mainly from supply to exhaust air side. If the exhaust air of class 3 transfer its heat a
pressure difference should be such as the direction of a leakage air flows is from supply to
exhaust air side. /12, p.20./
It isn’t allowed to mix supply and exhaust air flows for 4 class of exhaust air. Therefore, a
heat recovery unit with intermediate heat-transfer agent should be used for this class of
exhaust air. Regenerative exchangers(e.g. a rotating wheel) can be used if the contents of
class 3 exhaust air flow isn’t more than 5 %. But it is allowed to use regenerative exchangers
if the contents of class 3 exhaust air flow is more than 5 % in one family dwelings. /12, p.20./
According to EN 13779 plate heat exchangers can be installed in air-handling units through
which exhaust air goes from toilets and other rooms with exhaust air category 3 /5,p.44/.
14
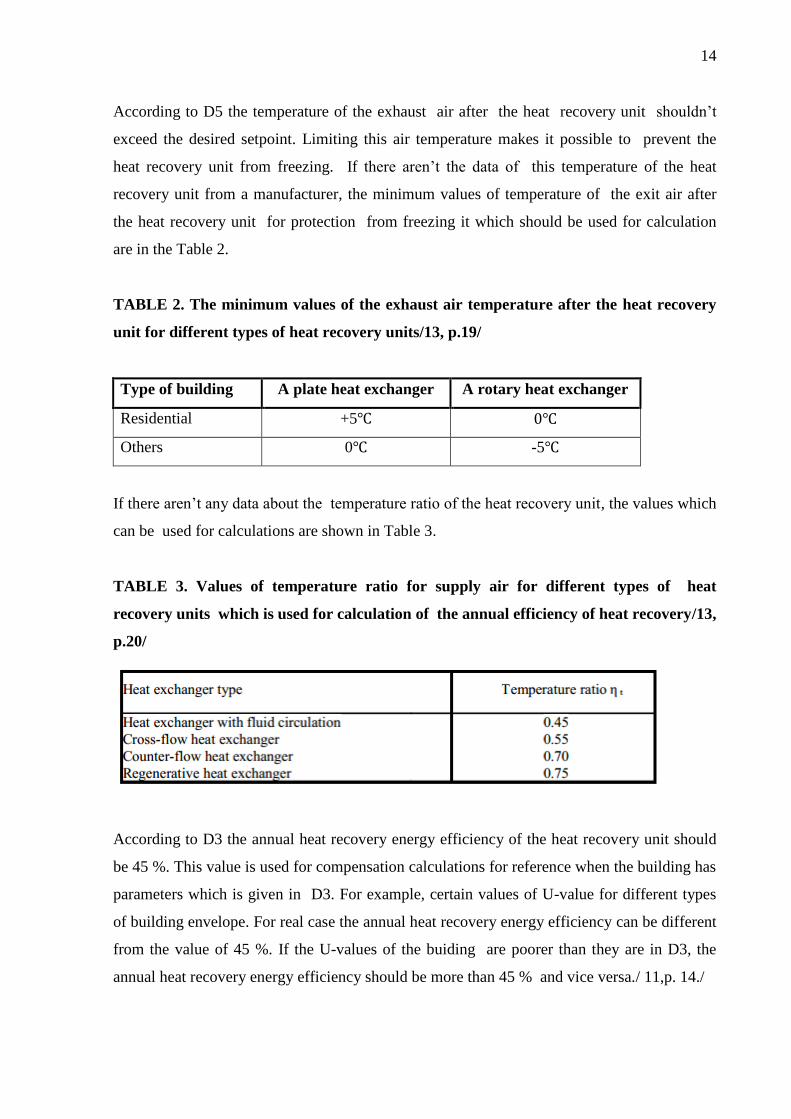
According to D5 the temperature of the exhaust air after the heat recovery unit shouldn’t
exceed the desired setpoint. Limiting this air temperature makes it possible to prevent the
heat recovery unit from freezing. If there aren’t the data of this temperature of the heat
recovery unit from a manufacturer, the minimum values of temperature of the exit air after
the heat recovery unit for protection from freezing it which should be used for calculation
are in the Table 2.
TABLE 2. The minimum values of the exhaust air temperature after the heat recovery
unit for different types of heat recovery units/13, p.19/
Type of building A plate heat exchanger A rotary heat exchanger
Residential +5
Others 0 -5
If there aren’t any data about the temperature ratio of the heat recovery unit, the values which
can be used for calculations are shown in Table 3.
TABLE 3. Values of temperature ratio for supply air for different types of heat
recovery units which is used for calculation of the annual efficiency of heat recovery/13,
p.20/
According to D3 the annual heat recovery energy efficiency of the heat recovery unit should
be 45 %. This value is used for compensation calculations for reference when the building has
parameters which is given in D3. For example, certain values of U-value for different types
of building envelope. For real case the annual heat recovery energy efficiency can be different
from the value of 45 %. If the U-values of the buiding are poorer than they are in D3, the
annual heat recovery energy efficiency should be more than 45 % and vice versa./ 11,p. 14./
15
According to EN 308 there are three categories of heat recovery units. The first category (I)
are recuperators, e.g a plate heat exchanger. The second category (II) are heat exchangers
with intermediary heat transfer medium, besides the category IIa is without phase-change and
the category IIb is with phase-change. A run-around coil exchanger is the category IIa. The
third category (III) are regenerators, moreover the category IIIa is non hygroscopic and the
category IIIb is hygroscopic. Heat recovery units with rotating wheels have the category
III./14, p.3/
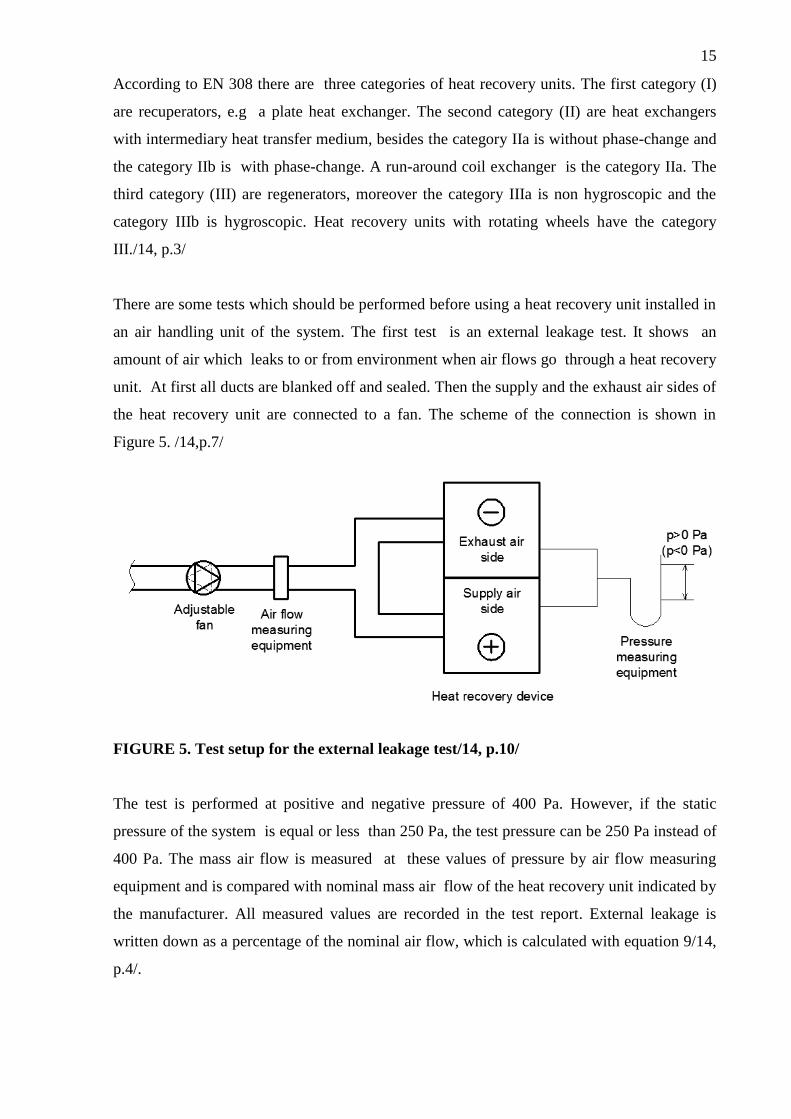
There are some tests which should be performed before using a heat recovery unit installed in
an air handling unit of the system. The first test is an external leakage test. It shows an
amount of air which leaks to or from environment when air flows go through a heat recovery
unit. At first all ducts are blanked off and sealed. Then the supply and the exhaust air sides of
the heat recovery unit are connected to a fan. The scheme of the connection is shown in
Figure 5. /14,p.7/
FIGURE 5. Test setup for the external leakage test/14, p.10/
The test is performed at positive and negative pressure of 400 Pa. However, if the static
pressure of the system is equal or less than 250 Pa, the test pressure can be 250 Pa instead of
400 Pa. The mass air flow is measured at these values of pressure by air flow measuring
equipment and is compared with nominal mass air flow of the heat recovery unit indicated by
the manufacturer. All measured values are recorded in the test report. External leakage is
written down as a percentage of the nominal air flow, which is calculated with equation 9/14,
p.4/.
16
(9)
During the test density of the air should be between 1,16 kg/m3 and 1,24 kg/m
3. The accuracy
of air flows measurements should be ±5% and the accuracy of the static pressure
measurements should be ±3%./14, p. 7/
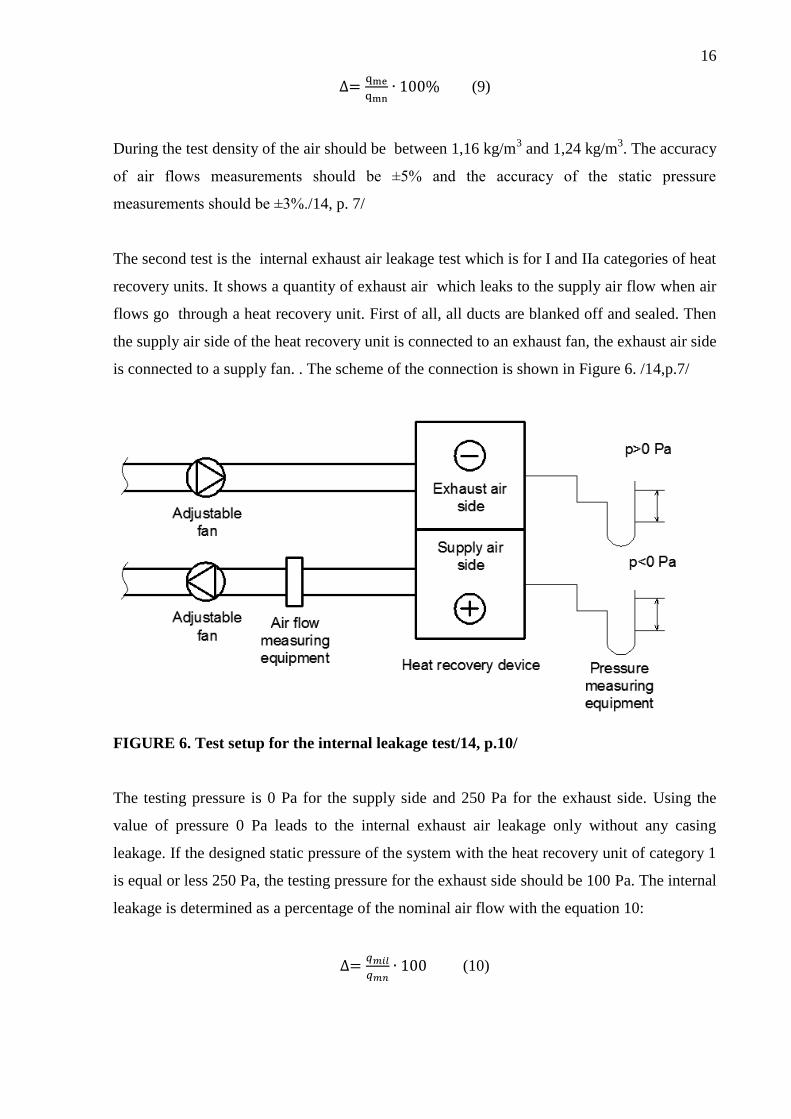
The second test is the internal exhaust air leakage test which is for I and IIa categories of heat
recovery units. It shows a quantity of exhaust air which leaks to the supply air flow when air
flows go through a heat recovery unit. First of all, all ducts are blanked off and sealed. Then
the supply air side of the heat recovery unit is connected to an exhaust fan, the exhaust air side
is connected to a supply fan. . The scheme of the connection is shown in Figure 6. /14,p.7/
FIGURE 6. Test setup for the internal leakage test/14, p.10/
The testing pressure is 0 Pa for the supply side and 250 Pa for the exhaust side. Using the
value of pressure 0 Pa leads to the internal exhaust air leakage only without any casing
leakage. If the designed static pressure of the system with the heat recovery unit of category 1
is equal or less 250 Pa, the testing pressure for the exhaust side should be 100 Pa. The internal
leakage is determined as a percentage of the nominal air flow with the equation 10:
(10)
17
The result of this calculation is recorded to the test report. The inaccuracy of air flows
measurements shouldn’t exceed ±6%. The inaccuracy of measurements of static pressure
difference between the supply and the exhaust side shouldn’t exceed ±3%. During the test
density of the air should be between 1,16 kg/m3 and 1,24 kg/m
3. Also, internal exhaust air
leakage test can be performed with the tracer gas technique.
The internal exhaust air leakage can be in the heat recovery units of category III, e.g. a heat
recovery unit with a rotating wheel. The leakage flow depends on the effectiveness of
insulation. So, overpressure on the supply side is used in these units and the manufacturer
usually gives the information about leakage of supply air into the exhaust air side. In spite of
overpressure requirements a small quantity of internal leakage can be obtained by the rotation
of the rotor. This phenomenon is called carry-over and another type of the test is needed to
define the mass exhaust air flow which leaks to the supply side of the heat recovery unit of
category III./14, p.5/
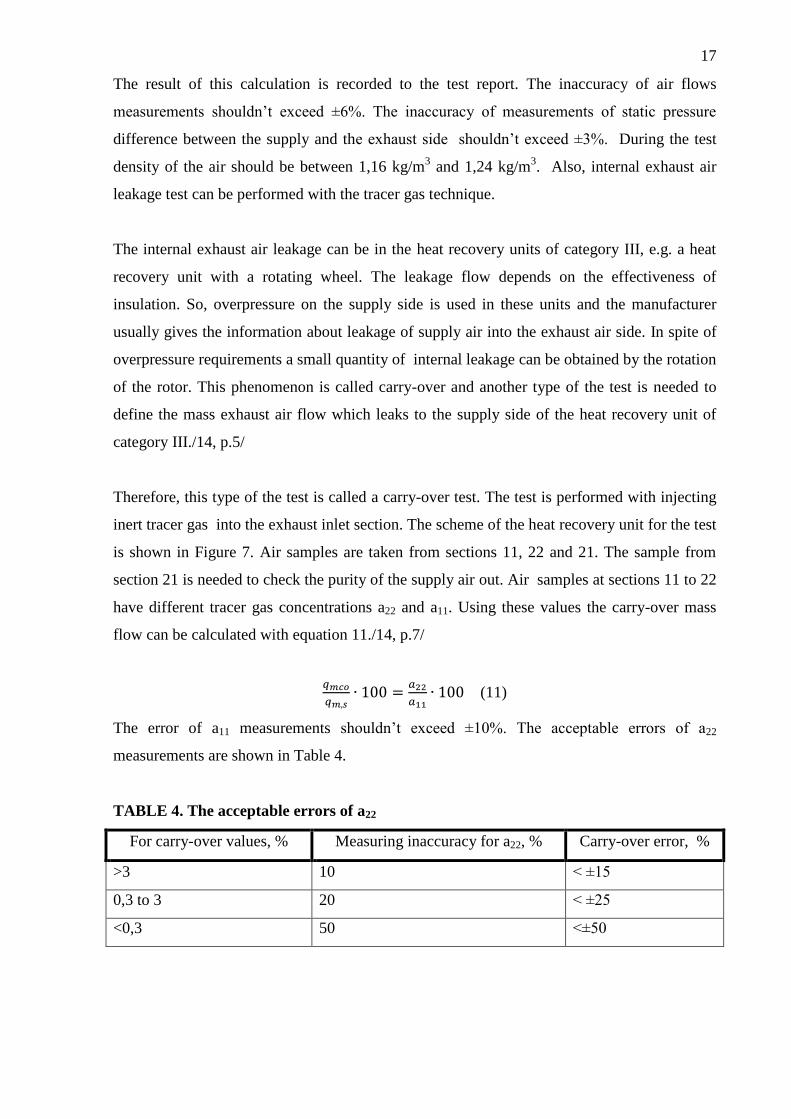
Therefore, this type of the test is called a carry-over test. The test is performed with injecting
inert tracer gas into the exhaust inlet section. The scheme of the heat recovery unit for the test
is shown in Figure 7. Air samples are taken from sections 11, 22 and 21. The sample from
section 21 is needed to check the purity of the supply air out. Air samples at sections 11 to 22
have different tracer gas concentrations a22 and a11. Using these values the carry-over mass
flow can be calculated with equation 11./14, p.7/
(11)
The error of a11 measurements shouldn’t exceed ±10%. The acceptable errors of a22
measurements are shown in Table 4.
TABLE 4. The acceptable errors of a22
For carry-over values, % Measuring inaccuracy for a22, % Carry-over error, %
>3 10 < ±15
0,3 to 3 20 < ±25
<0,3 50 <±50
18
The static pressure difference of the test should be from 0Pa to 20 Pa. During the test density
of the air should be between 1,16 kg/m3 and 1,24 kg/m
3. The supply and the exhaust mass
flows should be the same and equal to the nominal air flow of the heat recovery unit.
The fourth test is a ratio test. The temperature and humidity ratios are determined during the
test. The period of measurements is at least 30 minutes. The temperature ratio is calculated
with equation 1 using temperatures which are measured. The measured temperatures should
be adjusted with ±0,5K. The scheme of air handling unit for the test is shown in Figure 7.
/14,p.7/
FIGURE 7. Test setup for ratio tests and pressure drop tests/14, p.11/
The dry and wet or dew point temperatures are measured to determine moisture content of the
air. The humidity ratio is calculated with the equation 12:
(12)
The inaccuracy of dry bulb temperature shouldn’t exceed ±0,2K. The inaccuracy of wet bulb
temperature shouldn’t exceed ±0,3K. During measuring the wet bulb temperature velocity of
the air flow should be between 3,5 to10m/s. The static pressure difference of the test should
be from 0Pa to 20 Pa between sections 22 and 11. The ambient temperature should be
between 17 and 27 , but for warm climates it can be from 25 to 35 . If the external and
internal leakage exceed 3% of the nominal air flow the test shouldn’t be performed because
air leakages have an influence on temperature and humidity ratios./14, p.7/
19
The air conditions which should be during the test are shown in Table 5.
TABLE 5. The air conditions for the ratio test/14, p. 6/
Application mode Category/Temperature, Category/Temperature,
Recovery device category I; II; IIIa IIIb
Exhaust inlet air:
Exhaust air temp. before HRU (tex)
Wet bulb temp. before HRU
25 25
<14 18
Supply inlet air:
Supply air temp. before HRU (toutd)
Wet bulb temp. before HRU
5 5
3
The fifth test is a pressure drop test. The scheme for test is in Figure 7. The supply and the
exhaust air flows, the pressure drops on the exhaust-air side and on the supply-air side are
measured during the test. The measurements should be carried out at a constant temperature.
The pressure drops should be corrected for standard air with equation 13/14, p.8/.
(13)
The supply and exhaust air flows should be measured with errors less than ±3%. Errors of
static pressure measurements should be less than ±3%/14, p.8/
Heat balance should be calculated for all tests. The heat effect ratio should be equal to 1. It is
between the two flows. The error can be ±5%. Heat effect can be calculated with equation
14./14, p.8/.
(14)
It is calculated for the supply and exhaust air flows. The heat effect ratio is the heat effect of
supply air divided by the heat effect of exhaust air.
20
7 STUDY CASE
This chapter is the practical part of this bachelor thesis. There are the description of the
building and the ventilation system, the scheme of the air handling unit. Furthermore, the
calculations of efficiency of the heat recovery unit are shown. There is an example of the
calculations and the summary tables of obtained results.
7.1 Description of the building and its ventilation system
D-building is one of the buildings owned by Mikkeli University of Applied Sciences. It is an
educational building, i.e. the classrooms take up the biggest part of the building. Therefore, D-
building is a public building which has 3 storeys. There are technical rooms above the 3rd
storey. Two storeys of the building was built in the 1970s. The third floor was designed in
June, 2009 and built at the end of 2009. At the same time ventilation system was renovated
and new air-handling units were installed.
There are the ventilation system serviced D and X-building and 6 air handling units(TK41;
TK42; TK43; TK44; TK45; TK46) in this building. The ventilation system is a mechanical
supply-and-exhaust ventilation system. All air handling units are in the technical rooms which
are above the 3rd storey. TK41 and TK42 service the second floor. TK43 services the third
floor of D-building, a basement of D-building and part of X-building. TK44 services the first
and the third floors. TK45 services the first floor. TK46 services the second floor.
7.2 Characteristics of air handling unit chosen for research
TK43 was chosen for research. The heat recovery unit with a rotating wheel is in this air
handling unit. Operation hours of the air-handling unit are from 7-20 5 days a week. The
ventilation system doesn’t work at night and at weekends. But small fans work at that time to
provide air exchange rate 0,2 1/h according to D2. The supply air flow is more than the
exhaust air flow because the part of the exit air is exhausted through toilets. Furthermore, the
exhaust ventilation in toilets is working all the time. Figure 8 shows a scheme of the air
handling unit.
21
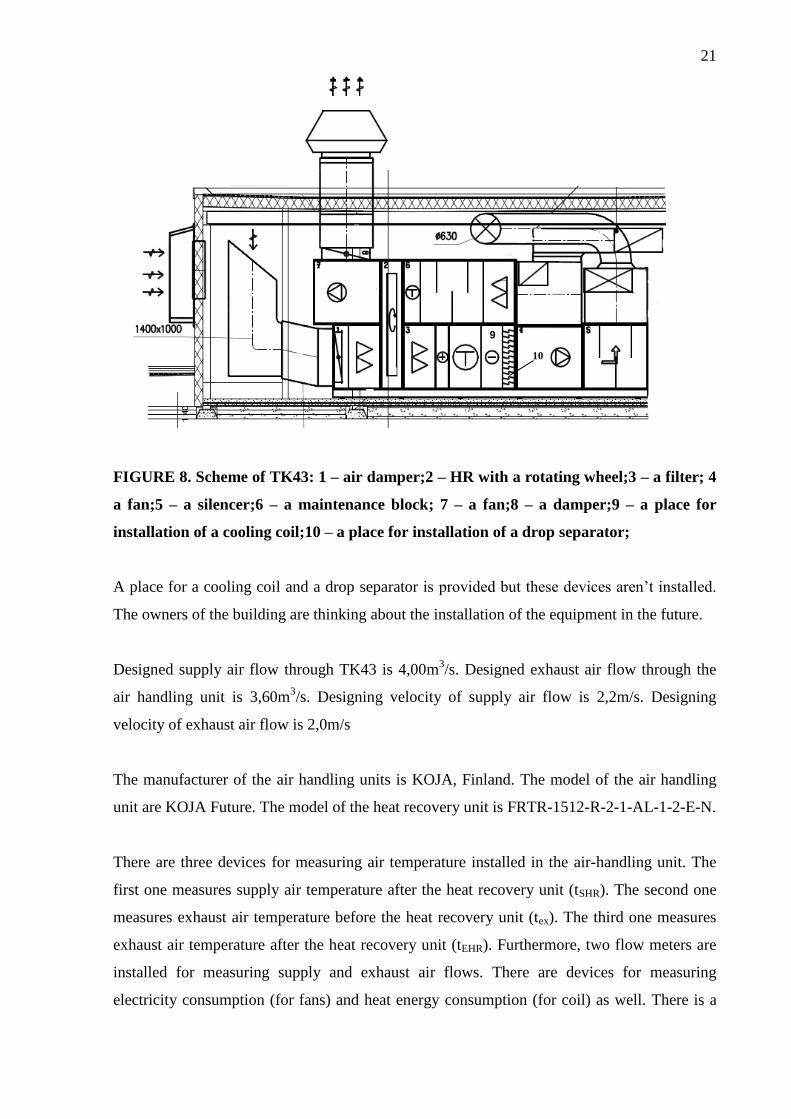
FIGURE 8. Scheme of TK43: 1 – air damper;2 – HR with a rotating wheel;3 – a filter; 4
a fan;5 – a silencer;6 – a maintenance block; 7 – a fan;8 – a damper;9 – a place for
installation of a cooling coil;10 – a place for installation of a drop separator;
A place for a cooling coil and a drop separator is provided but these devices aren’t installed.
The owners of the building are thinking about the installation of the equipment in the future.
Designed supply air flow through TK43 is 4,00m3/s. Designed exhaust air flow through the
air handling unit is 3,60m3/s. Designing velocity of supply air flow is 2,2m/s. Designing
velocity of exhaust air flow is 2,0m/s
The manufacturer of the air handling units is KOJA, Finland. The model of the air handling
unit are KOJA Future. The model of the heat recovery unit is FRTR-1512-R-2-1-AL-1-2-E-N.
There are three devices for measuring air temperature installed in the air-handling unit. The
first one measures supply air temperature after the heat recovery unit (tSHR). The second one
measures exhaust air temperature before the heat recovery unit (tex). The third one measures
exhaust air temperature after the heat recovery unit (tEHR). Furthermore, two flow meters are
installed for measuring supply and exhaust air flows. There are devices for measuring
electricity consumption (for fans) and heat energy consumption (for coil) as well. There is a
9
10
22
device which measures outdoor air temperature in the building automation system. It provides
values of outdoor air temperature for all air handling units of the building. The data from
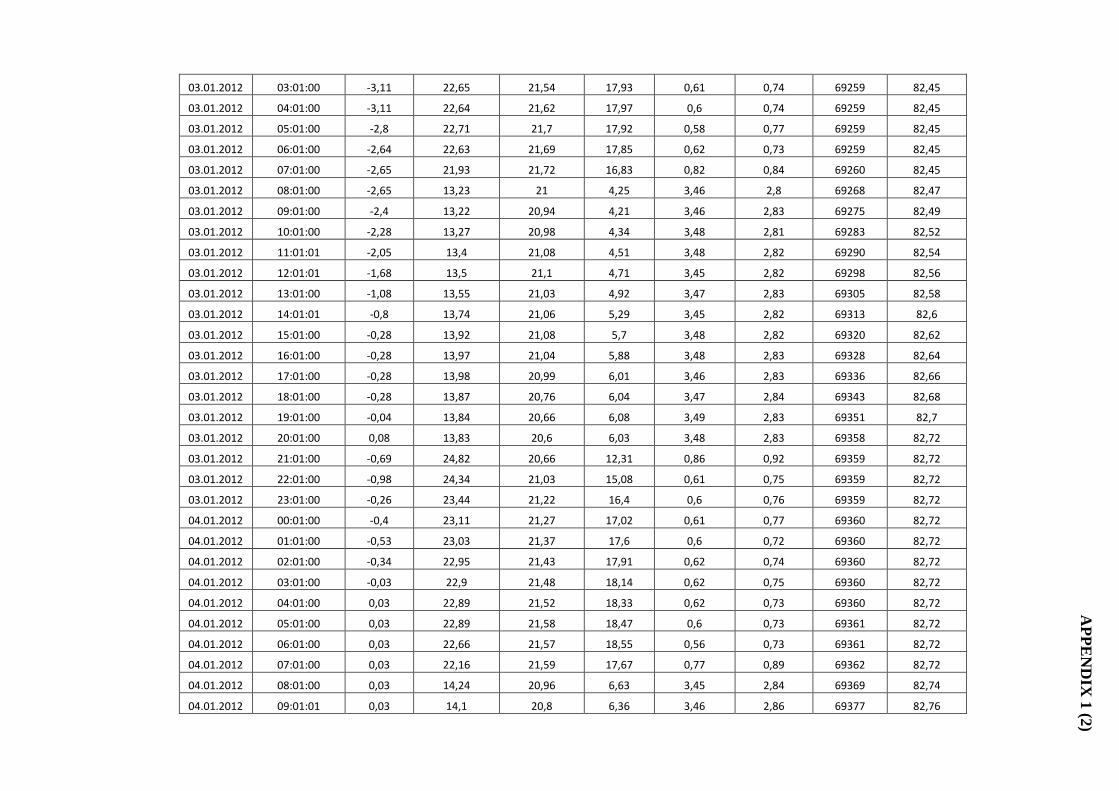
measuring devices is sent every hour and logged in reports which are made for every month.
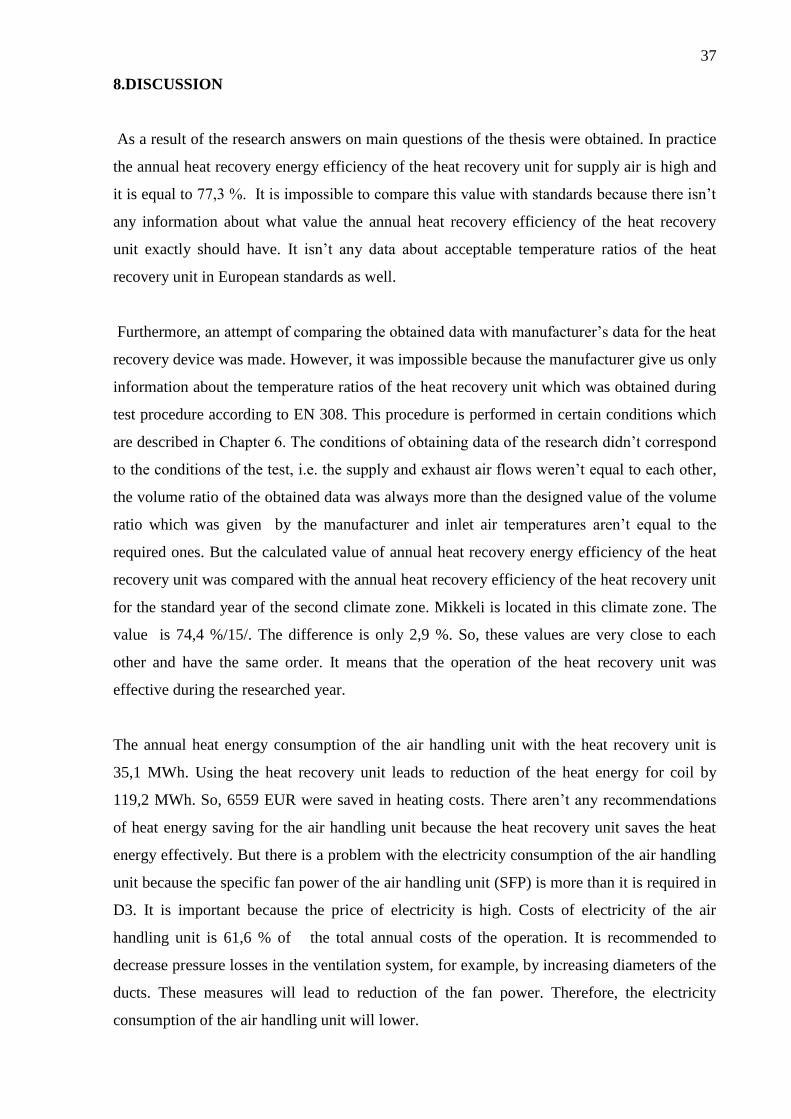
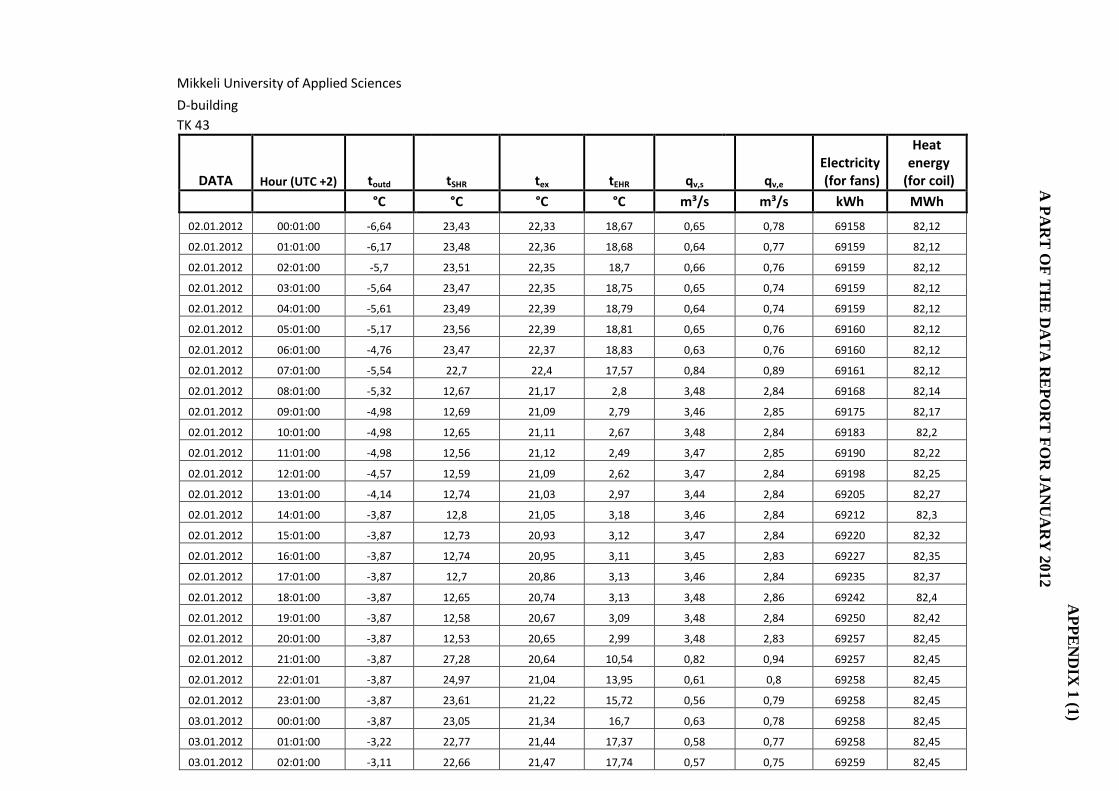
The example of the report is shown in Appendix 1. Scheme of the air-handling unit for
calculation is shown in Figure 9.
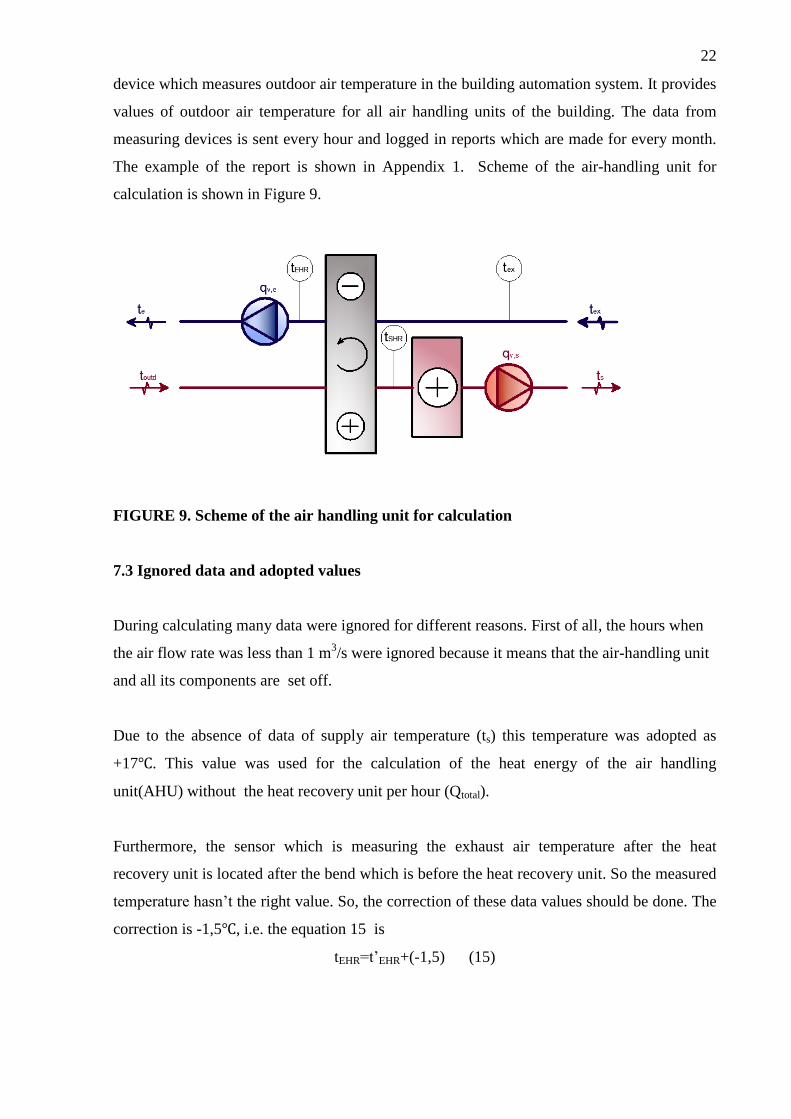
FIGURE 9. Scheme of the air handling unit for calculation
7.3 Ignored data and adopted values
During calculating many data were ignored for different reasons. First of all, the hours when
the air flow rate was less than 1 m3/s were ignored because it means that the air-handling unit
and all its components are set off.
Due to the absence of data of supply air temperature (ts) this temperature was adopted as
+17 . This value was used for the calculation of the heat energy of the air handling
unit(AHU) without the heat recovery unit per hour (Qtotal).
Furthermore, the sensor which is measuring the exhaust air temperature after the heat
recovery unit is located after the bend which is before the heat recovery unit. So the measured
temperature hasn’t the right value. So, the correction of these data values should be done. The
correction is -1,5 , i.e. the equation 15 is
tEHR=t’EHR+(-1,5) (15)
23
Sometimes the temperature ratio of the heat recovery unit for supply air was obtained more
than the temperature ratio of the heat recovery unit for exhaust air during calculating. It is
impossible because the supply air flow is more than the exhaust air flow. So these results are
incorrect and should be ignored. These results are obtained because of the small errors of
measuring devices. Correct values of temperature ratio are obtained because errors of
measuring devices haven’t influence on calculation. However, sometimes these errors of
measuring devices have influence on calculation because the values of data can have
deviation in different side: one of the temperature value has deviation from the true value to
negative side and another has deviation to positive side. Therefore incorrect values of
calculation are obtained.
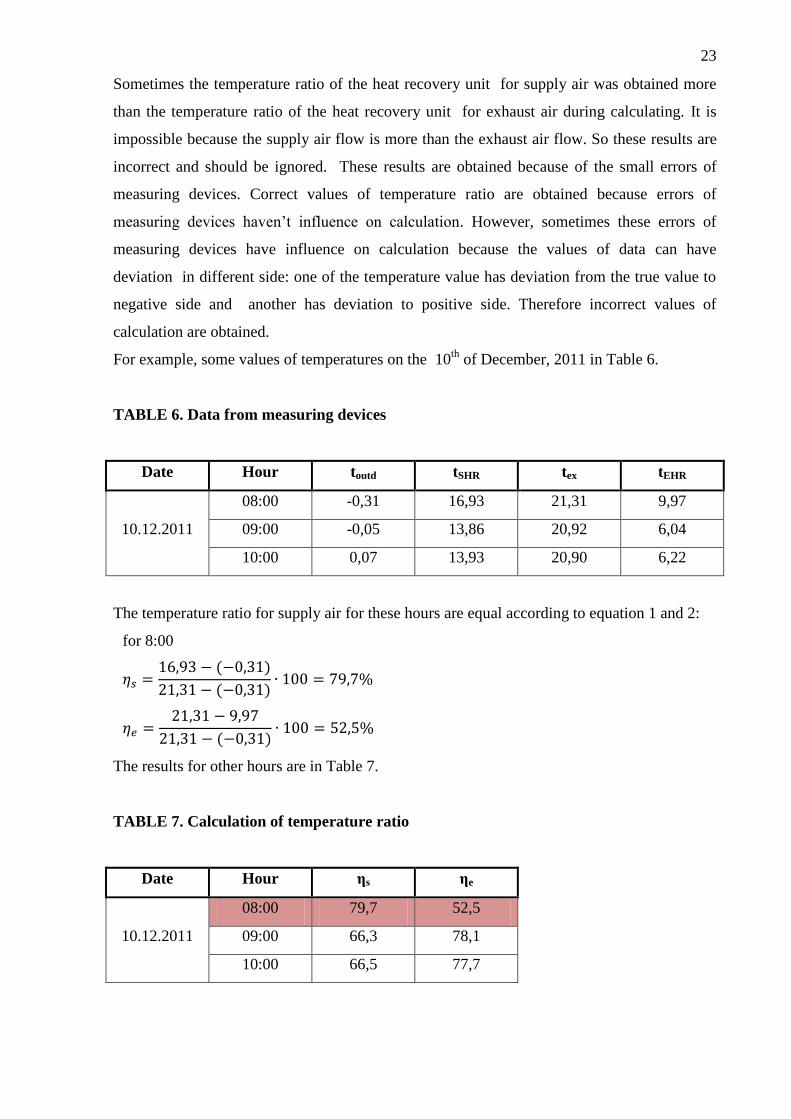
For example, some values of temperatures on the 10th
of December, 2011 in Table 6.
TABLE 6. Data from measuring devices
Date Hour toutd tSHR tex tEHR
10.12.2011
08:00 -0,31 16,93 21,31 9,97
09:00 -0,05 13,86 20,92 6,04
10:00 0,07 13,93 20,90 6,22
The temperature ratio for supply air for these hours are equal according to equation 1 and 2:
for 8:00
( )
( )
( )
The results for other hours are in Table 7.
TABLE 7. Calculation of temperature ratio
Date Hour ηs ηe
10.12.2011
08:00 79,7 52,5
09:00 66,3 78,1
10:00 66,5 77,7
24
Also there aren’t data of exhaust air temperature after the heat recovery unit for some
months. They are September, October, November, December of 2010 and January of 2011.
So it’s impossible to calculate the values of the temperature ratio for exhaust air with the
equation 2. The temperature ratios for exhaust air of these months are calculated only with
one way with equation 3.
There are a small amount of operation hours of the heat recovery unit during summer time
(June, July, August of 2011) and the calculated values of temperature ratios for supply and
exhaust air are less than 40%. Therefore, it is adopted that the heat recovery unit was set off
in these months. So, these values were ignored during calculations of annual heat recovery
energy efficiency of the heat recovery unit.
7.4 Example of calculation of efficiency
According to obtained data the calculation of efficiency of the heat recovery unit was done.
The data acquition has been begun since September, 2010.
For example, the calculation of efficiency of the heat recovery unit for the 2nd of January,
2012 at 12:01 was done like this:
Initial data/Appendix 1/:
Outdoor temperature toutd=-4,57 ;
Supply air temperature after HRU(heat recovery unit) tSHR=12,59 ;
Exhaust air temperature before HRU tex=21,09 ;
Exhaust air temperature after HRU tEHR=2,62-1,5=1,12 ;
Supply air flow qv,s=3,47 m3/s;
Exhaust air flow qv,e=2,84 m3/s;
Meter registration of electricity consumption Wei= 69190kWh, Wei+1 = 69198kWh
Meter registration of heat consumption Qci=82,22MWh, Qci+1=82,25MWh
1) The temperature ratio of the heat recovery unit for supply air (according to equation 1):
( )
( )
The maximum value of the temperature ratio of the heat recovery unit which was obtained
during calculations is 83,4 % with data of the 3th of January, 2011 at 9:00.
2) The temperature ratio of the heat recovery unit for exhaust air (according to equation 2):
25
( )
3) According to equation 5:
=1,16
4) The temperature ratio of the heat recovery unit for exhaust air (according to equation 3):
According to equation 4:
=1,22
5) The heat energy of the heat recovery unit per hour according to equation 7:
( ( ))
6) The heat energy consumption of the air handling unit (AHU) without the heat recovery
unit per hour according to equation 8:
( ( ))
7) The heat energy for coil per hour is calculated with equation/16/:
(16)
8) The electricity for fans per hour is calculated with equation/17/:
(17)
9) The heat recovery efficiency per hour according to equation /5/:
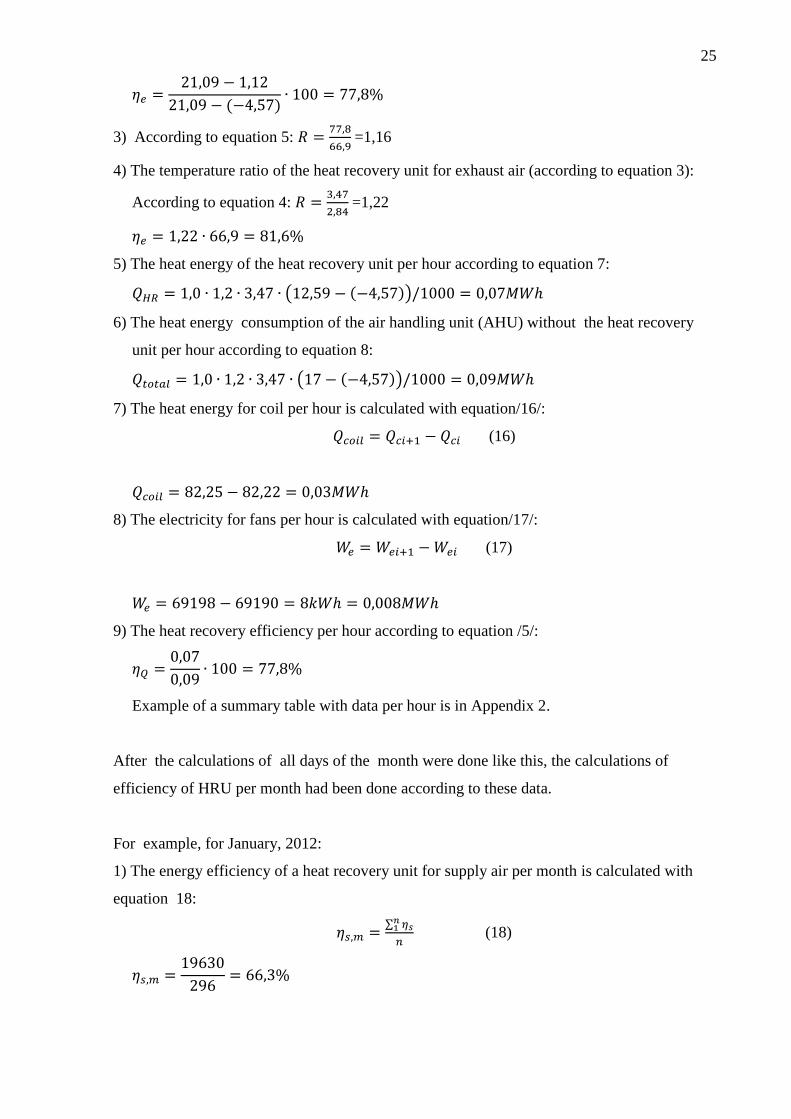
Example of a summary table with data per hour is in Appendix 2.
After the calculations of all days of the month were done like this, the calculations of
efficiency of HRU per month had been done according to these data.
For example, for January, 2012:
1) The energy efficiency of a heat recovery unit for supply air per month is calculated with
equation 18:
∑
(18)
26
2) The temperature efficiency of a heat recovery unit for exhaust air per month is calculated
with equation 19:
∑
(19)
The temperature efficiency of a heat recovery unit for exhaust air per month which
includes values of ηe calculated with equation /3/:
The relative difference between two results is
∑
3) The heat energy for coil per month is equal to the difference between the last and the first
in this month values of meter registration of heat consumption:
∑
4) The electricity for fans per hour is equal the difference between the last and the first in this
month values of meter registration of electricity consumption:
∑
5) The heat energy of the heat recovery unit per month is the sum of the values of the heat
power of the heat recovery unit per hour:
∑
6) The heat energy of the air handling unit (AHU) without the heat recovery unit per month is
the sum of the values of the heat power of the air handling unit (AHU) without the heat
recovery unit per hour:
∑
Also, it can be calculated with equation 20:
∑ ∑ ∑ (20)
∑
27
This value 32,9 MWh is more accurate than 30 MWh because in first case mainly errors of
measuring devices have an influence on accuracy and they are smaller than the errors of
calculation with adopted supply air temperature of 17 in any case.
∑
7) Amount of operation hours of the air handling unit is a quantity of hours when the supply
air flow is more than 1 m3/s. For January it is 302 hours. Amount of operation hours of
the heat recovery unit is the amount of operation hours of the air handling unit minus
hours when incorrect values of temperature ratios of the heat recovery were obtained
(ηs>ηe). For January it is 302 hours minus 6 hours. It means that the amount of operation
hours of the heat recovery unit is 296 hours for January. Total amount of hours is 744
hours in January. So, the amount of ignored hours is 744 hours minus 296 hours, i.e. 448
hours. It is 60,2% of the total amount of hours in January.
9) Mean supply and exhaust air flows per month are calculated with equations 21 and 22:
∑
(21)
∑
(22)
8) The heat recovery efficiency for supply air per month can be calculated with two methods
(equations 23 and 24):
∑
(23)
∑
∑ (24)
The calculated values were tabulated. Table 8 shows a table of calculations per month for
January, 2012.
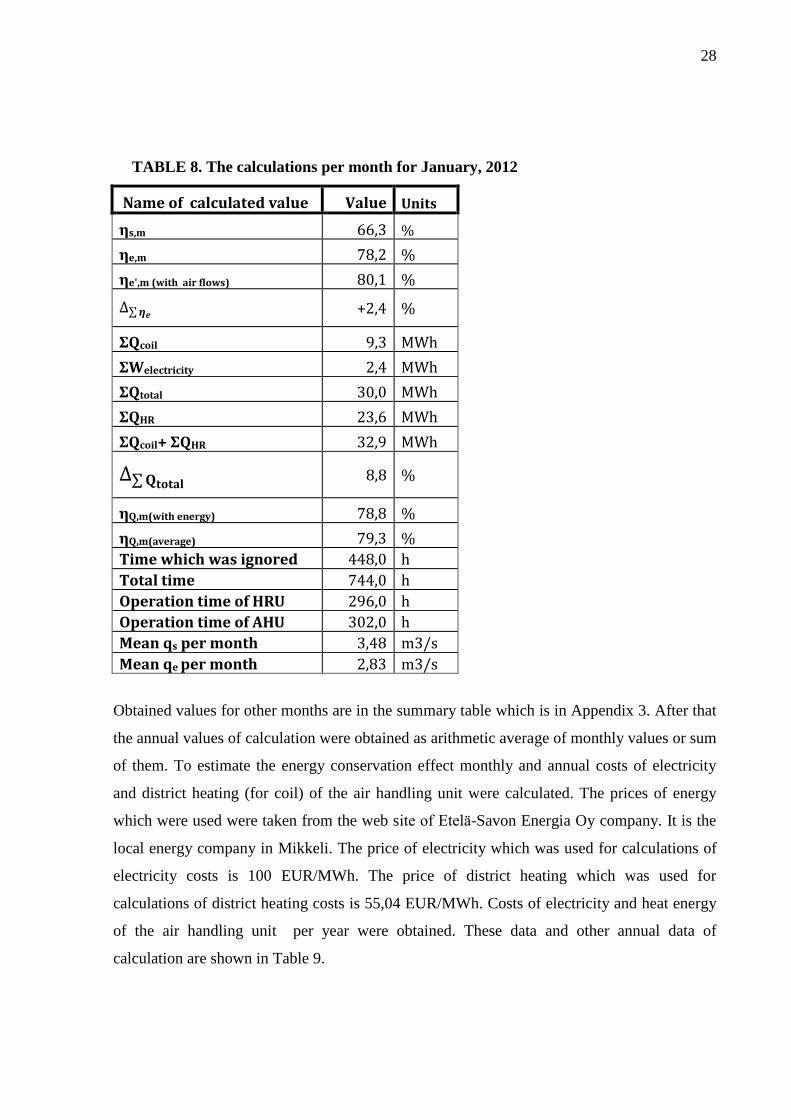
28
TABLE 8. The calculations per month for January, 2012
Name of calculated value Value Units
ηs,m 66,3 %
ηe,m 78,2 %
ηe',m (with air flows) 80,1 %
∑ +2,4 %
ΣQcoil 9,3 MWh
ΣWelectricity 2,4 MWh
ΣQtotal 30,0 MWh
ΣQHR 23,6 MWh
ΣQcoil+ ΣQHR 32,9 MWh
∑ 8,8 %
ηQ,m(with energy) 78,8 %
ηQ,m(average) 79,3 %
Time which was ignored 448,0 h
Total time 744,0 h
Operation time of HRU 296,0 h
Operation time of AHU 302,0 h
Mean qs per month 3,48 m3/s
Mean qe per month 2,83 m3/s
Obtained values for other months are in the summary table which is in Appendix 3. After that
the annual values of calculation were obtained as arithmetic average of monthly values or sum
of them. To estimate the energy conservation effect monthly and annual costs of electricity
and district heating (for coil) of the air handling unit were calculated. The prices of energy
which were used were taken from the web site of Etelä-Savon Energia Oy company. It is the
local energy company in Mikkeli. The price of electricity which was used for calculations of
electricity costs is 100 EUR/MWh. The price of district heating which was used for
calculations of district heating costs is 55,04 EUR/MWh. Costs of electricity and heat energy
of the air handling unit per year were obtained. These data and other annual data of
calculation are shown in Table 9.
29
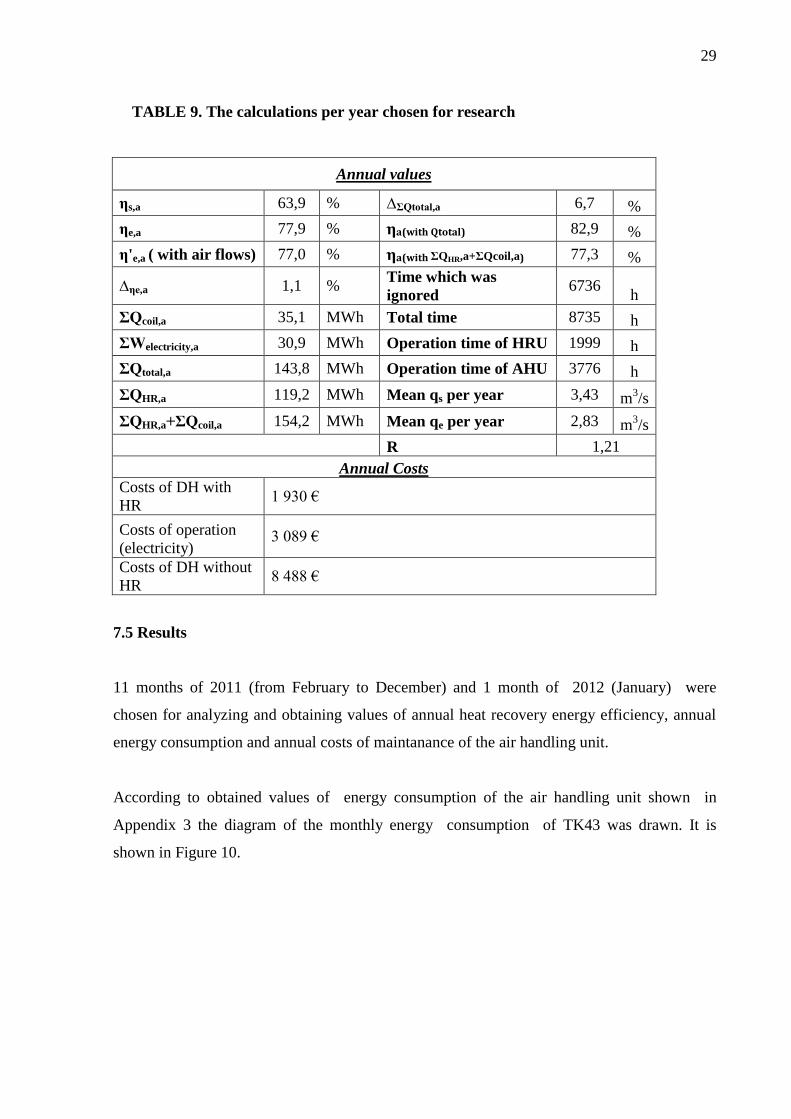
TABLE 9. The calculations per year chosen for research
Annual values
ηs,a 63,9 % ∆ΣQtotal,a 6,7 %
ηe,a 77,9 % ηa(with Qtotal) 82,9 %
η'e,a ( with air flows) 77,0 % ηa(with ΣQHR,a+ΣQcoil,a) 77,3 %
∆ηe,a 1,1 % Time which was
ignored 6736
h
ΣQcoil,a 35,1 MWh Total time 8735 h
ΣWelectricity,a 30,9 MWh Operation time of HRU 1999 h
ΣQtotal,a 143,8 MWh Operation time of AHU 3776 h
ΣQHR,a 119,2 MWh Mean qs per year 3,43 m3/s
ΣQHR,a+ΣQcoil,a 154,2 MWh Mean qe per year 2,83 m3/s
R 1,21
Annual Costs
Costs of DH with
HR 1 930 €
Costs of operation
(electricity) 3 089 €
Costs of DH without
HR 8 488 €
7.5 Results
11 months of 2011 (from February to December) and 1 month of 2012 (January) were
chosen for analyzing and obtaining values of annual heat recovery energy efficiency, annual
energy consumption and annual costs of maintanance of the air handling unit.
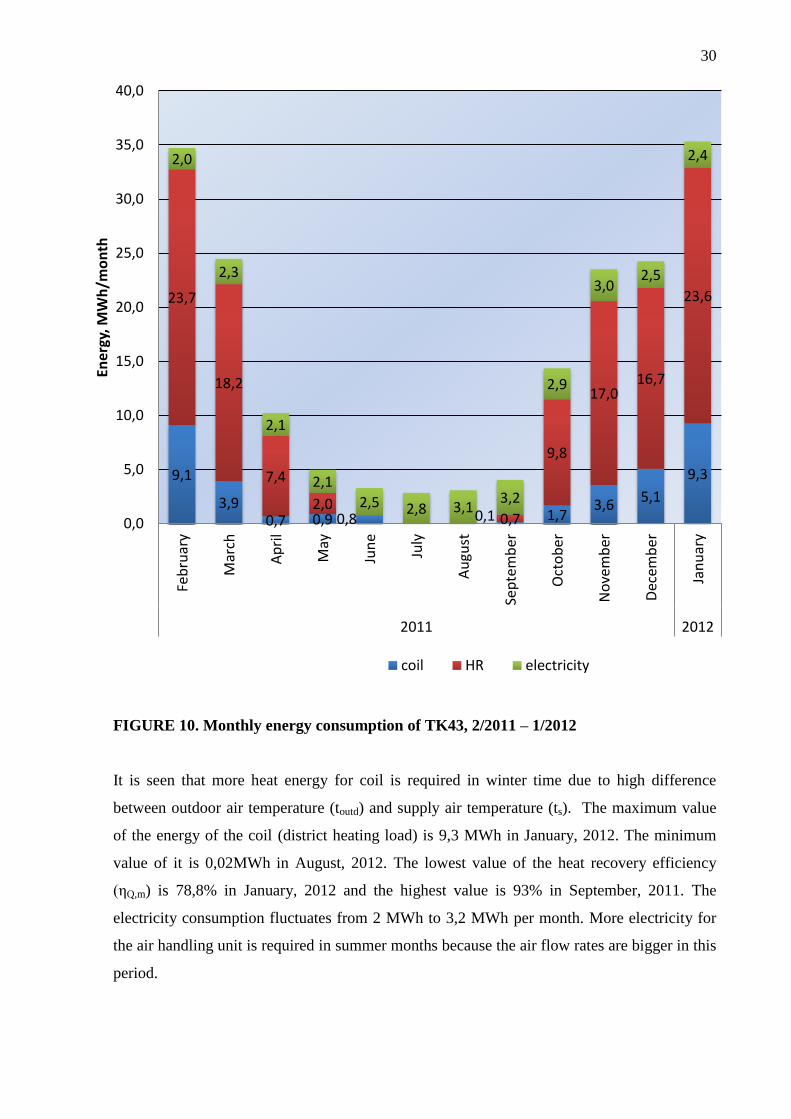
According to obtained values of energy consumption of the air handling unit shown in
Appendix 3 the diagram of the monthly energy consumption of TK43 was drawn. It is
shown in Figure 10.
30
FIGURE 10. Monthly energy consumption of TK43, 2/2011 – 1/2012
It is seen that more heat energy for coil is required in winter time due to high difference
between outdoor air temperature (toutd) and supply air temperature (ts). The maximum value
of the energy of the coil (district heating load) is 9,3 MWh in January, 2012. The minimum
value of it is 0,02MWh in August, 2012. The lowest value of the heat recovery efficiency
(ηQ,m) is 78,8% in January, 2012 and the highest value is 93% in September, 2011. The
electricity consumption fluctuates from 2 MWh to 3,2 MWh per month. More electricity for
the air handling unit is required in summer months because the air flow rates are bigger in this
period.
9,1
3,9 0,7 0,9 0,8 0,1 1,7
3,6 5,1
9,3
23,7
18,2
7,4
2,0 0,7
9,8
17,0 16,7
23,6
2,0
2,3
2,1
2,1
2,5 2,8 3,1 3,2
2,9
3,0 2,5
2,4
0,0
5,0
10,0
15,0
20,0
25,0
30,0
35,0
40,0
Feb
ruar
y
Mar
ch
Ap
ril
May
Jun
e
July
Au
gust
Sep
tem
ber
Oct
ob
er
No
vem
ber
Dec
emb
er
Jan
uar
y
2011 2012
Ener
gy, M
Wh
/mo
nth
coil HR electricity
31
Using the heat recovery unit leads to decreasing the consumption of energy for the coil. The
reduction is (23,6/(23,6+9,3))∙100=71,9% at least (by example of January, 2012: the energy
consumption of the coil – 9,3MWh; the energy consumption of the heat recovery unit –
23,6MWh). As a result the costs of district heating (for the coil) reduced as well. The
diminution of the costs is ((156-48)/156)∙100=69% at least according to Table 9 (by example
of May,2011: the costs with the heat recovery unit - 48 EUR; the costs without heat recovery
unit - 156 EUR).
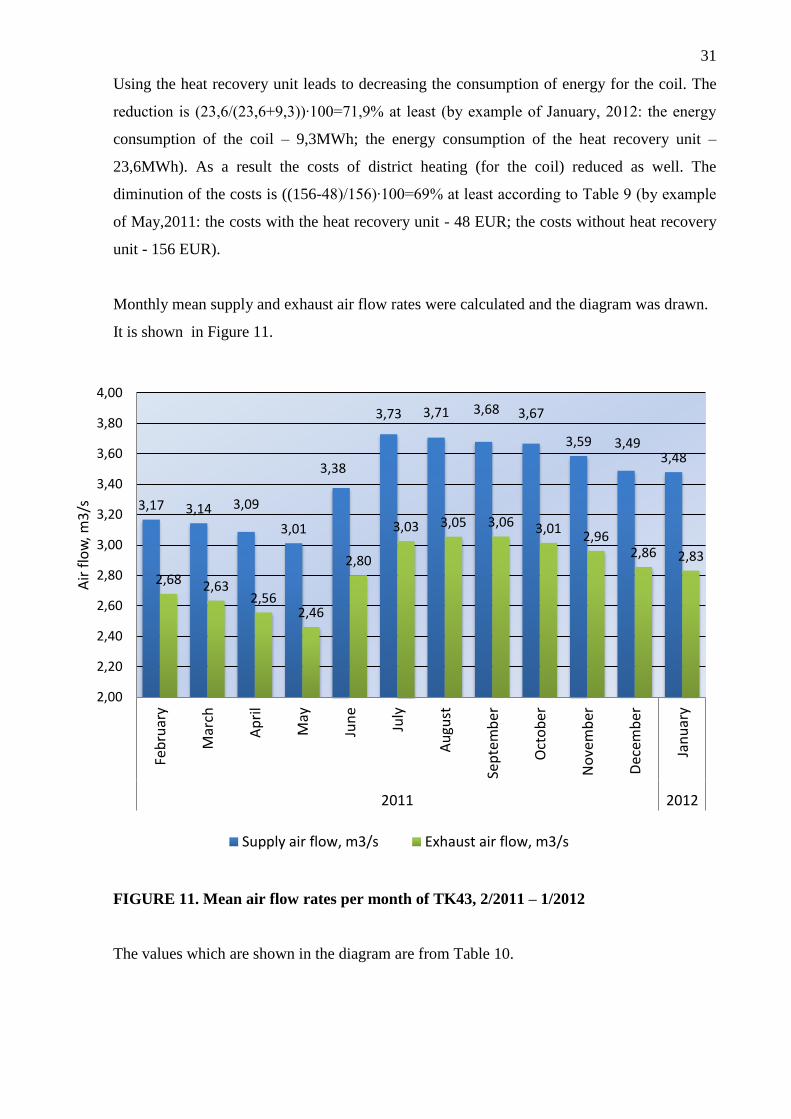
Monthly mean supply and exhaust air flow rates were calculated and the diagram was drawn.
It is shown in Figure 11.
FIGURE 11. Mean air flow rates per month of TK43, 2/2011 – 1/2012
The values which are shown in the diagram are from Table 10.
3,17 3,14 3,09
3,01
3,38
3,73 3,71 3,68 3,67
3,59 3,49 3,48
2,68 2,63 2,56
2,46
2,80
3,03 3,05 3,06 3,01 2,96
2,86 2,83
2,00
2,20
2,40
2,60
2,80
3,00
3,20
3,40
3,60
3,80
4,00
Feb
ruar
y
Mar
ch
Ap
ril
May
Jun
e
July
Au
gust
Sep
tem
ber
Oct
ob
er
No
vem
ber
Dec
emb
er
Jan
uar
y
2011 2012
Air
flo
w, m
3/s
Supply air flow, m3/s Exhaust air flow, m3/s
32
TABLE 10. Mean air flow rates per month/per year of TK43, 2/2011 – 1/2012
Value
Per month Per
year Units 2011 2012
Feb. March April May June July Aug. Sep. Oct. Nov. Dec. Jan.
Mean
Supply Air
flow qs 3,17 3,14 3,09 3,01 3,38 3,73 3,71 3,68 3,67 3,59 3,49 3,48 3,43 m
3/s
Mean
Exhaust Air
flow qe 2,68 2,63 2,56 2,46 2,80 3,03 3,05 3,06 3,01 2,96 2,86 2,83 2,83 m
3/s
Volume
Ratio
(with eq. 4) R 1,18 1,19 1,21 1,22 1,20 1,23 1,21 1,20 1,22 1,21 1,22 1,23 1,21 -
The maximum values of the mean supply and exhaust air flow rates are in September, 2011.
The highest value of the mean supply air flow rate is 3,68 m3/s. The highest value of the mean
exhaust air flow rate is 3,06 m3/s. It is the reason why the electricity consumption of this
month is maximum. The minimum values of the mean supply and exhaust air flow rates are
in May, 2011. The lowest value of the mean supply air flow rate is 3,01 m3/s The lowest value
of the mean exhaust air flow rate is 2,46 m3/s.
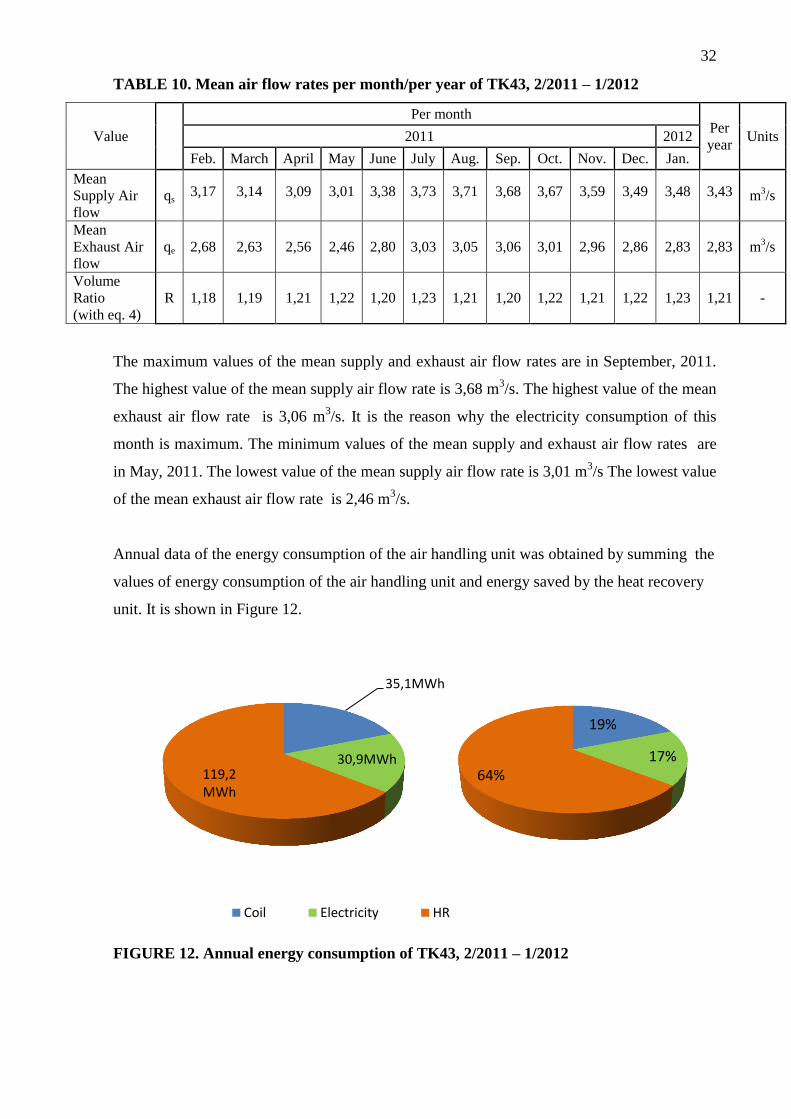
Annual data of the energy consumption of the air handling unit was obtained by summing the
values of energy consumption of the air handling unit and energy saved by the heat recovery
unit. It is shown in Figure 12.
FIGURE 12. Annual energy consumption of TK43, 2/2011 – 1/2012
35,1MWh
30,9MWh 119,2 MWh
Coil Electricity HR
19%
17% 64%
33
It is seen that the heat recovery unit saved 119,2 MWh of the heat energy of the coil. It is 64% of
annual energy consumption of the air handling unit and ((119,2/(119,2+35,1))*100)=77,3% of annual
heat energy consumption of the air handling unit.
Annual heat recovery energy efficiency for supply air was calculated in two ways with
equation 6. The first way is to calculate with the sum of obtained ΣQtotal per each month of
the calculated year when the supply air temperature was adopted +17 . The second way is to
calculate with the sum of ΣQcoil and ΣQHR per each month of the calculated year.
The first way:
The second way:
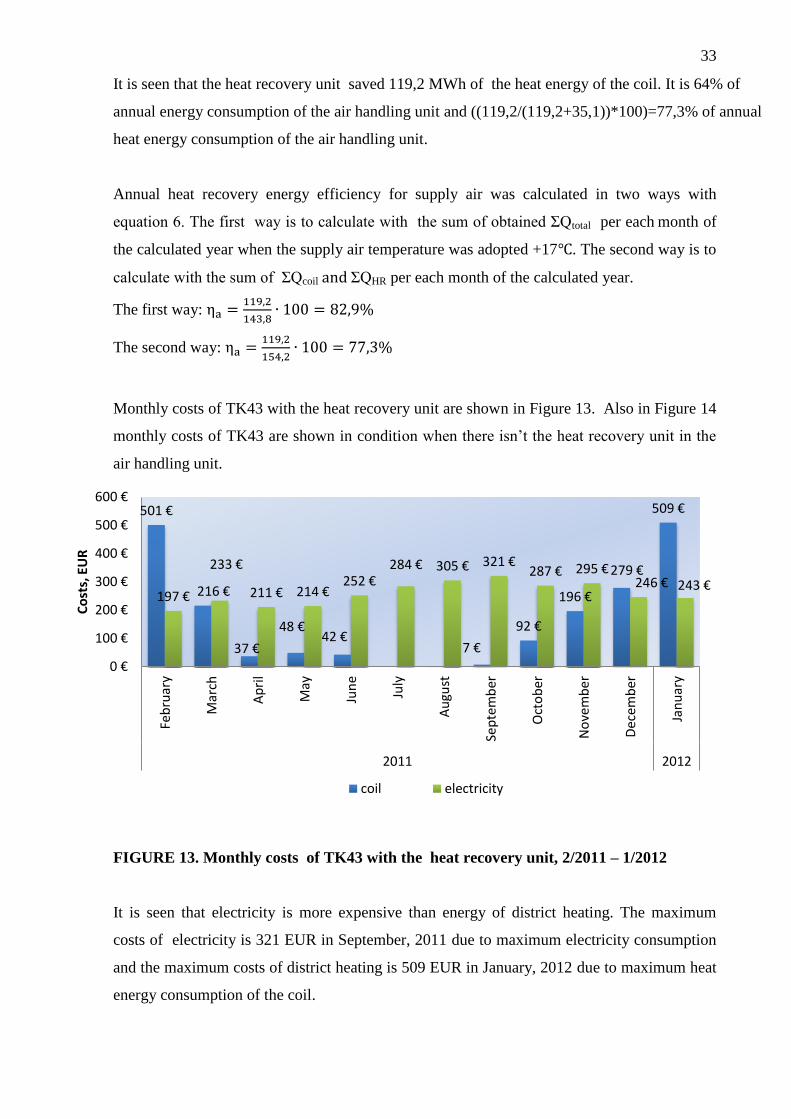
Monthly costs of TK43 with the heat recovery unit are shown in Figure 13. Also in Figure 14
monthly costs of TK43 are shown in condition when there isn’t the heat recovery unit in the
air handling unit.
FIGURE 13. Monthly costs of TK43 with the heat recovery unit, 2/2011 – 1/2012
It is seen that electricity is more expensive than energy of district heating. The maximum
costs of electricity is 321 EUR in September, 2011 due to maximum electricity consumption
and the maximum costs of district heating is 509 EUR in January, 2012 due to maximum heat
energy consumption of the coil.
501 €
216 €
37 €
48 € 42 €
7 €
92 €
196 €
279 €
509 €
197 €
233 €
211 € 214 € 252 €
284 € 305 € 321 € 287 € 295 €
246 € 243 €
0 €
100 €
200 €
300 €
400 €
500 €
600 €
Feb
ruar
y
Mar
ch
Ap
ril
May
Jun
e
July
Au
gust
Sep
tem
ber
Oct
ob
er
No
vem
ber
Dec
emb
er
Jan
uar
y
2011 2012
Co
sts,
EU
R
coil electricity
34
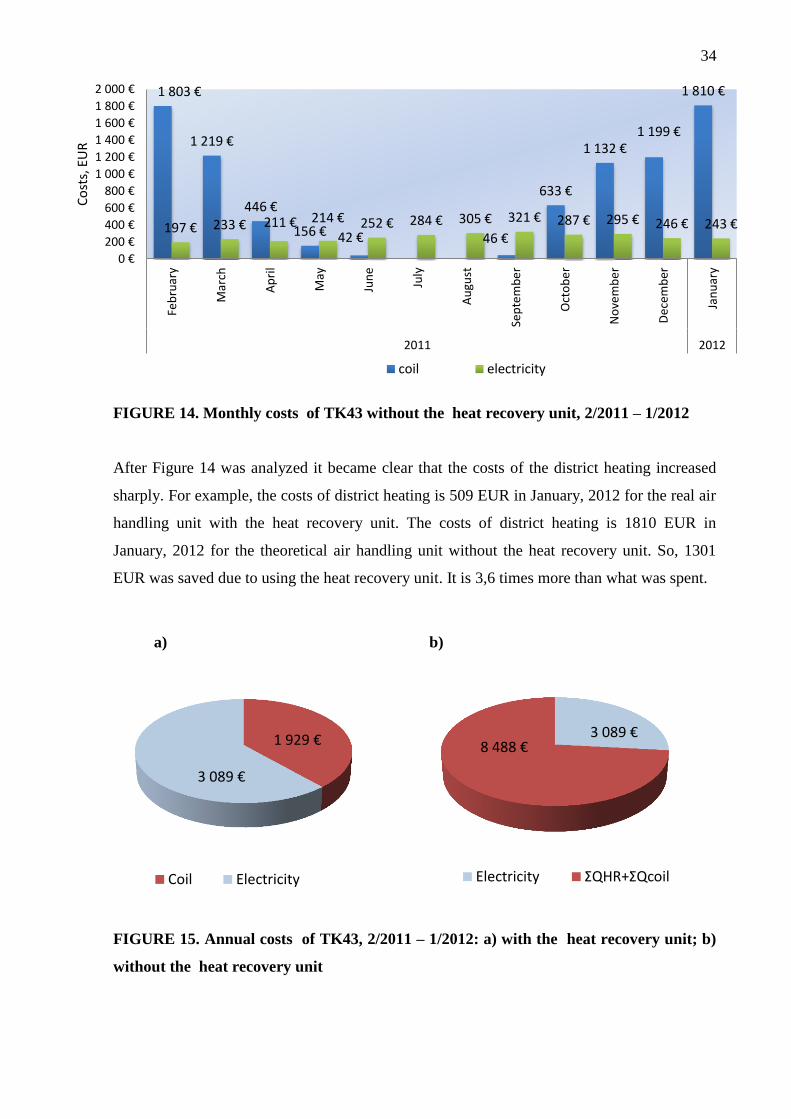
FIGURE 14. Monthly costs of TK43 without the heat recovery unit, 2/2011 – 1/2012
After Figure 14 was analyzed it became clear that the costs of the district heating increased
sharply. For example, the costs of district heating is 509 EUR in January, 2012 for the real air
handling unit with the heat recovery unit. The costs of district heating is 1810 EUR in
January, 2012 for the theoretical air handling unit without the heat recovery unit. So, 1301
EUR was saved due to using the heat recovery unit. It is 3,6 times more than what was spent.
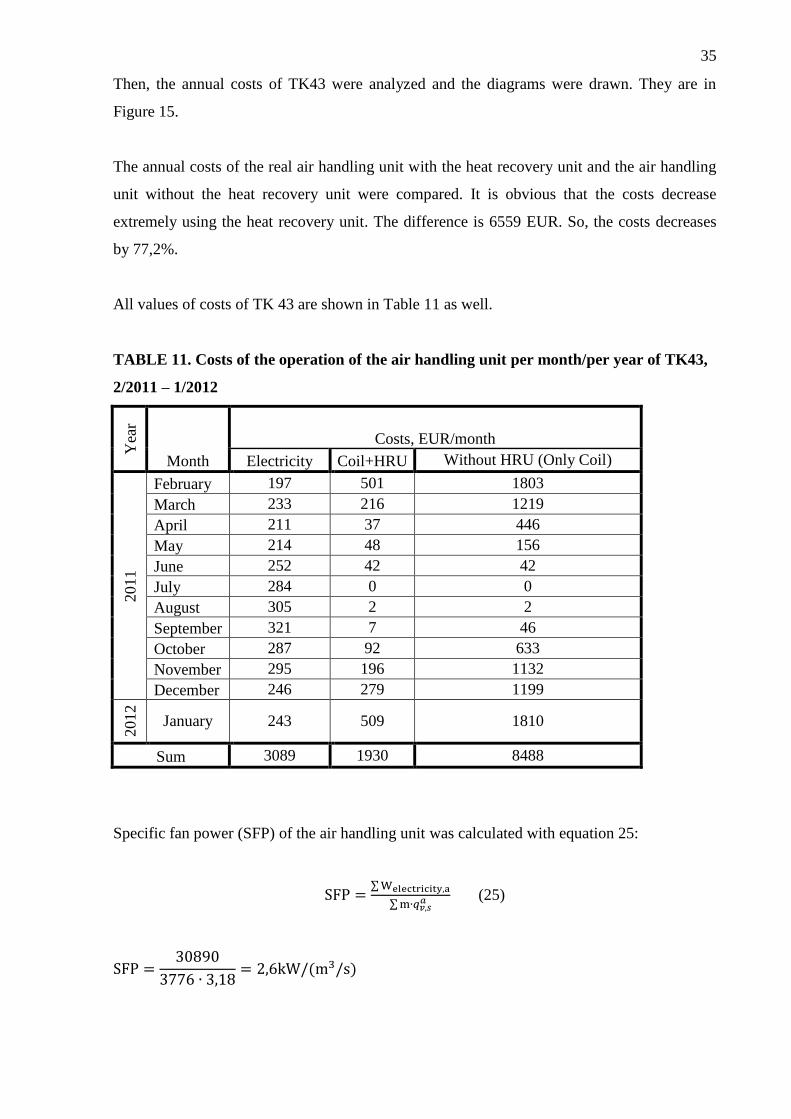
FIGURE 15. Annual costs of TK43, 2/2011 – 1/2012: a) with the heat recovery unit; b)
without the heat recovery unit
1 803 €
1 219 €
446 €
156 € 42 € 46 €
633 €
1 132 € 1 199 €
1 810 €
197 € 233 € 211 € 214 € 252 € 284 € 305 € 321 € 287 € 295 € 246 € 243 €
0 €
200 €
400 €
600 €
800 €
1 000 €
1 200 €
1 400 €
1 600 €
1 800 €
2 000 €
Feb
ruar
y
Mar
ch
Ap
ril
May
Jun
e
July
Au
gust
Sep
tem
be
r
Oct
ob
er
No
vem
be
r
De
cem
ber
Jan
uar
y
2011 2012
Co
sts,
EU
R
coil electricity
3 089 € 8 488 €
Electricity ΣQHR+ΣQcoil
a) b)
1 929 €
3 089 €
Coil Electricity
35
Then, the annual costs of TK43 were analyzed and the diagrams were drawn. They are in
Figure 15.
The annual costs of the real air handling unit with the heat recovery unit and the air handling
unit without the heat recovery unit were compared. It is obvious that the costs decrease
extremely using the heat recovery unit. The difference is 6559 EUR. So, the costs decreases
by 77,2%.
All values of costs of TK 43 are shown in Table 11 as well.
TABLE 11. Costs of the operation of the air handling unit per month/per year of TK43,
2/2011 – 1/2012
Yea
r
Month
Costs, EUR/month
Electricity Coil+HRU Without HRU (Only Coil)
2011
February 197 501 1803
March 233 216 1219
April 211 37 446
May 214 48 156
June 252 42 42
July 284 0 0
August 305 2 2
September 321 7 46
October 287 92 633
November 295 196 1132
December 246 279 1199
2012
January 243 509 1810
Sum 3089 1930 8488
Specific fan power (SFP) of the air handling unit was calculated with equation 25:
∑
∑ (25)
( )
36
According to D3 SFP of mechanical supply and exhaust air system shouldn’t be more than 2,0
kW/(m3/s). The obtained value is bigger than that one. The reason is that the designing of the
ventilation system was when Finnish National Building Code hadn’t so strict requirements.
The value of SFP which is 2,0 kW/(m3/s) was approved in 2012 in new version of D3.
The data about the heat recovery unit which was given by the manufacturer is the temperature
ratios for supply air exhaust air. The temperature ratio for supply air was obtained during the
test according to EN308 with inlet air temperatures written down in Chapter 6, Table 5. It is
70 %. Then the temperature ratio for exhaust air was calculated with equation (3) with values
of designed flow rates:
- the supply air flow rate is 4,00 m3/s;
- the exhaust air flow rate is 3,60 m3/s;
-the volume flow ratio calculated with the equation 4 is 1,11;
The value of the temperature ratio for exhaust air which was calculated by the manufacturer is
78 %.
The calculated values of the temperature ratios of the research can’t be compared with that
manufacturer’s data because manufacturer’s value of the temperature ratio for the supply air
was obtained when the supply and exhaust air flows were equal to each other. It is a
requirement of the test. In our case, these flows never are equal and the supply air flow rate is
more than the exhaust one. Furthermore, inlet air temperatures don’t corresponds to the
required temperatures of the test. There aren’t also any data of the research when the volume
flow ratio is 1,11. It was always more than this value.
37
8.DISCUSSION
As a result of the research answers on main questions of the thesis were obtained. In practice
the annual heat recovery energy efficiency of the heat recovery unit for supply air is high and
it is equal to 77,3 %. It is impossible to compare this value with standards because there isn’t
any information about what value the annual heat recovery efficiency of the heat recovery
unit exactly should have. It isn’t any data about acceptable temperature ratios of the heat
recovery unit in European standards as well.
Furthermore, an attempt of comparing the obtained data with manufacturer’s data for the heat
recovery device was made. However, it was impossible because the manufacturer give us only
information about the temperature ratios of the heat recovery unit which was obtained during
test procedure according to EN 308. This procedure is performed in certain conditions which
are described in Chapter 6. The conditions of obtaining data of the research didn’t correspond
to the conditions of the test, i.e. the supply and exhaust air flows weren’t equal to each other,
the volume ratio of the obtained data was always more than the designed value of the volume
ratio which was given by the manufacturer and inlet air temperatures aren’t equal to the
required ones. But the calculated value of annual heat recovery energy efficiency of the heat
recovery unit was compared with the annual heat recovery efficiency of the heat recovery unit
for the standard year of the second climate zone. Mikkeli is located in this climate zone. The
value is 74,4 %/15/. The difference is only 2,9 %. So, these values are very close to each
other and have the same order. It means that the operation of the heat recovery unit was
effective during the researched year.
The annual heat energy consumption of the air handling unit with the heat recovery unit is
35,1 MWh. Using the heat recovery unit leads to reduction of the heat energy for coil by
119,2 MWh. So, 6559 EUR were saved in heating costs. There aren’t any recommendations
of heat energy saving for the air handling unit because the heat recovery unit saves the heat
energy effectively. But there is a problem with the electricity consumption of the air handling
unit because the specific fan power of the air handling unit (SFP) is more than it is required in
D3. It is important because the price of electricity is high. Costs of electricity of the air
handling unit is 61,6 % of the total annual costs of the operation. It is recommended to
decrease pressure losses in the ventilation system, for example, by increasing diameters of the
ducts. These measures will lead to reduction of the fan power. Therefore, the electricity
consumption of the air handling unit will lower.
38
Finally, there are some recommendations for owners of the building about the location of the
measuring devices of the air handling unit. During the research it was found out that the
measured exhaust air temperature after the heat recovery unit hasn’t correct value due to
wrong location of the measuring sensor. So, it is recommended to change the location of this
device to get correct values. If calculations of the efficiency of the heat recovery unit are
planned in the future, it will be recommended to install a device for measuring a supply air
temperature (after the coil) in the air handling unit. This device will provide data of the
temperature which can be recorded and used for calculation of the real heat energy
consumption of the air handling unit.
39
BIBLIOGRAPHY
1. Милеев Л. Рекуператоры и рекуперация воздуха (Heat exchangers and heat recovery
of air). WWW document. http://www.teploved.ru/menu6_4.html/. No update information
available.Referred 19.09.2012.
2. Xetex. Heat recovery. Air-to-air cross flow flat plate haet exchangers. PDF document.
http://www.xetexinc.com Updated in 2009. Referred 19.09.2012
3. Recuperator. WWW document. http://www.recuperator.eu/eng/prodotti_piastre.html. No
update information available. Referred 19.09.12
4. Рекуператоры воздух-воздух (Heat exchangers air-to-air). Векотех. WWW document.
http://vecotech.com.ua. No update information available. Referred 08.10.2012
5. Nejc Brelih, Olli Seppanen, Thore Berlitsson, Mari-Liis Maripuu, Herve Lamy, Alex
Vanden Borre. Air-to-air heat recovery systems. REHVA, №17. 41-51. 2012.
6. Вишневский Е.П. Рекуперация тепловой энергии в системах вентиляции и
кондиционирования воздуха (Heat recovery in ventilation and air conditioning systems).
PDF document. www.sok.ru. Updated 11/2004. Referred 08.10.2012
7. Nilsson Per Erik. Achieving the desired indoor climate. Studentlitteratur. Denmark.
Narayana Press. 2007
8. Heat and energy wheels. WWW document. http://what-when-how.com/energy-
engineering/heat-and-energy-wheels/. No update information available. Referred
08.10.2012
9. Energy recovery systems. Center Point Energy. PDF document.
http://www.centerpointenergy.com/. No update information available. Referred
08.10.2012
10. Energy recovery wheel Technical guide. Semko flakt woods. PDF document.
http://www.flaktwoods.com/. Updated 2011. Referred 08.10.2012
11. D3. National building code. Energy Efficiency of Buildings. 2012. Ministry of the
Environment. Draft edition 28.09.2010
12. D2. National building code.Indoor Climate and Ventilation in Buildings.2003. Ministry of
the Environment.
13. D5. National building code. Calculation of power and energy needs for heating of
building.2012. Ministry of the Environment. Draft edition 28.09.2010
14. EN-308. Heat exchangers. Test procedures for establishing performance of air to air and
flue gases heat recovery devices.1997.European Committee for Standardization.
15. LTO-vuosihyötysuhteen laskenta XLS document. http://teknologiateollisuus.fi/.
Updated 29.03.2010. Referred 21.11.2012
A
PP
EN
DIX
1 (1
)
A P
AR
T O
F T
HE
DA
TA
RE
PO
RT
FO
R J
AN
UA
RY
2012
Mikkeli University of Applied Sciences
D-building TK 43
DATA Hour (UTC +2) toutd tSHR tex tEHR qv,s qv,e Electricity (for fans)
Heat energy
(for coil)
°C °C °C °C m³/s m³/s kWh MWh
02.01.2012 00:01:00 -6,64 23,43 22,33 18,67 0,65 0,78 69158 82,12
02.01.2012 01:01:00 -6,17 23,48 22,36 18,68 0,64 0,77 69159 82,12
02.01.2012 02:01:00 -5,7 23,51 22,35 18,7 0,66 0,76 69159 82,12
02.01.2012 03:01:00 -5,64 23,47 22,35 18,75 0,65 0,74 69159 82,12
02.01.2012 04:01:00 -5,61 23,49 22,39 18,79 0,64 0,74 69159 82,12
02.01.2012 05:01:00 -5,17 23,56 22,39 18,81 0,65 0,76 69160 82,12
02.01.2012 06:01:00 -4,76 23,47 22,37 18,83 0,63 0,76 69160 82,12
02.01.2012 07:01:00 -5,54 22,7 22,4 17,57 0,84 0,89 69161 82,12
02.01.2012 08:01:00 -5,32 12,67 21,17 2,8 3,48 2,84 69168 82,14
02.01.2012 09:01:00 -4,98 12,69 21,09 2,79 3,46 2,85 69175 82,17
02.01.2012 10:01:00 -4,98 12,65 21,11 2,67 3,48 2,84 69183 82,2
02.01.2012 11:01:00 -4,98 12,56 21,12 2,49 3,47 2,85 69190 82,22
02.01.2012 12:01:00 -4,57 12,59 21,09 2,62 3,47 2,84 69198 82,25
02.01.2012 13:01:00 -4,14 12,74 21,03 2,97 3,44 2,84 69205 82,27
02.01.2012 14:01:00 -3,87 12,8 21,05 3,18 3,46 2,84 69212 82,3
02.01.2012 15:01:00 -3,87 12,73 20,93 3,12 3,47 2,84 69220 82,32
02.01.2012 16:01:00 -3,87 12,74 20,95 3,11 3,45 2,83 69227 82,35
02.01.2012 17:01:00 -3,87 12,7 20,86 3,13 3,46 2,84 69235 82,37
02.01.2012 18:01:00 -3,87 12,65 20,74 3,13 3,48 2,86 69242 82,4
02.01.2012 19:01:00 -3,87 12,58 20,67 3,09 3,48 2,84 69250 82,42
02.01.2012 20:01:00 -3,87 12,53 20,65 2,99 3,48 2,83 69257 82,45
02.01.2012 21:01:00 -3,87 27,28 20,64 10,54 0,82 0,94 69257 82,45
02.01.2012 22:01:01 -3,87 24,97 21,04 13,95 0,61 0,8 69258 82,45
02.01.2012 23:01:00 -3,87 23,61 21,22 15,72 0,56 0,79 69258 82,45
03.01.2012 00:01:00 -3,87 23,05 21,34 16,7 0,63 0,78 69258 82,45
03.01.2012 01:01:00 -3,22 22,77 21,44 17,37 0,58 0,77 69258 82,45
03.01.2012 02:01:00 -3,11 22,66 21,47 17,74 0,57 0,75 69259 82,45
AP
PE
ND
IX 1
(2)
03.01.2012 03:01:00 -3,11 22,65 21,54 17,93 0,61 0,74 69259 82,45
03.01.2012 04:01:00 -3,11 22,64 21,62 17,97 0,6 0,74 69259 82,45
03.01.2012 05:01:00 -2,8 22,71 21,7 17,92 0,58 0,77 69259 82,45
03.01.2012 06:01:00 -2,64 22,63 21,69 17,85 0,62 0,73 69259 82,45
03.01.2012 07:01:00 -2,65 21,93 21,72 16,83 0,82 0,84 69260 82,45
03.01.2012 08:01:00 -2,65 13,23 21 4,25 3,46 2,8 69268 82,47
03.01.2012 09:01:00 -2,4 13,22 20,94 4,21 3,46 2,83 69275 82,49
03.01.2012 10:01:00 -2,28 13,27 20,98 4,34 3,48 2,81 69283 82,52
03.01.2012 11:01:01 -2,05 13,4 21,08 4,51 3,48 2,82 69290 82,54
03.01.2012 12:01:01 -1,68 13,5 21,1 4,71 3,45 2,82 69298 82,56
03.01.2012 13:01:00 -1,08 13,55 21,03 4,92 3,47 2,83 69305 82,58
03.01.2012 14:01:01 -0,8 13,74 21,06 5,29 3,45 2,82 69313 82,6
03.01.2012 15:01:00 -0,28 13,92 21,08 5,7 3,48 2,82 69320 82,62
03.01.2012 16:01:00 -0,28 13,97 21,04 5,88 3,48 2,83 69328 82,64
03.01.2012 17:01:00 -0,28 13,98 20,99 6,01 3,46 2,83 69336 82,66
03.01.2012 18:01:00 -0,28 13,87 20,76 6,04 3,47 2,84 69343 82,68
03.01.2012 19:01:00 -0,04 13,84 20,66 6,08 3,49 2,83 69351 82,7
03.01.2012 20:01:00 0,08 13,83 20,6 6,03 3,48 2,83 69358 82,72
03.01.2012 21:01:00 -0,69 24,82 20,66 12,31 0,86 0,92 69359 82,72
03.01.2012 22:01:00 -0,98 24,34 21,03 15,08 0,61 0,75 69359 82,72
03.01.2012 23:01:00 -0,26 23,44 21,22 16,4 0,6 0,76 69359 82,72
04.01.2012 00:01:00 -0,4 23,11 21,27 17,02 0,61 0,77 69360 82,72
04.01.2012 01:01:00 -0,53 23,03 21,37 17,6 0,6 0,72 69360 82,72
04.01.2012 02:01:00 -0,34 22,95 21,43 17,91 0,62 0,74 69360 82,72
04.01.2012 03:01:00 -0,03 22,9 21,48 18,14 0,62 0,75 69360 82,72
04.01.2012 04:01:00 0,03 22,89 21,52 18,33 0,62 0,73 69360 82,72
04.01.2012 05:01:00 0,03 22,89 21,58 18,47 0,6 0,73 69361 82,72
04.01.2012 06:01:00 0,03 22,66 21,57 18,55 0,56 0,73 69361 82,72
04.01.2012 07:01:00 0,03 22,16 21,59 17,67 0,77 0,89 69362 82,72
04.01.2012 08:01:00 0,03 14,24 20,96 6,63 3,45 2,84 69369 82,74
04.01.2012 09:01:01 0,03 14,1 20,8 6,36 3,46 2,86 69377 82,76
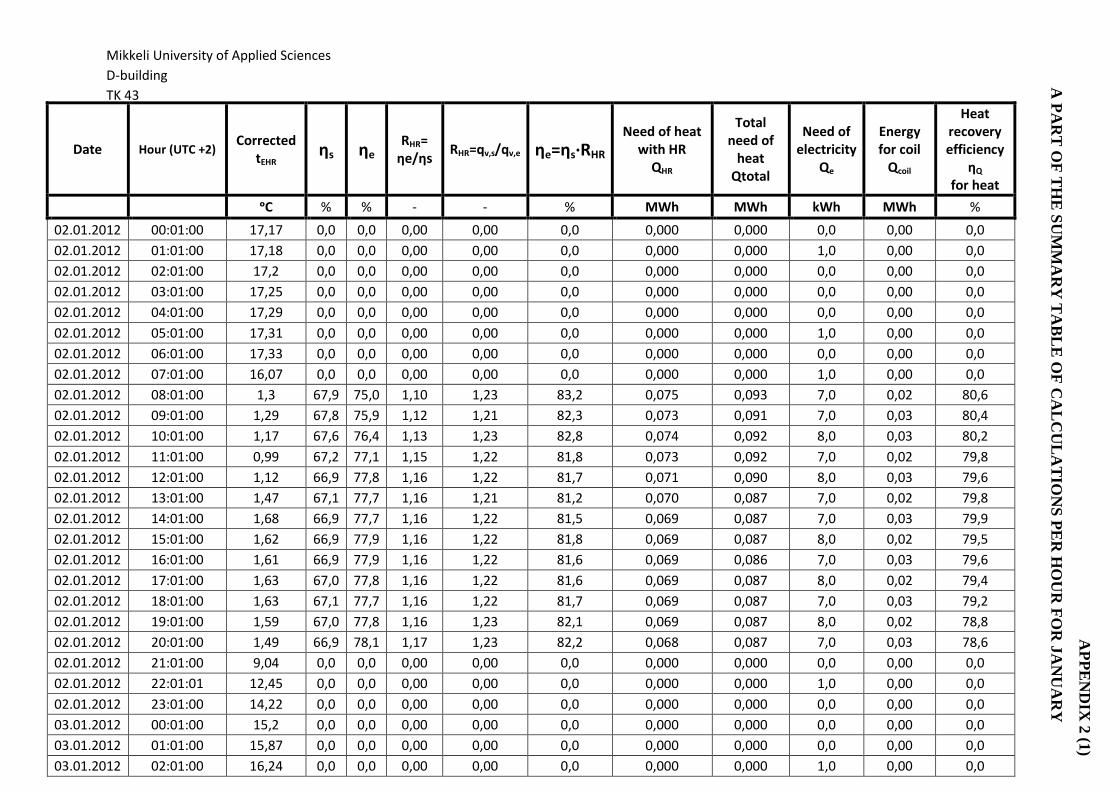
AP
PE
ND
IX 2
(1)
A P
AR
T O
F T
HE
SU
MM
AR
Y T
AB
LE
OF
CA
LC
UL
AT
ION
S P
ER
HO
UR
FO
R J
AN
UA
RY
2012
Date Hour (UTC +2) Corrected
tEHR ηs ηe RHR= ηe/ηs
RHR=qv,s/qv,e ηe=ηs·RHR Need of heat
with HR QHR
Total need of
heat Qtotal
Need of electricity
Qe
Energy for coil
Qcoil
Heat recovery efficiency
ηQ
for heat
ᵒC % % - - % MWh MWh kWh MWh %
02.01.2012 00:01:00 17,17 0,0 0,0 0,00 0,00 0,0 0,000 0,000 0,0 0,00 0,0
02.01.2012 01:01:00 17,18 0,0 0,0 0,00 0,00 0,0 0,000 0,000 1,0 0,00 0,0
02.01.2012 02:01:00 17,2 0,0 0,0 0,00 0,00 0,0 0,000 0,000 0,0 0,00 0,0
02.01.2012 03:01:00 17,25 0,0 0,0 0,00 0,00 0,0 0,000 0,000 0,0 0,00 0,0
02.01.2012 04:01:00 17,29 0,0 0,0 0,00 0,00 0,0 0,000 0,000 0,0 0,00 0,0
02.01.2012 05:01:00 17,31 0,0 0,0 0,00 0,00 0,0 0,000 0,000 1,0 0,00 0,0
02.01.2012 06:01:00 17,33 0,0 0,0 0,00 0,00 0,0 0,000 0,000 0,0 0,00 0,0
02.01.2012 07:01:00 16,07 0,0 0,0 0,00 0,00 0,0 0,000 0,000 1,0 0,00 0,0
02.01.2012 08:01:00 1,3 67,9 75,0 1,10 1,23 83,2 0,075 0,093 7,0 0,02 80,6
02.01.2012 09:01:00 1,29 67,8 75,9 1,12 1,21 82,3 0,073 0,091 7,0 0,03 80,4
02.01.2012 10:01:00 1,17 67,6 76,4 1,13 1,23 82,8 0,074 0,092 8,0 0,03 80,2
02.01.2012 11:01:00 0,99 67,2 77,1 1,15 1,22 81,8 0,073 0,092 7,0 0,02 79,8
02.01.2012 12:01:00 1,12 66,9 77,8 1,16 1,22 81,7 0,071 0,090 8,0 0,03 79,6
02.01.2012 13:01:00 1,47 67,1 77,7 1,16 1,21 81,2 0,070 0,087 7,0 0,02 79,8
02.01.2012 14:01:00 1,68 66,9 77,7 1,16 1,22 81,5 0,069 0,087 7,0 0,03 79,9
02.01.2012 15:01:00 1,62 66,9 77,9 1,16 1,22 81,8 0,069 0,087 8,0 0,02 79,5
02.01.2012 16:01:00 1,61 66,9 77,9 1,16 1,22 81,6 0,069 0,086 7,0 0,03 79,6
02.01.2012 17:01:00 1,63 67,0 77,8 1,16 1,22 81,6 0,069 0,087 8,0 0,02 79,4
02.01.2012 18:01:00 1,63 67,1 77,7 1,16 1,22 81,7 0,069 0,087 7,0 0,03 79,2
02.01.2012 19:01:00 1,59 67,0 77,8 1,16 1,23 82,1 0,069 0,087 8,0 0,02 78,8
02.01.2012 20:01:00 1,49 66,9 78,1 1,17 1,23 82,2 0,068 0,087 7,0 0,03 78,6
02.01.2012 21:01:00 9,04 0,0 0,0 0,00 0,00 0,0 0,000 0,000 0,0 0,00 0,0
02.01.2012 22:01:01 12,45 0,0 0,0 0,00 0,00 0,0 0,000 0,000 1,0 0,00 0,0
02.01.2012 23:01:00 14,22 0,0 0,0 0,00 0,00 0,0 0,000 0,000 0,0 0,00 0,0
03.01.2012 00:01:00 15,2 0,0 0,0 0,00 0,00 0,0 0,000 0,000 0,0 0,00 0,0
03.01.2012 01:01:00 15,87 0,0 0,0 0,00 0,00 0,0 0,000 0,000 0,0 0,00 0,0
03.01.2012 02:01:00 16,24 0,0 0,0 0,00 0,00 0,0 0,000 0,000 1,0 0,00 0,0
Mikkeli University of Applied Sciences D-building
TK 43
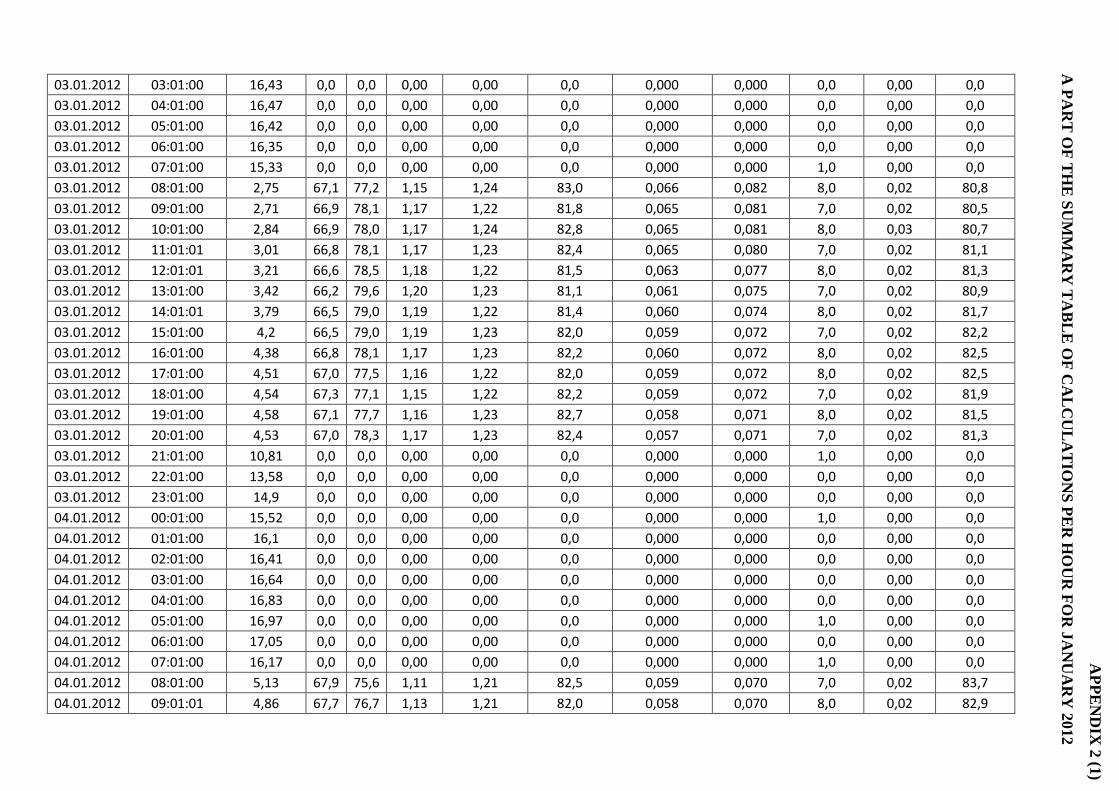
AP
PE
ND
IX 2
(1)
A P
AR
T O
F T
HE
SU
MM
AR
Y T
AB
LE
OF
CA
LC
UL
AT
ION
S P
ER
HO
UR
FO
R J
AN
UA
RY
2012
03.01.2012 03:01:00 16,43 0,0 0,0 0,00 0,00 0,0 0,000 0,000 0,0 0,00 0,0
03.01.2012 04:01:00 16,47 0,0 0,0 0,00 0,00 0,0 0,000 0,000 0,0 0,00 0,0
03.01.2012 05:01:00 16,42 0,0 0,0 0,00 0,00 0,0 0,000 0,000 0,0 0,00 0,0
03.01.2012 06:01:00 16,35 0,0 0,0 0,00 0,00 0,0 0,000 0,000 0,0 0,00 0,0
03.01.2012 07:01:00 15,33 0,0 0,0 0,00 0,00 0,0 0,000 0,000 1,0 0,00 0,0
03.01.2012 08:01:00 2,75 67,1 77,2 1,15 1,24 83,0 0,066 0,082 8,0 0,02 80,8
03.01.2012 09:01:00 2,71 66,9 78,1 1,17 1,22 81,8 0,065 0,081 7,0 0,02 80,5
03.01.2012 10:01:00 2,84 66,9 78,0 1,17 1,24 82,8 0,065 0,081 8,0 0,03 80,7
03.01.2012 11:01:01 3,01 66,8 78,1 1,17 1,23 82,4 0,065 0,080 7,0 0,02 81,1
03.01.2012 12:01:01 3,21 66,6 78,5 1,18 1,22 81,5 0,063 0,077 8,0 0,02 81,3
03.01.2012 13:01:00 3,42 66,2 79,6 1,20 1,23 81,1 0,061 0,075 7,0 0,02 80,9
03.01.2012 14:01:01 3,79 66,5 79,0 1,19 1,22 81,4 0,060 0,074 8,0 0,02 81,7
03.01.2012 15:01:00 4,2 66,5 79,0 1,19 1,23 82,0 0,059 0,072 7,0 0,02 82,2
03.01.2012 16:01:00 4,38 66,8 78,1 1,17 1,23 82,2 0,060 0,072 8,0 0,02 82,5
03.01.2012 17:01:00 4,51 67,0 77,5 1,16 1,22 82,0 0,059 0,072 8,0 0,02 82,5
03.01.2012 18:01:00 4,54 67,3 77,1 1,15 1,22 82,2 0,059 0,072 7,0 0,02 81,9
03.01.2012 19:01:00 4,58 67,1 77,7 1,16 1,23 82,7 0,058 0,071 8,0 0,02 81,5
03.01.2012 20:01:00 4,53 67,0 78,3 1,17 1,23 82,4 0,057 0,071 7,0 0,02 81,3
03.01.2012 21:01:00 10,81 0,0 0,0 0,00 0,00 0,0 0,000 0,000 1,0 0,00 0,0
03.01.2012 22:01:00 13,58 0,0 0,0 0,00 0,00 0,0 0,000 0,000 0,0 0,00 0,0
03.01.2012 23:01:00 14,9 0,0 0,0 0,00 0,00 0,0 0,000 0,000 0,0 0,00 0,0
04.01.2012 00:01:00 15,52 0,0 0,0 0,00 0,00 0,0 0,000 0,000 1,0 0,00 0,0
04.01.2012 01:01:00 16,1 0,0 0,0 0,00 0,00 0,0 0,000 0,000 0,0 0,00 0,0
04.01.2012 02:01:00 16,41 0,0 0,0 0,00 0,00 0,0 0,000 0,000 0,0 0,00 0,0
04.01.2012 03:01:00 16,64 0,0 0,0 0,00 0,00 0,0 0,000 0,000 0,0 0,00 0,0
04.01.2012 04:01:00 16,83 0,0 0,0 0,00 0,00 0,0 0,000 0,000 0,0 0,00 0,0
04.01.2012 05:01:00 16,97 0,0 0,0 0,00 0,00 0,0 0,000 0,000 1,0 0,00 0,0
04.01.2012 06:01:00 17,05 0,0 0,0 0,00 0,00 0,0 0,000 0,000 0,0 0,00 0,0
04.01.2012 07:01:00 16,17 0,0 0,0 0,00 0,00 0,0 0,000 0,000 1,0 0,00 0,0
04.01.2012 08:01:00 5,13 67,9 75,6 1,11 1,21 82,5 0,059 0,070 7,0 0,02 83,7
04.01.2012 09:01:01 4,86 67,7 76,7 1,13 1,21 82,0 0,058 0,070 8,0 0,02 82,9
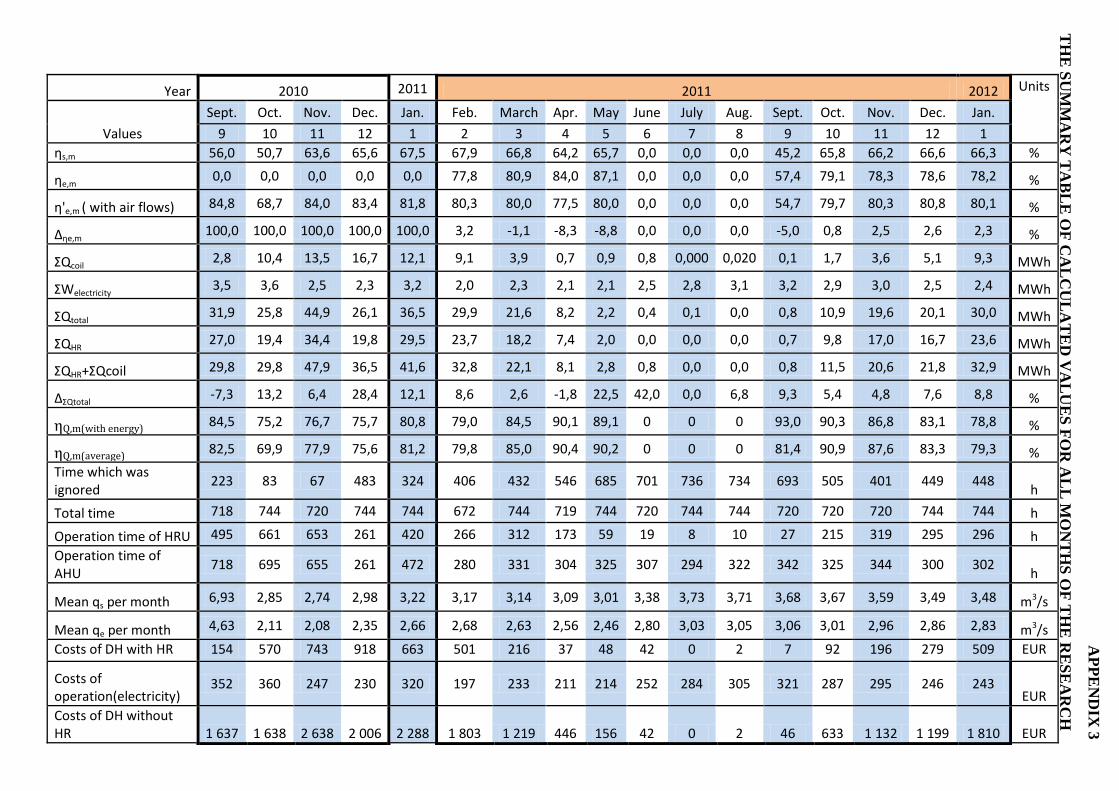
AP
PE
ND
IX 3
TH
E S
UM
MA
RY
TA
BL
E O
F C
AL
CU
LA
TE
D V
AL
UE
S F
OR
AL
L M
ON
TH
S O
F T
HE
RE
SE
AR
CH
Year 2010 2011 2011 2012 Units
Values
Sept. Oct. Nov. Dec. Jan. Feb. March Apr. May June July Aug. Sept. Oct. Nov. Dec. Jan.
9 10 11 12 1 2 3 4 5 6 7 8 9 10 11 12 1 ηs,m 56,0 50,7 63,6 65,6 67,5 67,9 66,8 64,2 65,7 0,0 0,0 0,0 45,2 65,8 66,2 66,6 66,3 %
ηe,m 0,0 0,0 0,0 0,0 0,0 77,8 80,9 84,0 87,1 0,0 0,0 0,0 57,4 79,1 78,3 78,6 78,2 %
η'e,m ( with air flows) 84,8 68,7 84,0 83,4 81,8 80,3 80,0 77,5 80,0 0,0 0,0 0,0 54,7 79,7 80,3 80,8 80,1 %
∆ηe,m 100,0 100,0 100,0 100,0 100,0 3,2 -1,1 -8,3 -8,8 0,0 0,0 0,0 -5,0 0,8 2,5 2,6 2,3 %
ΣQcoil 2,8 10,4 13,5 16,7 12,1 9,1 3,9 0,7 0,9 0,8 0,000 0,020 0,1 1,7 3,6 5,1 9,3 MWh
ΣWelectricity 3,5 3,6 2,5 2,3 3,2 2,0 2,3 2,1 2,1 2,5 2,8 3,1 3,2 2,9 3,0 2,5 2,4 MWh
ΣQtotal 31,9 25,8 44,9 26,1 36,5 29,9 21,6 8,2 2,2 0,4 0,1 0,0 0,8 10,9 19,6 20,1 30,0 MWh
ΣQHR 27,0 19,4 34,4 19,8 29,5 23,7 18,2 7,4 2,0 0,0 0,0 0,0 0,7 9,8 17,0 16,7 23,6 MWh
ΣQHR+ΣQcoil 29,8 29,8 47,9 36,5 41,6 32,8 22,1 8,1 2,8 0,8 0,0 0,0 0,8 11,5 20,6 21,8 32,9 MWh
∆ΣQtotal -7,3 13,2 6,4 28,4 12,1 8,6 2,6 -1,8 22,5 42,0 0,0 6,8 9,3 5,4 4,8 7,6 8,8 %
ηQ,m(with energy) 84,5 75,2 76,7 75,7 80,8 79,0 84,5 90,1 89,1 0 0 0 93,0 90,3 86,8 83,1 78,8 %
ηQ,m(average) 82,5 69,9 77,9 75,6 81,2 79,8 85,0 90,4 90,2 0 0 0 81,4 90,9 87,6 83,3 79,3 % Time which was ignored
223 83 67 483 324 406 432 546 685 701 736 734 693 505 401 449 448 h
Total time 718 744 720 744 744 672 744 719 744 720 744 744 720 720 720 744 744 h
Operation time of HRU 495 661 653 261 420 266 312 173 59 19 8 10 27 215 319 295 296 h Operation time of AHU
718 695 655 261 472 280 331 304 325 307 294 322 342 325 344 300 302 h
Mean qs per month 6,93 2,85 2,74 2,98 3,22 3,17 3,14 3,09 3,01 3,38 3,73 3,71 3,68 3,67 3,59 3,49 3,48 m3/s
Mean qe per month 4,63 2,11 2,08 2,35 2,66 2,68 2,63 2,56 2,46 2,80 3,03 3,05 3,06 3,01 2,96 2,86 2,83 m3/s Costs of DH with HR 154 570 743 918 663 501 216 37 48 42 0 2 7 92 196 279 509 EUR
Costs of operation(electricity)
352 360 247 230 320 197 233 211 214 252 284 305 321 287 295 246 243 EUR
Costs of DH without HR 1 637 1 638 2 638 2 006 2 288 1 803 1 219 446 156 42 0 2 46 633 1 132 1 199 1 810 EUR
Related Documents


