1616 P St. NW Washington, DC 20036 202-328-5000 www.rff.org March 2015 RFF DP 14-32 Efficiency Costs of Social Objectives in Tradable Permit Programs Kailin Kroetz, James N. Sanchirico, and Daniel K. Lew A version of this paper was accepted for publication by the Journal of the Association of Environmental and Resource Economists on 03/12/2015. http://www.press.uchicago.edu/ucp/journals/journal/jaere.html DISCUSSION PAPER

Welcome message from author
This document is posted to help you gain knowledge. Please leave a comment to let me know what you think about it! Share it to your friends and learn new things together.
Transcript

1616 P St. NW Washington, DC 20036 202-328-5000 www.rff.org
March 2015 RFF DP 14-32
Efficiency Costs of Social Objectives in Tradable Permit Programs
Kai l i n Kr oet z , James N. Sanchi r i co , and
Danie l K . Lew
A version of this paper was accepted for publication by the
Journal of the Association of Environmental and Resource
Economists on 03/12/2015.
http://www.press.uchicago.edu/ucp/journals/journal/jaere.html
DIS
CU
SS
ION
PA
PE
R

Efficiency Costs of Social Objectives in Tradable Permit Programs
Kailin Kroetz, James N. Sanchirico, and Daniel K. Lew
Abstract
Objectives of tradable permit programs are often broader than internalizing an externality and
improving economic efficiency. Many programs are designed to accommodate community, cultural, and
other non-efficiency goals through restrictions on trading. However, restrictions can decrease economic
efficiency gains. We use a policy experiment from the Alaska halibut and sablefish tradable permit
program, which includes both restricted and unrestricted permits, to develop one of the few empirical
measurements of the costs of meeting non-efficiency goals. We estimate that restrictions are reducing
resource rent in the halibut and sablefish fisheries by 25% and 9%, respectively.
Key Words: tradable permits, created markets, individual transferrable quota, catch shares,
Alaskan halibut and sablefish fishery
JEL Classification Numbers: Q22, Q28

Contents
Introduction ............................................................................................................................. 1
The Alaska Halibut and Sablefish Transferable Quota Program ...................................... 4
Vessel Class Restriction ...................................................................................................... 6
Blocking Restriction ........................................................................................................... 6
Data ..................................................................................................................................... 7
Identifying the Costs of Restrictions ..................................................................................... 8
Econometric Analysis ........................................................................................................... 10
Costs of Vessel Class Restriction ..................................................................................... 13
Costs of Blocking Restriction ........................................................................................... 14
Total Cost of Restrictions ................................................................................................. 14
Robustness Checks ................................................................................................................ 15
Parametric Robustness Checks ......................................................................................... 15
Nonparametric Analysis.................................................................................................... 16
Conclusions and Discussion ................................................................................................. 17
References .............................................................................................................................. 20
Figures and Tables ................................................................................................................ 25
Appendix. ............................................................................................................................... 31
Extended Data Description ............................................................................................... 31
Extended Program Description ......................................................................................... 33
Supplementary Figures ..................................................................................................... 34
Supplementary Tables ....................................................................................................... 37
Robustness Check, LLM ................................................................................................... 43
Additional Robustness Regression ................................................................................... 49

Resources for the Future Kroetz, Sanchirico, and Lew
1
Efficiency Costs of Social Objectives in Tradable Permit Programs
Kailin Kroetz, James N. Sanchirico, and Daniel K. Lew
Introduction
Tradable permit programs (TPPs) are a market-based policy designed to internalize
externalities. Examples include management of air pollutants such as CO2 and SO2, point and
non-point source water pollution, as well as the allocation of catch in commercial fisheries (Boyd
et al. 2003). Regardless of their application, TPPs establish a cap (e.g., amount of pollution or
resource extraction), then allocate a share of the cap to participants in the form of a permit. In
many programs, however, trading of the permits is restricted (Tietenberg 2007).
Restrictions on trade, such as who can trade with whom1 and whether permits can be
borrowed or banked, are often implemented to address cultural, secondary environmental issues,
and other non-efficiency goals. Often the justification is based on ‘equity’ issues and concerns
over the ‘winners’ and ‘losers’ (Hahn 1984). For example, an oft-stated concern in commercial
Kroetz: Resources for the Future, 1616 P Street NW, Washington DC 20036; email: [email protected]. Sanchirico:
Dept. of Environmental Science and Policy, University of California, Davis, One Shields Avenue, Davis, CA 95616;
and Resources for the Future: email: [email protected]. Lew: Alaska Fisheries Science Center, National
Marine Fisheries Service, National Oceanic and Atmospheric Administration; and Dept. of Environmental Science
and Policy, University of California, Davis, One Shields Avenue, Davis, CA 95616; email: [email protected].
Funding for this research was provided by Resources for the Future and the Alaska Fisheries Science Center,
National Marine Fisheries Service. The views and opinions expressed in this paper are the authors’ own, and do not
necessarily reflect those of Resources for the Future or the National Oceanic and Atmospheric Administration or the
U.S. Department of Commerce.
This publication was prepared by Kailin Kroetz, James N. Sanchirico, and Daniel K. Lew under NOAA Grant
#NA120AR4170070, California Sea Grant College Program Project #NA120AR4170070, through NOAA’s
National Sea Grant College Program, U.S. Dept. of Commerce. The statements, findings, conclusions and
recommendations are those of the author(s) and do not necessarily reflect the views of California Sea Grant, state
agencies, NOAA or the U.S. Dept. of Commerce.
We thank Joshua Abbott, Isabel Call, Ghada Elabed, Harrison Fell, Ron Felthoven, Jacqueline Ho, Larry Karp,
Stephen Kasperski, Douglas Larson, Clayton Munnings, Aaron Smith, Martin Smith, James Wilen, Zhongmin
Wang, the participants of the AERE conference (Seattle June 2011), the participants at the PERC Lessons Learned
in Rights-Based Fisheries Management workshop (Bozeman July 2011), and two anonymous reviewers for helpful
comments on earlier drafts of the manuscript. Jessica Gharrett and Terry Hiatt were very helpful in providing and
explaining the nuances of the data.
1 This encompasses many types of restrictions including restrictions on trade between economic agents within the
program, including who can trade with whom and the limitations placed on those transactions, as well as the
exclusion of potential participants from a program (e.g. the exclusion of some sectors from a program).

Resources for the Future Kroetz, Sanchirico, and Lew
2
fisheries is that larger operators may buy out smaller operators, which could have negative
implications for the social fabric of coastal communities and ports (see e.g. Willmann (2000)).
Trading rules are one possible means of addressing non-efficiency goals.2 While they
may produce societal benefits, they may also reduce the cost-effectiveness of a program (Stavins
1995) and/or reduce the potential for increases in revenue to occur through changes, such as
increases in product quality and switching to more valuable product forms (see e.g. Wilen (2005)
for further discussion and examples of revenue-side gains in fisheries after management
changes). The extent to which the benefits outweigh the costs or vice versa is not fully
understood. We provide one of the few empirical estimates of the magnitude of the efficiency
costs of trading restrictions, thereby enabling policymakers to understand the tradeoffs associated
with including restrictions in the design of a TPP (see also Gangadharan (2000, 2004) , Grafton
Squires and Fox (2000), and Singh, Weninger, and Doyle (2006)).
In general, we contribute to the set of ex post evaluations of TPPs3, albeit with a more
limited focus on measuring the costs of restrictions. Our analysis is similar to Gangadharan
(2004) who obtains an estimate of the variation in permit price by geographic area in the
Regional Clean Air Incentives Market (RECLAIM). However, we focus on restrictions that
impact the use of capital inputs, divisibility of a permit, corporate ownership, and consolidation
and therefore have the potential to impact profitability through mechanisms including limiting
size and returns to scale, access to credit and interest rates, and limiting technology and
constraining variable cost structures. Similar mechanisms in contexts including the lead phase
out program and wetland credit trading have been shown to reduce program efficiency (see e.g.
Kerr and Maré (1998) and Shabman (2004)). Furthermore, restrictions based on similar
mechanisms exist or are proposed for other TPPs, most notably in contexts with multiple user
groups. For example, geographical sectors can arise through the division of markets by political
entity, such as the European Union, Californian, and Chinese carbon markets (see e.g. Munnings
2 Of course, there are other means besides trading restrictions to address these goals. For example, when Peru
implemented a TPP to manage the Anchoveta stock, the program included a social fund called FONCOPES to
provide crew financial incentives for early retirement, retraining opportunities, and assistance in small business
development (Young and Lankester, 2013). In the carbon abatement context rebates can be used to offset increases
in the costs of energy associated with permit costs and therefore prevent low-income households from experiencing
an increase in energy costs (see e.g. Kunkel and Kammen (2011)). An assessment of the most cost-effective means
to address non-efficiency goals is beyond the scope of the paper.
3 See, for example, OECD (2004) and Tietenberg (2006) for summaries of multiple programs, and for specific
examples see Fowlie and Perloff (2012), Ellerman and Buchner (2007), Montero (1999), Schmalensee et al. (1998)
and Stavins (1998).

Resources for the Future Kroetz, Sanchirico, and Lew
3
et al. (2014) and Pizer et al. (2006)). User groups may also be separated within a program, such
as mobile and stationary emission sources, non-point and point sources, and commercial and
recreational fisheries sectors (see e.g. Call and Lew (2014)).
To estimate the impact of the restrictions we exploit a real-world policy experiment
where the designers of the Alaska federal halibut and sablefish Individual Transferrable Quota
(ITQ) program created both restricted (to varying degrees) and unrestricted markets. This
variation allows us to identify the costs of trading restrictions without imposing structural
assumptions necessary to estimate a counterfactual. Specifically, we consider the question of
whether the restrictions in the ITQ program resulted in lower resource rent than hypothetically
would have existed if the program had been implemented without the restrictions in place. We
conduct our analysis using a reduced form model of quota prices, with dummy variables
capturing the impact of restrictions. Similar identification strategies have been used to measure
the underlying costs and benefits of programs in a variety of settings. For example,
Chattopadhyay and Duflo (2004) exploit randomization across village councils of a mandate that
a leadership role be filled by a woman to study public good provision and gender in India, while
Bai, Li and Ouyang (2014) use geographic variation in property tax implementation to consider
property taxation effects in China.
In the fisheries context, our work contributes to the growing body of research utilizing
policy experiments to identify the impacts of policies. For example, Newell, Sanchirico and Kerr
(2005) use information on fish stocks that had the greatest reduction in catches pre and post the
ITQ program to identify the rate of return in an ITQ program, Smith, Zhang and Coleman (2006)
use data from before and after the creation of closed areas to measure the impact the of the
closure on the fishery, Abbott and Wilen (2010) use variation in the choice to participate in a
cooperative management structure to identify the gains from information sharing, and more
recently, Scheld, Anderson and Uchida (2012) exploit that only a share of the fishermen fishing
multiple fish stocks were operating under a quota program to measure the economic effects of
the program.
We use a unique (confidential) dataset from the Alaska federal halibut and sablefish ITQ
program. The program was implemented in 1995 (58 FR 215: 59375-59413) to limit access to
each of the fisheries, reduce overcapacity, and address “conservation and management problems
that are endemic to open access fisheries” (69 FR 84: 23681). At the same time, concern about
the potential impacts of the program on the social and cultural characteristics of the fisheries and
fishing communities in Alaska led to restrictions on quota trading.
Resources for the Future Kroetz, Sanchirico, and Lew
4
The number and diversity of restrictions on the transfer of quota in the halibut and
sablefish markets makes the program a unique and well-suited laboratory to measure the
efficiency costs of achieving non-efficiency objectives. Furthermore, relative to other TPPs, the
halibut and sablefish ITQ program has been in place for a long time, has an active and well-
documented trading market, and has a large number of participants.
Using both parametric and non-parametric methods, we find that restrictions in the
fisheries have decreased the present value of resource rent (as measured by quota asset prices)
over the lifetime of the program by approximately $121 million for halibut and $46 million for
sablefish (in $2012 USD). To put these numbers in context, the gross revenues for the halibut
and sablefish fisheries in 2011 was $205.2 million and $128.9 million, respectively (Fissel et al.
2012).
Our findings suggest that restrictions in TPPs can have significant efficiency
implications. This is a particularly important finding given that imposing restrictions in these
programs is becoming more commonplace. For example, recently proposed air pollution
legislation in California (see e.g. EPRI (2013)) and newly implemented programs for managing
West Coast and New England fisheries impose restrictions on permit markets. In the fisheries
management context, the use of restrictions is likely to grow as the National Oceanic and
Atmospheric Administration’s (NOAA) Catch Share Policy (NOAA 2010) discusses the key role
trading rules can play in addressing multiple objectives.
The remainder of the paper is organized as follows. First, we describe the Alaska halibut
and sablefish ITQ program, the restrictions we focus on in the paper, and the data used in our
analysis. We then provide a brief overview of how the costs of the restrictions were measured.
This is followed by estimates of the costs of the restrictions, including a set of parametric and
non-parametric robustness checks. We conclude with a summary of our results and future
research questions.
The Alaska Halibut and Sablefish Transferable Quota Program
Prior to ITQ implementation, both the halibut and sablefish fisheries were managed using
season length restrictions as a means of restricting catch. However, both fisheries went through
periods where significant numbers of vessels entered the fishery, causing the season lengths to be
progressively shortened in an effort to avoid exceeding the annual catch limits. When ITQs were
implemented in 1995, openings as short as 24 hours had occurred in the halibut fishery and

Resources for the Future Kroetz, Sanchirico, and Lew
5
seasons were as short as 20 days in the sablefish fishery.4 The Alaska halibut and sablefish
program was implemented in 1995 by the North Pacific Fishery Management Council (NPFMC),
the regulatory body overseeing the management of the fishery. The NPFMC determines how
much sablefish can be caught each year, while the annual amounts of Pacific halibut that can be
harvested in the United States (and Canada as well) are determined by the International Pacific
Halibut Commission (IPHC).
To sustain healthy fish populations, the yearly total allowable catch (TAC) of the halibut
stock and the sablefish stock are capped. TACs are assigned to specific geographic areas, of
which there are eight in the halibut fishery and six in the sablefish fishery (see Figure 1A in the
Appendix). Area-specific TACs are intended to prevent local stock depletion (Pautzke and
Oliver 1997).
At the inception of the program, the NPFMC granted revocable permits, which are
denoted quota share (QS), to past participants in the fisheries. The QS were allocated for a
species-area combination and based on the fishing history of each participant. Prior to program
implementation it was common for fishermen to fish both halibut and sablefish and fish in
multiple areas, and therefore some fishermen were allocated quota for multiple species-area
combinations. Ownership of QS for a species grants the owner the privilege to fish a percentage
of the species’ TAC in an area each year and into perpetuity. The yearly allowances in pounds of
fish are determined by multiplying the percentage of the TAC an individual is entitled to, which
is based on their QS holdings, with the TAC. The annual allocations of pounds are called IFQ
pounds and are allocated to individuals who hold QS via an IFQ permit.
Transfer of QS and IFQ is allowed in the fishery but subject to a number of restrictions.
Rather than provide an exhaustive coverage of them, we describe in detail the rules most relevant
for our analysis. Specifically, we discuss the vessel class and blocking rules.5
4 See, e.g., Homans and Wilen (1997) and NRC (1999) for more detail on the history of the halibut and sablefish
fisheries and their management.
5 The program also includes accumulation caps limiting how much quota an individual or entity can hold. We do
not focus on this restriction because there is evidence that fishermen find ways to circumvent these restrictions (see
e.g. Carothers (2013)). Additionally, there are also criteria fishermen must meet in order to purchase quota and enter
the fishery (see Pautzke and Oliver (1997) and also fishery management reports available at
http://www.fakr.noaa.gov/ram/ifq.htm).

Resources for the Future Kroetz, Sanchirico, and Lew
6
Vessel Class Restriction
Limiting the use of specific quota to certain vessel classes impacts production flexibility
and use of capital inputs. The restriction dictates who can own the QS and IFQ pounds and
where and how they can be fished and transferred, as well as the size and type of vessel
permitted to fish the IFQ pounds. Class A QS and IFQ pounds are the least restrictive, as they
can be owned by a corporation or an individual, sold,6 and fished on a vessel with or without the
owner on board. All other classes of quota may be fished only when the owner of the IFQ
pounds, who must be an individual, is on board.7
The class also dictates the type and length of the vessel on which the IFQ can be fished.
In both fisheries, Class A IFQ is the only IFQ that can be fished on any length vessel, including
catcher-processor vessels (large vessels that both catch fish and process it at sea). All other IFQ
must be fished on catcher-vessels, which are vessels that deliver their catch to shore-side
processors. Classes B and C in the sablefish fishery8 and Classes B, C, and D in the halibut
fishery,9 designate a variety of sizes of catcher-vessels on which the IFQ can be fished. Class B
vessels are larger than Class C vessels, which are larger than Class D.
Blocking Restriction
The blocking restriction makes some QS only transferable as an indivisible block and
places limits on the number of blocks one can hold. Blocked QS was established at the beginning
of the program for the purpose of ensuring a minimum fleet size (Pautzke and Oliver 1997); in
other words, there were concerns that the total number of vessels fishing would drastically
decrease. In conjunction with other restrictions the intention was to prevent over-consolidation
and ensure that the fishery would not end up dominated by only a few firms (Pautzke and Oliver
1997). Whether the initial issuance of QS was blocked depended on the amount of QS a
6 IFQ transactions are akin to leases. These leases are restricted to emergency circumstances only (such as a death or
military deployment) for quota associated with all classes of vessels, except Class A quota.
7 Companies grandfathered in at the beginning of the program are exempt from this restriction. Additionally,
participants who were initially allocated QS at the beginning of the program are permitted to hire skippers.
8 In the sablefish ITQ program the vessel lengths associated with the classes are as follows: Class A IFQ pounds can
be fished by any length and by either type of vessel, Class B must be fished by catcher vessels and the vessels can be
greater than 60 feet in length, and Class C must be fished by catcher vessels 60 feet or less.
9 The vessel classes in the halibut fishery are the same except Class C must be fished by vessels between 35 and 60
feet in length, and there is also a Class D designation, for which the IFQ pounds must be fished on catcher vessels
35 feet in length or less.

Resources for the Future Kroetz, Sanchirico, and Lew
7
participant received;10
participants receiving a relatively small amount of QS received quota in
an indivisible “block.”11
Blocked quota also results in a restriction on the total amount of quota a participant can
hold. Specifically, the number of blocks a participant can hold is limited, and the size of each
block is capped, restricting total QS units and associated yearly IFQ pounds that can be owned.
Furthermore, owning blocked quota can limit the ability to own unblocked quota. Specifically,
holding more than one block of QS disqualifies a participant from holding unblocked QS.
Data
We acquired primary confidential data on quota transactions from the National Marine
Fisheries Service, Alaska Regional Office. The dataset covers all market transactions since the
program’s inception in January 1995 through the end of the 2011 fishing year (the final year for
which we have complete data).12
Information describing the transactions includes: the transaction
date, names and identification numbers for the buyer and the seller, addresses of the buyer and
the seller, information on the price paid/received, the amount of IFQ pounds and QS in the
transfer, the reason for the transfer, information on how the buyer and seller found one another,
details on the relationship (if any) between the buyer and seller, and details of the quota
transacted (e.g., species, area, vessel class, blocked or unblocked, and “fishdownable”).13
Because of limitations on IFQ pound trading (i.e., leases) and the resulting small number
of leases, we use the QS (asset) price data that consists of 4,870 transactions for halibut and
2,160 for sablefish. Specifically, we use data from transactions that include both QS and IFQ
pounds, and where the number of pounds is equal to the yearly issuance of IFQ pounds
10 See Pautzke and Oliver (1997) for details on how the initial allocation of quota was determined.
11 Other examples of blocking restrictions include the West Coast sablefish limited entry endorsed sector permit
stacking scheme (Kroetz and Sanchirico 2009) and ‘locking’ of quota in the British Columbia trawl program
(Grafton, Nelson and Turris, 2005).
12 Our primary results use transaction data from the 2000-2011 fishing seasons due to different reporting
requirements than the earlier data. As a robustness check, we did the analysis using the period from 1995 to 2011.
Overall, the results are consistent with the shorter time period. The full set of results is available upon request.
13 As Newell, Sanchirico and Kerr (2005) found in the New Zealand ITQ fisheries, individual level market data can
include transactions that are not arm’s length (transactions where both parties act strictly in their own best interest).
Given the detailed nature of our transaction data, specifically the fields in the dataset describing the reason for the
transfer, information on how the buyer and seller found one another, and details on the relationship (if any) between
the buyer and seller, we are able to eliminate non-arm’s length transactions (8% of priced observations were
removed for halibut and 14% for sablefish).

Resources for the Future Kroetz, Sanchirico, and Lew
8
associated with the quantity of QS in the transaction.14
These transactions represent 78% of the
transactions in each fishery, and the prices are less likely to be confounded by other factors, such
as adjustments to the price for IFQ pounds not included in the transaction.
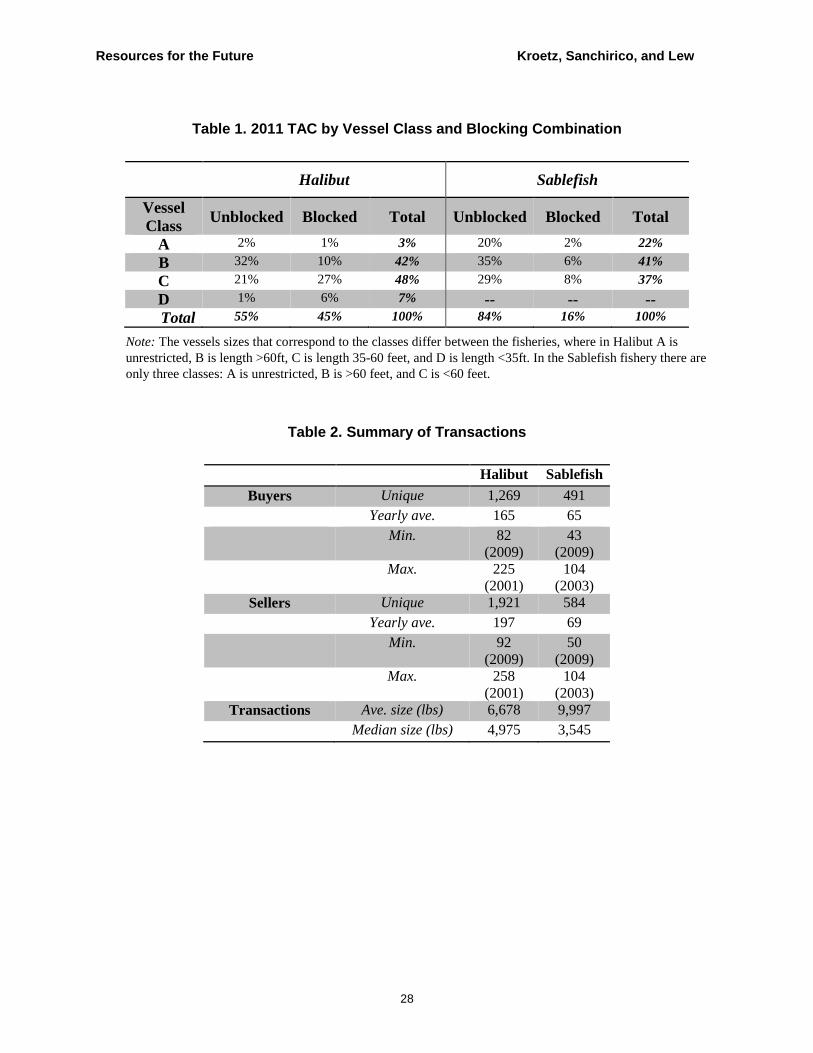
The observed transactions in the final set are relatively evenly distributed across the
years, although the transactions are more heavily concentrated in the spring relative to the rest of
the fishing year (the open season runs from late February/March through November). See Table
1 for a summary of the breakdown of the total quota by restriction type and see Table 2 for a
summary of the transaction data. Also see the appendix for more details.
Identifying the Costs of Restrictions
In a well-functioning quota market, the QS price (asset price) is equal to the discounted
present expected value from fishing the yearly allocation of pounds into the future. The annual
return (dividend) to holding a share is the resource rent and represents “the surplus value, i.e., the
difference between the price at which fish can be sold and the respective production costs which
include a normal return” (NOAA 2010). The asset price, therefore, is a function of the future
expectations of profitability in the fishery, discount rates, and expected TAC allocations in the
future (for more detailed discussion of quota prices and examples see Clark (1980, 1985, 2005)
and Newell, Papps and Sanchirico (2007)).
We set out to answer the question of whether or not restrictions led to lower resource rent
than would have existed in the hypothetical case where the ITQ program was implemented
without restrictions in place. Our focus is on estimating the differential in the QS price between
restricted quota and unrestricted quota. The basis of our identification strategy is that potentially
binding trading restrictions distort the price signals in the permit market. That is, a market where
rules restrict production processes is likely to lead to the TAC being fished at higher costs and/or
at lower per-unit revenue than when the trading market is unrestricted. We exploit the policy
14 We observe three types of transactions in the data. The first is QS-only transactions. These transactions do not
include any IFQ pounds. In the halibut fishery these transactions made up approximately 14% of the transactions,
and in the sablefish fishery the percentage is approximately 15%. The second type of transaction includes both QS
and IFQ pounds, and the amount of pounds is equal to the yearly issuance of IFQ pounds, which varies by year,
associated with the quantity of QS in the transaction. These “Full-IFQ” transactions are the majority of the
transactions we observe: 78% of halibut transactions and 78% of sablefish transactions are this type. Finally, there
are also transactions that include both QS and IFQ pounds, but the number of IFQ pounds is fewer than the yearly
issuance associated with the quantity of QS in the transaction. These transactions make up 7% of halibut
transactions and 8% of sablefish transactions.

Resources for the Future Kroetz, Sanchirico, and Lew
9
experiment that restrictions only apply to segments of each fishery, and we observe the quota
prices associated with both the unrestricted and restricted segments of the fisheries. 15
Our estimates represent the long-run marginal value of moving one unit of quota from a
restricted operation to an unrestricted one. For example, we consider the situation where one unit
of Class C blocked quota was instead unblocked or where one unit of Class C quota is fished on
vessels with lengths in the Class B category. We do not attempt to model the transitional
dynamics that would occur if a restriction is relaxed at a point in time and the fishermen and
markets readjust.16
The success of our identification strategy rests on the assumption of a competitive market
for quota where no one fisherman can influence the quota price. This assumption is supported
by work in other fisheries quota markets showing the markets are well-functioning (see Newell,
Sanchirico and Kerr (2005)), as well as by characteristics of the specific fisheries and quota
markets we analyze. Specifically, there are a large number of individuals owning quota in the
fisheries we examine (over 2,600 individuals in the halibut fishery and over 800 individuals in
the sablefish fishery are allocated pounds of quota each year (RAM 2012)), and brokers have
been active in the markets facilitating trades since the inception of the program.
While we estimate the marginal value of moving one unit of quota across restrictions,
from a policy perspective primary interest is likely to be on the difference in total resource rent
in the restricted versus the unrestricted scenario. For this, we compare the total resource rent in
the restricted scenario to that in the counterfactual scenario where one or more restrictions did
not exist. In the case where the equilibrium without restrictions would consist of vessels similar
to the vessels in the unrestricted segment of the fishery, we measure the total resource rent as the
product of the observed unrestricted quota price and the total TAC in the counterfactual.
15 Note that because we estimate a difference between restricted and unrestricted quota prices we do not view our
estimates as either an upper or lower bound. In other words, there is no reason to expect the difference to be higher
or lower over time as it is possible the timeframes and impacts of transitions of capital would differ between
restricted and unrestricted markets.
16 There is evidence, for example, that capital in fisheries may be slow to turn over after a policy change (see e.g.
Weninger and Just (1997)). The path of adjustment to a new management regime (with or without restrictions) is
interesting to consider, and a structural econometric model that incorporates capital dynamics is one method to
measure the full dynamic costs of the restrictions, but is beyond the scope of this paper.

Resources for the Future Kroetz, Sanchirico, and Lew
10
Similarly, the total restricted scenario resource rent is the sum of the products of the restricted
prices and the corresponding restricted TACs.17
Econometric Analysis
Before developing our reduced form model to measure the long-run impact on resource
rent of the blocking and vessel class restrictions, we present summary statistics that show how
prices across the restricted categories have varied over time. Specifically, Figure 1 illustrates
average quota prices by vessel class; the percentages of priced transactions we observe in each
vessel class are 1% A, 23% B, 45% C, and 31% D in the halibut fishery. For sablefish, the
observed percentages of priced transactions are 6% A, 37% B, and 56% C. The shortest halibut
vessel class (Class D) tends to have prices below the other classes, but the other class prices are
close to one another and the ranking changes year-to-year in some cases. There are several
possible reasons for why quota prices may differ by vessel class. For example, Haynie and
Layton (2010) provide empirical evidence that profitability varies by length of vessel in the
Bering Sea pollock fishery (e.g., due to different technologies and variable cost structures, and
ability to travel further distances).
Figure 2 illustrates the average real quota prices over time based on the blocking status,
where blocked quota comprises 80% of the halibut transactions and 57% for sablefish. The
average blocked quota prices are lower than the unblocked prices in both the halibut and
sablefish markets. Blocking has the potential to impact quota prices through similar mechanisms
as other restrictions that limit production flexibility including: impacts on size of the operation,
variables costs, and access to credit and interest rates.
These summary statistics are limiting, however. For example, the price of quota may
depend on the area designation of the quota18
and the class and blocking restrictions jointly.
Therefore we investigate potential price differences using a regression analysis to control for
other potential factors influencing quota prices. Ideally, we would observe restricted and
unrestricted quota prices for species k and quota attributes j at the same point in time t, and could
17 Using the average difference in quota prices we can estimate what the quota price and total resource rent in the
fisheries would have been without one of the restrictions (rent equals unrestricted quota price x TAC) and with the
restriction (rent equals unrestricted quota price x unrestricted TAC + restricted quota price x restricted TAC).
Differences between these estimates are the costs due to the restrictions.
18 See Table A1 in the Appendix for a breakdown of transactions by area.

Resources for the Future Kroetz, Sanchirico, and Lew
11
calculate the difference, which can be written as:
(1) 𝐷(𝑘, 𝑗|𝑡) = 𝑃(𝑘, 𝑗|𝑅, 𝑡) − 𝑃(𝑘, 𝑗|𝑈, 𝑡)
where U and R are used to distinguish between unrestricted and restricted quota prices,
respectively. The estimate is a reduced form estimate in the sense that we cannot ascribe the
difference to particular factors that may influence profitability including differences in ex-vessel
price received, inputs used, or input prices.
Estimation of 𝐷(𝑘, 𝑗|𝑡) is complicated by the fact that we only observe restricted and
unrestricted quota prices when a quota trade occurs and transactions often do not occur in the
same window of time or at regular intervals throughout the season. Furthermore, because factors
influencing quota prices change over time, we cannot condition on t (measured in days), and we
do not use this simple framework to directly compare quota prices observed at two different
points in time.
Instead, we rely on the fact that factors influencing prices tend to be correlated through
time (for example, current fish stock size is a function of fish stock size in the previous period;
similarly prices such as ex-vessel prices and fuel prices tend to be correlated through time).
Therefore, we expect the difference between restricted and unrestricted prices that are observed
close to the same day to be a good approximation of the difference D(k,j| t). This allows us to
use a reduced form regression model, with controls for factors other than the restrictions that
influence QS prices, to estimate the difference in prices.
For our analysis we construct a separate model for each species using observed quota
prices as our dependent variable. Specifically, we estimate:
(2) 𝑓(𝑄𝑢𝑜𝑡𝑎 𝑝𝑟𝑖𝑐𝑒)𝑖,𝑠,𝑦 = 𝛼 + 𝐑′𝜷 + 𝑫′𝒚∗𝒂𝒓𝒆𝒂 𝛄𝒚∗𝒂𝒓𝒆𝒂 + 𝑫′𝒔𝜸𝒔 + D𝑝𝑜𝑙𝛾𝑝𝑜𝑙 + 𝜀𝑖,𝑠,𝑦
The i subscripts index the observed market transactions, s indexes season, and y indexes
year. Because there are multiple restrictions, a fully-interacted set of vessel class and blocking
dummy variables (R vector) are used to measure the impact of restrictions. We use the
coefficients on these variables, β, to estimate the reduction in quota price due to each of the
restrictions.
We also include multiple control variables in the analysis, represented by D. A policy
dummy variable is included to capture the change to the regulations that occurred in the halibut

Resources for the Future Kroetz, Sanchirico, and Lew
12
fishery, where the limit on the number of blocks held increased from two to three. Seasonal
dummy variables are also included to capture seasonality in processing and/or potential costs
associated with the weather that varies throughout the season.19
Other variables include controls
for year to capture changes in the fishery at a yearly time scale, which are interacted with area
dummy variables specifying where the quota can be fished. 20
The area of fishing can impact the profitability of fishing and quota prices, and therefore
we control for area differences in our model. Specifically, ex-vessel prices vary by port in the
Alaska halibut and sablefish fisheries (NMFS 2010a, NMFS 2010b). Costs may also be region-
specific due to differences in distance to the fishing grounds, fuel prices, the prices of other
supplies, and fish abundance levels. We expect fishing costs to be lower where stocks are
higher, ceteris paribus.
We estimated a number of different specifications including unweighted and weighted
models using both a logged dependent variable (hereafter the “LLM” Model) and an
untransformed dependent variable (hereafter the “LM” Model). Because we have no economic
rationale for preferring one dependent variable formulation over the other, we use comparable R2
statistics to identify the preferred specification, and find that the LM is preferred (Wooldridge
2012). 21
Therefore, in the remainder of the paper, we present the results of the LM model, but
include a parallel set of results in the Appendix for the LLM model.
In terms of weighting, we focus our discussion on the estimates that put greater weight on
the larger transactions in the larger markets.22
Smaller markets are less important for the fishery
both from an economic and ecological point of view and often have few transactions. To put
more weight on the transactions from the larger markets, we weight the quota prices by the size
19 For our analysis, the year is divided into five periods, a pre-fishing season, three approximately three-month
fishing seasons (Spring, Summer, and Fall), and a post-fishing season. Alternative seasonal time period
specifications were tried, such as monthly dummies, but none impacted the restrictions coefficients of interest.
20 We take the area TAC (cap) as given and control for it in our analysis, as the area-specific TACs “reflect the
biological distribution of the stocks of fish… retaining these separations was intended to prevent local stock
depletion” (Pautzke and Oliver 1997). Whether the combination or further splitting of TACs could increase
economic efficiency is beyond the scope of this analysis.
21 Parameter estimates for both models are provided in the Appendix. 22 Specifically, the total weight assigned to an observation is the product of a within submarket weight and a
between submarket weight. To arrive at the within submarket weight, we begin by calculating the total pounds
transferred via all the transactions in each class/blocking/area submarket. This is just the sum of the pounds in each
of the transfers in the submarket. Within the submarket, we give each transaction a within submarket weight that is
proportional to the pounds in the transaction. The between submarket weight is proportional to the
class/blocking/area share of the TAC.

Resources for the Future Kroetz, Sanchirico, and Lew
13
of the potential market (IFQ pounds in an area/class/blocking combination). Because there are
reasons to think that the price signals from larger (relative) trades within a market might be more
reliable in any given year, we also weight by size of the transaction relative to the size of all
transactions in that submarket in a year.23
The weighting approach provides a good
approximation of the value/pound reduction due to restrictions to each pound in the fishery.
For comparison purposes, we also illustrate the unweighted regression results
(specification II). The coefficients of the unweighted regression can be interpreted as the average
observed difference in transacted quota prices, after controlling for interacted year and area fixed
effects, policy changes, and seasonal effects.
By multiplying the per-pound-equivalent reductions with the size of the market (i.e.,
amount of restricted TAC pounds in each category in 2011), we obtain estimates of the total
efficiency loss. In the remainder of the paper, we focus on describing the costs of the restrictions
based on the regression results for the restrictions individually and in aggregate.
Costs of Vessel Class Restriction
In Table 3 and Figure 3, we break down the effect of the vessel class restriction by
blocking status. In the halibut market, the results suggest the Class A unblocked quota trades for
higher prices than Class B, C, and D unblocked quota by $2.63, $3.04, and $5.24, respectively.
Recall that Class A quota is the least restrictive quota across a number of dimensions, including
that it can be fished on any size of vessel, can be leased and can be owned by a company or
individual. In fact, during our timeframe, we find that all Class A quota was landed by the same
length and type of vessels as Class B quota. Therefore, the large and significant difference that
we estimate between Class A and Class B unblocked QS prices in the halibut fishery is a
measure of the economic efficiency gains associated with having an essentially unrestricted use
of the quota.
Within each vessel class, there is also blocked quota. In the halibut blocked market, we
find that the difference between the value of A blocked quota and D blocked is $4.48 and the
difference between A blocked quota and C blocked quota prices is $1.92. The difference
between halibut Class A blocked quota and halibut Class B blocked quota is not statistically
23 For example, with one restriction the weight a restricted transaction would receive would be:
𝑅𝑒𝑠𝑡𝑟𝑖𝑐𝑡𝑒𝑑 𝑇𝐴𝐶
𝑅𝑒𝑠𝑡𝑟𝑖𝑐𝑡𝑒𝑑+𝑈𝑛𝑟𝑒𝑠𝑡𝑟𝑖𝑐𝑡𝑒𝑑 𝑇𝐴𝐶∗
𝑃𝑜𝑢𝑛𝑑𝑠 𝑖𝑛 𝑡𝑟𝑎𝑛𝑠𝑎𝑐𝑡𝑖𝑜𝑛
𝑇𝑜𝑡𝑎𝑙 𝑟𝑒𝑠𝑡𝑟𝑖𝑐𝑡𝑒𝑑 𝑝𝑜𝑢𝑛𝑑𝑠 𝑡𝑟𝑎𝑛𝑠𝑓𝑒𝑟𝑟𝑒𝑑.

Resources for the Future Kroetz, Sanchirico, and Lew
14
significant. This result could stem from a number of factors, but most likely is due to the limited
Class A blocked halibut quota allocated and even fewer trades.
In the sablefish market, we find that unblocked Class B and C quota trades approximately
$1.39 and $1.61 lower per pound than Class A unblocked quota, respectively. Blocked B and C
quota trade $2.52 and $3.07 below A blocked quota. Within both the halibut and sablefish
unblocked and blocked categories there is overlap in the confidence intervals between the Class
B and Class C coefficients (Figure 3). It could be that there is not a large difference in
profitability between the two sizes of vessel.
Costs of Blocking Restriction
Table 3 and Figure 3 also include statistics summarizing the effect of the blocking
restriction broken down by vessel class. We find for the halibut market that Class A blocked
quota trades at approximately $3.31 less than Class A unblocked quota, B blocked is lower than
B unblocked by $1.55, C blocked lower than C unblocked by $2.19, and D blocked lower than D
unblocked by $2.54. In the sablefish market, we find that B blocked quota is $1.90 lower than B
unblocked, and C blocked trades $2.23 lower than C unblocked.
Generally, our regression results suggest blocked quota trades at lower prices relative to
unblocked quota. The one exception is in the sablefish Class A market. This result is not
surprising given that there is so little blocked quota allocated, and similarly, so few transactions.
Furthermore, because every participant may hold up to one block of quota and still hold
unblocked quota, it is possible the blocking restriction on Class A quota has little impact.
Total Cost of Restrictions
In addition to calculating the cost of the blocking and vessel class restriction for each
possible combination, we can aggregate these costs based on the size of the market to arrive at
estimates of the total efficiency loss due to the set of restrictions (see Table 4). We do this by
calculating a linear combination of the coefficients on the restriction dummy variables and the
associated restricted TAC.
We estimate that including restrictions in the ITQ program design decreased the present
value of resource rent over the lifetime of the program by approximately $117 million for halibut
and $39 million for sablefish (in $2012 USD), relative to a hypothesized case where the
restrictions were not included in the program design. To aid in the understanding of these
Resources for the Future Kroetz, Sanchirico, and Lew
15
numbers we also present the total costs of restrictions as a percentage of total resource rent.24
We
find that including the restrictions resulted in a reduction in resource rent of 25% (36%) and 9%
(10%) in the halibut and sablefish fisheries respectively, when calculated for year 2011 (2000).
Additionally, we provide separate estimates for the total impact of the class restriction
and for the total impact of the blocking restrictions (Table 4). In the halibut fishery we estimate
a reduction in resource rent due to the class restriction equal to $73 million USD. We estimate
the impact of the blocking restriction on resource rent to be a reduction of approximately $28
million, or about 40% as large as the impact of the class restriction.25
In the sablefish fishery the
impact on resource rent due to restrictions is dominated by the class restriction, with a total
reduction in resource rent associated with these restrictions of $36 million relative to an $8
million reduction in resource rent attributable to the blocking restriction.
Robustness Checks
In this section, we explore the robustness of our results to different weighting schemes
under similar parametric assumptions26
and in a non-parametric analysis (local linear regression).
Our intent is to present results that follow directly from several sets of valid justifications and
explore the robustness of our results. We find the preferred model results are robust to a number
of specifications and approaches.
Parametric Robustness Checks
We explore weighting schemes based on two different criteria: the first is market size and
the second is the size of the transaction. Additionally, for each weighting scheme, we test the
assumption that there is a statistically significant change in the difference throughout the
program.27
24 We estimate the total resource rent using the mean values of variables such as the area and season where
appropriate. We then calculate the percentage reduction in resource rent as the estimated resource rent with
restrictions in place divided by the total estimated unrestricted rent.
25 Note that the total impact does not equal the sum of the class and the blocking impacts due to the presence of
significant classblocking interaction terms.
26 An alternative model is to formulate a regression without the year and area interacted dummy variables and
instead include variables related to the underlying factors that change through time that may influence quota prices.
We present the results with year and area interacted dummy variables as our primary results because they are more
parsimonious and the fit is similar. 27 Specifically, we rerun the analysis using subsets of the data corresponding to early and later periods in the
program. We find that the signs and magnitudes of the coefficients are generally similar and the overall estimates of
the costs of the restrictions do not differ significantly.

Resources for the Future Kroetz, Sanchirico, and Lew
16
Market Size Only
We explore the impact of assigning each transaction within a submarket equal weight; the
between submarket weight is proportional to the class/blocking/area share of the TAC, and is the
same as in the preferred specification. There are differences in some cases in the magnitude and
statistical significance of the parameter coefficients and point estimates of the costs of the
blocking and vessel class restrictions (see Table A3 in the Appendix). However, we find that the
confidence intervals for this and our preferred specification of the total impacts are overlapping
(see Table A4 in the Appendix).
Transaction Size
To account for the volume transacted (including exploring the impact of block size) on
our estimates of the costs of restrictions, we estimate a model weighting each observation
according to the number of pounds in the transaction (with no between submarket weights). The
rationale for pound-weighted models is that if the quota price differs according to transaction or
block size, then changing the weight given to the transactions will change the coefficient
estimates on the blocking dummy variables. The result is that the coefficients on the restriction
dummy variables represent the average difference in the price per pound per pound transacted.
As with the submarket size weighting scheme, we do find differences in the estimated impacts
for the blocking and vessel class restrictions but they are all the same sign and similar magnitude
as our preferred model (Table 3), and confidence intervals for the total costs of restrictions
overlap with those of the preferred model (Table 4).
Nonparametric Analysis
Our assumption that average differences in restricted and unrestricted quota prices are
sufficient to characterize efficiency losses would fail if there is a clear trend in the difference
over time (for example the difference systematically increases or decreases over time). To
explore this assumption we concentrate on the densest submarkets in order to generate
nonparametric estimates of the restricted and unrestricted quota prices over time using a local
linear regression with epanechnikov weights and a fixed bandwidth (window) of 12 months.28
28 When estimating the non-parametric fitted curve at a particular point, this choice of kernel and bandwidth gives
higher weight to observations that occur closer in time within the window and zero weight outside the window.
Using a window of 12 months provides a nice balance between the comparability of the prices and having a large
enough window to ensure adequate market activity.

Resources for the Future Kroetz, Sanchirico, and Lew
17
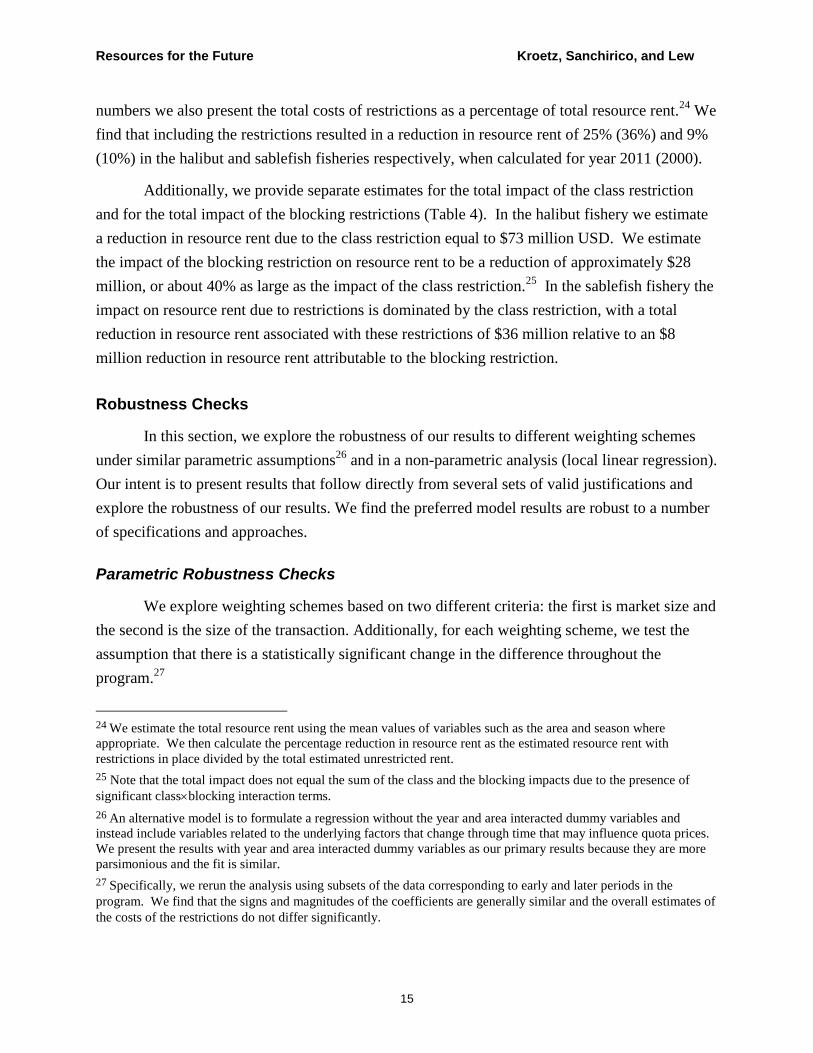
We present the restricted and unrestricted quota prices along with 95% confidence
intervals in Figure 4 for two example markets: 3A Class C blocked versus unblocked and SE
Class C blocked versus unblocked.29
The nonparametric curves were fit at 100 equally-spaced
points during the 2000-2011 time period. The confidence intervals were constructed by re-
estimating the nonparametric curve after removing a random subset of observations. For the
results we present, we randomly chose 10% of observations to remove and replicated the
procedure where we remove 10% of the observations randomly 5,000 times.30
The confidence
bands are calculated for each point of the function-evaluation, and are calculated as the
observation in the lowest 2.5th percentile of the fitted values of the replicate curves and the
97.5th
percentile observation. Figure 4 also includes the original quota prices that are used to
estimate the two (restricted and unrestricted) curves.
The nonparametric results suggest there are not significant changes to the differences in
restricted and unrestricted prices over time. Figures 4a and 4b corroborate our regression results;
the 95% confidence interval of the difference in prices attributable to the blocking restriction
implied by the fitted curves contains the point estimates from the parametric models.31
Furthermore, our non-parametric modeling (Figure A2c in the Appendix) is also suggestive of
the fact that there may not be a significant difference between Class B and Class C prices.
Conclusions and Discussion
TPPs are policy instruments that have the potential to achieve economic efficiency.
However, theoretical efficiency gains may not be realized in practical applications, which
necessitates evaluation of the actual performance of TPPs (Hahn 1984).
On their own, TPPs can create additional economic value; however, as we have shown,
the design can influence returns. Across all of our models and the time period 2000-2011, the
estimated total cost of including restrictions in the ITQ program design is on the order of 10-35%
29 We also include estimates for the 2C Class C blocked versus unblocked, 2C blocked Class C versus Class D, and
3A unblocked Class B versus Class C markets in Figure A2 in the Appendix.
30 Our result that the difference between restricted and unrestricted quota prices does not show a significant trend
over time is robust to the choice of the percentage of observations to omit, although obviously we cannot omit
relatively large percentages and still estimate the curve. Our result is also robust to the number of points of
evaluation. 31 We calculate the difference between the two fitted curves and bootstrap, with replacement, to estimate an average
difference and a 95% confidence interval. We find that halibut 3A Class C blocked quota trades for approximately
$4.22 USD lower than unblocked (95% CI -$6.41, -$1.69). Sablefish SE Class C blocked quota trades for
approximately $2.90 USD lower than unblocked (95% CI -$5.13, -$0.92).

Resources for the Future Kroetz, Sanchirico, and Lew
18
of the total resource rent. Better informed decisions can be made if estimates of the costs of
various types of restrictions are available and can be weighed against the potential benefits.
Several important areas of research remain that could help refine estimates of the costs of
restrictions in the halibut and sablefish TPP. First, we estimated the equilibrium cost but the
total costs of the restrictions needs to consider the costs in each year, which is dependent on how
the restrictions impact the adjustment path of capital in the fishery. Developing the necessary
counterfactual (what the adjustment path would have looked like without the restrictions) will
entail estimation of a dynamic discrete choice model of entry/exit decisions of quota owners.
Such a model will also allow for the quantification of potential benefits such as the change in
number of vessels and crew fishing, and crew income. Second, in this paper we examine several
types of restrictions, but do not go into detail about how the restrictions may interact with one
another and how these interactions may also impact economic efficiency. Third, while we
focused on direct impacts of restrictions, restrictions may also impact economic efficiency
indirectly through increased transaction costs (Hahn 1984, Stavins 1995, Fowlie and Perloff
2013). How transaction costs affect participation in and subsequently the efficiency of these
markets seems like an important area for further study.
Furthermore, we control for the area in our analysis, but we do not attempt to estimate its
impact on current and future fishery profit. Other contexts where spatial heterogeneity in location
(of extraction or pollution) is important include groundwater use, water quality, and air pollution
(see e.g. Seskin, Anderson Jr and Reid (1983), Farrow et al. (2005), Lankoski et al. (2008), and
Muller and Mendelsohn (2009)). In the fisheries context, a spatially differentiated management
structure may outperform a homogenous management structure (one area) in terms of efficiency,
if the population is indeed spatially differentiated and depending on the degree to which the area
designations account for the underlying population structure. We leave for further analysis a
quantitative assessment of optimal management area choice, optimal setting of TACs, and the
impact of these choices on profitability.
Our results are relevant for the design and assessment of TPPs attempting to achieve
multiple objectives through the imposition of trading restrictions. One common type of
restriction is the creation of sectors (akin to vessel classes in our analysis) within a broader
trading scheme for the same resource or pollutant, between which there are barriers to trade (or
between which trading is completely restricted). Sectors can include industrial sectors; for
example, in recently implemented Chinese carbon programs sectors including transportation,
water, hotels, restaurants, and public institutions are included in some but not all of the programs
(see e.g. Munnings et al. (2014)).

Resources for the Future Kroetz, Sanchirico, and Lew
19
Additionally, new potential applications of TPPs are being proposed, including the
management of habitat (Wissel and Watzold 2010), biodiversity (Gunningham and Young 1997),
and agrobiodiversity losses associated with land cover changes (Pascual and Perrings 2007).
With more TPPs being proposed and implemented worldwide, it is likely the implementation of
restrictions within TPPs will continue in the future.
This work is also relevant in light of the emphasis in fishery management programs on
non-efficiency objectives, including vibrant coastal communities, maintaining the culture of
fishing communities, and healthy ocean ecosystems. Non-efficiency goals often relate to the
distribution of the benefits and costs of management changes (see e.g. Wilen (2013) for a
discussion of the political economy of small-scale artisanal fishery management reforms).
Recent policies such as a mandate under the Magnuson Stevens Act National Standard 8 have
begun to require that the design and evaluation of management policies take into account the
impact of management changes on fishing jobs and communities. In turn, researchers have
begun to evaluate non-efficiency goals. For example, community-level changes are being
evaluated by creating indices of vulnerability, resilience, and participation (see e.g. Himes-
Cornell and Kasperski (2015) and Sethi, Reimer and Knapp (2014)).
When multiple management goals exist, using a single policy instrument to accomplish
all of the goals simultaneously poses challenges for policy design and can reduce the economic
efficiency of the policy (see e.g. Péreau, Little and Thébaud (2012) for a general discussion and
analysis of the challenge of designing ITQs to meet multiple objectives). Empirical analyses,
such as the analysis in this paper, are necessary to provide decision-makers with quantitative
estimates of tradeoffs between economic efficiency and non-efficiency goals.

Resources for the Future Kroetz, Sanchirico, and Lew
20
References
Abbott, Joshua K. and James E. Wilen. 2010. Voluntary cooperation in the commons?
Evaluating the sea state program with reduced form and structural models. Land
Economics 86(1): 131-154.
Bai Chongen, Qi Li and Min Ouyang. 2014. Property taxes and home prices: A tale of two cities.
Journal of Econometrics 180(1): 1-15.
Boyd, James, Dallas Burtraw, Alan Krupnick, Virginia Mcconnell, Richard G Newell, Karen
Palmer, James N Sanchirico and Margaret Walls. 2003. Trading cases: Is trading credits
in created markets a better way to reduce pollution and protect natural resources?
Environmental Science & Technology 37(11): 216A-223A.
Call, Isabel and Daniel K. Lew. 2014. Tradable permit programs: What are the lessons for the
new Alaska halibut catch sharing plan? Marine Policy Forthcoming.
Carothers, Courtney. 2013. A survey of us halibut IFQ holders: Market participation, attitudes,
and impacts. Marine Policy 38: 515-522.
Chattopadhyay, Raghabendra and Esther Duflo. 2004. Women as policy makers: Evidence from
a randomized policy experiment in india. Econometrica 72(5): 1409-1443.
Clark, Colin W. 1980. Towards a predictive model for the economic regulation of commerical
fisheries. Can. J. Fish. Aquat. Sci. 37: 1111-1129.
Clark, Colin W. 1985. Bioeconomic modelling and fisheries management. New York, John
Wiley & Sons.
Clark, Colin W. 2005. Mathematical bioeconomics: Optimal management of renewable
resources. Hoboken, New Jersey, Wiley-Interscience.
EPRI. 2013. Exploring the interaction between california’s greenhouse gas emissions cap-and-
trade program and complementary emissions reduction policies, Electric Power Research
Institute.
Farrow, R Scott, Martin T Schultz, Pinar Celikkol and George L Van Houtven. 2005. Pollution
trading in water quality limited areas: Use of benefits assessment and cost-effective
trading ratios. Land Economics 81(2): 191-205.
Fissel, Ben, Michael Dalton, Ron Felthoven, Brian Garber-Yonts, Alan Haynie, Amber Himes-
Cornell, S. Kasperski, Jean Lee, Daniel Lew, Lisa Pfeiffer, Jennifer Sepez and Chang
Seung. 2012. Stock assessment and fishery evaluation report for the groundfish fisheries
of the Gulf of Alaska and Bering Sea/Aleutian islands area: Economic status of the

Resources for the Future Kroetz, Sanchirico, and Lew
21
groundfish fisheries off alaska, 2011. National Marine Fisheries Service. Alaska Fisheries
Science Center, National Oceanic and Atmospheric Administration. Seattle, Washington.
Fowlie, Meredith and Jeffrey M Perloff. 2013. Distributing pollution rights in cap-and-trade
programs: Are outcomes independent of allocation? Review of Economics and Statistics
95(5): 1640-1652.
Gangadharan Lata. 2000. Transaction costs in pollution markets: An empirical study. Land
Economics 76(4).
Gangadharan, Lata. 2004. Analysis of prices in tradable emission markets: An empirical study of
the regional clean air incentives market in Los Angeles. Applied Economics 36(14):
1569-1582.
Grafton, R. Quentin, Dale Squires and Kevin J. Fox. 2000. Private property and economic
efficiency: A study of common-pool resource. The Journal of Law & Economics 43(2).
Grafton, R. Quentin, Harry W. Nelson and Bruce Turris. 2005. How to resolve the class II
common property problem? The case of British Columbia’s multi-species groundfish
trawl fishery. Australian National University. Economics and Environment Network
Working Paper EEN0506.
Gunningham, Neil and Mike D Young. 1997. Toward optimal environmental policy: The case of
biodiversity conservation. Ecology LQ 24: 243.
Hahn, Robert W. 1984. Market power and transferable property rights. The Quarterly Journal of
Economics 99(4).
Haynie, Alan C. and David F. Layton. 2010. An expected profit model for monetizing fishing
location choices. Journal of Environmental Economics and Management 59(2): 165-176.
Himes-Cornell, Amber and Stephen Kasperski. 2015. Assessing climate change vulnerability in
alaska's fishing communities. Fisheries Research 162: 1-11.
Homans, Frances R. and James E. Wilen. 1997. A model of regulated open access resource use.
Journal of Environmental Economics and Management 32(1): 1-21.
Kerr, Suzi and David Mare. 1998. Transaction costs and tradable permit markets: The united
states lead phaseout.
Kroetz, Kailin and James N. Sanchirico. 2009. Economic insights in the costs of design
restrictions in ITQ programs, Resources for the Future Report.

Resources for the Future Kroetz, Sanchirico, and Lew
22
Lankoski, Jussi, Erik Lichtenberg and Markku Ollikainen. 2008. Point/nonpoint effluent trading
with spatial heterogeneity. American Journal of Agricultural Economics 90(4): 1044-
1058.
Muller, Nicholas Z and Robert Mendelsohn. 2009. Efficient pollution regulation: Getting the
prices right. The American Economic Review: 1714-1739.
Munnings, Clayton, Richard Morgenstern, Zhongmin Wang and Xu Liu. 2014. Assessing the
design of three pilot programs for carbon trading in China. Discussion Paper.
Washington, DC, Resources for the Future. RFF DP 14-36.
Newell, Richard G., Kerry L. Papps and James N. Sanchirico. 2007. Asset pricing in created
markets. American Journal of Agricultural Economics 89(2): 259-272.
Newell, Richard G., James N. Sanchirico and Suzi Kerr. 2005. Fishing quota markets. Journal of
Environmental Economics and Management 49(3): 437-462.
NMFS RAM. 2010a. Halibut estimated ex-vessel prices, 1992-2010. Restricted Access
Management, National Marine Fisheries Service.
NMFS RAM. 2010b. Sablefish estimated ex-vessel prices, 1992-2010. Restricted Access
Management, National Marine Fisheries Service.
NOAA. 2010. NOAA Catch Share Policy, Available:
http://www.nmfs.noaa.gov/sfa/domes_fish/catchshare/docs/noaa_cs_policy.pdf.
NRC. 1999. Sharing the fish: Toward a national policy on individual fishing quotas.
Washington, DC, National Academy Press.
Pascual, U. and C. Perrings. 2007. Developing incentives and economic mechanisms for in situ
biodiversity conservation in agricultural landscapes. Agriculture, Ecosystems &
Environment 121(3): 256-268.
Pautzke, Clarence G. and Chris W. Oliver. 1997. Development of the individual fishing quota
program for sablefish and halibut longline fisheries off alaska. North Pacific
Management Council. Anchorage, Alaska, Presented September 4, 1997, to the National
Research Council's Committee to Review Individual Fishing Quotas.
Péreau, J.-C., L. Doyen, L. R. Little and O. Thébaud. 2012. The triple bottom line: Meeting
ecological, economic and social goals with individual transferable quotas. Journal of
Environmental Economics and Management 63(3): 419-434.

Resources for the Future Kroetz, Sanchirico, and Lew
23
Pizer, William, Dallas Burtraw, Winston Harrington, Richard Newell and James Sanchirico.
2006. Modeling economy-wide vs sectoral climate policies using combined aggregate-
sectoral models. The Energy Journal: 135-168.
RAM. 2012. Pacific halibut – sablefish IFQ report: Fishing year 2011. Restricted Access
Management (RAM) Division NOAA’s National Marine Fisheries Service (NMFS).
Juneau, AK.
Scheld, Andrew M., Christopher M. Anderson and Hirotsugu Uchida. 2012. The economic
effects of catch share management: The Rhode Island fluke sector pilot program. Marine
Resource Economics 27(3): 203-228.
Sethi, Suresh Andrew, Matthew Reimer and Gunnar Knapp. 2014. Alaskan fishing community
revenues and the stabilizing role of fishing portfolios. Marine Policy 48: 134-141.
Shabman, Leonard 2004. Compensation for the impacts of wetlands fill: The us experience with
credit sales. Proceedings of the OECD workshop on ex post evaluation of tradable
permits: methodological and policy issues.
Singh, Rajesh, Quinn Weninger and Matthew Doyle. 2006. Fisheries management with stock
growth uncertainty and costly capital adjustment. Journal of Environmental Economics
and Management 52(2): 582-599.
Smith, Martin D., Junjie Zhang and Felicia C. Coleman. 2006. Effectiveness of marine reserves
for large-scale fisheries management. Canadian Journal of Fisheries and Aquatic
Sciences 63(1): 153-164.
Stavins, Robert N. 1995. Transaction costs and tradeable permits. Journal of Environmental
Economics and Management 29(2): 133-148.
Tietenberg, Tom. 2007. Tradable permits in principle and practice. Moving to markets in
environmental regulation. J. Freeman and C. Kolstad. Oxford, Oxford University Press:
63-94.
Weninger, Quinn R. and Richard E. Just. 1997. An analysis of transition from limited entry to
transferable quota: Non-marshallian principles for fisheries management. Natural
Resource Modeling 10: 20.
Wilen, James E. 2005. Property rights and the texture of rents in fisheries. Evolving property
rights in marine fisheries: 49-67.
Wilen, James E. 2013. The challenges of pro-poor fisheries reform. Marine Resource Economics
28(3): 203-220.

Resources for the Future Kroetz, Sanchirico, and Lew
24
Willmann, R. 2000. Group and community-based fishing rights Use of Propery Rights in
Fisheries Management. Proceedings of the FishRights99 Conference, Fremantle, Western
Australia, FAO Fisheries Technical Paper.
Wissel, Silvia and Frank Watzold. 2010. A conceptual analysis of the application of tradable
permits to biodiversity conservation. Conservation Biology 24(2): 404-411.
Wooldridge, Jeffrey. 2012. Introductory econometrics: A modern approach, Cengage Learning.

Resources for the Future Kroetz, Sanchirico, and Lew
25
Figures and Tables
Figure 1. Average Quota Price by Vessel Category ($2012) (unweighted averages by year)
(a) Halibut (b) Sablefish
Figure 2. Average Quota Price by Blocking Status ($2012) (unweighted averages by year)
(a) Halibut (b) Sablefish
$10
$15
$25
$20
2000 2001 2002 2003 2004 2005 2006 2007 2008 2009 2010 2011
Year
Blocked Unblocked
$10
$15
$20
2000 2001 2002 2003 2004 2005 2006 2007 2008 2009 2010 2011
Year
Blocked Unblocked
$10
$15
$20
2000 2001 2002 2003 2004 2005 2006 2007 2008 2009 2010 2011
Year
Blocked Unblocked

Resources for the Future Kroetz, Sanchirico, and Lew
26
Figure 3. Difference between Restricted and Unrestricted Quota Prices ($2012) (impact of the class and blocking restrictions)
(a) Halibut Class (b) Halibut Blocking
(c) Sablefish Class (d) Sablefish Blocking
Resources for the Future Kroetz, Sanchirico, and Lew
27
Figure 4. Nonparametric Estimation of Restricted (Blocked) and Unrestricted (Unblocked) Quota Prices ($2012)
(a) Halibut Area 3A Class C
(b) Sablefish Area SE Class C
2000 2001 2002 2003 2004 2005 2006 2007 2008 2009 2010 2011 2012$5
$10
$15
$20
$25
$30
$35
$40
Year
Blocked
Unblocked
2000 2001 2002 2003 2004 2005 2006 2007 2008 2009 2010 2011 2012$0
$5
$10
$15
$20
$25
$30
$35
Year
Blocked
Unblocked
Resources for the Future Kroetz, Sanchirico, and Lew
28
Table 1. 2011 TAC by Vessel Class and Blocking Combination
Halibut Sablefish
Vessel
Class Unblocked Blocked Total Unblocked Blocked Total
A 2% 1% 3% 20% 2% 22%
B 32% 10% 42% 35% 6% 41%
C 21% 27% 48% 29% 8% 37%
D 1% 6% 7% -- -- --
Total 55% 45% 100% 84% 16% 100%
Note: The vessels sizes that correspond to the classes differ between the fisheries, where in Halibut A is
unrestricted, B is length >60ft, C is length 35-60 feet, and D is length <35ft. In the Sablefish fishery there are
only three classes: A is unrestricted, B is >60 feet, and C is <60 feet.
Table 2. Summary of Transactions
Halibut Sablefish
Buyers Unique 1,269 491
Yearly ave. 165 65
Min. 82
(2009)
43
(2009)
Max. 225
(2001)
104
(2003)
Sellers Unique 1,921 584
Yearly ave. 197 69
Min. 92
(2009)
50
(2009)
Max. 258
(2001)
104
(2003)
Transactions Ave. size (lbs) 6,678 9,997
Median size (lbs) 4,975 3,545

Resources for the Future Kroetz, Sanchirico, and Lew
29
Table 3. Change in Quota Prices due to Blocking and Vessel Class Restrictions (in $2012): LM Modela
[I]
Equal Weight for each Pound Transacted within an
Area/Class/Blocking Combinationb
[II]
Unweighted
Halibut Sablefish Halibut Sablefish
IMPACT OF CLASS RESTRICTION ON UNBLOCKED QUOTA PRICES
B Unblocked -2.627*** -1.389*** -3.537*** -1.862***
(0.412) (0.530) (0.757) (0.389)
C Unblocked -3.042*** -1.613** -1.814** -1.523***
(0.435) (0.650) (0.762) (0.390)
D Unblocked -5.239*** NA -7.13*** NA
(0.746) (0.914)
IMPACT OF CLASS RESTRICTION ON BLOCKED QUOTA PRICES
B Blocked -0.869 -2.518*** -1.768 -2.804***
(0.603) (0.261) (1.160) (0.344)
C Blocked -1.92*** -3.071*** -2.539** -3.637***
(0.617) (0.296) (1.160) (0.356)
D Blocked -4.475*** NA -5.897*** NA
(0.624) (1.166)
IMPACT OF BLOCKING RESTRICTION
Class A -3.308*** -.771 -2.65* -.959**
(0.713) (0.470) (1.365) (0.467)
Class B -1.55*** -1.899*** -.882*** -1.901***
(0.195) (0.195) (0.277) (0.213)
Class C -2.185*** -2.229*** -3.376*** -3.072***
(0.257) (0.249) (0.258) (0.189)
Class D -2.543*** NA -1.417** NA
(0.665) (0.574)
a. The coefficients should be interpreted as absolute changes in real quota price. A negative coefficient implies the restricted quota price is below that of the
unrestricted quota price. The unblocked (blocked) class restriction coefficients represent the difference between unblocked (blocked) Class B, C, and D unblocked
(blocked) quota relative to Class A unblocked (blocked) quota. The blocking restriction coefficients represent the difference between blocked and unblocked quota
in each vessel class. The standard errors of the coefficients are below the coefficients.
b. The combination is weighted by the average yearly percentage of the TAC.

Resources for the Future Kroetz, Sanchirico, and Lew
30
Table 4. Aggregate Change in Resource Rent due to Restrictions (in $million)a
Halibut Sablefish
Point Estimate
(95% Conf. Interval)
TOTAL (CLASS AND BLOCKING)
[I] Equal Weight for each Pound Transacted within an Area/Class/Blocking Combinationb -117.3
(-139.7, -94.9)
-39.5
(-62.7, -16.3)
[II] Unweighted -120.5
(-162.8, -78.2)
-45.7
(-60.9, -30.5)
CLASS ONLY
[I] Equal Weight for each Pound Transacted within an Area/Class/Blocking Combinationb -73.1
(-93.2, -53.0)
-36.2
(-56.1, -16.3)
[II] Unweighted -85.1
(-122.8, -47.4)
-41.6
(-54.4, -28.8)
BLOCKING ONLY
[I] Equal Weight for each Pound Transacted within an Area/Class/Blocking Combinationb -28.3
(-33.4, -23.1)
-8.2
(-9.4, -7.1)
[II] Equal Weight Per Transaction -33.8
(-38.7, -28.8)
-10.2
(-11.3, -9.0)
a. Negative numbers imply lower resource rent
b. The combination is weighted by the average yearly percentage of the TAC

Resources for the Future Kroetz, Sanchirico, and Lew
31
Appendix. Extended Data Description
Quota Transaction Data
Under a confidentiality agreement with the National Marine Fisheries Service, Alaska
Region Restricted Access Management (RAM) Division, we acquired primary data on quota
transactions. The dataset covers all of the transactions that occurred since the program’s
inception in January 1995 through the end of the 2011 fishing year.
There are a large number of holders of both blocked and unblocked quota. In the halibut
fishery in 2011 there were 2,455 registered owners of blocked quota and 640 of unblocked. In
2011 in the sablefish fishery there where 663 registered owners of blocked quota and 449 of
unblocked.
Information describing the transactions includes: the transaction date, the NMFS ID for
both the buyer and the seller, addresses of the buyer and the seller, information on the price
paid/received,32
the amount of IFQ pounds and QS units in the transfer, the reason for the
transfer, information on how the buyer and seller found one another, details on the relationship
(if any) between the buyer and seller, and details of the quota transacted (e.g., species, area,
vessel class, blocked or unblocked, and fishdownable). We are also able to identify lease
transactions. Lease transactions include only IFQ pounds and include no QS. Given the
restrictive conditions under which lease transaction may occur, very few leases do occur, and
therefore we do not use the lease data in our analysis.
We use data from the 2000-2011 fishing years. During this period 7,584 halibut quota
transactions and 3,085 sablefish quota transactions took place. Eliminating records with no price
listed left 4,869 halibut transactions and 2,158 sablefish transactions. Using the information
provided about each transaction we were able to eliminate administrative transfers, transactions
between family members, gifts, trades, transactions where payment was based on a percentage of
vessel profits, and lease of IFQ pounds. This left 4,256 halibut and 1,775 sablefish transactions.
Finally, we observed the price distribution to detect any potential entry errors. We eliminated
32 We adjust the prices to account for inflation using the producer price index (PPI). All the summary statistics and
analysis we do use these real prices.

Resources for the Future Kroetz, Sanchirico, and Lew
32
one sablefish record with a price over $100/pound-equivalent. Finally, we eliminate 215 halibut
transactions and 101 sablefish transactions due to inconsistency across fields. Specifically, we
eliminate transactions where the total transaction price differs depending on the method we use
to calculate it.
The standard in the fishery is to report a “pound-equivalent” quota price (hereafter quota
price), which is equal to the total transaction price (the value of the IFQ pounds plus the value of
the QS units) divided by the IFQ pounds in the transaction. By dividing the reported quota value
by the number of IFQ pounds, the quota price is comparable across areas, which have different
TAC levels.33
The class and/or blocking restrictions impact a substantial portion of the quota. In the
halibut fishery, the four vessel classes and two blocking statuses together create eight different
vessel class and blocking combinations. In the sablefish fishery, there are three vessel classes
and two blocking statuses resulting in six vessel class and blocking combinations. The allocation
of quota across these combinations has varied to some extent over the years. Using the 2011
TAC allocation as an example, Table 1 in the main text illustrates that the distribution of halibut
quota in 2011 is non-uniform with the B and C vessel classes receiving 42% and 48%,
respectively. On the other hand, the vessel class allocations in sablefish are more uniformly
distributed than halibut, but the amount of blocked (84%) versus unblocked (16%) quota is
skewed, while it is more evenly distributed in halibut.
CFEC Ex-vessel Price Data
Ex-vessel prices are difficult to estimate because fishermen often have relationships with
processors and negotiate contracts to receive compensation in different ways. For example,
often compensation is received at dates later than the landings date - sometimes when the
processor actually sells the fish. The variability in compensation results in self-reported raw fish
ticket price data being problematic. Therefore, we rely on the Alaskan Commercial Fisheries
Entry Commission’s (CFEC) estimated ex-vessel prices. These CFEC estimates are available in
a confidential landings database and address some of the issues with the reporting of prices.
33 Using the IFQ pounds in this calculation is potentially problematic if fishermen have expectations that future
TACs, and therefore the later allocation of IFQ pounds associated with each QS unit, will differ substantially from
the current one.

Resources for the Future Kroetz, Sanchirico, and Lew
33
Other Data
We use data on fuel oil prices from the Pacific States Marine Fisheries Commission
(http://www.psmfc.org/efin/data/fuel.html#REPORTS). We also obtained confidential data on
the amount fished in each year, area, and vessel class combination from RAM. Together with
the yearly issuance data, we can approximate the percent of the TAC remaining to be fished for
each area and vessel class combination throughout the year. The within-season variation in the
supply of IFQ pounds available for purchase can help control for within-season changes in the
quota price that otherwise might be attributed to the particular restrictions.
Extended Program Description
In this section we highlight 3 key types of changes that have occurred over the course of
the program:
1. Since 1995, the QS restrictions on vessel length were relaxed several times due to
safety concerns and problems with fully harvesting the quota in certain area/vessel
class categories. For instance, in 1996, a fish-down provision was implemented in
both fisheries (RAM 2009b, RAM 2009a) that allows an owner holding QS
designated for a particular vessel length to fish the associated IFQ pounds on shorter
vessels (e.g., B vessel IFQ could be fished on C vessels).34
2. Up to 2007, the number of halibut and sablefish blocks that could be held was limited
to two in each fishery (RAM 2009d). In 2007, the limit on the maximum number of
halibut QS blocks that an individual or entity may hold was increased to three (50
CFR 679.42). The objective for the increase was to provide additional flexibility to
owners of blocked quota (72 FR 44795).
3. In 2005, the managers relaxed the area-specific quota for halibut Area 4C by letting
4C quota be harvested in either Area 4C or 4D (Restricted Access Management
34 Initially, the fish-down provisions were not instituted in area 2C and the Southeast (SE) area for the halibut and
sablefish fishery, respectively. In Area 2C, fish-down was restricted to only those who held relatively small blocks
of quota (Restricted Access Management (RAM) Division, 2009a). In the SE fish-down of IFQ pounds was also
only allowed for smaller-sized blocks (Restricted Access Management (RAM) Division, 2009b). The rules in area
2C and SE were relaxed in 2007 to be consistent with the rules in the other areas (RAM 2009c). In 2007, a “fishing
up” provision in halibut areas 3B and 4C was instituted, where Class D IFQ pounds could now be used on Class C
vessels (RAM 2009c).
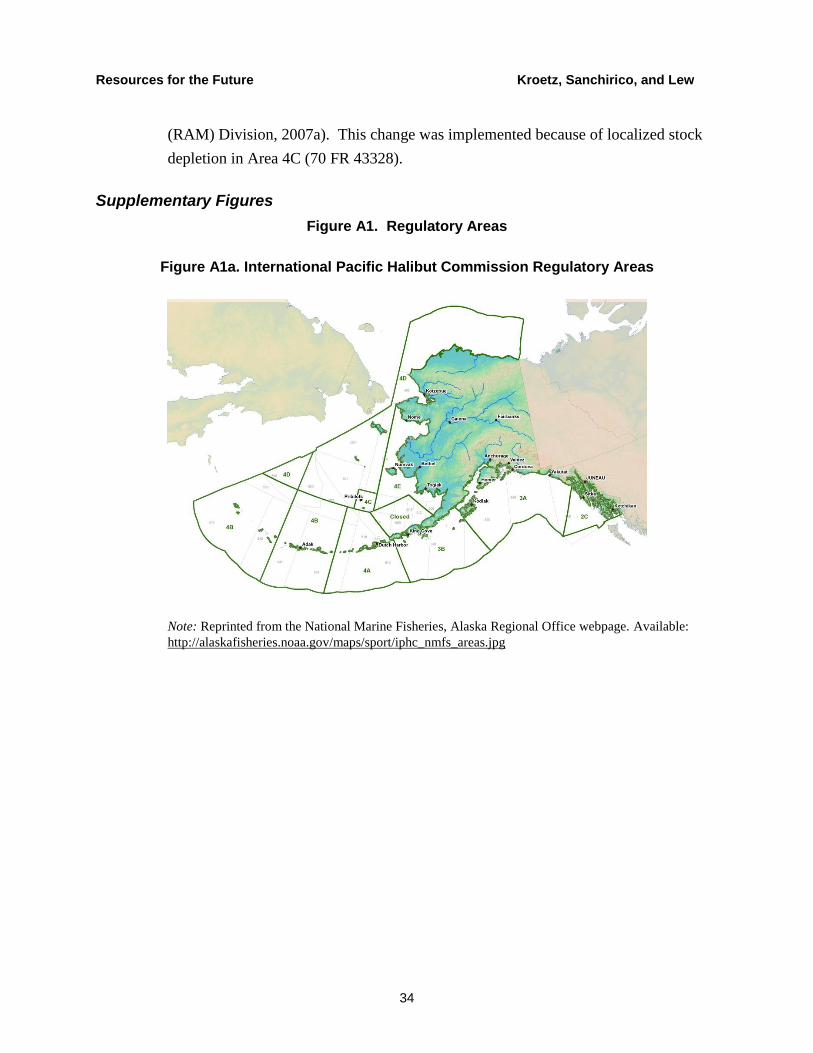
Resources for the Future Kroetz, Sanchirico, and Lew
34
(RAM) Division, 2007a). This change was implemented because of localized stock
depletion in Area 4C (70 FR 43328).
Supplementary Figures
Figure A1. Regulatory Areas
Figure A1a. International Pacific Halibut Commission Regulatory Areas
Note: Reprinted from the National Marine Fisheries, Alaska Regional Office webpage. Available:
http://alaskafisheries.noaa.gov/maps/sport/iphc_nmfs_areas.jpg

Resources for the Future Kroetz, Sanchirico, and Lew
35
Figure A1b. Sablefish Regulatory Areas
Note: Reprinted from the National Marine Fisheries, Alaska Regional Office webpage. Available:
http://alaskafisheries.noaa.gov/rr/figures/fig14.pdf

Resources for the Future Kroetz, Sanchirico, and Lew
36
Figure A2. Nonparametric Estimation of Restricted and Unrestricted Quota Prices
Figure A2a. Nonparametric Estimation of Halibut Area 2C Class C Blocked and Unblocked Quota Prices ($2012)
Figure A2b. Nonparametric Estimation of Halibut Area 2C Blocked Class C and Class D Quota Prices ($2012)
2000 2001 2002 2003 2004 2005 2006 2007 2008 2009 2010 2011 2012$0
$5
$10
$15
$20
$25
$30
$35
$40
Year
Blocked
Unblocked
2000 2001 2002 2003 2004 2005 2006 2007 2008 2009 2010 2011 2012$0
$5
$10
$15
$20
$25
$30
$35
$40
Year
Class D
Class C

Resources for the Future Kroetz, Sanchirico, and Lew
37
Figure A2c. Nonparametric Estimation of Halibut Area 3A Unblocked Class B and Class C Quota Prices ($2012)
Supplementary Tables
Table A1. Percentage of Transactions by Area
Area 2C 3A 3B 4A 4B 4C 4D
Halibut % 28% 42% 13% 10% 4% 2% 2%
Area AI BS CG SE WG WY --
Sablefish % 6% 10% 26% 29% 14% 15% --
Note: The percentages may not add to 100% due to rounding.
2000 2001 2002 2003 2004 2005 2006 2007 2008 2009 2010 2011 2012$0
$5
$10
$15
$20
$25
$30
$35
$40
$45
Year
Class C
Class B

Resources for the Future Kroetz, Sanchirico, and Lew
38
Table A2. Reduced-Form Model Output: Dependent Variable Quota Price (LM Model)
Halibut Sablefish
Variables
[I]
Equal Weight
for each
Pound
Transacted
within an
Area/Class/
Blocking
Combinationa
[II]
Equal
Weight Per
Transactio
n
[III]
Equal
Weight for
each
Transaction
within an
Area/Class/
Blocking
Combinationa
[IV]
Equal
Weight for
each Pound
Transacted
[I]
Equal
Weight for
each Pound
Transacted
within an
Area/Class/
Blocking
Combinationa
[II]
Equal
Weight Per
Transactio
n
[III]
Equal
Weight for
each
Transaction
within an
Area/Class/
Blocking
Combinationa
[IV]
Equal
Weight for
each Pound
Transacted
Blocked
(Unblocked
Omitted)
-3.307*** -2.650* -5.377*** -2.091*** -0.770 -0.958** -0.630 -0.565
(0.713) (1.365) (1.428) (0.641) (0.470) (0.467) (0.406) (0.411)
Class B
(Class A
Omitted)
-2.626*** -3.536*** -5.373*** -2.417*** -1.389*** -1.862*** -1.755*** -1.548***
(0.412) (0.757) (1.376) (0.293) (0.530) (0.389) (0.490) (0.364)
Class C -3.042*** -1.813** -3.814*** -2.609*** -1.612** -1.523*** -1.427*** -1.661***
(0.435) (0.762) (1.361) (0.351) (0.650) (0.390) (0.548) (0.483)
Class D -5.239*** -7.130*** -8.917*** -4.346*** NA NA NA NA
(0.746) (0.914) (1.526) (0.697)
Blocked &
Class B 1.757** 1.768 4.359*** 0.702 -1.128** -0.942* -1.248** -0.994**
(0.738) (1.399) (1.495) (0.671) (0.567) (0.512) (0.504) (0.469)
Blocked &
Class C 1.122 -0.725 1.920 -0.047 -1.458** -2.113*** -2.377*** -1.498***
(0.741) (1.392) (1.455) (0.679) (0.618) (0.506) (0.510) (0.512)
Blocked &
Class D 0.764 1.233 3.629** -0.852 NA NA NA NA
(0.966) (1.489) (1.605) (0.916)
Post-Season
(Fall
Omitted)
-0.607 -1.433*** -1.690* -0.555 -0.782* -0.335 -0.879* -0.522

Resources for the Future Kroetz, Sanchirico, and Lew
39
(0.890) (0.421) (1.008) (0.621) (0.407) (0.516) (0.498) (0.379)
Pre-Season -1.250*** -0.442 0.142 -0.897*** -0.314 0.639** 0.617 -0.233
(0.326) (0.293) (0.491) (0.254) (0.445) (0.285) (0.455) (0.379)
Spring -0.55193** -0.06577 0.36067 -0.48800*** -0.37447 0.43179* -0.00963 -0.26102
(0.220) (0.212) (0.379) (0.180) (0.250) (0.253) (0.351) (0.304)
Summer -0.05941 0.31163 0.91124** -0.00488 0.05536 0.60482** 0.21237 -0.03722
(0.216) (0.222) (0.373) (0.179) (0.272) (0.266) (0.409) (0.304)
Dummy for
2008 and on
blocked
quotab
-0.23052 0.25643 0.38252 -0.45228* NA NA NA NA
(0.263) (0.519) (0.561) (0.257)
Constant 16.63853*** 15.85403**
* 16.89247***
15.96104**
* 17.55090***
16.55741**
* 17.09755***
17.42781**
*
(0.468) (0.767) (1.377) (0.387) (0.664) (0.568) (0.625) (0.523)
Observations 3,138 3,138 3,138 3,138 1,263 1,263 1,263 1,263
R-squared 0.925 0.739 0.774 0.918 0.911 0.847 0.833 0.926
White hetereoskedasticity consistent standard errors in parentheses (yearxarea fixed effects omitted here to save space)
*** p<0.01, ** p<0.05, * p<0.1
a. The combination is weighted by the average yearly percentage of the TAC
b. Change from 2-3 block maximum

Resources for the Future Kroetz, Sanchirico, and Lew
40
Table A3. Blocking and Vessel Class Restriction: Change in Quota Prices due to Restrictions: Dependent Variable Quota Price (LM Model) a
Halibut Sablefish
[I]
Equal
Weight for
each Pound
Transacted
within an
Area/Class/
Blocking
Combinationb
[II]
Equal
Weight Per
Transactio
n
[III]
Equal
Weight for
each
Transaction
within an
Area/Class/
Blocking
Combinationb
[IV]
Equal
Weight for
each Pound
Transacted
[I]
Equal Weight
for each
Pound
Transacted
within an
Area/Class/
Blocking
Combinationb
[II]
Equal
Weight Per
Transactio
n
[III]
Equal
Weight for
each
Transaction
within an
Area/Class/
Blocking
Combinationb
[IV]
Equal
Weight for
each Pound
Transacted
IMPACT OF CLASS RESTRICTION ON UNBLOCKED QUOTA PRICES
B Unblocked -2.627*** -3.537*** -5.373*** -2.417*** -1.389*** -1.862*** -1.755*** -1.548***
(0.412) (0.757) (1.376) (0.293) (0.530) (0.389) (0.490) (0.364)
C
Unblocked -3.042*** -1.814** -3.814*** -2.609*** -1.613** -1.523*** -1.428*** -1.661***
(0.435) (0.762) (1.361) (0.351) (0.650) (0.390) (0.548) (0.483)
D
Unblocked -5.239*** -7.13*** -8.917*** -4.347*** NA NA NA NA
(0.746) (0.914) (1.526) (0.697)
IMPACT OF CLASS RESTRICTION ON BLOCKED QUOTA PRICES
B Blocked -0.869 -1.768 -1.013** -1.715*** -2.518*** -2.804*** -3.004*** -2.543***
(0.603) (1.160) (0.514) (0.597) (0.261) (0.344) (0.277) (0.293)
C Blocked -1.92*** -2.539** -1.894*** -2.656*** -3.071*** -3.637*** -3.805*** -3.16***
(0.617) (1.160) (0.494) (0.599) (0.296) (0.356) (0.313) (0.296)
D Blocked -4.475*** -5.897*** -5.287*** -5.199*** NA NA NA NA
(0.624) (1.166) (0.523) (0.609)
IMPACT OF BLOCKING RESTRICTION
Class A -3.308*** -2.65* -5.378*** -2.091*** -.771 -.959** -.631 -.565
(0.713) (1.365) (1.428) (0.641) (0.470) (0.467) (0.406) (0.411)
Class B -1.55*** -.882*** -1.018*** -1.389*** -1.899*** -1.901*** -1.879*** -1.56***

Resources for the Future Kroetz, Sanchirico, and Lew
41
(0.195) (0.277) (0.279) (0.204) (0.195) (0.213) (0.222) (0.198)
Class C -2.185*** -3.376*** -3.457*** -2.138*** -2.229*** -3.072*** -3.008*** -2.064***
(0.257) (0.258) (0.284) (0.252) (0.249) (0.189) (0.226) (0.214)
Class D -2.543*** -1.417** -1.748** -2.944*** NA NA NA NA
(0.665) (0.574) (0.703) (0.664)
*** p<0.01, ** p<0.05, * p<0.1
a. The coefficients should be interpreted as absolute changes in real quota price. A negative coefficient implies the restricted quota price is below that of
the unrestricted quota price. The unblocked (blocked) class restriction coefficients represent the difference between unblocked (blocked) Class B, C,
and D unblocked (blocked) quota relative to Class A unblocked (blocked) quota. The blocking restriction coefficients represent the difference between
blocked and unblocked quota in each vessel class. The standard errors of the coefficients are below the coefficients.
b. The combination is weighted by the average yearly percentage of the TAC.
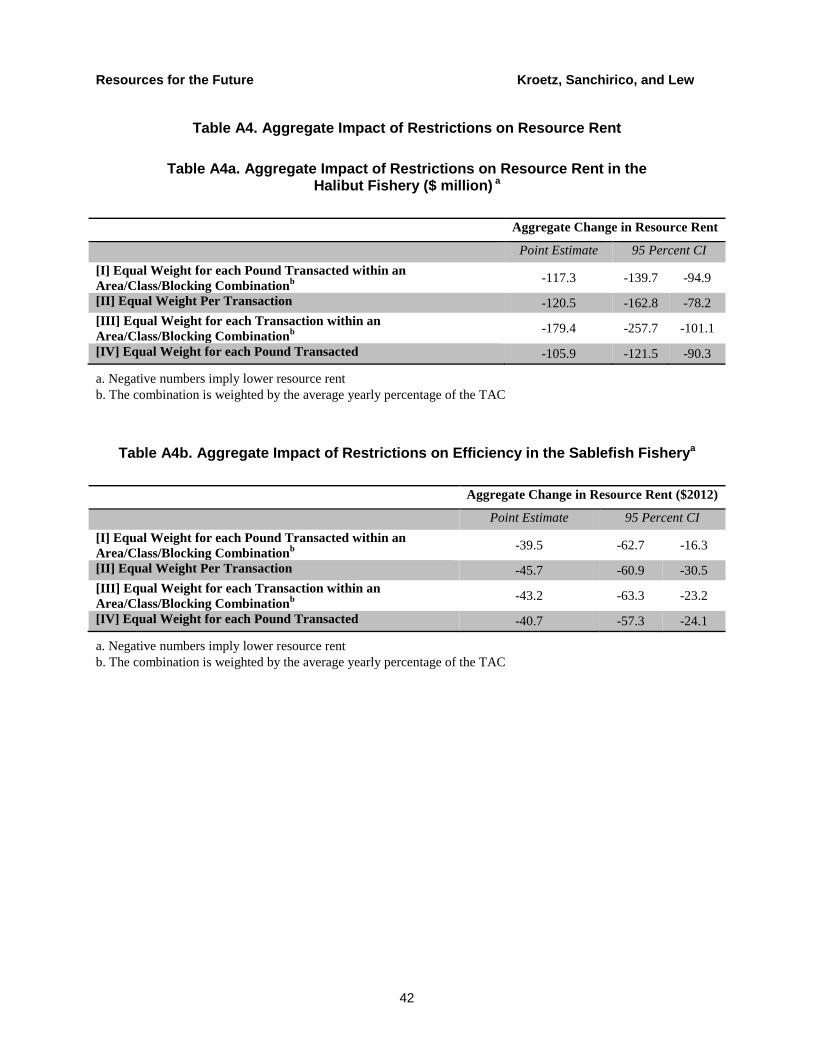
Resources for the Future Kroetz, Sanchirico, and Lew
42
Table A4. Aggregate Impact of Restrictions on Resource Rent
Table A4a. Aggregate Impact of Restrictions on Resource Rent in the Halibut Fishery ($ million) a
Aggregate Change in Resource Rent
Point Estimate 95 Percent CI
[I] Equal Weight for each Pound Transacted within an
Area/Class/Blocking Combinationb
-117.3 -139.7 -94.9
[II] Equal Weight Per Transaction -120.5 -162.8 -78.2
[III] Equal Weight for each Transaction within an
Area/Class/Blocking Combinationb
-179.4 -257.7 -101.1
[IV] Equal Weight for each Pound Transacted -105.9 -121.5 -90.3
a. Negative numbers imply lower resource rent
b. The combination is weighted by the average yearly percentage of the TAC
Table A4b. Aggregate Impact of Restrictions on Efficiency in the Sablefish Fisherya
Aggregate Change in Resource Rent ($2012)
Point Estimate 95 Percent CI
[I] Equal Weight for each Pound Transacted within an
Area/Class/Blocking Combinationb
-39.5 -62.7 -16.3
[II] Equal Weight Per Transaction -45.7 -60.9 -30.5
[III] Equal Weight for each Transaction within an
Area/Class/Blocking Combinationb
-43.2 -63.3 -23.2
[IV] Equal Weight for each Pound Transacted -40.7 -57.3 -24.1
a. Negative numbers imply lower resource rent
b. The combination is weighted by the average yearly percentage of the TAC

Resources for the Future Kroetz, Sanchirico, and Lew
43
Robustness Check, LLM
Table A5. Reduced-Form Model Output: Dependent Variable Logged Quota Price (LLM Model)
Halibut Sablefish
Variables
[I]
Equal
Weight for
each Pound
Transacted
within an
Area/Class/
Blocking
Combinationa
[II]
Equal
Weight Per
Transactio
n
[III]
Equal Weight
for each
Transaction
within an
Area/Class/
Blocking
Combinationa
[IV]
Equal
Weight for
each Pound
Transacted
[I]
Equal Weight
for each
Pound
Transacted
within an
Area/Class/
Blocking
Combinationa
[II]
Equal
Weight Per
Transactio
n
[III]
Equal Weight
for each
Transaction
within an
Area/Class/
Blocking
Combinationa
[IV]
Equal
Weight for
each Pound
Transacted
Blocked
(Unblocked
Omitted)
-0.251*** -0.284*** -0.331*** -0.182*** -0.005 0.063 0.059 -0.030
(0.036) (0.093) (0.049) (0.036) (0.052) (0.070) (0.055) (0.059)
Class B (Class
A Omitted) -0.196*** -0.279*** -0.311*** -0.192*** -0.165*** -0.240*** -0.193*** -0.296***
(0.014) (0.034) (0.031) (0.018) (0.039) (0.038) (0.035) (0.043)
Class C -0.219*** -0.190*** -0.223*** -0.216*** -0.177*** -0.239*** -0.171*** -0.313***
(0.016) (0.035) (0.030) (0.020) (0.045) (0.039) (0.040) (0.047)
Class D -0.345*** -0.556*** -0.514*** -0.311*** NA NA NA NA
(0.040) (0.053) (0.055) (0.039)
Blocked &
Class B 0.136*** 0.212** 0.249*** 0.070* -0.193*** -0.238*** -0.279*** -0.135**
(0.039) (0.096) (0.055) (0.042) (0.058) (0.071) (0.059) (0.066)
Blocked &
Class C 0.091** 0.072 0.111** 0.021 -0.179*** -0.318*** -0.335*** -0.152**
(0.038) (0.094) (0.049) (0.039) (0.060) (0.074) (0.063) (0.065)
Blocked &
Class D 0.040 0.199* 0.166** -0.072 NA NA NA NA
(0.054) (0.103) (0.069) (0.053)
Post-Season -0.114** -0.096*** -0.131** -0.093** -0.170** -0.080 -0.149* -0.152**

Resources for the Future Kroetz, Sanchirico, and Lew
44
(Fall Omitted)
(0.051) (0.030) (0.065) (0.043) (0.071) (0.069) (0.080) (0.072)
Pre-Season -0.079*** -0.040 0.002 -0.067*** -0.032 0.038 0.049 -0.043
(0.021) (0.029) (0.036) (0.022) (0.031) (0.034) (0.043) (0.049)
Spring -0.040*** -0.002 0.026 -0.044** -0.033 0.027 0.009 -0.039
(0.014) (0.021) (0.028) (0.018) (0.021) (0.031) (0.042) (0.042)
Summer -0.001 0.022 0.067** -0.003 -0.006 0.044 0.035 -0.028
(0.013) (0.023) (0.028) (0.016) (0.022) (0.031) (0.044) (0.044)
Dummy for
2008 and on
blocked
quotab
0.051*** 0.080** 0.082** 0.027 NA NA NA NA
(0.015) (0.032) (0.036) (0.019)
Constant 2.796*** 2.727*** 2.729*** 2.777*** 2.957*** 2.858*** 2.883*** 3.099***
(0.026) (0.045) (0.050) (0.034) (0.049) (0.125) (0.063) (0.057)
Observations 3,138 3,138 3,138 3,138 1,263 1,263 1,263 1,263
R-squaredc 0.567 0.583 0.583 0.565 0.710 0.698 0.699 0.686
White hetereoskedasticity consistent standard errors in parentheses (yearxarea fixed effects omitted here to save space)
*** p<0.01, ** p<0.05, * p<0.1
a. The combination is weighted by the average yearly percentage of the TAC
b. Change from 2-3 block maximum
c. The R2 values are calculated based on the procedure outlined in Wooldridge (2012) in Chapter 6. These R
2 values can be compared to those in Table
A3 to determine the relative fit of the LM and LLM.

Resources for the Future Kroetz, Sanchirico, and Lew
45
Table A6. Blocking and Vessel Class Restriction: Change in Quota Prices due to Restrictions: Dependent Variable Logged Quota Price (LLM Model) a
Halibut Sablefish
[I]
Equal Weight
for each
Pound
Transacted
within an
Area/Class/
Blocking
Combinationb
[II]
Equal
Weight Per
Transactio
n
[III]
Equal Weight
for each
Transaction
within an
Area/Class/
Blocking
Combinationb
[IV]
Equal
Weight for
each Pound
Transacted
[I]
Equal
Weight for
each Pound
Transacted
within an
Area/Class/
Blocking
Combinationb
[II]
Equal
Weight Per
Transaction
[III]
Equal Weight
for each
Transaction
within an
Area/Class/
Blocking
Combinationb
[IV]
Equal
Weight for
each Pound
Transacted
IMPACT OF CLASS RESTRICTION ON UNBLOCKED QUOTA PRICES
B Unblocked -.196*** -.279*** -.311*** -.192*** -.165*** -.24*** -.194*** -.296***
(0.014) (0.034) (0.031) (0.018) (0.039) (0.038) (0.035) (0.043)
C
Unblocked -.219*** -.19*** -.224*** -.216*** -.177*** -.239*** -.172*** -.313***
(0.016) (0.035) (0.030) (0.020) (0.045) (0.039) (0.040) (0.047)
D
Unblocked -.345*** -.556*** -.514*** -.311*** NA NA NA NA
(0.040) (0.053) (0.055) (0.039)
IMPACT OF CLASS RESTRICTION ON BLOCKED QUOTA PRICES
B Blocked -.06* -0.066 -0.063 -.122*** -.358*** -.477*** -.472*** -.431***
(0.036) (0.089) (0.044) (0.036) (0.043) (0.062) (0.050) (0.053)
C Blocked -.128*** -0.117 -.113*** -.195*** -.356*** -.556*** -.507*** -.465***
(0.036) (0.088) (0.041) (0.035) (0.045) (0.064) (0.055) (0.053)
D Blocked -.305*** -.357*** -.349*** -.384*** NA NA NA NA
(0.037) (0.089) (0.045) (0.038)
IMPACT OF BLOCKING RESTRICTION
Class A -.252*** -.285*** -.332*** -.183*** -.005 .063 .059 -.03
(0.036) (0.093) (0.049) (0.036) (0.052) (0.070) (0.055) (0.059)
Class B -.116*** -.072*** -.084*** -.113*** -.198*** -.174*** -.219*** -.165***

Resources for the Future Kroetz, Sanchirico, and Lew
46
(0.017) (0.026) (0.022) (0.023) (0.023) (0.025) (0.028) (0.029)
Class C -.161*** -.212*** -.221*** -.161*** -.184*** -.254*** -.276*** -.182***
(0.015) (0.017) (0.017) (0.015) (0.023) (0.027) (0.027) (0.024)
Class D -.212*** -.085* -.166*** -.256*** NA NA NA NA
(0.040) (0.044) (0.049) (0.039)
*** p<0.01, ** p<0.05, * p<0.1
a. The coefficients should be interpreted as the percentage change in real quota price. A negative coefficient implies the restricted quota price is below
that of the unrestricted quota price. The unblocked (blocked) class restriction coefficients represent the percentage difference between unblocked
(blocked) Class B, C, and D unblocked (blocked) quota relative to Class A unblocked (blocked) quota. The blocking restriction coefficients represent the
percentage difference between blocked and unblocked quota in each vessel class. The standard errors of the coefficients are below the coefficients.
b. The combination is weighted by the average yearly percentage of the TAC.

Resources for the Future Kroetz, Sanchirico, and Lew
47
Table A7. Aggregate Impact of Restrictions on Resource Rent
Table A7a. Aggregate Impact of Restrictions on Resource Rent in the Halibut Fisherya
Percentage Change in Resource Rentc Aggregate Change in Resource Rent
d
Point Estimate 95 Percent CI Point Estimate 95 Percent CI
TOTAL (CLASS AND BLOCKING)
[I] Equal Weight for each Pound Transacted within an
Area/Class/Blocking Combinationb
-28.17% -30.44% -25.89% -117.3 -139.7 -94.9
[II] Equal Weight Per Transaction -31.96% -38.06% -25.86% -120.5 -162.8 -78.2
[III] Equal Weight for each Transaction within an
Area/Class/Blocking Combinationb -35.54% -40.95% -30.14% -179.4 -257.7 -101.1
[IV] Equal Weight for each Pound Transacted -27.81% -30.86% -24.75% -105.9 -121.5 -90.3
CLASS ONLY
[I] Equal Weight for each Pound Transacted within an
Area/Class/Blocking Combinationb
-17.0% -20.37% -13.81% -73.1 -93.2 -53.0
[II] Equal Weight Per Transaction -19.43% -27.59% -11.27% -85.1 -122.8 -47.4
[III] Equal Weight for each Transaction within an
Area/Class/Blocking Combinationb -20.94% -25.57% -16.32% -107.5 -152.4 -62.6
[IV] Equal Weight for each Pound Transacted -19.77% -23.27% -16.28% -77.9 -95.9 -60.0
BLOCKING ONLY
[I] Equal Weight for each Pound Transacted within an
Area/Class/Blocking Combinationb
-7.02% -8.03% -6.00% -28.3 -33.4 -23.1
[II] Equal Weight Per Transaction -7.24% -8.38% -6.10% -33.8 -38.7 -28.8
[III] Equal Weight for each Transaction within an
Area/Class/Blocking Combinationb -8.13% -9.30% -6.96% -36.3 -41.8 -30.7
[IV] Equal Weight for each Pound Transacted -7.19% -8.29% -6.09% -27.8 -32.9 -22.6
a. Negative numbers imply lower resource rent
b. The combination is weighted by the average yearly percentage of the TAC
c. Based on the log specification
d. Based on the linear specification

Resources for the Future Kroetz, Sanchirico, and Lew
48
Table A7b. Aggregate Impact of Restrictions on Resource Rent in the Sablefish Fisherya
Percentage Change in Resource Rentc Aggregate Change in Resource Rent ($2012)
d
Point Estimate 95 Percent CI Point Estimate 95 Percent CI
TOTAL (CLASS AND BLOCKING)
[I] Equal Weight for each Pound Transacted within
an Area/Class/Blocking Combinationb
-15.97% -22.14% -9.81% -39.5 -62.7 -16.3
[II] Equal Weight Per Transaction -21.62% -27.19% -16.06% -45.7 -60.9 -30.5
[III] Equal Weight for each Transaction within an
Area/Class/Blocking Combinationb -17.69% -23.02% -12.35% -43.2 -63.3 -23.2
[IV] Equal Weight for each Pound Transacted -26.22% -32.91% -19.54% -39.5 -62.7 -16.3
CLASS ONLY
[I] Equal Weight for each Pound Transacted within
an Area/Class/Blocking Combinationb
-15.89% -21.22% -10.56% -36.2 -56.1 -16.3
[II] Equal Weight Per Transaction -22.63% -27.57% -17.70% -41.6 -54.4 -28.8
[III] Equal Weight for each Transaction within an
Area/Class/Blocking Combinationb
-18.64% -23.44% -13.83% -40.5 -58.2 -22.9
[IV] Equal Weight for each Pound Transacted -25.74% -31.53% -19.96% -38.3 -52.4 -24.2
BLOCKING ONLY
[I] Equal Weight for each Pound Transacted within
an Area/Class/Blocking Combinationb
-2.67% -3.16% -2.18% -82.5 -94.2 -70.7
[II] Equal Weight Per Transaction -2.95% -3.54% -2.36% -101.5 -113.0 -90.1
[III] Equal Weight for each Transaction within an
Area/Class/Blocking Combinationb -3.40% -4.00% -2.81% -98.1 -110.1 -86.0
[IV] Equal Weight for each Pound Transacted -2.51% -3.07% -1.94% -72.4 -83.9 -60.8
a. Negative numbers imply lower resource rent
b. The combination is weighted by the average yearly percentage of the TAC
c. Based on the log specification
d. Based on the linear specification

Resources for the Future Kroetz, Sanchirico, and Lew
49
Additional Robustness Regression
Following Newell et. al (2005), we rerun our regressions using data on ex-vessel price,
area-specific stock, fuel price, and labor indices. Additionally, we include measures of the prior
year’s percent of the TAC caught as well as the year-to-date percent of the TAC caught the prior
year. Finally, we include the change in GDP as a general measure of the economy, the 30-day T-
bill rate representing the risk-free portion of the quota discount rate. Our general result that
restrictions significantly impact efficiency is robust to this change in specification. Furthermore,
the coefficients of interest are of similar magnitudes. We present the results with year and area
interacted dummy variables as our primary results because they are more parsimonious and the
fit is similar.
Related Documents