Efficacy of Support Services for Learners with Disabilities Distance Education Technology Symposium 2008 Susan Moisey, CDE

Efficacy of Support Services for Learners with Disabilities Distance Education Technology Symposium 2008 Susan Moisey, CDE.
Dec 18, 2015
Welcome message from author
This document is posted to help you gain knowledge. Please leave a comment to let me know what you think about it! Share it to your friends and learn new things together.
Transcript

Efficacy of Support Services for Learners with Disabilities
Distance Education Technology Symposium 2008
Susan Moisey, CDE

Students with Disabilities
Individuals who are disadvantaged by reason of any verifiable and persistent physical, learning, cognitive, sensory, psychological, neurological, or temporary impairment that may affect their academic progress (Athabasca University, Policy for Students with Disabilities, 2000)

Office for Access for Students with Disabilities (ASD)
Established 1998
2 professional staff; 2 support staff
Growing numbers served

Students Served by ASD
0
200
400
600
800
1000
1200
1400
1600
2002 2003 2004 2005 2006
Prospective
Active

Course accommodations
accommodation to timing of course alternative format

Exam accommodations
accommodation to timing of examinations assistance with presenting questions and
recording answers environmental changes alternative format

External support
Provision of professional support from outside university, e.g., academic strategist, interpreter
Non-professional support, e.g., note-taker, support worker

Assistive technology
assessment procurement of equipment liaison with funding sources training

Research Questions
Does the course completion rate of students with disabilities differ from that of the general Athabasca University undergraduate population?
What is the relationship between course completion and factors such as type of disability and type(s) of services received?

Types of disabilities
42% Physical disabilities or chronic illness
18% Learning disabilities
16% Psychological conditions
4% Vision loss/blindness
2% Hearing impairment/deafness
18% Undetermined
100% n = 654

Types of Disabilities
Physical
Psychological
Learning
Hearing
Vision
Undetermined

Completion Rate
50.8 % Physical disabilities54.4 Learning disabilities51.5 Psychological conditions46.3 Vision loss/blindness69.3 Hearing impairment/deafness44.1 Undetermined50.6 % OverallGeneral AU population = 59.5 – 66.6%

Services Received
Type % Sig.
Extension 59% .21
Alternate format 2% .23
Exam – time 55% .01*
Exam – writing 28% .02*

Services Received
Type % Sig.
Exam - environment
28% .07
Exam - Alternate format
2% .23
External support professional
3% .61
External support non-professional
2% .51

Services Received
Type % Sig. Level
Assistive Tech - assessment
8% .21
Assistive Tech - procurement
8% .19
Assistive Tech - funding
8% .21
Assistive Tech - training
7% .14

Course Extensions (n = 384)
Hearing 71% .43
Learning 61% .09
Physical 73% (202) .01*
Psychological 74% .85
Visual 71% .99
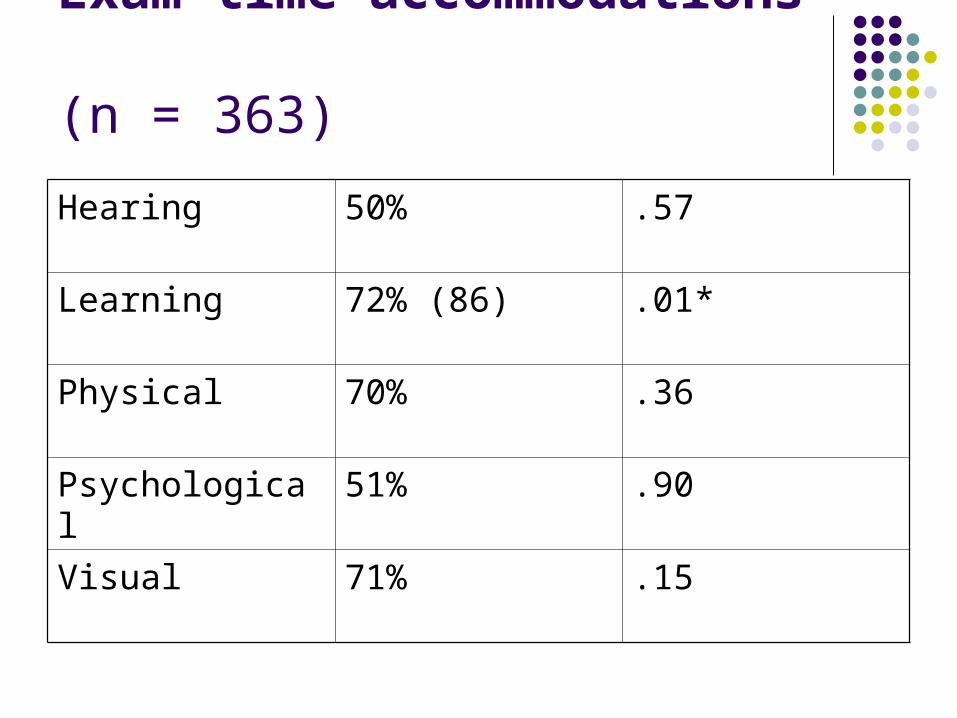
Exam time accommodations (n = 363)
Hearing 50% .57
Learning 72% (86) .01*
Physical 70% .36
Psychological 51% .90
Visual 71% .15

Exam writing accommodations (n = 182)
Hearing 14% .51
Learning 39% .43
Physical 38% (104) .04*
Psychological 12% .31
Visual 61% .68

Assistive Tech – Training (n = 47)
Hearing 0%
Learning 11% .12
Physical 9% .11
Psychological 7% .83
Visual 11% .76

Findings
Students with disabilities have a lower completion rate than students in the general AU population
Certain types of services appear to be more effective than others for enhancing course completion – course extensions - physical disabilities-- exam time accommodations - learning disabilities-- exam writing accs. – physical disabilities

Related Documents