Serial Vaccination and the Antigenic Distance Hypothesis: Effects on Influenza Vaccine Effectiveness During A(H3N2) Epidemics in Canada, 2010–2011 to 2014–2015 Danuta M. Skowronski, Catharine Chambers, Gaston De Serres, Suzana Sabaiduc, Anne-Luise Winter, James A. Dickinson, Jonathan B. Gubbay, Kevin Fonseca, Steven J. Drews, Hugues Charest, Christine Martineau, Mel Krajden, Martin Petric, Nathalie Bastien, Yan Li, Derek J. Smith Downloaded from https://academic.oup.com/jid/article/215/7/1059/2979766 by guest on 30 June 2022

Welcome message from author
This document is posted to help you gain knowledge. Please leave a comment to let me know what you think about it! Share it to your friends and learn new things together.
Transcript
Serial Vaccination and the Antigenic Distance
Hypothesis: Effects on Influenza Vaccine
Effectiveness During A(H3N2) Epidemics in Canada,
2010–2011 to 2014–2015
Danuta M. Skowronski, Catharine Chambers, Gaston De Serres, Suzana
Sabaiduc, Anne-Luise Winter, James A. Dickinson, Jonathan B. Gubbay, Kevin
Fonseca, Steven J. Drews, Hugues Charest, Christine Martineau, Mel Krajden,
Martin Petric, Nathalie Bastien, Yan Li, Derek J. Smith
Dow
nloaded from https://academ
ic.oup.com/jid/article/215/7/1059/2979766 by guest on 30 June 2022
Repeat Influenza A(H3N2) Vaccine Effects • JID 2017:215 (1 April) • 1059
The Journal of Infectious Diseases
The Journal of Infectious Diseases® 2017;215:1059–69
Serial Vaccination and the Antigenic Distance Hypothesis: Effects on Influenza Vaccine Effectiveness During A(H3N2) Epidemics in Canada, 2010–2011 to 2014–2015Danuta M. Skowronski,1,2 Catharine Chambers,1 Gaston De Serres,3,4,5 Suzana Sabaiduc,6 Anne-Luise Winter,7 James A. Dickinson,8 Jonathan B. Gubbay,9,10 Kevin Fonseca,11,12 Steven J. Drews,13,14 Hugues Charest,15,16 Christine Martineau,15 Mel Krajden,6,17 Martin Petric,17 Nathalie Bastien,18 Yan Li,18 and Derek J. Smith19
1Communicable Disease Prevention and Control Services, British Columbia Centre for Disease Control, Vancouver, 2School of Population and Public Health, University of British Columbia, Vancouver, 3Direction of Biological and Occupational Risks, Institut national de santé publique du Québec, 4Department of Social and Preventive Medicine, Laval University, Québec, 5Infection and Immunity, Centre Hospitalier Universitaire de Québec Research Centre, 6British Columbia Centre for Disease Control Public Health Laboratory, Vancouver, 7Communicable Diseases, Emergency Preparedness and Response, Public Health Ontario, Toronto, 8Departments of Family Medicine and Community Health Sciences, University of Calgary, 9Public Health Ontario Laboratory, Public Health Ontario, Toronto, 10Departments of Laboratory Medicine and Pathobiology and Paediatrics, University of Toronto, 11Diagnostic Virology, Alberta Provincial Laboratory, Calgary, 12Department of Microbiology, Immunology and Infectious Diseases, University of Calgary, 13Diagnostic Virology, Alberta Provincial Laboratory, Edmonton, 14Department of Laboratory Medicine and Pathology, University of Alberta, Edmonton, 15Laboratoire de santé publique du Québec, Institut national de santé publique du Québec, 16Département de microbiologie, d’infectiologie et d’immunologie, l’Université de Montréal, 17Department of Pathology and Laboratory Medicine, University of British Columbia, Vancouver, 18Infectious Disease Prevention and Control Branch, National Microbiology Laboratory, Public Health Agency of Canada, Winnipeg, Canada; and 19Department of Zoology, University of Cambridge, England
(See the editorial commentary by Treanor on pages 1017–9.)
Background. The antigenic distance hypothesis (ADH) predicts that negative interference from prior season’s influenza vaccine (v1) on the current season’s vaccine (v2) protection may occur when the antigenic distance is small between v1 and v2 (v1 ≈ v2) but large between v1 and the current epidemic (e) strain (v1 ≠ e).
Methods. Vaccine effectiveness (VE) against medically attended, laboratory-confirmed influenza A(H3N2) illness was esti-mated by test-negative design during 3 A(H3N2) epidemics (2010–2011, 2012–2013, 2014–2015) in Canada. Vaccine effectiveness was derived with covariate adjustment across v2 and/or v1 categories relative to no vaccine receipt among outpatients aged ≥9 years. Prior vaccination effects were interpreted within the ADH framework.
Results. Prior vaccination effects varied significantly by season, consistent with the ADH. There was no interference by v1 in 2010–2011 when v1 ≠ v2 and v1 ≠ e, with comparable VE for v2 alone or v2 + v1: 34% (95% confidence interval [CI] = −51% to 71%) versus 34% (95% CI = −5% to 58%). Negative interference by v1 was suggested in 2012–2013 with nonsignificant reduction in VE when v1 ≈ v2 and v1 ≠ e: 49% (95% CI = −47% to 83%) versus 28% (95% CI = −12% to 54%). Negative effects of prior vaccination were pronounced and statistically significant in 2014–2015 when v1 ≡ v2 and v1 ≠ e: 65% (95% CI = 25% to 83%) versus −33% (95% CI = −78% to 1%).
Conclusions. Effects of repeat influenza vaccination were consistent with the ADH and may have contributed to findings of low VE across recent A(H3N2) epidemics since 2010 in Canada.
Keywords. influenza; influenza vaccine; vaccine effectiveness; influenza A(H3N2) subtype; repeat vaccination; antigenic dis-tance hypothesis; negative interference; genomic sequencing; hemagglutination inhibition; antigenic site.
A growing body of evidence suggests that protection from sea-sonal influenza vaccine may be modified by vaccination in prior seasons [1–13]. Hoskins et al were the first to report such effects during a series of 3 boarding-school outbreaks due to influ-enza A(H3N2) in the 1970s [1–3]. Across the three outbreaks (1972, 1974, 1976), children who were repeatedly vaccinated,
recently vaccinated only, or consistently unvaccinated experi-enced similar cumulative attack rates, leading authors to con-clude that annual influenza vaccination conferred no long-term advantage [3]. In the context of vaccine that was at least par-tially protective during some outbreaks, however, the finding of comparable cumulative attack rates implies that during other outbreaks repeatedly vaccinated children were at increased risk. Indeed, during the final spring 1976 outbreak due to antigen-ically drifted A/Victoria virus mismatched to the current sea-son’s A/Port Chalmers vaccine (the latter also used as vaccine antigen the prior season), repeatedly vaccinated children had attack rates that were approximately 50% higher than consis-tently unvaccinated children (Supplementary Figure 1) [3].
In a follow-up efficacy trial, Keitel et al examined the effects of annually readministered trivalent influenza vaccine among
M A J O R A R T I C L E
© The Author 2017. Published by Oxford University Press for the Infectious Diseases Society of America. All rights reserved. For permissions, e-mail: [email protected]: 10.1093/infdis/jix074
Received 1 December 2016; editorial decision 27 December 2016; accepted 2 February 2017; published online February 9, 2017.
Presented in part: Options IX For the Control of Influenza Conference, Chicago, Illinois, 24–28 August 2016; Canadian Immunization Conference 2016, Ottawa, Ontario, Canada, 6–8 December 2016.
Correspondence: D. M. Skowronski, MD, FRCPC, British Columbia Centre for Disease Control, 655 West 12th Ave, Vancouver, British Columbia, Canada V5Z 4R4 ([email protected]).
Dow
nloaded from https://academ
ic.oup.com/jid/article/215/7/1059/2979766 by guest on 30 June 2022
1060 • JID 2017:215 (1 April) • Skowronski et al
nonelderly, community-dwelling adults [4]. Across the 5 study seasons (1983–1984 to 1987–1988), authors found variable effects of repeat vaccination, widely interpreted to contradict Hoskins [1–4]. Both studies administered whole-virus vaccines at doses that are no longer applicable and both included sero-logic diagnosis of influenza now recognized to overestimate vaccine protection [1–4]. However, during the final 1987–1988 study season, when the A(H3N2) vaccine component was closely related to the prior season’s vaccine but distinct from the epidemic strain, and with restriction to include only ran-domized participants and virologically confirmed outcomes, Keitel reported similar findings to Hoskins [3, 4]. With more annual vaccinations there was significant 48% higher A(H3N2) risk. This pattern was not linear but was driven by rates of culture-confirmed infection that were 2.7-fold higher among maximally vaccinated participants compared with placebo recipients (P = .07) (Supplementary Figure 2). In combination, the Hoskins and Keitel studies signaled that repeated vaccina-tion could be associated with reduced protection and increased influenza susceptibility under certain conditions in some sea-sons, but neither study was adequately powered to resolve the issue [3, 4]. A subsequent meta-analysis concluded no evidence for decreasing protection with annually repeated influenza vac-cination; those conclusions, however, were reached with broad pooling across seasons, subtypes, settings, vaccines, age groups, and serological/virological outcomes [14].
In modeling simulations during the late 1990s, Smith et al attempted to reconcile variable observations of repeat influ-enza vaccination effects through a unifying antigenic distance hypothesis (ADH) [15]. The ADH assigned antigenic distances (ADs) between vaccine and epidemic strains based on the hemagglutination inhibition (HI) assay [16], derived as log2 of the fold difference in HI antibody titers between homologous and heterologous comparator strains. This was translated into a predictive mathematical model for relative vaccine effective-ness (VE) but without absolute clinical meaning [15]. In this model, repeat vaccination effects were foremost determined by the AD between prior (v1) and current (v2) season’s vac-cines and between v1 and the current season’s epidemic (e) strain [15]. According to the underlying theory of associative immunological memory, prior vaccination effects represent a balance between preexisting v1-induced antibody potentially interfering with v2 antigen and v2 stimulation of rapid v1 mem-ory responses potentially protective against e. When v1 and v2 are more antigenically distinct (ie, v1 ≠ v2), their interactions should be minimal. Conversely, when the AD between v1 and v2 is smaller (ie, v1 ≈ v2), effect modification by v1 on the cur-rent season’s VE becomes more likely. Negative interference is anticipated when v1 ≈ v2 but the AD between v1 and e is large (ie, v1 ≠ e). Pronounced negative effects from v1 on VE are anticipated under the extreme scenario of homologous (ie, identical) vaccine components in the current and prior season
(ie, v1 ≡ v2), and v1 ≠ e. By comparison, positive interference is anticipated when the AD between v1 and e is smaller (ie, v1 ≈ e).
Since the 2004–2005 season, the test-negative design (TND) has been used globally to monitor influenza VE annually [17]. A recent meta-analysis of TND studies (>90% published since 2010) highlighted low VE (<40% on average) for the A(H3N2) subtype [17]. This low VE was not well explained by the current season’s vaccine match to the circulating strain (ie, v2–e relat-edness); accordingly other explanatory agent–host factors have been sought, including the ADH [5, 7–13, 15]. The Canadian Sentinel Practitioner Surveillance Network (SPSN) is unique in linking prior and current season’s vaccine history to detailed genetic characterization of influenza variants collected from VE study participants [8–10]. Here we use the clinical and viro-logical databases of this integrated platform to explore effects of prior vaccination on current season’s VE during recent A(H3N2) epidemics in Canada since 2010–2011. Findings are interpreted within the ADH framework primarily invoking v1, v2, and e relatedness, with secondary consideration also of an additional prior season’s vaccine (v0) receipt.
METHODS
Canadian Sentinel Practitioner Surveillance Network
Patients presenting within 7 days of influenza-like illness (ILI) onset to outpatient sentinel clinics in participating provinces (Alberta, British Columbia, Ontario, Quebec) were eligible. Influenza-like illness was defined as acute respiratory illness requiring fever and cough and at least 1 of sore throat, arthral-gia, myalgia, or prostration. Fever was not a requirement in patients aged ≥65 years. Influenza was diagnosed by reverse transcription, polymerase chain reaction (RT-PCR) at provin-cial reference laboratories from specimens collected by nasal/nasopharyngeal swab. Epidemiological data, including receipt of current (v2) and up to 2 previous seasons’ sequential vac-cines (v1 and v0), were collected by sentinel practitioners from consenting patients/guardians using a standard questionnaire at specimen collection, before laboratory testing.
Analysis of Current and Prior Vaccination Effects
Patients testing positive for influenza A(H3N2) were consid-ered cases, whereas those testing negative for any influenza were considered controls. The odds ratio (OR) for medically attended, laboratory-confirmed influenza A(H3N2) illness was derived by logistic regression across self-reported vaccination categories using an indicator variable: (1) unvaccinated both current and prior season (reference group), (2) vaccinated prior but not current season, (3) vaccinated current but not prior sea-son, and (4) vaccinated both current and prior season. Vaccine effectiveness was derived as (1 − OR) × 100%. Odds ratios in relation to current but not prior season vaccination as the refer-ence group were also assessed.
Dow
nloaded from https://academ
ic.oup.com/jid/article/215/7/1059/2979766 by guest on 30 June 2022
Repeat Influenza A(H3N2) Vaccine Effects • JID 2017:215 (1 April) • 1061
Only seasons for which the A(H3N2) subtype comprised the large majority of influenza A detections were included: 2010–2011 (80% of detections) [8], 2012–2013 (81% of detections) [9], and 2014–2015 (97% of detections) [10]. The analysis period spanned November 1–April 30 of each season. Participants reporting current season’s vaccination <2 weeks before ILI onset were excluded. For consistency in age-based dosing rec-ommendations, participants aged <9 years were also excluded. Adjustment for the same potential confounders was applied each season, including age group (9–19, 20–49, 50–64, ≥65 year); sex (female, male); comorbidity (no, yes); province (Alberta, British Columbia, Ontario, Quebec); interval from ILI onset to specimen collection (0–4, 5–7 days); and calendar time (specimen collec-tion week modeled using cubic B-spline functions with 3 equally spaced knots). Participants missing vaccination status for the cur-rent and/or prior season or covariate information were excluded. Ethics review boards in each province provided study approval.
Influenza Vaccines
Influenza vaccines were administered during the regular cam-paign commencing in October/November, offered without charge to all residents of Ontario and Alberta and to high-risk groups and their close contacts in British Columbia and Quebec. Vaccines were almost entirely trivalent, nonadjuvanted, inacti-vated products, of which more than two thirds were split virion and the remainder subunit. Adjuvanted and live-attenuated influenza vaccines were also available but primarily for groups excluded from this analysis.
Antigenic and Genetic Characterization of Vaccine–Virus Relatedness
Sanger-sequencing of the viral HA1 gene in influenza test-pos-itive specimens was undertaken each season to establish clade distribution and to detect notable amino-acid differences at established antigenic sites, labeled A–E for A(H3N2) viruses [8–10]. Genetic comparisons are between the dominant epidemic
clade detected by the SPSN relative to the egg-adapted, high-growth reassortant (HGR) vaccine used by manufacturers [8–10, 18].
Antigenic relatedness across representative egg-passaged vac-cine and cell-passaged epidemic reference viruses each season was quantified by the AD using HI titers posted by the WHO Collaborating Centre for Reference and Research on Influenza (London), as detailed in Supplementary Table 1 [15, 19]. By convention, antigenic distinction of a heterologous strain is defined by ≥8-fold difference in HI-antibody titer relative to the homologous strain, corresponding to an AD ≥3 (ie, log28 = 3), although the Smith et al model allows for cross-reactivity between viruses up to ADs <7.
RESULTS
Seasonal and Participant Profiles
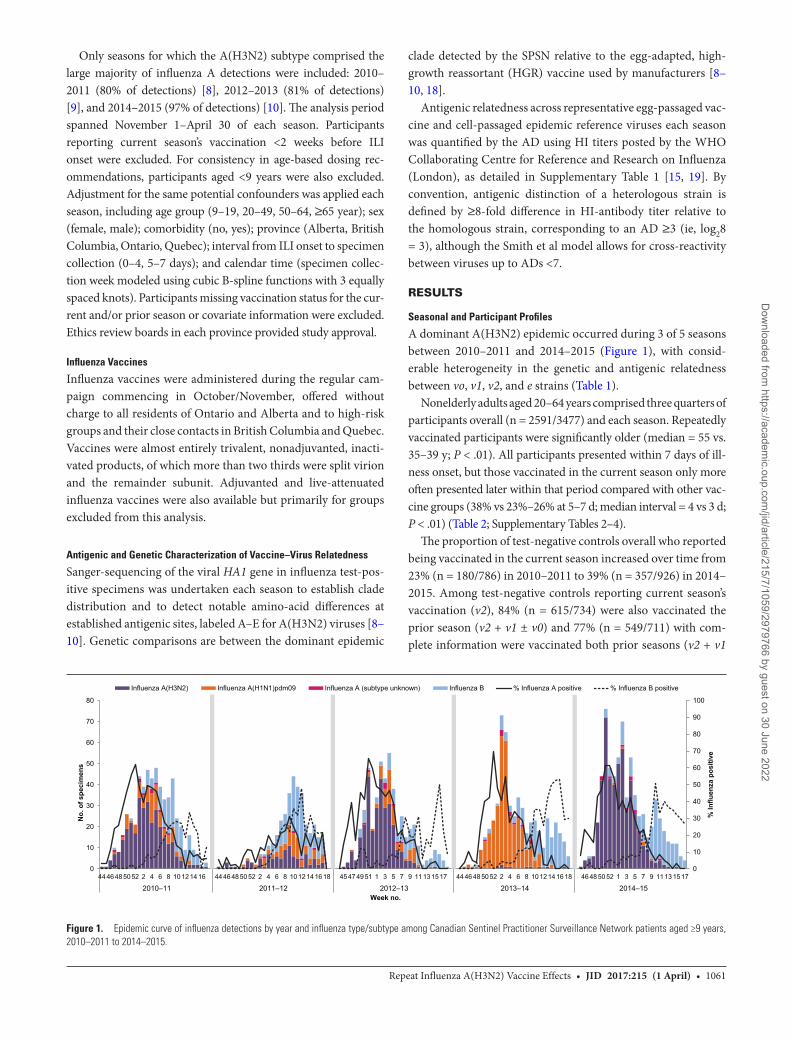
A dominant A(H3N2) epidemic occurred during 3 of 5 seasons between 2010–2011 and 2014–2015 (Figure 1), with consid-erable heterogeneity in the genetic and antigenic relatedness between vo, v1, v2, and e strains (Table 1).
Nonelderly adults aged 20–64 years comprised three quarters of participants overall (n = 2591/3477) and each season. Repeatedly vaccinated participants were significantly older (median = 55 vs. 35–39 y; P < .01). All participants presented within 7 days of ill-ness onset, but those vaccinated in the current season only more often presented later within that period compared with other vac-cine groups (38% vs 23%–26% at 5–7 d; median interval = 4 vs 3 d; P < .01) (Table 2; Supplementary Tables 2–4).
The proportion of test-negative controls overall who reported being vaccinated in the current season increased over time from 23% (n = 180/786) in 2010–2011 to 39% (n = 357/926) in 2014–2015. Among test-negative controls reporting current season’s vaccination (v2), 84% (n = 615/734) were also vaccinated the prior season (v2 + v1 ± v0) and 77% (n = 549/711) with com-plete information were vaccinated both prior seasons (v2 + v1
0
10
20
30
40
50
60
70
80
90
100
0
10
20
30
40
50
60
70
80
44 46 48 50 52 2 4 6 8 10 12 14 16 44 46 48 50 52 2 4 6 8 10 12 14 16 18 45 47 49 51 1 3 5 7 9 11 13 15 17 44 46 48 50 52 2 4 6 8 10 12 14 16 18 46 48 50 52 1 3 5 7 9 11 13 15 17
2010–11 2011–12 2012–13 2013–14 2014–15
% In
fluen
za p
ositi
ve
No.
of s
peci
men
s
Week no.
Influenza A(H3N2) Influenza A(H1N1)pdm09 Influenza A (subtype unknown) Influenza B % Influenza A positive % Influenza B positive
Figure 1. Epidemic curve of influenza detections by year and influenza type/subtype among Canadian Sentinel Practitioner Surveillance Network patients aged ≥9 years, 2010–2011 to 2014–2015.
Dow
nloaded from https://academ
ic.oup.com/jid/article/215/7/1059/2979766 by guest on 30 June 2022
1062 • JID 2017:215 (1 April) • Skowronski et al
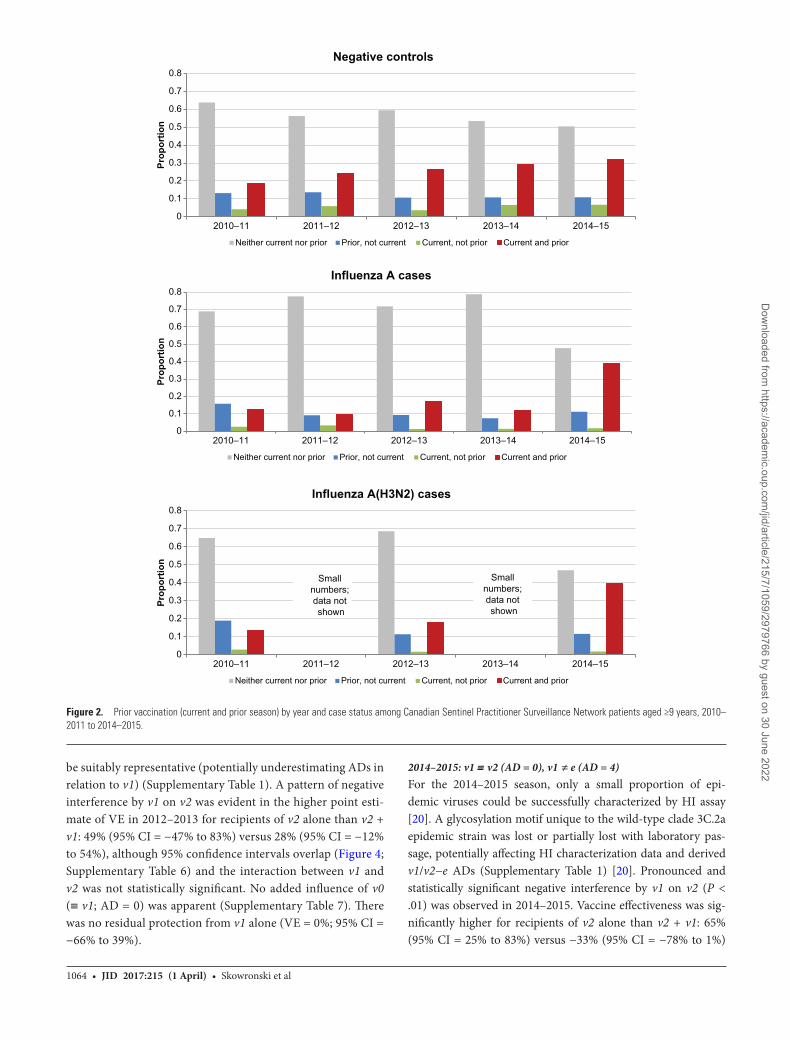
+ v0). Among cases (but not controls) there was a substantial increase in the proportion reporting prior season(s)’ vaccina-tion in 2014–2015 (Figure 2; Supplementary Figure 3).
Vaccine Effectiveness: Prior Season(s)’ Effects Stratified by Season and
Vaccine–Virus Relatedness
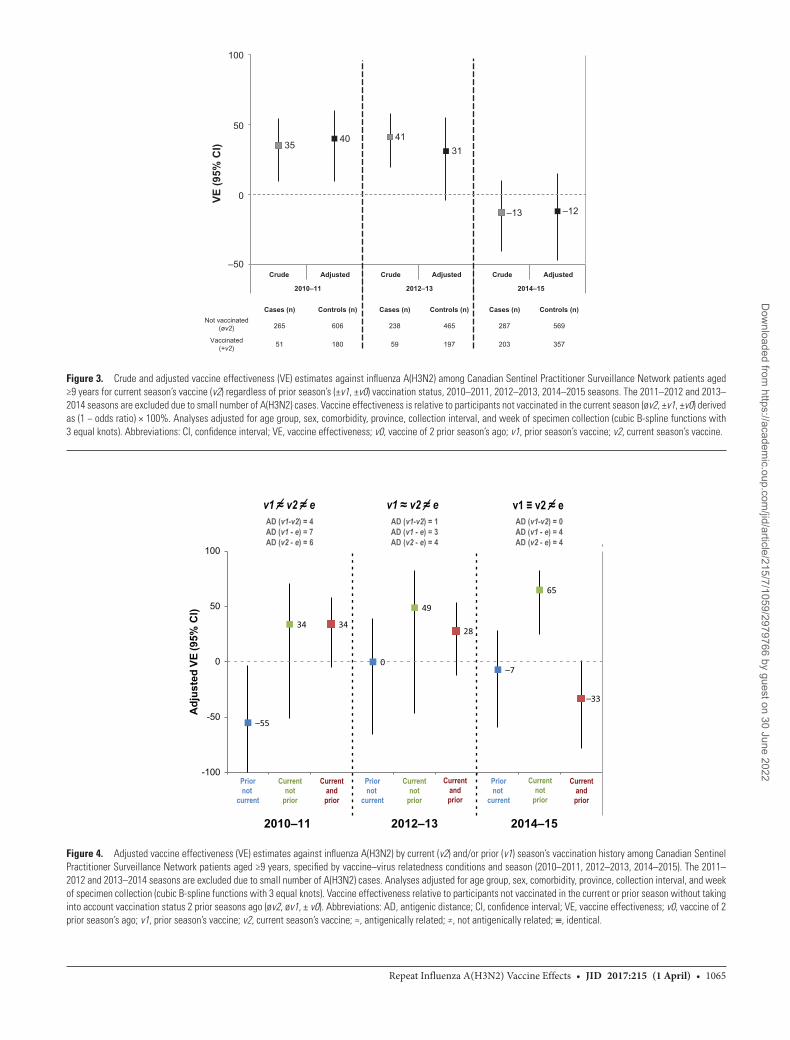
The current season’s vaccine was antigenically distinct from the dominant circulating variant (ie, v2≠e) for each epidemic, with v2–e ADs ranging 4–6 (Table 1; Supplementary Table 1). Adjusted VE did not exceed 40% during any epidemic but
varied significantly by season (P < .01 for season × current vac-cine status interaction) (Figure 3; Supplementary Table 5). Prior vaccination effects also varied significantly by season (P = .01 for season × current/prior vaccine status category interaction), precluding pooled analyses.
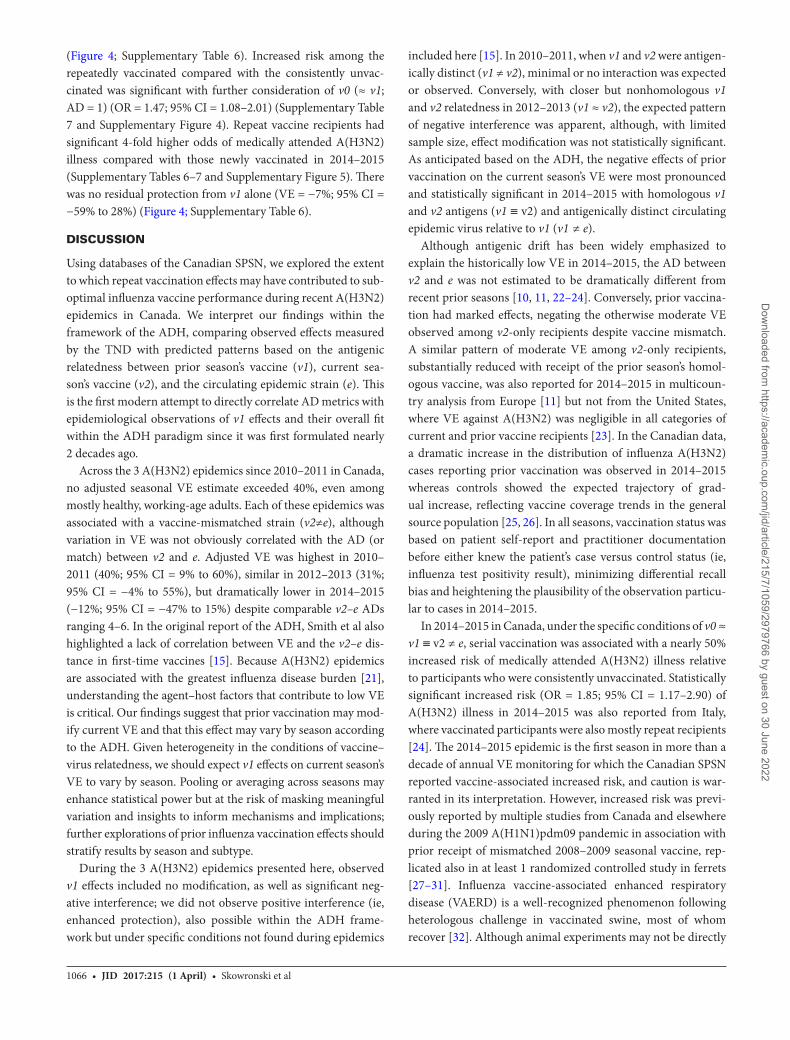
2010–2011: v1 ≠ v2 (AD = 4), v1 ≠ e (AD = 7)There was no apparent interference by v1 on v2 in 2010–2011, and the interaction between v1 and v2 was not statistically sig-nificant. Vaccine effectiveness was comparable for recipients of
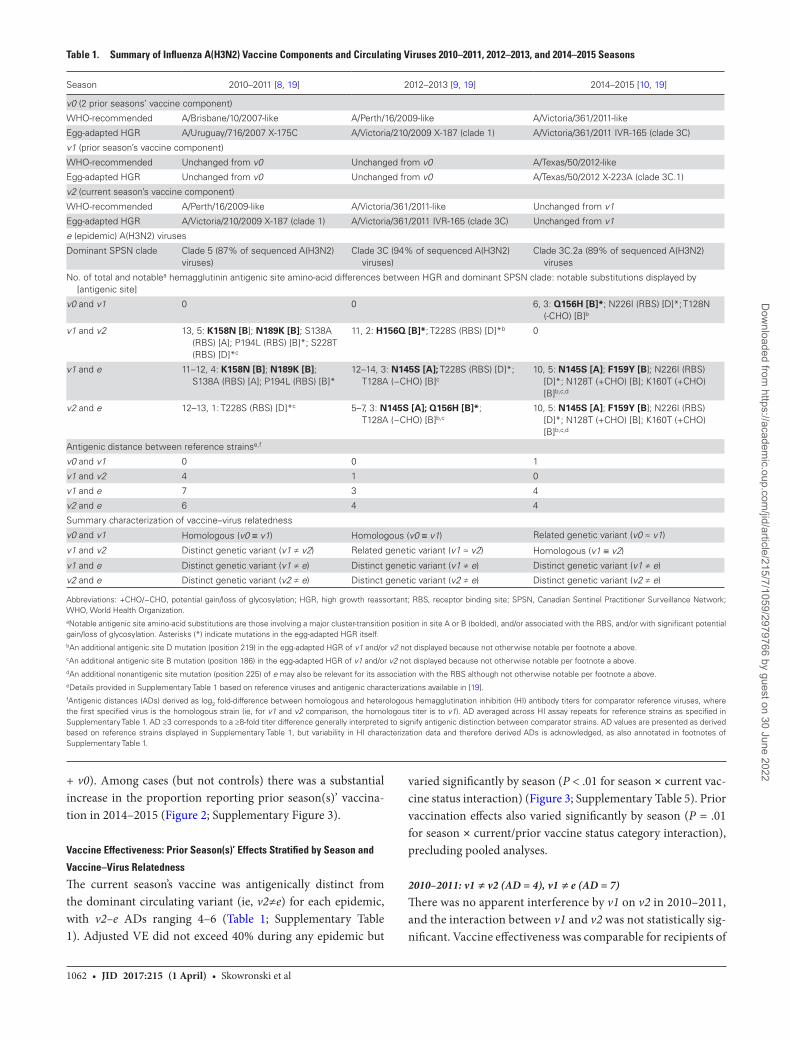
Table 1. Summary of Influenza A(H3N2) Vaccine Components and Circulating Viruses 2010–2011, 2012–2013, and 2014–2015 Seasons
Season 2010–2011 [8, 19] 2012–2013 [9, 19] 2014–2015 [10, 19]
v0 (2 prior seasons’ vaccine component)
WHO-recommended A/Brisbane/10/2007-like A/Perth/16/2009-like A/Victoria/361/2011-like
Egg-adapted HGR A/Uruguay/716/2007 X-175C A/Victoria/210/2009 X-187 (clade 1) A/Victoria/361/2011 IVR-165 (clade 3C)
v1 (prior season’s vaccine component)
WHO-recommended Unchanged from v0 Unchanged from v0 A/Texas/50/2012-like
Egg-adapted HGR Unchanged from v0 Unchanged from v0 A/Texas/50/2012 X-223A (clade 3C.1)
v2 (current season’s vaccine component)
WHO-recommended A/Perth/16/2009-like A/Victoria/361/2011-like Unchanged from v1
Egg-adapted HGR A/Victoria/210/2009 X-187 (clade 1) A/Victoria/361/2011 IVR-165 (clade 3C) Unchanged from v1
e (epidemic) A(H3N2) viruses
Dominant SPSN clade Clade 5 (87% of sequenced A(H3N2) viruses)
Clade 3C (94% of sequenced A(H3N2) viruses)
Clade 3C.2a (89% of sequenced A(H3N2) viruses
No. of total and notablea hemagglutinin antigenic site amino-acid differences between HGR and dominant SPSN clade: notable substitutions displayed by [antigenic site]
v0 and v1 0 0 6, 3: Q156H [B]*; N226I (RBS) [D]*; T128N (-CHO) [B]b
v1 and v2 13, 5: K158N [B]; N189K [B]; S138A (RBS) [A]; P194L (RBS) [B]*; S228T (RBS) [D]*c
11, 2: H156Q [B]*; T228S (RBS) [D]*b 0
v1 and e 11–12, 4: K158N [B]; N189K [B]; S138A (RBS) [A]; P194L (RBS) [B]*
12–14, 3: N145S [A]; T228S (RBS) [D]*; T128A (−CHO) [B]c
10, 5: N145S [A]; F159Y [B]; N226I (RBS) [D]*; N128T (+CHO) [B]; K160T (+CHO) [B]b,c,d
v2 and e 12–13, 1: T228S (RBS) [D]*c 5–7, 3: N145S [A]; Q156H [B]*; T128A (−CHO) [B]b,c
10, 5: N145S [A]; F159Y [B]; N226I (RBS) [D]*; N128T (+CHO) [B]; K160T (+CHO) [B]b,c,d
Antigenic distance between reference strainse,f
v0 and v1 0 0 1
v1 and v2 4 1 0
v1 and e 7 3 4
v2 and e 6 4 4
Summary characterization of vaccine–virus relatedness
v0 and v1 Homologous (v0 ≡ v1) Homologous (v0 ≡ v1) Related genetic variant (v0 ≈ v1)
v1 and v2 Distinct genetic variant (v1 ≠ v2) Related genetic variant (v1 ≈ v2) Homologous (v1 ≡ v2)
v1 and e Distinct genetic variant (v1 ≠ e) Distinct genetic variant (v1 ≠ e) Distinct genetic variant (v1 ≠ e)
v2 and e Distinct genetic variant (v2 ≠ e) Distinct genetic variant (v2 ≠ e) Distinct genetic variant (v2 ≠ e)
Abbreviations: +CHO/−CHO, potential gain/loss of glycosylation; HGR, high growth reassortant; RBS, receptor binding site; SPSN, Canadian Sentinel Practitioner Surveillance Network; WHO, World Health Organization. aNotable antigenic site amino-acid substitutions are those involving a major cluster-transition position in site A or B (bolded), and/or associated with the RBS, and/or with significant potential gain/loss of glycosylation. Asterisks (*) indicate mutations in the egg-adapted HGR itself.bAn additional antigenic site D mutation (position 219) in the egg-adapted HGR of v1 and/or v2 not displayed because not otherwise notable per footnote a above.cAn additional antigenic site B mutation (position 186) in the egg-adapted HGR of v1 and/or v2 not displayed because not otherwise notable per footnote a above.dAn additional nonantigenic site mutation (position 225) of e may also be relevant for its association with the RBS although not otherwise notable per footnote a above.eDetails provided in Supplementary Table 1 based on reference viruses and antigenic characterizations available in [19].fAntigenic distances (ADs) derived as log2 fold-difference between homologous and heterologous hemagglutination inhibition (HI) antibody titers for comparator reference viruses, where the first specified virus is the homologous strain (ie, for v1 and v2 comparison, the homologous titer is to v1). AD averaged across HI assay repeats for reference strains as specified in Supplementary Table 1. AD ≥3 corresponds to a ≥8-fold titer difference generally interpreted to signify antigenic distinction between comparator strains. AD values are presented as derived based on reference strains displayed in Supplementary Table 1, but variability in HI characterization data and therefore derived ADs is acknowledged, as also annotated in footnotes of Supplementary Table 1.
Dow
nloaded from https://academ
ic.oup.com/jid/article/215/7/1059/2979766 by guest on 30 June 2022
Repeat Influenza A(H3N2) Vaccine Effects • JID 2017:215 (1 April) • 1063
v2 alone and for v2 + v1: 34% (95% confidence interval [CI] = −51% to 71%) versus 34% (95% CI = −5% to 58%), respectively (Figure 4; Supplementary Table 6). Those reporting v1 alone were at significantly higher risk (VE = −55%; 95% CI = −134% to −3%) compared with those unvaccinated both seasons. A role for v0 (≡ v1; AD = 0) may be suggested by the higher VE point estimate among v2 recipients who received neither v1 nor v0 (58%; 95% CI = −32% to 87%) compared with those receiving all three vaccines (32%; 95% CI = −11% to 58%),
although 95% confidence intervals overlap (Supplementary Table 7).
2012–2013: v1 ≈ v2 (AD = 1), v1 ≠ e (AD = 3)For the 2012–2013 season, HI characterization data were not available for the egg-passaged v1 referent virus used by manufacturers (A/Victoria/210/2009); ADs were instead derived based on the egg-passaged version of the WHO-recommended v1 referent (A/Perth/16/2009), which may not
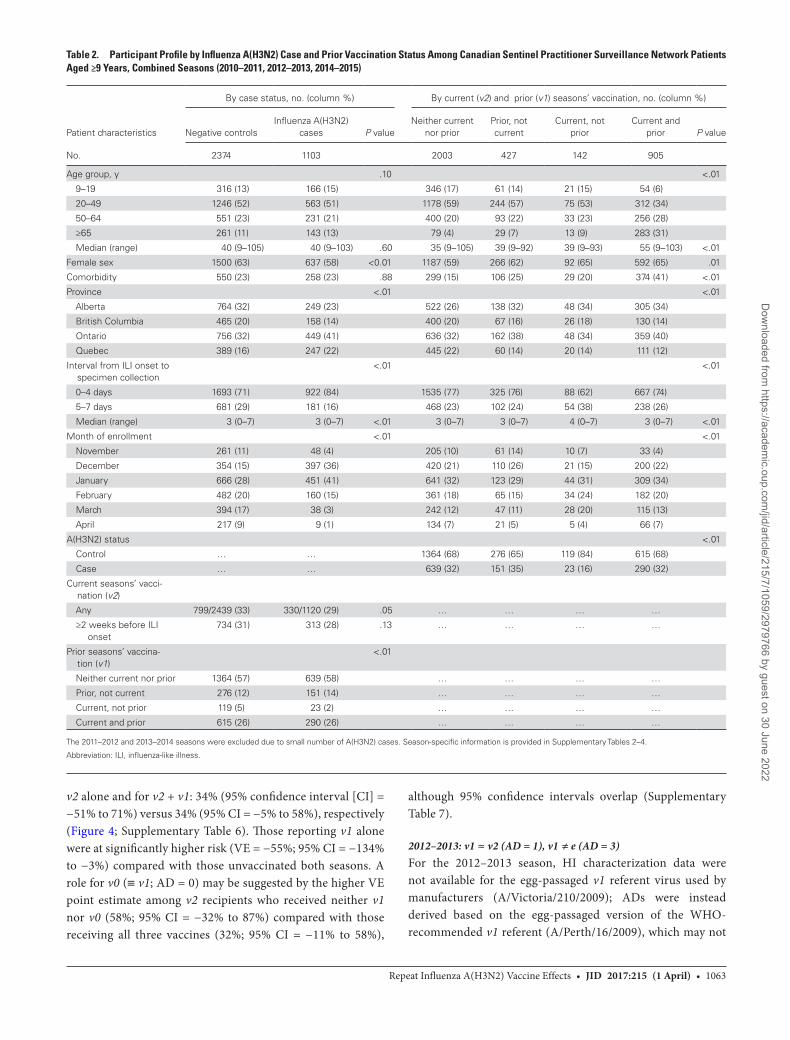
Table 2. Participant Profile by Influenza A(H3N2) Case and Prior Vaccination Status Among Canadian Sentinel Practitioner Surveillance Network Patients Aged ≥9 Years, Combined Seasons (2010–2011, 2012–2013, 2014–2015)
Patient characteristics
By case status, no. (column %) By current (v2) and prior (v1) seasons’ vaccination, no. (column %)
Negative controlsInfluenza A(H3N2)
cases P valueNeither current
nor priorPrior, not current
Current, not prior
Current and prior P value
No. 2374 1103 2003 427 142 905
Age group, y .10 <.01
9–19 316 (13) 166 (15) 346 (17) 61 (14) 21 (15) 54 (6)
20–49 1246 (52) 563 (51) 1178 (59) 244 (57) 75 (53) 312 (34)
50–64 551 (23) 231 (21) 400 (20) 93 (22) 33 (23) 256 (28)
≥65 261 (11) 143 (13) 79 (4) 29 (7) 13 (9) 283 (31)
Median (range) 40 (9–105) 40 (9–103) .60 35 (9–105) 39 (9–92) 39 (9–93) 55 (9–103) <.01
Female sex 1500 (63) 637 (58) <0.01 1187 (59) 266 (62) 92 (65) 592 (65) .01
Comorbidity 550 (23) 258 (23) .88 299 (15) 106 (25) 29 (20) 374 (41) <.01
Province <.01 <.01
Alberta 764 (32) 249 (23) 522 (26) 138 (32) 48 (34) 305 (34)
British Columbia 465 (20) 158 (14) 400 (20) 67 (16) 26 (18) 130 (14)
Ontario 756 (32) 449 (41) 636 (32) 162 (38) 48 (34) 359 (40)
Quebec 389 (16) 247 (22) 445 (22) 60 (14) 20 (14) 111 (12)
Interval from ILI onset to specimen collection
<.01 <.01
0–4 days 1693 (71) 922 (84) 1535 (77) 325 (76) 88 (62) 667 (74)
5–7 days 681 (29) 181 (16) 468 (23) 102 (24) 54 (38) 238 (26)
Median (range) 3 (0–7) 3 (0–7) <.01 3 (0–7) 3 (0–7) 4 (0–7) 3 (0–7) <.01
Month of enrollment <.01 <.01
November 261 (11) 48 (4) 205 (10) 61 (14) 10 (7) 33 (4)
December 354 (15) 397 (36) 420 (21) 110 (26) 21 (15) 200 (22)
January 666 (28) 451 (41) 641 (32) 123 (29) 44 (31) 309 (34)
February 482 (20) 160 (15) 361 (18) 65 (15) 34 (24) 182 (20)
March 394 (17) 38 (3) 242 (12) 47 (11) 28 (20) 115 (13)
April 217 (9) 9 (1) 134 (7) 21 (5) 5 (4) 66 (7)
A(H3N2) status <.01
Control … … 1364 (68) 276 (65) 119 (84) 615 (68)
Case … … 639 (32) 151 (35) 23 (16) 290 (32)
Current seasons’ vacci-nation (v2)
Any 799/2439 (33) 330/1120 (29) .05 … … … …
≥2 weeks before ILI onset
734 (31) 313 (28) .13 … … … …
Prior seasons’ vaccina-tion (v1)
<.01
Neither current nor prior 1364 (57) 639 (58) … … … …
Prior, not current 276 (12) 151 (14) … … … …
Current, not prior 119 (5) 23 (2) … … … …
Current and prior 615 (26) 290 (26) … … … …
The 2011–2012 and 2013–2014 seasons were excluded due to small number of A(H3N2) cases. Season-specific information is provided in Supplementary Tables 2–4.
Abbreviation: ILI, influenza-like illness.
Dow
nloaded from https://academ
ic.oup.com/jid/article/215/7/1059/2979766 by guest on 30 June 2022
1064 • JID 2017:215 (1 April) • Skowronski et al
be suitably representative (potentially underestimating ADs in relation to v1) (Supplementary Table 1). A pattern of negative interference by v1 on v2 was evident in the higher point esti-mate of VE in 2012–2013 for recipients of v2 alone than v2 + v1: 49% (95% CI = −47% to 83%) versus 28% (95% CI = −12% to 54%), although 95% confidence intervals overlap (Figure 4; Supplementary Table 6) and the interaction between v1 and v2 was not statistically significant. No added influence of v0 (≡ v1; AD = 0) was apparent (Supplementary Table 7). There was no residual protection from v1 alone (VE = 0%; 95% CI = −66% to 39%).
2014–2015: v1 ≡ v2 (AD = 0), v1 ≠ e (AD = 4)For the 2014–2015 season, only a small proportion of epi-demic viruses could be successfully characterized by HI assay [20]. A glycosylation motif unique to the wild-type clade 3C.2a epidemic strain was lost or partially lost with laboratory pas-sage, potentially affecting HI characterization data and derived v1/v2−e ADs (Supplementary Table 1) [20]. Pronounced and statistically significant negative interference by v1 on v2 (P < .01) was observed in 2014–2015. Vaccine effectiveness was sig-nificantly higher for recipients of v2 alone than v2 + v1: 65% (95% CI = 25% to 83%) versus −33% (95% CI = −78% to 1%)
0
0.1
0.2
0.3
0.4
0.5
0.6
0.7
0.8
2010–11 2011–12 2012–13 2013–14 2014–15
Prop
ortio
n
Negative controls
Neither current nor prior Prior, not current Current, not prior Current and prior
0
0.1
0.2
0.3
0.4
0.5
0.6
0.7
0.8
2010–11 2011–12 2012–13 2013–14 2014–15
Prop
ortio
n
Influenza A cases
Neither current nor prior Prior, not current Current, not prior Current and prior
0
0.1
0.2
0.3
0.4
0.5
0.6
0.7
0.8
2010–11 2011–12 2012–13 2013–14 2014–15
Prop
ortio
n
Influenza A(H3N2) cases
Neither current nor prior Prior, not current Current, not prior Current and prior
Small numbers; data not shown
Small numbers; data not shown
Figure 2. Prior vaccination (current and prior season) by year and case status among Canadian Sentinel Practitioner Surveillance Network patients aged ≥9 years, 2010–2011 to 2014–2015.
Dow
nloaded from https://academ
ic.oup.com/jid/article/215/7/1059/2979766 by guest on 30 June 2022
Repeat Influenza A(H3N2) Vaccine Effects • JID 2017:215 (1 April) • 1065
Cases (n)
Crude Crude CrudeAdjusted Adjusted Adjusted
2010–11 2012–13 2014–15
Controls (n) Cases (n) Controls (n) Cases (n) Controls (n)Not vaccinated
(øv2) 265 606 238 465 287 569
Vaccinated(+v2) 51 180 59 197 203 357
VE (9
5% C
I)
–50
50
3540 41
31
–13 –120
100
Figure 3. Crude and adjusted vaccine effectiveness (VE) estimates against influenza A(H3N2) among Canadian Sentinel Practitioner Surveillance Network patients aged ≥9 years for current season’s vaccine (v2) regardless of prior season’s (±v1, ±v0) vaccination status, 2010–2011, 2012–2013, 2014–2015 seasons. The 2011–2012 and 2013–2014 seasons are excluded due to small number of A(H3N2) cases. Vaccine effectiveness is relative to participants not vaccinated in the current season (øv2, ±v1, ±v0) derived as (1 − odds ratio) × 100%. Analyses adjusted for age group, sex, comorbidity, province, collection interval, and week of specimen collection (cubic B-spline functions with 3 equal knots). Abbreviations: CI, confidence interval; VE, vaccine effectiveness; v0, vaccine of 2 prior season’s ago; v1, prior season’s vaccine; v2, current season’s vaccine.
Figure 4. Adjusted vaccine effectiveness (VE) estimates against influenza A(H3N2) by current (v2) and/or prior (v1) season’s vaccination history among Canadian Sentinel Practitioner Surveillance Network patients aged ≥9 years, specified by vaccine–virus relatedness conditions and season (2010–2011, 2012–2013, 2014–2015). The 2011–2012 and 2013–2014 seasons are excluded due to small number of A(H3N2) cases. Analyses adjusted for age group, sex, comorbidity, province, collection interval, and week of specimen collection (cubic B-spline functions with 3 equal knots). Vaccine effectiveness relative to participants not vaccinated in the current or prior season without taking into account vaccination status 2 prior seasons ago (øv2, øv1, ± v0). Abbreviations: AD, antigenic distance; CI, confidence interval; VE, vaccine effectiveness; v0, vaccine of 2 prior season’s ago; v1, prior season’s vaccine; v2, current season’s vaccine; ≈, antigenically related; ≠, not antigenically related; ≡, identical.
Dow
nloaded from https://academ
ic.oup.com/jid/article/215/7/1059/2979766 by guest on 30 June 2022
1066 • JID 2017:215 (1 April) • Skowronski et al
(Figure 4; Supplementary Table 6). Increased risk among the repeatedly vaccinated compared with the consistently unvac-cinated was significant with further consideration of v0 (≈ v1; AD = 1) (OR = 1.47; 95% CI = 1.08–2.01) (Supplementary Table 7 and Supplementary Figure 4). Repeat vaccine recipients had significant 4-fold higher odds of medically attended A(H3N2) illness compared with those newly vaccinated in 2014–2015 (Supplementary Tables 6–7 and Supplementary Figure 5). There was no residual protection from v1 alone (VE = −7%; 95% CI = −59% to 28%) (Figure 4; Supplementary Table 6).
DISCUSSION
Using databases of the Canadian SPSN, we explored the extent to which repeat vaccination effects may have contributed to sub-optimal influenza vaccine performance during recent A(H3N2) epidemics in Canada. We interpret our findings within the framework of the ADH, comparing observed effects measured by the TND with predicted patterns based on the antigenic relatedness between prior season’s vaccine (v1), current sea-son’s vaccine (v2), and the circulating epidemic strain (e). This is the first modern attempt to directly correlate AD metrics with epidemiological observations of v1 effects and their overall fit within the ADH paradigm since it was first formulated nearly 2 decades ago.
Across the 3 A(H3N2) epidemics since 2010–2011 in Canada, no adjusted seasonal VE estimate exceeded 40%, even among mostly healthy, working-age adults. Each of these epidemics was associated with a vaccine-mismatched strain (v2≠e), although variation in VE was not obviously correlated with the AD (or match) between v2 and e. Adjusted VE was highest in 2010–2011 (40%; 95% CI = 9% to 60%), similar in 2012–2013 (31%; 95% CI = −4% to 55%), but dramatically lower in 2014–2015 (−12%; 95% CI = −47% to 15%) despite comparable v2–e ADs ranging 4–6. In the original report of the ADH, Smith et al also highlighted a lack of correlation between VE and the v2–e dis-tance in first-time vaccines [15]. Because A(H3N2) epidemics are associated with the greatest influenza disease burden [21], understanding the agent–host factors that contribute to low VE is critical. Our findings suggest that prior vaccination may mod-ify current VE and that this effect may vary by season according to the ADH. Given heterogeneity in the conditions of vaccine–virus relatedness, we should expect v1 effects on current season’s VE to vary by season. Pooling or averaging across seasons may enhance statistical power but at the risk of masking meaningful variation and insights to inform mechanisms and implications; further explorations of prior influenza vaccination effects should stratify results by season and subtype.
During the 3 A(H3N2) epidemics presented here, observed v1 effects included no modification, as well as significant neg-ative interference; we did not observe positive interference (ie, enhanced protection), also possible within the ADH frame-work but under specific conditions not found during epidemics
included here [15]. In 2010–2011, when v1 and v2 were antigen-ically distinct (v1 ≠ v2), minimal or no interaction was expected or observed. Conversely, with closer but nonhomologous v1 and v2 relatedness in 2012–2013 (v1 ≈ v2), the expected pattern of negative interference was apparent, although, with limited sample size, effect modification was not statistically significant. As anticipated based on the ADH, the negative effects of prior vaccination on the current season’s VE were most pronounced and statistically significant in 2014–2015 with homologous v1 and v2 antigens (v1 ≡ v2) and antigenically distinct circulating epidemic virus relative to v1 (v1 ≠ e).
Although antigenic drift has been widely emphasized to explain the historically low VE in 2014–2015, the AD between v2 and e was not estimated to be dramatically different from recent prior seasons [10, 11, 22–24]. Conversely, prior vaccina-tion had marked effects, negating the otherwise moderate VE observed among v2-only recipients despite vaccine mismatch. A similar pattern of moderate VE among v2-only recipients, substantially reduced with receipt of the prior season’s homol-ogous vaccine, was also reported for 2014–2015 in multicoun-try analysis from Europe [11] but not from the United States, where VE against A(H3N2) was negligible in all categories of current and prior vaccine recipients [23]. In the Canadian data, a dramatic increase in the distribution of influenza A(H3N2) cases reporting prior vaccination was observed in 2014–2015 whereas controls showed the expected trajectory of grad-ual increase, reflecting vaccine coverage trends in the general source population [25, 26]. In all seasons, vaccination status was based on patient self-report and practitioner documentation before either knew the patient’s case versus control status (ie, influenza test positivity result), minimizing differential recall bias and heightening the plausibility of the observation particu-lar to cases in 2014–2015.
In 2014–2015 in Canada, under the specific conditions of v0 ≈ v1 ≡ v2 ≠ e, serial vaccination was associated with a nearly 50% increased risk of medically attended A(H3N2) illness relative to participants who were consistently unvaccinated. Statistically significant increased risk (OR = 1.85; 95% CI = 1.17–2.90) of A(H3N2) illness in 2014–2015 was also reported from Italy, where vaccinated participants were also mostly repeat recipients [24]. The 2014–2015 epidemic is the first season in more than a decade of annual VE monitoring for which the Canadian SPSN reported vaccine-associated increased risk, and caution is war-ranted in its interpretation. However, increased risk was previ-ously reported by multiple studies from Canada and elsewhere during the 2009 A(H1N1)pdm09 pandemic in association with prior receipt of mismatched 2008–2009 seasonal vaccine, rep-licated also in at least 1 randomized controlled study in ferrets [27–31]. Influenza vaccine-associated enhanced respiratory disease (VAERD) is a well-recognized phenomenon following heterologous challenge in vaccinated swine, most of whom recover [32]. Although animal experiments may not be directly
Dow
nloaded from https://academ
ic.oup.com/jid/article/215/7/1059/2979766 by guest on 30 June 2022
Repeat Influenza A(H3N2) Vaccine Effects • JID 2017:215 (1 April) • 1067
relevant to human experience, elements of involved mechanis-tic pathways may overlap and inform biological plausibility.
The ADH is a useful conceptualization but is not amenable to exact extrapolation [15]. The originally published simulations were based on AD between v2 and e set at 2 with variability explored around v1–v2 and v1–e. Sensitivity analyses explored effects of homologous vaccination ranging up to a v2–e dis-tance of 3, but not greater. Emphasis was placed on the prior season’s vaccination; the effects of earlier or multiple prior virus or vaccine exposures were not considered. The ADH predicts relative, but not absolute, VE, and the possibility that serial vaccine receipt might be associated with increased risk under some conditions was not considered, although such signals may have already been evident in the studies by both Hoskins and Keitel under specific conditions of multiple repeat vac-cinations and v1, v2, and e relatedness [3, 4] (Supplementary Figures 1 and 2). The ADH is predicated on the HI assay, but variability in HI results by assay conditions must be acknowl-edged [16, 20]. For example, in 2 of 3 epidemics analyzed here (2010–2011, 2012–2013), Canada’s national influenza refer-ence laboratory characterized all viruses as well-matched to the WHO-recommended v2 reference strain (AD < 3) [8, 9, 33, 34]. Those characterizations, however, were in relation to the cell-passaged v2 referent (whereas manufacturers use an egg-adapted reassortant), included varying animal-source erythro-cytes, and did not include oseltamivir to address neuraminidase (NA)-mediated effects [8, 9]. We based our AD calculations on HI assays standardized for these conditions by the WHO Collaborating Centre for Reference and Research on Influenza (London) [19]. Even so, further variability in the mix of variants by setting, the representativeness of selected reference strains, and changes induced by laboratory passaging complicates AD derivation, interpretation, and generalization. Future evalua-tions and their extrapolation would benefit from the assembly of a standard and definitive library of HI characterizations and ADs between specific egg-passaged vaccine strains and circu-lating genetic variants each season. The incorporation of mod-ern genomic, bioinformatic mapping and antibody landscape approaches could also improve resolution in the understanding of vaccine-virus relatedness and response [35, 36].
Vaccine effects beyond those involving the HA1 (ie, HA2 or NA) and other agent-host immunological influences beyond (or complementary to) the ADH likely also play a role, including possible heterosubtypic effects of trivalent vaccine not otherwise considered. Original priming (eg, imprint-ing) and prominent recall (eg, back-boosting) responses to historic influenza exposures can shape hierarchical anti-body responses, with either positive or negative implications [37–42]. Annually repeated vaccination, compared with less frequent infection exposures, may accelerate antibody refo-cusing toward prior versus evolved epitopes, with selection for cross-reactive but non-neutralizing memory responses
[43]. In the context of preexisting antibody, immune com-plex formation and Fc-receptor activation can suppress B-cell response to subsequent influenza vaccine doses [44]. Antibody-dependent mechanisms may also suppress innate cytokine signaling pathways required for proinflammatory T-cell responses [45], and in children, annual repeat vaccina-tion has been reported to hamper development of virus-spe-cific CD8+ T-cell immunity [46]. Repeat vaccination may also select for T-cell responses that are antagonistic, such as pref-erential activation and/or recruitment of regulatory cells upon reexposure [47]. Such mechanisms may also modify risk in previous but not current vaccine recipients. Ultimately, the mechanisms to explain the potential negative effects of repeat vaccination remain unknown but are likely multifactorial, requiring a more complex systems approach to resolve [48].
Random and systematic error, including residual confound-ing and behavioral differences, may also contribute to findings. Few A(H3N2) epidemics were analyzed here, and each season represented a unique set of specific vaccine–virus relatedness conditions. Sample size in our indicator-variable analyses was also limited. Additional seasons are required before definitive conclusions can be drawn about correlation with the ADH. Population-based immunization registries are not available in Canada for the study period, but self-report is considered an accurate predictor of influenza vaccination status, as demon-strated in US analyses relative to registry data for both cur-rent [49] and prior season’s vaccination status (Ed Belongia Marshfield Clinic Research Foundation, personal communica-tion), especially among adults who comprise the majority (86%) of our participants. We have the greatest confidence in VE esti-mates for repeatedly vaccinated relative to consistently unvac-cinated participants, both in terms of reliable personal recall of vaccine history and also statistical certainty owing to sam-ple size, but less confidence in smaller subsets of participants reporting more erratic vaccination behaviors. Change in vacci-nation habit may be correlated with influenza risk, a bias that has been raised previously in deriving VE estimates in elderly adults based on administrative datasets but also potentially relevant in assessing current/prior vaccination effects using an observa-tional design [50]. First-time vaccinees may have been newly motivated to receive influenza vaccine because of recent acute respiratory illness, possibly due to influenza. In the context of recent prior infection, vaccine responses may be enhanced [51] and/or VE may be overestimated through confounding by more durable and cross-protective infection-induced immunity. We did not have data available on prior infection history, but the proportion of newly vaccinated individuals with that recent history would have to be substantial to meaningfully influence VE estimates. Prior vaccination may have conversely blocked opportunity to acquire infection-induced immunity (ie, infec-tion-block hypothesis), leading to underestimation of VE in the recurrently vaccinated—an indirect mechanism for repeat
Dow
nloaded from https://academ
ic.oup.com/jid/article/215/7/1059/2979766 by guest on 30 June 2022
1068 • JID 2017:215 (1 April) • Skowronski et al
vaccination effects originally favored by Hoskins but insuf-ficient to fully explain observed effects of vaccine-associated increased risk [3, 27, 31].
In summary, serial vaccination may have contributed to poor influenza vaccine performance during recent A(H3N2) epi-demics in Canada. The ADH remains a useful framework for reconciling variability in repeat vaccination effects but requires update to incorporate recent epidemiological findings, modern and standardized laboratory approaches for monitoring vac-cine–virus relatedness and response, and a broader understand-ing of immunological context and consequences. Integrated immuno-epidemiological evaluation across an extended hori-zon is needed to understand the spectrum of repeat vaccination effects and to determine whether annual influenza vaccina-tion is likely to provide long-term advantage at the individual or population levels—a return to the question first posed by Hoskins 40 years ago [3].
Supplementary DataSupplementary materials are available at The Journal of Infectious Diseases online. Consisting of data provided by the authors to benefit the reader, the posted materials are not copyedited and are the sole responsibility of the authors, so questions or comments should be addressed to the correspond-ing author.
NotesAcknowledgments. The authors gratefully acknowledge the contribu-
tion of those at the sentinel sites whose regular submission of specimens and data provided the basis of our analyses. The authors acknowledge the coordi-nation and technical support provided by epidemiologic and laboratory staff in all participating provinces. The authors thank the following for network coordination and data entry activities in each province: Lisan Kwindt for national database management and sentinel network coordination activi-ties in British Columbia; Elaine Douglas, Kinza Rizvi, Sandra Berzins, and Kasim Qureshi for TARRANT in Alberta; Romy Olsha for Public Health Ontario; and Sophie Auger for the Institut national de santé publique du Québec. The authors thank those who provided laboratory support at the British Columbia Centre for Disease Control Public Health Laboratory, the Alberta Provincial Laboratory for Public Health (ProvLab), the Public Health Ontario Laboratory, the Laboratoire de santé publique du Québec and the National Microbiology Laboratory in Manitoba. The authors thank Dr Alireza Eshaghi of the Public Health Ontario Laboratory for genomic support, Dr Robert Balshaw of the British Columbia Centre for Disease Control for statistical support and consultation, and Dr Naveed Janjua of the British Columbia Centre for Disease Control for his previous work with the SPSN. The authors acknowledge the WHO Collaborating Centre for Reference and Research on Influenza (London) for the antigenic character-izations upon which their antigenic distance analyses are based. Finally, the authors acknowledge the authors and originating and submitting laborato-ries of the reference virus sequences from Global Initiative on Sharing All Influenza Data’s EpiFlu Database (www.gisaid.org) that informed genetic comparisons.
Financial support. Funding was provided by the Canadian Institutes of Health Research (grant TPA-90193), the British Columbia Centre for Disease Control, Alberta Health and Wellness, Public Health Ontario, Ministère de la santé et des services sociaux du Québec, l’Institut national de santé publique du Québec, and the Public Health Agency of Canada. S. S. was funded by the Canadian Institutes of Health Research (grant TPA-90193) and by the Public Health Agency of Canada. D. J. S. is funded by the US National Institute of Allergy and Infectious Diseases–National Institutes of Health Centers of Excellence for Influenza Research and Surveillance
contract HHSN272201400008C. Additional funding was provided by the Public Health Agency of Canada and the Bill & Melinda Gates Foundation in support of the I-ReV (Influenza-Repeat Vaccination) Symposium held in Vancouver, British Columbia, Canada in October 2016, enabling multi-dis-ciplinary discussion of related epidemiological findings and their possible immunological mechanisms.
Potential conflicts of interest. G. D. S. has received grants unrelated to influenza from GSK and Pfizer and travel reimbursement to attend an ad hoc advisory board meeting of GSK also unrelated to influenza; he has provided paid expert testimony in a grievance against a vaccinate-or-mask healthcare worker influenza vaccination policy for the Ontario Nurse Association. J. G. has received research grants from GlaxoSmithKline Inc and Hoffman-La Roche Ltd to study antiviral resistance in influenza, and from Pfizer Inc to conduct microbiological surveillance of Streptococcus pneumoniae. M. K. has received research grants from Roche, Merck, Siemens, Hologic, and Boerhinger Ingelheim for unrelated studies. All other authors: No reported conflicts. All authors have submitted the ICMJE Form for Disclosure of Potential Conflicts of Interest. Conflicts that the editors consider relevant to the content of the manuscript have been disclosed.
References
1. Hoskins TW, Davies JR, Allchin A, Miller CL, Pollock TM. Controlled trial of inactivated influenza vaccine containing the A-Hong Kong strain during an out-break of influenza due to the A-England-42-72 strain. Lancet 1973; 2:116–20.
2. Hoskins TW, Davies JR, Smith AJ, Allchin A, Miller CL, Pollock TM. Influenza at Christ’s Hospital: March, 1974. Lancet 1976; 1:105–8.
3. Hoskins TW, Davies JR, Smith AJ, Miller CL, Allchin A. Assessment of inacti-vated influenza-A vaccine after three outbreaks of influenza A at Christ’s Hospital. Lancet 1979; 1:33–5.
4. Keitel WA, Cate TR, Couch RB, Huggins LL, Hess KR. Efficacy of repeated annual immunization with inactivated influenza virus vaccines over a five year period. Vaccine 1997; 15:1114–22.
5. McLean HQ, Thompson MG, Sundaram ME, et al. Impact of repeated vaccination on vaccine effectiveness against influenza A(H3N2) and B during 8 seasons. Clin Infect Dis 2014; 59:1375–85.
6. Thompson MG, Li DK, Shifflett P, et al.; Pregnancy and Influenza Project Workgroup. Effectiveness of seasonal trivalent influenza vaccine for preventing influenza virus illness among pregnant women: a population-based case-control study during the 2010-2011 and 2011-2012 influenza seasons. Clin Infect Dis 2014; 58:449–57.
7. McLean HQ, Thompson MG, Sundaram ME, et al. Influenza vaccine effectiveness in the United States during 2012–2013: variable protection by age and virus type. J Infect Dis 2015; 211:1529–40.
8. Skowronski DM, Janjua NZ, De Serres G, et al. A sentinel platform to evaluate influenza vaccine effectiveness and new variant circulation, Canada 2010–2011 season. Clin Infect Dis 2012; 55:332–42.
9. Skowronski DM, Janjua NZ, De Serres G, et al. Low 2012-13 influenza vaccine effectiveness associated with mutation in the egg-adapted H3N2 vaccine strain not antigenic drift in circulating viruses. PLoS One 2014; 9:e92153.
10. Skowronski DM, Chambers C, Sabaiduc S, et al. A perfect storm: impact of genomic variation and serial vaccination on low influenza vaccine effectiveness during the 2014-2015 season. Clin Infect Dis 2016; 63:21–32.
11. Valenciano M, Kissling E, Reuss A, Rizzo C, Gherasim A, Horváth JK, et al. Vaccine effectiveness in preventing laboratory-confirmed influenza in primary care patients in a season of co-circulation of influenza A(H1N1)pdm09, B and drifted A(H3N2), I-MOVE multicentre case–control study, Europe 2014/15. Euro Surveill 2016; 21: pii:30139.
12. Thompson MG, Naleway A, Fry AM, et al. Effects of repeated annual inactivated influenza vaccination among healthcare personnel on serum hemagglutinin inhi-bition antibody response to A/Perth/16/2009 (H3N2)-like virus during 2010-11. Vaccine 2016; 34:981–8.
13. Ohmit SE, Petrie JG, Malosh RE, Fry AM, Thompson MG, Monto AS. Influenza vaccine effectiveness in households with children during the 2012–2013 season: assessments of prior vaccination and serologic susceptibility. J Infect Dis 2015; 211:1519–28.
14. Beyer WE, de Bruijn IA, Palache AM, Westendorp RG, Osterhaus AD. Protection against influenza after annually repeated vaccination: a meta-analysis of serologic and field studies. Arch Intern Med 1999; 159:182–8.
15. Smith DJ, Forrest S, Ackley DH, Perelson AS. Variable efficacy of repeated annual influenza vaccination. Proc Natl Acad Sci U S A 1999; 96:14001–6.
Dow
nloaded from https://academ
ic.oup.com/jid/article/215/7/1059/2979766 by guest on 30 June 2022
Repeat Influenza A(H3N2) Vaccine Effects • JID 2017:215 (1 April) • 1069
16. Katz JM, Hancock K, Xu X. Serologic assays for influenza surveillance, diagnosis and vaccine evaluation. Expert Rev Anti Infect Ther 2011; 9:669–83.
17. Belongia EA, Simpson MD, King JP, et al. Variable influenza vaccine effectiveness by subtype: a systematic review and meta-analysis of test-negative design studies. Lancet Infect Dis 2016; 16:942–51.
18. World Health Organization. WHO recommendations on the composition of influ-enza virus vaccines. http://www.who.int/influenza/vaccines/virus/recommenda-tions/en/. Accessed 30 November 2016.
19. Francis Crick Institute. Annual and interim reports. https://www.crick.ac.uk/research/worldwide-influenza-centre/annual-and-interim-reports/. Accessed 30 November, 2016.
20. Skowronski DM, Sabaiduc S, Chambers C, et al. Mutations acquired during cell culture isolation may affect antigenic characterisation of influenza A(H3N2) clade 3C.2a viruses. Euro Surveill 2016; 21:30112.
21. Thompson MG, Shay DK, Zhou H, et al. Estimates of deaths associated with seasonal influenza—United States, 1976–2007. Morb Mortal Wkly Rep 2010; 59:1057–62. http://www.cdc.gov/mmwr/preview/mmwrhtml/mm5933a1.htm?s_cid=mm5933a1_w. Accessed 30 November 2016.
22. Flannery B, Zimmerman RK, Gubareva LV, et al. Enhanced genetic characteri-zation of influenza A(H3N2) viruses and vaccine effectiveness by genetic group, 2014-2015. J Infect Dis 2016; 214:1010–9.
23. Zimmerman RK, Nowalk MP, Chung J, et al. 2014–2015 influenza vaccine effec-tiveness in the United States by vaccine type. Clin Infect Dis 2016; 63:1564–73.
24. Rizzo C, Bella A, Alfonsi V, et al. Influenza vaccine effectiveness in Italy: Age, sub-type-specific and vaccine type estimates 2014/15 season. Vaccine 2016; 34:3102–8.
25. Public Health Agency of Canada. Vaccine coverage amongst adult Canadians: results from the 2012 adult National Immunization Coverage (aNIC) survey. http://www.phac-aspc.gc.ca/im/nics-enva/vcac-cvac-eng.php. Accessed 30 November 2016.
26. Government of Canada. Vaccine uptake in Canadian adults: results from the 2014 adult National Immunization Coverage Survey (aNICS). http://www.healthycanadians.gc.ca/publications/healthy-living-vie-saine/vaccine-coverage-adults-results-2014-re-sultats-couverture-vaccinale-adultes/index-eng.php. Accessed 30 November 2016.
27. Skowronski DM, De Serres G, Crowcroft NS, et al.; Canadian SAVOIR Team. Association between the 2008–09 seasonal influenza vaccine and pandemic H1N1 illness during Spring-Summer 2009: four observational studies from Canada. PLoS Med 2010; 7:e1000258.
28. Gilca R, Deceuninck G, De Serres G, et al. Effectiveness of pandemic H1N1 vaccine against influenza-related hospitalization in children. Pediatrics 2011; 128:e1084–91.
29. Crum-Cianflone NF, Blair PJ, Faix D, et al. Clinical and epidemiologic characteris-tics of an outbreak of novel H1N1 (swine origin) influenza A virus among United States military beneficiaries. Clin Infect Dis 2009; 49:1801–10.
30. Tsuchihashi Y, Sunagawa T, Yahata Y, et al. Association between seasonal influenza vaccination in 2008-2009 and pandemic influenza A (H1N1) 2009 infection among school students from Kobe, Japan, April-June 2009. Clin Infect Dis 2012; 54:381–3.
31. Skowronski DM, Hamelin ME, De Serres G, et al. Randomized controlled ferret study to assess the direct impact of 2008-09 trivalent inactivated influenza vaccine on A(H1N1)pdm09 disease risk. PLoS One 2014; 9:e86555.
32. Gauger PC, Vincent AL, Loving CL, et al. Kinetics of lung lesion development and pro-inflammatory cytokine response in pigs with vaccine-associated enhanced respiratory disease induced by challenge with pandemic A/H1N1 influenza virus. Vet Pathol 2012; 49:900–12.
33. Public Health Agency of Canada. Statement on seasonal influenza vaccine for 2011–12. An Advisory Committee Statement (ACS). National Advisory Committee on Immunization (NACI). Canada Communicable Disease Report 2011; 37:1–55. http://www.phac-aspc.gc.ca/publicat/ccdr-rmtc/11vol37/acs-dcc-5/index-eng.php. Accessed 30 November 2016.
34. Public Health Agency of Canada. Statement on seasonal influenza vaccine for 2013–14. National Advisory Committee on Immunization (NACI). Canada Communicable Disease Report 2013; 39:1–37. http://www.phac-aspc.gc.ca/pub-licat/ccdr-rmtc/13vol39/acs-dcc-4/index-eng.php. Accessed 30 November 2016.
35. Fonville JM, Wilks SH, James SL, et al. Antibody landscapes after influenza virus infection or vaccination. Science 2014; 346:996–1000.
36. Neher RA, Bedford T, Daniels RS, Russell CA, Shraiman BI. Prediction, dynamics, and visualization of antigenic phenotypes of seasonal influenza viruses. Proc Natl Acad Sci U S A 2016; 113:E1701–9.
37. Morens DM, Burke DS, Halstead SB. The wages of original antigenic sin. Emerg Infect Dis 2010; 16:1023–4.
38. Skowronski DM, Hottes TS, McElhaney JE, et al. Immuno-epidemiologic correlates of pandemic H1N1 surveillance observations: higher antibody and lower cell-me-diated immune responses with advanced age. J Infect Dis 2011; 203:158–67.
39. Skowronski DM, Janjua NZ, De Serres G, et al. Cross-reactive and vaccine-in-duced antibody to an emerging swine-origin variant of influenza A virus subtype H3N2 (H3N2v). J Infect Dis 2012; 206:1852–61.
40. Miller MS, Gardner TJ, Krammer F, et al. Neutralizing antibodies against previ-ously encountered influenza virus strains increase over time: a longitudinal analy-sis. Sci Transl Med 2013; 5:198ra107.
41. Hensley SE. Challenges of selecting seasonal influenza vaccine strains for humans with diverse pre-exposure histories. Curr Opin Virol 2014; 8:85–9.
42. Gostic KM, Ambrose M, Worobey M, Lloyd-Smith JO. Potent protection against H5N1 and H7N9 influenza via childhood hemagglutinin imprinting. Science 2016; 354:722–6.
43. Huang KY, Rijal P, Schimanski L, et al. Focused antibody response to influenza linked to antigenic drift. J Clin Invest 2015; 125:2631–45.
44. O’Gorman WE, Huang H, Wei YL, et al. The split virus influenza vaccine rapidly activates immune cells through Fcγ receptors. Vaccine 2014; 32:5989–97.
45. Halstead SB, Mahalingam S, Marovich MA, Ubol S, Mosser DM. Intrinsic anti-body-dependent enhancement of microbial infection in macrophages: disease regulation by immune complexes. Lancet Infect Dis 2010; 10:712–22.
46. Bodewes R, Fraaij PL, Geelhoed-Mieras MM, et al. Annual vaccination against influenza virus hampers development of virus-specific CD8⁺ T cell immunity in children. J Virol 2011; 85:11995–2000.
47. Ndifon W. A simple mechanistic explanation for original antigenic sin and its alle-viation by adjuvants. J R Soc Interface 2015; 12:20150627.
48. Tsang JS. Utilizing population variation, vaccination, and systems biology to study human immunology. Trends Immunol 2015; 36:479–93.
49. Irving SA, Donahue JG, Shay DK, Ellis-Coyle TL, Belongia EA. Evaluation of self-reported and registry-based influenza vaccination status in a Wisconsin cohort. Vaccine 2009; 27:6546–9.
50. Hottes TS, Skowronski DM, Hiebert B, et al. Influenza vaccine effectiveness in the elderly based on administrative databases: change in immunization habit as a marker for bias. PLoS One 2011; 6:e22618.
51. Davies JR, Grilli EA. Natural or vaccine-induced antibody as a predictor of immu-nity in the face of natural challenge with influenza viruses. Epidemiol Infect 1989; 102:325–33.
Dow
nloaded from https://academ
ic.oup.com/jid/article/215/7/1059/2979766 by guest on 30 June 2022
Related Documents