Trans. Nonferrous Met. Soc. China 30(2020) 76−89 Effects of welding parameters and welding sequence on residual stress and distortion in Al6061-T6 aluminum alloy for T-shaped welded joint Amirreza KHOSHROYAN 1 , Armin Rahmati DARVAZI 2 1. Department of Marine Technology, Amirkabir University of Technology, Tehran, Iran; 2. Faculty of Technology and Engineering (East of Guilan), University of Guilan, Rudsar, Iran Received 1 April 2019; accepted 19 August 2019 Abstract: The distribution of temperature and then the distribution of residual stress and distortion in the stiffened aluminum alloy Al6061-T6 plates under the metal inert gas (MIG) welding process were investigated by three dimensional thermo-mechanical coupled finite element model using Ansys software. The properties of materials were considered temperature-dependent and the filler metal was added to the workpiece by the element birth and death technique. In three modes of current, two different speeds and two various sequences, the distribution of residual stress and distortion were calculated and analyzed. The results showed that increase in welding speed decreased the vertical deflection in the plate, transverse shrinkage and angular distortion of plate and the lateral deflection of stiffener, but increased the maximum longitudinal tensile stress in the plate and stiffener. Furthermore, increase in current increased the residual stress and deformation in the plate and stiffener, and the change in the welding sequence changed the distribution of the distortion in the plate and the stiffener without significant change in the distribution of the longitudinal residual stress. Key words: welding parameters; welding sequence; residual stress; distortion 1 Introduction Aluminum alloy Al6061 is a combination of aluminum, silicon and magnesium alloys. This alloy is commonly used for a wide range of products, including car parts, airplanes and aerospace supplies, marine industries, and so on. Al6061 has high hardness, corrosion resistance and wear resistance as well as good welding and fatigue resistance [1]. A major progress in the production of aluminum and its alloys came about with the development of the inert gas shielded welding processes of MIG (metal inert gas) and TIG (tungsten inert gas). These arc welding processes made a high strength weld without the need for aggressive fluxes [2]. The MIG welding is much faster and easier to learn, and so is more common than TIG welding. In MIG welding, the generated heat is produced by an electric arc between a consumable wire electrode and the base metal, and then the solid wire electrode feeds continuously through the arc into the weld pool, which finally becomes the weld filler metal [3]. When two plates are welded together, residual stresses and distortions are generated in the vicinity of the weld zone as a result of plastic deformation due to the non-uniform thermal expansion and contraction in the welding process [4]. The residual stress and distortion can extensively weaken the performance and consistency of the welded assembly [5], and welding parameters play a significant role in controlling them and leading to a good weld. The welding parameters that are controlled to produce an acceptable weld are current, voltage, wire feed speed, welding speed, current density and Corresponding author: Armin Rahmati DARVAZI; E-mail: [email protected] DOI: 10.1016/S1003-6326(19)65181-2

Welcome message from author
This document is posted to help you gain knowledge. Please leave a comment to let me know what you think about it! Share it to your friends and learn new things together.
Transcript
Trans. Nonferrous Met. Soc. China 30(2020) 76−89
Effects of welding parameters and welding sequence on residual stress and
distortion in Al6061-T6 aluminum alloy for T-shaped welded joint
Amirreza KHOSHROYAN1, Armin Rahmati DARVAZI2
1. Department of Marine Technology, Amirkabir University of Technology, Tehran, Iran; 2. Faculty of Technology and Engineering (East of Guilan), University of Guilan, Rudsar, Iran
Received 1 April 2019; accepted 19 August 2019
Abstract: The distribution of temperature and then the distribution of residual stress and distortion in the stiffened aluminum alloy Al6061-T6 plates under the metal inert gas (MIG) welding process were investigated by three dimensional thermo-mechanical coupled finite element model using Ansys software. The properties of materials were considered temperature-dependent and the filler metal was added to the workpiece by the element birth and death technique. In three modes of current, two different speeds and two various sequences, the distribution of residual stress and distortion were calculated and analyzed. The results showed that increase in welding speed decreased the vertical deflection in the plate, transverse shrinkage and angular distortion of plate and the lateral deflection of stiffener, but increased the maximum longitudinal tensile stress in the plate and stiffener. Furthermore, increase in current increased the residual stress and deformation in the plate and stiffener, and the change in the welding sequence changed the distribution of the distortion in the plate and the stiffener without significant change in the distribution of the longitudinal residual stress. Key words: welding parameters; welding sequence; residual stress; distortion
1 Introduction
Aluminum alloy Al6061 is a combination of aluminum, silicon and magnesium alloys. This alloy is commonly used for a wide range of products, including car parts, airplanes and aerospace supplies, marine industries, and so on. Al6061 has high hardness, corrosion resistance and wear resistance as well as good welding and fatigue resistance [1].
A major progress in the production of aluminum and its alloys came about with the development of the inert gas shielded welding processes of MIG (metal inert gas) and TIG (tungsten inert gas). These arc welding processes made a high strength weld without the need for aggressive fluxes [2]. The MIG welding is much faster and easier to learn, and so is more common
than TIG welding. In MIG welding, the generated heat is produced by an electric arc between a consumable wire electrode and the base metal, and then the solid wire electrode feeds continuously through the arc into the weld pool, which finally becomes the weld filler metal [3].
When two plates are welded together, residual stresses and distortions are generated in the vicinity of the weld zone as a result of plastic deformation due to the non-uniform thermal expansion and contraction in the welding process [4]. The residual stress and distortion can extensively weaken the performance and consistency of the welded assembly [5], and welding parameters play a significant role in controlling them and leading to a good weld.
The welding parameters that are controlled to produce an acceptable weld are current, voltage, wire feed speed, welding speed, current density and
Corresponding author: Armin Rahmati DARVAZI; E-mail: [email protected] DOI: 10.1016/S1003-6326(19)65181-2
Amirreza KHOSHROYAN, Armin Rahmati DARVAZI/Trans. Nonferrous Met. Soc. China 30(2020) 76−89
77
preheat temperature [5]. To obtain a good quality weld and subsequently increase the productivity of the process, it is therefore, necessary to control the input welding parameters. The welding parameters are normally selected based on the experience. This selection procedure does not lead to the optimal and economical use of the machinery and good quality of the surface [6]. Therefore, in order to save time and cost of experiments, the numerical techniques can be employed to simulate welding process and optimize welding parameters.
FRANCIS [7] simulated the welding process for butt and T-joints for 2000 series aluminum alloys using two solid and solid-shell models with finite element method and compared the results with previous experimental data. BRADÁČ [8] calibrated the heat source parameters for Gaussian and double-ellipsoidal models after comparison between numerical results and experimental data. MOHAMAD et al [9] investigated the welding process on two 6061 aluminum alloys and SUS304 stainless steel products. The welding was performed by the MIG welding process in the butt form and with preheating treatment. They concluded that the optimal parameters for welding of Al6061 and SUS304 were the preheating temperature of 90 °C, the voltage of 17.5 V, and the current of 110 A. CHIKHALE et al [10] investigated welding of Al6061 at various currents and speeds based on the British welding specification which was performed by means of a semi-automatic MIG device capable of varying the current and voltage in the range of 10−420 A and 10−41 V. Then, they performed toughness and tensile tests on the workpiece. The largest failure was observed in the HAZ region, so they concluded that the HAZ region could be smaller if the welding parameters such as welding speed, voltage and current were selected correctly.
LI et al [11] welded Al6061-T6 to A356-T6 plates with the thickness of 4 mm in T-joint form. They studied the effect of welding current and welding speed on weld geometry, microstructure and mechanical properties of the welded plates. BAHARNEZHAD and GOLHIN [12] examined the effect of crucial parameters on thermal, mechanical, and microstructural behaviors in the MIG welding process of Al6063 by simulation and experiment. The thermo-mechanical model was simulated by Abaqus software, and the temperature distribution and residual stress were obtained. Then, the
simulation results were compared with the experimental data. The results showed that the simulation could exactly predict the temperature and stress distributions. VARGAS JAVIER et al [13] simulated the welding of a 4.8 mm aluminum alloy 6061-T6 plate with a MIG welding process at various currents, voltages and welding speeds by finite element method, and compared the calculated temperature with the experimental data. ISMAIL and AFIEQ [14] simulated the MIG welding process by the nonlinear finite element method and investigated the effect of the changing of the voltage and welding speed on the heat distribution in the transition state using Gaussian heat source. Comparing the temperature distribution and the geometry of weld with the experimental data showed that the change in voltage and welding speed had a significant effect on the distribution of the temperature, and the shape and size of the fillet bead of weld.
FU et al [15] studied the effects of the welding sequence on the residual stress in TIG welding process of the Al6061-T6 alloy. They concluded that the final stresses in the weld and its vicinity are not affected by the initial stresses of the material. However, these can be reduced by selecting an appropriate sequence of welding. BONAZZI et al [16] simulated the welding process of aluminum thin plates in a three-dimensional model using Abaqus software and compared the simulated results with the experimental data. The simulation could predict the transient temperature and the distribution of distortion and residual stresses on the surface and inside of the plate with a thickness of 2 mm in T-joint welded by the MIG welding process. YI et al [17] studied the effect of current on the shape and the residual stress of stiffened plate Al6061-T6 welded by MIG technique numerically and experimentally. The simulation was carried out in a three-dimensional form with a double- ellipsoidal heat source. The results showed that in this case, the best current is 90 A, and the temperature in the filler metal is 200 °C above the fusion points. The T-shaped aluminum alloy in these conditions had suitable welding conditions so that it had a smooth surface, a perfect shape and a fine structure, and the calculated thermal curves and the residual stresses were well adapted to the experimental data.
A number of researches have been done to
Amirreza KHOSHROYAN, Armin Rahmati DARVAZI/Trans. Nonferrous Met. Soc. China 30(2020) 76−89
78
study the stress and the distortion caused by welding of steel stiffened plates [18−21], but there are few researches about T-joint welding of aluminum alloy Al6061-T6, which are welded by MIG welding process. Therefore, in this work, a 3D thermo-mechanical coupled finite element model is presented using Ansys software to investigate the distribution of temperature, residual stress and distortion in a T-shaped stiffened aluminum alloy plate welded by MIG welding process. After verification of the model, the simulation in three speeds of 10, 9 and 8 mm/s and three welding currents of 220, 190 and 170 A were carried out. Since the welding sequence has a significant effect on the residual stress and distortion, all the welding simulations were also performed in the second sequence. Then, the effect of various welding parameters such as current, speed, and sequences on the distribution of residual stress and distortion, such as vertical deflection in the plate, transverse shrinkage and angular distortion of plate and, the lateral deflection of stiffener, were investigated. 2 Finite element modelling 2.1 Geometry and mesh pattern
In order to simulate the welding process, firstly, the thermal analysis is carried out. The thermal analysis results are considered as loading for the mechanical analysis. To calculate residual stresses and distortions, the temperature of the nodes calculated in the transient thermal analysis for each step is used as thermal body load in the nonlinear mechanical analysis that is then performed. Because of the high temperature gradient in the weld line, the thermal and mechanical properties of the material are considered to be temperature- dependent. The residual stress and distortion are the final responses of the simulation of the welding process.
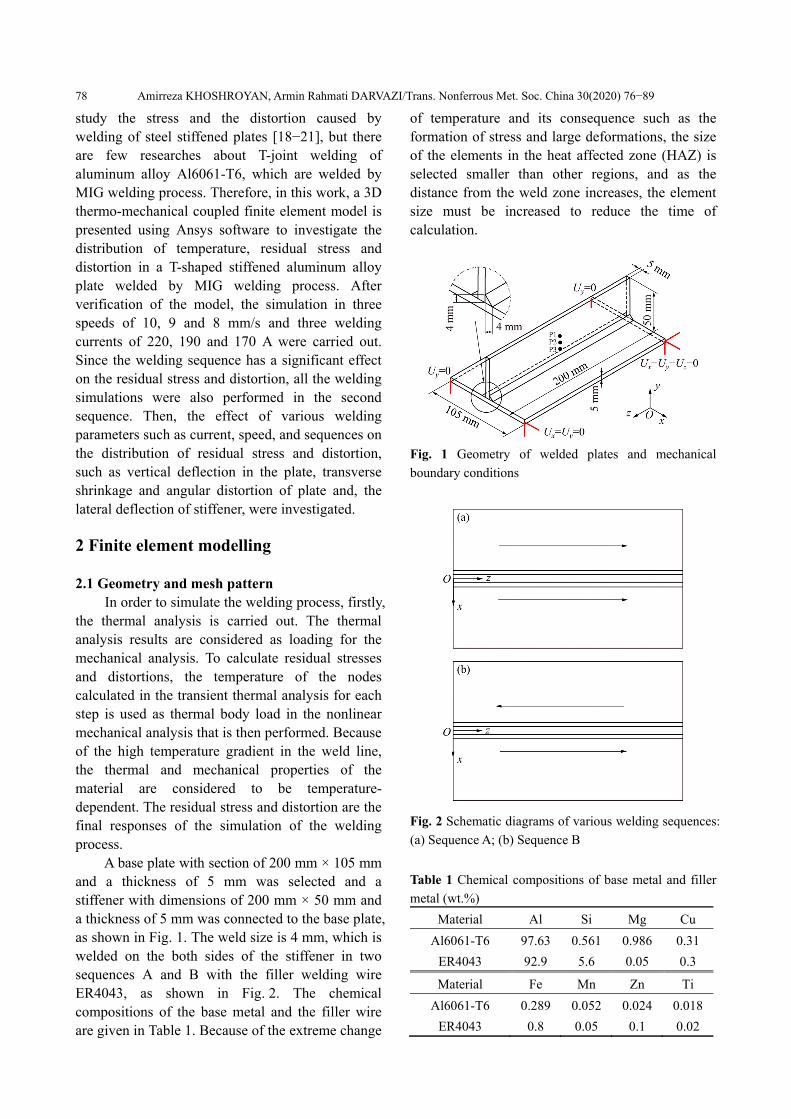
A base plate with section of 200 mm × 105 mm and a thickness of 5 mm was selected and a stiffener with dimensions of 200 mm × 50 mm and a thickness of 5 mm was connected to the base plate, as shown in Fig. 1. The weld size is 4 mm, which is welded on the both sides of the stiffener in two sequences A and B with the filler welding wire ER4043, as shown in Fig. 2. The chemical compositions of the base metal and the filler wire are given in Table 1. Because of the extreme change
of temperature and its consequence such as the formation of stress and large deformations, the size of the elements in the heat affected zone (HAZ) is selected smaller than other regions, and as the distance from the weld zone increases, the element size must be increased to reduce the time of calculation.
Fig. 1 Geometry of welded plates and mechanical
boundary conditions
Fig. 2 Schematic diagrams of various welding sequences:
(a) Sequence A; (b) Sequence B
Table 1 Chemical compositions of base metal and filler
metal (wt.%)
Material Al Si Mg Cu
Al6061-T6 97.63 0.561 0.986 0.31
ER4043 92.9 5.6 0.05 0.3
Material Fe Mn Zn Ti
Al6061-T6 0.289 0.052 0.024 0.018
ER4043 0.8 0.05 0.1 0.02
Amirreza KHOSHROYAN, Armin Rahmati DARVAZI/Trans. Nonferrous Met. Soc. China 30(2020) 76−89
79
Simulation of welding in 9 different modes is given in Table 2. At first, in order to investigate the accuracy of the simulation, the finite element model is correlated with the experimental data from the previous research ]17[ . In this mode, the thickness of the plate and stiffener is 2 mm, and welding on one side of stiffener has been done.
Table 2 Values of welding parameters
Welding
mode
I/
A
U/
V
Velocity/
(mmꞏs−1) Sequence
Qtotal/
(Jꞏs−1)
Heat
input/
(Jꞏmm−1)
N1a 170 22 8 A 2992 467.5
N1b 170 22 8 B 2992 467.5
N2a 190 22 8 A 3344 522.5
N2b 190 22 8 B 3344 522.5
N3a 190 22 10 A 3344 418
N3b 190 22 10 B 3344 418
N4a 220 22 10 A 3872 484
N4b 220 22 10 B 3872 484
N5 190 22 9 A 3344 464.44
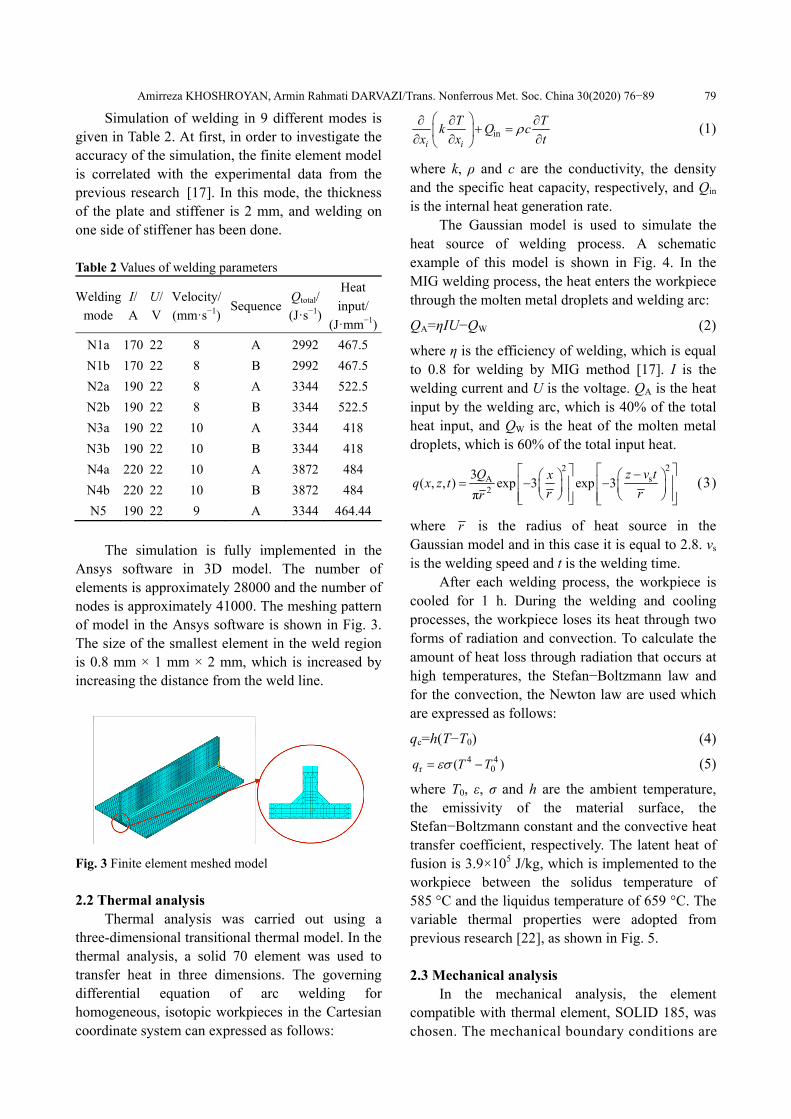
The simulation is fully implemented in the
Ansys software in 3D model. The number of elements is approximately 28000 and the number of nodes is approximately 41000. The meshing pattern of model in the Ansys software is shown in Fig. 3. The size of the smallest element in the weld region is 0.8 mm × 1 mm × 2 mm, which is increased by increasing the distance from the weld line.
Fig. 3 Finite element meshed model
2.2 Thermal analysis
Thermal analysis was carried out using a three-dimensional transitional thermal model. In the thermal analysis, a solid 70 element was used to transfer heat in three dimensions. The governing differential equation of arc welding for homogeneous, isotopic workpieces in the Cartesian coordinate system can expressed as follows:
ini i
T Tk Q c
x x t
(1)
where k, ρ and c are the conductivity, the density and the specific heat capacity, respectively, and Qin is the internal heat generation rate.
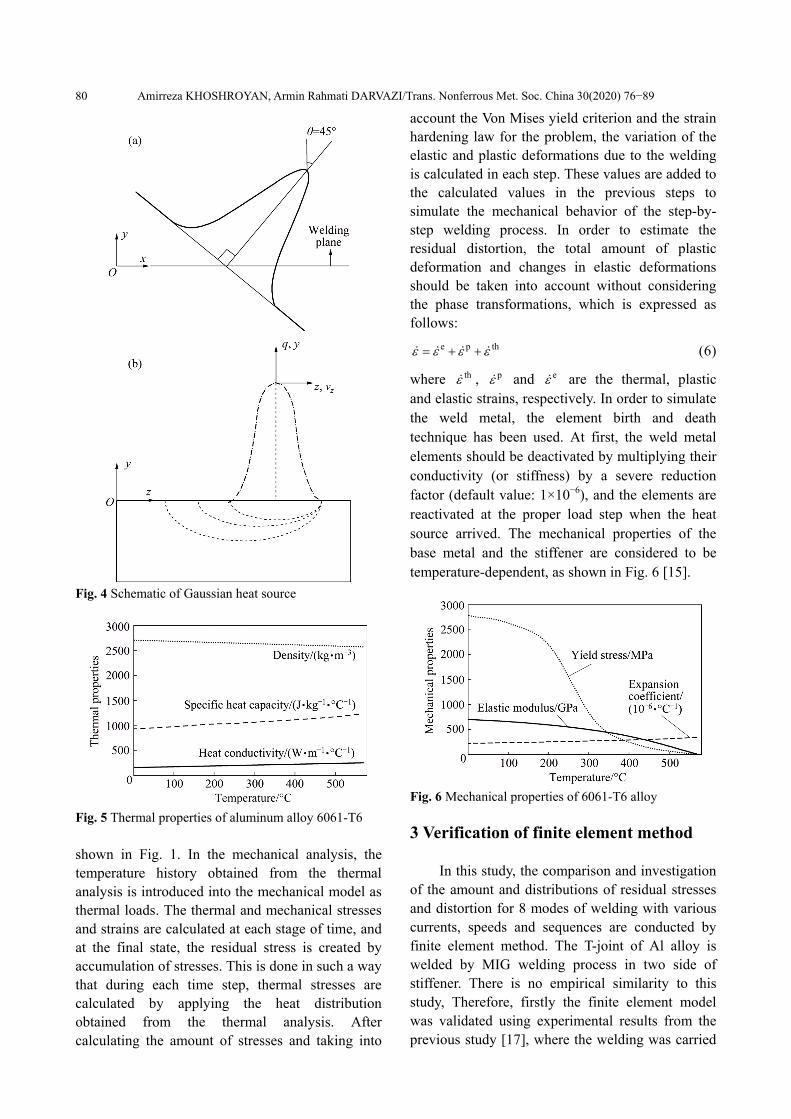
The Gaussian model is used to simulate the heat source of welding process. A schematic example of this model is shown in Fig. 4. In the MIG welding process, the heat enters the workpiece through the molten metal droplets and welding arc: QA=ηIU−QW (2) where η is the efficiency of welding, which is equal to 0.8 for welding by MIG method [17]. I is the welding current and U is the voltage. QA is the heat input by the welding arc, which is 40% of the total heat input, and QW is the heat of the molten metal droplets, which is 60% of the total input heat.
22sA
2
3( , , ) exp 3 exp 3
π
z v tQ xq x z t
r rr
(3)
where r is the radius of heat source in the Gaussian model and in this case it is equal to 2.8. vs is the welding speed and t is the welding time.
After each welding process, the workpiece is cooled for 1 h. During the welding and cooling processes, the workpiece loses its heat through two forms of radiation and convection. To calculate the amount of heat loss through radiation that occurs at high temperatures, the Stefan−Boltzmann law and for the convection, the Newton law are used which are expressed as follows: qc=h(T−T0) (4)
4 4r 0( )q T T (5)
where T0, ε, σ and h are the ambient temperature, the emissivity of the material surface, the Stefan−Boltzmann constant and the convective heat transfer coefficient, respectively. The latent heat of fusion is 3.9×10⁵ J/kg, which is implemented to the workpiece between the solidus temperature of 585 °C and the liquidus temperature of 659 °C. The variable thermal properties were adopted from previous research [22], as shown in Fig. 5. 2.3 Mechanical analysis
In the mechanical analysis, the element compatible with thermal element, SOLID 185, was chosen. The mechanical boundary conditions are
Amirreza KHOSHROYAN, Armin Rahmati DARVAZI/Trans. Nonferrous Met. Soc. China 30(2020) 76−89
80
Fig. 4 Schematic of Gaussian heat source
Fig. 5 Thermal properties of aluminum alloy 6061-T6
shown in Fig. 1. In the mechanical analysis, the temperature history obtained from the thermal analysis is introduced into the mechanical model as thermal loads. The thermal and mechanical stresses and strains are calculated at each stage of time, and at the final state, the residual stress is created by accumulation of stresses. This is done in such a way that during each time step, thermal stresses are calculated by applying the heat distribution obtained from the thermal analysis. After calculating the amount of stresses and taking into
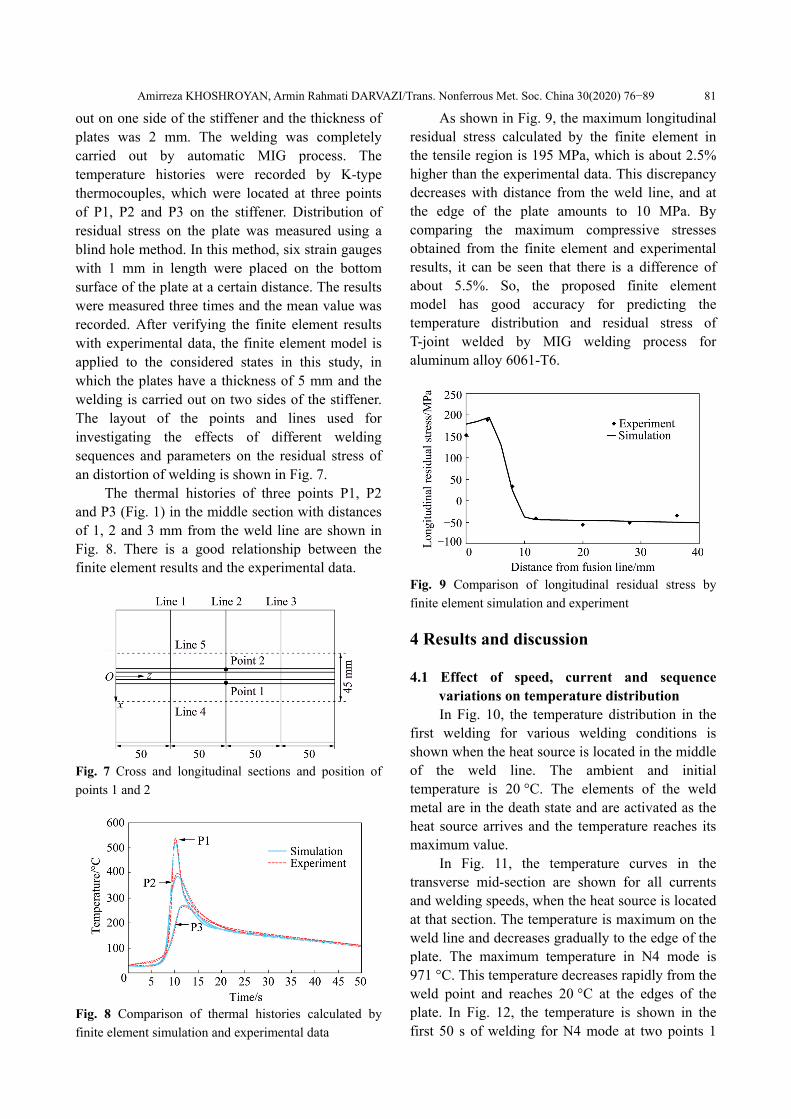
account the Von Mises yield criterion and the strain hardening law for the problem, the variation of the elastic and plastic deformations due to the welding is calculated in each step. These values are added to the calculated values in the previous steps to simulate the mechanical behavior of the step-by- step welding process. In order to estimate the residual distortion, the total amount of plastic deformation and changes in elastic deformations should be taken into account without considering the phase transformations, which is expressed as follows:
e p th (6) where th , p and e are the thermal, plastic and elastic strains, respectively. In order to simulate the weld metal, the element birth and death technique has been used. At first, the weld metal elements should be deactivated by multiplying their conductivity (or stiffness) by a severe reduction factor (default value: 1×10⁻⁶), and the elements are reactivated at the proper load step when the heat source arrived. The mechanical properties of the base metal and the stiffener are considered to be temperature-dependent, as shown in Fig. 6 [15].
Fig. 6 Mechanical properties of 6061-T6 alloy
3 Verification of finite element method
In this study, the comparison and investigation of the amount and distributions of residual stresses and distortion for 8 modes of welding with various currents, speeds and sequences are conducted by finite element method. The T-joint of Al alloy is welded by MIG welding process in two side of stiffener. There is no empirical similarity to this study, Therefore, firstly the finite element model was validated using experimental results from the previous study [17], where the welding was carried
Amirreza KHOSHROYAN, Armin Rahmati DARVAZI/Trans. Nonferrous Met. Soc. China 30(2020) 76−89
81
out on one side of the stiffener and the thickness of plates was 2 mm. The welding was completely carried out by automatic MIG process. The temperature histories were recorded by K-type thermocouples, which were located at three points of P1, P2 and P3 on the stiffener. Distribution of residual stress on the plate was measured using a blind hole method. In this method, six strain gauges with 1 mm in length were placed on the bottom surface of the plate at a certain distance. The results were measured three times and the mean value was recorded. After verifying the finite element results with experimental data, the finite element model is applied to the considered states in this study, in which the plates have a thickness of 5 mm and the welding is carried out on two sides of the stiffener. The layout of the points and lines used for investigating the effects of different welding sequences and parameters on the residual stress of an distortion of welding is shown in Fig. 7.
The thermal histories of three points P1, P2 and P3 (Fig. 1) in the middle section with distances of 1, 2 and 3 mm from the weld line are shown in Fig. 8. There is a good relationship between the finite element results and the experimental data.
Fig. 7 Cross and longitudinal sections and position of
points 1 and 2
Fig. 8 Comparison of thermal histories calculated by
finite element simulation and experimental data
As shown in Fig. 9, the maximum longitudinal residual stress calculated by the finite element in the tensile region is 195 MPa, which is about 2.5% higher than the experimental data. This discrepancy decreases with distance from the weld line, and at the edge of the plate amounts to 10 MPa. By comparing the maximum compressive stresses obtained from the finite element and experimental results, it can be seen that there is a difference of about 5.5%. So, the proposed finite element model has good accuracy for predicting the temperature distribution and residual stress of T-joint welded by MIG welding process for aluminum alloy 6061-T6.
Fig. 9 Comparison of longitudinal residual stress by
finite element simulation and experiment
4 Results and discussion 4.1 Effect of speed, current and sequence
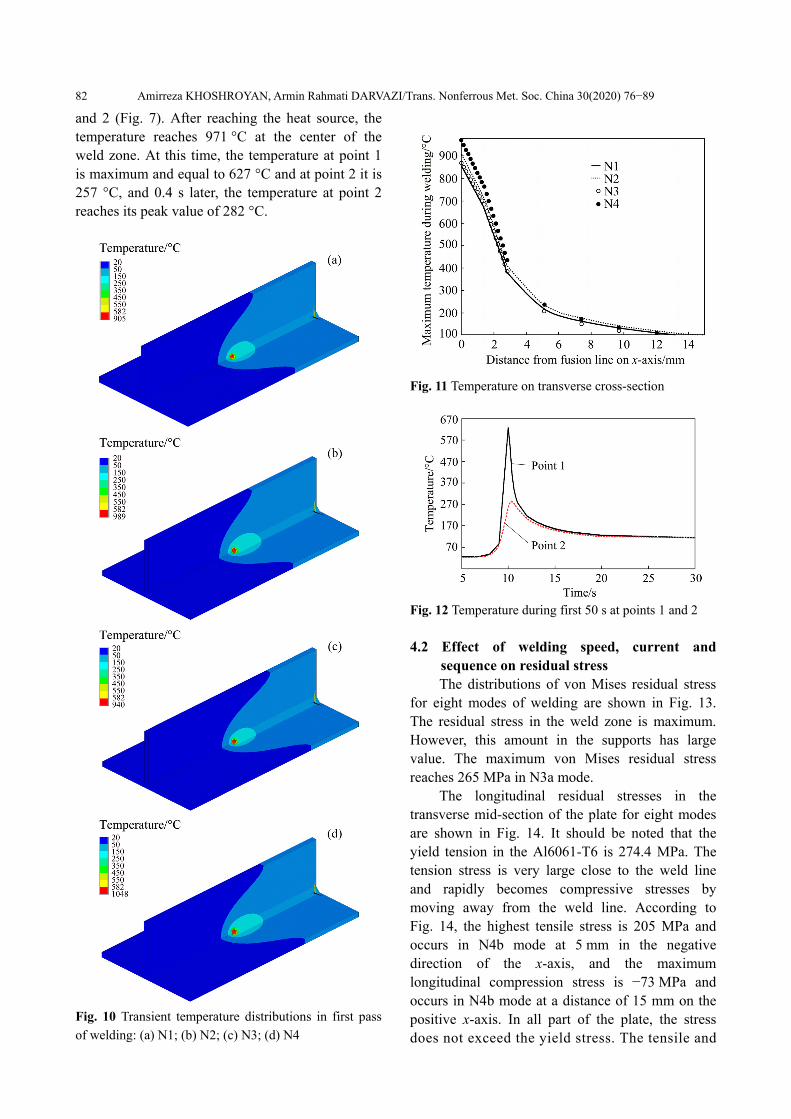
variations on temperature distribution In Fig. 10, the temperature distribution in the
first welding for various welding conditions is shown when the heat source is located in the middle of the weld line. The ambient and initial temperature is 20 °C. The elements of the weld metal are in the death state and are activated as the heat source arrives and the temperature reaches its maximum value.
In Fig. 11, the temperature curves in the transverse mid-section are shown for all currents and welding speeds, when the heat source is located at that section. The temperature is maximum on the weld line and decreases gradually to the edge of the plate. The maximum temperature in N4 mode is 971 °C. This temperature decreases rapidly from the weld point and reaches 20 °C at the edges of the plate. In Fig. 12, the temperature is shown in the first 50 s of welding for N4 mode at two points 1
Amirreza KHOSHROYAN, Armin Rahmati DARVAZI/Trans. Nonferrous Met. Soc. China 30(2020) 76−89
82
and 2 (Fig. 7). After reaching the heat source, the temperature reaches 971 °C at the center of the weld zone. At this time, the temperature at point 1 is maximum and equal to 627 °C and at point 2 it is 257 °C, and 0.4 s later, the temperature at point 2 reaches its peak value of 282 °C.
Fig. 10 Transient temperature distributions in first pass
of welding: (a) N1; (b) N2; (c) N3; (d) N4
Fig. 11 Temperature on transverse cross-section
Fig. 12 Temperature during first 50 s at points 1 and 2
4.2 Effect of welding speed, current and
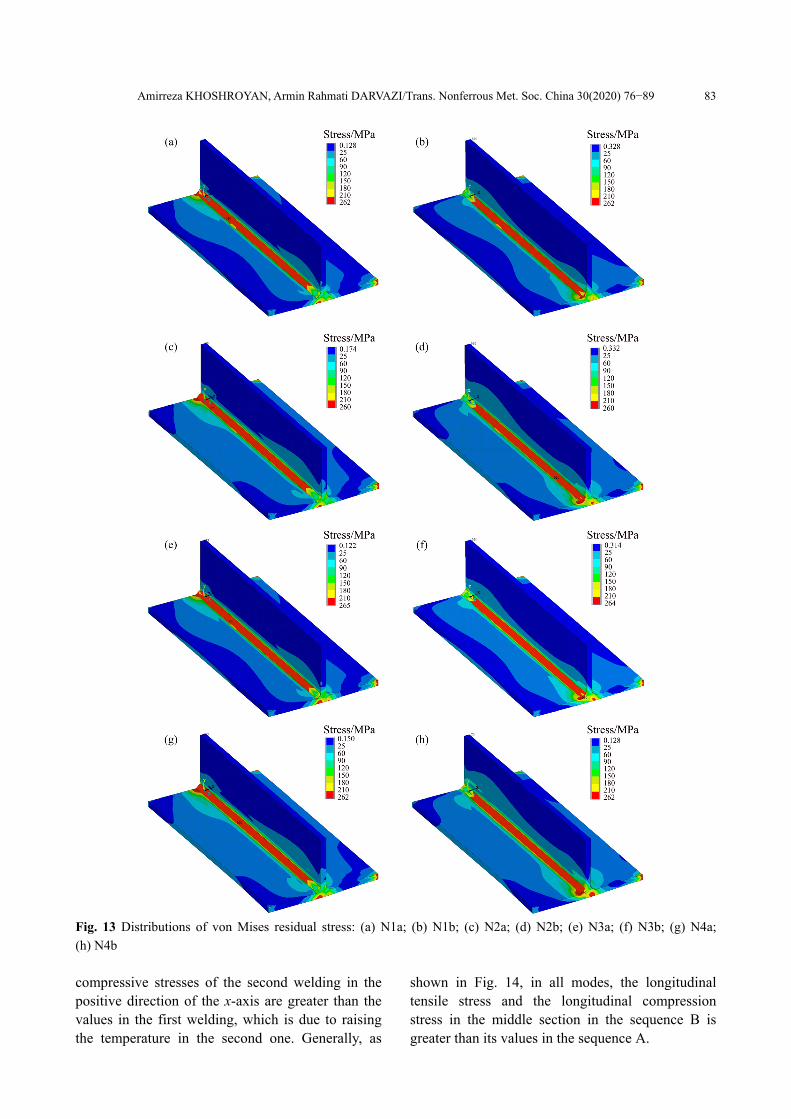
sequence on residual stress The distributions of von Mises residual stress
for eight modes of welding are shown in Fig. 13. The residual stress in the weld zone is maximum. However, this amount in the supports has large value. The maximum von Mises residual stress reaches 265 MPa in N3a mode.
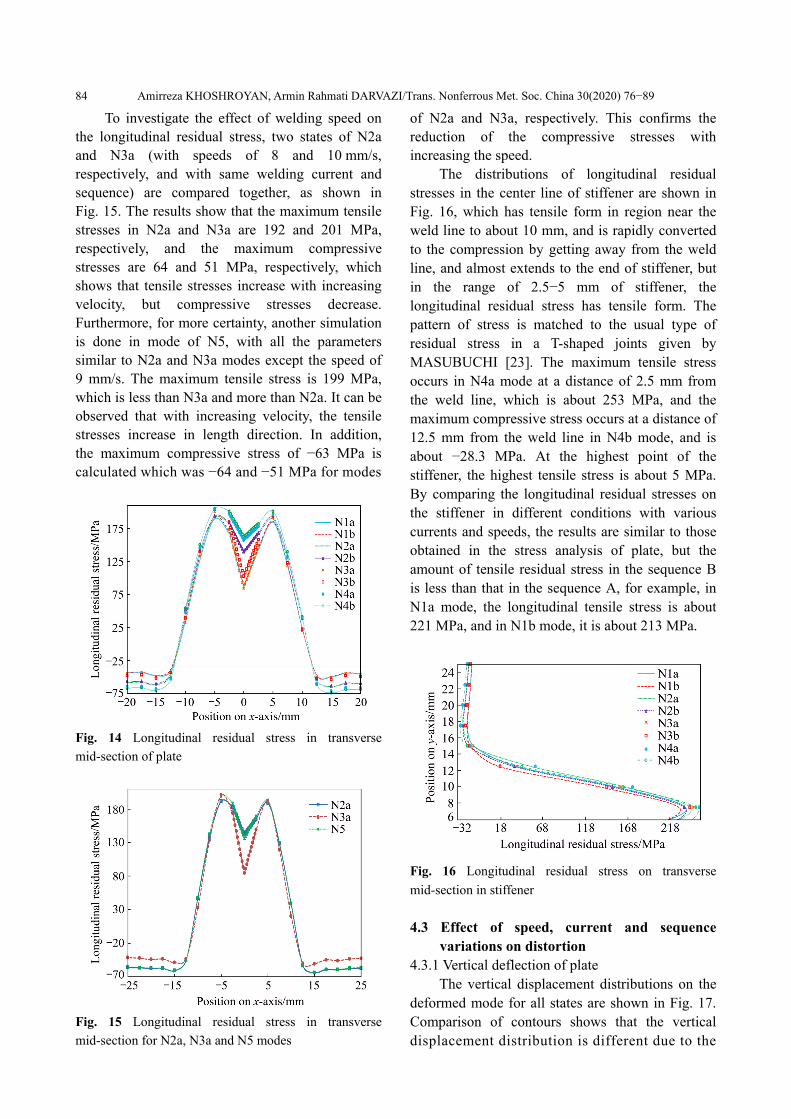
The longitudinal residual stresses in the transverse mid-section of the plate for eight modes are shown in Fig. 14. It should be noted that the yield tension in the Al6061-T6 is 274.4 MPa. The tension stress is very large close to the weld line and rapidly becomes compressive stresses by moving away from the weld line. According to Fig. 14, the highest tensile stress is 205 MPa and occurs in N4b mode at 5 mm in the negative direction of the x-axis, and the maximum longitudinal compression stress is −73 MPa and occurs in N4b mode at a distance of 15 mm on the positive x-axis. In all part of the plate, the stress does not exceed the yield stress. The tensile and
Amirreza KHOSHROYAN, Armin Rahmati DARVAZI/Trans. Nonferrous Met. Soc. China 30(2020) 76−89
83
Fig. 13 Distributions of von Mises residual stress: (a) N1a; (b) N1b; (c) N2a; (d) N2b; (e) N3a; (f) N3b; (g) N4a;
(h) N4b compressive stresses of the second welding in the positive direction of the x-axis are greater than the values in the first welding, which is due to raising the temperature in the second one. Generally, as
shown in Fig. 14, in all modes, the longitudinal tensile stress and the longitudinal compression stress in the middle section in the sequence B is greater than its values in the sequence A.
Amirreza KHOSHROYAN, Armin Rahmati DARVAZI/Trans. Nonferrous Met. Soc. China 30(2020) 76−89
84
To investigate the effect of welding speed on the longitudinal residual stress, two states of N2a and N3a (with speeds of 8 and 10 mm/s, respectively, and with same welding current and sequence) are compared together, as shown in Fig. 15. The results show that the maximum tensile stresses in N2a and N3a are 192 and 201 MPa, respectively, and the maximum compressive stresses are 64 and 51 MPa, respectively, which shows that tensile stresses increase with increasing velocity, but compressive stresses decrease. Furthermore, for more certainty, another simulation is done in mode of N5, with all the parameters similar to N2a and N3a modes except the speed of 9 mm/s. The maximum tensile stress is 199 MPa, which is less than N3a and more than N2a. It can be observed that with increasing velocity, the tensile stresses increase in length direction. In addition, the maximum compressive stress of −63 MPa is calculated which was −64 and −51 MPa for modes
Fig. 14 Longitudinal residual stress in transverse
mid-section of plate
Fig. 15 Longitudinal residual stress in transverse
mid-section for N2a, N3a and N5 modes
of N2a and N3a, respectively. This confirms the reduction of the compressive stresses with increasing the speed.
The distributions of longitudinal residual stresses in the center line of stiffener are shown in Fig. 16, which has tensile form in region near the weld line to about 10 mm, and is rapidly converted to the compression by getting away from the weld line, and almost extends to the end of stiffener, but in the range of 2.5−5 mm of stiffener, the longitudinal residual stress has tensile form. The pattern of stress is matched to the usual type of residual stress in a T-shaped joints given by MASUBUCHI [23]. The maximum tensile stress occurs in N4a mode at a distance of 2.5 mm from the weld line, which is about 253 MPa, and the maximum compressive stress occurs at a distance of 12.5 mm from the weld line in N4b mode, and is about −28.3 MPa. At the highest point of the stiffener, the highest tensile stress is about 5 MPa. By comparing the longitudinal residual stresses on the stiffener in different conditions with various currents and speeds, the results are similar to those obtained in the stress analysis of plate, but the amount of tensile residual stress in the sequence B is less than that in the sequence A, for example, in N1a mode, the longitudinal tensile stress is about 221 MPa, and in N1b mode, it is about 213 MPa.
Fig. 16 Longitudinal residual stress on transverse
mid-section in stiffener 4.3 Effect of speed, current and sequence
variations on distortion 4.3.1 Vertical deflection of plate
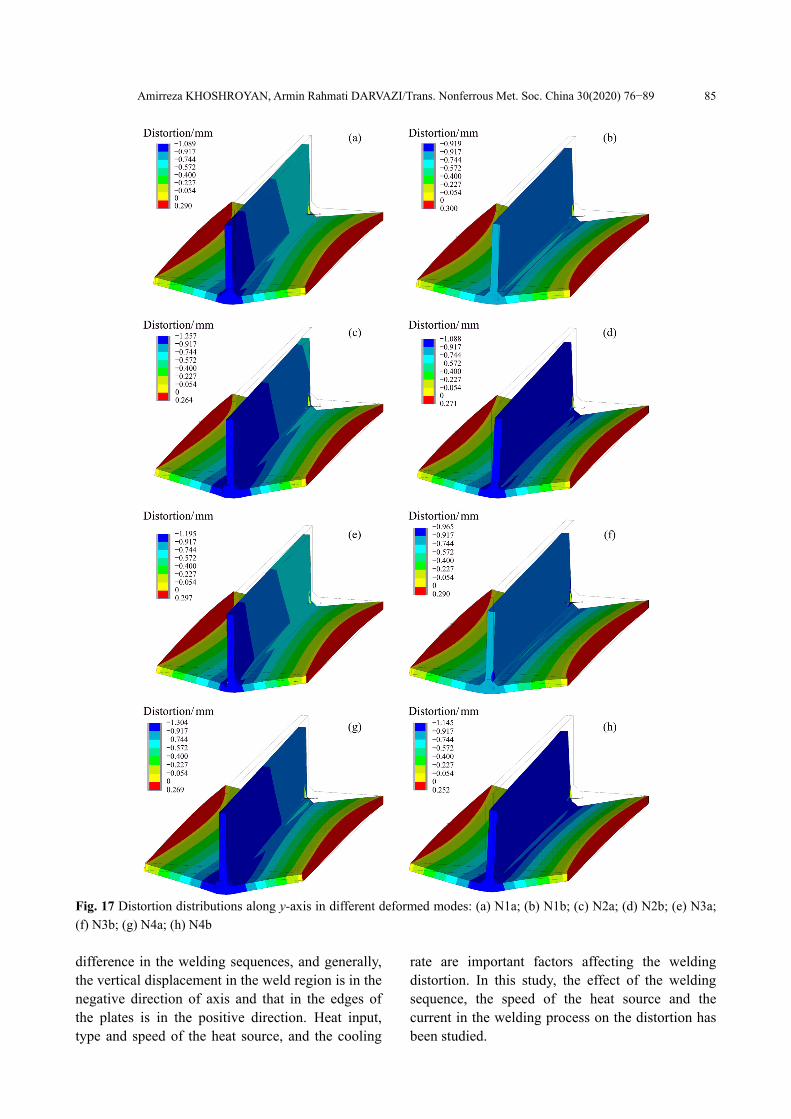
The vertical displacement distributions on the deformed mode for all states are shown in Fig. 17. Comparison of contours shows that the vertical displacement distribution is different due to the
Amirreza KHOSHROYAN, Armin Rahmati DARVAZI/Trans. Nonferrous Met. Soc. China 30(2020) 76−89
85
Fig. 17 Distortion distributions along y-axis in different deformed modes: (a) N1a; (b) N1b; (c) N2a; (d) N2b; (e) N3a;
(f) N3b; (g) N4a; (h) N4b difference in the welding sequences, and generally, the vertical displacement in the weld region is in the negative direction of axis and that in the edges of the plates is in the positive direction. Heat input, type and speed of the heat source, and the cooling
rate are important factors affecting the welding distortion. In this study, the effect of the welding sequence, the speed of the heat source and the current in the welding process on the distortion has been studied.
Amirreza KHOSHROYAN, Armin Rahmati DARVAZI/Trans. Nonferrous Met. Soc. China 30(2020) 76−89
86
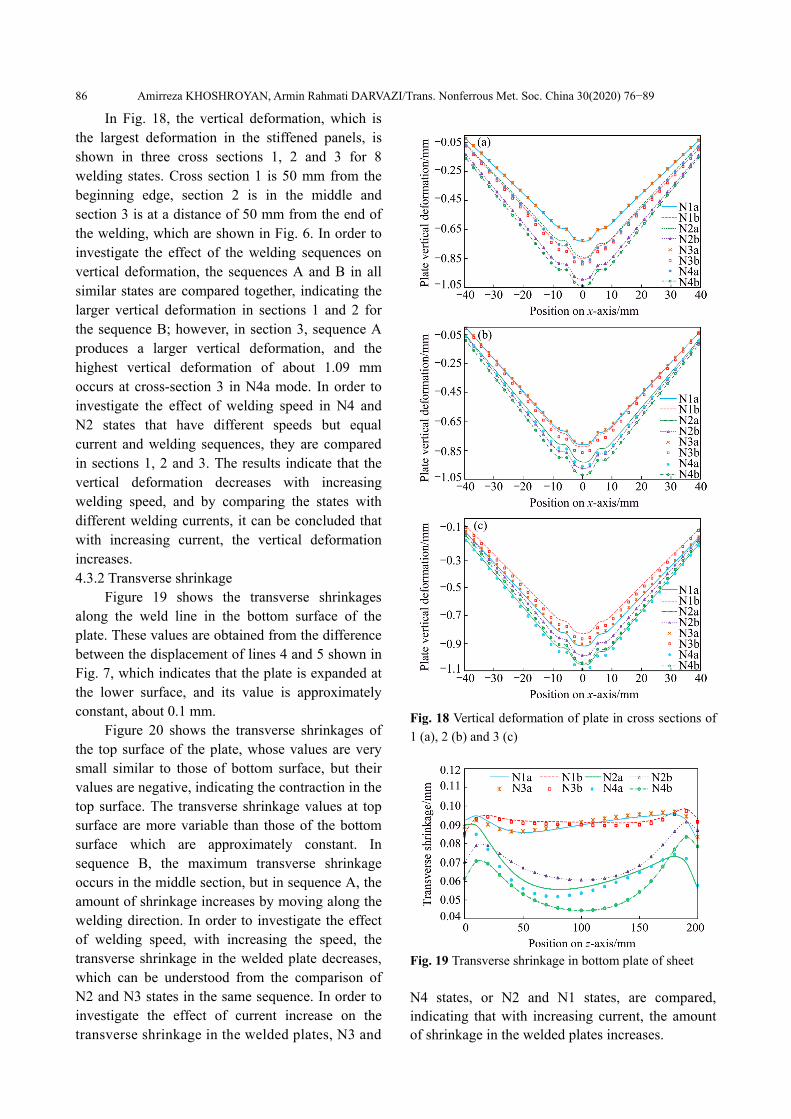
In Fig. 18, the vertical deformation, which is the largest deformation in the stiffened panels, is shown in three cross sections 1, 2 and 3 for 8 welding states. Cross section 1 is 50 mm from the beginning edge, section 2 is in the middle and section 3 is at a distance of 50 mm from the end of the welding, which are shown in Fig. 6. In order to investigate the effect of the welding sequences on vertical deformation, the sequences A and B in all similar states are compared together, indicating the larger vertical deformation in sections 1 and 2 for the sequence B; however, in section 3, sequence A produces a larger vertical deformation, and the highest vertical deformation of about 1.09 mm occurs at cross-section 3 in N4a mode. In order to investigate the effect of welding speed in N4 and N2 states that have different speeds but equal current and welding sequences, they are compared in sections 1, 2 and 3. The results indicate that the vertical deformation decreases with increasing welding speed, and by comparing the states with different welding currents, it can be concluded that with increasing current, the vertical deformation increases. 4.3.2 Transverse shrinkage
Figure 19 shows the transverse shrinkages along the weld line in the bottom surface of the plate. These values are obtained from the difference between the displacement of lines 4 and 5 shown in Fig. 7, which indicates that the plate is expanded at the lower surface, and its value is approximately constant, about 0.1 mm.
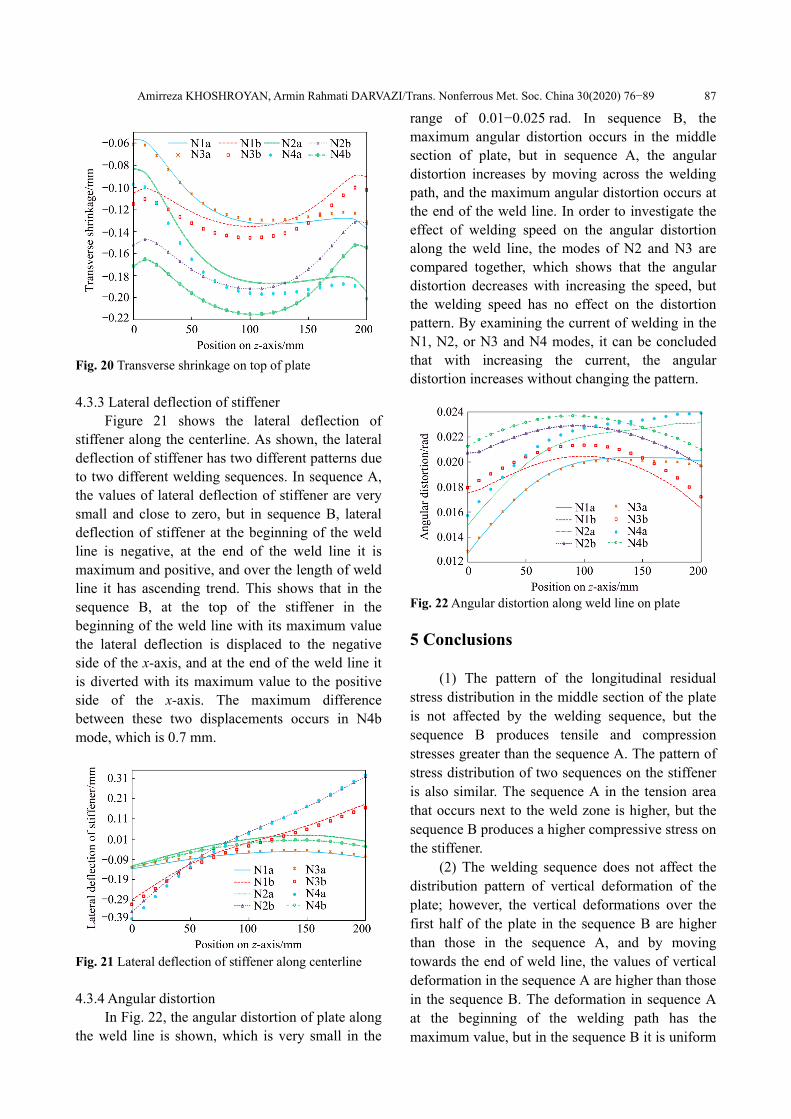
Figure 20 shows the transverse shrinkages of the top surface of the plate, whose values are very small similar to those of bottom surface, but their values are negative, indicating the contraction in the top surface. The transverse shrinkage values at top surface are more variable than those of the bottom surface which are approximately constant. In sequence B, the maximum transverse shrinkage occurs in the middle section, but in sequence A, the amount of shrinkage increases by moving along the welding direction. In order to investigate the effect of welding speed, with increasing the speed, the transverse shrinkage in the welded plate decreases, which can be understood from the comparison of N2 and N3 states in the same sequence. In order to investigate the effect of current increase on the transverse shrinkage in the welded plates, N3 and
Fig. 18 Vertical deformation of plate in cross sections of
1 (a), 2 (b) and 3 (c)
Fig. 19 Transverse shrinkage in bottom plate of sheet
N4 states, or N2 and N1 states, are compared, indicating that with increasing current, the amount of shrinkage in the welded plates increases.
Amirreza KHOSHROYAN, Armin Rahmati DARVAZI/Trans. Nonferrous Met. Soc. China 30(2020) 76−89
87
Fig. 20 Transverse shrinkage on top of plate 4.3.3 Lateral deflection of stiffener
Figure 21 shows the lateral deflection of stiffener along the centerline. As shown, the lateral deflection of stiffener has two different patterns due to two different welding sequences. In sequence A, the values of lateral deflection of stiffener are very small and close to zero, but in sequence B, lateral deflection of stiffener at the beginning of the weld line is negative, at the end of the weld line it is maximum and positive, and over the length of weld line it has ascending trend. This shows that in the sequence B, at the top of the stiffener in the beginning of the weld line with its maximum value the lateral deflection is displaced to the negative side of the x-axis, and at the end of the weld line it is diverted with its maximum value to the positive side of the x-axis. The maximum difference between these two displacements occurs in N4b mode, which is 0.7 mm.
Fig. 21 Lateral deflection of stiffener along centerline 4.3.4 Angular distortion
In Fig. 22, the angular distortion of plate along the weld line is shown, which is very small in the
range of 0.01−0.025 rad. In sequence B, the maximum angular distortion occurs in the middle section of plate, but in sequence A, the angular distortion increases by moving across the welding path, and the maximum angular distortion occurs at the end of the weld line. In order to investigate the effect of welding speed on the angular distortion along the weld line, the modes of N2 and N3 are compared together, which shows that the angular distortion decreases with increasing the speed, but the welding speed has no effect on the distortion pattern. By examining the current of welding in the N1, N2, or N3 and N4 modes, it can be concluded that with increasing the current, the angular distortion increases without changing the pattern.
Fig. 22 Angular distortion along weld line on plate
5 Conclusions
(1) The pattern of the longitudinal residual stress distribution in the middle section of the plate is not affected by the welding sequence, but the sequence B produces tensile and compression stresses greater than the sequence A. The pattern of stress distribution of two sequences on the stiffener is also similar. The sequence A in the tension area that occurs next to the weld zone is higher, but the sequence B produces a higher compressive stress on the stiffener.
(2) The welding sequence does not affect the distribution pattern of vertical deformation of the plate; however, the vertical deformations over the first half of the plate in the sequence B are higher than those in the sequence A, and by moving towards the end of weld line, the values of vertical deformation in the sequence A are higher than those in the sequence B. The deformation in sequence A at the beginning of the welding path has the maximum value, but in the sequence B it is uniform
Amirreza KHOSHROYAN, Armin Rahmati DARVAZI/Trans. Nonferrous Met. Soc. China 30(2020) 76−89
88
along the weld line, and the maximum deformation in sequence A is higher than that in the sequence B.
(3) The transverse shrinkage distribution in the welded plate in the sequences A and B is different. In the sequence B, the maximum transverse shrinkage occurs in the middle section, but in the sequence A it occurs at the end of the plate.
(4) The angular distortion pattern along the weld line in the plate is different for sequence A and B. The maximum angular distortion occurs in the sequence B at the middle of the weld length, but the maximum value in the sequence A occurs at the end of the weld length.
(5) Lateral deflection of stiffener along the center line has a different pattern for two sequences A and B. In sequence A, these values are close to zero, which means that there is little deflection above the stiffener along x-axis, but for the sequence B, initially, the welding is in the negative direction of the x-axis, and at the end of the weld line it is positive indicating the major effect of the welding sequence on the lateral deflection of stiffener.
(6) The patterns of residual stress and distortion distributions are not affected by the welding speed, but by increasing welding speed, the maximum tensile longitudinal residual stress in the plate and stiffener increases, and the maximum compression longitudinal residual stress decreases. By increasing welding speed, the vertical deformation, transverse shrinkage, angular distortion in the plate, and deflection of stiffener decrease. Increasing the welding current has no effect on the residual stress pattern, vertical deformation and transverse shrinkage. However, with increasing welding current, the value of longitudinal residual stress increases in the tensile and compression area in the plate and stiffener, and the vertical deformation, transverse shrinkage and angular distortion are larger in the welded plate. The lateral deflection of stiffener in sequence B increases with increasing the welding current.
References [1] TSAO L C, TSAI T C, WU C S, CHUANG T H.
Brazeability of the 6061-T6 aluminum alloy with
Al−Si−20Cu-based filler metals [J]. Journal of Materials
Engineering and Performance, 2001, 10: 705−709.
[2] MATHERS G. The welding of aluminium and its alloys [M].
Woodhead Publishing, 2002.
[3] MALLICK PANKAJ K. Materials, design and
manufacturing for lightweight vehicles [M]. Elsevier, 2010.
[4] UEDA Y, KIM Y C, YUAN M G. A predicting method of
welding residual stress using source of residual stress (report
I): Characteristics of inherent strain (source of residual stress)
(mechanics, strength & structural design) [J]. Transactions of
JWRI, 1989, 18: 135−141.
[5] VENKATKUMAR D, RAVINDRAN D, SELVAKUMAR G.
Finite element analysis of heat input effect on temperature,
residual stresses and distortion in butt welded plates [J].
Materials Today Proceedings, 2018, 5: 8328−8337.
[6] JOGI BHAGWAN F, AWALE A S, NIRANTAR S R,
BHUSARE H S. Metal inert gas (MIG) welding process
optimization using teaching-learning based optimization
(TLBO) algorithm [J]. Materials Today: Proceedings, 2018,
5: 7086−7095.
[7] FRANCIS J D. Welding simulations of aluminum alloy
joints by finite element analysis [D]. Virginia Tech, 2001.
[8] BRADÁČ J. Calibration of heat source model in numerical
simulations of fusion welding [J]. Machines, Technologies,
Materials, 2013, 11: 9−12.
[9] MOHAMAD M R, SHAH L H, ISHAK M. Investigation of
preheating method on joint strength of aluminium−stainless
steel dissimilar welding using metal inert gas (MIG) process
[C]//IOP Conference Series: Materials Science and
Engineering. IOP Publishing, 2017: 012019.
[10] CHIKHALE S R, KOLHE K P, KUMAR P. Prediction of
mechanical properties of Al alloy 6061-T6 by using GMAW
[J]. International Journal of Current Engineering and
Technology, 2016, 5: 300−306.
[11] LI Peng, NIE Fu-heng, DONG Hong-gang, LI Shuai, YANG
Guo-shun, ZHANG Hai. Pulse MIG welding of
6061-T6/A356-T6 aluminum alloy dissimilar T-joint [J].
Journal of Materials Engineering and Performance, 2018, 27:
4760−4769.
[12] BAHARNEZHAD S, GOLHIN A P. In-situ measurement
and finite element simulation of thermo-mechanical
properties of AA 6063 aluminum alloy for MIG weldment [J].
Materials Physics & Mechanics, 2017, 32: 222−236.
[13] VARGAS JAVIER A, TORRES JAIME E, PACHECO
JOVANNY A, HERNANDEZ ROQUE J. Analysis of heat
input effect on the mechanical properties of Al-6061-T6
alloy weld joints [J]. Materials & Design, 2013, 52:
556−564.
[14] ISMAIL M I S, AFIEQ W M. Thermal analysis on a weld
joint of aluminium alloy in gas metal arc welding [J].
Advances in Production Engineering & Management, 2016,
11: 29−37.
[15] FU Ding-fa, ZHOU Chang-qing, LI Can, WANG Guan, LI
Luo-xing. Effect of welding sequence on residual stress in
thin-walled octagonal pipe–plate structure [J]. Transactions
of Nonferrous Metals Society of China, 2014, 24: 657−664.
[16] BONAZZI E, COLOMBINI E, PANARI D, VERGNANO A,
LEALI F, VERONESI P. Numerical simulation and
experimental validation of MIG welding of T-joints of thin
aluminum plates for top class vehicles [J]. Metallurgical and
Materials Transactions A, 2017, 48: 379−388.
[17] YI Jie, CAO Shu-fen, LI Luo-xing, GUO Peng-cheng, LIU
Kai-yong. Effect of welding current on morphology and
Amirreza KHOSHROYAN, Armin Rahmati DARVAZI/Trans. Nonferrous Met. Soc. China 30(2020) 76−89
89
microstructure of Al alloy T-joint in double-pulsed MIG
welding [J]. Transactions of Nonferrous Metals Society of
China, 2015, 25: 3204−3211.
[18] LI Chun-ling, DING FAN, YU Xiao-quan, HUANG
Jian-kang. Residual stress and welding distortion of Al/steel
butt joint by arc-assisted laser welding-brazing [J].
Transactions of Nonferrous Metals Society of China, 2019,
29: 692−700.
[19] LU Yao-hui, LU Chuan, ZHANG De-wen, CHEN Tian-li,
ZENG Jing, WU Ping-bo. Numerical computation methods
of welding deformation and their application in bogie frame
for high-speed trains [J]. Journal of Manufacturing
Processes, 2019, 38: 204−213.
[20] RODRIGUES LINO A S, BORGES DIEGO J A, BAIA
PAOLA E C, FREITAS ELAINE N, BRAGA EDUARDO M.
Welding procedures influence analysis on the residual stress
distribution and distortion of stiffened panels welded via
robotized FCAW [J]. Thin-walled Structures, 2019, 141:
175−183.
[21] ZHU J, KHURSHID M, BARSOUM Z. Accuracy of
computational welding mechanics methods for estimation of
angular distortion and residual stresses [J]. Welding in the
World, 2019: 1−15.
[22] SOUNDARARAJAN V, ZEKOVIC S, KOVACEVIC R.
Thermo- mechanical model with adaptive boundary
conditions for friction stir welding of Al 6061 [J].
International Journal of Machine Tools and Manufacture,
2005, 45: 1577−1587.
[23] MASUBUCHI K. Analysis of welded structures: Residual
stresses, distortion, and their consequences [M]. Elsevier,
2013.
焊接参数和焊接顺序对 Al6061-T6 铝合金 T 形接头 残余应力和变形的影响
Amirreza KHOSHROYAN1, Armin Rahmati DARVAZI2
1. Department of Marine Technology, Amirkabir University of Technology, Tehran, Iran;
2. Faculty of Technology and Engineering (East of Guilan), University of Guilan, Rudsar, Iran
摘 要:采用三维热力耦合有限元模型软件 Ansys 研究铝合金 Al6061-T6 加筋板在金属惰性气体(MIG)保护焊接
过程中的温度分布、残余应力和变形。考虑材料性能随温度的变化,采用“单元生死”技术将填充金属加入工件中。
在三种电流模式、两种速度和两种顺序下,分别计算和分析材料的残余应力和变形。结果表明,焊接速度的提高
降低板材的垂直挠度、横向收缩率和角变形以及筋条的横向挠度,但增加板材和筋条的最大纵向拉应力。此外,
较高的电流增加板材和筋条的残余应力和变形,不同的焊接顺序改变板材和筋条的变形,但纵向残余应力的分布
没有明显变化。
关键词:焊接参数;焊接顺序;残余应力;变形
(Edited by Bing YANG)
Related Documents


![Investigation of Process Parameters during MIG …taking welding current, arc voltage, welding speed, heat input rate as welding parameters. Rakesh kumar et al., [2], Satish kumar](https://static.cupdf.com/doc/110x72/5e6c0ac208da340d900ef82d/investigation-of-process-parameters-during-mig-taking-welding-current-arc-voltage.jpg)