Working Papers|108| February 2013 Naida Trkić-Izmirlija and Adnan Efendić Effects of the global economic crisis and public spending on income distribution in Bosnia and Herzegovina The wiiw Balkan Observatory

Welcome message from author
This document is posted to help you gain knowledge. Please leave a comment to let me know what you think about it! Share it to your friends and learn new things together.
Transcript
Working Papers|108| February 2013
Naida Trkić-Izmirlija and Adnan Efendić
Effects of the global economic crisis and public spendingon income distribution in Bosnia and Herzegovina
The wiiw Balkan Observatory
www.balkan-observatory.net
About Shortly after the end of the Kosovo war, the last of the Yugoslav dissolution wars, theBalkan Reconstruction Observatory was set up jointly by the Hellenic Observatory, theCentre for the Study of Global Governance, both institutes at the London School ofEconomics (LSE), and the Vienna Institute for International Economic Studies (wiiw).A brainstorming meeting on Reconstruction and Regional Co-operation in the Balkanswas held in Vouliagmeni on 8-10 July 1999, covering the issues of security,democratisation, economic reconstruction and the role of civil society. It was attendedby academics and policy makers from all the countries in the region, from a number ofEU countries, from the European Commission, the USA and Russia. Based on ideas anddiscussions generated at this meeting, a policy paper on Balkan Reconstruction andEuropean Integration was the product of a collaborative effort by the two LSE institutesand the wiiw. The paper was presented at a follow-up meeting on Reconstruction andIntegration in Southeast Europe in Vienna on 12-13 November 1999, which focused onthe economic aspects of the process of reconstruction in the Balkans. It is this policypaper that became the very first Working Paper of the wiiw Balkan ObservatoryWorking Papers series. The Working Papers are published online at www.balkan-observatory.net, the internet portal of the wiiw Balkan Observatory. It is a portal forresearch and communication in relation to economic developments in Southeast Europemaintained by the wiiw since 1999. Since 2000 it also serves as a forum for the GlobalDevelopment Network Southeast Europe (GDN-SEE) project, which is based on aninitiative by The World Bank with financial support from the Austrian Ministry ofFinance and the Oesterreichische Nationalbank. The purpose of the GDN-SEE projectis the creation of research networks throughout Southeast Europe in order to enhancethe economic research capacity in Southeast Europe, to build new research capacities bymobilising young researchers, to promote knowledge transfer into the region, tofacilitate networking between researchers within the region, and to assist in securingknowledge transfer from researchers to policy makers. The wiiw Balkan ObservatoryWorking Papers series is one way to achieve these objectives.
The wiiw Balkan Observatory

Global Development Network Southeast Europe
This study has been developed in the framework of research networks initiated and monitored by wiiwunder the premises of the GDN–SEE partnership. The Global Development Network, initiated by The World Bank, is a global network ofresearch and policy institutes working together to address the problems of national andregional development. It promotes the generation of local knowledge in developing andtransition countries and aims at building research capacities in the different regions. The Vienna Institute for International Economic Studies is a GDN Partner Institute andacts as a hub for Southeast Europe. The GDN–wiiw partnership aims to support theenhancement of economic research capacity in Southeast Europe, to promoteknowledge transfer to SEE, to facilitate networking among researchers within SEE andto assist in securing knowledge transfer from researchers to policy makers. The GDN–SEE programme is financed by the Global Development Network, theAustrian Ministry of Finance and the Jubiläumsfonds der OesterreichischenNationalbank. For additional information see www.balkan-observatory.net, www.wiiw.ac.at andwww.gdnet.org
The wiiw Balkan Observatory

Research paper:
Effects of the global economic crisis and public spending
on income distribution in Bosnia and Herzegovina
February 2013
Research Team:
Trkić-Izmirlija Naida
E-mail: [email protected]
Efendić Adnan
E-mail: [email protected]

Table of contents
Abstract ............................................................................................................................... 1
1. Introduction ............................................................................................................... 2
2. Literature review ....................................................................................................... 3
3. Methodological framework of the research .............................................................. 6
4. Contextual framework - global economic crisis, public spending and income
distribution in BiH ........................................................................................................... 7
4.1. Global economic crisis in Bosnia and Herzegovina ......................................... 7
4.2. Public spending in Bosnia and Herzegovina .................................................. 10
4.3. Income distribution in Bosnia and Herzegovina ............................................ 17
4.3.1. Current data on income distribution in BiH ................................................ 17
4.3.2. Establishing a proxy for income distribution in BiH .................................. 18
5. Empirical investigation of the link “equality-crisis-public spending in BiH” ........ 22
5.1. Initial investigation of the variables of interest .............................................. 22
5.2. Empirical modelling ....................................................................................... 24
5.3. Qualitative discussion of the obtained results ................................................ 26
6. Conclusion .............................................................................................................. 30
References ......................................................................................................................... 31

List of graphs
Graph 4.1 Real GDP growth in Bosnia and Herzegovina .................................................. 8
Graph 4.2 GDP per capita in Bosnia and Herzegovina (in US$) ........................................ 9
Graph 4.3 Unemployment in Bosnia and Herzegovina (% of labour force) .................... 10
Graph 4.4 GDP, expenditures and fiscal balance ............................................................ 12
Graph 4.5 Structure of expenditures ................................................................................. 13
Graph 4.6 Shares of health, education and social protection in total budgets .................. 15
Graph 4.7 Growth rates of GDP, total exp., health, education and social protection ....... 16
Graph 4.8 Visual interpretation of the Gini coefficient for BiH ....................................... 20
Graph 4.9 Illustration of the Lorenz curve of income distribution BiH ........................... 20
List of tables
Table 4.1 Descriptive statistics of the Gini coefficient for BiH ...................................... 19
Table 5.1 Descriptive statistics of the main variables of interest ..................................... 22
Table 5.2 Simple correlations between the variables of interest ...................................... 23
Table 5.3 Base-line model results ..................................................................................... 26
Table A.1 Fiscal Indicators for BiH for the period 1996-2010 ......................................... 33
Table A.2 Descriptive statistics on income question ........................................................ 34
Table A.3 The Gini coefficient calculations for five income groups ............................... 35

Effects of the global economic crisis and public spending
on income distribution in Bosnia and Herzegovina
Naida Trkić-Izmirlija and Adnan Efendić
Abstract
This research focuses on the relationship between public spending and income
distribution in Bosnia and Herzegovina (BiH). In our empirical strategy we rely on a
unique survey data used to establish a proxy for inequality over the observed period
2000-2010. In addition, we investigate the consequences of contemporary global
economic and financial crisis on income distribution. We find indications that the global
economic crisis, with its BiH onset in 2009-2010, has increased income inequality in
BiH. Our findings also imply that increased public spending and improvement in the
quality of institutions in BiH were supportive in reducing income inequality over the
observed period. After examining several institutional indicators, we identify a particular
importance of political stability in BiH as a determinant of income distribution.
Disaggregated analysis of public spending by functional and economic categories
revealed that higher expenditures for social protection and capital spending are associated
with lower income inequality. Contrary, higher expenditures for education are linked
with higher income inequality.

2 | P a g e
1. Introduction
During the first years of the new millennium, macroeconomic indicators in countries of
southeast Europe on average largely resembled those of EU countries and developed
economies. With the onset of the global economic and financial crisis in 2008, the situation
started changing dramatically. That is the period of widening income inequality in most
European countries, which is primarily linked to factors lying behind the crisis (Watt, 2009).
While the effects of the crisis on developed economies have been explored relatively more,
the effects on developing countries, and more specifically southeast European (SEE)
countries1 are less known.
The latest crisis has been rather specific in its appearance compared to the past global
economic downturns. Also, there is no strongly established research tradition in this field and
more often than not, empirical work is guided by a lack of relevant data (which is a general
problem in transition countries).
The main hypothesis tested in this research is that economic downturns which have occurred
in BiH as a result of the crisis introduced structural breaks in overall income distribution by
increasing income inequality. In addition to testing this hypothesis, we aim to identify the
effects of certain public spending2 policies on income distribution (given their effects on
income distribution are unknown).
The research starts with a detailed investigation of existing applied research in this field of
economics (Section 2), in particular, applied research focused on southeast Europe. Building
upon that, the research aims to develop a methodological framework for conducting such
analysis that is designed to take into account specifics of BiH (Section 3). In Section 4 we
provide a short overview of the fiscal situation and of public spending (in terms of
1 For the purpose of this research, Southeast Europe shall be defined as the pool of the following nine countries:
Albania, Bosnia and Herzegovina, Bulgaria, Croatia, Macedonia, Montenegro, Romania, Serbia and Turkey. 2 If not specified differently, expenditures/spending refers to the sum of expenditures incurred by all state-level
institutions of BiH, expenditures of Brčko District in BiH, expenditures of both entities and expenditures of all
cantons.

3 | P a g e
magnitude, structure and trends) in BiH, and present existing and new data on income
distribution in BiH. With this background in mind, we present the empirical part of our
research in Section 5. This section provides a descriptive analysis of variables of interest
(public spending variables, inequality and institutional variables), investigates relationships
(correlations) among them and reports some quantitative and qualitative results derived from
a simple empirical modelling. Section 6 concludes the paper.
2. Literature review
Over the last decade, numerous authors have analysed the causes of inequality in income
distribution focusing their attention on public spending policies and often institutional
determinants. We discuss several studies we consider most insightful.
Afonso et al. (2008; 2010) use a cross-country empirical research focusing on OECD
countries, aiming to explain income distribution with public spending, education (spending
but also performance) and institutional performance. Their findings confirm that public
policies have a significant effect on income distribution and the effect happens most notably
through social spending but also (albeit in an indirect way) through high quality education
(i.e. human capital) and sound economic institutions.
Gregorini and Longoni (2009) examine the link between inequality, public spending and
political institutions and test political, economic, demographic and social variables as
potential determinants of public spending. They focus on developing countries over the
period 1970-2005. Using panel data analysis, they find evidence that income distribution is
indeed linked with public spending, which in turn depends on institutional characteristics.
Holzner (2011) considers the joint relationship between inequality and economic growth
stressing the role of public spending in transition economies. The author utilizes empirical
data for fourteen Central and East European countries over the period 1998–2006. The results
of this research confirm that countries with higher expenditures for social protection, health
and economic affairs tend to experience less inequality.

4 | P a g e
De Grigorio and Lee (2003) investigate how education affects income distribution. Based on
a large sample of countries observed during a time period of three decades (1960-1990), they
find evidence that educational factors (higher educational attainment and more equal
distribution of education) play a significant role in better income distribution, which is the
finding reported by Afonso et al. (2010) as well. They also find that social expenditures
affect income distribution positively. A significant proportion of cross–country income
inequality identified in their research remains unexplained though.
In their analysis of distributional effects of public spending, Schwarz and Ter-Minassian
(2000) accept that public spending can influence income distribution and that this happens
through economic development and growth (first and foremost, qualitative aspects of
growth). Further, the authors point out that political and institutional pressures play important
roles too, to the extent that political and institutional pressures and constraints hampering
redistribution may affect distribution even more than policy design does. Accordingly, the
authors recommend that, if public spending is to truly affect income distribution, measures
that have wide support are designed and scope for various interest groups to use expenditure
policies as a way to pursue their own interests is limited.
Roine et al. (2009) investigate the long-run determinants of inequality in a panel data
covering the entire twentieth century. The authors distinguish determinants of inequality
between different income groups, reporting that different determinants of inequality (e.g.
economic growth, financial development, banking crisis, trade openness and taxation) might
have different influences on income distribution between different income categories.
Another interesting finding is that the banking crisis is associated with a reduced income
share of the rich category. However, their sample does not include the region of our interest.
Existing research supports the hypothesis that public spending might affect income inequality
through different channels. At the same time, public spending changes together with the
economic environment, and accordingly, public spending will usually change over the period
of economic crisis as a consequence of the structural changes in the economic system (e.g.,
Afonso and Jalles, 2012; Corsetti et al., 2012; Kollmann et al., 2012). The change in the
5 | P a g e
public spending is not expected only because of the changes in public revenue side and
problems related to financing expenditures, but also because of government responses and
policies pursued primarily to stabilize economic output. Accordingly, in the period of global
economic downturn we can expect variations in public spending, which could change income
distribution.
There is also a good number of papers which specifically investigate the link between
institutions and inequality and mainly find that institutional inefficiency increases income
inequality.
For example, Chong and Calderon (2000) report a cross-section empirical research between
institutions and income distribution. The authors find a quadratic relation between
institutions and income inequality (in other words, institutional quality is positively linked
with income inequality in the case of low-income countries, while for rich economies the link
is negative). However, this research fails to establish any dynamic link between the variables
of interest.
Carmingnani (2009) uses panel data and an endogenous system of three structural equations
to investigate the links between income distribution, institutional quality and government
stability. The author finds that less efficient institutions increase income inequality while
greater inequality increases the probability of government termination.
Chong and Gradstein (2007) investigate the relationship between inequality and institutional
quality. The authors rely on a dynamic panel model estimated as a system GMM (generalised
method of movements) in order to control for potential problem of endogeneity caused by
simultaneity. They find that bad institutions cause inequality, which is in line with economic
theory. In addition, these authors identify a mutually reinforcing mechanism between these
variables, i.e. they find evidence of simultaneity caused by reverse causality. Hence, grater
inequality may explain to some extent weak institutional performance as well.

6 | P a g e
Finally, having in mind that the financial sector was at the core of the crisis, Watt (2009)
argues that the effect on income distribution could be particularly negative and that income
distribution could be affected through number of direct and indirect channels of influences.
Although we can identify some key channels of influences, as Nolan (2009) points out,
income inequality reflects a complex interaction of various factors which are not often short-
run rooted. One of the most important direct channels of influence is raising unemployment
which increases poverty and widens income distribution (Watt, 2009; Nolan, 2009). In
addition, workers are forced to defend their jobs with lower wages while governments
generally support public sector wage cuts in the time of deficit. All of these measures again
might increase income inequality at the bottom and in the middle class. The latest global
economic downturn is a period when a whole spectrum of policies have been used to fight
the recession. However, all of these policies affect not only growth, but simultaneously
income distribution as well (Garcia-Penalosa, 2010), which is another direct and/or indirect
channel of influence worth investigating.
3. Methodological framework of the research
With the aforementioned aim of our research and our research hypothesis in mind, as well as
experiences and findings of other researchers which were set out in the foregoing literature
review, we formulate our methodological framework as follows.
The research will be focused on Bosnia and Herzegovina (where necessary, SEE countries
will be examined for reference purposes). Wherever possible, the period that will be
examined shall include years 1996 - 20103. The research will be based on annual data since
more frequent indicators are not available.
3 Official data before 1996 do not exist. From 1992 to 1995, BiH was in a war and data for that period cannot be
considered as reliable. Data for years prior to 1992 on the other hand are not comparable with the existing
macroeconomic aggregates, because of different systems of national accounting.
7 | P a g e
Our key empirical investigation will be based on time series analysis, constrained by a very
small sample (maximum fifteen observations, i.e. years). This will be rather challenging, and
more advanced econometric modelling (e.g. panel analysis) is not feasible. Accordingly, we
will need to rely on techniques that will give us intuitions and guides for qualitative
interpretation. All variables that will be used in our investigation (e.g., inequality, total public
spending, public spending on health, education and social protection, current and capital
spending, and different indices capturing institutional efficiency) will be more discussed
through a qualitative analysis of the data and the obtained empirical results. Also, we will
estimate pair-wise correlations among the variables of interest, calculate their statistical
significance and investigate whether there is an indication of certain relations between the
variables. These results will motivate our deeper quantitative investigation that will be done
through a simple time-series modelling in order to estimate the causal links.
All empirical results should be treated with considerable caution having in mind the limited
time span and general problem of data availability for BiH. To reduce the effect of these
limitations, we shall complement official data through qualitative judgments, insider
expertise and data that are not publicly available.
4. Contextual framework - global economic crisis, public spending and income distribution in BiH
4.1. Global economic crisis in Bosnia and Herzegovina
The global economic crisis, which started in most of the developed economies in 2008, hit
the BiH with a one-year lag, i.e. in 2009. That was the year when the post-war BiH registered
for the first time a negative growth rate and a significant drop practically in all
macroeconomic indicators.
8 | P a g e
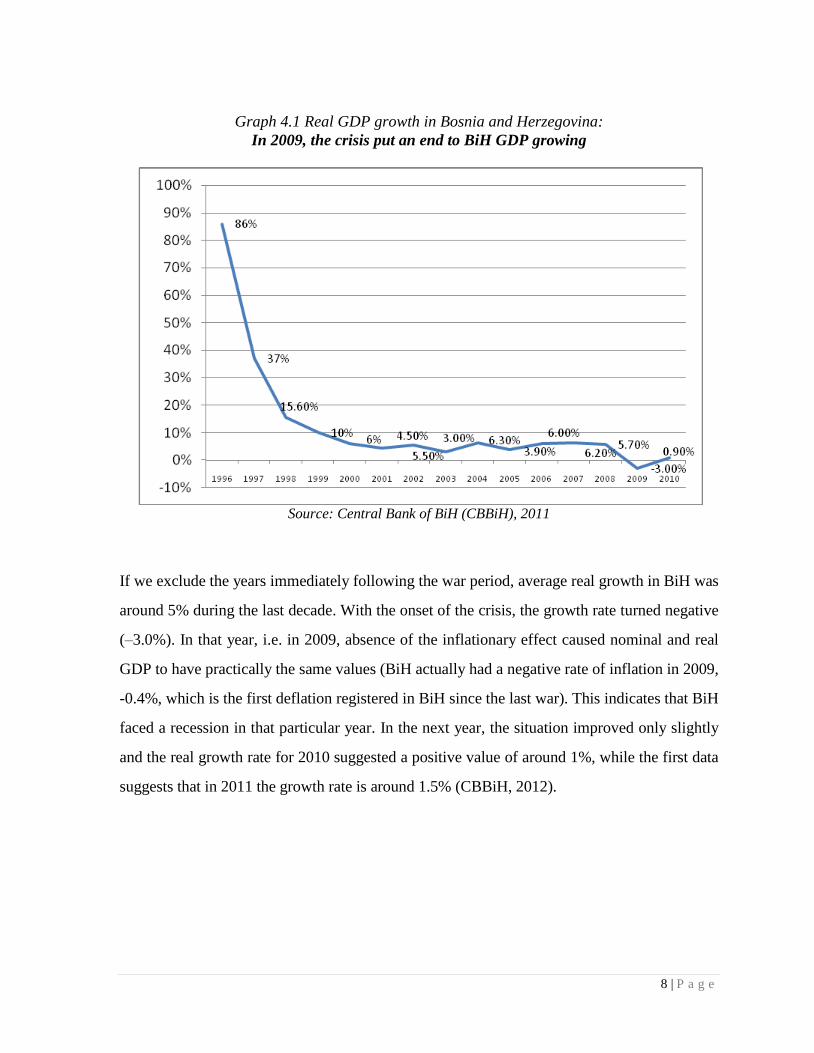
Graph 4.1 Real GDP growth in Bosnia and Herzegovina:
In 2009, the crisis put an end to BiH GDP growing
Source: Central Bank of BiH (CBBiH), 2011
If we exclude the years immediately following the war period, average real growth in BiH was
around 5% during the last decade. With the onset of the crisis, the growth rate turned negative
(–3.0%). In that year, i.e. in 2009, absence of the inflationary effect caused nominal and real
GDP to have practically the same values (BiH actually had a negative rate of inflation in 2009,
-0.4%, which is the first deflation registered in BiH since the last war). This indicates that BiH
faced a recession in that particular year. In the next year, the situation improved only slightly
and the real growth rate for 2010 suggested a positive value of around 1%, while the first data
suggests that in 2011 the growth rate is around 1.5% (CBBiH, 2012).

9 | P a g e
Graph 4.2 GDP per capita in Bosnia and Herzegovina (in US$):
After 12 years of continuous increase, GDP/capita started deteriorating in 2009
Source: CBBiH, 2011
Similar to the trend in the GDP, BiH faced 12 years of continuous increase in GDP/capita
following the war, as we can see from the above graph. However, in 2008, the GDP/capita
reached its peak and for the first time after the war, it started falling in 2009 and fell further
in 2010. In the context of the real economy, the already high official unemployment rate
(Graph 4.3) increased in both 2009 and 2010. Estimates of the International Labour
Organisation (ILO) report a lower unemployment rate but also show an increasing trend over
those two years (i.e. from 25% in 2008 to 29.1% in 2010). All these macroeconomic
indicators are in line with expected trends for a recession period.

10 | P a g e
Graph 4.3 Unemployment in Bosnia and Herzegovina (% of labour force):
Following a short stabilisation of unemployment and a subsequent drop,
unemployment started rising again in 2009
*
Source: BiH Directorate for Economic Planning (DEP), 2011
All in all, over the period of the global economic downturn (which is in the case of BiH
linked primarily to 2009) there was a significant drop in key macroeconomic indicators.
Although growth and unemployment indicators showed a slightly positive change in 2010, it
is hard to say that we have witnessed significant improvement, which should normally be the
case had the crisis period ended.
4.2. Public spending in Bosnia and Herzegovina
In line with existing research and theory, we expect the crisis to affect structure and
magnitude of public spending, which should in turn affect income distribution. However,
testing this assumption in the BiH context is not simple. Reliable figures about public
spending in BiH, and especially consolidated in a reasonable way and based on a
methodology consistent throughout time, unfortunately do not exist. Each of the fourteen

11 | P a g e
governments in BiH4 and almost 150 local self-governance units (municipalities) plan,
execute, manage, record and report their expenditures rather independently. Accordingly,
efforts to introduce unified and systematic expenditure reporting that would allow
consolidation which is necessary to provide an answer to questions such as “How much
public money was spent overall?” or “How much of that amount was spent on education,
social protection or health?” had only limited success.
In absence of such information, a large portion of this research had to be allocated to liaison
with individual governments in BiH and collecting information about their total expenditures,
expenditures for social protection5, for health
6 and for education
7. The result of that process
is presented in the Appendix 1, in Table A.1, and while these figures should not be
considered accurate, they are the best possible estimation based on fragmented and limited
information available.
It was already mentioned earlier in this paper that the GDP of BiH experienced continuous
growth prior to 2009. Total expenditures, on the other hand, seem to have followed their
own, cyclical trend - while expenditures increased steadily until 2000, they fell before
catching up again in 2002, rising ever since8. This trend differs from that of revenues as well
- although BiH legislation stipulates that expenditures should not exceed revenues and
financing, cash accounting and debt make this possible. Accordingly, until 2000, fiscal
balance in BiH was continuously negative (i.e. expenditures were higher than the sum of
revenues and financing), which reoccurred once the crisis kicked in in 2009.
4 Bosnia and Herzegovina is divided in fourteen administrative units – one national level (State), one district
(Brčko District), two entities (Federation of Bosnia and Herzegovina and Republika Srpska) and ten cantons
which are subdivisions within the Federation of Bosnia and Herzegovina. 5 In this paper, social expenditures refer to the sum of costs of all government agencies dealing with social issues, the
return fund for internally displaced persons, employment funds, pension funds and the childcare fund in RS. 6 Health expenditures include expenditures of all ministries of health as well as expenditures of health protection funds.
7 Education expenditures include expenditures of ministries of education, schools, on-budget universities,
pedagogic institutes, and scholarships and grants. 8 This statement, just as all other statements in this paper relating to expenditures, should be accepted with caution,
as total expenditures were, for the purpose of this paper, not calculated simply as the sum of official budgets but
include also extra-budgetary expenditures for health and social protection where such information was available.
Please note though that no information could be obtained about social protection expenditures incurred between
1996 and 1999 and that total expenditures for those years are net of social protection expenditures.
12 | P a g e
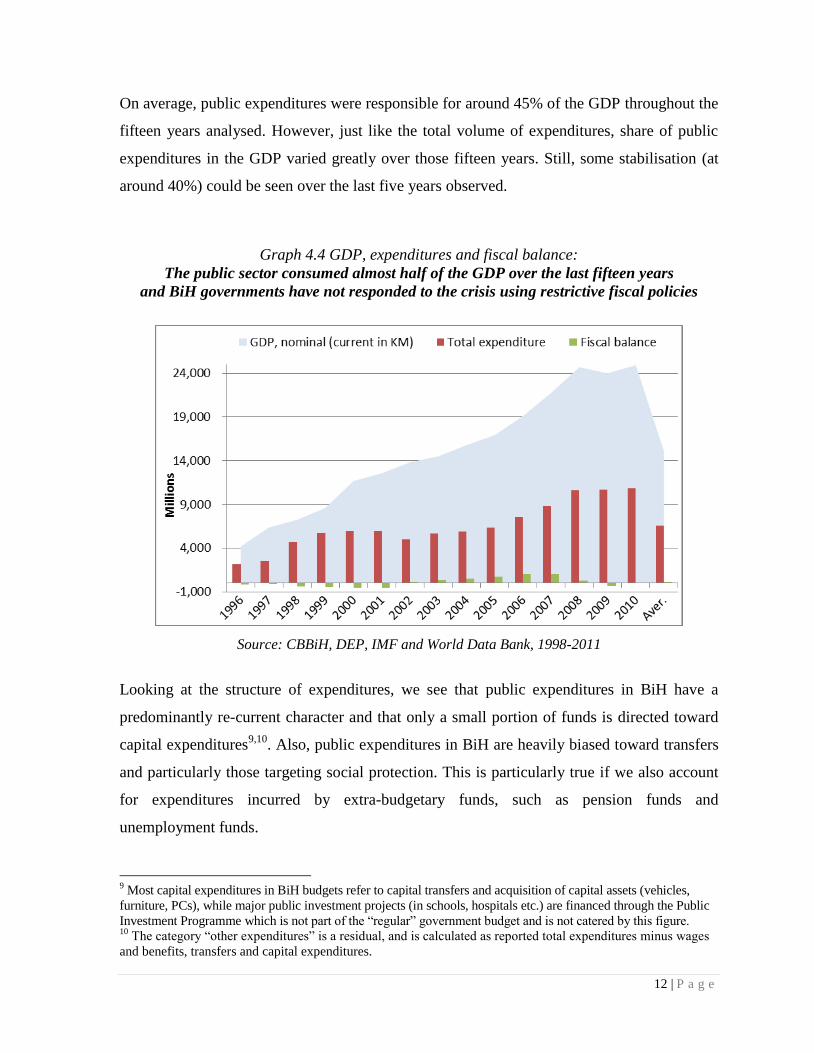
On average, public expenditures were responsible for around 45% of the GDP throughout the
fifteen years analysed. However, just like the total volume of expenditures, share of public
expenditures in the GDP varied greatly over those fifteen years. Still, some stabilisation (at
around 40%) could be seen over the last five years observed.
Graph 4.4 GDP, expenditures and fiscal balance:
The public sector consumed almost half of the GDP over the last fifteen years
and BiH governments have not responded to the crisis using restrictive fiscal policies
Source: CBBiH, DEP, IMF and World Data Bank, 1998-2011
Looking at the structure of expenditures, we see that public expenditures in BiH have a
predominantly re-current character and that only a small portion of funds is directed toward
capital expenditures9,10
. Also, public expenditures in BiH are heavily biased toward transfers
and particularly those targeting social protection. This is particularly true if we also account
for expenditures incurred by extra-budgetary funds, such as pension funds and
unemployment funds.
9 Most capital expenditures in BiH budgets refer to capital transfers and acquisition of capital assets (vehicles,
furniture, PCs), while major public investment projects (in schools, hospitals etc.) are financed through the Public
Investment Programme which is not part of the “regular” government budget and is not catered by this figure. 10
The category “other expenditures” is a residual, and is calculated as reported total expenditures minus wages
and benefits, transfers and capital expenditures.

13 | P a g e
As demonstrated below in Graph 4.5, in the period immediately following the war, the largest
portion of public expenditures (around 70%) was spent on wages and benefits. This is not
surprising since total expenditures were very low in international and historical comparison,
while governments were staffing up and payment of wages and benefits is a contractual
obligation which must be met. On transfers (to individuals, NGO’s and state owned
enterprises) less than 10% of expenditures were spent. On capital expenditures, as little as 1%
and 3% were spent in 1996 and 1997 respectively. However, in 1998, major changes in the
structure of expenditures were introduced. Wages and contributions dropped to 22% or less (but
have “recovered” in 2002 with 29% and have been growing ever since). Transfers increased to
36% on average (their growing trend remained until 2010) and capital expenditures increased to
around 5%. The main determinants of this significant change in the structure of expenditures
were post-war affairs (financing of defence, war veterans, reconstruction, etc.), transition to
market economy and state-building efforts. More details on events that have taken place in BiH
during the period between 1996 and 2010, which may have had an impact on volume and
structure of expenditures, are presented on the next page, in Textbox 4.1.
Graph 4.5 Structure of expenditures:
BiH budgets’ focus has shifted toward transfers
Sources: CBBiH, DEP and IMF, 1998-2011

14 | P a g e
Textbox 4.1 Major events in BiH between 1996 and 2010
Sources: IMF’s Article IV Reports and Selected Issues, 1998-2010
In the period between 1996 and 1998, BiH made significant efforts to increase its revenues – it
launched privatisation and liquidation of state-owned banks and enterprises, reformed the customs
tariff system and administration, started harmonising the sales tax countrywide, unification of tax
policies, reduction of corporate income tax rates and social insurance contribution rates. Its
expenditure side was governed by considerable military service expenditures (which made up more
than 5% of the 1998 GDP according to IMF estimates, excluding off-budget military expenses which
were almost just as high) and social expenditures (benefits for pensioners and invalids, war invalids
and survivors, child protection, health insurance and unemployment insurance. According to IMF,
benefits for war invalids and war survivors made up almost 10% of the 1998 budget). Expenditures for
education, health and infrastructure were relatively low compared to other countries in the region,
partly due to significant off-budget donor support in these areas.
Between 1999 and 2000, privatisation (particularly of small enterprises) progressed, labour market reform
was implemented and military employment was further reduced. War invalids and their families continued
to receive a high portion of the budget, and social insurance and assistance programs remained poorly
targeted. While reported unemployment was high (many companies decide not to register their employees
to have their health insurance covered by the unemployment fund), the governments widened continuously
and new institutions were formed (an example being the State Border Service, which replaced entity
functions and resulted in more employees earning higher, State-level pay-scale salaries). Brčko separated as
an administrative unit, with its own institutional structure causing considerable costs. Also, public sector
wages continued increasing and public servants continued receiving privileges such as allowances for
participation in committees. At the same time, recovery from devastation caused by the war was aided by
considerable foreign assistance and nearly all investments in education and health were financed by donors.
During 2001 and 2002, revenues increased considerably, tax administration was strengthened and the
country had better control over spending (the country was again under an IMF Stand-by Agreement
regulating its expenditures but also closing financing gaps). Pensions grew, certain customs privileges
for war veterans were abolished and new identification documents and passports were issued brining
in additional revenues. Domestic claims were restructured and ex-Yugoslavia succession proceeds
were used to cover costs of further military demobilisation.
Between 2003 and 2007, tax administration was further strengthened, indirect taxation and customs
were introduced at the State level and one of the three telecommunication companies was privatised
boosting revenues. Import tariffs were cut under free-trade agreements. There were only few smaller
investments in infrastructure, limited efforts to accelerate repatriation of refugees and internally
displaced persons, and while major defence reforms were carried out (centralisation and control
structures, continued demobilisation etc.) the social benefits system was reformed only marginally.
Between 2008 and 2010, public debt was low compared to other SEE countries. Income tax and public
wage reforms were carried out (wages were reduced in 2009 and frozen in 2010 at the 2009 level to free
up money for new institutions and capital investments). Repatriation of displaced persons continued.
Finally, the Federation of BiH, the larger of the two entities in the country, made the first steps toward
reducing transfers by eliminating special unemployment benefits for demobilised soldiers and embarked
on an audit of rights-based benefits for non-war and war invalids.

15 | P a g e
Having reviewed indicative trends and patters in total expenditures, it is also worth reviewing
those of the other three selected expenditure-related variables – expenditures for health,
education and social protection. The below Graph 4.6 presents them in comparison with total
public expenditures in BiH. As the foregoing discussion already introduced, BiH
expenditures are dominated by expenditures targeting social protection. Fiscal data are not
available for the first four years of interest, but during the period between 2000 and 2010,
social expenditures consumed one third of country’s expenditures. From 2000 until 2004, this
figure was lower but grew continuously (from 27% in 2000 to 42% in 2004). Following that,
it dropped and started rising again, resulting in 35% of total expenditures in 2010. Health and
education were allocated far smaller shares during the period 1996-2010, on average 12%
and 15% respectively. Also, these two government functions seem to follow a different trend
from that of social protection. Both functions have started off somewhat stronger in 1996 but
dropped in 1998, and since then, both have been mostly growing, reaching 16% and 20%
respectively in 2010.
Graph 4.6 Shares of health, education and social protection in total expenditures:
Health and education expenditures constitute very small portions of total expenditures,
while social protection is put far greater emphasis on
Sources: WHO (health), Council of Europe, EU, WB and BiH ministries of finance (education),WB,
IBHI and BiH ministries of finance (social p.) and CBBiH, DEP and IMF (other exp.), 1998-2011
16 | P a g e
The described situation is quite different from that in other countries in southeast Europe11
.
While the other eight SEE countries of interest for this study have on average doubled their
GDP during the period of observation (212%), in BiH, it has grown almost five times (495%).
It should be noted though that such growth in BiH mainly reflects reconstruction of the war-
damaged economy and not “real” economic growth. Growth in reported population was also
stronger in BiH than elsewhere in the region (14% compared to 10%). Finally, differences
could be observed also in the share of public expenditures in the GDP - while public
consumption contributed to BiH GDP by 44% on average, in other countries of the region GDP
was less driven by public consumption (32% on average). Of that, Bosnia and Herzegovina
spent slightly more on health than other SEE countries (5.4% compared to 4.5%), while it spent
the double on education (7.1% compared to 3.6% on average in other countries of the region).12
Graph 4.7 shows the growth rates for public expenditures overall and expenditures for health,
education and social protection, compared with the growth in the nominal GDP.
Graph 4.7 Growth rates of GDP, total exp., health, education and social protection:
While allocations for health, education, social protection and expenditures seem unrelated
to the GDP growth, it appears that two of the allocations (for health and social protection)
are linked to overall expenditures
Sources: WHO (health), Council of Europe, EU, WB and BiH ministries of finance (education),WB, IBHI and BiH ministries of finance (social p.) and CBBiH, DEP and IMF (other exp.), 1998-2011
11
This comparison is based on country data available in the World Data Bank as of February 2012. 12
Similar data on social protection could not be found.

17 | P a g e
With respect to total expenditures, it seems that until 2003, they grew counter-cyclically (i.e.
in opposite relationship to the GDP). In 2004, the situation changed and they started
following the GDP trend (which is the pattern one would expect, as expenditures were
around 44% of the GDP during the fifteen years observed). Education expenditures seem to
have followed an independent trend until 2006, when the situation changed and they started
following growth in total expenditures. Allocation for health expenditures followed the trend
in total expenditures almost from the beginning (possibly, allocations for health were decided
based on a percentage of total expenditures and were adjusted using the same increment as
with total expenditures). Social protection expenditures seem also to have followed the trend
of total expenditures, albeit less than health.
From this analysis and the fact that reported population in BiH has not grown by more than
14% over the relevant time period, we can conclude that changes in expenditures for
government functions relating to human capital (education, health and social protection),
which as the theory claims affect income distribution, have most likely not been based on
population estimates or the economic situation, but were rather the result of arbitrary
decisions. These relationships were concluded based on a simple visual analysis of the trends.
Whether there is also evidence of statistically significant relationships among these variables,
and most importantly between them and income inequality, will be discussed in the empirical
part of this research paper (Section 5).
4.3. Income distribution in Bosnia and Herzegovina
4.3.1. Current data on income distribution in BiH
There is very little information available on income distribution in BiH. Although different
statistical sources reported the Gini coefficient in their works, to our knowledge, it does not
go beyond three years: 2001, 2004 and 2007. This circumstance represents a serious obstacle
for any research dealing with income distribution in BiH; in particular, no continuous
variable exists that would allow econometric analysis including calculation of any kind of

18 | P a g e
correlations between variables of interest. However, if we look at the coefficient for the three
years available, we see an increasing trend of this index, ranging from 0.28 in 2001; 0.35 in
2004 to 0.37 in 2007 (WB, 2012), which is a considerable increase over such a short period
of time. These three time-series observations do not allow us to say a lot about this indicator
or estimate the effect of the current global economic crisis on inequality in BiH though. We
may conclude only that we have indication that inequality in BiH has risen over the observed
period.
Having in mind our aim to investigate the origins of and trends in inequality in BiH, we opt
to rely on alternative sources of relevant data and establish our own proxy for the Gini
coefficient, which will give us a longer time-span and provide sufficient inputs for more
credible conclusions. We are aware that poverty and income distribution is a
multidimensional phenomenon (Ferreira, 2011) and any income distribution measure is at the
best proxy. However, we try to go a step further by using some novelty longitudinal data in
our analysis. Accordingly, the following sub-section describes our alternative strategy in
measuring inequality in BiH.
4.3.2. Establishing a proxy for income distribution in BiH
During the process of this research, we have investigated all available data bases which could
help us establish the necessary Gini coefficient and ended with the UNDP BiH Early Warning
System (EWS) surveys database (2000-2010) as the second-best source for this purpose. The
main reasons why we have selected this database are as follows. The EWS survey was
conducted on a quarterly, semi-annual or annual basis over the period 2000-2010, giving us
eleven years of continuous data. The sample used was established to be representative in terms
of different entities in BiH, ethnicities, cantons, municipalities, urban-rural areas, male-female
and minority-majority respondents, i.e., being representative of BiH population. The overall
sample size is around 66,000 observations from over 30 views that took place over eleven
years, giving us around 6,000 observations per year on average. As part of our research, we
have identified the most suitable question from the used questionnaires that can be used to
proxy income distribution (more details about the question are provided, in Textbox 4.2).

19 | P a g e
Textbox 4.2: Developing a proxy for the Gini coefficient using the EWS BiH survey
In order to calculate our proxy for the Gini coefficient, we rely on the methodology used for
census data that is described in Appendix 3 (as supporting reference, please see also Sen
(1997)). Generally, based on the survey data we have established five categories of
households (0-400KM; 401-800KM; 801-1200KM; 1201-1600KM; 1601-2000KM),
identified respondents per group, calculated income per group based on averages13
, obtained
the accumulated income per group, and based on the formula detailed in Appendix 3
calculated the proxy for the Gini coefficients for all of the observed years. Summary statistics
of the Gini coefficient proxies is below (in Table 4.1) while a visual interpretation of our
calculations of the Gini coefficient follows in Graph 4.8.
Table 4.1 Descriptive statistics of the proxies of the Gini coefficient for BiH (2000-2010)
Mean St. dev. Min. Max.
EQUAL 0.37 0.02 0.33 0.40
Source: Authors’ calculations using Stata 11
13
For instance, the second income group in its original scale is 1-100KM and the average used to calculate the
total income of respondents belonging to this group is 50KM. For the following group (101-200KM) the
average is 150 KM. The next income scale (201-300KM had) the average of 250KM; etc.
The Early Warning System question assessed as most suitable for the purpose of establishing a
proxy for the Gini coefficient was: “This is a list with different categories of total income. In which
category would you put your household if you included all salaries, pensions and other sources of
income?”. The scale provided ranged as: 0; 1-100KM; 101-200KM; 201-300KM; .... 1900-
2000KM; over 2000 KM. The distribution of answers is reported in Table A.2 in Appendix 2.
Around 4.6% of respondents did not answer this question and 9.7% reported they did not know the
answer. This is not surprising since respondents are generally often not keen to report their income
and all such responses were excluded. Another challenge was the category “over 2000 KM”. In
our methodology we need to calculate the total income of all categories based on upper limits
and/or averages of all scales. Since this category is without an upper level, we had to exclude it as
well. However, there were only 1.7% of such responses and we do not have indications that the
obtained results are significantly different after this remedy.

20 | P a g e
020
40
60
80
10
0
CU
MU
LA
TIV
E %
OF
IN
CO
ME
0 20 40 60 80 100CUMULATIVE % OF POPULATION
LORENZ CURVE WITH INCOME INEQUALITY
Graph 4.8 Visual interpretation of the Gini coefficient proxies for BiH:
Calculation of the proxy for the Gini coefficient returned eleven observations
Source: Authors’ calculations
To draw a representative Lorenz curve, which is a graphical interpretation of income distribution,
we use data from the latest available year (i.e. 2010). The result is reported on Graph 4.9. As
depicted in the above Graph 4.8, the obtained Gini coefficient proxy for 2010 was 0.38.
Graph 4.9 Illustration of the Lorenz curve of income distribution in BiH (2010)
Source: Authors’ calculations

21 | P a g e
The calculated proxies for the Gini coefficient suggest three changes that are worth
mentioning: in 2006, in 2008, and between 2009 and 2010. In 2006, there was the first
structural break. The most likely reason for this break in 2006 was the introduction of the
value added tax in BiH, with higher rates of average taxation, especially on essential goods14
.
Such measure should make us expect a rise in inequality, as lower income categories were
affected by the rise in taxation of essential goods more than the rich in relative terms. The
second structural break that is suggested was in 2008. From the economical point of view,
this was a rather successful year combined with political and institutional achievements in the
country geared toward the preparation of the country for EU accession. That structural break
had brought an optimistic trend to almost all economic indicators in BiH for that particular
year and it seems to the Gini index as well (which fell in that particular year). The third
structural break seems to have taken place in the period 2009-2010. The most likely reason
for that is the effect of the global economic crisis combined with internal political and
institutional problems, which we aim to explore in the remainder of this paper to an extent
feasible with the data we operate with15
.
Although the main advantage of our proxy for the Gini coefficient is that we use new data
and produce this longitudinal proxy for eleven years (which is not available in any other
source), we need to mention a few limitations of our strategy. Firstly, we rely on survey data
and responses on income, which might not be accurate, not least because people are often
willing not to say an accurate level of their income. Secondly, this methodology is designed
to be used more for data based on a population census, which has not been done in BiH since
1991, but we operate with a representative sample of the BiH population. A disadvantage of
this coefficient is that we cannot use it for comparative purposes with other similar countries
in the region. And finally, although the time span of this proxy is much better than in other
sources, any time-serious modelling with eleven years of data remains very limited.
14
Prior to the introduction of the value added tax, the tax rate applicable to most essential products was 0%. 15
Following the general elections in BiH in 2010, political parties spent almost two years agreeing on the
composition of the State government, while the Euro-Atlantic improvement was very limited.

22 | P a g e
5. Empirical investigation of the link “equality-crisis-public spending in BiH”
5.1. Initial investigation of the variables of interest
As already mentioned, our key variables of interest include indicators measuring and/or
proxying income inequality, institutional performance and public spending in BiH. In Table
5.1 we report the descriptive statistics of these variables, while Table 5.2, which follows
thereafter, reports pair-wise correlations between these indicators.
Table 5.1 Descriptive statistics of the main variables of interest
Variable Observations Mean St. dev. Min Max
EQUAL 11 .3727273 .0214900 .33 .4
DTIME 15 .1333333 .3518658 0 1
INST 15 .5486667 .1001332 .32 .65
PSTAB 12 .3033333 .0600505 .24 .43
GEFFIC 12 .2408333 .1004045 .07 .38
PREGUL 12 .3783333 .1076892 .21 .51
PSPEND 15 .4546667 .0958322 .36 .67
PSOCIAL 11 .1390909 .0144600 .12 .16
PEDUC 15 .0666667 .0175933 .04 .09
PHEALTH 15 .0506667 .0116292 .03 .07
CAPITEX 15 .0193333 .0079881 .01 .03
Source: Authors’ calculations using Stata 11
In our model, variable EQUAL denotes inequality (i.e. the proxied Gini coefficient), DTIME
is a time dummy variable, INST stands for an aggregated composite institutional index,
PSTAB for an index of political stability, GEFFIC for a government effectiveness index,
PREGUL for a regulatory quality index, PSPEND for total public expenditures in BiH,
PSOCIAL for total expenditures in BiH for social protection, PEDUC for total public
expenditures in BiH for education, PHEALTH for total expenditures in BiH for health and
23 | P a g e
CAPITEX for total capital expenditures financed through BiH budgets. Note, all variables
excluding the time dummy (DTIME) are relevant measures transformed to be indices in the
range from 0 to 1 in order to make empirical investigation easier.
From Table 5.1 we see that the six of our indicators are available for fifteen years, three are
available for twelve years, while social protection expenditures and the Gini proxy are
available for eleven years only. Since the Gini proxy is the dependent variable in our model,
this reduces the sample size to eleven years effectively.
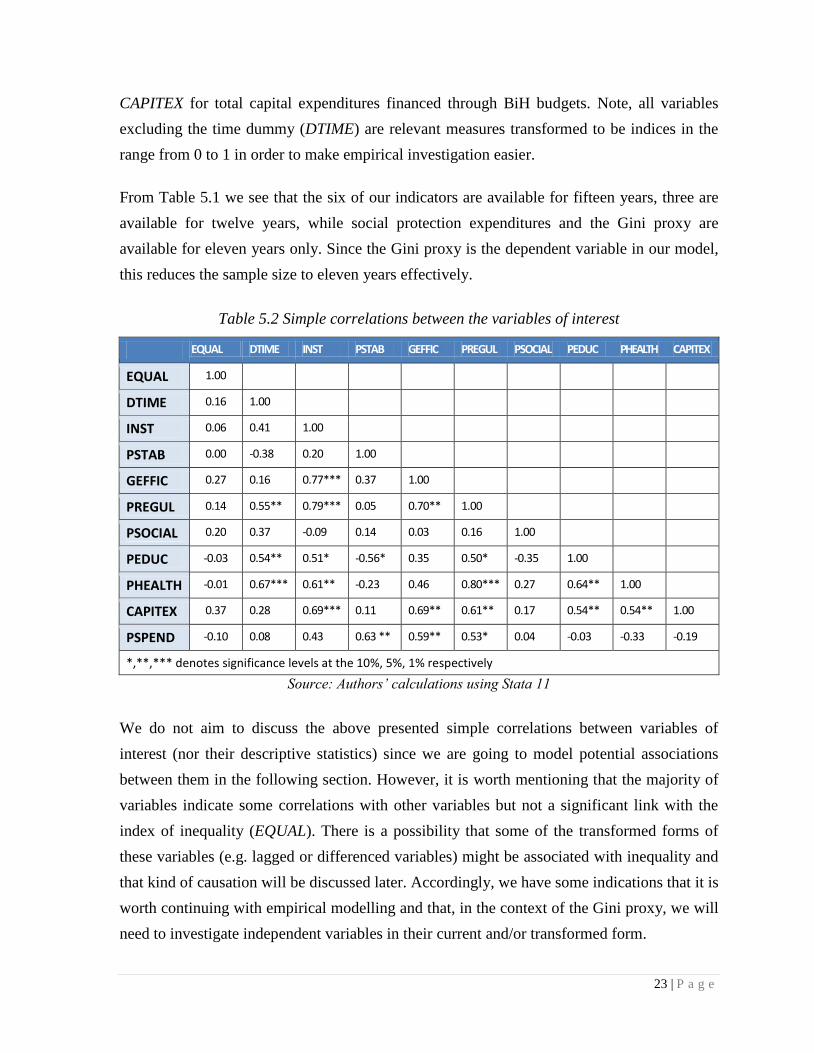
Table 5.2 Simple correlations between the variables of interest
EQUAL DTIME INST PSTAB GEFFIC PREGUL PSOCIAL PEDUC PHEALTH CAPITEX
EQUAL 1.00
DTIME 0.16 1.00
INST 0.06 0.41 1.00
PSTAB 0.00 -0.38 0.20 1.00
GEFFIC 0.27 0.16 0.77*** 0.37 1.00
PREGUL 0.14 0.55** 0.79*** 0.05 0.70** 1.00
PSOCIAL 0.20 0.37 -0.09 0.14 0.03 0.16 1.00
PEDUC -0.03 0.54** 0.51* -0.56* 0.35 0.50* -0.35 1.00
PHEALTH -0.01 0.67*** 0.61** -0.23 0.46 0.80*** 0.27 0.64** 1.00
CAPITEX 0.37 0.28 0.69*** 0.11 0.69** 0.61** 0.17 0.54** 0.54** 1.00
PSPEND -0.10 0.08 0.43 0.63 ** 0.59** 0.53* 0.04 -0.03 -0.33 -0.19
*,**,*** denotes significance levels at the 10%, 5%, 1% respectively
Source: Authors’ calculations using Stata 11
We do not aim to discuss the above presented simple correlations between variables of
interest (nor their descriptive statistics) since we are going to model potential associations
between them in the following section. However, it is worth mentioning that the majority of
variables indicate some correlations with other variables but not a significant link with the
index of inequality (EQUAL). There is a possibility that some of the transformed forms of
these variables (e.g. lagged or differenced variables) might be associated with inequality and
that kind of causation will be discussed later. Accordingly, we have some indications that it is
worth continuing with empirical modelling and that, in the context of the Gini proxy, we will
need to investigate independent variables in their current and/or transformed form.

24 | P a g e
5.2. Empirical modelling
Our model aims to investigate the effect of public spending (PSPEND) on income
distribution (EQUAL); hence, these two variables will be of the main interest. The variable
EQUAL (an index ranged from 0 to 1, 0 representing minimum and 1 maximum inequality) is
the dependent variable, while PSPEND (% share of the total government expenditure in
GDP) is the independent variable. We expect that changes in the total level of public
spending over time might affect changes in income distributions. Namely, as Garcia-Penalosa
(2010) point out, any public policy pursued, including a response to a crisis, might affect
income distribution. We also need to investigate and control for some other potential
determinants which might influence income distribution, which is a complex phenomenon
affected with various factors (Nolan, 2009). Unfortunately, the very small number of the
degrees of freedom in our sample forces us to keep the number of independent variables to a
minimum. We believe that institutional performance (INST) is the best candidate to be
examined and discussed in our research (we rely on a composite and later disaggregated
indices constructed in the range 0 to 1, where 0 represents the minimum and 1 maximum of
institutional efficiency). The main rationale for including this variable in the regression is a
large body of literature which finds evidence of a positive effect of institutional
quality/efficiency on income inequality (e.g., Chong and Gradstein, 2007; Carmingnani,
2009). Afonso et al. (2010) explain that more efficient institutions are generally associated
with more efficient allocation of resources, and hence, lower inequality. At the same time,
having local expertise, we need to remind the reader that BiH has a quite specific,
complicated and costly institutional environment (Efendic et al., 2011), which deserves a
particular attention in any such research. We will employ a vector of institutional proxies (an
aggregated and some disaggregated components) that will capture different institutional
dimensions which might affect the relationship of interest. All these models need to be
estimated separately. Some important time-series issues relevant for such a modelling cannot
be properly investigated (because of the lack of observations), including the potential
problem of spurious regression, endogeneity, and co-integration. However, we expect a
negative coefficient, meaning that when institutions are efficient, it is more likely that
distribution of income will improve.
25 | P a g e
We will estimate this simple model by employing OLS methodology and STATA 11
software, using the following simple specification in the first stage:
Equation (1)
We follow the majority of authors and use our established Gini index as a proxy for income
distribution (EQUAL), while the key independent variables are public spending (PSPEND) and
institutional performance (INST) explained earlier. We include also a time dummy variable
(DTIME). In addition, we will estimate this regression by using disaggregated components of
government expenditure (instead of PSPEND) which might affect income distribution in BiH.
These more focused data include: public spending on social protection (PSOCIAL), public
spending on education (PEDUC) and public spending on health (PHEALTH) consolidated for
all governments in BiH (details can again be found in Table A.1).
As it has already been touched upon earlier, in establishing institutional proxies we will
follow the majority of institutional economists and rely on different aggregated and
disaggregated institutional indicators used to measure institutional performance. Firstly, we
will use a constructed aggregated composite institutional index (INST) which relies on the
EBRD structural and institutional change indicators (more on such established indicators can
be found in Falcetti et al., 2006; Eicher and Schreiber, 2010; Efendic, 2010) in order to
establish a proxy for general institutional quality in this country. Then, we will rely on
different disaggregated institutional components (substituting INST in the model) that will
enable us to explore more concrete institutional fields. For this analysis we will employ The
Worldwide Governance Indicators including indices capturing government efficiency
(proxied by the „Government effectiveness“ index - GEFFIC); political stability (proxied by
the „Index of political stability“ - PSTAB) and quality of regulation by the government
(proxied by the „Regulatory quality“ index - PREGUL). These indicators are available
annually and cover the observed period. Index „t“ denotes the time 1996-2010, while α is the
intercept term and β, γ and δ are the coefficients to be estimated.
A challenge is to investigate if there was a structural change in inequality before and after the
crisis period in BiH (i.e., 2000, 2008 and 2009-2010). In order to do that, we would need to
analyse whether the value of the parameters remains the same over the entire period or a
structural change occurred in (we envisage) 2009-2010. This will be investigated by relying

26 | P a g e
on a time dummy variable in order to keep the specification and testing procedures as simple
as possible. Since the structural break is related only to the last two years, formal testing
procedures (e.g. the Chow test for structural stability) are not feasible. Hence, the variable
DTIME will be a time dummy variable used to find out more about the potential structural
breaks in the model, with a special focus on the period of the global crisis.
5.3. Qualitative discussion of the obtained results
Equation (1) is estimated by using the OLS cross-time methodology. The obtained empirical
results are reported in Table 5.3, including some basic model diagnostics.
Table 5.3 Base-line model results
The dependent variable EQUAL is an index measuring inequality Model I Model II Model III Model IV Model V
Variables coeff. (p-value)
coeff. (p-value)
coeff. (p-value)
coeff. (p-value)
coeff. (p-value)
CONSTANT 0.62 (0.01)
1.20 (0.02)
0.37 (0.01)
0.37 (0.00)
0.37 (0.00)
DTIME 0.04 (0.09)
0.05 (0.04)
0.01 (0.20)
0.01 (0.94)
-0.01 (0.87)
D5.INST -0.21 (0.03)
-0.47 (0.03)
-0.25 (0.08)
-0.22 (0.09)
D4.PSTAB -0.03 (0.07)
PSPEND -0.60 (0.08)
-2.00 (0.03)
D6.PSOCIAL -0.06 (0.01)
D6.PEDUC 0.07 (0.06)
CAPITAL -0.11 (0.04)
Observations 10 5 5 9 9
F-statistic p-value reported p=0.11 p=0.06 p =0.02 p =0.02 p=0.08
R-squared 0.61 0.99 0.99 0.99 0.70
Ramsey RESET test 0.20 - - - 0.67
Breusch-Pagan test 0.27 0.64 0.74 0.74 0.73
Variance inflation factor Mean=3.1 Max=3.95
Mean=1.85 Max=2.32
Mean=2.09 Max=2.16
Mean=2.09 Max=2.16
Mean=1.07 Max=1.11
Sources: Authors’ calculations using Stata 11
27 | P a g e
Before we interpret any of the obtained results we would like to remind the reader that we
operate with a very short time span of the data and that all results should be treated with
caution and at the best as intuitive. That is an external limitation that cannot be influenced;
still, as much information will be extracted from this dataset as possible.16
Equation (1) is estimated in its general form (Model I) including also different variations of
institutional variables (Model II) and public spending variables (Models III-V). Majority of
estimated models had problems with model diagnostics and we report in Table 5.3 only models
which had satisfactory or at least close to satisfactory model diagnostics. Interestingly enough,
some estimated models (i.e. Model III and Model IV) have very high R-squared indicating that
the estimated linear regressions fit the data almost perfectly. However, the sample size limits us
in making strong statistical inference from these coefficients.
The general model (Model I), which controls for the effects of total public spending and
general institutional efficiency on income inequality, is estimated with rather weak statistical
diagnostics17
but still provides a few interesting results. Firstly, in line with discussed
literature, the model suggests that there was a systematic increase in income inequality over
the crisis period (DTIME) in comparison to the rest of the observed period. The economic
downturn in BiH of 2009-2010 has increased income inequality on average by 4% and this
result comes to be consistent with our visual inspection of the data on income inequality
presented in Graph 4.8. Further, in terms of institutional influence on income inequality, two
important observations could be made. Firstly, a positive change in institutional environment
over five year period (D5.INST18
) is negatively associated with income inequality. Hence,
more efficient institutions decrease income inequality, which confirms the findings of some
other non-transition studies (e.g., Chong and Gradstein, 2007; Carmingani, 2009). Secondly,
this effect is not contemporaneous; instead, the results imply that the effect works only with
lags, i.e., the effect of institutions works with a five year difference. Institutional literature
generally recognizes the lagged effect of institutions in economics, and a similar finding for
16
In order to avoid repetition: the same limitation to the rest of this section. 17
The F-test of joint significance has a p-value of 0.11. Since it is reasonably close to the 10% level of
significance (the threshold level acceptable for small samples), we have decided to discuss this model. 18
Note, in our investigation we have obtained that only the five-years difference of the institutional proxy
(D5.INST) has a significant effect in the model with reasanably apropriate diagnostics. Note that this is not the
case with the current (INST) or lagged effect (anything less than five-years difference) of this variable.

28 | P a g e
transition sample of countries is obtained by Efendic (2010)19
. Finally, public spending
(PSPEND) in the model has a negative coefficient, suggesting that higher levels of public
spending in the model are associated with lower inequality, which is consistent with some
transition research (e.g. Holzner, 2011).
The base model is estimated in the second stage by substituting the aggregated institutional
index with more specific institutional determinants (including indices measuring political
stability, government effectiveness and regulatory quality). Only one of these determinants,
political stability, appeared to be significant in a model that had acceptable diagnostics (Model
II). Accordingly, we identify political stability (D4.PSTAB) to be a relevant determinant in the
model, suggesting that grater political instability is associated with an increase in income
inequality. Since BiH is a transition country which has faced a number of political crises in the
post-war period, this result is not surprising. An interesting feature of this variable though is its
influence with a lagged effect (this time with a four years difference), which coincide with
electoral cycles. This importance of political stability in decreasing income inequality deserves
appropriate attention and would need to be investigated further in the future.
In the remaining models we report effects of different components of public expenditures i.e.
spending for social protection (Model III), spending on education (Model IV), and the effect
of public capital spending (Model V).
Model III reports the effect of spending on social protection (D6.SOCIAL) with a negative
and significant correlation. Hence, higher spending for social protection is associated with
slightly lower income inequality, which is a conventional finding. Still, in our model, the
magnitude of the estimated coefficient (being 0.06) is much lower than for institutional
proxies, for example.
The effect of public spending for education (D6.EDUC) has a positive and significant (albeit
weak as well) effect on income distribution; a higher spending on education is associated with
an increase in income inequality. Although some authors report similar results (e.g. Bergh and
19
Using a dynamic panel model, the author identifies that in transition countries, changes in institutions over a
period of five years are positively associated with economic performance. The key finding is that the time effect
of institutions in transition matters and that the peak effect is reached with a five year difference.
29 | P a g e
Fink, 2008), this result seems somewhat unconventional. A conventional argument is that
higher educational attainment results in a higher and more equal distribution of human capital,
reducing the wage and income gap (e.g. Afonso et al., 2010). Holzner (2011), on the other
hand, observes that in the transition context, tertiary education has a positive effect on income
distribution while secondary education has a negative effect. However, we are controlling
only the total public spending for education without distinguishing between different levels of
education. Nevertheless, a possible justification of the obtained result could be the existence
of a so-called “dual economy” - coexistence of the modern/formal and the traditional/informal
sector (Yuki, 2012), which is very likely the case in BiH. In other words, more spending on
education rises the total share of educated people in BiH labour force, who per se belong to
higher income categories (modern sector). However, the effects of education and spending on
education could be properly measured and investigated only in a long run, which we cannot
do due to the limited time span of this research.
The effect of capital expenditure (CAPITAL) on inequality (Model V) is negative and
significant, and one of the strongest of all the examined public expenditure categories. In
addition, capital expenditure has a contemporaneous effect on income inequality in the direction
that more capital expenditures reduce income inequality. Apart from well-known long-run
effects of investment (of stimulating economic growth), capital spending also have a short-run
positive and multiplying effect in the economy. An increase in capital spending is namely
associated with a higher level of national output, generally stimulating higher standard of living.
In addition, public capital spending is often used to target projects of public interest that have
social dimensions and address different public interests, which can positively influence income
distribution in the economy. Accordingly, public investments might be considered a public
instrument that can be used as a short-run remedy for reducing income inequality in BiH.
The last model (a model in which public spending on health was an independent variable) has
a problem with model diagnostics, which is why it is not reported here. Still, it is very
interesting to notice that the observed human capital related components of public
expenditures (social and education) have a significant effect only with a six years difference.
In any other specification that is different from these ones reported in Table 5.3, these public
spending variables were not significant and the models had problems with diagnostics.
Although this needs to be investigated more, there is a rather strong indication that changes
30 | P a g e
in the levels of above mentioned segments of public expenditures have a medium-term effect
and that policy makers need to pursue these policies having in mind appropriate timespans.
6. Conclusion
One of the topics which have deserved a lot of attention in the recent period among many
researchers is the effect of the global economic downturn on different countries and different
social and economic indicators. In line with this interest, our research focuses on the effects
of contemporary global economic and financial crisis in BiH on income distribution. It is
important to mention that the global economic crisis hit BiH in 2009, although the crisis
started a year (or even two) earlier in more developed economies. Hence, the global
economic downturn affected BiH with a short-run lag. Throughout our empirical analysis we
have found plenty indications that the global economic crisis has increased income inequality
in BiH. At a very general level, we find that higher public spending and improvement in
quality of institutions in BiH were supportive in reducing income inequality.
We have investigated the effect of some institutional determinants and different components
of public expenditures on income inequality. After controlling different institutional
indicators, we have identified a particular importance of political stability in BiH as a
determinant of income inequality. This finding is important for policy makers and especially
for domestic political forces, as a warning that political crises, which are rather frequent in
BiH, have many negative indirect effects, including this one of increasing inequality.
A more disaggregated analysis of public spending revealed indications that expenditures for
social protection are negatively correlated with income inequality, while spending on education
has a positive effect. Since the effect of public expenditures for education is more long-run
oriented and registered through a positive effect on economic growth and development, this
finding should be considered in this broader context.
An important feature of disaggregated public spending components is their timing effects,
which work only in a medium-run. Policy makers need to be aware that public spending
policies and their effects very often overcome electoral cycles, which is why they need to
purse these policies in line with their longer effects and not some short-run priorities.
31 | P a g e
References
Afonso A., Schuknecht L, Tanzi V. (2008). Income Distribution Determinants and Public
Spending Efficiency. ECB working paper series No. 861.
Afonso, A. and Jalles, J. T. (2012). Fiscal volatility, financial crisis and growth. Applied
Economics Letters, Vol. 19, Issue 18, pp. 1821-1826.
Afonso, A., Schuknecht, L. and Tanzi V. (2010). Income distribution determinants and public
spending efficiency. Journal of Economic Inequality, Vol. 8, pp. 367-389.
Bergh, A., Fink, G. (2008). Higher education policy, enrolment, and income inequality.
Social Science Quarterly, Vol. 89, pp. 217-235.
Carmignani, F. (2009). The distributive effect of institutional quality when government
stability is endogenous. European Journal of Political Economy, Vol. 25, pp. 409-421.
Central Bank BiH (CBBiH) (2011). Annual Report 2010. Sarajevo: Central Bank BiH.
Central Bank BiH (CBBiH) (2012). Annual Report 2011. Sarajevo: Central Bank BiH.
Chong, A., Calderon, C. (2000). Institutional quality and income distribution. Economic
Development and Cultural Change, Vol. 48, 761–786.
Chong, A., Gradstein, M. (2007). Inequality and institutions. The Review of Economics and
Statistics, Vol. 89, pp. 454-465.
Corsetti, G., Meier, a. and Muller, G. J. (2012). What determines government spending
multipliers?. Economic Policy, Vol. 27, Issue 72, pp. 521.565.
De Grigorio J. and J.-W. Lee (2003). Education and Income Inequality: New Evidence From
Cross-Country Data. Review of Income and Wealth, Vol. 48, pp. 395–416.
Directorate for Economic Planning BiH (2011). Bosna i Hercegovina – Ekonomski trendovi
2010. godina. Sarajevo: Directorate for Economic Planning BiH. Directorate for Economic
Planning BiH (2012). Bosna i Hercegovina – Ekonomski trendovi 2011. godina. Sarajevo:
Directorate for Economic Planning BiH.
Efendic, A. (2010). Institutions and economic performance in transition countries – with
special reference to Bosnia and Herzegovina. Germany, Saarbrücken: Lambert Academic
Publishing.
Efendic, A., Pugh, G. and Adnett, N. (2011). Confidence in formal institutions and reliance
on informal institutions in Bosnia and Herzegovina: an empirical investigation using survey
data. Economics of Transition, Volume 19, Issue 3, pp. 521-540.
Eicher, T. and Schreiber, T. (2007). Institutions and Growth: Time Series Evidence from
Natural Experiments. University of Washington, Department of Economics, Working Paper
No. UWEC-2007-15.
Falcetti, E., Lysenko, T., and Sanfey, P. (2006). Reforms and growth in transition: Re-
examining the evidence. Journal of Comparative Economics, Vol. 34, pp. 421-445.

32 | P a g e
Ferreira F. H. G. (2011). Poverty is multidimensional. But what are we going to do about it?,
Journal of Economic Inequality. Vol. 9, pp. 493-95.
Garcia-Penalosa, C. (2010). Income distribution, economic growth and European integration,
Journal of Economic Inequality. Vol. 8, pp. 277-292.
Gregorini F. and E. Longoni (2009). Inequality, Political Systems and Public Spending.
Working paper series of the Department of Economics of the University of Milan – Bicocca
No. 159.
Holzner, M. (2011). Inequality, Growth and Public Spending in Central, East and Southeast
Europe. ECINEQ Working Papers No. 2011-221.
International Monetary Fund (1998; 2000). Bosnia and Herzegovina: Selected Issues.
Washington: IMF.
International Monetary Fund (2000; 2003). Bosnia and Herzegovina: Reviews under the
Stand-By Arrangement. Washington: IMF.
International Monetary Fund (2002; 2004; 2005; 2006; 2007; 2008; 2010). Bosnia and
Herzegovina: Article IV Consultations – Staff Report. Washington: IMF.
Kollmann, R., Ratto, M., Roeger, W, and in’t Veld, J. (2012). Fiscal policy, banks and the
financial crisis. Journal of Economic Dynamics and Control, Vol. 37, pp. 387-403.
Nolan, B. (2009). Income inequality and public policy. The Economic and Social Review,
Vol. 40, No. 4, pp. 489-510.
Rodrik D. (1998). Why Do More Open Economies Have Bigger Governments?. Journal of
Political Economy, Vol. 106 No. 5.
Roine, J., Vlachos, J. and Wadenstrom, D. (2009). The long-run determinants of inequality:
What can we learn from top income data?. Journal of Public Economics, Vol. 93, pp. 974-988.
Schwartz G. and Teresa Ter-Minnassian (2000). The Distributional Effects of Public
Expenditure. Journal of Economic Surveys, Vol. 14 No. 3.
Sen, A. (1997). On Economic Inequality, expanded edition with a substantial annexe by
Foster, J. E. & Sen, A.. Oxford: Oxford University Press.
Watt, A. (2009). Distributional issues in the context of the economic crisis in Europe.
Intereconomics, March/April 2009, 82-93.
World Bank (WB) (2012). http://data.worldbank.org/indicator/SI.POV.GINI, data taken for
the Gini coefficient, visited in February 2013.
Yuki, K. (2012). Education, inequality, and development in a dual economy. MPRA Paper
No. 39062.
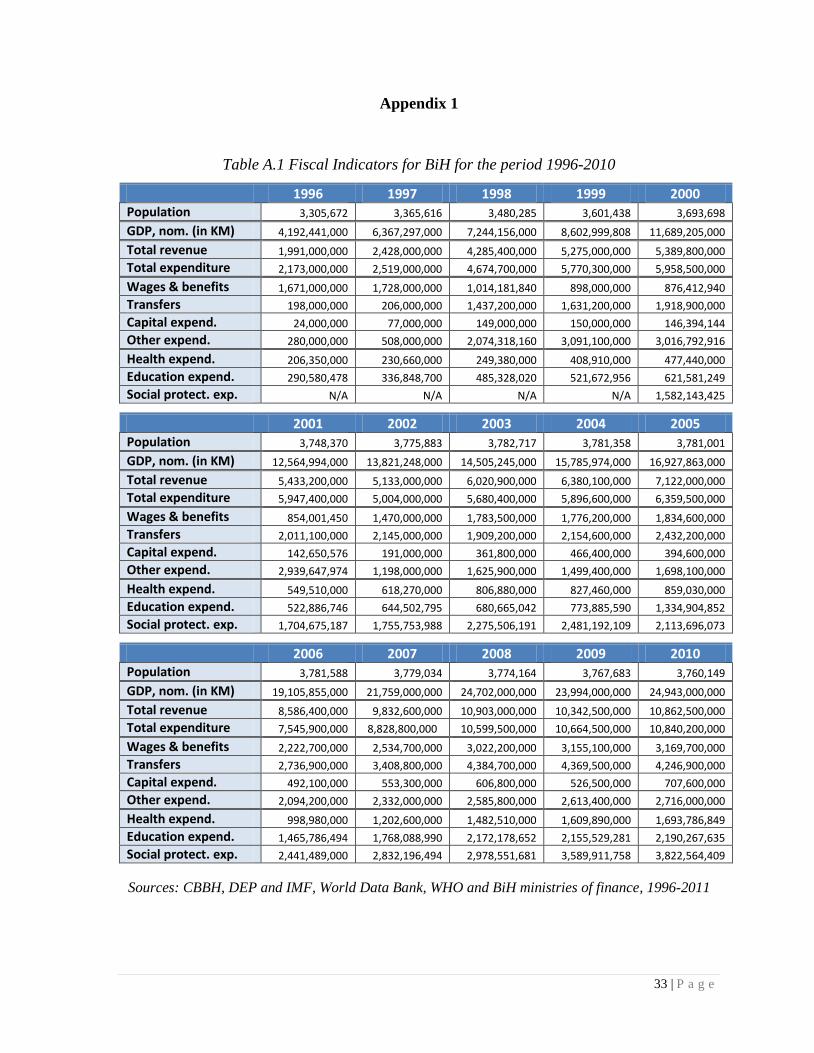
33 | P a g e
Appendix 1
Table A.1 Fiscal Indicators for BiH for the period 1996-2010
1996 1997 1998 1999 2000 Population 3,305,672 3,365,616 3,480,285 3,601,438 3,693,698
GDP, nom. (in KM) 4,192,441,000 6,367,297,000 7,244,156,000 8,602,999,808 11,689,205,000
Total revenue 1,991,000,000 2,428,000,000 4,285,400,000 5,275,000,000 5,389,800,000
Total expenditure 2,173,000,000 2,519,000,000 4,674,700,000 5,770,300,000 5,958,500,000
Wages & benefits 1,671,000,000 1,728,000,000 1,014,181,840 898,000,000 876,412,940
Transfers 198,000,000 206,000,000 1,437,200,000 1,631,200,000 1,918,900,000
Capital expend. 24,000,000 77,000,000 149,000,000 150,000,000 146,394,144
Other expend. 280,000,000 508,000,000 2,074,318,160 3,091,100,000 3,016,792,916
Health expend. 206,350,000 230,660,000 249,380,000 408,910,000 477,440,000
Education expend. 290,580,478 336,848,700 485,328,020 521,672,956 621,581,249
Social protect. exp. N/A N/A N/A N/A 1,582,143,425
2001 2002 2003 2004 2005 Population 3,748,370 3,775,883 3,782,717 3,781,358 3,781,001
GDP, nom. (in KM) 12,564,994,000 13,821,248,000 14,505,245,000 15,785,974,000 16,927,863,000
Total revenue 5,433,200,000 5,133,000,000 6,020,900,000 6,380,100,000 7,122,000,000
Total expenditure 5,947,400,000 5,004,000,000 5,680,400,000 5,896,600,000 6,359,500,000
Wages & benefits 854,001,450 1,470,000,000 1,783,500,000 1,776,200,000 1,834,600,000
Transfers 2,011,100,000 2,145,000,000 1,909,200,000 2,154,600,000 2,432,200,000
Capital expend. 142,650,576 191,000,000 361,800,000 466,400,000 394,600,000
Other expend. 2,939,647,974 1,198,000,000 1,625,900,000 1,499,400,000 1,698,100,000
Health expend. 549,510,000 618,270,000 806,880,000 827,460,000 859,030,000
Education expend. 522,886,746 644,502,795 680,665,042 773,885,590 1,334,904,852
Social protect. exp. 1,704,675,187 1,755,753,988 2,275,506,191 2,481,192,109 2,113,696,073
2006 2007 2008 2009 2010 Population 3,781,588 3,779,034 3,774,164 3,767,683 3,760,149
GDP, nom. (in KM) 19,105,855,000 21,759,000,000 24,702,000,000 23,994,000,000 24,943,000,000
Total revenue 8,586,400,000 9,832,600,000 10,903,000,000 10,342,500,000 10,862,500,000
Total expenditure 7,545,900,000 8,828,800,000 10,599,500,000 10,664,500,000 10,840,200,000
Wages & benefits 2,222,700,000 2,534,700,000 3,022,200,000 3,155,100,000 3,169,700,000
Transfers 2,736,900,000 3,408,800,000 4,384,700,000 4,369,500,000 4,246,900,000
Capital expend. 492,100,000 553,300,000 606,800,000 526,500,000 707,600,000
Other expend. 2,094,200,000 2,332,000,000 2,585,800,000 2,613,400,000 2,716,000,000
Health expend. 998,980,000 1,202,600,000 1,482,510,000 1,609,890,000 1,693,786,849
Education expend. 1,465,786,494 1,768,088,990 2,172,178,652 2,155,529,281 2,190,267,635
Social protect. exp. 2,441,489,000 2,832,196,494 2,978,551,681 3,589,911,758 3,822,564,409
Sources: CBBH, DEP and IMF, World Data Bank, WHO and BiH ministries of finance, 1996-2011

34 | P a g e
Appendix 2
Table A.2 Descriptive statistics on income question
2000-2010 Frequency Percent Valid Percent Cumulative
Percent
No income 902 1.4 1.4 1.4
Less than 100 KM/DM 3292 4.9 5.1 6.6
101 - 200 7532 11.3 11.8 18.3
201 - 300 7789 11.7 12.2 30.5
301 - 400 6921 10.4 10.8 41.3
401 - 500 5578 8.3 8.7 50.0
501 - 600 4303 6.4 6.7 56.8
601 - 700 3352 5.0 5.2 62.0
701 - 800 2843 4.3 4.4 66.4
801 - 900 2093 3.1 3.3 69.7
901 - 1000 2319 3.5 3.6 73.3
1001 - 1100 1340 2.0 2.1 75.4
1101 - 1200 1134 1.7 1.8 77.2
1201 - 1300 901 1.3 1.4 78.6
1301 - 1400 605 .9 .9 79.5
1401 - 1500 812 1.2 1.3 80.8
1501 - 1600 486 .7 .8 81.6
1601 - 1700 303 .5 .5 82.1
1701 - 1800 296 .4 .5 82.5
1801 - 1900 235 .4 .4 82.9
1901 - 2000 290 .4 .5 83.3
More than 2000 KM/DM 1129 1.7 1.8 85.1
BO/Od 3060 4.6 4.8 89.9
NZ/NS 6457 9.7 10.1 100.0
Total 63991 95.8 100.0
Sources: Authors’ calculations using Stata 11

35 | P a g e
Appendix 3
Methodology used to calculate the Gini coefficient proxies for BiH
Table A.3 The Gini coefficient proxy calculations for five income groups
Group Members per group
Income per group
Accumulated income
Gini calculations
1 A1 E1 K1 = E1 G1 = (2 * K1 - E1) * A1
2 A2 E2 K2 = E2 + K1 G2 = (2 * K2 - E2) * A2
3 A3 E3 K3 = E3 + K2 G3 = (2 * K3 - E3) * A3
4 A4 E4 K4 = E4 + K3 G4 = (2 * K4 - E4) * A4
5 A5 E5 K5 = E5 + K4 G5 = (2 * K5 – E5) * A5
Totals ΣA ΣE ΣG
Gini = 1 - ΣG/ΣA/ΣE
Source: Based on Sen (1997)
Related Documents