Landesamt für Natur, Umwelt und Verbraucherschutz Nordrhein–Westfalen www.lanuv.nrw.de Effects of the Climate Change in North Rhine-Westphalia Climate Impact Monitoring 2016 LANUV-Information 38

Welcome message from author
This document is posted to help you gain knowledge. Please leave a comment to let me know what you think about it! Share it to your friends and learn new things together.
Transcript
Landesamt für Natur, Umwelt und Verbraucherschutz Nordrhein–Westfalen
www.lanuv.nrw.de
Effects of the Climate Change in North Rhine-WestphaliaClimate Impact Monitoring 2016
LANUV-Information 38

Effects of the Climate Change in North Rhine-Westphalia
Climate Impact Monitoring 2016
LANUV-Information 38

Legal Notice
Editor
State Office for Nature, Environment and Consumer Protection North Rhine-Westphalia (LANUV) Leibnizstraße 10, 45659 Recklinghausen Telephone: 02361 305-0, Facsimile: 02361 305-3215 E-Mail: [email protected] www.lanuv.nrw.de
Text and Editorial Staff Christina Seidenstücker (LANUV)
Layout Claudia Brinkmann (LANUV)
Translation Petra Jeworrek-Mayer (LANUV)
As of September 2017
Information Services Information and Data concerning Nature, Environment and Consumer Protection in NRW is available on www.lanuv.nrw.de Current Air Quality Data additionally on WDR Teletext
Stand-By Duty Information On-Call Service of the LANUV NRW (24-hours On-Call): Telephone 0201 7144 88
Copying – even as an excerpt - is only permitted with prior approval of the editor, precise reference to source and allocation of file copies. The usage for advertising purposes is explicitly forbidden.
Dear Reader,
The anthropogenic climate change has reached North Rhine-Westphalia and its effects are explicitly noticed in nature and environment. Long-standing measurements show that the temperatures increase and intensity and distribution of precipitation change. This has consequences: Hence the growing seasons of domestic plants shift, waters and ground temperatures increase and especially in the cities and metropolitan areas it leads to an increased heat stress for the population during summer times.
Therefore North Rhine-Westphalia – as the first state - has already developed a climate impact monitoring in 2011. Since that time the State Office for Nature, Environment and Consumer Protection NRW (LANUV) has been documenting the development of the climate and its effects in North Rhine-Westphalia by means of indicators from different fields of environment. Because only if we realize the influence of the climate change on nature and environment at an early stage, we are able to react in time and to respond appropriately to changes and risks. The indicators are annually updated and are available on the internet at www.klimafolgenmonitoring.nrw.de .
With the aid of this brochure we wish to provide the citizens of North Rhine-Westphalia a current overview of the indicators of the climate impact monitoring.
I hope you find this brochure interesting.
Yours
Dr. Thomas Delschen
President of State Office for Nature, Environment and Consumer Protection North Rhine-Westphalia

Topic
Climate Impact Monitoring North Rhine-Westphalia 4
Category 1: Climate and Atmosphere 6
Category 2: Water 12
Category 3: Ecosystem and Biodiversity 16
Category 4: Soil 18
Category 5: Agriculture 20
Category 6: Forestry 22
Category 7: Human Health 24
Summary and Perspective 28
Further Information 29
4
The Climate Impact Monitoring North Rhine-Westphalia
Already in 2011 North Rhine-Westphalia (NRW) – as the first state – has announced a climate impact monitoring. Since that time indicators from different fields of environment, like e.g. soil, biodiversity or agriculture document the development of the climate and its effects in North Rhine-Westphalia. These indicators are annually updated and if necessary completed. Currently a total of 23 indicators from seven fields of different sectors can be viewed in the expert information system Climate Impact Monitoring (www.klimafolgenmonitoring.nrw.de). The indicators are based on measuring and monitoring programs of the LANUV and other State Offices as well as on data of the German Weather Service (DWD).
This brochure shows selected results of the climate impact monitoring NRW. The development of each indicator is summarized to the essential. For detailed background information it is recommended to have a look at the online service (www.klimafolgenmonitoring.nrw.de). Also the specific LANUV report 74 „Climate Change and Climate Impact in North Rhine-Westphalia – Results of the Monitoring Programs 2016“ provides profound information concerning the climate and its impact in North Rhine-Westphalia.
5
Description of the Indicators
The indicators are in each case described with a graphic and text. If possible, data is illustrated in the graphics, which is valid for the whole area of North Rhine-Westphalia, like e.g. the mean annual temperature or heat alerts. Wherever this is not possible, the data of a measuring station representative of whole NRW is shown. This is the case e.g. with soil or waters temperature. To be able to detect a trend, preferably long time series have been chosen, which were tested for their statistical significance by means of the Mann-Kendall-Test. The tested periods can either cover the whole measuring period or – in case of long time series – different 30-year-time periods (standard reference period).
The nonparametric Mann-Kendall-Test gives information about the fact, how clearly and reliably a trend emerges from the variability within a time series. The higher the level of significance, the stronger a trend is regarded as statistically valid. The levels of significance are shown in chart 1:
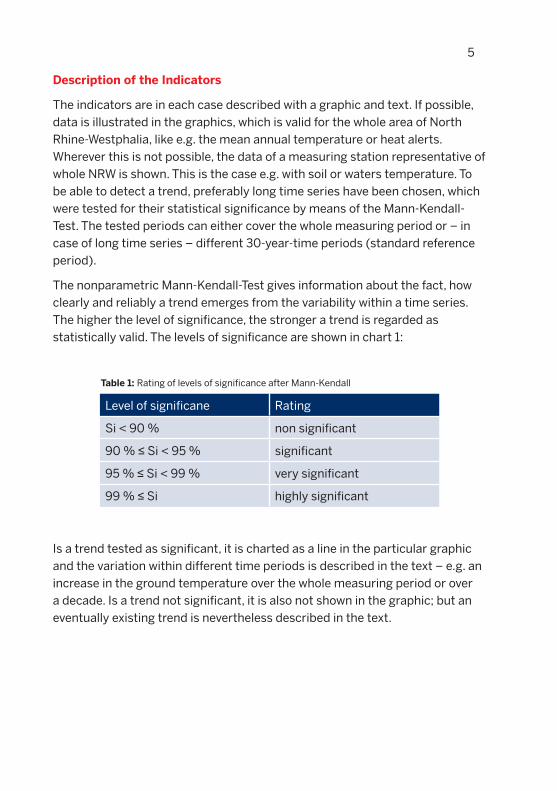
Table 1: Rating of levels of significance after Mann-Kendall
Level of significane Rating
Si < 90 % non significant
90 % ≤ Si < 95 % significant
95 % ≤ Si < 99 % very significant
99 % ≤ Si highly significant
Is a trend tested as significant, it is charted as a line in the particular graphic and the variation within different time periods is described in the text – e.g. an increase in the ground temperature over the whole measuring period or over a decade. Is a trend not significant, it is also not shown in the graphic; but an eventually existing trend is nevertheless described in the text.
6
0
2
4
6
8
10
12
1950 1960 1970 1980 1990 2000 2010
mitt
lere
Tem
pera
tur i
n °C
mittlere Temperatur Trend
Category 1: Climate and Atmosphere
In the Category „Climate and Atmosphere“ so-called “State-Indicators” of the climate itself are analyzed. Because only if the climatic changes are known, the effects can be deduced from it. Thus this category is the basis to be able to interpret the results of all following categories.
Indicator 1.1 – Temperature
The temperature is the command variable to describe climate changes. It is directly affected by the anthropogenic caused increase in the greenhouse gas content in our atmosphere.
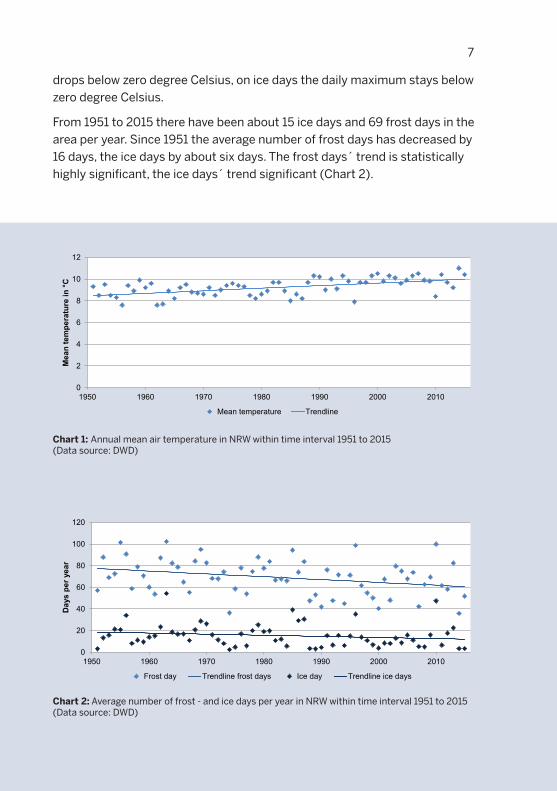
The average annual temperature between 1951 and 2015 in North Rhine-West-phalia is 9,3° degree Celsius. During this period it has increased by 1,5 degree. The trend is statistically highly significant. In North Rhine-Westphalia the year 2014 with an average annual temperature of eleven degree Celsius was the warmest since the start of measurements in 1881 (Chart 1).
Indicator 1.2 – Temperature Degree Days Cold
Cold classification days like frost and ice days characterize – if they occur cumulatively – exceedingly cold periods of a year and therewith give an im-pression of the cold stimulus in an area. On frost days the daily minimum
7
drops below zero degree Celsius, on ice days the daily maximum stays below zero degree Celsius.
From 1951 to 2015 there have been about 15 ice days and 69 frost days in the area per year. Since 1951 the average number of frost days has decreased by 16 days, the ice days by about six days. The frost days´ trend is statistically highly significant, the ice days´ trend significant (Chart 2).
Chart 1: Annual mean air temperature in NRW within time interval 1951 to 2015 (Data source: DWD)
Chart 2: Average number of frost - and ice days per year in NRW within time interval 1951 to 2015 (Data source: DWD)
0
2
4
6
8
10
12
1950 1960 1970 1980 1990 2000 2010
Mea
n te
mpe
ratu
re in
°C
Mean temperature Trendline
0
20
40
60
80
100
120
1950 1960 1970 1980 1990 2000 2010
Day
s pe
r yea
r
Frost day Trendline frost days Ice day Trendline ice days
8
Indicator 1.3 – Temperature Degree Days Warm
Warm classification days like summer days and the hot days characterize – if they occur cumulatively – exceedingly warm periods of a year. Therewith they give an impression of the thermal load in an area. On summer days the daily maximum rises above 25 degree Celsius, on hot days even above 30 degree Celsius.
From 1951 to 2015 there has been an average of 27 summer days and five hot days per year. Since 1951 the average number of summer days has increased by almost 16 and the hot days by nearly 5 days per year. Both trends are statistically highly significant (Chart 3).
Indicator 1.4 – Precipitation Totals
The change in temperature has amongst other things an effect on the content of water vapor of the air and the circulation systems of the earth, so that the precipitation patterns can regionally change.
In North Rhine-Westphalia there has fallen an average of 880 mm precipitation from 1951 to 2015. The accumulated precipitations have increased by trend since 1951, but this increase is statistically not significant (Chart 4).
Indicator 1.5 – Heavy Precipitation Days
With temperature and precipitation also the annual number of heavy precipitation days can change. Heavy precipitation days are days, where the precipitation sum exceeds ten, 20 or 30 mm.
From 1951 to 2015 an annual average of 24 days with more than ten, five days with more than 20 as well as one day with more than 30 mm precipitation have occurred in North Rhine-Westphalia. Since 1951 none of the three heavy precipitation categories have shown a statistically significant trend. Never-theless it is assumed a slight increase by trend (Chart 5).

9
Chart 3: Average number of summer - and hot days per year in NRW within time interval 1951 to 2015 (Data source: DWD)
Chart 4: Mean annual precipitation totals in NRW within time interval 1951 to 2015 (Data source: DWD)
Chart 5: Number of days with heavy precipitation (> 10 mm, > 20 mm und > 30 mm) per year as areal average across NRW within time interval 1951 to 2015 (Data source: DWD)
0
10
20
30
40
50
60
1950 1960 1970 1980 1990 2000 2010
Day
s pe
r yea
r
Summer day Trendline summer days Hot day Trendline hot days
0
200
400
600
800
1000
1200
1951 1961 1971 1981 1991 2001 2011
Prec
ipita
tion
in m
m
Precipitation
0
5
10
15
20
25
30
35
40
1950 1960 1970 1980 1990 2000 2010
Day
s pe
r yea
r
>10 mm >20 mm >30 mm
10
Indicator 1.6 – Heavy Precipitation Events
Heavy precipitation events define extreme precipitations for a period of 60 minutes. Its number is shown per year. As the applied method of calculation is very complex, the extreme precipitations are only updated every ten years.
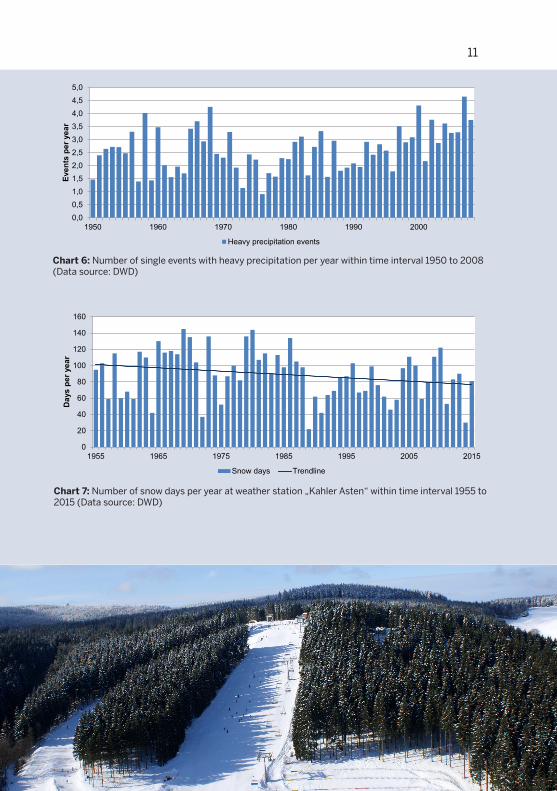
From 1950 to 2008 the average number of heavy precipitation events has slightly increased per year. In the 2000s local heavy precipitation events increased, which have often led to damages in residential areas. The chart shows further peaks at the end of the 1950s and the mid of the 1960s (Chart 6).
Indicator 1.7 – Snow Days
Snow days are days with a closed snow cover more than ten centimeter. Warmer temperatures can lead to a reduction in snow depths and snow days. At the same time an increased precipitation in the winter half year can counter the trend.
In the long-term average (1955 to 2015) the number of snow days at the weather station Kahler Asten is about 90. During the last 30 years (1986 to 2015) nearly 80 snow days on average have still been registered. The snow days have decreased by a total of 25 days from 1955 to 2015. This decline is statistically very significant (Chart 7).
11
Chart 6: Number of single events with heavy precipitation per year within time interval 1950 to 2008 (Data source: DWD)
Chart 7: Number of snow days per year at weather station „Kahler Asten“ within time interval 1955 to 2015 (Data source: DWD)
0
20
40
60
80
100
120
140
160
1955 1965 1975 1985 1995 2005 2015
Day
s pe
r yea
r
Snow days Trendline
0,00,51,01,52,02,53,03,54,04,55,0
1950 1960 1970 1980 1990 2000
Even
ts p
er y
ear
Heavy precipitation events
12
Category 2: Water
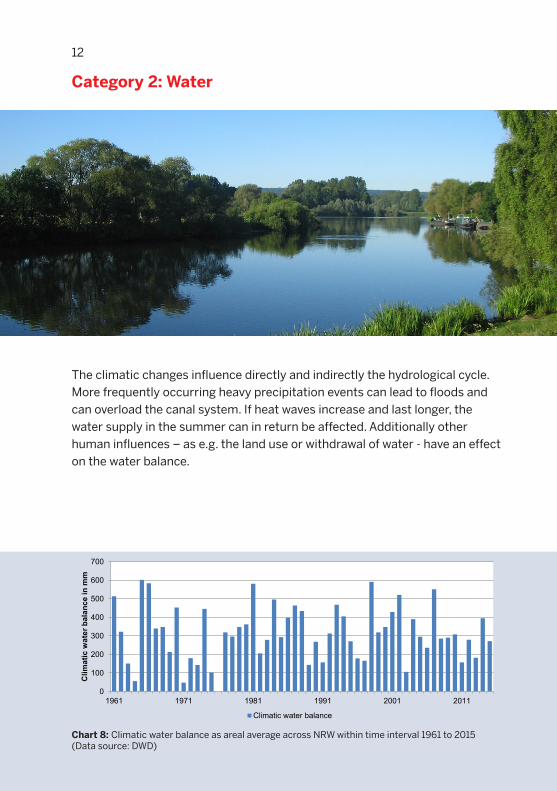
The climatic changes influence directly and indirectly the hydrological cycle. More frequently occurring heavy precipitation events can lead to floods and can overload the canal system. If heat waves increase and last longer, the water supply in the summer can in return be affected. Additionally other human influences – as e.g. the land use or withdrawal of water - have an effect on the water balance.
Chart 8: Climatic water balance as areal average across NRW within time interval 1961 to 2015 (Data source: DWD)
0
100
200
300
400
500
600
700
1961 1971 1981 1991 2001 2011
Clim
atic
wat
er b
alan
ce in
mm
Climatic water balance
13
Indicator 2.1 – Climatic Water Balance
The climatic water balance evolves from the difference between precipitation and evaporation. Precipitation patterns can regionally change due to the anthropogenic caused temperature rise. Also the evaporation is directly dependent on the temperature.
In the annual mean the climatic water balance in North Rhine-Westphalia is positive. This means, that the precipitations are higher than the evaporation. From 1961 to 2015 the areal mean has been 315 millimeters, during the last 30-year-time period from 1985 to 2015 321 millimeters. For the time series as of 1961 no trend is detectable so far (Chart 8).
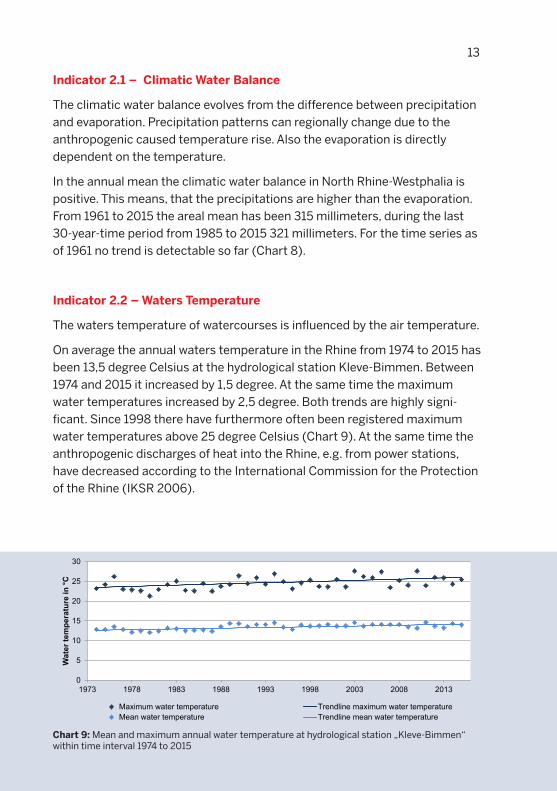
Indicator 2.2 – Waters Temperature
The waters temperature of watercourses is influenced by the air temperature.
On average the annual waters temperature in the Rhine from 1974 to 2015 has been 13,5 degree Celsius at the hydrological station Kleve-Bimmen. Between 1974 and 2015 it increased by 1,5 degree. At the same time the maximum water temperatures increased by 2,5 degree. Both trends are highly signi-ficant. Since 1998 there have furthermore often been registered maximum water temperatures above 25 degree Celsius (Chart 9). At the same time the anthropogenic discharges of heat into the Rhine, e.g. from power stations, have decreased according to the International Commission for the Protection of the Rhine (IKSR 2006).
Chart 9: Mean and maximum annual water temperature at hydrological station „Kleve-Bimmen“ within time interval 1974 to 2015
0
5
10
15
20
25
30
1973 1978 1983 1988 1993 1998 2003 2008 2013
Wat
er te
mpe
ratu
re in
°C
Maximum water temperature Trendline maximum water temperatureMean water temperature Trendline mean water temperature
14
Indicator 2.3 – Mean River Discharge
The natural discharge behavior in rivers and streams is primarily governed by the quantity and the seasonable distribution of precipitation in the drainage area. Those can change as a result of the anthropogenic climate warming. Furthermore the precipitation types (rain or snow) as well as the morphology of the drainage areas assume a role.
On average the annual discharge at the gauging station Feudingen at the Lahn (Bad Laasphe, district Siegen-Wittgenstein) has been about 0,65 cubic meters from 1951 to 2015. Since start of measurements the mean discharge has decreased here by 16 percent. The trend is statistically significant (Chart 10).
Indicator 2.4 – Groundwater Level
The climate changes can also affect the groundwater level. The groundwater levels therewith reflect the long-term changes of the climatic conditions. But also man additionally influences this, e.g. by means of groundwater tapping or the method of land use.
At the gauging station Hamminkeln the groundwater level has been 19 meters above sea level between 1951 and 2015. It has decreased statistically highly significant by 0,8 meters since start of measurements. Especially the seventies were years with low precipitation. In this decade also the groundwater level declined considerably (Chart 11).
Indicator 2.5 – Groundwater Recharge
The groundwater recharge in an area is primarily governed by precipitation as well as the discharge on the surface and the occurrence of evaporation. If the climatic basic parameters change, this is also connected with an impact on these elements.
At the lysimetric station St. Arnold the annual groundwater recharge in the hydrological discharge year (November to October) has nearly been 400 millimeters on average from 1966 to 2015. The groundwater recharge has decreased by about 115 millimeters since 1966. This decline is statistically significant (Chart 12).

15
Chart 10: Mean annual river discharge (calendar year) at river gauge „Feudingen/Lahn (Rural district Siegen-Wittgenstein)“ within time interval 1951 to 2014
Chart 11: Annual groundwater level at gauging station „Hamminkeln“ within 1951 to 2015 during the hydrologic-operational year as well as the winter - and summer half-year
Chart 12: Groundwater recharge at lysimetric station „St. Arnold“ within time interval 1966 to 2015 for the hydrological discharge year
0,0
0,2
0,4
0,6
0,8
1,0
1,2
1950 1960 1970 1980 1990 2000 2010
Dis
char
ge in
m3 /s
Mean river discharge Trendline
17,5
18,0
18,5
19,0
19,5
20,0
20,5
1950 1960 1970 1980 1990 2000 2010
Gro
undw
ater
leve
l in
m a
.s.l.
Groundwater level hydrologic year Trendline groundwater level hydrological yearGroundwater level summer Groundwater level winter
0
200
400
600
800
1000
1200
1966 1976 1986 1996 2006
GW
rech
arge
and
pre
cipi
tatio
n in
m
m
Groundwater (GW) recharge Precipitation - St Arnold Trendline groundwater recharge
16
Category 3: Ecosystems and Biodiversity
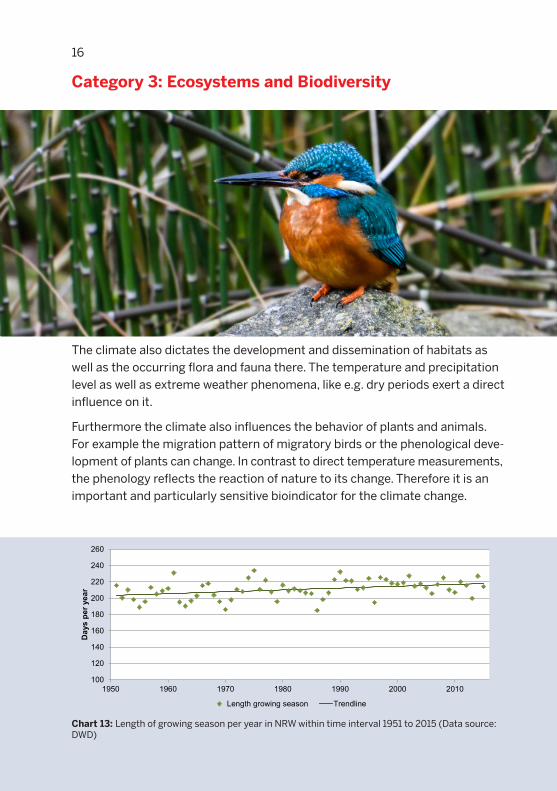
The climate also dictates the development and dissemination of habitats as well as the occurring flora and fauna there. The temperature and precipitation level as well as extreme weather phenomena, like e.g. dry periods exert a direct influence on it.
Furthermore the climate also influences the behavior of plants and animals. For example the migration pattern of migratory birds or the phenological deve-lopment of plants can change. In contrast to direct temperature measurements, the phenology reflects the reaction of nature to its change. Therefore it is an important and particularly sensitive bioindicator for the climate change.
Chart 13: Length of growing season per year in NRW within time interval 1951 to 2015 (Data source: DWD)
100
120
140
160
180
200
220
240
260
1950 1960 1970 1980 1990 2000 2010
Day
s pe
r yea
r
Length growing season Trendline

17
Indicator 3.1 – Length of Growing Season
The temperature influences the start of particular phases in the plant development, like e.g. the beginning of flowering of the goat willow or the leaf fall of the common oak. These two occurrences mark beginning and end of the growing season.
On average the lengths of the phenological growing season in North Rhine-Westphalia has been 211 days from 1951 to 2015. It has been increased by about 15 days. This trend is statistically highly significant (Chart 13).
Indicator 3.2 – Climate Sensitive Bird Species
Our breeding birds fly in part about a thousand kilometers to their wintering areas and back. The climate change has a more or less high influence on this behavior. But the spread (areal) and population size of breeding bird species is more influenced by the intensity of land use.
The researched time series show, that the thermophilic species spread on average in North Rhine-Westphalia, while the more psychrophilic species decrease (Chart 14). This result indicates, that the breeding areas, resp. distri-bution pattern of thermophilic species possibly also in North Rhine-Westphalia move to the North, resp. Northeast.
Chart 14: Annual population development of breeding bird species in NRW within time interval 2006 to 2015 (Data: Ecologic-areal random sample)
94
96
98
100
102
104
106
108
110
2005 2006 2007 2008 2009 2010 2011 2012 2013 2014 2015 2016
Inde
x
Psychrophilic bird species Temperature non-sensitive bird species Thermophilic bird species

18
Category 4: Soil
Climate changes can change the pedogenic processes in the long term and therewith influence the functions of the soil. Furthermore human interventions affect the function of the soil as carbon reservoir and therewith have an influ-ence on the climate. If for example grassland is ploughed, the humus decom-position is increased and CO2 released. This in turn can have an effect on the plant growth and also on the agricultural and forestry production.
Chart 15: Annual mean of air temperature at 2 metres above ground and of soil temperatures beneath pasture land at 5 respectively 50 centimeters depth within time interval 1993 to 2015 at observational station “Waldfeucht”
8
9
10
11
12
13
14
1992 1997 2002 2007 2012
Tem
pera
ture
in °C
Soil temperature 5 cm depth Trendline soil temperature 5 cm depthSoil temperature 50 cm depth Trendline soil temperature 50 cm depthTemperature 2 m height
19
Indicator 4.1 – Soil Temperature
The soil temperature is influenced by the air temperature. Like the latter it is subject to natural variation in the course of a day and a year.
The soil temperature at the observational station Waldfeucht at a depth of five centimeters has been 11,6 degree Celsius on average from 1993 to 2015, at a depth of 50 centimeters 11,4 degree Celsius. In comparison, the air temperature at a height of two meters has been 10,9 degree Celsius on average. Since 1993 the soil temperatures have increased: at a depth of five centimeters by 1,3 de-gree, at a depth of 50 centimeters by 1,1 degree. The trend of the soil tempera-tures is statistically highly significant (Chart 15).
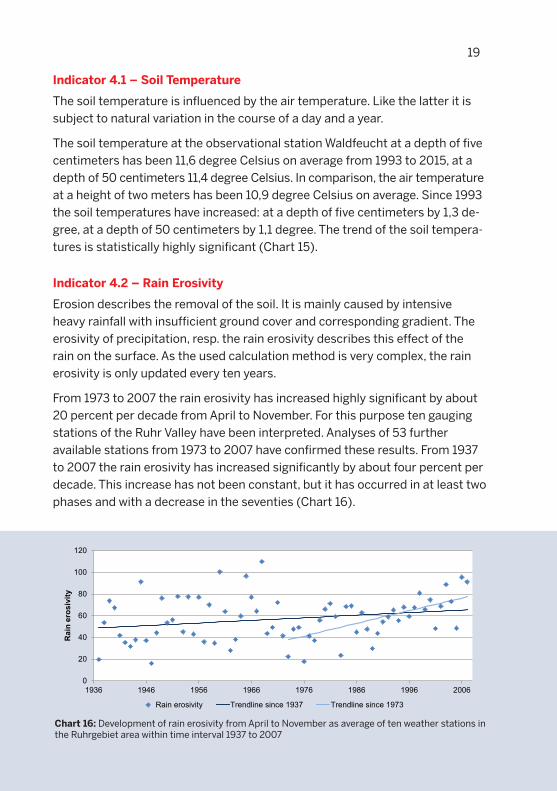
Indicator 4.2 – Rain Erosivity
Erosion describes the removal of the soil. It is mainly caused by intensive heavy rainfall with insufficient ground cover and corresponding gradient. The erosivity of precipitation, resp. the rain erosivity describes this effect of the rain on the surface. As the used calculation method is very complex, the rain erosivity is only updated every ten years.
From 1973 to 2007 the rain erosivity has increased highly significant by about 20 percent per decade from April to November. For this purpose ten gauging stations of the Ruhr Valley have been interpreted. Analyses of 53 further available stations from 1973 to 2007 have confirmed these results. From 1937 to 2007 the rain erosivity has increased significantly by about four percent per decade. This increase has not been constant, but it has occurred in at least two phases and with a decrease in the seventies (Chart 16).
Chart 16: Development of rain erosivity from April to November as average of ten weather stations in the Ruhrgebiet area within time interval 1937 to 2007
0
20
40
60
80
100
120
1936 1946 1956 1966 1976 1986 1996 2006
Rai
n er
osiv
ity
Rain erosivity Trendline since 1937 Trendline since 1973
20
Category 5: Agriculture
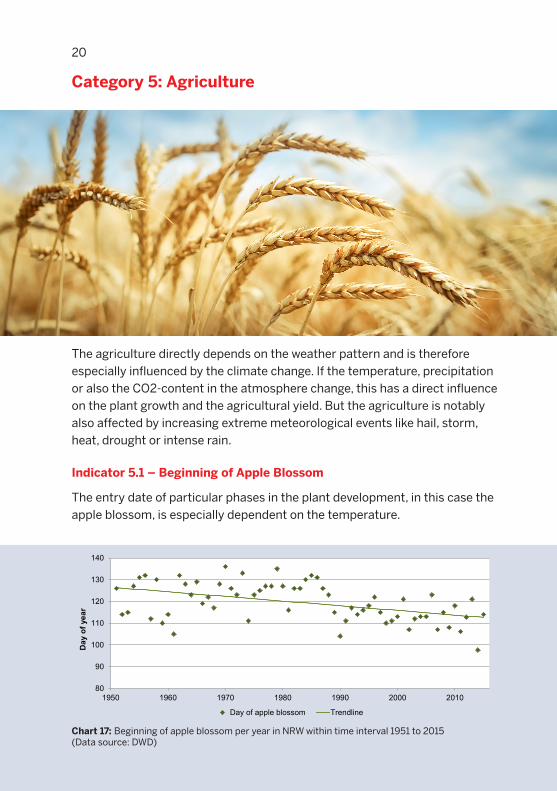
The agriculture directly depends on the weather pattern and is therefore especially influenced by the climate change. If the temperature, precipitation or also the CO2-content in the atmosphere change, this has a direct influence on the plant growth and the agricultural yield. But the agriculture is notably also affected by increasing extreme meteorological events like hail, storm, heat, drought or intense rain.
Indicator 5.1 – Beginning of Apple Blossom
The entry date of particular phases in the plant development, in this case the apple blossom, is especially dependent on the temperature.
Chart 17: Beginning of apple blossom per year in NRW within time interval 1951 to 2015 (Data source: DWD)
80
90
100
110
120
130
140
1950 1960 1970 1980 1990 2000 2010
Day
of y
ear
Day of apple blossom Trendline

21
Chart 17: Beginning of apple blossom per year in NRW within time interval 1951 to 2015 (Data source: DWD)
From 1951 to 2015 the apple blossom has started in North Rhine-Westphalia on average on the 120th day of the year (30th April). The trend analysis of this period shows, that apple trees in comparison to the Fifties bloom nearly 14 days earlier today. The trend is statistically highly significant (Chart 17).
Indicator 5.2 – Cropping and Budding of Corn and Winter Wheat
The phenology of agricultural crops is not only governed by the weather and climate, but also by human influences. Maybe the seed has been changed by breeding or the cultivation method and the type of tillage have been improved.
From 1951 to 2015 corn has been sowed on average on the 119th day of the year (29th April). The germ bud has broken through the soil surface (the so-called budding) on the 135th day (15th May). Since 1951 the seed has almost started ten days earlier, the beginning of the budding has started 13 days earlier. Therewith the distance between these two events decreased by approx. three days. The decreasing trends are statistically highly significant.
Winter wheat has been sowed on average on the 288th day of the year (15th October) over a total period from 1951 to 2015 and has budded on the 302nd day (29th October). The seed begins on average ten days earlier in comparison to 1951, the beginning of the budding 9 days earlier. Hence the distance between these two events decreased by approx. one day. Also the decreasing trends of the winter wheat are statistically highly significant (Chart 18).
Chart 18: Days of cropping and budding of corn and winter wheat per year in NRW within time interval 1951 to 2015 (Data source: DWD)
0
50
100
150
200
250
300
350
1950 1960 1970 1980 1990 2000 2010
Day
of y
ear
First day of budding corn Trendline first day of budding cornFirst day of budding winter wheat Trendline first day of budding winter wheatFirst day to crop corn Trendline first day to crop cornFirst day to crop winter wheat Trendline first day to crop winter wheat

22
Category 6: Forestry
Just as the agriculture, so the forestry is highly influenced by the climate and the weather. Increasing temperatures, increasing drought, weather extremes, increasing CO2 or ozone concentration and also the change in the insolation affect directly or indirectly the forest. Concerned is the single tree, the particu-lar tree population or also the woodland of the whole region.
Chart 19: Danger of forest fires (Canadian forest fire index) for NRW within time interval 1961 to 2015 (Data source: DWD)
0
50
100
150
200
250
1960 1970 1980 1990 2000 2010
Day
s pe
r yea
r
Danger of forest fire 1+2 Trendline danger of forest fire 1+2Danger of forest fire 4+5 Trendline danger of forest fire 4+5

23
Indicator 6.1 – Danger of Forest Fires
Increased temperatures and declined precipitations can lead to drought and thus increase the risk of forest fires. In the long-term average (1961 to 2015) the number of days with a forest fire danger level 1 and 2 (very less or less danger) has been 187 days per year in North Rhine-Westphalia, the number of days with a danger level 4 and 5 (high to very high danger) has been 13 days. While the days with a forest fire danger level 1 and 2 decreased by about 23 days from 1961 to 2015, the number of days with a danger level 4 and 5 increased by about 21 days within the same time interval. Both trends are statistically highly significant (Chart 19).
Indicator 6.2 – Phenology of Beeches
The beginning of particular phases in the plant development over the years also shifts due to a change in temperature.
The leaves sprout of the beech within a time interval from 2001 to 2015 has taken part on average on the 121st day of the year (01st May). The growing season of the beech has lasted within this time interval on average 168 days. The sprout has begun earlier by trend, the growing season has taken longer. The trends are not significant. Here it has to be considered, that the analyzed time series are still very short (Chart 20).
Chart 20: Average phenological events of beeches per year at six observational sites in NRW within time interval 2001 to 2015
80
100
120
140
160
180
200
2000 2002 2004 2006 2008 2010 2012 2014 2016
Day
of y
ear a
nd le
ngth
in d
ays
First day of beeches to bud Vegetation period of beeches
24
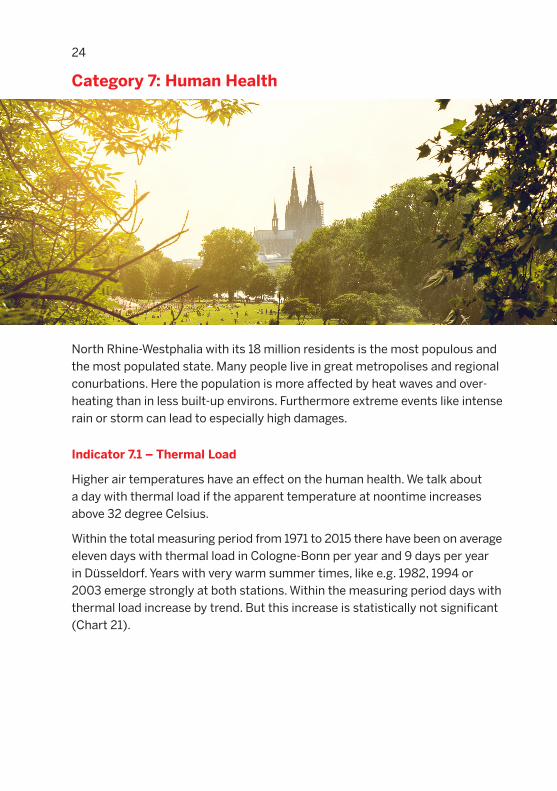
Category 7: Human Health
North Rhine-Westphalia with its 18 million residents is the most populous and the most populated state. Many people live in great metropolises and regional conurbations. Here the population is more affected by heat waves and over-heating than in less built-up environs. Furthermore extreme events like intense rain or storm can lead to especially high damages.
Indicator 7.1 – Thermal Load
Higher air temperatures have an effect on the human health. We talk about a day with thermal load if the apparent temperature at noontime increases above 32 degree Celsius.
Within the total measuring period from 1971 to 2015 there have been on average eleven days with thermal load in Cologne-Bonn per year and 9 days per year in Düsseldorf. Years with very warm summer times, like e.g. 1982, 1994 or 2003 emerge strongly at both stations. Within the measuring period days with thermal load increase by trend. But this increase is statistically not significant (Chart 21).
25
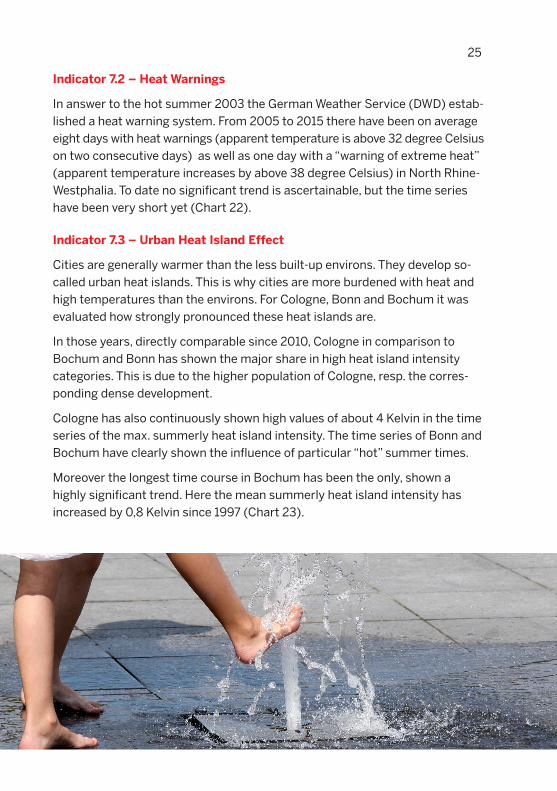
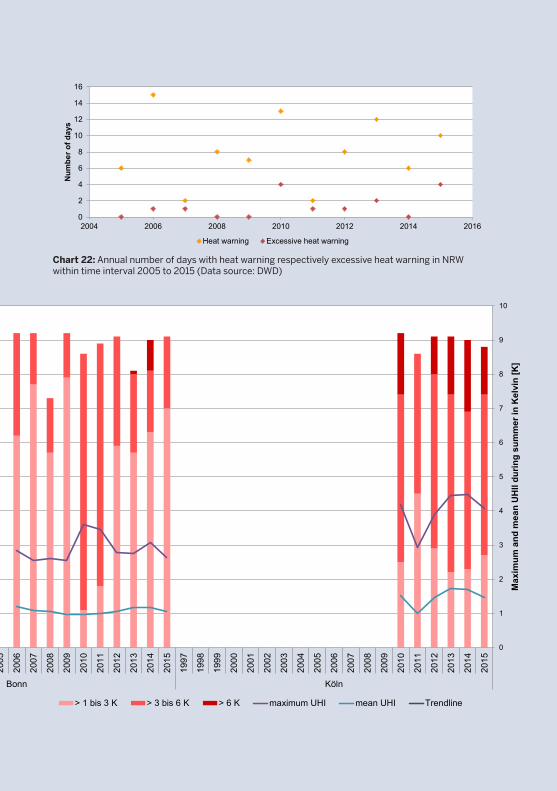
Indicator 7.2 – Heat Warnings
In answer to the hot summer 2003 the German Weather Service (DWD) estab-lished a heat warning system. From 2005 to 2015 there have been on average eight days with heat warnings (apparent temperature is above 32 degree Celsius on two consecutive days) as well as one day with a “warning of extreme heat” (apparent temperature increases by above 38 degree Celsius) in North Rhine-Westphalia. To date no significant trend is ascertainable, but the time series have been very short yet (Chart 22).
Indicator 7.3 – Urban Heat Island Effect
Cities are generally warmer than the less built-up environs. They develop so-called urban heat islands. This is why cities are more burdened with heat and high temperatures than the environs. For Cologne, Bonn and Bochum it was evaluated how strongly pronounced these heat islands are.
In those years, directly comparable since 2010, Cologne in comparison to Bochum and Bonn has shown the major share in high heat island intensity categories. This is due to the higher population of Cologne, resp. the corres-ponding dense development.
Cologne has also continuously shown high values of about 4 Kelvin in the time series of the max. summerly heat island intensity. The time series of Bonn and Bochum have clearly shown the influence of particular “hot” summer times.
Moreover the longest time course in Bochum has been the only, shown a highly significant trend. Here the mean summerly heat island intensity has increased by 0,8 Kelvin since 1997 (Chart 23).

26
Chart 21: Annual number of days with thermal load at both airport weather stations “Düsseldorf“ and „Köln-Bonn“ within time interval 1971 to 2015 (Data source: DWD)
Chart 23: Occurance and intensity of summerly intensity urban heat island effects during time interval 1997 to 2015 in the cities of Bochum, Bonn and Köln (Data sources: GIUB/Bonn, LANUV/Köln, RUB/Bochum)
0
5
10
15
20
25
30
1970 1975 1980 1985 1990 1995 2000 2005 2010 2015
Num
ber o
f day
s
Thermal load Düsseldorf Thermal load Köln-Bonn
0
1
2
3
4
5
6
7
8
9
10
0
10
20
30
40
50
60
70
80
90
100
1997
1998
1999
2000
2001
2002
2003
2004
2005
2006
2007
2008
2009
2010
2011
2012
2013
2014
2015
1997
1998
1999
2000
2001
2002
2003
2004
2005
2006
2007
2008
2009
2010
2011
2012
2013
2014
2015
1997
1998
1999
2000
2001
2002
2003
2004
2005
2006
2007
2008
2009
2010
2011
2012
2013
2014
2015
Bochum Bonn Köln
Max
imum
and
mea
n U
HII
durin
g su
mm
er in
Kel
vin
[K]
Occ
uren
ce o
f urb
an h
eat i
slan
d (U
HI)
effe
cts
dur
ing
sum
mer
, so
rted
afte
r int
ensi
ty a
s nu
mbe
r of d
ays
> 1 bis 3 K > 3 bis 6 K > 6 K maximum UHI mean UHI Trendline
27
Chart 22: Annual number of days with heat warning respectively excessive heat warning in NRW within time interval 2005 to 2015 (Data source: DWD)
0
2
4
6
8
10
12
14
16
2004 2006 2008 2010 2012 2014 2016
Num
ber o
f day
s
Heat warning Excessive heat warning
0
1
2
3
4
5
6
7
8
9
10
0
10
20
30
40
50
60
70
80
90
100
1997
1998
1999
2000
2001
2002
2003
2004
2005
2006
2007
2008
2009
2010
2011
2012
2013
2014
2015
1997
1998
1999
2000
2001
2002
2003
2004
2005
2006
2007
2008
2009
2010
2011
2012
2013
2014
2015
1997
1998
1999
2000
2001
2002
2003
2004
2005
2006
2007
2008
2009
2010
2011
2012
2013
2014
2015
Bochum Bonn Köln
Max
imum
and
mea
n U
HII
durin
g su
mm
er in
Kel
vin
[K]
Occ
uren
ce o
f urb
an h
eat i
slan
d (U
HI)
effe
cts
dur
ing
sum
mer
, so
rted
afte
r int
ensi
ty a
s nu
mbe
r of d
ays
> 1 bis 3 K > 3 bis 6 K > 6 K maximum UHI mean UHI Trendline

28
Summary and Conclusion
Climate change has reached North Rhine-Westphalia. The mean annual tempe-ratures have increased since the beginning of the measurements and more hot days and less frost and snow days have been measured. Due to the increased temperatures the precipitation patterns have changed: The annual accumula-ted precipitation and also the days with heavy rainfall have increased by trend.
Climate change has already affected the nature and environment in North Rhine-Westphalia. This includes the increase in the soil and waters tempe-rature or the changes in the phenological phases: Hence the apple blossom starts earlier or the growing season has extended. Thermophilic bird species have enlarged their distribution area, while psychrophilic bird species have reduced it.
The consequences of the meteorological change are noticeable for the people in North Rhine-Westphalia – especially in the cities and metropolitan areas: Here it results in increased thermal load during summer times due to urban climate effects. Especially in view of elderly people, young children and people with pre-existing conditions this can lead in health restrictions.
North Rhine-Westphalia as the most populated state of Germany is especially affected by the climate change – but at the same time particularly responsible for it. Here a third of all emerged greenhouse gases is emitted. Therefore North Rhine-Westphalia as the first state has passed a climate protection bill with mandatory emission reduction targets. Besides the reduction of the green-house gas emissions, the adaption to the impacts of the climate change is the second important mainstay of a successful climate policy.
To be able to determine the success of the measures, a comprehensive moni-toring to the climate protection plan in NRW will be established within the next few years. In this regard also the climate impact monitoring shall be expanded and further spheres of activity complemented. Thus it is worth having a regu-lar look at the status quo on www.klimafolgenmonitoring.nrw.de.
29
Further Information
State Office for Nature, Environment and Consumer Protection NRW (LANUV), Recklinghausen, www.lanuv.nrw.de
Ministry for Environment, Agriculture, Conservation and Consumer Protection NRW (MULNV), Düsseldorf, www.umwelt.nrw.de
Specialized Information System Climate Impact Monitoring NRW, www.klimafolgenmonitoring.nrw.de; www.kfm.nrw.de
Specialized Information System Climate Atlas NRW, www.klimaatlas.nrw.de
Specialized Information System Climate Adaption NRW, www.lanuv.nrw.de/klimaanpassung/
NRW-Climate Protection Gate of the Ministry for Environment, Agriculture, Conservation and Consumer Protection NRW (MULNV), www.klima.nrw.de

Picture sources
Fotolia: K.-U. Häßler (title, back cover), Christian Müller (inside cover), spuno.(4),
Jürgen Fälchle (10), ErnstPieber (11), lucag_g (18), Igor Strukov (20), JensHN (24), A_Bruno
(inside back cover)
Panthermedia: Japaner (12), Cebas1 (25)
LANUV: Claudia Brinkmann (6, 16, 22)

State Office for Nature, Environment and Consumer Protection North Rhine-WestphaliaLeibnizstr. 1045659 RecklinghausenTelephone 02361 [email protected]
www.lanuv.nrw.de
Related Documents