1 Copyright © 2004 by ASME EFFECTS OF SWIRLER CONFIGURATIONS ON FLOW STRUCTURES AND COMBUSTION CHARACTERISTICS Guoqiang Li and Ephraim J. Gutmark Gas Dynamics and Propulsion Laboratory Department of Aerospace Engineering and Engineering Mechanics University of Cincinnati, Cincinnati, OH 45221-0070 Voice: (513) 556-1227 FAX: (513) 556-5038 E-mail: [email protected] ABSTRACT Modern gas turbine combustion technologies are driven by stringent regulations on pollutant emissions such as CO and NO x . A combustion system of multiple swirlers coupled with distributed fuel injection was studied as a new concept for reducing NO x emissions by application of Lean Direct Injection (LDI) combustion. The present paper investigates the effects of swirler configurations on the flow structures in isothermal flow and combustion cases using a multiple-swirlers fuel injector at atmospheric conditions. The swirling flow field within the combustor was characterized by a central recirculation zone formed after vortex breakdown. The differences between the tangential and axial velocity profiles, the shape of the recirculation zones and the turbulence intensity distribution for the different fuel injector configurations impacted the flame structure, the temperature distribution and the emission characteristics both for gaseous and liquid fuels. Co-swirling configuration was shown to have the lowest NO x emission level compared with the counter-swirling ones for both types of fuels with lower inlet temperature. In contrast to this, the swirl configuration had less effect on the combustion characteristics in the case of gaseous fuel with high air inlet temperature. The differences in NO x emissions were shown to be closely related to the Damkohler number or the degree to which the flame resembled well-mixed combustion, which is the foundation for LDI combustion. INTRODUCTION Increasingly stringent regulations on pollutant emissions from gas turbine engines, particularly regarding low oxides of nitrogen (NO x ), require development of new combustion concepts 1 . An effective way to reduce NO x formation is by operating the combustor in a lean premixed combustion mode near the Lean Blowout Limit (LBO). This type of design results in efficient combustion with extremely low emissions and improved combustor performance. However, these combustion systems are susceptible to combustion dynamics and autoignition, and are often plagued by flame stability and flashback problems 2 . One of the options of avoiding the disadvantages of lean- premixed combustion is the lean direct fuel injection system. This is achieved by utilizing multiple air swirlers that are coupled with a distributed fuel injection system to generate intense mixing and achieve low NO x emissions without premixing 3,4,5 . This approach enables control of fuel/air mixing via swirl configurations and fuel injection match-up, which was shown to be critical for NO x emissions and combustion efficiency. Terasaki and Hayashi 5 showed that the NO x emissions for a double-swirler burner was only half or quarter of the conventional small-hub swirler and large-hub swirler, respectively. Correa 2 discussed the Lean Direct Injection (LDI) concept and pointed out that very high turbulence intensity (20%) has to be attainable in LDI systems. The Damkohler number, Da, (defined as the time scale of the mixing process relative to the time scale of the chemical reaction) for LDI should be Da<<1, indicative of a flame in a well-mixed regime 2 . Formation of NO x in gas turbine combustors can be attributed to thermal NO, prompt NO, NO generated via nitrous oxide and fuel NO 6 . Because non-premixed flames are associated with stoichiometric interfaces and high temperatures 2 , the main NO x contributor is from thermal NO and is therefore highly sensitive to the flame temperature and can be promoted by high concentrations of free oxygen atoms and OH radical pool 2 . The thermal NO was shown to be exponentially dependent on temperature and linearly dependent on residence time 7 . The swirling flow fields formed by different swirler configurations can alter the temperature fields and residence time, consequentially affecting the thermal NO x formation. Numerous efforts have been devoted to study swirling flows with respect to their aerodynamics, the interaction between aerodynamics and combustion, and the effects of swirl to emissions 8,9,10 . The swirling flow field is characterized by the formation of a Central Recirculation Zone (CRZ) when the swirl strength is sufficiently high and vortex breakdown occurs 8 . This recirculation zone stabilizes the combustion process in a compact region within the combustion chamber 8 . The turbulence field of swirling flows is intensified by large Proceedings of ASME Turbo Expo 2004 Power for Land, Sea, and Air June 14-17, 2004, Vienna, Austria GT2004-53674 Downloaded From: https://proceedings.asmedigitalcollection.asme.org on 06/30/2019 Terms of Use: http://www.asme.org/about-asme/terms-of-use

Welcome message from author
This document is posted to help you gain knowledge. Please leave a comment to let me know what you think about it! Share it to your friends and learn new things together.
Transcript
Downloaded From: https
Proceedings of ASME Turbo Expo 2004 Power for Land, Sea, and Air
June 14–17, 2004, Vienna, Austria
GT2004-53674 EFFECTS OF SWIRLER CONFIGURATIONS ON FLOW STRUCTURES
AND COMBUSTION CHARACTERISTICS Guoqiang Li and Ephraim J. Gutmark
Gas Dynamics and Propulsion Laboratory Department of Aerospace Engineering and Engineering Mechanics
University of Cincinnati, Cincinnati, OH 45221-0070 Voice: (513) 556-1227 FAX: (513) 556-5038 E-mail: [email protected]
Proceedings of ASME Turbo Expo 2004 Power for Land, Sea, and Air
June 14-17, 2004, Vienna, Austria
GT2004-53674
ABSTRACT
Modern gas turbine combustion technologies are driven by stringent regulations on pollutant emissions such as CO and NOx. A combustion system of multiple swirlers coupled with distributed fuel injection was studied as a new concept for reducing NOx emissions by application of Lean Direct Injection (LDI) combustion. The present paper investigates the effects of swirler configurations on the flow structures in isothermal flow and combustion cases using a multiple-swirlers fuel injector at atmospheric conditions. The swirling flow field within the combustor was characterized by a central recirculation zone formed after vortex breakdown. The differences between the tangential and axial velocity profiles, the shape of the recirculation zones and the turbulence intensity distribution for the different fuel injector configurations impacted the flame structure, the temperature distribution and the emission characteristics both for gaseous and liquid fuels. Co-swirling configuration was shown to have the lowest NOx emission level compared with the counter-swirling ones for both types of fuels with lower inlet temperature. In contrast to this, the swirl configuration had less effect on the combustion characteristics in the case of gaseous fuel with high air inlet temperature. The differences in NOx emissions were shown to be closely related to the Damkohler number or the degree to which the flame resembled well-mixed combustion, which is the foundation for LDI combustion.
INTRODUCTION
Increasingly stringent regulations on pollutant emissions from gas turbine engines, particularly regarding low oxides of nitrogen (NOx), require development of new combustion concepts1. An effective way to reduce NOx formation is by operating the combustor in a lean premixed combustion mode near the Lean Blowout Limit (LBO). This type of design results in efficient combustion with extremely low emissions and improved combustor performance. However, these combustion systems are susceptible to combustion dynamics and autoignition, and are often plagued by flame stability and flashback problems2.
://proceedings.asmedigitalcollection.asme.org on 06/30/2019 Terms of U
One of the options of avoiding the disadvantages of lean-premixed combustion is the lean direct fuel injection system. This is achieved by utilizing multiple air swirlers that are coupled with a distributed fuel injection system to generate intense mixing and achieve low NOx emissions without premixing3,4,5. This approach enables control of fuel/air mixing via swirl configurations and fuel injection match-up, which was shown to be critical for NOx emissions and combustion efficiency. Terasaki and Hayashi5 showed that the NOx emissions for a double-swirler burner was only half or quarter of the conventional small-hub swirler and large-hub swirler, respectively. Correa2 discussed the Lean Direct Injection (LDI) concept and pointed out that very high turbulence intensity (20%) has to be attainable in LDI systems. The Damkohler number, Da, (defined as the time scale of the mixing process relative to the time scale of the chemical reaction) for LDI should be Da<<1, indicative of a flame in a well-mixed regime2.
Formation of NOx in gas turbine combustors can be attributed to thermal NO, prompt NO, NO generated via nitrous oxide and fuel NO6. Because non-premixed flames are associated with stoichiometric interfaces and high temperatures2, the main NOx contributor is from thermal NO and is therefore highly sensitive to the flame temperature and can be promoted by high concentrations of free oxygen atoms and OH radical pool2. The thermal NO was shown to be exponentially dependent on temperature and linearly dependent on residence time7. The swirling flow fields formed by different swirler configurations can alter the temperature fields and residence time, consequentially affecting the thermal NOx formation.
Numerous efforts have been devoted to study swirling flows with respect to their aerodynamics, the interaction between aerodynamics and combustion, and the effects of swirl to emissions8,9,10. The swirling flow field is characterized by the formation of a Central Recirculation Zone (CRZ) when the swirl strength is sufficiently high and vortex breakdown occurs8. This recirculation zone stabilizes the combustion process in a compact region within the combustion chamber8. The turbulence field of swirling flows is intensified by large
1 Copyright © 2004 by ASME
se: http://www.asme.org/about-asme/terms-of-use
Down
structures and substantially affects the flame structures and NOx emissions10. The use of sufficiently high swirl to stabilize the flame on the boundary of the recirculation zone is therefore an effective way to materialize an LDI system. In addition, the recirculation zone itself does not contribute to NOx formation despite its long residence times but moderate temperatures10. The effects of swirl to NOx emissions are, however, far more than conclusive, depending on the specific configuration. Generally, increasing swirl will generate larger CRZ to entrain more air thus cooling down the combustion products and thereby reducing thermal NO. However, increasing swirl also increases local oxygen availability and turbulence intensity to promote NO formation9.
Variable swirler configurations are capable of providing a certain desired flow field. Gupta et al.11 used variable air swirlers to control both the initial fuel-air mixing and the flame structure in the dome zone of the combustor. The results showed that significant changes in NOx emission levels could be obtained by small changes in the swirler configurations and the operational parameters. Temperature field measured by a thermocouple in a dual concentric swirl burner in a premixed flame showed that the co-swiring flame had a wide and long area of low temperature fluctuations compared with more intense but smaller temperature fluctuations for a counter-swirling case12. Temperature measurements with an air-blast nozzle in a non-premixed LDI with co/counter swirl13 showed that the counter swirl case had larger high temperature region. Unfortunately, no NOx emissions data were available for these two studies. For premixed combustion14, it was shown that counter swirl case generated a more compact flame, lower temperature field and less NOx emissions despite a more intense turbulence field which was formed due to stronger shear layer typical to a counter-swirl case.
It is essential for LDI combustion applications to understand the complex swirling flow for different swirl configurations, and to establish the correlation between the flow structures and the combustion dynamics and emissions. However, systematic studies on non-premixed LDI or partial premixed combustion, including flow structure of the swirling flow, temperature field, flame structures and emissions are rare in the published literature. The present study aims to correlate the flow field and the combustion characteristics in a mutilple swirl LDI burner in order to demonstrate the effects of the swirler configurations on emissions.
Applying the concept of variable nozzle geometry, a triple swirler spray atmospheric combustor was built for use with liquid and gaseous fuels. The fuel injector was developed by Delavan Gas Turbine Products (DGTP, a division of Goodrich Aerospace) in collaboration with General Electric Aircraft Engines (GEAE). The combustion air flows through the air swirlers in the fuel injector assembly and no additional dilution air is provided. The present paper includes measurements of flow structures in isothermal conditions using Laser Doppler Velocimetry (LDV) and Particle Image Velocimetry (PIV), in addition to measurements of emission characteristics, OH chemiluminescence imaging and temperature field mapping for various swirler configurations in combustion.
EXPERIMENTAL SETUP The atmospheric combustion test rig with the fuel/air
swirler assembly Triple Annular Research Swirler (TARS) fuel
loaded From: https://proceedings.asmedigitalcollection.asme.org on 06/30/2019 Terms of Use
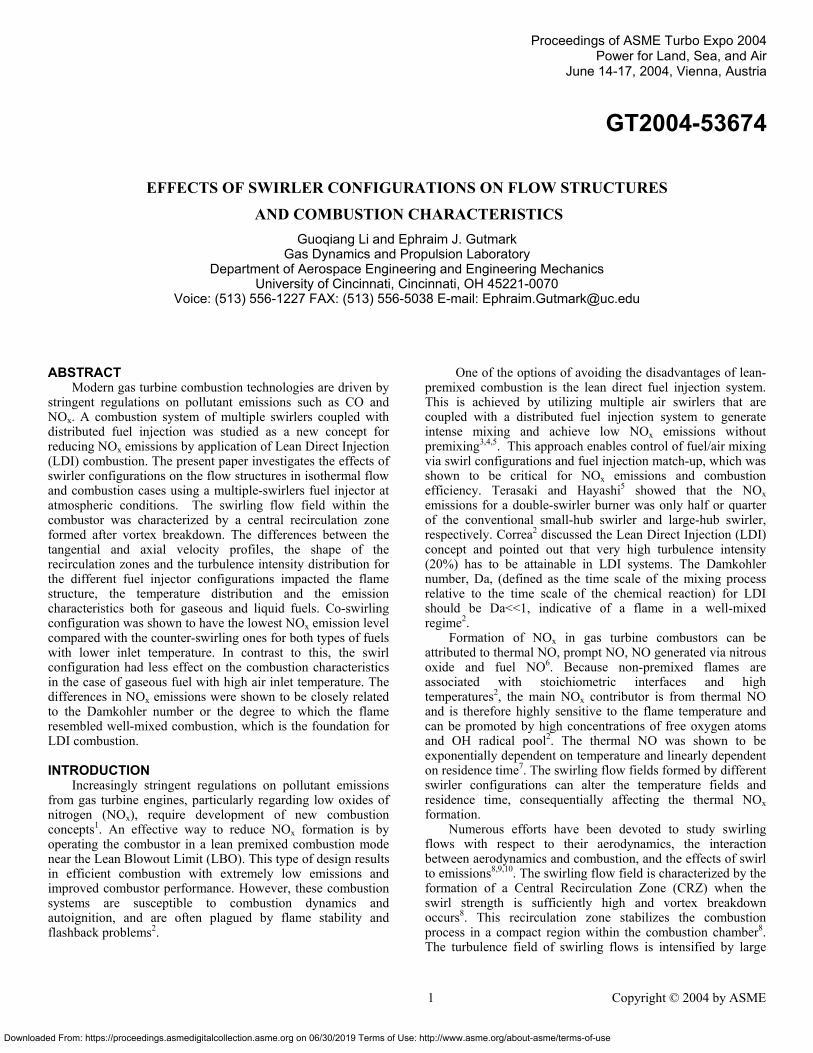
injector is depicted in Figure 1. The combustor was set up vertically with the air fed from below, preheated by a 36 kW electrical heater and conditioned by a set of fine mesh screens and a honeycomb straightener that were installed in a flow conditioning chamber. Static pressure transducer and type K thermocouple were mounted on this chamber to monitor the pressure drop and inlet air temperature, respectively. TARS (exit diameter D=5 cm) was centered in a mounting plate that was installed on a 15 cm inner diameter plenum chamber. The combustion chamber was 45.7 cm long, with four flat walls assembled by four posts to form an octagonal shaped cross-section. The walls consisted of either quartz glass to allow optical access for OH/CH chemiluminescence of the flame, or an instrumentation plate for installation of pressure transducers and thermocouples. A circular exhaust nozzle was mounted downstream of the combustion chamber as a contraction for the exhaust combustion gas (Fig. 1).
Figure 1: Atompheric combustion test rig and instrumentaion for TARS.
The cold flow test rig was identical to the combustion test
rig except that it was installed vertically with flow entering from above to prevent liquid spray droplet from falling back into the measurement region. The combustion chamber was identical to combustion case. The flow was seeded with olive oil that was injected by TSI six-jet atomizer through two ports in the plenum chamber. 2-D Laser Doppler Velocimetry (LDV) measured the mean flow fields for different swirl configurations while a stereoscopic PIV system, consisted of two 2k by 2k 12 bits CCD cameras and two 120 mJ pulse lasers, was used for 3-D flow structure measurements with spatial correlation.
40cm
5cm
Exhaust Nozzle
TARS
Emission Probe
microphone
Combustion Chamber
Gas Analyzer
Air
65cm
10cm
Pilot fuel
Main fuel
Air assist
Transverse system
thermocouple
Air Heater
2 Copyright © 2004 by ASME
: http://www.asme.org/about-asme/terms-of-use
Dow
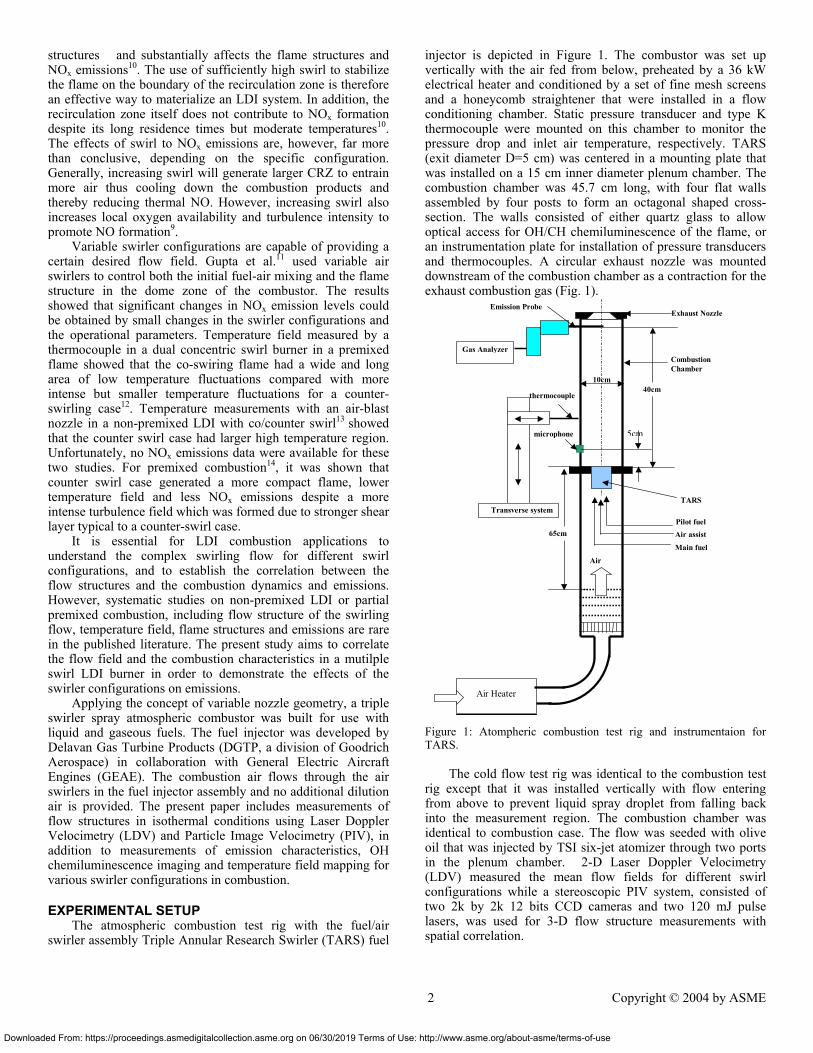
Figure 2: Triple Annular Research Swirler (TARS) and its configurations: (a) Cross sectional view; (b) swirler configurations.
The TARS (Fig. 2) features three air swirlers (inner, intermediate and outer swirler) and two sets of distributed fuel injection holes: pilot fuel injecting inward into the intermediate swirling air passage and the main fuel injecting outward into the outer swirling air passage. The pilot and main fuel were split inside the partition that separated between the intermediate and outer swirling annuli. The pilot fuel was injected through four holes while the main fuel through eight. The pilot and main fuel injection holes were identical with flow number of 0.0017 kg/s/sqrt(Mpa), calibrated on Mil-C-7024 (density of 762 kg/m3). The design of the TARS nozzle/swirler assembly also incorporated an air assist mechanism. Two air assist lines were inserted into the fuel nozzle, feeding small amount of air to be premixed with the fuel inside the partition before being injected with the fuel through the 30 mil holes. This design provided a possible mechanism to control the fuel injection by modulating the air assist. The air assist lines could also be used to feed gaseous fuel thus making the fuel nozzle assembly capable of operating with both liquid and gaseous fuels.
A fuel supply system was designed to supply, control and meter the flow rates of the pilot fuel, main fuel, and air assist flow. The liquid fuel (ethanol) was stored in a 16- gallon tank that can be pressurized by nitrogen up to 160 psi. The fuel was delivered through a main control valve and a turbine flow meter (Hoffer Mini-Flow meter, MF1/70B, 1% accuracy) and then was split into the pilot and main fuel branches, each having its own controller and on-off valve. The gaseous fuel was regulated to a pressure of 30 psi, controlled by a control valve and metered by a gas flow meter (Alicat M series, 1% accuracy). The main air was metered by a digital gas flow meter (EPI 8716MPNH). In order to maintain reasonable fuel/air ratio and about 4% pressure drop across the TARS, only the pilot fuel line was used for the liquid fuel tests, yielding an inner ring fuel liquid distribution. While for the
(b)
(a)
6.6cm
D3 (5cm))
Intermediat e Swirler β
Inner Swirler γ
Outer Swirler α
Pilot Fuel/Air Assist
Main Fuel/Air Assist
Swirler 1: S304545 Swirler 2: 3045C45 Swirler3: 304545C
45 45
3 0 45
45 30
45
45
30
D1 D2
nloaded From: https://proceedings.asmedigitalcollection.asme.org on 06/30/2019 Terms of Us
gaseous fuel, a total of 12 holes were used forming dual rings fuel distribution.
An electrochemical cell gas analyzer (IMR 3000P) was used to analyze the combustion exhaust gases. The sampling probe was inserted 40 cm (four times the diameter of the combustion chamber) above the dump plane and aligned on the centerline. Previous study15 showed that the profiles of CO and NOx emissions were fairly uniform at this axial location and therefore the centerline measurement could be used to represent the radial distribution. Carbon monoxide (CO), nitric oxide (NO), NO2, and O2 were analyzed independently.
An intensified CCD camera (Roper Scientific PI-Max 1024x1024 SB) was focused on the centerline plane of the combustor chamber. A Nikkor 105mm/F4.5 UV lens with a 310 nm (10 nm bandwidth) band-pass filter was used for OH chemiluminescence imaging. In most cases the exposure time was set to 10 ms with a gain of 128. A type B thermocouple (6%Rh/Pt-30%Rh, 10 mil lead wire) with ceramic tube insulation was mounted on a 2-D traverse system to map the temperature field (along the black dotted lines in Fig. 1) for the different cases. All the temperature data presented in this paper were corrected for radiation effects using the following equation16:
kNudTTTT wtctctcg /)( 44 −+= σε (1)
where, Tg is the gas temperature (K), Ttc is the thermocouple temperature (K) and Tw is the wall temperature (K); Emissivity εtc =0.22; Stefan-Boltzmann constant σ = 5.67 x 10⁻⁸ JK-4m-2s-1; Bead diameter d = 0.254 mm; Thermal conductivity for air at 1450K: k=0.0924W/m.K, Nusselt Number17: Nu = 2. The paper includes two parts: first part describing the isothermal flow structures measured by LDV and PIV, and the secondary part discussing the combustion characteristics, emissions and their correlation to the flow features.
RESULTS AND DISCUSSIONS 1. Flow structure
Research on swirling flow in combustion cases 8, 9, 10 has shown that the combustion will increase turbulence intensity within swirling flow but the main flow structure remains. It is more convenient and practical to measure flow field for isothermal flow other than combustion cases, especially for confined geometry. Therefore, this study first investigated isothermal flow field. Four TARS configurations (Table 1) were measured by LDV. The four swirler configurations are labeled as cases 1, 2, 3, 4 for S304545, S3045C45, S304545C and S554545, respectively. The first three configurations were studied to determine the relationship between the flow structure and the swirler configuration in order to identify the individual effect of the outer, intermediate and inner swirlers. The different swirlers were defined by the vane angles: 30º outer, 45° intermediate and 45° inner swirlers, and “C” indicated a counter-rotating direction (Fig. 2b). The swirling direction was chosen as an important focus of this investigation because the counter rotating swirling streams formed more intense shear stresses and affected to a greater extent the combustion process compared to the variation of the vane angles. The effect of
3 Copyright © 2004 by ASME
e: http://www.asme.org/about-asme/terms-of-use
Dow
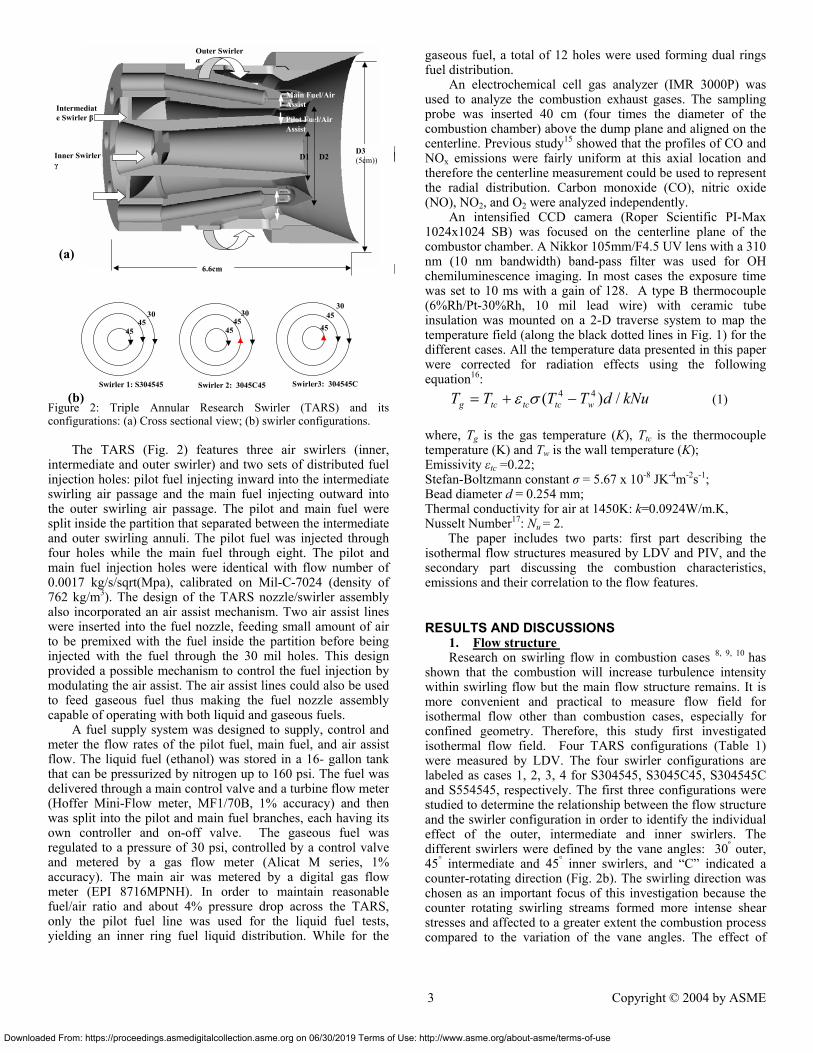
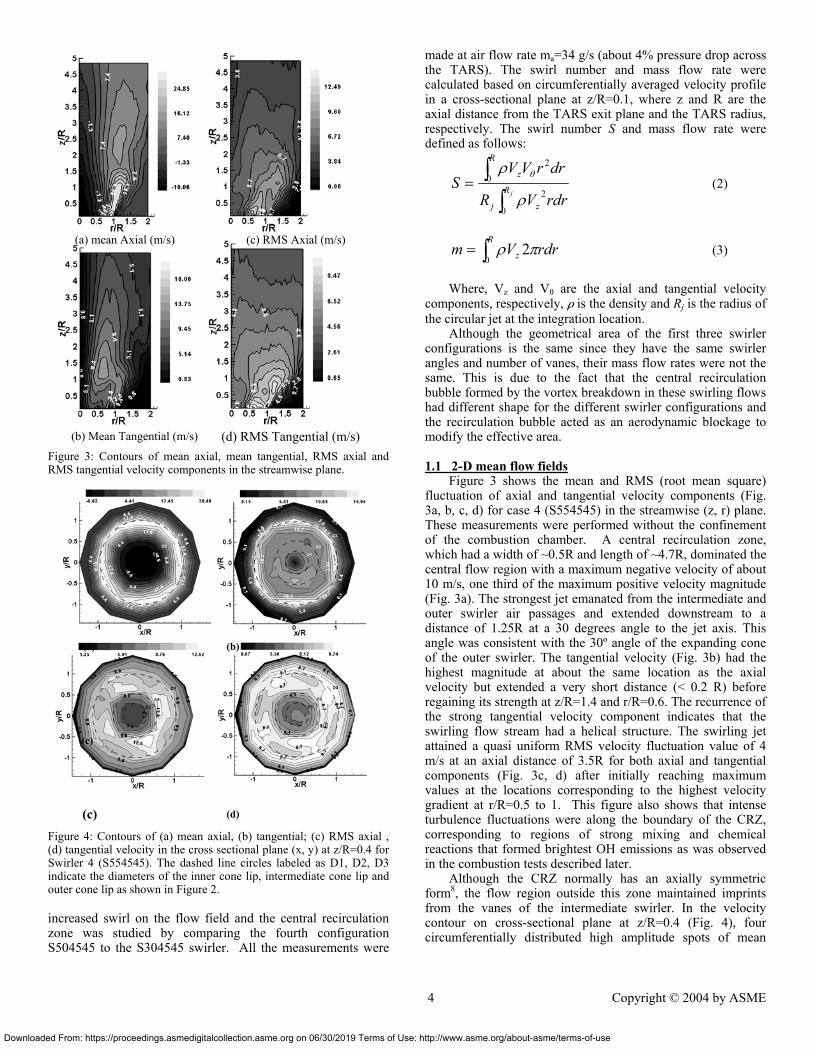
Figure 3: Contours of mean axial, mean tangential, RMS axial and RMS tangential velocity components in the streamwise plane. Figure 4: Contours of (a) mean axial, (b) tangential; (c) RMS axial , (d) tangential velocity in the cross sectional plane (x, y) at z/R=0.4 for Swirler 4 (S554545). The dashed line circles labeled as D1, D2, D3 indicate the diameters of the inner cone lip, intermediate cone lip and outer cone lip as shown in Figure 2. increased swirl on the flow field and the central recirculation zone was studied by comparing the fourth configuration S504545 to the S304545 swirler. All the measurements were
(a) mean Axial (m/s) (c) RMS Axial (m/s)
(b) Mean Tangential (m/s) (d) RMS Tangential (m/s)
(c)
(a) (b)
(c)
(d)
nloaded From: https://proceedings.asmedigitalcollection.asme.org on 06/30/2019 Terms of Use
made at air flow rate ma=34 g/s (about 4% pressure drop across the TARS). The swirl number and mass flow rate were calculated based on circumferentially averaged velocity profile in a cross-sectional plane at z/R=0.1, where z and R are the axial distance from the TARS exit plane and the TARS radius, respectively. The swirl number S and mass flow rate were defined as follows:
∫∫=
jR
zj
R
z
rdrVR
drrVVS
0
20
2
ρ
ρ θ (2)
∫=R
z rdrVm0
2πρ (3)
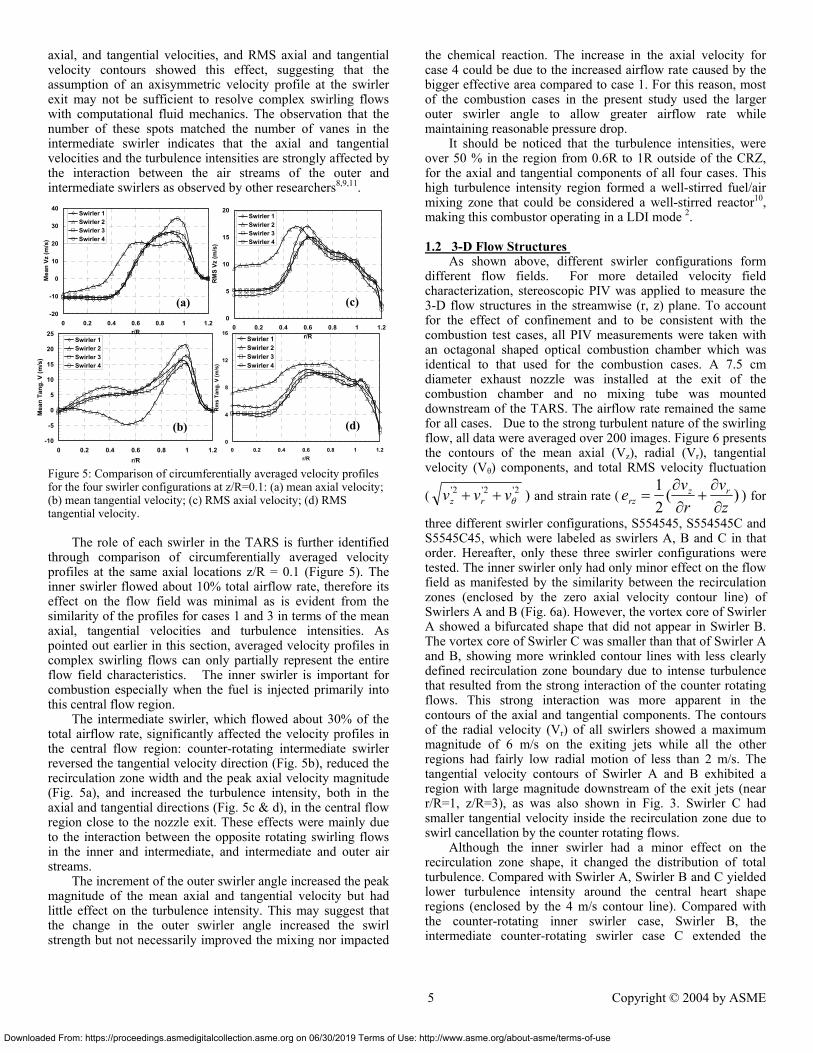
Where, Vz and Vθ are the axial and tangential velocity components, respectively, ρ is the density and Rj is the radius of the circular jet at the integration location. Although the geometrical area of the first three swirler configurations is the same since they have the same swirler angles and number of vanes, their mass flow rates were not the same. This is due to the fact that the central recirculation bubble formed by the vortex breakdown in these swirling flows had different shape for the different swirler configurations and the recirculation bubble acted as an aerodynamic blockage to modify the effective area. 1.1 2-D mean flow fields Figure 3 shows the mean and RMS (root mean square) fluctuation of axial and tangential velocity components (Fig. 3a, b, c, d) for case 4 (S554545) in the streamwise (z, r) plane. These measurements were performed without the confinement of the combustion chamber. A central recirculation zone, which had a width of ~0.5R and length of ~4.7R, dominated the central flow region with a maximum negative velocity of about 10 m/s, one third of the maximum positive velocity magnitude (Fig. 3a). The strongest jet emanated from the intermediate and outer swirler air passages and extended downstream to a distance of 1.25R at a 30 degrees angle to the jet axis. This angle was consistent with the 30º angle of the expanding cone of the outer swirler. The tangential velocity (Fig. 3b) had the highest magnitude at about the same location as the axial velocity but extended a very short distance (< 0.2 R) before regaining its strength at z/R=1.4 and r/R=0.6. The recurrence of the strong tangential velocity component indicates that the swirling flow stream had a helical structure. The swirling jet attained a quasi uniform RMS velocity fluctuation value of 4 m/s at an axial distance of 3.5R for both axial and tangential components (Fig. 3c, d) after initially reaching maximum values at the locations corresponding to the highest velocity gradient at r/R=0.5 to 1. This figure also shows that intense turbulence fluctuations were along the boundary of the CRZ, corresponding to regions of strong mixing and chemical reactions that formed brightest OH emissions as was observed in the combustion tests described later. Although the CRZ normally has an axially symmetric form8, the flow region outside this zone maintained imprints from the vanes of the intermediate swirler. In the velocity contour on cross-sectional plane at z/R=0.4 (Fig. 4), four circumferentially distributed high amplitude spots of mean
4 Copyright © 2004 by ASME
: http://www.asme.org/about-asme/terms-of-use
Down
axial, and tangential velocities, and RMS axial and tangential velocity contours showed this effect, suggesting that the assumption of an axisymmetric velocity profile at the swirler exit may not be sufficient to resolve complex swirling flows with computational fluid mechanics. The observation that the number of these spots matched the number of vanes in the intermediate swirler indicates that the axial and tangential velocities and the turbulence intensities are strongly affected by the interaction between the air streams of the outer and intermediate swirlers as observed by other researchers8,9,11.
Figure 5: Comparison of circumferentially averaged velocity profiles for the four swirler configurations at z/R=0.1: (a) mean axial velocity; (b) mean tangential velocity; (c) RMS axial velocity; (d) RMS tangential velocity. The role of each swirler in the TARS is further identified through comparison of circumferentially averaged velocity profiles at the same axial locations z/R = 0.1 (Figure 5). The inner swirler flowed about 10% total airflow rate, therefore its effect on the flow field was minimal as is evident from the similarity of the profiles for cases 1 and 3 in terms of the mean axial, tangential velocities and turbulence intensities. As pointed out earlier in this section, averaged velocity profiles in complex swirling flows can only partially represent the entire flow field characteristics. The inner swirler is important for combustion especially when the fuel is injected primarily into this central flow region. The intermediate swirler, which flowed about 30% of the total airflow rate, significantly affected the velocity profiles in the central flow region: counter-rotating intermediate swirler reversed the tangential velocity direction (Fig. 5b), reduced the recirculation zone width and the peak axial velocity magnitude (Fig. 5a), and increased the turbulence intensity, both in the axial and tangential directions (Fig. 5c & d), in the central flow region close to the nozzle exit. These effects were mainly due to the interaction between the opposite rotating swirling flows in the inner and intermediate, and intermediate and outer air streams. The increment of the outer swirler angle increased the peak magnitude of the mean axial and tangential velocity but had little effect on the turbulence intensity. This may suggest that the change in the outer swirler angle increased the swirl strength but not necessarily improved the mixing nor impacted
-20
-10
0
10
20
30
40
0 0.2 0.4 0.6 0.8 1 1.2r/R
Mea
n Vz
(m/s
)
Swirler 1Swirler 2Swirler 3Swirler 4
0
5
10
15
20
0 0.2 0.4 0.6 0.8 1 1.2r/R
RM
S Vz
(m/s
)Swirler 1Swirler 2Swirler 3Swirler 4
-10
-5
0
5
10
15
20
25
0 0.2 0.4 0.6 0.8 1 1.2r/R
Mea
n Ta
ng. V
(m/s
)
Swirler 1Swirler 2Swirler 3Swirler 4
0
4
8
12
16
0 0.2 0.4 0.6 0.8 1 1.2r/R
Rm
s Ta
ng. V
(m/s
)
Swirler 1Swirler 2Swirler 3Swirler 4
(a) (c)
(b) (d)
loaded From: https://proceedings.asmedigitalcollection.asme.org on 06/30/2019 Terms of Us
the chemical reaction. The increase in the axial velocity for case 4 could be due to the increased airflow rate caused by the bigger effective area compared to case 1. For this reason, most of the combustion cases in the present study used the larger outer swirler angle to allow greater airflow rate while maintaining reasonable pressure drop. It should be noticed that the turbulence intensities, were over 50 % in the region from 0.6R to 1R outside of the CRZ, for the axial and tangential components of all four cases. This high turbulence intensity region formed a well-stirred fuel/air mixing zone that could be considered a well-stirred reactor10, making this combustor operating in a LDI mode 2.
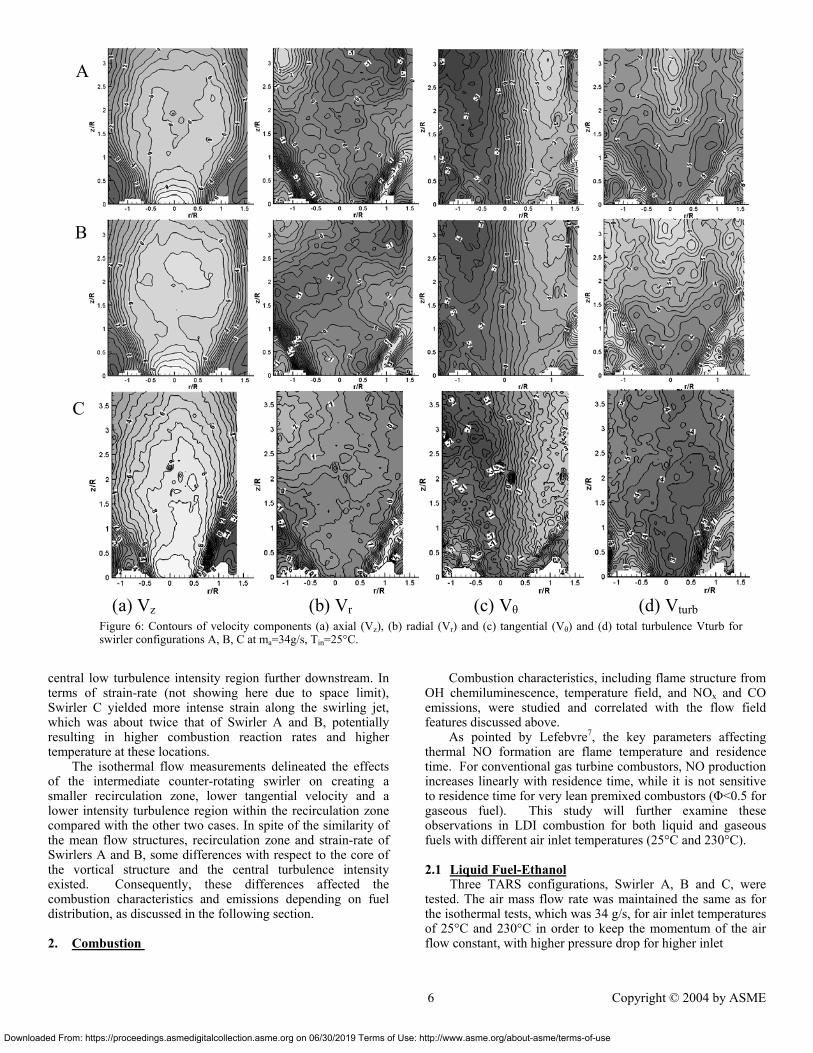
1.2 3-D Flow Structures As shown above, different swirler configurations form different flow fields. For more detailed velocity field characterization, stereoscopic PIV was applied to measure the 3-D flow structures in the streamwise (r, z) plane. To account for the effect of confinement and to be consistent with the combustion test cases, all PIV measurements were taken with an octagonal shaped optical combustion chamber which was identical to that used for the combustion cases. A 7.5 cm diameter exhaust nozzle was installed at the exit of the combustion chamber and no mixing tube was mounted downstream of the TARS. The airflow rate remained the same for all cases. Due to the strong turbulent nature of the swirling flow, all data were averaged over 200 images. Figure 6 presents the contours of the mean axial (Vz), radial (Vr), tangential velocity (Vθ) components, and total RMS velocity fluctuation
( 2'2'2'θvvv rz ++ ) and strain rate ( )(
21
zv
rve rz
rz ∂∂
+∂∂
= ) for
three different swirler configurations, S554545, S554545C and S5545C45, which were labeled as swirlers A, B and C in that order. Hereafter, only these three swirler configurations were tested. The inner swirler only had only minor effect on the flow field as manifested by the similarity between the recirculation zones (enclosed by the zero axial velocity contour line) of Swirlers A and B (Fig. 6a). However, the vortex core of Swirler A showed a bifurcated shape that did not appear in Swirler B. The vortex core of Swirler C was smaller than that of Swirler A and B, showing more wrinkled contour lines with less clearly defined recirculation zone boundary due to intense turbulence that resulted from the strong interaction of the counter rotating flows. This strong interaction was more apparent in the contours of the axial and tangential components. The contours of the radial velocity (Vr) of all swirlers showed a maximum magnitude of 6 m/s on the exiting jets while all the other regions had fairly low radial motion of less than 2 m/s. The tangential velocity contours of Swirler A and B exhibited a region with large magnitude downstream of the exit jets (near r/R=1, z/R=3), as was also shown in Fig. 3. Swirler C had smaller tangential velocity inside the recirculation zone due to swirl cancellation by the counter rotating flows. Although the inner swirler had a minor effect on the recirculation zone shape, it changed the distribution of total turbulence. Compared with Swirler A, Swirler B and C yielded lower turbulence intensity around the central heart shape regions (enclosed by the 4 m/s contour line). Compared with the counter-rotating inner swirler case, Swirler B, the intermediate counter-rotating swirler case C extended the
5 Copyright © 2004 by ASME
e: http://www.asme.org/about-asme/terms-of-use
Down
(a) Vz (b) Vr (c) Vθ (d) Vturb
A
B
C
Figure 6: Contours of velocity components (a) axial (Vz), (b) radial (Vr) and (c) tangential (Vθ) and (d) total turbulence Vturb for swirler configurations A, B, C at ma=34g/s, Tin=25°C.
l
central low turbulence intensity region further downstream. In terms of strain-rate (not showing here due to space limit), Swirler C yielded more intense strain along the swirling jet, which was about twice that of Swirler A and B, potentially resulting in higher combustion reaction rates and higher temperature at these locations. The isothermal flow measurements delineated the effects of the intermediate counter-rotating swirler on creating a smaller recirculation zone, lower tangential velocity and a lower intensity turbulence region within the recirculation zone compared with the other two cases. In spite of the similarity of the mean flow structures, recirculation zone and strain-rate of Swirlers A and B, some differences with respect to the core of the vortical structure and the central turbulence intensity existed. Consequently, these differences affected the combustion characteristics and emissions depending on fuel distribution, as discussed in the following section.
2. Combustion
oaded From: https://proceedings.asmedigitalcollection.asme.org on 06/30/2019 Terms of Us
Combustion characteristics, including flame structure from OH chemiluminescence, temperature field, and NOx and CO emissions, were studied and correlated with the flow field features discussed above.
As pointed by Lefebvre7, the key parameters affecting thermal NO formation are flame temperature and residence time. For conventional gas turbine combustors, NO production increases linearly with residence time, while it is not sensitive to residence time for very lean premixed combustors (Φ<0.5 for gaseous fuel). This study will further examine these observations in LDI combustion for both liquid and gaseous fuels with different air inlet temperatures (25°C and 230°C).
2.1 Liquid Fuel-Ethanol
Three TARS configurations, Swirler A, B and C, were tested. The air mass flow rate was maintained the same as for the isothermal tests, which was 34 g/s, for air inlet temperatures of 25°C and 230°C in order to keep the momentum of the air flow constant, with higher pressure drop for higher inlet
6 Copyright © 2004 by ASME
e: http://www.asme.org/about-asme/terms-of-use
Do
temperatures. This scaling allowed the swirler numbers to be comparable for different inlet air temperatures while maintaining the Reynolds numbers sufficiently high when the elevated temperatures tend to decrease them. The bulk velocity, however, was increased for high inlet temperature because of the decreased density and constant mass flow rate, resulting a lower residence time. This fact has to be kept in mind when comparing between different inlet air temperatures.
The liquid fuel was injected inwards through 4 injection ports into the flow region inside the vortex core. It was thus expected that the flow field near the central region would have a more pronounced effect on the flame structure and the emission characteristics for liquid fuel. Also due to the atomization, vaporization and fuel/air mixing processes associated with liquid fuel combustion, the emission characteristics become more sensitive to differences in the flow field, especially with low combustion air temperature.
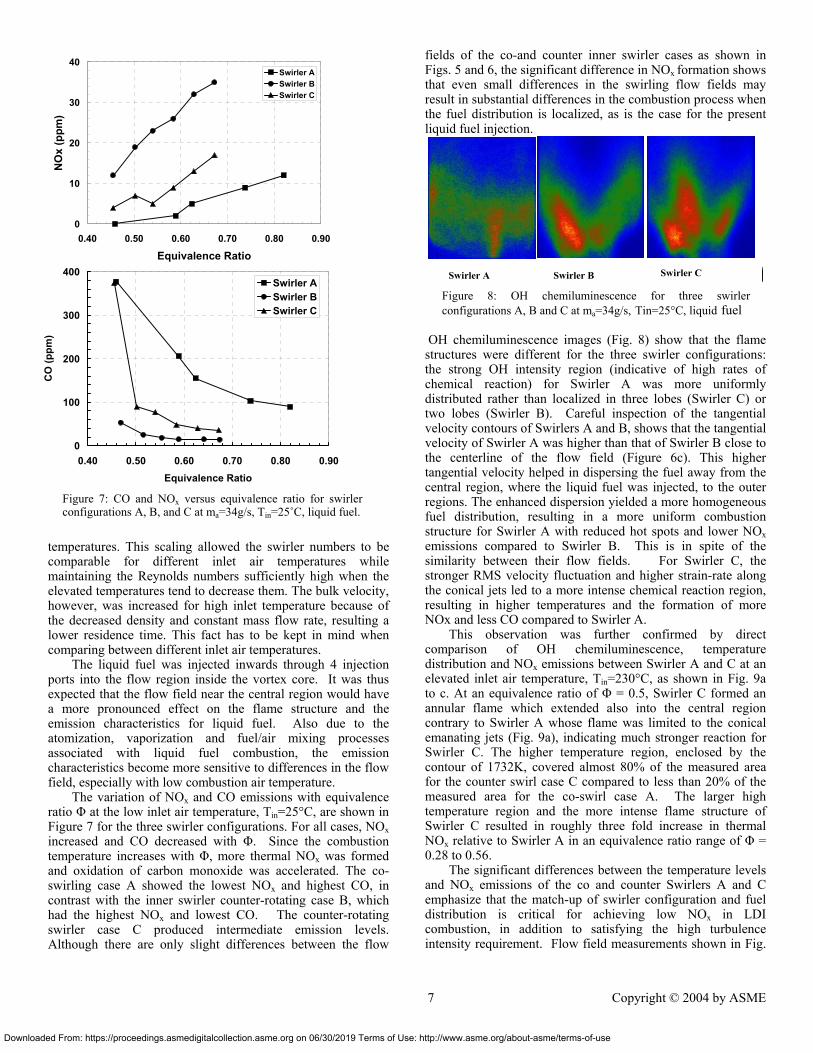
The variation of NOx and CO emissions with equivalence ratio Φ at the low inlet air temperature, Tin=25°C, are shown in Figure 7 for the three swirler configurations. For all cases, NOx increased and CO decreased with Φ. Since the combustion temperature increases with Φ, more thermal NOx was formed and oxidation of carbon monoxide was accelerated. The co-swirling case A showed the lowest NOx and highest CO, in contrast with the inner swirler counter-rotating case B, which had the highest NOx and lowest CO. The counter-rotating swirler case C produced intermediate emission levels. Although there are only slight differences between the flow
0
100
200
300
400
0.40 0.50 0.60 0.70 0.80 0.90Equivalence Ratio
CO
(ppm
)
Swirler ASwirler BSwirler C
0
10
20
30
40
0.40 0.50 0.60 0.70 0.80 0.90
Equivalence Ratio
NO
x (p
pm)
Swirler ASwirler BSwirler C
Figure 7: CO and NOx versus equivalence ratio for swirler configurations A, B, and C at ma=34g/s, Tin=25˚C, liquid fuel.
wnloaded From: https://proceedings.asmedigitalcollection.asme.org on 06/30/2019 Terms of
fields of the co-and counter inner swirler cases as shown in Figs. 5 and 6, the significant difference in NOx formation shows that even small differences in the swirling flow fields may result in substantial differences in the combustion process when the fuel distribution is localized, as is the case for the present liquid fuel injection.
OH chemiluminescence images (Fig. 8) show that the flame structures were different for the three swirler configurations: the strong OH intensity region (indicative of high rates of chemical reaction) for Swirler A was more uniformly distributed rather than localized in three lobes (Swirler C) or two lobes (Swirler B). Careful inspection of the tangential velocity contours of Swirlers A and B, shows that the tangential velocity of Swirler A was higher than that of Swirler B close to the centerline of the flow field (Figure 6c). This higher tangential velocity helped in dispersing the fuel away from the central region, where the liquid fuel was injected, to the outer regions. The enhanced dispersion yielded a more homogeneous fuel distribution, resulting in a more uniform combustion structure for Swirler A with reduced hot spots and lower NOx emissions compared to Swirler B. This is in spite of the similarity between their flow fields. For Swirler C, the stronger RMS velocity fluctuation and higher strain-rate along the conical jets led to a more intense chemical reaction region, resulting in higher temperatures and the formation of more NOx and less CO compared to Swirler A.
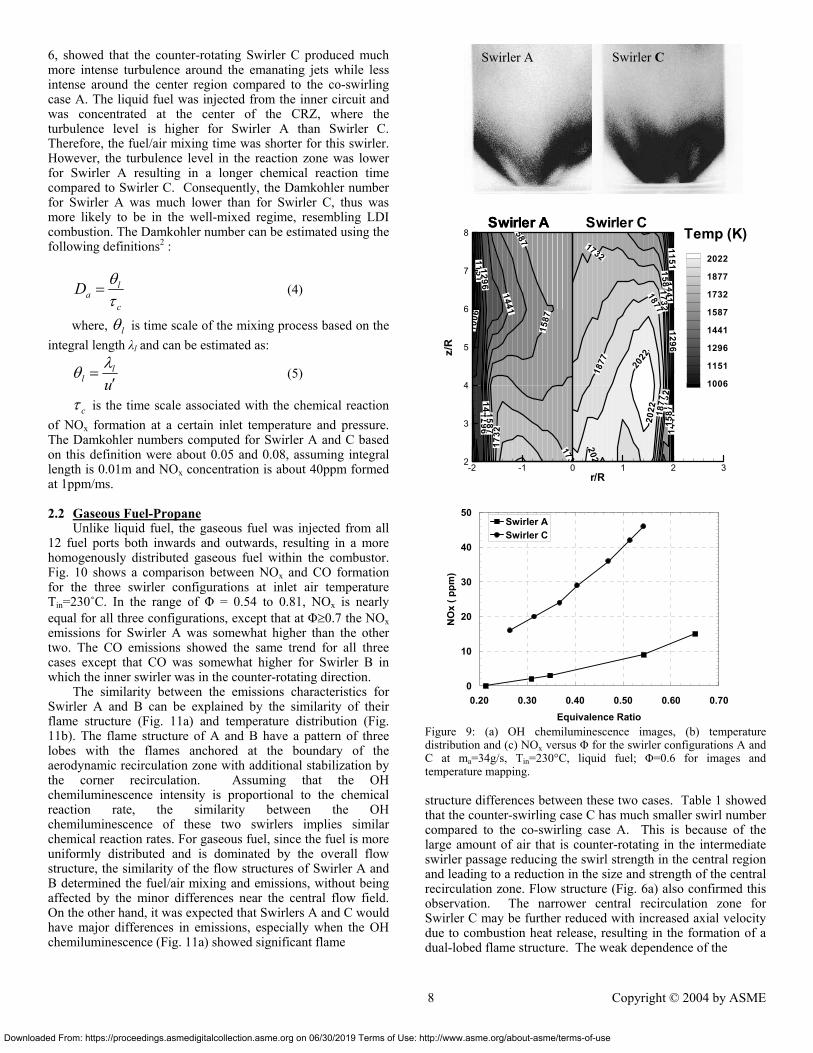
This observation was further confirmed by direct comparison of OH chemiluminescence, temperature distribution and NOx emissions between Swirler A and C at an elevated inlet air temperature, Tin=230°C, as shown in Fig. 9a to c. At an equivalence ratio of Φ = 0.5, Swirler C formed an annular flame which extended also into the central region contrary to Swirler A whose flame was limited to the conical emanating jets (Fig. 9a), indicating much stronger reaction for Swirler C. The higher temperature region, enclosed by the contour of 1732K, covered almost 80% of the measured area for the counter swirl case C compared to less than 20% of the measured area for the co-swirl case A. The larger high temperature region and the more intense flame structure of Swirler C resulted in roughly three fold increase in thermal NOx relative to Swirler A in an equivalence ratio range of Φ = 0.28 to 0.56.
The significant differences between the temperature levels and NOx emissions of the co and counter Swirlers A and C emphasize that the match-up of swirler configuration and fuel distribution is critical for achieving low NOx in LDI combustion, in addition to satisfying the high turbulence intensity requirement. Flow field measurements shown in Fig.
Swirler A Swirler B Swirler C
Figure 8: OH chemiluminescence for three swirler configurations A, B and C at ma=34g/s, Tin=25°C, liquid fuel
7 Copyright © 2004 by ASME
Use: http://www.asme.org/about-asme/terms-of-use
Dow
6, showed that the counter-rotating Swirler C produced much more intense turbulence around the emanating jets while less intense around the center region compared to the co-swirling case A. The liquid fuel was injected from the inner circuit and was concentrated at the center of the CRZ, where the turbulence level is higher for Swirler A than Swirler C. Therefore, the fuel/air mixing time was shorter for this swirler. However, the turbulence level in the reaction zone was lower for Swirler A resulting in a longer chemical reaction time compared to Swirler C. Consequently, the Damkohler number for Swirler A was much lower than for Swirler C, thus was more likely to be in the well-mixed regime, resembling LDI combustion. The Damkohler number can be estimated using the following definitions2 :
c
laD
τθ
= (4)
where, lθ is time scale of the mixing process based on the integral length λl and can be estimated as:
ul
l ′=λθ (5)
cτ is the time scale associated with the chemical reaction of NOx formation at a certain inlet temperature and pressure. The Damkohler numbers computed for Swirler A and C based on this definition were about 0.05 and 0.08, assuming integral length is 0.01m and NOx concentration is about 40ppm formed at 1ppm/ms.
2.2 Gaseous Fuel-Propane
Unlike liquid fuel, the gaseous fuel was injected from all 12 fuel ports both inwards and outwards, resulting in a more homogenously distributed gaseous fuel within the combustor. Fig. 10 shows a comparison between NOx and CO formation for the three swirler configurations at inlet air temperature Tin=230˚C. In the range of Φ = 0.54 to 0.81, NOx is nearly equal for all three configurations, except that at Φ≥0.7 the NOx emissions for Swirler A was somewhat higher than the other two. The CO emissions showed the same trend for all three cases except that CO was somewhat higher for Swirler B in which the inner swirler was in the counter-rotating direction.
The similarity between the emissions characteristics for Swirler A and B can be explained by the similarity of their flame structure (Fig. 11a) and temperature distribution (Fig. 11b). The flame structure of A and B have a pattern of three lobes with the flames anchored at the boundary of the aerodynamic recirculation zone with additional stabilization by the corner recirculation. Assuming that the OH chemiluminescence intensity is proportional to the chemical reaction rate, the similarity between the OH chemiluminescence of these two swirlers implies similar chemical reaction rates. For gaseous fuel, since the fuel is more uniformly distributed and is dominated by the overall flow structure, the similarity of the flow structures of Swirler A and B determined the fuel/air mixing and emissions, without being affected by the minor differences near the central flow field. On the other hand, it was expected that Swirlers A and C would have major differences in emissions, especially when the OH chemiluminescence (Fig. 11a) showed significant flame
nloaded From: https://proceedings.asmedigitalcollection.asme.org on 06/30/2019 Terms of Us
Figure 9: (a) OH chemiluminescence images, (b) temperature distribution and (c) NOx versus Φ for the swirler configurations A and C at ma=34g/s, Tin=230°C, liquid fuel; Φ=0.6 for images and temperature mapping.
structure differences between these two cases. Table 1 showed that the counter-swirling case C has much smaller swirl number compared to the co-swirling case A. This is because of the large amount of air that is counter-rotating in the intermediate swirler passage reducing the swirl strength in the central region and leading to a reduction in the size and strength of the central recirculation zone. Flow structure (Fig. 6a) also confirmed this observation. The narrower central recirculation zone for Swirler C may be further reduced with increased axial velocity due to combustion heat release, resulting in the formation of a dual-lobed flame structure. The weak dependence of the
Swirler A Swirler C
115112 96
1441
1441
158 7
1587
1732
1732
1732
1877
1877
1877
2022
2022
2022
1006
11511296
12961441
1441
1587
1587
587
1732
1732
r/R
z/R
-2 -1 0 1 2 32
3
4
5
6
7
8
2022
1877
1732
1587
1441
1296
1151
1006
Swirler ASwirler A Swirler CTemp (K)
0
10
20
30
40
50
0.20 0.30 0.40 0.50 0.60 0.70Equivalence Ratio
NO
x ( p
pm)
Swirler ASwirler C
8 Copyright © 2004 by ASME
e: http://www.asme.org/about-asme/terms-of-use
Dow
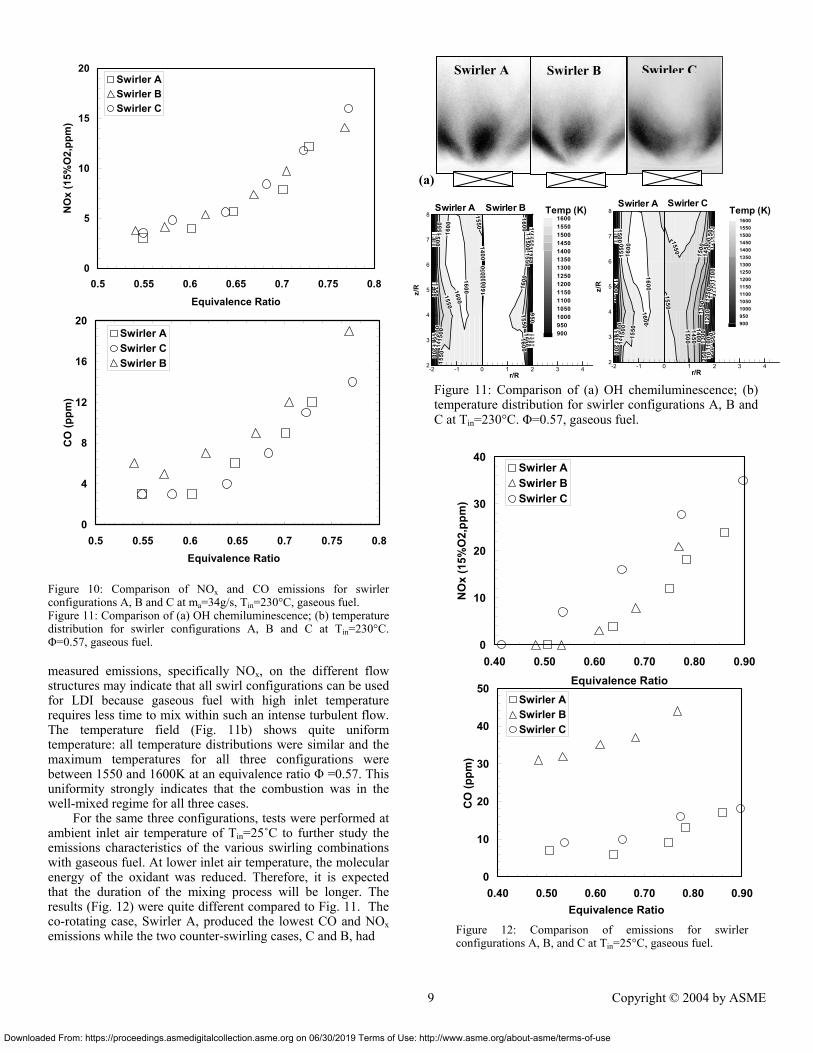
Figure 10: Comparison of NOx and CO emissions for swirler configurations A, B and C at ma=34g/s, Tin=230°C, gaseous fuel. Figure 11: Comparison of (a) OH chemiluminescence; (b) temperature distribution for swirler configurations A, B and C at Tin=230°C. Φ=0.57, gaseous fuel. measured emissions, specifically NOx, on the different flow structures may indicate that all swirl configurations can be used for LDI because gaseous fuel with high inlet temperature requires less time to mix within such an intense turbulent flow. The temperature field (Fig. 11b) shows quite uniform temperature: all temperature distributions were similar and the maximum temperatures for all three configurations were between 1550 and 1600K at an equivalence ratio Φ =0.57. This uniformity strongly indicates that the combustion was in the well-mixed regime for all three cases.
For the same three configurations, tests were performed at ambient inlet air temperature of Tin=25˚C to further study the emissions characteristics of the various swirling combinations with gaseous fuel. At lower inlet air temperature, the molecular energy of the oxidant was reduced. Therefore, it is expected that the duration of the mixing process will be longer. The results (Fig. 12) were quite different compared to Fig. 11. The co-rotating case, Swirler A, produced the lowest CO and NOx emissions while the two counter-swirling cases, C and B, had
0
5
10
15
20
0.5 0.55 0.6 0.65 0.7 0.75 0.8Equivalence Ratio
NO
x (1
5%O
2,pp
m)
Swirler ASwirler BSwirler C
0
4
8
12
16
20
0.5 0.55 0.6 0.65 0.7 0.75 0.8Equivalence Ratio
CO
(ppm
)
Swirler ASwirler CSwirler B
nloaded From: https://proceedings.asmedigitalcollection.asme.org on 06/30/2019 Terms of U
Swirler A Swirler CSwirler B
(a)
95010 001050
10501 100
110 01150
115 0
1200
120 0
1250
1 250
1300
130 01350
13 50
135 0
14001 40 0
1400
1450145 0
145 0
15001500
150 0
15501550
1550
1600
1600
1600
1600
10001 05 0
1 100
1 100
115 0
1150
1 2001 20 0
12501250
1 300
130 01 3 5 0
1400
14 00
1450
1 450
1500
1500
1550
1550
1550
1550
1600
16001600
r/R
z/R
-2 -1 0 1 2 3 42
3
4
5
6
7
8 1600155015001450140013501300125012001150110010501000950900
Swirler A Swirler B Temp (K)
900
950
950
1000
100 0
1 050
1050
1 10 0
1100
1150
1150
1200
1 20 0
250
1250
1250
130 0
1300
1350
1350
1400
1400
1450
1450
1500
1500
15501550
10 001050
1050
11 00
1100
11 5012 00
1 20 01250
1 250
1 300
1300
1 350
135 0
1400
140 0
1450
14 50
1500
1500
1550
1550
1600
160016 00
r/R
z/R
-2 -1 0 1 2 3 42
3
4
5
6
7
81600155015001450140013501300125012001150110010501000950900
Temp (K)Swirler A Swirler C
Figure 11: Comparison of (a) OH chemiluminescence; (b) temperature distribution for swirler configurations A, B and C at Tin=230°C. Φ=0.57, gaseous fuel.
0
10
20
30
40
0.40 0.50 0.60 0.70 0.80 0.90Equivalence Ratio
NO
x (1
5%O
2,pp
m)
Swirler ASwirler BSwirler C
0
10
20
30
40
50
0.40 0.50 0.60 0.70 0.80 0.90Equivalence Ratio
CO
(ppm
)
Swirler ASwirler BSwirler C
Figure 12: Comparison of emissions for swirler configurations A, B, and C at Tin=25°C, gaseous fuel.
9 Copyright © 2004 by ASME
se: http://www.asme.org/about-asme/terms-of-use
Dow
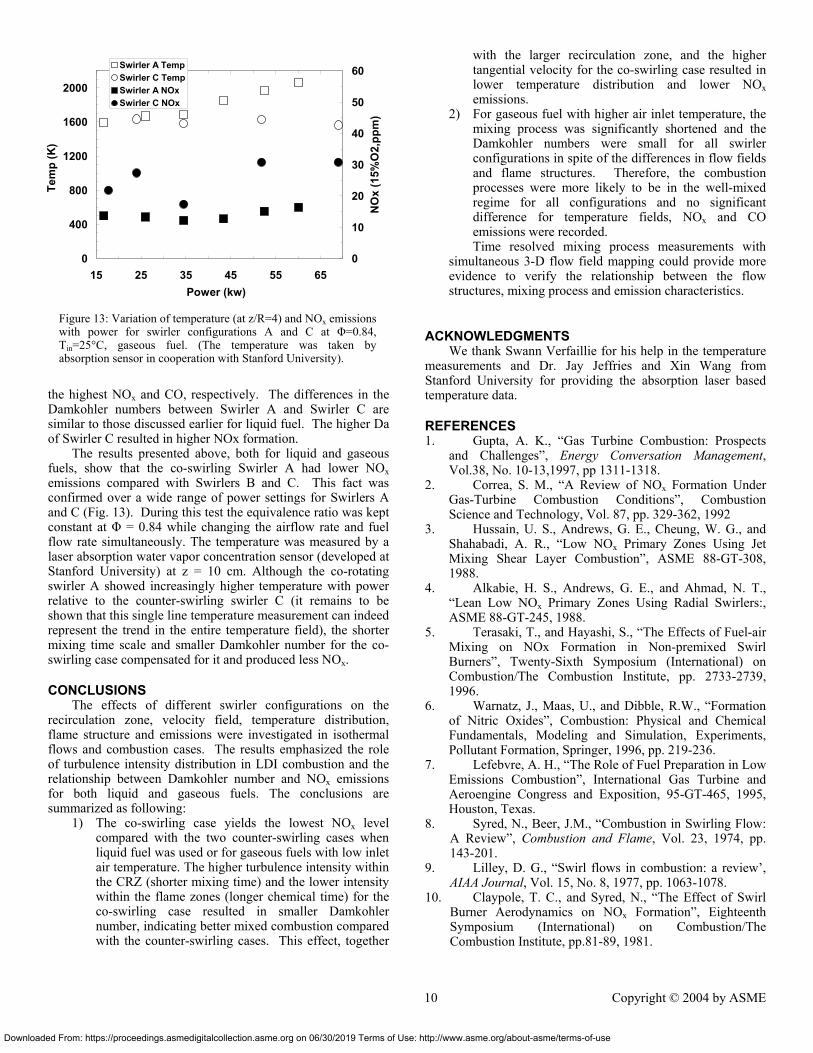
the highest NOx and CO, respectively. The differences in the Damkohler numbers between Swirler A and Swirler C are similar to those discussed earlier for liquid fuel. The higher Da of Swirler C resulted in higher NOx formation. The results presented above, both for liquid and gaseous fuels, show that the co-swirling Swirler A had lower NOx emissions compared with Swirlers B and C. This fact was confirmed over a wide range of power settings for Swirlers A and C (Fig. 13). During this test the equivalence ratio was kept constant at Φ = 0.84 while changing the airflow rate and fuel flow rate simultaneously. The temperature was measured by a laser absorption water vapor concentration sensor (developed at Stanford University) at z = 10 cm. Although the co-rotating swirler A showed increasingly higher temperature with power relative to the counter-swirling swirler C (it remains to be shown that this single line temperature measurement can indeed represent the trend in the entire temperature field), the shorter mixing time scale and smaller Damkohler number for the co-swirling case compensated for it and produced less NOx.
CONCLUSIONS The effects of different swirler configurations on the recirculation zone, velocity field, temperature distribution, flame structure and emissions were investigated in isothermal flows and combustion cases. The results emphasized the role of turbulence intensity distribution in LDI combustion and the relationship between Damkohler number and NOx emissions for both liquid and gaseous fuels. The conclusions are summarized as following:
1) The co-swirling case yields the lowest NOx level compared with the two counter-swirling cases when liquid fuel was used or for gaseous fuels with low inlet air temperature. The higher turbulence intensity within the CRZ (shorter mixing time) and the lower intensity within the flame zones (longer chemical time) for the co-swirling case resulted in smaller Damkohler number, indicating better mixed combustion compared with the counter-swirling cases. This effect, together
0
400
800
1200
1600
2000
15 25 35 45 55 65Power (kw)
Tem
p (K
)
0
10
20
30
40
50
60
NO
x (1
5%O
2,pp
m)
Swirler A TempSwirler C TempSwirler A NOxSwirler C NOx
Figure 13: Variation of temperature (at z/R=4) and NOx emissions with power for swirler configurations A and C at Φ=0.84, Tin=25°C, gaseous fuel. (The temperature was taken by absorption sensor in cooperation with Stanford University).
nloaded From: https://proceedings.asmedigitalcollection.asme.org on 06/30/2019 Terms of U
with the larger recirculation zone, and the higher tangential velocity for the co-swirling case resulted in lower temperature distribution and lower NOx emissions.
2) For gaseous fuel with higher air inlet temperature, the mixing process was significantly shortened and the Damkohler numbers were small for all swirler configurations in spite of the differences in flow fields and flame structures. Therefore, the combustion processes were more likely to be in the well-mixed regime for all configurations and no significant difference for temperature fields, NOx and CO emissions were recorded. Time resolved mixing process measurements with
simultaneous 3-D flow field mapping could provide more evidence to verify the relationship between the flow structures, mixing process and emission characteristics.
ACKNOWLEDGMENTS We thank Swann Verfaillie for his help in the temperature
measurements and Dr. Jay Jeffries and Xin Wang from Stanford University for providing the absorption laser based temperature data.
REFERENCES 1. Gupta, A. K., “Gas Turbine Combustion: Prospects
and Challenges”, Energy Conversation Management, Vol.38, No. 10-13,1997, pp 1311-1318.
2. Correa, S. M., “A Review of NOx Formation Under Gas-Turbine Combustion Conditions”, Combustion Science and Technology, Vol. 87, pp. 329-362, 1992
3. Hussain, U. S., Andrews, G. E., Cheung, W. G., and Shahabadi, A. R., “Low NOx Primary Zones Using Jet Mixing Shear Layer Combustion”, ASME 88-GT-308, 1988.
4. Alkabie, H. S., Andrews, G. E., and Ahmad, N. T., “Lean Low NOx Primary Zones Using Radial Swirlers:, ASME 88-GT-245, 1988.
5. Terasaki, T., and Hayashi, S., “The Effects of Fuel-air Mixing on NOx Formation in Non-premixed Swirl Burners”, Twenty-Sixth Symposium (International) on Combustion/The Combustion Institute, pp. 2733-2739, 1996.
6. Warnatz, J., Maas, U., and Dibble, R.W., “Formation of Nitric Oxides”, Combustion: Physical and Chemical Fundamentals, Modeling and Simulation, Experiments, Pollutant Formation, Springer, 1996, pp. 219-236.
7. Lefebvre, A. H., “The Role of Fuel Preparation in Low Emissions Combustion”, International Gas Turbine and Aeroengine Congress and Exposition, 95-GT-465, 1995, Houston, Texas.
8. Syred, N., Beer, J.M., “Combustion in Swirling Flow: A Review”, Combustion and Flame, Vol. 23, 1974, pp. 143-201.
9. Lilley, D. G., “Swirl flows in combustion: a review’, AIAA Journal, Vol. 15, No. 8, 1977, pp. 1063-1078.
10. Claypole, T. C., and Syred, N., “The Effect of Swirl Burner Aerodynamics on NOx Formation”, Eighteenth Symposium (International) on Combustion/The Combustion Institute, pp.81-89, 1981.
10 Copyright © 2004 by ASME
se: http://www.asme.org/about-asme/terms-of-use
Downlo
11. Gupta, A. K., Ong, L. H., and Marchionna, N., “NOx Reduction and Combustion Phenomena in the Multi-annular Gas Turbine Swirl Burner”, AIAA Paper 87-2036, 1987.
12. Gupta, A. K., Lewis, M. J., and Daurer, M., “Swirl Effects on Combustion Characteristics of Premixed Flames”, Journal of Engineering for Gas Turbines and Power, Vol. 123, pp. 619-626, 2001.
13. Merkle, K., Buvhner, H., Zarzalis, N., and Sara, O. N., “Influence of CO and Counter Swirl on Lean Stability Limits of an Airblast Nozzle”, GT 2003-38004, Proceedings of ASME Turbo Expo 2003, Georgia, USA
14. Oven, M. J., Gouldin, F. C., and McLean, W. J., “Temperature and Species Concentration Measurements in a Swirl-Stabilized Combustor”, Eighteenth Symposium (International) on Combustion/The Combustion Institute, pp.363-374, 1981.
15. Li, G., and Gutmark, E. J., “Combustion Characteristics of a Multiple Swirl Spray Combustor”,
aded From: https://proceedings.asmedigitalcollection.asme.org on 06/30/2019 Terms of U
AIAA 2003-0489, AIAA Aerospace Science Meeting and Exhibit, Reno, 2003.
16. Shaddix, C. R., “Correcting Thermocouple Measurements for Radiation Loss: a Critical Review”, Proceedings of the 33rd National Heat Transfer Conference, 1999, Albuquerque, New Mexico.
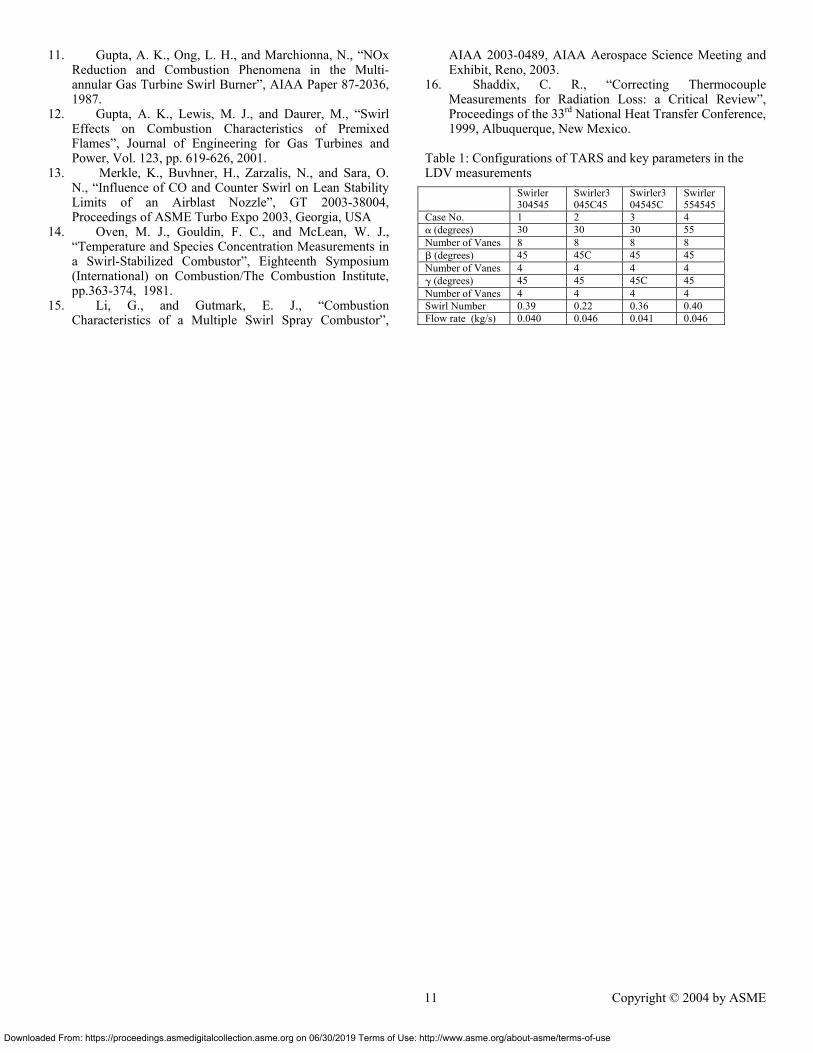
Table 1: Configurations of TARS and key parameters in the LDV measurements
Swirler304545
Swirler3045C45
Swirler304545C
Swirler554545
Case No. 1 2 3 4 α (degrees) 30 30 30 55 Number of Vanes 8 8 8 8 β (degrees) 45 45C 45 45 Number of Vanes 4 4 4 4 γ (degrees) 45 45 45C 45 Number of Vanes 4 4 4 4 Swirl Number 0.39 0.22 0.36 0.40 Flow rate (kg/s) 0.040 0.046 0.041 0.046
11 Copyright © 2004 by ASME
se: http://www.asme.org/about-asme/terms-of-use
Related Documents