Perception & Psychophysics 1980, Vol. 27 (4),307-312 Effects of spatial parameters on the perceptual organization of a bistable motion display ALLAN J. PANTLE and J. TIMOTHY PETERSIK Miami University, Oxford, Ohio 45056 In a dynamic visual display which consisted of two alternating frames, each with three line elements, the individual elements which possessed a high degree of spatial correspondence from one frame to the next were paired perceptually and moved about locally. Any remaining ele- ments moved independently and followed different movement rules. When there was no high degree of spatial correspondence of any elements across frames, or when the interval of time between frames was long, the elements behaved as a perceptual unit and moved about as a group. The local pairings and movements appeared to be mediated by a process with differ- ent functional characteristics from those of the process which mediated the wholistic move- ment of the elements as a group. / / / / / / / / / / I I I o ® t l I I I / I / ¢¢® I / / / lated areas in alternating, Julesz-type, random-element' patterns. For this reason, the process mediating the element movement sensation (termed the s-process by Petersik and Pantle, 1979) was identified with the process responsible for the segregation and perceived movement of subjective figures in random-element displays (termed the short-range process by Braddick, 1974). The basis for the operation of the short-range process is the physical identity of a subset of elements or points in successive frames of a display sequence (Anstis, 1970; Bell & Lappin, 1973; Braddick, 1973, 1974; Julesz, 1971). In order that the subset of ele- ments or points be linked across frames and emerge The purpose of the present experiments was to study the nature of the perceptual organizations im- posed by our visual system on a dynamic display that was employed by Pantle and Picciano (1976) and re- sembled one described by Ternus (1938). With the display, competing sensations of stroboscopic move- ment are produced by a cyclic alternation of two stimulus frames. Frame I contains three stimulus ele- ments (A, B, C) arranged in a horizontal row on a blank background. Frame 2 contains three identical elements (D, E, F), also arranged horizontally but shifted to the right such that the positions of D and E of Frame 2 overlap those of Band C, respectively, of Frame 1 (see Figure 1). When stimulus conditions are appropriately chosen, the spatiotemporal display gives rise to a bistable percept: Either an observer perceives a group of three elements moving back and forth as a whole (group movement) or he perceives the overlapping elements of each frame as stationary and a third element moving back and forth from one end of the display to the other (element movement). The rationale for the two specific objectives of our present research with the element-group movement display (hereafter, EG display) is as follows: (1) As Petersik and Pantle (1979) elaborated in detail, stimulus parameters of the EG display can be manipulated so as to favor either the element or group movement sensation. The values of the param- eters which favor element movement were shown to be the same as those required for an observer to seg- regate and perceive the apparent movement of corre- This research was supported in part by Air Force Contract F336l5-76-C-5006, sponsored by the Aerospace Medical Research Laboratory, Wright-Patterson Air Force Base, Ohio 45433. We thank Peggy Johnston and Ken Hicks for their help. J. T. Petersik is now at Southeast Missouri State University, Department of Psy- chology, Cape Girardeau, Missouri 63701. Figure 1. A schematic representation of the spatiotemporal characteristics of the display used to produce bistable movement sensations. Copyright 1980 Psychonomic Society, Inc. 307 0031-5117/80/040307-06$00.85/0

Welcome message from author
This document is posted to help you gain knowledge. Please leave a comment to let me know what you think about it! Share it to your friends and learn new things together.
Transcript
Perception & Psychophysics1980, Vol. 27 (4),307-312
Effects of spatial parameters on theperceptual organization of a
bistable motion display
ALLAN J. PANTLE and J. TIMOTHY PETERSIKMiami University, Oxford, Ohio 45056
In a dynamic visual display which consisted of two alternating frames, each with three lineelements, the individual elements which possessed a high degree of spatial correspondence fromone frame to the next were paired perceptually and moved about locally. Any remaining elements moved independently and followed different movement rules. When there was no highdegree of spatial correspondence of any elements across frames, or when the interval of timebetween frames was long, the elements behaved as a perceptual unit and moved about as agroup. The local pairings and movements appeared to be mediated by a process with different functional characteristics from those of the process which mediated the wholistic movement of the elements as a group.
/
//
//
//
//
/ II I
o ~ ® t lI I
I /
I /
¢¢®I /
/ /
lated areas in alternating, Julesz-type, random-element'patterns. For this reason, the process mediating theelement movement sensation (termed the s-process byPetersik and Pantle, 1979) was identified with theprocess responsible for the segregation and perceivedmovement of subjective figures in random-elementdisplays (termed the short-range process by Braddick,1974). The basis for the operation of the short-rangeprocess is the physical identity of a subset of elementsor points in successive frames of a display sequence(Anstis, 1970; Bell & Lappin, 1973; Braddick, 1973,1974; Julesz, 1971). In order that the subset of elements or points be linked across frames and emerge
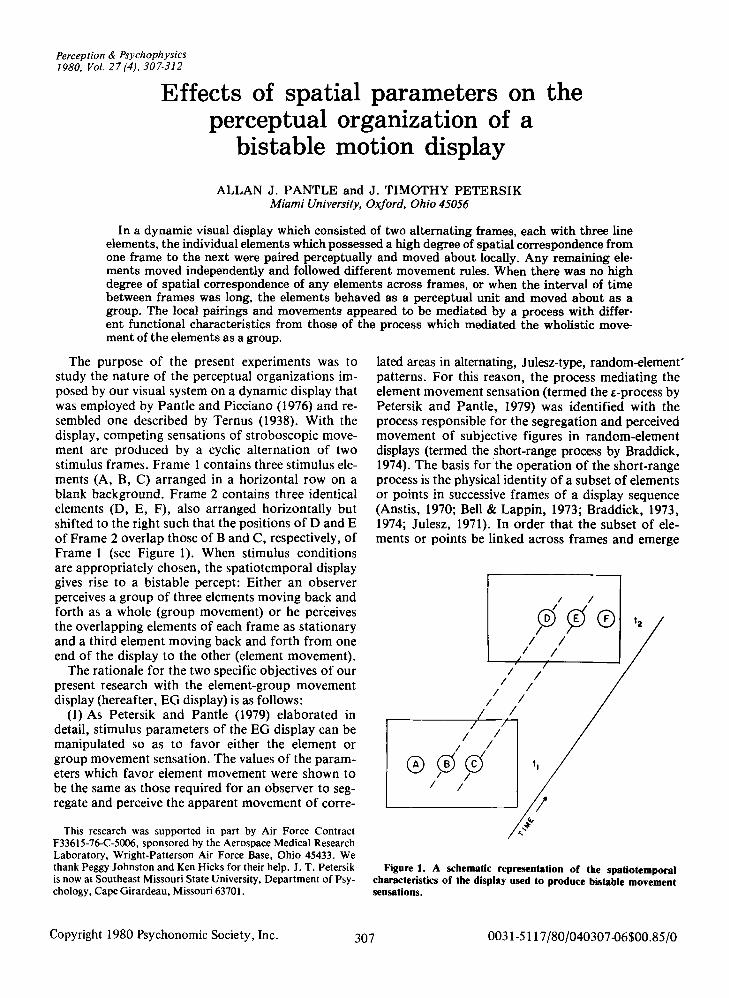
The purpose of the present experiments was tostudy the nature of the perceptual organizations imposed by our visual system on a dynamic display thatwas employed by Pantle and Picciano (1976) and resembled one described by Ternus (1938). With thedisplay, competing sensations of stroboscopic movement are produced by a cyclic alternation of twostimulus frames. Frame I contains three stimulus elements (A, B, C) arranged in a horizontal row on ablank background. Frame 2 contains three identicalelements (D, E, F), also arranged horizontally butshifted to the right such that the positions of D and Eof Frame 2 overlap those of Band C, respectively, ofFrame 1 (see Figure 1). When stimulus conditionsare appropriately chosen, the spatiotemporal displaygives rise to a bistable percept: Either an observerperceives a group of three elements moving back andforth as a whole (group movement) or he perceivesthe overlapping elements of each frame as stationaryand a third element moving back and forth from oneend of the display to the other (element movement).
The rationale for the two specific objectives of ourpresent research with the element-group movementdisplay (hereafter, EG display) is as follows:
(1) As Petersik and Pantle (1979) elaborated indetail, stimulus parameters of the EG display can bemanipulated so as to favor either the element orgroup movement sensation. The values of the parameters which favor element movement were shown tobe the same as those required for an observer to segregate and perceive the apparent movement of corre-
This research was supported in part by Air Force ContractF336l5-76-C-5006, sponsored by the Aerospace Medical ResearchLaboratory, Wright-Patterson Air Force Base, Ohio 45433. Wethank Peggy Johnston and Ken Hicks for their help. J. T. Petersikis now at Southeast Missouri State University, Department of Psychology, Cape Girardeau, Missouri 63701.
Figure 1. A schematic representation of the spatiotemporalcharacteristics of the display used to produce bistable movementsensations.
Copyright 1980 PsychonomicSociety, Inc. 307 0031-5117/80/040307-06$00.85/0
308 PANTLE AND PETERSIK
as a subjective figure, the shift in the location of thesubset from one frame to the next cannot be too large« 20 min)' (Braddick, 1974). If, indeed, the s-processis identical in its functional characteristics to theshort-range process, we reasoned that the strength ofthe element movement sensation might depend uponthe extent to which parts of the separate frames ofthe EG display were in exact, or nearly exact, correspondence. It would follow that spatial perturbations(rotations or shifts) of the overlapping elements ofone frame (say, D and E in Figure 1) of the displaywould weaken the element-movement sensation.
Just as the element movement sensation has limitingconditions which are like those for the segregationand perception of movement of correlated areas inrandom-dot patterns, the group movement sensationis favored by the same stimulus conditions that arerequired to obtain stroboscopic movement of textureclusters (pantle, 1973; Ramachandran, MadhusudhanRao, & Vidyasagar, 1973). In those studies, the alternation of a pair of frames, each of which contained acluster of elements defined by a global form cue,caused an observer to perceive the cluster to moveback and forth as a whole. The cluster movementsensation occurred despite the fact that the internalarrangement of the elements of the cluster did not remain the same from one frame to the next. The groupmovement sensation may simply be a specific instanceof the cluster movement sensation (mediated by they-process of Petersik & Pantle, 1979) in which thethree lines of the EG display are processed as a cluster whose average brightness differs from that of thesurrounding blank background. If so, small systematic perturbations of the individual elements of oneframe of the display should not affect the strength ofthe group movement sensation.
In summary, spatial perturbations ought to weakenthe element movement sensation, but not the groupmovement sensation, and, therefore, the percentageof group movement sensations ought to increase asthe degree of the spatial perturbations is increased.
(2) With the spatial separation of 1 deg or morebetween adjacent elements typically used in the EGdisplay (Braddick & Adlard, 1978; Pantle & Picciano,1976; Petersik & Pantle, 1979), only two local pairings are possible between the elements of successiveframes, namely the overlapping elements. However,if the spacing between all elements is reduced, localpairings among all three elements of the successiveframes may be possible, and the element movementsensation may be abolished in favor of one in whichall three elements move together locally.
EXPERIMENT 1
In all our experiments, we used lines as elements.In the first experiment, we introduced small system-
atic perturbations in the orientation of the two lineelements of one frame (elements which correspondedto D and E of the frame at time t2 in Figure 1) whichoverlapped the two line elements (B and C) of theother frame. If the processes underlying the elementand group movement sensations are differentiallysensitive to the tilts of the line elements, then onewould expect them to alter the proportion of elementand group movement responses.
MethodSubjects. The observers were eight undergraduate psychology
students, six of whom served in partial fulfillment of course requirements. Two of the subjects were experienced psychophysicalobservers, but all subjects were naive with respect to the purposeof the experiment.
Stimuli and Apparatus. The stimuli were similar to those shownin Figure 1, with the exception that the stimuli were light greenlines which appeared on a darker background. Each stimulusframe was presented on a CRT screen coated with a rapid decayphosphor (P31) by a PDP-ll/lO computer. The viewing distancewas 104 cm, and at this distance each line subtended 3 min 40 secof visual angle in width and 3 deg 8 min in height. The separationbetween adjacent lines was 1 deg. Stimulus frames were viewedwith ambient room illumination, and the resultant luminance ofthe CRT screen was .38 cd/m'. Against the background of theCRT screen, each of the stimulus lines generated by the computerhad a luminance of 22.9 cd/m'. The oscilloscope screen subtended11 deg 45 min vertically and 15 deg 15 min horizontally.
Procedure. Each subject served in five experimental sessions,and in each session he viewed two randomized blocks of 20 trials.There was one trial in each block for each combination of the fourdisplays described below and five intervals between frames (ISIs).On each trial, a subject viewed the alternating frames of a displayfor 3 sec. Each frame in the sequence had a duration of 200 msec.For each trial, the subject's task was to report whether he sawelement or group movement.
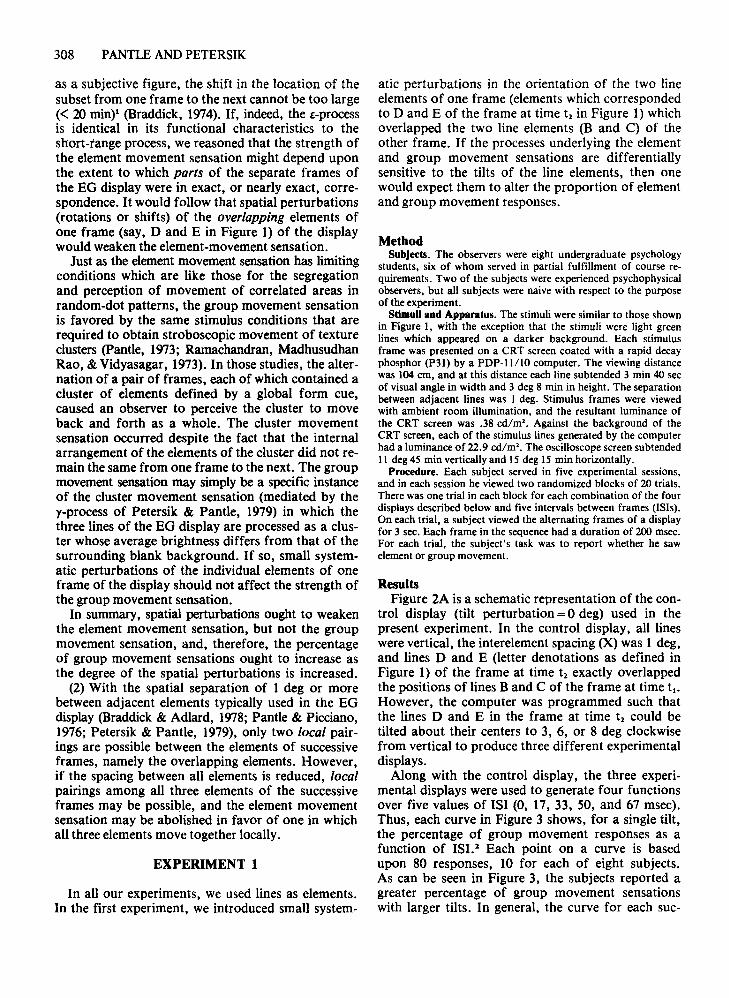
ResultsFigure 2A is a schematic representation of the con
trol display (tilt perturbation =0 deg) used in thepresent experiment. In the control display, all lineswere vertical, the interelement spacing (X) was I deg,and lines D and E (letter denotations as defined inFigure 1) of the frame at time t2 exactly overlappedthe positions of lines Band C of the frame at time t1 •
However, the computer was programmed such thatthe lines D and E in the frame at time t2 could betilted about their centers to 3, 6, or 8 deg clockwisefrom vertical to produce three different experimentaldisplays.
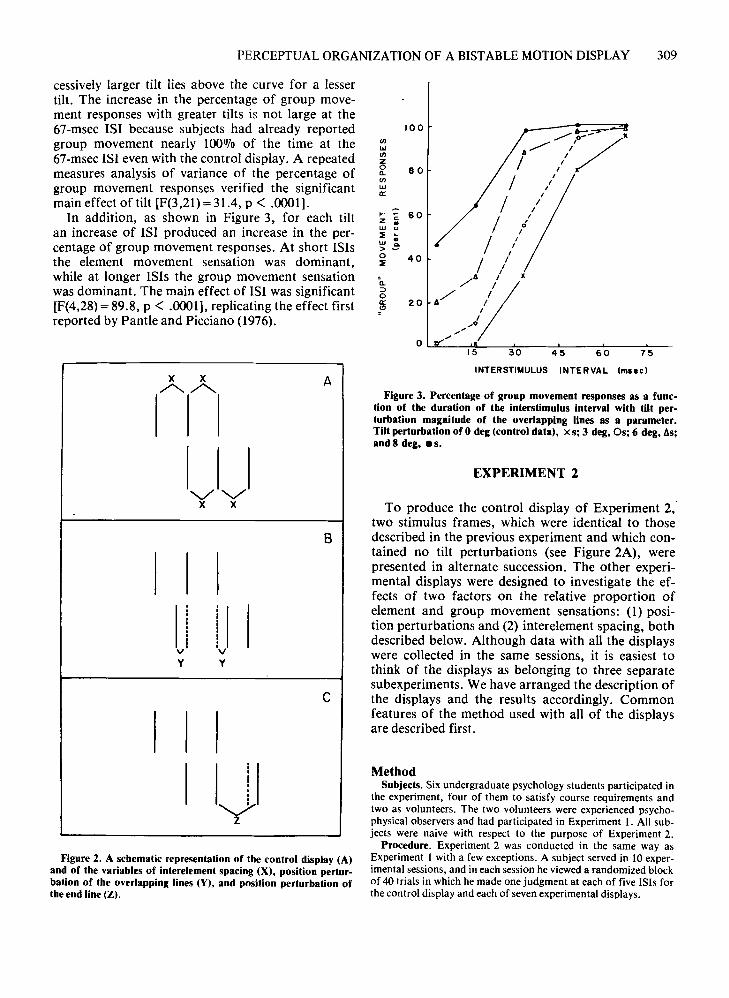
Along with the control display, the three experimental displays were used to generate four functionsover five values of lSI (0, 17,33, 50, and 67 msec).Thus, each curve in Figure 3 shows, for a single tilt,the percentage of group movement responses as afunction of lSI. 2 Each point on a curve is basedupon 80 responses, 10 for each of eight subjects.As can be seen in Figure 3, the subjects reported agreater percentage of group movement sensationswith larger tilts. In general, the curve for each sue-
PERCEPTUAL ORGANIZATION OF A BISTABLE MOTION DISPLAY 309
cessively larger tilt lies above the curve for a lessertilt. The increase in the percentage of group movement responses with greater tilts is not large at the67-msec lSI because subjects had already reportedgroup movement nearly 100% of the time at the67-msec lSI even with the control display. A repeatedmeasures analysis of variance of the percentage ofgroup movement responses verified the significantmain effect of tilt [F(3,2l) =31.4, p < .0001].
In addition, as shown in Figure 3, for each tiltan increase of lSI produced an increase in the percentage of group movement responses. At short ISIsthe element movement sensation was dominant,while at longer ISIs the group movement sensationwas dominant. The main effect of lSI was significant[F(4,28) =89.8, p < .0001], replicating the effect firstreported by Pantle and Picciano (1976).
en...enZo0..en...a:
0..::>oa:(!)
100
80
45 60 75
x x A»<:>»;
'-./ '-./x x
B
.i!!.
v vy y
C
iIII
:II
YFigure 2. A schematic representation of the control display (A)
and of the variables of interelement spacing (X), position perturbation of the overlapping lines (Y), and position perturbation ofthe end line (Z).
INTERSTIMULUS INTERVAL (mile)
Figure 3. Percentage of group movement responses as a function of the duration of the interstimulus interval with tilt perturbation magnitude of the overlapping lines as a parameter.Tilt perturbation of 0 deg (control data), x s; 3 deg, Os; 6 deg, f.s;and 8 deg, .s.
EXPERIMENT 2
To produce the control display of Experiment 2,two stimulus frames, which were identical to thosedescribed in the previous experiment and which contained no tilt perturbations (see Figure 2A), werepresented in alternate succession. The other experimental displays were designed to investigate the effects of two factors on the relative proportion ofelement and group movement sensations: (1) position perturbations and (2) interelement spacing, bothdescribed below. Although data with all the displayswere collected in the same sessions, it is easiest tothink of the displays as belonging to three separatesubexperiments. We have arranged the description ofthe displays and the results accordingly. Commonfeatures of the method used with all of the displaysare described first.
MethodSubjects. Six undergraduate psychology students participated in
the experiment, four of them to satisfy course requirements andtwo as volunteers. The two volunteers were experienced psychophysical observers and had participated in Experiment I. All subjects were naive with respect to the purpose of Experiment 2.
Procedure. Experiment 2 was conducted in the same way asExperiment I with a few exceptions. A subject served in 10 experimental sessions, and in each session he viewed a randomized blockof 40 trials in which he made one judgment at each of five ISIs forthe control display and each of seven experimental displays.
310 PANTLE ANDPETERSIK
Figure 4. Percentage of group movement responses as a function of the duration of the interstimulus interval with positionperturbation magnitude of the overlapping lines as a parameter.Position perturbation (Y) of 0 min (control data), • s; 4 min, x s;8 min, as; and 16 min, As.
100 . ? ... •90
.----- / /I
0/ x "80 / ,/rn
'" /I
rn Iz 70 I0 •Q.
/Irn I
'" 60a: J0 I
.... :: Jz c 50 J. J'" u~ ~ I'" . 40 -: J>.e0 J~ I
30 J=Q. I::l J0 20 Ja: J~ I
10 III• •
ResultsPosition perturbations of overlapping lines. The
two stimulus frames shown in Figure 2B represent acondition in which the location of the "overlapping"lines of one stimulus frame have been shifted laterally by a distance, Y, relative to their locations in thecontrol condition (represented by the dashed lines inFigure 2B). (By definition, the shift of the overlapping lines in the control condition was °deg.) Thecomputer was programmed so that the lateral shift Ycould be 4, 8, or 16 min of visual angle.
Along with the control display, the three experimental displays were used to generate four functionsover the five values of lSI. Each curve in Figure 4shows, for a single position perturbation Y, the meanpercentage of group movement responses as a function of lSI. As can be seen in Figure 4, the larger theposition perturbation, the greater was the percentageof group movement responses. The curve for eachlarger perturbation Y lies above the curve for a smallerperturbation. At long ISis, the change in group movement responses was small because a "ceiling" of100010 group movement responses was approachedfor all degrees of perturbation. A repeated measuresanalysis of variance of the percentage of group movement responses verified the significant main effect ofposition perturbation (magnitude of Y) [F(3,15)= 34.4,p < .0001]. The main effect of lSI, namely that moregroup movement was seen with longer ISis, was alsosignificant [F(4,20)=46.3, p < .0001].
100 ,..--- --.I
I90 ,
II
80,
rn,
'"I
rn Iz ·70 I0 4Q. Irn I
'" 60 Ia:I
I.... - 50 IZ -C I
'" . Iu~ ~ I'" • 40 J>.e0 J~
I30 I
IQ. I::l 20 I0 III:: I
~ I
10I
0 17 33 50 67
INTERSTIMULUS INTERVAL (mile)
Figure 5. Percentage of group movement responses as a function of the duration of the interstimulus interval with perturbation magnitude of the end line as a parameter. Perturbation(Z)of 0 min (control data), • s; and 40 min, as.
Position perturbation of end line. In order todetermine whether (1) the changes of spatial periodicity concomitant with the perturbations of the positions of the overlapping lines or (2) a perturbation ofthe position of the end line (F in Figure 1) woulddecrease the percentage of element movement sensations, another display was constructed from the twoframes shown in Figure 2e. The end-line perturbation display was like that used in the control condition (where the interelement spacing was 1 deg), except that the position of the end line was perturbedby making its distance from E 1 deg 40 min insteadof 1 deg. The results obtained with the end-line perturbation display are given in Figure 5 along withthose of the control condition. The control (dashed)and end-line perturbation (solid) curves are nearlyalike. This means that the effect of introducing anaperiodicity or a change in the position of one ofthe end lines of one of the display frames was minimal. If anything, the end-line perturbation curve islower than the control curve, not higher.
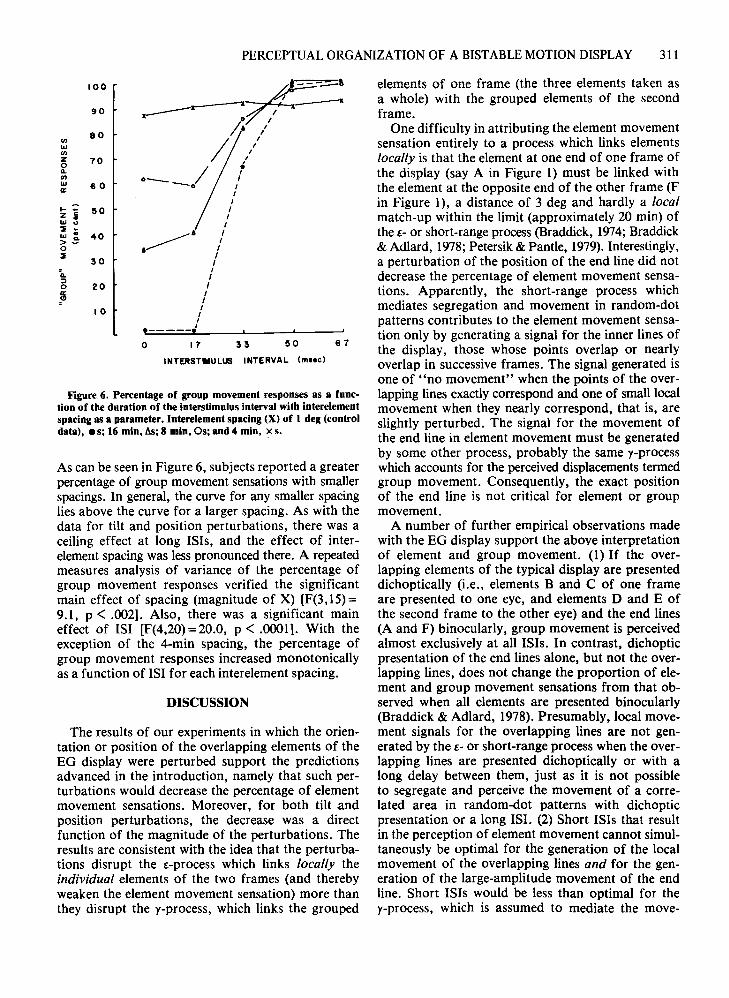
Interelement spacing. Figure 2A is a schematicrepresentation of two stimulus frames with an interelement spacing X. In the present subexperiment, thecomputer was programmed so that, on differenttrials, the interelement spacing X could be I deg(control condition), or 4, 8, or 16 min of visual angle.Displays with the control and three experimentalspacings were used with each of five values of lSI(0, 17,33, 50, and 67 msec). Each curve in Figure 6shows, for a single spacing X, the mean percentageof group movement responses as a function of lSI.
6 7503317
INTERSTIMULUS INTERVAL (maee)
o
PERCEPTUAL ORGANIZATION OF A BISTABLE MOTION DISPLAY 311
100 ~--'90
____X-"""""'"It l------I
80 Ii' /en ;: ,III
,en ,Z 70
,0
'- /~... I
en IIII 60 -, Ia: I
..... :: I
z " llO I• I
III u I:li! ~III • 40 .>: I>.e I0 I:li!
30II
Q. I
:> f0 20 fa: I~ I
10 III, I,
0 11 33 llO 61
INTERSTIMULUS INTERVAL (ml.e)
Figure 6. Percentage of group movement responses as a function of the duration of the interstimulus interval with interelementspacing as a parameter. Interelement spacing (X) of 1 deg (controldata), • s; 16 min, As;8 min, Os; and 4 min, x s.
As can be seen in Figure 6, subjects reported a greaterpercentage of group movement sensations with smallerspacings. In general, the curve for any smaller spacinglies above the curve for a larger spacing. As with thedata for tilt and position perturbations, there was aceiling effect at long ISis, and the effect of interelement spacing was less pronounced there. A repeatedmeasures analysis of variance of the percentage ofgroup movement responses verified the significantmain effect of spacing (magnitude of X) [F(3,15)=9.1, p < .002]. Also, there was a significant maineffect of lSI [F(4,20) = 20.0, p < .00011. With theexception of the 4-min spacing, the percentage ofgroup movement responses increased monotonicallyas a function of lSI for each interelement spacing.
DISCUSSION
The results of our experiments in which the orientation or position of the overlapping elements of theEG display were perturbed support the predictionsadvanced in the introduction, namely that such perturbations would decrease the percentage of elementmovement sensations. Moreover, for both tilt andposition perturbations, the decrease was a directfunction of the magnitude of the perturbations. Theresults are consistent with the idea that the perturbations disrupt the s-process which links locally theindividual elements of the two frames (and therebyweaken the element movement sensation) more thanthey disrupt the y-process, which links the grouped
elements of one frame (the three elements taken asa whole) with the grouped elements of the secondframe.
One difficulty in attributing the element movementsensation entirely to a process which links elementslocally is that the element at one end of one frame ofthe display (say A in Figure 1) must be linked withthe element at the opposite end of the other frame (Fin Figure I), a distance of 3 deg and hardly a localmatch-up within the limit (approximately 20 min) ofthe £- or short-range process (Braddick, 1974; Braddick& Adlard, 1978; Petersik & Pantle, 1979). Interestingly,a perturbation of the position of the end line did notdecrease the percentage of element movement sensations. Apparently, the short-range process whichmediates segregation and movement in random-dotpatterns contributes to the element movement sensation only by generating a signal for the inner lines ofthe display, those whose points overlap or nearlyoverlap in successive frames. The signal generated isone of "no movement" when the points of the overlapping lines exactly correspond and one of small localmovement when they nearly correspond, that is, areslightly perturbed. The signal for the movement ofthe end line in element movement must be generatedby some other process, probably the same y-processwhich accounts for the perceived displacements termedgroup movement. Consequently, the exact positionof the end line is not critical for element or groupmovement.
A number of further empirical observations madewith the EG display support the above interpretationof element and group movement. (1) If the overlapping elements of the typical display are presenteddichoptically (i.e., elements Band C of one frameare presented to one eye, and elements D and E ofthe second frame to the other eye) and the end lines(A and F) binocularly, group movement is perceivedalmost exclusively at all ISIs. In contrast, dichopticpresentation of the end lines alone, but not the overlapping lines, does not change the proportion of element and group movement sensations from that observed when all elements are presented binocularly(Braddick & Adlard, 1978). Presumably, local movement signals for the overlapping lines are not generated by the e- or short-range process when the overlapping lines are presented dichoptically or with along delay between them, just as it is not possibleto segregate and perceive the movement of a correlated area in random-dot patterns with dichopticpresentation or a long lSI. (2) Short ISis that resultin the perception of element movement cannot simultaneously be optimal for the generation of the localmovement of the overlapping lines and for the generation of the large-amplitude movement of the endline. Short ISis would be less than optimal for they-process, which is assumed to mediate the move-
312 PANTLE AND PETERSIK
ment of the end line. Interestingly, when the displayduration is extended beyond the few seconds used fora trial in our experiments, the movement of the endline in the case of element movement disappears oradapts within 10 sec, and the end line appears to justflash on and off in place at either end of the display.At the same time, local movement for any slightlyperturbed overlapping line persists. (3) It seems safeto conclude that the process (s-process) that codes thelocal movement of the overlapping lines of the display is highly sensitive to spatial detail and position.The movement of the end line in the case of elementmovement appears to be coded by some other processakin to that which produces group movement. During group movement, the perceptual organization ofthe entire display is governed by a process (y-process)which is less sensitive to spatial detail and position,in the sense that it can tolerate small changes in thespatial structure of a stimulus that it treats as a unit,"
The effects of the manipulation of interelementspacing in our experiments remain to be explained.As the interelement spacing was decreased, observersreported a smaller percentage of element movementsensations. This result would be expected under ourhypotheses because local pairings of all three elements in successive frames, rather than just the twooverlappingelements, can be achieved by the s-processas the interelement spacing is reduced below 20 min.The important point to keep in mind is that what theobserver calls group movement with short ISIs and asmall interelement spacing may be mediated by aprocess (the s-process) which is different from theone (the y-process) responsible for what the observercalls group movement at long ISIs with either a smallor large interelement spacing.
REFERENCES
ANSTIS, S. Phi movement as a substitution process. VisionResearch, 1970, 10, 1411-1430.
ANSTIS, S. M. Apparent movement. In R. Held, H. W. Leibowitz,& H.-L. Teuber (Eds.), Handbook of sensory physiology(Vol. VIII). Perception. Berlin: Springer-Verlag, 1978.
ATTNEAVE, F. Multistability in perception. Scientific American,1971,225,62-71.
BELL, H., & LAPPIN, J. Sufficient conditions for the discrimination of motion. Perception & Psychophysics, 1973, 14,45-50.
BELL,H., & LAPPIN, J. The detection of rotation in random-dotpatterns. Perception & Psychophysics, 1979,26,415-417.
BRADDlCK, O. The masking of apparent motion in random-dotpatterns. Vision Research, 1973, 13, 355-369.
BRADDlCK, O. A short-range process in apparent motion. VisionResearch, 1974,14,519-527.
BRADDICK, 0., & ADLARD, A. Apparent motion and the motiondetector. In J. Armington, J. Krauskopf, & B. Wooten (Eds.),
Visual psychophysics ar.d physiology. New York: AcademicPress, 19~8.
JULESZ, B. Foundations of cyclopean perception. Chicago: University of Chicago Press, 1971.
PANTLE, A. Stroboscopic movement based upon global information in successively presented visual patterns. Journal of theOptical Society ofAmerica 1973,63, 1280A.
PANTLE, A., & PICCIANO, L A multistable movement display:Evidence for two separate motion systems in human vision.Science, 1976,193,500-502.
PETERSIK, J. T., & PANTL>:, A. Factors controlling the competingsensations produced by a bistable stroboscopic motion display.Vision Research, 1979,19,143-154.
RAMACHANDRAN, V., MADHUSUDHAN RAO, V., & VIDYASAGAR,T. Apparent movement with subjective contours. VisionResearch, 1973, 13, 139Y-I401.
TERNus, J. The problem of phenomenal identity. In W. D. Ellis(Ed.), A source book ofGestalt psychology. London: Routledge& Kegan Paul, 1938.
NOTES
I. There is some disagreement between Bell and Lappin (1973,1979) and Braddick (1974} as to whether the spatial displacementlimit of the short-range process should be stated in terms of visualangle at the retina or in terms of spacing between elements withina pattern. It may be significant that the particular elements thatwere displaced and the dependent measures employed by Braddickwere not the same a" those of Bell and Lappin. Our choice ofvalues for our independent variables reveals our prejudice for aretinal angle limit, and the results support the predictions.
2. For nonzero tilt conditicns in this experiment and for nonzero position perturbation conditions (of the "overlapping" lines)in Experiment 2, the subjects readily perceived the local movements (local rotations in Experiment I and local lateral shifts inExperiment 2) of the "overlapping" lines in the case of elementmovement. While the "overlapping" lines appeared to move locally, the third line was seen to move from one end of the displayto the other across the local movement paths of the' 'overlapping"lines. During group movement, the change in the spatial arrangement of the group of three lines from one frame to the next for anonzero perturbation condition easily went unnoticed unless a subject scrutinized the display sequence for such a change.
3. One final note on the evolution of our thinking about theprocesses which determine the alternate perceptual organizationsof the EO display seems to be in order. From the beginning, wepostulated two separate processes as underlying the competingsensations elicited by the EO display in much the same vein asAttneave (1971) proposed mutual inhibition between neural mechanisms as the basis of multistable phenomena. Oiven that theassumption of two processes was correct, we set about the task ofidentifying our named processes (f- and yo) with hypothetical motion processes already suggested in the literature. The goal of theidentification task was to avoid any unnecessary proliferation ofhypothetical processes in the literature. Anstis' (1978) theoreticalanalysis of experiments on motion perception is much like ourown. In the present paper we suggest that the e-process which weidentified with a short-range process in our previous papers onlycompetes with the y-process via its generation of local movementsignals for the overlapping elements of the EO display.
(Received for publication July 9, 1979;revision accepted January 7,1980.)
Related Documents


![Bistable [2]Rotaxane Based Molecular Electronics ...thesis.library.caltech.edu/2030/10/Choi_Jang_Wook_2007.pdf · Bistable [2]Rotaxane Based Molecular Electronics: Fundamentals and](https://static.cupdf.com/doc/110x72/5ec39875f0c68315cb72de5b/bistable-2rotaxane-based-molecular-electronics-bistable-2rotaxane-based.jpg)