EFFECTS OF SOIL PROPERTIES ON CORROSION OF OIL PIPELINE AT NORTH OF IRAQ A THESIS SUBMITTED TO THE GRADUATE SCHOOL OF APPLIED SCIENCES OF NEAR EAST UNIVERSITY BY HAWKAR JALAL MUHAMMED In Partial Fulfillment of the Requirements for the Degree of Master of Science in Mechanical Engineering NICOSIA, 2016

Welcome message from author
This document is posted to help you gain knowledge. Please leave a comment to let me know what you think about it! Share it to your friends and learn new things together.
Transcript
EFFECTS OF SOIL PROPERTIES ON CORROSION OF
OIL PIPELINE AT NORTH OF IRAQ
A THESIS SUBMITTED TO THE GRADUATE
SCHOOL OF APPLIED SCIENCES
OF
NEAR EAST UNIVERSITY
BY
HAWKAR JALAL MUHAMMED
In Partial Fulfillment of the Requirements for
the Degree of Master of Science
in
Mechanical Engineering
NICOSIA, 2016

I hereby declare that all information in this document has been obtained and presented in
accordance with academic rules and ethical conduct. I also declare that, as required by these
rules and conduct, I have fully cited and referenced all material and results that are not original
to this work.
Name, Last name: Hawkar J. Muhammed
Signature:
Date: 15-1-2016

i
ACKNOWLEDGEMENTS
This thesis would not have been possible without the help, support and patience of my
supervisor Prof. Dr. Mahmut A. Savaş and co-supervisior Assist. Prof. Dr. Ali Evcil
without their constant encouragement and guidance. They have helped me through all
stages of the writing of my thesis. Without their consistent and illuminating instructions,
this thesis could not have reached its present form.
Above all, my unlimited thanks and heartfelt love would be dedicated to my dearest family
for their great confidence in me. I’m greatly indebted to my mother who was indeed my
inspiration and she led me to the treasures of knowledge. I would like to thank her for
giving me support, encouragement and her endless love have sustained me throughout my
life. I want to thank my dear father who has been the source of all the inspiration in the
adventures of my life.
Eventually, there is a long list of friends that I would like to thank. I can’t mention them
all; nevertheless, I would like to thank them for their valuable help and support.

ii
To my parents…
iii
ABSTRACT
An investigation was carried out on the effects of some soil properties on the corrosion
reaction of API X70 pipeline steel that is used in buried oil pipelines from Iraq to Turkey.
Experiments were performed on eight samples of soil collected from the actual site of the
underground crude oil pipeline along 80 km between Taq-Taq and Khurmala region of
North of Iraq. Coupons of API X70 steel were buried in each soil sample to inspect at the
effects of the content of moisture (ASTM D4643-08), clay-content (ASTM D422-63) and
pH (BS 1377-3:1990) on the corrosivity of API X70 steel.
The results showed that the content of moisture of the soil had the largest effect on
corrosivity followed by clay content and pH.
Statistical analyses using ANOVA (Analysis of Variance) and MLR (Multiple Linear
Regression) were consistent with the observation.
Keywords: ANOVA; corrosion; linear regression; moisture; pH; pipeline; statistical
analysis; soil texture
iv
ÖZET
Bu çalışmada Irak – Türkiye petrol boru hattında kullanılan çelik boruların paslanmasında
bazı zemin etkileri incelenmiştir. Kuzey Irak’ da Taq-Taq ve Khurmala bölgeleri arasında
toprağa gömülü yaklaşık 80 km uzunluktaki petrol boru hattı boyunca zemin numuneleri
toplanmıştır. Sekiz farklı alandan (ASTMD D 4220-95) standardına göre alınan ve
muhafaza edilen zemin numunelerinin petrol boru hattı çeliklerinden API X70 çeliği
üzerindeki korozyon etkileri araştırılmıştır. Zemin su içeriği (ASTM D 4643-08), kil
yüzdesi (ASTM D 42263) ve pH (BS–1377–3: 1990) değerlerinin korozyonu ne derecede
etkiledikleri tespit edilmiştir.
Bu testler sonunda, çelik numunelerin paslanmasını en fazla sırası ile zemin su içeriği, kil
yüzdesi ve pH değerinin etkilediği görülmüştür.
ANOVA (Analysis of Variance) ve MLR (Multiple Linear Regression) yöntemleri ile
yapılan istatistiksel analizler test bulguları ile uyumlu sonuçlar vermiştir.
Anahtar kelimeler: ANOVA; boru hattı; istatistiksel analiz; lineer regrasyon; paslanma;
pH değeri; zemin dolgusu; zemin su içeriği

v
TABLE OF CONTENTS
ACKNOWLEDGEMENTS ................................................................................................. i
ABSTRACT ........................................................................................................................ iii
ÖZET ................................................................................................................................... iv
TABLE OF CONTENTS .................................................................................................... v
LIST OF TABLES ............................................................................................................ viii
LIST OF FIGURES ............................................................................................................ ix
LIST OF EQUATIONS ...................................................................................................... x
LIST OF SYMBOLS .......................................................................................................... xi
LIST OF APPREVATIONS ............................................................................................. xii
CHAPTER 1 INTRODUCTION
1.1 Statement of the Problem ......................................................................................................... 1
1.2 The Aim of the Thesis .............................................................................................................. 2
1.3 Limitations of the Study ........................................................................................................... 2
1.4 Overview of the Thesis ............................................................................................................ 2
CHAPTER 2 PREVIOUS WORK
2.1 Soil Characteristics and Pipeline Corrosion ............................................................................. 4
2.2 Corrosion Modeling and Statistical Analysis ........................................................................... 6
CHAPTER 3 LITERATURE REVIEW
3.1 Corrosion .................................................................................................................................. 8
3.1.1 Anode ................................................................................................................................ 8
3.1.2 Cathode ............................................................................................................................. 8
3.1.3 Electrolyte ......................................................................................................................... 8
3.1.4 Metallic Path ..................................................................................................................... 8
3.2 Corrosion Damage Forms ........................................................................................................ 9
3.2.1 General corrosion ............................................................................................................ 10
3.2.2 Pitting .............................................................................................................................. 10
3.2.3 Selective leaching ............................................................................................................ 10
3.2.4 Intergranular corrosion .................................................................................................... 11
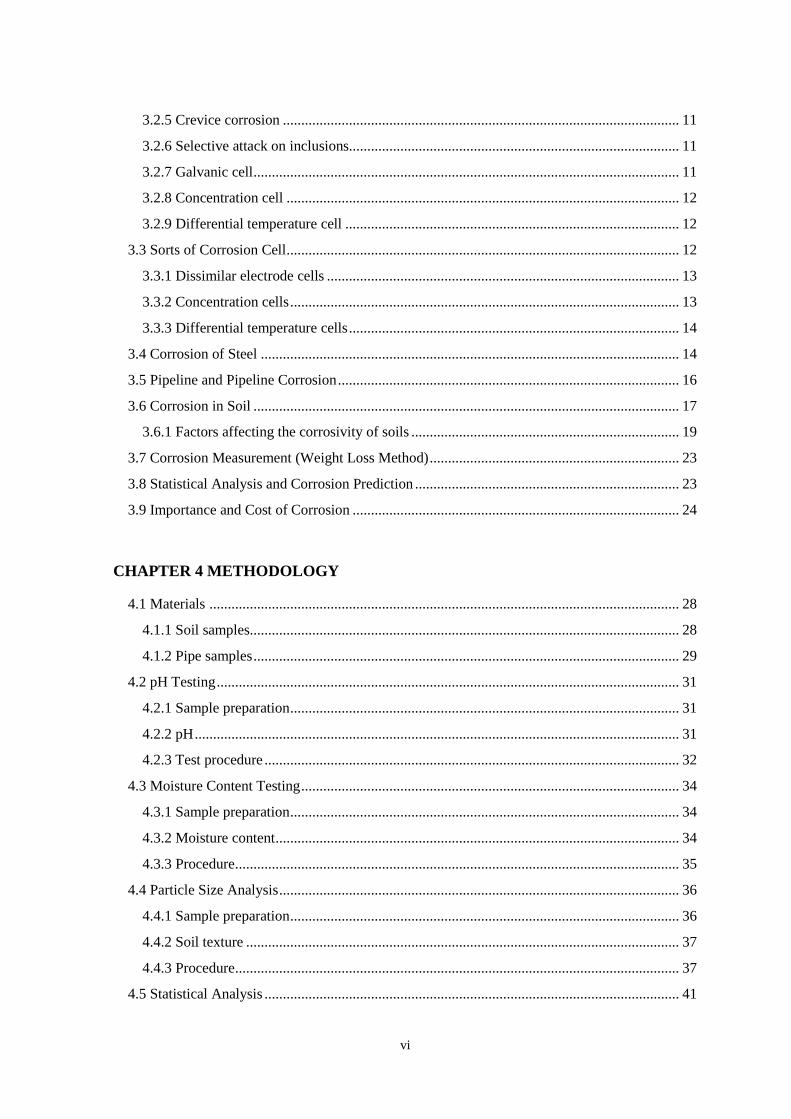
vi
3.2.5 Crevice corrosion ............................................................................................................ 11
3.2.6 Selective attack on inclusions.......................................................................................... 11
3.2.7 Galvanic cell .................................................................................................................... 11
3.2.8 Concentration cell ........................................................................................................... 12
3.2.9 Differential temperature cell ........................................................................................... 12
3.3 Sorts of Corrosion Cell ........................................................................................................... 12
3.3.1 Dissimilar electrode cells ................................................................................................ 13
3.3.2 Concentration cells .......................................................................................................... 13
3.3.3 Differential temperature cells .......................................................................................... 14
3.4 Corrosion of Steel .................................................................................................................. 14
3.5 Pipeline and Pipeline Corrosion ............................................................................................. 16
3.6 Corrosion in Soil .................................................................................................................... 17
3.6.1 Factors affecting the corrosivity of soils ......................................................................... 19
3.7 Corrosion Measurement (Weight Loss Method) .................................................................... 23
3.8 Statistical Analysis and Corrosion Prediction ........................................................................ 23
3.9 Importance and Cost of Corrosion ......................................................................................... 24
CHAPTER 4 METHODOLOGY
4.1 Materials ................................................................................................................................ 28
4.1.1 Soil samples..................................................................................................................... 28
4.1.2 Pipe samples .................................................................................................................... 29
4.2 pH Testing .............................................................................................................................. 31
4.2.1 Sample preparation .......................................................................................................... 31
4.2.2 pH .................................................................................................................................... 31
4.2.3 Test procedure ................................................................................................................. 32
4.3 Moisture Content Testing ....................................................................................................... 34
4.3.1 Sample preparation .......................................................................................................... 34
4.3.2 Moisture content .............................................................................................................. 34
4.3.3 Procedure ......................................................................................................................... 35
4.4 Particle Size Analysis ............................................................................................................. 36
4.4.1 Sample preparation .......................................................................................................... 36
4.4.2 Soil texture ...................................................................................................................... 37
4.4.3 Procedure ......................................................................................................................... 37
4.5 Statistical Analysis ................................................................................................................. 41

vii
CHAPTER 5 RESULTS AND DISSCUSION
5.1 pH Test ................................................................................................................................... 43
5.2 Moisture Test ......................................................................................................................... 44
5.3 Particle Size Analysis ............................................................................................................. 46
5.4 Corrosion Rate ....................................................................................................................... 47
5.5 Statistical Analysis ................................................................................................................. 48
CHAPTER 6 CONCLUSIONS AND FUTURE WORK
6.1 Conclusions ............................................................................................................................ 51
6.2 Future Work ........................................................................................................................... 52
REFERENCES .................................................................................................................. 53
APPENDIES ...................................................................................................................... 57
Appendix 1: (BS 1377-3:1990) British standard ......................................................................... 58
Appendix 2: (ASTM D4643-08) American Society for Testing and Material ........................... 60
Appendix 3: (ASTM D422-63) American Society for Testing and Material ............................. 61
Appendix 4: (ASTM D4220-95) American Society for Testing Material .................................. 62
Appendix 5: (ASTM G1-90) American Society for Testing Material ........................................ 63
Appendix 6: (ASTM G16-13) American Society for Testing Material ...................................... 64
Appendix 7: (ASTM G31-72) American Society for Testing and Material ............................... 65
Appendix 8: (ASTM G162-99) American Society for Testing and Material ............................. 66
Appendix 9: (API 5L American Petroleum Institute) ................................................................. 67
Appendix 10: Composite Correction ........................................................................................... 69

viii
LIST OF TABLES
Table 4.1: Mechanical and chemical properties of API 5L X70. ....................................... 31
Table 4.2: Relative acidity pH of soil and corrosivity of soil ............................................. 32
Table 4.3: Test specimen masses ........................................................................................ 34
Table 4.4: Maximum particles size with the amount of soil portion .................................. 36
Table 4.5: Particle size in a soil texture .............................................................................. 37
Table 5.1: pH test results .................................................................................................... 43
Table 5.2: Mass of samples before and after drying ........................................................... 44
Table 5.3: Soil samples and their moisture contents .......................................................... 45
Table 5.4: Texture data for soil samples ............................................................................. 46
Table 5.5: Corrosion rate calculation.................................................................................. 47
Table 5.6: Model summary ................................................................................................. 48
Table 5.7: Analysis of variance ANOVA ........................................................................... 48
Table 5.8: Coefficient of regression ................................................................................... 48

ix
LIST OF FIGURES
Figure 3.1: Corrosion phenomenon in action ....................................................................... 9
Figure 3.2: Corrosion cell phenomenon in action .............................................................. 12
Figure 3.3: Dry cell............................................................................................................. 13
Figure 3.4: Concentration cell ............................................................................................ 14
Figure 3.5: Concentration cell formation in an underground pipeline ............................... 15
Figure 3.6: Formation of rust in seawater .......................................................................... 16
Figure 3.7: Corrosion mechanism of soil for buried pipe .................................................. 19
Figure 3.8: Corrosion produce in disturbed soil vs. undisturbed soil, the direction of
positive current represented by arrow .............................................................. 20
Figure 3.9: Different moisture capacities as function of sand content ............................... 21
Figure 4.1: Soil samples ..................................................................................................... 28
Figure 4.2: Oil and gas pipeline map in North of Iraq ....................................................... 29
Figure 4.3: Coupon samples dimensions ............................................................................ 30
Figure 4.4: Sample preparation .......................................................................................... 31
Figure 4.5: A&B GR 120 analytical balance...................................................................... 33
Figure 4.6: (100 mL) beaker with 30g soil and 70mL distilled water ................................ 33
Figure 4.7: Calibration of pH meter with standard buffer solution .................................... 33
Figure 4.8: H30140E laboratory bench oven, digital series, HUMBOLDT ...................... 35
Figure 4.9: Composite correction slurry ............................................................................. 38
Figure 4.10: Dispersing soil mixer machine ...................................................................... 39
Figure 4.11: Sedimentation 1000 mL cylinder with distilled water and soil slurry ........... 40
Figure 4.12: Hydrometer forms include time interval and recording (temperature,
hydrometer, and composite correction) with stop watch ................................ 40
Figure 5.1: pH test .............................................................................................................. 43
Figure 5.2: Effect of moisture content on soil corrosivity.................................................. 46

x
LIST OF EQUATIONS
Equation 3.1: White green precipitate................................................................................ 15
Equation 3.2: Hydrogen Ion expressed as pH .................................................................... 22
Equation 3.3: Half-cell reaction of hydrogen .................................................................... 22
Equation 3.4: pH of pure water .......................................................................................... 22
Equation 4.1: Corrosion rate equation ............................................................................... 30
Equation 4.2: Moisture contents in Soil ............................................................................. 36
Equation 4.3: Hygroscopic moisture .................................................................................. 39
Equation 4.4: Rate of soil in suspension ............................................................................ 41
Equation 4.5: Diameter of particle ..................................................................................... 41
Equation 4.6: Effective depth............................................................................................. 41
Equation 4.7: Multiple regression equation ....................................................................... 42
xi
LIST OF SYMBOLS
a: Correction faction to be applied to the reading of hydrometer 152H
A: Cross-sectional area of sedimentation cylinder
b1,b2,bn: Coefficient of the variables
C: Hygroscopic moisture
CR Corrosion rate
D: Diameter of particle
K: Constant depending on the temperature of the suspension and the
specific gravity of the soil particles
L: Effective depth
L1:
Distance along the stem of the hydrometer from the top of the bulb to
the mark for a hydrometer reading
L2: Overall length of the hydrometer bulb
M1: Mass of container and moist specimen
M2: Mass of container and oven dried specimen
MAir-Dry: Mass of air dry
MC: Mass of container
MOven-Dry: Mass of oven dry
MS: Mass of solid particles
MW: Mass of water
P:
Percentage of soil remaining in suspension at the level at which the
hydrometer measures the density of the suspension
R: Hydrometer reading with composite correction applied
T:
Interval of time from beginning of sedimentation to the taking of the
reading
VB: Volume of hydrometer bulb
W:
Oven-dry mass of soil in a total test sample represented by mass of soil
dispersed
X1,X2,Xn: Independent variables
Y: Dependent variable

xii
LIST OF APPREVATIONS
API: American Petroleum Institute
ANOVA: Analysis of Variance
ASTM: American Standard for Testing and Material
BS: British Standard
MLR: Multiple Linear Regression
1
CHAPTER 1
INTRODUCTION
The corrosion defined as surface degradation of metals, or its properties on account of their
response with its environment. The principle of corrosion must be comprehended so as to
adequately select materials and to design, create, and use metal structures for the ideal
financial existence of facilities and security in operation. The serious outcomes of the
corrosion procedure have turned into a reasons of shutdown of plants, misuse of worthy
resources, misfortune or defilement of item, decrease in proficiency, immoderate support,
and costly over layout. Corrosion control is accomplished by using so as to perceive and
understanding erosion components, consumption safe materials and design, and by
utilizing defensive frameworks, device and treatments.
Corrosion is a slow process. Hence it requires time to see its negative results. Actually,
corrosion is the main consideration in deciding the investment and production costs in the
industry. Some estimation revealed, the expense of corrosion to a country compasses to
(3.5-5) % of the gross national product. With respect to Turkey, there are estimations
guaranteeing this value is not less than 4.5 %. Oil and gas pipelines in the North of Iraq are a
modern phenomenon, and currently there is no study on the evaluation of the cost for the
maintenance and protection against corrosion. The estimation of cost against corrosion in the
future may ranges between (0.5-1.5) % of gross domestic product.
Graphite-containing oil is extremely normal grease on the grounds that graphite is
promptly accessible from steel industries, with a content of molybdenum disulphide more
costly, and the graphite grease which is well known to be the cause of galvanically
induced-corrosion in bimetallic couples. This case creates problems in (F16) aircraft
fighter (Roberge, 1999).
1.1 Statement of the Problem
The corrosion of underground pipeline cause degradation of the pipe, with time the
degradation will cause a failure to the pipes, means loss of economic, causing a catastrophe
in the humanity. To avoid this, the parameters that affect the loss of pipe metals among

2
these parameters the influence of soil properties has been chosen as case study to treat the
underground pipeline.
1.2 The Aim of the Thesis
The point of this research is based after knowing the natural condition that encompass
covered or incompletely covered pipeline or structures, I have taken the soil properties that
have an enormous impact on the corrosion rate of the pipeline or structures, as a sample to
develop the security framework with thought to these properties in North of Iraq.
1.3 Limitations of the Study
The absence of the following:
Non-use periods of time to retrieve the steel coupons to know the corrosion rate
against time.
Non-use of the original site for the best results.
The absence of test in the various seasons of the year to see the effect of climate
change on corrosion rate.
1.4 Overview of the Thesis
The thesis consists of an investigation of soil properties between Taq-Taq and Khurmala
far away from Kirkuk city about 60 km, 85 km of the southeast city of Erbil and 120 km of
the northwest city of Sulaymaniyah in North of Iraq to analyze the corrosivity of soil
towards the concealed pipeline through six chapters. Chapter one consists of an
introduction of the thesis with the aim, importance, and the limitation of the study. Chapter
two is a brief summary of the studies those done on the parameters that affect the corrosion
rate of buried pipelines or structure which were based on the experimental analysis.
Chapter three summarizes the theory of the study. In chapter four described the materials
and the methodology that have used in the investigation. Chapter five represented the
results that were obtained from inspection of the soil samples and statistical analysis.

3
Chapter six in this chapter concluded the influence by far of soil properties on the buried
pipeline steel coupon.

4
CHAPTER 2
PREVIOUS WORK
2.1 Soil Characteristics and Pipeline Corrosion
Bhattarai, (2013) investigated the soil parameters such as moisture content, pH, resistivity,
oxidation-reduction potential, chloride and sulfate contents those have an influence on the
corrosive nature of soils toward the buried galvanized steel and cast iron pipelines used to
supply the drinking water in Kathmandu Valley. He discovered that the twenty three soil
samples taken from the study area were mildly corrosive to non corrosive nature toward
the buried pipeline.
Ikechukwu et al. (2014) examined the relationship of soil properties towards metal loss of
API 5L X42 carbon steel coupons. An aggregate of four specimen of X42 coupons were
set in four distinctive soil tests taken from four unique states inside of the Niger Delta
district for 2352 hours, to consider the impact of soil properties towards metal loss by
means of weight loss method. The soil coupons were covered in the soil samples put in a
plastic bag, permitted to corrode normally and afterwards recovered at regular intervals.
The impact of soil pH and resistivity were assessed utilizing the weight loss method to
assess the consumption rate on coupons in the diverse soil tests. Results demonstrated that
both parameters had an impact on covered steel yet soil resistivity had a commanding
impact contrasted with soil pH.
Kleiner et al. (2010) portrays research that tries to pick up an intensive comprehension of
the geometry of outer corrosion pits and the elements (e.g., soil properties, appurtenances,
service associations, and so forth) that impact this geometry. This comprehension would
prompt a definitive goal of accomplishing a superior capacity to survey the remaining
existence of ductile iron pipe for a given set of circumstances. Fluctuating lengths of
ductile iron pipes were unearthed by a few North American and Australian water utilities.
The uncovered pipes were cut into segments, sandblasted and labeled. Soil samples
separated along the unearthed pipes were additionally given. Funnel portions were
checked, utilizing a uniquely created laser scanner examined information was prepared
utilizing extraordinarily created programming. Measurable investigations were performed
on three geometrical properties, to be specific pit profundity, pit region and pit volume.
5
Different soil qualities were explored for their effect on the geometric properties of the
corrosion pits. Preparatory discoveries showed that the information does not generally
supports customary traditions.
Yahaya et al. (2011) outlined a technique of the outside development demonstrating of
corrosion on covered gas pipelines under different exposures to soil conditions. The
method can be utilized to produce field information to demonstrate observationally the
corrosion dynamic in soil or for check of consumption information from research center
testing. The potential model taking into account the proposed system is exceedingly
potential to foresee the probability of consumption development rate experienced by
covered lines presented to destructive environment. As a result, it can significantly help
administrator to secure the trustworthiness of their pipelines until the structure achieves its
outlined lifetime.
Lim et al. (2011) evaluated the soil engineering parameters which are moisture and clay
contents on corrosion rate of X70 pipeline type. Total number of test specimen of X70
carbon steel pipe coupon were set underground in five different sites in Peninsular
Malaysia for 12 months were retrieved every three months to determine the weight loss
and corrosion rate as a function of time. They discovered that the highly corrosion growth
approximately relate with high moisture content of soil while a slow corrosion growth
begin with clayey soil content. The moisture content was more effective to cause X70
carbon steel pipe corrode than clay content.
Sulaiman et al. (2014) examined the corrosion parameters utilizing the Potentiodynamic
polarization bends. So as to focus corrosion parameters of potential and current thickness
of the intriguing metal, carbon steel and ecological states of outside consumption of
covered carbon steel pipeline in Iraqi soil were readied in the research facility utilizing
reenacted arranged conditions. Arrangements of sodium chloride at diverse focuses (300,
1100, 1900, 2700, and 3500 ppm) were utilized. pH of arrangement were acidic at pH =5,
and alkaline at pH = 9. Lab conditions were like those of Iraqi soil where the pipelines
were covered. Temperature was consistent at 20 °C. Potentiodynamic polarization bends,
of potential versus log current thickness, were acquired utilizing M Lab Multi-Channel
Potentiostat Galvanostat. The carbon steel coupon (ASTM A179-84A) was utilized as the
considered metal. The after effects of this work uncover the conduct of carbon steel in

6
outside erosion conditions under Iraqi soil. The rate of corrosion of carbon steel increments
with the increment in chloride fixation in arrangement as pH changes from acidic to
alkaline medium the rate of corrosion reductions.
Pritchard et al. (2013) surveyed the UK soil towards infrastructure, has basically evaluated
the soil variables that are considered to influence soil corrosivity of which are extremely
complex, don't act in segregation are inherently connected and interrelated. The survey also
illustrated that the gas, oil, and water processes sector are most influenced by corrosion
processes with compare to the other sectors.
Saupi et al. (2015) have focused on corrosion properties that open to soil environment. In
this review, the corrosion forms as for outward appearance and changed physical
properties are uniform assault, galvanic corrosion, erosion corrosion, stress corrosion,
pitting corrosion, and between granular corrosion. Outer corrosion is corrosion assault
upon the outside of the pipe soil medium and the most failure mechanism experienced by
covered steel pipelines.
Chuka et al. (2014) conducted an experimental study on the effect of environment on
corrosion of mild steel, for a period of five weeks, the different media were supplying for
this study are: 0.1M of Hydrochloric acid, underground (soil), atmosphere, salt water, fresh
water. It was spotted that mild steel corrode in the different circumference with decreasing
concentration in the order of 0.1M of hydrochloric acid, underground (soil), atmosphere,
salt water, fresh water.
2.2 Corrosion Modeling and Statistical Analysis
Ossai, (2013) applied the Monte Carlo Simulation with degradation models in order to
estimate the corrosion growth and the reliability of oil and gas pipeline. The outcome of
the study demonstrates that the corruption models and Monte Carlo simulation can forecast
the corrosion rate of the pipelines to a precision of between 83.3-98.6% and 85.2-97%
respectively.
Norhazilan et al. (2012) investigated the relationship between three engineering soil
properties which are: moisture content, clay content, and plasticity index. Statistical

7
analysis was conveyed out to evaluate the relationship between soil properties and
corrosion rate. The investigation comprised of simple bar graph, linear regression, multiple
regression method, and Analysis of Variances (ANOVA). The site testing results
demonstrated that the moisture content as the most administration impact on corrosion rate
in light of the correlation coefficient.
Anyanwu et al. (2014) found from the ANOVA that soil resistivity had a noteworthy
commitment to corrosion response in soil. A mathematical model was created utilizing
multiple regression analysis. The outcome demonstrated that the model created was
suitable for forecast of corrosion development rate with soil pH and resistivity as the two
independent variables; since the coefficient of determination R2=0.8129 was significantly
high.

8
CHAPTER 3
LITERATURE REVIEW
3.1 Corrosion
Corrosion in general form is the destructive chemical or electrochemical reaction or loss in
material properties when the materials are to be in contact with their environment. For
corrosion to happen, the development of a corrosion cell is crucial. A corrosion cell is
basically embodied the accompanying four segments:
Anode
Cathode
Electrolyte
Metallic path
3.1.1 Anode
One of the two dissimilar metal terminals in an electrolytic cell represented as the negative
terminal of the cell. Electrons are discharged at the anode, which is the more responsive
metal. Electrons are insoluble in fluid arrangements and they just move through the wire
association into the cathode. Corrosion terminology is the inverse of electroplating
classification, where an anode is positive, the cathode is negative.
3.1.2 Cathode
One of the two terminals in an electrolytic cell represented as a positive terminal of a cell.
Decrease happens at the cathode also, electrons are expended.
3.1.3 Electrolyte
It is the electrically conductive arrangement (e.g. salt solution) that must be available for
corrosion to happen.
3.1.4 Metallic path
The two terminals are joined remotely by a metallic conduit. In the metallic conduit,
'routine " current streams from (+) to (−) which is truly electrons spilling out of (−) to (+).
9
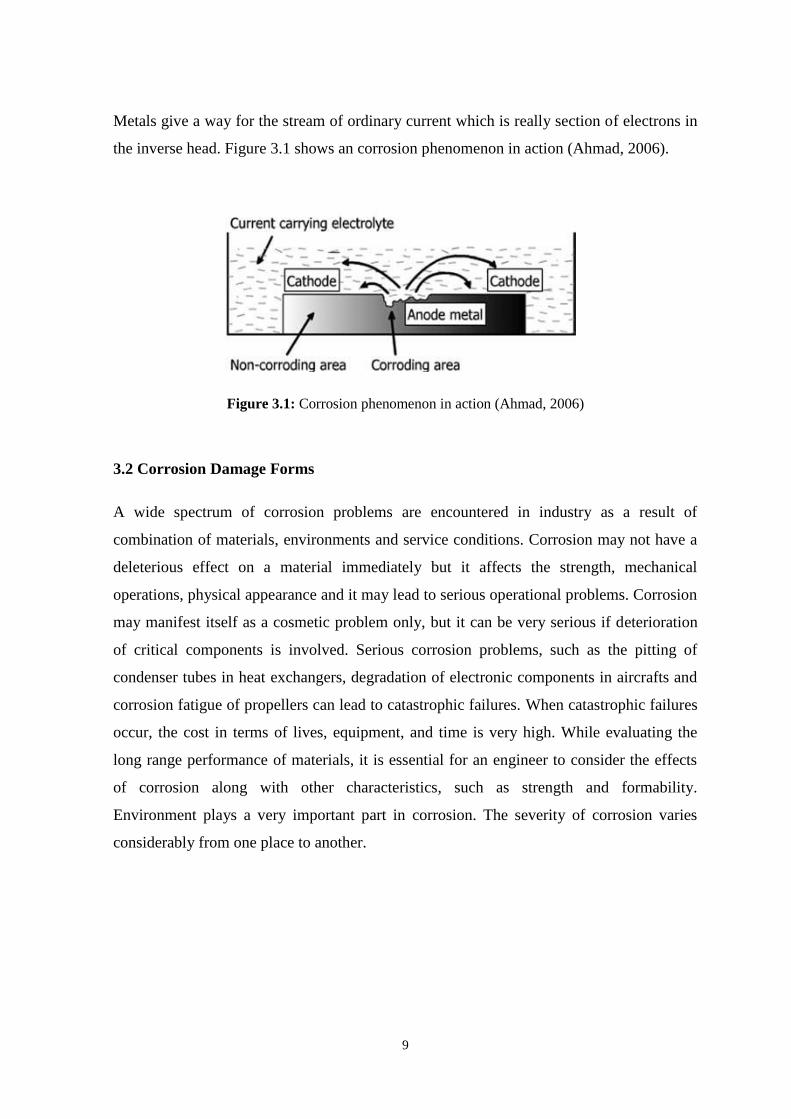
Metals give a way for the stream of ordinary current which is really section of electrons in
the inverse head. Figure 3.1 shows an corrosion phenomenon in action (Ahmad, 2006).
Figure 3.1: Corrosion phenomenon in action (Ahmad, 2006)
3.2 Corrosion Damage Forms
A wide spectrum of corrosion problems are encountered in industry as a result of
combination of materials, environments and service conditions. Corrosion may not have a
deleterious effect on a material immediately but it affects the strength, mechanical
operations, physical appearance and it may lead to serious operational problems. Corrosion
may manifest itself as a cosmetic problem only, but it can be very serious if deterioration
of critical components is involved. Serious corrosion problems, such as the pitting of
condenser tubes in heat exchangers, degradation of electronic components in aircrafts and
corrosion fatigue of propellers can lead to catastrophic failures. When catastrophic failures
occur, the cost in terms of lives, equipment, and time is very high. While evaluating the
long range performance of materials, it is essential for an engineer to consider the effects
of corrosion along with other characteristics, such as strength and formability.
Environment plays a very important part in corrosion. The severity of corrosion varies
considerably from one place to another.

10
The most corrosion sorts classified regarding outer appearance and physical features as
follows:
3.2.1 General corrosion
This is the most common form of corrosion and the most popular type, general corrosion
occurs in atmosphere, liquid and soil under normal service condition. This sort of corrosion
can appear as rusting of iron, tarnishing of silver and fogging of nickel (Revie & Uhlig,
2008). This type of corrosion will produce a rough surface and will cause loss amount of
metal which react with environment and produce adherent film coating of corrosion
product.
3.2.2 Pitting
Pitting is extremely localized corrosion, this type of corrosion is by visual examination, its
characteristic of interior walls at the point when subject into high speed fluid. The pitting
begins when one area of metal surface become anodic with respect to surrounding surface,
the combination of small anodic area and large cathodic area cause pit to form. The
outcome pits are portrayed as deep. In the event that the territory of assault is moderately
bigger and not all that deep, the pits are named shallow, iron covered in the soil consumes
with arrangement of shallow pits, while stainless steels drenched in seawater distinctively
corrode with development of deep pits.
3.2.3 Selective leaching
Also called parting, dealloying corrosion, its consist of removal of an element from alloy
by corrosion. The most common example of selective leaching is dezincification, it occurs
with zinc alloys, consist of removed of zinc from brass which is an alloy from zinc and
copper. Comparative procedures happen in other compound systems in which aluminum;
iron; cobalt; chromium and different components are removed, selective leaching is the
general concept to portray these procedures, and its utilization blocks the production of
terms, for example, dealuminumification, decobaltification, and so forth. Parting is a
metallurgical concept that is applied.

11
3.2.4 Intergranular corrosion
Its corrosion along the grain boundaries often where precipitates particles form.
Intergranular corrosion usually related to thermal processing such as welding. Certain
austenitic steel are susceptible to inter granular corrosion. The susceptibility is called
sensation, sensation it takes place when austenitic stainless steels are heated the chromium
and carbon precipitate in grain boundaries as chromium carbide.
3.2.5 Crevice corrosion
This is a localized form of corrosion, caused by the deposition of dirt, dust, mud and
deposits on a metallic surface or by the existence of voids, gaps and cavities between
adjoining surfaces. An important condition is the formation of a differential aeration cell
for crevice corrosion to occur. This phenomenon limits the use, particularly of steels, in
marine environment, chemical and petrochemical industries.
3.2.6 Selective attack on inclusions
It is a special case of selective leaching, in this type of attack the body of metal is resisting
to the environmental and only small amount of material corroded away, inclusion in the
metal provide a small anodic area surrounded by a large cathodic area.
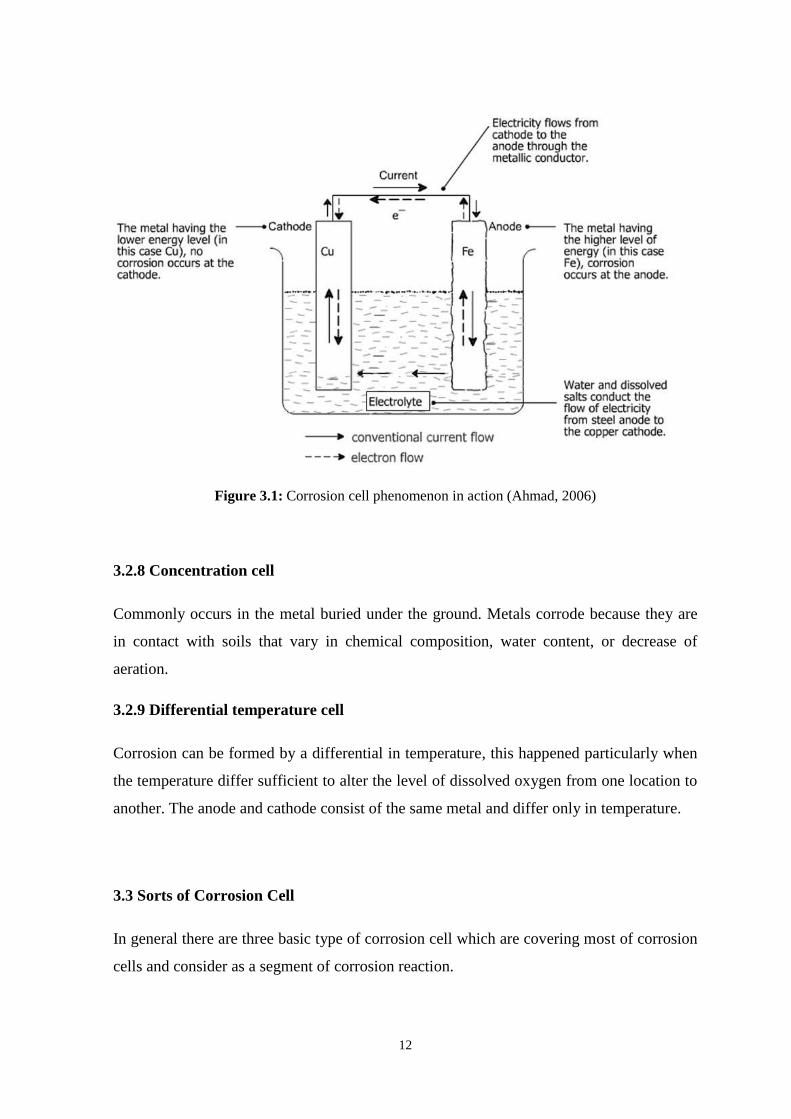
3.2.7 Galvanic cell
Dissimilar metals are physically joined in the presence of an electrolyte. The more anodic
metal corrodes. The galvanic cell may have an anode or cathode of unique metals in an
electrolyte or the same metal in unique conditions in a typical electrolyte. For instance,
steel and copper anodes drenched in an electrolyte Figure 3.2, represents to a galvanic cell.
The more honorable metal copper acts as the cathode and the more dynamic iron go about
as an anode. Current stream pass from iron anode to copper cathode in the electrolyte.
12
Figure 3.1: Corrosion cell phenomenon in action (Ahmad, 2006)
3.2.8 Concentration cell
Commonly occurs in the metal buried under the ground. Metals corrode because they are
in contact with soils that vary in chemical composition, water content, or decrease of
aeration.
3.2.9 Differential temperature cell
Corrosion can be formed by a differential in temperature, this happened particularly when
the temperature differ sufficient to alter the level of dissolved oxygen from one location to
another. The anode and cathode consist of the same metal and differ only in temperature.
3.3 Sorts of Corrosion Cell
In general there are three basic type of corrosion cell which are covering most of corrosion
cells and consider as a segment of corrosion reaction.
13
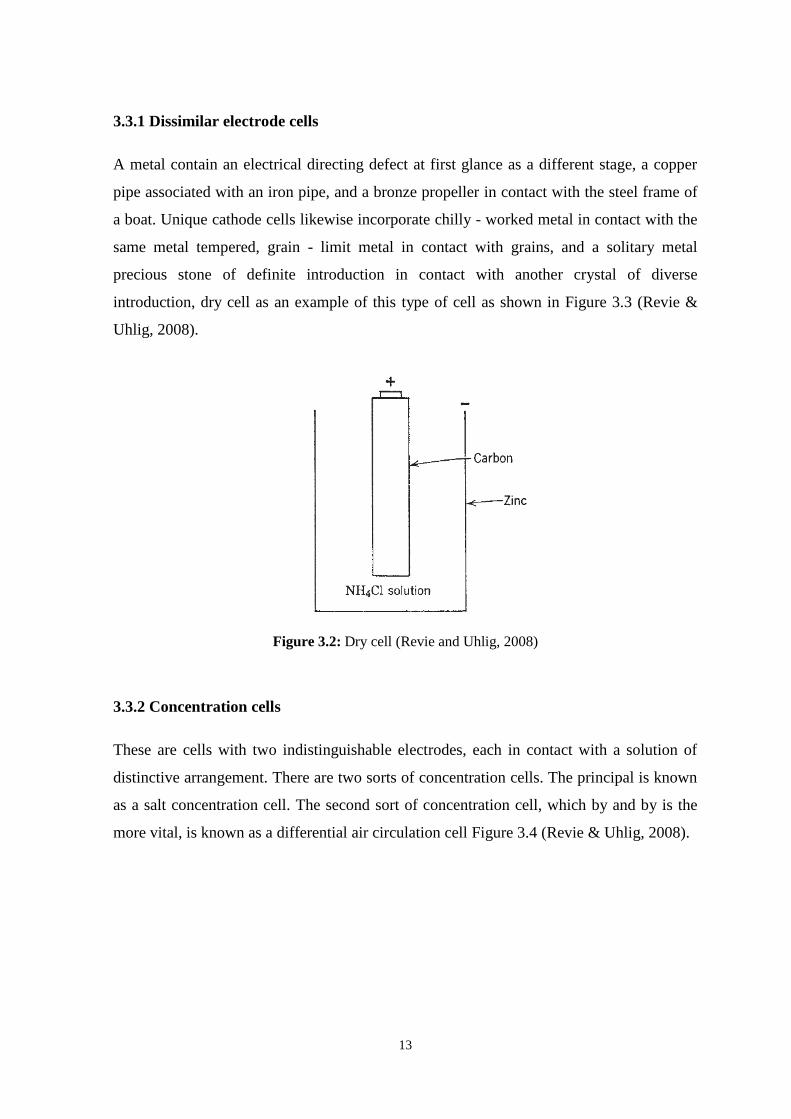
3.3.1 Dissimilar electrode cells
A metal contain an electrical directing defect at first glance as a different stage, a copper
pipe associated with an iron pipe, and a bronze propeller in contact with the steel frame of
a boat. Unique cathode cells likewise incorporate chilly - worked metal in contact with the
same metal tempered, grain - limit metal in contact with grains, and a solitary metal
precious stone of definite introduction in contact with another crystal of diverse
introduction, dry cell as an example of this type of cell as shown in Figure 3.3 (Revie &
Uhlig, 2008).
Figure 3.2: Dry cell (Revie and Uhlig, 2008)
3.3.2 Concentration cells
These are cells with two indistinguishable electrodes, each in contact with a solution of
distinctive arrangement. There are two sorts of concentration cells. The principal is known
as a salt concentration cell. The second sort of concentration cell, which by and by is the
more vital, is known as a differential air circulation cell Figure 3.4 (Revie & Uhlig, 2008).

14
Figure 3.4: Concentration cell (Revie and Uhlig, 2008)
3.3.3 Differential temperature cells
Segments of these cells are electrodes of the same metal, each of which is at an alternate
temperature, inundated in an electrolyte of the same beginning composition. These cells
are found in heat exchangers, boilers, drenching radiators, and comparable equipment.
3.4 Corrosion of Steel
On the planet today, steel is utilized as a part of different designing applications for the
creation of some vehicles segments, auxiliary shapes; I beam and angle iron and sheets that
are utilized as a part of pipelines, structures, plants, extensions and tin cans.(Callister,
1997). Corrosion is a characteristic process that lessens the coupling vitality in metals with
the deciding result including a metal being oxidized as the mass metal looses one or more
electrons. The lost electrons are led through the mass metal to another site where they are
decreased (Chuka et al. 2014).
The main impetus that makes metals corrode is a characteristic outcome of their
impermanent presence in metallic structure. With a specific end goal to create metals
beginning from actually happening minerals and ores, it is important to give a sure
measure of vitality. It is accordingly just normal that when these metals are presented to
their surroundings they would return back to the first state in which they were found in
nature (Roberge, 2008).

15
An average cycle is shown by iron. The essential consumption result of iron, for instance,
is Fe(OH)2 (or more probable FeO•nH2O), however the activity of oxygen and water can
yield different items having distinctive colors (Roberge, 2008):
Fe2O3·H2O or hydrous ferrous oxide, sometimes written as Fe(OH)3, is the principal
component of red-brown rust. It can form a mineral called hematite, the most common
iron ore.
Fe3O4·H2O or hydrated magnetite, also called ferrous ferrite (Fe2O3·FeO), is most often
green but can be deep blue in the presence of organic complexants.
Fe3O4 or magnetite is black.
Consider a bit of iron presented to muggy air which goes about as an electrolyte. Fe2+
ions
are discharged from the anode by oxidation and OH− particles from the cathode by
decrease on the metal surface. The negative and positive ions combine.
(White green color precipitate) (3.1)
Fe(OH)2 is insoluble in water and separates from the electrolyte. A more familiar name of
Fe(OH)2 is rust (Ahmad, 2006).
Figure 3.5: Concentration cell formation in an underground pipeline (Ahmad, 2006)

16
Figure 3.6: Formation of rust in seawater (Ahmad, 2006)
In most consumption issues, the critical contrasts in response potential are not those
between unique metals, but rather are those that exist between independent regions blended
over all the surface of a solitary metal. These potential contrasts result from neighborhood
concoction or physical contrasts inside or on the metal, for example, varieties in grain
structure, hassles, and scale considerations in the metal, grain limits, and scratches or other
surface condition. Steel is a combination of immaculate iron with little measures of carbon
present as Fe3C and follow measures of other components. Iron carbide (Fe3C) is cathodic
as for iron. In light of the fact that in run of the mill consumption of steel the anodic and
cathodic regions untruth next to each other on the metal surface, basically it is secured with
both positive and negative destinations. Amid erosion, the anodes and cathodes of metals
may trade much of the time (Chilingar et al., 2008).
3.5 Pipeline and Pipeline Corrosion
The concept of pipe is characterized as a rule of round cross area. It can be made of any
suitable material, for example, steel. The pipeline concept alludes to a long line of
associated fragments of pipe, with pumps, valves, control tools, and other tool/offices
required for working the system. It is proposed for transporting a fluid (liquid or gas),
mixture of fluids or solids and fluid solid mixture (Liu, 2003).
The metal in the pipe line is steel, fundamentally involved iron with one to two percent
alloy for quality and strength. With respect to outer corrosion, the circumstance would be
seawater for offshore pipelines and groundwater or clammy soil for onshore pipelines. The

17
decay would be disintegration of the iron into the environment, which decreases the quality
of the pipeline (Baker, 2008).
Regularly, corrosion in pipelines shows as setting as opposed to as a uniform decrease in
wall thickness. This is on account of nature at an anodic range has a tendency to wind up
more acidic. In such cases the pits will be detached from one another and, different times,
they will be so near one another that they overlap and create a general yet unpredictable
diminishing in the pipe wall.
Seamless pipes have been utilized as a part of a few frameworks. Most linepipe contains a
longitudinal weld, or seam. The long seam, as it is called, most much of the time is made
by submerged-arc segment welding or upset butt welding. A submerged-arc weld contains
a filler metal that has a creation somewhat, not the same as that of the body of the pipe and
the heat influenced zone beside the weld metal has a microstructure not quite the same as
that of whatever is left of the pipe. Upset butt welds, which can be either electric-resistance
welds or flash welds, don't contain filler metal; they likewise have a heat influenced zone
that has an alternate microstructure. Since these distinctive microstructures can be more
powerless to corrosion than the encompassing metal, particular corrosion at the seam can
here and there happen with minimal contiguous corrosion related collapse.
MIC (Microbiologically affected corrosion) is brought about by microorganisms whose
activities start the corrosion cycle. There are a few sorts of organisms that, while creating
distinctive impacts, have been found to advance either outside or inside corrosion. The
principle sorts are sulfate-reducing microscopic bacteria (SRB) and corrosive producing
bacteria (APB). Microscopic organisms can advance outside corrosion by depolarizing the
pipe through the utilization of hydrogen gas shaped at the pipe surface by the cathodic
assurance streams. When the pipe is depolarized, corrosion can happen (Baker, 2008).
3.6 Corrosion in Soil
There are more than 3.7 million kilometers (2.3 million miles) of pipelines crossing the
United States, transporting natural gas and hazardous liquids from sources such as wells,
refineries, and ports to customers. Underground corrosion is of major importance and

18
results in a significant portion of pipeline failures. Because of corrosion, these pipelines
must be regularly inspected, maintained, and sometimes replaced (Ricker, 2010).
Soil corrosivity, when contrasted with that of the air or seawater corrosivity is regularly
harder to classify with respect to both pipe particular parameters and encompassing soil
properties (Ferreira, 2006). This is because of the soil's to a great degree confined many-
sided quality and heterogeneity.
In soils, water and gas occupy the spaces between solid particles, and these spaces can
constitute as much as half the volume of dry soil. Some of this water is bound to mineral
surfaces, whereas bulk water can flow through porous soil. Fluid flow through soil is
controlled by the permeability of the soil, which, in turn, depends on the size distribution
of the solid particles in the soil. Coarse – grained sand, for example, allows good drainage
and access of atmospheric oxygen to a depth greater than, for example, fine - grained soils
high in clay. Capillary action in fine - grained soil can draw water up, keeping the soil
water - saturated, preventing drainage, retarding evaporation, and restricting oxygen access
from the atmosphere to a buried structure, such as a pipeline (Wilmott and Jack, 2000).
The electrochemical corrosion processes that take place on metal surfaces in soils occur in
the groundwater that is in contact with the corroding structure. Both the soil and the
climate influence the groundwater composition. For example, some clay soils buffer the
groundwater pH. Groundwater in desert regions can be high in chloride and very corrosive.
On the other hand, groundwater in tropical climates tends to be very acidic.
The corrosion behavior of iron and steel buried in the soil approximates, in some respects,
the behavior on total immersion in water. Minor composition changes and structure of
steel, for example, are not important to corrosion resistance. Hence, a copper - bearing
steel, low alloy steel, mild steel, and wrought iron are found to corrode at approximately
the same rate in any given soil. In addition, cold working or heat treatment does not affect
the rate. Gray cast iron in soils, as well as in water, is subject to graphitic corrosion.
Galvanic effects of coupling iron or steel of one composition to iron or steel of a different
composition are important, because they are under conditions of total immersion (Revie
and Uhlig, 2008).
In other respects, corrosion in soils resembles atmospheric corrosion in that observed rates,
although usually higher than in the atmosphere, vary to a marked degree with the type of
soil. A metal may perform satisfactorily in some parts of the country, but not elsewhere,

19
because of specific differences in soil composition, pH, moisture content, and so on. For
example, a cast iron water pipe may last 50 years in New England soil, but only 20 years in
the more corrosive soil of southern California. Corrosion rates of underground pipeline
have been measured using the Stern – Geary linear polarization method, as well as weight
loss. The former method has been useful, for example, in assessing the corrosion rates of
footings of galvanized - steel towers used to support power lines Figure 3.7 shows the
mechanism of corrosion of buried pipe.
Figure 3.7: Corrosion mechanism of soil for buried pipe (Camitz, 1998)
3.6.1 Factors affecting the corrosivity of soils
One of the primary variables that impact the rate of outer corrosion is the distinctions in the
attributes of the soil from spot to put along a pipeline, and from top to bottom. Contrasts in
air circulation, moisture content, and soil arrangement in these regions can create solid
main impetuses for corrosion (Baker, 2008).
Among the factors that affect corrosivity of a given soil are:
Porosity (aeration).
Electrical conductivity or resistivity
Dissolved salts, including depolarizers or inhibitors
Moisture
pH
Soil texture
The variety of concoction and physical properties in the soil, even over a solitary site, can
change how an item corrodes contrasted with another indistinguishable object. At the point

20
when underground pipes are initially introduced a refill is comprised of accessible
(regularly irritated) soil from close-by, frequently this soil will contain transported material
and building waste, either from the close-by surface or, in the event that it is brought into
the site from somewhere else, it is the thing that geotechnical architects portray as “made
ground” (Waltham, 2002). The Figure 3.8 shows the different and direction of current.
Figure 3.8: Corrosion produces in disturbed soil vs. undisturbed soil, the direction of positive
current represented by arrow (Bradford, 2001)
Each of these variables may affect the anodic and cathodic polarization characteristics of a
metal in a soil. A porous soil may retain moisture over a longer period of time or may
allow optimum aeration, and both factors tend to increase the initial corrosion rate. The
situation is more complex, however, because corrosion products formed in an aerated soil
may be more protective than those formed in non aerated soil. In most soils, particularly if
not well - aerated, observed corrosion takes the form of deep pitting. Localized corrosion
of this kind is obviously more damaging to a pipeline than a higher overall corrosion rate
occurring more uniformly. Another factor to be considered is that, in poorly aerated soils
containing sulfates, sulfate – reducing bacteria may be active; these organisms often
produce the highest corrosion rates normally experienced in any soil.
Aeration of soils may affect corrosion not only by the direct action of oxygen in forming
protective films, but also indirectly through the influence of oxygen reacting with and
21
decreasing the concentration of the organic complexing agents or depolarizers naturally
present in some soils. In this regard, the beneficial effect of aeration extends to soils that
harbor sulfate - reducing bacteria because these bacteria become dormant in the presence
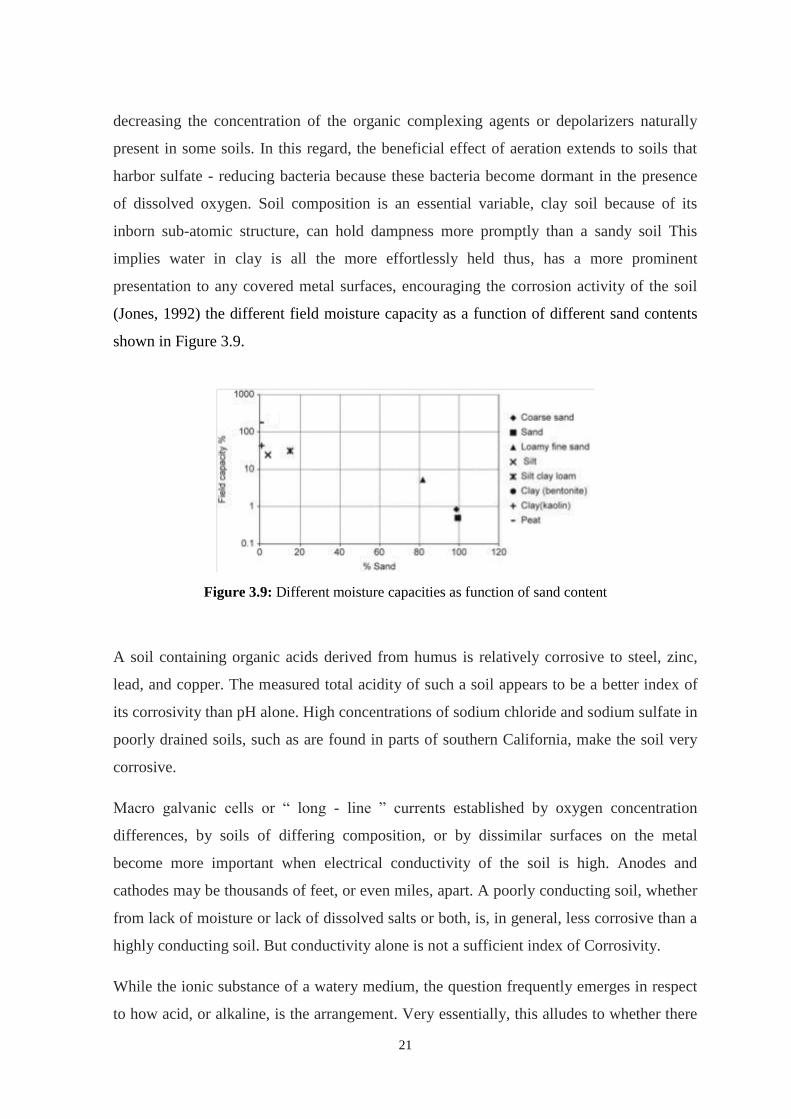
of dissolved oxygen. Soil composition is an essential variable, clay soil because of its
inborn sub-atomic structure, can hold dampness more promptly than a sandy soil This
implies water in clay is all the more effortlessly held thus, has a more prominent
presentation to any covered metal surfaces, encouraging the corrosion activity of the soil
(Jones, 1992) the different field moisture capacity as a function of different sand contents
shown in Figure 3.9.
Figure 3.9: Different moisture capacities as function of sand content
A soil containing organic acids derived from humus is relatively corrosive to steel, zinc,
lead, and copper. The measured total acidity of such a soil appears to be a better index of
its corrosivity than pH alone. High concentrations of sodium chloride and sodium sulfate in
poorly drained soils, such as are found in parts of southern California, make the soil very
corrosive.
Macro galvanic cells or “ long - line ” currents established by oxygen concentration
differences, by soils of differing composition, or by dissimilar surfaces on the metal
become more important when electrical conductivity of the soil is high. Anodes and
cathodes may be thousands of feet, or even miles, apart. A poorly conducting soil, whether
from lack of moisture or lack of dissolved salts or both, is, in general, less corrosive than a
highly conducting soil. But conductivity alone is not a sufficient index of Corrosivity.
While the ionic substance of a watery medium, the question frequently emerges in respect
to how acid, or alkaline, is the arrangement. Very essentially, this alludes to whether there
22
is an abundance of H+ (hydrogen) or OH
− (hydroxyl) particles present. The H
+ particle is
acid while the OH− particle is alkaline or essential (Roberege, 2008).
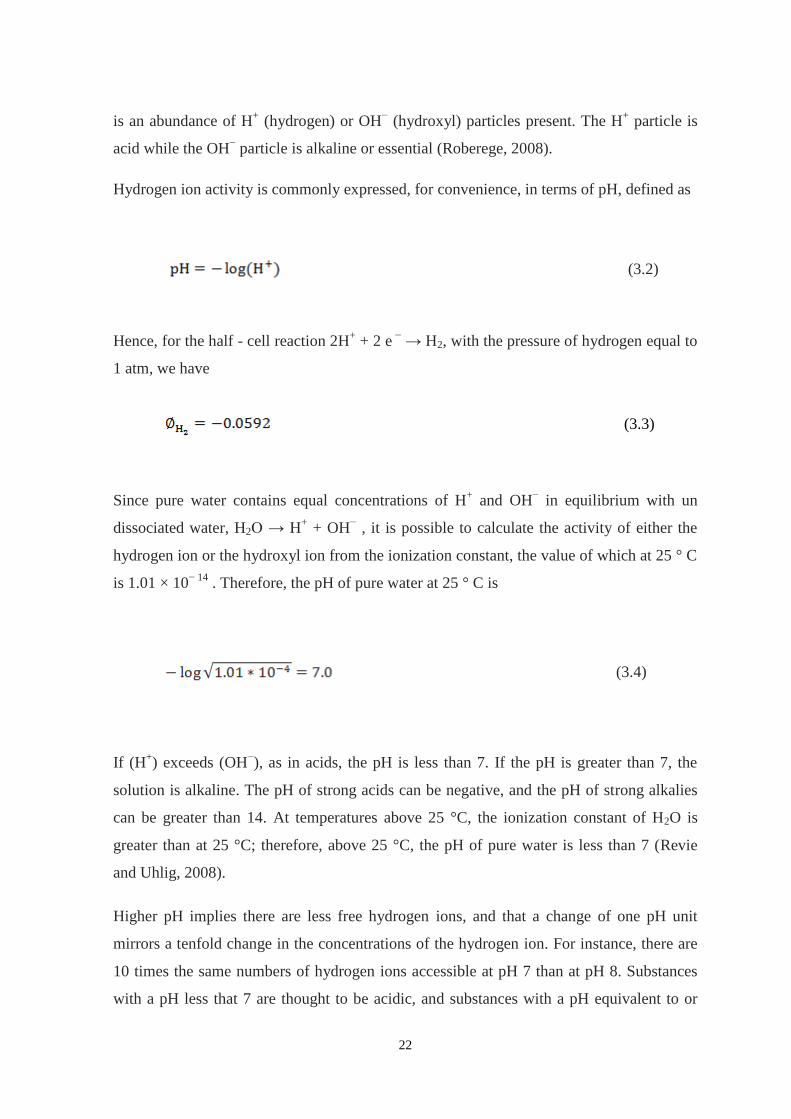
Hydrogen ion activity is commonly expressed, for convenience, in terms of pH, defined as
(3.2)
Hence, for the half - cell reaction 2H+ + 2 e
− → H2, with the pressure of hydrogen equal to
1 atm, we have
(3.3)
Since pure water contains equal concentrations of H+ and OH
− in equilibrium with un
dissociated water, H2O → H+ + OH
− , it is possible to calculate the activity of either the
hydrogen ion or the hydroxyl ion from the ionization constant, the value of which at 25 ° C
is 1.01 × 10− 14
. Therefore, the pH of pure water at 25 ° C is
(3.4)
If (H+) exceeds (OH
−), as in acids, the pH is less than 7. If the pH is greater than 7, the
solution is alkaline. The pH of strong acids can be negative, and the pH of strong alkalies
can be greater than 14. At temperatures above 25 °C, the ionization constant of H2O is
greater than at 25 °C; therefore, above 25 °C, the pH of pure water is less than 7 (Revie
and Uhlig, 2008).
Higher pH implies there are less free hydrogen ions, and that a change of one pH unit
mirrors a tenfold change in the concentrations of the hydrogen ion. For instance, there are
10 times the same numbers of hydrogen ions accessible at pH 7 than at pH 8. Substances
with a pH less that 7 are thought to be acidic, and substances with a pH equivalent to or

23
more prominent than 7 are thought to be basic. Subsequently, a pH of 2 is extremely acidic
and a pH of 12 exceptionally basic (Roberge, 1999).
3.7 Corrosion Measurement (Weight Loss Method)
Electrochemical procedures give a distinct option for conventional methods used to decide
the rate of corrosion quantitative determination of corrosion rates and Immediate. The
determination of the corrosion rate will be as a time function.
Weight reduction tests are the most widely recognized of all rate estimation tests. A little
metal coupon (generally low-carbon steel) is uncovered in the liquid or soil or exposed to
any corrosive environments framework where corrosion may be dynamic. The coupon is
left for a limited time frame and after that evacuated, cleaned, and weighed to decide the
measure of metal loss. Weight reduction, surface area of coupon, and presentation time are
utilized to compute corrosion rate (Chilingar et al. 2008) described in section 4.1.2 chapter
four.
The weight of the specimen former and in the wake of being presented to soil environment
was recorded to decide the metal loss and therefore the corrosion rate equation 4.1 in
chapter four.
3.8 Statistical Analysis and Corrosion Prediction
Predictive displaying and statistical procedure control have gotten to be indispensable parts
of the present day science and building of complex frameworks. The massive presentation
of computers in the working environment has additionally definitely changed the
significance of these machines in every day operations. Models of materials corruption
procedures have been created for a huge number of circumstances utilizing an awesome
assortment of strategies. For researchers and specialists who are creating materials, models
have turned into a fundamental benchmarking component for the choice and life forecast
connected with the presentation of new materials or procedures.
24
Models are in this setting an acknowledged technique for representing to current
understandings of reality. For frameworks chiefs, the corrosion execution or under
performance of materials has an altogether different significance. In the setting of life-
cycle administration, corrosion is stand out component of the entire picture, and the
principle trouble with corrosion information is to convey it to the framework
administration level.
Statistical appraisal of time to disappointment is an essential theme in dependability
building for which numerous numerical apparatuses have been produced. Evans, who
pioneered the mixed-potential theory to explain basic corrosion kinetics, propelled the idea
of corrosion likelihood in connection to limited corrosion. As indicated by Evans, a precise
learning of the corrosion rate was less critical than discovering the statistical danger of its
introduction. Petting is, obviously, one and only of the numerous types of limited
corrosion, and the same contention can be reached out to any type of corrosion in which
the instruments controlling the start stage vary from those controlling the spread stage
(Roberge, 1999).
Statistics is the section of scientific method which manages the data acquired by counting
or measuring the properties of natural phenomena, a natural phenomenon incorporates
everything of the happenings of the external world, whether human or not.
The “Statistical Package for the Social Sciences” (SPSS) is a package of programs for
manipulating, analyzing, and presenting data. the package is widely used in the social and
behavioral sciences. There are several forms of SPSS. The core program is called SPSS
Base and there are a number of add-on modules that extend the range of data entry,
statistical, or reporting capabilities (Landau and Everitt, 2004).
3.9 Importance and Cost of Corrosion
The three principle purposes behind the significance of corrosion are: financial aspects,
wellbeing, what's more, protection. To lessen the monetary effect of corrosion, corrosion
engineers, with the backing of corrosion researchers, mean to lessen material misfortunes,
as well as the going with financial misfortunes, that outcome from the corrosion of
channeling, tanks, metal parts of machines, boats, spans, marine structures, etc. Corrosion

25
can trade off the security of working gear by bringing on disappointment (with disastrous
results) of, for instance, weight vessels, boilers, metallic compartments for poisonous
chemicals, turbine sharp edges and rotors, spans, plane segments, and car directing
components. Wellbeing is a basic thought in the outline of hardware for atomic force
plants and for transfer of atomic squanders. Loss of metal by corrosion is a waste not just
of the metal, additionally of the vitality, the water, and the human exertion that was utilized
to create and manufacture the metal structures in the first place. Furthermore, revamping
eroded hardware requires further venture of every one of these assets metal, vitality, water,
and human.
Financial misfortunes are partitioned into direct misfortunes and circuitous misfortunes.
Direct misfortunes incorporate the expenses of corrosion structures and hardware on the
other hand their segments, for example, condenser tubes, suppressors, pipelines, and metal
material, including fundamental work. Different illustrations are (a) repainting structures
where anticipation of rusting is the prime target and (b) the capital expenses in addition to
upkeep of cathodic insurance frameworks for underground pipelines.
Sizable direct misfortunes are represented by the need to a few million residential hot -
water tanks every year in view of disappointment by consumption and the requirement for
substitution of a great many consumed vehicles mufflers. Direct misfortunes incorporate
the additional expense of utilizing consumption - safe metals and combinations rather than
carbon steel where the last has sufficient mechanical properties however not sufficient
erosion resistance There are additionally the expenses of arousing or nickel plating of steel,
of adding erosion inhibitors to water, and of dehumidifying storage spaces for metal gear
(Revie and Uhlig, 2008).
The financial component is also a vital for a significant part of the current research in
corrosion. Misfortunes supported by industry and by governments sum to numerous
billions of dollars every year, pretty nearly $ 276 billion in the United States, or 3.1% of
the Gross Domestic Product (GDP), as indicated by a later study. It has been assessed that
around 25 – 30% of this aggregate could be stayed away from on the off chance that at
present accessible consumption innovation were adequately connected. Investigations of
the expense of consumption to Australia, Great Britain, Japan, and other nations have
likewise been done. In every nation examined, the expense of corrosion is more or less 3 –

26
4 % of the Gross National Product. Backhanded misfortunes are more difficult to evaluate,
however a brief overview of average misfortunes of this kind urges the conclusion that
they add a few billion dollars to the direct misfortunes effectively outlined (Koch et al.,
2002).
Some examples of indirect losses are as follows:
Shutdown
The substitution of a consumed tube in an oil refinery may cost a couple of hundred
dollars; however shutdown of the unit while repairs are in progress may cost $
50,000 or more every hour in lost creation. Thus, substitution of consumed heater or
condenser tubes in an expensive force plant may require $ 1,000,000 or more every
day for force acquired from interconnected electric frameworks to supply clients
while the evaporator is down. Misfortunes of this kind cost the electrical utilities in
the United States large amount of money every year.
Loss of Product
Misfortunes of oil, gas, or water happen through a corroded channel framework until
repairs are made. Radiator fluid may be lost through a corroded auto radiator; or gas
spilling from a corroded pipe may enter the storm cellar of a building, bringing on a
blast.
Loss of Efficiency
Loss of efficiency may happen as a result of decreased warmth exchange through
gathered corrosion items, or due to the obstructing of channels with rust requiring
expanded pumping limit. It has been assessed that, in the United States, expanded
pumping limit made vital by fractional obstructing of water mains with rust, costs
large amount of money every year. A further sample is given by inner - ignition
motors of vehicles where cylinder rings and chamber dividers are consistently
consumed by ignition gasses and condensates. Loss of discriminating measurements
prompting overabundance gas and oil utilization can be brought about by
consumption to a degree equivalent to or more noteworthy than that created by wear.
Corrosion procedures can force limits on the efficiencies of vitality transformation
frameworks, speaking to misfortunes that may add up to billions of dollars.

27
Contamination of Product
A little measure of copper grabbed by slight corrosion of copper channeling or of
metal gear that is generally strong may harm a whole clump of cleanser. Copper salts
quicken rancidity of cleansers and abbreviate the time that they can be put away
before utilization. Hints of metals might likewise adjust the shade of colors.
Overdesign
Over design is normal in the design of response vessels, boilers, condenser tubes, oil
- well sucker poles, pipelines transporting oil also, gas at high weight, water tanks,
and marine structures. Gear is frequently planned ordinarily heavier than typical
working weights or connected anxieties would require so as guaranteeing sensible
life. With sufficient information of consumption, more solid appraisals of gear life
can be made, and configuration can be simplified regarding materials and work. For
instance, oil - well sucker poles are typically overdesigned to expansion
administration life before disappointment happens by corrosion weakness. On the off
chance that the consumption components were disposed of, misfortunes would be
sliced at any rate down the middle. There would be further investment funds in the
light of the fact that less power would be obliged to work a lightweight bar, and the
cost of recuperating a lightweight pole after breakage would be lower.
Indirect misfortunes are a significant piece of the monetary expense forced by corrosion,
despite the fact that it is hard to land at a sensible appraisal of aggregate misfortunes. In the
occasion of loss of wellbeing or life through blast, unusual disappointment of compound
hardware, or destruction of planes, or autos through sudden disappointment by
consumption of basic parts, the circuitous misfortunes are still harder to survey and are
past translation as far as dollars (Revie and Uhlig, 2008).

28
CHAPTER 4
METHODOLOGY
4.1 Materials
4.1.1 Soil samples
The properties of soil are considered as one of the most important parameter that
influences the corrosion rate of pipelines. Through this point the investigation of soil
characteristics in this research comes out. The soil properties of underground pipelines that
transport the crude oil of oil wells located in North of Iraq to Turkey.
The eight samples were collected along the pipe line; the pipeline route in area consists of
complex terrain and valleys, interspersed with agricultural land of Zagros basin. The
samples were labeled as ‘SS-1, SS-2, SS-3, SS-4, SS-5, SS-6, SS-7, and SS-8’. The
samples were taken from the depth of about one meter from the ground level for the real
location of the pipelines in (June/2015), the soil samples were taken in an air tight
polyvinyl container less than 24 hours after collection from actual site (Bhattarai, 2013) as
shown in Figure 4.1 (a) and (b) and preserved with the desired inherent conditions in
accordance with ASTM D 4220-95 Reapproved, 2000 (Standard Practices for Preserving
and Transporting Soil Samples. Appendix 4) the procedure presented in this standard were
primarily developed for soil samples that are to be tested for engineering properties. The
area is located at latitude of (45°-46°) north and within longitude of (34°-36°) east as
shown in Figure 4.2.
(a) Agricultural site (b) Hills area
Figure 4.1: Soil samples
1:5
Scale

29
Figure 4.2: Oil and gas pipeline map in north of Iraq1
4.1.2 Pipe samples
The API 5L X70 steel pipe was used as a case study for this research to examine the
influence of soil parameters on the corrosion rate of the pipe. The eight test specimens
'steel coupon' were cut from the pipe, the flat coupon have a dimension of (60 mm * 40
mm * 10 mm) (Noor et al, 2012) the coupon geometry is shown in Figure 4.3. Utilizing hot
cut process, cold cut technique was at that point used to uproot heat influenced area on the
coupon which may bring about changes in properties of the material. The coatings of those
specimens were removed. The procedures, preparation and cleaning process were done
following the ASTM G01-03 Reapproved, 1999 (Standard Practice for Preparing, Cleaning
and Evaluating Corrosion Test Specimen) (American Society for Testing and Material/
Appendix 5).
1 http://www.GenelEnergy.com

30
Figure 4.3: Coupon samples dimensions in mm
To evaluate the corrosion rate of the pipe, the coupons were installed in polyvinyl
container containing the soil samples to simulate the actual site to corrode naturally
(Anyanwu et al, 2014) for a period of three months (2160 hours) the process of installation,
preparation of soil medium are referred to ASTM 162-99 (2004) (Standard Practice for
Conducting and Evaluating Laboratory Corrosions Tests in Soils. Appendix 8), then the
coupons were retrieved to measuring the metal loss of the samples, the coupon cleaning
procedure were referred to ASTM G01- 03 (Reapproved 1999) (Standard Practice for
Laboratory Immersion Corrosion Testing and Metals/ Appendix 5).
The corrosion rate was calculated by using Equation 4.1
(4.1)
The results are given in Table 5.5 of chapter five.
The chemical and mechanical properties of API 5L X70 are shown in Table 4.1 as
specified in API 5L specifications.
31
Table 4.1: Mechanical and chemical properties of API 5L X70 steel pipe (Appendix 9)
Chemical Properties Mechanical Properties
C % Mn % P % S % Ti % Yield strength,
Psi (MPa)
Tensile
Strength, psi
(MPa)
0.28 1.40 0.030 0.030 0.06 70000 (483) 82000 (565)
4.2 pH Testing
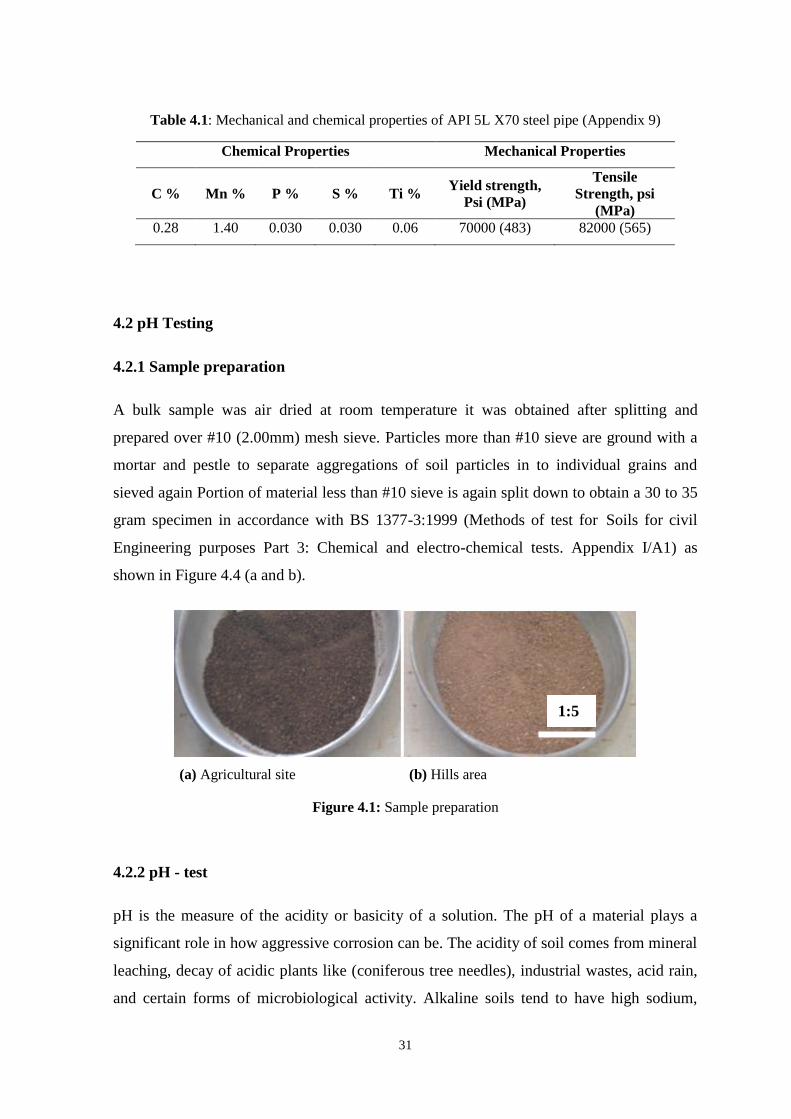
4.2.1 Sample preparation
A bulk sample was air dried at room temperature it was obtained after splitting and
prepared over #10 (2.00mm) mesh sieve. Particles more than #10 sieve are ground with a
mortar and pestle to separate aggregations of soil particles in to individual grains and
sieved again Portion of material less than #10 sieve is again split down to obtain a 30 to 35
gram specimen in accordance with BS 1377-3:1999 (Methods of test for Soils for civil
Engineering purposes Part 3: Chemical and electro-chemical tests. Appendix I/A1) as
shown in Figure 4.4 (a and b).
(a) Agricultural site (b) Hills area
Figure 4.1: Sample preparation
4.2.2 pH - test
pH is the measure of the acidity or basicity of a solution. The pH of a material plays a
significant role in how aggressive corrosion can be. The acidity of soil comes from mineral
leaching, decay of acidic plants like (coniferous tree needles), industrial wastes, acid rain,
and certain forms of microbiological activity. Alkaline soils tend to have high sodium,
1:5

32
potassium, magnesium, and calcium contents; these elements produce calcareous deposits
on buried structures that have protective behavior against corrosion. The pH level has an
influence on the solubility of corrosion products and also the nature of microbiological
activity (Roberge, 1999). Table 4.2 shows the relation between pH level and soil
corrosivity.
Table 4.2: Relative acidity pH of soil and corrosivity of soil (Roberge, 1999)
Corrosivity of Soil Relative Acidity (pH) of Soil Extract
Low
Moderate
High
Very high
>12
7.5 - 12
4 – 7.5
<4
4.2.3 Test procedure
Using analytical balance for determining (30 ± 0.1) g from the soil samples required for the
test Figure 4.5, and placed in 100 mL beaker 75 mL of distilled water was added to the
beaker with stirring for a few minutes and leaving the solution for 8 hours with covering
the breaker by glass cover and stirred again before the test Figure 4.6.
Calibration of pH meter required by using standard buffer solution provide from the
manufacturer Figure 4.7, taking two to three reading with washing the electrode by
distilled water again with stirring the solution between each reading in accordance with BS
1377-1:1990 Methods of test for Soils for civil Engineering purposes Part 3: Chemical and
electro-chemical tests/ Appendix 1).

33
Figure 4.5: A&B GR 120 analytical balance
(a) Hills area (b) Agricultural site
Figure 4.6: (100 mL) beaker with 30g soil and 70mL distilled water
Figure 4.7: Calibration of pH meter with standard buffer solution

34
4.3 Moisture Content Testing
4.3.1 Sample preparation
After the fragmentation of the soil to smaller parts by hammers prepared for test, saving
the samples in a non-corrosive container and preventing air to contact with the soils, at a
temperature between (3-30) ºC, in a place far away from exposure to direct sunlight.
Taking samples of the soil after mixing and mass selection was done in accordance with
ASTM D4643-08 (Standard Test Method for Determination of Water (Moisture) Content
of Soil by Microwave Oven Heating/ Appendix 2). Table 4.3 shows the relation between
sieve number and recommended mass of moist specimen.
Table 4.3: Test specimen masses (ASTM D 4643-08)
Sieve retaining not more than
about 10% of sample
Recommended mass of
moist specimen, g
2.0 mm (No. 10)
4.75 mm (No. 4)
19 mm (¾ in.)
100 to 200
300 to 500
500 to 1000
4.3.2 Moisture content
The test measure the water present in a soil as percentage between the amounts of absorbed
water through soil mass to the same amount of soil mass without water ASTM D 4643-08
(Standard Test Method for Determination of Water (Moisture) Content of Soil by
Microwave Oven Heating/ Appendix 2).
The water plays a critical role as fundamental electrolyte in the electrochemical corrosion
action (Roberge, 2008).
Shrier et al., (2000) identified three types of soil moisture:
Free ground water: Basically this represent to the water table of the substrate, beneath
which water is constantly present. The profundity to free ground water can fluctuate,
subordinate upon topographical and climatic elements.

35
Gravitational water: Whereby water, ordinarily as an after effect of precipitation,
enters the soil surface and permeates downwards. In the long run this water achieves
the free ground water table, regularly quickly, particularly in coarser grained soils
(sand and gravel as an example).
Capillary water: Water that is held inside of the "capillary" spaces between clay and
silt particles, this asset is the thing that plants and creatures living inside of the soil
mass depend on for their water utilization. The large sandy soils have a little measure
of fine water accessible.
Water substance and water movement in soils can be seen as a variable of (Cole and
Marney, 2012):
Water flow patterns.
Ground topography, soil profiles and the position of the water table.
Soil type and water saturation limits.
4.3.3 Procedure
Identified soil samples were used in clean, dry container were weighed using GR 120
analytical balance shown in Figure 4.5, After determination the amount of soil sample to
be tested according to Table 4.2, place an amount of 200g into the container and then
recording the mass of container and the sample together, the sample placed inside the an
oven dryer Figure 4.8, 700 W oven dryer accordance with ASTM 4643-08 (Standard Test
Method for Determination of Water (Moisture) Content of Soil by Microwave Oven
Heating/ Appendix 2) and dried for 3 minutes at a temperature of 110 °C.
Figure 4.8: H30140E laboratory bench oven, digital series, HUMBOLDT
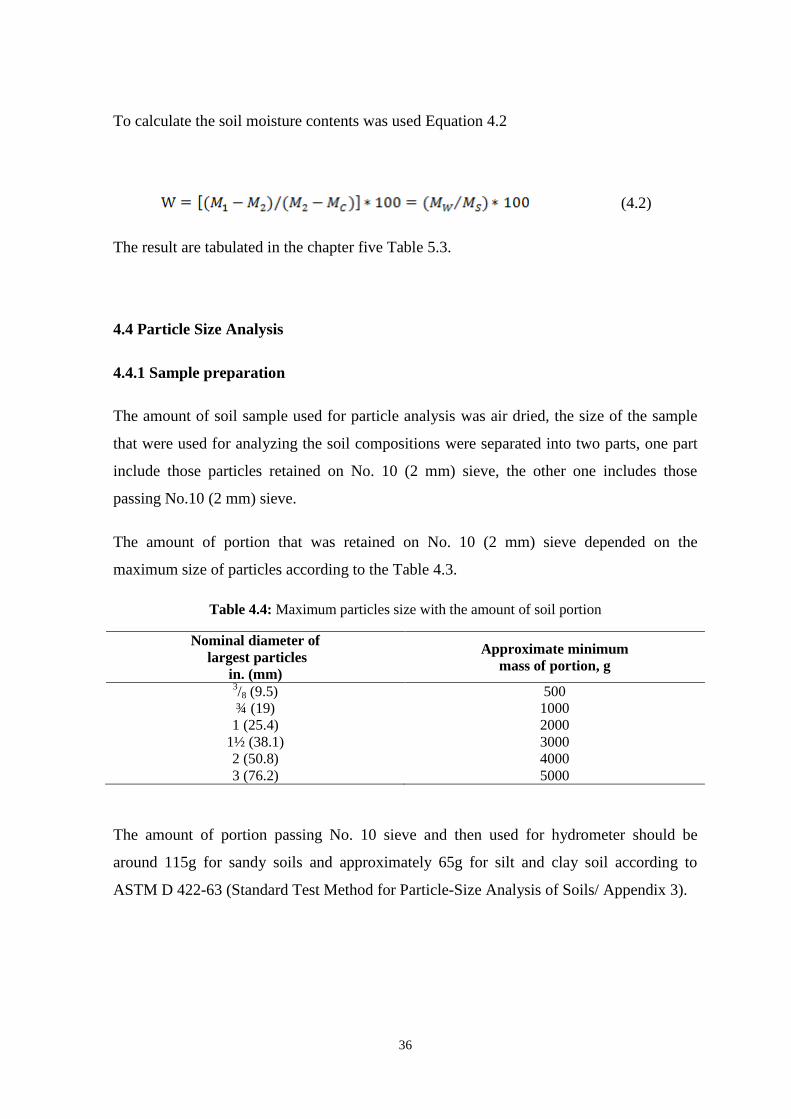
36
To calculate the soil moisture contents was used Equation 4.2
(4.2)
The result are tabulated in the chapter five Table 5.3.
4.4 Particle Size Analysis
4.4.1 Sample preparation
The amount of soil sample used for particle analysis was air dried, the size of the sample
that were used for analyzing the soil compositions were separated into two parts, one part
include those particles retained on No. 10 (2 mm) sieve, the other one includes those
passing No.10 (2 mm) sieve.
The amount of portion that was retained on No. 10 (2 mm) sieve depended on the
maximum size of particles according to the Table 4.3.
Table 4.4: Maximum particles size with the amount of soil portion
Nominal diameter of
largest particles
in. (mm)
Approximate minimum
mass of portion, g
3/8 (9.5)
¾ (19)
1 (25.4)
1½ (38.1)
2 (50.8)
3 (76.2)
500
1000
2000
3000
4000
5000
The amount of portion passing No. 10 sieve and then used for hydrometer should be
around 115g for sandy soils and approximately 65g for silt and clay soil according to
ASTM D 422-63 (Standard Test Method for Particle-Size Analysis of Soils/ Appendix 3).

37
4.4.2 Soil texture
The soil texture is an indication to the size of mineral spread or include in a soil, the sand,
silt and clay are refer to the soil texture Table 4.4 illustrate the different particle size with
the soil texture.
Table 4.5: Particle Size in a Soil Texture (Roberge, 1999)
Category Diameter (mm)
Sand (very coarse)
Sand (coarse)
Sand (medium)
Sand (fine)
Sand (very fine)
Silt
Clay
1 – 2
0.5 – 1
0.25 – 0.5
0.10 – 0.25
0.05 – 0.10
0.002 – 0.05
< 0.002
4.4.3 Procedure
The analysis classifies the soil particles in to two groups according to ASTM D 442 – 63
(Standard Test Method for Particle-Size Analysis of Soils. Appendix I/A3) as follow:
Sieve analysis of soil portion that retained on number 10 (2 mm) sieve. The portion
retained on No. 10 sieve will be again sieving into a series of fraction using 3-in. (76.2
mm), 2-in. (50.8 mm), 1½-in. (38.1 mm), 1-in. (25.4 mm), ¾-in. (19.05 mm), ½-in.
(12.7 mm), 3/8-in. (9.552 mm), No. 4 (4.75 mm), No. 10 (2 mm). And making further
sieving analysis and weighting and recording the amount that retained on each sieve,
to specify the total percentage passing for each sieve dividing the total mass passing
by the total mass of sample and multiplying the result by 100.
Hydrometer and sieve analysis of portion passing the No. 10 (2 mm) sieve. Weigh out
the soil sample that passed No.10 sieve about 50g that was used for hydrometer
testing. The analysis consists of the following steps:
Composite Correction Factor and Calibration:
The first step in the hydrometer analysis is the calibration of the hydrometer that used
in the test because the manufacturers calibrate the hydrometer at a standard
temperature 20 °C. Hydrometers are graduated by the producer to be perused at the

38
base of the meniscus framed by the fluid on the stem. Since it is impractical to secure
readings of soil suspensions at the base of the meniscus, readings must be taken at the
top and a correction used connected. In our texture test a H152 hydrometer type was
used. For convenience, a chart or table of composite revisions for a progression of 1°
temperature contrasts Figure 4.6 for the scope of expected test temperatures may be
arranged and utilized as required. This is in (Appendix 10).
Figure 4.9: Composite correction slurry

39
Determination of Hygroscopic Moisture:
The moisture differences between air dried and oven dried samples were found using
Equation 4.3, weigh out about (10 to 15) g in a small container, and then drying the
sample in an oven at (110 ± 5) °C and weigh out the mass of oven dried sample.
(4.3)
Soaking the Soil Sample:
Since the soil sample mostly clay/silt, weighing out about (50) g of soil and then pour
it in a glass beaker with (40) g of sodium hexametaphosphate that act as dispersion
agglomeration within the sample and allow to soak for at least 16 hours after that it
will be disperse further on a soil dispersion mixer machine as shown in Figure 4.10.
Figure 4.10: Dispersing Soil mixer machine (ASTM D 422)

40
Hydrometer Test:
The procedure is as follows:
Prepare the glass sedimentation cylinder with dispersed soil slurry from the dispersion
mixer machine and add distilled water until the total volume reach 1000 ml Figure
4.11. Utilizing the palm of the hand over the open end of the cylinder (or an elastic
plug in the open end), turn the cylinder upside down and back for a time of 1 min to
finish the unsettling of the slurry. Toward the end of 1 min set the cylinder in a
suitable area and take hydrometer readings at the accompanying interims of time (0.5,
1, 2, 5, 15, 45, 90, 180, 240, 1440) minutes Figure 4.12.
Figure 4.11: Sedimentation 1000 mL cylinder with distilled water and soil slurry
Figure 4.12: Hydrometer forms include time interval and recording (temperature, hydrometer, and
composite correction) with stop watch

41
Calculation of soil percentage in suspension
The mass of a total sample represented by the mass of soil used in the hydrometer test
by dividing the oven-dry mass used by the percentage passing No. 10 (2 mm) sieve,
and multiplying the result by 100. This value is the weight W in the equation for
percentage remaining in suspension.
The rate of soil staying in suspension at the level at which the hydrometer is
measuring the density of the suspension computed by using Equation 4.4:
(4.4)
Diameter of Soil Particles:
The diameters of particles corresponding to the percentage indicated by a given
hydrometer reading were calculated according to Stokes’ law Equation 4.5:
(4.5)
The values of effective depth (L) are calculated from Equation 4.6:
(4.6)
The procedure followed the following route:
Sieve analysis for portion finer than No. 10 (2 mm), wash and dry the amount of soil
were used in the hydrometer test and then sieve under set (No. 40, No. 100, No. 200),
weighing the amount that retained on each sieve, to specify the total percentage
passing for each sieve dividing the total mass passing by the total mass of sample and
multiplying the result by 100.
4.5 Statistical Analysis
The statistical analysis was performed using IBM SPSS Statistics 20 software, the multiple
linear regressions (MLR) and analysis of variance methods were employed to estimate the
corrosion rate through (MLR) Equation 4.7 and compare the predicted corrosion rate with
the corrosion rate obtained experimentally from weight loss method Equation 4.1 in

42
chapter 4. Also to determine the relationship between soils parameters that play a role in
the corrosion of buried pipeline the statistical process was performed according to ASTM
G 16-13 (Standard Guide for Applying Statistics to Analysis of Corrosion Data/ Appendix
6).
The multiple regression analysis consists of a tool of statistical that examines the multiple
independent variables those are related to dependent variable means modeling a data set
with more than one independent variables and one dependent variable. The outcomes of
independent variables can be used to make much more powerful and accurate predictions.
The a, b1, b2, and bn in equation 4.7 called regression coefficient the b1 is indicate the
expected change in Y the dependent variable per unit change in X1 when X2 (dependent
variables) is held constant, similarly for b2. The linear word is used from the equation 4.7
it is a linear function of the unknown parameters a, b1, b2, bn.
Compares means between the independent groups. It’s more likely to identify analysis of
variance ANOVA in terms of factors with levels.) a factor is an independent variable (i.e.,
some property, characteristic, or quality that can be manipulated) that is being used as a
predictor or “explainer of variance” in the data analysis. In most cases, each specific value
of the independent variable defines a level within the factor. The Equation 4.7 was shown
below are (MLE) to estimate the corrosion of the pipeline.
…bnXn (4.7)

43
CHAPTER 5
RESULTS AND DISSCUSION
5.1 pH Test
pH examination were performed in the Sulaymaniyah Constructional Laboratories
according to the procedure outlined in (BS 1377-3:1990/ Appendix 2). The device used in
the study was G038-B028 hanna portable pH meter. The sample prepared as mentioned, 30
g of soil and 70 g from soil sample in beaker as shown in Figure 5.1 (a and b), read the pH
(2 – 3) reading until the difference will be close to 0.05 pH units before being adopted. The
test outcomes of the samples are shown in Table (5.1).
(a) Agricultural site soil sample (b) Hills area soil sample
Figure 5.1: pH test
Table 5.1: pH test results
Samples pH meter reading
SS-1
SS-2
SS-3
SS-4
SS-5
SS-6
SS-7
SS-8
8.66
8.57
8.89
9.00
9.10
8.40
8.80
8.70

44
Sulaiman. et, al. (2014) found that in Iraqi soil when the pH adjusts from acidic to alkaline
then the corrosion will be decreased. Oguzie Et al. (2004) recommend that an underground
structure becomes sensitive to corrosion at any level of pH. Mostly it is concerned to take
note(s) of the inside of that pH scope of the range of (4 - 8.5) that iron may be free from.
The pH results of the soil samples in this investigation, the highest value of pH is 9.1 and
the lowest value of pH is 8.4. The result revealed that the soil were slightly corrosive to
non corrosive, the results of pH also shown that the soil samples are alkaline.
5.2 Moisture Test
Moisture test were performed in the Sulaymaniyah Constructional Laboratories according
to the procedure outlined in (ASTM D4643 – 08/ Appendix 2). The device used in this test
was A&B GR 120 analytical balance, H-30140E laboratory bench oven, digital series,
HUMBOLDT. Weighed out the sample was 200 g for each sample, the container was 100
g. the data obtained shown in Table 5.2.
Table 5.2: Mass of Samples before and after drying
Soil Sample Mass before drying,
g Mass after drying, g Mass of container, g
SS-1 200 193 100
SS-2
SS-3
SS-4
SS-5
SS-6
SS-7
SS-8
200
200
200
200
200
200
200
134
142
148
152
143
168
162
100
100
100
100
100
100
100
The moisture content in the soil samples were calculated according to Equation 4.1, the
result of moisture content shown in Table 5.3. It seems that the moisture content was

45
varied between 3.62% and 49.25% in the eight samples. Hence the regional area, climate
and year seasons has a key role to play in the determination of the water content in soil.
Table 5.3: Soil samples and their moisture contents
Soil Samples Moisture content, %
SS-1 3.62
SS-2
SS-3
SS-4
SS-5
SS-6
SS-7
SS-8
49.25
40.84
35.13
31.57
39.86
19.04
23.45
Gupta, (1979) evaluated the significant content of the moisture of the soils on the
corrosion of mild steel when it is more than (50%) holding limit, the other research were
done on the study of influence of soil properties on the buried pipelines and structure,
(Ismail and El-Shamy, 2009) discovered that the sensitive moisture content in a soil for
corrosion are between (50-60) % where shown in Figure 5.2 (Yahaya et, al. 2001) shows
that the high moisture content cause a quick growth of corrosion on X70 carbon steel
coupons. The results of moisture content of the soil samples in this region revealed that the
high moisture content cause corrosion rate in the pipe coupons increases and decreases in
low level of moisture content.
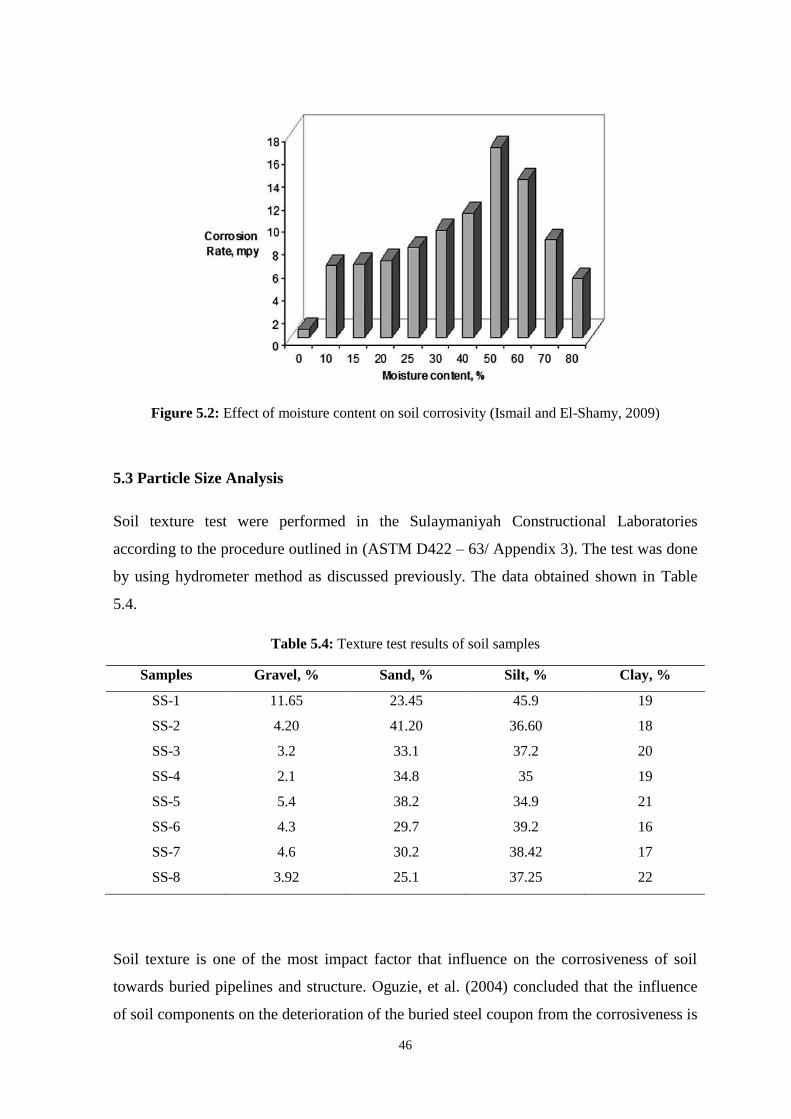
46
Figure 5.2: Effect of moisture content on soil corrosivity (Ismail and El-Shamy, 2009)
5.3 Particle Size Analysis
Soil texture test were performed in the Sulaymaniyah Constructional Laboratories
according to the procedure outlined in (ASTM D422 – 63/ Appendix 3). The test was done
by using hydrometer method as discussed previously. The data obtained shown in Table
5.4.
Table 5.4: Texture test results of soil samples
Samples Gravel, % Sand, % Silt, % Clay, %
SS-1 11.65 23.45 45.9 19
SS-2
SS-3
SS-4
SS-5
SS-6
SS-7
SS-8
4.20
3.2
2.1
5.4
4.3
4.6
3.92
41.20
33.1
34.8
38.2
29.7
30.2
25.1
36.60
37.2
35
34.9
39.2
38.42
37.25
18
20
19
21
16
17
22
Soil texture is one of the most impact factor that influence on the corrosiveness of soil
towards buried pipelines and structure. Oguzie, et al. (2004) concluded that the influence
of soil components on the deterioration of the buried steel coupon from the corrosiveness is

47
clay > loam > sand, Yahya, et al. (2011) discovered that the corrosion rate can be initiated
at a low level of clay content. The texture test shown that most of the soil samples were
(sandy) to (sand - silt) depends on previous research these kinds of soil are slightly
corrosive to non corrosive.
5.4 Corrosion Rate
The coupon initial weight and the final weight after test are presented in Table 5.5 to
decide the metal loss and hence, the corrosion rate.
The normal rate of corrosion will figured utilizing the accompanying mathematical
Equation 4.1; the data are tabulated in Table 5.5.
Table 5.5: Corrosion rate calculation
Soil
Samples
Initial
Weight,
g
Final
Weight,
g
Density
D
(g/cm3)
Factor
K for
mm/year
Surface
Area
cm2
Time
Exposure
T, hours
Corrosion
Rate
mm/year
SS-1 188.40 188.32 7.85 8.76*104
68 2160 0.0061
SS-2 188.40 186.50 7.85 8.76*104
68 2160 0.1444
SS-3 188.40 186.81 7.85 8.76*104
68 2160 0.1208
SS-4 188.40 187.00 7.85 8.76*104
68 2160 0.1064
SS-5 188.40 187.16 7.85 8.76*104
68 2160 0.0942
SS-6 188.40 186.85 7.85 8.76*104
68 2160 0.1178
SS-7 188.40 187.66 7.85 8.76*104
68 2160 0.0562
SS-8 188.40 187.49 7.85 8.76*104
68 2160 0.0691
When Table 5.5 is examined with Table 5.3 and Table 5.4, it can be seen that sample SS-2
which contained the highest moisture content (49.25%) is the most corrosive soil sample
toward pipe steel coupon.

48
5.5 Statistical Analysis
The statistical analyses were carried out by using multiple linear regression (MLR) and
analysis of Variances (ANOVA) of the IBM SPSS 20 software. The data are shown in
Table 5.6, 5.7 and 5.8.
Table 5.6: Model summary
Model R R2
Adjusted R2 Standard Error
of the Estimate
1 1.000a
0.999 0.999 0.0016496 a Predictors: (Constant), pH, Moisture and Clay
Table 5.7: Analysis of variance (ANOVA)a
Model Sum of
Squares df Mean Square F Sig.
1 Regression
Residual
Total
0.014
0.000
0.014
3
4
7
0.005
0.000
1662.53
2
0.000b
a Dependent Variable: Corrosion
b Predictors: (Constant), pH, Moisture and Clay
Table 5.8: Coefficient of regression a
Model
Un standardized
Coefficients
Standardized
Coefficients t Sig.
B Std.
Error Beta
(Constant)
X1 Moisture
X2 Clay
X3 pH
-0.049
0.003
0.000
0.006
0.025
0.000
0.000
0.003
1.000
-0.008
0.029
-1.907
69.679
-0.464
1.707
0.129
0.000
0.667
0.163 a Dependent Variable: Corrosion
To estimate the corrosion rate using multiple independent variables related to soil
parameters. The equation 4.6 in the previous chapter for the (MLR) can be written:

49
The table 5.6 which is a summary of the multiple regression analysis, the R2 (R square)
which is a measure of the extent of the degree of participation and effectiveness
independent variables (moisture, clay and pH) (predictors) in the rate of corrosion
(dependent variable) of the coupon, multiplying the R2 value by (100) means 99% of the
predictors have responsibility of corrosion in the coupon.
The table 5.7 represent the (ANOVA) is utilized for recognizing the elements essentially
influencing the rate of corrosion of the coupons. This analysis was conducted for
significance level of =0.05, for a confidence level of 95%. P-value (sig.) under 0.05 is
considered the independent variables to have a statistical contribution in corrosion conduct
of coupons. The significance (sig.) in table 5.7 is less than 0.05 so the variables have
significance affect the corrosion rate of the coupons.
Table 5.8 which represents the constant and the coefficient of the variables values in the
regression equation, and the P- value (sig.) of each predictors (moisture, clay and pH). The
P- value of the moisture content is less than 0.05 the sig. value of the moisture is (0.000),
for clay is (0.667) much greater than 0.05 and for the pH is (0.163) greater than 0.05 but
when it compare with the sig. value of clay content it have more effects on the soil
corrosivity toward buried pipe coupons, so the moisture content in the soil samples
considered having greater effect. This is in agreement with corrosion rate estimations given
in Table 5.5.
The coefficients of regression equation are represented in Table 5.8 which was used in the
typical linear regression equation 4.6 the final form of the regression equation (statistical
modeled corrosion rate) was shown in Equation 4.6
The estimated corrosion rate from statistical modeling was shown in Table 5.9 with
experimental corrosion rate of pipe coupons.

50
Table 5.9: Experimental corrosion rate and estimated corrosion rate
Soil samples
Experimental
Corrosion rate
(mm/year)
Estimated Corrosion
Rate (mm/year)
Absolute
Error
SS-1 0.0061 0.01382 -126.5 %
SS-2 0.1444 0.15017 -4.0 %
SS-3 0.1208 0.12686 -5.0 %
SS-4 0.1064 0.11039 -3.7 %
SS-5 0.0942 0.10031 -6.5 %
SS-6 0.1178 0.12098 -2.7 %
SS-7 0.0562 0.06092 -8.4 %
SS-8 0.0691 0.07355 -6.4 %
In summary, the most corrosive soil sample was the one (SS-2) with highest moisture
content (49.25%).

51
CHAPTER 6
CONCLUSIONS AND FUTURE WORK
6.1 Conclusions
In this investigation some of soil properties were investigated to study the effect of these
properties towards the corrosion of buried API 5L X70 pipeline steel.
The results of some soil properties and steel pipe coupons can be summarized as follows:
The pH value for eight soil samples shows the lowest value at 8.4 and the highest value at
9.1, these results revealed that the soils are non corrosive. The highest moisture content is
49.25%, the lowest is 3.62% and when the moisture content is high then, the corrosion will
increase. The clay content in the soil samples was varied between 16 % and 22 %. The clay
content in the soil is related with the aeration and the amount of holding water. This means
the high clay content may cause a high corrosion in the buried pipeline.
The experimental corrosion rate of buried steel coupon revealed the highest corrosion rate
of 0.1444 mm/year when moisture content was 49.25 %, pH 8.57 and clay content was 18
%. The lowest rate was 0.0061 mm/year with the moisture content was 3.62 %, pH 8.66
and clay content 19 %; therefore, the amount of moisture content has the highest effect on
rate of corrosion in steel coupons.
The estimated rate of corrosion on steel coupons revealed a closer result with the
experimental corrosion rate. The lowest value was 0.01382 mm/year and the highest value
was at 0.15017 mm/year, depending on the amount of moisture content and pH value.
It is concluded through the outcome of the tests for soil properties toward steel coupons
that both the experimental and also the estimated corrosion rates showed that the moisture
content ratio has the primary role in causing corrosion of steel coupons, and this was
followed by a lesser extent with pH and very small percentage with the clay content.

52
6.2 Future Work
In the future the other parameters of soil such as chloride and sulfite contents, resistivity of
the soil, redox potential and the mineral and organic contents in the soil should be studied
in different seasons of the year using different steel pipeline grades especially, those listed
under API 5L SPL 2 (Specific Product Level) which related with the chemical composition
and mechanical properties of a pipeline steel.
Also, a survey can be made on the effect of crude oil composition, velocity in the corrosion
of the inner surface of the pipeline, settlement of mud and residue inside the pipe during
maintenance, oil embargo, etc. The inspection should be made at directly the actual site.
53
REFERENCES
Ahmad, Z. (2006). Principles of Corrosion Engineering and Corrosion Control. Oxford:
Butterworth-Heinemann/IChemE Series.
Anyanwu, I. S., Eseonu, O., and Nwosu, H. U. (2014). Experimental investigations and
mathematical modelling of corrosion growth rate on carbon steel under the
influence of soil pH and resistivity. International organization of Scientific
Research Journal of Engineering, 4(10), 7-18.
Baker, M. (2008). Pipeline Corrosion. Phoenix: U.S. Department of Transportation
Pipeline and Hazardous Materials Safety Administration Office of Pipeline Safety.
Bhattarai, J. (2013). Study on the corrosive nature of soil towards the buried-structures.
Scientific World, 11(11) 43-47.
Bradford, S. A. (2001). Practical Handbook of Corrosion Control in Soils: Pipelines,
Tanks, Casings, Cables. Edmonton: Casti Publishing Ltd.
Callister, W. D. (1997). Material Science and Engineering: an Introduction. New York:
John Willy & Sons.
Camitz, G. (1998). Corrosion and Protection of Steel Piles and Sheet Piles in Soil and
Water. Stockholm: Swedish Commission on Pile Research.
Chilingar, G., Mourhatch, R., and Al-Qahtani, G. (2008). The Fundamentals of Corrosion
and Scaling for Petroleum and Environmental Engineers. Houston, Texas: Gulf
Publishing Company.
Cole, I., and Marney, D. (2012). The science of pipe corrosion: A review of the literature
on the corrosion of ferrous metals in soils. Corrosion Science, 56(14), 5-16.
Emmanuel, C., Odio, O., Chukwuneke, J., and Sinebe., E. (2014). Investigation of the
effect of corrosion on mild steel in five different environments. International
Journal of Scientific & Technology Research Volume, 3(7), 306-310.
Ferreira, C., and Ponciano, J. (2006). Determination of the soil corrosivity of samples from
southeastern Brazilian region. Eurocorr, 5(1), 38-70.
54
Gupta SK. (1979). The critical soil moisture content in the underground corrosion of mild
steel. Corrosion Science, 19(3), 171-178.
Ikechukwu, A. S., Ugochukwu, N. H., Ejimofor, R. A., and Obioma, E. (2014). Correlation
between soil properties and external corrosion growth rate of carbon steel. The
International Journal of Engineering and Science, 3(10) 38-47.
Ismail, A., and El-Shamy, A. (2009). Engineering behavior of soil materials on the
corrosion of mild steel. Applied Clay Science, 42(3-4), 356-362.
Jones, D. A. (1992). Principles and Prevention of Corrosion. New York: MacMillan
Publishing Company.
Kleiner, Y., Rajani, B., and Krys, D. (2012). Impact of soil properties on pipe corrosion:
Re-examination of traditional conventions. 12th Annual International Conference
on Water Distribution Systems Analysis. (pp. 968-982). Tucson, AZ.
Koch, G. H., Brongers, M. P., Thompson, N. G., Virmani, Y. P., and Payer, J. H. (2002).
Corrosion Costs and Preventive Strategies in the United States. McLean, Virginia:
Federal Highway Administration, U.S. Department of Transportation.
Landau, S., and Everitt, B. S. (2004). A Handbook of Statistical Analyses Using SPSS.
London: Chapman & Hall/CRC Press LLC.
Liu, H. (2003). Pipeline Engineering. Florida: Lewis Publishers.
Norhazilan, M., Nordin, Y., K.S. Lim, R. S., Safuan, A., and Norhamimi, M. (2012).
Relationship between soil properties and corrosion of carbon steel. Journal of
Applied Sciences Research, 8(3), 1739-1747.
Oguzie, E., Agochukwu, I., and Onuchukwu, A. (2004). Monitoring the corrosion
susceptibility of mild steel in varied soil textures by corrosion product count
technique. Materials Chemistry and Physics, 84(1), 1-6.
OSSAI, C. I. (2013). Pipeline corrosion prediction and reliability analysis: A systematic
approach with Monte Carlo simulation and degradation models. International
Journal of Scientific and Technology Research, 2(3), 58 - 69.

55
Parker, M., and Peattie, E. (1999). Pipe Line Corrosion and Cathodic Protection. Houston:
Gulf Professional Publishing.
Pritchard, O., Hallett, S. H., and Farewell, T. S. (2013). Soil Corrosivity in the UK -
Impact on Critical Infrastructure. Infrastructure Transitions Research Consortium.
Cranfield University.
Revie, R., and Uhlig, H. (2008). Corrosion and Corrosion Control an Introduction to
Corrosion Science and Engineering. Hoboken, New Jersey: A John Wiley & Sons.
Ricker, R. E. (2010). Analysis of pipeline steel corrosion data from NBS (NIST) studies
conducted between 1922-1940 and relevance to pipeline management. Journal of
Research of the National Institute of Standards and Technology, 115(10), 373-392.
Roberge, P. (1999). Handbook of Corrosion Engineering. New York: McGraw-Hill
Companies.
Roberge, R. (2008). Corrosion Engineering Principles and Practice. New York: McGraw-
Hill Companies.
Saupi, S., Sulaiman, M., and Masri, M. (2015). Effects of soil properties to corrosion of
underground pipelines: A review. Journal of Tropical Resources and Sustainable
Science, 3(2), 14-18.
Shreir, L., Jarman, R., and Burstein, G. (2000). Corrosion Volume 1: Metal/Environment
Reactions. Oxford: Butterworth-Heinemann.
Sulaiman, Q., Taie, A., and Hassan, M. (2014). Evaluation of sodium chloride and acidity
effect on corrosion of buried carbon steel pipeline in Iraqi soil. Iraqi Journal of
Chemical and Petroleum Engineering, 29(9), 1-8.
Velázquez, J., Caleyo, F., Valor, A., and Hallen, J. (2009). Predictive model for pitting
corrosion in buried oil and gas pipelines. NACE International Corrosion
Engineering Section, 65(5), 332 342.
Waltham, T. (2002). Foundations of Engineering Geology. London: Spon Press.
Wilmott, M., and Jack, T. (2000). Corrosion by Soils. London: John Wiley and Sons.

56
Yahaya, N., Lim, K., Noor, N., Othman, S., and Abdullah, A. (2011). Effects of clay and
moisture content on soil-corrosion dynamic. Malaysian Journal of Civil
Engineering, 8(3), 24-32.

57
APPENDICES
58
APPENDIX 1
(BS 1377-3:1990) BRITISH STANDARD

59
9 Determination of the pH value The requirements of Part 1 of this standard, where
appropriate, shall apply to this test method.
9.1 General
This clause describes the procedure for determining
the pH value, by the electrometric method, which
gives a direct reading of the pH value of a soil
suspension in water. This method can also be used
for determining the pH value of a sample of ground
water. NOTE Good practice in chemical testing requires that duplicate
specimens should be tested. In each of the test methods the
measurement of only one value of the overall result is described.
It is recognized that it is necessary in many practical applications
to make a number of tests in order to obtain a mean value and an indication of the realiability of the results. Guidance on the
number of measurements required and the treatment of the
results obtained is beyond the scope of this Part of this standard.
9.2 Apparatus
9.2.1 Apparatus for preparation of test specimens
9.2.1.1 Balance, readable to 0.001 g.
9.2.1.2 Pestle and mortar, or a suitable mechanical
crusher.
9.2.1.3 Test sieve, of 2 mm aperture size, with
receiver.
9.2.1.4 Non-corrodible tray.
9.2.2 Apparatus for electrometric method of pH
determination
9.2.2.1 pH meter, fitted with a glass electrode and a
calomel reference electrode (which may be
incorporated in one probe) covering the range pH 3.0
to pH 10.0. The scale shall be readable and accurate
to 0.05 pH units.
9.2.2.2 Three 100 mL glass or plastics beakers with
cover glasses and stirring rods.
9.2.2.3 Two 500 mL volumetric flasks.
9.2.2.4 Wash bottle, preferably made of plastics,
containing distilled water.
9.3 Reagents
9.3.1 General. All reagents shall be of recognized
analytical reagent quality.
9.3.2 Buffer solution, pH 4.0. Dissolve 5.106 g of
potassium hydrogen phthalate in distilled water
and dilute to 500 mL with distilled water.
Alternatively, a proprietary buffer solution of pH 4.0
may be used.
9.3.3 Buffer solution, pH 9.2. Dissolve 9.54 g of
sodium tetraborate (borax) in distilled water and
dilute to 500 mL. Alternatively, a proprietary buffer
solution of pH 9.2 may be used.
9.3.4 Potassium chloride. Saturated solution (for
maintenance of the calomel electrode).
9.4 Preparation of test specimen
9.4.1 Obtain an initial sample as described in 7.3,
and of the appropriate size specified in 7.5 of
BS 1377-1:1990.
9.4.2 Allow the sample to air-dry by spreading out
on a tray exposed to air at room temperature.
9.4.3 Sieve the sample on a 2 mm test sieve (if
appropriate, guarded by a sieve of larger aperture)
and crush retained particles other than stones to
pass through the 2 mm test sieve.
9.4.4 Reject the stones, ensuring that no fine
material adheres to them, e.g. by brushing. Record
the mass m2 (in g) of the sample passing the 2 mm
test sieve to the nearest 0.1 %. Throughout these
and subsequent operations ensure that there is no
loss of fines.
9.4.5 Divide the material passing the 2 mm test
sieve by successive riffling through the 15 mm
divider to produce a representative test sample
of 30 g to 35 g.
9.5 Electrometric method of pH determination
9.5.1 From the sample obtained as described in 9.4,
weigh out 30 ± 0.1 g of soil and place in a 100 mL
beaker.
9.5.2 Add 75 mL of distilled water to the beaker, stir
the suspension for a few minutes, cover with a cover
glass and allow to stand for at least 8 h. NOTE The pH value of a soil suspension varies with the ratio
of soil to water, an increase in dilution bringing the pH closer to 7.
9.5.3 Stir the suspension again immediately before
testing.
9.5.4 Calibrate the pH meter by using the standard
buffer solutions, following the procedure
recommended by the manufacturer.
9.5.5 Wash the electrode with distilled water and
immerse in the soil suspension. Take two or three
readings of the pH of the suspension with brief
stirrings between each reading. These readings
shall agree to within 0.05 pH units before being
accepted. NOTE The pH readings of the soil suspension should reach a
constant value in about 1 min. No readings should be taken until the pH meter has reached equilibrium.
9.5.6 Remove the electrodes from the suspension
and wash them with distilled water. Re-check the
calibration of the pH meter against one of the
standard buffer solutions.
9.5.7 If the instrument is out of adjustment by more
than 0.05 pH units, set it to the correct adjustment
and repeat steps 9.5.5 and 9.5.6 until consistent
readings are obtained.
9.5.8 When not in use, leave the electrode standing
in a beaker of distilled water.
9.6 Test Report
The test report shall state that the test was caried
out in accordance with 9.5 of BS 1377-3:1990 and
shall contain the following information: a) the method of test used;
b) the pH value of the soil suspension to the nearest 0.1 pH
unit;
c) the information required by 9.1 of BS 1377-1:1990.

60
APPENDIX 2
(ASTM D4643-08) AMERICAN SOCIETY FOR TESTING AND MATERIA
Designation: D 4643 – 08
Standard Test Method for
Determination of Water (Moisture) Content of Soil by Microwave Oven Heating1
This standard is issued under the fixed designation D 4643; the number immediately following the designation indicates the year of
original adoption or, in the case of revision, the year of last revision. A number in parentheses indicates the year of last reapproval. A
superscript epsilon (e) indicates an editorial change since the last revision or reapproval. This standard has been approved for use by agencies of the Department of Defense.
1. Scope*
1.1 This test method outlines procedures for determining the
water (moisture) content of soils by incrementally drying soil
in a microwave oven.
1.2 This test method can be used as a substitute for Test
Method D 2216 when more rapid results are desired to
expedite other phases of testing and slightly less accurate
results are acceptable.
1.3 When questions of accuracy between this test method
and Test Method D 2216 arise, Test Method D 2216 shall be
the referee method.
1.4 This test method is applicable for most soil types. For
some soils, such as those containing significant amounts of
halloysite, mica, montmorillonite, gypsum or other
hydratedmaterials, highly organic soils, or soils in which the
pore water contains dissolved solids (such as salt in the case
of marine deposits), this test method may not yield reliable
water content values.
1.5 The values stated in SI units are to be regarded as the
standard. No other units of measurement are included in this
test method.
1.6 Refer to Practice D 6026 for guidance concerning the
use of significant figures. This is especially important if the
water content will be used to calculate other relationships
such as moist mass to dry mass or vice versa, wet unit weight
to dry unit weight or vice versa, and total density to dry
density or vice versa. For example, if four significant digits
are required
in any of the above calculations, then the water content has to
be recorded to the nearest 0.1 %. This occurs since 1 plus the
water content (not in percent) will have four significant digits
regardless of what the value of the water content is; that is, 1
plus 0.1/100 = 1.001, a value with four significant digits.
While, if three significant digits are acceptable, then the
water content can be recorded to the nearest 1 %.
1.7 This standard does not purport to address all of then
safety concerns, if any, associated with its use. It is the
responsibility of the user of this standard to establish
appropriate safety and health practices and determine the
applicability of regulatory limitations prior to use. See
Section 7.
2. Referenced Documents
2.1 ASTM Standards: 2
D 653 Terminology Relating to Soil, Rock, and
Contained Fluids
D 2216 Test Methods for Laboratory Determination of
Water (Moisture) Content of Soil and Rock by Mass
D 3740 Practice for Minimum Requirements for Agencies
Engaged in the Testing and/or Inspection of Soil and
Rock as Used in Engineering Design and Construction
D 4753 Guide for Evaluating, Selecting, and Specifying
Balances and Standard Masses for Use in Soil, Rock, and
Construction Materials Testing
D 6026 Practice for Using Significant Digits in
Geotechnical Data
3. Terminology
3.1 Definitions:
3.1.1 All definitions are in accordance with Terminology
D 653.
3.2 Definitions of Terms Specific to This Standard:
3.2.1 microwave heating—a process by which heat is
induced within a material due to the interaction between
dipolar molecules of the material and an alternating, high
frequency electric field. Microwaves are electromagnetic
waves with 1 mm to 1 m wavelengths.
3.2.2 water (moisture) content—the ratio, expressed as a
percentage, of the mass of “pore” or “free” water in a
given mass of soil to the mass of the solid particles.

61
APPENDIX 3
(ASTM D422-63) AMERICAN SOCIETY FOR TESTING AND MATERIAL
Designation: D 422 – 63 (Reapproved 1998)
Standard Test Method for
Particle-Size Analysis of Soils1
This standard is issued under the fixed designation D 422; the number immediately following the designation indicates the year of
original adoption or, in the case of revision, the year of last revision. A number in parentheses indicates the year of last reapproval. A
superscript epsilon (e) indicates an editorial change since the last revision or reapproval.
A5- ASTM G1-90 American Society for Testing Material: Standard Practice for
Preparing, Cleaning and Evaluating Corrosion Test Specimen.
1. Scope
1.1 This test method covers the quantitative determination
of the distribution of particle sizes in soils. The distribution of
particle sizes larger than 75 μm (retained on the No. 200 sieve)
is determined by sieving, while the distribution of particle sizes
smaller than 75 μm is determined by a sedimentation process,
using a hydrometer to secure the necessary data (Note 1 and
Note 2). NOTE 1—Separation may be made on the No. 4 (4.75-mm), No. 40
(425-μm), or No. 200 (75-μm) sieve instead of the No. 10. For whatever
sieve used, the size shall be indicated in the report.
NOTE 2—Two types of dispersion devices are provided: (1) a highspeed
mechanical stirrer, and (2) air dispersion. Extensive investigations
indicate that air-dispersion devices produce a more positive dispersion of
plastic soils below the 20-μm size and appreciably less degradation on all
sizes when used with sandy soils. Because of the definite advantages
favoring air dispersion, its use is recommended. The results from the two
types of devices differ in magnitude, depending upon soil type, leading to
marked differences in particle size distribution, especially for sizes finer
than 20 μm.
2. Referenced Documents
2.1 ASTM Standards:
D 421 Practice for Dry Preparation of Soil Samples for
Particle-Size Analysis and Determination of Soil Constants2
E 11 Specification for Wire-Cloth Sieves for Testing Purposes3
E 100 Specification for ASTM Hydrometers4
3. Apparatus
3.1 Balances—A balance sensitive to 0.01 g for weighing
the material passing a No. 10 (2.00-mm) sieve, and a balance
sensitive to 0.1 % of the mass of the sample to be weighed for
weighing the material retained on a No. 10 sieve.
3.2 Stirring Apparatus—Either apparatus A or B may be
used.
3.2.1 Apparatus A shall consist of a mechanically operated
stirring device in which a suitably mounted electric motor
turns a vertical shaft at a speed of not less than 10 000 rpm
without
load. The shaft shall be equipped with a replaceable stirring
paddle made of metal, plastic, or hard rubber, as shown in
Fig.1. The shaft shall be of such length that the stirring
paddle will operate not less than 3⁄4 in. (19.0 mm) nor more
than 11⁄2 in. (38.1 mm) above the bottom of the dispersion
cup. A special dispersion cup conforming to either of the
designs shown in Fig. 2 shall be provided to hold the sample
while it is being dispersed.
3.2.2 Apparatus B shall consist of an air-jet dispersion cup5
(Note 3) conforming to the general details shown in Fig. 3
(Note 4 and Note 5). NOTE 3—The amount of air required by an air-jet dispersion cup is of
the order of 2 ft3/min; some small air compressors are not capable of
supplying sufficient air to operate a cup.
NOTE 4—Another air-type dispersion device, known as a dispersion
tube, developed by Chu and Davidson at Iowa State College, has been
shown to give results equivalent to those secured by the air-jet
dispersion
cups. When it is used, soaking of the sample can be done in the
sedimentation cylinder, thus eliminating the need for transferring the
slurry. When the air-dispersion tube is used, it shall be so indicated in
the
report.
NOTE 5—Water may condense in air lines when not in use. This water
must be removed, either by using a water trap on the air line, or by
blowing the water out of the line before using any of the air for
dispersion
purposes.
3.3 Hydrometer—An ASTM hydrometer, graduated to read
in either specific gravity of the suspension or grams per litre
of suspension, and conforming to the requirements for
hydrometers 151H or 152H in Specifications E 100.
Dimensions of both hydrometers are the same, the scale
being the only item of difference.
3.4 Sedimentation Cylinder—Aglass cylinder essentially 18
in. (457 mm) in height and 21⁄2 in. (63.5 mm) in diameter, and
marked for a volume of 1000 mL. The inside diameter shall
be such that the 1000-mL mark is 36 6 2 cm from the bottom
on the inside.
3.5 Thermometer—A thermometer accurate to 1°F (0.5°C).
3.6 Sieves—A series of sieves, of square-mesh woven-wire
cloth, conforming to the requirements of Specification E 11.
A full set of sieves includes the following (Note 6):

62
APPENDIX 4
(ASTM D4220-95) AMERICAN SOCIETY FOR TESTING MATERIAL
Designation: D 4220 – 95 (Reapproved 2000)
Standard Practices for
Preserving and Transporting Soil Samples1 This standard is issued under the fixed designation D 4220; the number immediately following the designation indicates the year of original adoption or, in the case of revision, the year of last revision. A number in parentheses indicates the year of last reapproval. A
superscript epsilon (e) indicates an editorial change since the last revision or reapproval.
1. Scope *
1.1 These practices cover procedures for preserving soil
samples immediately after they are obtained in the field and
accompanying procedures for transporting and handling the
samples.
1.2 Limitations—These practices are not intended to address
requirements applicable to transporting of soil samples
known or suspected to contain hazardous materials.
1.3 This standard does not purport to address all of the
safety concerns, if any, associated with its use. It is the
responsibility of the user of this standard to establish appropriate
safety and health practices and determine the applicability
of regulatory limitations prior to use. See Section 7.
2. Referenced Documents
2.1 ASTM Standards:
D 420 Guide to Site Characterization for Engineering, Design,
and Construction Purposes2
D 653 Terminology Relating to Soil, Rock, and Contained Fluids2
D 1452 Practice for Soil Investigation and Sampling by
Auger Borings2
D 1586 Test Method for Penetration Test and Split-Barrel
Sampling of Soils2
D 1587 Practice for Thin-Walled Tube Sampling of Soils2
D 2488 Practice for Description and Identification of Soils
(Visual-Manual Procedure)2
D 3550 Practice for Ring-Lined Barrel Sampling of Soils2
D 4564 Test Method for Density of Soil in Place by the
Sleeve Method2 D 4700 Guide for Soil Sampling from the Vadose
Zone2
3. Terminology
3.1 Terminology in these practices is in accordance with
Terminology D 653.
4. Summary of Practices
4.1 The various procedures are given under four groupings
as follows:
4.1.1 Group A—Samples for which only general visual
identification is necessary.
4.1.2 Group B—Samples for which only water content and
classification tests, proctor and relative density, or profile
logging is required, and bulk samples that will be remolded or
compacted into specimens for swell pressure, percent swell,
consolidation, permeability, shear testing, CBR, stabilimeter,
etc.
4.1.3 Group C—Intact, naturally formed or field
fabricated, samples for density determinations; or for
swell pressure, percent swell, consolidation,
permeability testing and shear testing with or without
stress-strain and volume change measurements,
to include dynamic and cyclic testing.
4.1.4 Group D—Samples that are fragile or highly
sensitive for which tests in Group C are required.
4.2 The procedure(s) to be used should be included in
the project specifications or defined by the designated
responsible person.
5. Significance and Use
5.1 Use of the various procedures recommended in
these practices is dependent on the type of samples
obtained (Practice D 420), the type of testing and
engineering properties required, the fragility and
sensitivity of the soil, and the climatic conditions. In
all cases, the primary purpose is to preserve the
desired inherent conditions.
5.2 The procedures presented in these practices were
primarily developed for soil samples that are to be
tested for engineering properties, however, they may
be applicable for samples of soil and other materials
obtained for other purposes.
6. Apparatus
6.1 The type of materials and containers needed
depend upon the conditions and requirements listed
under the four groupings A to D in Section 4, and also
on the climate and transporting mode and distance.
6.1.1 Sealing Wax, includes microcrystalline wax,
paraffin, beeswax, ceresine, carnaubawax, or
combinations thereof.
6.1.2 Metal Disks, about 1⁄16 in. (about 2 mm) thick
and having a diameter slightly less than the inside
diameter of the tube, liner, or ring and to be used in
union with wax or caps and tape, or both.
6.1.3 Wood Disks, prewaxed, 1 in. (25 mm) thick and
having a diameter slightly less than the inside
diameter of the liner or tube.
63
APPENDIX 5
(ASTM G1-90) AMERICAN SOCIETY FOR TESTING MATERIAL

64
APPENDIX 6
(ASTM G16-13) AMERICAN SOCIETY FOR TESTING MATERIAL
Designation: G16 − 13
Standard Guide for
Applying Statistics to Analysis of Corrosion Data1 This standard is issued under the fixed designation G16; the number immediately following the designation indicates the year of original
adoption or, in the case of revision, the year of last revision. A number in parentheses indicates the year of last reapproval. A superscript
epsilon (´) indicates an editorial change since the last revision or reapproval.
1. Scope
1.1 This guide covers and presents briefly some generally
accepted methods of statistical analyses which are useful in the
interpretation of corrosion test results.
1.2 This guide does not cover detailed calculations and methods,
but rather covers a range of approaches which have found
application in corrosion testing.
1.3 Only those statistical methods that have found wide
acceptance in corrosion testing have been considered in this guide.
1.4 The values stated in SI units are to be regarded as standard.
No other units of measurement are included in this standard.
2. Referenced Documents
2.1 ASTM Standards:2
E178 Practice for Dealing With Outlying Observations
E691 Practice for Conducting an Interlaboratory Study to
Determine the Precision of a Test Method
G46 Guide for Examination and Evaluation of Pitting Corrosion
IEEE/ASTM SI 10 American National Standard for Use of the
International System of Units (SI): The Modern Metric
System
3. Significance and Use
3.1 Corrosion test results often show more scatter than many other
types of tests because of a variety of factors, including the fact
that minor impurities often play a decisive role in controlling
corrosion rates. Statistical analysis can be very helpful in allowing
investigators to interpret such results, especially in determining
when test results differ from one another significantly. This can be
a difficult task when a variety
of materials are under test, but statistical methods provide a
rational approach to this problem.
3.2 Modern data reduction programs in combination with
computers have allowed sophisticated statistical analyses on data
sets with relative ease. This capability permits investigators to
determine if associations exist between many variables and, if so,
to develop quantitative expressions relating the variables.
3.3 Statistical evaluation is a necessary step in the analysis of
results from any procedure which provides quantitative
information. This analysis allows confidence intervals to be
estimated from the measured results.
4. Errors
4.1 Distributions—In the measurement of values
associated with the corrosion of metals, a variety of
factors act to produce measured values that deviate
from expected values for the conditions that are
present. Usually the factors which contribute to the
error of measured values act in a more or less
random way so that the average of several values
approximates the expected value better than a single
measurement. The pattern in which data are scattered
is called its distribution, and a
variety of distributions are seen in corrosion work.
4.2 Histograms—A bar graph called a histogram may
be used to display the scatter of the data. A
histogram is constructed by dividing the range of
data values into equal intervals on the abscissa axis
and then placing a bar over each interval of a height
equal to the number of data points within that
interval. The number of intervals should be few
enough so that almost all intervals contain at least
three points; however, there should be a sufficient
number of intervals to facilitate visualization of the
shape and symmetry of the bar heights. Twenty
intervals are usually recommended for a histogram.
Because so many points are required to construct a
histogram, it is unusual to find data sets in corrosion
work that lend themselves to this type of analysis.
4.3 Normal Distribution—Many statistical
techniques are based on the normal distribution. This
distribution is bellshaped and symmetrical. Use of
analysis techniques developed for the normal
distribution on data distributed in another manner
can lead to grossly erroneous conclusions. Thus,
before attempting data analysis, the data should
either be verified as being scattered like a normal
distribution, or a transformation

65
APPENDIX 7
(ASTM G31-72) AMERICAN SOCIETY FOR TESTING AND MATERIAL
Designation: G 31 – 72 (Reapproved 2004)
Standard Practice for
Laboratory Immersion Corrosion Testing of Metals1 This standard is issued under the fixed designation G 31; the number immediately following the designation indicates the year of original
adoption or, in the case of revision, the year of last revision. A number in parentheses indicates the year of last reapproval. A superscript
epsilon (e) indicates an editorial change since the last revision or reapproval.
A8- ASTM G162-99 American Society for Testing and Material: Standard Practice for
Conducting and Evaluating Laboratory Corrosions Tests in Soils.
1. Scope
1.1 This practice2 describes accepted procedures for and
factors that influence laboratory immersion corrosion tests,
particularly mass loss tests. These factors include specimen
preparation, apparatus, test conditions, methods of cleaning
specimens, evaluation of results, and calculation and reporting
of corrosion rates. This practice also emphasizes the importance
of recording all pertinent data and provides a checklist
for reporting test data. Other ASTM procedures for laboratory
corrosion tests are tabulated in the Appendix. (Warning—In
many cases the corrosion product on the reactive metals
titanium and zirconium is a hard and tightly bonded oxide that
defies removal by chemical or ordinary mechanical means. In
many such cases, corrosion rates are established by mass gain
rather than mass loss.)
1.2 The values stated in SI units are to be regarded as the
standard. The values given in parentheses are for information
only.
1.3 This standard does not purport to address all of the
safety concerns, if any, associated with its use. It is the
responsibility of the user of this standard to establish appropriate
safety and health practices and determine the applicability
of regulatory limitations prior to use.
2. Referenced Documents
2.1 ASTM Standards: 3
A 262 Practices for Detecting Susceptibility to Intergranular
Attack in Austenitic Stainless Steels
E 8 Test Methods for Tension Testing of Metallic Materials
G 1 Practice for Preparing, Cleaning, and Evaluating Corrosion
Test Specimens
G 4 Guide for Conducting Corrosion Coupon Tests in Field
Applications
G 16 Guide for Applying Statistics to Analysis of Corrosion
Data
G 46 Guide for Examination and Evaluation of Pitting Corrosion.
3. Significance and Use
3.1 Corrosion testing by its very nature precludes
completestandardization. This practice, rather than a
standardized procedure, is presented as a guide so that
some of the pitfalls of such testing may be avoided.
3.2 Experience has shown that all metals and alloys do
not respond alike to the many factors that affect
corrosion and that “accelerated” corrosion tests give
indicative results only, or may even be entirely
misleading. It is impractical to propose an inflexible
standard laboratory corrosion testing procedure for
general use, except for material qualification tests
where standardization is obviously required.
3.3 In designing any corrosion test, consideration must
be given to the various factors discussed in this
practice, because these factors have been found to
affect greatly the results obtained.
4. Interferences
4.1 The methods and procedures described herein
represent the best current practices for conducting
laboratory corrosion tests as developed by corrosion
specialists in the process industries. For proper
interpretation of the results obtained, the specific
influence of certain variables must be considered.
These include:
4.1.1 Metal specimens immersed in a specific hot liquid
may not corrode at the same rate or in the same manner
as in equipment where the metal acts as a heat transfer
medium in heating or cooling the liquid. If the
influence of heat transfer effects is specifically of
interest, specialized procedures (in which the corrosion
specimen serves as a heat transfer agent) must be
employed (1).4
4.1.2 In laboratory tests, the velocity of the
environment relative to the specimens will normally be
determined by convection currents or the effects
induced by aeration or boiling or both. If the specific
effects of high velocity are to be studied, special
techniques must be employed to transfer the

66
APPENDIX 8
(ASTM G162-99) AMERICAN SOCIETY FOR TESTING AND MATERIAL
67
APPENDIX 9
(API 5L) AMERICAN PETROLEUM INSTITUTE
API 5L

68
1 Scope 1.1 PURPOSE AND COVERAGE The purpose of this specification is to provide standards for
pipe suitable for use in conveying gas, water, and oil in both
the oil and natural gas industries. This specification covers
seamless and welded steel line pipe. It includes plain-end,
threaded-end, and belled-end pipe, as well as through-the-ftowline
(TFL) pipe and pipe with ends prepared for use with special
couplings. Although the plain-end line pipe meeting this
specification is primarily intended for field makeup by
circumferential welding, the manufacturer will not assume
responsibility for field welding.
1.2 PRODUCT SPECIFICATION LEVEL (PSL) This specification establishes requirements for two product
specification levels (PSL I and PSL 2). These two PSL
designations
define different levels of standard technical requirements.
PSL 2 has mandatory requirements for carbon
equivalent, notch toughness, maximum yield strength, and
maximum tensile strength. These and other differences are
summarized in Appendix 1.
Requirements that apply to only PSL I or only PSL 2 are
so designated. Requirements that are not designated to a specific
PSL apply to both PSL I and PSL 2.
The purchaser may add requirements to purchase orders
for either PSL I or PSL 2, as provided by the supplementary
requirements (Appendix F) and other options (4.2 and 4.3).
1.3 GRADES The grades (see the note) covered by this specification are
the standard Grades A25, A, B, X42, X46, X52, X56, X60,
X65, X70 and X80; and any intermediate grades (grades that
are higher than X42, intermediate to two sequential standard
grades, and agreed upon by the purchaser and manufacturer).
PSL I pipe can be supplied in Grades A25 through X70.
PSL 2 pipe can be supplied in Grades B through X80.
Class II (CI II) steel is rephosphorized and probably has
better threading properties than Class I (CI l). Because Class
II (CI II) has higher phosphorus content than Class I (CI l), it
may be somewhat more difficult to bend.
Pipe manufactured as Grade X60 or higher shall not be
substituted for pipe ordered as Grade X52 or lower without
purchaser approval.
1.4 DIMENSIONS The sizes used herein are dimensionless designations,
which are derived from the specified outside diameter
as measured in U.S. Customary units, and provide a
convenient method of referencing pipe size within the
text and tables (but not for order descriptions). Pipe
sizes 23/8 and larger are expressed as integers and
fractions; pipe sizes smaller than 23/8 are expressed
to three decimal places. These sizes replace the "size
designation" and the "nominal size designation" used
in the previous edition of this specification. Users of
this specification who are accustomed to specifying
nominal sizes rather than 00 sizes are advised to
familiarize themselves with these new size
designations used in this specification, especially the
usage in Tables 4, 5, and 6A. PSL I pipe can be
supplied in sizes ranging from 0.405 through 80.
PSL 2 pipe can be supplied in sizes ranging from 4'/2
through 80. Dimensional requirements on threads and
thread gages, stipulations on gaging practice, gage
specifications and certification, as well as instruments
and methods for inspection of threads are given in
API Standard 5B and are applicable to threaded
products covered by this specification.
1.5 UNITS U.S. Customary units are used in this specification; SI
(metric) units are shown in parentheses in the text and
in many tables. The values stated in either U.S.
Customary units or SI units are to be regarded
separately as standard. The values stated are not
necessarily exact equivalents; therefore, each system
is to be used independently of the other, without
combining values for any specific order item.
See Appendix M for specific information about
rounding procedures and conversion factors.
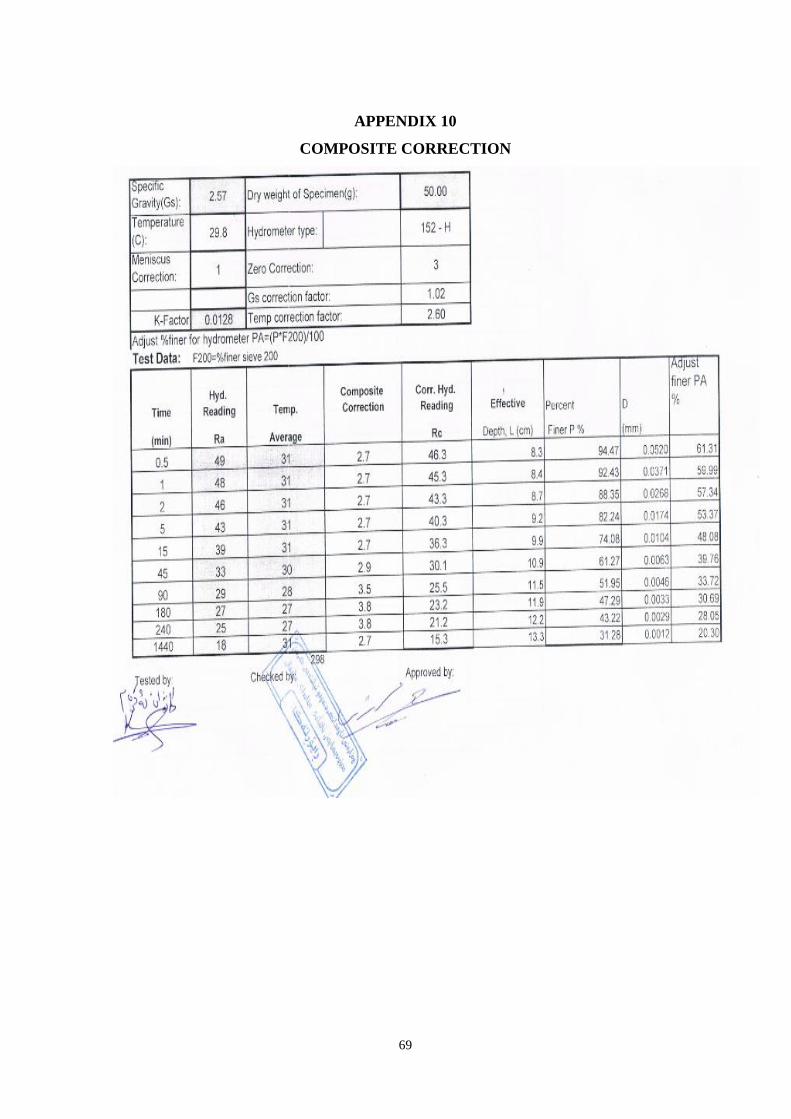
69
APPENDIX 10
COMPOSITE CORRECTION
Related Documents