C oronavirus disease (COVID-19), caused by severe acute respiratory syndrome coronavirus 2 (SARS- CoV-2), emerged in China in December 2019 (1) and by September 14, 2020, had spread worldwide, caus- ing >28.6 million cases and >917,000 deaths (2). To suppress the epidemic curve, public health authori- ties needed to use the strongest possible mitigation strategies until effective therapies and vaccines are available. Central mitigation strategies include non- pharmaceutical interventions, such as travel-related restrictions, case-based, and social distancing inter- ventions. Social distancing aims to decrease social contacts and reduce transmission (3). In Greece, the first COVID-19 case was reported on February 26, 2020 (4). Soon after, several social distancing, travel-related, and case-based interven- tions were implemented. A nationwide lockdown restricting all nonessential movement throughout the country began on March 23 (Figure 1). By the end of April, the first epidemic wave had waned, and withdrawal of physical distancing interventions became a social priority. Despite an ongoing severe financial crisis and an older population, Greece has been noted as an ex- ample of a country with successful response against COVID-19 (5). However, given the resurgence of cases in Greece and other countries, careful consid- eration and close monitoring are needed to inform strategies for resuming and maintaining social and economic activities. We describe a survey implemented during lock- down in Greece and assess the effects of physical distancing measures on contact behavior. We used these data and mathematical modeling to obtain es- timates for the first epidemic wave in the country, during February–April 2020, to assess the effects of all social distancing measures, and to assess the rela- tive contribution of each measure towards the con- trol of COVID-19. Materials and Methods Social Contacts Survey We conducted a phone survey during March 31– April 7, 2020, to estimate the number of social contacts and age mixing of the population on a weekday during the lockdown and on the same day of the week before the pandemic, during mid-January 2020, by using contact diaries (Ap- pendix Figure 1, https://wwwnc.cdc.gov/EID/ Effects of Social Distancing Measures during the First Epidemic Wave of Severe Acute Respiratory Syndrome Infection, Greece Vana Sypsa, Sotirios Roussos, Dimitrios Paraskevis, Theodore Lytras, Sotirios Tsiodras, 1 Angelos Hatzakis 1 452 Emerging Infectious Diseases • www.cdc.gov/eid • Vol. 27, No.2 February, 2021 RESEARCH Author affiliations: National and Kapodistrian University of Athens, Athens, Greece (V. Sypsa, S. Roussos, D. Paraskevis, S. Tsiodras, A. Hatzakis); National Public Health Organization, Athens (T. Lytras); European University Cyprus, Nicosia, Cyprus (T. Lytras) DOI: https://doi.org/10.3201/eid2702.203412 1 These senior authors contributed equally to this article. Greece imposed a nationwide lockdown in March 2020 to mitigate transmission of severe acute respiratory syn- drome coronavirus 2 during the first epidemic wave. We conducted a survey on age-specific social contact pat- terns to assess effects of physical distancing measures and used a susceptible-exposed-infectious-recovered model to simulate the epidemic. Because multiple dis- tancing measures were implemented simultaneously, we assessed their overall effects and the contribution of each measure. Before measures were implemented, the estimated basic reproduction number (R 0 ) was 2.38 (95% CI 2.01–2.80). During lockdown, daily contacts decreased by 86.9% and R 0 decreased by 81.0% (95% credible interval [CrI] 71.8%–86.0%); each distancing measure decreased R 0 by 10%–24%. By April 26, the at- tack rate in Greece was 0.12% (95% CrI 0.06%–0.26%), one of the lowest in Europe, and the infection fatality ra- tio was 1.12% (95% CrI 0.55%–2.31%). Multiple social distancing measures contained the first epidemic wave in Greece.

Welcome message from author
This document is posted to help you gain knowledge. Please leave a comment to let me know what you think about it! Share it to your friends and learn new things together.
Transcript

Coronavirus disease (COVID-19), caused by severe acute respiratory syndrome coronavirus 2 (SARS-
CoV-2), emerged in China in December 2019 (1) and by September 14, 2020, had spread worldwide, caus-ing >28.6 million cases and >917,000 deaths (2). To suppress the epidemic curve, public health authori-ties needed to use the strongest possible mitigation strategies until effective therapies and vaccines are available. Central mitigation strategies include non-pharmaceutical interventions, such as travel-related restrictions, case-based, and social distancing inter-ventions. Social distancing aims to decrease social contacts and reduce transmission (3).
In Greece, the first COVID-19 case was reported on February 26, 2020 (4). Soon after, several social distancing, travel-related, and case-based interven-tions were implemented. A nationwide lockdown restricting all nonessential movement throughout the country began on March 23 (Figure 1). By the end of April, the first epidemic wave had waned, and withdrawal of physical distancing interventions became a social priority.
Despite an ongoing severe financial crisis and an older population, Greece has been noted as an ex-ample of a country with successful response against COVID-19 (5). However, given the resurgence of cases in Greece and other countries, careful consid-eration and close monitoring are needed to inform strategies for resuming and maintaining social and economic activities.
We describe a survey implemented during lock-down in Greece and assess the effects of physical distancing measures on contact behavior. We used these data and mathematical modeling to obtain es-timates for the first epidemic wave in the country, during February–April 2020, to assess the effects of all social distancing measures, and to assess the rela-tive contribution of each measure towards the con-trol of COVID-19.
Materials and Methods
Social Contacts SurveyWe conducted a phone survey during March 31–April 7, 2020, to estimate the number of social contacts and age mixing of the population on a weekday during the lockdown and on the same day of the week before the pandemic, during mid-January 2020, by using contact diaries (Ap-pendix Figure 1, https://wwwnc.cdc.gov/EID/
Effects of Social Distancing Measures during the First Epidemic Wave of Severe Acute Respiratory
Syndrome Infection, GreeceVana Sypsa, Sotirios Roussos, Dimitrios Paraskevis, Theodore Lytras, Sotirios Tsiodras,1 Angelos Hatzakis1
452 Emerging Infectious Diseases • www.cdc.gov/eid • Vol. 27, No.2 February, 2021
RESEARCH
Author affiliations: National and Kapodistrian University of Athens, Athens, Greece (V. Sypsa, S. Roussos, D. Paraskevis, S. Tsiodras, A. Hatzakis); National Public Health Organization, Athens (T. Lytras); European University Cyprus, Nicosia, Cyprus (T. Lytras)
DOI: https://doi.org/10.3201/eid2702.203412 1These senior authors contributed equally to this article.
Greece imposed a nationwide lockdown in March 2020 to mitigate transmission of severe acute respiratory syn-drome coronavirus 2 during the first epidemic wave. We conducted a survey on age-specific social contact pat-terns to assess effects of physical distancing measures and used a susceptible-exposed-infectious-recovered model to simulate the epidemic. Because multiple dis-tancing measures were implemented simultaneously, we assessed their overall effects and the contribution of each measure. Before measures were implemented, the estimated basic reproduction number (R0) was 2.38 (95% CI 2.01–2.80). During lockdown, daily contacts decreased by 86.9% and R0 decreased by 81.0% (95% credible interval [CrI] 71.8%–86.0%); each distancing measure decreased R0 by 10%–24%. By April 26, the at-tack rate in Greece was 0.12% (95% CrI 0.06%–0.26%), one of the lowest in Europe, and the infection fatality ra-tio was 1.12% (95% CrI 0.55%–2.31%). Multiple social distancing measures contained the first epidemic wave in Greece.

Effects of Social Distancing Measures, Greece
article/27/2/20-3412-App1.pdf). Participants pro-vided oral informed consent. We defined contact as either skin-to-skin contact or a 2-way conversation with >3 words spoken in the physical presence of another person (6). For each contact, we recorded information on the contact person’s age and loca-tion of the contact, such as home, school, work-place, transportation, leisure, or other. We planned to recruit 600 participants of all ages residing in Athens by using proportional quota sampling and oversampling among persons 0–17 years of age.
We estimated the average number of contacts for the prepandemic and lockdown periods. We defined 6 age groups to build age-specific contact matrices, adjusting for the age distribution of the
population of Greece, by using socialmixr in R software (R Foundation for Statistical Computing, https://www.r-project.org).
Estimating the Course of the First Epidemic Wave and Assessing Effects of Social DistancingTo estimate the course of the epidemic, we first esti-mated the basic reproduction number (R0), the aver-age number of secondary cases 1 case would produce in a completely susceptible population in the absence of control measures. Then, we used social contacts matrices to assess the effects of physical distancing measures on R0. Finally, we simulated the course of the epidemic using a susceptible-exposed-infectious-recovered (SEIR) model.
Emerging Infectious Diseases • www.cdc.gov/eid • Vol. 27, No.2 February, 2021 453
Figure 1. Daily number of coronavirus disease cases by date of sampling for laboratory testing (25) and timeline of key measures, Greece. Dates of telephone survey are indicated. Asterisks indicate spikes in the number of diagnosed cases at the end of March and late April that correspond to clusters of cases in 3 settings: a ship, a refugee camp, and a clinic. EU, European Union.

RESEARCH
Estimating R0
We estimated R0 based on the number of confirmed cases with infection onset dates before the first social distancing measures were adopted, up to March 9, and accounted for imported cases. We used a max-imum-likelihood method to obtain the R0 and 95% CI, assuming that the serial interval distribution is known (7). We used the daily number of cases by date of symptom onset and inferred infection dates assum-ing an average incubation period of 5 days (8,9). We assumed a gamma distributed serial interval with a mean of 6.67 (SD 4.85) days, in accordance with other studies (10,11; D. Cereda et al., unpub. data, https://arxiv.org/abs/2003.09320). As a sensitivity analysis, we estimated R0 assuming a shorter serial interval of 4.7 days (Appendix) (12).
Assessing Effects of Social Distancing on R0
Primary social distancing measures implemented in Greece began on March 11. These measures and the dates implemented were closing all educational establishments on March 11; theatres, courthouses, cinemas, gyms, playgrounds, and nightclubs on March 13; shopping centers, cafes, restaurants, bars, museums, and archaeological sites on March 14; sus-pending services in churches on March 16; closing all private enterprises, with some exceptions, on March 18; and, finally, restricting all nonessential movement throughout the country on March 23 (Figure 1; Ap-pendix Table 1).
We assessed the effects of these measures on R0 through the social contact matrices obtained before and during lockdown, as used in other studies (13,14). For respiratory-spread infectious agents, R0 is a func-tion of the age-specific number of daily contacts, the probability that a single contact leads to transmission, and the total duration of infectiousness; thus, R0 is proportional to the dominant eigenvalue of the social contact matrix (15). If the other 2 parameters did not change before and during social distancing measures, the relative reduction, δ, in R0 is equivalent to the re-duction in the dominant eigenvalue of the contact ma-trices obtained for the 2 periods (Appendix) (14,16). To account for a lower susceptibility for children than for adults, we introduced an age-dependent proportion-ality factor, si, measuring susceptibility to infection of persons in age group i, as in other studies (13,17). We performed the analysis using a conservative estimate for si, and considered the susceptibility among persons 0–17 years of age to be 0.34 compared with persons >18 years of age (Appendix Table 2) (13).
We estimated the relative reduction in R0 in 2 periods: the period of initial measures until the day
before lockdown (March 11–22), which included closure of schools, entertainment venues, and shops (reduction δ1); and the period of lockdown (March 23–April 26) (reduction δ2). Because we did not assess social contacts during the period of initial measures, we created a synthetic contact matrix by assuming no school contacts because of school closures, and a reduction in leisure and work contacts (18–20) (Ap-pendix). To assess uncertainty, we performed a non-parametric bootstrap on contact data by participant to estimate the mean and 95% credible interval (95% CrI) of δ1 and δ2 (n = 1,000 bootstrap samples).
Simulating the Epidemic in GreeceWe used a SEIR model to simulate the outbreak from the beginning of local transmission until April 26, 2020, the day before the originally planned date to ease lockdown measures. Susceptible persons (S) be-come infected at a rate β and move to the exposed state (E) as infected but not infectious. Exposed per-sons become infectious at a rate σ, and a proportion p will eventually develop symptoms (p = 80%) (21). To account for asymptomatic transmission during the incubation period, we introduce a compartment for infectious presymptomatic persons (Ipre). Ipre cases be-come symptomatic infectious (Isymp) cases at a rate of σs. We assumed that infectiousness can occur 1.5 days before the onset of symptoms (22–24). The remainder (1 – p) will be true asymptomatic or subclinical cases (Iasymp). We assumed that the infectiousness of sub-clinical cases relative to symptomatic cases was q = 50% (24). Symptomatic cases recover (R) at a rate of γs, and asymptomatic cases recover (R) at a rate of γasymp (Table 1; Figure 2; Appendix).
We derived the transmission rate β from R0 and parameters related to the duration of infectiousness (Appendix). We incorporated uncertainty in R0 by drawing values uniformly from the estimated 95% CI (2.01–2.80). We modeled the effect of measures by multiplying β by the parameters δ1 and δ2; in which δ1 corresponds to the reduction of R0 in the period of ini-tial social distancing measures, where δ1 was drawn from a normal distribution with a mean of 42.7% (SD 1.7%); and δ2 corresponds to the reduction of R0 dur-ing lockdown, for which δ2 was drawn from a normal distribution of 81.0% (SD 1.6%) estimated from the bootstrap on the contact data. To account for the un-certainty in R0, δ1, and δ2, we performed 1,000 simu-lations of the model and obtained median estimates and 95% CrIs.
We obtained the infection fatality ratio (IFR) and the cumulative proportion of critically ill patients by dividing the reported number of deaths and of
454 Emerging Infectious Diseases • www.cdc.gov/eid • Vol. 27, No.2 February, 2021

Effects of Social Distancing Measures, Greece
critically ill patients (25) by the total number of cases predicted by the model. We used a lag of 18 days for deaths and 14 days for critically ill patients based on unpublished data on hospitalized patients from the National Public Health Organization in Greece. To validate our findings, we used a reverse approach; we applied a published estimate of the IFR (26) to the number of infections predicted by the model
and compared the resulting cumulative and daily number of deaths to the observed deaths (Appendix Table 3).
Effects of Social Distancing InterventionsBecause multiple social distancing measures were implemented simultaneously, to delineate the effects of each measure on R0, we used information from the
Emerging Infectious Diseases • www.cdc.gov/eid • Vol. 27, No.2 February, 2021 455
Table 1. Parameters of the susceptible-exposed-infectious-recovered model used to assess effects of social distancing measures during the first epidemic wave of coronavirus disease, Greece Epidemiologic parameters Value Comments and references R0 (95% CI) 2.38 (2.01–2.80) Estimated from data on the number of confirmed cases
in Greece by accounting for imported cases and assuming gamma distributed serial interval with mean
6.67 days (SD 4.88 days) (D. Cereda et al., unpub. data, https://arxiv.org/abs/2003.09320) and aligned with
other studies (10,11) Latent period (1/σ) 3.5 days Based on an average incubation time of 5 days (8,9)
and assuming that infectiousness starts 1.5 days prior to the symptom onset (22–24)
Percentage (p) infected cases developing symptoms 80 From K. Mizumoto et al. (21), the estimated proportion of true asymptomatic cases was 20.6% assuming a
mean incubation period of 5.5 days Symptomatic cases Length of infectiousness before symptoms, d (1/σs) 1.5 (22–24) Duration of infectious period from development of symptoms to recovery, d (1/γs)
4.5 To obtain a serial interval of 6 days (8,9)
True asymptomatic cases Infectiousness (q) of asymptomatic vs. symptomatic persons, %
50 (24)
Duration of infectious period until recovery (1/γasymp) 6 days The same duration of infectiousness as for symptomatic cases = 1/σs + 1/γs
Figure 2. Modified susceptible-exposed-infectious-recovered (SEIR) model used to estimate the course of the first epidemic wave of coronavirus disease, Greece. Cases are classified into susceptible (S), exposed (E), infectious (I, which is divided into 3 conditions: Ipre, before developing symptoms, Isymp for clinically ill, or Iasymp for true asymptomatic), and recovered (R). We assumed that a proportion (p) of exposed cases will develop symptoms and that infectiousness can occur before the onset of symptoms. β is the rate at which persons become infected and move to E; exposed individuals become infectious at a rate σ and presymptomatic infectious cases develop symptoms at a rate σs; γasymp is the rate of recovery for asymptomatic persons; γs is the rate of recovery for symptomatic persons.
RESEARCH
contacts reported on a regular weekday in January 2020 and mimicked the impact of each intervention by excluding or reducing subsets of corresponding social contacts (16,17,19,20) (Appendix). We also as-sessed scenarios with less disruptive social distanc-ing measures (Appendix). In addition, we evaluated the increase in effective reproduction number (Rt) for varying levels of infection control measures (hand hygiene, use of facemasks, and maintaining distance >1.5 m) when social distancing measures are partially lifted after lockdown (Appendix).
Results
Social Contacts before and during LockdownIn total, 602 persons provided contact diaries and re-ported 12,463 contacts before the pandemic and 1,743 during lockdown (Table 2). The mean daily number of contacts declined from 20.7 before to 2.9 during lockdown; when adjusted for the age distribution of the population, the reduction was 19.9 before and 2.6 during lockdown (86.9%).
We noted a change in age-mixing patterns in the contact matrices (Figure 3, panel A). In the prepan-demic period, the diagonal of the contact matrix de-picts the assortativity by age; participants tended to associate more with people of similar age (Figure 3, panel A). When social distancing measures were put into effect, the assortativity by age disappeared and contacts occurred mainly between household mem-bers (Figure 3, panels B–D).
R0 and Effects of Social Distancing MeasuresBefore lockdown, the estimated R0 was 2.38 (95% CI 2.01–2.80). During the first period of social distancing measures, in which schools, entertainment venues, and shops were closed, R0 was estimated to decrease by 42.7% (95% CrI 34.9%–51.3%); under lockdown, R0 decreased by 81.0% (95% CrI 71.7%–86.1%). Thus, the
cumulative measures implemented during lockdown would have reduced R0 to <1.0 even if the initial R0 had been as high as 5.3 (95% CrI 3.5–7.2). Estimated Rt was 1.13 (95% CrI 1.38–1.61) during the period of the initial measures but was 0.46 (95% CrI 0.35–0.57) during lockdown (Figure 4, panel A).
Contribution of Each Social Distancing MeasureWe assessed the effect of each measure separately and in combinations (Figure 5). During lockdown, the estimated reduction in R0 attributed to each mea-sure was 10.3% (95% CrI 5.2%–20.3%) for the decline in work contacts, 18.5% (95% CrI 10.7%–26.3%) for school closures, and 24.1% (95% CrI 14.8%–34.3%) for the decline in leisure activity contacts. Thus, each measure separately would have reduced R0 to <1.0 if the initial R0 had been as high as 1.11 for the decline in work contacts, 1.23 for school closures, and 1.32 for the decline in leisure activity contacts. A combi-nation of measures could be effective if the initial R0 had been as high as 1.78 for interventions reducing work and school contacts, 1.72 for reducing work and leisure contacts, and 1.43 for reducing school and leisure contacts.
We assessed alternative scenarios with less dis-ruptive social distancing measures. A 50% reduction in school contacts, such as smaller class sizes; 20% in work contacts, such as teleworking for part of the population or rotating weekly schedules in which employees telework some days and work onsite other days; and 20% in leisure activities could reduce R0 to <1.0 for initial levels as high as 1.32 (95% CrI 1.27–1.38). An even larger decline in leisure activities (50%) could successfully reduce an initial R0 as high as 1.48 (95% CrI 1.35–1.62).
Finally, we assessed the increase in Rt when mea-sures were partially lifted after lockdown. To mimic the measures implemented after lockdown in Greece, we assumed that contacts at work would return to
456 Emerging Infectious Diseases • www.cdc.gov/eid • Vol. 27, No.2 February, 2021
Table 2. Number of contacts on a weekday during lockdown, March 31–April 7, 2020, and on the corresponding day in January 2020 before the coronavirus disease epidemic in Athens, Greece
Covariate Mid-January 2020 During lockdown Reduction of reported
contacts, % Participants, no. (%) No. (%) Mean (95% CI) No. (%) Mean (95% CI) Overall 602 (100.0) 12,463 (100.0) 20.7 (18.9–22.5) 1,743 (100.0) 2.9 (2.6–3.2) 86.0* Sex M 295 (49.0) 6,218 (49.9) 21.1 (18.3–23.9) 934 (53.6) 3.2 (2.7–3.6) 85.0 F 307 (51.0) 6,245 (50.1) 20.3 (18.0–22.7) 809 (46.4) 2.6 (2.2–3.1) 87.1 Age, y 0–4 20 (3.3) 386 (3.1) 19.3 (12.8–25.8) 53 (3.0) 2.7 (2.2–3.1) 86.3 5–11 58 (9.6) 2,020 (16.2) 34.8 (29.1–40.6) 168 (9.6) 2.9 (2.6–3.2) 91.7 12–17 83 (13.8) 2,758 (22.1) 33.2 (28.4–38.1) 275 (15.8) 3.3 (2.3–4.3) 90.0 18–29 74 (12.3) 1,316 (10.6) 17.8 (14.4–21.1) 361 (20.7) 4.9 (3.1–6.7) 72.6 30–64 209 (34.7) 4,852 (38.9) 23.2 (19.5–26.9) 529 (30.4) 2.5 (2.2–2.9) 89.1 >65 158 (26.3) 1,131 (9.1) 7.2 (5.4–8.9) 357 (20.5) 2.3 (1.8–2.7) 68.4 *The reduction in the reported contacts becomes 86.9% after adjusting for the age distribution of the population of Greece.
Effects of Social Distancing Measures, Greece
levels 50% lower than pre-pandemic, school to 50%, and leisure to 60%. For instance, class sizes were re-duced 50% when schools reopened in May. Under this scenario, Rt would remain <1.0 assuming >20% reduction in susceptibility as a result of infection con-trol measures, including hand hygiene, use of face masks, and maintaining physical distances >1.5 me-ters (Figure 6). Under milder social distancing mea-sures, infection control policies would need to be much more effective (Appendix Figure 2).
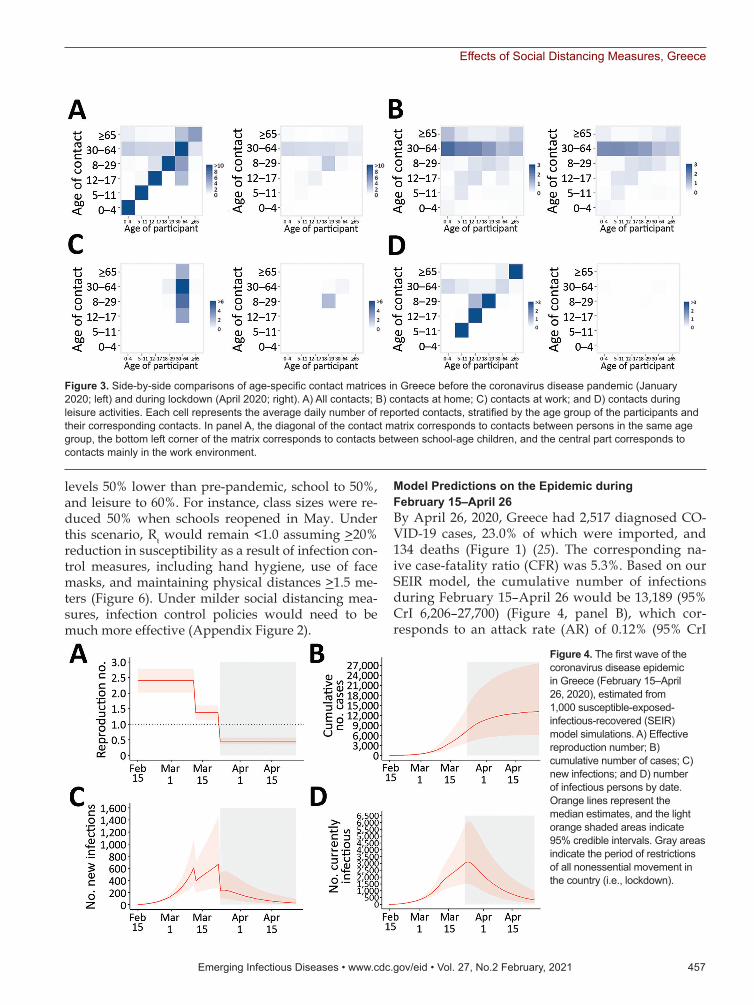
Model Predictions on the Epidemic during February 15–April 26By April 26, 2020, Greece had 2,517 diagnosed CO-VID-19 cases, 23.0% of which were imported, and 134 deaths (Figure 1) (25). The corresponding na-ive case-fatality ratio (CFR) was 5.3%. Based on our SEIR model, the cumulative number of infections during February 15–April 26 would be 13,189 (95% CrI 6,206–27,700) (Figure 4, panel B), which cor-responds to an attack rate (AR) of 0.12% (95% CrI
Emerging Infectious Diseases • www.cdc.gov/eid • Vol. 27, No.2 February, 2021 457
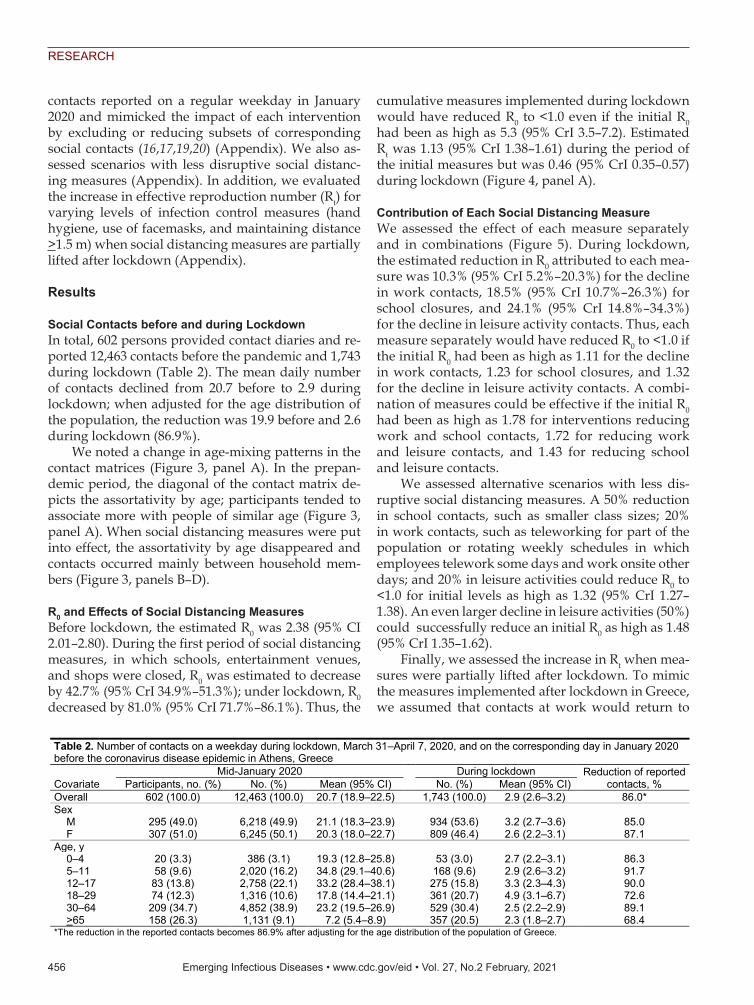
Figure 3. Side-by-side comparisons of age-specific contact matrices in Greece before the coronavirus disease pandemic (January 2020; left) and during lockdown (April 2020; right). A) All contacts; B) contacts at home; C) contacts at work; and D) contacts during leisure activities. Each cell represents the average daily number of reported contacts, stratified by the age group of the participants and their corresponding contacts. In panel A, the diagonal of the contact matrix corresponds to contacts between persons in the same age group, the bottom left corner of the matrix corresponds to contacts between school-age children, and the central part corresponds to contacts mainly in the work environment.
Figure 4. The first wave of the coronavirus disease epidemic in Greece (February 15–April 26, 2020), estimated from 1,000 susceptible-exposed-infectious-recovered (SEIR) model simulations. A) Effective reproduction number; B) cumulative number of cases; C) new infections; and D) number of infectious persons by date. Orange lines represent the median estimates, and the light orange shaded areas indicate 95% credible intervals. Gray areas indicate the period of restrictions of all nonessential movement in the country (i.e., lockdown).

RESEARCH
0.06%–0.26%). The estimated case ascertainment rate was 19.1% (95% CrI 9.1%–40.6%). By the end of April, 25 (95% CrI 6–97) new infections per day and 329 (95% CrI 97–1,027) total infectious cases were es-timated (Figure 4, panels C, D).
On the basis of the number of deaths and critically ill patients reported in Greece by April 26, and using the number of infections obtained from the model as denominator, we estimated the IFR to be 1.12% (95% CrI 0.55%–2.31%) and the cumulative proportion of critically ill patients to be 1.55% (95% CrI 0.75%–3.22%). As a validation, we estimated the number of deaths by applying a published age-adjusted estimat-ed IFR to the number of infections predicted by the model (Appendix Table 3). The predicted number of deaths was 137 (95% CrI 66–279) compared with the reported number of 134 deaths (Appendix Figure 3). As a sensitivity analysis, we simulated the epidemic and calculated IFR and AR assuming a shorter mean serial interval of 4.7 days. We obtained similar results for the AR and the IFR as when the serial interval was 6.67 days (Appendix Figure 4).
DiscussionGreece and other countries managed to successfully slow the first wave of the SARS-CoV-2 epidemic early in 2020. Assessing the burden of infection and death in the population and quantifying the effects of social distancing was necessary because the stringent mea-sures taken had major economic costs and restricted
individual freedom. In addition, several countries, including Greece, began seeing COVID-19 cases in-crease after resuming economic activities and travel, indicating the need to reimplement some types of location-specific physical distancing measures.
We assessed the effects of social distancing by using a social contacts survey to directly measure participants’ contact patterns during lockdown in a sample including children. To our knowledge, only 2 other diary-based social contacts surveys have been implemented during COVID-19 lockdown, 1 in China (13) and 1 in the United Kingdom (14); only the study from China included children. Our study had com-mon findings with the other 2: a large reduction in the number of contacts, 86.9% in Greece, 86.4%–90.3% in China, and 73.1% in United Kingdom; and assortativ-ity by age (i.e., contacts between people of the same age group) disappeared during lockdown and con-tacts were mainly among household members. Other studies have assessed the impact of social distancing indirectly by using contact data from prepandemic periods and assuming that interventions reduce so-cial mixing in different contexts (18,20,27).
We estimated that R0 declined by 81% and reached 0.46 during lockdown. This finding agrees with find-ings from a study pooling information from 11 coun-tries in Europe, which also reported an 81% reduction in R0 (28) and with estimates from China (3,29), the United Kingdom (76.2%; 14), and France (77%; 30). In our analysis, we assumed lower susceptibility among
458 Emerging Infectious Diseases • www.cdc.gov/eid • Vol. 27, No.2 February, 2021
Figure 5. The percenage decline of R0 associated with multiple social distancing measures during coronavirus disease lockdown in Greece and the relative contribution of each measure or combination of measures implemented. Boxplots demonstrate distribution of the estimated percent decline from nonparametric bootstrap on the social contacts data based on 1,000 bootstrap samples. R0 reduction during lockdown was obtained by comparing social contacts data collected for April 2020 versus January 2020. The other estimates were derived by using the information from contact diaries in January 2020 corresponding to a regular school or work day and excluding or reducing subsets of social contacts at school, work, home, and leisure activities, based on observations during lockdown. Because contact with a particular person can take place in multiple settings, we assigned contacts at multiple locations to a single location by using the following hierarchical order: home, work, school, leisure activities, transportation, and other locations. Dotted line indicates the minimum reduction needed to bring R0 from 2.38 to <1. Box top and bottom lines indicate 25th and 75th percentiles; horizontal lines within boxes indicate medians; whiskers indicate 25th/75th percentile plus 1.5 times the interquartile range. R0, basic reproduction number.

Effects of Social Distancing Measures, Greece
children because of support from a growing body of evidence (13,17,31–33; K. Mizumoto et al., unpub. data, https://doi.org/10.1101/2020.03.09.20033142).
We further attempted to delineate the effects of each measure. For example, many countries, includ-ing Greece, instituted large-scale or national school closures (34). We estimated that each measure alone could reduce an R0 of ≈1.1–1.3 to <1.0. Only multiple social distancing measures would be effective for reducing an R0 at the initial level (2.38) observed in Greece. The finding concerning an 18.5% reduction in R0 related to school closures agrees with recent stud-ies suggesting that this measure likely is much less effective for COVID-19 than for influenza-like infec-tions (17,28). Concerning the course of the epidemic after lockdown, moderately relaxing social distanc-ing could be safe if ongoing infection control strate-gies are adopted; milder social distancing measures would demand stricter infection control policies.
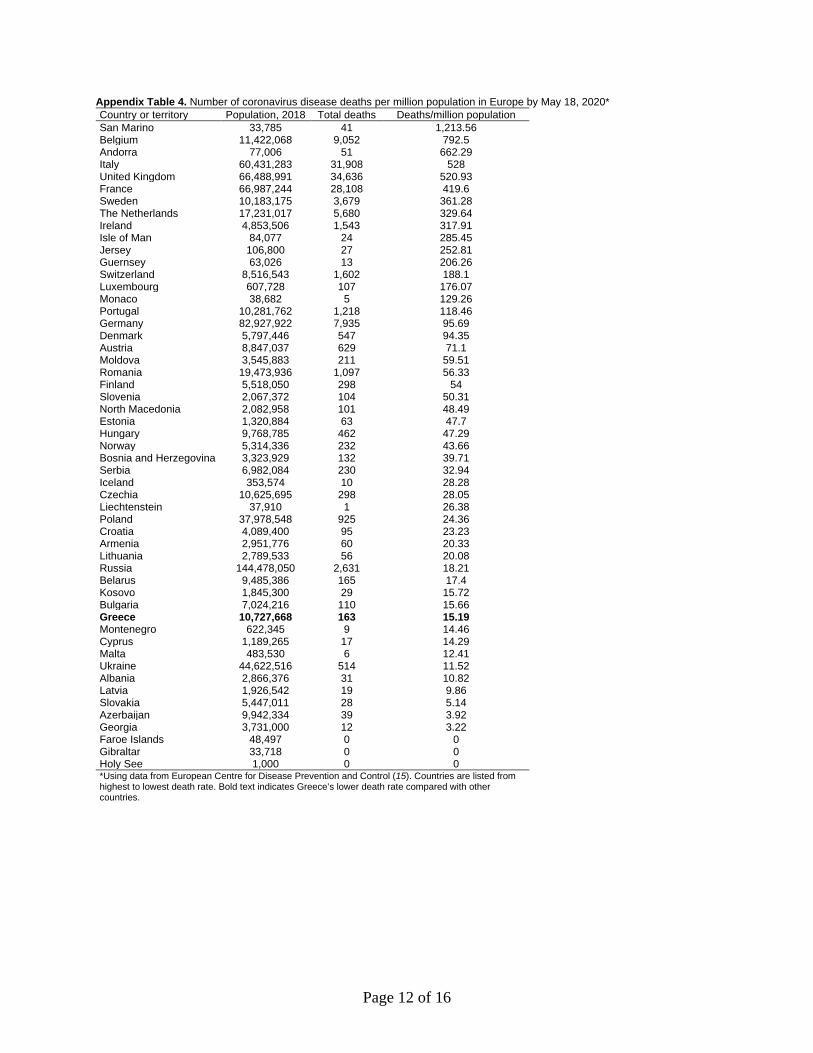
By May 18, 2020, Greece had one of the lowest re-ported COVID-19 death rates in Europe, 15.2 deaths/1 million population (35) (Appendix Table 4). Our IFR estimate of 1.12% was similar to that anticipated for the population of Greece based on a published esti-mate adjusting for demography (26). In addition, the estimated AR of 0.12% (95% CrI 0.06%–0.26%) was one of the lowest in Europe (28,36). Other researchers have applied back calculation of infections from re-ported deaths (28), and the resulting infection AR was almost identical (0.13%) (36). Our estimate is further confirmed by a serosurvey in residual serum samples that identified 0.25% (95% CI 0.02%–0.50%) seroprev-alence in Greece in April 2020 (37). The number of in-fectious cases subsided considerably towards the end of April; however, even during this period with low
transmission levels, 2 local outbreaks were identified, 1 in a refugee camp and 1 in a private healthcare unit, thus increasing the number of diagnosed cases in the respective days (Figure 1). An increasing number of reports around the world suggest the significance of superspreading events (38–41), and caution should be exercised to prevent or recognize these events early.
The first limitation of our study was that, due to the absence of prepandemic data on social contacts, we asked respondents to report their contacts ≈2 months prior to the survey to ensure reports were not affected by increased awareness of the pandemic. Re-call bias might be observed, although to what direc-tion is not clear. A general limitation in contact diaries is that participants record a fraction of their contacts (42). However, biases in participant recall are difficult to quantify, especially for those with many contacts in different settings. For example, short-lived contacts and work contacts are more likely to be underreport-ed (42). Thus, recall bias could be different among children and adults and in various settings. In addi-tion, underreporting might have occurred before and during lockdown because of many social contacts be-fore the pandemic or because participants were afraid to disclose contacts during lockdown. Second, the survey was conducted in a sample from the Athens metropolitan area and not from the whole country. However, no consistent relationship has been found between social contacts and urbanization (43). In ad-dition, most (79%) of the population of Greece lives in urban areas, and Athens accounts for 35% of the population. Furthermore, the observed reduction of social contacts during lockdown was similar to other surveys (13,14). Third, estimated R0 depends on the serial interval. Because no data from a local study of
Emerging Infectious Diseases • www.cdc.gov/eid • Vol. 27, No.2 February, 2021 459
Figure 6. Estimated Rt after the partial lifting of social distancing measures at the end of the first coronavirus disease epidemic wave in Greece for varying effectiveness levels of infection control measures, such as hand hygiene, use of masks, maintaining social distances, in reducing susceptibility to infection. Rt during lockdown was 0.46. For the partial lifting of measures, we hypothesized a scenario in which contacts at work and school contacts will return to 50% lower than pre-epidemic levels and leisure activities will return to 60% lower than pre-epidemic levels. Dotted line indicates the threshold of Rt = 1. Boxplots of the distribution of the estimated Rt from nonparametric bootstrap on the social contacts data based on 1,000 bootstrap samples. Box top and bottom lines indicate 25th and 75th percentiles; horizontal lines within boxes indicate medians; whiskers indicate 25th/75th percentile plus 1.5 times the interquartile range. Rt, effective reproduction number.

RESEARCH
infector–infectee pairs were available, the distribution of the serial interval was based on previous estimates (10,11; D. Cereda et al., unpub. data, https://arxiv.org/abs/2003.09320). The estimated R0 aligned with estimates obtained in China (44) and Italy (45), and we accounted for the uncertainty in this value. We also repeated the analysis assuming a shorter serial interval (12), which resulted in a lower reproduction number. Fourth, in assessing the effect of each social distancing measure separately, we should note that an interrelation exists between the different measures and our approach might be an approximation. For ex-ample, school closure alone might result in increases in leisure contacts or decline in work contacts because parents need to be home with younger children. Fifth, as elsewhere, we assumed that changes in social con-tacts occur as soon as interventions take place, rather than gradually during lockdown dates (28), which could be valid for some interventions, such as school closure, but not for others. Finally, we did not con-sider case-based interventions that might have af-fected contacts, such as isolation of confirmed cases and quarantine of close contacts. In Greece, narrow testing criteria were applied beginning March 16 and elderly or severely ill persons, other high-risk groups, and healthcare personnel were tested but others were not; also, the testing capacity during March and April was low.
Overall, the social distancing measures Greece put in place in early March 2020 had a substantial im-pact on contact patterns and reduced R0 to <1.0. By the end of April, the spread of COVID-19 was contained in Greece, and the country had one of the lowest ARs in Europe after the first pandemic wave. However, as social distancing and travel restrictions are relaxed, close monitoring of Rt is essential in order to adapt interventions over time without having to resort to stringent measures. Measuring social mixing patterns and adherence to infection control measures through repeated surveys can be additional tools for real-time monitoring of the epidemic potential in the months to come.
This article was preprinted at https://doi.org/10.1101/ 2020.05.27.20114017.
AcknowledgmentsWe thank the personnel of the National Public Health Organization for performing the epidemiological surveillance of SARS-CoV-2 in Greece.
The social contacts survey was funded by the Hellenic Scientific Society for the Study of AIDS and Sexually Transmitted Diseases, Athens.
About the AuthorDr. Sypsa is an associate professor of epidemiology and medical statistics in the Medical School of the National and Kapodistrian University of Athens in Greece. Her research interests include the epidemiology and mathematical modeling of hepatitis C, HIV, influenza, and other infectious diseases, as well as infectious diseases among prisoners and persons who inject drugs.
References 1. Wu F, Zhao S, Yu B, Chen YM, Wang W, Song ZG, et al. A
new coronavirus associated with human respiratory disease in China. Nature. 2020;579:265–9. https://doi.org/10.1038/s41586-020-2008-3
2. World Health Organization. Weekly epidemiological update: coronavirus disease 2019 (COVID-19), 14 September 2020 [cited 2020 Sep 18]. https://www.who.int/docs/default-source/coronaviruse/situation-reports/20200914-weekly-epi-update-5.pdf
3. Leung K, Wu JT, Liu D, Leung GM. First-wave COVID-19 transmissibility and severity in China outside Hubei after control measures, and second-wave scenario planning: a modelling impact assessment. Lancet. 2020;395:1382–93. https://doi.org/10.1016/S0140-6736(20)30746-7
4. National Public Health Organisation. Epidemiological surveillance of COVID-19—daily report 26 March 2020 [in Greek] [cited 2020 Jul 10]. https://eody.gov.gr/wp-content/uploads/2020/03/covid-gr-daily-report-20200320.pdf
5. Perrigo B, Hincks J. Greece has an elderly population and a fragile economy. How has it escaped the worst of the coronavirus so far? Time. 2020 Apr 21 [cited 2020 Jul 10]. https://time.com/5824836/greece-coronavirus
6. Mossong J, Hens N, Jit M, Beutels P, Auranen K, Mikolajczyk R, et al. Social contacts and mixing patterns relevant to the spread of infectious diseases. PLoS Med. 2008;5:e74. https://doi.org/10.1371/journal.pmed.0050074
7 White LF, Wallinga J, Finelli L, Reed C, Riley S, Lipsitch M, et al. Estimation of the reproductive number and the serial interval in early phase of the 2009 influenza A/H1N1 pandemic in the USA. Influenza Other Respir Viruses. 2009;3:267–76. https://doi.org/10.1111/j.1750-2659.2009.00106.x
8. Li Q, Guan X, Wu P, Wang X, Zhou L, Tong Y, et al. Early transmission dynamics in Wuhan, China, of novel coronavirus-infected pneumonia. N Engl J Med. 2020;382:1199–207. https://doi.org/10.1056/NEJMoa2001316
9. Lauer SA, Grantz KH, Bi Q, Jones FK, Zheng Q, Meredith HR, et al. The incubation period of coronavirus disease 2019 (COVID-19) from publicly reported confirmed cases: estimation and application. Ann Intern Med. 2020;172:577–82. https://doi.org/10.7326/M20-0504
10. Bi Q, Wu Y, Mei S, Ye C, Zou X, Zhang Z, et al. Epidemiology and transmission of COVID-19 in 391 cases and 1286 of their close contacts in Shenzhen, China: a retrospective cohort study. Lancet Infect Dis. 2020;20:911–9. https://doi.org/10.1016/S1473-3099(20)30287-5
11. Lavezzo E, Franchin E, Ciavarella C, Cuomo-Dannenburg G, Barzon L, Del Vecchio C, et al.; Imperial College COVID-19 Response Team. Suppression of a SARS-CoV-2 outbreak in the Italian municipality of Vo’. Nature. 2020;584:425–9. https://doi.org/10.1038/s41586-020-2488-1
12. Nishiura H, Linton NM, Akhmetzhanov AR. Serial interval of novel coronavirus (COVID-19) infections. Int J Infect Dis. 2020;93:284–6. https://doi.org/10.1016/j.ijid.2020.02.060
460 Emerging Infectious Diseases • www.cdc.gov/eid • Vol. 27, No.2 February, 2021

Effects of Social Distancing Measures, Greece
13. Zhang J, Litvinova M, Liang Y, Wang Y, Wang W, Zhao S, et al. Changes in contact patterns shape the dynamics of the COVID-19 outbreak in China. Science. 2020;368:1481–6. https://doi.org/10.1126/science.abb8001
14. Jarvis CI, Van Zandvoort K, Gimma A, Prem K, Klepac P, Rubin GJ, et al.; CMMID COVID-19 working group. Quantifying the impact of physical distance measures on the transmission of COVID-19 in the UK. BMC Med. 2020;18:124. https://doi.org/10.1186/s12916-020-01597-8
15. Wallinga J, Teunis P, Kretzschmar M. Using data on social contacts to estimate age-specific transmission parameters for respiratory-spread infectious agents. Am J Epidemiol. 2006;164:936–44. https://doi.org/10.1093/aje/kwj317
16. Hens N, Ayele GM, Goeyvaerts N, Aerts M, Mossong J, Edmunds JW, et al. Estimating the impact of school closure on social mixing behaviour and the transmission of close contact infections in eight European countries. BMC Infect Dis. 2009;9:187. https://doi.org/10.1186/1471-2334-9-187
17. Davies NG, Klepac P, Liu Y, Prem K, Jit M, Eggo RM; CMMID COVID-19 working group. Age-dependent effects in the transmission and control of COVID-19 epidemics. Nat Med. 2020;26:1205–11. https://doi.org/10.1038/ s41591-020-0962-9
18. Davies NG, Kucharski AJ, Eggo RM, Gimma A, Edmunds WJ, Jombart T, et al.; Centre for the Mathematical Modelling of Infectious Diseases COVID-19 working group. Effects of non-pharmaceutical interventions on COVID-19 cases, deaths, and demand for hospital services in the UK: a modelling study. Lancet Public Health. 2020;5:e375–85. https://doi.org/10.1016/S2468-2667(20)30133-X
19. Willem L, Van Hoang T, Funk S, Coletti P, Beutels P, Hens N. SOCRATES: an online tool leveraging a social contact data sharing initiative to assess mitigation strategies for COVID-19. BMC Res Notes. 2020;13:293. https://doi.org/ 10.1186/s13104-020-05136-9
20. Prem K, Liu Y, Russell TW, Kucharski AJ, Eggo RM, Davies N, et al.; Centre for the Mathematical Modelling of Infectious Diseases COVID-19 Working Group. The effect of control strategies to reduce social mixing on outcomes of the COVID-19 epidemic in Wuhan, China: a modelling study. Lancet Public Health. 2020;5:e261–70. https://doi.org/ 10.1016/S2468-2667(20)30073-6
21. Mizumoto K, Kagaya K, Zarebski A, Chowell G. Estimating the asymptomatic proportion of coronavirus disease 2019 (COVID-19) cases on board the Diamond Princess cruise ship, Yokohama, Japan, 2020. Euro Surveill. 2020;25:2000180. https://doi.org/10.2807/1560-7917.ES.2020.25.10.2000180
22. He X, Lau EHY, Wu P, Deng X, Wang J, Hao X, et al. Temporal dynamics in viral shedding and transmissibility of COVID-19. Nat Med. 2020;26:672–5. https://doi.org/ 10.1038/s41591-020-0869-5
23. Ganyani T, Kremer C, Chen D, Torneri A, Faes C, Wallinga J, et al. Estimating the generation interval for coronavirus disease (COVID-19) based on symptom onset data, March 2020. Euro Surveill. 2020;25:2000257. https://doi.org/10.2807/1560-7917.ES.2020.25.17.2000257
24. Li R, Pei S, Chen B, Song Y, Zhang T, Yang W, et al. Substantial undocumented infection facilitates the rapid dissemination of novel coronavirus (SARS-CoV2). Science. 2020;368:489–93. https://doi.org/10.1126/science.abb3221
25. National Public Health Organisation. Epidemiological surveillance of COVID-19—daily report 26 [in Greek]. April 2020 [cited 2020 Jul 10]. https://eody.gov.gr/wp-content/uploads/2020/04/covid-gr-daily-report-20200426.pdf
26. Verity R, Okell LC, Dorigatti I, Winskill P, Whittaker C, Imai N, et al. Estimates of the severity of coronavirus disease
2019: a model-based analysis. Lancet Infect Dis. 2020;20:669–77. https://doi.org/10.1016/S1473-3099(20)30243-7
27. Di Domenico L, Pullano G, Sabbatini CE, Boëlle PY, Colizza V. Impact of lockdown on COVID-19 epidemic in Île-de-France and possible exit strategies. BMC Med. 2020;18:240. https://doi.org/10.1186/s12916-020-01698-4
28. Flaxman S, Mishra S, Gandy A, Unwin HJT, Mellan TA, Coupland H, et al.; Imperial College COVID-19 Response Team. Estimating the effects of non-pharmaceutical interventions on COVID-19 in Europe. Nature. 2020;584:257–61. https://doi.org/10.1038/s41586-020-2405-7
29. Pan A, Liu L, Wang C, Guo H, Hao X, Wang Q, et al. Association of public health interventions with the epidemiology of the COVID-19 outbreak in Wuhan, China. JAMA. 2020;323:1915–23. https://doi.org/10.1001/jama.2020.6130
30. Salje H, Tran Kiem C, Lefrancq N, Courtejoie N, Bosetti P, Paireau J, et al. Estimating the burden of SARS-CoV-2 in France. Science. 2020;369:208–11. https://doi.org/10.1126/science.abc3517
31. Jing QL, Liu MJ, Zhang ZB, Fang LQ, Yuan J, Zhang AR, et al. Household secondary attack rate of COVID-19 and associated determinants in Guangzhou, China: a retrospective cohort study. Lancet Infect Dis. 2020;20:1141–50. https://doi.org/10.1016/S1473-3099(20)30471-0
32. Li W, Zhang B, Lu J, Liu S, Chang Z, Peng C, et al. The characteristics of household transmission of COVID-19. Clin Infect Dis. 2020;71:1943–6. https://doi.org/10.1093/cid/ciaa450
33. Danis K, Epaulard O, Bénet T, Gaymard A, Campoy S, Botelho-Nevers E, et al.; Investigation Team. Cluster of coronavirus disease 2019 (Covid-19) in the French Alps, February 2020. Clin Infect Dis. 2020;71:825–32. https://doi.org/10.1093/cid/ciaa424
34. Viner RM, Russell SJ, Croker H, Packer J, Ward J, Stansfield C, et al. School closure and management practices during coronavirus outbreaks including COVID-19: a rapid systematic review. Lancet Child Adolesc Health. 2020;4:397–404. https://doi.org/10.1016/S2352-4642(20)30095-X
35. European Centre for Disease Prevention and Control. Daily number of new reported cases of COVID-19 by country worldwide. 2020 May 20 [cited 2020 May 20]. https://www.ecdc.europa.eu/en/publications-data/download-todays-data-geographic-distribution-covid-19-cases-worldwide
36. Imperial College London. COVID-19 model, estimates as of 4th of May 2020; Greece [cited 2020 Apr 25]. https://mrc-ide.github.io/covid19estimates/#/details/Greece
37. Bogogiannidou Z, Vontas A, Dadouli K, Kyritsi MA, Sote-riades S, Nikoulis DJ, et al. Repeated leftover serosurvey of SARS-CoV-2 IgG antibodies, Greece, March and April 2020. Euro Surveill. 2020;25. https://doi.org/10.2807/1560-7917.ES.2020.25.31.2001369
38. Arons MM, Hatfield KM, Reddy SC, Kimball A, James A, Jacobs JR, et al.; Public Health–Seattle and King County and CDC COVID-19 Investigation Team. Presymptomatic SARS-CoV-2 infections and transmission in a skilled nursing facility. N Engl J Med. 2020;382:2081–90. https://doi.org/10.1056/NEJMoa2008457
39. Kimball A, Hatfield KM, Arons M, James A, Taylor J, Spicer K, et al.; Public Health–Seattle & King County; CDC COVID-19 Investigation Team. Asymptomatic and presymptomatic SARS-CoV-2 infections in residents of a long-term care skilled nursing facility—King County, Washington, March 2020. MMWR Morb Mortal Wkly Rep. 2020;69:377–81. https://doi.org/10.15585/mmwr.mm6913e1
Emerging Infectious Diseases • www.cdc.gov/eid • Vol. 27, No.2 February, 2021 461

RESEARCH
40. Park SY, Kim Y-M, Yi S, Lee S, Na B-J, Kim CB, et al. Coronavirus disease outbreak in call center, South Korea. Emerg Infect Dis. 2020;26:1666–70. https://doi.org/10.3201/eid2608.201274
41. McMichael TM, Currie DW, Clark S, Pogosjans S, Kay M, Schwartz NG, et al.; Public Health–Seattle and King County, EvergreenHealth, and CDC COVID-19 Investigation Team. Epidemiology of Covid-19 in a long-term care facility in King County, Washington. N Engl J Med. 2020;382:2005–11. https://doi.org/10.1056/NEJ-Moa2005412
42. Read JM, Edmunds WJ, Riley S, Lessler J, Cummings DA. Close encounters of the infectious kind: methods to measure social mixing behaviour. Epidemiol Infect. 2012;140:2117–30. https://doi.org/10.1017/S0950268812000842
43. Hoang T, Coletti P, Melegaro A, Wallinga J, Grijalva CG, Edmunds JW, et al. A systematic review of social contact surveys to inform transmission models of close-contact
infections. Epidemiology. 2019;30:723–36. https://doi.org/ 10.1097/EDE.0000000000001047
44. Kucharski AJ, Russell TW, Diamond C, Liu Y, Edmunds J, Funk S, et al.; Centre for Mathematical Modelling of Infec-tious Diseases COVID-19 working group. Early dynamics of transmission and control of COVID-19: a mathematical modelling study. Lancet Infect Dis. 2020;20:553–8. https://doi.org/10.1016/S1473-3099(20)30144-4
45. Giordano G, Blanchini F, Bruno R, Colaneri P, Di Filippo A, Di Matteo A, et al. Modelling the COVID-19 epidemic and implementation of population-wide interventions in Italy. Nat Med. 2020;26:855–60. https://doi.org/10.1038/s41591-020-0883-7
Address for correspondence: Vana Sypsa, Medical School, Department of Hygiene, Epidemiology and Medical Statistics, Building No. 12, M. Asias 75, Athens 11527, Greece; email: [email protected]
462 Emerging Infectious Diseases • www.cdc.gov/eid • Vol. 27, No.2 February, 2021
®
Emerging Viruses
To revisit the July 2020 issue, go to:https://wwwnc.cdc.gov/eid/articles/issue/
26/7/table-of-contents
• Case Manifestations and Public Health Response for Outbreak of Meningococcal W Disease, Central Australia, 2017
• Transmission of Chikungunya Virus in an Urban Slum, Brazil
• Public Health Role of Academic Medical Center in Community Outbreak of Hepatitis A, San Diego County, California, USA, 2016–2018
• Macrolide-Resistant Mycoplasma pneumoniae Infections in Pediatric Community-Acquired Pneumonia
• Efficient Surveillance of Plasmodium knowlesi Genetic Subpopulations, Malaysian Borneo, 2000–2018
• Bat and Lyssavirus Exposure among Humans in Area that Celebrates Bat Festival, Nigeria, 2010 and 2013
• Rickettsioses as Major Etiologies of Unrecognized Acute Febrile Illness, Sabah, East Malaysia
• Meningococcal W135 Disease Vaccination Intent, the Netherlands, 2018–2019
• Risk for Coccidioidomycosis among Hispanic Farm Workers, California, USA, 2018
• Atypical Manifestations of Cat-Scratch Disease, United States, 2005–2014
• Large Nationwide Outbreak of Invasive Listeriosis Associated with Blood Sausage, Germany, 2018–2019
• Paradoxal Trends in Azole-Resistant Aspergillus fumigatus in a National Multicenter Surveillance Program, the Netherlands, 2013–2018
• High Contagiousness and Rapid Spread of Severe Acute Respiratory Syndrome Coronavirus 2
• Human Adenovirus Type 55 Distribution, Regional Persistence, and Genetic Variability
• Identifying Locations with Possible Undetected Imported Severe Acute Respiratory Syndrome Coronavirus 2 Cases by Using Importation Predictions
• Severe Acute Respiratory Syndrome Coronavirus 2−Specific Antibody Responses in Coronavirus Disease Patients
• Burden and Cost of Hospitalization for Respiratory Syncytial Virus in Young Children, Singapore
• Policy Decisions and Use of Information Technology to Fight COVID-19, Taiwan
• Sub-Saharan Africa and Eurasia Ancestry of Reassortant Highly Pathogenic Avian Influenza A(H5N8) Virus, Europe, December 2019
• Serologic Evidence of Severe Fever with Thrombocytopenia Syndrome Virus and Related Viruses in Pakistan
• Survey of Parental Use of Antimicrobial Drugs for Common Childhood Infections, China
• Shuni Virus in Wildlife and Nonequine Domestic Animals, South Africa
• Transmission of Legionnaires’ Disease through Toilet Flushing
• Carbapenem Resistance Conferred by OXA-48 in K2-ST86 Hypervirulent Klebsiella pneumoniae, France
• Laboratory-Acquired Dengue Virus Infection, United States, 2018
• Linking Epidemiology and Whole-Genome Sequencing to Investigate Salmonella Outbreak, Massachusetts, USA, 2018
July 2020

Page 1 of 16
Article DOI: https://doi.org/10.3201/eid2702.203412
Effects of Social Distancing Measures during the First Epidemic Wave of Severe
Acute Respiratory Syndrome Infection, Greece
Appendix
Social Contacts Survey
During March 31–April 7, 2020, we conducted a survey of social contacts among persons
in Athens, Greece. Proportional quota sampling based on age and sex was used and persons 0–17
years old were oversampled. Random digital dialing was used to reach the population and only 1
person in each household was asked to participate to the study. Trained staff administered
questionnaires by telephone. Calls were placed between 10:00 AM–3:00 PM and 5:30 PM–9:30 PM
(Appendix Figure 1).
Eligible participants had to be local resident of Athens, and to have lived >6 months in
Athens during the past year, which was applicable only for respondents >2 years of age. Time
and budget restrictions did not allow expansion of the survey outside Athens. However, Athens
Metropolitan Area includes 3.83 million of the 10.8 million persons residing in Greece.
The questionnaire consisted of three sections: 1) general information, such as sex, age,
educational level, household size, and age of household members; 2) a contact diary for a 24-
hour period from 5:00 AM of the day before the interview to 5:00 AM the day of the interview or
the previous Friday if the interview took place on Monday; and 3) a contact diary for the same
day of the week in mid-January before the first cases were diagnosed in Europe.
Parental-proxy completion was used for all children 0–11 years of age and for children
and adolescents 12–17 years of age if the parent did not consent to provide information on their
own. More specifically, interviews of persons <18 years old were performed as follows: parents
or guardians responded to the questionnaire on behalf of children 0–11 years old; for children
Page 2 of 16
and adolescents 12–17 years of age, either the participant provided information on their own
with parental informed consent, or parents provided information on behalf of the participant. For
parental-proxy completion, parents were asked to collaborate with their child if the child was old
enough to provide information.
In social contacts studies, children often are deliberately oversampled because of their
important role in the spread of infectious diseases (1,2). In our survey, we oversampled children
and adolescents 0–17 years of age because we wanted to be able to assess social contacts in
various age groups (0–4, 5–11, 12–17) and to explore the impact of school closure.
Estimates Assuming a Shorter Serial Interval
We also estimated R0 assuming a shorter serial interval with mean of 4.7 days and
standard deviation of 2.9 days (3). Using a shorter serial interval, estimated R0 was 1.85 (95% CI
1.56–2.17) compared with an estimated R0 of 2.38 (95% CI 2.01–2.80) under a longer serial
interval in the main analysis. In the susceptible-exposed-infectious-recovered (SEIR) model, we
assumed a duration of infectiousness of 3 days rather than 4.5 days under a longer serial interval
(Appendix Figure 4).
Assuming a shorter serial interval, estimated effective reproduction number (Rt) was
close to 1 before the implementation of lockdown. Then during lockdown, Rt was 0.35 (95% CrI
0.27–0.44) assuming a serial interval of 4.7 days compared with 0.46 (95% CrI 0.35–0.57) under
a serial interval of 6.67 days. The cumulative number of infections from the start of the epidemic
until the end of the simulations period on April 26, was 12,423 (95% CrI 5,562–28,713)
compared with 13,189 infections (95% CrI 6,206–27,700) under a longer serial interval. The
cumulative number of infections corresponds to an AR of 0.11% (95% CrI 0.05%–0.27%)
compared with 0.12% (95% CrI 0.06%–0.26%) assuming the longer serial interval. At the end of
the simulations period, April 26, the median number of new infections per day was predicted to
reach 2.5 (95% CrI 0.5–14.4) compared with 25 new infections per day (95% CrI 6–97) with the
longer serial interval. On April 26, the median number of infectious cases in our model was 22
(95% CrI 5–101) compared with 329 infectious cases (95% CrI 97–1,027) assuming a longer
serial interval.
Page 3 of 16
Based on the number of deaths reported in Greece by April 26, we estimated the infection
fatality ratio (IFR) by using the number of infections as denominator with a time lag of 18 days.
Using this calculation, estimated IFR was 1.11% (95% CrI 0.49%–2.47%) compared with 1.12%
(95% CrI 0.55%–2.31%) assuming a longer serial interval.
Assessing the Impact of Social Distancing Measures
Estimating the Relative Change in R0 before and during Social Distancing Measures
The relative change (δ) in R0 before and during social distancing measures is equivalent
to the reduction in the dominant eigenvalue of the contact matrices obtained for the 2 periods and
was calculated as follows (equation [1]):
𝛿𝛿 = 1 − max𝑒𝑒𝑒𝑒𝑒𝑒𝑒𝑒𝑒𝑒𝑒𝑒𝑒𝑒𝑒𝑒𝑒𝑒𝑒𝑒 (𝐾𝐾𝑑𝑑𝑑𝑑𝑑𝑑𝑑𝑑𝑑𝑑𝑑𝑑)max𝑒𝑒𝑒𝑒𝑒𝑒𝑒𝑒𝑒𝑒𝑒𝑒𝑒𝑒𝑒𝑒𝑒𝑒𝑒𝑒 (𝐾𝐾𝑝𝑝𝑑𝑑𝑝𝑝)
where the elements of the matrices 𝐾𝐾𝑝𝑝𝑝𝑝𝑒𝑒 and 𝐾𝐾𝑑𝑑𝑒𝑒𝑝𝑝𝑒𝑒𝑒𝑒𝑒𝑒 are defined as 𝑘𝑘𝑒𝑒𝑖𝑖,𝑝𝑝𝑝𝑝𝑒𝑒 = 𝑠𝑠𝑒𝑒𝑐𝑐𝑒𝑒𝑖𝑖,𝑝𝑝𝑝𝑝𝑒𝑒 and
𝑘𝑘𝑒𝑒𝑖𝑖,𝑑𝑑𝑒𝑒𝑝𝑝𝑒𝑒𝑒𝑒𝑒𝑒 = 𝑠𝑠𝑒𝑒𝑐𝑐𝑒𝑒𝑖𝑖,𝑑𝑑𝑒𝑒𝑝𝑝𝑒𝑒𝑒𝑒𝑒𝑒 in which cij,pre is the average number of contacts between persons in age
group i with persons in age group j before the period of social distancing measures, cij,during is the
number of contacts during the period of social distancing measures, and si is the susceptibility to
infection of an age-i person (i,j = 1,..6).
Estimating the Social Contacts Matrix during the Initial Measures
The first period of measures during March 11–22, included closure of schools,
entertainment venues, and shops except from supermarkets, grocery stores, and pharmacies.
Because we did not measure the reduction in contacts during this period, we used the information
from the contacts reported on a regular weekday in January 2020 and mimicked the impact of
these intervention by excluding school contacts and reducing contacts at work and leisure
activities accordingly (2,4–6). Thus, we created a synthetic contact matrix by assuming that no
school contacts took place because of school closures and that contact through leisure activities
was reduced by 80% and work contacts reduced by 30% during lockdown as a result of these
first measures. We accounted for a reduction in work contacts because a special purpose leave
was provided to working parents with children enrolled in nursery schools and kindergarten or
with children <15 years of age attending mandatory education schools. Contacts reported at
multiple locations, such as contact with a person at school and leisure activities, were assigned to

Page 4 of 16
a single location using the following hierarchical order: home, work, school, leisure activities,
transportation, and other locations (4). Thus, the social contacts matrix for the first period of
measures was as follows:
𝐶𝐶𝑖𝑖𝑖𝑖𝑖𝑖𝑖𝑖𝑖𝑖𝑖𝑖 𝑚𝑚𝑚𝑚𝑖𝑖𝑠𝑠𝑚𝑚𝑚𝑚𝑚𝑚𝑠𝑠 = 𝐶𝐶ℎ𝑜𝑜𝑚𝑚𝑚𝑚 + �1− 𝑓𝑓1� ∙ 𝐶𝐶𝑤𝑤𝑜𝑜𝑚𝑚𝑘𝑘 + 0 ∙ 𝐶𝐶𝑠𝑠𝑐𝑐ℎ𝑜𝑜𝑜𝑜𝑖𝑖 + �1− 𝑓𝑓2� ∙ 𝐶𝐶𝑖𝑖𝑚𝑚𝑖𝑖𝑠𝑠𝑚𝑚𝑚𝑚𝑚𝑚 + 𝐶𝐶𝑖𝑖𝑚𝑚𝑖𝑖𝑖𝑖𝑠𝑠𝑡𝑡𝑜𝑜𝑚𝑚𝑖𝑖 + 𝐶𝐶𝑜𝑜𝑖𝑖ℎ𝑚𝑚𝑚𝑚
where 𝐶𝐶ℎ𝑜𝑜𝑜𝑜𝑒𝑒 ,𝐶𝐶𝑤𝑤𝑜𝑜𝑝𝑝𝑤𝑤,𝐶𝐶𝑠𝑠𝑠𝑠ℎ𝑜𝑜𝑜𝑜𝑒𝑒 ,𝐶𝐶𝑒𝑒𝑒𝑒𝑒𝑒𝑠𝑠𝑒𝑒𝑝𝑝𝑒𝑒,𝐶𝐶𝑡𝑡𝑝𝑝𝑒𝑒𝑒𝑒𝑠𝑠𝑝𝑝𝑜𝑜𝑝𝑝𝑡𝑡 ,𝐶𝐶𝑜𝑜𝑡𝑡ℎ𝑒𝑒𝑝𝑝 were the matrices obtained from the
contacts reported on a regular weekday before the pandemic in Greece in January 2020 and f1, f2
are the reduction in leisure and work contacts during the first measures.
The relative change in R0 was then estimated from equation [1] by using the contacts cij
from the corresponding social contacts matrices 𝐶𝐶𝑖𝑖𝑖𝑖𝑖𝑖𝑖𝑖𝑖𝑖𝑖𝑖 𝑚𝑚𝑚𝑚𝑖𝑖𝑠𝑠𝑚𝑚𝑚𝑚𝑚𝑚𝑠𝑠 and 𝐶𝐶𝑡𝑡𝑚𝑚𝑚𝑚.
Effects of Each Measure Implemented during Lockdown
To assess the impact of each measure separately, we estimated the reduction in R0 by
using the social contacts matrix before the pandemic and the synthetic matrix corresponding to
each measure or combination of measures. For example, to estimate the impact of school
closures, we compared the original matrix with social contacts reported on a regular weekday
(Cpre) to the matrix resulting from the sum of home, work, leisure, transportation, and other
contacts, excluding contacts in the school setting. The resulting synthetic contact matrix for
school closure became
𝐶𝐶𝑠𝑠𝑐𝑐ℎ𝑜𝑜𝑜𝑜𝑖𝑖 𝑐𝑐𝑖𝑖𝑜𝑜𝑠𝑠𝑚𝑚𝑚𝑚𝑚𝑚 = 𝐶𝐶ℎ𝑜𝑜𝑚𝑚𝑚𝑚 + 𝐶𝐶𝑤𝑤𝑜𝑜𝑚𝑚𝑘𝑘 + 0 ∙ 𝐶𝐶𝑠𝑠𝑐𝑐ℎ𝑜𝑜𝑜𝑜𝑖𝑖 + 𝐶𝐶𝑖𝑖𝑚𝑚𝑖𝑖𝑠𝑠𝑚𝑚𝑚𝑚𝑚𝑚 + 𝐶𝐶𝑖𝑖𝑚𝑚𝑖𝑖𝑖𝑖𝑠𝑠𝑡𝑡𝑜𝑜𝑚𝑚𝑖𝑖𝑖𝑖𝑖𝑖𝑖𝑖𝑜𝑜𝑖𝑖 + 𝐶𝐶𝑜𝑜𝑖𝑖ℎ𝑚𝑚𝑚𝑚
Similarly, the impact of closing restaurants, coffee shops, cinemas, and other venues was
estimated by reducing the subset of leisure contacts data by a proportion f. The synthetic contact
matrix became
𝐶𝐶𝑚𝑚𝑚𝑚𝑟𝑟𝑚𝑚𝑐𝑐𝑖𝑖𝑖𝑖𝑜𝑜𝑖𝑖 𝑖𝑖𝑚𝑚𝑖𝑖𝑠𝑠𝑚𝑚𝑚𝑚𝑚𝑚 = 𝐶𝐶ℎ𝑜𝑜𝑚𝑚𝑚𝑚 + 𝐶𝐶𝑤𝑤𝑜𝑜𝑚𝑚𝑘𝑘 + 𝐶𝐶𝑠𝑠𝑐𝑐ℎ𝑜𝑜𝑜𝑜𝑖𝑖 + (1− 𝑓𝑓) ∙ 𝐶𝐶𝑖𝑖𝑚𝑚𝑖𝑖𝑠𝑠𝑚𝑚𝑚𝑚𝑚𝑚 + 𝐶𝐶𝑖𝑖𝑚𝑚𝑖𝑖𝑖𝑖𝑠𝑠𝑡𝑡𝑜𝑜𝑚𝑚𝑖𝑖𝑖𝑖𝑖𝑖𝑖𝑖𝑜𝑜𝑖𝑖 + 𝐶𝐶𝑜𝑜𝑖𝑖ℎ𝑚𝑚𝑚𝑚
This approach was used to assess the impact of a combination of measures, for example school
closure and reduction in contacts at work, because they were measured during lockdown.
Effects of Milder Measures in Reducing Transmission during the First Wave
We assessed the impact of a theoretical scenario with less disruptive social distancing
measures. A reduction of 50% in school contacts, such as classes split in half, combined with
20% teleworking and 20% reduction in leisure activities, results in the following contact matrix:

Page 5 of 16
𝐶𝐶𝑚𝑚𝑖𝑖𝑖𝑖𝑟𝑟 𝑚𝑚𝑚𝑚𝑖𝑖𝑠𝑠𝑚𝑚𝑚𝑚𝑚𝑚𝑠𝑠 = 𝐶𝐶ℎ𝑜𝑜𝑚𝑚𝑚𝑚 + (1− 0.20) ∙ 𝐶𝐶𝑤𝑤𝑜𝑜𝑚𝑚𝑘𝑘 + (1− 0.50) ∙ 𝐶𝐶𝑠𝑠𝑐𝑐ℎ𝑜𝑜𝑜𝑜𝑖𝑖 + (1− 0.20) ∙ 𝐶𝐶𝑖𝑖𝑚𝑚𝑖𝑖𝑠𝑠𝑚𝑚𝑚𝑚𝑚𝑚+ 𝐶𝐶𝑖𝑖𝑚𝑚𝑖𝑖𝑖𝑖𝑠𝑠𝑡𝑡𝑜𝑜𝑚𝑚𝑖𝑖𝑖𝑖𝑖𝑖𝑖𝑖𝑜𝑜𝑖𝑖 + 𝐶𝐶𝑜𝑜𝑖𝑖ℎ𝑚𝑚𝑚𝑚
Effects of Lifting Measures Post Lockdown for Varying Effectiveness of Infection Control Measures
We assessed scenarios in which lockdown measures were partially lifted. As a result, the
number of contacts increase but they do not return to the pre-epidemic levels. We hypothesized a
scenario (scenario 1) in which contacts at work and school would return to levels that are 50%
lower than prepandemic levels and leisure activities are 60% lower. The rational for this scenario
is based on the following selected measures implemented post lockdown in Greece:
• High schools opened in mid-May and primary schools opened in June. Class sizes were
reduced by half with a maximum of 15 students per classroom, desks were spaced 1.5 meters
apart, and breaks were staggered to allow for physical distancing.
• Retail stores opened on May 11 with restrictions on the number of persons per square
meter.
• Cafes, restaurants, and bars opened on June 1 with only outdoor spaces and restrictions
on the number of people allowed per table.
Apart from scenario 1 (work reduced 50%, school 50%, leisure activities 60%.), we also
assessed 2 scenarios with milder social distancing measures concerning the number of contacts
post lockdown: scenario 2 involved work and leisure activities reduced by 20%, school by 50%
and scenario 3 involved having all contacts are near prepandemic levels with just 20% reduction.
In each scenario, we applied the following methodology. The corresponding social
contacts matrix for the period after lockdown is denoted as Cpost and Cduring is the contact matrix
during lockdown. The resulting increase in Rt can be assessed as follows:
1 −max 𝑚𝑚𝑖𝑖𝑒𝑒𝑚𝑚𝑖𝑖𝑒𝑒𝑖𝑖𝑖𝑖𝑚𝑚𝑚𝑚 (𝐾𝐾𝑝𝑝𝑜𝑜𝑠𝑠𝑡𝑡)
max 𝑚𝑚𝑖𝑖𝑒𝑒𝑚𝑚𝑖𝑖𝑒𝑒𝑖𝑖𝑖𝑖𝑚𝑚𝑚𝑚 (𝐾𝐾𝑑𝑑𝑒𝑒𝑝𝑝𝑒𝑒𝑒𝑒𝑒𝑒)
where the elements of the matrices 𝐾𝐾𝑝𝑝𝑜𝑜𝑠𝑠𝑡𝑡 and 𝐾𝐾𝑑𝑑𝑒𝑒𝑝𝑝𝑒𝑒𝑒𝑒𝑒𝑒 are defined as 𝑘𝑘𝑒𝑒𝑖𝑖,𝑝𝑝𝑜𝑜𝑠𝑠𝑡𝑡 = ℎ𝑠𝑠𝑒𝑒𝑐𝑐𝑒𝑒𝑖𝑖,𝑝𝑝𝑜𝑜𝑠𝑠𝑡𝑡 and
𝑘𝑘𝑒𝑒𝑖𝑖,𝑑𝑑𝑒𝑒𝑝𝑝𝑒𝑒𝑒𝑒𝑒𝑒 = 𝑠𝑠𝑒𝑒𝑐𝑐𝑒𝑒𝑖𝑖,𝑑𝑑𝑒𝑒𝑝𝑝𝑒𝑒𝑒𝑒𝑒𝑒 in which cij,post and cij,during are the average number of contacts between
persons in age group i with persons in age group j post and during lockdown, and si is the
susceptibility to infection of an age i person (i,j = 1,..6). We assumed that post lockdown
Page 6 of 16
susceptibility to infection is reduced by a fraction (1 – h) as a result of intensive infection control
measures, including hand hygiene, use of facemasks, and maintaining distances >1.5 m. We
assumed the same reduction for all age groups.
We did not account for infection control measures during lockdown because contacts
during that period occurred mostly within households. In addition, some measures, such as the
use of fabric facemasks by the general public, were not recommended during lockdown in
Greece. During the period of lifting lockdown measures, public health officials strongly
recommended use of fabric facemasks by the general public and government officials made use
of facemasks mandatory on public transportation and in crowded public spaces. To account for
the efficacy of measures, such as keeping distances, and the possible impact of others, such as
use of masks (7,8), we assumed a 5%–30% reduction in susceptibility (i.e., h ranging between
0.70–0.95) (Figure 6). This reduction corresponds to the efficacy and the adherence to these
measures.
Under the scenarios with the milder social distancing measures (work and leisure contacts
return to levels 20% below pre-epidemic, and school contacts are 20%–50% lower than pre-
epidemic levels), infection control measures would need to reduce susceptibility to infection by
45%–50% (i.e., higher efficacy and adherence would be needed) (Appendix Figure 2).
Susceptible-Exposed-Infectious-Recovered (SEIR) Model
According to the model, susceptible persons (S) become infected at a rate, β, and move to
the exposed state (E). At this point they are infected but not infectious. Exposed persons become
infectious at a rate, σ, and a proportion, p, and will eventually develop symptoms. To account for
asymptomatic transmission during the incubation period, we introduced a compartment for
infectious cases who have not developed symptoms yet (Ipre). These persons develop symptoms
at a rate, σs (Isymp). The remainder (1 – p) will be true asymptomatic or subclinical cases (Iasymp).
We assumed that the infectiousness of these subclinical cases relative to symptomatic is q.
Symptomatic cases recover (R) at a rate, γs, and asymptomatic at a rate, γasymp. Only cases in
compartments Ipre, Isymp, and Iasymp are assumed to be infectious. The transitions between the
compartments of the model are described by the following set of equations:

Page 7 of 16
Susceptible, ( )asymp pre symptdSd
Sq I I I t
N
⋅ + += −δ ⋅β⋅ ⋅
Exposed, ( )asymp pre symptSq I I I imd
dp
tort
N⋅ + + −σ⋅Ε +
Ε= δ ⋅β⋅ ⋅
Infectious before developing symptoms, s prepredI
p E Idt
σ ⋅= ⋅ ⋅ −σ
Infectious and symptomatic, s pre symsymp
s pIt
IdI
dσ ⋅ ⋅= − γ
Infectious and true asymptomatic (subclinical cases), ( )asympasym a mp sy p
dI1 p E I
dt= − ⋅ ⋅ ⋅σ − γ
Recovered, symps asymp asympdRdt
I I⋅ + γ ⋅= γ
The parameter β is estimated through R0 from the following equation:
β = 𝑅𝑅0
(1 − 𝑡𝑡)𝑞𝑞 1𝛾𝛾𝑒𝑒𝑠𝑠𝑎𝑎𝑜𝑜𝑝𝑝
+ 𝑡𝑡( 1𝜎𝜎𝑠𝑠
+ 1𝛾𝛾𝑠𝑠
)
To incorporate the impact of social distancing in the model, the infection rate β was
multiplied by the parameter δt (t = 1,2) corresponding to the reduction of R0 in 2 periods of social
distancing measures. We considered 2 major periods of social distancing measures: March 11–
22, the period of initial measures including closure of schools, restaurants, shopping centers,
cinemas, etc. until the day before lockdown, and March 23–April 27, the period of lockdown.
Based on the social contacts data, we estimated not only the reduction in the total number of
contacts but also in the number of contacts at work, home, school, and leisure activities during
lockdown. Thus, we modeled the relative reduction in R0 in the 2 periods of social distancing
measures, as described in the manuscript and Appendix.
We assumed that local transmission initiated on February 15, 2020 because the earliest
reported date of symptom onset among locally infected cases was February 20. In our model, we
seeded 1 symptomatic case in the population at day 0 (February 15th) and further seeded the
epidemic by 700 imported cases over the first 40 days. This assumption was based on the ≈500
Page 8 of 16
imported cases diagnosed by April 7 in Greece and taking into account unreported asymptomatic
imported cases (9).
As a sensitivity analysis, we obtained model predictions assuming that asymptomatic and
symptomatic persons are equally infectious (q = 100%) and the results were similar. For
example, the cumulative number of infections from the start of the epidemic until the end of the
simulation period was 13,066 (95% CrI 6,012–27,112) assuming q = 100% compared with
13,189 infections (95% CrI 6,206–27,700) assuming q = 50%.
Infection Fatality Ratio (IFR) and Comparison of Observed Deaths to Model Predictions
To validate our findings, we used a reverse approach; we applied a published estimate of
the IFR (10) to the number of infections predicted by the model and compared the resulting
number of deaths (cumulative and daily number) to the observed.
We adjusted the IFR estimate by Verity et al (10) to account for nonhomogeneous attack
rates across age groups, as proposed elsewhere (11), and for the age distribution of the
population of Greece. To account for the lower ARs among younger persons (12–14 years of
age), we multiplied the age-specific IFR for persons 0–9 and 10–19 years of age by 1/0.34,
where 0.34 is the relative susceptibility to infection of these age groups compared to adults (12).
The corrected age specific IFRs were then combined to produce an overall IFR adjusting for the
age distribution of the population in Greece (Appendix Table 3). To validate the model, we
applied this IFR to the total number of infections predicted by the model and assumed a lag of 18
days between infection and death to compare the predicted number of deaths to the cumulative
number of reported deaths (Appendix Figure 2).
References
1. Mossong J, Hens N, Jit M, Beutels P, Auranen K, Mikolajczyk R, et al. Social contacts and mixing
patterns relevant to the spread of infectious diseases. PLoS Med. 2008;5:e74. PubMed
https://doi.org/10.1371/journal.pmed.0050074
2. Hens N, Ayele GM, Goeyvaerts N, Aerts M, Mossong J, Edmunds JW, et al. Estimating the impact of
school closure on social mixing behaviour and the transmission of close contact infections in

Page 9 of 16
eight European countries. BMC Infect Dis. 2009;9:187. PubMed https://doi.org/10.1186/1471-
2334-9-187
3. Nishiura H, Linton NM, Akhmetzhanov AR. Serial interval of novel coronavirus (COVID-19)
infections. Int J Infect Dis. 2020;93:284–6. PubMed https://doi.org/10.1016/j.ijid.2020.02.060
4. Willem L, Van Hoang T, Funk S, Coletti P, Beutels P, Hens N. SOCRATES: an online tool leveraging
a social contact data sharing initiative to assess mitigation strategies for COVID-19. BMC Rese
Notes. 2020;13:293. PubMed https://doi.org/10.1186/s13104-020-05136-9
5. Prem K, Liu Y, Russell TW, Kucharski AJ, Eggo RM, Davies N, et al.; Centre for the Mathematical
Modelling of Infectious Diseases COVID-19 Working Group. The effect of control strategies to
reduce social mixing on outcomes of the COVID-19 epidemic in Wuhan, China: a modelling
study. Lancet Public Health. 2020;5:e261–70. PubMed https://doi.org/10.1016/S2468-
2667(20)30073-6
6. Davies NG, Kucharski AJ, Eggo RM, Gimma A, Edmunds WJ, Jombart T, et al.; Centre for the
Mathematical Modelling of Infectious Diseases COVID-19 working group. Effects of non-
pharmaceutical interventions on COVID-19 cases, deaths, and demand for hospital services in the
UK: a modelling study. Lancet Public Health. 2020;5:e375–85. PubMed
https://doi.org/10.1016/S2468-2667(20)30133-X
7. Leung NHL, Chu DKW, Shiu EYC, Chan KH, McDevitt JJ, Hau BJP, et al. Respiratory virus shedding
in exhaled breath and efficacy of face masks. Nat Med. 2020;26:676–80. PubMed
https://doi.org/10.1038/s41591-020-0843-2
8. National Academies of Sciences, Engineering, and Medicine. Rapid expert consultation on the
effectiveness of fabric masks for the COVID-19 pandemic; April 8, 2020. Washington, DC: The
National Academies Press;2020. https://doi.org/10.17226/25776
9. National Public Health Organisation. Epidemiological surveillance of COVID-19– daily report 26
April 2020 [in Greek] [cited 2020 Jul 10]. https://eody.gov.gr/wp-content/uploads/2020/04/covid-
gr-daily-report-20200426.pdf
10. Verity R, Okell LC, Dorigatti I, Winskill P, Whittaker C, Imai N, et al. Estimates of the severity of
coronavirus disease 2019: a model-based analysis. Lancet Infect Dis. 2020;20:669–77. PubMed
https://doi.org/10.1016/S1473-3099(20)30243-7
11. Flaxman S, Mishra S, Gandy A, Unwin HJT, Mellan TA, Coupland H, et al.; Imperial College
COVID-19 Response Team. Estimating the effects of non-pharmaceutical interventions on

Page 10 of 16
COVID-19 in Europe. Nature. 2020;584:257–61. PubMed https://doi.org/10.1038/s41586-020-
2405-7
12. Zhang J, Litvinova M, Liang Y, Wang Y, Wang W, Zhao S, et al. Changes in contact patterns shape
the dynamics of the COVID-19 outbreak in China. Science. 2020;368:1481–6. PubMed
https://doi.org/10.1126/science.abb8001
13. Jing QL, Liu MJ, Zhang ZB, Fang LQ, Yuan J, Zhang AR, et al. Household secondary attack rate of
COVID-19 and associated determinants in Guangzhou, China: a retrospective cohort study.
Lancet Infect Dis. 2020;20:1141–50. PubMed https://doi.org/10.1016/S1473-3099(20)30471-0
14. Li W, Zhang B, Lu J, Liu S, Chang Z, Peng C, et al. The characteristics of household transmission of
COVID-19. Clin Infect Dis. 2020;71:1943–6. PubMed https://doi.org/10.1093/cid/ciaa450
15. European Centre for Disease Prevention and Control. Daily number of new reported cases of COVID-
19 by country worldwide 2020 May 20 [cited 2020 May 20].
https://www.ecdc.europa.eu/en/publications-data/download-todays-data-geographic-distribution-
covid-19-cases-worldwide
Appendix Table 1. Main control measures implemented in Greece during the coronavirus disease pandemic, February 26–March 29, 2020 Start date, 2020 Description Feb 26 Testing and isolation of confirmed or suspected cases and their contacts Feb 27 Ban of carnival festivities Mar 5 Testing and isolation of confirmed or suspected cases and their contacts in
outbreaks and superspreading events Mar 9 Ban of flights to northern Italy Mar 9 Suspension of open care centers and cancellation of indoor conferences and
sporting events Mar 10 Ban of outdoor mass gatherings and sporting events Mar 11 School and university closures Mar 13 Closure of all theatres, cinemas, gyms, playgrounds, clubs, and courthouses Mar 14 Ban of flights to Italy Mar 14 Closure of shopping centers, archeological sites, bars, and restaurants Mar 15 Border closure to Albania and North Macedonia Mar 16 Ban of religious services Mar 18 Border closure to non-European Union nationals Mar 18 Nationwide closure of all private enterprises Mar 19 Closure of sea borders Mar 20 14-day quarantine for inbound travelers Mar 23 Border closure to United Kingdom and Turkey Mar 23 Ban of all intra- and inter-city movements across country (complete lock down) Mar 23 Hotel closures Mar 26 Testing of inbound travelers from countries with high rate of transmission Mar 29 Border closure to the Netherlands and Germany

Page 11 of 16
Appendix Table 2. Literature estimates concerning the relative susceptibility to severe acute respiratory syndrome coronavirus 2 infection by age*
Reference and data Relative susceptibility to infection,
odds ratio (95% CI) Zhang et al. (12); 7,375 contacts from 114 clusters; age, y
0–14 0.34 (0.24–0.49) 15–64 Referent >65 1.47 (1.12–1.92) Jing et al. (13); 2,075 contacts of 212 primary cases in 195 unrelated clusters; age, y
0–19 0.27 (0.13–0.55) 20–59 0.80 (0.53–1.19) >60 Referent Li et al. (14); 392 household contacts of 105 index patients; age, y
0–17 0.18 (0.06, 0.54) >18 Referent *Although reference 12 and 13 do not use exactly the same age categories, we note that in Jing et al. (13), the odds ratio of infection for persons 0–19 years of age versus persons 20–59 years of age is 0.34 (0.27/0.80), which is similar to that estimated by Zhang et al. (12) for the comparison of persons 0–14 years of age vs. persons 15–64 years of age.
Appendix Table 3. Infection fatality ratio adjusted for the age distribution of the population and relative susceptibility to infection by age, Greece*
Age group, y
No. Greece
IFR, % (10) Relative susceptibility† Adjusted IFR, %‡
IFR standardized for the age distribution of the population in Greece,
%§ 0–9 1,049,839 0.00161 0.34 0.00474 1.14 (0.62–2.19) 10–19 1,072,705 0.00695 0.34 0.02044 20–29 1,350,868 0.0309 1 0.0309 30–39 1,635,304 0.0844 1 0.0844 40–49 1,581,095 0.161 1 0.161 50–59 1,391,854 0.595 1 0.595 60–69 1,134,045 1.93 1 1.93 70–79 1,017,242 4.28 1 4.28 >80 583,334 7.80 1 7.80 *IFR is based on published estimates from Verity et al. (10). IFR, infection fatality ratio. †Relative susceptibility to infection based on Zhang et al. (12). ‡IFR adjusted for age susceptibility. §The lower and upper limits were calculated using the upper and lower bounds of the age specific IFR provided by Verity et al. (10).
Page 12 of 16
Appendix Table 4. Number of coronavirus disease deaths per million population in Europe by May 18, 2020* Country or territory Population, 2018 Total deaths Deaths/million population San Marino 33,785 41 1,213.56 Belgium 11,422,068 9,052 792.5 Andorra 77,006 51 662.29 Italy 60,431,283 31,908 528 United Kingdom 66,488,991 34,636 520.93 France 66,987,244 28,108 419.6 Sweden 10,183,175 3,679 361.28 The Netherlands 17,231,017 5,680 329.64 Ireland 4,853,506 1,543 317.91 Isle of Man 84,077 24 285.45 Jersey 106,800 27 252.81 Guernsey 63,026 13 206.26 Switzerland 8,516,543 1,602 188.1 Luxembourg 607,728 107 176.07 Monaco 38,682 5 129.26 Portugal 10,281,762 1,218 118.46 Germany 82,927,922 7,935 95.69 Denmark 5,797,446 547 94.35 Austria 8,847,037 629 71.1 Moldova 3,545,883 211 59.51 Romania 19,473,936 1,097 56.33 Finland 5,518,050 298 54 Slovenia 2,067,372 104 50.31 North Macedonia 2,082,958 101 48.49 Estonia 1,320,884 63 47.7 Hungary 9,768,785 462 47.29 Norway 5,314,336 232 43.66 Bosnia and Herzegovina 3,323,929 132 39.71 Serbia 6,982,084 230 32.94 Iceland 353,574 10 28.28 Czechia 10,625,695 298 28.05 Liechtenstein 37,910 1 26.38 Poland 37,978,548 925 24.36 Croatia 4,089,400 95 23.23 Armenia 2,951,776 60 20.33 Lithuania 2,789,533 56 20.08 Russia 144,478,050 2,631 18.21 Belarus 9,485,386 165 17.4 Kosovo 1,845,300 29 15.72 Bulgaria 7,024,216 110 15.66 Greece 10,727,668 163 15.19 Montenegro 622,345 9 14.46 Cyprus 1,189,265 17 14.29 Malta 483,530 6 12.41 Ukraine 44,622,516 514 11.52 Albania 2,866,376 31 10.82 Latvia 1,926,542 19 9.86 Slovakia 5,447,011 28 5.14 Azerbaijan 9,942,334 39 3.92 Georgia 3,731,000 12 3.22 Faroe Islands 48,497 0 0 Gibraltar 33,718 0 0 Holy See 1,000 0 0 *Using data from European Centre for Disease Prevention and Control (15). Countries are listed from highest to lowest death rate. Bold text indicates Greece’s lower death rate compared with other countries.

Page 13 of 16
Appendix Figure 1. Flow chart of the recruitment process for a social contacts survey used to assess
effects of social distancing measures during the first epidemic wave of severe acute respiratory syndrome
coronavirus 2, Greece.
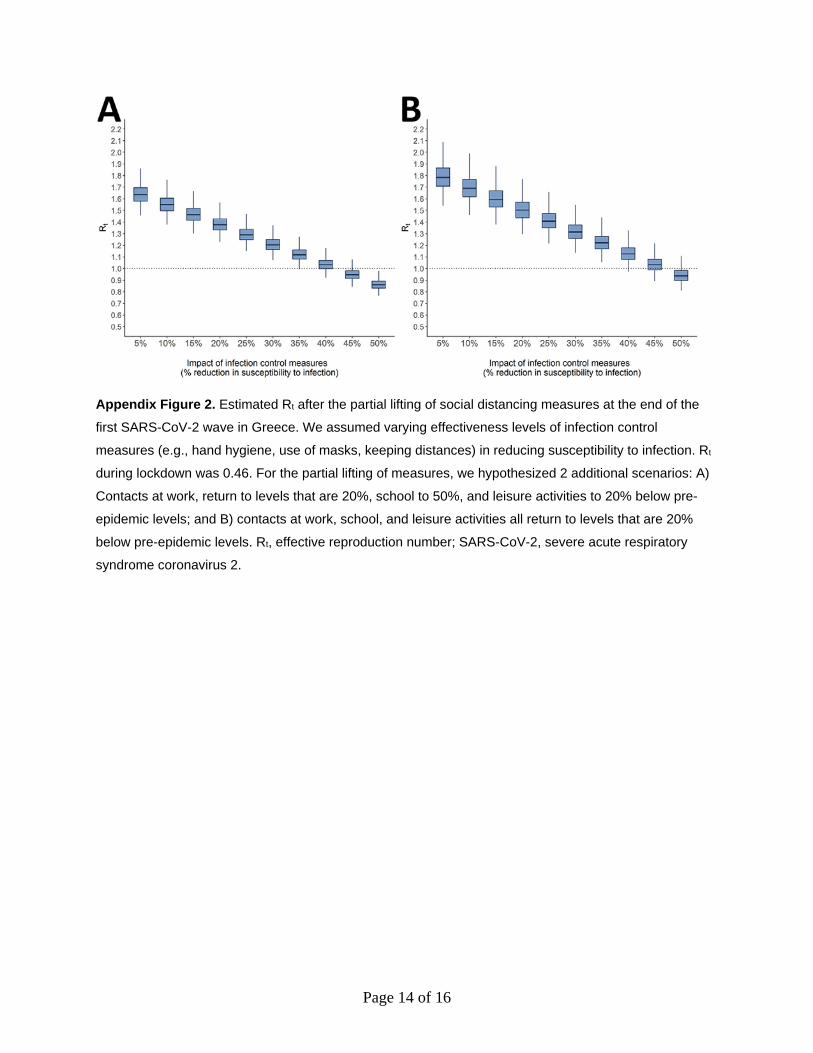
Page 14 of 16
Appendix Figure 2. Estimated Rt after the partial lifting of social distancing measures at the end of the
first SARS-CoV-2 wave in Greece. We assumed varying effectiveness levels of infection control
measures (e.g., hand hygiene, use of masks, keeping distances) in reducing susceptibility to infection. Rt
during lockdown was 0.46. For the partial lifting of measures, we hypothesized 2 additional scenarios: A)
Contacts at work, return to levels that are 20%, school to 50%, and leisure activities to 20% below pre-
epidemic levels; and B) contacts at work, school, and leisure activities all return to levels that are 20%
below pre-epidemic levels. Rt, effective reproduction number; SARS-CoV-2, severe acute respiratory
syndrome coronavirus 2.
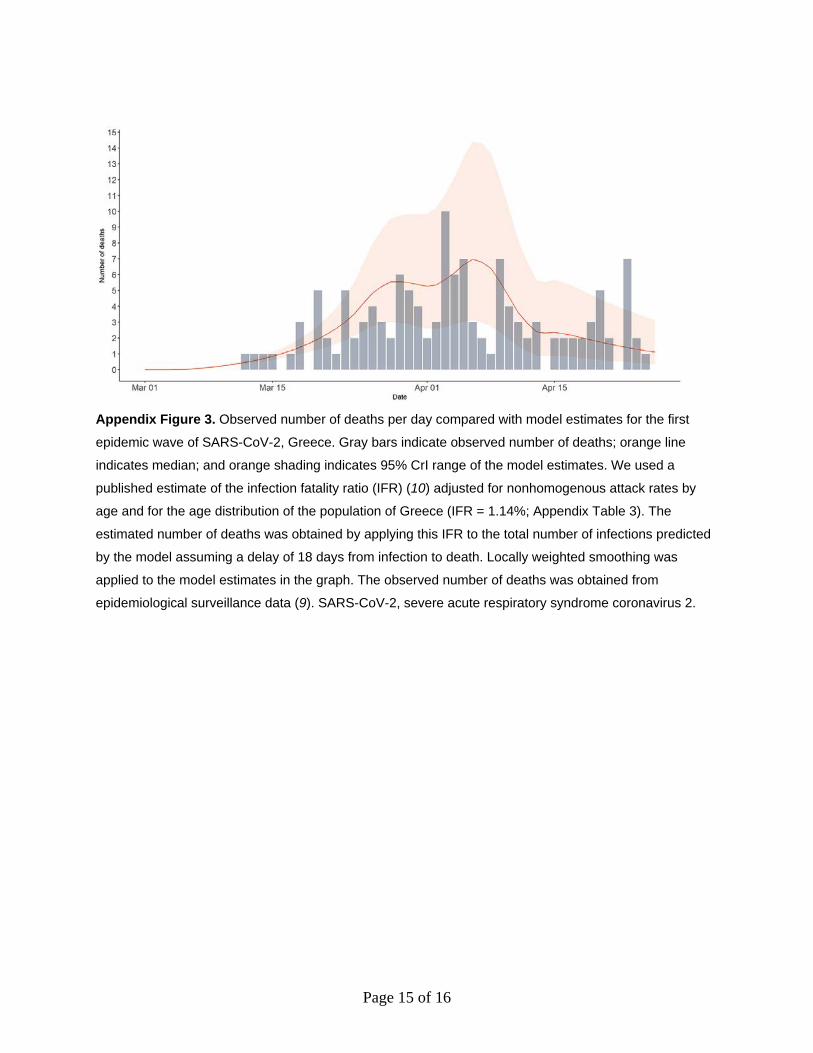
Page 15 of 16
Appendix Figure 3. Observed number of deaths per day compared with model estimates for the first
epidemic wave of SARS-CoV-2, Greece. Gray bars indicate observed number of deaths; orange line
indicates median; and orange shading indicates 95% CrI range of the model estimates. We used a
published estimate of the infection fatality ratio (IFR) (10) adjusted for nonhomogenous attack rates by
age and for the age distribution of the population of Greece (IFR = 1.14%; Appendix Table 3). The
estimated number of deaths was obtained by applying this IFR to the total number of infections predicted
by the model assuming a delay of 18 days from infection to death. Locally weighted smoothing was
applied to the model estimates in the graph. The observed number of deaths was obtained from
epidemiological surveillance data (9). SARS-CoV-2, severe acute respiratory syndrome coronavirus 2.

Page 16 of 16
Appendix Figure 4. Estimates for the first wave of the SARS-CoV-2 epidemic assuming a shorter serial
interval (mean 4.7 days) in a SEIR model for Greece, February 15–April 26, 2020. Model estimates for A)
Effective reproduction number; B) cumulative number of cases; C) number of new infections; and D)
current number of infected persons. Solid orange line represents median estimates; light orange shaded
areas indicate 95% credible intervals from 1,000 simulations of the SEIR model. Gray zone indicates
estimates during lockdown, the period in which all nonessential movement in the country was restricted.
SARS-CoV-2, severe acute respiratory syndrome coronavirus 2; SEIR, susceptible-exposed-infected-
recovered.
Related Documents