Effects of selective REM deprivation and stress on the architecture of subsequent sleep rebound and some hypothalamic neuropeptides Ph.D. theses Tamás Kitka Semmelweis University Szentágothai János School of Ph.D. studies Supervisor: Prof. György Bagdy D.Sc. Official reviewers: Dr. Csaba Fekete D.Sc. Dr. András Boros Ph.D. Head of the Final Examination Committee: Prof. Attila Fonyó D.Sc. Members of the Final Examination Committee: Dr. Róbert Bódizs Ph.D. Dr. Lucia Wittner Ph.D. Budapest 2012

Welcome message from author
This document is posted to help you gain knowledge. Please leave a comment to let me know what you think about it! Share it to your friends and learn new things together.
Transcript

Effects of selective REM deprivation and stress on the
architecture of subsequent sleep rebound and some
hypothalamic neuropeptides
Ph.D. theses
Tamás Kitka
Semmelweis University
Szentágothai János School of Ph.D. studies
Supervisor: Prof. György Bagdy D.Sc.
Official reviewers: Dr. Csaba Fekete D.Sc.
Dr. András Boros Ph.D.
Head of the Final Examination Committee:
Prof. Attila Fonyó D.Sc.
Members of the Final Examination Committee:
Dr. Róbert Bódizs Ph.D.
Dr. Lucia Wittner Ph.D.
Budapest
2012

1
1 Introduction
1.1 Stages of sleep
The stages of sleep are basically, but not exclusively identified based on their
electroencephalographic (EEG) characteristics. This method gives information about the
synchronicity of neuronal activation at the observed region; hence the amplitude of the
EEG sign is high if the neurons show synchronous activation. Generally, the EEG waves
are classified based on their frequency. The borders of EEG bands are not clearly
defined, thus the exact values used by different workgroups may vary. The bands studied
are usually the following: slow oscillation (0.5-1 Hz), delta (1-4 Hz), theta (5-7 or 5-9
Hz), alpha (8-13 or 10-20 Hz), beta (14-30 or 20-30 Hz) and gamma (30-60 Hz).
The sleep consists of REM (rapid eye movement) sleep and SWS (slow wave sleep).
Synonyms for these names also exist: PS (paradoxical sleep) for REM and NREM (non-
REM) for SWS. In animal studies, two substages of SWS are defined (SWS1 and SWS2).
1.2 The melanin-concentrating hormone
The MCH (melanin-concentrating hormone) is a 19-amino acid cyclic neuropeptide
that has been first described in salmon pituitary as a hormone responsible for skin paling.
It has been shortly described that this peptide is also expressed in the mammalian brain,
but it doesn’t affect skin color there. In mammals, MCH-containing neurons are situated
in the tuberal hypothalamus and zona!subzona incerta
MCH-ergic neurons send projections to several brain regions involved in the
regulation of sleep/waking and food intake. Several peptides were found to be
colocalized with MCH. For example. most of MCH-ergic neurons express nesfatin and
GABA (gamma-aminobutyric acid), and a portion of them also contain CART (cocaine-
and amphetamine-regulated transcript).
The role of MCH-ergic system in the regulation of sleep and waking has been studied
by several workgroups. Their results equivocally prove that MCH-ergic neurons reach
their maximal activity during REM sleep, and pharmacological, immunological or
genetical modulation of this system affects time spent is REM sleep. Contrary, the effect
of MCH-ergic activity on the architecture of REM sleep is unknown. There are results in

2
the literature supporting the role of MCH in the modulation of either duration and
frequency of REM sleep episodes, but other findings also exist that confute both roles of
this system.
MCH-ergic neurons can be divided into two subpopulations based on their CART-
immunoreactivity (CART-IR): there are CART-containing and non-CART-IR MCH-
ergic neurons. These subpopulations also differ regarding their projection areas: CART-
IR neurons send fibers to the cerebral cortex, the medial septal complex (a region having
a known role in the generation of hippocampal theta), the hippocampus, but also have
descending fibers reaching the tectum, dorsolateral periaqueductal grey and dorsal raphe.
In the brainstem, the densest innervation from this subpopulation is received by the
dorsal paragigantocellular nucleus. In contrast, the non-CART-IR subpopulation of
MCH-ergic neurons innervates some regions in the lower brainstem and spinal cord.
Both subgroups of MCH-ergic cells are activated during the sleep rebound following
REM-deprivation using a small platform (for the description of this method see chapter
Hiba! A hivatkozási forrás nem található.). However, it has to be noted that this
protocol is very stressful for the animals and the MCH-ergic system is known to play a
role in behavioural and thermoregulatory effects of stress. Furthermore, several stress-
induced changes can be blocked by using MCHR1- (MCH receptor 1) antagonists. Thus
it can be presumed that the stress caused by this method can play a role in the
aforementioned activation of the MCH-ergic neurons during sleep rebound.
1.1 Orexins
Orexin A and B (also known as hypocretin 1 and 2) have been first described in 1998.
The first identified role of these peptides is the modulation of food intake. These two
orexins are spliced from the same precursor, prepro-orexin. The localization of orexin-
containing neurons is reminiscent of the one of MCH-ergic cells: the somae are situated
at the dorsal LH (lateral hypothalamus), PFA (perifornical area) and PH (posterior
hypothalamus). These neurons send fibers to almost the entire central nervous system,
but the majority of their terminals can be found at brain regions related to the regulation
of food intake, autonomic control and sleep and waking.

3
Orexinergic neurons cease firing during sleep, with the exception of limb twitches
during REM sleep. Accordingly, activation of orexinergic system has been shown to
reduce the time spent in sleep, and also the time spent in REM sleep. Its latter effect is
exerted through the decreased frequency of REM sleep episodes.
Orexinergic and MCH-ergic neurons have reciprocal monosynaptic connections.
MCH-ergic cells express orexin 1 receptor, and correspondingly orexin A and B have
been shown to excite the MCH-containing neurons. The excitability of orexinergic
neurons by orexin-A can be attenuated using MCH, and this effect of MCH is diminished
in MCHR1 knockout mice.
1.2 The “flower-pot” REM-deprivation technique
In this method, the animal is placed on a small, round platform surrounded by water.
The size of this platform is sufficient for the animal to stand on it, but it is not large
enough to lie down even when curled. Thus as the animal reaches REM sleep, it falls in
the water because of the muscle atony and awakes. Usually two platforms of different
sizes are used: a smaller one described above and a larger one as control. This latter one
is big enough for the animal to sleep curled, so it is possible to reach REM sleep, but the
two platforms are similar in terms of other circumstances.
It is known that sleep deprivation using both small and large platforms decreases time
spent in SWS, and also causes severe stress. However, it is proven that the basic
difference between the sleep pattern of animals on a small or large platform is present in
the time spent in REM sleep, the two platforms are similar in terms of time spent in SWS.
Furthermore, they are also similar regarding the stress caused. Based on these data, we
can presume that it is possible to study the effects of selective REM deprivation by
comparing the effects of these two platforms, although neither of them is capable to
evoke selective REM deprivation. Hence the comparison of the effects of these two
platforms will be referred hereafter as effects of selective REM deprivation.

4
2 Aims
The effects of “flower pot” method on sleep pattern, as well as the effects of repeated
sleep deprivation and rebound have been studied by several workgroups. However, the
comparison of the sleep patterns throughout 24 hours after sleep deprivation by a small
and a large (stress-control) platform has not been described yet. So the effects of selective
REM deprivation were not separated from the effects of stress caused by this method, and
the time course of the sleep rebound was also unknown. The aim of our experiment on
the architecture of REM rebound was to perform this comparison, and thus to describe
the time course of the sleep architecture during the sleep rebound caused by the selective
REM deprivation. Thereafter, we studied the connection between the architecture of sleep
rebound caused by the selective REM deprivation and the endogenous activation of
hypothalamic MCH-ergic and orexinergic neurons. Furthermore, we also aimed to clarify
whether the activation of CART-IR and non-CART-IR subpopulations of MCH-ergic
neurons is associated with the architecture of REM sleep in a similar, or different
manner.
Summarizing the aims of the experiments:
The aim of the first experiment was to describe (1) the architecture of REM
rebound, and (2) the time course of sleep rebound following selective REM
deprivation (Kitka et al, 2009).
In the second experiment, we intended to clarify that (3) which subpopulation
(CART-IR, non-CART-IR) of MCH-ergic neurons has neurophysiological
connection with the REM rebound following selective REM deprivation (Kitka
et al, 2011).
Besides, we studied (4) whether the activation of MCH- and orexin-containing
neurons can be correlated with the changes in sleep pattern caused by selective
REM deprivation. In other words, we aimed to test the possibility that these
neuronal populations play an important role in the regulation of sleep
architecture following selective REM deprivation.

5
3 Materials and methods
3.1 Study design
Male Wistar rats were equipped with frontoparietal EEG electrodes and EMG
electrodes in the neck muscles in both experiments. Motor activity was recorded by the
registration of the movements of the cable for EEG and EMG signs. After the recovery
from the surgery, animals were habituated to the experimental conditions. The following
animal groups were used:
HC (home cage) group: animals were kept in their home cages during the time
of sleep deprivation
SP (small platform) group (only at the second experiment): animals spent 72
hours on a small platform
LP (large platform) group (only at the second experiment): animals spent 72
hours on a large platform
SPR (small platform, sleep rebound) group: animals spent 72 hours on a small
platform, and after that a polysomnographic recording was performed during
the sleep rebound
LPR (large platform, sleep rebound) group: animals spent 72 hours on a large
platform, and after that a polysomnographic recording was performed during
the sleep rebound
The diameter of the small and the large platform was 6.5 cm and 13 cm, respectively.
After the sleep deprivation, a 23-hour-long or a 3-hour-long sleep rebound was
performed in the case of the first or the second experiment, respectively. In the second
experiment, animals were transcardially perfused immediately after the sleep deprivation
(HC, SP and LP groups) or immediately after the sleep rebound (SPR, LPR). The sleep
deprivation and rebound was started at lights on at all cases. Water and food was
available ad libitum for all animals during both experiments.
3.2 Evaluation of the recordings
The vigilance states were classified by SleepSign for Animal sleep analysissoftware
(Kissei Comtec America, Inc., USA) for 4 s periods over 23 h as follows:

6
AW (active wakefulness): the EEG is characterized by low amplitude activity at beta
(14–30 Hz) and alpha (8–13 Hz) frequencies accompanied by high EMG and motor
activity
PW (passive wakefulness): the EEG is characterized by low amplitude activity at
beta (14–30 Hz) and alpha (8–13 Hz) frequencies accompanied by high EMG activity
SWS1 (light slow wave sleep): high voltage slow cortical waves (0.5–4 Hz)
interrupted by low voltage fast EEG activity (spindles 6–15 Hz) accompanied by
reduced EMG and motor activity
SWS2 (deep slow wave sleep): continuous high amplitude slow cortical waves (0.5–4
Hz) with reduced EMG and motor activity
IS (intermediate stage of sleep): a brief stage just prior to REMS and sometimes just
after it, characterized by unusual association of high-amplitude spindles (mean 12.5
Hz) and low-frequency (mean 5.4 Hz) theta rhythm
REM (rapid eye movement) sleep: low amplitude and high frequency EEG activity
with regular theta waves (5–9 Hz) accompanied by silent EMG and motor activity
with occasional twitching
After the automatic scoring, recordings were visually verified. In the case of the study
on the architecture of REM-rebound, the following parameters were calculated for each
animal, with hourly resolution:
Time spent in each sleep stage
TSWS (total slow wave sleep): SWS1 + SWS2
SWS2%: time spent in SWS2 in the percent of TSWS (indicated the average
deepness of SWS)
TW (total wakefulness): AW + PW
Average length of REM sleep episodes
Number or REM sleep episodes
In the case of the study on the neurobiological background of REM sleep architecture
during the rebound, only the pattern of REM sleep was evaluated (time spent in REM,
average length of REM episodes, number of REM episodes). The so-called short REM
attempts (sRa-s) were not taken into the calculation of the number and average REM

7
sleep episodes. Thus a REM episode was defined to be at least 16 s long and not
interrupted by 16 s or longer period of other vigilance stage.
3.3 Immunohistochemistry
Immunohistochemistry was performed only at the study on the neurobiological
background of REM sleep architecture during the rebound. Animals were deeply
anesthetized, transcardially perfused, their brains were removed and 4 series of 50 μm
thick sections were made from their hypothalami.
All primary antibodies were produced in rabbit, except from the MCH/CART/cFos
triple immunohistochemistry, where we used goat anti-MCH. Microwave treatment was
used in order to avoid antibody cross-reaction and to block the horse radish peroxidase.
In case of double immunohistochemistry, we visualized the cFos-containing and MCH-
or orexin-containing neuronal elements with nickel-diaminobenzidine and
diaminobenzidine, respectively. In case of triple immunohistochemistry, the visualization
was performed using FITC-Tyramide (cFos), Alexa 594 (CART) and Streptavidin-
Pacific Blue (MCH).
We quantified the MCH-immunoreactive (MCH-IR) cells at the zona incerta (ZI),
lateral hypothalamus (LH), paraventricular area and perifornical area (PFA); as well as
the orexin-IR cells at the LH, PFA, dorsomedial and posterior hypothalamus for the
double immunohistochemistry using a Reichert visopan microscope. For the triple
immunohistochemistry, labelled neuronal elements were counted at the ZI, PFA and LH
using a Nikon Eclipse E 8000 confocal microscope.
3.4 Statistical evaluation
We used repeated measures ANOVA (analysis of variance) on the data of predefined
time intervals at the study on the architecture of REM rebound. The factors were “group”
(non-repeated) and “time” (repeated). Studied intervals were: 2-24 hours, 2-6 hours, 7-12
hours, 2-12 hours, 13-24 hours. Besides, the data of each hour were evaluated using one-
way ANOVA (factor: “group”). In case of significant effect on “group” (p<0.05), we
performed a Tukey’s post hoc test using the factor “group”. A difference between groups
was considered to be significant in case of significance (p<0.05) in the post hoc test.

8
Daily rhythms were evaluated using cosinor analysis (fitting of a sinusoid curve) with
a period time of 24 hours. We considered a difference between groups to be significant if
the 95% confidence intervals did not overlap. The studied parameters of the curve were
acrophase (the place of the maximal value), mesor (average value) and amplitude.
The data of different groups coming from the double immunohistochemistry and the
evaluation of REM sleep pattern were compared using one-way ANOVA (factor:
“group”). We used factorial ANOVA for the statistical evaluation of triple
immunohistochemistry (factors: “group” and “CART-immunoreactivity”). We performed
a Tukey’s post hoc test in case of significant ANOVA effect of “group”.
Interindividual correlations were studied using linear regression. As the distribution of
the percentage of cFos-IR neuronal elements within orexin-IR cells was exponential-like
in most comparisons, we used the logarithm with base 10 for the regression analysis of
this rate.
STATISTICA 7.0 (Statsoft, Inc, Tulsa, OK, USA) and Time Series Analysis Seriel
Cosinor 6.0 Lab View (Expert Soft Technologie) software were used for the statistical
analysis. Data in all figures are expressed as mean ± SEM.
4 Results
4.1 Study on the 24-hour architecture of the REM-rebound
The architecture of sleep rebound following selective REM-deprivation, and its time
curve were studied in this experiment (Kitka et al, 2009).
4.1.1 Sleep parameters
Several differences were seen between the sleep pattern of the three groups
throughout the whole recorded day. In general, the data of SPR group were different from
the data of HC group during the whole day. The data of LPR group showed differences
from the SPR and HC group mostly during the passive and active phase, respectively. For
the sake of clarity, the results of this experiment (significant differences) are
demonstrated in a table (Table 1). The results regarding the architecture of REM sleep are
shown in more details (Figure 1).

9
Table 1 (next page). Differences between the sleep parameters of HC (home cage), SPR (small
platform, sleep rebound) and LPR (large platform, sleep rebound) groups. AW: active wakefulness,
PW: passive wakefulness, SWS1: light slow wave sleep, SWS2: deep slow wave sleep, IS:
intermediate stage of sleep, REM: rapid eye movement sleep, sRa: short REM attempt, TSWS:
total slow wave sleep, TW: total wakefulness, SWS2%: SWS2 in the percent of TSWS. The light
(passive) phase started at the beginning of the measurement and lasted for 12 hours. One sign:
p<0.05, two signs: p<0.01, three signs: p<0.001. ▲: increased,▼: decreased

10
2-24 h 2-6 h 7-12 h 2-12 h 13-24 h
AW
PW
SWS1 ▼
SWS2
IS
REM ▲▲ ▲▲ ▲▲ ▲▲
REM no.
REM length ▲▲ ▲ ▲ ▲▲
REM no. incl. sRa-s
REM length incl. sRa-s ▲ ▲ ▲ ▲▲
TSWS ▼
TW ▼
SWS2%
2-24 h 2-6 h 7-12 h 2-12 h 13-24 h
AW ▼ ▼▼
PW
SWS1 ▲▲
SWS2
IS
REM ▲▲▲ ▲▲▲ ▲▲▲ ▲▲▲ ▲▲▲
REM no. ▲▲▲ ▲▲ ▲▲ ▲▲▲ ▲▲▲
REM length ▲▲ ▲ ▲▲ ▲▲
REM no. incl. sRa-s ▲▲▲ ▲▲ ▲▲ ▲▲ ▲▲
REM length incl. sRa-s ▲▲▲ ▲▲ ▲▲ ▲▲ ▲
TSWS ▼▼▼ ▼ ▲▲
TW ▼▼▼ ▼▼ ▼▼▼
SWS2%
2-24 h 2-6 h 7-12 h 2-12 h 13-24 h
AW ▼
PW
SWS1 ▲ ▲▲
SWS2 ▼
IS
REM ▲ ▲
REM no. ▲ ▲
REM length
REM no. incl. sRa-s ▲ ▲
REM length incl. sRa-s
TSWS
TW ▼▼▼ ▼▼
SWS2% ▼
SPR group compared to LPR group
SPR group compared to HC group
LPR group compared to HC group
11

12
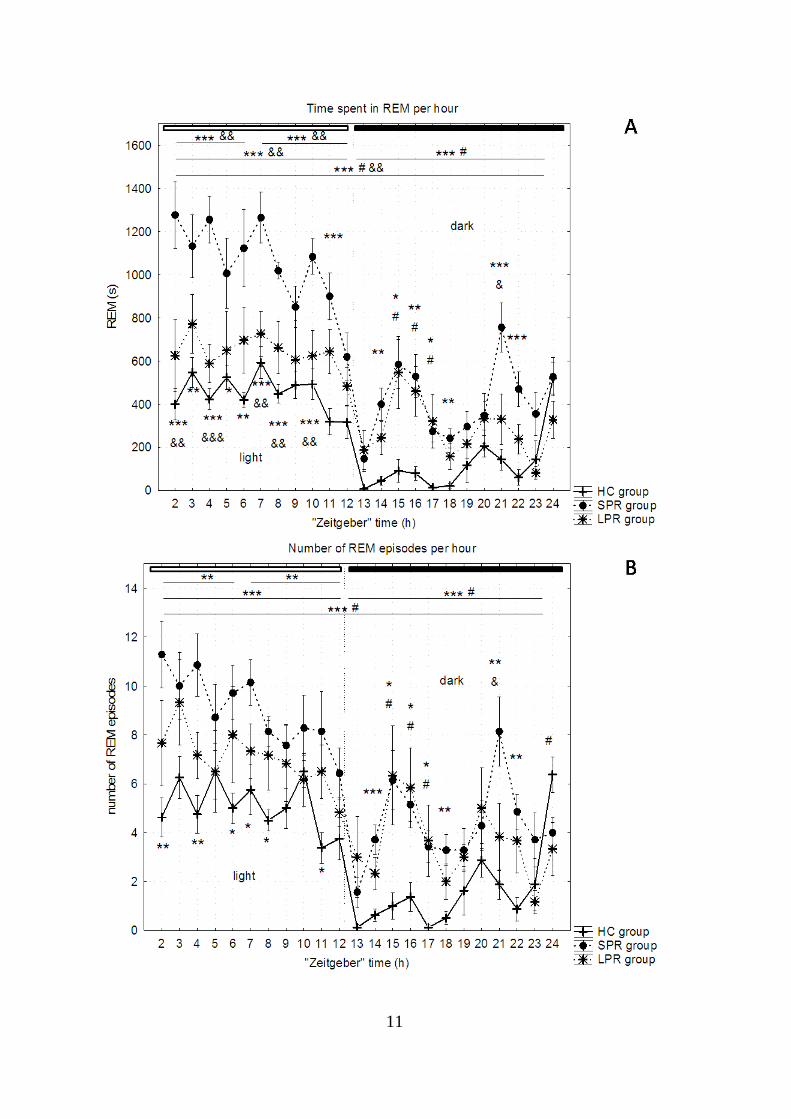
Figure 1 Time spent in REM sleep (A), number (B) and average length (C) of REM sleep episodes
throughout 24 hours following the 72-hour-long sleep deprivation period. HC: home, SPR: small
platform sleep rebound, LPR: large platform, sleep rebound. *: difference between HC and SPR, #:
difference between HC and LPR, &: difference between SPR and LPR groups. One sign: p<0.05,
two signs: p<0.01, three signs: p<0.001
4.1.2 Evaluation of daily rhythms
We did not find any alterations between the acrophases of any groups or studied
parameters, meaning that we did not find any phase-shift. Thus only the amplitude and
mesor values will be demonstrated (Table 2).

13
Table 2 The results of the cosinor analysis. HC: home cage, SPR: small platform sleep rebound,
LPR: large platform sleep rebound group; AW: active wakefulness, PW: passive wakefulness,
SWS1: light slow wave sleep, SWS2: deep slow wave sleep, IS: intermediate stage of sleep, REM:
rapid eye movement sleep, sRa: short REM attempt, TSWS: total slow wave sleep, TW: total
wakefulness, SWS2%: SWS2 in the percent of TSWS. *: difference between HC and SPR, #:
difference between HC and LPR, &: difference between SPR and LPR groups (p<0,05)
mean CI min CI max mean CI min CI max
HC 0 995 860 1130 1130 1030 1230
SPR 0 595 * 475 716 820 * 733 907
LPR 0 640 # 496 784 861 # 757 964
HC 0,0127 118 40,3 197 730 674 785
SPR 0 192 137 247 540*& 500 579
LPR 0,0007 210 104 317 696 620 773
HC 0 329 253 405 646 591 701
SPR 0,4346 50,6 * -26,6 128 775 *& 722 829
LPR 0,0038 200 84,1 316 1020 # 935 1100
HC 0 555 456 653 699 629 768
SPR 0 300 * 220 318 582 & 525 639
LPR 0 347 # 243 451 362 # 288 436
HC 0 96,3 79,5 113 112 99,9 124
SPR 0 92,6 71,3 114 161 *& 145 176
LPR 0 131 91,1 170 205 # 176 234
HC 0 250 215 256 283 257 308
SPR 0 442 *& 373 511 723 *& 673 772
LPR 0 231 163 299 457 # 408 507
HC 0 2,67 2,22 3,12 3,33 3 3,65
SPR 0 2,52 1,79 3,25 5,49 * 4,97 6,02
LPR 0 2,19 1,39 2,99 5,62 # 4,69 5,84
HC 0 3,32 2,78 3,87 4,32 3,93 4,7
SPR 0 3,5 2,68 4,32 7,88 *& 7,29 8,47
LPR 0 2,64 1,76 3,53 6,45 # 5,81 7,08
HC 0 770 659 881 1340 1270 1420
SPR 0 260 *& 172 348 1360 1290 1420
LPR 0 496 # 391 600 1380 1310 1460
HC 0 1110 972 1250 1860 1760 1960
SPR 0 788 * 653 923 1360 * 1260 1460
LPR 0 844 692 996 1560 # 1450 1670
HC 0 18,4 13 23,7 45,8 42 49,5
SPR 0 13,8 8,79 18,8 40,5 & 36,9 44
LPR 0 13,7 7,47 20 22,9 # 18,5 27,3
TSWS (s)
TW (s)
SWS2%
SWS1 (s)
SWS2 (s)
IS (s)
REM (s)
REM no.
REM no. (incl. sRa-s)
PW (s)
group p(H0)amplitude mesor
AW (s)

14
4.2 Study on the neurobiological background of the architecture of REM-
rebound
Slimilarly to the previous experiment, we have seen that the SPR animals spent more
time in REM sleep than the LPS animals during the rebound following the 72-hour-long
sleep deprivation (p=0.011). In addition, this difference was accompanied by an increase
in the average length of REM episodes (p=0.017), while the number of REM episodes
was unchanged.
4.2.1 Morphological data
The ratio of orexin-cFos and MCH-cFos double labelled neurons is demonstrated by
Figure 2, while the ratio of cFos-IR neurons within the CART-IR and non-CART-IR
subpopulations of MCH-containing neurons is shown at Figure 3.

15
Figure 2 Percent of cFos-staining cells within MCH- (melanin-concentrating hormone)
immunoreactive (A) and orexin-immunoreactive (B) neurons at all studied brain regions after the
3-hour-long rebound following 72-hour-long sleep deprivation. HC: home cage, SP: small platform
sleep deprived, SPR: small platform sleep rebound, LP: large platform sleep deprived, and LPR:
large platform sleep rebound; #: difference compared to HC group, &: difference compared to
respective non-sleep rebound group, *: difference between SPR and LPR groups; one sign: p<0.05,
two signs: p<0.01, three signs: p<0.001
3. ábra. Percent of cFos immunoreactive cells within the CART-IR and non-CART-IR
subpopulations of melanin-concentrating hormone-containing neurons after the 3-hour-long
rebound following 72-hour-long sleep deprivation. SPR: small platform sleep rebound, LPR: large

16
platform sleep rebound, CART-IR: cocaine- and amphetamine regulated transcript-
immunoreactive; ***: p<0.01 compared to SPR non-CART-IR cell group, ##: p<0.01 compared to
LPR CART-IR cell group
4.2.2 Interindividual correlations
In order to elucidate the relation between the architecture of REM sleep and the
activation of MCH- and orexin-containing neurons, we performed a linear regression on
the data of SPR group. The correlations found are demonstrated by Figure 4. None of the
studied immunohistochemical parameters have shown a correlation with the average
length of REM episodes.
42 44 46 48 50 52 54 56 58
c-Fos% within the MCH immunopositive cells
30
35
40
45
50
55
60
65
70
75
Tim
e s
pe
nt in
RE
MS
(m
in)
du
rin
g the
3h
reb
ou
nd
95% confidence
A
R2=0.779, p=0.002
0.2 0.3 0.4 0.5 0.6 0.7 0.8 0.9 1.0 1.1
log c-Fos% within orexin immunopositive cells
30
35
40
45
50
55
60
65
70
75
Tim
e s
pe
nt in
RE
MS
(m
in)
du
rin
g the
3h
reb
ou
nd
95% confidence
B
R2=0.734, p=0.003

17
42 44 46 48 50 52 54 56 58
c-Fos% within the MCH immunopositive cells
14
16
18
20
22
24
26
28
30
32
nu
mb
er
of R
EM
S e
pis
od
es d
uring
th
e
3h
reb
ou
nd
95% confidence
C
R2=0.769, p=0.002
0.2 0.3 0.4 0.5 0.6 0.7 0.8 0.9 1.0 1.1
log c-Fos% within the orexin immunopositive cells
14
16
18
20
22
24
26
28
30
32
nu
mb
er
of R
EM
S e
pis
od
es d
uring
th
e
3h
reb
ou
nd
95% confidence
D
R2=0.569, p=0.019
42 44 46 48 50 52 54 56 58
c-Fos% within MCH immunopositive cells
0.2
0.3
0.4
0.5
0.6
0.7
0.8
0.9
1.0
1.1
log
c-F
os%
with
in o
rexin
imm
un
op
ositiv
e c
ells
95% confidence
E
R2=0.538, p=0.024

18
Figure 4 (previous page) Correlations between individual parameters in the small platform sleep
rebound group. (A) Time spent in REM during the 3 h rebound and the percentage of cFos double-
stained neurons within the MCH-IR (melanin-concentrating hormone-immunoreactive) cells, (B)
time spent in REM during the 3 h rebound and the percentage of cFos double-stained neurons
within the orexin-IR cells, (C) number of REM episodes during the 3 h rebound and the
percentage of cFos double-stained neurons within the MCH-IR cells, (D) number of REM episodes
during the 3 h rebound and the percentage of cFos double-stained neurons within the orexin-IR
cells, (E) percentage of cFos double-stained neurons within the MCH-IR cells and the percentage of
cFos double-stained neurons within the orexin-IR cells
5 Conclusions
1. Although the rebound following sleep deprivation using both a small or a large
platform resulted in an elevation of the number of REM sleep episodes, we did not find
significant alteration between this parameter of the sleep rebound groups. In contrast, the
average length of REM episodes was increased during the rebound following a small
platform sleep deprivation compared to the large platform sleep rebound group. Based on
this result, we propose that the elongation of REM episodes is characteristic for the REM
rebound caused by the selective REM deprivation; while the increased number of REM
episodes is a consequence of the stress factors (new environment, humidity,
immobilisation), or the general sleep deficit caused by the “flower pot” method.
2. The increased time spent in REM sleep caused by the selective REM deprivation
is characteristic for the subsequent passive phase. In contrast, the increased time spent in
slow wave sleep can be observed during the forthcoming active phase, when the slow
wave sleep becomes superficial in the case of the LPR (stress-control) group
3. Based on our results, the non-CART-IR subpopulation of MCH-ergic neurons
show similar activation during the rebound following sleep deprivation by a small or a
large platform. Contrarily, the activation of the CART-containing subpopulation is higher
during the rebound caused by the sleep deprivation using a small platform, than using a
large one. This result suggests that the activation of this neuronal population may be
related to the REM-rebound caused by a selective REM deprivation.

19
4. Despite the findings that the selective REM deprivation results in the elongation of
REM episodes during the subsequent sleep rebound, and the activation of MCH-
containing neurons is apparent parallelly, we did not find an interindividual correlation
between these parameters. In contrast, there was a significant correlation between the
number of REM episodes and the activation of MCH- and orexin immunoreactive
neurons. In accordance with their known effects on REM sleep, this correlation was
positive in the case of MCH-ergic and negative in the case of orexinergic neurons.
Therefore we can presume that the pattern of REM rebound caused by selective REM
deprivation (i.e. the increased average length of REM episodes) is not regulated by the
MCH-ergic neurons. Thus we may conclude that the neurobiological background of this
phenomenon is still unknown, and elucidating its regulation requires further experiments.
6 List of own publications
6.1 Publications used for the dissertation
Kitka T, Adori C, Katai Z, Vas S, Molnar E, Papp RS, Toth ZE, Bagdy G. (2011)
Association between the activation of MCH and orexin immunorective neurons and REM
sleep architecture during REM rebound after a three day long REM deprivation.
Neurochem Int 59(5): 686-694.
Kitka T, Katai Z, Pap D, Molnar E, Adori C, Bagdy G. (2009) Small platform sleep
deprivation selectively increases the average duration of rapid eye movement sleep
episodes during sleep rebound. Behav Brain Res 205(2): 482-487.
6.2 Publications not used for the dissertation
Bagdy G, Filakovszky J, Kántor S, Juhász G, Graf M, Jakus R, Gonda X, Zsombok T,
Ádori Cs, Balogh B, Kirilly E, Andó RD, Lazáry J, Gyöngyösi N, Benkő A, Molnár E,
Kitka T (2009). A szerotonin a központi idegrendszerben: kirándulás a neurobiológiától,
genetikától a farmakológia, pszichiátria és neurológia felé. Orvosképzés S2 (53-132): 73-
92

20
Bálint E, Kitka E, Zachar G, Ádám, Á, Hemmings Jr HC, Csillag A (2004).
Abundance and location of DARPP-32 in striato-tegmental circuits of domestic chicks. J
Chem Neuroanat 28: 27-36
Balogh B, Kitka T, Kirilly E, Renoir T, Lanfumey L, Hamon M, Kantor S, Bagdy G
(2008): Sleep effects of citalopram in control and MDMA-pretreated rats. Fundam Clin
Pharmacol 22 (suppl 2): 122-122
Gyongyosi N, Balogh B, Kirilly E, Kitka T, Kantor S, Bagdy G (2008). MDMA
treatment 6 months earlier attenuates the effects of CP-94,253, a 5-HT1B receptor
agonist, on motor control but not sleep inhibition. Brain Res 22 (1231):34-46
Katai Z, Kitka T, Garay T, Molnar E, Bagdy G (2009). Peak in the theta power
spectrum of EEG shows strong association with voluntary movements in rats. Eur
Neuropsychopharm 19 (Suppl. 3):S292-S293
Kitka T, Bagdy G (2008). Effect of 5-HT2A/2B/2C receptor agonists and antagonists
on sleep and waking in laboratory animals and humans. In: Serotonin and Sleep:
Molecular, Functional and Clinical Aspects. Monti JM, Pandi-Perumal SR, Jacobs BL,
Nutt, DJ (Eds) Birkhauser Verlag, Switzerland, 2008: 387-415.
Related Documents