DISCUSSION PAPER SERIES Forschungsinstitut zur Zukunft der Arbeit Institute for the Study of Labor Effects of Religiosity on Social Behaviour: Experimental Evidence from a Representative Sample of Spaniards IZA DP No. 7683 October 2013 Pablo Brañas-Garza Antonio M. Espín Shoshana Neuman

Welcome message from author
This document is posted to help you gain knowledge. Please leave a comment to let me know what you think about it! Share it to your friends and learn new things together.
Transcript

DI
SC
US
SI
ON
P
AP
ER
S
ER
IE
S
Forschungsinstitut zur Zukunft der ArbeitInstitute for the Study of Labor
Effects of Religiosity on Social Behaviour: Experimental Evidence from a Representative Sample of Spaniards
IZA DP No. 7683
October 2013
Pablo Brañas-GarzaAntonio M. EspínShoshana Neuman

Effects of Religiosity on Social Behaviour:
Experimental Evidence from a Representative Sample of Spaniards
Pablo Brañas-Garza Middlesex University London
Antonio M. Espín Universidad de Granada
Shoshana Neuman
Bar-Ilan University and IZA
Discussion Paper No. 7683 October 2013
IZA
P.O. Box 7240 53072 Bonn
Germany
Phone: +49-228-3894-0 Fax: +49-228-3894-180
E-mail: [email protected]
Any opinions expressed here are those of the author(s) and not those of IZA. Research published in this series may include views on policy, but the institute itself takes no institutional policy positions. The IZA research network is committed to the IZA Guiding Principles of Research Integrity. The Institute for the Study of Labor (IZA) in Bonn is a local and virtual international research center and a place of communication between science, politics and business. IZA is an independent nonprofit organization supported by Deutsche Post Foundation. The center is associated with the University of Bonn and offers a stimulating research environment through its international network, workshops and conferences, data service, project support, research visits and doctoral program. IZA engages in (i) original and internationally competitive research in all fields of labor economics, (ii) development of policy concepts, and (iii) dissemination of research results and concepts to the interested public. IZA Discussion Papers often represent preliminary work and are circulated to encourage discussion. Citation of such a paper should account for its provisional character. A revised version may be available directly from the author.

IZA Discussion Paper No. 7683 October 2013
ABSTRACT
Effects of Religiosity on Social Behaviour: Experimental Evidence from a Representative Sample of Spaniards1
This study explores the effect of several personal religion-related variables on social behaviour, using three paradigmatic economic games: the dictator (DG), ultimatum (UG), and trust (TG) games. A large carefully designed sample of a Spanish urban adult population (N=766) is employed. From participants’ decisions in these games we obtain measures of altruism, bargaining behaviour and sense of fairness/equality, trust, and positive reciprocity. Three dimensions of religiosity are examined: (i) religious denomination; (ii) the intensity of religiosity, measured by active participation at church services; and (iii) converting out into a different denomination than the one raised in. The major results are: (i) individuals with “no religion” made decisions closer to rational selfish behaviour in the DG and the UG compared to those who affiliate with a “standard” religious denomination; (ii) among Catholics, intensity of religiosity is the key variable that affects social behaviour insofar as religiously-active individuals are generally more pro-social than non-active ones; and (iii) the religion raised in seems to have no effect on pro-sociality, beyond the effect of the current measures of religiosity. Importantly, behaviour in the TG is not predicted by any of the religion-related variables we analyse. Given the accelerating share of “no religion” individuals (in Europe and elsewhere) and the large influx of immigrants – who tend to be more religiously active compared to the native populations – our findings have significant implications for the future pro-sociality patterns in Europe. JEL Classification: C7, C9, Z12, Z13 Keywords: economic experiments, religion, church attendance, pro-social behaviour, Spain Corresponding author: Pablo Brañas-Garza Middlesex University London Business School Hendon Campus The Burroughs London NW4 4BT United Kingdom E-mail: [email protected]
1 Thanks are due to Filippos Exadaktylos, Tere García and Juan F. Muñoz for their help in running the experiments. Financial support from the Spanish Ministry of Science and Innovation (ECO2010-17049), the Government of Andalusia Project for Excellence in Research (P07.SEJ.02547), and the Ramón Areces Foundation (R + D 2011) is gratefully acknowledged.

2
1. Introduction and motivation
Rules and norms of behaviour are fundamental elements of religions. Every single
religion contains a system of ideas and rules about how life should be lived. The rules
are not restricted to the family (or the individual) but cover also the social dimension,
that is, how to behave in the community. These social norms prevent individuals from
misconduct within the society (“Thou shalt not kill, not commit adultery, not steal,
not bear false witness against thy neighbour, …”, Ten Commandments) and therefore
restrain anti-social behaviour. Moreover, most religions promote generosity towards
members of the society and also towards foreigners (in Islam the concept of i’thar,
that is “preferring others to oneself”), especially towards those who need support (in
Judaism, one is requested to give one tenth of his earnings to the needy; or “One who
does not give to the poor has no luck”, Proverbs 28:27). Religions also promote
egalitarian distribution of resources. As Harrington and Keenan (2005) and Wallis
(2005) point out, egalitarianism is behind the idea of religious charity: sharing with
those who have less.
One of the basic principles of religions is that God observes what humans do. It
follows that individuals believe that they are constantly monitored by Him, who has
the power to punish those who deviate from the norm, and reward those who follow
the rules (e.g., Johnson and Krueger, 2004; Norenzayan and Shariff, 2008).
Punishment and reward are expected in both the current life and the afterlife. Brañas-
Garza et al. (2010) provide empirical evidence (based on a large data set, estimating
equations of attendance of church services) that both the fear of divine punishment
(Hell) and the expectation of divine reward (Heaven) significantly affect church
attendance. Interestingly, belief in Heaven (reward) has a stronger incentive for
church attendance than belief in Hell (punishment).
Accordingly, religiosity has proved to exert a huge effect on individual decision-
making and behaviour. An extensive literature shows that religion and religiosity (as
well as other cultural traits) matter to important economic phenomena, such as:
educational attainments (Cohen-Zada, D., 2005; Fan, 2008); labor force participation
(Fernandez and Fogli, 2009); income and financial assets (Keister, 2003); marriage
and inter-faith marriage (Bisin et al., 2004); fertility (Neuman, 1986; Neuman and

3
Ziderman, 1986; Becker, 1993; Fernandez and Fogli, 2006, 2009; Neuman, 2007;
Brañas-Garza and Neuman, 2007; Bar-El et al., 2013).2
It was also demonstrated that religion and intensity of religiosity affect social
interactions and attitudes: several studies relate to donations (e.g., Flanagan, 1991;
Barry, 1996; Brooks, 2003) and show that intensity of religious participation is
positively associated with amounts donated in charity giving. Guiso et al. (2003) find
a positive relationship between religiosity and trust in others and in institutions.
Brañas-Garza et al. (2009) use a sample of Latin American Catholics and show that
religiously-active Catholics trust peers and institutions more compared to non-active
Catholics and individuals who belong to other denominations.
An accelerating phenomenon (in Europe and elsewhere) is the growing number of
individuals who claim to have “no religion”. Data from the 2002-2010 waves of the
European Social Survey (ESS) include 39.1% of respondents who identify their
religion as “no religion” (García-Muñoz and Neuman, 2013b). A recent report
published by the Pew Research Center’s Forum on Religion & Public Life (on the
18th of December, 2012) claims that the third largest “religion” is the “no religion” –
it is estimated that there are 1.1 billion individuals who claim to have “no religion”
(16% of the world population; the majority lives in communist countries, 700 million
in China). Christianity is the largest religion (2.2 billion individuals, comprising 32%
of the world population) and Islam comes second (1.6 billion individuals, comprising
23% of world population). After the third “no religion” denomination, the fourth is
Hindu (1 billion individuals) and the fifth is Buddhism (0.5 billion). Only 14 million
individuals belong to the faith of Judaism (0.02 percent of world population). Given
the pronounced share of the “no-religion” group it is essential to study their social
behaviour as it will have major effects on society.
Another significant phenomenon is the increasing influx of immigrants (into Europe
and other regions), who compose a considerable share of the populations in many
2 There are also studies that show the effect of aggregate country-level religiosity on country-level economic performance. E.g., Barro and McCleary (2003) claim that religious beliefs (at the country level) may stimulate economic growth. We focus however on individual behaviour and these studies are beyond the scope of our paper.

4
countries.3 The intensified religiosity of immigrants (compared to natives) became a
fundamental issue that could affect all spheres of life, including the economic and
social domains. Indeed, a large set of studies relate to the religiosity of immigrants.
First-generation immigrants (in European countries and in the United States) appear
to be more religious than natives, in terms of church attendance and also in terms of
the more intimate activity of prayer (everything else being equal). See Aleksynska
and Chiswick (2013), and García-Muñoz and Neuman (2012, 2013a, 2013b), for
most recent studies, and Williams (1988) for an earlier study. In Europe (but not in
the United States), second-generation immigrants are still more religious than natives
(Malepaard et al., 2010; Fleischman and Phalet, 2012; García-Muñoz and Neuman,
2013b). The “religious vitality theory” claims that second-generation immigrants
have a lower tendency to assimilate (religiously) if they belong to a minority religion,
highlighting the role of religious socialization within families and communities rather
than within the state (Fleischman and Phalet, 2012). The fact that immigrants in
Europe are more religious than the local populations and do not assimilate religiously
even in the second generation, combined with the projection that the share of
immigrants in European countries will keep growing, leads to the prediction that
immigrants will have a pronounced effect on the religious landscape in Europe.4 If
religiosity affects social behaviour as our study tries to explore, the outcome could be
major changes in social behaviour and social institutions in Europe, which could as
well affect other domains of the society and economy. 3 The United Nations reports that in 2010 213.9 million people, that constitute 3.1% of the world population, were migrants who lived and worked in a country in which they were not born. Europe had a share of 32.6% in world migrants’ stock, and the United States hosted 20% of world migrants. Moreover, the flow of migrants has constantly increased over the last two decades. The United Nations estimated that the number of migrants was 155.5 million people in 1990. It follows that between 1990 and 2010 an increase of 37.5% was evidenced. The increase is even more impressive in Europe (41.3%) and soars to 84.1% in the United States (United Nations, 2009). In many European countries more than 10% of the population are “foreign born” individuals (e.g., Austria, Spain, Sweden, Germany, the UK, the Netherlands; Luxembourg has 32.5% of “foreign born”; See García-Muñoz and Neuman, 2013b, table 1)
4 Immigration and the religiosity of immigrants are key factors in shaping the religious and demographic landscape of Europe. Based on the demographic advantage of the religious immigrant populations caused by (i) the dramatic decrease in fertility rates within secular native European populations; which (ii) is combined with high fertility rates among the religious immigrant populations; and (iii) coupled with the immigration of more religious groups into secular countries; the long-term consequences will be: 1) a constant and drastic change in the religious makeup, with a growing share of more religious residents in general and of members of Islam faith in particular; and 2) de-secularization and growing religious intensity (García-Muñoz and Neuman, 2013b).

5
One of the major reasons why immigrants in European countries do not adapt to the
religious standards and performance in the receiving countries, in contrast to
immigrants in the United States who do, stems from the different incentives behind
the intensified religiosity of immigrants: while in the United states, religiosity of
immigrants serves as a “bridge” between immigrants and natives that accelerates the
assimilation process, in European countries it is a “buffer” and shock-observer
against the hardships of integration and serves as “balm to the soul”. Empirical
evidence for the differing motives at the two sides of the Atlantic is based on the
estimation of extended “mass participation equations” and “prayer equations”, using
data from several waves of the European Social Survey (ESS), the American General
Social Survey (GSS), and the International Social Survey Program (ISSP) (See
García-Muñoz and Neuman, 2013b, for details). It follows that, while in the United
States intensified religiosity of immigrants has social networking effects that lead to
assimilation and adaptation within the receiving populations, in Europe the social
effects are local and evident only within the immigrant's community.
It should be noted that all the studies cited above on the relationship between
religiosity and pro-social behaviour are based on self-reported survey data, rather
than the direct observation of the individual's attitude and behaviour. There are
several experimental studies that investigate the role of religious denomination and
intensity of religiosity on social behaviour, using economic games. Yet the results
vary and are not conclusive. For instance, Anderson and Mellor (2009) – using a
sample of 64 subjects, at the age of 50 and over – investigate whether religious
denomination and intensity of attendance of church services are correlated with
cooperation. They are using a repeated Public Good experiment, and find that neither
denomination nor church-attendance significantly affect contributions to the public
good. The experiment was replicated using a sample of 144 students, yielding similar
insignificant effects. Anderson et al. (2010), on the other hand, find that contributions
increase with frequency of church attendance, among subjects attending religious
services. In the same paper, Anderson et al. also find that church attendance does not
have a significant effect on the outcomes of a Trust game. Using a large sample from
three European countries, Migheli (2012) does however find a weak positive effect of
religiosity, measured by time devoted to religious associations, on the amounts
passed by the senders to the receivers in a trust game. In a similar vein, Eckel and

6
Grossman (2003) report a positive correlation between attendance at religious
services and donations to charities, in an experiment with 168 subjects. Ahmed
(2009), using a sample of 102 men, finds that religious students (preparing to enter
the clergy in India) are more cooperative in a public good game and give more in a
Dictator game than non-religious ones.
In order to avoid the causality problems associated with studies that look at
correlations, recent research has made use of religious priming in economic
experiments. Shariff and Norenzayan (2007), using two samples, of 50 and 78
subjects, find that individuals who were assigned to a treatment with a scramble-
sentence task aimed at priming religious concepts, were more generous in a dictator
game. However, in a similar experimental setup, using a larger sample of 304
subjects and a modified Ultimatum game, McKay et al. (2011) did not find a
significant effect of religious priming on subjects’ “altruistic” punishment of unfair
behaviour, although a significant positive effect was found for those subjects who had
previously donated to a religious organization.
In a large experimental study (N>800), Benjamin et al. (2010) explore the impact of
religious identity – which was made salient by using a sentence-unscrambling task –
on: contributions in a public good game; giving in a dictator game; risk aversion, time
discounting and behaviour in a labour market task. Results are unclear: after religious
priming, Protestants contribute more to the public good, Catholics contribute less and
become less risk averse, while Jews reciprocate more in the labour market game.
Also, they find no evidence that “religious identity salience” affects discount rates or
purely altruistic generosity in the dictator game. Rand and et al. (2013), based on two
experiments with 69 and 547 subjects, analyse the effect of explicit religious primes
on subjects’ behaviour, in a Prisoner’s Dilemma Game. They suggest a positive effect
of religious primes on cooperation, at least among Christians. See Norenzayan and
Shariff (2008), for a discussion on the origins and the evolutionary roots of religious
pro-sociality.
Thus, the literature on how religion affects social behaviour has been largely
inconclusive. In this paper, we aim to add to this literature of Experimental
Economics of Religion (see Hoffman, 2013). Using a large representative sample of a
Spanish urban adult population (766 subjects), we explore how individual religious

7
variables correlate with social behaviour in three canonical economic games.
Specifically, from participants’ decisions in these games we obtained measures of
altruism (giving in a dictator game, DG), bargaining behaviour and sense of
fairness/equality (offer and minimum acceptable offer – MAO – in an ultimatum
game, UG), trust (passing the money in a binary trust game, TG) and positive
reciprocity (returning part of the trusted amount in the TG).
Three dimensions of religiosity are considered and examined: the subjects’
religion/denomination (61.6% are Catholics; 2% Muslims; 0.8% Evangelicals; 4.3%
have other religions; and 31.3% are claiming to have “no-religion”, hereafter NR5);
frequency of church-attendance; and if the respondent changed her/his religion at
some point in her/his life (from any denomination to another, including NR; for
instance, 12.3% of respondents in the sample changed from Catholic to NR).
The paper aims at answering the following questions: do Catholics (compared to the
rest of the sample) exhibit a different social behaviour? Are those who claim to have
no-religion (with respect to the rest of the sample, i.e., believers in any denomination)
less or more pro-social? Is it just denomination that matters, or is religious intensity
(measured by attendance at religious services) the most important variable explaining
social behaviour? And, finally, are religion-specific social values transmitted from
parents to children? Data on religious conversion can help in answering the last
question. It could be learnt from an examination of a group of individuals who
currently share the same religion and comparing two within sub-groups: those who
always had that religion, versus the sub-group that changed denomination (i.e., was
raised within a different religion).
While these are interesting general questions, given the multidimensional nature of
both social behaviour and religiosity, it is also essential to unravel in which specific
dimensions are religiosity and social behaviour interconnected. Our set of
experimental variables will facilitate such an examination.
We believe that our results provide a true reflection of the effects of religion and
religiosity on social behaviour, and thus contribute significantly to the relatively
5 This figure is close to the ESS figure of 39.1% that claim to have “no religion”, indicating that in this sense the sample is representative of the European population. The terms “no religion” and “not believing” will be used interchangeably.
8
scarce existing experimental literature. Our findings are trusted to be highly reliable
due to (i) the large sample; (ii) the use of several types of games: DG, UG, and TG;
(iii) the composition of the sample, that includes representative ordinary people, with
varied socio-demographic characteristics, rather than only University students who
compose the majority of samples in experimental economics studies; and (iv) the
unique sample that does not consist of only self-selected volunteers who come to the
lab (which is common in most studies). Instead, interviewers went to the respondents’
places. The last two features are exclusive and innovative and distinguish our
experiments from the standard experiments presented in the literature.
The paper is structured as follows. The next section describes the research methods.
The third section explains the variables of interest (in particular the experimental
variables) and provides some basic statistics. Section four presents the findings, and
the last section offers concluding remarks and implications.
2. Methods
This section will be divided into two parts. First we describe the sample obtained
through a stratified random method. Second we focus on the protocol and the
experimental games.
Sampling
The survey-experiment was conducted in Granada (Spain) in 2010. A stratified
random method was used to obtain the sample. In particular, the city was divided into
nine geographical districts, which served as sampling strata. Within each stratum we
applied a proportional random method to minimize sampling errors. This method
ensures a geographically representative sample.
Our sample consists of individuals who agreed to complete the survey when the
interviewers (who worked in pairs for security and logistic reasons) invited them to
participate. Being interviewed in the own apartments decreases opportunity costs
(thus increasing the participation rate) and prevents selection-bias (that could exist
when volunteers are coming to the lab). In order to control for selection-bias within
households, only the individual who opened the door was allowed to participate.

9
Lastly, the data collection process was well distributed across both daytime and
weekday. This sampling procedure resulted in a representative sample of the city’s
adult population in terms of age and gender. Detailed information of the procedures,
including survey and experimental instructions, can be found in Exadaktylos et al.
(2013).
Protocol and the experimental games
The interviewers were last-year University students enrolled in a course on “Field
Experiments”. Their performance was linked to their final grade in the course and
carefully monitored by the main researchers in real time by means of a web-based
system and follow-up calls to randomly selected participants in order to ensure the
reliability of the data collected. The interviewers introduced themselves to the
potential participants and explained that they were carrying out a study for the
University of Granada. Upon agreement to participate, the participants were informed
that the data would be used for scientific purposes only and under conditions of
anonymity, according to the Spanish Law on Data Protection. One interviewer read
the questions clearly, while the other noted down the answers (to the socio-economic
questions). The duration of the survey/experiment averaged 40 minutes and 835
observations were finally obtained.
In the first part, extensive socio-economic information of the participants was
collected. In the second part, participants played both roles of three paradigmatic
games of research on social preferences, namely the dictator game (DG), the
ultimatum game (UG) and the trust game (TG). Thus, each participant made five
decisions, since the second player in the DG is totally passive. At the beginning of the
second part, the participants received some general information about the nature of
experimental economic games according to standard procedures. In particular,
participants were informed that:
• The five decisions involved real monetary payoffs, coming from a national
research project, endowed with a specific budget for this purpose;
• The monetary outcome would depend on the participant’s decision, or on both
her/his own and another randomly matched participant’s decision, whose
identity would forever remain anonymous;

10
• One of every ten participants would be randomly selected to be paid, and the
exact payoff would be determined by a randomly selected role (game);
• Matching and payment would be implemented within the next few days;
• The procedures ensure absolute double-blinded anonymity by using a decision
sheet, which they would place in the provided envelope and then seal. Thus,
participants’ decisions would remain forever unknown to: the interviewers,
the researchers, and the randomly matched participant.
Once the general instructions had been explained, the interviewer read the details for
each experimental decision separately. After every instruction set, participants were
asked to write down their decisions privately and proceed to the next task. To control
for possible order effects on decisions, the order both between and within games was
randomized across participants, resulting in 24 different orders (always setting aside
the two decisions of the same game).
On average, the eighty subjects who were randomly selected for real payment earned
€9.60 (min €0; max €40).
3. Variables of interest and basic statistics
The data set is very rich and facilitates the use of a large battery of controls (e.g.,
gender, income, education, age, political views, cognitive skills…). After the
exclusion of observations with missing values, we arrived at a sample size of 766
individuals.
Experimental design and variables
We have five basic measurements based on subjects’ behaviour in the experimental
games, each reflecting a dimension of social behaviour: genuine altruism, strategic
altruism, fairness, trust, and positive reciprocity. The derivation of these elements is
described below:
(i) In the DG, subjects had to split a pie of €20 between themselves and an
anonymous participant. Subjects decided which share of the €20, in €2 increments,

11
they wanted to transfer to the other participant. Hence, this variable facilitates the
observation of genuine altruism/generosity;
(ii) In the case of the UG, proposers made an offer (also from a “pie” of €20) to the
responder, but implementation was upon acceptance of the offer by the randomly
matched responder. In case of rejection neither participant earned anything. For the
role of the responder in the UG we used the strategy method, in which subjects have
to state their willingness to accept or reject each of the proposals. Since low offers in
the UG might be rejected, we consider proposers’ generous offers as strategic
altruism. The subjects’ minimum acceptable offer (MAO) as responders in the UG –
that is, the minimum amount of money that the subject would accept – reflects a
sense of fairness (or aversion to inequality, at least to disadvantageous inequality);
(iii) In the TG (a binary version created by Ermisch et al. 2009), the trustor (1st
mover) had to decide whether to pass €10 or €0 euros to the trustee (2nd mover). In
case of passing nothing, the trustor earned €10 and the trustee nothing. If she/he
passed the €10, the trustee would receive €40 (the amount of money was quadrupled).
In the second step: the trustee, conditional on the trustor having passed the money,
had to decide whether to send back €22, and keep €18 for himself, or keep all €40
without sending anything back, in which case the trustor would not earn anything.
Hence, a trustor passing the money in this binary TG reflects confidence in the
trustworthiness of the trustee, while the trustee returning a positive amount of money
indicates positive reciprocity since she/he could keep the whole pie.
Religious dimensions
The first section of the survey includes questions on the following aspects of
religiosity (relative frequencies of responses in parentheses):
• Item 15 relates to religious denomination/beliefs.
As far as your religious denomination/beliefs are concerned, do you
classify yourself as: No religion (31.3%, NR hereafter), Catholic (61.6%),
Muslim (2%), Evangelical (0.8%), other religion (4.3%)
• Item 15.1 focuses on frequency of attendance of church (place of worship)
services (relative frequencies among Catholics, in parentheses).

12
How often do you go to church (place of worship)? Never (40.5%), less
than once a month (26.6%), once in a month (14.1%), once in a week
(16.7%), every day (2.2%)
• Items 16 and 16.1 relate to changes in the religious denomination.
Have you ever changed your religious denomination / beliefs? Yes
(16.2%), No (83.8%)
Individuals who changed denomination were then asked: Before
changing your denomination/beliefs, you identified your denomination /
beliefs as: No religion (0%), Catholic (98.3%), Muslim (0%),
Evangelical (0%), other religion (1.7%)
The combination of information derived from questions 15 and 16 enables the
calculation of the share of subjects who were (raised as) Catholics and currently
claim to have “no religion” (NR). Indeed, this group comprises 12.3% of the sample,
which also means that the vast majority (75.8%) of those who switched to another
denomination were raised as Catholics and are now affiliated with “no religion”. This
is another indication of secularization in Spain (see also Brañas-Garza et al., 2013).
Definition of socio-economic control variables and descriptive statistics
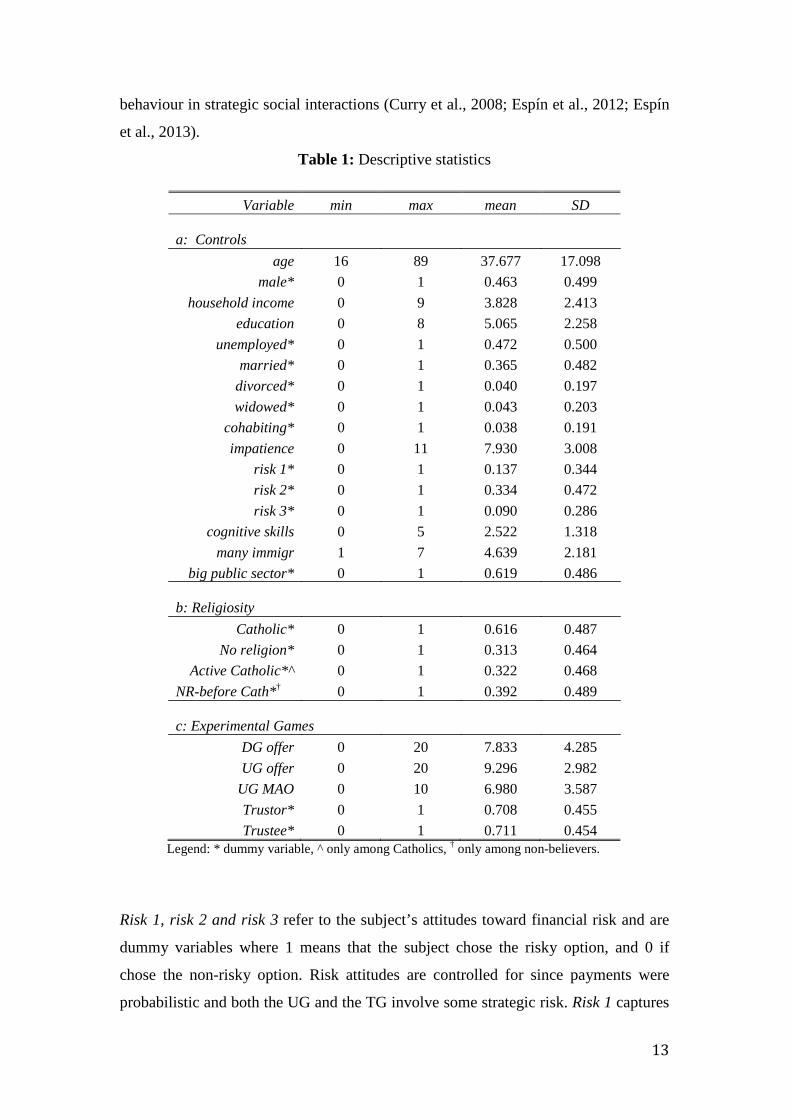
Table 1 presents descriptive statistics (min, max, mean and SD) of the main variables
of interest of this study. Block “a” relates to controls, block “b” to religious
dimensions, and block “c” to experimental variables.
The definitions of control variables that are not self-explanatory are the following:
Household income refers to self-reported household monthly income and consists of
10 categories corresponding to €0-€4,500 (in €500 increments); Education refers to
the subject’s educational level and has 9 categories from “did not study at all” to “a
graduate university degree”. Cohabiting takes on the value of one if the subject
declares living with a partner not within wedlock, and zero otherwise.
Impatience corresponds to the number of impatient choices the subject made in an
inter-temporal choice task and captures preference for sooner-smaller rewards over
larger but more delayed rewards. The measure of impatience is included as a control
because the payments of the experiment were delayed, and it has been found to affect
13
behaviour in strategic social interactions (Curry et al., 2008; Espín et al., 2012; Espín
et al., 2013).
Table 1: Descriptive statistics
Variable min max mean SD a: Controls
age 16 89 37.677 17.098 male* 0 1 0.463 0.499
household income 0 9 3.828 2.413 education 0 8 5.065 2.258
unemployed* 0 1 0.472 0.500 married* 0 1 0.365 0.482
divorced* 0 1 0.040 0.197 widowed* 0 1 0.043 0.203
cohabiting* 0 1 0.038 0.191 impatience 0 11 7.930 3.008
risk 1* 0 1 0.137 0.344 risk 2* 0 1 0.334 0.472 risk 3* 0 1 0.090 0.286
cognitive skills 0 5 2.522 1.318 many immigr 1 7 4.639 2.181
big public sector* 0 1 0.619 0.486 b: Religiosity
Catholic* 0 1 0.616 0.487 No religion* 0 1 0.313 0.464
Active Catholic*^ 0 1 0.322 0.468 NR-before Cath*† 0 1 0.392 0.489 c: Experimental Games
DG offer 0 20 7.833 4.285 UG offer 0 20 9.296 2.982
UG MAO 0 10 6.980 3.587 Trustor* 0 1 0.708 0.455 Trustee* 0 1 0.711 0.454
Legend: * dummy variable, ^ only among Catholics, † only among non-believers.
Risk 1, risk 2 and risk 3 refer to the subject’s attitudes toward financial risk and are
dummy variables where 1 means that the subject chose the risky option, and 0 if
chose the non-risky option. Risk attitudes are controlled for since payments were
probabilistic and both the UG and the TG involve some strategic risk. Risk 1 captures

14
“risk-loving” in the domain of gains when both the risky and the non-risky option
have the same expected value. Risk 2 captures risk-loving in the gains’ domain as
well, but in a question where the risky option yields a higher expected value than the
non-risky one. Finally, Risk 3 captures risk loving when the risky option involves
possible losses.
'Cogn skills' refers to cognitive skills measured by the number of correct answers in a
five-question mathematical test. Two additional controls are included as proxies for
political orientation, as religious adherence has been associated with different
political preferences, such as racism and conservative attitudes (Guiso et al. 2003).
'Many immigr' captures the degree of agreement (on a seven-point Likert scale) with
the statement “there are too many immigrants in Spain”; Big public sector is a
dummy variable that takes on the value of one if the subject answers positively the
question “Do you think that the public sector in Spain is too large?”.
The religiosity-related variables of block b are the following: Active=1 if the
respondent reports that she/he attends church services once a month or more, and =0
if attendance is less frequent than once a month; NR-before Cath=1 if the respondent
changed her/his religious denomination from Catholic to no-religion (= 0 otherwise).
Finally, the experimental variables: trustor=1 if the subject passed the money to the
trustee when in the role of trustor in the TG, and =0 if she/he did not; while trustee=1
if the subject reciprocated the trustor’s trust, and=0 otherwise.
4. Results
Effect of religious denomination
We will first explore if the religion/denomination per se has a significant effect on
social behaviour. Two sub-populations are compared: Catholics with the rest of the
sample (regressions presented in Table 2); and NR with all others (including
Catholics, Table 3). As in many other studies within the field of the Economics of
Religion, “no-religion/not-believing” is also considered a religious denomination (see
for instance, Aleksynska and Chiswick, 2013). We do not relate specifically to social
attributes of other religions (e.g., Evangelical, Muslim), due to their small sample
sizes.

15
Five models are presented in each Table (columns (1) - (5)): DG and UG offers (in €,
from 0 to 20) are the dependent variables in models (1) and (2), using a Tobit
regression; column (3) explores UG MAO in €, from 0 to 10 (using an OLS
regression model). Finally, (4) and (5) are Probit models analysing the behaviour as a
TG trustor and trustee, respectively.
Socio-economic variables are included in order to arrive at net effects of our core
variables, controlling for socio-economic differences between respondents. The same
control variables are used in the two regression sets and their effects are not much
different in Tables 2 and 3: age has an inverse U-shaped parabolic effect on the
individuals’ sense of fairness (UG MAO). Both age and age-squared are significant,
indicating that MAO increases with age, reaches a maximum at about 55 and then
decreases. No any other relevant effect is found to be related to age.
Married people are less likely to ask for equal shares (MAO) in the UG, indicating
that they behave closer to the Nash equilibrium compared to singles. Divorced are
more likely to be generous (DG). Cohabiting individuals offer less in the UG but trust
more (pass the money) in the TG. However, both estimates are only marginally
significant.
Impatient subjects offer less in the UG – they are less strategically generous – but
they ask for a larger share of the pie as responders. Obviously, impatient individuals
are not easy to manage in bargaining and agreement processes. A deeper analysis of
this result is reported in Espín et al. (2013), where it is argued that impatience may be
associated with a preference for spiteful competition in bargaining.
Turning to the effect of risk attitudes: risk-lovers in the gains’ domain (risk 1) ask for
more money in the UG (which is somehow a risky strategy) but they don’t
reciprocate in the TG (indicating that they are not very pro-social). Quite consistently,
those who are ready to lose money (risk 3) risk their own money as trustors in the TG.
Contrary to Risk 1 these subjects seem pro-social: they share more in the DG and UG,
ask less in the UG, and trust and reciprocate more in the TG. In any case, these results
should be treated with caution, given that the three risk variables are correlated
(multicollinearity).

16
Table 2: Catholics versus non-Catholics
DG offer UG offer UG MAO Trustor Trustee
(1) (2) (3) (4) (5)
Catholic 0.625 0.318 0.573** 0.026 -0.158
(0.479) (0.238) (0.271) (0.116) (0.129)
age 0.024 -0.011 0.110** 0.007 -0.000
(0.082) (0.053) (0.043) (0.021) (0.021)
age sq. -0.000 0.000 -0.001** -0.000 0.000
(0.001) (0.001) (0.000) (0.000) (0.000)
male -0.392 -0.055 -0.083 -0.082 0.043
(0.392) (0.214) (0.242) (0.103) (0.111)
house income -0.139 0.008 0.083 -0.002 -0.015
(0.104) (0.058) (0.064) (0.024) (0.026)
education 0.008 0.049 -0.096 -0.015 -0.004
(0.110) (0.073) (0.065) (0.026) (0.026)
unemployed -0.467 -0.030 0.412 0.165 -0.100
(0.417) (0.240) (0.290) (0.103) (0.128)
married 0.697 0.023 -1.239*** 0.238 0.084
(0.701) (0.405) (0.472) (0.172) (0.196)
divorced 2.030** 0.074 -1.043 0.058 0.231
(0.800) (0.699) (0.734) (0.275) (0.294)
widowed -0.398 0.061 -0.146 0.332 0.243
(1.007) (0.580) (0.768) (0.281) (0.386)
cohabiting -0.163 -0.849* -0.308 0.450* -0.301
(1.216) (0.463) (0.721) (0.259) (0.310)
impatience -0.096 -0.084** 0.093** 0.007 0.011
(0.081) (0.040) (0.046) (0.018) (0.021)
risk 1 -0.238 0.011 1.174*** -0.134 -0.414***
(0.562) (0.309) (0.371) (0.133) (0.150)
risk 2 0.653 -0.130 -0.169 0.183* -0.099
(0.403) (0.269) (0.316) (0.104) (0.104)
risk 3 1.695*** 0.816** -1.002* 0.920*** 0.569***
(0.598) (0.371) (0.596) (0.219) (0.185)
cogn skills -0.148 -0.023 0.245** 0.001 0.096**
(0.179) (0.094) (0.106) (0.044) (0.042)
many immigr -0.302*** -0.104 0.027 -0.094*** -0.080***
(0.098) (0.065) (0.060) (0.027) (0.025)
big public sector 0.421 0.027 0.298 -0.017 0.118
(0.389) (0.259) (0.265) (0.114) (0.125)
Constant 9.834*** 10.179*** 3.351*** 0.360 0.569
(2.235) (1.148) (1.102) (0.480) (0.564)
LR 3.171*** 1.520** 2.829*** 95.259*** 131.556*** ll -2047.19 -1907.167 -2030.929 -436.102 -414.165 N 766 766 766 766 766
Notes: Dependent variables are displayed on top of the columns. Tobit estimates for models (1) and (2), OLS for model (3) and Probit for models (4) and (5). Robust SEs clustered by interviewer are presented (in parentheses). All regressions control for order effects. * p<0.1, ** p<0.05, *** p<0.01.

17
Individuals with better cognitive skills demand more money as responders in the UG,
but they are also more prone to return (to reciprocate) in the TG, indicating that they
may have a larger sense of social responsibility.
Finally, those who claim that there are too many immigrants share less in the DG,
indicating that people who have little empathy for foreigners are also not so nice with
locals. In addition, they offer less in the UG, they don’t pass money in the TG, and
also don’t give the money back in the TG. Clearly, those who do not like immigrants
are not very pro-social.
No significant effects of education, income or gender are found. We can therefore
conclude that socio-demographics are not very relevant, but some specific personal
characteristics related to preferences (risk attitudes, impatience) or cognitive skills are
affecting decisions in several games.
Turning now to our core variable of Religious denomination, Table 2 focuses on
Catholics versus the rest of the sample, including NRs. We do not find any sound
effect rather than the positive relationship with UG MAO. That is, Catholics tend to
ask for more money as responders in the UG. Since we do not find any effect related
to generosity (either pure (DG) or strategic (UG proposer)), trust (TG trustor), or
reciprocation (TG trustee) we may say that there is a positive effect of being Catholic
on the aversion to disadvantageous, but not advantageous, inequality. Interestingly,
when the sample is restricted to "standard" religions only, excluding NRs, the effect
of UG MAO becomes insignificant too (regression results not presented, can be
provided upon request). We can therefore conclude that Catholics do not exhibit a
different pro-social behaviour compared to members of other faiths.
In Table 3 the sub-sample of NRs is contrasted with the rest of participants (i.e.,
individuals who belong to the “standard” religions, including Catholics). Results are
sharper now: those who classify themselves as NRs are less generous in the DG, offer
less as proposers in the UG and claim less money as responders (that might be
indicative of a less strict sense of fairness). Hence we may conclude that NRs are less
generous and not strongly driven by fairness.

18
Table 3: Non-believers/No religion versus believers
DG offer UG offer UG MAO Trustor Trustee
(1) (2) (3) (4) (5)
no-religion -0.939* -0.547** -0.645** 0.039 0.181
(0.506) (0.251) (0.318) (0.126) (0.123)
age 0.024 -0.011 0.109** 0.006 0.000
(0.083) (0.053) (0.043) (0.021) (0.021)
age sq. -0.000 0.000 -0.001** -0.000 0.000
(0.001) (0.001) (0.000) (0.000) (0.000)
male -0.401 -0.055 -0.110 -0.090 0.050
(0.397) (0.218) (0.240) (0.101) (0.112)
house income -0.139 0.007 0.086 -0.001 -0.016
(0.104) (0.058) (0.064) (0.024) (0.026)
education 0.019 0.056 -0.090 -0.016 -0.005
(0.110) (0.073) (0.064) (0.027) (0.026)
unemployed -0.441 -0.015 0.428 0.164 -0.107
(0.412) (0.239) (0.292) (0.103) (0.128)
married 0.638 -0.017 -1.265*** 0.246 0.091
(0.709) (0.415) (0.468) (0.173) (0.196)
divorced 1.974** 0.041 -1.061 0.068 0.241
(0.800) (0.701) (0.739) (0.274) (0.293)
widowed -0.434 0.038 -0.172 0.332 0.249
(1.015) (0.588) (0.761) (0.282) (0.385)
cohabiting -0.076 -0.786* -0.285 0.434* -0.312
(1.210) (0.472) (0.734) (0.261) (0.307)
impatience -0.097 -0.085** 0.094** 0.008 0.010
(0.081) (0.040) (0.046) (0.018) (0.021)
risk 1 -0.200 0.036 1.201*** -0.137 -0.422***
(0.555) (0.304) (0.376) (0.134) (0.150)
risk 2 0.673* -0.120 -0.162 0.181* -0.101
(0.404) (0.268) (0.320) (0.104) (0.104)
risk 3 1.647*** 0.780** -1.008* 0.934*** 0.572***
(0.593) (0.371) (0.604) (0.216) (0.186)
cogn skills -0.145 -0.022 0.249** 0.002 0.095** (0.179) (0.095) (0.106) (0.044) (0.042)
many immigr -0.313*** -0.112* 0.027 -0.091*** -0.079***
(0.098) (0.068) (0.059) (0.027) (0.026)
big public sector 0.415 0.021 0.298 -0.016 0.117
(0.385) (0.257) (0.267) (0.114) (0.125)
Constant 10.481*** 10.611*** 3.847*** 0.346 0.419
(2.282) (1.172) (1.134) (0.478) (0.548)
LR 3.214*** 1.612** 2.879*** 93.804*** 136.593*** ll -2045.933 -1905.847 -2030.549 -436.072 -413.943 N 766 766 766 766 766
Notes: Dependent variables are displayed on top of the columns. Tobit estimates for models (1) and (2), OLS for model (3) and Probit for models (4) and (5). Robust SEs clustered by interviewer are presented (in parentheses). All regressions control for order effects. * p<0.1, ** p<0.05, *** p<0.01.

19
Interestingly, NRs are not different from “believers/individuals with a religion” in
terms of trust: neither in terms of passing the pie to the second mover (trustor) nor in
terms of returning the money (trustee). Given that previous results have been
inconsistent (e.g., Anderson et al., 2010; Benjamin et al., 2010; Migheli 2012), and
based on our carefully-designed large sample, we may conclude that the effects of
believing in a religion on trust and trustworthiness, if any, are not clear and may be
influenced by other factors, such as the country of residence.
Effect of intensity of religiosity (measured by church attendance)
We will now relate to the effect of intensity of religiosity (measured by frequent
attendance of church services) on social behaviour, by distinguishing between active
worshipers who go to church (place of worship) at least once a month and non-active
ones who do not go to church on a regular basis (less than once a month). In order to
hold constant the effect of denomination and focus on intensity of religious
performance, we will relate to the sub-sample of Catholics, who constitute over 60%
of the sample. All other religions have a very low representation that does not allow
for a meaningful distinction between active- and non-active worshipers (Muslims -
2%, Evangelicals - 0.8%, and all other religions combined - 4.3%). NRs compose
more than 30% of the sample, however a distinction between active- and non-active
attenders of church services is obviously meaningless.
Our conjecture is that frequent participation in church services will affect
social/moral behaviour: the frequent attenders are more knowledgeable about
religious texts and doctrines and in closer contact with the priest, inducing them
follow these moral rules and doctrines. On the other hand, those who do not attend
church services on a frequent regular basis, have a more vague knowledge of these
sacred texts without a continuous updating, and probably also prefer a more relaxed
and unrestricted style of life.
The effect of our core variable “being an Active Catholic” is interesting: members of
this sub-sample do give more in the DG, which is reflecting a clearer sense of
altruism and is quite consistent with what we saw in Table 2. In line with Tan’s
(2006) results suggesting a negative relationship between ritual activity and MAO we
find that active Catholics demand less money (than non-active Catholics) as
responders in the UG.

20
Table 4: Active Catholics (attend. ≥ once a month) vs. Non-Active Catholics (< once a month)
DG offer UG offer UG MAO Trustor Trustee
(1) (2) (3) (4) (5)
Active 1.028* 0.163 -0.851** 0.175 -0.103
(0.542) (0.292) (0.387) (0.159) (0.140)
age 0.039 0.045 0.083 0.027 0.021
(0.086) (0.059) (0.057) (0.029) (0.025)
age sq. -0.000 -0.000 -0.001 -0.000 -0.000
(0.001) (0.001) (0.001) (0.000) (0.000)
male -0.341 -0.175 -0.033 -0.009 0.209
(0.477) (0.242) (0.306) (0.138) (0.138)
house income -0.344*** -0.054 0.139* -0.032 -0.024
(0.113) (0.078) (0.080) (0.032) (0.035)
education 0.080 0.120 -0.107 0.018 -0.025
(0.125) (0.085) (0.077) (0.035) (0.036)
unemployed -1.323** -0.082 0.071 0.063 0.012
(0.531) (0.305) (0.361) (0.136) (0.176)
married 0.265 -0.701 -0.857 0.181 0.081
(0.766) (0.493) (0.536) (0.226) (0.250)
divorced 1.396 -0.222 -0.072 -0.019 0.176
(1.037) (0.812) (0.886) (0.362) (0.378)
widowed -0.498 -0.725 -0.008 0.230 0.137
(1.129) (0.711) (0.857) (0.365) (0.468)
cohabiting -2.306 -2.374* -0.018 0.018 -0.636
(2.469) (1.435) (1.359) (0.385) (0.503)
impatience -0.038 -0.058 0.026 0.020 0.023
(0.085) (0.049) (0.053) (0.022) (0.027)
risk 1 -0.237 -0.139 1.023** -0.102 -0.568***
(0.596) (0.413) (0.472) (0.188) (0.219)
risk 2 0.446 -0.281 0.100 0.251* -0.099
(0.490) (0.356) (0.400) (0.141) (0.132)
risk 3 1.945*** 1.105** -0.946 0.901*** 0.453*
(0.622) (0.478) (0.642) (0.263) (0.236)
cogn skills -0.108 -0.069 0.410*** -0.097* 0.027 (0.205) (0.110) (0.143) (0.059) (0.055)
many immigr -0.139 -0.099 0.009 -0.096** -0.082**
(0.129) (0.084) (0.075) (0.040) (0.041)
big public sect. 0.158 -0.230 -0.087 -0.177 0.241
(0.459) (0.344) (0.333) (0.157) (0.160)
Constant 9.780*** 9.861*** 4.422*** 0.994 0.241
(2.842) (1.316) (1.581) (0.898) (0.809)
LR 3.253*** 1.333 3.107*** 69.559*** 110.065*** ll -1223.316 -1145.235 -1199.287 -256.395 -241.397 N 462 462 462 462 462
Notes: Dependent variables are displayed on top of the columns. Tobit estimates for models (1) and (2), OLS for model (3) and Probit for models (4) and (5). Robust SEs clustered by interviewer are presented (in parentheses). All regressions control for order effects. Ten observations had missing values for church attendance and were dropped. * p<0.1, ** p<0.05, *** p<0.01.

21
The difference between those with high- and low attendance levels could reflect the
effect of religious social interaction on social preferences (see Tan, 2006). While non-
active Catholics have a more strict sense of self-centred fairness (i.e., they ask for a
more egalitarian distribution), active Catholics are more likely to play the Nash
equilibrium, accepting lower offers. Remember that the larger group of all Catholics
(Table 2) exhibited a tendency of demanding more money (and a similar amount
compared to members of other “standard” religions, when NRs have been excluded in
an unreported regression, see page 18). Combining the two seemingly contradicting
findings leads to the conclusion that within the group of Catholics, there are major
differences between active- and non-active individuals. The larger sub-group of non-
actives (67.8% of Catholics) dominates and leads to a larger demand of money when
no distinction (related to religious activity) is made. Moreover, our results contribute
to the large pool of already existing evidence showing that intensity of religiosity is a
very relevant predictor of behaviour, beyond and above the effect of religious
denomination.6
It should also be emphasized that behaving as if playing the Nash equilibrium (NE -
in the case of active Catholics) as UG responder, is not necessarily an indication of
selfishness: it is true that pure money-maximizing subjects would accept any positive
offer, setting MAO to its minimum value. However, it is also true that extremely pro-
social subjects - concerned with other players’ payoffs - would accept any offer just
to maximize the counterpart’s profits (and social welfare). Brañas-Garza et al. (2006)
present support for this idea, using information from post-experimental interviews
that shows that a large share of those who played the NE argued that “maybe the
other player needs the money” as the principal reason to accept any offer, even zero.
In the same vein, the results of Staffiero et al. (2013) indicate that setting MAO at the
minimum amount (i.e., zero) may be a symptom of pro-social behaviour.
6 An examination of the effects of the control variables shows some minor differences between the whole sample and the subsample of Catholics. Nor Age, neither the marital-status of married are significant predictors of MAO (UG), and cohabiting is no longer affecting TG behaviour. The effect of impatience disappears for Catholic respondents while the connection between risk attitudes and behaviour along the reported games remains basically unaltered. The effect of Cognitive skills is also similar in the UG but its relationship with TG behaviour now relates to the role of trustor and becomes negative. The negative view about immigrants seems to be less important for the subsample of Catholics, since its negative effect on pro-social behaviour is now restricted to the TG.

22
Another suggestion that playing the NE does not indicate selfish behaviour can be
drawn from column (1) in Table 4, which can be used to disentangle selfishness from
pro-social preferences. The positive coefficient for active Catholics demonstrates that
active Catholics give more money in the DG. This is clearly indicating that this sub-
sample of active Catholics is less selfish. We therefore conclude that active Catholics
ask for less money in the UG (MAO) because they have a higher sense of solidarity.
Effect of conversion from Catholicism into NR: does childhood religious education
matter?
Utilizing the information on the third dimension of religiosity, namely the experience
of conversion into a religion that is different from the one educated/raised in (see
also Brañas-Garza et al. 2013 on converting-out), can shed light on the effects of
childhood experience and cultural transmission from parents to their offspring. An
extensive literature claims that values and norms (including religious norms) are
transmitted across generations (e.g., Bisin and Verdier, 2000, 2001; Bar-El, 2013).
The relatively large sample of NRs who were previously Catholic (94 out of 240 who
are currently NRs were raised as Catholics and at some stage in life converted to NR),
can be used to answer this interesting question.
Table 5 presents the repeated regressions of DG offer, UG offer, UG MAO, trustor
and trustee for the sub-sample of individuals who are currently NRs, including a
dummy variable for the sub-group of subjects who were raised as Catholics before
converting to NR.
The conclusion is quite straightforward. The two sub-groups of NRs are not different
in terms of social preferences (insignificant coefficients in all five models). This
result contrasts the theory that claims that values are transferred from parents to
children. Our data does not lend support to this wide-spread theory. However, we
should keep in mind that we relate to a distinct and very special (although growing)
group that consists of NR individuals.

23
Table 5: NRs who were raised as Catholics versus “all-life” NRs
DG offer UG offer UGMAO Trustor Trustee
(1) (2) (3) (4) (5)
NR-before Cath 0.223 0.037 -0.037 -0.252 0.256
(0.734) (0.393) (0.424) (0.212) (0.237)
age -0.001 -0.004 0.045 0.027 -0.023
(0.177) (0.082) (0.101) (0.038) (0.060)
age sq. 0.001 -0.000 0.000 -0.000 0.000
(0.002) (0.001) (0.001) (0.000) (0.001)
male -0.838 -0.205 -0.564 -0.176 0.054
(0.738) (0.397) (0.547) (0.201) (0.218)
house income -0.008 0.069 0.150 -0.022 -0.037
(0.170) (0.087) (0.116) (0.048) (0.043)
education -0.023 0.087 -0.084 -0.044 0.104**
(0.199) (0.126) (0.136) (0.053) (0.051)
unemployed 0.899 -0.091 0.984 0.314 -0.411**
(0.943) (0.390) (0.609) (0.236) (0.207)
married 0.752 0.706 -2.376** 0.335 -0.022
(1.220) (0.776) (1.176) (0.367) (0.381)
divorced 1.624 -1.126 -3.403** 0.171
(1.466) (1.699) (1.648) (0.883)
widowed -6.162 1.978 0.285 0.338
(4.058) (1.248) (1.878) (0.791)
cohabiting 0.292 -0.319 -0.512 0.840* -0.340
(1.369) (0.439) (0.772) (0.467) (0.424)
impatience -0.219* -0.123** 0.193** -0.005 -0.034
(0.120) (0.057) (0.093) (0.030) (0.036)
risk 1 -0.243 0.141 1.878*** -0.279 -0.394
(1.177) (0.579) (0.589) (0.274) (0.280)
risk 2 0.958 0.067 -0.198 0.230 -0.294
(0.896) (0.420) (0.504) (0.217) (0.231)
risk 3 1.239 0.175 -0.119 1.010* 1.103*
(1.106) (0.477) (0.836) (0.565) (0.564)
cogn skills -0.292 0.000 -0.238 0.353*** 0.251**
(0.394) (0.189) (0.193) (0.090) (0.107)
many immigr -0.436*** -0.066 -0.020 -0.048 0.009
(0.159) (0.104) (0.121) (0.047) (0.047)
big public sec 0.929 0.202 0.801* 0.383** -0.191
(0.710) (0.384) (0.426) (0.188) (0.213)
Constant 9.523** 5.756 6.767*** -2.014** 0.945
(4.481) (3.532) (2.460) (0.849) (1.188)
LR 3.9278*** 2.574*** 5.310*** 93.075*** 71.413*** ll -624.169 -566.919 -623.767 -118.376 -110.599 N 240 240 240 240 229
Notes: Dependent variables are displayed on top of the columns. Tobit estimates for models (1) and (2), OLS for model (3) and Probit for models (4) and (5). Robust SEs clustered by interviewer are presented (in parentheses). widower=1 and divorced=1 predict success perfectly in model (6), thus the two variables are dropped and 11 observations not used All regressions control for order effects. * p<0.1, ** p<0.05, *** p<0.01.

24
5. Concluding remarks
A large well-designed sample of Spanish individuals is used to explore the effects of
(i) religious denomination; (ii) religious intensity; and (iii) religious conversion on
pro-social behaviour, using the Dictator, Ultimatum and Trust Games.
The main results of the paper are the following:
(i) The sub-sample of “no religion” individuals (30% of the sample) is less
generous compared to members of any “standard” religion, indicated by
passing less money in both the Dictator and the Ultimatum games. In
other words, those who classify themselves as NRs are more selfish. In
addition, their MAO is lower, that is, they are more likely to accept unfair
offers in the UG. Behaving as if playing the NE combined with selfishness
in the DG is indicative of a perfect rational self-interested behaviour.
Given the accelerating shares of “no religion” individuals in Europe (and
elsewhere), and assuming that this result can be generalised for other
places as well, we can project that the society could become more self-
interested as a result of the dominant role of non-believers.
(ii) Catholics are willing to reject unfair offers in the UG (higher MAO) more
than the rest of the sample. They are not significantly different in terms of
other pro-social characteristics. In our Spanish sample the shares of “other
religious denominations” is very low. More than 90% of the sample is
composed of Catholics and “no religion” respondents. It follows that little
can be proposed about the pro-sociability of other religions, and as a result
this finding could not be generalized and applied to other (more
religiously diverse) countries.
(iii) Religious intensity (measured by active attendance of church services)
matters above and beyond denomination: comparing religiously-active
Catholics with non-active Catholics, we find that the former are more
generous in the DG (while Catholics as a whole do not exhibit a
differential behaviour in the DG) and claim less in the UG, that is, like in
Tan (2006) MAO decreases with attendance. We can therefore conclude
that there are differences in social behaviour within the group of Catholics,
and active Catholics exhibit a more pro-social behaviour than non-active
25
Catholics (similar results are shown in Eckel and Grossman, 2003, and
Ahmed, 2009). Due to the small shares of other denominations, it was not
possible to distinguish between active- and non-active worshipers of other
religions, other than Catholicism. A generalization of this finding could be
relevant for the growing immigrant populations (in Europe and elsewhere,
see footnote 3): given that immigrants tend to be more religiously-active,
it follows that (at least for Catholic immigrants) the growing shares of
immigrants could lead to more societal generosity; due to the small
percentage of immigrants in our sample (7%) we could not relate to them
in our empirical analysis, but we could still conjecture that they are more
likely to behave pro-socially since they are notably more religious. 7
(iv) The two demographic phenomena described above: increasing numbers of
“no religion” individuals on the one hand, and of actively-religious
immigrants, on the other hand, have opposing effects on society. Given
the much more pronounced growth rates of NRs, we arrive at quite
pessimistic projections of a society that could become less generous and
less pro-social.
(v) It appears that only the current denomination (or “no denomination”)
affects social behaviour. Respondents who were raised as Catholics and
then converted to “no religion” do not exhibit different social preferences
compared to “all life” NRs. This finding is different from what is
proposed in the “cultural transmission” literature (Bisin and Verdier,
2001), where it is claimed that cultural transmission of values/beliefs from
parents to their offspring is affecting behaviour later in life.
(vi) Like Anderson et al. (2010), we fail to find any significant effect of
religious denomination or religious activity on subjects’ behaviour in
either role of the TG. Given the large number of observations we analyse,
such a systematic result is noteworthy and should be further examined. A
potential explanation could be that Trust Games are not the proper “device”
for the measurement of trust. Indeed, recently, researchers refer to this
7 In our sample, 21 (out of 53 immigrants) are European and half of them are NRs (52.38%). Within the rest 32 immigrants, the majority (81.25%) is actively religious. The actively-religious immigrants have the following distribution of religious denominations: 7 are Catholic, 11 - Muslim, 1 - evangelical, and 7 belong 'other religions'.
26
type of problem not as a trust games but as an investment problem (Ashraf
et al., 2006; Ben-Ner and Halldorsson, 2010).
References Ahmed, A.M. (2009). ‘Are Religious People More Prosocial? A Quasi-Experimental Study with Madrasah Pupils in a Rural Community in India’, Journal for the Scientific Study of Religion 48: 368-374.
Aleksynska, M. and Chiswick, B.R. (2013). ‘The Determinants of Religiosity among Immigrants and the Native Born in Europe’, Review of Economics of the Household, forthcoming.
Anderson, L.R. and Mellor J.M. (2009). ‘Religion and Cooperation in a Public Goods Experiment’, Economics Letters 105: 58-60.
Anderson, L.R., Mellor, J.M. and Milyo J. (2010). ‘Did the Devil Make Them Do It? The Effects of Religion in Public Goods and Trust Games’, Kyklos 63: 163-175.
Ashraf, N., Bohnet, I. and Piankov, N. (2006). ‘Decomposing Trust and Trustworthiness’, Experimental Economics 9: 193-208.
Bar-El, R., Garcia-Muñoz, T., Neuman, S. and Tobol, Y. (2012). ‘The Evolution of Secularization: Cultural Transmission, Religion and Fertility - Theory, Simulations and Evidence’, Journal of Population Economics 26(3): 1129-1174.
Barro, R. and McCleary, R. (2003). 'Religion and Economic Growth across Countries', American Sociological Review 68: 760-81.
Barry, J.S. (1996). ‘How a Flat Tax Would Affect Charitable Contributions’, Backgrounder No. 1093. Heritage Foundation.
Becker, G.S. (1993). ‘A Treatise on the Family’, Cambridge, Massachusetts: Harvard University Press, first paperback edition.
Ben-Ner, A. and Halldorsson, F. (2010). ‘Trusting and Trustworthiness: What are they, how to Measure them, and what Affects them’, Journal of Economic Psychology 31(1): 64-79.
Benjamin, D.J., Choi, J.J. and Fisher, G.W. (2010). ‘Religious Identity and Economic Behavior’, National Bureau of Economic Research: No. w15925.
Bisin, A. and Verdier, T. (2000). ‘Beyond the Melting Pot: Cultural Transmission, Marriage, and the Evolution Of Ethnic and Religious Traits’, The Quarterly Journal of Economics 115(3): 955-988.
Bisin, A. and Verdier, T. (2001). ‘The Economics of Cultural Transmission and the Dynamics of Preferences ‘, Journal of Economic Theory 97: 298-319.
Bisin, A., Topa, G. and Verdier, T. (2004). ‘Religious Intermarriage and Socialization in the United States’, Journal of Political Economy 11(3): 615-664.
Brañas-Garza, P. and Neuman, S. (2004), ‘Analyzing Religiosity within an Economic Framework: The Case of Spanish Catholics’, Review of Economics of the Household 2 (1): 5-22
27
Brañas-Garza, P. and Neuman, S. (2007). ‘Parental Religiosity and Daughters’ Fertility: The Case of Catholics in Southern Europe’, Review of Economics of the Household 5(3): 305-327.
Brañas-Garza, P., Cobo-Reyes, R. and Dominguez, A. (2006). ‘Si él lo necesita: Gypsy Fairness in Vallecas’, Experimental Economics 9(3): 253-264.
Brañas-Garza, P., García-Munoz T. and Neuman S. (2010). ‘The Big Carrot: High-Stakes Incentives Revisited’, Journal of Behavioral Decision Making 23(3): 208-313.
Brañas-Garza, P., Rossi, M. and Zaclicever, D. (2009). ‘Individual’s Religiosity Enhances Trust: Latin American Evidence for the Puzzle’, Journal of Money, Credit & Banking 41: 555-566.
Brañas-Garza, P., García-Munoz T. and Neuman S. (2013). ‘Determinants of Disaffiliation: An International Study’, Religions 4(1): 166-185.
Brooks, A.C. (2003). ‘Religious Faith and Charitable Giving’, Policy Review 121.
Cohen-Zada, D. (2005). ‘Preserving Religious Identity Through Education: Economic Analysis and Evidence From the US’, Journal of Urban Economics 60(3): 372-398.
Curry, O.S., Price, M.E. and Price, J.G. (2008). ‘Patience is a Virtue: Cooperative People have Lower Discount Rates’, Personality and Individual Differences 44: 778-783.
Eckel, C.C. and Grossman, P.J (2003). ‘V Rebate versus Matching: Does How We Subsidize Charitable Contributions Matter?’, Journal of Public Economics 87: 681-701.
Ermisch, J., Gambetta, D., Laurie, H., Siedler, T. and Noah Uhrig, S.C. (2009). ‘Measuring People’s Trust’, Journal of the Royal Statistical Society A, 172, 749-769
Espín, A.M., Brañas-Garza, P., Herrmann, B. and Gamella, J.F. (2012). ‘Patient and Impatient Punishers of Free-Riders”, Proceedings of the Royal Society of London B, 279 (1749): 4923-4928.
Espín, A.M., Exadaktylos, F., Herrmann, B., and Brañas-Garza, P. (2013). ‘Short- and Long-run Goals in Ultimatum Bargaining”, ESI Chapman Working Papers: 13-17.
Exadaktylos, F., Espín, A.M. and Brañas-Garza P. (2013). ‘Experimental Subjects are not Different’, Scientific Reports 3: Article Number 1213.
Fan, C.S. (2008). ‘Religious Participation and Children’s Education: A Social Capital Approach’, Journal of Economic Behavior and Organization 65: 303-317.
Flanagan, J. (1991). Successful Fundraising: A Complete Handbook for Volunteers and Professionals. Chicago: Contemporary Books.
Fernandez, R. and Fogli, A. (2006). ‘Fertility: The Role of Culture and Family Experience’, Journal of the European Economic Association 4(2-3): 552-561.
Fernandez, R. and Fogli, A. (2009). ‘Culture: An Empirical Investigation of Beliefs, Work and Fertility’, American Economic Journal 1(1): 146-177.
Fleischmann, F. and Phalet, K. (2012). ‘Integration and Religiosity among the Turkish Second Generation in Europe: A Comparative Analysis across Four Capital Cities’, Ethnic and Racial Studies 35(2): 320-341.

28
García-Muñoz, T. and Neuman, S. (2012). ‘Is Religiosity of Immigrants a Bridge or a Buffer in the Process of Integration?: A Comparative Study of Europe and the United States’, IZA Discussion Paper No. 6384. Bonn
García-Muñoz, T. and Neuman, S. (2013a). ‘Immigration-Religiosity Intersections across the Atlantic: Europe and the United States’, In: Constant A. and Zimmermann K.F. (eds.). The International Handbook on the Economics of Migration. Edward Elgar Publishing Limited.
García-Muñoz, T. and Neuman, S. (2013b). ‘Bridges or Buffers? Motives behind Immigrants' Religiosity - A Comparative Study of Europe and the US’, mimeo. Guiso, L., Sapienza, P. and Zingales, L. (2003). ‘People’s Opium? Religion and Economic Attitudes’, Journal of Monetary Economics 50(1): 225-282
Harrington, D. (S.J.) and Keenan J. (S.J.) (2005). Jesus and Virtues Ethics: Building Bridges between New Testament Studies and Moral Theology. Maryland: Rowman and Litterfield.
Hoffman, R. (2013). ‘The Experimental Economics of Religion’, Journal of Economic Surveys 27(5): 813-845.
Johnson, D.P. and Kruger, O. (2004). ‘The Good of Wrath: Supernatural Punishment and the Evolution of Cooperation’, Political Theology 5(2): 159-176.
Keister, L.A. (2003). ‘Religion and Wealth: The Role of Religious Affiliation and Participation in Early Adult Asset Accumulation’, Social Forces 82: 175-207.
Maliepaard, M., Lubbers, M. and Gijsberts, M. (2010). ‘Generational Differences in Ethnic and Religious Attachment and their Interrelation: A Study among Moslem Minorities in the Netherlands’, Ethnic and Racial Studies 33(3): 451-472
McKay, R., Efferson, C., Whitehouse, H. and Fehr, E. (2011). ‘Wrath of God: Religious Primes and Punishment’, Proceedings of the Royal Society B: Biological Sciences, 278(1713), 1858-1863.
Migheli, M. (2012). ‘Assessing Trust through Social Capital? A possible Experimental Answer’, The American Journal of Economics & Sociology 71: 291-327.
Neuman. S. (1986). ‘Religious Observance within a Human Capital Framework: Theory and Applications’, Applied Economics: 1193-1203.
Neuman, S. (2007). ‘Is Fertility Indeed Related to Religiosity’, Population Studies 61(2): 219-224.
Neuman, S. and Ziderman, A. (1986). ‘How Does Fertility Relate to Religiosity: Survey Evidence from Israel’, Sociology and Social Research 70(2): 178-180.
Norenzayan, A. and Shariff, A.F. (2008). ‘The Origin and Evolution of Religious Pro-sociality’, Science 322: 58-62.
Pew Research Center’s Forum on Religion & Public Life. (2012). ‘Global Religious Landscape’, http://www.pewforum.org/2012/12/18/global-religious-landscape-exec/.
Schwadel, P. (2005). ‘Individual, Congregational and Denomination Effects on Church Members’ Civic Participation’, Journal for the Scientific Study of Religion, 44: 159-171.

29
Shariff, A.F. and Norenzayan, A. (2007). ‘God is Watching You: Priming God Concepts Increases Pro-social Behavior in an Anonymous Economic Game’, Psychological Science 18: 803-809.
Staffiero, G., Exadaktylos, F. and Espín, A.M. (2013). ‘Accepting Zero in the Ultimatum Game does not Reflect Selfish Preferences’, Economics Letters 121: 236-238.
Tan, J.H.W. (2006). ‘Religion and Social Preferences: An Experimental Study’, Economics Letters 90(1): 60-67.
United Nations Population Division (2009). ‘International Migrant Stock: The 2008 Revision Population Database’. Wallis, J. (2005). God’s Politics. San Francisco, CA: Harper Collins Publishers.
Williams R.B. (1988). Religions of Immigrants from India and Pakistan: New Threads in American Tapestry. New York: Cambridge University Press.
Related Documents


