EFFECTS OF PUBLIC PROCUREMENT PROCEDURES ON FINANCIAL PERFORMANCE OF FARMERS’ COOPERATIVE SOCIETIES IN KIAMBU COUNTY PETER KIMANI NJOROGE D61/P/7064/2005 A RESEARCH PROJECT SUBMITTED IN PARTIAL FULFILLMENT OF THE REQUIREMENTS OF MASTERS OF BUSINESS ADMINISTRATION OF UNIVERSITY OF NAIROBI OCTOBER 2012

Welcome message from author
This document is posted to help you gain knowledge. Please leave a comment to let me know what you think about it! Share it to your friends and learn new things together.
Transcript

EFFECTS OF PUBLIC PROCUREMENT PROCEDURES ON FINANCIAL
PERFORMANCE OF FARMERS’ COOPERATIVE SOCIETIES IN KIAMBU
COUNTY
PETER KIMANI NJOROGE
D61/P/7064/2005
A RESEARCH PROJECT SUBMITTED IN PARTIAL FULFILLMENT OF THE
REQUIREMENTS OF MASTERS OF BUSINESS ADMINISTRATION OF
UNIVERSITY OF NAIROBI
OCTOBER 2012

ii
DECLARATION
This research project is my original work and has not been presented to any other
examination body or any research institution or University.
Signature……………………Date………...................................
Peter Kimani Njoroge
D61/P/7064/2005
This research project has been submitted for examination with our approvals as
University supervisor
Signature………………Date…………………………
Joseph Barasa

iii
DEDICATION
This study is dedicated to my beloved wife
Jennifer Wanjiku
and my dear son
Paul Njoroge.
That you may excel beyond this!

iv
ACKNOWLEDGEMENT
I acknowledge the power of God, the maker, and the provider of knowledge for enabling
me to complete my two years in the right spirit.
Most important, I sincerely wish to acknowledge the support from my supervisor Mr.
Joseph Barasa and moderator Mr. Mwangi Mirie without whom I could not have gone
this far with my project work.
I owe a great deal of gratitude to my parents Paul Wamaitho Njoroge and Lucy Wambui
Njoroge for their unfailing moral support through prayers throughout my period of study
and for understanding and appreciating the demand of the course in terms of time and
resources.

v
ABSTRACT
Procurement is the acquisition of goods and/or services at the best possible total cost of
ownership, in the right quality and quantity, at the right time, in the right place and from
the right source for the direct benefit or use of corporations, individuals, or even
governments. Simple procurement may involve nothing more than repeat purchasing. The
study sought to establish the effects of public procurement procedures on the financial
performance of farmers’ cooperative societies in Kiambu County. In specific, it sought to
determine the effect of professionalism, financial management, records management and
response time in the implementation of public procurement procedures on financial
performance of profit making farmers’ cooperative societies in Kiambu County. The
target population was stratified into farmers’ Cooperative Societies, which formed 10
strata. In each stratum, the study used simple random sampling technique in coming up
with a sample of 3 employees from procurement department from each firm. This study
utilized a questionnaire to collect primary data and analyzed through descriptive
statistics.
From the findings, professionalism in implementation of public procurement procedures
ensures assessment of the procurement procedures in profit making farmers’ cooperative
societies in Kiambu County. On financial management, majority of the profit making
farmers’ cooperative societies faces difficulties in decision-making process leading to lost
opportunities for financial growth. From the findings most of the cooperative societies
experiences challenges in securing record and data. The study recommends that profit
making farmers’ cooperative societies in Kiambu County should ensure proper
competitive recruitment of the procurement personnel. This will enhance professionalism
in public procurement procedures. The study recommends proper adoption of response
rate strategies, which incorporates technology. Response time in procurement in
consideration to competitive environment includes lower procurement costs, faster cycle
times, reduced maverick or unauthorized buying, more highly organized information, and
tighter integration of the procurement function with key back-office systems.

vi
Table of Contents
DECLARATION............................................................................................................... ii
DEDICATION.................................................................................................................. iii
ACKNOWLEDGEMENT ............................................................................................... iv
ABSTRACT ........................................................................................................................v
LIST OF TABLES .............................................................................................................x
LIST OF FIGURES ......................................................................................................... xi
CHAPTER ONE ................................................................................................................1
INTRODUCTION..............................................................................................................1
1.1 Background of the Study ...........................................................................................1
1.1.1 Procurement Systems in Kenya ..........................................................................3
1.1.2 Public Procurement Oversight Authority (PPOA) ..............................................5
1.1.3 Public entity ........................................................................................................6
1.1.4 Procurement Planning and Financial Performance .............................................6
1.1.5 Government and the development of cooperatives .............................................8
1.2 Statement of the Problem ...........................................................................................9
1.3 Research Objectives .................................................................................................12
1.3.1 General Objective .............................................................................................12
1.3.2 Specific Objectives ...........................................................................................12
vii
CHAPTER TWO .............................................................................................................13
LITERATURE REVIEW ...............................................................................................13
2.1 Introduction ..............................................................................................................13
2.2 Theoretical Review ..................................................................................................13
2.2. 1 Procurement .....................................................................................................13
2.2.2 Procurement within the Public Sector...............................................................15
2.2.3 Advantages of Public Procurement and Disposal Act 2005 .............................17
2.3 Conceptual Framework ............................................................................................19
2.3.1 Professionalism .................................................................................................20
2.3.2 Financial Management ......................................................................................22
2.3.3 Records Management........................................................................................23
2.3.4 Response Time ..................................................................................................26
2.4 Empirical Review.....................................................................................................29
CHAPTER THREE .........................................................................................................31
RESEARCH METHODOLOGY ...................................................................................31
3.1 Introduction ..............................................................................................................31
3.2 Research Design.......................................................................................................31
3.3 Target Population .....................................................................................................32
3.4 Sample Design and Procedure .................................................................................32

viii
3.5 Data Collection ........................................................................................................33
3.5.1 Type of Data .....................................................................................................33
3.5.2 Research Instrument..........................................................................................33
3.5.3 Data Collection Method ....................................................................................34
3.6 Pilot Study ................................................................................................................35
3.7 Data Analysis ...........................................................................................................35
3.8 Data Presentation .....................................................................................................36
CHAPTER FOUR ............................................................................................................37
DATA ANALYSIS AND INTERPRETATION ............................................................37
4.1 Introduction ..............................................................................................................37
4.2 General Information .................................................................................................37
4.3 Professionalism ........................................................................................................40
4.4 Financial management .............................................................................................43
4.5 Records management ...............................................................................................45
4.6 Response Rate ..........................................................................................................46
4.7 Inferential statistics ..................................................................................................48
CHAPTER FIVE .............................................................................................................52
SUMMARY OF FINDINGS, CONCLUSIONS AND RECOMMENDATIONS ......52
5.1 Introduction ..............................................................................................................52

ix
5.2 Summary of findings................................................................................................52
5.3 Conclusions ..............................................................................................................54
5.4 Recommendations ....................................................................................................55
REFERENCES .................................................................................................................57
Appendix I: Questionnaire ..............................................................................................64

x
LIST OF TABLES
Table 4.1Implementation of the public procurement Act of 2005.................................... 38
Table 4.2: Influence of Professionalism ........................................................................... 40
Table 4.3: Effect of Professionalism on financial performance ....................................... 41
Table 4.4: Professionalism challenges in implementation of public procurement
procedures ......................................................................................................................... 42
Table 4.5: Financial management challenges in implementation of public procurement
procedures ......................................................................................................................... 44
Table 4.6: Influence of records management .................................................................... 45
Table 4.7: Records management challenges in implementation of public procurement
procedures ......................................................................................................................... 45
Table 4.8: Influence of Response Rate ............................................................................. 47
Table 4.9: Challenges in implementation of public procurement procedures .................. 47
Table 4.10: Model Summary ............................................................................................ 49
Table 4.11: ANOVA (Analysis of Variance) ..................................................................... 50
Table 4.12: Multiple Regression Analysis ........................................................................ 51
xi
LIST OF FIGURES
Figure2.1: Conceptual framework .................................................................................... 19
Figure 4.2: Respondents committee .................................................................................. 37
Figure 4.3: Rating the organization in terms of the Public Procurement and Disposal Act
implementation ................................................................................................................. 39
Figure 4.4: Effect of implementation of the procurement Act of 2005 ............................ 39
Figure 4.5: Influence of Financial management ............................................................... 43

xii
LIST OF ABBREVIATION
MTEF Medium Term Expenditure Framework
ORM Operating Resource Management
PPDA Public Procurement and Disposal Act
PPOA Public Procurement Oversight Authority
POEA Public Officer Ethics Act
PPAB Public Procurement Advisory Board
PPARB Public Procurement Administrative Review Board
PE Private Enterprise
SRM Supplies Resource Management
RM Records management
VFM Value for money

1
CHAPTER ONE
INTRODUCTION
1.1 Background of the Study
Procurement is the acquisition of goods and/or services at the best possible total cost of
ownership, in the right quality and quantity, at the right time, in the right place and from
the right source for the direct benefit or use of corporations, individuals, or even
governments. Simple procurement may involve nothing more than repeat purchasing.
Complex procurement could involve finding long term partners – or even 'co-destiny'
suppliers that might fundamentally commit one organization to another. Lengthy
procedures have sometimes undermined efficiency in the public procurement system
(Arminas, 2002).
According to public procurement and disposal Act 2005, procurement means the
acquisition by purchase, lease, rental, hire purchase, tenancy, franchise, or by any other
contractual means of any type of works assets services, goods including livestock or
combination. Public procurement is traditionally one of the government sectors most
vulnerable to corruption, due to its size, complexity and the sums of money at stake that
provide both incentives and opportunities for corrupt behaviors (Tandoor and Koehn,
2004). Within this context, procurement reform is essentially about addressing corruption
risks, with view to reducing opportunities for public officials to solicit or accept bribes at
the various stages of procurement processes as well as strengthening internal and external
controls to ensure enforcement.

2
Public procurement regulation and processes constantly change, not only to adapt to
economic and social circumstances but ultimately to increase transparency, fairness and
interoperability and modernize the award of contract process (Nwabuzor, 2005). Yet, as
procurement reform usually affect the interests of well connected and organized groups in
society, reform processes are likely to meet major challenges such as opposition and
resistance to change among the ruling elites. Against this background, emerging efforts to
look at the political economy aspects of procurement constitute a promising trend to help
understand the politics of change and address challenges and political barriers as they
come up along the reform process (Rothery, 2003).
Public procurement reform in Uganda was perceived as part of a policy package focusing
on strategies to eradicate poverty in the country, through creating an appropriate policy
framework and the re-orientating of government spending in crucial sectors. The reforms
were based in part on the findings of a study carried out to assess public procurement and
to develop an action plan to improve the country’s system for procuring goods, works
and services. The main finding of this study suggests that the legal framework for public
procurement in Uganda is not supportive, as the existing laws are inadequate and
fragmented. It also reveals that public procurement in the country is characterized by
malpractices, such as under-invoicing and inadequate official documentation. The study,
in addition, identifies the lack of a procurement professional body to regulate the actions
of procurement officers.
In Tanzania, the Public Procurement Act 2001 was enacted by parliament and
subsequently assented by the president on 6 April 2001 (GoT 2001). It is the reference for
3
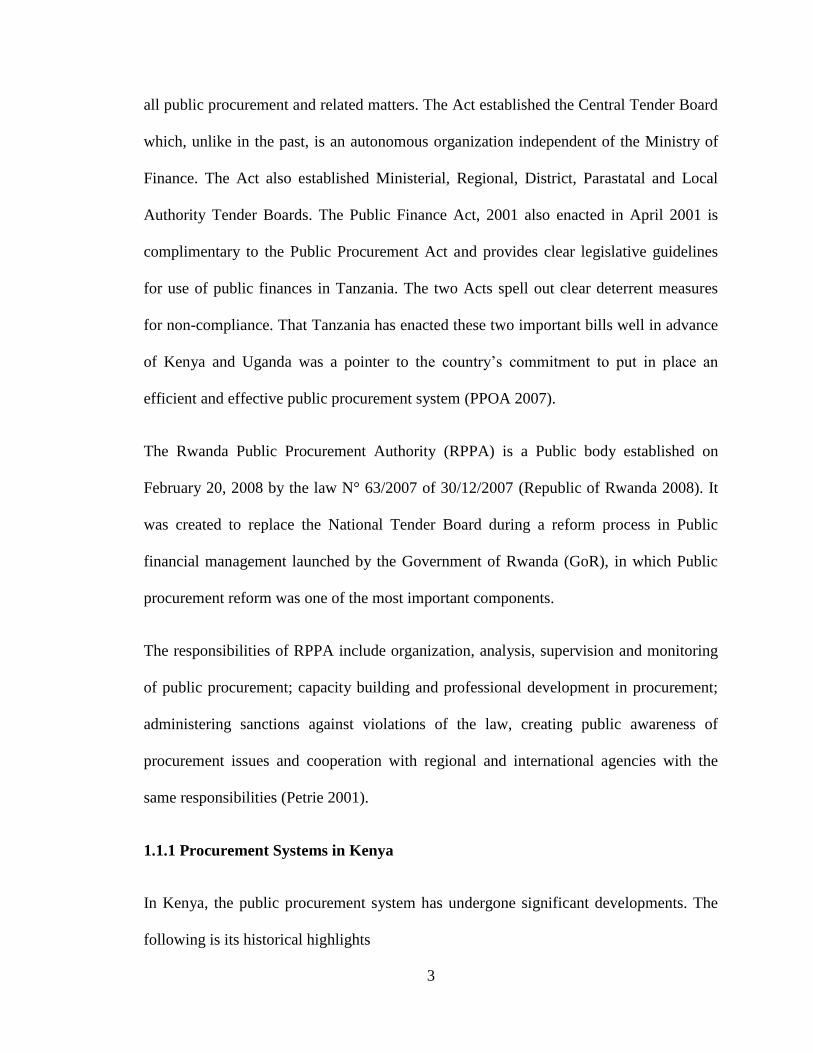
all public procurement and related matters. The Act established the Central Tender Board
which, unlike in the past, is an autonomous organization independent of the Ministry of
Finance. The Act also established Ministerial, Regional, District, Parastatal and Local
Authority Tender Boards. The Public Finance Act, 2001 also enacted in April 2001 is
complimentary to the Public Procurement Act and provides clear legislative guidelines
for use of public finances in Tanzania. The two Acts spell out clear deterrent measures
for non-compliance. That Tanzania has enacted these two important bills well in advance
of Kenya and Uganda was a pointer to the country’s commitment to put in place an
efficient and effective public procurement system (PPOA 2007).
The Rwanda Public Procurement Authority (RPPA) is a Public body established on
February 20, 2008 by the law N° 63/2007 of 30/12/2007 (Republic of Rwanda 2008). It
was created to replace the National Tender Board during a reform process in Public
financial management launched by the Government of Rwanda (GoR), in which Public
procurement reform was one of the most important components.
The responsibilities of RPPA include organization, analysis, supervision and monitoring
of public procurement; capacity building and professional development in procurement;
administering sanctions against violations of the law, creating public awareness of
procurement issues and cooperation with regional and international agencies with the
same responsibilities (Petrie 2001).
1.1.1 Procurement Systems in Kenya
In Kenya, the public procurement system has undergone significant developments. The
following is its historical highlights

4
1963-1969: local purchases were determined by individual entities, while international
procurement were done by crown agents.
1969-1978: Procurement was conducted by treasury circulars.
1978-2001: Procurement was determined through supplies, manual and treasury circulars.
2001-2006: Introduction of exchequer and audit (Public procurement Regulations).
2007 to 2012: the introduction of the Public Procurement and Disposal Act (PPDA).
In 2003, the Government of Kenya (GoK) began to implement reforms to address
inefficiency in the use of public resources and weak institutions of governance. Reforms
included the development of anti-corruption strategies to facilitate the fight against
corruption and the enactment of the Public Officer Ethics Act 2003, the Anti-Corruption
and Economic Crimes Act 2003, the Financial Management Act 2004 and the PPDA
2005. The latter was meant to make public procurement process more transparent, ensure
accountability and reduce wastage of public resources. In addition the reforms were
aimed at promoting fairness, increase public confidence, and promote local industry and
economies development.
A 2005 Independent Procurement Review, conducted jointly by the GoK and the
European Union, identified several critical problems with Kenya’s procurement system.
The review found weak oversight institutions, a lack of transparency, poor linkages
between procurements and expenditures, delays and inefficiencies, and poor records
management. The GoK sought to improve its public procurement systems by enacting the

5
PPDA and creating the Public Procurement Oversight Authority (PPOA) and regulations
implementing the Act gazetted by the GoK on January 1, 2007.
1.1.2 Public Procurement Oversight Authority (PPOA)
The PPOA mandate was to ensure that procurement procedures are complied with and to
generally monitor and assist with the implementation and operation of the public
procurement system. The organization also provides advice and assistance to procuring
entities. The overall procurement procedure depends on circumstances and the nature of
procurement being made. The Public Procurement and Disposal Act, 2005 created the
Public Procurement Oversight Authority (PPOA), the Public Procurement Advisory
Board (PPAB) and the continuance of the Public Procurement Complaints, Review and
Appeals Board as the Public Procurement Administrative Review Board (PPARB). The
PPAB and PPARB are autonomous bodies.
The PPOA is mandated with the responsibility of: ensuring that procurement procedures
established under the Act are complied with; monitoring the procurement system and
reporting on its overall functioning; initiating public procurement policy; assisting in the
implementation and operation of the public procurement system( by preparing and
distributing manuals and standard tender documents, providing advice and assistance to
procuring entities, and develop, promote and support training and professional
development of staff involved in procurement).
Procurement should be done through open tendering or through other alternatives
including; restricted tendering, direct procurement, request for proposals, request for
quotations, low value procurement or specifically permitted procurement procedures.

6
According to the PPDA, invitation to tender must be advertised at least twice in a
newspaper of nationwide circulation. For international tendering, all tender documents
must be in English. Advertising must include one or more English language newspaper or
other publications that together, have sufficient circulation outside Kenya to allow
effective competition.
1.1.3 Public entity
It refers to a political subdivision of the state, including a municipality and its
subdivisions, a school district, a regional educational attendance area, or an organization
composed of political subdivisions of the state. The PPDA has given the guidelines of
which organization falls within the meaning of public entity. According to central bank of
Kenya’s Act 1996, “public entity” means the Government, a local authority, or any public
body specified by the Minister, on the recommendation of the Bank, as a public entity for
the purposes of the Act. Farmer’s cooperative societies operate in a rapid changing and
competitive environment and since they are public entities they are required to follow the
PPDA.
1.1.4 Procurement Planning and Financial Performance
Any procurement begins with the planning decision to make the purchase. This will
involve deciding whether there is a need for the particular goods or services and will
equally involve ensuring that the purchaser has the legal powers to undertake the
transaction, obtaining any relevant approvals within the government hierarchy and
arranging the necessary funding (Arrowsmith, Linarelli & Wallace, 2000). Procurement
is one of the primary functions of procurement with a potential to contribute to the

7
success of local government operations and improved service delivery. A function sets in
motion the entire acquisition/procurement. Despite this importance, very limited
scientific research has been done to examine the extent to which efforts in procurement
planning can contribute to effective local governance (Benon Basheka 2008) He also
noted that, Procurement planning is the primary function that sets the stage for
subsequent procurement activities. It ‘fuels and then ignites’ the engine of the
procurement process. A mistake in procurement planning therefore has wide implications
for local governance, measured from the two indicators of accountability and
participation. A mistake in procurement planning will not only have a direct impact on
operating costs but also, its profitability, return on investment, balance sheet size, and
capital adequacy, among others.
Mullins (2003) argued that procurement planning is a process of determining the
procurement needs of an entity and the timing of their acquisition and their funding such
that the entities operations are met as required in an efficient way. Byokusheka (2008)
noted that, the procurement objective is to provide quality goods and services through
open and fair competition in the exact quantity and proper quality as specified; and has to
be delivered at the time and place where needed. Therefore, to secure such goods and
services at competitive prices requires accurate planning and involvement of a number of
stakeholders. It has been argued that planning is not concerned with future decisions but
rather with the future impact of decisions made today and thorough planning is critical as
agencies are always facing budget constraints that cannot satisfy all capital acquisition
needs (Drabkin & Thai, 2003).

8
Procurement Planning is a process of determining the procurement needs of an entity and
the timing of their acquisition and their funding such that the entities operations are met
as required in an efficient way. The answers to the above questions touch three major
areas. First is the entity involved in procurement. Second are the providers of the various
goods, services and works needed by an entity and third are the legal provisions on the
conduct of procurement. Cooperative societies may not necessarily have legal provisions
but have policies and procedures that govern the conduct of procurement for the
institution.
Procurement must take a thoroughly professional view of its role in business as a whole
and that must include planning (Bailey, Farmer, Jessop & Jones,1998). Any such
procurement begins with the planning decision to make the purchase and this will involve
in the first place, deciding whether there is a need for the particular goods or services,
ensuring that the purchaser has the legal powers to undertake the transaction, obtaining
any relevant approvals within the government hierarchy and arranging the necessary
funding (Arrowsmith, Linarelli& Wallace, 2000). This process is identical to the private
sector and additionally, checking for whether such requirements are provided for in the
budget is key in the private sector. Where the required goods and services are not in the
approved budget, then special approval ought to be sought before going through the
ordinary procurement process.
1.1.5 Government and the development of cooperatives
A fundamental characteristic of the Kenyan cooperative movement is its close association
with the state to the point of developing a dependent relationship. It will be recalled that

9
the first cooperatives in the country founded in the colonial era were moulded by the
colonial government to suit the interests of the white settlers through strict legislation that
restricted the participation of Africans in these enterprises (Cooperative Bank of Kenya,
1993). At independence, the government sought to use cooperatives as instruments for
promoting economic development especially in the rural areas. It had, therefore, to ensure
the emergence of strong, viable and efficient cooperatives by directing the formation and
management of these institutions from major institutions. This state-controlled promotion
of cooperative development was formalized by the introduction of a single legal
framework for all types of cooperatives in 1966 via The Cooperative Societies Act, Cap.
490.
Agricultural cooperatives are engaged in food production, storage, marketing and
processing. A core function of cooperatives in food production is the purchasing/supply
of input services to members of primary societies. On average, agricultural cooperatives
perform no fewer than two of the three functions. Some of the service activities they
undertake include land preparation; seed procurement and distribution; harvesting of
crops; processing and marketing of produce; sourcing of funds and agricultural
machinery; and training of farmers.
1.2 Statement of the Problem
It is known that despite government concentrated efforts in reforming procurement
systems, there is still a problem attributable to huge losses in improper procurement to
the tune of 30 billion shillings (Central Bank of Kenya). Public procurement requires a
tight/waterproof system to be followed and adopted. This however is not true in most

10
instances e.g. the Goldenberg and Anglo leasing. Since public resources are scarce, the
efficiency of the procurement process is a primary consideration of every procurement
regime. Therefore, open, transparent and non-discriminatory procurement is the best tool
to achieve value for money as it optimizes competition among suppliers (Petrie, 2001).
In Kenya, transparency in public procurement has faced many hurdles necessitating the
enactment of PPDA of 2005. A 2005 Independent Procurement Review, conducted
jointly by the GoK and the European Union, identified several critical problems with
Kenya’s procurement system; weak oversight institutions, poor linkages between
procurements and expenditures, delays and inefficiencies and poor records management.
The GoK sought to improve its public procurement systems by enacting the Public
Procurement and Disposal Act and creating the Public Procurement Oversight Authority
(PPOA). Although the regulations implementing the Act were gazetted on January 1,
2007, it has been ineffective due to prominent personalities bending the rules to their
advantage (Anonymous, 2007). Adoption of the Act, places many public entities in
challenging environment, record management, supervision and setting up committees,
complexities in linkages between procurements and expenditures, as well as time
management.
The Exchequer and Audit (Public Procurement) Regulations of 2001 created the Public
Procurement Directorate (PPD) and the Public Procurement Regulations of 2001 in
Kenya. The scope of public entities was broadened to include schools, colleges,
universities, cooperatives and local authority Organizations that have been the hardest hit
with irregularities in procurement (Kipchilat, 2006). Kenya Anti-Corruption Commission
11
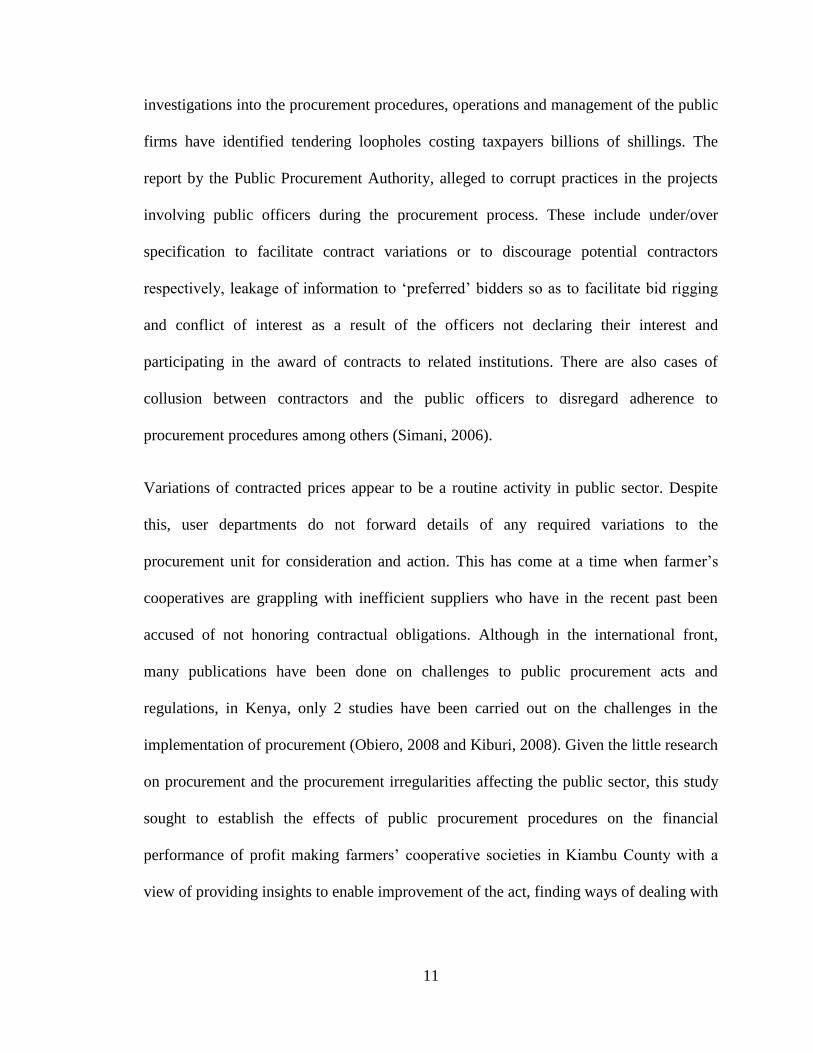
investigations into the procurement procedures, operations and management of the public
firms have identified tendering loopholes costing taxpayers billions of shillings. The
report by the Public Procurement Authority, alleged to corrupt practices in the projects
involving public officers during the procurement process. These include under/over
specification to facilitate contract variations or to discourage potential contractors
respectively, leakage of information to ‘preferred’ bidders so as to facilitate bid rigging
and conflict of interest as a result of the officers not declaring their interest and
participating in the award of contracts to related institutions. There are also cases of
collusion between contractors and the public officers to disregard adherence to
procurement procedures among others (Simani, 2006).
Variations of contracted prices appear to be a routine activity in public sector. Despite
this, user departments do not forward details of any required variations to the
procurement unit for consideration and action. This has come at a time when farmer’s
cooperatives are grappling with inefficient suppliers who have in the recent past been
accused of not honoring contractual obligations. Although in the international front,
many publications have been done on challenges to public procurement acts and
regulations, in Kenya, only 2 studies have been carried out on the challenges in the
implementation of procurement (Obiero, 2008 and Kiburi, 2008). Given the little research
on procurement and the procurement irregularities affecting the public sector, this study
sought to establish the effects of public procurement procedures on the financial
performance of profit making farmers’ cooperative societies in Kiambu County with a
view of providing insights to enable improvement of the act, finding ways of dealing with

12
challenges in the procurement system as well as enhancing setting up competitive
strategies in operating in the challenging business environment.
1.3 Research Objectives
1.3.1 General Objective
The general objective of the study was to examine effects of public procurement
procedures on financial performance of profit making farmers’ cooperative societies in
Kiambu County.
1.3.2 Specific Objectives
i. To analyze the effect of professionalism and the implementation of public
procurement procedures on the financial performance of profit making farmers’
cooperative societies in Kiambu County.
ii. To determine the effect of financial management and the implementation of
public procurement procedures on the financial performance of profit making
farmers’ cooperative societies in Kiambu County.
iii. To investigate the effect of records management and the implementation of public
procurement procedures on financial performance of profit making farmers’
cooperative societies in Kiambu County.
iv. To find out the effect response time and the implementation of public
procurement procedures on financial performance of profit making farmers’
cooperative societies in Kiambu County.

13
CHAPTER TWO
LITERATURE REVIEW
2.1 Introduction
This chapter presents the past or previous studies that have been done and theories
advanced on challenges to procurement. The chapter is hence broken down into
theoretical review (procurement, procurement within the public sector, advantages of
public procurement and disposal act); conceptual framework (professionalism, financial
management, records management and response time); critical review; empirical review;
summary and finally gaps to be filled by the study.
2.2 Theoretical Review
2.2. 1 Procurement
On a general level procurement essentially involves commerce between two or more
businesses and is such an important element of business operations that a clear strategy is
imperative. This has led to much investigation of means to streamline the industrial
procurement process. From a strategic perspective, procurement can encompass the
entire operation including a company's requisitioning, transportation, warehousing, and
in-bound receiving processes (Nevalainen, 2001, p. 60), where the dominant goal is
process efficiency (Aldin et al., 2004).
Procurement is a complex process that has both direct and indirect functions.
Specifically, the distinction is that direct procurement is the purchase of high volume

14
materials and/or services that directly facilitate the creation of the end product. Indirect
procurement is the purchase of the support materials and services necessary to enable the
creation of the end product. Subsets within this category are operating resource
management (ORM) and maintenance, repair, and operations (MRO). MRO purchases
tend to be low volume and high frequency items (Bartezzaghi and Ronchi, 2004). As
reported by Neef (2001), direct procurement accounted for fewer purchasing transactions
(between 20% and 40% in manufacturing companies) but could account for up to 60% of
a manufacturing firm's total procurement expenditure. This distinction is an important
one to note when analyzing the internet's role in procurement (e-procurement), as the
characteristics of different materials may determine their suitability to online transactions
(Bartezzaghi and Ronchi, 2004).
Procurement activities simply begin with the supplier's promise to fulfill buyer's requests.
However, those promises and expectations are generally vague and uncertain in nature,
especially for technology-intensive procurement projects (Forker and Stannack, 2000).
Besides, during the product hand-over, discussion for the necessary engineering
adjustment has to be transmitted together. Promises, expectation, and discussion mostly
involve the knowledge interaction and communication. The current interest in SRM
(Supplies Resource Management) among academics and business practices focuses more
on basic transactional issues, particularly the sourcing and trading including supplier
selection, quality/cost demands, and supplier capabilities/evaluation. Technology and
knowledge communication are relatively neglected (Amaral, 2004). Notably, according
to an investigation by Accenture in 2003, most business purchases in the USA continue
to employ conventional product supply contracts. The lack or refusal of information

15
interaction and communication between buyers and suppliers in the USA leads to an
obstacle to a stable and long-term relationship development (Kannan and Tan, 2003),
which runs against the essential initiative of SRM. Based on research findings, the quality
of purchasing products, financial performance, experience learning and knowledge
creation (Choi et al., 2004), enterprise competence enhancement (Sheth and Sharma,
1997), and continuous collaboration opportunities with partners (Handfield et al., 1997)
are all related to the completion and success of the buyer-supplier interaction associated
with the knowledge incorporated in procurements.
2.2.2 Procurement within the Public Sector
Sound public procurement policies and practices are among the essential elements of
good governance (KIPPRA, 2006; Odhiambo and Kamau; World Bank, 2002). Otieno
(2004) notes the irregular procurement activities in public institutions provide the biggest
loophole through which public resources are misappropriated. In some cases, tenders are
awarded to firms either through single sourcing or manipulation of bids; and worse still,
full payments have often been made for projects that fail to take off or are abandoned half
way. Still in other cases, tenders are awarded to un-competitive bidders through irregular
disqualification of the lower bidders.
According to Thai (2001), the basic principles of good procurement practice include
accountability, where effective mechanisms must be in place in order to enable procuring
entities spend the limited resources carefully, knowing clearly that they are accountable
to members of the public; competitive supply, which requires the procurement be carried
out by competition unless there are convincing reasons for single sourcing; and

16
consistency, which emphasizes the equal treatment of all bidders irrespective of race,
nationality or political affiliation. An ideal procurement system should also focus on
effectiveness, where procuring entities should meet the commercial, regulatory and socio-
economic goals of government in a manner that is appropriate to the procurement
requirement. Furthermore, a good procurement practice should embrace: efficiency,
which requires that procurement processes be carried out as cost effectively as possible;
fair-dealing, where suppliers should be treated fairly, without discrimination or prejudice
including protection of commercial confidentiality where necessary.
The process should also uphold integrity by ensuring that there are no malpractices;
informed decision-making, which requires public bodies to base decisions on accurate
information and ensure that requirements are being met. More still, the procurement
practice should be responsive to aspirations, expectations and needs of the target society.
Finally, there is need for transparency to enhance openness and clarity on procurement
policy and its delivery (World Bank, 2002). Various studies have shown that procurement
and revenue management form the core functions of public financial management,
particularly within the Medium Term Expenditure Framework (MTEF). The main
objectives of the MTEF include linking policy, planning, budgeting; achieving fiscal
discipline through a realistic macro economic framework; resource allocation, efficiency
in line with strategic priorities and operational efficiency through delivery of quality
managerial services. Public procurement within the MTEF, framework aims at advancing
social economic development by improving elements such as economic growth, poverty
reduction, decentralization and enterprise development in the private sector. In addition,
public procurement within the MTEF is also closely linked to the export market

17
development as well as foreign direct investment into the country (KIPPRA 2005). In
most developing countries, public procurement serves a greater role than it does in
developed nations. This is because in developing countries, governments are the main
buyers of goods and services. In this regard they often influence the size, structure,
conduct and performance of national industries (KIPPRA, 2006; Aketch, 2005).
2.2.3 Advantages of Public Procurement and Disposal Act 2005
In the past decades, the public procurement system in Kenya has undergone significant
developments. From being a system with no regulations in the 1960s, and a system
regulated by Treasury Circulars in the 1970s, 1980s and 1990s to the introduction of the
Public Procurement and Disposal Act (PPDA) of 2005 and the Procurement Regulations
of 2006 which has introduced new standards for public procurement in Kenya.
According to Public Procurement Oversight Authority (2007), Procurement Act of 2005
establishes a strong Public Procurement System which enhances economy and efficiency,
competition, integrity, transparency, public confidence and conducive investment
climate. It establishes a strong organizational framework with a strong oversight
mechanism, well defined Procuring Units and Tender Committees, it reduces delay in the
procurement process, strengthens professionalism in public procurement through
recognizing the role of the professionals and the need for continuous staff training and
development, seals loopholes for corruption, therefore reduces wastage of public
resources, enhances compliance with the Act and the Regulations due to the sanctions for
non compliance and improves the image of the country as a good investment destination.

18
According to Oanda (2008), although the Public Procurement and Disposal Act 2005
promises to dramatically improve the procurement environment in Kenya there are a
number of loopholes through which part of the problems from the past can sneak back
into play. This is the lack of a clear definition of who is procurement professional whom
the PPD Act 2005 says must be entrusted with procurement responsibility in any public
entity. Oanda avers that while it is clear who is called a Lawyer, Engineer, Doctor or
Accountant, a procurement professional is not well defined by the Act. For the Public
Procurement and Disposal Act 2005 to be enforced professionally, enactment of a legal
instrument that regulates the conduct of supplies management practitioners in both
private and public sectors in Kenya is of paramount importance. The Article 27
(Responsibility for complying Act, etc.) and Article 28 (Engagement of procuring agents)
in the Public Procurement and Disposal Act 2005 for instance, would not be
professionally enforced unless professional competence, qualification and integrity of the
procurement practitioners are regulated through a well-structured legal framework as is
the case with Supplies Practitioners Management Act.
Value for money (VFM) is the most important principle of procurement. VFM in the
public sector entails consideration of the contribution to be made to advancing
government policies and priorities while achieving the best return and performance for
the money being spent (Bauld and McGuinness, 2006). Sometimes the government is at
liberty to consider other criteria than the lowest price; for example technical capabilities,
qualifications of key personnel, and past performance records in awarding contracts to
potential suppliers (Cummings and Qiao, 2003). Some of the barriers which need to be

19
overcome in order to achieve VFM are weak governing bodies, politics, tradition, and
lack of education and training programmes (Palmer and Butt, 1985).
Although the Public Procurement and Disposal Act 2005 promises to dramatically
improve the procurement environment in Kenya there are a number of loopholes
undermining it implementation and through which part of the problems from the past,
sneaks back into play (Oanda, 2008). Among the weaknesses cited by PPOA include
weak oversight and enforcement, non-transparent procurement practices, lack of effective
links between procurement and financial management and poor records management and
filing systems (Anonymous, 2007).
2.3 Conceptual Framework
Figure2.1: Conceptual framework
Independent Variables Dependent Variable
Financial performance
of profit making
farmers’ cooperative
societies in Kiambu
county
Records management
systems
terms and conditions
Financial Management
Professionalism
Response Time

20
2.3.1 Professionalism
The benefits of a centralized arrangement are that it removes the diffusion of
accountability for procurement decisions by placing this within the agency that holds the
funds. It also enables capacity to be built in the user agencies where there is a greater
need (Murray, 2001a). However, in contemplating the move to such a decentralized
system, a number of difficult issues have to be tackled. These include the manner in
which the decentralized system should be managed, how to leverage the buying power
that comes with centralized purchasing especially of common user items and how to
create adequate capacity in the buying agencies to tackle types of procurement they had
no responsibility over before (Atkinson, 2003).
In dealing with the oversight problem, many countries have coupled decentralization of
the procurement function with the creation of central entities with oversight and
enforcement responsibility. This involves involving professionals e.g. in tendering,
procurement, evaluation, disposal and others, which are very costly, and time consuming.
However, in countries without the history of such an agency, vigorous debates can occur
regarding the powers and responsibilities that such an entity should have the extent to
which it should be endowed with operational independence and where such an entity
should be placed within existing government structures (Phillips, et al 2007). While the
answers to many of these issues depends largely on how the government fiduciary
arrangements are organized, the principle should be to vest such an entity with adequate
authority and independence to enable it vigorously enforce the procurement rules across
all public agencies.

21
In carrying out assessments of existing procurement systems, one constantly finds that
abuse of the procurement system arises largely due to weak or inconsistent enforcement
of the prevailing rules (Soudry, 2007). This is clearly reflected by the dissonance between
the prevailing (formal) rules (in whichever juridical form these may be) and what actually
takes place in practice during the procurement process simply due to involving certain
individuals with little knowledge in the procurement processes . Public entities will go to
lengths to create a semblance of formal compliance with procedural and other
requirements while seriously compromising the intent and spirit of such rules (Porter,
2001). In severely compromised systems, even this veneer of formal compliance is not
observed mainly because public officials and their private sector accomplices have no
fear of retribution.
Ambiguities and gaps in the rules also lead to different interpretations and practices that
are mainstreamed. And, when the problem is framed as one of lack of enforcement,
doubt is often expressed as to whether replacing existing rules with a new legal
framework will result in any radical improvements (Gunasekaran, 2005). This can be a
difficult question because, while the lack of enforcement can partly be traced to the
weakness in the rules themselves, a solution will require a multi-faceted approach. It will
include for example, strengthening the right of bidders to obtain redress when the public
entities breach the rules, forcing greater transparency into the decision-making process
(including public notification of contract awards) coupled with other institutional
oversight mechanisms such as procurement audits (Scarpetta, 2003). The challenge lies
in achieving proper balance so that mechanisms of enforcement do not become so heavy
as to make the system inefficient and costly

22
2.3.2 Financial Management
Financial Management is putting together the economic resources at hand to make
efficient use of them and taking decisions that can successfully culminate in acquiring
more assets for the business. With effective Financial Management you can even attract
finance to meet the short term and long term requirement of the family or firm. The
whole process is intense and deals with the selection of specific or a combination of
assets to deal with a financial issue, if any. The aim of Financial Management is to reduce
the size of a problem and ensure fiscal growth of the enterprise (Rosen, 2002).
In government, public financial management concerns the taxing and spending of
government, which in turn influences resource allocation and income distribution (Rosen,
2002: 16). The spending portion covers the budget cycle, including budget preparation,
internal controls, accounting, internal and external audit, procurement, and monitoring
and reporting arrangements.
The planning and financial framework does not include clear links to procurement
planning and, consequently, procuring entities are not required to prepare procurement
plans. In addition, the procurement oversight arrangements do not generate the
information that would be required to fully integrate procurement planning into corporate
plans. Established international practice considers procurement planning as a key activity
within the public financial management system to enhance the transparency and economy
of procurement processes as well as the quality of the goods, services and works procured
(Warkentin, 2002). In addition, the institutionalization of procurement planning can
ensure that procurement inputs relate more effectively to corporate objectives and

23
provide timely information on funding requirements. Also, budget execution is mainly
affected by the impact of cash management in the context of fiscal constraints,
weaknesses in the commitments controls, and shortcomings in the procurement process.
2.3.3 Records Management
Record management is a crucial aspect of survival for any company, no matter the size.
Not only is keeping track of important information vital to the smooth operations of a
company, trying to track down and find documents (both paper and electronic) can be a
very costly process. Having a system in place to manage the classification, storage,
archiving, and destruction of company records can help avert a costly and potentially
damaging situation.
One of the best ways to implement a record management policy is utilizing a business
that specializes in it; there are a myriad of companies that offer record management
solutions for both paper and electronic documents. Such solutions make it easy to track,
retrieve, and securely store important documents (Bolton, 2006). With so many threats
facing companies today, record management is one vital key to managing a successful.
A record keeping system is a day to day method by which a business manager records the
financial transactions of the business. These business records let the manager analyze
where the business is and where it is going. Keeping records is crucial for the successful
management of any business. A comprehensive record-keeping system makes it possible
for business managers to develop accurate and timely financial reports that show the
progress and current condition of the business. With the financial report generated from a
good record-keeping system, they can compare performance during one period of time

24
(month, quarter or year) with another period, calculate trends and plan for the business's
future (Robek, Brown & Stephens, 1995). An appropriate record-keeping system can
determine the survival or failure of a business. For those already in businesses, good
record keeping systems can increase the chances of staying in business and the
opportunity to earn larger profits. Complete records will keep you in touch with your
business’s operations and obligations and help you see problems before they occur
(Robek, Brown & Stephens, 1995).
A basic record-keeping system should be easy to use, understand, reliable, accurate and
timely. The business needs some type of business journal to record transactions and a
well-organized filing system. The system should also be generating monthly financial
statements that include cash flow, accounts receivable, accounts payable, payroll, overall
income statement and balance statement (Kautz, 1998). A record system should also do
more than simply record. Ideally, a good record system should be able to project itself
into the future or the past and give an ideal picture of the financial situation at that point
in time.
Wood and Sangster, (1999) outlines that record keeping is an important aspect in
business as it is the base from which information is prepared concerning an entity’s
financial performance. Data obtained from the records is sorted out, classified and
summarized into useful information to be reported in form of financial statements
prepared at the end of particular periods (usually annually).The primary uses of financial
statements are evaluating past performance and predicting future performance. These
statements are therefore the major factors that determine the kind of information to be

25
extracted for performance evaluation. Rukunga (1999) stated that, once in business one
realizes the necessity of keeping records of transactions because he/she may want to
know the expenditure for a given period and items on which the business money is being
spent. One would also want to know how the business is fairing on revenue earnings for
the same period, the other expenses incurred and finally if the business is making any
profits. It is also important to have information on who owes the business money and
when it is due, and whether the business owes anyone money and how much it owes.
Proper maintenance of business records will assist in assessing the level or amount of
credit required to enable the business perform better.
Fess and Rollin (1997) indicate that the use of records is an integral part of successful
financial management. Knowledge of the past performance of an enterprise gives
additional value beyond its historical aspects. Comparison with the current operations
may reveal the means of accelerating favorable trends and reducing those that are
unfavorable. In the conduct of day to day operations, management relies upon records in
various ways such as knowing the amount owed to creditors or customers and the due
dates, knowing when to place orders and amount of cash required for purchases. Many
other essential items of information can be obtained in a timely and orderly manner if
adequate records are maintained. Financial records are tools that help entrepreneurs
manage their businesses better. Broadly, the records help one evaluate the past and
present performance of the business and to project and plan its future. Important financial
information is extracted from the accounting records to make various analyses which are
used by management for decision making. Modern businesses are complicated and
involve many daily transactions, which cannot be handled mentally.

26
Records management programs are not generally an organization's primary business, and
even though RM programs don't usually generate income they are important to every
organization poor record management will lead to poor control of creation and growth of
records, increased operating costs, lowered efficiency and productivity, low assimilation
of new records management technologies, low regulatory compliance, maximize
litigation risks, increased risk on vital information, reduced management decision
making, and increased risk on corporate memory (Robek, Brown and Stephens, 1995).
The term intellectual control refers to the accessibility of records via their content. This
usually involves creating an index of records to aid the identification and retrieval of
relevant items from storage. If the owners have failed to provide an adequate index to
their records, subsequent retrieval can be time-consuming, expensive and unreliable and
the record storage process may be perceived as a ‘black hole’ to be avoided.
2.3.4 Response Time
The purchasing function is in a grey area when it comes to competency. Supplier
relationships are frequently described as strategic based on time factor (Bensaou, 1999;
Gadde and Snehota, 2000; Kraljic, 1983; Olsen and Ellram, 1997; etc.) and the nature of
supplier relationships may be directly related to the buyer's core competence (Cox, 1996)
but outsourcing decisions are frequently taken without a thorough strategic review
(Lonsdale and Cox, 1997). Suppliers directly impact the quality, cost and delivery of the
firms that incorporate the suppliers' outputs into their final product (Krause and Scannell,
2002). Strategic purchases, high value purchases and supplier selection and evaluation in
relation to the response rate have substantial implications for a firm's ability to make

27
profits (Zsidisin, 2003) and thus should be considered as a core competence. An OEM
(Original Equipment Manufacturer) operating just-in-time manufacturing may well view
procurement as integral to their core competency (Purchasing, 1995). For smaller
companies purchasing may be a core competence as the function structures and manages
relationships with suppliers with whom they have little leverage as they do not represent
significant cash flows (Christiansen and Maltz, 2002).
Donavon Favre, global lead of Accenture's procurement solutions unit, believes work that
is not a core competency should be done by an organisation for which that work is a core
competency. At most companies, purchasing indirect or non-critical materials are not
core competencies (Favre et al., 2004). Parts, components and systems that entail mature
technology that add nothing to the product value in the view of the customer may be
considered commodities. Commodity component families can be identified as having
many possible suppliers and may generate small margins, whilst strategic component
families have few suppliers and high premiums (Venkatesan, 1992).
Response time in procurement in consideration to competitive environment includes
lower procurement costs, faster cycle times, reduced maverick or unauthorized buying,
more highly organized information, and tighter integration of the procurement function
with key back-office systems. Effectiveness includes increased control over the supply
chain, proactive management of key procurement data, and higher-quality purchasing
decisions within organizations (Harrington, 1999).
Efficiency in procurement is more evident and has been reported as the number one
reason for utilizing e-business tools (Harrington, 1999; Kalakota and Whinston, 1996).

28
Efficiency is realized through lower costs (including the opportunity cost of time) in
performing various facets of the purchasing task. E-commerce tools reduce transaction
costs between organizations by facilitating communications and enabling tasks to be
completed more rapidly. The conversion of paper documents for ordering, invoicing, and
tracking into electronic documents lowers expenses associated with accounting, record
keeping, and the various archival tasks associated with procurement (Ramusson, 1999).
Other cost savings include economies gained from reduced order cycle time and greater
timeliness in ordering and delivery (Peters and Hogenson, 1999). Order cycle cost
reductions occur when Internet-based buying lowers managerial involvement in purchase
activities and in the number of separate buying tasks and procedures that must be carried
out (Kalakota and Robinson, 1999). E-commerce tools offer the opportunity to group
tasks such as vendor identification, specification transfer, and pricing into a seamless
communication stream, lowering time and cost investments (Solomon, 1999).
Further, highly knowledgeable technical personnel, reduced conflict and better
coordination imply better product selection and inventory management. Importantly, e-
commerce tools not only lower the cost of search but also make the search aspects of the
buying process more effective (Kosiur, 1997). Purchasers are able to utilize Internet
search engines and other Web-based product and vendor directories to widen the scope of
their search. Effectiveness outcomes of increased search capabilities include lower and
generally more competitive, pricing as well as a wider array of quality choices.
Mainly inefficiencies are brought by, ordering unapproved or nonessential items and poor
compliance with corporate contracts leading to unnecessary administrative overhead and

29
payment cost , failure to order through approved suppliers, reducing the ability of to
negotiate lower prices and resulting to overall cost creep, high error rates and long
purchase cycle times caused by the many stage nature of existing procurement process
involving staff in lengthy reconciliation and other non value-adding activities and
unnecessary complicated and time wasting logistics and fulfillment procedure involved
in taking delivery of good and services to delivering them to the end user.
Inefficiencies in the procurement processes lead to lack of control and not realizing value
for money in any business. Other problem that may result from inefficiency in the
procurement process includes poor management of procurements, corruption, theft and
loss of public properties.
2.4 Empirical Review
Angeles (2007) sought to pursue the understanding of current business-to-business e-
procurement practices by describing the success factors and challenges to its
implementation in the corporate setting. The study through factor analysis resulted in
three e-procurement success factors: supplier and contract management; end-user
behavior and e-procurement business processes; and information and e-procurement
infrastructure.
Murray, (2009) sought to establish perceived local government procurement best
practice. Secondary research is then drawn upon to establish local government
procurement's response to the economic recession. The study was set within the context
of English local government. Its contribution is in highlighting that perceived best public
procurement practice may well, in the short-term, be inappropriate and perhaps delay

30
economic recovery. Suggestions for more radical short-term procurement strategic
interventions were set out and justified as accelerating the economic recovery. The
suggestions were considered appropriate, not only for the crisis, but also for future
economic downturns or indeed any country facing such a situation. The analysis
suggested that English local government procurement strategy generally remain unaltered
from that adopted prior to the economic recession. It is then argued that current best
practice may well hinder an economic recovery and a short-term shift in procurement
strategy is required.
There are reported financial benefits from outsourcing procurement in the literature.
Raising purchasing process compliance from 60 per cent to 95 per cent can reduce a
companies cost of goods sold by 4 per cent and procurement outsourcing across the board
can reduce costs of service and materials by up to 15 per cent (Favre et al., 2004).
A noted benefit derived from outsourcing purchasing is the imposed behavioral and
process discipline which the provider brings (John, 2003b). It may be argued that this
process discipline could and should be imposed in-house, but in reality this is often very
difficult to enforce. Without process discipline it is difficult to track costs. Many smaller
firms run into trouble because they simply do not know their true costs (Morgan, 1995)
and we believe true cost to be even more difficult to calculate for larger firms who do not
have rigorous processes. This illustrates that great care needs to be taken when setting out
the value expected to be gained from engaging a service provider and the method in
which this value will be measured and communicated in terms of quantified and realized
benefits.

31
CHAPTER THREE
RESEARCH METHODOLOGY
3.1 Introduction
This chapter sets out various stages and phases that followed in completing the study. It
involves a blueprint for the collection, measurement and analysis of data. This section is
an overall scheme, plan or structure conceived to aid the researcher in answering the
raised research questions. Specifically the following subsections were included; research
design, target population, data collection instruments, data collection procedures and
finally data analysis.
3.2 Research Design
Research design refers to the method used to carry out a research. This research problem
was studied using descriptive research design. According to Cooper and Schindler
(2003), a descriptive study is concerned with finding out the what, where and how of a
phenomenon. Descriptive research design was chosen because it enables the researcher to
generalise the findings to a larger population. This study therefore was able to generalise
the findings to all the departments in the Firm. The focus of this study was quantitative.
However, some qualitative approaches were used in order to gain a better understanding
and possibly enable a better and more insightful interpretation of the results from the
quantitative study.

32
3.3 Target Population
Target population in statistics is the specific population about which information is
desired. According to Ngechu (2004), a population is a well defined or set of people,
services, elements, events, group of things or households that are being investigated. This
definition ensures that population of interest is homogeneous. Population studies are
more representative because everyone has equal chance to be included in the final sample
that is drawn according to Mugenda and Mugenda (1999). The target population for this
study was employees in procurement department and other heads of departments in the
profit making farmers’ Cooperative Societies in Kiambu County who have the
responsibility of procurement activities in the Firms. The study focused on the section
and particularly on the top, middle and lower level management staff who are directly
dealing with the day-to-day procurement activities in the firms. Mugenda and Mugenda
(1999) explain that the target population should have some observable characteristics, to
which the researcher intends to generalize the results of the study.
3.4 Sample Design and Procedure
The study used stratified random sampling technique in coming up with the sample being
that the target population is heterogeneous, that is, consist of different farmers’
Cooperative Societies. This would make the use of other sampling techniques such as
random sampling technique inappropriate, as they would come up with unrepresentative
sample. When sub-populations vary considerably, it is advantageous to sample each
subpopulation (stratum) independently (O'Sullivan and Barnes, 2007). Stratified
sampling technique focuses on important subpopulations but ignores irrelevant ones,

33
improves the accuracy of estimation, is efficient and sampling equal numbers from strata
varying widely in size may be used to equate the statistical power of tests of differences
between strata. Stratified sampling also allows other sampling techniques such as random
and systematic sampling techniques, to be conducted within the stratum (Groves, 2004).
The target population was stratified into farmers’ Cooperative Societies, which formed 10
strata. In each stratum, the study used simple random sampling technique in coming up
with a sample of 3 employees from procurement department from each firm. This helped
reduce repetitiveness and redundancy of the data collected, since each firm adopts the
procurement procedure. Random sampling technique would be advantageous for it
accords each member of within the stratum an equal chance of being included in the
study.
3.5 Data Collection
3.5.1 Type of Data
The study utilized both primary and secondary data. Primary data was gathered through
questionnaires, while secondary data was obtained from the firm’s annual financial
records. These supplemented the primary data received from questionnaires.
3.5.2 Research Instrument
With respect to procurement, this study utilized a questionnaire to collect primary data as
used in various previous research projects (Lumpkin and Dess, 2001). A questionnaire is
a research instrument consisting of a series of questions and other prompts for gathering
information from respondents. The study considered questionnaires for they have
34
advantages over other types of research instruments in that they are cheap, do not require
as much effort from the questioner as verbal or telephone surveys, and often have
standardized answers that make it simple to compile data.
The questionnaire designed in this study comprised of two sections. The first part
included the demographic and operational characteristics designed to determine
fundamental issues including the demographic characteristics of the respondent. The
second part was devoted to the examination of the effects of public procurement
procedures on the operations of farmers’ cooperative societies in Kiambu County study
where the variables of the study were put into focus. The questionnaire is designed to
include both structured and unstructured questions. The structured questions was used in
an effort to conserve time and money as well as to facilitate an easier analysis as they are
in immediate usable form; while the unstructured questions was used so as to encourage
the respondent to give an in-depth and felt response without feeling held back in
revealing of any information.
3.5.3 Data Collection Method
This study collected quantitative data using a self-administered questionnaire.
Nevertheless, where it proved difficult for the respondents to complete the questionnaires
immediately, the questionnaire were left with the respondents and picked later. Before the
questionnaire was finally administered to participants, a pilot study was carried out to
ensure that the questions are relevant, clearly understandable and make sense. The pilot
study aimed at determining the reliability of the questionnaire including the wording,
structure and sequence of the questions. A cover letter from University of Nairobi was

35
taken along to enable the administering of the questionnaire. The respondents were
assured of confidentiality of their names and responses and that the responses would not
be handled by any other person but rather was used purely for academic purposes.
3.6 Pilot Study
This pilot study involved a pretest of the questionnaire on 10 respondents from the
cooperative societies. The respondents were conveniently selected since statistical
conditions are not necessary in the pilot study (Cooper and Schindler, 2003). The purpose
was to refine the questionnaire so that respondents in the major study had no problem in
answering the questions. Expert opinion was requested to comment on the
representativeness and suitability of questions and give suggestions of corrections to be
made to the structure of the questionnaire. This helped to improve the content validity
and reliability of the data that was collected. The questionnaire was hand delivered and
administered at the respondents’ place of work to ensure objective response and reduce
non-response rate. The results of the pilot study were not included in the actual study.
3.7 Data Analysis
Before processing the responses, the completed questionnaires were edited for
completeness and consistency. The data was then coded to enable the responses to be
grouped into various categories. Data collected was purely quantitative and it was
analyzed by descriptive analysis such as measure of central tendency and measure of
dispersion. The descriptive statistical tools helped in describing the data and determining
the extent used. Data analysis used SPSS and Microsoft Excel to generate quantitative
reports through tabulations, percentages, and measures of central tendency. The

36
researcher conducted a multiple regression analysis to determine the relative importance
of each of the variables with respect to financial performance of the cooperative societies.
A probabilistic model to predict the extent to which the identified independent variables
affect the dependent variable was used. The population regression line is represented by
the following equation: Y = βo + β1x1 + β2x2 +β3x3 +β4x4 + €
Where; Y = financial performance – The dependent variable (determined through profit
margin of the Cooperative societies) βo = This is the Y-intercept which is a constant not a
variable and it occurs when x1=x2=x3=x4=0
x1 = Professionalism– independent variable
x2 = Financial Management– independent variable
x3 = Records management – independent variable
x4 = Response Rate– independent variable
€ = error variable which represents all the factors that affects the dependent variable but
was not included in the model either because they are difficult to measure or not known.
3.8 Data Presentation
Tables were used to present responses and facilitate comparison. Cooper and Schindler
(2003) notes that the use of percentages is important for two reasons; first they simplify
data by reducing all the numbers to range between 0 and 100. Second, they translate the
data into standard form with a base of 100 for relative comparisons. This generated
quantitative reports through tabulations, percentages, and measure of central tendency.

37
CHAPTER FOUR
DATA ANALYSIS AND INTERPRETATION
4.1 Introduction
This chapter presents the data that was found on an examination of the effects of public
procurement procedures on financial performance of profit making farmers’ cooperative
societies in Kiambu County. This study made use of frequencies (absolute and relative)
on single response questions. On multiple response questions, the study used Likert scale
in collecting and analyzing the data whereby a scale of 5 points were used in computing
the means and standard deviations. These were then presented in tables, graphs and charts
as appropriate with explanations being given in prose.
4.2 General Information
This section presents data on general information on existence of procurement
committees; implementation of the public procurement Act of 2005 and the effect on
financial performance by the sampled profit making farmers’ cooperative societies in
Kiambu County
Figure 4.2: Respondents committee
Source: Author

38
From the findings, 45% of the respondents served in procurement committee; 25% in
tender committee; 17% in inspection and acceptance committee while 13% in disposal
committee. Thus the distribution of most of the respondents in procurement committee
means that they would provide sufficient data on the effects of public procurement
procedures on financial performance of profit making farmers’ cooperative societies in
Kiambu County.
Table 4.1: Implementation of the public procurement Act of 2005
Year Frequency Percent
2007 1 2.5
2009 4 10.0
2010 30 75.0
2011 4 10.0
i don’t know 1 2.5 Total 40 100.0
Source: Author
The asked the respondents to state the year in which their organizations started
implementing the public procurement Act of 2005. From the findings, 75% indicated year
2010, 10% stated year 2009 and 2011 while 2.5% stated year 2007 while one respondent
had no idea. From these findings, it is clear that most of the profit making farmers’
cooperative societies in Kiambu County implemented public procurement Act in the year
2010 and hence there had been the perceived influence on financial performance as most
had already complied.

39
Figure 4.3: Rating the organization
Source: Author
The study asked the respondents to rate their organization in terms of the Public
Procurement and Disposal Act 2005 implementation. From the findings, 70% rated it as
good, 20% as fair, 7.5% and 2.5% as poor. The findings indicate that majority of profit
making farmers’ cooperative societies in Kiambu County had indeed performed well
after Public Procurement and Disposal Act 2005 implementation.
Figure 4.4: Effect of implementation of the procurement Act of 2005
Source: Author

40
The study inquired the respondents’ view on whether implementation of the procurement
Act of 2005 has affected the society’s financial performance. From the findings, 97%
agreed while 3% denied. In addition, 52.5% stated that this had a great impact while
47.5% indicated a moderate impact. Therefore, it is clear that the Act had a significant
impact on profit making farmers’ cooperative societies in Kiambu County in terms of
profitability.
4.3 Professionalism
The study in this section sought to establish the effect of professionalism in
implementation of public procurement procedures on the financial performance of the
cooperative societies in Kiambu County.
Table 4.2: Influence of Professionalism
Frequency Percent
To no extent 1 2.5
To a little extent 1 2.5
To a great extent 30 75
To a very great extent 8 20
Total 40 100
Source: Author
From the findings, 75% of the respondents indicated that professionalism in
implementation of public procurement procedures affect financial performance to a great
extent. Further, 20% indicated a very great extent while each of 2.5% stated a little as
well as no influence respectively. From the findings it is clear that professionalism in
implementation of public procurement procedures is significant determinant of financial
performance.

41
Table 4.3: Effect of Professionalism on financial performance
Effect of Professionalism on financial performance Mean Std.
Deviation Enhances accountability for procurement decisions 4.45 .639
Management of oversight over the procuring system 4.08 1.421 Enables capacity to be built in the user departments 3.55 1.154 Enhances procurement planning 4.18 .813
Ensures there is assessment of the procurement procedures
during implementation
4.35 .834
Source: Author
The study asked the respondents to state the extent to which professionalism in the
implementation of procurement procedures affect financial performance of the
cooperatives. From the findings professionalism ensures there is assessment of the
procurement procedures during implementation had a mean score of 4.35; enhances
accountability for procurement decisions [M=4.45], enhances procurement planning
[M=4.18], management of oversight over the procuring system [M=4.08].The
respondents moderately stated that professionalism enables capacity to be built in the user
departments [M=3.55]. The findings thus indicate that professionalism in implementation
of public procurement procedures ensures there is assessment of the procurement
procedures; enhances accountability for procurement decisions; enhances procurement
planning and ensures management of oversight over the procuring system in profit
making farmers’ cooperative societies in Kiambu County.

42
Table 4.4: Professionalism challenges in implementation of public procurement procedures
Mean
Std.
Deviation
Lack of oversight over the various procurement processes 3.35 0.834
Inadequate capacity to handle all types of procurements
necessary
3.20 1.043
Ambiguity in the powers and responsibilities of those involved
in the procurement process
3.30 0.723
Operational independence 3.43 1.010
Difficulties operating in the existing organization structures 3.93 0.944
Abuse of the procurement system by various parties 1.90 0.982
Inconsistent utilization of the procurement procedures for
various purchases
2.20 0.723
Compliance with procedural requirements 3.25 0.840
Compromise on the intent and spirit of rules 1.88 0.648
Ambiguities and gaps in the rules and procedures 3.08 1.347
Inefficiencies in implementation 2.20 0.883
High costs of ensuring professionalism in implementation of the
procurement procedures
3.30 0.992
Source: Author
The study asked the respondents to state the extent to which challenges affiliated to
professionalism affect the implementation of procurement procedures in the cooperatives.
The respondents were required to rate their level of agreement based on a Likert scale of
1-5 where 1= To no extent, 2= To a little extent, 3= To a moderate extent, 4= great extent
and 5= very great extent. From the findings, difficulties operating in the existing
organization structures had a high mean score of 3.93; operational independence had a
mean score of 3.43; lack of oversight over the various procurement processes had a mean
of 3.35; ambiguity in the powers and responsibilities of those involved in the
procurement process and high costs of ensuring professionalism in implementation of the
procurement procedures had a mean of 3.30.On the other hand, abuse of the procurement
system by various parties and compromise on the intent and spirit of rules had low mean
scores of 1.90 and 1.88. From these findings, it is evident that the profit making farmers’
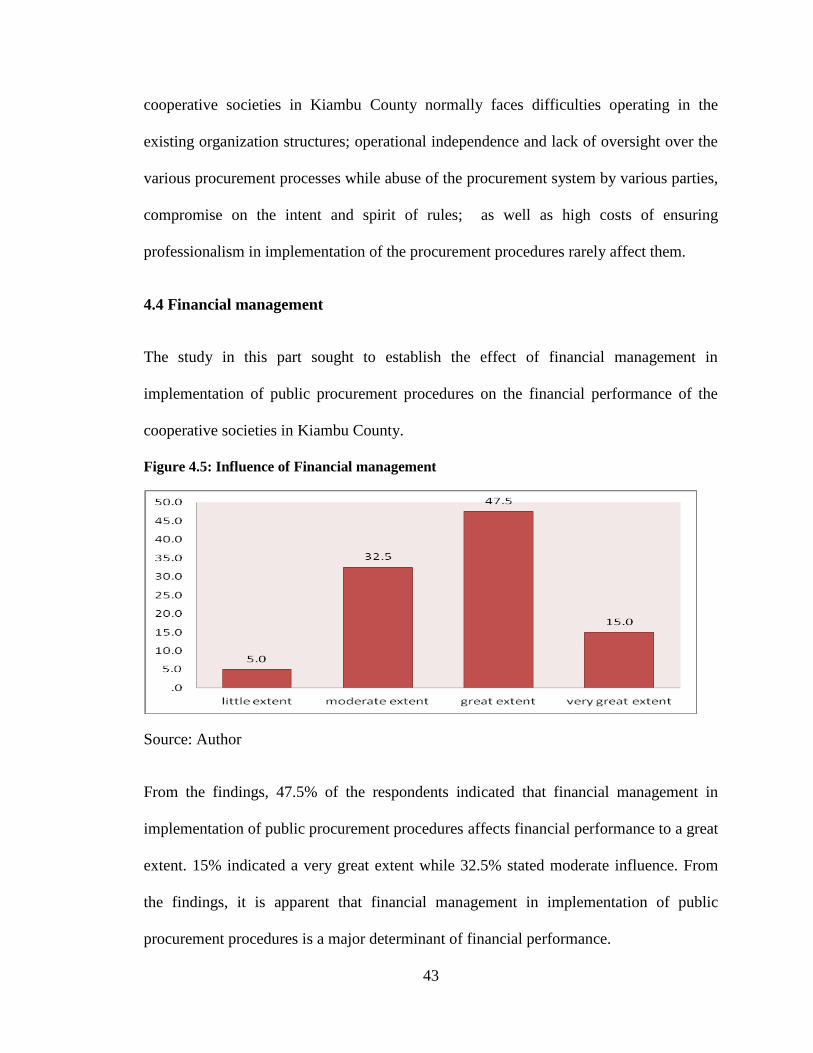
43
cooperative societies in Kiambu County normally faces difficulties operating in the
existing organization structures; operational independence and lack of oversight over the
various procurement processes while abuse of the procurement system by various parties,
compromise on the intent and spirit of rules; as well as high costs of ensuring
professionalism in implementation of the procurement procedures rarely affect them.
4.4 Financial management
The study in this part sought to establish the effect of financial management in
implementation of public procurement procedures on the financial performance of the
cooperative societies in Kiambu County.
Figure 4.5: Influence of Financial management
Source: Author
From the findings, 47.5% of the respondents indicated that financial management in
implementation of public procurement procedures affects financial performance to a great
extent. 15% indicated a very great extent while 32.5% stated moderate influence. From
the findings, it is apparent that financial management in implementation of public
procurement procedures is a major determinant of financial performance.

44
Table 4.5: Financial management challenges
Mean
Std.
Deviation
Ineffective financial management system 2.38 1.213
Difficult decision making process leading to lost opportunities for
financial growth 4.55 6.516
Lack of budget preparation capacity 2.00 1.013
Weak internal controls leading to income/asset losses 1.50 0.679
Inadequate capacity in accounting for revenue and assets 1.38 0.490
Ineffective internal and external oversight mechanisms 2.20 0.464
Inadequate monitoring and reporting arrangements 2.38 0.705
Unclear links to procurement planning, budgets and strategy 2.23 0.862
Source: Author
The study asked the respondents to state the extent to which challenges associated to
financial management affect the implementation of procurement procedures in the
cooperatives. The respondents were required to rate their level of agreement based on a
Likert scale of 1-5 where 1= To no extent, 2= To a little extent, 3= To a moderate extent,
4= great extent and 5= very great extent. From the findings, majority of the profit making
farmers’ cooperative societies in Kiambu County faces difficulties in decision-making
process leading to lost opportunities for financial growth. However, they rarely face
ineffective financial management system; Lack of budget preparation capacity; Weak
internal controls leading to income/asset losses; inadequate capacity in accounting for
revenue and assets as well as ineffective internal and external oversight mechanisms
during implementation of procurement procedures.
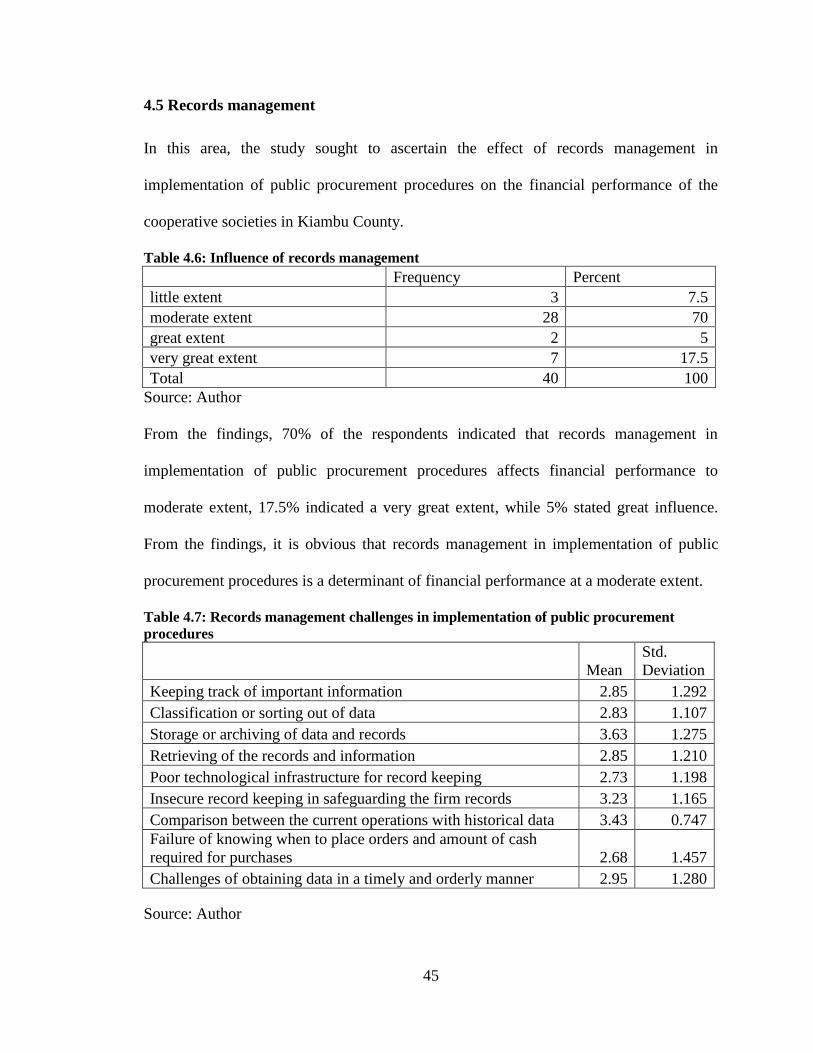
45
4.5 Records management
In this area, the study sought to ascertain the effect of records management in
implementation of public procurement procedures on the financial performance of the
cooperative societies in Kiambu County.
Table 4.6: Influence of records management
Frequency Percent
little extent 3 7.5
moderate extent 28 70
great extent 2 5
very great extent 7 17.5
Total 40 100
Source: Author
From the findings, 70% of the respondents indicated that records management in
implementation of public procurement procedures affects financial performance to
moderate extent, 17.5% indicated a very great extent, while 5% stated great influence.
From the findings, it is obvious that records management in implementation of public
procurement procedures is a determinant of financial performance at a moderate extent.
Table 4.7: Records management challenges in implementation of public procurement
procedures
Mean
Std.
Deviation
Keeping track of important information 2.85 1.292
Classification or sorting out of data 2.83 1.107
Storage or archiving of data and records 3.63 1.275
Retrieving of the records and information 2.85 1.210
Poor technological infrastructure for record keeping 2.73 1.198
Insecure record keeping in safeguarding the firm records 3.23 1.165
Comparison between the current operations with historical data 3.43 0.747
Failure of knowing when to place orders and amount of cash
required for purchases 2.68 1.457
Challenges of obtaining data in a timely and orderly manner 2.95 1.280
Source: Author

46
The study asked the respondents to state the extent to which challenges related to records
management affect the implementation of procurement procedures in the cooperatives.
The respondents were required to rate their level of agreement based on a Likert scale of
1-5 where 1= To no extent, 2= To a little extent, 3= To a moderate extent, 4= great extent
and 5= very great extent. From the findings, comparison between the current operations
with historical data had a mean score of 3.43 while insecure record keeping in
safeguarding the firm records had a mean score of 3.23. Keeping track of important
information [M= 2.85]; classification or sorting out of data [M=2.83]; lack of proper
record keeping leading to increased operating costs [M=2.41]; Poor record keeping
leading to increased litigation risks [ M=1.85] and Poor record keeping affecting
effective management decision making processes [M=1.97].
From the findings most of the cooperative societies faces insecure record keeping and
comparison current and historical data while they rarely face Keeping track of important
information; classification of data; lack of proper record keeping; Poor record keeping
leading to increased litigation risks; Poor record keeping affecting effective management
decision making processes during implementation of procurement procedures.
4.6 Response Rate
In this section, the study sought to determine the effect of response rate in
implementation of public procurement procedures on the financial performance of the
cooperative societies in Kiambu County.

47
Table 4.8: Influence of Response Rate
Frequency Percent
No extent 1 2.5
little extent 3 7.5
moderate extent 20 50
great extent 9 22.5
very great extent 6 17.5
Total 40 100
Source: Author
From the findings, 50% of the respondents indicated that response rate in implementation
of public procurement procedures affects financial performance to moderate extent,
22.5% indicated a great extent, and 17.5% indicated very great extent while 7.5% stated
little influence. From the findings, it is clear that response rate in implementation of
public procurement procedures is a determinant of financial performance at a moderate
extent.
Table 4.9: Challenges in implementation of public procurement procedures
Mean
Std.
Deviation
Inefficiency in procurement processes leading to low responses rates and
thus increased procurement costs 2.58 1.567
Failure to order through approved suppliers due to low response rates thus
increase purchase prices/costs 3.13 1.305
Low response rates cause longer cycle times and high opportunity costs and
re-order levels 3.30 1.018
Inefficiencies in the procurement system resulting to high error rates 2.55 0.904
Reduction in the ability to negotiate lower prices due to low response rates 3.03 1.441
Low response rates leading to losses due to lost investment opportunities 2.98 1.493
Decreased control over the supply chain 2.23 0.800
Inefficiencies arising from ordering unapproved or nonessential items 2.13 0.911
Inefficiencies are experienced due to poor compliance with corporate
contracts leading to unnecessary administrative costs 2.40 0.672
Source: Author

48
The study asked the respondents to state the extent to which challenges related to
response rate affect the implementation of procurement procedures in the cooperatives.
The respondents were required to rate their level of agreement based on a Likert scale of
1-5 where 1= To no extent, 2= To a little extent, 3= to a moderate extent, 4= great extent
and 5= very great extent. From the findings, low response rates cause longer cycle times
and high opportunity costs and re-order levels; failure to order through approved
suppliers due to low response rates thus increase purchase prices/costs and reduction in
the ability to negotiate lower prices due to low response rates had mean scores of 3.3,
3.13 and 3.03 respectively. Other statements had low mean scores. Decreased control
over the supply chain [M=2.23]; Inefficiencies arising from by ordering unapproved or
nonessential items [M=2.13].
From the findings, it is clear that profit making farmers cooperative societies face low
response rates causing longer cycle times and high opportunity costs; failure to order
through approved suppliers due to low response rates thus increase in purchase
prices/costs and; reduction in the ability to negotiate lower prices due to low response
rates. On the other hand, they rarely face decreased control over the supply chain;
inefficiencies arising from ordering unapproved or nonessential items.
4.7 Inferential statistics
This section presents a discussion of the results of inferential statistics. The researcher
conducted a multiple regression analysis to determine the relative importance of each of
the variables with respect to financial performance of the cooperative societies. A

49
probabilistic model to predict the extent to which the identified independent variables
affect the dependent variable was used. The population regression line is represented by
the following equation:
Y = βo + β1x1 + β2x2 +β3x3 +β4x4 + €
Where: Y = financial performance – The dependent variable (determined through profit
margin of the Cooperative societies), βo = This is the Y-intercept which is a constant not
a variable and it occurs when x1=x2=x3=x4=0, x1 = Professionalism– independent
variable, x2 = Financial Management– independent variable, x3 = Records management –
independent variable and x4 = Response Rate– independent variable.
The researcher applied the statistical package for social sciences (SPSS) to code, enter
and compute the measurements of the multiple regressions for the study. Findings are
presented in the following tables;
Table 4.10: Model Summary
Source: Author (a. Predictors: (Constant), Professionalism, Financial Management, Records
management and Response Rate, b. Dependent Variable: financial performance)
Coefficient of determination explains the extent to which changes in the dependent
variable can be explained by the change in the independent variables or the percentage of
variation in the dependent variable (financial performance) that is explained by all the
Model R R Square Adjusted R
Square
Std. Error of the
Estimate
1 . 918a .843 .805 .51038
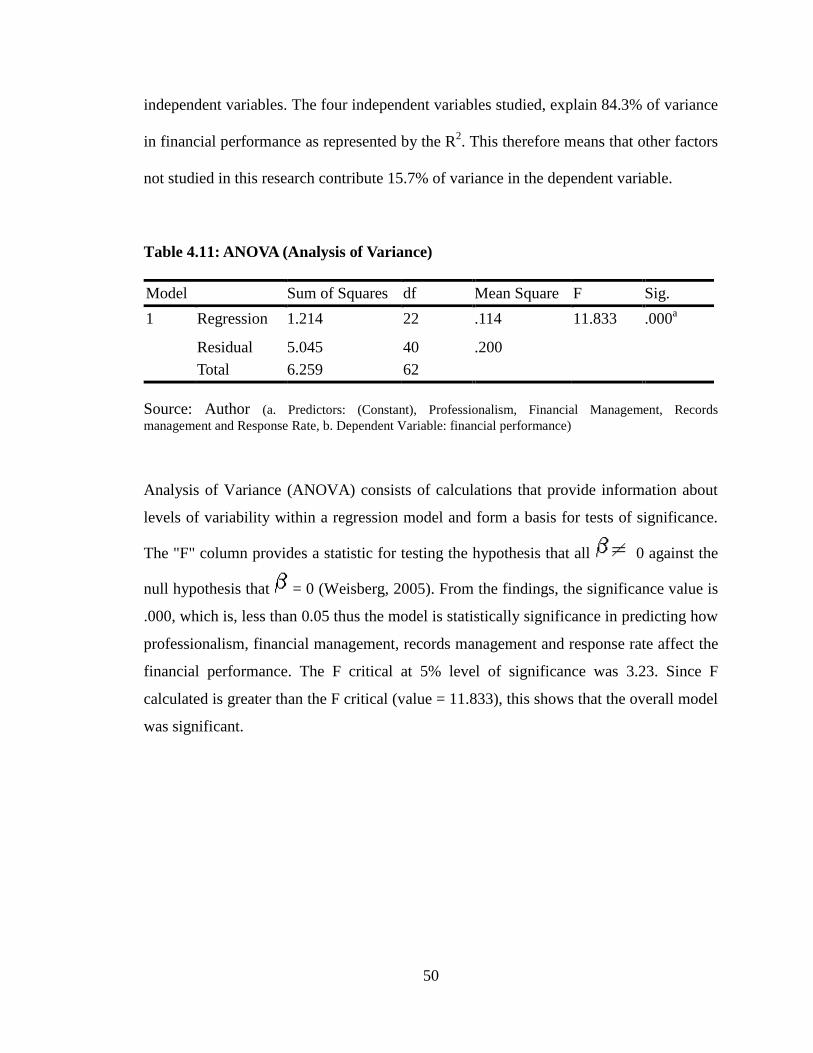
50
independent variables. The four independent variables studied, explain 84.3% of variance
in financial performance as represented by the R2. This therefore means that other factors
not studied in this research contribute 15.7% of variance in the dependent variable.
Table 4.11: ANOVA (Analysis of Variance)
Model Sum of Squares df Mean Square F Sig.
1 Regression 1.214 22 .114 11.833 .000a
Residual 5.045 40 .200
Total 6.259 62
Source: Author (a. Predictors: (Constant), Professionalism, Financial Management, Records
management and Response Rate, b. Dependent Variable: financial performance)
Analysis of Variance (ANOVA) consists of calculations that provide information about
levels of variability within a regression model and form a basis for tests of significance.
The "F" column provides a statistic for testing the hypothesis that all 0 against the
null hypothesis that = 0 (Weisberg, 2005). From the findings, the significance value is
.000, which is, less than 0.05 thus the model is statistically significance in predicting how
professionalism, financial management, records management and response rate affect the
financial performance. The F critical at 5% level of significance was 3.23. Since F
calculated is greater than the F critical (value = 11.833), this shows that the overall model
was significant.

51
Table 4.12: Multiple Regression Analysis
Model Unstandardized
Coefficients
Standardized
Coefficients
t Sig.
B Std.
Error
Beta B
(Constant) 3.374 .842 4.009 .000
Professionalism 0.842 .046 0.330 1.830 .001
Financial Management 0.656 .13 0.032 5.046 .0041
Records management 0.752 .88 0.167 8.545 .0015
Response Rate
0.705 .65 0.154 4.5779 .0022
Source: Author
From the regression findings, the substitution of the equation (Y = β0+ β1X1 + β2X2 +
β3X3+ β4X4) becomes: Y= 3.374+ 0.842X1+ 0.656X2+ 0.752X3+0.705X4
Where Y is the dependent variable (financial performance), X1 is the Professionalism
variable, X2 is the Financial Management variable, X3 is Records management variable
and X4 is the Response Rate variable. According to the equation, taking all factors
(professionalism, financial management, records management and response rate) constant
at zero, financial performance will be 3.374. The data findings also show that a unit
increase in professionalism will lead to a 0.842 increase in financial performance; a unit
increase in records management will lead to a 0.752 increase in financial performance; a
unit increase in financial management will lead to a 0.656 increase in financial
performance; and a unit increase in response rate will lead to a 0.705 increase in financial
performance. This means that the most significant factor is professionalism followed by
records management.

52
CHAPTER FIVE
SUMMARY OF FINDINGS, CONCLUSIONS AND RECOMMENDATIONS
5.1 Introduction
This chapter presents summary of findings as discussed in the previous chapter. From the
findings, conclusions and recommendations are discussed based on the objectives of the
study mainly to examine effects of public procurement procedures on financial
performance of profit making farmers’ cooperative societies in Kiambu County.
5.2 Summary of findings
From the findings, most of the profit making farmers’ cooperative societies in Kiambu
County implemented public procurement Act in the year 2010. The findings further
indicate that majority of profit making farmers’ cooperative societies in Kiambu County
had indeed performed well (financially) after Public Procurement and Disposal Act 2005
implementation.
From the findings, professionalism in implementation of public procurement procedures
ensures there is assessment of the procurement procedures; enhances accountability for
procurement decisions; enhances procurement planning and ensures management of
oversight over the procuring system in profit making farmers’ cooperative societies in
Kiambu County. Thus, professionalism in implementation of public procurement
procedures is significant determinant of financial performance. However the firms faces
difficulties operating in the existing organization structures; operational independence
and lack of oversight over the various procurement processes while abuse of the

53
procurement system by various parties, compromise on the intent and spirit of rules; as
well as high costs of ensuring professionalism in implementation of the procurement
procedures rarely affect them.
On financial management, majority of the profit making farmers’ cooperative societies in
Kiambu County faces difficulties in decision-making process leading to lost opportunities
for financial growth. However, they rarely face ineffective financial management system;
Lack of budget preparation capacity; Weak internal controls leading to income/asset
losses; inadequate capacity in accounting for revenue and assets as well as ineffective
internal and external oversight mechanisms during implementation of procurement
procedures. Thus, financial management in implementation of public procurement
procedures is a major determinant of financial performance.
From the findings most of the cooperative societies faces insecure record keeping and
comparison current and historical data while they rarely face keeping track of important
information; classification of data; lack of proper record keeping; Poor record keeping
leading to increased litigation risks; poor record keeping affecting effective management
decision making processes during implementation of procurement procedures. Thus,
records management in implementation of public procurement procedures is a
determinant of financial performance at a moderate extent.
From the findings, response rate in implementation of public procurement procedures
affect financial performance at a moderate extent. This is through low response rates
causing longer cycle times and high opportunity costs; failure to order through approved
suppliers due to low response rates thus increase in purchase prices/costs and; reduction
54
in the ability to negotiate lower prices due to low response rates. On the other hand, they
rarely face decreased control over the supply chain; inefficiencies arising from ordering
unapproved or nonessential items.
According to the regression equation, taking all factors (professionalism, financial
management, records management and response rate) constant at zero, financial
performance will be 3.374. The data findings also shown that a unit increase in
professionalism will lead to a 0.842 increase in financial performance; a unit increase in
records management will lead to a 0.752 increase in financial performance; a unit
increase in financial management will lead to a 0.656 increase in financial performance;
and a unit increase in response rate will lead to a 0.705 increase in financial performance.
This means that the most significant factor is professionalism followed by records
management.
5.3 Conclusions
From the findings, the study concluded that professionalism during implementation of
public procurement procedures is major determinant of financial performance.
Professionalism in profit making farmers’ cooperative societies in Kiambu County
ensures there is assessment of the procurement procedures; accountability for
procurement decisions; procurement planning and management of oversight over the
procuring system. However, the cooperative societies face difficulties operating in the
existing organization structures; operational independence and lack of oversight over the
various procurement processes. The study further concludes that financial management
during implementation of public procurement procedures determines financial

55
performance. Majority of the firms face difficulties in decision-making process leading to
lost opportunities for financial growth and rarely face ineffective financial management
system; lack of budget preparation capacity; weak internal controls leading to
income/asset losses. The study concluded that records management in implementation of
public procurement procedures determines financial performance at a moderate extent.
Most of the cooperative societies faces insecure record keeping and comparison current
and historical data while they rarely face keeping track of important information;
classification of data; lack of proper record keeping; Poor record keeping leading to
increased litigation risks; poor record keeping affecting effective management decision
making processes during implementation of procurement procedures.
In conclusion, response rate moderately influence financial performance during
implementation of public procurement procedures. The cooperative societies face low
response rates causing longer cycle times and high opportunity costs; failure to order
through approved suppliers due to low response rates thus increase in purchase
prices/costs and; reduction in the ability to negotiate lower prices due to low response
rates.
5.4 Recommendations
From the findings, the study recommended that profit making farmers’ cooperative
societies in Kiambu County should ensure proper competitive recruitment of the
procurement personnel. This will enhance professionalism in public procurement
procedures. Thus reducing weak professional oversight, abuse of the procurement
system; as well as high costs of professionalism in implementation of the procurement

56
procedures. There is a need for these societies to develop policies as well as systems to
ensure proper monitoring and evaluation of finances. Efficiency in strengthening of
procurement committee, tender committee, inspection and acceptance committee is
required in facilitation of decision-making process during implementation of procurement
procedures. This will ensure that weak internal controls, budget preparation anomalies,
inadequate capacity in accounting for revenue and assets as well as ineffective internal
and external oversight mechanisms challenges are avoided.
The study recommends that the cooperatives need to build up on good record keeping
methods that may include adoption of technology, data updating and classification. This
will lead to enhance effective management and keeping track of important information in
implementation of public procurement procedures, thus improved financial performance.
The study recommends proper adoption of response rate strategies, which incorporates
technology. Response time in procurement in consideration to competitive environment
includes lower procurement costs, faster cycle times, reduced maverick or unauthorized
buying, more highly organized information, and tighter integration of the procurement
function with key back-office systems. Efficiency will be realized through lower costs
(including the opportunity cost of time) in performing various facets of the purchasing
task. All these strategies aim at enhancing profitability of profit making farmers’
cooperative societies in Kiambu County

57
REFERENCES
Aldin, N., Brehmer, P.O., and Johansson, A. (2004). Business development with electronic
commerce: refinement and repositioning, Business Process Management Journal,
10 (1), 44-62.
Ansoff, H. I. and McDonnell, E. J. (1990). Implanting Strategic Management. 2nd
ed.
London: Prentice-Hall.
Arminas, D. (2002). Hidden dangers in global advance, Supply Management, 7(10) 14-15.
Arrowsmith, S. (2003). Transparency in government procurement: the objectives of
regulation and the boundaries of the World Trade Organisation , Journal of World
Trade, 37 (2), 283-303.
Atkinson, W. (2003). New buying tools present different ethical challenges, Purchasing,
132 (4) 27-30.
Barratt, M., Rosdahl, K. (2002). Exploring business-to-business market sites, European
Journal of Purchasing & Supply Management, 8 (2), 111-22.
Barrett, P. (2000). Balancing accountability and efficiency in a more competitive public
sector environment, Australian Journal of Public Administration, 59 (3), 58-71.
Bartezzaghi, E., Ronchi, S. (2004). A portfolio approach in the e-purchasing of materials
, Journal of Purchasing and Supply Management, 10 (3) 117-26.
Bartezzaghi, E., Ronchi, S. (2005). E-sourcing in a buyer-operator-seller perspective:
benefits and criticalities, Production Planning & Control, 16 (4)405-12.
Bauld, S., McGuinness, K. (2006). Value for money, Summit, No. 1, (l) 9 20-1.
Bolton, P. (2006). Government procurement as a policy tool in South Africa , Journal of
Public Procurement, 6 (3) 193-217.

58
Bradford, M. (2004). Claims outsourcing can benefit TPA clients, Business Insurance, 38
41, 24.
Brynjolfsson, E., and Smith, M. (2000). Frictionless commerce? A comparison of internet
and conventional retailers, Management Science, 46 (4) 563-85.
Chopra, S., Dougan, D., and Taylor, G. (2001). B2B e-commerce opportunities , Supply
Chain Management Review, 5 (3) 50-62.
Commonwealth Procurement Guidelines (2005). available at:
www.dofa.gov.au/ctc/docs/commonwelath-procurement-guidelines (accessed 22
April 2006).
Cooper, D.R & Schindler, P.S (2003). Business Research Methods. New York: Mc
Cummings, G., and Qiao, Y. (2003). The use of qualification-based selection in public
procurement: a survey research, Journal of Public Procurement, 3 (2) 215-26.
Erridge, A., and Henningan, S. (2007). Public procurement and social policy in Northern
Ireland: the unemployment pilot project , in Piga, P., Thai, K.V. (Eds),Advancing
Public Procurement: Practices, Innovation and Knowledge-sharing, Pr
Academics Press, Boca Raton.
Favre, D., Findlay, C., and Zaniker, J.C. (2004). The Case for Procurement Outsourcing,
available at: www.ascet.com (accessed October, 2004).
Gordon J. M. (2009). Public procurement strategy for accelerating the economic
recovery , Supply Chain Management: An International Journal, 14 ( 6) 429 – 434
Government of Tanzania (2001). “Public Procurement Act No. 3 of 2001”, Government
publication.
Gunasekaran, A. (2005). Benchmarking in public sector organisations , Benchmarking:
International Journal, 12 (4) 289-92.

59
Harris, L., Cohen, G. (2003). Marketing in the internet age: what can we learn from past?
, Management Decision, 4 (9) 944-56.
John, G. (2003b). The core conundrum , Supply Management, 8 (9) 20.
Kalin, S. (2000). Trading places , CIO Magazine, No. February, 15.
Kenya Anti-Corruption Commission, KACC (2009). Ministry of Roads Procurement
Review conducted between July 2007 and December 2008
Kiburi F. W. (2008). Factors Influencing The Implementation Of E-Procurement Among
Firms Listed On The Nairobi Stock Exchange. A Management Research Thesis of
the University of Nairobi
Kipchilat, G.T (2006). “An Evaluation of the Impact of the Public Procurement
Regulations on Procurement in Kenyan Public Universities.” Unpublished MBA
Project. Egerton University, Nakuru Kenya.
Kothari, C.R. (2000). Research Methodology. Vishwa Prakashan: New Delhi.
Leavy, B. (2001). Supply Strategy – what to outsource and where, Irish Marketing
Review, 14 (2) 46.
Lee, H., Whang, S. (2001). E-business and supply chain integration , Stanford Global
Supply Chain Management Forum, .
Lumpkin G T and Dess G G, (2001). Linking two dimensions of orientation to firm
performance: The moderating role of environment and life cycle . Journal of
Business Venturing, 16(5), 429-451

60
Lumpkin, G.T., and Dess, G.G. (2000). E-business strategies and internet business models:
how the internet adds value , Organizational Dynamics, 33 (2) 161-73.
MacGregor, R.C., and Vrazalic, L. (2005). The effects of strategic alliance membership on
the disadvantages of electronic-commerce adoption: a comparative study of
Swedish and Australian regional small businesses , Journal of Global Information
Management, 13 (3) 1-19.
McCue, C., and Prier, E. (2007). Using agency theory to model cooperative public
purchasing , in Piga, P., Thai, K.V. (Eds),Advancing Public Procurement:
Practices, Innovation and Knowledge-sharing, PrAcademics Press, Boca Raton,
FL, .
Min, H., and Galle, W.P. (2003). E-purchasing: profiles of adopters and nonadopters ,
Industrial Marketing Management, 32 (3), 227-33.
Mintzberg, H. (1988). Crafting strategy. Harvard Business Review, 66 (3), 71-90.
Morgan, J. (1995). You can outsource work – but not the worries, Purchasing, 118 (8) 17.
Mugenda, O. M and Mugenda, A. G. (1999). Research Methods: Quantitative and
Qualitative approaches. Nairobi, Acts Press.
Murray, J.G. (2000). Effects of a green purchasing strategy , Supply Chain Management:
An International Journal, 5 (1) 37-44.
Murray, J.G. (2001a). Local government and private sector purchasing: a comparative
study , European Journal of Purchasing and Supply Management,. 7 (2) .91-100.
Neef, D. (2001). e-Procurement from Strategy to Implementation, Financial Times
Prentice Hall, Harlow.
Nevalainen, A. (2001). The e-Business Dictionary, Rockbend Books, Alaska .

61
Ngechu M., (2004). Understanding the Research Process and Methods: An Introduction
to Research Methods Nairobi, Acts Press.
Nwabuzor, A. (2005). Corruption and development: new initiatives in economic
openness and strengthened rule of law, Journal of Business Ethics, Vol. 59 No.1,
.121-38.
Oanda, C. (2008). Significance of the Supplies Practitioners Management Act: Enactment
of a Legal Instrument that Regulates the Conduct of Supplies Management
Practitioners. Kenya Institute of Supplies Management Report
Obiero M. (2008). The Challenges in the Implementation Of The 2005 Procurement
Act On The Kenyan Ministry Of Higher Education, Science And Technology.
Office of Public Communications (19/02/2008). Roads Minister Performs Roads
Inspection Tour. Kenya government publication. Government Printers. Nairobi
Palmer, R.D., and Butt, A.H. (1985). Value for Money in the Public Sector, The Decision
Makers Guide, Basil Blackwell, Ltd, Oxford .
Petrie, M. (2001). Transparency and accountability in New Zealand: an assessment, Public
Sector Journal, 24 (1) 14-19.
Phillips, W., Caldwell, N., and Callender, G. (2007). Public procurement – a pillar of good
governance? , in Knight, L., Harland, C., Telgen, J., Thai, K.V., Callendar, C.,
McHen, H. (Eds),Public Procurement: International Case and Commentary,
Routledge, London, 138-48.
Porter, M.E. (1980). Competitive advantage. New York: Free press.
Porter, M.E. (2001). Strategy and the internet, Harvard Business Review, 79 (3) 62.
62
Public Procurement Oversight Authority. (2007) Assessment of the Procurement System
in Kenya. Ramboll Management. PPOA Manual.
Reason, M., Evans, E. (2000) Implementing e-Procurement, Hawksmere, London, .
Rebecca A., and Ravi N.(2007). Business-to-business e-procurement: success factors
and challenges to implementation , Supply Chain Management: An International
Journal, 12 ( 2) 104 – 115.
Rege, V. (2001). Transparency in government procurement: issues of concern and interest
to developing countries , Journal of World Trade, 35 (4) 485-515.
Reilly, B. (2000). e-Procurement: a blueprint for revolution or hype? , Gartner Advisory
Strategic Analysis Report, Gartner Group, 9 February.
Republic of Rwanda (2008). GoR PFM Reform Strategy (2008-2012) Government of
Rwanda publication. Kigali.
Robek, Brown, Stephens, (1995). Ten Business Reasons for Records Management in
Information and Records Management: Document-based Information Systems
Rothery, R. (2003). China's legal framework for public procurement , Journal of Public
Procurement, 3 (3) 370-89.
Scarpetta, S. (2003). The Sources of Economic Growth in OECD Countries, Organisation
for Economic Co-operation and Development, Paris.
Schofield, J.W. (2000). Increasing the generalisability of qualitative research , in Gomm,
R., Hammersley, M., Foster, P. (Eds),Case Study Method, Sage, London, 69-
97.
Simani, N. M. (2006). Examination into the Systems, Policies, Procedures and
Practices at the Ministry of Roads and Public Works alongside the Kenya Roads
Board. A 30 October 2006 report to News Editors.

63
Smith-Deighton, R. (2004). Regulatory transparency in OECD countries: overview,
trends and challenges , Australian Journal of Public Administration, 63,1, 66-73.
Soudry, O. (2007). A principal-agent analysis of accountability in public procurement ,
in Piga, P., Thai, K.V. (Eds),Advancing Public Procurement: Practices,
Innovation and Knowledge-sharing, PrAcademics Press, Boca Raton, FL, .
Tandoor, K.R., and Koehn, E.E. (2004). Construction and corruption in developing regions
, AACE International Transactions, 68-71.
Thai, K.V., and Drabkin, D.A. (2007). US Federal government procurement: structure,
process and current issues , in Knight, L., Harland, C., Telgen, J., Thai, K.V.,
Callendar, C., McHen, H. (Eds),Public Procurement: International Case and
Commentary, Routledge, London, .
Tudor, S. (2005). Benchmarking procurement, Summit, 8 (2) 17-19.
Venkatesan, R. (1992). Strategic sourcing: to make or not to make? , Harvard Business
Review, November-December, 70 (6) 98-107.
Warkentin, M. (2002). Business to Business-Electronic Commerce: Challenges and
Solutions, IRM Press, Hershey, Paris.
Zheng, J., Knight, L., Harland, C., Humby, S., and James, K. (2007). An analysis of
research into the future of purchasing and supply management , Journal of
Purchasing and Supply Management, 13 (1) 69-83.

64
Appendix I: Questionnaire
This questionnaire consists of two parts; kindly answer all the questions by ticking in the
appropriate box or filling in the spaces provided.
SECTION A: GENERAL INFORMATION
1. Of which committee are you a member?
Tender committee [ ]
Inspection and acceptance committee [ ]
Procurement committee [ ]
Disposal committee [ ]
2. When did your organization start implementing the public procurement Act of 2005?
(a) 2007 [ ]
(b) 2008 [ ]
(c) 2009 [ ]
(d) 2010 [ ]
(e) 2011 [ ]
(f) 2012 [ ]
(f) I don’t know [ ]
3. In your own view how would you rate the organization in terms of implementing the
Public Procurement and Disposal Act of 2005
(a) Very good [ ]

65
(b) Good [ ]
(c) Fair [ ]
(d) Poor [ ]
(e) Very poor [ ]
(f) I don’t know [ ]
4. In your view has the implementation of the procurement Act of 2005 affected the
Society’s financial performance?
Yes [ ]
No [ ]
Not sure [ ]
Don’t Know [ ]
If yes, to what extent?
Low extent [ ]
Moderate extent [ ]
Great extent [ ]
Very great extent [ ]
SECTION B: EFFECTS OF PUBLIC PROCUREMENT PROCEDURES ON THE
FINANCIAL PERFORMANCE OF THE CO-OPERATIVE SOCIETY

66
PROFESSIONALISM
5. To what extent does the need for professionalism in implementing public
procurement procedures affect the financial performance of the cooperative?
To a very great extent [ ]
To a great extent [ ]
To a moderate extent [ ]
To a little extent [ ]
To no extent [ ]
6. With regard to the following matters, to what extent does professionalism in the
implementation of procurement procedures affect financial performance of the
cooperative. Use a scale of 1 to 5 where 1 is to a very great extent and 5 is to no
extent.
Benefits
1 2 3 4 5
Enhances accountability for procurement decisions
Management of oversight over the procuring system
Enables capacity to be built in the user departments
Enhances procurement planning
Ensures there is assessment of the procurement procedures
during implementation

67
7. To what extent does the firm face the following challenges in the implementation of
public procurement procedures? Use a scale of 1 to 5 where 1 is to a very great extent
and 5 is to no extent
Challenges 1 2 3 4 5
Lack of oversight over the various procurement processes
Inadequate capacity to handle all types of procurements
necessary
Ambiguity in the powers and responsibilities of those
involved in the procurement process
Operational independence
Difficulties operating in the existing organization structures
Abuse of the procurement system by various parties
Inconsistent utilization of the procurement procedures for
various purchases
Compliance with procedural requirements
Compromise on the intent and spirit of rules
Ambiguities and gaps in the rules and procedures
Inefficiencies in implementation
High costs of ensuring professionalism in implementation of
the procurement procedures
Other (specify.........................................................)
FINANCIAL MANAGEMENT
8. To what extent does the need for enhanced financial management in the
implementation of public procurement procedures affect financial performance in
your firm?
To a very great extent [ ]
To a great extent [ ]
To a moderate extent [ ]
To a little extent [ ]
To no extent [ ]

68
9. To what extent does the organization face the following challenges in the
implementation of the public procurement procedures? Use a scale of 1 to 5 where 1
is to a very great extent and 5 is to no extent.
Challenges 1 2 3 4 5
Ineffective financial management system
Difficult decision making process leading to lost
opportunities for financial growth
Lack of budget preparation capacity
Weak internal controls leading to income/asset losses
Inadequate capacity in accounting for revenue and assets
Ineffective internal and external oversight mechanisms
Inadequate monitoring and reporting arrangements
Unclear links to procurement planning, budgets and strategy
Other (specify.........................................................)
RECORDS MANAGEMENT
10. To what extent does record management in the implementation of public procurement
procedures affect financial performance in your firm?
To a very great extent [ ]
To a great extent [ ]
To a moderate extent [ ]
To a little extent [ ]
To no extent [ ]
11. To what extent do the following records management challenges in the
implementation of public procurement procedures affect your firm’s financial

69
performance? Use a scale of 1 to 5 where 1 is to a very great extent and 5 is to no
extent
Challenges 1 2 3 4 5
Keeping track of important information
Classification or sorting out of data
Storage or archiving of data and records
Retrieving of the records and information
Poor technological infrastructure for record keeping
Insecure record keeping in safeguarding the firm records
Comparison between the current operations with historical
data
Failure of knowing when to place orders and amount of cash
required for purchases
Challenges of obtaining data in a timely and orderly manner
Lack of proper record keeping leading to increased operating
costs
Improper record keeping leading to low regulatory
compliance
Poor record keeping leading to increased litigation risks
Poor record keeping affecting effective management decision
making processes
Other (specify.........................................................)
RESPONSE RATES
12. To what extent do response rates in the implementation of procurement procedures
affect financial performance in your firm?
To a very great extent [ ]
To a great extent [ ]
To a moderate extent [ ]
To a little extent [ ]
To no extent [ ]

70
13. Rate the extent to which the following challenges are experienced in your firm? Use a
scale of 1 to 5 where 1 is to a very great extent and 5 is to no extent
Challenges 1 2 3 4 5
Inefficiency in procurement processes leading to low responses
rates and thus increased procurement costs
Failure to order through approved suppliers due to low response
rates thus increase purchase prices/costs
Low response rates cause longer cycle times and high opportunity
costs and re-order levels
Inefficiencies in the procurement system resulting to high error
rates
Reduction in the ability to negotiate lower prices due to low
response rates
Low response rates leading to losses due to lost investment
opportunities
Decreased control over the supply chain
Inefficiencies arising from by ordering unapproved or nonessential
items
Inefficiencies are experienced due to poor compliance with
corporate contracts leading to unnecessary administrative costs
THANK YOU!!
Related Documents