»/ /the effects of prebreaking on the efficiency of hammermill particle size reduction systems in feed manufacturing/ by ROGER L. SCHOLTEN B.S., University of Northern Iowa, 1972 M.B.A., University of New Haven, 1984 A MASTER'S THESIS submitted in partial fulfillment of the requirements for the degree MASTER OF SCIENCE Department of Grain Science and Industry KANSAS STATE UNIVERSITY Manhattan, Kansas 1985 Approved by: Major Professor

Welcome message from author
This document is posted to help you gain knowledge. Please leave a comment to let me know what you think about it! Share it to your friends and learn new things together.
Transcript
»/
/the effects of prebreaking on the efficiency
of hammermill particle size reduction systems
in feed manufacturing/
by
ROGER L. SCHOLTEN
B.S., University of Northern Iowa, 1972
M.B.A., University of New Haven, 1984
A MASTER'S THESIS
submitted in partial fulfillment of the
requirements for the degree
MASTER OF SCIENCE
Department of Grain Science and Industry
KANSAS STATE UNIVERSITY
Manhattan, Kansas
1985
Approved by:
Major Professor
^,0MM TABLE OF CONTENTS
£164 Page
c .«L
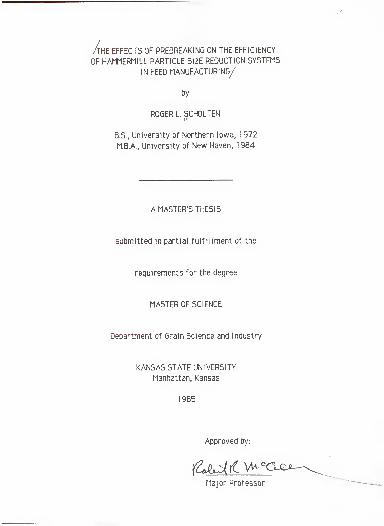
INTRODUCTION 1
PURPOSE OF THESIS 3
REVIEW OF LITERATURE 4
Reasons for Grinding 4
The Hammermill Grinder 5
Mechanics and Theory of Impact Grinding 5
Independent Variables Affecting Hammermill Performance . 8
Material Characteristic Factors 8
Hammer Design and Relationship Factors 9
Screen Design Factors II
Air Flow Factors 12
Various Other Design and Relationship Factors 13
Temperature Differential and Shrink 14
Temperature Differential 14
Shrink 15
Particle Size Measurement 15
Efficiency Designations 17
MATERIALS AND METHODS 18
Raw Materials and Equipment 18
Grain 13
Hammermill 18
Prebreaker 19
Sieve 20
Mixer 21
Analysis Procedures 21
Sampling 21
Temperature Analysis 22
Moisture Analysis 22
Particle Size Analysis 22
Procedural Methods 23
Hammermill Procedure 23
Prebreaking Procedure 24Sieving Procedure 24Compositing Procedure 24
Data Analysis 25Experimental Design 26
(continued)
TABLE OF CONTENTS (CONTINUED)
Page
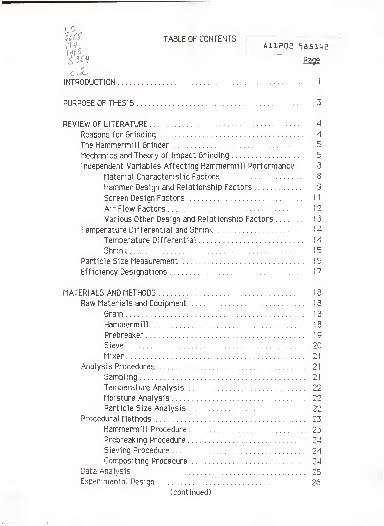
RESULTS AND DISCUSSION 26
Particle Size Produced 26
Grinding Efficiency 30
Production Rates 32
Temperature Differentials ~54
Moisture Analysis 36
CONCLUSION 39
ACKNOWLEDGEMENTS 40
LITERATURE CITED 41
APPENDIX A 44
APPENDIX B 45
APPENDIX C 46
APPENDIX D 47
APPENDIX E 50
APPENDIX F 51
APPENDIX G 52
APPENDIX H 53
LIST OF TABLES
Iable ms.
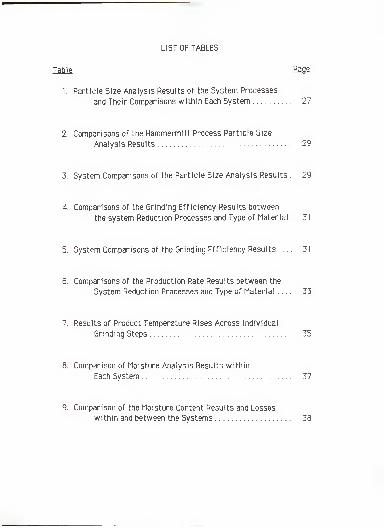
I. Particle Size Analysis Results of the System Processes
and Their Comparisons within Each System 27
2. Comparisons of the Harnmermill Process Particle Size
Analysis Results 29
3. System Comparisons of the Particle Size Analysis Results . 29
4. Comparisons of the Grinding Efficiency Results between
the system Reduction Processes and Type of Material . 3
1
5. System Comparisons of the Grinding Efficiency Results 3
6. Comparisons of the Production Rate Results between the
System Reduction Processes and Type of Material .... 3~5
7. Results of Product Temperature Rises Across Individual
Grinding Steps 35
8. Comparison of Moisture Analysis Results within
Each System 37
9. Comparison of the Moisture Content Results and Losses
within and between the Systems 38
INTRODUCTION
Grain processing is as old as man. Stone mills were the earliest form
of grinding machines. In its most primitive form, particle size reduction
was accomplished by pounding cereal grains between two stones using
human power. That process was followed by the use of a pair of circular
stones rotated by human power and, later by animal power. As civilization
progressed, water power, wind power, and steam power made possible the
use of larger and more powerful grinding machines. During this time,
energy efficiency was not an important factor and millers concentrated on
maximizing the available power and its accessibility.
In recent generations, electrically driven motors have become
universally applied within the grain processing industry. The formula feed
industry today has turned to almost exclusive use of the hammermill for
particle size reduction. There are many reasons for the hammermiU's wide
acceptance, but its greatest inherent advantage lies in its versatility. The
hammermill can produce a "finer" grind from a greater variety of raw
materials than any other machine. It must be mentioned, however, that
there is some argument for the use of a roller mill to more efficiently
produce a "coarser" grind of certain ingredients (Martin, 1983;
Heimann,l983).
The hammermill is also known to be one of the highest energy
consuming machines used within the feed industry. Electrical energy at
one time was inexpensive and little attention was paid to energy costs and
efficiency. The Arab oil embargo of 1973 changed that forever. Energy
costs, including electricity, skyrocketed dramatically and, since then,
have continued to increase and, are forecasted to continue to increase.
According to Energy Users News (1964), the price per million BTU's for
industrial electrical users averaged, in 1983 dollars, $10.94 in 1978,
$ 1 6.20 in 1 983, and is projected to rise to $ 1 7. 1 5 by 1 995.
Particle size reduction, in general, is not an efficient operation. How
efficiently the processing system performs its function is of vital
importance in saving limited resources. The objective of the industry
must be to minimize the amount of energy usage per unit processed, which
also makes good economical sense through the lowering of production
costs. That objective calls for an increased effort by machinery designers,
machinery manufacturers, and feed manufacturers to improve hammermill
performance through more efficient systems design and efficient energy
management.
Numerous variables affect hammermill performance and efficiency.
The variables include: raw material characteristics, hammer design and
tip speed relationship factors, screen design factors, air flow factors, and
various other design and relationship variables. These variables have been
studied in some detail, especially by equipment manufacturers, but further
research is needed in each area.
Most of the published studies focus on the hammermill as an entity
and not as part of a particle size reduction system. The utilization of a
hammermill within a grain processing system is a major area needing
unbiased scientific research.
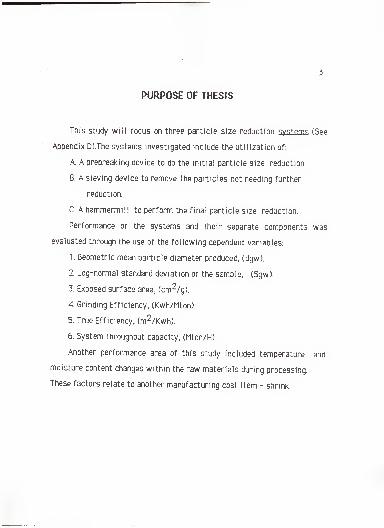
PURPOSE OF THESIS
This study will focus on three particle size reduction systems (See
Appendix D).The systems investigated include the utilization of:
A. A prebreaking device to do the initial particle size reduction.
B. A sieving device to remove the particles not needing further
reduction.
C. Ahammermill to perform the final particle size reduction.
Performance of the systems and their separate components was
evaluated through the use of the following dependent variables:
1. Geometric mean particle diameter produced, (dgw).
2. Log-normal standard deviation of the sample, (Sgw).
3. Exposed surface area, (cm2/g).
4. Grinding Efficiency, (Kwh/Mton).
5. True Efficiency, (m2/Kwh).
6. System throughput capacity, (Nton/H)
Another performance area of this study included temperature and
.
moisture content changes within the raw materials during processing.
These factors relate to another manufacturing cost item - shrink.
REVIEW OF LITERATURE
REASONS FOR GRINDING
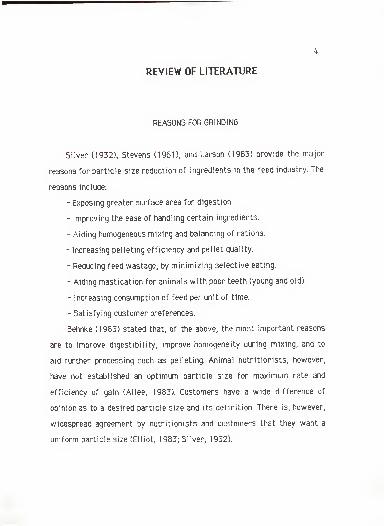
Silver (1932), Stevens (1961), and Larson (1983) provide the major
reasons for particle size reduction of ingredients in the feed industry. The
reasons include:
- Exposing greater surface area for digestion.
- Improving the ease of handling certain ingredients.
- Aiding homogeneous mixing and balancing of rations.
- Increasing pelleting efficiency and pellet quality.
- Reducing feed wastage, by minimizing selective eating.
- Aiding mastication for animals with poor teeth (young and old).
- Increasing consumption of feed per unit of time.
- Satisfying customer preferences.
Behnke (1983) stated that, of the above, the most important reasons
are to improve digestibility, improve homogeneity during mixing, and to
aid further processing such as pelleting. Animal nutritionists, however,
have not established an optimum particle size for maximum rate and
efficiency of gain (Allee, 1983). Customers have a wide difference of
opinion as to a desired particle size and its definition. There is, however,
widespread agreement by nutritionists and customers that they want a
uniform particle size (Elliot, 1983; Silver, 1932).
THE HAMMERMILL GRINDER
Hammermills consist of either fixed or free swinging hammers
mounted on a rotating shaft. Outside of and fully, or partially, enclosing
the hammers, is a perforated screen controlling the maximum particle size
to exit from the chamber. The perforations in the screen may vary
anywhere from .79 mm (1/32 in.) to 50.8 or more millimeters (two or
more inches).
According to Thomas (I960), reduction by the harnmerrnill is
accomplished by a combination of impact, sheer, and attrition. The
greatest proportion of particle size reduction is generally recognized to be
the result of particle impact. Impact takes place between the hammers and
the grain particles; and, subsequently, after the particle has been
accelerated by the hammers, impact occurs through striking the screen,
another stationary surface, or another particle.
MECHANICS AND THEORY OF IMPACT GRINDING
Rotating hammers and accelerated particles possess kinetic energy as
a result of their mass and velocity. The transfer of that energy into
breaking molecular bonds in materials with diverse physical properties
and the creation of new surface area is an extremely complex process. As
Beke (1964) explained, it is hardly surprising, under the circumstances,
that there should exist no law or formula of absolute accuracy and
reliability to define the mechanism of the process.
6
Various physical laws describing pulverization have been proposed by
Rittinger, Kick, Griffith and Bond (none specifically cited). Aspects of
these theoretical works have been discussed in the literature by Austin et
al. ( 1 964), Beke ( 1 964), Lowrison ( 1 974), and Pfost ( 1 976). Rumf ( 1 959)
probably best described the kinetic energy transfer into breaking bonds
through his treatise: Stress Theory of Impact Grinding.
Rumf (ibid) discussed the various impacts that occur, the resulting
stresses, and energy relationships. As explained by Lowrison (1974), when
two bodies impact, they compress each other until they have the same
velocity and remain in that state until restitution of compression begins.
The bodies, then, push each other apart and go their separate ways. The
restitution of compression takes an extremely short period of time to
complete; and, during that time, the particle is internally stressed with a
small portion of the original kinetic energy converted into strain energy.
The strain energy is released in the form of elastic restitution, plastic
deformation, crack formation and propagation, and ideally into new
surface area through surface rupture and particle fracture.
Friedrich (1959) described fracture as occuring when the localized
strain energy exceeds a critical surface energy limit which is a function
of the material. Rupture points requiring the least amount of energy occur
along lines of weaknesses. Those points consist of cracks, pores,
stratifications, and along cleavage planes.
The efficiency of generating new surface area through impact is
extremely low. Beke (1964) and Friedrich (1959) asserted that less than
one per cent of the input energy is used to create new surfaces. Austin et
al. (1964) stated that a maximum of less than three per cent is converted.
Thermal energy created by friction accounts for the greatest
proportion of energy output. Rumf (1959) and Beke (1964) estimated the
proportion of kinetic energy converted into thermal energy to be in excess
of 90 per cent, whereas, Friedrich (1959) quoted a figure of 99 per cent.
The thermal energy output occurs as heat absorbed by the machine, by the
air circulation, and by the product.
Impact grinding efficiencies also suffer from additional theoretical
and physical difficulties. Lowrison (1974) stated that, as particles
become smaller, there are fewer lines of weaknesses to attack and, also,
that there is a difficulty in isolating the smaller particles for impaction.
Austin et al. (1964) provided insight into the latter through their
mechanistic approach.
Ideally, during impact grinding, material would cease to be reduced as
soon as it reaches the desired particle size. Overgrinding takes place
because some material stays in the mill undergoing additional impacts
which results in a double problem of expending power needlessly and of
reducing material particles smaller than required. Another factor relating
to these problems is the possiblity of violent impacts with resulting
fracture into much smaller particles than is desirable. The creation of
fines is a recognized problem with impact grinding by the hammermill.
INDEPENDENT VARIABLES AFFECTING HAMMERMILL PERFORMANCE
There are many variables which affect the particle sizes generated,
their distribution, and overall grinding efficiency. The factors can be
catagorized as: raw material characteristics, hammer design and
relationships, screen design features, an air flow characteristic, and
various other design and relationship factors.
Material Characteristic Factors: Early studies have shown, and it is
generally recognized, that grinding energy requirements vary for the
different grains because of their wide variation in starch and fiber
composition. Silver (1932) found that corn (high relative starch content)
required less energy than barley, and barley required less energy than oats
(high relative fiber content). Baker (1960), confirmed by Stevens (1962),
found that sorghum was easier to grind than corn which, again, was easier
to grind than oats. Grains, therefore, can be placed into a grinding
efficiency spectrum based upon their starch to fiber composition. The
spectrum can be bounded by starchy, easy-to-grind, "nonfibrous and
friable" materials at one end, and the tough-to-grind, "fibrous and
nonfriable" materials at the other
.
Grain moisture content also plays a vital role in grinding capacity and
efficiency. Friedrich (1959) and Silver (1932) reported that capacity and
efficiency are inversely related to moisture content. Baker (1960)
confirmed that relationship and further stated that the magnitude of the
decrease in efficiency through an increasing moisture content varies
directly with grain fiber content.
Hammer Design and Relationship Factors: Increased numbers of
hammers and total hammer surface (width) will obviously cause an
increase in the no-load energy requirement and can ultimately affect net
efficiency. Fifteen hammers (3mm width) per 100 mm of rotor width was
found by Friedrich (1959) to be most desirable. That number can vary with
hammer width but not directly proportional to width. He also stated that
the arrangement of the hammers must allow a great enough time period
between hammers (also peripheral speed related) so that entering material
impacts on the hammer strike surface. Otherwise, a much less efficient
glancing blow with abrasion and slow impaction on stationary parts
results. He further stated that, if more than four groups of hammers are
used, the number of hammers per group must be reduced and the hammer
arrangement should be staggered.
A number of studies have dealt with hammer width. Friedrich (1959)
found a 15 % improvement in efficiency and capacity by going from an 8
mm (.31 in.) to a 3 mm (.1 18 in.) width hammer. Reducing the width from
3.2 mm (1/8 in.) to 1.6 mm (1/16 in.) results in an increase in efficiency
of 18 % for corn and 22 % for oats as reported by Baker (1960). Stevens
(1962) confirmed that, by going from 6.4 mm (1/4 in.) to 3.2 mm (1/8 in.)
to 1.6 mm (1/16 in.), an increase in grinding efficiency occurs at each
step. The magnitude of the increase was also found to be grain and
peripheral speed dependent. Neither of those two studies attempted to
keep the total hammer surface area equivalent, nor at all times, the
number of hammers equivalent, ft must also be noted that the magnitude of
the results are partially explained by the reduction in no-load
requirements.
10
The first major independent variable affecting "fineness" of grind,
power requirements, efficiency, and capacity is the peripheral speed of
the hammer tips. The revolving hammer provides the kinetic energy for
impact grinding. According to Friedrich (1959), there is an important
relationship between speed of rotation and capacity, efficiency, and
fineness of grind. Over the years, there has been a difference of opinion as
to ideal peripheral speed. Friedrich (1959) found that feed material
required a speed range of 4200 to 6600 meters per minute (13,780 to
21,653 ft/min). Speeds above 4572 m/min (15,000 ft/min) are sufficient
according to Silver (1932), with an ideal range of 2134 to 2743 m/min
(7000 to 9000 ft/min). Stevens (1962) reported that, if the objective is
grinding efficiency, peripheral speeds of 2158 to 3191 m/min (7080 to
10,470 ft/min) are the most desirable. Later analysis by Stevens, et al,
(1983) revealed that the optimum speed was 3200 m/min (10,500 ft/min)
based upon a "true efficiency" calculation. He further stated that an
optimum peripheral speed, as measured by "true efficiency", can be
determined and depends on the grain and screen perforation size.
All researchers agree that a slower speed produces a "coarser"
particle size.
The clearance between the hammer tip and the screen affects both
particle size and efficiency. An 8mm (.315 in.) gap was found by Friedrich
(1959) to be the optimum clearance for the various types of grain.
n
Screen Design Factors: The screen is the second major variable
affecting particle size and performance. It will control the maximum final
particle size of the product exiting from the grinding chamber. It is
understood that efficiency and capacity will increase as the screen
openings are enlarged.
Research by Friedrich (1959) initially showed this relationship. Baker
(I960) reported an average gain in production rate of 42 % when going
from a screen containing 2.38 mm (3/32 in.) to one containing 3.18 mm
(1/8 in.) openings. He further found an increase of 42 % going from 3.18
mm (1/8 in.) to 4.76 mm (3/16 in.), and a 35 % gain going from 4.76 mm
(3/16 in.) to 6.35 mm (1/4 in.). Stevens confirmed that general
relationship, in a reanalysis of his original studies using "true efficiency"
as a measure (Stevens, et al; 1983).
The percentage of open area within the screen has a direct effect on
capacity and efficiency. An initial study by Baker (1960) showed that, by
blanking one half of an 180° screen, grinding capacity and efficiency
decreased by 20 %. Westhusin (1983) provided greater insight during his
analysis using screens containing 18%, 27.3%, 41%, and 60.9% open areas.
He found direct linear relationships between the independent variable per
cent open area and the dependent variables of particle size,
(measured in Kg/Kwh) and true efficiency (measured in m2/Kwh).
12
Air Flow Factors- Air flow through the hammermill has been found to
be advantageous for optimum results. Air flow aids in controlling the
environment of the grinding chamber by reducing heat buildup and moisture
accumulations. It also provides a means of breaking the rotational pull on
materials by the rotating hammers. Finally, it assists particle movement
through the screen, thus reducing overgrinding and maintaining a more
uniform particle size.
Air flow can be the result of two independent actions. "Inherent" air
flow is created by the rotating hammers. "Induced" air flow is created by
external air moving devices, such as a separate motor driven fan, a
pnuematic conveying system, or a dust control exhaust system.
Friedrich ( 1 959) reported an optimum air volume of about 4000 cubic
meters per hour per square meter of screen surface (equivalent to 1.52
cubic feet per minute per square inch of screen surface [cfm/in2 ]).
Fan-aided product discharge was found by Baker (1960) to increase
production by an average of 12 % over non-assisted gravity discharge.
An examination of data generated by Stevens (1962) shows even
greater results. He compared a non-assisted system versus an air-assisted
system consisting of an induced air flow of 424 cfm (0.977 cfm/in2 )
measured at the fan. His analysis showed that the increase in efficiency
(measured in Ibs/kwh) averaged 49 % using a 2.38 mm (3/32 in.) screen, 53
% using a 3.18 mm (1/8 in.) screen, 12.4 % using a 4.76 mm (3/16 in.)
screen, and a 12.5% increase using a 6.35 mm (1/4 in.) screen. His
13
research showed a negligible gain, to a loss, in efficiency when the
induced air flow was further increased to 582 cfm (1.34 cfm/in2 ) .
Particle size was not found to be affected by the different air flows in his
research.
Olson (1983) stated that 1.25 cfm/in2 is optimal for maximum
production with a resulting improvement in capacity of 15 to 40 per cent.
According to Larson (1983), experience indicates that an air flow of 500
cfm per square foot of screen surface area (3.47 cfm/in2 ) should provide
the most efficient performance.
Various Other Design and Relationship Factors: Research by Friedrich
(1959) showed that tangential feeding into the hammer tips, which as a
zone possesses the highest kinetic energy level, provides 20 % greater
capacity and efficiency when compared to central feeding. The feed rate
should be as consistent as posssible and at, or near, the maximum
capacity of the machine. It is generally recognized that machinery running
at or near capacity performs its function most efficiently.
Westhusin (1983) found that screen hole design influences
hammermill performance. He found that a drilled hole, when compared to
the more commonly produced punched hole, produced a smaller mean
particle size, exposed more surface area, and produced a higher "true
efficiency".
It must be noted that one highly controllable factor affecting
efficiency is the mechanical condition of the hammermill and its wear
Ik
surfaces. Wear can be detected through lowered capacities and
efficiencies and, also, through the increased temperature of surfaces and
products.
TEMPERATURE DIFFERENTIALS AND SHRINK
As stated earlier, thermal energy is the main energy output of the
system. Heat generation increases moisture losses during grinding which
results in shrink. Overheated, moist products also present major problems
in both storage (condensation, mold, and freezing), and the flowability
from storage bins.
Temperature Differentials Research conducted by Baker (1960)
showed that product temperature rise is related to the material being
ground, the screen hole size, and the availability of air assistance.
Grinding oats through a 2.38 mm (3/32 in.) screen, non-fan-assisted,
resulted in a temperature rise of 13.3 °C (24 °F), while corn experienced a
temperature rise of 8.9 °C (16 °F). Air assistance resulted in temperature
rises of °C (0 °F) and 2.2 °C (4 °F), respectively. Using a larger screen
hole size, 6.35 mm (1/4 in.), corn showed a 2.2 °C (4 °F) for air-assisted
and a 2.2 °C (4 °F) to a 8.3 °C ( 10 °F) range (moisture content dependent)
for non-air-assisted.
Other reported temperature differential ranges include: Pfeiffer, et
el, (1983) with a normal rise of 5.6 to 8.3 °C (10 to 15 °F), Moy (date
unknown) with a range of 5 to 10 °C (9 to 18 °F), and Silver (1932) with a
range of 2.2 to 1 2.8 °C (4 to 23 ° F).
15
Shrink - Shrink caused by moisture losses has been attributed to heat
buildup (moisture bearing capacity of air doubles for every 1 1.2 °C (20 °F)
rise) and the method of conveying the material away. McEllhiney (1983)
discussed the results of studies conducted by Remen and Wolfe. They
reported moisture losses of .95 % to 1.10 % when grinding and
pnuematically conveying the ground corn. Remen also reported that the
system design (gravity drop into a bin, versus mechanical handling of
ground material, versus pneumatic handling of materials) makes a wide
difference in total per cent moisture loss. He also noted that an average
moisture loss of 1.20 % occurs when starting with greater than 15%
moisture corn and an .81 percentage loss occurs for less than 15%
moisture corn. Wolfe reported that shrink varies only slightly with screen
size ( 1 . 1 0% for 3. 1 8 mm [ 1 /8~] and 1 .05% for 476 mm [3/ 1 6"]).
PARTICLE SIZE MEASUREMENT
Researchers, producers, and customers historically have reported
fineness of grind based on appearance to them. Designations of "fine",
"medium", and "coarse" based on appearance are not precise and leave much
to personal judgement. More sophisticated techniques have been developed
using sieving on standard sieve sets. The simplest designation was stating
the upper and lower limits containing the material, e.g. -20 +80, or
stating the sieve through which the material will pass, e.g. -200 mesh.
16
The first standardized method of expressing particle size was
approved in 1940 by the American Society of Agricultural Engineers
(A5AE). The method was called the Method of Determining Modulus of
Uniformity and Modulus of Fineness of Ground Feed. The procedure involved
using a specified sieve set to separate the material into eight size
categories. Through calculation, a number based upon the per cent in each
category designated the Modulus of Fineness (relative particle size) and
three proportions described the Modulus of Uniformity (relative particle
size distribution).
That technique was limited in its applications and did not facilitate
the calculation of a number of more revealing parameters. Using
sophisticated mathematical analysis, Headley and Pfost (1966 and 1968)
developed performance parameters based upon a logarithmic normal
distribution. That analysis, again, was based upon the percentages retained
on specified screens. The method produces the geometric mean particle
size (measured in microns), the geometric log normal standard deviation
(a measure of size distribution variability), total surface area per gram
(cm2/gm), and the number of particles per gram. (See Appendix A & B). The
A.S.A.E. adopted this procedure in 1968 and entitled it: "Methods of
Determining and Expressing Fineness of Feed Materials by Sieving" (ASAE
1983) (ASAE Standard - S3 19). The calculations are fairly simple and
straight forward, but quite lengthy; so computer programs have been
developed to perform them.
17
EFFICIENCY DESIGNATIONS
Efficiency, as expressed by Stevens ( 1981 ), is any method of relating
the amount of work output to input. One method commonly used in the feed
industry is pounds or kilograms of ground material produced per
horsepower hour. It is a convenient way to express capacity, since it can
easily be related to a given hammermill motor.
Other efficiency expressions are based upon kilowatt hours of power
consumed. Reported descriptions include: Ibs/kwh, Kg/kwh, kwh/ton,
kwh/Mton (Appendix C), lbs/HPH, and Kg/HPH. Values for Kwh are easily
calculated by knowing amps consumed, voltage, the applicable power
factor, and motor efficiency. The formula is:
Kwh-[(amp)(volts)(power factorXmotor efficiency )( 1 .73)]/ 1 OOO
An efficiency rating in terms of square meters of new surface area
produced per watt hour was developed by Pfost and Headley (1971). They
used the total surface area previously calculated and the calculated
energy used in grinding to more accurately reflect the efficiency of the
reduction process. Their rating is referred to as "true efficiency", since it
relates both production and quality (fineness) to energy consumed
(Appendix C).
18
MATERIALS AND METHODS
RAW MATERIALS AND EQUIPMENT
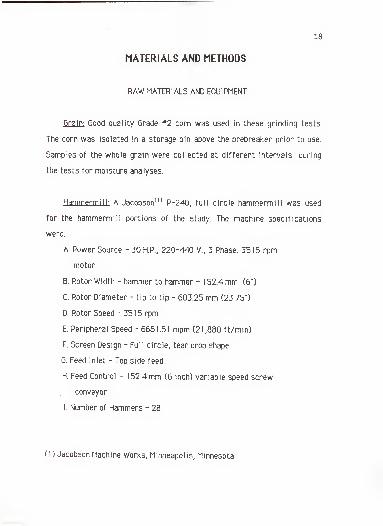
Grain: Good quality Grade *2 corn was used in these grinding tests.
The corn was isolated in a storage bin above the prebreaker prior to use.
Samples of the whole grain were collected at different intervals during
the tests for moisture analyses.
Hammermill- A JacobsonU) P-240, full circle harnmemnill was used
for the hammermill portions of the study. The machine specifications
were:
A. Power Source - 30 HP., 220-440 V., 3 Phase, 3515 rpm
motor
B. Rotor Width - hammer to hammer -1 52.4 mm (6")
C. Rotor Diameter - tip to tip - 603.25 mm (23.75")
D. Rotor Speed - 35 1 5 rpm
E. Peripheral Speed - 6661.51 mpm (21,380 ft/min)
F. Screen Design - Full circle, tear drop shape
G. Feed Inlet - Top side feed
H. Feed Control - 152.4 mm (6 inch) variable speed screw
conveyor
I. Number of Hammers - 28
( 1 ) Jacobson Machine Works, Minneapolis, Minnesota
19
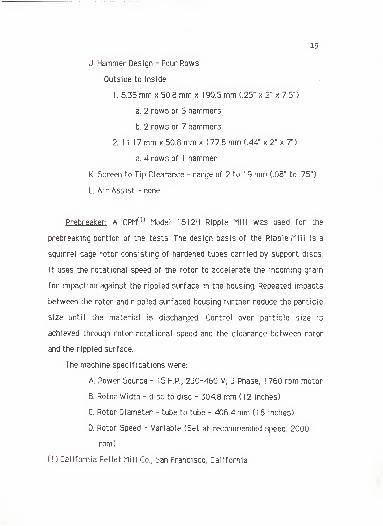
J. Hammer Design - Four Rows
Outside to Inside
1
.
6.35 mm x 50.8 mm x 1 90.5 mm (.25" x 2" x 7.5")
a. 2 rows of 5 hammers
b. 2 rows of 7 hammers
2. 1 1 . 1 7 mm x 50.8 mm x 1 77.8 mrn (.44" x 2" x 7")
a. 4 rows of 1 hammer
K. Screen to Tip Clearance - range of 2 to 19 mm (.08" to .75")
L. Air Assist - none
Prebreaker: A CPM(1) Model 1612H Ripple Mill was used for the
prebreaking portion of the tests. The design basis of the Ripple Mill is a
squirrel cage rotor consisting of hardened tubes carried by support discs.
It uses the rotational speed of the rotor to accelerate the incoming grain
for impaction against the rippled surface in the housing. Repeated impacts
between the rotor and rippled surfaced housing further reduce the particle
size until the material is discharged. Control over particle size is
achieved through rotor rotational speed and the clearance between rotor
and the rippled surface.
The machine specifications were:
A. Power Source -1 5 H.P., 230-460 V, 3 Phase, 1 760 rpm motor
B. Rotor Width - disc to disc - 304.8 mm ( 12 inches)
C. Rotor Diameter - tube to tube - 406.4 mm ( 16 inches)
D. Rotor Speed - Variable (Set at recommended speed: 2000
rpm)
( 1 ) California Pellet Mill Co., San Francisco, California
20
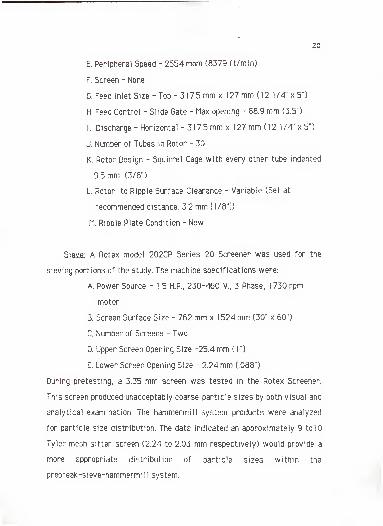
E. Peripheral Speed - 2554 mpm (8379 ft/min)
F. Screen - None
G. Feed Inlet Size -Top - 317.5 mm x 127 mm (12 1/4" x 5")
H. Feed Control - Slide Gate - Max opening - 88.9 mm (3.5")
I. Discharge - Horizontal - 3 1 7.5 mm x 1 27 mm ( 1 2 1/4" x 5")
J. Number of Tubes in Rotor - 30
K. Rotor Design - Squirrel Cage with every other tube indented
9.5 mm (3/8")
L. Rotor to Ripple Surface Clearance - Variable (Set at
recommended distance: 3.2 mm [1/8"])
li. Ripple Plate Condition - New
Sieve: A Rotex model 202CP Series 20 Screener was used for the
sieving portions of the study. The machine specifications were:
A. Power Source - 1.5 H.P., 230-460 V., 3 Phase, 1730 rpm
motor
B. Screen Surface Size - 762 mm x 1 524 mm (30" x 60")
C. Number of Screens - Two
D. Upper Screen Opening Size -25.4 mm (
1
")
E. Lower Screen Opening Size - 2.24 mm (.088")
During pretesting, a 3.35 mm screen was tested in the Rotex Screener.
This screen produced unacceptably coarse particle sizes by both visual and
analytical examination. The hammermill system products were analyzed
for particle size distribution. The data indicated an approximately 9 to 10
Tyler mesh sifter screen (2.24 to 2.03 mm respectively) would provide a
more appropriate distribution of particle sizes within the
prebreak-sieve-hamrnermill system.
21
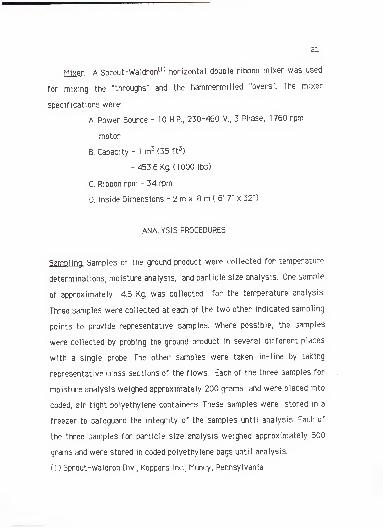
Mixer: A Sprout-WaldronU) horizontal double ribbon mixer was used
for mixing the "throughs" and the hammermilled "overs". The mixer
specifications were:
A. Power Source -1 H.P., 230-460 V., 3 Phase, 1 750 rpm
motor
B. Capacity -1 m3 (35 ft
3)
- 453.6 Kg. ( 1 000 lbs)
C. Ribbon rpm - 34 rpm
D. Inside Dimensions - 2 m x .8 m (6' 7" x 32")
ANALYSIS PROCEDURES
Sampling: Samples of the ground product were collected for temperature
determinations, moisture analysis, and particle size analysis. One sample
of approximately 4.5 Kg. was collected for the temperature analysis.
Three samples were collected at each of the two other indicated sampling
points to provide representative samples. Where possible, the samples
were collected by probing the ground product in several different places
with a single probe. The other samples were taken in-line by taking
representative cross sections of the flows. Each of the three samples for
moisture analysis weighed approximately 200 grams and were placed into
coded, air tight polyethylene containers. These samples were stored in a
freezer to safeguard the integrity of the samples until analysis. Each of
the three samples for particle size analysis weighed approximately 500
grams and were stored in coded polyethylene bags until analysis.
(I) Sprout-Waldron Div., Koppers Inc., Muncy, Pennsylvania
22
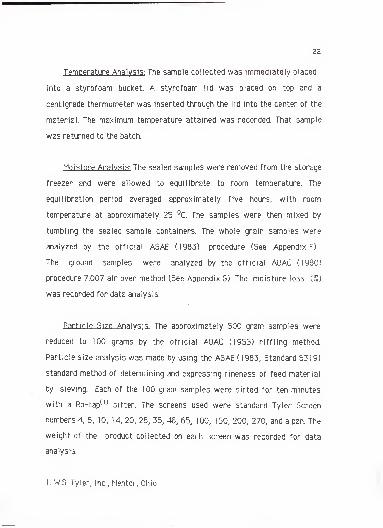
Temperature Analysis: The sample collected was immediately placed
into a styrofoam bucket. A styrofoam lid was placed on top and a
centigrade thermometer was inserted through the lid into the center of the
material. The maximum temperature attained was recorded. That sample
was returned to the batch.
Moisture Analysis: The sealed samples were removed from the storage
freezer and were allowed to equilibrate to room temperature. The
equilibration period averaged approximately five hours, with room
temperature at approximately 25 °C. The samples were then mixed by
tumbling the sealed sample containers. The whole grain samples were
analyzed by the official ASAE (1983) procedure (See Appendix F) .
The ground samples were analyzed by the official AOAC (1980)
procedure 7.007 air oven method (See Appendix G). The moisture loss (%)
was recorded for data analysis.
Particle Size Analysis- The approximately 500 gram samples were
reduced to 100 grams by the official AOAC (1955) riffling method.
Particle size analysis was made by using the ASAE (1983, Standard S3 19)
standard method of determining and expressing fineness of feed material
by sieving. Each of the 100 gram samples were sifted for ten minutes
with a Ro-tap(n sifter. The screens used were standard Tyler Screen
numbers 4, 6, 10, 14, 20, 28, 35, 48, 65, 100, 150, 200, 270, and a pan. The
weight of the product collected on each screen was recorded for data
analysis.
I. W.S. Tyler, Inc., Mentor, Ohio
23
PROCEDURAL METHODS
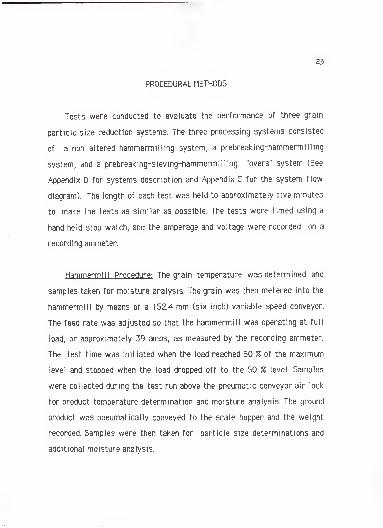
Tests were conducted to evaluate the performance of three grain
particle size reduction systems. The three processing systems consisted
of a non altered hammermilling system, a prebreaking-harnmermilling
system, and a prebreaking-sieving-harnmermilling "overs" system (See
Appendix D for systems description and Appendix E for the system flow
diagram). The length of each test was held to approximately five minutes
to make the tests as similar as possible. The tests were timed using a
hand held stop watch, and the amperage and voltage were recorded on a
recording ammeter.
Hammermill Procedure: The grain temperature was determined and
samples taken for moisture analysis. The grain was then metered into the
hammermill by means of a 152.4 mm (six inch) variable speed conveyor.
The feed rate was adjusted so that the hammermill was operating at full
load, or approximately 39 amps, as measured by the recording ammeter.
The test time was initiated when the load reached 50 % of the maximum
level and stopped when the load dropped off to the 50 % level. Samples
were collected during the test run above the pneumatic conveyor air lock
for product temperature determination and moisture analysis. The ground
product was pneumatically conveyed to the scale hopper and the weight
recorded. Samples were then taken for particle size determinations and
additional moisture analysis.
zk
Prehreaking Procedure: The ingoing grain temperature was determined
and samples collected for moisture analysis. The feed rate to the
prebreaker was controlled by the use of the slide gate at the throat
opening. The slide gate position was adjusted so that the prebreaker was
operating at full load or approximately 19 amps as measured by the
recording ammeter. The time was started when the load at the start
reached the 50 % level and stopped when the load dropped to the 50 %
level. The material was discharged into and collected in a bin hopper
located at the side and below the prebreaker. Immediately upon completion
of the test run, the product temperature was determined; and the samples
for moisture analysis were taken. Additional samples were then taken for
particle size determination.
Sieving Procedure- The prebroken grain was metered into the sieve by
means of a 152.4 mm ( six inch) variable speed screw conveyor. The test
time was initiated when the product first entered the sieve and stopped
when the last product entered the sieve. The "overs" from the 2.24 mm
(.088 inch) screen were pneumatically conveyed to a bin above the
hammermill. The "throughs" were pneumatically conveyed to the scale
hopper, the weight recorded, and discharged into the mixer. Samples of the
"overs" and "throughs" were taken in-line, prior to conveying, for moisture
analysis and particle size determination.
Composite; The "throughs" from the sieve and the hammermilled
"overs" were mixed for three minutes in a ribbon mixer. Samples were then
taken for moisture analysis and particle size determination.
25
DATA ANALYSIS
The raw data were collated and the calculations performed using a
spreadsheet software program. Generated data included:
A. Particle Size Analysis:
1. Geometric mean particle size - dgw (Appendix A)
2. Geometric log-normal standard deviation - Sgw (Appendix A)
3. Total surface area per gram - crn2/g (Appendix B)
4. Number of particles per gram (Appendix B)
B. Grinding Efficiencies
:
1. Kilowatt hours per metric ton Kwh/Mton (Appendix C)
2. Kilograms produced per horsepower hour - Kg/HPH
5. True Efficiency - m2/Kwh (Appendix C)
C. Production Rates:
1. Capacities in tons produced per hour - T/H
2. Capacities in metric tons produced per hour - Mton/H
D. Temperature Differentials:
1. Prebreaker product in degrees centigrade - °C
2. Hamrnermill product in degrees centigrade - °C
E. Moisture Analysis Data:
1. Per cent changes - % (Appendix F & G)
An average amperage and voltage reading was determined from the
recording ammeter and used for the calculations. A power factor of .90 and
a motor efficiency factor of .90 was used for all calculations. (See
Appendix H for examples of computer generated output)
26
Aspects of the generated data were then analyzed using a Statistical
Analysis System (SAS)(1).
EXPERIMENTAL DESIGN
The statistical design of the system comparisons was a randomized
design consisting of three treatments and three replications.
RESULTS AND DISCUSSION
PARTICLE SIZES PRODUCED
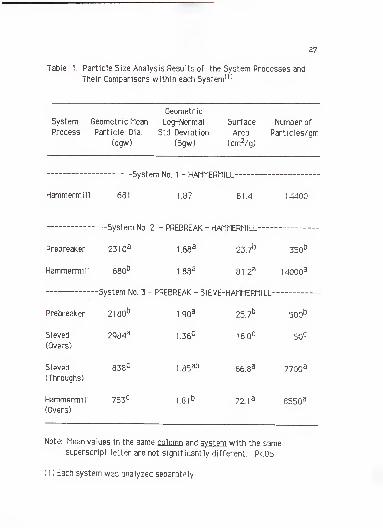
The particle size analysis results of the individual system processes
are shown in table I. The prebreaker-hamrnermill system results indicate
that the prebreaker produces a significantly larger geometric mean
particle size, a smaller generated surface area per gram, and a smaller
number of generated particles per gram than the harnrnerrnill produces.
Similar geometric log-normal standard deviations were produced by these
systems.
Significant differences were observed when comparing the products
from the four processing steps within the prebreaker-sieve-harnrnermill
sytern. The overs from sieving the prebreaker product possess a
significantly larger average mean diameter and the throughs possess a
significantly smaller mean diameter when compared to the prebreaker
product. The weight ratio of overs to throughs produced from the sieving
(I)SAS Institute, 1979)
27
Table 1. Particle Size Analysis Results of the System Processes and
Their Comparisons within each System11
)
Geometric
System Geometric Mean Log-Normal
Process Particle Dia. 5td. Deviation
(dgw) (Sgw)
Surface
Area
(cm2/g)
Number of
Particles/gm
Hammermill
-System No. 1- HAMMERMILL-
681 1.87 81.4 4400
-System No. 2 - PREBREAK - HAMMERMILL-
Prebreaker
Hammermill
Prebreaker
Sieved
(Overs)
Sieved
(Throughs)
Hammermill
(Overs)
2310a
680 1
1.88a
1.88a
2Z.T
31.2*
-System No. 3 - PREBREAK - 5IEVE-HAMMERMILL-
2180 [
2984a
838c
753 (
1.90*
.36c
.85
1.81
ab
25.7 1
6.0C
66.8a
72.
350 L
!4000'
500 c
50c
7700a
8550a
Note: Mean values in the same column and system with the samesuperscript letter are not significantly different. P<.05
( 1 ) Each system was analyzed separately.
28
process (2.24 mm screen) was approximately 2:1. The sieved throughs and
the product from hammermilling the sieved overs were statistically
(P<.05) equivalent across the four particle size analysis parameters
shown in the table. There was an indication, however, by visually
comparing the product retained on the upper sieves during sieve analysis
and by comparing the two averages in the table, that the throughs were
slightly coarser and have a slightly larger calculated mean diameter than
the hammemnilled overs.
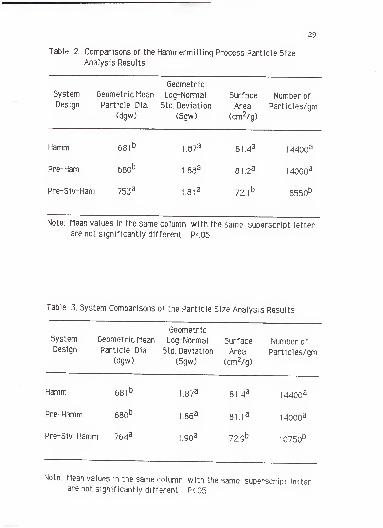
The particle size comparisons of the products produced by the
hammermill within each system is shown in table 2. The results indicate
that the product produced by straight hammermilling and the product
produced by prebreaking and then hammermilling are equivalent across the
particle size parameters. When the overs from the sieve were ground, a
significantly larger particle size was produced, a smaller total surface
area and a reduced total number of particles per gram were produced
than were generated by hammermilling whole or prebroken corn. This
result may be due to the removal of the soft endosperm through
prebreaking and sieving, thus producing overs with a high percentage of
the "harder to grind" horny endosperm remaining to be milled.
The particle size analysis results and the comparisons of the
products produced by each system are shown in table 3. There were no
significant differences in analytical results between the products
produced by the hammermill system and the prebreaker -hammermill
system. The prebreaker-sieve-harnmermiil system did result in significant
differences in the data when compared to the other two systems. There
29
Table 2. Comparisons of the Hammermilling Process Particle Size
Analysis Results
Geometric
System Geometric Mean Log-Normal Surface Number of
Design Particle Dia. Std. Deviation Area Particles/gm
(dgw) (Sgw) (cm2/g)
Hamm 681 b1.87
a81.4a 1 4400a
Pre-Ham 680b 1.88a
81.2a 14000a
Pre-5iv-Ham 753a 1.81a
72.
1
b 8550b
Note: Mean values in the same column with the same superscript letter
are not significantly different. P<.05
Table 3. System Comparisons of the Particle Size Analysis Results
GeometricSystem Geometric Mean Log-Normal Surface Number ofDesign Particle Dia. Std. Deviation Area Particles/gm
(dgw) (Sgw) (cm2/g)
Hamm 681 b1.87
a81.4a 14400a
Pre-Hamm 680b 1.86a 81. l
a1 4000a
Pre-Siv-Hamm 764a 1.90a
72.9b 10750b
Note: Mean values in the same column with the same superscript letterare not significantly different. P<.05
30
was a higher average mean particle diameter, a lower generated surface
area, and a reduced number of particles produced per gram in this system.
The higher mean particle size was due to compositing the throughs and
the hamrnermill overs, which both have relatively higher mean particle
diameters than produced from harnmermilling the whole or prebroken corn.
Grinding Efficiency
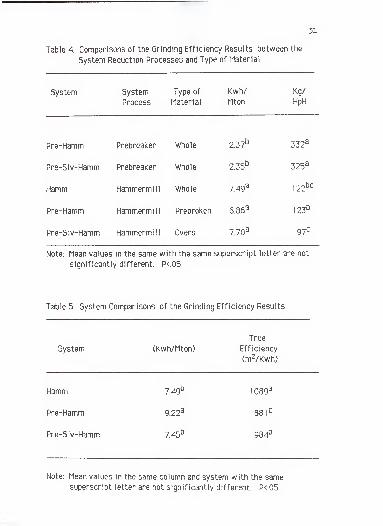
The grinding efficiency results of the individual reduction processes
are shown in table 4. Comparing the efficiency results between the
prebreaker and the hamrnermill within the prebreak-hammermill system
and the prebreak-sieve-harnrnermill system, shows that the prebreaker
was significantly more efficient in both kilowatt hours consumed per
metric ton produced and in kilograms of product produced per
horsepower hour. The
kg/hph results for the two systems containing the prebreaker are useful
for the designing of balanced systems, so that each piece of processing
equipment is running under full load where it performs most efficiently.
The kwh/Mton comparisons of the hamrnermill processing steps
indicate trends between the systems but not statistically significant
(P<.05) differences. The trends indicate that it takes more energy (kwh)
per metric ton to grind the sieved overs (7.70 kwh), than whole corn (7.49
kwh), or than prebroken corn (6.86 kwh).
The three systems" efficiency data, calculated through accumulating
all processing energy consumed within the particular system, and the
comparisons between each system are shown in table 5. The hamrnermill
system and the prebreak-sieve-harnrnermill system are equivalent in
efficiency when measured by kwh/Mton.
31
Table 4. Comparisons of the Grinding Efficiency Results between the
System Reduction Processes and Type of Material
System System
Process
Type of
Material
Kwh/
Mton
Kg/
HpH
Pre-Hamm Prebreaker Whole
Pre-Siv-Hamm Prebreaker Whole
Hamm
Pre-Hamm
Hammermill Whole
Pre-Siv-Hamm Hammermill Overs
2.37 L
2.35b
7.49 e
Hammermill Prebroken 6.86a
7.70a
332a
325a
122
123 [
97 l
be
Note: Mean values in the same with the same superscript letter are not
significantly different. P<.05
Table 5. System Comparisons of the Grinding Efficiency Results
System
True
(Kwh/Mton) Efficiency
(m2/Kwh)
7.49b 1089a
9.22a 881 c
7.45b 984b
Hamm
Pre-Hamm
Pre-Siv-Hamm
Note: Mean values in the same column and system with the samesuperscript letter are not significantly different. P<.05
32
The prebreak-harnmermill system consumed significantly more energy by
almost two kwh per metric ton (a 23% difference) than the other two
systems. The energy consumed by the prebreaker is not overcome in this
system by the slight reduction of the energy consumed by the hammemnill
when compared to straight hammermilling.
When the particle size produced by each system was factored into a
true efficiency measurement, all three syterns have significantly different
efficiency ratings. The hammermill system had the highest true efficiency
rating. Though the prebreak-sieve-hammermill system was equivalent in
energy consumed per metric ton, this system had a lower true efficiency;
since, it produces a significantly larger average mean diameter particle
size. This difference in the true efficiency measurements between these
two systems may not be relevant in feed manufacturing if the higher
average diameter particle size is acceptable.
The prebreak-harnmermill system had the lowest true efficiency
rating. This system produces equivalent average mean particle sizes when
compared to the hammermill system, but consumes significantly more
energy as previously discussed.
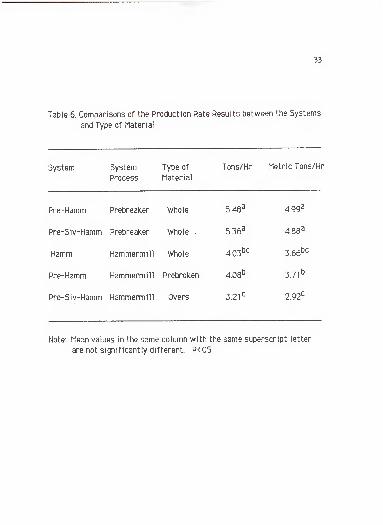
Production Rates
The production rates in metric tons per hour for the milling
equipment utilized thoughout the tests and the equipment comparisons are
shown in table 6. The prebreaker gave a significantly higher production
rate when compared to the hammermill in each of the three systems. A
through-put trend was indicated when comparing the hammermill
33
Table 6. Comparisons of the Production Rate Results between the Systems
and Type of Material
System System
Process
Type of
Material
Tons/Hr Metric Tons/Hr
Pre-Hamm Prebreaker Whole
Pre-Siv-Hamm Prebreaker Whole
Hamm Hammermill Whole
5.48d
5.36a
4.03be
499d
488a
3.66bc
Pre-Hamm Hammermill Prebroken 4.08£ 3.711
Pre-Siv-Hamm Hammermill Overs 3.21' 2.921
Note: Mean values in the same column with the same superscript letter
are not significantly different. P<.05
3^
production rates between the three systems. The rate of output from
hammermilling prebroken corn was slightly higher (3.71 Mton/Hr) than
hammermilling whole corn (3.66 Mton/Hr) which, in turn, was higher than
hammermilling overs (2.92 Mton/Hr). However, the data shows an
insignificant improvement in the production rate of the hammerrnill by
prebreaking the corn prior to hammermilling.
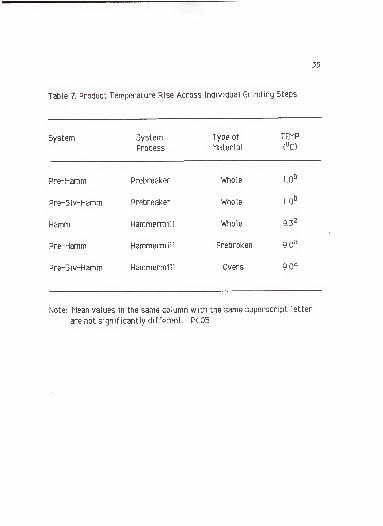
Temperature Differentials
The product temperature rises during grinding with the particle size
reduction equipment are shown in table 7. The prebreaker showed only a
one degree (C) rise in this installation. This low temperature rise is due to
a significantly larger average diameter particle size produced by the
prebreaker and considering that there is a lack of a screening/sizing
device to entrap particles for repeated impacts and subsequent heat
generation. The prebreaker product temperature rise may also have been
affected by the installation design. The product was thrust by the
prebreaker into a large collecting/holding bin. This factor may have
allowed the heat to be dissipated immediately after grinding, lowering
product temperature prior to temperature sample collection.
The hammerrnill consistently produced a product temperature
differential of nine degrees centigrade. The data indicate that there was
no effect on the temperature differentials by the form of material being
milled by the hammerrnill. The temperature differential produced by the
hammerrnill in these systems is consistent with the data previously
reported in the literature review (Moy, date unknown; and Silver, 1932).
35
Table 7. Product Temperature Rise Across Individual Grinding Steps
System System
Process
Type of
Material
TEMP
(°C)
Pre-Hamm Prebreaker Whole 1.0b
Pre-Siv-Hamm Prebreaker Whole 1.0b
Hamm Hammermill Whole 9.3a
Pre-Hamm Hammermill Prebroken 9.0a
Pre-Siv-Hamm Hammermill Overs 9.0a
Note: Mean values in the same column with the same superscript letter
are not significantly different. P<.05
36
Moisture Analysis
The analytical moisture results and the comparisons within each
system are shown in table 8. The first significant feature noted was that,
in each system, the greatest loss of moisture occured at the first milling
step. This result was true whether prebreaking or hammermilling was the
first reduction process. Each system, also, showed a moisture loss trend
continuing after the initial loss, but not significant (P>.05) losses
between the steps. As expected, in most cases, loss of moisture occurred
during pneumatic conveying of the products.
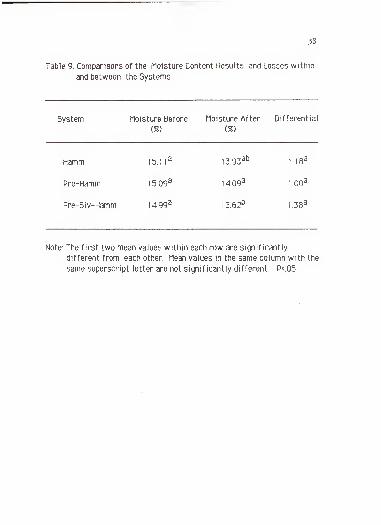
The total moisture loss by the processing systems and the moisture
loss comparisons between systems are shown in table 9. The differentials
between the three systems showed a definite trend, though not a
significant (P>.05) difference in these experiments. Additional data would
be needed to confirm significant differences between the systems. The
prebreak-sieve-hammermill system showed the greatest loss of
moisture (1.38%). This may be due to the number of processing and
conveying steps within the system. The hammermill systems relatively
higher loss (1.18%), compared to the prebreak-hammermill system (1.00%),
may be due to the higher temperatures generated at the first milling step
where the greatest moisture losses take place in each system.

Table 8. Comparison of Moisture Analysis Results within each System37
System
No. 1 HAMM
Component/Step
Whole Corn
Hammermill
Conveying
Moisture Differential
15.1 r
3.97 1
13.93s
.14
.04
No. 2 PRE-HAMM Whole
Prebreaker
Hammermill
Conveying
1 5.09a
4.141
14.13[
409 L
.95
.01
.04
No. 3 PRE-S1V-HAMM Whole
Prebreaker
Sieved (Overs)
Conveyed (Overs)
Hammermill (Overs)
Conveyed (Hamm)
Sieved (Throughs)
Conveyed (Throughs)
Composite (Thru&Hamm)
1 499a
13.92b
13.64b
13.66b
13.78b
1 3.66b
407 [
13.91b
13.62b
-1.07
+.02
+.12
-12
-.16
Note: Mean values in the same column and system with the same
superscript letter are not significantly different. P<.05
38
Table 9. Comparisons of the Moisture Content Results and Losses within
and between the Systems
System Moisture Before
(%)
Moisture After Differential
(%)
Hamm 15. 3.933D
18c
Pre-Hamm 15.09* 409* 1.00'
Pre-5iv-Hamm 1499' 3.62b 1.38'
Note: The first two mean values within each row are significantly
different from each other. Mean values in the same column with the
same superscript letter are not significantly different. P<.05
39
Conclusion
This study indicates that there is no performance advantage at this
stage of Ripple Mill development to design a particle size reduction
system that includes this particular prebreaker. The hammermill system
produces an equivalent, or slightly smaller, average diameter particle size
when compared to the two systems containing the prebreaker. The
hammermill system performs equivalently or better than the other two
systems when comparing system efficiencies in both Kwh/Mton and true
efficiency.
The prebreaker did not increase the production rate of the
hammermill in this system enough to sufficiently warrant a prebreaker
installation directly prior to the hammermill, even if energy efficiencies
are ignored. Installing a properly sized prebreaker and sieve system prior
to an already installed hammermill could provide a system that produces
at a higher production rate for the given sized hammermill. This type of
system would produce product at a slightly higher mean diameter particle
size and would perform equivalently in energy efficiency. There were no
prebreaker effects on the product temperature rises during hammermilling
nor were there significant improvements in moisture retention, providing
for a reduction in shrink losses during manufacturing.
ko
ACKNOWLEDGEMENTS
I wish to express my sincere appreciation and gratitude to Professor
Robert R. McEllhiney for his valuable counsel, encouragement, and guidance
thoughout the course of my graduate studies. Sincere thanks are also
extended to Dr. Charles W. Deyoe, Head of the Department of Grain Science
and Industry for serving on the Advisory Committee, along with Dr. Keith
C. Behnke and Dr. Robert Wilcox.
Thanks are also due to Mr. Donald Duncan for his many hours spent
installing the equipment and the KSU feed mill crew for their assistance
and understanding thoughout my research. Mr. Stuart Martin's able
assistance in the running of the pilot plant experiments was greatly
appreciated. Thanks are also extended to the other faculty members for the
encouragement and friendship extended to this older student.
Finally, the author wishes to express sincere appreciation for the
love, understanding and moral support that his wife Valerie, his son Keith
and his daughter Jennifer have given him during the course of his work.
They deserve most of the credit for what the author has accompished.
LITERATURE CITED
American Society of Agricultural Engineers, 1983. Method of Determining
and Expressing Fineness of Feed Materials by Sieving. Agricultural
Engineers Yearbook. ASAE S3 1 9, pp. 325-326.
American Society of Agricultural Engineers, 1983. Moisture Measurement
- Grains and Seeds. Agricultural Yearbook. ASAE S352 p. 328.
Association of Official Analytical Chemists, 1980. Animal Feed- Drying at
135 °C. AOAC 13 th Edition. AOAC 7.007, p. 125.
Allee, G.L., 1983. The Effect of Particle Size of Cereal Grains on
Nutritional Value for Swine. Proceedings of the First International
Symposium on Particle Size Reduction in the Feed Industry. Kansas
State University, Manhattan Kansas, p. D-l.
Austin, L.G. and R.R. Klingpel, 1964 The Theory of Grinding Operations.
Industrial and Engineering Chemistry, 56:0 1), pp. 13-29.
Baker, R.J., 1960. Factors that Affect the Granulation and Capacity in
Grinding Corn, Oats, and Sorghum Grain with a Hammermill. Master's
Thesis. Kansas State University, Manhattan, Kansas.
Behnke, K.C., 1983. Measuring and Defining Particle Size of Feedstuffs.
Proceedings of the First International Symposium on Particle Size
Reduction in the Feed Industry, Kansas State University, Manhattan
Kansas, p. C -1-5.
Beke, B., 1964 Principles of Comminution. Publishing House of the
Hungarian Academy of Sciences., pp. 22, 72, 78, and 83.
Elliott, R.R., 1983. The Effects of Differential Roll Speeds on Particle Size
Reduction and Particle Size Control in Rollermil! Grinders.
Proceedings of the First International Symposium on Particle Size
Reduction in the Feed Industry, Kansas State University, Manhattan
Kansas, p. P - 2-7
Energy Users News, 1984 Projections to 1995: Energy Department
Update, Vol 9 No. 23.

Friedrich, Ing., 1959. Factors Affecting the Particle Reduction Process in
Hammermills. translated from Die Muhlel, Heft 48, pp. 648-651, 1959
and Heft 49, pp. 660-661.
Headley, V.E. and H.B. Pfost, 1966. Describing Particle Size Distribution
of Feedstuffs Statistically. Feedstuffs, vol. 33, no. 40, p. 50.
Headley, V.E. and H.B. Pfost, 1968. A Comminution Equation Relating Energy
to Surface Area by log-probability Method. ASAE Trans. 1 1:3, pp.
331-338.
Heimann, MA, 1983. Energy Consumption and Machine Efficiency in
Particle Reduction: A Roller Mill and Hammermill Comparison.
Proceedings of the First International Symposium on Particle Size
Reduction in the Feed Industry, Kansas State University, Manhattan
Kansas, pp. Q -1 -20.
Larson, F.D., 1983. Feed Milling Technology Handbook. Published by F. Dean
Larson Engineering Ltd., Calgary, Canada, p. 151.
Lowrison, C.G., 1974. Crushing and Grinding.Buttersworth and Co., Ltd.,
London, pp. 23, 33, 38, 39, 44, 49-66, 1 15-122, and 191-208.
Martin, 5., 1 983. The Effect of Particle Size on Mixing and Pelleting
Quality and Production Rates. Proceedings of the First International
Symposium on Particle Size Reduction in the Feed Industry, Kansas
State University, Manhattan Kansas, pp. F - 1-14.
Moy, CHR., Date Unknown. Mechanical raw-material preparation in animal
feed production, Diagram, Buhler/Buhler-Miag, Buhler Brothers Ltd.,
Uzwill, Switzerland, Issue 68, pp. 13-16.
McEllhiney, R.R., 1983. The Costs of Particle Size Reduction in the Feed
Industry. Proceedings of the First International Symposium on
Particle Size Reduction in the Feed Industry, Kansas State University,
Manhattan Kansas, pp. S - 1-14.
Olson, J.R., 1 983. Air Assist in Hammermill Grinding and their Effect on
Particle Size Distribution and Efficiency in Grinding. Proceedings
of the First International Symposium on Particle Size Reduction in
the Feed Industry, Kansas State University, Manhattan Kansas, pp. L-l
& L-2.
^3
Pfeiffer, J.W. andJ.R. Boose, 1983. The Present and Future Automation In
Particle Size Reduction Systems in Feed Manufacturing Plants.
Proceedings of the First International Symposium on Particle Size
Reduction in the Feed Industry, Kansas State University, Manhattan
Kansas, pp. R - 1-11.
Pfost, H. B. and V.E. Headley, 1971. Use of Logarithmic Normal Distribution
to Describe Hammermill Performance. A5AE Trans., Vol 14, No. 3, pp.
92-104
Pfost, KB., 1976. Grinding and Rolling. Feed Manufacturing Technology.
AFMA, Arlington, Va, pp. 71-84
Rumf, K, 1959 Stress Theory of Impact Grinding. Chemie-lng-Tech.,
Vol. 31, No. 5, pp 357-389.
Silver, C.A., 1932. Characteristics of Feed Mill Performance. Agricultural
Engineering, Vol 13, pp. 31-34
Stevens, C.A., 1961. Grinding and Rolling. Feed Production Handbook,
Published by Feed Production School, Inc. Kansas City, Mo., p. 27.
Stevens, C.A, 1962. Factors Affecting Hammermill Performance. Master's
Thesis. Kansas State University, Manhattan, Kansas.
Stevens, C. A, 1981. Hammermills: Efficiency and Operation Costs.
Feedstuffs, Vol. 53, No. 21, pp. E1-E4
Stevens, C.A. and V. Westhusin, 1983. The Effect of Peripheral Speed and
Screen Type on Efficiency and Particle Size in Hammermill Grinding.
Proceedings of the First International Symposium on Particle Size
Reduction in the Feed Industry, Kansas State University, Manhattan
Kansas, pp. K -1 -25.
Thomas, G.F., 1960. Proceedings of The 1960 Midwest Feed Production
School. Sponsored by Feed Production School, Inc., Kansas City Mo.,
p. I.
Westhusin, V., 1983. Grinding Performance as Affected by HammermillDesign. Master's Thesis. Kansas State University, Manhattan, Kansas.
kk
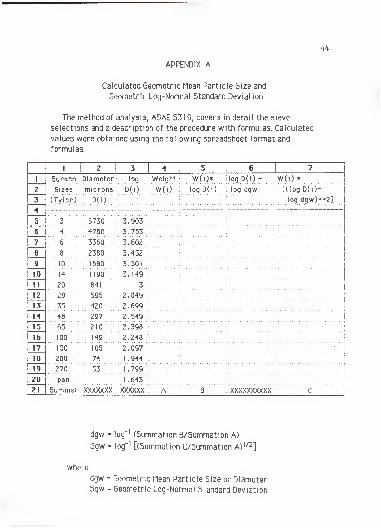
APPENDIX A
Calculated Geometric Mean Particle Size and
Geometric Log-Normal Standard Deviation
The method of analysis, ASAE S3 19, covers in detail the sieve
selections and a description of the procedure with formulas. Calculated
values were obtained using the following spreadsheet format and
formulas.
1 2 3 4 5 6 7
1 Screen Diameter log Weight: W(i)* !logD(i)- W(i) *
2 Sizes microns D(i) W(i) log D(i) I log dgw [(logD(i)-
3 (Tyler) D(i) log dgw)**2j
4
5 3 5730 3.903
6 4 4760 3.753
7 6 3360 3.602
8 8 2380 3.452
9 10 1680 3.301
10 14 1190 3.149
11 20 841 3
12 28 595 2.849
13 35 420 2.699
14 48 297 2.549
15 65 210 2.398
16 100 149 2.248
17 150 105 2.097•
18 200 74 1.944
19 270 53 1.799
20 pan 1.643
21 Summs: xxxxxxx XXXXXX A B :
. XXXXXXXXXX C
dgw = log"' (Summation B/Summation A)
5gw = log"' [(Summation C/5ummation A) I/2]
where:
dgw = Geometric Mean Particle size or Diameter5gw = Geometric Log-Normal Standard Deviation
^5
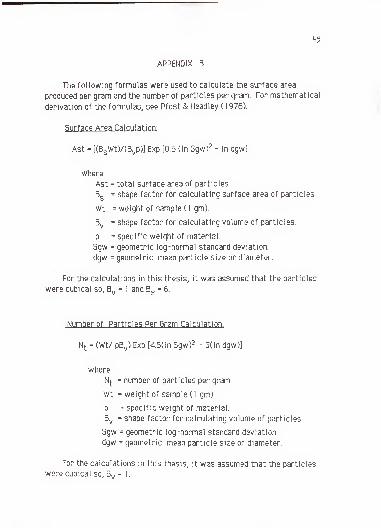
APPENDIX B
The following formulas were used to calculate the surface area
produced per gram and the number of particles per gram. For mathematical
derivation of the formulas, see Pfost & Headley ( 1 976).
Surface Area Calculation:
Ast = [(BsWt)/(Bvp)] Exp [0.5 (In Sgw)2 - In dgwj
Where:
Ast = total surface area of particles.
Q n = shape factor for calculating surface area of particles.
Wt = weight of sample ( 1 gm).
Bv shape factor for calculating volume of particles.
p = specific weight of material.
Sgw = geometric log-normal standard deviation,
dgw = geometric mean particle size or diameter.
For the calculations in this thesis, it was assumed that the particles
were cubical so, Bv
= 1 and B3
= 6.
Number of Particles Per Gram Calculation:
Nt= (Wt/ pBv ) Exp [4.5(ln Sgw)2 - 3(ln dgw)]
where:
Nj. = number of particles per gram
Wt = weight of sample ( 1 gm)
p - specific weight of material.
Bv= shape factor for calculating volume of particles.
Sgw = geometric log-normal standard deviation,
dgw = geometric mean particle size or diameter.
For the calculations in this thesis, it was assumed that the particles
were cubical so, Bv= 1.
APPENDIX C
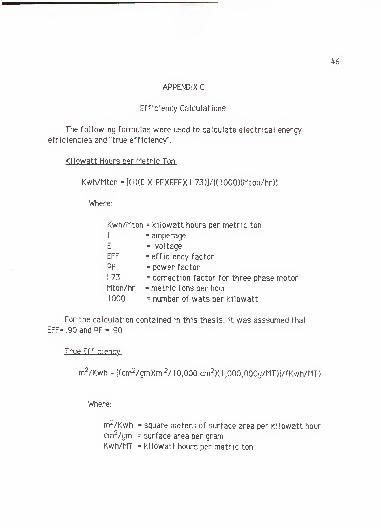
Efficiency Calculations
The following formulas were used to calculate electrical energy
efficiencies and "true efficiency'*.
Kilowatt Hours per Metric Ton:
Kwh/Mton = [(l)(E )( PF)(EFF)(l.73)]/[(IOOO)(Mton/hr)J
Where:
Kwh/Mton = kilowatt hours per metric ton
I- amperage
E = voltage
EFF = efficiency factor
PF = power factor
1.73 = correction factor for three phase motor
Mton/hr = metric tons per hour
1000 number of wats per kilowatt
For the calculation contained in this thesis, it was asssurned that
EFF= .90 and PF = .90.
True Fff icipncv
m2/Kwh = [(cm2/grn)(m 2/ 1 0,000 cm2
)( 1 ,000,000g/MT)]/(Kwh/MT)
Where:
mVKwh = square meters of surface area per kilowatt hour
cm2/gm = surface area per gram
Kwh/MT = kilowatt hours per metric ton
47
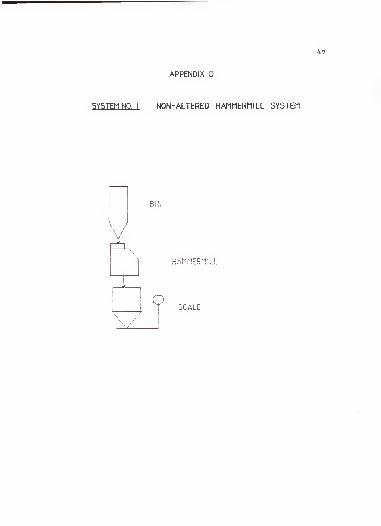
APPENDIX D
SYSTEM NO. 1 NON-ALTERED HAMMERMILL SYSTEM
BIN
HAMMERMILL
( \
SCALE
48
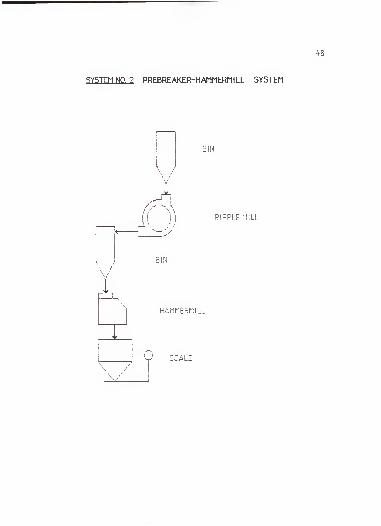
SYSTFM NO. 2 PREBREAKER-HAMMERMILL SYSTEM
i I
BIN
/Z>—
.
T±
I |
RIPPLE Mil
<. < BIN
LL_
*
HAMMERMILL
i i
T<LE
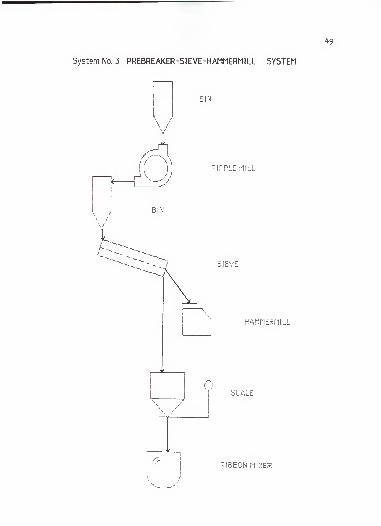
System No. 3 PREBREAKER-SIEVE-HAMMERMILL SYSTEM
49
BIN
t
\ /
Y
/( ))/ - - t
RIPPLE MILL
<I
BIN
--J
SIEVE
o
HAMMERMILL
o LALh
RIBBON MIXER
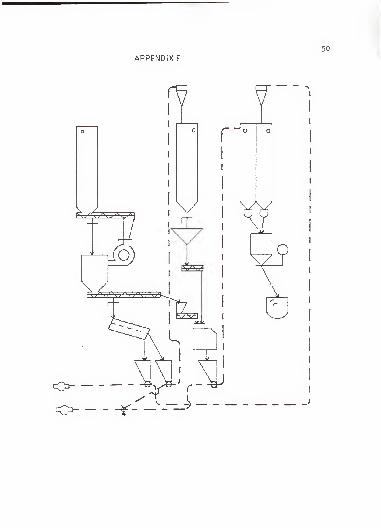
APPENDIX E
50
£.. a(..'V^y.
J>
fV
fc y^TT^, ^s. : a. ..zs^z;
F
r
V /
X
rr
51
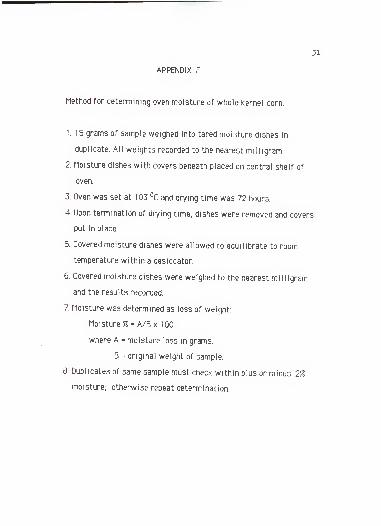
APPENDIX F
Method for determining oven moisture of whole kerne! corn.
1. 15 grams of sample weighed into tared moisture dishes in
duplicate. All weights recorded to the nearest milligram.
2. Moisture dishes with covers beneath placed on central shelf of
oven.
3. Oven was set at 103 °C and drying time was 72 hours.
4 Upon termination of drying time, dishes were removed and covers
put in place.
5. Covered moisture dishes were allowed to equilibrate to room
temperature within a desiccator.
6. Covered moisture dishes were weighed to the nearest milligram
and the results recorded.
7. Moisture was determined as loss of weight:
Moisture % = A/Bx 100
where A = moisture loss in grams.
B = original weight of sample.
8. Duplicates of same sample must check within plus or minus .2%
moisture; otherwise repeat determination.

52
APPENDIX G
Method for determining oven moisture of ground corn.
1. All samples were ground prior to weighing.
2. Approximately two grams of sample weighed into tared moisture
dishes in duplicate. All weights recorded to the nearest milligram.
3. Moisture dishes with covers beneath placed on central shelf of
oven.
4 Oven was set at 135 °C and drying time was two hours.
5. Upon termination of drying time, dishes were removed and covers
put in place.
6. Covered dishes were allowed to equilibrate to room temperature
within a desiccator.
7. Covered moisture dishes were weighed to the nearest milligram
and the results recorded.
8. Moisture was determined as loss of weight:
Moisture % = A/B x 100
where A moisture loss in grams.
B = original weight of sample.
9. Duplicates of same sample must check within plus or minus .2%
moisture; otherwise repeat determination.

APPENDIX H:
53
1 2 3 4 5 6
1 Test Variation: Pr-S-H i|i Screen Grams on
2 Step Number: CM :|: Sizes Screen Percent
3 Sample Number: R16CMPS1 i|i (Tyler) (weight)
4 Date Milled: 10/25 !|i
5 Ingredient: Corn :|.: 3 0.00%
6 Specific Wt. (gms): 1.32 4 0.00%7 *******.*t*********t***:************\
; 6 0.00 0.00%
8 Experiment Data: %%%%%%%%%% ]. 8 0.20 0.20%
9 Prebreaker Time: :,.;, 9.70 9.34%
10 Minutes: 4 !|! 14 20.80 ; 21.10%11 Seconds: !|! 20 17.30 ! 17.55%
12 Sieve Time: :|: 28 15.80 ; 16.02%
13 Minutes: 3 |: 35 14.30 ! 14.50%14 Seconds: 25 !|l 48 10.90 11.05%IS Hammermill Time:
1 : 65 7.80 ; 7.91%16 Minutes: 4 ;|; 100 1.70 : 1.72%17 Seconds: 25 :| 150 0.10 ! 0.10%18 Weight (lbs):
|: 200 o.oo ; 0.00%19 Prebreaker: 723 !|! 270 o.oo : 0.00%20 Sieve Overs: 464 :|: pan o.oo •: 0.00%21 Sieve Unders: 256 |: Summation: I 98.60 ! 100.00%22 Hammermill: 460 :| ************* *********^*** ************23 Amps:
24 Prebreaker: 18 !|!
25 Sieve: 2.25 i|!
26 Hammermill: 37 ;;;
27 Volts:!
:
28 Prebreaker: 420 !|i
29 Sieve: 420 !|i
30 Hammermill: 420 ;i;
31
32 Prebreaker: 15 !|!
33 Sieve:
Hammermill:
1.5 !|i
30 ;|;34
35 Ambient Conditions: :-— _
i
i
36 Dry Bulb Temp.:
Wet Bulb Temp.:
Rel Humidity:
72 ;|:
62 :|:
58 ;i!
37
38
39

5^
401 I
2
Test Variation: Pr-S-H
41 StepNumber: CM :{: Screen : Grams on
42 Sample Number: '-. R16CMPSI :|j Sizes Screen Percent
43 it*********************;************]: (Tyler) (weight)
44 Calculated Data: %%%%%%%%%%
45 Average Diameter : """"""..!.: 3 P?PP..: °- ooz
46 Particle Size: ! 763.39354 i|! 4 °- 00 °- 00*
47 Standard Deviation :|: 6 0.00 ...P-OOX
48 of Particle Size: \ 1.9084993 !|i 8 ...P-20
.. P-.2P*
49 Surface Area in i ;|i 10 9.70 _!_.9-84%
50
51
52
53
sq cm per gram: ! 73.373101 !|: 14 20.80 : 21.10%
Number of Particles :|. 20 17.30 17 5521
per gram: 11157.141|
28 15.80 16.02%
Grinding Efficiencies
in kwh per Ton:
35
48
14.30
10.90
14.50%
11.05%54
55 Prebreaker:
Hammermill:
2.0501577
7.3136063
65
100
7.80
1.70
7.91%
1.72%56
57 in kwh per MTon:
Prebreaker:
150
200
0.10
0.00
0.10%
0.00%58 2.2627718
59 Hammermill:
Sieve Efficiency:
8.0720728 270
pan
0.00
0.00
0.00%
0.00%60 \
61 in kwh per ton:
in kwh per MTon:
0.2198091 :|: Summation:j
98.60 100.00%
0.2426047 \************* ***********************62
63
64 Total Efficiency:
in kwh per ton:
in kwh per MTon:
65
66
6.9231603
7.6411351
67
68 True Efficiency in
sq meters per kwh:69 962.31739
70
71 Efficiency/HPH:
Prebreaker:
Hammermill:
Ibs/HPH !|; Kg/HPH
723 : 328.6363672
73 208.30189 ;j! 94.682676
"W74
75 Production Rates:
Prebreaker:
Hammermill:
T/H MT/H
4.929545576 1.422!
77
78
3.1245283 2.8404803

THE EFFECTS OF PREBREAKING ON THE EFFICIENCY
OF HAMMERMILL PARTICLE SIZE REDUCTION SYSTEMS
IN FEED MANUFACTURING
by
ROGER L. SCHOLTEN
B.5., University of Northern Iowa, 1972
M.B.A, University of New Haven, 1984
AN ABSTRACT OF A MASTER'S THEISI5
submitted in partial fulfillment of the
requirements for the degree
MASTER OF SCIENCE
Department of Grain Science and Industry
KANSAS STATE UNIVERSITY
Manhattan, Kansas
985
Studies were conducted to evaluate the effect of prebreaking on the
performance of hammermill grinding systems. The systems consisted of a
straight hammermilling system, a prebreaker-hamrnermill system, and a
prebreaker-sieve^hamrnermill system. The grinding performances of each
system on corn were determined and compared.
The hammermill system and the prebreaker-hamrnermill system
produced equivalent mean particle sizes and exposed equivalent surface
areas. The prebreaker-sieve-hammemnill system produced a 12% higher
mean particle size and exposed 10% less surface area.
The hammermill system and the prebreaker-sieve-hammermill
system performed equivalent^ in grinding efficiency, as measured by
kwh/metric ton. The prebreaker-hamrnermill system consumed 23% more
energy per metric ton. True efficiency ratings showed system
performances to be in the following efficiency order: hammermill system
(1089 m2/Kwh) > prebreaker-sieve-hammermill system (984 m2/Kwh) >
prebreaker-hamrnermill system (881 m2/Kwh).
Prebreaking did not improve hammermill production rates, as
measured by metric tons/hour. As a system, the prebreaker-sieve-
hammermill system produced at a higher rate. Its' rate was based on the
production rate of the prebreaker instead of the hammermill, which
occured in the other systems tested.
The investigation showed prebreaking had no effect on product
temperature rises during the hammermilling process.
The moisture analysis results showed that the greatest moisture loss
occurs at the initial particle reduction step. Total system moisture losses
ranged from 1.00 to 1.38%. A moisture loss trend was indicated for the
systems in the following order: prebreaker-sieve-hamrnerrnill system >
hammermill system > prebreaker-hamrnermill system.
Related Documents