EFFECTS OF OWNERSHIP STRUCTURE ON FIRM’S DIVIDEND POLICY: EVIDENCE FROM NAIROBI SECURITIES EXCHANGE BY OBED OBIERO BOGONKO D61/61046/2011 A RESEARCH PROJECT REPORT SUBMITTED IN PARTIAL FULFILLMENT OF THE REQUIREMENTS FOR THE AWARD OF THE DEGREE OF MASTER OF BUSINESS ADMINISTATION, SCHOOL OF BUSINESS, UNIVERSITY OF NAIROBI. NOVEMBER, 2013

Welcome message from author
This document is posted to help you gain knowledge. Please leave a comment to let me know what you think about it! Share it to your friends and learn new things together.
Transcript

EFFECTS OF OWNERSHIP STRUCTURE ON FIRM’S DIVIDEND POLICY: EVIDENCE FROM NAIROBI SECURITIES EXCHANGE
BY
OBED OBIERO BOGONKO
D61/61046/2011
A RESEARCH PROJECT REPORT SUBMITTED IN PARTIAL FULFILLMENT OF THE REQUIREMENTS FOR THE AWARD OF
THE DEGREE OF MASTER OF BUSINESS ADMINISTATION, SCHOOL OF BUSINESS, UNIVERSITY OF NAIROBI.
NOVEMBER, 2013

ii
DECLARATION
This research project report is my original work and has never been presented for an
award of diploma or a degree in this or any other university.
Signature………………………………………… Date……………………………
OBED OBIERO BOGONKO
D61/61046/2011
This research project report has been submitted for examination with my approval as the
University supervisor.
Signature………………………………………… Date……………………………
Dr. FREDRICK OGILO
LECTURER
DEPARTMENT OF ACCOUNTING AND FINANCE
SCHOOL OF BUSINESS
UNIVERSITY OF NAIROBI
iii
DEDICATION
To my late father Mr Moses Obiero who instilled a lot of discipline in me from and early
stage.

iv
ACKNOWLEDGEMENTS
My Foremost gratitude goes to God Almighty who renewed my strength at every single
stage of doing this project. Thank you Lord for the gifts of life, health and wellbeing.
Without your grace, I would not have come this far.
A lot of thanks to my supervisor Dr Fredrick Ogillo who have relinquished without
complain many hours of positive criticism comments and suggestions that have enabled
me to come up with a refined proposal I also thank my boss Mr Ketan Moolraj GFC
Heritage group of hotels for his support and understanding during my entire MBA course.
Obiero family you have been a pillar throughout the journey. To my dear wife Catherine
Kavana you always renewed my strength to work even harder thank you. Last but not
least I sincerely thank my friends for their contribution and critique of my work it was a
great learning experience.

v
TABLE OF CONTENTS
Declaration.......................................................................................................................... i
Dedication.......................................................................................................................... ii
Acknowledgements.......................................................................................................... iii
Table of contents.............................................................................................................. iv
List of tables..................................................................................................................... vii
List of abbreviations ......................................................................................................viii
Abstract ............................................................................................................................. ix
CHAPTER ONE: INTRODUCTION ..............................................................................1
1.1 Background ....................................................................................................................1
1.1.1 Ownership structure effects ............................................................................2
1.1.2 Dividend policy...............................................................................................3
1.1.3 Effects of ownership structure on dividend policy .........................................4
1.1.4 Nairobi Securities Exchange...........................................................................6
1.2 Research problem...........................................................................................................7
1.3 Objective of study..........................................................................................................9
1.4 Value of study................................................................................................................9
CHAPTER TWO: LITERATURE REVIEW ...............................................................10
2.1 Introduction..................................................................................................................10
2.2 Theoretical review .......................................................................................................10
2.2.1 Dividend irrelevance theory..........................................................................11
2.2.2 Bird-in-the-hand theory ................................................................................12
2.2.3 Tax differential theory ..................................................................................13

vi
2.2.4 Information signalling effect theory .............................................................13
2.2.5 Agency theory...............................................................................................14
2.2.6 Clientele effect theory...................................................................................16
2.3 Determinants of dividend policy..................................................................................17
2.4 Empirical review..........................................................................................................19
2.5 Summary to the literature.............................................................................................23
CHAPTER THREE: RESEARCH METHODOLOGY ..............................................24
3.1 Introduction..................................................................................................................24
3.2 Research design ...........................................................................................................24
3.3 Population of the study ................................................................................................24
3.4 Data collection .............................................................................................................25
3.5 Data analysis ................................................................................................................25
3.5.1 Operationalization of the variables ...............................................................26
CHAPTER FOUR: DATA ANALYSIS, RESULTS AND FINDINGS ......................27
4.1 Introduction..................................................................................................................27
4.2 Regression analysis......................................................................................................27
CHAPTER FIVE: SUMMARY, CONCLUSIONS AND RECOMMENDATI ONS.30
5.1 Introduction..................................................................................................................30
5.2 Summary of findings....................................................................................................30
5.2.1 Effects of changes of ownership structure on payout……………..…………30
5.2.2 Association between changes of ownership structure and changes in payout.31
5.3 Conclusions..................................................................................................................31
5.4 Limitations of study .....................................................................................................32
5.5 Recommendations........................................................................................................32

vii
5.6 Suggestions for further studies.....................................................................................32
REFERENCES.................................................................................................................34
APPENDICES..................................................................................................................39
Appendix I: Firms listed at the NSE as at 2012.....................................................39
Appendix II: Introduction letter .............................................................................41
Appendix III: Data collection form........................................................................42
Appendix IV: Changes in payout, foreign ownership and local ownership ..........43
Appendix V: Residual output.................................................................................47

viii
LIST OF TABLES
Table 4.1: Model summary of changes in ownership structure on changes in payout...... 27
Table 4.2: ANOVA for change in payout and change in ownership.................................. 28
Table 4.3: Coefficients of the model .................................................................................... 28

ix
LIST OF ABBREVIATIONS
CMA Capital Markets Authority
DPS Dividend per Share
MM Modgilliani and Miller
NSE Nairobi Securities Exchange
POR Payout Ratio
UK United Kingdom
US United States of America

x
ABSTRACT
This study sought to investigate the effects of ownership structure (local and foreign) on
the dividend policies of firm’s listed at the Nairobi Securities Exchange. The study is
causal in nature. The population of this study comprised of all the listed firms at the NSE
from January 2008 to December 2012. A census of the population was conducted.
Analysis was conducted through the use of a regression analysis. The findings generated
two key results. First, the results indicated that ownership structure only influenced a
paltry 0.8% of variations in payout as indicated by the adjusted R square. This meant that
the model used explained very little of the firms’ variability in dividend payout. The
study therefore concluded that the firms’ ownership structure does not significantly
influence dividend policy. Secondly, Coefficient of changes in foreign ownership
structure at 5% level of significance yielded a p-value which was not significant and was
negative. Coefficients of changes in local ownership likewise yielded a p-value which
was not significant either, but on the contrary had a positive sign. The study thus
concluded that changes in ownership structure do not influence changes in dividend
policy for companies listed in the Nairobi Securities Exchange. The study also concluded
that though to an inconsequential extent, changes in local ownership were positively
associated to changes in dividend policy while changes in foreign ownership were
negatively associated to changes in dividend policy. The study recommends that further
research be done to establish: the effect of other forms of ownership structures on firms’
dividend policy; and why local ownership exhibited a positive relationship with payout
while foreign ownership exhibited negative association with payout.

1
CHAPTER ONE: INTRODUCTION
1.1 Background
Dividend policy is one of the major decisions that companies normally make. Dividend
policy regards to the division of earnings between payments to shareholders and re-
investment in the firm and payout may be constant, decreasing, increasing or non-
existence over time. McMenamin (1999) defined dividend policy as a firm's plan of
action adopted by its directors whenever the dividend decision has to be made. A firm’s
ownership structure meanwhile refers to distribution of equity not only in terms of capital
and votes (control) but also by the identity of equity owners (Ghabri and Sioud, 2011).
Jensen and Meckling (1976) defined ownership structure in terms of capital
contributions.
The debate as to whether dividend policy matters has become a major issue of interest in
the financial literature for a period spanning more than half a century. The seminal work
by Miller and Modigliani (1958, 1961) established that, under restrictive conditions,
when investment policy is held constant, a firm's dividend policy does not affect
shareholder wealth because higher dividend payouts lead to lower retained earnings and
capital gains, leaving the wealth of shareholders unchanged. Motivated by Lintner’s
(1956) finding that firm follows well-considered payout strategies; financial theory has
offered a range of explanations for dividend policies. The main theories of dividend
policy are; the residual theory, the Miller and Modigliani irrelevance theory, the bird in
the hand theory, dividend signaling theory, the dividend clientele effect, and agency cost
(McMenamin, 1999).However, the signaling theory and agency cost theory have emerged

2
as the most popular theories on dividend payouts. The signaling theory argues that firms
can convey information about future profitability and cash flows to the market by paying
dividends (Miller and Rock, 1985). Dividend payout guarantees equal payout for both
inside and outsider equity holders.
Incorporated in 1954, the Nairobi Securities Exchange (NSE) is the leading securities
exchange in East and Central Africa. The products traded at the NSE are shares (equity)
and bonds (debt/leverage instruments) which are financial instruments that are jointly
referred to as securities. NSE facilitates investments and savings by bringing together
borrowers and lenders. Currently, a total of 60 firms categorized into 8 sectors are listed
(NSE, 2013). The NSE plays an important role in economic development in Kenya, by
providing a medium for the transfer of funds from surplus spending units to deficit
spending units.
1.1.1Ownership structure effects
The literature is replete with different forms of ownership structures: Jensen and
Meckling (1976) defined ownership structure in terms of capital contributions. They
described ownership structure to comprise of inside equity (managers), outside equity and
debt, thus proposing an extension of the form of ownership structure beyond the debt-
holder and equity-holder view. Zheka (2005) unlike the above authors constructed
ownership structure using variables including proportions of foreign share ownership,
managerial ownership, institutional shareholder ownership, individual ownership, and

3
government share ownership. Morck et al. (1988) argued a case for family ownership as
well; among others.
The payout policy in UK is significantly related to ownership of companies. However,
the presence of strong block holder or block holder coalitions (in particular, executive
directors, financial institutions and other industrial firms) weakened the relationship
between corporate earnings and the payout dynamics (Bob, 2004). In China the higher
the state ownership, the higher cash dividends rates and the higher the public ownership,
the higher stock dividends rates. In particular, the relation between dividends policy and
ownership structure is non-linear (Wei, 2003). In a study in India ownership structure is
one of the important variables that influence, though not uniformly the dividend payout
policies. Whereas ownership by the corporate and directors was positively related with
dividends payout level, no evidence was established in support of association between
foreign ownership and dividend payout growth (Kumar, 2003).
1.1.2 Dividend Policy
According to Pandey (2010) dividend policy is the practice that management follows in
making dividend payout decisions out of a firms earnings by determining how much
dividend to pay to shareholders and how much to reinvest. He argued that a perfect
dividend policy is the one that strikes a balance between current dividends and future
growth. Ross (1977) on the other hand defined dividend payment as the distribution of
company profits to shareholders. Baskin (1989) measured dividend policy of a firm by
considering to measures of dividends dividend payout and dividend yield. Brealey et al.

4
(2013) defined dividend payout ratio as the percentage of earnings paid to shareholders in
dividends while dividend as the return on investments for stock in the absence of capital
gain.
There are three schools of thoughts that have emerged with regards to dividend payout.
The first is the conservatives which see dividend payment as attractive hence a positive
Impact on the share prices the second believes that stock prices are negatively correlated
with dividend payouts and the third group maintains that dividend payout is irrelevant
and does not have any influences on stock prices. Brealey et al. (2013); Lintner (1956)
argued that stock holders prefer stable dividends and the market puts a premium on such
stability. According to Fama (1997) dividend policy is relevant to the value as well as the
marketability of common stock.
1.1.3 Effect of Ownership structure on dividend Policy
Manos (2002) investigated the agency theory of dividend policy in the context of an
emerging economy, India. He modified the Rozeff’s cost minimization model by
introducing a business group affiliation namely foreign ownership, institutional
ownership, insider ownership and ownership dispersion as a proxy for agency cost
theory. The results revealed a positive impact of all business group affiliation to payout
decisions. The positive relationship between foreign and payout indicated that the greater
the percentage held by foreign institutions, the greater the need to induce capital market
monitoring. Besides that, capital market monitoring is also important when the dispersion
of ownership increases since the more widely the ownership spread, the more acute the

5
free rider problem, hence, the greater need for outside monitoring. Further, the evidence
of a positive relationship between institutional and the payout ratio is consistent with the
preference for dividends related prediction.
Short et al. (2002) investigated dividend payout models to examine the potential
association between ownership structures and dividend policy. They modified the Full
Adjustment Model; the Partial Adjustment Model (Lintner, 1956); the Waud Model
(Waud, 1966); and the Earnings Trend Model. The result from the four dividends models
consistently showed positive and statistically significant associations between
institutional ownership and dividend payout ratios and thus suggested a link between
institutional ownership and dividend policy.
Cook and Jeon (2006) investigated the determinants of foreign and domestic ownership
and a firm’s payout policy. The results supported the agency model and showed that
higher foreign ownership is associated with a greater dividend payout. Domestic
intuitional investors, however, did not play a prominent role in a firm’s payout policy.
Thus, they concluded that foreign investors are more active monitors of corporate by
reducing agency problems and leading firms to increase the level of payouts.
1.1.4 Nairobi Securities Exchange
A stock market is a place where securities are traded. These securities are issued by listed
companies and by the government, with the aim of raising funds for different purposes
such as to fund expansion for the former, and the development and finance budget

6
deficits for the latter. Common securities traded on stock exchange include company
shares, corporate bonds, and government debt in the form of treasury bonds. The Nairobi
Securities Exchange was formed in 1954 as a voluntary organization of stock brokers is
now one of the most active stock markets in Africa. Subsequent development of the
market has seen an increase in the number of stock brokers, introduction of investment
banks, establishment of custodial institutions and credit rating agencies and the number
of listed companies have increased over time. As a capital market institution, the stock
market exchange plays an important role in the process of economic development. It
helps mobilize domestic savings thereby bringing about reallocation of financial
resources from dormant to active agents. Long-term investments are made liquid, as the
transfer of securities between shareholders is facilitated. The exchange has also enabled
companies to engage local participation in their equity thereby giving Kenyans a chance
to own shares (Nairobi Securities Exchange, 2013).
Companies can also raise extra finance essential for expansion and development. To raise
funds a new issuer publishes a prospectus which gives all pertinent particulars about the
operations and future prospects and states the price of the issue. A stock market also
enhances the inflow of international capital. They are also used as tools for privatization
programs. The Nairobi securities exchange deals in both variable income securities and
fixed income securities .Variable income securities are the ordinary shares which have no
fixed rate of dividend payable as the dividend is dependent on the profitability of the
company and what the board decides. The fixed income securities include treasury and
corporate bonds, preference shares, debenture stocks – these have a fixed rate of

7
interest/dividend, which is not dependent on profitability. Most of the business in the
exchange is in the financial or industrial sectors though agriculture and other commercial
services are also represented (Nairobi Securities Exchange, 2013).
1.2 Research Problem
Dividend policy has been explained and justified by different theoretical frameworks:
Dividend irrelevance theory (Miller and Modigliani, 1961); Bird-in-the hand theory
(Lintner , 1962; Gordon, 1963); Clientele effect theory (Pettit, 1977; Scholz, 1992);
Agency theory (Jensen and Meckling, 1986); pecking order theory (Myers, 1984; Myers
and Majluf, 1984); among others. The relationship between control structures and payout
is a focus of several empirical studies internationally.
The Nairobi Securities Exchange is the most dynamic and largest securities exchange in
East and Central Africa (NSE, 2013). It currently has 60 listed companies which span 8
different sectors. All the companies in the NSE have varied ownership structures.
Naturally, being listed companies, all the companies pay some dividend on the stock. As
a result they must all have a dividend payout policy (NSE, 2013).
Several empirical studies have been conducted to establish the effect of ownership
structure on payout policy: Bob (2004) established that the payout policy in UK was
significantly related to ownership of companies; Zeckhauser and Pound (1990) did not
find significant differences in payout ratios between firms with and without large block
holders; Gugler and Yurtoglu (2003) found that the power of the largest equity holder
reduces the dividend payout ratio whereas the power of the second largest shareholder
increases the payout; Moh’d et al. (1995) found that larger managerial ownership

8
translates into lower dividend payout ratios, while larger institutional stakes are
associated with higher payout; among other international studies. Locally, Ochola (2005);
Nyumba (2011); Karanja (1987); among others have studied dividend payout before,
however, relatively little attention has been made on ownership structure effects on
dividend policy.
Karanja (1987) attempted to establish whether changes in ownership structure affects
payout but under a very different context; less foreign and institutional ownership; less
listed companies; different regulatory frameworks; among others have all transformed.
Given the contextual changes in the NSE operating environment, it is useful to establish
the effect of NSE listed firm ownership structures on their respective dividend payout
policies. How does ownership structure affect dividend policy of firms listed in the NSE
in the prevailing operating environment?
1.3 Objectives of the Study
I. To establish the effects of ownership structure on dividend policy of firms listed
at the Nairobi Securities Exchange.
II. To determine how changes in ownership structure are associated with
corresponding changes in dividend payout
1.4 Value of the Study
The study will be of great value to investors in determining the investments to hold
depending on the dividend payouts they prefer; it will also enable financial consultants to
offer more enlightened services to their clients in coming up with portfolios that suit the
needs of investors.
9
It will add to the scant local literature on effects of ownership structures on dividend
payout policies. Additionally, the relationship between payout and ownership structure is
also put to the test under the prevailing environmental context.
It will assist regulators prescribe and formulate more enlightened dividend and ownership
related policies and best practices. It will also furnish policy makers with information on
the likely direction of dividend payout given a certain ownership structure configuration.
10
CHAPTER TWO: LITERATURE REVIEW
2.1 Introduction
This chapter focused on a review literature on effects of ownership structure on dividend
policies. Theories that explain dividend policies were first discussed. Determinants of
dividend policy were then discussed. Empirical evidence of the effects of ownership on
dividend policies was then given. Finally, a summary of the literature was discussed.
2.2 Theoretical review
Various theoretical frameworks have attempted to explain the concept of dividend policy.
Six have stood out: Dividend irrelevance theory; Bird-in-the-hand theory; Tax differential
theory; Information signaling theory; Agency theory; Clientele effect theory (Lintner,
1956; Miller and Modigliani, 1961; Krishman, 1933; Solomon, 1963; Jensen and
Meckling, 1976; Pettit, 1977).
The first empirical study of dividend policy was conducted by Lintner (1956), who
investigated corporate managers to understand how they arrived at the dividend policy.
Lintner found that a prevailing dividend rate formed a bench mark for the management.
Companies’ management would thus progressively increase dividends in pursuit of the
target payout ratio. While Lintner (1956) provided the stylistic description of dividends,
the watershed in the theoretical modeling of dividends was almost certainly the classic
paper of Miller and Modigliani (1961), which first proposed dividend irrelevance.

11
2.2.1Dividend irrelevance theory
Miller and Modigliani (1961) argued that dividend policy has no effect on either the price
of a firm's stock or on its cost of capital. Since a firm's value is determined by its
investment policy and the manner in which the earnings stream is split between retained
earnings and dividends does not affect this value. MM demonstrates that under a
particular set of assumptions that if a firm pays higher dividends, then it must sell more
stock to new investors and the share of the value of the company given up to the new
investors is exactly equal to the dividend paid out. The main assumption is that there is
100 per cent payout by management in every period. Other assumptions are: that there
exist perfect capital markets; that is, no taxes or transactional cost, the market price
cannot be influenced by a single buyer or seller, and free and costless access to
information about the market; that investors are rational and that they value securities
based on the value of discounted future cash flow to investors; that managers act as the
best agents of shareholders; and that there is certainty about the investment policy of the
firm, with full knowledge of future cash flows.
They argued that investors are able to replicate any dividend streams that corporations
might be able to pay. Such that if dividends are lower than desired, investors can sell
some of their shares to obtain their desired dividends and if the dividends are higher than
desired, investors can use the dividends to purchase additional shares in the company
(home-made dividends). Because investors are able to manufacture homemade dividends,
which are perfect substitutes to corporate dividends, then dividend policy is irrelevant.
Given that a firm is not able to increase its value by simply altering the mix of dividends
12
and retained earnings, investors’ concerns are about total returns that they receive, not
whether they receive those returns in form of dividends or capital gains. However, MM's
(1961) theory has heavily been criticized for being unrealistic in the real world, as we
know it, investors pay taxes, firms incur floatation costs and investors incur transaction
costs. This implies that payments of dividends and substituting with new issues are not
the same.
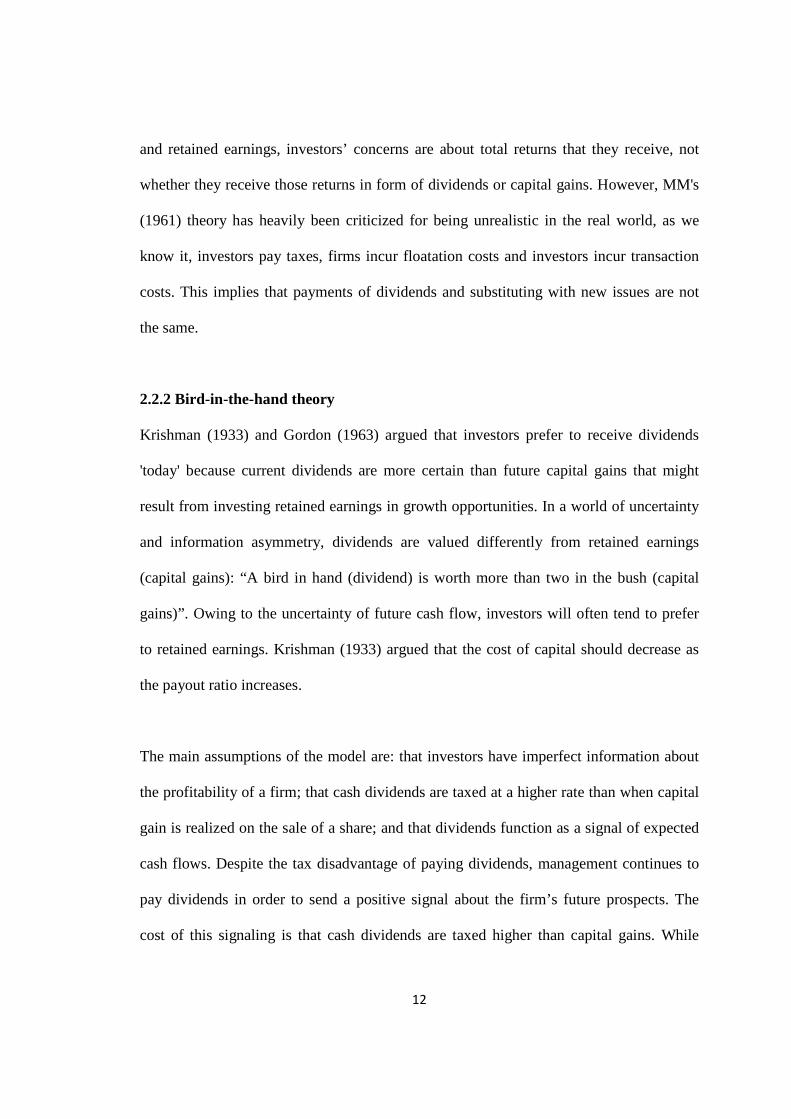
2.2.2 Bird-in-the-hand theory
Krishman (1933) and Gordon (1963) argued that investors prefer to receive dividends
'today' because current dividends are more certain than future capital gains that might
result from investing retained earnings in growth opportunities. In a world of uncertainty
and information asymmetry, dividends are valued differently from retained earnings
(capital gains): “A bird in hand (dividend) is worth more than two in the bush (capital
gains)”. Owing to the uncertainty of future cash flow, investors will often tend to prefer
to retained earnings. Krishman (1933) argued that the cost of capital should decrease as
the payout ratio increases.
The main assumptions of the model are: that investors have imperfect information about
the profitability of a firm; that cash dividends are taxed at a higher rate than when capital
gain is realized on the sale of a share; and that dividends function as a signal of expected
cash flows. Despite the tax disadvantage of paying dividends, management continues to
pay dividends in order to send a positive signal about the firm’s future prospects. The
cost of this signaling is that cash dividends are taxed higher than capital gains. While

13
some investors would rather have capital gains to cut down on tax impact, others may
prefer dividends because they prefer immediate cash in hand (Husseiney et al., 2011).
2.2.3 Tax differential theory
Litzenberger and Ramaswamy (1979) propositioned that investors prefer one dividend
policy to another because of the tax effect on dividend receipts. Investors must pay taxes
at the time dividend and capital gains are received. Taxes on dividends must be paid in
the same year when dividends are received whereas capital gains (where taxed) are not
until investments are sold. Depending on an investor's tax position; he may prefer either
payout of current earnings as dividends or capital gains associated with the stock value.
2.2.4 Information signaling effect theory
In their revolutionary paper of 1961, argued that dividends did not convey any useful
information to the investors and hence was a rejection of the “information content of
dividends hypothesis". MM invoked the assumption of perfect capital market where "all
traders in the stock market" have equal access to information about the ruling price and
about all other relevant characteristics of shares. Though Miller and Modigliani (1961)
assumed that investors and management have perfect knowledge about a firm, this has
been countered by many researchers, as management who look after the firm tend to have
more precise and timely information about the firm than outside investors. This,
therefore, creates a gap between managers and investors; to bridge this gap, management
use dividends as a tool to convey private information to shareholders (Al-Malkawi,
2007).

14
Solomon (1963) and Ross (1977) observe that increase in dividends is often accompanied
by increases in the prices of stocks while a decline in dividends generally leads to a stock
price decline. The payment of dividend is seen to convey to shareholders that the
company is profitable and financially strong. Ross (1977) observed that in an inefficient
market, management can use dividend policy to signal important information to the
market, which is only known to them. For instance, if management pays high dividends,
it signals high-expected profits in future to maintain the high dividend level (Solomon,
1963).
Petit (1972) equally concurred that the amount of dividends paid seems to carry great
information about the prospects of a firm; this can be evidenced by the movement of
share price. An increase in dividends may be interpreted as good news and brighter
prospects, and vice versa. However, Lintner (1956) observed that management are
reluctant to reduce dividends even when there is a need to do so, and only increase
dividends when it is believed that earnings have permanently increased. Kumar (2003),
however, observed that shareholders with majority ownership normally exercise control
over key decisions, which may include dividend payments and such action may not be
associated with existence of any material information.
2.2.5 Agency theory
Agency cost is the implicit cost of the conflict of interest that exists between shareholders
and management (Ross et al., 2008). This arises when management acts in their own
interest rather than on behalf of the shareholders who own the firm. This could be direct

15
or indirect. This is contrary to the assumptions of Miller and Modigliani (1961), who
assumed that managers are perfect agents for shareholders and no conflict of interest
exists between them. Managers are bound to conduct some activities, which could be
costly to shareholders, such as undertaking unprofitable investments that would yield
excessive returns to them, and unnecessarily high management compensation (Al-
Malkawi, 2007).
These costs are borne by shareholders; therefore, shareholders of firms with excess free
cash flow would require high dividend payments instead. The payment of dividend
reduces the agency problem between managers and shareholders by reducing the
discretionary funds available to managers (Jensen and Meckling. 1976; Rozeff, 1982;
Easterbrook, (1984). Easterbrook (1984) also identified two agency costs: the cost of
monitoring managers and the cost of risk aversion on the part of managers. Jensen (1986)
documents further that if firms have free cash flows then the firms pay dividends or retire
debts to reduce the agency cost of free cash flow. Further, a similar type of conflict exists
between shareholders and bondholders because shareholders can expropriate wealth from
bondholders by paying themselves dividends. Moreover, bondholders try to contain this
problem through restrictions in dividend payments in the bond indenture (Kalay, 1982).
Easterbrook (1984) observed that firms payout dividends in order to reduce agency costs,
because payments of dividends reduce the discretionary funds available to managers. The
motivation behind the Easterbrook's (1984) agency explanation of payout is that capital
market participants have better skills and/or incentives to monitor management, than

16
incumbent shareholders do. By demanding a high payout, the incumbent forces the firm
to seek refinancing and, consequently, delegate the monitoring task to new fund
providers.
2.2.6 Clientele effect theory
This theory was advanced by Pettit (1977). It states that different groups or clienteles of
stakeholders prefer different dividend payout policies depending on their level of income
from other sources of income. Low-income earners prefer high dividends to meet their
daily consumption while high-income earners prefer low dividends to avoid payment of
more taxes. Therefore when a firm sets a dividend policy, there will be shifting of
investors into and out of the firm until equilibrium is achieved. He argued that stocks
with low dividend yields will be preferred by investors with high income; by younger
investors; by investors’ who’s ordinary and capital gains tax rates differ substantially; and
investors whose portfolios have high systematic risk.
The retired individuals and university endowment funds generally prefer current incomes,
so they may want the firm to pay out a high percentage of earnings. Such investors (and
also pension funds) are often in a low or even zero tax brackets, so taxes are of no
concern. On the other hand, stockholders in the peak earning years might prefer
reinvestment, because they have less need for current investment income and would
simply reinvest any dividends received after first paying income taxes on the dividend
income. Evidence from several studies suggests that there is in fact a clientele effect. MM
(1961) argued that one clientele is as good as another, so the existence of clientele effect

17
does not necessarily imply that one dividend policy is better than any other may be
wrong, though, no one has offered proof that the aggregate makeup of investors permits
firms to disregard clientele effects, as this issue, like most others in the dividend arena, is
still up in the air (Brigham and Gapenski, 1997).
2.3 Determinants of dividend policy
Profits have long been regarded as the primary indicator of a firm’s capacity to pay
dividends. Pruitt and Gitman (1991), in their study found that, current and past years’
profits were important factors in influencing dividend payments. Baker (1985) equally
found that a major determinant of dividend payment was the anticipated level of future
earnings.
Pruitt and Gitman (1991) found that risk (year-to-year variability of earnings) also
determined firms’ dividend policy. A firm that has relatively stable earnings is often able
to predict approximately what its future earnings will be. Such a firm is therefore more
likely to pay out a higher percentage of its earnings than a firm with fluctuating earnings.
In other studies, Rozeff (1982); Lloyd et al (1985), and Collins et al (1996) used beta
value of a firm as an indicator of its market risk. They found statistically significant and
negative relationship between beta and the dividend payout. Their findings suggested that
firms having a higher level of market risk will pay out dividends at lower rate. D’Souza
(1999) also found statistically significant and negative relationship between beta and
dividend payout.

18
The liquidity or cash-flow position is also an important determinant of dividend payouts.
A poor liquidity position means less generous dividend due to shortage of cash. Alli et al.
(1993) demonstrated that dividend payments depended more on cash flows, which
reflected the company’s ability to pay dividends, than on current earnings, which are less
heavily influenced by accounting practices. They claimed that current earnings do not
really reflect the firm’s ability to pay dividends.
Both residual theory and agency cost theory have different explanation towards growth
opportunities. Under residual theory, companies with high growth opportunities tend to
pay lower dividends because they may use the available funds to finance the investments
with positive net present value. This implies that, given investment opportunities, a firm
with higher cash flow or earnings tends to pay higher dividends (Deshmukh, 2005).
Collins et al.(1996);Gul(1999);Zeng (2003) and Amidu and Abor (2006) established a
significant negative relationship between firm growth and dividend payout. Gul(1999)
and Deshmukh (2005) also found a significant negative relationship between growth
opportunities and dividend yields implying that high growth firms have low dividend
yields compared to low growth firms.
Myers and Majluf (1984) found that the asymmetric information situation between
managers and external investors led to underinvestment problems. Based on that,
Deshmukh (2003) asserted that with respect to the change in the dividend, other things
held constant, the higher the level of asymmetric information due to small firm size, the

19
higher probability of underinvestment; consequently the lower the dividends paid to
stockholders.
2.4 Empirical review
A number of empirical studies have been conducted both locally and internationally on
ownership structure and dividend policy. Abdelsalam et al. (2008) sought to examine
dividend policies in an emerging capital market, in a country undergoing a transitional
period. Using pooled cross-sectional observations from the top 50 listed Egyptian firms
between 2003 and 2005, they examined the effect of board of directors’ composition and
ownership structure on dividend policies in Egypt. They found that there was a
significant positive association between institutional ownership and firm performance,
and both dividend decision and payout ratio. The results confirmed that firms with a
higher return on equity and a higher institutional ownership distributed higher levels of
dividend. No significant association was found between board composition and dividend
decisions or ratios.
Renneboog and Trojanowski (2007) sought to examine whether or not dividend policy is
influenced by the firm’s corporate control structure by investigating the relationship
between the dynamics of earnings payout and the voting power enjoyed by different
types of shareholders. They analyzed a large panel of UK firms whose payout policy is
significantly related to control concentration in the 1990s. They employed the traditional
framework proposed by Linter and an econometrically sound approach to modeling the
dynamics of the total payout suggested. They found that profitability is a crucial
determinant of payout decisions, but the presence of strong block holders or block holder

20
coalitions weakened the relationship between the corporate earnings and the payout
dynamics. Block holders appeared to realize that an overly generous payout may render
the company liquidity constrained, and, consequently, result in suboptimal investment.
Harada and Nguyen (2011) sought to test two agency-based hypotheses regarding the
effect of ownership concentration on dividend policy using a large sample of Japanese
firms. They run level regressions associating payout rates to ownership concentration.
Different measures of payout were used to ensure the robustness of results. How
ownership concentration affects the propensity to increase dividends following changes
in variables correlated with free cash flows was also examined. They found that the
results were consistent with rent extraction by large shareholders. Ownership
concentration was associated with significantly lower dividends in proportion to earnings
as well as relative to book equity. An endogenous relation between ownership
concentration and dividend payout was established, but the results were not statistically
different. Firms with concentrated ownership were also less likely to increase dividends
when earnings increased or when debt decreased.
Seita-Atmaja (2010) sought to examine whether board independence influences debt and
dividend policies of family controlled firms. He examined panel data on a sample of
Australianpublicly-listed firms over the period 2000-2005 using panel (random effects)
regression. The empirical test demonstrated that family controlled firms appear to have
higher levels of leverage and dividend payout ratios than their non-family counterparts.
More importantly, the result indicated that the positive impact of family control on

21
dividend policy was due to the higher proportion of independent directors on family
boards. This underlined the significant role that independent directors play in influencing
firm’s dividend policies, especially for family controlled firms. The result also supported
the notion that independent directors and dividends are complementary government
mechanisms.
Mulinge (2009) sought to establish the effect of Block holders on dividend policy of
listed firms. The study used descriptive secondary data from Nairobi Stock Exchange
data base and the individual financial statements of the firms. The dividends payments,
earnings per share and ownership structures were used. The dividend declared and the
dividend payout ratios were calculated and analyzed using regression and correlation
analysis. The results indicated that firms with block holders tend to give higher dividends
compared to firms with higher state ownership, foreign ownership and individual
ownership. She concluded that there was a positive relationship between the block
holders and dividend policy since firms with higher block holder ownership had been
observed to have higher dividend payout ratios.
Odero (2012) sought to investigate the relationship between types of ownership structure
and dividend payments of Nairobi Securities Exchange (NSE) listed companies. A cross-
sectional analysis of 33 sample firms for the years 2009 to 2011 was utilized. The study
examined the explanatory power of three alternative models of dividend policy, the full
adjustment model, the partial adjustment model and the Waud model which are
moderated by the possible effects of four types of ownership structure, namely ownership

22
concentration, institutional ownership, managerial ownership and foreign ownership.
Ownership concentration is measured by the summation of the percentage of shares
controlled by ten major shareholders.Institutional ownership is measured by a percentage
of equity owned by institutional investors, while, managerial ownership is measured by
adding the total percentage of shares directly held by directors in the company, and
foreign ownership is measured by the sum of all shares in the hands of foreign
shareholders in the list of ten largest shareholders, either held through nominee
companies or other corporate foreign share holdings (Odero, 2007).
The study found that the partial adjustment model had the highest explanatory power. It
was also found that ownership concentration was the only variable that was positively
and statistically significant in influencing dividends in every type of dividend model, a
finding that is consistent with agency theory. This finding has policy implication since
high dividend payments can be used for mitigating agency conflict as dividends can be
substituted for shareholder monitoring. Hence, large shareholders have strong incentives
to require higher dividend payments in order to reduce monitoring costs. Nevertheless,
this study showed that dividend decisions of Kenyan companies are not influenced by the
Structure of ownership (Odero, 2007).
Karanja (1987) studied the dividend practices of publicly quoted companies in Kenya. He
found that there are three important factors that determine dividend policy in Kenya, i.e.
cash and liquidity, current and prospective profitability and company's level of
23
distributable resources. He also noted that foreign controlled companies have more liberal
dividend policies than locally controlled firms.
2.5 Summary to the Literature
Various theoretical frameworks have attempted to explain the concept of dividend policy.
Six have stood out: Dividend irrelevance theory; Bird-in-the-hand theory; Tax differential
theory; Information signaling theory; Agency theory; Clientele effect theory. Some of the
key determinants of dividend payout include: Profits; Risk; Cash flow position;
Information asymmetry; among others. Several empirical studies have been conducted
internationally to establish the effect of ownership structure on payout policy. Locally, a
handful of studies have been conducted on dividend payout before, however, relatively
little attention has been focused on ownership structure effects on dividend policy. A
similar study has been conducted before in 1978 (over thirty years ago) but under a very
different context; less foreign and institutional ownership; less listed companies; different
regulatory frameworks; among others have all transformed. The change of contextual
environment therefore necessitates an investigation as to whether ownership structure
influences payout policy under a different context.

24
CHAPTER THREE: RESEARCH METHODOLOGY
3.1 Introduction
This chapter described the methods that were used in the collection of data pertinent in
answering the research question. It was divided into research design, population and
sampling design, Data collection methods and data analysis methods.
3.2 Research Design
This research enquiry was a causal study of the relationship between Ownership and
dividend policy of the companies listed on the NSE as at December 2012. Mugenda
(2003) explained that causal studies explore the relationships between variables and this
is consistent with this study which sought to establish the nature of relationship between
the variables. The research analyzed data on all the selected firms listed on the NSE
within the specified period of time. This was consistent with other studies that have
successfully used causal design such as Ryan (2008), Mwangi (2010) and Ouma (2011).
3.3 Population of the study
The population consisted of all the companies listed at the NSE over the period (2005-
2012). The Study was conducted on companies that had continually been quoted during
the study period. There were 60 quoted companies at the NSE during the study period
(Appendix1).Listed firms were suitable for this study due to the credibility and
authenticity of such data. A census was conducted.

25
3.4 Data Collection
Data used in this study was secondary data; specifically the company’s consolidated
financial statements for the periods 2008 - 2012 on dividend payout ratios. The annual
reports of listed companies were obtained from the CMA and NSE libraries. The data on
ownership composition/structure was obtained from CMA and NSE, as listed companies
are required by the CMA rules and regulations to send on monthly basis summary of
shareholding structure in terms of foreign investors, east African investors, local
institutional investors and individual investors. This study focused on Foreign Investors
and Local Investors.
3.5 Data Analysis
To carry out the study a regression model was used to assess the relationship between
change in the payout ratio and changes in foreign ownership and local ownership. The
model was successfully used by Ouma (2011).
The model was in the form;
∆P = α +β1∆F+ β2∆L+ ε
Where;
α is the regression intercept
∆P is the change of payout ratio
∆F is the change in foreign ownership
∆L is the change in local ownership

26
ε is the error term
To check whether one or more of the independent variables significantly predicted the
dependent variable at the selected probability level, a t-test was used (Mugenda, 2003).
3.5.1 Operationalization of the Variables
Dividend payout ratio is that proportion of earnings that is distributed to shareholders.
Change of payout ratio was obtained by using the prevailing year and the preceding year.
∆Payout = Payout t – Payoutt-1
Foreign Ownership was obtained by taking the proportion of all shares held by foreigners
both individual and institutional to total shares declared in published financial statements.
The change in foreign ownership was computed as follows:
∆Foreign ownership = percentage of foreign investors t – percentage of foreign investors
t-1
Local ownership was the proportion of shares held by local investors both individual and
institutional to total shares declared. The Change was computed using the prevailing year
and the preceding year.
∆Local ownership = percentage of local investors t – percentage of local investors t-1

27
CHAPTER FOUR: DATA ANALYSIS, RESULTS AND FINDINGS
4.1 Introduction
This chapter described and interpreted the analysis of data. Analysis results and findings
were also indicated.
4.2 Regression analysis
A regression analysis was conducted on the changes in payout (Y) against changes in
foreign and local ownership structure (X1, X2). The regression equation was as follows:
∆P = α +β1∆F+ β2∆L+ ε
∆P, ∆F and ∆L data was generated for 36 companies listed in the NSE that spanned the
years 2008 through to 2012 (Refer appendix iv). The data was subjected to a regression
analysis, the findings (output) of which are indicated below:
Table 4.1: Model summary of change in ownership structure on change of payout
Source: Computations from raw data obtained from NSE (Refer to appendix 3).
Table 4.1 shows that ownership structure only influenced a paltry 0.8% of variations in
payout (Y) by the independent variables (X1, X2) as indicated by the adjusted R square.
Regression Statistics Multiple R 0.081027276 R Square 0.00656542 Adjusted R Square -0.007525851 Standard Error 0.486436685 Observations 144

28
The model thus only explained 0.8 % of the variations in payout. This meant that the
model used explains very little of the firms’ variability in dividend payout.
Table 4.2: Anova for change in payout and change in ownership structure ANOVA
Df SS MS F Significance F Regression 2 0.220493078 0.110246539 0.465921042 0.628519516 Residual 141 33.36351141 0.236620648 Total 143 33.58400449
Source: Computations from raw data obtained from NSE (Refer to appendix 3).
Significance F on table 4.2 demonstrates the usefulness of the overall regression model at
a 5% level of significance. Since the p-value of the F test is larger than alpha (0.6285 >
.05) it was concluded that the regression model was not fit to explain changes in payout
in the firms under study. Table 4.2 also clearly indicates that the regression only
accounted for an insignificant number of variations in payout changes; 0.22 (0.66%) out
of 33.584; the rest of the variations being accounted for by other factors external to the
model (Residual) as indicates by the sum of the squares (SS). Residual (or error)
represents unexplained (or residual) variation after fitting a regression model. It is the
difference (or left over) between the observed value of the variable and the value
suggested by the regression model.
Table 4.3: Coefficients of the model
Coefficients Standard
Error t Stat P-value Intercept 0.458719032 0.043522226 10.53987986 1.63E-19 Foreign -0.014411923 0.015300532 -0.94192298 0.347843098 Local -0.000443409 0.001461083 -0.30347926 0.76197199
Source: Computations from raw data obtained from NSE (Refer to appendix 3).

29
Table 4.3 depicts the numerical relationship between the independent variable and the
independent variables in the following resultant equation
The coefficients and their signs are of particular importance. As shown, change in foreign
ownership has a negative but insignificant effect on payout at 0.014%. An increase in
foreign ownership thus led to a decrease in payout. On the other hand, local ownership
has a positive but marginally larger effect on payout at 0.044%. An increase in local
ownership would thus result in an inconsequential but positive increase in payout.
A t-test was finally conducted to ascertain whether one or more of the independent
variables significantly predict the dependent variable at the 5% significance level. Testing
whether the coefficient of changes in foreign ownership structure is equal to zero at 5%
level of significance yields a p-value of (0.3478 > 0.05), which is not significant.
Changes in local ownership likewise yields a p-value of (0.7620> 0.05), which is not
significant either. Therefore, none of the explanatory variables are useful predictors of
explaining changes in payout.

30
CHAPTER FIVE: SUMMARY OF FINDINGS, CONCLUSIONS AND
RECOMMENDATIONS
5.1 Introduction
This chapter gave a summary of the analysis in chapter four and highlights the key
findings. It also drew conclusions and implications from the finding. Limitations of the
study were also discussed. Recommendations for further studies were finally given.
5.2 Summary of findings
This study was conducted with the primary aim of establishing the effect of ownership
structure on firms’ dividend policy. The study also aimed at establishing the association
between changes in ownership structure and corresponding changes in payout. The study
focused on firms listed in the Nairobi Securities Exchange. To achieve the above
objectives, a regression analysis was conducted whereby changes in firms’ payout was
regressed against the two explanatory variables; changes in foreign ownership and
changes in local ownership for a period of 5 years (2008-2012). Data on changes in
payout ratio (Y) for the study firms’ was obtained from the NSE; corresponding data for
the changes in foreign and local ownership respectively (X1, X2) was also obtained from
the same source. The two sets of data were then subjected to a regression analysis.
5.2.1 Effect of changes in ownership structure on payout
The study found that changes in ownership structure of firms’ (X1, X2) only influenced a
paltry 0.8% of variations in payout (Y) is explained by the independent variables (X1, X2)
as indicated by the adjusted R square statistic of -0.007525851 (refer to table 4.1).Table
4.2 indicated that the regression model was also found to account for only 0.22 (0.66%)

31
out of 33.584 variation; with the bulk of the variation in (Y) being accounted for by
residuals (99.34%).
5.2.2 Association between changes in ownership structure and changes in payout
It was also found that change in foreign ownership has a negative but insignificant effect
on payout at 0.014% (refer to table 4.3). On the other hand, local ownership has a
positive but marginally larger effect on payout at 0.044%. Finally, a t-test was conducted
to ascertain whether one or more of the independent variables significantly predict the
dependent variable at the 5% significance level. Coefficient of changes in foreign
ownership structure at 5% level of significance yielded a p-value of (0.3478 > 0.05),
which is not significant. Changes in local ownership likewise yielded a p-value of
(0.7620 > 0.05), which is not significant either (refer to table 4.3).
5.3 Conclusions
Two major conclusions can be drawn from the findings of this study. The results
indicated that the firms’ ownership structure does not significantly influence dividend
policy. The study concluded that other factors other than local and foreign ownership
changes were responsible for changes in dividend policy of NSE listed firms. The study
also concluded that though to an insignificant extent, changes in local ownership were
positively associated to changes in dividend policy while changes in foreign ownership
were negatively associated to changes in dividend policy.

32
5.4 Limitations of the study
Census data from NSE had gaps on some firms. Out of a population of 60 listed firms,
this study was only able to access data for 36 firms. This study also only used two forms
of ownership namely foreign and local; however, there exists other forms of ownership
that the study did not factor in. Finally, this study is based on 2008-2012 payouts, foreign
and local ownership data and thus interpretations deviating from the findings of this
research may occur if period is outside the study period or ownership variables are not
study variables.
5.5 Recommendations
This study found that changes in ownership structure barely explained dividend payout
decisions. The study therefore recommends that changes in ownership structure of firms
in the NSE should not be used as a basis for projecting dividend payout variations of
listed firms. The study also found that change in foreign ownership had a negative but
inconsequential effect on payout, whereas changes in local ownership had a positive but
equally marginal effect on variations in payout. The study consequently recommends that
on the basis of the findings, a change in foreign or local ownership respectively may give
a remote indication as to what direction dividend payout may take in a given listed firm.
5.6 Suggestions for further studies
Further investigation may be done to establish the effect of other forms of ownership
structures on firms’ dividend policy. In addition, further inquiry may be done into why
local ownership exhibited a positive relationship with payout while foreign ownership

33
exhibited a negative association with payout. Finally, an investigation may be done to
establish the key factors that influence dividend policy in locally listed firms.

34
REFERENCES
Abdelsalam, O., El-Masry, A. and Elsigini, S. (2008). Board composition, ownership structure and dividend policies in an emerging market. Managerial Finance, 34 (2), 963-964. Alli, K. L., Khan, A. Q. and Ramirez, G. (1993). Determinants of Corporate Dividend Policy: A Factorial Analysis. The Financial Review, 28 (4), 523-547.
Baker, H.K., Farrelly, G.E. and Edelman, R.B. (1985). A survey of management views ondividendpolicy.Financial Management, 14(3), 1007-1034.
Black F. (1976). The Dividend Puzzle.Journal of Portfolio Management, 2, 5-8.
Bob, R. (2004).Ownership Structure and Payout Policy in UK.Unpublished working paper, Tilburg University.
Brealey, R.A., Stewart, M. and Allen, F. (2013).Principles of Corporate Finance, (2nd Ed.), McGraw-Hill Higher Education. Brennan, M. J. and Thakor M.J. (1990).Shareholder Preferences and Dividend Policy.
Journal of Finance 45 (4), 993-1018.
Capital Markets Act, Capital Markets Regulations (2002). (Securities; Public Offers; Listing and Disclosures).
Capital Markets Regulations, 2002.
Collins, M.C., Saxena, A.K. and Wansley, J.W. (1996). The role of insiders and dividend policy: a comparison of regulated and unregulated firms. Journal of Financial and Strategic Decisions, 9 (2), 1-9.
Deshmukh, S. (2003). Dividend initiation and asymmetric information: a hazard model. The Financial Review, 38 (3), 351-368.
D’Souza, J. (1999). Agency cost, market risk, investment opportunities and dividend policy an international perspective. Managerial Finance, 25 (6), 35-43.
Easterbrook, Frank H. (1984). Two agency - cost explanations of dividends. American Economic Review, 74 (4) 650-659.
Eckbo B. E. and S. Verma. (1994). Managerial share ownership, voting power, and cash dividend policy. Journal of Corporate Finance 1, 33-62.

35
Ghabri, Y. and Sioud, O. B. O. (2011). Ultimate ownership structure and stock liquidity:
Empirical evidence from Tunisia.Studies in Economics Finance. 28 (4), 282-300. Gugler, Kiaus, B. BurcinYurtoglu. (2003). Corporate Governance and dividend pay-out
policy in Germany. European Economic Review,47, 731-758.
Harada, K. and Nguyen, P. (2011). Ownership concentration and dividend policy in Japan. Managerial Finance, 37(4), 362-379. Healy, P. M. and Krishna, G. P. (1988). Earnings informationconveyed by dividend initiations and omissions, The Journal of Financial Economics 21, 149-175.
Hussainey, K., Mgbame, C. O. and Chiloke-Mgbame, A. (2011). Dividend policy and
share price volatility: UK evidence. Journal of Risk Finance, 12 (1), 57-68. Jensen, M. C. (1986). Agency cost of free cash flow, corporate finance, and takeovers.
Journal of American Economic Review 76(2), 323-329. Jensen, M.C. and Meckling, W.H. (1976).Theory of the firm: managerial behaviour, agency costs and capital structures. Journal of Financial Economics, 3, 305-360.
Kalay, A.(1982).Stockholder-Bondholder Conflict and dividend constraints.Journal of Financial Economics, 211-233.
Karanja, J. (1987). The dividend practices of publicly quoted companies in Kenya. Unpublished MBA project, University of Nairobi.
Kitonga T.M. (2001). A survey of the opinions of management and external auditors of
publicly quoted companies of the need for a corporate Governance audit in Kenya.Unpublished MBA project, University of Nairobi.
Lang,K., Larry H.P. and Litzenberger, R. H. (1989). Dividend Announcements. Journal of Financial Economics 24, 181-191. Lintner, J. (1956). Distribution of income of corporations among dividends, retained earnings, and taxes.Journal of American Economic Review,46, 97-113.
Lloyd, W.P., Jahera, S.J. and Page, D.E. (1985).Agency cost and dividend payout ratios. Quarterly Journal of Business and Economics, 24(3)19-29.
Jensen, M. C. (1986). Agency Costs of Free Cash Flow, Corporate Finance and Takeover.Journal of American Economic Review; 76, 323-329. Miller, M. and Modigliani, F. (1961).Dividend policy, growth, and the valuation of
shares.Journal of Business,34, 411-433.

36
Miller, M. H. and Rock, K. (1985).Dividend policy under asymmetric information. Journal of Finance, 40, 1031 -1052. Miller, M. H. and Scholes, M. (1982). Dividends and taxes: Some empirical evidence. Journal ofPolitical Economy, 1118-1141.
Modigliani, F. and Miller, M. (1958). The cost of capital, corporation finance, and the theoryofinvestments.American Economic Review Journal,48, 261-297.
Moh’d, M.A., Perry, L.G. and Rimbey, J.N. (1995). An investigation of the dynamic Relationshipbetween agency theory and dividend policy.Financial Review, 30, 367-385. Mollah, K. S. (2000).The influence of agency costs and dividend policy in an emerging market: Evidence from the Dhaka stock exchange.Leeds University Business School.
Morck, R., Shleifer, A. and Vishny, R. (1988).Management ownership and market valuation:an empirical analysis. Journal of Financial Economics, 20, 293-315.
Mulinge, W. N. (2009). Effect of blockholder ownership on dividend policies: An empirical analysis of firms listed on NSE. Unpublished MBA Thesis, University of Nairobi.
Myers M. (2004).The Determinants of Corporate Dividend Policy. Academy of
Accountingand Financial Studies Journal, 1-12. Myers, S.C. and Majluf, N. (1984). Corporate financing and investment decisions when firms have information that investors donot have. Journal of Financial Economics, 13, 187-221.
Njoroge, J.K. (2001). Dividend policy, growth in assets, return on assets and return on equity at the Nairobi Stock Exchange.Unpublished MBA project,University of Nairobi.
Nairobi Securities Exchange, 2013. Nyumba A.G. (2011).Clientele effects in dividend distribution for firms quoted at the
Nairobi stock exchange.Unpublished MBA Thesis, University of Nairobi. Ochola, C. O. (2005). Shareholders pressure on firms’ decision to pay dividends at Nairobi Stock Exchange, Unpublished MBA Thesis, University of Nairobi. Oltetia J.K. (2002).Ownership structure and the financialperformance of Listed Companies in Kenya.Unpublished MBA Thesis, University of Nairobi.

37
Pandey, I. M. (2010).Financial Management (10th ed). India: Vikas Publishing House. Petit, R. R. (1972).Dividend announcements, security performance, and capital market Efficiency.Journal of Finance, 27, 993-1007. Pettit, R. R. (1977).Taxes, transactions costs and the clientele effect of dividends. Journal of Financial Economics,5 (3), 419-436.
Renneboog, H. and Trojanowski, G. (2007). Control structures and payout policy. ManagerialFinance, 33(1), 43-64.
Rozeff, M. S. (1982). Growth, beta and agency costs as determinants of dividend payout
ratios.The Journal of Financial Research, 5 (3), 249-259.
Ross, S. A.,Westerfield, R.W. and Jaffe J.F. (1990).Corporate finance, 2nd edition.McGraw-Hill, New York, NY.
Ross, S.A., Westerfield, R.W., Jaffe, J. and Jordan, B.D. (2008),Modern Financial Management,8th ed., McGraw-Hill, New York, NY.
Seita-Atmaja, L. (2010). Dividend and debt policies of family controlled firms, the
impact of board independence. International Journal of Managerial Finance, 6 (2), 128-142.
Shleifer, A. and Vishny, R. W.(1997).A Survey on Corporate Governance.Journal of Finance 52 (2), 737-783.
Thuku D.I. (2002). Ownership structure and Bank financial performance in Kenya. Unpublished MBA Thesis, University of Nairobi. Titman, S. and Wessels, R. (1988). The determinants of capital structure choice.Journal ofFinance,1-19.
Wairimu, K. (2002). The empirical relationship between dividends and investments decisions of firms quoted at the Nairobi Stock Exchange. Unpublished MBA Thesis, University of Nairobi.
Walter, J. (1963). Dividend policy: Its influence on the value of the enterprise, Journal
of Finance. 280-291.
Wei, G. (2004). Dividend policy and ownership structure in China. Working paper, Cardiff University.
Williams, J. (1988). Efficient signaling with dividends, investments and stock

38
repurchases.Journal of Finance 43, 737-747. Zeckhauser, R.J. and Pound, J. (1990).Are large shareholders effective monitors? An investigation of share ownership and corporate performance, in Hubbard, R.G. (Ed.),Asymmetric Information, Corporate Finance, and Investment, University of `Chicago Press, Chicago. Zheka, V. (2005).Corporate governance, ownership structure and corporate efficiency: Thecaseof Ukraine.Managerial and Decision Economics, 26 (7), 451-60.
39
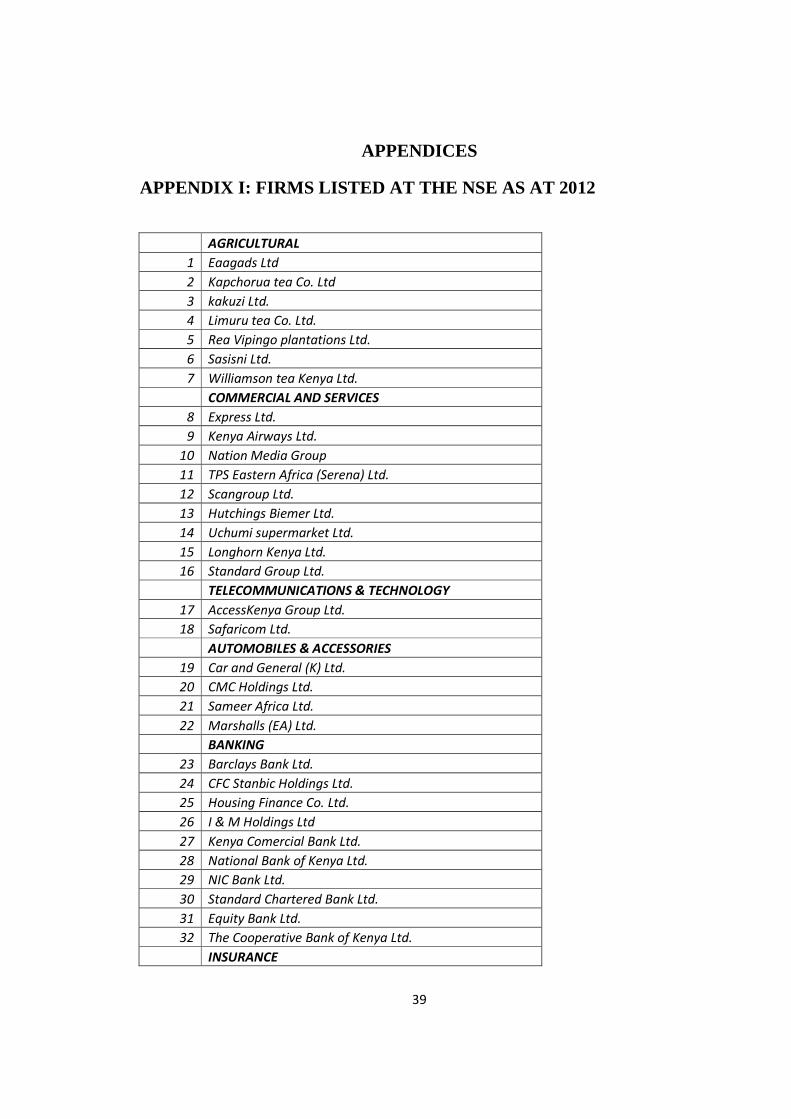
APPENDICES
APPENDIX I: FIRMS LISTED AT THE NSE AS AT 2012
AGRICULTURAL
1 Eaagads Ltd
2 Kapchorua tea Co. Ltd
3 kakuzi Ltd.
4 Limuru tea Co. Ltd.
5 Rea Vipingo plantations Ltd.
6 Sasisni Ltd.
7 Williamson tea Kenya Ltd.
COMMERCIAL AND SERVICES
8 Express Ltd.
9 Kenya Airways Ltd.
10 Nation Media Group
11 TPS Eastern Africa (Serena) Ltd.
12 Scangroup Ltd.
13 Hutchings Biemer Ltd.
14 Uchumi supermarket Ltd.
15 Longhorn Kenya Ltd.
16 Standard Group Ltd.
TELECOMMUNICATIONS & TECHNOLOGY
17 AccessKenya Group Ltd.
18 Safaricom Ltd.
AUTOMOBILES & ACCESSORIES
19 Car and General (K) Ltd.
20 CMC Holdings Ltd.
21 Sameer Africa Ltd.
22 Marshalls (EA) Ltd.
BANKING
23 Barclays Bank Ltd.
24 CFC Stanbic Holdings Ltd.
25 Housing Finance Co. Ltd.
26 I & M Holdings Ltd
27 Kenya Comercial Bank Ltd.
28 National Bank of Kenya Ltd.
29 NIC Bank Ltd.
30 Standard Chartered Bank Ltd.
31 Equity Bank Ltd.
32 The Cooperative Bank of Kenya Ltd.
INSURANCE

40
34 Jubilee Holdings Ltd.
35 Pan African Insurance Holdings Lotd.
36 Kenya Re-Insurance Corporation Ltd.
37 CFC Insurance Holdings
38 British-American Investments Company (Kenya) Ltd.
39 CIC Insurance Group
INVESTMENTS
39 City Trust Ltd.
40 Olympia Capital Holdings Ltd.
41 Centum Investment Co. Ltd.
42 Trans-Century Ltd.
MANUFUCTURING & ALLIED
43 BOC Kenya Ltd.
44 British American Tobacco Kenya Ltd.
45 Carbacid Investments Ltd.
46 East African Breweries Ltd.
47 Mumias Sugar Co. Ltd.
48 Unga Group Ltd.
49 Eveready East Africa Ltd.
50 Kenya Orchards Ltd.
51 A. Baumann CO Ltd.
CONTRUCTION & ALLIED
52 Athi River Mining
53 Bamburi Cement Ltd.
54 Crown Berger Ltd.
55 E.A. Cables Ltd.
56 E. A. Portland Cement Ltd.
ENERGY & PETROLEUM
57 KenolKobil
58 Total Kenya Ltd.
59 Kenya Power & Lighting Co. Ltd.
60 Kengen Ltd.

41
APPENDIX II: INTRODUCTION LETTER

42
APPENDIX III: DATA COLLECTION FORM
1.Name of firm…………………………………………………………………….
2.Industry of firm…………………………………………………………………
3.Dividend payout of firm
Year 2008 2009 2010 2011 2012
Amount in Kshs.
DPR
1. Ownership of firm
Year 2008 2009 2010 2011 2012
Local in Kshs.
Foreign in Kshs.
Total in Kshs.

43
APPENDIX IV: CHANGES IN PAYOUT, FOREIGN OWNERSHIP
AND LOCAL OWNERSHIP
2009 NSE Listed Firm ∆ Payout ∆ Foreign ∆ Local
1 Kakuzi ltd 0.144175 0.66 0.00
2 Limuru tea co. ltd 0.333333 -0.48 -0.66
3 Rea vipingo plantations ltd 0.201613 -0.10 0.10
4 Kenya Airways Ltd -0.11312 0.41 -0.04
5 Nation Media Group 0.710594 0.10 0.00
6 Scangroup Ltd 0.276243 14.63 0.00
7 TPS Eastern Africa (Serena) Ltd 0.376506 0.25 1.87
8 Safaricom Ltd 0.377358 0.95 0.01
9 Barclays Bank Ltd 2.232143 0.42 1.00
10 Diamond Trust Bank Kenya Ltd 0.201939 -0.83 30.17
11 Equity Bank Ltd 0.350877 2.50 -42.40
12 Housing Finance Co Ltd 0.490196 0.07 41.60
13 Kenya Commercial Bank Ltd 0.543478 0.61 -0.95
14 NIC Bank Ltd 0.181818 -0.04 -14.63
15 Standard Chartered Bank Ltd 0.729483 -0.49 -0.02
16 The Co-operative Bank of Kenya Ltd 0.235294 0.09 -0.25
17 Jubilee Holdings Ltd 0.245499 0.17 0.00
18 Kenya Re-Insurance Corporation Ltd 0.226244 -1.19 0.00
19 B.O.C Kenya Ltd 0.609137 0.02 0.00
20 British American Tobacco Kenya Ltd 0.947368 -0.55 -0.42
21 Carbacid Investments Ltd 0.662837 0.00 62.16
22 East African Breweries Ltd 0.924225 2.15 -12.01
23 Mumias Sugar Co. Ltd 0.380952 -0.55 -19.11
24 Bamburi Cement Ltd 0.600437 0.03 -33.14
25 Crown Berger Ltd 0.194704 -0.12 0.55
26 E.A.Cables Ltd 0.819672 -0.03 -0.17
27 Kengen ltd 0.531915 0.15 -0.61
28 Kenya Power & Lighting Co ltd 0.196271 -0.14 1.19
29 Kapchorua tea Co Ltd 0.363738 -0.13 0.83
30 Williamson tea Kenya Ltd 0.318725 -0.15 0.04
31 Express Ltd 0.767442 -0.53 0.19
32 Cfc Stanbic Holdings Ltd 3.076923 -1.03 0.39
33 Pan Africa Insurance Holdings Ltd 0.588235 -1.50 0.49
34 Everready East Africa 0 -0.09 0.10
35 Sameer Africa 0.877193 0.01 0.82
36 Centum Investments 0.789474 0.04 0.00

44
2010 NSE Listed Firm ∆ Payout ∆ Foreign ∆ Local
1 Kakuzi ltd 0.15753 -0.11 0.00
2 Limuru tea co. ltd 0.120192 -0.15 0.11
3 Rea vipingo plantations ltd 0.714286 0.03 -0.03
4 Kenya Airways Ltd 0.227273 3.80 0.01
5 Nation Media Group 0.818833 -0.35 0.00
6 Scangroup Ltd 0.331754 -0.16 0.00
7 TPS Eastern Africa (Serena) Ltd 0.284738 -2.18 -0.63
8 Safaricom Ltd 0.526316 1.12 -0.01
9 Barclays Bank Ltd 0.697436 0.03 0.02
10 Diamond Trust Bank Kenya Ltd 0.114058 0.14 -34.39
11 Equity Bank Ltd 0.414508 2.60 41.90
12 Housing Finance Co Ltd 0.424242 -0.11 -41.57
13 Kenya Commercial Bank Ltd 0.452899 2.01 -1.13
14 NIC Bank Ltd 0.108696 -0.04 0.15
15 Standard Chartered Bank Ltd 0.726588 0.00 -0.03
16 The Co-operative Bank of Kenya Ltd 0.305344 0.58 2.18
17 Jubilee Holdings Ltd 0.171875 -1.47 0.00
18 Kenya Re-Insurance Corporation Ltd 0.136187 0.35 0.00
19 B.O.C Kenya Ltd 2.315271 -0.63 0.00
20 British American Tobacco Kenya Ltd 0.990379 4.62 -0.03
21 Carbacid Investments Ltd 0.552486 -0.02 -62.44
22 East African Breweries Ltd 0.963656 0.45 12.70
23 Mumias Sugar Co. Ltd 0.38835 0.21 14.01
24 Bamburi Cement Ltd 0.606277 -1.08 33.18
25 Crown Berger Ltd 0.199681 0.02 -0.71
26 E.A.Cables Ltd 1.123596 0.02 1.47
27 Kengen ltd 0.561798 0.43 -2.01
28 Kenya Power & Lighting Co ltd 0.170321 0.51 -0.35
29 Kapchorua tea Co Ltd 0.175562 0.03 -0.03
30 Williamson tea Kenya Ltd 0.062469 -0.35 0.28
31 Express Ltd -0.68354 0.50 -0.04
32 Cfc Stanbic Holdings Ltd 0.122511 1.31 3.40
33 Pan Africa Insurance Holdings Ltd 0.2443 1.22 0.00
34 Everready East Africa 0 -0.06 -0.39
35 Sameer Africa 2.65 0.14 -0.62
36 Centum Investments 0.281407 -0.21 0.00

45
2011 NSE Listed Firm ∆ Payout ∆ Foreign ∆ Local
1 Kakuzi ltd 0.115823 1.68 0.00
2 Limuru tea co. ltd 0.222552 0.67 -24.63
3 Rea vipingo plantations ltd 0.141207 0.76 -0.76
4 Kenya Airways Ltd 0.196078 0.66 0.04
5 Nation Media Group 0.629426 0.87 0.00
6 Scangroup Ltd 0.27451 4.61 0.00
7 TPS Eastern Africa (Serena) Ltd 0.288889 -1.72 -3.82
8 Safaricom Ltd 0.666667 3.47 0.01
9 Barclays Bank Ltd 1.04698 0.39 0.11
10 Diamond Trust Bank Kenya Ltd 0.125475 1.83 33.05
11 Equity Bank Ltd 0.358423 3.88 -42.43
12 Housing Finance Co Ltd 0.444444 0.26 36.98
13 Kenya Commercial Bank Ltd 0.497312 10.24 -48.43
14 NIC Bank Ltd 0.090253 0.38 -29.98
15 Standard Chartered Bank Ltd 0.570539 0.15 16.52
16 The Co-operative Bank of Kenya Ltd 0.25974 1.58 -45.13
17 Jubilee Holdings Ltd 0.183333 0.56 0.00
18 Kenya Re-Insurance Corporation Ltd 0.127737 0.44 0.00
19 B.O.C Kenya Ltd 0.622568 0.01 29.99
20 British American Tobacco Kenya Ltd 0.984506 0.42 11.12
21 Carbacid Investments Ltd 0.56243 3.01 -2.53
22 East African Breweries Ltd 0.94086 3.53 -1.83
23 Mumias Sugar Co. Ltd 0.396825 0.79 -3.88
24 Bamburi Cement Ltd 0.692521 -7.94 -0.26
25 Crown Berger Ltd 0.173853 0.12 -0.77
26 E.A.Cables Ltd 0.695652 -1.19 -0.57
27 Kengen ltd 0.531915 -0.22 -10.24
28 Kenya Power & Lighting Co ltd 0.208333 2.92 -0.43
29 Kapchorua tea Co Ltd 0.156904 -0.03 0.12
30 Williamson tea Kenya Ltd 0.153909 -0.10 -0.62
31 Express Ltd -0.98485 -0.04 -0.32
32 Cfc Stanbic Holdings Ltd 0.13544 2.53 6.27
33 Pan Africa Insurance Holdings Ltd 0.262136 0.11 -0.15
34 Everready East Africa 0 0.00 -1.58
35 Sameer Africa 0.970149 0.78 -0.10
36 Centum Investments 0.331897 0.05 0.00

46
2012 NSE Listed Firm ∆ Payout ∆ Foreign ∆ Local
1 Kakuzi ltd 0.193798 -0.18 76.01
2 Limuru tea co. ltd 0.088339 0 0.00
3 Rea vipingo plantations ltd 0.173502 1.75 -1.75
4 Kenya Airways Ltd 0.226257 5.79 -74.73
5 Nation Media Group 0.627353 0.37 97.53
6 Scangroup Ltd 0.271493 5.91 97.53
7 TPS Eastern Africa (Serena) Ltd 0.361111 1.13 0.00
8 Safaricom Ltd 0.96875 2.81 -5.16
9 Barclays Bank Ltd 0.621118 1.46 -59.38
10 Diamond Trust Bank Kenya Ltd 0.108945 1.51 4.03
11 Equity Bank Ltd 0.383436 6.51 -9.36
12 Housing Finance Co Ltd 0.434783 1.14 0.00
13 Kenya Commercial Bank Ltd 0.462287 5.31 -2.02
14 NIC Bank Ltd 0.165837 17.08 23.35
15 Standard Chartered Bank Ltd 0.469925 0.17 52.07
16 The Co-operative Bank of Kenya Ltd 0.271739 0.22 43.93
17 Jubilee Holdings Ltd 0.2 0.11 98.84
18 Kenya Re-Insurance Corporation Ltd 0.1 0.6 98.84
19 B.O.C Kenya Ltd 0.499505 0.71 -24.11
20 British American Tobacco Kenya Ltd 0.99358 3.72 -35.62
21 Carbacid Investments Ltd 0.52356 0.33 -34.16
22 East African Breweries Ltd 0.650074 4.67 44.19
23 Mumias Sugar Co. Ltd 0.378788 2.85 -60.03
24 Bamburi Cement Ltd 0.862777 1.56 -1.91
25 Crown Berger Ltd 0.170999 4.39 -73.25
26 E.A.Cables Ltd 0.574713 -0.77 51.06
27 Kengen ltd 0.46875 0.01 14.66
28 Kenya Power & Lighting Co ltd 0.211864 0.91 0.78
29 Kapchorua tea Co Ltd 0.376317 -0.01 0.13
30 Williamson tea Kenya Ltd 0.613399 0.03 0.99
31 Express Ltd -0.75556 0.43 -0.56
32 Cfc Stanbic Holdings Ltd 0.138889 9.01 0.43
33 Pan Africa Insurance Holdings Ltd 0.356589 0.24 -0.53
34 Everready East Africa 0 0.02 -0.27
35 Sameer Africa 0.483333 0.73 -8.00
36 Centum Investments 0.254167 -0.51 71.24

47
APPENDIX V: RESIDUAL OUTPUTS
Observation Predicted Payout Residuals
Standard
Residuals
1 0.449153265 -0.304977948 -0.631394188
2 0.465899837 -0.132566504 -0.274451713
3 0.460159396 -0.258546492 -0.535267398
4 0.452834253 -0.565956425 -1.171696512
5 0.457211824 0.253382491 0.524576395
6 0.247854946 0.028388148 0.058771828
7 0.45435565 -0.077849626 -0.161171658
8 0.445057672 -0.067699182 -0.140157248
9 0.452172516 1.779970341 3.685062927
10 0.457246094 -0.255307483 -0.528561695
11 0.441434934 -0.090557741 -0.187481199
12 0.439284137 0.050911941 0.105402715
13 0.450327689 0.093150572 0.192849123
14 0.465818547 -0.284000366 -0.587964414
15 0.465818769 0.263664514 0.545863211
16 0.457477095 -0.222182977 -0.459984211
17 0.456235345 -0.210736164 -0.436285935
18 0.475814926 -0.249570582 -0.51668462
19 0.458453313 0.150683743 0.311959735
20 0.466815068 0.480553353 0.994886996
21 0.431156308 0.231680635 0.479647159
22 0.433079643 0.491145385 1.016815623
23 0.475055958 -0.094103577 -0.194822124
24 0.472950832 0.12748585 0.263933262
25 0.460218047 -0.265513997 -0.549692185
26 0.459258764 0.360413367 0.746161836
27 0.45682428 0.075090614 0.15545969
28 0.460162975 -0.263892121 -0.546334424
29 0.46022806 -0.096489951 -0.199762622
30 0.460905696 -0.142180596 -0.294355716
31 0.466343996 0.301097864 0.623361272
32 0.473391003 2.603532074 5.390078308
33 0.480118141 0.108117153 0.223834354
34 0.460024961 -0.460024961 -0.952387177
35 0.458172211 0.419020771 0.867496427
36 0.458201255 0.331272429 0.68583151
37 0.460268413 -0.302738482 -0.626757835
38 0.46087264 -0.340680333 -0.705308642
39 0.458352637 0.255933078 0.52985686

48
40 0.403953099 -0.176680372 -0.365780414
41 0.463727338 0.355105825 0.73517366
42 0.460980436 -0.129226881 -0.26753771
43 0.490433536 -0.205695495 -0.425850267
44 0.442524447 0.083791343 0.173472762
45 0.458252623 0.239183275 0.495179834
46 0.472018429 -0.357960073 -0.741082795
47 0.402643598 0.011864174 0.024562334
48 0.478736407 -0.054493983 -0.112818596
49 0.430274099 0.022624451 0.046839279
50 0.459295577 -0.350599925 -0.72584512
51 0.458698666 0.267889063 0.554609272
52 0.449448472 -0.144104961 -0.298339718
53 0.479839161 -0.307964161 -0.637576529
54 0.453654205 -0.317467434 -0.657251104
55 0.467812408 1.847458528 3.824783353
56 0.392163426 0.598215747 1.238482812
57 0.48666722 0.065818968 0.136264652
58 0.446649823 0.517006565 1.070355882
59 0.449508011 -0.061158496 -0.126616102
60 0.459605584 0.146671163 0.303652513
61 0.458746811 -0.2590663 -0.536343552
62 0.457768202 0.665827304 1.378458649
63 0.453356763 0.108440989 0.224504791
64 0.451493867 -0.281172385 -0.582109661
65 0.45831338 -0.282751583 -0.585379065
66 0.463626679 -0.401157913 -0.830515048
67 0.451529034 -1.135073337 -2.349936164
68 0.438331824 -0.315820339 -0.653841132
69 0.441138179 -0.196838505 -0.407513688
70 0.459761843 -0.459761843 -0.951842447
71 0.456977496 2.193022504 4.540202576
72 0.461727666 -0.180320631 -0.373316822
73 0.434507002 -0.318683766 -0.659769269
74 0.45998558 -0.237433651 -0.491557597
75 0.448101389 -0.306894713 -0.635362458
76 0.449188858 -0.253110426 -0.52401314
77 0.446180659 0.18324499 0.379371107
78 0.392280068 -0.117770264 -0.243819138
79 0.485201194 -0.196312305 -0.406424298
80 0.408705226 0.257961441 0.53405617
81 0.453051778 0.593928088 1.229606094
82 0.417689403 -0.292214117 -0.6049693

49
83 0.421613592 -0.063190653 -0.130823265
84 0.438575206 0.005869238 0.012151052
85 0.33261467 0.164697158 0.340971632
86 0.466535763 -0.376283056 -0.779016766
87 0.449233385 0.121306035 0.251139224
88 0.455957279 -0.196217019 -0.406227028
89 0.450648355 -0.267315022 -0.553420838
90 0.452377786 -0.32464056 -0.672101587
91 0.445276542 0.177291552 0.367045736
92 0.447736831 0.536769302 1.11127057
93 0.416460446 0.14596925 0.302199345
94 0.408657296 0.532202919 1.101816812
95 0.449054327 -0.05222893 -0.108129269
96 0.573264607 0.119256169 0.246895398
97 0.457333209 -0.283480636 -0.586888421
98 0.476120582 0.219531592 0.454495063
99 0.466429696 0.065485197 0.135573648
100 0.416828961 -0.208495628 -0.431647365
101 0.459099056 -0.302195291 -0.625633268
102 0.460433184 -0.306523888 -0.63459474
103 0.459438508 -1.444286993 -2.990099516
104 0.419476598 -0.284036417 -0.588039052
105 0.457198644 -0.195062721 -0.403837292
106 0.459417598 -0.459417598 -0.951129758
107 0.447522073 0.52262718 1.081992212
108 0.457998436 -0.126101884 -0.261068046
109 0.427609608 -0.233811158 -0.48405797
110 0.458721025 -0.370381803 -0.766799434
111 0.434274655 -0.260773078 -0.539877087
112 0.408411865 -0.182154882 -0.377114263
113 0.410142133 0.217210439 0.449689591
114 0.330300081 -0.058806868 -0.12174754
115 0.442435359 -0.081324248 -0.168365149
116 0.420508165 0.548241835 1.135022093
117 0.464007825 0.157110188 0.325264368
118 0.435167942 -0.326222988 -0.67537768
119 0.369045714 0.014389869 0.029791268
120 0.442291083 -0.007508474 -0.015544753
121 0.38308928 0.079197825 0.163962827
122 0.202211311 -0.036373831 -0.075304545
123 0.433182845 0.036741967 0.076066696
124 0.436068209 -0.164329078 -0.340209598
125 0.413308163 -0.213308163 -0.441610732

50
126 0.406246321 -0.306246321 -0.634020095
127 0.459175377 0.040330064 0.083495112
128 0.42089914 0.572680805 1.18561796
129 0.469112011 0.054448199 0.11272381
130 0.371819511 0.278254784 0.576069367
131 0.444262658 -0.065474779 -0.13555208
132 0.437081773 0.425695548 0.881315181
133 0.427931221 -0.256932589 -0.531926143
134 0.447175658 0.127536986 0.26403913
135 0.452076298 0.016673702 0.034519475
136 0.445257845 -0.233393438 -0.483193168
137 0.458807488 -0.082490378 -0.170779382
138 0.457849048 0.155549715 0.32203373
139 0.452772099 -1.208327654 -2.501594178
140 0.328674742 -0.189785853 -0.392912621
141 0.455496107 -0.098906959 -0.20476654
142 0.458550722 -0.458550722 -0.949335068
143 0.451745934 0.031587399 0.065395221
144 0.434481394 -0.180314727 -0.3733046
Related Documents