www.cbo.gov/publication/53270 Working Paper Series Congressional Budget Office Washington, DC Effects of Medicare Advantage Enrollment on Beneficiary Risk Scores Alice Burns Congressional Budget Office [email protected] Tamara Hayford Congressional Budget Office [email protected] Working Paper 2017-08 November 2017 To enhance the transparency of the work of the Congressional Budget Office and to encourage external review of that work, CBO’s working paper series includes papers that provide technical descriptions of official CBO analyses as well as papers that represent independent research by CBO analysts. Papers in this series are available at http://go.usa.gov/ULE. This paper has not been subject to CBO’s regular review and editing process. The views expressed here should not be interpreted as CBO’s. The authors thank the following staff of the Congressional Budget Office: Tom Bradley, Lyle Nelson, and Daria Pelech for their helpful comments; Linda Bilheimer, Jeffrey Kling, and Paul Masi (formerly of CBO), for their technical assistance and guidance; Ben Layton for fact-checking; and Elizabeth Schwinn for editing.

Welcome message from author
This document is posted to help you gain knowledge. Please leave a comment to let me know what you think about it! Share it to your friends and learn new things together.
Transcript

www.cbo.gov/publication/53270
Working Paper Series
Congressional Budget Office Washington, DC
Effects of Medicare Advantage Enrollment on Beneficiary Risk Scores
Alice Burns Congressional Budget Office
Tamara Hayford Congressional Budget Office
Working Paper 2017-08
November 2017
To enhance the transparency of the work of the Congressional Budget Office and to encourage external review of that work, CBO’s working paper series includes papers that provide technical descriptions of official CBO analyses as well as papers that represent independent research by CBO analysts. Papers in this series are available at http://go.usa.gov/ULE.
This paper has not been subject to CBO’s regular review and editing process. The views expressed here should not be interpreted as CBO’s.
The authors thank the following staff of the Congressional Budget Office: Tom Bradley, Lyle Nelson, and Daria Pelech for their helpful comments; Linda Bilheimer, Jeffrey Kling, and Paul Masi (formerly of CBO), for their technical assistance and guidance; Ben Layton for fact-checking; and Elizabeth Schwinn for editing.

Abstract
Medicare beneficiaries may receive services through a traditional fee-for-service (FFS) program or they
may enroll in Medicare Advantage (MA), under which they select a private health insurance plan.
Medicare pays the MA plan to provide beneficiaries’ health care services. Medicare adjusts payments to
MA plans based on beneficiaries’ demographic characteristics and documented health conditions: those
traits are summarized in a risk score that estimates the relationship between beneficiary characteristics
and FFS Medicare spending. Recent literature finds that health conditions are documented more
thoroughly for MA enrollees than for FFS beneficiaries. As a result, beneficiaries enrolled in MA plans
are assigned higher risk scores than identical beneficiaries in the FFS program, prompting concerns that
Medicare is overpaying MA plans. This paper explores the mechanisms contributing to differences in MA
and FFS risk scores.
Using Medicare administrative data from 2008–2013, we employ a difference-in-differences model to
compare the growth in risk scores of Medicare beneficiaries who switch from FFS to MA (switchers) to
the risk-score growth of beneficiaries who remain in FFS (stayers). We find that the risk scores of
switchers grew faster than those of stayers, and the effect of MA enrollment on risk scores rose from a 5.0
percent increase in 2009 to an 8.3 percent increase in 2012. Risk scores for MA enrollees who stayed with
the same insurer increased an additional 1.5 percent for each continuous year of enrollment. This model
suggests that over time, the effects of MA enrollment on risk scores increased for all beneficiaries
regardless of the duration of enrollment with a particular insurer. However, risk scores also increased
more for beneficiaries who remained with the same insurer. For example, among beneficiaries who
switched MA plans in 2009 but remained with the same insurer, continuous enrollment with that insurer
accounted for 18.3 percent of risk score growth in 2010 and 34.7 percent of risk score growth in 2012.
That finding may suggest a competitive advantage for established MA plans if those plans receive higher
payments than new entrants for serving similar beneficiaries.
Keywords: Medicare, Medicare Advantage, selection, risk adjustment
JEL Classification: I13, I18, H51

Contents Introduction ................................................................................................................................................... 1
Policy Background ........................................................................................................................................ 1
Risk Scores in FFS and MA ...................................................................................................................... 2
Adjustments for Differences in Coding Intensity ..................................................................................... 2
Data and Methods ......................................................................................................................................... 4
Differences Between Switchers and Stayers ............................................................................................. 5
Estimation Strategy ................................................................................................................................... 6
Results ........................................................................................................................................................... 8
Mechanisms Contributing to Coding Differences................................................................................... 10
Specification Tests .................................................................................................................................. 11
Discussion ................................................................................................................................................... 13
References ................................................................................................................................................... 16

1
Introduction
Medicare beneficiaries may elect to receive their health care services through the traditional fee-for-
service (FFS) system or through a managed care plan in the Medicare Advantage (MA) program. Under
the FFS system, the government generally pays providers based on the services beneficiaries use and
bears the risk of higher-than-expected health care costs. By contrast, in the MA program, the government
pays insurance plans a flat fee (or capitation), and the plan in turn pays providers. Under the MA system,
plans bear the risk if health care costs exceed Medicare’s payments. In 2015, 31 percent of Medicare
beneficiaries were enrolled in MA (Kaiser Family Foundation 2015).
Insurers in the MA program have an incentive to enroll beneficiaries who the insurer expects will cost
less than the Medicare capitation for that beneficiary. The Medicare program attempts to address that by
using a relatively sophisticated risk adjustment mechanism that makes it more difficult for insurers to
prospectively determine which individuals will have costs below what Medicare pays. That risk
adjustment system assigns all beneficiaries a risk score that adjusts payments to MA plans based on
beneficiaries’ demographic characteristics and health conditions. As a result, insurers have an incentive to
find ways to provide health care that costs less than what Medicare FFS would have paid, and to increase
Medicare payments by documenting conditions more thoroughly than those conditions would have been
documented in the FFS system. This paper aims to identify the extent to which insurers are engaging in
the latter activity.
More specifically, this study uses risk-score data for individual beneficiaries in MA and FFS to explore
how MA enrollment affects enrollees’ risk scores. Consistent with prior research, we find substantive
coding differences between FFS and MA and that those differences are growing over time. We add to
prior research by decomposing the mechanisms behind that growth. We explore whether the fact that
coding differences continued to grow over time is a function of the fact that MA insurers gather additional
data on enrollees over time or whether it reflects more general increases in coding intensity across all MA
enrollees regardless of time with the same insurer. We find the majority of risk score differences are
attributable to increases that affected all beneficiaries but also find a nontrivial increase in risk scores for
enrollees who remain with the same insurer.
Policy Background
MA plans are paid using a methodology that reflects local health care spending, bids by plans, plan
quality, and enrollees’ characteristics. Each year, plans submit bids to the Centers for Medicare &
Medicaid Services (CMS) with the price they propose to charge to provide benefits under Medicare Part
A and Part B to an average Medicare beneficiary.1 CMS compares those bids to benchmarks that reflect
Medicare’s FFS spending at the county or regional level. If the bid is less than the benchmark, which is
true for most plans, the plan’s base payment includes a rebate that reflects the difference between the bid
and benchmark. (Although CMS pays the rebate to MA plans, the plans must pass the rebate on to
enrollees in the form of additional benefits or lower premiums.) If the bid equals the benchmark, the
plan’s base payment equals the benchmark. If the bid is greater than the benchmark, the plan’s base
payment equals the benchmark plus a premium paid by enrollees. That premium equals the difference
1 MA plans also submit bids to provide prescription drug benefits under Part D—which has its own risk-adjustment
system—but this paper analyzes risk scores derived from Part A and B benefits only.

2
between the bid and the benchmark. Beginning in 2012, CMS has adjusted benchmarks and rebates based
on each plan’s quality ratings (Medicare Payment Advisory Commission 2016a).
CMS also adjusts the base payments for enrollees’ characteristics. Initially, payments were only adjusted
for enrollees’ age, gender, Medicaid eligibility, residence in a nursing home (or similar institution that
provides long-term care), and whether the beneficiary gained eligibility for Medicare on the basis of age
or disability (i.e., demographic characteristics). The Balanced Budget Act of 1997 required CMS to
incorporate information about health status into those adjustments. Between 2004 and 2007, CMS phased
in the current risk-adjustment system, which uses diagnosis information to classify beneficiaries’ health
conditions into Hierarchical Condition Categories (HCCs).
Risk Scores in FFS and MA CMS uses an algorithm to derive a single risk score for each enrollee based on HCCs and other
beneficiary characteristics. That algorithm reflects the relationship between beneficiary characteristics
and spending in the FFS population (CMS 2013, CMS Medicare Plan Payment Group 2011). An
enrollee’s risk score represents the expected difference in spending for each Medicare beneficiary relative
to spending for a FFS beneficiary with average risk. CMS centers FFS risk scores around 1.0. Higher
numbers reflect higher expected spending and lower numbers reflect lower expected spending.
HCCs for beneficiaries in FFS Medicare are obtained from claims that providers submit to receive
payment for services. For many types of providers, HCCs in the FFS population are informational only
and do not affect payment.2 In MA, health plans report enrollees’ HCCs to CMS each quarter, along with
the type of providers that treated the diagnosed conditions and applicable service dates. Demographic
characteristics and HCCs determine risk scores, and CMS multiplies the base payment to MA plans by
those scores (thus increasing payments for higher-risk individuals and reducing them for lower-risk
individuals). Because there are different incentives for MA plans than for FFS providers, health
conditions for MA beneficiaries are widely thought to be more comprehensively documented than are
health conditions for FFS beneficiaries, resulting in a “coding intensity difference” between FFS and MA
risk scores (CMS 2009, pp. 7–11, GAO 2013).
Adjustments for Differences in Coding Intensity To address differences in coding intensity, the Deficit Reduction Act of 2005 required CMS to adjust risk
scores for MA beneficiaries before calculating payment amounts. Between 2010 and 2013, CMS’s
adjustments reduced risk scores by 3.41 percent. In response to concerns that the adjustments were lower
than coding differences, the Affordable Care Act (ACA) established minimum adjustments for 2014 and
beyond. The American Taxpayer Relief Act of 2012 increased the statutory minimums to 4.91 percent in
2014, rising gradually to 5.9 percent by 2019. The statutory minimums will end if CMS switches to a
risk-adjustment system that relies on MA diagnoses and spending data (Medicare Payment Advisory
Commission 2015, p. 329).3
Challenges in Estimating Differences in Coding Intensity. Estimating the magnitude of the difference
in coding intensity between MA and FFS is a challenge because differences in risk scores can reflect both
coding intensity and selection—the different health profiles of individuals who choose MA rather than
2 Payments for inpatient hospital care reflect both health status and services provided using diagnosis-related groups.
CMS is also testing several demonstration programs that involve using HCCs to adjust provider payments.
3 CMS began incorporating MA diagnoses and spending data into the risk-adjustment system in 2015 and intends to
rely solely on those data by 2020 (GAO 2017).

3
FFS. Selection may occur if the beneficiaries who choose to enroll in MA have different health
characteristics than beneficiaries who remain in FFS. Indeed, research suggests that before the
implementation of the current risk adjustment system, beneficiaries in MA tended to be healthier, with
less morbidity and lower mortality rates than FFS beneficiaries with similar demographic characteristics
(McGuire, Newhouse, and Sinaiko 2011, Morgan et al. 1997, Newhouse 2002, Riley and Zarabozo 2006).
By increasing payments for higher-risk individuals and reducing them for lower-risk individuals,
incorporating health conditions into risk adjustment mechanisms reduces plans’ ability to identify and
disproportionately enroll individuals who would be likely to cost plans less than Medicare’s capitated
payments. Evidence on whether selection still exists in MA is mixed, though most studies find that risk
adjustment has reduced its magnitude. (Brown and others 2014, Chao and Wu 2013, Jacobson, Neuman,
and Damico 2015, McWilliams, Hsu, and Newhouse 2012, Morrisey and others 2013, Newhouse and
McGuire 2014, Newhouse et al. 2012, Newhouse et al. 2013, Newhouse et al. 2014).
Previous Estimates of Coding Intensity Differences. Selection confounds the analysis of coding
intensity differences because it would imply that all else being equal, MA enrollees have different risk
scores than beneficiaries in Medicare FFS. Existing studies of coding intensity take different approaches
to accounting for this challenge. Two studies, by CMS and the Government Accountability Office
(GAO), used administrative Medicare data on individual beneficiaries to estimate changes in risk scores
over time for FFS and MA beneficiaries by comparing risk score growth among FFS stayers
(beneficiaries with at least two years consecutive enrollment in FFS) to MA stayers (beneficiaries with at
least two years consecutive enrollment in MA). Using this approach, CMS concluded that risk scores for
MA beneficiaries grew 1.75 percent faster than risk scores for FFS beneficiaries for each year of MA
enrollment between 2004 and 2007 (CMS 2009, pp. 7–11). GAO estimated that the coding intensity
difference was 4.2 percent in 2010 (GAO 2013, p. 3).
Other studies that used alternative methods to account for selection have found somewhat larger
differences in coding intensity. Kronick and Welch analyzed risk score growth among FFS and MA
beneficiary cohorts, finding that on average, MA risk scores increased from 90 percent of average FFS
risk scores in 2004 to 109 percent of FFS risk scores in 2013. They used a decomposition analysis to
attribute the growth in risk scores to various causes, including beneficiaries switching into and out of MA,
beneficiaries entering the Medicare program, and beneficiaries dying. After accounting for various causes
of differential growth, the authors concluded that most of the differential growth was attributable to more
intensive coding in the MA population (Kronich and Welch 2014). Similarly, using aggregate data on the
way that county-level risk scores vary with changes in MA penetration, Geruso and Layton estimate that
the risk scores of MA enrollees are roughly 6 to 16 percent higher than they would have been had those
beneficiaries remained in the FFS program (Geruso and Layton 2015).
Finally, the Medicare Payment Advisory Commission (MedPAC) calculated the ratio of the average risk
score of beneficiaries who switched from FFS to MA (switchers) relative to the average risk score of
beneficiaries who remained in FFS (stayers) for several cohorts of switchers. That analysis found that the
ratio of the risk scores of switchers to the risk scores of stayers increased by at least 6 percent during the
first year of MA enrollment and an additional 2 percent for each subsequent year of MA enrollment. As a
result, the total difference between risk scores was likely 6 percent or more in 2014 (Medicare Payment
Advisory Commission 2016b). In an updated analysis in 2017, MedPAC estimated that in 2015,
differences in coding intensity resulted in MA enrollees having risk scores that were roughly 10 percent
higher than scores for similar FFS beneficiaries (Medicare Payment Advisory Commission 2017, p.347-
348).
Although there are few studies on coding differences, the size of the effects is fairly similar across
studies, and several studies show that the differences between FFS beneficiaries and MA enrollees are
increasing over time. A number of different mechanisms might explain the increasing coding differences

4
between MA and FFS. For example, MedPAC found that after switching to MA, beneficiaries’ risk scores
grew more rapidly than stayers’ risk scores and that the difference in growth rates was directly related to
the time beneficiaries remained enrolled in MA. That could occur as a result of insurers collecting more
information about beneficiaries and more accurately documenting their chronic conditions. In that case,
the increase in coding differences would occur at an individual level and reflect the length of enrollment
in MA—e.g., increasing differences in coding intensity would be a function of individual beneficiaries’
enrollment duration.
An alternative explanation for the increasing coding differences between MA and FFS would be that
coding differences increased over time for all MA enrollees irrespective of how long they were enrolled
in MA. For example, coding differences for all enrollees would increase if insurers became more adept at
identifying and documenting beneficiaries’ health conditions or if more insurers begin to adopt practices
that allow them to thoroughly code beneficiary health conditions. Practices such as administering a health
risk assessment to enrollees or working with network providers to comprehensively code medical claims
may allow plans to more accurately document beneficiary health conditions but they also create costs for
the plans. The technology supporting those practices might have improved, thereby allowing insurers to
more precisely document risk, or the technology might have become more accessible or affordable,
allowing a wider number of insurers to adopt such practices. Alternatively, insurers that are better at
documenting risk might be able to reduce their bids and thus could offer better benefits and attract a larger
percentage of MA enrollees. If it is the case that a higher percentage of enrollees select insurers that
document HCCs more intensively, then average coding intensity would increase across all MA enrollees.
Although existing research suggests that both enrollment duration and time have contributed to increasing
coding differences, research has not explicitly explored the relative contributions of each mechanism.
This study builds upon existing research by further analyzing the growth in risk scores over time: It
explicitly tests three models of risk-score growth and decomposes the respective contributions of
enrollment duration and calendar year to the increased differences in coding intensity.
Data and Methods
Our analysis relied on Medicare administrative data that included information on demographic
characteristics, program enrollment, and beneficiary risk scores. We linked each year’s risk score data
with the prior year’s demographic and enrollment data because risk scores for a given year adjust
payments to plans for that year, but reflect conditions documented in the prior year. For example, the
2009 risk score data reflect the chronic conditions documented during 2008. That documentation in turn
was affected by whether the beneficiary was enrolled in MA or FFS in 2008. For that reason, the
demographic and enrollment data come from the 2008–2012 beneficiary summary files and the risk score
data come from the 2009–2013 risk adjustment files.
To estimate the effect of MA enrollment on risk scores, we restricted the study population to beneficiaries
who were continuously enrolled in Medicare from 2008 through 2013 and were also exclusively enrolled
in FFS during 2008. Continuous enrollment allowed us to observe the growth in risk scores over time, and
the availability of a FFS-based risk score for all beneficiaries in 2008 ensured that we were able to
measure the growth in risk scores from a common FFS baseline. We divided the study population into
stayers and switchers: stayers include beneficiaries that remained in FFS for the entire study period and
switchers include beneficiaries who switched from FFS to MA in any year from 2009 through 2013. That
strategy allowed us to limit the effects of selection because we compared the growth in switcher and

5
stayer risk scores from a common FFS baseline. Among switchers, we excluded beneficiaries in plans
other than health maintenance organizations, preferred provider organizations, private FFS plans, and
special needs plans.4 We also excluded switchers if they switched back to FFS during the study period so
that we could focus on the effects of switching from FFS to MA. Those selection criteria resulted in a
study population comprising 21.0 million stayers and 2.3 million switchers.
Differences Between Switchers and Stayers Switchers and stayers have somewhat similar demographic characteristics (Figure 1) but very different
risk score patterns (Figure 2). Descriptive data show that switchers and stayers were largely similar in
terms of demographic and eligibility characteristics. Switchers were younger than stayers, more likely to
be a minority race or ethnicity, more likely to have originally been eligible for Medicare on the basis of
disability, and less likely to have spent six or more months in an institution.
Figure 1. Characteristics of Beneficiaries Who Switch to MA (Switchers) and Beneficiaries Who
Stay in FFS (Stayers), 2008
(Percentage of Beneficiaries)
Source: Authors’ analysis of Medicare beneficiary summary file and risk adjustment data, 2008–2013.
4 For more information on types of MA plans see CMS, Medicare Managed Care Manual, Chapter 1 – General
Provisions, (January 7, 2011), Section 20 – Types of MA Plans, https://www.cms.gov/Regulations-and-
Guidance/Guidance/Manuals/downloads/mc86c01.pdf.
1
14
24
2
5
9
83
57
21
39
22
18
0
15
30
3
11
13
73
55
13
37
27
22
Institutionalized
Medicaid-eligible
Originally eligible due to disability
Asian
Hispanic
Black
White
Female
Age 80 and older
Age 70–79
Age 65–69
Under age 65
Switchers Stayers
6
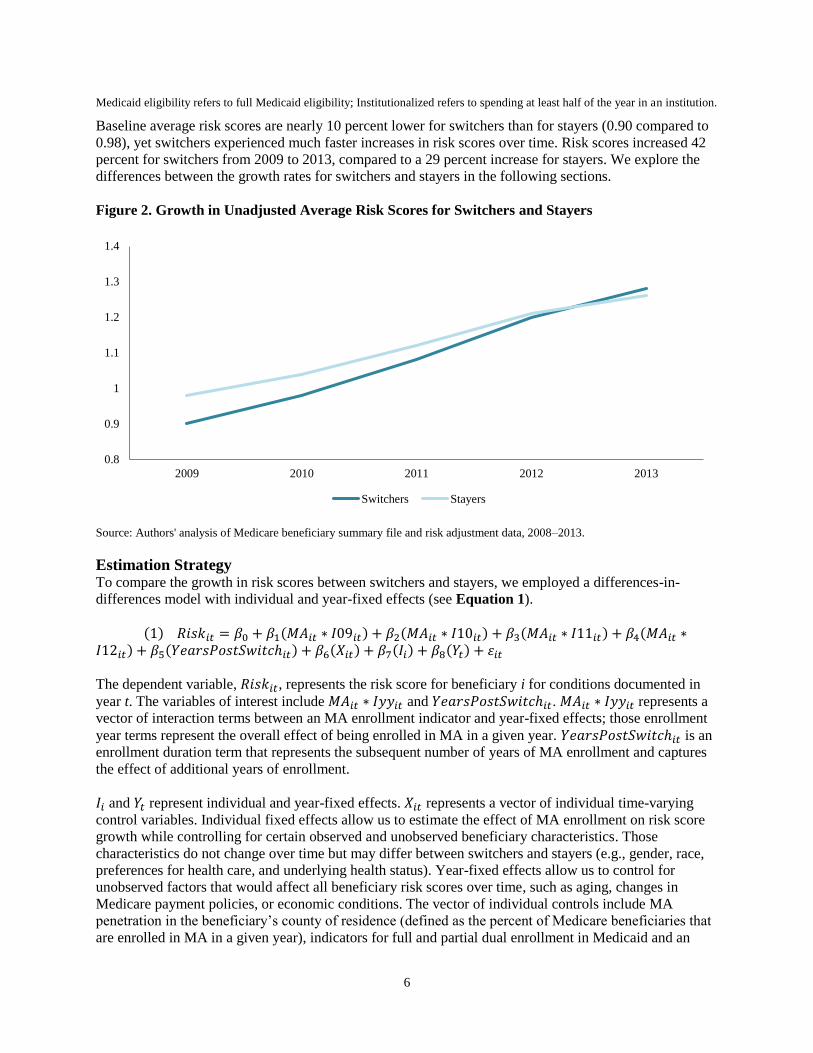
Medicaid eligibility refers to full Medicaid eligibility; Institutionalized refers to spending at least half of the year in an institution.
Baseline average risk scores are nearly 10 percent lower for switchers than for stayers (0.90 compared to
0.98), yet switchers experienced much faster increases in risk scores over time. Risk scores increased 42
percent for switchers from 2009 to 2013, compared to a 29 percent increase for stayers. We explore the
differences between the growth rates for switchers and stayers in the following sections.
Figure 2. Growth in Unadjusted Average Risk Scores for Switchers and Stayers
Source: Authors' analysis of Medicare beneficiary summary file and risk adjustment data, 2008–2013.
Estimation Strategy To compare the growth in risk scores between switchers and stayers, we employed a differences-in-
differences model with individual and year-fixed effects (see Equation 1).
(1) 𝑅𝑖𝑠𝑘𝑖𝑡 = 𝛽0 + 𝛽1(𝑀𝐴𝑖𝑡 ∗ 𝐼09𝑖𝑡) + 𝛽2(𝑀𝐴𝑖𝑡 ∗ 𝐼10𝑖𝑡) + 𝛽3(𝑀𝐴𝑖𝑡 ∗ 𝐼11𝑖𝑡) + 𝛽4(𝑀𝐴𝑖𝑡 ∗𝐼12𝑖𝑡) + 𝛽5(𝑌𝑒𝑎𝑟𝑠𝑃𝑜𝑠𝑡𝑆𝑤𝑖𝑡𝑐ℎ𝑖𝑡) + 𝛽6(𝑋𝑖𝑡) + 𝛽7(𝐼𝑖) + 𝛽8(𝑌𝑡) + 𝜀𝑖𝑡
The dependent variable, 𝑅𝑖𝑠𝑘𝑖𝑡, represents the risk score for beneficiary i for conditions documented in
year t. The variables of interest include 𝑀𝐴𝑖𝑡 ∗ 𝐼𝑦𝑦𝑖𝑡 and 𝑌𝑒𝑎𝑟𝑠𝑃𝑜𝑠𝑡𝑆𝑤𝑖𝑡𝑐ℎ𝑖𝑡. 𝑀𝐴𝑖𝑡 ∗ 𝐼𝑦𝑦𝑖𝑡 represents a
vector of interaction terms between an MA enrollment indicator and year-fixed effects; those enrollment
year terms represent the overall effect of being enrolled in MA in a given year. 𝑌𝑒𝑎𝑟𝑠𝑃𝑜𝑠𝑡𝑆𝑤𝑖𝑡𝑐ℎ𝑖𝑡 is an
enrollment duration term that represents the subsequent number of years of MA enrollment and captures
the effect of additional years of enrollment.
𝐼𝑖 and 𝑌𝑡 represent individual and year-fixed effects. 𝑋𝑖𝑡 represents a vector of individual time-varying
control variables. Individual fixed effects allow us to estimate the effect of MA enrollment on risk score
growth while controlling for certain observed and unobserved beneficiary characteristics. Those
characteristics do not change over time but may differ between switchers and stayers (e.g., gender, race,
preferences for health care, and underlying health status). Year-fixed effects allow us to control for
unobserved factors that would affect all beneficiary risk scores over time, such as aging, changes in
Medicare payment policies, or economic conditions. The vector of individual controls include MA
penetration in the beneficiary’s county of residence (defined as the percent of Medicare beneficiaries that
are enrolled in MA in a given year), indicators for full and partial dual enrollment in Medicaid and an
0.8
0.9
1
1.1
1.2
1.3
1.4
2009 2010 2011 2012 2013
Switchers Stayers

7
indicator for spending at least half of the year in an institution.5 We did not control for gender, race, or
other beneficiary characteristics that remain constant over time because the individual fixed effects
account for those differences.6
Our second model refines the first model by replacing the enrollment duration term with one that reflects
the number of years switchers stayed with their current insurer. Among people in the 2009-2011 switch
cohorts, 63 percent remained with the same insurer during the analysis period; specifically, 50 percent of
the 2009 cohort, 61 percent of the 2010 cohort, and 88 percent of 2011 cohort did not switch insurers
during the study period (the 2012 switch cohort are only enrolled in MA for one year). If the effect of MA
duration is driven by plans learning more about enrollees, then it is relevant whether enrollees remain
with the same insurer or switch between insurers. In Equation 2, 𝑌𝑒𝑎𝑟𝑠𝑃𝑜𝑠𝑡𝑆𝑤𝑖𝑡𝑐ℎ_𝐼𝑛𝑠𝑖𝑡 is constructed
similarly to 𝑌𝑒𝑎𝑟𝑠𝑃𝑜𝑠𝑡𝑆𝑤𝑖𝑡𝑐ℎ𝑖𝑡, but represents the number of years since switching to a particular
insurer rather than the number of years since switching to MA.7
(2) 𝑅𝑖𝑠𝑘𝑖𝑡 = 𝜑0 + 𝜑1(𝑀𝐴𝑖𝑡 ∗ 𝐼09𝑖𝑡) + 𝜑2(𝑀𝐴𝑖𝑡 ∗ 𝐼10𝑖𝑡) + 𝜑3(𝑀𝐴𝑖𝑡 ∗ 𝐼11𝑖𝑡) + 𝜑4(𝑀𝐴𝑖𝑡 ∗𝐼12𝑖𝑡) + 𝜑5(𝑌𝑒𝑎𝑟𝑠𝑃𝑜𝑠𝑡𝑆𝑤𝑖𝑡𝑐ℎ_𝐼𝑛𝑠𝑖𝑡) + 𝜑6(𝑋𝑖𝑡) + 𝜑7(𝐼𝑖) + 𝜑8(𝑌𝑡) + 𝜀𝑖𝑡
Our third model is a robustness check in which we replicated the approach used by MedPAC. That
analysis also compared risk score growth between switchers and stayers, but differed from ours in a key
regard. The MedPAC analysis allowed the effect of switching from FFS to MA to change over time but it
did not allow the effect of enrollment in MA to change over time (as ours does). For that reason,
Equation 3 replaces the enrollment year terms from Equation 1 with indicators for the year in which
beneficiaries switched into MA.
(3) 𝑅𝑖𝑠𝑘𝑖𝑡 = 𝛾0 + 𝛾1(𝑀𝐴𝑖𝑡 ∗ 𝑆𝑤𝑖𝑡𝑐ℎ09𝑖) + 𝛾2(𝑀𝐴𝑖𝑡 ∗ 𝑆𝑤𝑖𝑡𝑐ℎ10𝑖) + 𝛾3(𝑀𝐴𝑖𝑡 ∗ 𝑆𝑤𝑖𝑡𝑐ℎ11𝑖)+ 𝛾4(𝑀𝐴𝑖𝑡 ∗ 𝑆𝑤𝑖𝑡𝑐ℎ12𝑖) + 𝛾5(𝑌𝑒𝑎𝑟𝑠𝑃𝑜𝑠𝑡𝑆𝑤𝑖𝑡𝑐ℎ𝑖𝑡) + 𝛾6(𝑋𝑖𝑡) + 𝛾7(𝐼𝑖) + 𝛾8(𝑌𝑡) + 𝜀𝑖𝑡
In Equation 3, 𝑀𝐴𝑖𝑡 ∗ 𝑆𝑤𝑖𝑡𝑐ℎ𝑦𝑦𝑖 represents a vector of interaction terms between indicators for each
switch-year cohort (2009, 2010, 2011, and 2012) and MA enrollment. Those switch cohort terms
represent the effect on beneficiaries’ risk scores of switching to MA in a given year. This approach
assumes that the effect of switching to MA varies over time, whereas the enrollment year terms in
equations 1 and 2 allow the effect of being enrolled in MA to vary over time. If the program-wide effect
of enrollment in MA does vary by year, then the estimated effect of enrollment duration in Equation 3
would be biased upwards because it would also capture any increases in coding intensity that occur for all
MA enrollees as a function of time.
5 CMS uses separate models for community and institutional beneficiaries to account for significant cost differences
between the two populations. For more information see CMS, Medicare Managed Care Manual, “Chapter 7 – Risk
Adjustment,” (January 7, 2011), pp. 11–13, https://go.usa.gov/xRJs6. However, we use the community risk score
throughout to ensure that we are making an apples-to-apples comparison of the documentation of conditions across
people and years.
6 Although people’s ages change over time, they change at the same rate for each person. The meaningful difference
across individuals is their age at the beginning of the analysis period, which does not change over time and is
therefore also absorbed by the individual fixed effects.
7 We use contract identification as a proxy for the insurer. The contract identification represents a contract between
an organization and CMS to operate one or more plans in a region. While the same insurer may operate multiple
contracts in a region, each contract represents a single insurer.

8
We also conducted three specification checks for selection bias. Although the analysis controls for
beneficiaries’ risk prior to switching, selection bias could be present if switchers enrolled in MA because
they anticipated a future change in health status or if switchers’ risk scores were growing differently than
stayers even before the switch. The first specification check tests for pre-switch differences between
stayers and switchers by adding two pre-switch indicators to equation (2) to check for differences in pre-
existing trends between stayers and switchers. Pre-switch indicators equal 1 for switchers 1 or 2 years
before the switch and equal zero otherwise; pre-switch indicators always equal zero for stayers. We also
tested the pre-switch trends assumption using the same model but excluding 2009 and 2010 switchers
(because they did not have a full set of pre-switch trends) and using three similar models that only include
the years of data prior to the switch (one model for 2010 switchers, one for 2011 switchers, and one for
2012 switchers).
Our second specification check limited the analysis to stayers who moved from one state to another state
during the study period and switchers who moved at least one year prior to their switch. Moving from one
state to another prompts a plausibly exogenous reason to switch for two reasons: first, there will most
likely be a different selection of health plans available in a different state, and second, beneficiaries will
already need to identify new health care providers so they may be less concerned with whether their long-
term provider is part of MA plans’ networks. This is an imperfect test for selection because health shocks
could be the reason for moving, particularly among the Medicare population. However, if that analysis
yields similar results to our primary specifications, it would provide suggestive evidence that our results
do not reflect switchers moving to MA in anticipation of health shocks—unless of course, movers who
switch are more likely to have done so because of an anticipated health shock than movers who remained
in FFS.
In the third specification test, we replaced our dependent variable with an alternative risk adjuster that is
less likely to be subject to coding practices, following the methodology described by Colla et al. (2012).
That methodology used the combined annual rates of four low-variation conditions (acute myocardial
infarction (AMI), colorectal cancer, hip fracture, and stroke) as a substitute risk adjuster because those
conditions all require an acute care hospitalization and are less likely to be susceptible to coding
differences. If changes in MA enrollees’ health were driving the results, the coefficients on the MA
variables in that model should be similar to the coefficients in our main model.
One limitation of this specification is that unlike Colla, we did not have access to beneficiaries’ inpatient
hospital claims and diagnoses to determine which MA enrollees had each of the conditions. Instead, we
used HCCs as a proxy for the conditions. Unfortunately, in several cases the HCCs did not overlap
perfectly with the four conditions, and thus might have been sensitive to some coding intensity
differences. The HCCs we used included: acute myocardial infarction (for AMI); breast, prostate,
colorectal and other cancers and tumors (for colorectal cancer); hip fracture/dislocation (for hip fracture);
and ischemic or unspecified stroke (for stroke). We also included a specification with AMI likelihood as
the dependent variable because that condition overlapped perfectly with the Colla methodology.
Results
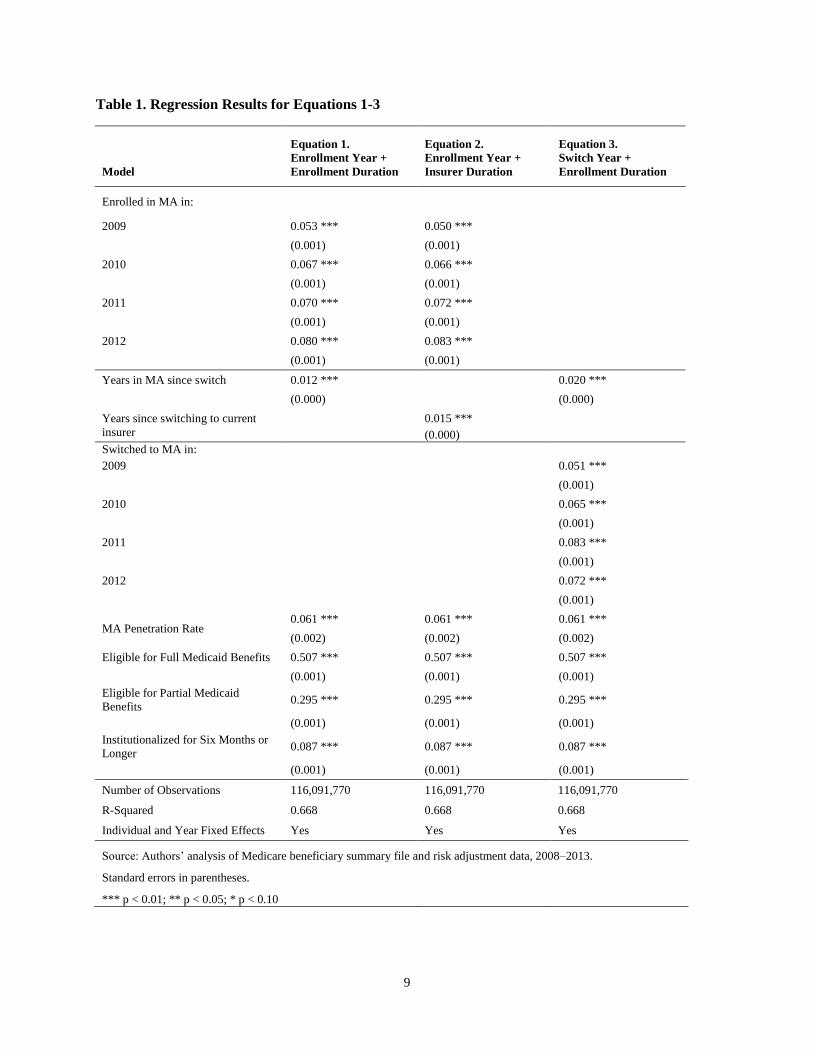
Table 1 reports the results from our three primary models. Consistent with existing research, the results
for Equation 1 suggest that MA enrollment is associated with an increase in risk scores relative to FFS
that has grown over time, from 5.3 percentage points in 2008 to 8.0 percentage points in 2012.
9
Table 1. Regression Results for Equations 1-3
Model
Equation 1.
Enrollment Year +
Enrollment Duration
Equation 2.
Enrollment Year +
Insurer Duration
Equation 3.
Switch Year +
Enrollment Duration
Enrolled in MA in:
2009 0.053 *** 0.050 ***
(0.001) (0.001)
2010 0.067 *** 0.066 ***
(0.001) (0.001)
2011 0.070 *** 0.072 ***
(0.001) (0.001)
2012 0.080 *** 0.083 ***
(0.001) (0.001)
Years in MA since switch 0.012 ***
0.020 ***
(0.000)
(0.000)
Years since switching to current
insurer
0.015 ***
(0.000)
Switched to MA in:
2009
0.051 ***
(0.001)
2010
0.065 ***
(0.001)
2011
0.083 ***
(0.001)
2012
0.072 ***
(0.001)
MA Penetration Rate 0.061 *** 0.061 *** 0.061 ***
(0.002) (0.002) (0.002)
Eligible for Full Medicaid Benefits 0.507 *** 0.507 *** 0.507 ***
(0.001) (0.001) (0.001)
Eligible for Partial Medicaid
Benefits 0.295 *** 0.295 *** 0.295 ***
(0.001) (0.001) (0.001)
Institutionalized for Six Months or
Longer 0.087 *** 0.087 *** 0.087 ***
(0.001) (0.001) (0.001)
Number of Observations 116,091,770 116,091,770 116,091,770
R-Squared 0.668 0.668 0.668
Individual and Year Fixed Effects Yes Yes Yes
Source: Authors’ analysis of Medicare beneficiary summary file and risk adjustment data, 2008–2013.
Standard errors in parentheses.
*** p < 0.01; ** p < 0.05; * p < 0.10
10
Each additional year in MA is associated with a 1.2 percentage point increase in risk scores.8 The controls
for dual eligibility and residing in an institution have a substantial and positive effect on risk scores that is
consistent across each of the three models (Table 1). The results from Equation 2 show that length of
enrollment with a particular insurer has a larger effect on risk scores than length of enrollment in MA
(though both effects are significant): the estimated effect of remaining enrolled with the same insurer is
25 percent larger than the effect of the enrollment duration term in Equation 1. 9 The coefficients on the
enrollment year terms, however, are virtually identical in this model. The coefficients range from 5.0 to
8.3 percentage points.
Both of our enrollment duration estimates are smaller than the duration effect found by MedPAC.
However, as noted above, the enrollment duration term in Equation 3 (our replication of the MedPAC
analysis) could be biased upwards. Bias might occur if the effects of increased differences in coding
between MA and FFS over time apply to people in all years of MA enrollment rather than only in the year
that they switched to MA. The results from Equation 3 suggest that such is the case. As MedPAC
observed in its study, we find that each additional year of MA enrollment is associated with a 2
percentage point increase in risk scores; that coefficient is 67 percent larger than the corresponding
coefficient in Equation 1.
Mechanisms Contributing to Coding Differences Our results suggest that increased coding differences over time reflect both increases in average risk
scores occurring across all individuals in MA and increases in individual risk scores that occur with
continuous enrollment with the same insurer. In Figure 3, we show the specific coding intensity increase
for four cohorts of switchers who remain with the same MA insurer from the time they switch through
2012.
In the year 2012, we find that the coding intensity increase—relative to stayers—was 12.7 percent for the
2009 cohort but only 8.3 percent for the 2012 cohort. This suggests that for beneficiaries that remained
with the same insurer, continuous enrollment with that insurer contributed to 34.7 percent of the risk score
increase observed among the 2009 cohort, while overall coding increases contributed 65.3 percent for the
year 2012. Alternatively, for the 2011 cohort, continuous enrollment with the same insurer contributed to
only 15.0 percent of the total risk score increase, demonstrating that the effects of time versus enrollment
duration are quite sensitive to the number of years beneficiaries remain enrolled with the same insurer.
Looking at actual enrollment patterns for the 2009 switcher cohort, we find that as of 2012, 50.0 percent
of switchers stayed with the same insurer for four years (2009–2012), 11.7 percent stayed with the same
insurer for three years (2010–2012), 26.5 percent for two years (2011–2012), and 11.8 percent were new
8 Although our model includes fixed effects, we don’t cluster the standard errors in the main specification because
the large sample size limited the processing capabilities of SAS, the analytic software we used. Using non-clustered
standard errors might lead us to falsely conclude significance if we have underestimated actual standard errors. For
that reason, we conducted a robustness check with a 5 percent random sample of the study population using
clustered standard errors. That analysis yielded statistically significant results. (Results are available from the
authors.)
9 In results not reported in this paper but available from the authors, we also estimated a model that included both
years after switching to MA and years after switching to the current plan sponsor, to confirm which of the two
effects was the driving factor. In that model, the estimated effect of remaining with the same plan sponsor was 1.2
percentage points per year, while the estimated effect of remaining in MA regardless of plan sponsor was 0.4
percentage points. Both estimates were statistically significant at the 1 percent level.

11
to an insurer in 2012. Accounting for those enrollment patterns, the average 2012 increase in risk score
for the 2009 cohort as a whole was 11.3 percentage points. More than one-fourth of that increase, 26.5
percent, stemmed from the insurer duration effect. For our entire study population, the average increase in
2012 risk scores was 10.0 percentage points. Of that increase, 16.8 percent stemmed from the insurer
duration effect.
Figure 3. Percentage Increase in Risk Scores for Beneficiaries Who Stay With a Particular MA
Plan, by Year of Switch and Calendar Year
Source: Authors’ analysis of Medicare beneficiary summary file and risk adjustment data, 2008–2013.
Specification Tests In the first specification test, we assessed whether there were differences in the pre-switch trends for
stayer and switcher risk scores by adding dummy variables to differentiate future switchers from stayers
in the years prior to their switch. The coefficients on both indicators were negative and statistically
significant, suggesting that switchers’ risk scores were growing more slowly than stayers’ risk scores
before they switched to MA. Two years before the switch, switcher risk scores grew 0.7 percent less than
stayers. One year before the switch, switcher risk scores grew 1.0 percent less than stayers (see Table 2).
The difference between the two years—0.3 percent—is quite small but potentially indicates slower
growth in risk scores among future switchers compared to stayers. That finding is consistent with the
possibility of favorable selection, which would tend to bias our results towards zero. We obtained similar
results from the models that exclude 2009 and 2010 switchers and from the models that only include the
years of data prior to the switch.10
In the second specification test, we limited the analysis to people who moved from one state to another.
Consistent with main results, that analysis also found larger increases in risk scores among switchers
10 Results are available from the authors.
8.0
10.1
12.7
6.6
8.7
11.2
7.2
9.7
8.3
2010 2011 2012
2009 Switchers 2010 Switchers 2011 Switchers 2012 Switchers

12
compared to stayers (see Table 2). One limitation of this test is that people may have moved as the result
of an adverse health event—to receive specialized treatment or to be close to a family caregiver, for
example. Note, however, that the limitation would only affect our results if switchers moved as the result
of adverse health more frequently than did stayers. Repeating that analysis with pre-switch interaction
terms suggests that in the years prior to the switch, switchers who relocated had lower risk scores and
slower growth in risk scores than did stayers who relocated (see Table 2).
Table 2. Regression Results for Specification Tests
Model
Pre-Switch
Indicators
Movers Only
Main Results
Movers Only,
Pre-Switch
Indicators
Count of Low-
Variable
Conditions
Acute Myocardial
Infarction
2 years before switch -0.007 ***
-0.017 ***
(0.001)
(0.003)
1 year before switch -0.011 ***
-0.022
(0.001)
(0.003)
Years since switching
to current insurer 0.013 *** 0.015 *** 0.011 *** 0.001 *** 0.000 ***
(0.000) (0.003) (0.003) (0.000) (0.000)
Enrolled in MA in:
2009 0.041 *** 0.071 *** 0.051 *** 0.003 *** 0.000 ***
(0.001) (0.007) (0.008) (0.000) (0.000)
2010 0.057 *** 0.074 *** 0.055 *** 0.002 *** 0.000 ***
(0.001) (0.005) (0.005) (0.000) (0.000)
2011 0.065 *** 0.068 *** 0.053 *** -0.001 *** 0.000 ***
(0.001) (0.004) (0.004) (0.000) (0.000)
2012 0.077 *** 0.082 *** 0.071 *** 0.001 * 0.000
(0.001) (0.003) (0.004) (0.000) (0.000)
MA Penetration Rate 0.062 *** 0.105 *** 0.106 *** 0.002 ** 0.001 **
(0.002) (0.004) (0.003) (0.001) (0.000)
Eligible for Full
Medicaid Benefits
0.507 *** 0.451 *** 0.451 *** 0.055 *** 0.008 ***
(0.001) (0.002) (0.002) (0.000) (0.000)
Eligible for Partial
Medicaid Benefits
0.295 *** 0.304 *** 0.304 *** 0.023 *** 0.004 ***
(0.001) (0.003) (0.003) (0.000) (0.000)
Institutionalized for
Six Months or Longer
0.087 *** 0.056 *** 0.056 *** -0.032 *** -0.010 ***
(0.001) (0.004) (0.004) (0.000) (0.000)
Number of
Observations 116,091,770 4,706,255 4,706,255 116,091,770 116,091,770
R-Squared 0.668 0.647 0.647 0.566 0.247
Individual and Year
Fixed Effects Yes Yes Yes Yes Yes
Source: Authors’ analysis of Medicare beneficiary summary file and risk adjustment data, 2008–2013.
Standard errors in parentheses.
*** p < 0.01; ** p < 0.05; * p < 0.10
13
In the third specification test, we replaced the dependent variable with two alternatives that are less likely
to be affected by coding differences: a count of low-variation conditions and the likelihood of being
diagnosed with AMI. That analysis found that the MA variables were all substantively insignificant for
both models. In fact, the coefficients for all five of the MA variables were 0.0 (see Table 2). 11 Those
results suggest that the underlying health status of MA enrollees did not change relative to that of FFS
beneficiaries, which in turn implies that the results in our main specifications stem from coding
differences rather than selection.
Discussion
In this paper, we build on previous research by exploring the mechanisms by which MA enrollment
affects the growth in beneficiary risk scores, using individual-level data to control for baseline differences
in risk scores. The magnitudes of the increases we find are similar to other estimates in the literature. Our
results suggest that the widening gap in risk scores between FFS and MA enrollees is the result of two
factors: an overall increase in risk scores among MA enrollees over time and an additional effect driven
by insurers learning about their enrollees over time.
One limitation of this analysis is that we only follow MA enrollees for a maximum of four years.
Therefore, it is unclear whether our estimates would be applicable as beneficiaries remain with the same
insurer beyond four years. Moreover, although beneficiary risk scores continued to increase with each
subsequent year of enrollment with the same insurer during our study period, it is unlikely that those
increases would continue indefinitely. Without a longer study period, it is impossible to determine how
long those increases might continue.
Extending our current analysis to include new years of data also poses some methodological concerns
because CMS has made several changes to the risk adjustment system. First, in 2014, CMS changed the
existing system to weight some HCCs more heavily and others less heavily. Second, in 2016, CMS began
to incorporate data on the services MA plans provided to enrollees (e.g., encounter data) into the risk
adjustment formula (Medicare Payment Advisory Commission 2017). As a result, incorporating newer
data would require either shifting to the new risk adjustment model or continuing to use the old model
even though coding incentives have changed, neither of which would be an apples-to-apples comparison
to previous years.
Because increases in coding intensity translate directly into increased payments to MA plans, there have
been many calls for reforms that would reduce overpayments to MA plans. In theory, reform could
address either the increased documentation of MA enrollees’ conditions or the lack of diagnostic
information among FFS beneficiaries. Kronick notes that “diagnostic reporting in FFS Medicare is
woefully incomplete” and provides an example: Only 60 percent of FFS beneficiaries with quadriplegia
in one year have a claim with quadriplegia in the subsequent year (2017, p. 325). Increased information
on MA enrollees’ diagnoses is not in itself problematic; indeed, detailed information on conditions may
help MA plans to better manage health care for their enrollees. However, because MA payments are
based on the relationship between conditions and use of resources in the FFS system, differences in
coding intensity may result in overpayments to MA plans.
11 We also tested models with each of the other four conditions as the dependent variables and a model where the
dependent variable was the probability of having any of the four conditions. In all cases, the MA results were
substantively insignificant. The results are available from the authors.

14
The current policy for reducing coding-related overpayments to MA plans is to apply a coding intensity
adjustment to reduce risk scores for all MA enrollees. As noted above, the ACA and subsequent
legislation increased the minimum amount of the coding intensity adjustment but our results suggest that
coding intensity is higher than that minimum and that it changes over time (while the minimum will
remain constant starting in 2018). Moreover, flat annual adjustments for all MA plans treat all plans and
beneficiaries equally, despite the fact that our paper and other research suggest that coding intensity
differences vary across beneficiaries and MA insurers. Across-the-board adjustments may therefore give a
competitive advantage to certain insurers. For example, our paper finds that length of enrollment with the
same insurer increases the risk score. As a result, incumbents have a competitive advantage under the
current risk adjustment system: the same beneficiary garners the insurer a higher Medicare payment by
remaining enrolled with that insurer. Those findings suggest that differences in coding intensity across
beneficiary populations and insurers would be a valuable topic for future research.
To depict how coding intensity differences vary over time and over years of enrollment with a single
insurer, Figure 4 illustrates those factors for hypothetical cohorts of beneficiaries who switched from FFS
to MA in 2009 and 2010 and remained with the same MA insurer through 2012. In 2012, coding
differences led to an 11.2 percentage-point increase in risk scores among beneficiaries who switched to
MA in 2010 and a 12.7 percentage-point increase for those who switched in 2009. Those differences were
larger than the differences for 2011 (8.7 and 10.1 percentage points respectively). They highlight the
notion that accounting for both time trends and enrollment patterns is important in estimating coding
differences between MA and FFS.
Figure 4. Differences Between Risk Score Increase and CMS Adjustment for Switchers That
Remain Enrolled With a Particular Insurer
(Percentage Increase in Risk Score)
Source: Authors’ analysis of Medicare beneficiary summary file and risk adjustment data, 2008–2013.
The challenges associated with risk adjustment in MA may be instructive for other Medicare reforms and
for additional public programs. In January 2015, CMS announced a goal of moving 30 percent of
Medicare FFS payments into alternative payment models by 2016 and 50 percent of FFS payments into
such systems by 2018 (CMS 2015). These models will require risk adjustment to function effectively, and
will face the same challenges that arise in the MA risk-adjustment system. Further, almost 80 percent of
Medicaid beneficiaries were enrolled in a managed care plan in 2014 (CMS 2016, p. 17), and risk
adjustment is used in the health insurance marketplaces established by the Affordable Care Act.
3.4 3.4 3.4 3.4
6.75.3
9.37.8
10.1
8.7
12.7
11.2
2009 Switchers in 2011 2010 Switchers in 2011 2009 Switchers in 2012 2010 Switchers in 2012
CMS adjustment Difference between CMS Adjustment and Coding Intensity Increase

15
As capitated payment models using risk adjustment become more prevalent in the health care market, the
MA experience offers several useful lessons for implementing alternative payment mechanisms. First,
risk adjustment creates incentives to thoroughly document health risks; that documentation may help
health plans and providers manage enrollees’ health. Second, because the accumulation of data on
enrollees allows for higher payments in some cases, risk adjustment may favor incumbents and
disadvantage new entrants into insurance markets. That occurs because established insurers have panels
of enrollees on whom they have accumulated data, and therefore may be paid more than new entrants for
beneficiaries with similar health care costs. Finally, the MA experience shows that risk adjustment
requires information both on beneficiary characteristics and on the relationship between beneficiary
characteristics and resource use. Insufficient information on either beneficiary characteristics or how
beneficiary characteristics affect resource use is likely to introduce inequity and inefficiency into the risk-
adjustment system.

16
References
Brown, Jason, and others. “How Does Risk Selection Respond to Risk Adjustment? Evidence
from the Medicare Advantage Program.” American Economic Review, 104(10): 3335–
3364, https://www.aeaweb.org/articles?id=10.1257/aer.104.10.3335.
Chao, Yi-Sheng and Chao-Jung Wu. 2013. “Medicare HMO coverage selection and its impact on
the accumulated health spending over the first four years of Medicare Coverage in the
United States.” The Journal of Global Health Care Systems, vol. 3, no. 2. Accessed April
28, 2016. http://www.jghcs.info/index.php/j/article/view/212.
Centers for Medicare & Medicaid Services. 2009. “Advance Notice of Methodological Changes
for Calendar Year (CY) 2010 for Medicare Advantage (MA) Capitation Rates and Part C
and Part D Payment Policies.” Last modified February 20, 2009.
https://www.cms.gov/Medicare/Health-
Plans/MedicareAdvtgSpecRateStats/downloads/Advance2010.pdf.
Centers for Medicare & Medicaid Services. 2011. “Medicare Managed Care Manual Chapter 1—
General Provisions.” Last modified January 7, 2011. https://www.cms.gov/Regulations-
and-Guidance/Guidance/Manuals/downloads/mc86c01.pdf
Centers for Medicare & Medicaid Services. 2013. “Medicare Managed Care Manual, Chapter
7—Risk Adjustment.” Last modified June 2013. http://www.cms.gov/Regulations-and-
Guidance/Guidance/Manuals/downloads/mc86c07.pdf.
Centers for Medicare & Medicaid Services. 2015. “Better Care. Smarter Spending. Healthier
People: Paying Providers for Value, Not Volume.” Last modified January 26, 2015.
https://www.cms.gov/Newsroom/MediaReleaseDatabase/Fact-sheets/2015-Fact-sheets-
items/2015-01-26-3.html.
Centers for Medicare & Medicaid Services. 2016. Medicaid Managed Care Enrollment and
Program Characteristics, 2014. (Report prepared by Mathematica Policy Research.) Last
modified spring 2016. https://www.medicaid.gov/medicaid/managed-
care/enrollment/index.html.
CMS Medicare Plan Payment Group. 2011. Evaluation of the CMS-HCC Risk Adjustment
Model. (Report prepared by RTI International.) Last modified March
2011. http://www.cms.gov/Medicare/Health-
Plans/MedicareAdvtgSpecRateStats/Downloads/Evaluation_Risk_Adj_Model_2011.pdf.
Colla, Carrie H., and others. 2012. “Spending Differences Associated With the Medicare
Physician Group Practice Demonstration.” The Journal of the American Medical
Association 308(10):1015–1023. Accessed May 17, 2017,
http://jamanetwork.com/journals/jama/fullarticle/1357260.
Geruso, Michael and Timothy Layton. 2015. “Upcoding: Evidence from Medicare on Squishy
Risk Adjustment.” Working Paper No. 21222. National Bureau of Economic Research
Last modified May 2015. http://www.nber.org/papers/w21222.
Government Accountability Office. 2013. “Medicare Advantage: Substantial Excess Payments
Underscore Need for CMS to Improve Accuracy of Risk Score Adjustments.” GAO-13-
206. Last modified January 31, 2013. http://www.gao.gov/products/GAO-13-206.
Government Accountability Office. 2017. “Medicare Advantage: Limited Progress Made to
Validate Encounter Data Used to Ensure Proper Payments.” GAO-17-223. Last modified
January 17, 2017. https://www.gao.gov/products/GAO-17-223.
17
Jacobson, Gretchen A., Patricia Neuman, and Anthony Damico. 2015. “At Least Half of New
Medicare Advantage Enrollees Had Switched From Traditional Medicare During 2006 –
2011.” Health Affairs 34(1):48–55. Accessed April 28, 2016,
http://content.healthaffairs.org/content/34/1/48.abstract.
Kaiser Family Foundation. 2015. “Medicare Advantage 2015 Spotlight: Enrollment Market
Update.” Last modified June 30, 2015. http://kff.org/medicare/issue-brief/medicare-
advantage-2015-spotlight-enrollment-market-update/.
Kronick, Richard. 2017. “Projected Coding Intensity in Medicare Advantage Could Increase
Medicare Spending By $200 billion Over Ten Years.” Health Affairs 36(2):320-327.
Accessed May 10, 2017, http://content.healthaffairs.org/content/36/2/320.abstract.
Kronick, Richard and W. Pete Welch. 2014. “Measuring Coding Intensity in the Medicare
Advantage Program.” Medicare & Medicaid Research Review 4(2):E1–E19. Accessed
April 28, 2016.
https://www.cms.gov/mmrr/Articles/A2014/MMRR2014_004_02_a06.html.
McGuire, Thomas G., Joseph P. Newhouse, and Anna D. Sinaiko. 2011. “An Economic History
of Medicare Part C.” Milbank Quarterly 89(2):289–332. Accessed April 28, 2016,
http://onlinelibrary.wiley.com/doi/10.1111/j.1468-0009.2011.00629.x/full.
McWilliams, J. Michael, John Hsu, and Joseph P. Newhouse. 2012. “New Risk-Adjustment
System Was Associated With Reduced Favorable Selection in Medicare Advantage.”
Health Affairs 31(12):2630–2640. Accessed April 28, 2016,
http://content.healthaffairs.org/content/31/12/2630.abstract.
Medicare Payment Advisory Commission. 2015. “Chapter 13. The Medicare Advantage
Program: Status report” in Report to the Congress: Medicare Payment Policy. Last
modified March 2015, http://www.medpac.gov/docs/default-source/reports/chapter-13-
the-medicare-advantage-program-status-report-march-2015-report-.pdf?sfvrsn=0.
Medicare Payment Advisory Commission. 2016a. “Medicare Advantage Program Payment
System.” Last modified October 2016, http://www.medpac.gov/docs/default-
source/payment-basics/medpac_payment_basics_16_ma_final.pdf.
Medicare Payment Advisory Commission. 2016b. “Chapter 12. The Medicare Advantage
program: Status report” in Report to the Congress: Medicare Payment Policy. Last
modified March 2016. http://www.medpac.gov/docs/default-source/reports/chapter-12-
the-medicare-advantage-program-status-report-march-2016-report-.pdf%20.
Medicare Payment Advisory Commission. 2017. “Chapter 13. Status report on the Medicare
Advantage program.” Last modified March 2017. http://www.medpac.gov/docs/default-
source/reports/mar17_medpac_ch13.pdf?sfvrsn=0.
Morgan, Robert O., and others. 1997. “The Medicare-HMO Revolving Door—The Healthy Go
in and the Sick Go Out.” The New England Journal of Medicine 337:169–175. Accessed
April 28, 2016, http://www.nejm.org/doi/full/10.1056/NEJM199707173370306#t=article.
Morrisey, M.A., and others. 2013. “Favorable Selection, Risk Adjustment, and the Medicare
Advantage Program.” Health Services Research 38(3):1039–1056. Accessed April 28,
2016, http://onlinelibrary.wiley.com/doi/10.1111/1475-6773.12006/abstract.
Newhouse, Joseph P. 2002. Pricing the Priceless: a Health Care Conundrum. Cambridge
Massachusetts: MIT Press.
Newhouse, Joseph P. and Thomas G. McGuire. “How Successful Is Medicare Advantage?” in
The Milbank Quarterly 92(2):351–394. Accessed April 28, 2016,
http://onlinelibrary.wiley.com/doi/10.1111/1468-0009.12061/full.
18
Newhouse, Joseph P., and others. 2012. “Steps to Reduce Favorable Risk Selection in Medicare
Advantage Largely Succeeded, Boding Well for Health Insurance Exchanges.” Health
Affairs 31(12):2618–2628, Accessed April 28, 2016.
http://dx.doi.org/10.1377/hlthaff.2012.0345.
Newhouse, Joseph P., and others. 2013. “Do Medicare Advantage Plans Select Enrollees in
Higher Margin Clinical Categories?” Journal of Health Economics 32(6):1278–1288.
Accessed April 28, 2016. https://www.ncbi.nlm.nih.gov/pubmed/24308879.
Newhouse, Joseph P., and others. 2014. “How Much Favorable Selection is Left in Medicare
Advantage?” National Bureau of Economic Research working paper no. 20021. Last
modified March 2014. http://www.nber.org/papers/w20021.
Riley, Gerald and Carlos Zarabozo. 2006. “Trends in the Health Status of Medicare Risk
Contract Enrollees.” Health Care Financing Review 28(2):81–96. Accessed April 28,
2016. https://www.cms.gov/Research-Statistics-Data-and-
Systems/Research/HealthCareFinancingReview/downloads/06-07Winpg81.pdf.
Related Documents