Ecological Engineering 57 (2013) 216–225 Contents lists available at SciVerse ScienceDirect Ecological Engineering j ourna l ho me pa g e: www.elsevier.com/locate/ecoleng Effects of load fluctuations on treatment potential of a hybrid sub-surface flow constructed wetland treating milking parlor waste water Pradeep Kumar Sharma a,b,∗ , Inoue Takashi a , Kunihiko Kato c , Hidehiro Ietsugu d , Kunihiko Tomita e , Tetsuaki Nagasawa a a Graduate School of Agriculture, Hokkaido University, N9, W9, Kita-ku, Sapporo, 060-8589, Japan b Department of Environment Science, Graphic Era University, 566/6, Bell Road, Clement Town, Dehradun, 248002, India c National Agricultural Research Centre for Hokkaido Region, Hitsujigaoka-1, Toyohira-ku, Sapporo, 062-8555, Japan d TUSK Co. Ltd., Hokkaido, Japan e Town Office, Embetsu, Hokkaido, Japan a r t i c l e i n f o Article history: Received 12 December 2012 Received in revised form 27 February 2013 Accepted 6 April 2013 Keywords: Hybrid sub-surface constructed wetland Milking parlor wastewater Load fluctuation a b s t r a c t A hybrid sub-surface constructed wetland (CW) system consisting of 2 gravel filled vertical sub- surface (VFa & VFb) beds, each 160 m 2 in size planted with Phragmites australis and a sand filled horizontal sub-surface (HF) bed, 336 m 2 in size, planted with rice was operated from 2007 to 2010 for treating milking parlor waste water in Hokkaido, Japan. Hybrid CW system received huge fluctuations in average yearly inlet loads for TSS (526.0–1259 mg L −1 & 2.7–9.0 g m −2 d −1 ), BOD 5 (1,080–2,114 mg L −1 & 8.4–14.4 g m −2 d −1 ), COD(1,962–7,085 mg L −1 & 14.5–50.0 g m −2 d −1 ), TN (116.0–243.0 mg L −1 & 0.8–1.6 g m −2 d −1 ), NH 4 -N (54.0–90.0 mg L −1 & 0.40–0.64 g m −2 d −1 ), TC (1,022–2,215 mg L −1 & 6.0–15.1 g m −2 d −1 ), TP (15.3–41.7 mg L −1 & 0.11–0.28 g m −2 d −1 ) during study period. Average yearly purification and removal rates were least fluctuated for TSS (95.7–99.4%); mod- erately for BOD 5 (86.1–95.7%), COD(87.5–96.1%) and TC (79.5–91.3%); highly for TN (72.6–90.6%), NH 4 -N (62.9–85.3%) and TP (64.8–87.2%). A sharp decrease in TP purification and removal rates were observed in 2008 due to sharp decrease in influent TP concentration in 2008 compared to 2007. OTR values for VF(a), VF(b), HF bed and total system were observed as 21.7, 19.3, 4.8 and 12.3 g O 2 m −2 d −1 respectively. Average k value of hybrid CW system for BOD 5 , TN, NH 4 -N and TP during study period were 7.0 ± 1.8, 7.4 ± 3.3, 5.6 ± 4.1 and 4.9 ± 2.0 m yr −1 respectively. Average concentration of TSS, TP, TN and NH 4 -N in the final effluent for all years were below the discharge limit value of: 150 mg L −1 for TSS; 8 mg L −1 for TP, 60 mg L −1 for TN and NH 4 -N. However, average BOD 5 and COD concentrations could not meet the discharge limit value of 120 mg L −1 during 2007 and 2008. © 2013 Elsevier B.V. All rights reserved. 1. Introduction Milking parlors discharge nutrient-rich wastewater which has high potential of polluting surface and/or ground water. Most of times, this wastewater is either stored and irrigated onto land (Moir et al., 2005) or treated by conventional methods such as ∗ Corresponding author. Department of Environment Science, Graphic Era Uni- versity, 566/6, Bell Road, Clement Town, Dehradun, Uttarakhand, India, 248002. Tel.: +91 9720625982; fax: +91 135 2644025. E-mail addresses: [email protected] (P.K. Sharma), [email protected] (I. Takashi), [email protected] (K. Kato), [email protected] (T. Nagasawa). trickling filters, activated sludge process, anaerobic lagoon and aerated lagoons (Munavalli and Saler, 2009), however all these treatment methods are expensive. Thus, small-scale milking parlor owners often show no/less interest in adopting any of these tech- nologies. On the other hand, constructed wetlands (CWs) which are simple in design and operation as well as cost effective has been tested worldwide to treat different types of wastewater such as domestic, industrial, acid mine drainage, agricultural runoff and land fill leachate (Beutel et al., 2009; Nyquist and Greger, 2009; Kadlec and Zmarthie, 2010; Serrano et al., 2011; Vymazal, 2011). Among the recent developments, hybrid sub-surface CWs are becoming more popular because of their higher treatment potential (Noorvee et al., 2005; Öövel, 2007; Tszynska and Obarska- Pempkowiak, 2008; Justin et al., 2009; Singh et al., 2009; Kato et al., 0925-8574/$ – see front matter © 2013 Elsevier B.V. All rights reserved. http://dx.doi.org/10.1016/j.ecoleng.2013.04.031

Welcome message from author
This document is posted to help you gain knowledge. Please leave a comment to let me know what you think about it! Share it to your friends and learn new things together.
Transcript
Esw
PKa
b
c
d
e
ARRA
KHML
1
ht(
vT
tn
0h
Ecological Engineering 57 (2013) 216– 225
Contents lists available at SciVerse ScienceDirect
Ecological Engineering
j ourna l ho me pa g e: www.elsev ier .com/ locate /eco leng
ffects of load fluctuations on treatment potential of a hybridub-surface flow constructed wetland treating milking parlor wasteater
radeep Kumar Sharmaa,b,∗, Inoue Takashia, Kunihiko Katoc, Hidehiro Ietsugud,unihiko Tomitae, Tetsuaki Nagasawaa
Graduate School of Agriculture, Hokkaido University, N9, W9, Kita-ku, Sapporo, 060-8589, JapanDepartment of Environment Science, Graphic Era University, 566/6, Bell Road, Clement Town, Dehradun, 248002, IndiaNational Agricultural Research Centre for Hokkaido Region, Hitsujigaoka-1, Toyohira-ku, Sapporo, 062-8555, JapanTUSK Co. Ltd., Hokkaido, JapanTown Office, Embetsu, Hokkaido, Japan
a r t i c l e i n f o
rticle history:eceived 12 December 2012eceived in revised form 27 February 2013ccepted 6 April 2013
eywords:ybrid sub-surface constructed wetlandilking parlor wastewater
oad fluctuation
a b s t r a c t
A hybrid sub-surface constructed wetland (CW) system consisting of 2 gravel filled vertical sub-surface (VFa & VFb) beds, each 160 m2 in size planted with Phragmites australis and a sandfilled horizontal sub-surface (HF) bed, 336 m2 in size, planted with rice was operated from 2007to 2010 for treating milking parlor waste water in Hokkaido, Japan. Hybrid CW system receivedhuge fluctuations in average yearly inlet loads for TSS (526.0–1259 mg L−1 & 2.7–9.0 g m−2 d−1),BOD5 (1,080–2,114 mg L−1 & 8.4–14.4 g m−2 d−1), COD(1,962–7,085 mg L−1 & 14.5–50.0 g m−2 d−1),TN (116.0–243.0 mg L−1 & 0.8–1.6 g m−2 d−1), NH4-N (54.0–90.0 mg L−1 & 0.40–0.64 g m−2 d−1), TC(1,022–2,215 mg L−1 & 6.0–15.1 g m−2 d−1), TP (15.3–41.7 mg L−1 & 0.11–0.28 g m−2 d−1) during studyperiod. Average yearly purification and removal rates were least fluctuated for TSS (95.7–99.4%); mod-erately for BOD5 (86.1–95.7%), COD(87.5–96.1%) and TC (79.5–91.3%); highly for TN (72.6–90.6%), NH4-N(62.9–85.3%) and TP (64.8–87.2%). A sharp decrease in TP purification and removal rates were observedin 2008 due to sharp decrease in influent TP concentration in 2008 compared to 2007. OTR values forVF(a), VF(b), HF bed and total system were observed as 21.7, 19.3, 4.8 and 12.3 g O2 m−2 d−1 respectively.
Average k value of hybrid CW system for BOD5, TN, NH4-N and TP during study period were 7.0 ± 1.8,7.4 ± 3.3, 5.6 ± 4.1 and 4.9 ± 2.0 m yr−1 respectively.Average concentration of TSS, TP, TN and NH4-N in the final effluent for all years were below thedischarge limit value of: 150 mg L−1 for TSS; 8 mg L−1 for TP, 60 mg L−1 for TN and NH4-N. However,average BOD5 and COD concentrations could not meet the discharge limit value of 120 mg L−1 during2007 and 2008.
tat
. Introduction
Milking parlors discharge nutrient-rich wastewater which has
igh potential of polluting surface and/or ground water. Most ofimes, this wastewater is either stored and irrigated onto landMoir et al., 2005) or treated by conventional methods such as∗ Corresponding author. Department of Environment Science, Graphic Era Uni-ersity, 566/6, Bell Road, Clement Town, Dehradun, Uttarakhand, India, 248002.el.: +91 9720625982; fax: +91 135 2644025.
E-mail addresses: [email protected] (P.K. Sharma),[email protected] (I. Takashi), [email protected] (K. Kato),[email protected] (T. Nagasawa).
onabalK
apP
925-8574/$ – see front matter © 2013 Elsevier B.V. All rights reserved.ttp://dx.doi.org/10.1016/j.ecoleng.2013.04.031
© 2013 Elsevier B.V. All rights reserved.
rickling filters, activated sludge process, anaerobic lagoon anderated lagoons (Munavalli and Saler, 2009), however all thesereatment methods are expensive. Thus, small-scale milking parlorwners often show no/less interest in adopting any of these tech-ologies. On the other hand, constructed wetlands (CWs) whichre simple in design and operation as well as cost effective haseen tested worldwide to treat different types of wastewater suchs domestic, industrial, acid mine drainage, agricultural runoff andand fill leachate (Beutel et al., 2009; Nyquist and Greger, 2009;adlec and Zmarthie, 2010; Serrano et al., 2011; Vymazal, 2011).
Among the recent developments, hybrid sub-surface CWsre becoming more popular because of their higher treatmentotential (Noorvee et al., 2005; Öövel, 2007; Tszynska and Obarska-empkowiak, 2008; Justin et al., 2009; Singh et al., 2009; Kato et al.,
l Engineering 57 (2013) 216– 225 217
2arot
7fuloEut
2
2
(Esou
O
a
C
(
L
tt
2
flbactew
bopadnp2b
FH
Sbtatpoi2
Hots
2
aaa(ad(wE2mgPb2t
2
P.K. Sharma et al. / Ecologica
005, 2010, 2013; Sharma et al., 2012; Serrano et al., 2011; Vymazalnd Kröpfelová, 2011). The Performance of a CW is affected by aange of factors such as operational mode (loading rate, continu-us or batch-load) and environmental conditions (climate, season,emperature etc.) (Chazarenc et al., 2007).
Hokkaido is the largest milk producing region in Japan and has,809 dairy farms and 1374 milking parlors. Most of these dairyarms in Hokkaido are small-scaled farms and discharge large vol-mes of wastewater everyday. This paper presents the effects of
oad fluctuations on the treatment efficiencies, OTR and k valuef a real-scale hybrid sub-surface flow CW system constructed inmbetsu, Hokkaido in November, 2006 and operated for 3 yearsnder high load fluctuations during milking parlor wastewaterreatment.
. Materials and methods
.1. Site description
The hybrid sub-surface CWs consisting of three beds in seriesVFa, VFb and HF) is located at a privately owned dairy farm inmbetsu, Hokkaido (44◦ 45′ N, 141◦ 48′ E). VF beds were con-tructed in November 2006 according to design recommendationsf Cooper (1997; Cooper, 2005). The bed sizes were determinedsing following equations:
TR = Q ∗ {(BODIn − BODOut)
+ 4.3 ∗ (NH4 − NIn − NH4 − NOut)} ∗ 100/Total area (2.1)
OTR (Oxygen transfer rate): g O2 m−2 day−1
Q(Flow rate): Influent Volume(m3 day−1); Total area:m2; BODnd NH4–N: mg L−1
OTR of beds were considered as follows (Cooper et al., 1997;ooper, 2005):
VF beds= 28 g O2 m−2 day−1, HF bed = 15 g O2 m−2 day−1
Limit loading rate (LLR) was calculated using following equationCooper et al., 1997; Cooper, 2005):
LR = Flow rate(Q ) ∗ BODIn ∗ 100/Total area (2.2)
LLR = 25(g BOD5 m−2 day−1) or 50 (g CODCr m−2 day−1)Area of HF bed was kept nearly equal to areas of both VF beds
ogether so that both beds (VF &HF) could equally contribute inreatment of wastewater.
.2. Filter material, bed depth, surface vegetation
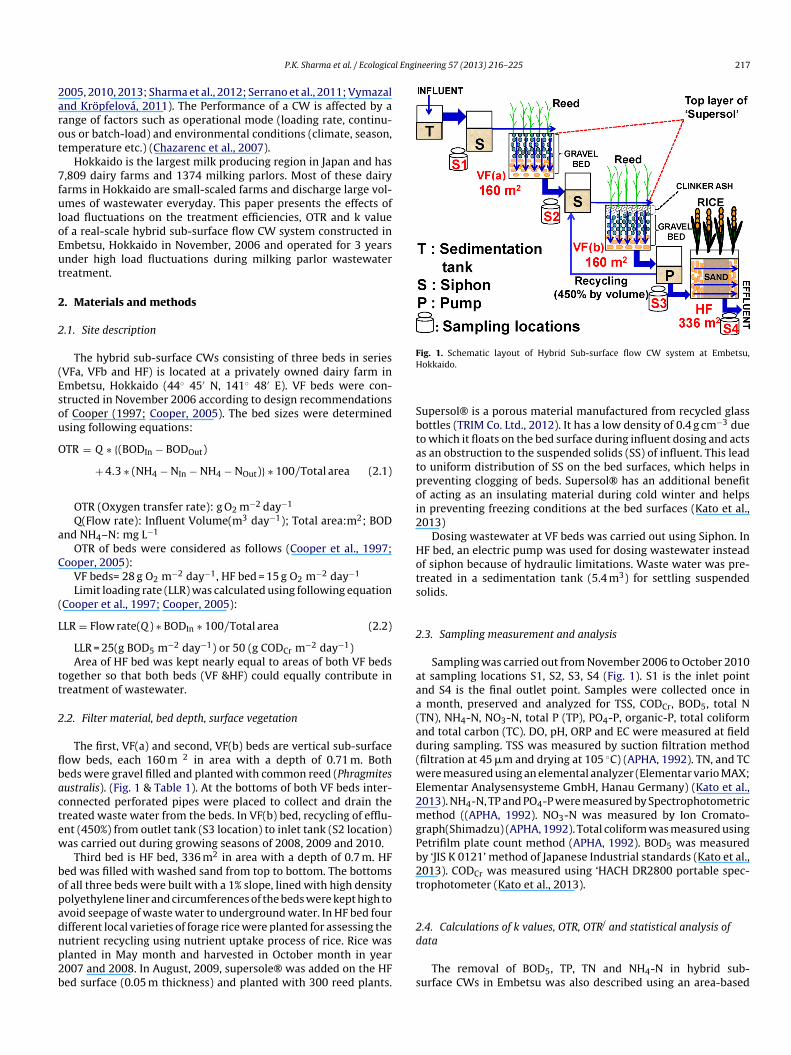
The first, VF(a) and second, VF(b) beds are vertical sub-surfaceow beds, each 160 m 2 in area with a depth of 0.71 m. Botheds were gravel filled and planted with common reed (Phragmitesustralis). (Fig. 1 & Table 1). At the bottoms of both VF beds inter-onnected perforated pipes were placed to collect and drain thereated waste water from the beds. In VF(b) bed, recycling of efflu-nt (450%) from outlet tank (S3 location) to inlet tank (S2 location)as carried out during growing seasons of 2008, 2009 and 2010.
Third bed is HF bed, 336 m2 in area with a depth of 0.7 m. HFed was filled with washed sand from top to bottom. The bottomsf all three beds were built with a 1% slope, lined with high densityolyethylene liner and circumferences of the beds were kept high tovoid seepage of waste water to underground water. In HF bed fourifferent local varieties of forage rice were planted for assessing the
utrient recycling using nutrient uptake process of rice. Rice waslanted in May month and harvested in October month in year007 and 2008. In August, 2009, supersole® was added on the HFed surface (0.05 m thickness) and planted with 300 reed plants.d
s
ig. 1. Schematic layout of Hybrid Sub-surface flow CW system at Embetsu,okkaido.
upersol® is a porous material manufactured from recycled glassottles (TRIM Co. Ltd., 2012). It has a low density of 0.4 g cm−3 dueo which it floats on the bed surface during influent dosing and actss an obstruction to the suspended solids (SS) of influent. This leado uniform distribution of SS on the bed surfaces, which helps inreventing clogging of beds. Supersol® has an additional benefitf acting as an insulating material during cold winter and helpsn preventing freezing conditions at the bed surfaces (Kato et al.,013)
Dosing wastewater at VF beds was carried out using Siphon. InF bed, an electric pump was used for dosing wastewater insteadf siphon because of hydraulic limitations. Waste water was pre-reated in a sedimentation tank (5.4 m3) for settling suspendedolids.
.3. Sampling measurement and analysis
Sampling was carried out from November 2006 to October 2010t sampling locations S1, S2, S3, S4 (Fig. 1). S1 is the inlet pointnd S4 is the final outlet point. Samples were collected once in
month, preserved and analyzed for TSS, CODCr, BOD5, total NTN), NH4-N, NO3-N, total P (TP), PO4-P, organic-P, total coliformnd total carbon (TC). DO, pH, ORP and EC were measured at fielduring sampling. TSS was measured by suction filtration methodfiltration at 45 �m and drying at 105 ◦C) (APHA, 1992). TN, and TCere measured using an elemental analyzer (Elementar vario MAX;
lementar Analysensysteme GmbH, Hanau Germany) (Kato et al.,013). NH4-N, TP and PO4-P were measured by Spectrophotometricethod ((APHA, 1992). NO3-N was measured by Ion Cromato-
raph(Shimadzu) (APHA, 1992). Total coliform was measured usingetrifilm plate count method (APHA, 1992). BOD5 was measuredy ‘JIS K 0121’ method of Japanese Industrial standards (Kato et al.,013). CODCr was measured using ‘HACH DR2800 portable spec-rophotometer (Kato et al., 2013).
.4. Calculations of k values, OTR, OTR/ and statistical analysis ofata
The removal of BOD5, TP, TN and NH4-N in hybrid sub-urface CWs in Embetsu was also described using an area-based
218 P.K. Sharma et al. / Ecological Engineering 57 (2013) 216– 225
Table 1Details of size, filter material and surface vegetation of hybrid sub-surface CWs at Embetsu, Hokkaido.
Name of bed Type of bed Area of bed (m2) Filter material Surface vegetation
Position Type Size/density Thickness (cm)
VFA Vertical sub-surface 160 Top Supersol 0.4 g cm−3 5 Phragmites australisMiddle Gravel 5–15 mm 30Bottom Gravel 5–25 mm 36
Total 71VFB Vertical sub-surface 160 Top Supersol 0.4 g cm−3 1 Phragmites australis
Upper middle Clinker ash d10 ∼ 0.06 mm 20d60 ∼ 1.5 mmd60/d10 ∼ 25
Lower middle Gravel 5–15 mm 25Bottom Gravel 5–25 mm 25
Total 71HF Horizontal sub-surface 336 Top to bottom Sand d10 ∼ 0.25 mm 70 Rice (2007, 2008)
Phragmites australis
fi1
l
Wtti
vtntt
arvb
k
Wia
i1
og
an
fnf
O
Ot
pwi
la
2
ow
P
C
R
L
L
Q
3
3
1ear3ad
3
pt
rst-order model (later called the k-C* model) (Kadlec and knight,996; Kadlec, 2000):
n[C0 − C ∗ /Ci − C∗] = −k/q (2.3)
here k is the area-based, first-order rate-constant (m yr−1), qhe hydraulic loading rate (m yr−1), C0 the effluent concentra-ion (mg L−1), Ci the influent concentration (mg L−1) and C* is therreducible background wetland concentration (mg L−1).
Based on the published data (Kadlec and Knight, 1996), the C*
alues of BOD5 and TN were chosen as 1 and 1.5 mg L−1 respec-ively. It is well known that constructed wetlands have very lowatural TP and NH4-N background concentrations. The C* values forhese parameters are assumed to be 0.03 and 0.05 mg L−1 respec-ively (Kadlec and Knight, 1996).
Processes like ammonification, nitrification, and denitrificationre temperature dependent. Therefore rates of NH4-N and TNeduction will also be temperature dependent (Kadlec, 2000). KTalues need a conversion to k20 values for comparison. The relationetween kT and k20 is the Arrhenius equation.
T = k20�T−20 (2.4)
here kT is the reaction rate coefficient at temperature T (◦C), k20s the reaction rate coefficient at 20 ◦C, ø is the temperature factornd T is the temperature (◦C).
An estimate of the temperature factor of ammonium oxidations ø = 1.04 and for nitrogen reduction ø = 1.05 (Kadlec and Knight,996).
After calculating k values for all the parameters, the dependencef k on mass loading and removed rates (g m−2 d−1) was investi-ated.
OTR is a measure of atmospheric oxygen transferred into bednd utilized for aerobic degradation of organic matter as well asitrification of ammonium nitrogen.
OTR/ reflects measure of atmospheric oxygen, required forull degradation of organic matter and nitrification of ammoniumitrogen present in the wastewater. OTR/ can be calculated using
ollowing formula.
TR/ = Q ∗ {BODInlet + 4.3 ∗ (NH4 − NInlet)}/Total area (2.5)
TR/: mg O2 m−2 d−1; Q: m3 d−1; total area: m2; inlet concentra-ions: mg L−1.
The statistical analysis of the data was performed using therogramme ‘Analyse-it 2.22’. Spearman Rank Correlation analysisas used for analyzing the relationship between the water qual-
ty and environmental indicators, OTR and OTR/, k values, mass
Toam
(2009∼)d60 ∼ 0.49 mmd60/d10 ∼ 1.7
oading rates and mass removed rates. The level of significance oflpha = 0.05 was accepted in all cases.
.5. System efficiency for pollutant removal
The efficiency of hybrid sub-surface CW was calculated in termsf purification and removal rates for all selected parameters ofastewater for each year from 2007 to 2010.
Purification rate was calculated using following formulae:
urification rate (%) = {(Ci − Co)/Ci} ∗ 100 (2.6)
i: Inlet concentration (mg L−1); Co: Outlet concentration (mg L−1).Removal rate was calculated using following formulae:
emoval rate (%) = {(Li − Lo)/Li} ∗ 100 (2.7)
i: Inlet load (g m−2 d−1); Lo: Outlet load (g m−2 d−1)Load was calculated using following formulae:
oad (L) = Q ∗ C/A (2.8)
: Flow rate (m3 d−1); C: concentration (mg L−1); A: area (m2).
. Results and Discussion
.1. Meteorology
The average precipitation in Embetsu was recorded as,053 mm y−1. Daily average air temperature was 6.4 ◦C withxtremes varying between −7.9 ◦C as lowest at the end of Januarynd 20.3 ◦C as highest in the beginning of August. Average of annualecord of minimum and maximum temperature is −22.8 ◦C and0.6 ◦C for the period of 1978 to 2009. The cold period representsbout 4 months from December to March. Snow covers the terrainuring this period.
.2. Composition of influent
Influent was discharged from a milking parlor located in theremises of dairy farm. Approximately, 120 cows were milked inhis milking parlor twice in a day throughout the study period.
he influent was a mixture of wastewaters generated from variousperations of milking parlor, such as floor washings, disinfect-nt and detergent washings, wastewater from equipments, spilledilk, cow dung and urine.
l Engi
mI
3d
3
wfh21t2migid1HiEp2y
3
aBT(po(
ilto2ocdPbTtcasItrtotrtw
wbtfw
2(ar4witciipiaNt1p
t2tb2papflflflcdwEatirtii
aH9
Nflw2aT
3
P.K. Sharma et al. / Ecologica
In 2007, from February to December, large quantity of rejectedilk was also mixed with influent every day. Nearly all times,
nfluent was yellowish in color with strong odor.Average influent volume was 4.9 m3 d−1 and ranged from 1.2 to
6.2 m3 d−1 during the study period. Higher volume was observeduring snow melting seasons and heavy precipitation.
.3. pH, EC, DO, ORP
pH of influent ranged between 4.7 to 8.1 during study periodith an average of 6.6 showing nearly neutral nature. Average pH
rom influent to effluent was more or less similar in 2007 and 2008owever; it showed an increase of 0.4 and 0.3 unit in 2009 and010 respectively (Table 2). Daily mean influent temperature was3.0 ◦C and fluctuated between 3.6 to 23.2 ◦C. Lowest and highestemperature was recorded on 12th March 2007 and 11th August010 respectively. Average influent DO increased during treat-ent. Maximum DO increase was observed in 2007. Usually during
nitial periods of operation, filter material of CW beds occupyreater amount of atmospheric oxygen which results into increasen DO level of influent during course of treatment. EC showed aecrease during treatment. Average influent EC ranged between.0 to 1.5 mS cm−1 being maximum in 2007 and minimum in 2008.igher EC values in 2007 were due to addition of rejected milk in
nfluent. Effluent EC was observed in a range of 0.7 to 0.9 mS cm−1.C decrease rate fluctuated from 30 to 43% throughout the studyeriod. Average influent ORP ranged between 283–264 mV from007 to 2010 and showed an increase in the effluent during eachear. Maximum increase of +68 mV was observed in 2009.
.4. Concentrations and purification rates
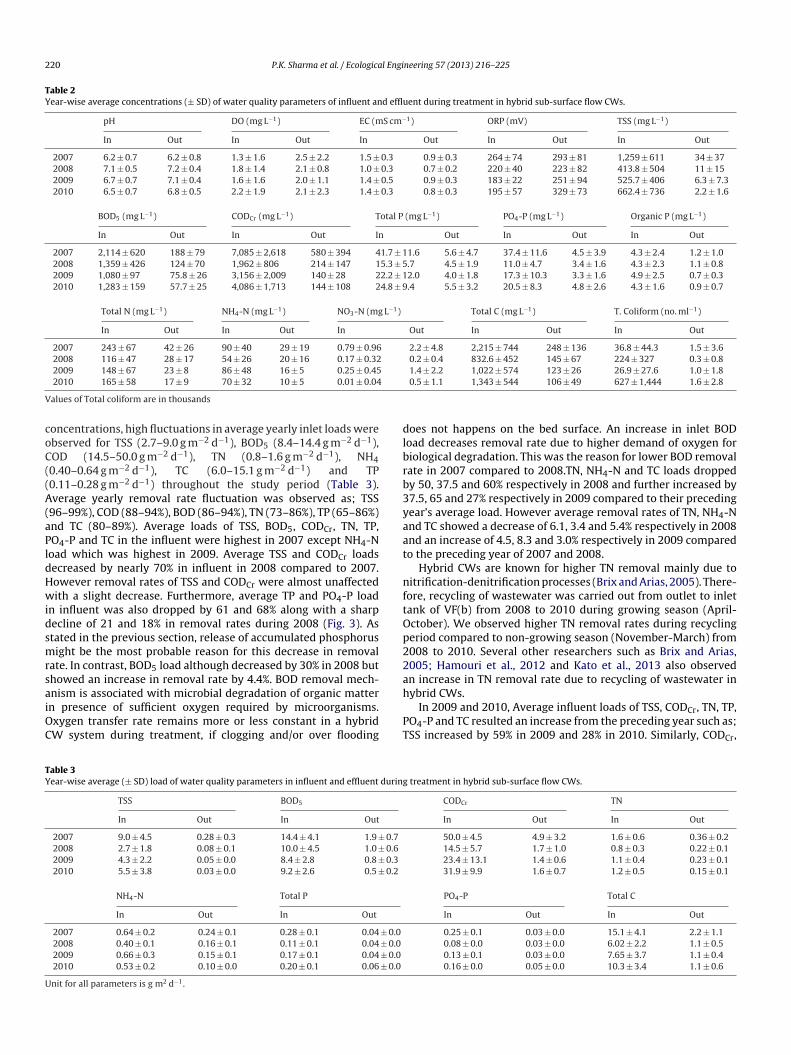
Hybrid CW system received high fluctuations in aver-ge yearly inlet concentrations for TSS (526.0–1,259 mg L−1),OD5 (1,080–2,114 mg L−1), COD (1,962–7,085 mg L−1),N (116.0–243.0 mg L−1), NH4 (54.0–90.0 mg L−1), TC1,022–2,215 mg L−1) and TP (15.3–41.7 mg L−1) during studyeriod (Table 2). Average yearly purification rate fluctuation wasbserved as; TSS (96–99%), COD (88–96%), BOD (90–96%), TN74–91%), TP (65–87%) and TC (79–91%).
Average concentrations of all parameters were highest in thenfluent and effluent during 2007 compared to rest years. In 2007 aarge quantity of rejected milk was also mixed with influent andhrown to hybrid CWs which resulted into high concentrationsf water quality parameters of the influent during this period. In007, average influent concentrations of TSS, TP, PO4-P and TC werebserved nearly 3 times higher compared to 2008. Average effluentoncentrations showed similar trend to influent and were highesturing 2007 for all parameters. Average concentrations of TSS, TP,O4-P, TN, NH4-N and total coliform in the effluent of all years wereelow the discharge limit value of: 150 mg L−1 for TSS; 8 mg L−1 forP and PO4-P, 60 mg L−1 for TN and NH4-N and 3000 no. ml−1 forotal coliform. However, average BOD5 and CODCr concentrationsould not meet the discharge limit value of 120 mg L−1 during 2007nd 2008. Figure 2 presents average purification rates of hybridystem for TSS, CODCr, BOD5, TN, NH4-N, TP, TC and total coliform.n 2008, average concentrations of TSS, CODCr, TN, TP and TC inhe influent dropped by 67, 72, 52, 63 and 62% respectively withespect to their concentrations in 2007. This significant concen-ration drop resulted into decrease in average purification ratesf TSS, CODCr, TN, TP and TC by 1.9, 3.2, 8.3, 22.2 and 9.4% respec-
ively in 2008 compared to 2007 (Fig. 2). TSS and CODCr purificationates were slightly affected by large variations in influent concen-rations between two consecutive years. The major source of TSSas excreta of cows which mixed with the influent during floortae
neering 57 (2013) 216– 225 219
ashing operations at milking parlor. A positive correlationetween TSS and CODCr (Spearman R value; 0.85, p < 0.0001) showshat CODCr was mainly in the form of particulate COD and derivedrom TSS. TSS is purified by sedimentation and filtration processeshich are slightly affected by variations in inlet concentrations.
TN and TC showed moderate decrease in purification rates from007 to 2008. TN in the wastewater is sum of organic and inorganicNH4-N, NO2-N and NO3-N) nitrogen. In 2007, average organicnd inorganic N content in influent accounted for 62.6 and 37.4%espectively whereas in 2008 TN comprised of 53.4% organic and6.6% inorganic N. The organic N was mainly in the form of excretahich settled on the surfaces of beds. While NH4-N dominated
n inorganic nitrogen. A sharp decrease of 22.2% was observed inhe purification rate of TP from 2007 to 2008 (Fig. 2). TP purifi-ation takes place by adsorption and precipitation of dissolved Pn the filter material of the beds of CWs. When TP concentrationsn influent dropped sharply the apparent release of accumulatedhosphorus from the binding sites of filter media might resulted
nto a sharp decrease in the TP purification rate. Arias et al. (2003)lso found similar results in his study. Average influent BOD5 andH4-N concentrations in 2008 decreased by 35.7 and 40% respec-
ively. However BOD5 and NH4-N purification rates increased by.3 and 3% in 2008 compared to 2007. Generally BOD5 and NH4-Nurification rates decrease by increasing concentrations.
In 2009, average TSS, CODCr, TN, TP, NH4-N and TC concen-rations in the influent were increased by 27, 61, 28, 45, 59 and3% respectively in contrast to 2008. Moreover, average purifica-ion rates of TSS, CODCr, TN, TP, NH4-N and TC in 2009 increasedy 2.8, 4.4, 2.0, 12.8, 10.4 and 1.6% respectively compared to007. Generally high influent concentrations correspond with highurification rates in CWs, reflecting their high buffer capacity (Yend Li, 2009). In our system, although inlet concentrations of allarameters i.e. TSS, BOD, COD, TN, NH4-N, TC, TP showed highuctuations but purification rates for these parameters were notuctuated to that extent. Specifically, BOD purification rate, whichuctuated only 6% in spite of huge fluctuations in inlet BOD con-entrations (1,080–2,114 mg L−1). This can be explained by highecomposition rate of organic matter (BOD) during the periodhen system received high inlet concentrations. This confirms that
mbetsu hybrid CWs posses a good buffer capacity. Kern (2003)lso reported similar results during treatment of dairy wastewa-er using CWs. Average BOD5 concentrations in influent althoughncreased by 20% in 2009 than 2008 however purification rateemained unaffected. In 2010 compared to 2009, average concen-rations of all parameters except NH4-N showed an increase in thenfluent, likewise purification rates of all parameters resulted anncrease during this period.
Total coliform concentration in influent showed a great fluctu-tion from 2007 to 2010, being highest in 2010 and lowest in 2009.owever, purification rates were always >90% reaching as high as9.5% in 2008.
Among all parameters, average yearly purification rates of TN,H4 and TP showed high fluctuations as a result of inlet loaductuations. Our results are comparable with Kato et al. (2013)ho operated 3 hybrid CWs at different inlet loading rates (COD:
,400–5,000 mg L−1) for dairy waste water treatment and observed fluctuation of 39–90% for TN, 36–82% for NH4-N and 70–93% forP.
.5. Loads and Removal rates
Load and removal rates are more accurate way to presenthe treatment efficiencies of CWs because concentrationnd purification rates might alter due to precipitation,vaporation and evapo-transpiration processes. Similar to
220 P.K. Sharma et al. / Ecological Engineering 57 (2013) 216– 225
Table 2Year-wise average concentrations (± SD) of water quality parameters of influent and effluent during treatment in hybrid sub-surface flow CWs.
pH DO (mg L−1) EC (mS cm−1) ORP (mV) TSS (mg L−1)
In Out In Out In Out In Out In Out
2007 6.2 ± 0.7 6.2 ± 0.8 1.3 ± 1.6 2.5 ± 2.2 1.5 ± 0.3 0.9 ± 0.3 264 ± 74 293 ± 81 1,259 ± 611 34 ± 372008 7.1 ± 0.5 7.2 ± 0.4 1.8 ± 1.4 2.1 ± 0.8 1.0 ± 0.3 0.7 ± 0.2 220 ± 40 223 ± 82 413.8 ± 504 11 ± 152009 6.7 ± 0.7 7.1 ± 0.4 1.6 ± 1.6 2.0 ± 1.1 1.4 ± 0.5 0.9 ± 0.3 183 ± 22 251 ± 94 525.7 ± 406 6.3 ± 7.32010 6.5 ± 0.7 6.8 ± 0.5 2.2 ± 1.9 2.1 ± 2.3 1.4 ± 0.3 0.8 ± 0.3 195 ± 57 329 ± 73 662.4 ± 736 2.2 ± 1.6
BOD5 (mg L−1) CODCr (mg L−1) Total P (mg L−1) PO4-P (mg L−1) Organic P (mg L−1)
In Out In Out In Out In Out In Out
2007 2,114 ± 620 188 ± 79 7,085 ± 2,618 580 ± 394 41.7 ± 11.6 5.6 ± 4.7 37.4 ± 11.6 4.5 ± 3.9 4.3 ± 2.4 1.2 ± 1.02008 1,359 ± 426 124 ± 70 1,962 ± 806 214 ± 147 15.3 ± 5.7 4.5 ± 1.9 11.0 ± 4.7 3.4 ± 1.6 4.3 ± 2.3 1.1 ± 0.82009 1,080 ± 97 75.8 ± 26 3,156 ± 2,009 140 ± 28 22.2 ± 12.0 4.0 ± 1.8 17.3 ± 10.3 3.3 ± 1.6 4.9 ± 2.5 0.7 ± 0.32010 1,283 ± 159 57.7 ± 25 4,086 ± 1,713 144 ± 108 24.8 ± 9.4 5.5 ± 3.2 20.5 ± 8.3 4.8 ± 2.6 4.3 ± 1.6 0.9 ± 0.7
Total N (mg L−1) NH4-N (mg L−1) NO3-N (mg L−1) Total C (mg L−1) T. Coliform (no. ml−1)
In Out In Out In Out In Out In Out
2007 243 ± 67 42 ± 26 90 ± 40 29 ± 19 0.79 ± 0.96 2.2 ± 4.8 2,215 ± 744 248 ± 136 36.8 ± 44.3 1.5 ± 3.62008 116 ± 47 28 ± 17 54 ± 26 20 ± 16 0.17 ± 0.32 0.2 ± 0.4 832.6 ± 452 145 ± 67 224 ± 327 0.3 ± 0.8
V
coC((A(aPldHwidsmrsaiOC
dlbrb3yaat
nftOp22a
TY
U
2009 148 ± 67 23 ± 8 86 ± 48 16 ± 5 0.25 ± 0.452010 165 ± 58 17 ± 9 70 ± 32 10 ± 5 0.01 ± 0.04
alues of Total coliform are in thousands
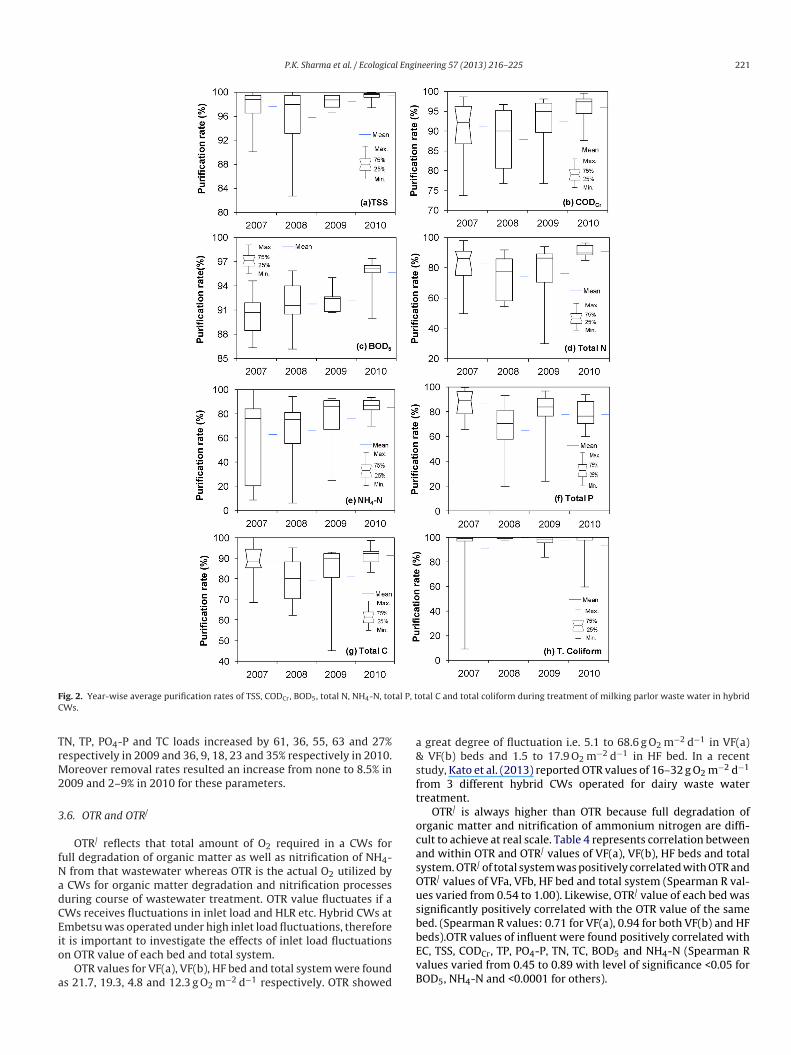
oncentrations, high fluctuations in average yearly inlet loads werebserved for TSS (2.7–9.0 g m−2 d−1), BOD5 (8.4–14.4 g m−2 d−1),OD (14.5–50.0 g m−2 d−1), TN (0.8–1.6 g m−2 d−1), NH40.40–0.64 g m−2 d−1), TC (6.0–15.1 g m−2 d−1) and TP0.11–0.28 g m−2 d−1) throughout the study period (Table 3).verage yearly removal rate fluctuation was observed as; TSS
96–99%), COD (88–94%), BOD (86–94%), TN (73–86%), TP (65–86%)nd TC (80–89%). Average loads of TSS, BOD5, CODCr, TN, TP,O4-P and TC in the influent were highest in 2007 except NH4-Noad which was highest in 2009. Average TSS and CODCr loadsecreased by nearly 70% in influent in 2008 compared to 2007.owever removal rates of TSS and CODCr were almost unaffectedith a slight decrease. Furthermore, average TP and PO4-P load
n influent was also dropped by 61 and 68% along with a sharpecline of 21 and 18% in removal rates during 2008 (Fig. 3). Astated in the previous section, release of accumulated phosphorusight be the most probable reason for this decrease in removal
ate. In contrast, BOD5 load although decreased by 30% in 2008 buthowed an increase in removal rate by 4.4%. BOD removal mech-
nism is associated with microbial degradation of organic mattern presence of sufficient oxygen required by microorganisms.xygen transfer rate remains more or less constant in a hybridW system during treatment, if clogging and/or over floodingh
PT
able 3ear-wise average (± SD) load of water quality parameters in influent and effluent during
TSS BOD5
In Out In Out
2007 9.0 ± 4.5 0.28 ± 0.3 14.4 ± 4.1 1.9 ± 0.7
2008 2.7 ± 1.8 0.08 ± 0.1 10.0 ± 4.5 1.0 ± 0.6
2009 4.3 ± 2.2 0.05 ± 0.0 8.4 ± 2.8 0.8 ± 0.3
2010 5.5 ± 3.8 0.03 ± 0.0 9.2 ± 2.6 0.5 ± 0.2
NH4-N Total P
In Out In Out
2007 0.64 ± 0.2 0.24 ± 0.1 0.28 ± 0.1 0.04 ± 0.0
2008 0.40 ± 0.1 0.16 ± 0.1 0.11 ± 0.1 0.04 ± 0.0
2009 0.66 ± 0.3 0.15 ± 0.1 0.17 ± 0.1 0.04 ± 0.0
2010 0.53 ± 0.2 0.10 ± 0.0 0.20 ± 0.1 0.06 ± 0.0
nit for all parameters is g m2 d−1.
1.4 ± 2.2 1,022 ± 574 123 ± 26 26.9 ± 27.6 1.0 ± 1.80.5 ± 1.1 1,343 ± 544 106 ± 49 627 ± 1,444 1.6 ± 2.8
oes not happens on the bed surface. An increase in inlet BODoad decreases removal rate due to higher demand of oxygen foriological degradation. This was the reason for lower BOD removalate in 2007 compared to 2008.TN, NH4-N and TC loads droppedy 50, 37.5 and 60% respectively in 2008 and further increased by7.5, 65 and 27% respectively in 2009 compared to their precedingear’s average load. However average removal rates of TN, NH4-Nnd TC showed a decrease of 6.1, 3.4 and 5.4% respectively in 2008nd an increase of 4.5, 8.3 and 3.0% respectively in 2009 comparedo the preceding year of 2007 and 2008.
Hybrid CWs are known for higher TN removal mainly due toitrification-denitrification processes (Brix and Arias, 2005). There-
ore, recycling of wastewater was carried out from outlet to inletank of VF(b) from 2008 to 2010 during growing season (April-ctober). We observed higher TN removal rates during recyclingeriod compared to non-growing season (November-March) from008 to 2010. Several other researchers such as Brix and Arias,005; Hamouri et al., 2012 and Kato et al., 2013 also observedn increase in TN removal rate due to recycling of wastewater in
ybrid CWs.In 2009 and 2010, Average influent loads of TSS, CODCr, TN, TP,O4-P and TC resulted an increase from the preceding year such as;SS increased by 59% in 2009 and 28% in 2010. Similarly, CODCr,
treatment in hybrid sub-surface flow CWs.
CODCr TN
In Out In Out
50.0 ± 4.5 4.9 ± 3.2 1.6 ± 0.6 0.36 ± 0.214.5 ± 5.7 1.7 ± 1.0 0.8 ± 0.3 0.22 ± 0.123.4 ± 13.1 1.4 ± 0.6 1.1 ± 0.4 0.23 ± 0.131.9 ± 9.9 1.6 ± 0.7 1.2 ± 0.5 0.15 ± 0.1
PO4-P Total C
In Out In Out
0.25 ± 0.1 0.03 ± 0.0 15.1 ± 4.1 2.2 ± 1.10.08 ± 0.0 0.03 ± 0.0 6.02 ± 2.2 1.1 ± 0.50.13 ± 0.1 0.03 ± 0.0 7.65 ± 3.7 1.1 ± 0.40.16 ± 0.0 0.05 ± 0.0 10.3 ± 3.4 1.1 ± 0.6
P.K. Sharma et al. / Ecological Engineering 57 (2013) 216– 225 221
F al P, tC
TrM2
3
fNadCEio
a
a&sft
ocasOusb
ig. 2. Year-wise average purification rates of TSS, CODCr, BOD5, total N, NH4-N, totWs.
N, TP, PO4-P and TC loads increased by 61, 36, 55, 63 and 27%espectively in 2009 and 36, 9, 18, 23 and 35% respectively in 2010.oreover removal rates resulted an increase from none to 8.5% in
009 and 2–9% in 2010 for these parameters.
.6. OTR and OTR/
OTR/ reflects that total amount of O2 required in a CWs forull degradation of organic matter as well as nitrification of NH4-
from that wastewater whereas OTR is the actual O2 utilized by CWs for organic matter degradation and nitrification processesuring course of wastewater treatment. OTR value fluctuates if aWs receives fluctuations in inlet load and HLR etc. Hybrid CWs atmbetsu was operated under high inlet load fluctuations, therefore
t is important to investigate the effects of inlet load fluctuationsn OTR value of each bed and total system.OTR values for VF(a), VF(b), HF bed and total system were founds 21.7, 19.3, 4.8 and 12.3 g O2 m−2 d−1 respectively. OTR showed
bEvB
otal C and total coliform during treatment of milking parlor waste water in hybrid
great degree of fluctuation i.e. 5.1 to 68.6 g O2 m−2 d−1 in VF(a) VF(b) beds and 1.5 to 17.9 O2 m−2 d−1 in HF bed. In a recenttudy, Kato et al. (2013) reported OTR values of 16–32 g O2 m−2 d−1
rom 3 different hybrid CWs operated for dairy waste waterreatment.
OTR/ is always higher than OTR because full degradation ofrganic matter and nitrification of ammonium nitrogen are diffi-ult to achieve at real scale. Table 4 represents correlation betweennd within OTR and OTR/ values of VF(a), VF(b), HF beds and totalystem. OTR/ of total system was positively correlated with OTR andTR/ values of VFa, VFb, HF bed and total system (Spearman R val-es varied from 0.54 to 1.00). Likewise, OTR/ value of each bed wasignificantly positively correlated with the OTR value of the sameed. (Spearman R values: 0.71 for VF(a), 0.94 for both VF(b) and HF
eds).OTR values of influent were found positively correlated withC, TSS, CODCr, TP, PO4-P, TN, TC, BOD5 and NH4-N (Spearman Ralues varied from 0.45 to 0.89 with level of significance <0.05 forOD5, NH4-N and <0.0001 for others).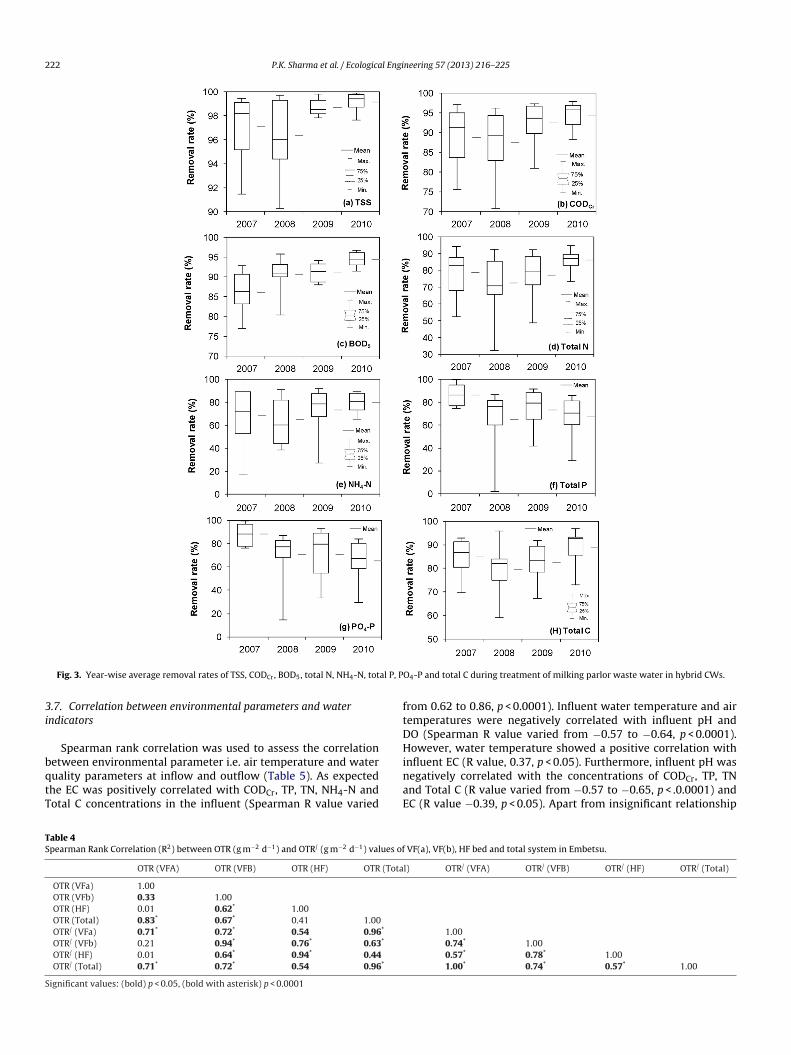
222 P.K. Sharma et al. / Ecological Engineering 57 (2013) 216– 225
al P, P
3i
bqtT
ftDH
TS
S
Fig. 3. Year-wise average removal rates of TSS, CODCr, BOD5, total N, NH4-N, tot
.7. Correlation between environmental parameters and waterndicators
Spearman rank correlation was used to assess the correlation
etween environmental parameter i.e. air temperature and wateruality parameters at inflow and outflow (Table 5). As expectedhe EC was positively correlated with CODCr, TP, TN, NH4-N andotal C concentrations in the influent (Spearman R value variedinaE
able 4pearman Rank Correlation (R2) between OTR (g m−2 d−1) and OTR/ (g m−2 d−1) values of
OTR (VFA) OTR (VFB) OTR (HF) OTR (Tota
OTR (VFa) 1.00OTR (VFb) 0.33 1.00OTR (HF) 0.01 0.62* 1.00OTR (Total) 0.83* 0.67* 0.41 1.00OTR/ (VFa) 0.71* 0.72* 0.54 0.96*
OTR/ (VFb) 0.21 0.94* 0.76* 0.63*
OTR/ (HF) 0.01 0.64* 0.94* 0.44
OTR/ (Total) 0.71* 0.72* 0.54 0.96*
ignificant values: (bold) p < 0.05, (bold with asterisk) p < 0.0001
O4-P and total C during treatment of milking parlor waste water in hybrid CWs.
rom 0.62 to 0.86, p < 0.0001). Influent water temperature and airemperatures were negatively correlated with influent pH andO (Spearman R value varied from −0.57 to −0.64, p < 0.0001).owever, water temperature showed a positive correlation with
nfluent EC (R value, 0.37, p < 0.05). Furthermore, influent pH wasegatively correlated with the concentrations of CODCr, TP, TNnd Total C (R value varied from −0.57 to −0.65, p < .0.0001) andC (R value −0.39, p < 0.05). Apart from insignificant relationship
VF(a), VF(b), HF bed and total system in Embetsu.
l) OTR/ (VFA) OTR/ (VFB) OTR/ (HF) OTR/ (Total)
1.000.74* 1.000.57* 0.78* 1.001.00* 0.74* 0.57* 1.00
P.K. Sharma et al. / Ecological EngiTa
ble
5Sp
earm
an
Ran
k
Cor
rela
tion
valu
es
betw
een
air
tem
per
atu
re
and
wat
er
qual
ity
par
amet
ers
in
the
infl
ow
(I)
and
outfl
ow
(O)
of
Hyb
rid
Sub-
surf
ace
flow
con
stru
cted
wet
lan
d
syst
em
at
Embe
tsu
.
Q(I
)
Wat
er◦ C
(I)
Air
◦ C
(I)
pH
(I)
EC
(I)
DO
(I)
CO
D
(I)
BO
D
(I)
TP
(I)
TN
(I)
NH
4-N
(I)
TC
(I)
Q
(O)
Wat
er◦ C
(O)
Air
◦ C(O
)p
H
(O)
EC
(O)
DO
(O)
CO
D
(O)
BO
D
(O)
TP
(O)
TN
(O)
NH
4-N
(O)
TC
(O)
Q(I
)
1.00
Wat
er◦ C
(I)
0.04
1.00
Air
◦ C
(I)
0.12
0.94
1.00
pH
(I)
−0.0
3
−0.6
1
−0.6
4
1.00
EC
(I)
−0.0
40.
37
0.39
−0.3
9
1.00
DO
(I)
0.14
−0.5
7
−0.6
1
0.47
−0.2
6
1.00
CO
D
(I)
−0.0
1
0.21
0.25
−0.6
5
0.62
−0.1
3
1.00
BO
D
(I)
0.01
−0.1
5
−0.2
6
−0.2
2
0.15
0.05
0.53
1.00
TP
(I)
−0.0
4
0.28
0.29
−0.6
5
0.70
−0.1
3
0.98
0.59
1.00
TN
(I)
−0.0
4
0.23
0.21
−0.5
7
0.71
−0.1
4
0.96
0.50
0.95
1.00
NH
4-N
(I)
−0.1
60.
07
0.07
−0.2
5
0.86
−0.1
5
0.49
0.23
0.57
0.63
1.00
TC
(I)
−0.0
4
0.26
0.30
−0.6
5
0.64
−0.1
3
0.99
0.57
0.96
0.96
0.48
1.00
Q
(O)
0.30
−0.2
0
−0.2
0
0.19
−0.0
8
0.22
−0.0
8
0.00
0.00
−0.0
2
−0.1
5
−0.0
1
1.00
Wat
er◦ C
(O)
−0.1
1
0.86
0.85
−0.6
2
0.39
−0.6
7
0.25
−0.1
1
0.32
0.30
0.17
0.34
−0.1
9
1.00
Air
◦ C
(O)
−0.0
2
0.94
1.00
−0.6
1
0.39
−0.6
2
0.26
−0.2
5
0.26
0.19
0.05
0.22
−0.0
8
0.82
1.00
pH
(O)
0.10
0.05
0.03
0.28
0.01
0.11
−0.3
6
−0.3
7
0.00
−0.2
5
0.01
−0.3
7
0.00
0.08
0.01
1.00
EC
(O)
−0.1
1
0.26
0.21
−0.1
8
0.30
−0.1
3
0.34
−0.0
1
0.33
0.39
0.35
0.36
−0.2
6
0.27
0.13
−0.0
8
1.00
DO
(O)
0.00
0.04
0.09
0.07
−0.0
7
−0.0
1
−0.1
1
−0.0
9
−0.1
0
−0.0
7
−0.0
4
−0.0
7
0.20
−0.4
3
−0.4
7
0.09
−0.1
1
1.00
CO
D
(O)
−0.1
7
−0.0
8
−0.2
0
−0.1
4
0.04
0.02
0.43
0.65
0.42
0.38
−0.0
5
0.43
−0.2
8
0.05
−0.2
0
−0.2
6
0.23
−0.1
0 1.
00B
OD
(O)
−0.1
1
−0.0
7
−0.2
0
−0.1
9
0.24
−0.1
0
0.36
0.70
0.45
0.40
0.22
0.40
−0.0
9
0.11
−0.2
1
−0.1
6
0.08
−0.0
4 0.
63
1.00
TP
(O)
0.36
0.39
0.31
−0.2
0
0.24
−0.0
7
0.26
0.07
0.24
0.25
−0.0
1
0.26
−0.0
3
0.33
0.31
0.16
0.50
−0.3
1
0.30
0.03
1.00
TN
(O)
−0.0
6
0.01
−0.1
2
−0.0
7
0.12
0.06
0.32
0.42
0.36
0.40
0.07
0.35
−0.0
5
0.12
−0.1
1
0.10
0.49
−0.0
2
0.66
0.48
0.47
1.00
NH
4-N
(O)
−0.0
2
0.02
−0.1
6
−0.0
6
0.07
0.12
0.31
0.49
0.32
0.34
0.08
0.33
−0.0
8
0.10
−0.0
8
0.02
0.41
−0.1
0
0.61
0.48
0.46
0.91
1.00
TC
(O)
−0.1
5
0.07
−0.0
6
−0.1
7
0.12
0.00
0.40
0.37
0.42
0.40
0.00
0.42
−0.3
3
0.18
−0.0
7
0.15
0.61
−0.1
2
0.81
0.45
0.47
0.74
0.68
1.00
Q:
Wat
er
flow
;
DO
:
dis
solv
ed
oxyg
en;
TC:
tota
l car
bon
;
EC:
elec
tric
al
con
du
ctiv
ity.
Bol
d
valu
es
wit
h
un
der
lin
e
are
stat
isti
call
y
sign
ifica
nt
at
p
<
0.00
01;
wit
hou
t
un
der
lin
e
are
sign
ifica
nt
at
p
<
0.05
.
bapfwp0pDhb(sEtT−itaIivDairastaca
3
fih5o1cHV4ababTabilHiwvtcabl
neering 57 (2013) 216– 225 223
etween NH4-N and BOD5 concentrations, CODCr, BOD5, TP, TNnd NH4-N concentrations in the influent confirmed a significantositive correlation among each other (Spearman R value variedrom 0.49 to 0.99).On the other hand, effluent TP concentrationas significantly positively correlated with air and influent tem-eratures as well as influent flow. (R values varied from 0.31 to.39, p < 0.05).Higher influent flow especially during snow meltingeriod might have carried precipitated phosphorus from the bed.uring summer seasons higher air and water temperatures mightave increased the evaporation and evapo-transpiration rates ateds resulting higher TP concentrations in the effluent. Öövel et al.2007) found the similar results in his study during treatment ofchoolhouse wastewater in a hybrid constructed wetland system atstonia. Influent DO was negatively correlated with effluent wateremperature (R value −0.67, p < 0.0001). Influent CODCr, BOD5 andC concentrations were negatively correlated with pH (R value0.36 and −0.37, p < 0.05). This is due to the fact that when dur-
ng biological degradations of the organic matter (COD, BOD andotal carbon), acids are released as an intermediate products bycidophilic microorganisms which decrease the pH of waste water.nfluent and effluent CODCr, and TC concentrations showed a pos-tive significant correlation with each other (Spearman R valuearied from 0.40 to 0.43, p < 0.05). Similar to influent DO, effluentO concentration was negatively correlated with effluent temper-ture and air temperature. (R values −0.43 and −0.47, p < 0.05). ECs directly related to dissolved ions present in the water and thisesulted a positive correlation of EC with TP, TN, TC at p < 0.0001nd NH4-N at p < 0.05 in the effluent. In the effluent, CODCr alsohowed a positive correlation with BOD5, TN, NH4-N, TC concen-rations at p < 0.0001 (Spearman R value varied from 0.61 t0 0.81)nd TP concentration at p < 0.05 (Spearman R value 0.30). TN con-entration in the effluent too was positively correlated with NH4-Nnd TC concentration (R value 0.91 and 0.74, p < 0.0001).
.8. Application of k-C* model
The average and standard deviation values of the area-basedrst-order rate-constant k for BOD5, TN, NH4-N and TP of the wholeybrid CWs throughout the study period were 7.0 ± 1.8, 7.4 ± 3.3,.6 ± 4.1 and 4.9 ± 2.0 m yr−1 respectively (Table 6). Average k valuef BOD5 in VF(a), VF(b) and HF bed was observed as 6.5 ± 3.74,0.6 ± 4.69 and 6.4 ± 3.1 m yr−1 respectively The first-order rate-onstant value (k) of BOD5 was highest in VF(b) bed followed byF and VF(a) bed. The bed area, filter material, and HRTs of bothF beds were same but inlet BOD5 load in VF(a) bed was as high as5.0 g m−2 d−1 compared to 26 g m−2 d−1 in VF(b) bed. This resulted
more oxygen demand in VF(a) bed for decomposition of theiodegradable organic matter. However OTR values of both VF bedsre nearly similar, This indicate more anaerobic conditions on VF(a)ed compared to VF(b) bed. On the other hand, average k values ofP in VF(a), VF(b) and HF bed were observed as 5.4 ± 2.4, 7.5 ± 4.8nd 7.6 ± 5.8 m yr−1 respectively. High k values in VF(b) than VF(a)eds were due to recycling of wastewater at VF(b) bed during grow-
ng seasons. High k value for HF bed was due to larger bed size andonger HRT in HF bed. Average k20 values of TN in VF(a), VF(b) andF bed were 12.0 ± 9.0, 10.3 ± 7.1 and 6.9 ± 8.0 respectively. Sim-
larly average k20 values for NH4-N in VF(a), VF(b) and HF bedsere observed as 10.4 ± 6.8, 9.1 ± 7.2 and 8.6 ± 10.8 respectively. k
alues of TN and NH4-N for VF beds were higher than HF bed dueo high nitrification rate at these beds as a result of more aerobic
onditions at bed surfaces and denitrification of nitrified effluentt VF(b) inlet by recycling mechanism which were started in VF(b)ed in 2008. This in total resulted higher removal of TN and NH4-Noads in VF beds.
224 P.K. Sharma et al. / Ecological Engineering 57 (2013) 216– 225
Table 6Spearman Rank Correlation (R2) between the mass loading rates, mass removed rates and the area based first-order rate-constant (k) of BOD5, TN, NH4-N and TP in thehybrid constructed wetland system in Embetsu.
BOD5 (L) BOD5 (k) BOD5 (R) TN (L) TN (k) TN (R) NH4-N (L) NH4-N (k) NH4-N (R) TP (L) TP (k) TP (R)
BOD5 (L) 1.00BOD5 (k) 0.07 1.00BOD5 (R) 0.99 0.14 1.00TN (L) 0.48 0.13 0.48 1.00TN (k) 0.17 0.19 0.18 0.26 1.00TN (R) 0.34 0.11 0.36 0.93 0.38 1.00NH4-N (L) 0.49 0.00 0.47 0.85 0.27 0.82 1.00NH4-N (k) −0.11 0.16 −0.10 0.06 0.85 0.24 0.22 1.00NH4-N (R) 0.24 −0.12 0.23 0.61 0.45 0.70 0.84 0.56 1.00TP (L) 0.49 0.05 0.48 0.94 0.26 0.90 0.80 0.07 0.62 1.00TP (k) 0.31 −0.28 0.29 0.48 0.63 0.54 0.53 0.49 0.64 0.57 1.00
0.87
L rst-or
bekepivpTmP(vr0wfldeh
4
fTTpa(NppiAcotamiwrNtw
lpfhsabrPdPC1
stp
A
cg
R
A
A
B
B
C
C
C
H
J
TP (R) 0.50 −0.10 0.49 0.88 0.32
: Mass loading rate (g m−2d−1); R: Mass removed load (g m−1 d−1); k: area based fi
Average k values for total N and NH4-N were nearly similar inoth VF beds but k values of BOD5 and total P showed a differ-nce in both of these beds. k values of HF bed were lower than the
values of VF(a) and VF(b) beds for BOD5, TN and NH4-N. How-ver k value of TP was almost similar in HF and VFB bed. Table 6resents the Spearman Rank Correlation (R2) values among load-
ng rate, removed load and area based first-order rate-constant (k)alue of BOD5, TN, NH4-N and TP for entire hybrid CWs. A strongositive correlation was observed between loading rates of BOD5,N, NH4-N and TP and their corresponding removed loads (Spear-an R value varied from 0.84 to 0.99, p < 0.0001). k value of Total
was positively correlated with the loading rates of TN, NH4-NR value 0.48 and 0.53, p < 0.05) and TP(R value 0.57, p < 0.0001). kalues of TN, NH4-N and TP were significantly correlated with theirespective removed loads (R values 0.38 for TN, p < 0.05; 0.70 and.73 for NH4-N and TP, p < 0.0001). k values of TN, NH4-N, and TPere also significantly correlated among each other. (R for varied
rom 0.49 to 0.83). Significant correlation of k values with massoading and removal rates allow us to assume that the k-C* modelescribes the removal rates adequately and it can be used for thevaluation of the performance of constructed wetland systems likeybrid system of Embetsu.
. Conclusion
Hybrid CW system received high fluctuations in influent loador all parameters from 2007 to 2010. Average influent TSS, COD,P and TC load showed maximum fluctuation followed by BOD,N and NH4-N loads. However, besides such high fluctuations,urification and removal rates of hybrid CWs were least fluctu-ted for TSS (95.7–99.4%); moderately for BOD5 (86.1–95.7%), COD87.5–96.1%) and TC (79.5–91.3%); highly for TN (72.6–90.6%), NH4-
(62.9–85.3%) and TP (64.8–87.2%). TSS is removed by physicalrocesses such as sedimentation and filtration. This ensures thathysical processes of CWs are highly tolerant to load fluctuations
n a CW system compared to biological and chemical processes.lthough COD load fluctuation was higher than BOD load but purifi-ation and removal rate fluctuation of both parameters was morer less similar. This suggests that BOD removal is more sensitiveo load fluctuations in CWs. TN and NH4-N removals were highlyffected due to inlet load fluctuations. TN and NH4-N removalainly occurs by nitrification coupled with denitrification process
n the CW beds. Nitrification requires mixing of atmospheric N withastewater during treatment pathway. High influent loads might
estrict good nitrification which subsequently affects TN and NH4- purification and removal rates of the CW system. Along with
his, TP purification and removal rates were also sharply decreasedhen influent TP loads sharply declined than its previous year’s
K
K
0.80 0.14 0.71 0.94 0.73 1.00
der rate-constant value (m y−1)
oads. This suggests that TP is mainly removed by adsorption andrecipitation processes and remains accumulated in the CW bedor long time. During heavy rainfall and snow melting periods, highydraulic rates might carry this accumulated phosphorus and sub-equently increase TP concentration in effluents. Therefore a properrrangement of TP removal using covered gravel pits constructedefore a CW system could be a better alternative for phospho-us removal from wastewater. Average concentrations of TSS, TP,O4-P, TN and NH4-N in the effluent of all years were below theischarge limit value of: 150 mg L−1 for TSS; 8 mg L−1 for TP andO4-P, 60 mg L−1 for TN and NH4-N. However, average BOD5 andODCr concentrations could not meet the discharge limit value of20 mg L−1 during 2007 and 2008.
It can be concluded from the present study that hybrid CWystem is able to produce compromising results besides high fluc-uations in inlet load during treatment of high strength milkingarlor wastewater.
cknowledgement
The authors wish to thank Research Council of Ministry of Agri-ulture, Forestry and Fisheries (MAFF), Japan, for their support byranting funds for the project.
eferences
PHA, 1992. Standard methods for examination of water and wastewater, 18th ed.American Public Health Association, Washington, DC.
rias, C.A., Brix, H., Johansen, N.H., 2003. Phosphorus removal from municipalwastewater in an experimental two-stage vertical flow constructed wetlandsystem equipped with a calcite filter. Wat. Sci. Technol. 48 (5), 51–58.
rix, H., Arias, C.A., 2005. The use of vertical flow constructed wetlands foronsite treatment of domestic wastewater: new Danish guidelines. Ecol. Eng.25, 491–500.
eutel, M.W., Newton, C.D., Brouillard, E.S., Watts, R.J., 2009. Nitrate removal insurface-flow constructed wetlands treating dilute agricultural runoff in thelower Yakima Basin, Washington. Ecol. Eng. 35, 1538–1546.
hazarenc, F., Maltais-Landry, G., Troesch, S., Comeau, Y., Brisson, J., 2007. Effectof loading rate on performance of constructed wetlands treating an anaerobicsupernatant. Wat. Sci. Technol. 56 (3), 23–29.
ooper, P., Smith, M., Maynard, H., 1997. The design and performance of a nitrifyingvertical–flow reed bed treatment system. Wat. Sci. Technol. 35 (5), 215–221.
ooper, P., 2005. The performance of vertical flow constructed wetland systemswith special reference to the significance of oxygen transfer and hydraulic load-ing rates. Wat. Sci. Technol. 51 (9), 81–90.
amouri, B.E., Kinsley, C., Crolla, A., 2012. A hybrid wetland for small communitywastewater treatment in Morocco. Sustainable Sanitation Pract. 12, 22–26.
ustin, M.Z., Vrhovsek, D., Stuhlbacher, A., Bulc, T.G., 2009. Treatment of wastewaterin hybrid constructed wetland from the production of vinegar and packaging ofdetergents. Desalination 246, 100–109.
adlec, R.H., Zmarthie, L.A., 2010. Wetland treatment of leachate from a closedlandfill. Ecol. Eng. 36 (7), 946–957.
ato, K., Moriaka, R., Hosokawa, H., Osada, H., Kanazawa, K., Nozoe, T., 2005. Pre-liminary studies on hybrid wetland systems for purification of milking parlourwastewater in northern part of Japan. In: Proc. 1st International symposium
l Engi
K
K
K
K
M
M
N
N
Ö
S
S
S
T
T
V
V
P.K. Sharma et al. / Ecologica
on wetland pollutant dynamics and control, (WETPOL), Ghent, Belgium, pp.250–251.
ato, K., Inoue, T., Ietsugu, H., Koba, T., Sasaki, H., Miyaji, N., Yokota, T., Sharma, P.K.,Kitagawa, K., Nagasawa, T., 2010. Design and performance of hybrid reed bedsystems for treating high content wastewater in the cold climate. In: Proc. 12th
Internat. Conf. on Wetland Systems for Water Pollution Control, (ICWS), Venice,Italy, pp. 511–517.
ato, K., Inoue, T., Ietsugu, H., Koba, T., Sasaki, H., Miyaji, N., Kitagawa, K., Sharma, P.K.,Nagasawa, T., 2013. Performance of six multi-stage hybrid wetland systems fortreating high-content wastewater in the cold climate of Hokkaido, Japan. Ecol.Eng. 51, 256–263.
adlec, R.H., 2000. The inadequacy of first-order treatment wetland models. Ecol.Eng. 15, 105–119.
ern, J., 2003. Seasonal efficiency of a Constructed Wetland for treating dairyfarm wastewater. In: Mander, Ü., Jenssen, P. (Eds.), Constructed Wetlands forwastewater treatment in cold climates. WIT Press, Southampton, UK, pp. 195–212.
oir, S.E., Sym, S.G., Clark, J., McGechan, M.B., Castle, K., 2005. An Experimental Planfor testing Methods of treating Dilute farms Effluents and Dirty Water. Ecol. Eng.90 (3), 349–355.
unavalli, G.R., Saler, P.S., 2009. Treatment of dairy wastewater by water hyacinth.Wat. Sci. Technol. 59 (4), 713–722.
oorvee, A., Poldvere, E., Mandar, U., 2005. The effect of vertical flow fil-ter bed on a hybrid constructed wetland system. Wat. Sci. Technol. 51 (9),137–144.
yquist, J., Greger, M., 2009. A field study of constructed wetlands for preventingand treating acid mine drainage. Ecol. Eng. 35, 630–642.
Y
neering 57 (2013) 216– 225 225
övel, M., Tooming, A., Mauring, T., Mander, Ü., 2007. Schoolhouse wastewaterpurification in a LWA-filled Hybrid Constructed Wetland in Estonia. Ecol. Eng.29, 17–26.
errano, L., Varga, D., De, la., Ruiz, I., Soto, M., 2011. Winery wastewater treatmentin a hybrid constructed wetland. Ecol. Eng. 37 (5), 744–753.
ingh, S., Haberl, R., Moog, O., Shrestha, R.R., 2009. Performance of an anaerobicbaffled reactor and hybrid constructed wetland treating high strength wastewater in Nepal-A model for DEWATS. Ecol. Eng. 35, 654–660.
harma, P.K., Takashi, I., Kato, K., Ietsugu, H., Tomita, K., Nagasawa, T., 2012.Seasonal efficiency of a hybrid sub-surface flow constructed wetland sys-tem in treating milking parlor wastewater at northern hokkaido. Ecol. Eng.http://dx.doi.org/10.1016/j.ecoleng.2012.12.054 (In Press).
RIM Co. Ltd., 2012. Eco-product Supersol made from waste glass bottles, Charac-teristics and constituents. http://www.trims.co.jp/english/product/index.html(accessed 04.02.13).
szynska, A., Obarska-Pempkowiak, H., 2008. Dependence between quality andremoval effectiveness of organic matter in hybrid constructed wetlands. Biores.Technol. 99, 6010–6016.
ymazal, J., 2011. Long-term performance of constructed wetlands with horizontalsub-surface flow: Ten case studies from the Czech Republic. Ecol. Eng. 37 (1),54–63.
ymazal, J., Kröpfelová, L., 2011. A three-stage experimental constructed wetland
for treatment of domestic sewage: First 2 years of operation. Ecol. Eng. 37 (1),90–98.e, F., Li, Y., 2009. Enhancement of nitrogen removal in towery hybrid constructedwetland to treat domestic wastewater for small communities. Ecol. Eng. 35,1053–1943.
Related Documents


![INDEX [stoneborofair.info] · 7:00 pm Milking Contest (Milking Parlor) FREE Dairy Products Sponsored by the Mercer County Dairy Promotion Committee 7:30 pm Fair Opening –The SLIM](https://static.cupdf.com/doc/110x72/603ed440fe450c4eb533d1c2/index-700-pm-milking-contest-milking-parlor-free-dairy-products-sponsored.jpg)