Effects of land markets and land management on ecosystem function: A framework for modelling exurban land-change q Derek T. Robinson a, * , Shipeng Sun b , Meghan Hutchins c , Rick L. Riolo d , Daniel G. Brown c , Dawn C. Parker b , Tatiana Filatova e , William S. Currie c , Sarah Kiger c a Department of Geography and Environmental Management, University of Waterloo, 200 University Avenue West, Waterloo, ON N2L 3G1, Canada b School of Planning, University of Waterloo, Waterloo, ON N2L 3G1, Canada c School of Natural Resources & Environment, University of Michigan, Ann Arbor, MI 48109, United States d Center for the Study of Complex Systems, University of Michigan, Ann Arbor, MI 48109, United States e Centre for Studies in Technology and Sustainable Development, University of Twente, 7500 AE Enschede, The Netherlands article info Article history: Received 19 May 2011 Received in revised form 30 June 2012 Accepted 30 June 2012 Available online xxx Keywords: Land-use and land-cover change Carbon storage and flux Policy Agent-based modelling Exurban development abstract This paper presents the conceptual design and application of a new land-change modelling framework that represents geographical, sociological, economic, and ecological aspects of a land system. The framework provides an overarching design that can be extended into specific model implementations to evaluate how policy, land-management preferences, and land-market dynamics affect (and are affected by) land-use and land-cover change patterns and subsequent carbon storage and flux. To demonstrate the framework, we implement a simple integration of a new agent-based model of exurban residential development and land-management decisions with the ecosystem process model BIOME-BGC. Using a stylized scenario, we evaluate the influence of different exurban residential-land-management strat- egies on carbon storage at the parcel level over a 48-year period from 1958 to 2005, simulating stocks of carbon in soil, litter, vegetation, and net primary productivity. Results show 1) residential parcels with management practices that only provided additions in the form of fertilizer and irrigation to turfgrass stored slightly more carbon than parcels that did not include management practices, 2) conducting no land-management strategy stored more carbon than implementing a strategy that included removals in the form of removing coarse woody debris from dense tree cover and litter from turfgrass, and 3) the removal practices modelled had a larger impact on total parcel carbon storage than our modelled additions. The degree of variation within the evaluated land-management practices was approximately 42,104 kg C storage on a 1.62 ha plot after 48 years, demonstrating the substantial effect that residential land-management practices can have on carbon storage. Ó 2012 Elsevier Ltd. All rights reserved. 1. Introduction The effects of land-use and land-cover change (LULCC) on the carbon cycle and the provision of ecosystem services have become critical issues of global concern. Land-use and land-cover changes have contributed w30% of historical anthropogenic efflux of CO 2 , making them the second largest driver of anthropogenic CO 2 efflux, behind only fossil fuel burning (Sarmiento and Sundquist, 1992; Sundquist, 1993). Recent decades have seen rates of conversion of natural and agricultural land to low-density residential develop- ment exceed population growth in industrialized nations (Theobald, 2005). However, the processes and implications of LULCC on the carbon cycle and the provision of ecosystem services are not well understood. The emerging field of land-change science addresses these issues (Rindfuss et al., 2004). Turner et al. (2007) identify four goals under which land-change scientists seek to improve our under- standing: “(i) observation and monitoring of land changes underway throughout the world, (ii) understanding of these changes as a coupled humaneenvironment system, (iii) spatially explicit modelling of land change, and (iv) assessments of system outcomes, such as vulnerability, resilience, or sustainability.” This paper addresses the third point. Its primary goal is to present a new q Thematic Issue on the Spatial ABMs for SES. * Corresponding author. Tel.: þ1 519 888 4567. E-mail addresses: [email protected], [email protected] (D.T. Robinson), [email protected] (S. Sun), [email protected] (R.L. Riolo), [email protected] (D.G. Brown), [email protected] (D.C. Parker), t.fi[email protected] (T. Filatova). Contents lists available at SciVerse ScienceDirect Environmental Modelling & Software journal homepage: www.elsevier.com/locate/envsoft 1364-8152/$ e see front matter Ó 2012 Elsevier Ltd. All rights reserved. http://dx.doi.org/10.1016/j.envsoft.2012.06.016 Environmental Modelling & Software xxx (2012) 1e12 Please cite this article in press as: Robinson, D.T., et al., Effects of land markets and land management on ecosystem function: A framework for modelling exurban land-change, Environmental Modelling & Software (2012), http://dx.doi.org/10.1016/j.envsoft.2012.06.016

Welcome message from author
This document is posted to help you gain knowledge. Please leave a comment to let me know what you think about it! Share it to your friends and learn new things together.
Transcript
at SciVerse ScienceDirect
Environmental Modelling & Software xxx (2012) 1e12
Contents lists available
Environmental Modelling & Software
journal homepage: www.elsevier .com/locate/envsoft
Effects of land markets and land management on ecosystem function: Aframework for modelling exurban land-changeq
Derek T. Robinson a,*, Shipeng Sun b, Meghan Hutchins c, Rick L. Riolo d, Daniel G. Brown c,Dawn C. Parker b, Tatiana Filatova e, William S. Currie c, Sarah Kiger c
aDepartment of Geography and Environmental Management, University of Waterloo, 200 University Avenue West, Waterloo, ON N2L 3G1, Canadab School of Planning, University of Waterloo, Waterloo, ON N2L 3G1, Canadac School of Natural Resources & Environment, University of Michigan, Ann Arbor, MI 48109, United StatesdCenter for the Study of Complex Systems, University of Michigan, Ann Arbor, MI 48109, United StateseCentre for Studies in Technology and Sustainable Development, University of Twente, 7500 AE Enschede, The Netherlands
a r t i c l e i n f o
Article history:Received 19 May 2011Received in revised form30 June 2012Accepted 30 June 2012Available online xxx
Keywords:Land-use and land-cover changeCarbon storage and fluxPolicyAgent-based modellingExurban development
q Thematic Issue on the Spatial ABMs for SES.* Corresponding author. Tel.: þ1 519 888 4567.
E-mail addresses: derekthomasrobinson@gmail.(D.T. Robinson), [email protected] (S. Sun), [email protected] (D.G. Brown), [email protected]@utwente.nl (T. Filatova).
1364-8152/$ e see front matter � 2012 Elsevier Ltd.http://dx.doi.org/10.1016/j.envsoft.2012.06.016
Please cite this article in press as: Robinson,modelling exurban land-change, Environme
a b s t r a c t
This paper presents the conceptual design and application of a new land-change modelling frameworkthat represents geographical, sociological, economic, and ecological aspects of a land system. Theframework provides an overarching design that can be extended into specific model implementations toevaluate how policy, land-management preferences, and land-market dynamics affect (and are affectedby) land-use and land-cover change patterns and subsequent carbon storage and flux. To demonstratethe framework, we implement a simple integration of a new agent-based model of exurban residentialdevelopment and land-management decisions with the ecosystem process model BIOME-BGC. Usinga stylized scenario, we evaluate the influence of different exurban residential-land-management strat-egies on carbon storage at the parcel level over a 48-year period from 1958 to 2005, simulating stocks ofcarbon in soil, litter, vegetation, and net primary productivity. Results show 1) residential parcels withmanagement practices that only provided additions in the form of fertilizer and irrigation to turfgrassstored slightly more carbon than parcels that did not include management practices, 2) conducting noland-management strategy stored more carbon than implementing a strategy that included removals inthe form of removing coarse woody debris from dense tree cover and litter from turfgrass, and 3) theremoval practices modelled had a larger impact on total parcel carbon storage than our modelledadditions. The degree of variation within the evaluated land-management practices was approximately42,104 kg C storage on a 1.62 ha plot after 48 years, demonstrating the substantial effect that residentialland-management practices can have on carbon storage.
� 2012 Elsevier Ltd. All rights reserved.
1. Introduction
The effects of land-use and land-cover change (LULCC) on thecarbon cycle and the provision of ecosystem services have becomecritical issues of global concern. Land-use and land-cover changeshave contributed w30% of historical anthropogenic efflux of CO2,making them the second largest driver of anthropogenic CO2 efflux,behind only fossil fuel burning (Sarmiento and Sundquist, 1992;
com, [email protected]@umich.edu (R.L. Riolo),waterloo.ca (D.C. Parker),
All rights reserved.
D.T., et al., Effects of land mantal Modelling & Software (2
Sundquist, 1993). Recent decades have seen rates of conversion ofnatural and agricultural land to low-density residential develop-ment exceed population growth in industrialized nations(Theobald, 2005). However, the processes and implications ofLULCC on the carbon cycle and the provision of ecosystem servicesare not well understood.
The emerging field of land-change science addresses theseissues (Rindfuss et al., 2004). Turner et al. (2007) identify four goalsunder which land-change scientists seek to improve our under-standing: “(i) observation and monitoring of land changesunderway throughout the world, (ii) understanding of thesechanges as a coupled humaneenvironment system, (iii) spatiallyexplicit modelling of land change, and (iv) assessments of systemoutcomes, such as vulnerability, resilience, or sustainability.” Thispaper addresses the third point. Its primary goal is to present a new
rkets and land management on ecosystem function: A framework for012), http://dx.doi.org/10.1016/j.envsoft.2012.06.016
D.T. Robinson et al. / Environmental Modelling & Software xxx (2012) 1e122
agent-based modelling (ABM) framework that is designed to inte-grate biophysical, geographic, cultural and economic factors withland-use and land-management decision-making. Our secondarygoal is to illustrate its performance by investigating the impacts offour land-management strategies on carbon balance dynamics inexurban residential land e a human-dominated ecosystem.
Few unified modelling efforts have explicitly incorporated thedynamic and combined effects of land-use change, land manage-ment, and land markets on LULCC patterns and ecosystemprocesses, especially in residential landscapes. Instead, most havefocused on how individual mechanisms may affect LULCC patternsin isolation. For example, the influence of market mechanisms (e.g.Parker et al., 2012), demographics (e.g. Deadman et al., 2004; Anet al., 2005; Fontaine and Rounsevell, 2009), and policy (e.g.Zellner et al., 2009; Robinson et al., 2009) on LULCC patterns aretypically explored. These evaluations involve models that representsome processes explicitly and simplify others through the use ofscenarios (e.g. Monticino et al., 2007; Kok and Van Delden, 2009;Verburg et al., 2010). Less frequently implemented are integratedmodels that combine multiple mechanisms to evaluate land-usechange impacts at local, or continental to global scales (e.g.Schaldach et al., 2011; Schreinemachers and Berger, 2011).
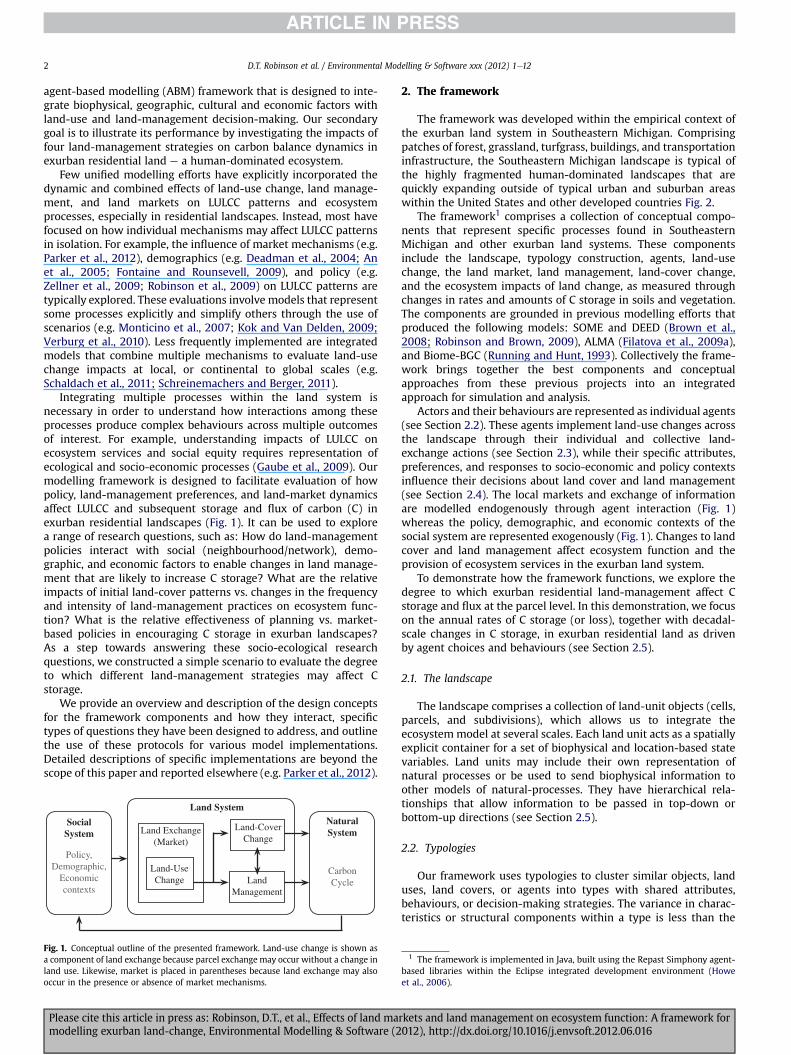
Integrating multiple processes within the land system isnecessary in order to understand how interactions among theseprocesses produce complex behaviours across multiple outcomesof interest. For example, understanding impacts of LULCC onecosystem services and social equity requires representation ofecological and socio-economic processes (Gaube et al., 2009). Ourmodelling framework is designed to facilitate evaluation of howpolicy, land-management preferences, and land-market dynamicsaffect LULCC and subsequent storage and flux of carbon (C) inexurban residential landscapes (Fig. 1). It can be used to explorea range of research questions, such as: How do land-managementpolicies interact with social (neighbourhood/network), demo-graphic, and economic factors to enable changes in land manage-ment that are likely to increase C storage? What are the relativeimpacts of initial land-cover patterns vs. changes in the frequencyand intensity of land-management practices on ecosystem func-tion? What is the relative effectiveness of planning vs. market-based policies in encouraging C storage in exurban landscapes?As a step towards answering these socio-ecological researchquestions, we constructed a simple scenario to evaluate the degreeto which different land-management strategies may affect Cstorage.
We provide an overview and description of the design conceptsfor the framework components and how they interact, specifictypes of questions they have been designed to address, and outlinethe use of these protocols for various model implementations.Detailed descriptions of specific implementations are beyond thescope of this paper and reported elsewhere (e.g. Parker et al., 2012).
SocialSystem
Natural SystemLand Exchange
(Market)
Land-Use Change Land
Management
Land-Cover Change
Policy,Demographic,
Economiccontexts
CarbonCycle
Land System
Fig. 1. Conceptual outline of the presented framework. Land-use change is shown asa component of land exchange because parcel exchange may occur without a change inland use. Likewise, market is placed in parentheses because land exchange may alsooccur in the presence or absence of market mechanisms.
Please cite this article in press as: Robinson, D.T., et al., Effects of land mamodelling exurban land-change, Environmental Modelling & Software (2
2. The framework
The framework was developed within the empirical context ofthe exurban land system in Southeastern Michigan. Comprisingpatches of forest, grassland, turfgrass, buildings, and transportationinfrastructure, the Southeastern Michigan landscape is typical ofthe highly fragmented human-dominated landscapes that arequickly expanding outside of typical urban and suburban areaswithin the United States and other developed countries Fig. 2.
The framework1 comprises a collection of conceptual compo-nents that represent specific processes found in SoutheasternMichigan and other exurban land systems. These componentsinclude the landscape, typology construction, agents, land-usechange, the land market, land management, land-cover change,and the ecosystem impacts of land change, as measured throughchanges in rates and amounts of C storage in soils and vegetation.The components are grounded in previous modelling efforts thatproduced the following models: SOME and DEED (Brown et al.,2008; Robinson and Brown, 2009), ALMA (Filatova et al., 2009a),and Biome-BGC (Running and Hunt, 1993). Collectively the frame-work brings together the best components and conceptualapproaches from these previous projects into an integratedapproach for simulation and analysis.
Actors and their behaviours are represented as individual agents(see Section 2.2). These agents implement land-use changes acrossthe landscape through their individual and collective land-exchange actions (see Section 2.3), while their specific attributes,preferences, and responses to socio-economic and policy contextsinfluence their decisions about land cover and land management(see Section 2.4). The local markets and exchange of informationare modelled endogenously through agent interaction (Fig. 1)whereas the policy, demographic, and economic contexts of thesocial system are represented exogenously (Fig. 1). Changes to landcover and land management affect ecosystem function and theprovision of ecosystem services in the exurban land system.
To demonstrate how the framework functions, we explore thedegree to which exurban residential land-management affect Cstorage and flux at the parcel level. In this demonstration, we focuson the annual rates of C storage (or loss), together with decadal-scale changes in C storage, in exurban residential land as drivenby agent choices and behaviours (see Section 2.5).
2.1. The landscape
The landscape comprises a collection of land-unit objects (cells,parcels, and subdivisions), which allows us to integrate theecosystemmodel at several scales. Each land unit acts as a spatiallyexplicit container for a set of biophysical and location-based statevariables. Land units may include their own representation ofnatural processes or be used to send biophysical information toother models of natural-processes. They have hierarchical rela-tionships that allow information to be passed in top-down orbottom-up directions (see Section 2.5).
2.2. Typologies
Our framework uses typologies to cluster similar objects, landuses, land covers, or agents into types with shared attributes,behaviours, or decision-making strategies. The variance in charac-teristics or structural components within a type is less than the
1 The framework is implemented in Java, built using the Repast Simphony agent-based libraries within the Eclipse integrated development environment (Howeet al., 2006).
rkets and land management on ecosystem function: A framework for012), http://dx.doi.org/10.1016/j.envsoft.2012.06.016

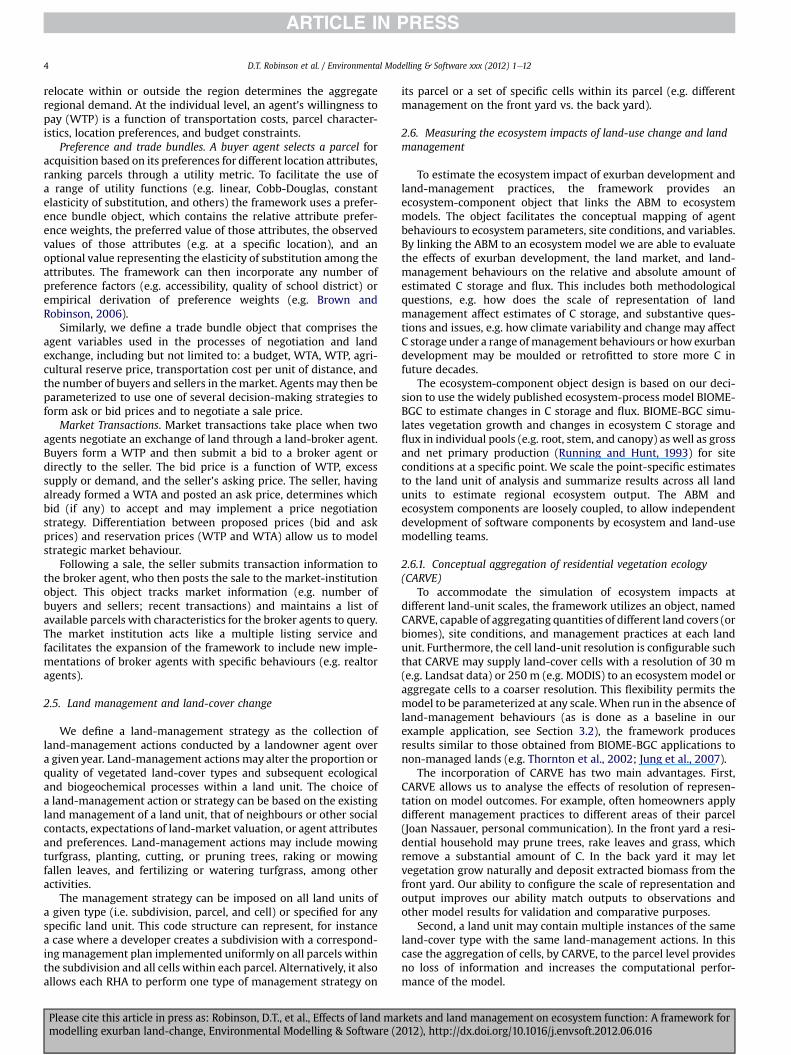
Fig. 2. Mosaic of land cover typically found across Southeastern Michigan.
D.T. Robinson et al. / Environmental Modelling & Software xxx (2012) 1e12 3
variance between types. We can then observe and analyse types aswholes, simplifying the challenge of understanding complexsystem behaviour. Typologies have been used in previous ABM toreduce the detail required to represent a system (e.g. Smajgl et al.,2011), but care must be taken to ensure that reduced representa-tions adequately represent system heterogeneity.
A typology may be strict in its classification (e.g. qualitativenominal groupings), nonstrict (e.g. quantitative values for attributesthatmayoverlap among groups), or somemixture of the two. Itmaybe based on expert opinion (e.g. Zellner et al., 2009), theory, orderived by data reduction techniques like cluster analysis (e.g.Fernandez et al., 2005; Fontaine and Rounsevell, 2009). An agenttype may also be defined by an event or change of context (e.g.household life-cycle stages e Deadman et al., 2004; An et al., 2005)or an agentmaybelong to several different types (e.g. Huigen, 2004).
We defined four agent types that represent the key actors thatdrive the exurban land system: rural landowners (e.g. farmers),developers, land brokers, and residential households. The typeshave, in some instances, their own sub-typologies that generalizegroups of agents based on the heterogeneity in their attributes,preferences, or behaviours. Section 2.3 provides a generaldescription of these agents.
2.3. Agents
Rural landowners use the land to support a traditional livelihood(e.g. through agriculture). At any point in time it may decide to lista portion or all of one or more parcels that it owns for sale on theland market. The rural landowner’s behaviours do not change untilan offer is made that exceeds its willingness to accept price (WTA).When this occurs the landowner may sell the parcel.
Developers acquire land parcels to subdivide or aggregate forsale and profit. Each developer has its own preferences for thebiophysical and geographical characteristics of a parcel or set ofparcels. Developers influence land-management strategies on theparcels they create by initializing the proportions of land coverswithin them. When a parcel is acquired, a development template isapplied that represents the land-use and land-cover patternsresulting from the development process. Each developer has a setof one or more templates that have the same dimensions as theparcel area. Typically template selection is based upon parcel size;however, a developer may have a set of templates that allow it toaccommodate various policy or preference constraints that affectthe type of developments that may occur.
Land Brokers facilitate the exchange of land between two agentsby 1) providing information to agents concerning available parcels,
Please cite this article in press as: Robinson, D.T., et al., Effects of land mamodelling exurban land-change, Environmental Modelling & Software (2
2) transferring property ownership, 3) posting sale opportunitiesand closures to the market institution, and 4) implementingnegotiation mechanisms to determine the sale price among otherfunctional activities.
Residential households participate in land exchange whenentering the model at an exogenously defined in-migration rate, orwhen they attempt to move from one parcel to another within themodel landscape. Each residential-household agent (RHA) seeks tofind a settlement location that optimizes its utility under budgetand informational constraints. If the RHA is successful in acquiringa parcel then it begins to manage the land within the parcelboundary (see Section 2.4). RHAs may also offer their properties upfor land exchange. When an RHA determines to sell its parcel itmay: 1) search out an alternative location that provides a higherutility and attempt to purchase that location before selling thecurrent location; or 2) sell to the highest bidder and either a) exitthe model, or b) look for an alternative settlement location. Land-management strategies and sale prices formed by RHAs may bea function of spatial neighbourhood or social factors (e.g. networksor norms).
2.4. Land-use change
We define land-use change as the exchange of land betweentwo agents performing different land-use activities (e.g. residentialor rural land use). Land exchange may, but does not necessarily,change land use (e.g. a property is transferred from one residentialhousehold to another) or land price. The exchange may occur in theabsence (see Section 2.4.1) or presence (see Section 2.4.2) of a landmarket, as influenced by exogenous policy, economic, and demo-graphic contexts (see Section 2.7). Land is supplied and may bedemanded by rural landowner agents (e.g. farmers), subdivisiondeveloper agents, or RHAs.
2.4.1. The non-market approachThe framework provides the ability to model the exchange of
land and its subsequent change in use without the inclusion ofland-market processes. In the non-market approach, land policiesprovide the only constraints to land acquisition (e.g. Robinson andBrown, 2009). Non-market implementations of our frameworkfocus on evaluating the effects of RHA preferences on geographical(e.g. nearness to water or roads) and biophysical (e.g. soil condi-tions, elevation, percent tree cover) characteristics on developmentpatterns.
2.4.2. The land marketThe land-market model borrows from the previously developed
ALMA model (Filatova et al., 2009a, 2009b) and utilizes conceptsfrom urban economics (e.g. location decisions under budgetconstraints, strategic bidding, and competition) to representinteractions between the demand and supply of land. Whenimplemented within a model run, the land market is formed bybilateral trades amongst agents that buy and sell parcels. Thecollective outcome of these decentralized trades replaces tradi-tional equilibrium price determination mechanisms (Arthur et al.,1997; Tesfatsion and Judd, 2006). The land market allows us toask questions about the effects of interactions between marketfactors (e.g. credit availability, competition) and heterogeneousindividual characteristics (e.g. budget constraints, strategic behav-iour) on LUCC and ecosystem function.
Demand and supply. The supply of land (i.e. parcels) by an agentfor purchase or acquisition by another agent is a function of policyconstraints (e.g. zoning), existing stock of available land, and eachagent’s motivation for supply, willingness to accept (WTA) and askprices. The rate of in-migration and existing agents’ desires to
rkets and land management on ecosystem function: A framework for012), http://dx.doi.org/10.1016/j.envsoft.2012.06.016
D.T. Robinson et al. / Environmental Modelling & Software xxx (2012) 1e124
relocate within or outside the region determines the aggregateregional demand. At the individual level, an agent’s willingness topay (WTP) is a function of transportation costs, parcel character-istics, location preferences, and budget constraints.
Preference and trade bundles. A buyer agent selects a parcel foracquisition based on its preferences for different location attributes,ranking parcels through a utility metric. To facilitate the use ofa range of utility functions (e.g. linear, Cobb-Douglas, constantelasticity of substitution, and others) the framework uses a prefer-ence bundle object, which contains the relative attribute prefer-ence weights, the preferred value of those attributes, the observedvalues of those attributes (e.g. at a specific location), and anoptional value representing the elasticity of substitution among theattributes. The framework can then incorporate any number ofpreference factors (e.g. accessibility, quality of school district) orempirical derivation of preference weights (e.g. Brown andRobinson, 2006).
Similarly, we define a trade bundle object that comprises theagent variables used in the processes of negotiation and landexchange, including but not limited to: a budget, WTA, WTP, agri-cultural reserve price, transportation cost per unit of distance, andthe number of buyers and sellers in the market. Agentsmay then beparameterized to use one of several decision-making strategies toform ask or bid prices and to negotiate a sale price.
Market Transactions. Market transactions take place when twoagents negotiate an exchange of land through a land-broker agent.Buyers form a WTP and then submit a bid to a broker agent ordirectly to the seller. The bid price is a function of WTP, excesssupply or demand, and the seller’s asking price. The seller, havingalready formed a WTA and posted an ask price, determines whichbid (if any) to accept and may implement a price negotiationstrategy. Differentiation between proposed prices (bid and askprices) and reservation prices (WTP and WTA) allow us to modelstrategic market behaviour.
Following a sale, the seller submits transaction information tothe broker agent, who then posts the sale to the market-institutionobject. This object tracks market information (e.g. number ofbuyers and sellers; recent transactions) and maintains a list ofavailable parcels with characteristics for the broker agents to query.The market institution acts like a multiple listing service andfacilitates the expansion of the framework to include new imple-mentations of broker agents with specific behaviours (e.g. realtoragents).
2.5. Land management and land-cover change
We define a land-management strategy as the collection ofland-management actions conducted by a landowner agent overa given year. Land-management actions may alter the proportion orquality of vegetated land-cover types and subsequent ecologicaland biogeochemical processes within a land unit. The choice ofa land-management action or strategy can be based on the existingland management of a land unit, that of neighbours or other socialcontacts, expectations of land-market valuation, or agent attributesand preferences. Land-management actions may include mowingturfgrass, planting, cutting, or pruning trees, raking or mowingfallen leaves, and fertilizing or watering turfgrass, among otheractivities.
The management strategy can be imposed on all land units ofa given type (i.e. subdivision, parcel, and cell) or specified for anyspecific land unit. This code structure can represent, for instancea case where a developer creates a subdivision with a correspond-ing management plan implemented uniformly on all parcels withinthe subdivision and all cells within each parcel. Alternatively, it alsoallows each RHA to perform one type of management strategy on
Please cite this article in press as: Robinson, D.T., et al., Effects of land mamodelling exurban land-change, Environmental Modelling & Software (2
its parcel or a set of specific cells within its parcel (e.g. differentmanagement on the front yard vs. the back yard).
2.6. Measuring the ecosystem impacts of land-use change and landmanagement
To estimate the ecosystem impact of exurban development andland-management practices, the framework provides anecosystem-component object that links the ABM to ecosystemmodels. The object facilitates the conceptual mapping of agentbehaviours to ecosystem parameters, site conditions, and variables.By linking the ABM to an ecosystem model we are able to evaluatethe effects of exurban development, the land market, and land-management behaviours on the relative and absolute amount ofestimated C storage and flux. This includes both methodologicalquestions, e.g. how does the scale of representation of landmanagement affect estimates of C storage, and substantive ques-tions and issues, e.g. how climate variability and change may affectC storage under a range of management behaviours or howexurbandevelopment may be moulded or retrofitted to store more C infuture decades.
The ecosystem-component object design is based on our deci-sion to use the widely published ecosystem-process model BIOME-BGC to estimate changes in C storage and flux. BIOME-BGC simu-lates vegetation growth and changes in ecosystem C storage andflux in individual pools (e.g. root, stem, and canopy) as well as grossand net primary production (Running and Hunt, 1993) for siteconditions at a specific point. We scale the point-specific estimatesto the land unit of analysis and summarize results across all landunits to estimate regional ecosystem output. The ABM andecosystem components are loosely coupled, to allow independentdevelopment of software components by ecosystem and land-usemodelling teams.
2.6.1. Conceptual aggregation of residential vegetation ecology(CARVE)
To accommodate the simulation of ecosystem impacts atdifferent land-unit scales, the framework utilizes an object, namedCARVE, capable of aggregating quantities of different land covers (orbiomes), site conditions, and management practices at each landunit. Furthermore, the cell land-unit resolution is configurable suchthat CARVE may supply land-cover cells with a resolution of 30 m(e.g. Landsat data) or 250 m (e.g. MODIS) to an ecosystemmodel oraggregate cells to a coarser resolution. This flexibility permits themodel to be parameterized at any scale. When run in the absence ofland-management behaviours (as is done as a baseline in ourexample application, see Section 3.2), the framework producesresults similar to those obtained from BIOME-BGC applications tonon-managed lands (e.g. Thornton et al., 2002; Jung et al., 2007).
The incorporation of CARVE has two main advantages. First,CARVE allows us to analyse the effects of resolution of represen-tation on model outcomes. For example, often homeowners applydifferent management practices to different areas of their parcel(Joan Nassauer, personal communication). In the front yard a resi-dential household may prune trees, rake leaves and grass, whichremove a substantial amount of C. In the back yard it may letvegetation grow naturally and deposit extracted biomass from thefront yard. Our ability to configure the scale of representation andoutput improves our ability match outputs to observations andother model results for validation and comparative purposes.
Second, a land unit may contain multiple instances of the sameland-cover type with the same land-management actions. In thiscase the aggregation of cells, by CARVE, to the parcel level providesno loss of information and increases the computational perfor-mance of the model.
rkets and land management on ecosystem function: A framework for012), http://dx.doi.org/10.1016/j.envsoft.2012.06.016
D.T. Robinson et al. / Environmental Modelling & Software xxx (2012) 1e12 5
2.7. Land policy, demographic, and economic contexts
One goal in extending LULCC models to include land marketsand land-management behaviour and linking to an ecosystemmodel is to evaluate a number of land-use and land-managementpolicies that could be enacted to help keep highly fragmentedand human dominated exurban landscapes acting as C sinks. Land-policy scenarios are implemented exogenously in our frameworkby manipulating specific model implementation parameters. Policyoptions could include minimum lot-size zoning regulations, use oftax or transaction costs to promote high vs. low rates of develop-ment, or carbon-storage incentives such as C payments.
3. Simulating the impacts of residential land management oncarbon storage
To demonstrate how the framework functions, we use a simplemodel based on a contrived scenario to evaluate the degree towhich different residential land-management strategies influenceC storage at the parcel level over a 48-year period from 1958 to2005. We apply the model to a hypothetical and stylized land-scape that is representative of LULCC patterns and environmentalconditions in Southeastern Michigan. We simulate changes instocks of C in soil, litter, vegetation, and their sums, as well as netprimary productivity (NPP) due to changes in land management.These scenarios emphasize the relationship between land-management practices and environmental outcomes, while mini-mizing the role of the land-exchange process.
3.1. The application example narrative
The narrative begins with a parcel owned and farmed by a rural-landowner agent. Two residential-developer agents bid on theparcel and the highest bid above the asking price is awarded the
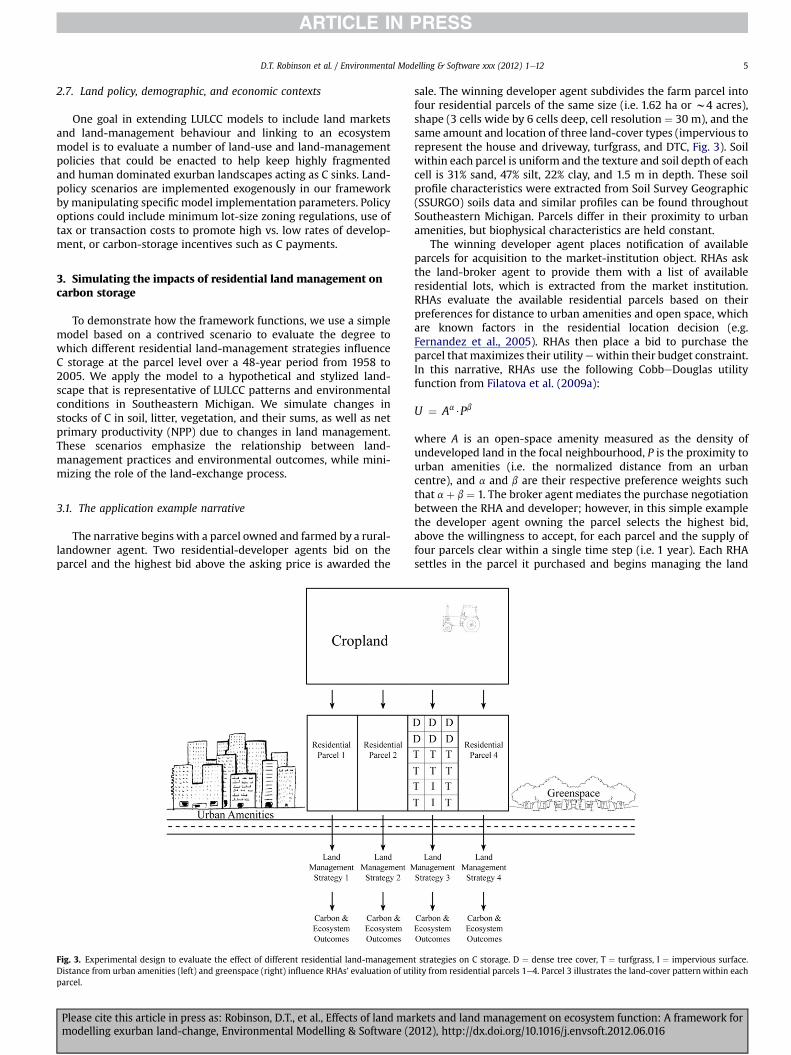
Fig. 3. Experimental design to evaluate the effect of different residential land-managemenDistance from urban amenities (left) and greenspace (right) influence RHAs’ evaluation of utparcel.
Please cite this article in press as: Robinson, D.T., et al., Effects of land mamodelling exurban land-change, Environmental Modelling & Software (2
sale. The winning developer agent subdivides the farm parcel intofour residential parcels of the same size (i.e. 1.62 ha or w4 acres),shape (3 cells wide by 6 cells deep, cell resolution ¼ 30 m), and thesame amount and location of three land-cover types (impervious torepresent the house and driveway, turfgrass, and DTC, Fig. 3). Soilwithin each parcel is uniform and the texture and soil depth of eachcell is 31% sand, 47% silt, 22% clay, and 1.5 m in depth. These soilprofile characteristics were extracted from Soil Survey Geographic(SSURGO) soils data and similar profiles can be found throughoutSoutheastern Michigan. Parcels differ in their proximity to urbanamenities, but biophysical characteristics are held constant.
The winning developer agent places notification of availableparcels for acquisition to the market-institution object. RHAs askthe land-broker agent to provide them with a list of availableresidential lots, which is extracted from the market institution.RHAs evaluate the available residential parcels based on theirpreferences for distance to urban amenities and open space, whichare known factors in the residential location decision (e.g.Fernandez et al., 2005). RHAs then place a bid to purchase theparcel that maximizes their utilityewithin their budget constraint.In this narrative, RHAs use the following CobbeDouglas utilityfunction from Filatova et al. (2009a):
U ¼ Aa$Pb
where A is an open-space amenity measured as the density ofundeveloped land in the focal neighbourhood, P is the proximity tourban amenities (i.e. the normalized distance from an urbancentre), and a and b are their respective preference weights suchthat a þ b ¼ 1. The broker agent mediates the purchase negotiationbetween the RHA and developer; however, in this simple examplethe developer agent owning the parcel selects the highest bid,above the willingness to accept, for each parcel and the supply offour parcels clear within a single time step (i.e. 1 year). Each RHAsettles in the parcel it purchased and begins managing the land
t strategies on C storage. D ¼ dense tree cover, T ¼ turfgrass, I ¼ impervious surface.ility from residential parcels 1e4. Parcel 3 illustrates the land-cover pattern within each
rkets and land management on ecosystem function: A framework for012), http://dx.doi.org/10.1016/j.envsoft.2012.06.016
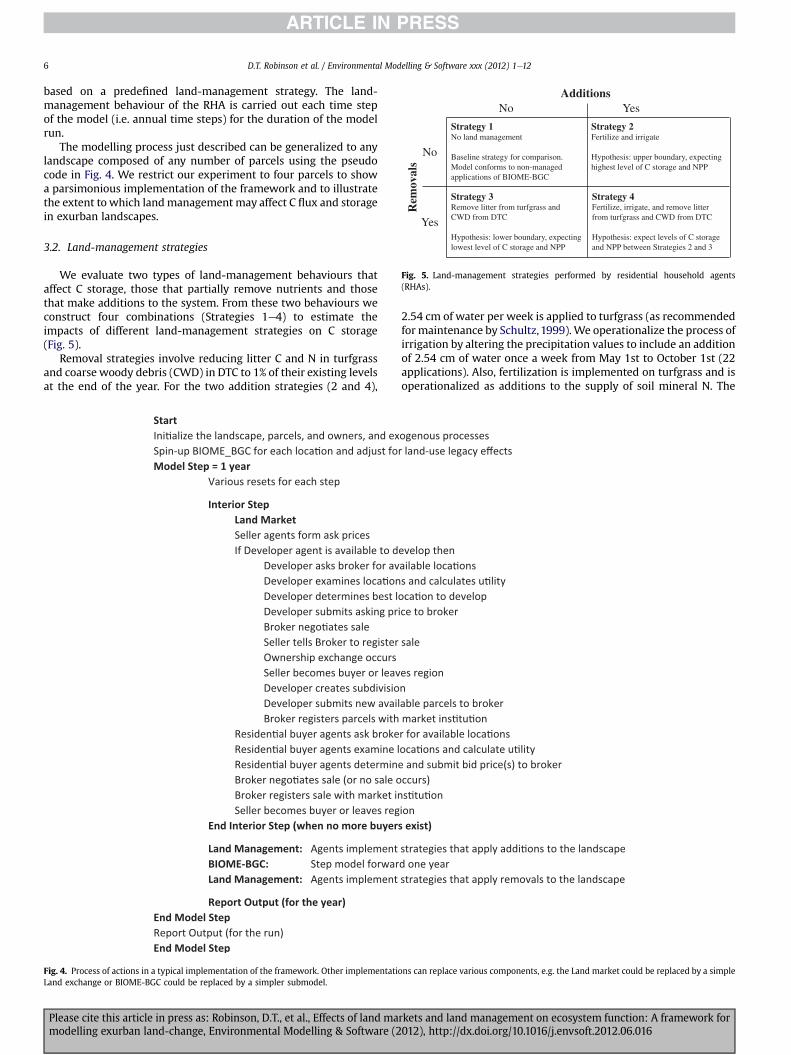
Strategy 1No land management
Baseline strategy for comparison. Model conforms to non-managed applications of BIOME-BGC
Strategy 2Fertilize and irrigate
Hypothesis: upper boundary, expecting highest level of C storage and NPP
Strategy 4Fertilize, irrigate, and remove litter from turfgrass and CWD from DTC
Hypothesis: expect levels of C storage and NPP between Strategies 2 and 3
Strategy 3Remove litter from turfgrass and CWD from DTC
Hypothesis: lower boundary, expecting lowest level of C storage and NPP
No
No
Yes
Yes
Additions
Rem
oval
s
Fig. 5. Land-management strategies performed by residential household agents(RHAs).
D.T. Robinson et al. / Environmental Modelling & Software xxx (2012) 1e126
based on a predefined land-management strategy. The land-management behaviour of the RHA is carried out each time stepof the model (i.e. annual time steps) for the duration of the modelrun.
The modelling process just described can be generalized to anylandscape composed of any number of parcels using the pseudocode in Fig. 4. We restrict our experiment to four parcels to showa parsimonious implementation of the framework and to illustratethe extent to which landmanagement may affect C flux and storagein exurban landscapes.
3.2. Land-management strategies
We evaluate two types of land-management behaviours thataffect C storage, those that partially remove nutrients and thosethat make additions to the system. From these two behaviours weconstruct four combinations (Strategies 1e4) to estimate theimpacts of different land-management strategies on C storage(Fig. 5).
Removal strategies involve reducing litter C and N in turfgrassand coarse woody debris (CWD) in DTC to 1% of their existing levelsat the end of the year. For the two addition strategies (2 and 4),
Fig. 4. Process of actions in a typical implementation of the framework. Other implementatiLand exchange or BIOME-BGC could be replaced by a simpler submodel.
Please cite this article in press as: Robinson, D.T., et al., Effects of land mamodelling exurban land-change, Environmental Modelling & Software (2
2.54 cm of water per week is applied to turfgrass (as recommendedfor maintenance by Schultz,1999).We operationalize the process ofirrigation by altering the precipitation values to include an additionof 2.54 cm of water once a week from May 1st to October 1st (22applications). Also, fertilization is implemented on turfgrass and isoperationalized as additions to the supply of soil mineral N. The
ons can replace various components, e.g. the Land market could be replaced by a simple
rkets and land management on ecosystem function: A framework for012), http://dx.doi.org/10.1016/j.envsoft.2012.06.016
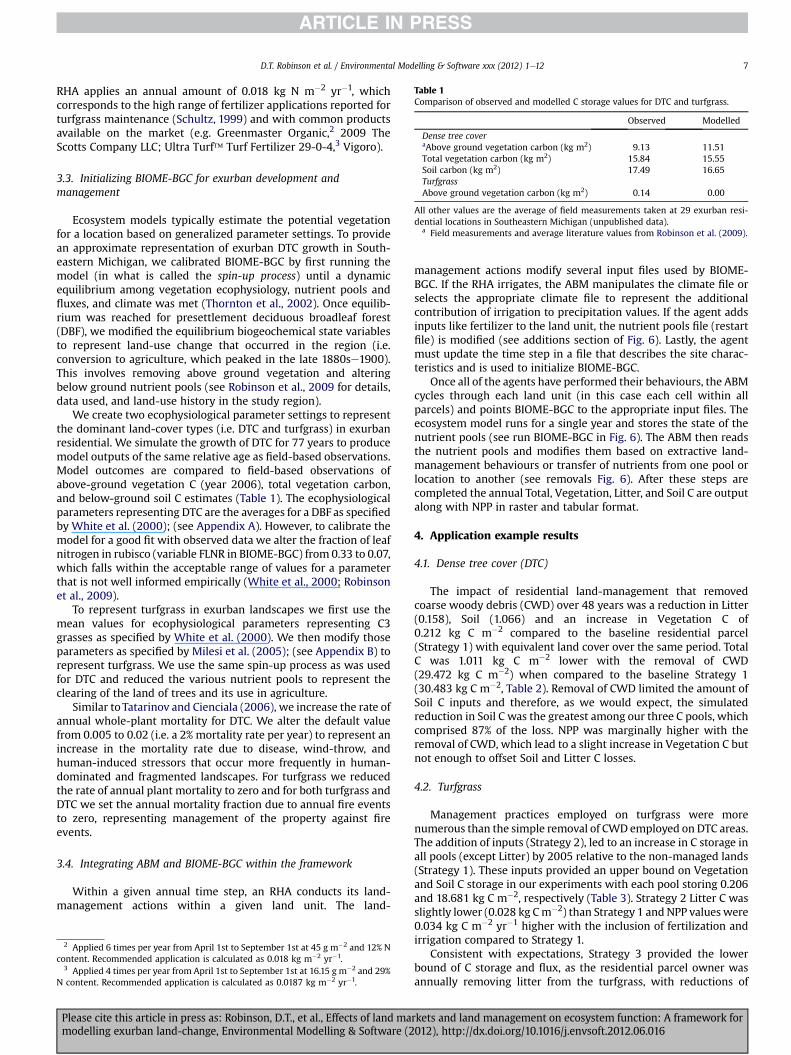
Table 1Comparison of observed and modelled C storage values for DTC and turfgrass.
Observed Modelled
Dense tree coveraAbove ground vegetation carbon (kg m2) 9.13 11.51Total vegetation carbon (kg m2) 15.84 15.55Soil carbon (kg m2) 17.49 16.65TurfgrassAbove ground vegetation carbon (kg m2) 0.14 0.00
All other values are the average of field measurements taken at 29 exurban resi-dential locations in Southeastern Michigan (unpublished data).
a Field measurements and average literature values from Robinson et al. (2009).
D.T. Robinson et al. / Environmental Modelling & Software xxx (2012) 1e12 7
RHA applies an annual amount of 0.018 kg N m�2 yr�1, whichcorresponds to the high range of fertilizer applications reported forturfgrass maintenance (Schultz, 1999) and with common productsavailable on the market (e.g. Greenmaster Organic,2 2009 TheScotts Company LLC; Ultra Turf� Turf Fertilizer 29-0-4,3 Vigoro).
3.3. Initializing BIOME-BGC for exurban development andmanagement
Ecosystem models typically estimate the potential vegetationfor a location based on generalized parameter settings. To providean approximate representation of exurban DTC growth in South-eastern Michigan, we calibrated BIOME-BGC by first running themodel (in what is called the spin-up process) until a dynamicequilibrium among vegetation ecophysiology, nutrient pools andfluxes, and climate was met (Thornton et al., 2002). Once equilib-rium was reached for presettlement deciduous broadleaf forest(DBF), we modified the equilibrium biogeochemical state variablesto represent land-use change that occurred in the region (i.e.conversion to agriculture, which peaked in the late 1880se1900).This involves removing above ground vegetation and alteringbelow ground nutrient pools (see Robinson et al., 2009 for details,data used, and land-use history in the study region).
We create two ecophysiological parameter settings to representthe dominant land-cover types (i.e. DTC and turfgrass) in exurbanresidential. We simulate the growth of DTC for 77 years to producemodel outputs of the same relative age as field-based observations.Model outcomes are compared to field-based observations ofabove-ground vegetation C (year 2006), total vegetation carbon,and below-ground soil C estimates (Table 1). The ecophysiologicalparameters representing DTC are the averages for a DBF as specifiedby White et al. (2000); (see Appendix A). However, to calibrate themodel for a good fit with observed data we alter the fraction of leafnitrogen in rubisco (variable FLNR in BIOME-BGC) from 0.33 to 0.07,which falls within the acceptable range of values for a parameterthat is not well informed empirically (White et al., 2000; Robinsonet al., 2009).
To represent turfgrass in exurban landscapes we first use themean values for ecophysiological parameters representing C3grasses as specified by White et al. (2000). We then modify thoseparameters as specified by Milesi et al. (2005); (see Appendix B) torepresent turfgrass. We use the same spin-up process as was usedfor DTC and reduced the various nutrient pools to represent theclearing of the land of trees and its use in agriculture.
Similar to Tatarinov and Cienciala (2006), we increase the rate ofannual whole-plant mortality for DTC. We alter the default valuefrom 0.005 to 0.02 (i.e. a 2% mortality rate per year) to represent anincrease in the mortality rate due to disease, wind-throw, andhuman-induced stressors that occur more frequently in human-dominated and fragmented landscapes. For turfgrass we reducedthe rate of annual plant mortality to zero and for both turfgrass andDTC we set the annual mortality fraction due to annual fire eventsto zero, representing management of the property against fireevents.
3.4. Integrating ABM and BIOME-BGC within the framework
Within a given annual time step, an RHA conducts its land-management actions within a given land unit. The land-
2 Applied 6 times per year from April 1st to September 1st at 45 g m�2 and 12% Ncontent. Recommended application is calculated as 0.018 kg m�2 yr�1.
3 Applied 4 times per year from April 1st to September 1st at 16.15 g m�2 and 29%N content. Recommended application is calculated as 0.0187 kg m�2 yr�1.
Please cite this article in press as: Robinson, D.T., et al., Effects of land mamodelling exurban land-change, Environmental Modelling & Software (2
management actions modify several input files used by BIOME-BGC. If the RHA irrigates, the ABM manipulates the climate file orselects the appropriate climate file to represent the additionalcontribution of irrigation to precipitation values. If the agent addsinputs like fertilizer to the land unit, the nutrient pools file (restartfile) is modified (see additions section of Fig. 6). Lastly, the agentmust update the time step in a file that describes the site charac-teristics and is used to initialize BIOME-BGC.
Once all of the agents have performed their behaviours, the ABMcycles through each land unit (in this case each cell within allparcels) and points BIOME-BGC to the appropriate input files. Theecosystem model runs for a single year and stores the state of thenutrient pools (see run BIOME-BGC in Fig. 6). The ABM then readsthe nutrient pools and modifies them based on extractive land-management behaviours or transfer of nutrients from one pool orlocation to another (see removals Fig. 6). After these steps arecompleted the annual Total, Vegetation, Litter, and Soil C are outputalong with NPP in raster and tabular format.
4. Application example results
4.1. Dense tree cover (DTC)
The impact of residential land-management that removedcoarse woody debris (CWD) over 48 years was a reduction in Litter(0.158), Soil (1.066) and an increase in Vegetation C of0.212 kg C m�2 compared to the baseline residential parcel(Strategy 1) with equivalent land cover over the same period. TotalC was 1.011 kg C m�2 lower with the removal of CWD(29.472 kg C m�2) when compared to the baseline Strategy 1(30.483 kg C m�2, Table 2). Removal of CWD limited the amount ofSoil C inputs and therefore, as we would expect, the simulatedreduction in Soil C was the greatest among our three C pools, whichcomprised 87% of the loss. NPP was marginally higher with theremoval of CWD, which lead to a slight increase in Vegetation C butnot enough to offset Soil and Litter C losses.
4.2. Turfgrass
Management practices employed on turfgrass were morenumerous than the simple removal of CWD employed on DTC areas.The addition of inputs (Strategy 2), led to an increase in C storage inall pools (except Litter) by 2005 relative to the non-managed lands(Strategy 1). These inputs provided an upper bound on Vegetationand Soil C storage in our experiments with each pool storing 0.206and 18.681 kg C m�2, respectively (Table 3). Strategy 2 Litter C wasslightly lower (0.028 kg Cm�2) than Strategy 1 and NPP values were0.034 kg C m�2 yr�1 higher with the inclusion of fertilization andirrigation compared to Strategy 1.
Consistent with expectations, Strategy 3 provided the lowerbound of C storage and flux, as the residential parcel owner wasannually removing litter from the turfgrass, with reductions of
rkets and land management on ecosystem function: A framework for012), http://dx.doi.org/10.1016/j.envsoft.2012.06.016

Fig. 6. The sequence of actions structuring the integration between the ABM framework and the ecosystem model BIOME-BGC.
Table 2Simulated dense tree cover C storage and flux values for year 2005 in kg C m�2 (a).Proportion of C storage and flux relative to the baseline Strategy 1 (b). Note: Thelabel removal refers to if an agent land-management strategy included nutrientremovals (yes) of coarse woody debris or not (no). Additional inputs were notapplied to DTC in the modelled land-management strategies; however the table isformatted for clarity based on the configuration of Fig. 5 and consistency of inter-pretation with Table 3.
Dense tree cover (a) (b)
Addition Addition
No Yes No Yes
VegetationRemoval No 13.324 na No 0.000 na
Yes 13.536 na Yes 0.212 naLitterRemoval No 0.509 na No 0.000 na
Yes 0.351 na Yes �0.158 naSoilRemoval No 16.650 na No 0.000 na
Yes 15.584 na Yes �1.066 naTotal CRemoval No 30.483 na No 0.000 na
Yes 29.472 na Yes �1.011 naNPPRemoval No 0.581 na No 0.000 na
Yes 0.605 na Yes 0.024 na
D.T. Robinson et al. / Environmental Modelling & Software xxx (2012) 1e128
Please cite this article in press as: Robinson, D.T., et al., Effects of land mamodelling exurban land-change, Environmental Modelling & Software (2
0.066, 0.588, and 3.238 kg C m�2 for Vegetation, Litter, and Soil C,respectively, relative to Strategy 1. Total C storage for Strategy 3(15.196 kg C m�2) was the lowest of the four land-managementstrategies. The two strategies (3 and 4) that included removalshad substantially lower amounts of carbon storage for all pools andNPP, which suggests that C removals from the landscape havea greater impact than fertilizer and irrigation additions. Approxi-mately 83% of the reduction in C storage from removals, relative toStrategy 1, was due to reduced Soil C storage. The removal of theprimary C input to turfgrass soil substantially reduced the amountof C stored. These removals also led to a decrease in the annualaccumulation of C, as shown by a simulated NPP of0.247 kg C m�2 yr�1, which is 0.132 kg C m�2 yr�1 lower thanStrategy 1 and 0.166 kg C m�2 yr�1 lower than Strategy 2.
We did not know, a priori, whether Strategy 4would have higheror lower C storage than the baseline Strategy 1, because we did notknow whether removals would dominate additions. Given thatremovals had more effect than additions, we expected Strategy 4 tobe lower than baseline (Strategy 1), which it is for all measures. Wealso expected that Strategy 4 (additions and removals) would be(slightly) higher than Strategy 3 (removals only). Howevera surprising result was that NPP and C storage pools were onlyslightly higher for Strategy 4 than for Strategy 3. Strategy 4 Vege-tation, Litter, and Soil C values were only 3.758E-05, 5.485E-07, and3.167E-03 higher than Strategy 3, respectively. Likewise, NPP wasonly 7.517E-05 kg C m�2 yr�1 higher for Strategy 4 than Strategy 3.
rkets and land management on ecosystem function: A framework for012), http://dx.doi.org/10.1016/j.envsoft.2012.06.016
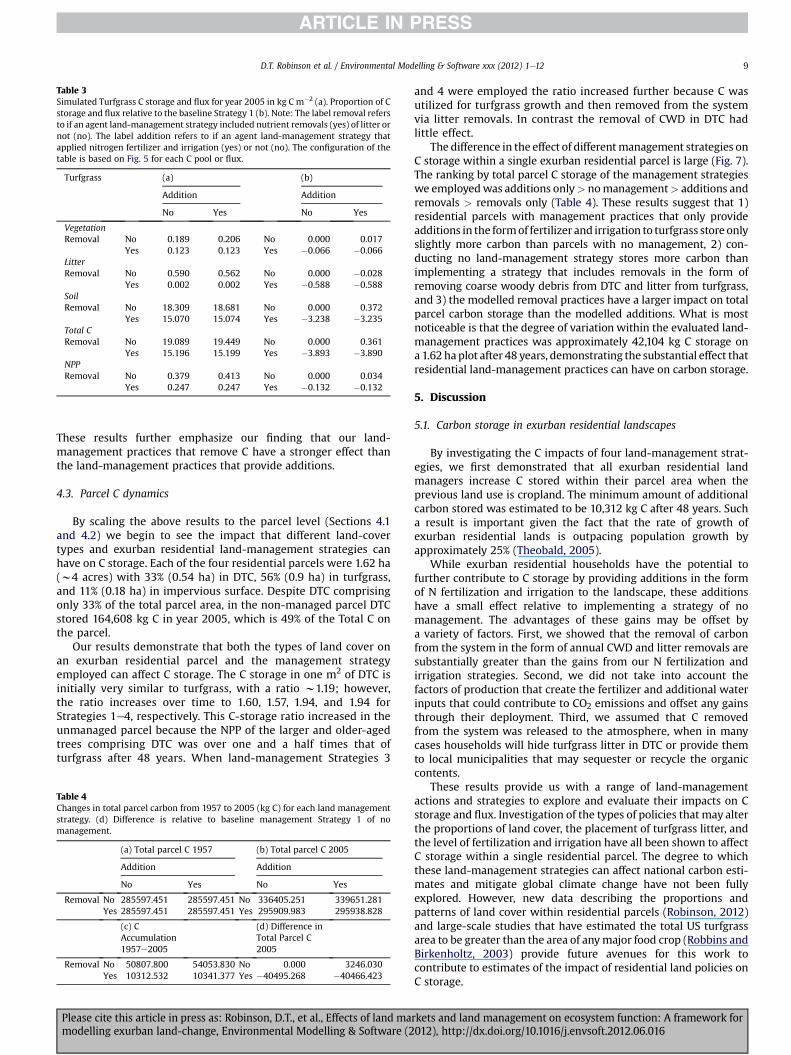
Table 3Simulated Turfgrass C storage and flux for year 2005 in kg C m�2 (a). Proportion of Cstorage and flux relative to the baseline Strategy 1 (b). Note: The label removal refersto if an agent land-management strategy included nutrient removals (yes) of litter ornot (no). The label addition refers to if an agent land-management strategy thatapplied nitrogen fertilizer and irrigation (yes) or not (no). The configuration of thetable is based on Fig. 5 for each C pool or flux.
Turfgrass (a) (b)
Addition Addition
No Yes No Yes
VegetationRemoval No 0.189 0.206 No 0.000 0.017
Yes 0.123 0.123 Yes �0.066 �0.066LitterRemoval No 0.590 0.562 No 0.000 �0.028
Yes 0.002 0.002 Yes �0.588 �0.588SoilRemoval No 18.309 18.681 No 0.000 0.372
Yes 15.070 15.074 Yes �3.238 �3.235Total CRemoval No 19.089 19.449 No 0.000 0.361
Yes 15.196 15.199 Yes �3.893 �3.890NPPRemoval No 0.379 0.413 No 0.000 0.034
Yes 0.247 0.247 Yes �0.132 �0.132
D.T. Robinson et al. / Environmental Modelling & Software xxx (2012) 1e12 9
These results further emphasize our finding that our land-management practices that remove C have a stronger effect thanthe land-management practices that provide additions.
4.3. Parcel C dynamics
By scaling the above results to the parcel level (Sections 4.1and 4.2) we begin to see the impact that different land-covertypes and exurban residential land-management strategies canhave on C storage. Each of the four residential parcels were 1.62 ha(w4 acres) with 33% (0.54 ha) in DTC, 56% (0.9 ha) in turfgrass,and 11% (0.18 ha) in impervious surface. Despite DTC comprisingonly 33% of the total parcel area, in the non-managed parcel DTCstored 164,608 kg C in year 2005, which is 49% of the Total C onthe parcel.
Our results demonstrate that both the types of land cover onan exurban residential parcel and the management strategyemployed can affect C storage. The C storage in one m2 of DTC isinitially very similar to turfgrass, with a ratio w1.19; however,the ratio increases over time to 1.60, 1.57, 1.94, and 1.94 forStrategies 1e4, respectively. This C-storage ratio increased in theunmanaged parcel because the NPP of the larger and older-agedtrees comprising DTC was over one and a half times that ofturfgrass after 48 years. When land-management Strategies 3
Table 4Changes in total parcel carbon from 1957 to 2005 (kg C) for each land managementstrategy. (d) Difference is relative to baseline management Strategy 1 of nomanagement.
(a) Total parcel C 1957 (b) Total parcel C 2005
Addition Addition
No Yes No Yes
Removal No 285597.451 285597.451 No 336405.251 339651.281Yes 285597.451 285597.451 Yes 295909.983 295938.828
(c) CAccumulation1957e2005
(d) Difference inTotal Parcel C2005
Removal No 50807.800 54053.830 No 0.000 3246.030Yes 10312.532 10341.377 Yes �40495.268 �40466.423
Please cite this article in press as: Robinson, D.T., et al., Effects of land mamodelling exurban land-change, Environmental Modelling & Software (2
and 4 were employed the ratio increased further because C wasutilized for turfgrass growth and then removed from the systemvia litter removals. In contrast the removal of CWD in DTC hadlittle effect.
The difference in the effect of differentmanagement strategies onC storage within a single exurban residential parcel is large (Fig. 7).The ranking by total parcel C storage of the management strategieswe employedwas additions only> nomanagement> additions andremovals > removals only (Table 4). These results suggest that 1)residential parcels with management practices that only provideadditions in the formof fertilizer and irrigation to turfgrass store onlyslightly more carbon than parcels with no management, 2) con-ducting no land-management strategy stores more carbon thanimplementing a strategy that includes removals in the form ofremoving coarse woody debris from DTC and litter from turfgrass,and 3) the modelled removal practices have a larger impact on totalparcel carbon storage than the modelled additions. What is mostnoticeable is that the degree of variation within the evaluated land-management practices was approximately 42,104 kg C storage ona 1.62 haplot after 48 years, demonstrating the substantial effect thatresidential land-management practices can have on carbon storage.
5. Discussion
5.1. Carbon storage in exurban residential landscapes
By investigating the C impacts of four land-management strat-egies, we first demonstrated that all exurban residential landmanagers increase C stored within their parcel area when theprevious land use is cropland. The minimum amount of additionalcarbon stored was estimated to be 10,312 kg C after 48 years. Sucha result is important given the fact that the rate of growth ofexurban residential lands is outpacing population growth byapproximately 25% (Theobald, 2005).
While exurban residential households have the potential tofurther contribute to C storage by providing additions in the formof N fertilization and irrigation to the landscape, these additionshave a small effect relative to implementing a strategy of nomanagement. The advantages of these gains may be offset bya variety of factors. First, we showed that the removal of carbonfrom the system in the form of annual CWD and litter removals aresubstantially greater than the gains from our N fertilization andirrigation strategies. Second, we did not take into account thefactors of production that create the fertilizer and additional waterinputs that could contribute to CO2 emissions and offset any gainsthrough their deployment. Third, we assumed that C removedfrom the system was released to the atmosphere, when in manycases households will hide turfgrass litter in DTC or provide themto local municipalities that may sequester or recycle the organiccontents.
These results provide us with a range of land-managementactions and strategies to explore and evaluate their impacts on Cstorage and flux. Investigation of the types of policies that may alterthe proportions of land cover, the placement of turfgrass litter, andthe level of fertilization and irrigation have all been shown to affectC storage within a single residential parcel. The degree to whichthese land-management strategies can affect national carbon esti-mates and mitigate global climate change have not been fullyexplored. However, new data describing the proportions andpatterns of land cover within residential parcels (Robinson, 2012)and large-scale studies that have estimated the total US turfgrassarea to be greater than the area of anymajor food crop (Robbins andBirkenholtz, 2003) provide future avenues for this work tocontribute to estimates of the impact of residential land policies onC storage.
rkets and land management on ecosystem function: A framework for012), http://dx.doi.org/10.1016/j.envsoft.2012.06.016
Fig. 7. Total parcel C storage by four different exurban residential land-management strategies.
D.T. Robinson et al. / Environmental Modelling & Software xxx (2012) 1e1210
5.2. Methodological issues associated with the integration of agent-based approaches and ecosystem models
We opted to integrate BIOME-BGC with our ABM of exurbandevelopment and land management for a variety of reasons. Itsprior use across a variety of biomes including forests and grasslandsthrough a change in parameter sets made it an attractive candidateto develop parameter sets for human-dominated residential land asa new conceptual biome. Its prior application to spatial scales from30m to heterogeneous regional landscapes was appropriate for ourscale of analysis. Lastly, the combination of carbon, nitrogen, andwater cycles provide a variety of entry points for which we can alterprocesses within those cycles based on land-managementpractices.
We chose to integrate BIOME-BGC with our ABM using a loosecoupling approach to facilitate future linkage to a range ofecosystem process models. The benefits of loose coupling include:ease of integration, freedom from full understanding of the indi-vidual model components, and a framework that embraces inde-pendent model development and linking to other ecologicalmodels. The primary disadvantage of a loose-coupling approach isthe computational overhead associated with maintaining startingconditions, modifying input files, and extracting results fromoutput files.
In our application example, we ran BIOME-BGC once per year for48 years with land management modifying input files (i.e.ecophysiology, meteorological, nutrient pools, and site character-istics) and output files (i.e. nutrient pools). The model was run at 16different locations within each of four different residential parcels.The result is a possible 15,360 (5 files � 48 years � 16 locations � 4parcels) file manipulations, which does not include the spinuprequired because we assumed soil and other site conditions wereuniform across the four parcels. A single model run averaged about3 min when run on different dual-core Linux machines. Assumingthe same computational performance, a model run for a sampletownship at the urban-rural fringe, such as Scio Township, which
Please cite this article in press as: Robinson, D.T., et al., Effects of land mamodelling exurban land-change, Environmental Modelling & Software (2
is w88 km2 in size e a typical size for townships across the Mid-west U.S. (Linklater, 2002) e with approximately 50% in turfgrassand DTC would take approximately 2312.5 min or 1.6 days. We aregenerous in this estimate as much of the area is likely not managedland andwould therefore involve less interaction between the ABMand BIOME-BGC and lower processing times.
To lessen the overhead associatedwith file manipulation, CARVEcan be used to aggregate and disaggregate land management andsite conditions to a specified land unit. However, if CARVE aggre-gates heterogeneous land-management practices then the result isan averaging of vegetation growth response across the areaaggregated. The degree to which this averaging affects individualand aggregate carbon storage across a parcel, subdivision, or regionhas not yet been investigated and will be the focus of futureresearch.
Due to our loose coupling approach we had to make assump-tions to represent different land-management practices as driversof vegetation growth. One set of assumptions was associated withthe timing of land-management practices. While BIOME-BGC runsat a daily time scale, the only daily variables read in by the modelare the climate (e.g. precipitation, temperature, solar radiation)and atmospheric variables (CO2 and N deposition). We repre-sented irrigation at a daily time step by adding the irrigationquantities to precipitation. While land-management activities aremore closely associated with daily than annual activities, access tothe nutrient pools to implement litter and CWD removal (e.g.raking) or nutrient additions was only available at an annual timestep.
We could potentially include two additional land-managementapproaches in future applications. The first is to represent actionslike pesticide use by altering the ecophysiological parameters thatrepresent variables like the probability of mortality. The second isto use the gap between potential values produced by BIOME-BGCand observed values to represent the possible gains due tomanagement or technology improvements that cannot be explicitlyincorporated via the ecosystem model parameters.
rkets and land management on ecosystem function: A framework for012), http://dx.doi.org/10.1016/j.envsoft.2012.06.016
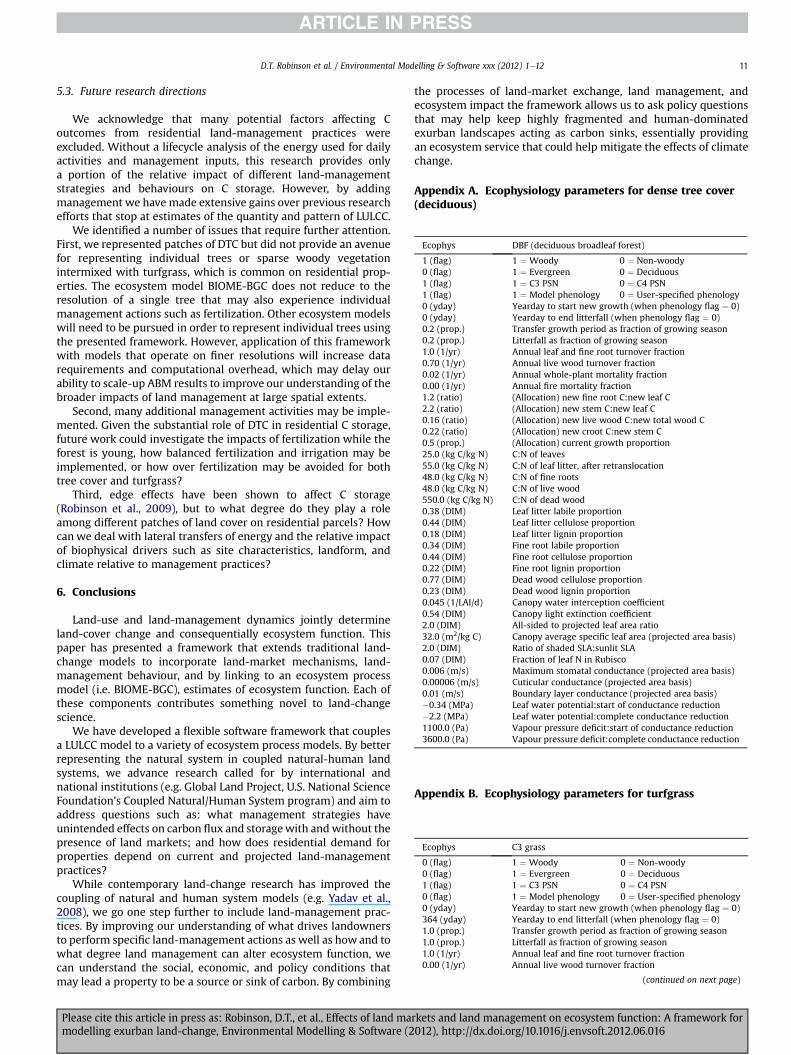
Ecophys DBF (deciduous broadleaf forest)
1 (flag) 1 ¼ Woody 0 ¼ Non-woody0 (flag) 1 ¼ Evergreen 0 ¼ Deciduous1 (flag) 1 ¼ C3 PSN 0 ¼ C4 PSN1 (flag) 1 ¼ Model phenology 0 ¼ User-specified phenology0 (yday) Yearday to start new growth (when phenology flag ¼ 0)0 (yday) Yearday to end litterfall (when phenology flag ¼ 0)0.2 (prop.) Transfer growth period as fraction of growing season0.2 (prop.) Litterfall as fraction of growing season1.0 (1/yr) Annual leaf and fine root turnover fraction0.70 (1/yr) Annual live wood turnover fraction0.02 (1/yr) Annual whole-plant mortality fraction0.00 (1/yr) Annual fire mortality fraction1.2 (ratio) (Allocation) new fine root C:new leaf C2.2 (ratio) (Allocation) new stem C:new leaf C0.16 (ratio) (Allocation) new live wood C:new total wood C0.22 (ratio) (Allocation) new croot C:new stem C0.5 (prop.) (Allocation) current growth proportion25.0 (kg C/kg N) C:N of leaves55.0 (kg C/kg N) C:N of leaf litter, after retranslocation48.0 (kg C/kg N) C:N of fine roots48.0 (kg C/kg N) C:N of live wood550.0 (kg C/kg N) C:N of dead wood0.38 (DIM) Leaf litter labile proportion0.44 (DIM) Leaf litter cellulose proportion0.18 (DIM) Leaf litter lignin proportion0.34 (DIM) Fine root labile proportion0.44 (DIM) Fine root cellulose proportion0.22 (DIM) Fine root lignin proportion0.77 (DIM) Dead wood cellulose proportion0.23 (DIM) Dead wood lignin proportion0.045 (1/LAI/d) Canopy water interception coefficient0.54 (DIM) Canopy light extinction coefficient2.0 (DIM) All-sided to projected leaf area ratio32.0 (m2/kg C) Canopy average specific leaf area (projected area basis)2.0 (DIM) Ratio of shaded SLA:sunlit SLA0.07 (DIM) Fraction of leaf N in Rubisco0.006 (m/s) Maximum stomatal conductance (projected area basis)0.00006 (m/s) Cuticular conductance (projected area basis)0.01 (m/s) Boundary layer conductance (projected area basis)�0.34 (MPa) Leaf water potential:start of conductance reduction�2.2 (MPa) Leaf water potential:complete conductance reduction1100.0 (Pa) Vapour pressure deficit:start of conductance reduction3600.0 (Pa) Vapour pressure deficit:complete conductance reduction
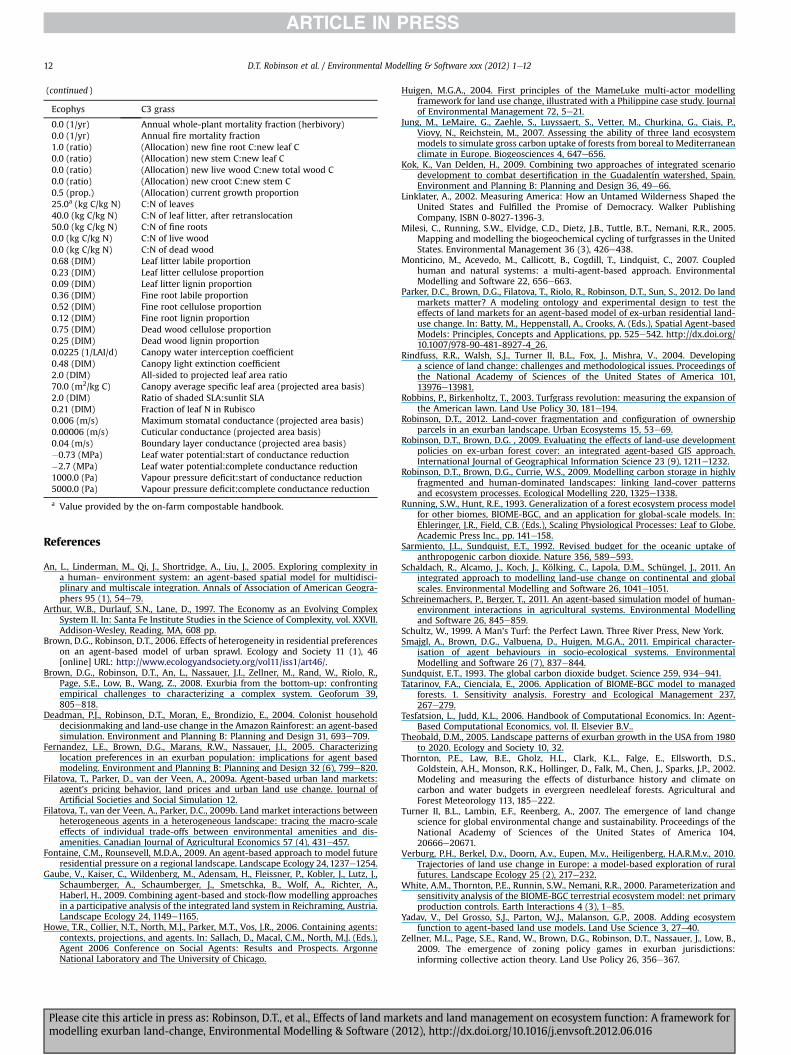
Ecophys C3 grass
0 (flag) 1 ¼ Woody 0 ¼ Non-woody0 (flag) 1 ¼ Evergreen 0 ¼ Deciduous1 (flag) 1 ¼ C3 PSN 0 ¼ C4 PSN0 (flag) 1 ¼ Model phenology 0 ¼ User-specified phenology0 (yday) Yearday to start new growth (when phenology flag ¼ 0)364 (yday) Yearday to end litterfall (when phenology flag ¼ 0)1.0 (prop.) Transfer growth period as fraction of growing season1.0 (prop.) Litterfall as fraction of growing season1.0 (1/yr) Annual leaf and fine root turnover fraction0.00 (1/yr) Annual live wood turnover fraction
(continued on next page)
D.T. Robinson et al. / Environmental Modelling & Software xxx (2012) 1e12 11
5.3. Future research directions
We acknowledge that many potential factors affecting Coutcomes from residential land-management practices wereexcluded. Without a lifecycle analysis of the energy used for dailyactivities and management inputs, this research provides onlya portion of the relative impact of different land-managementstrategies and behaviours on C storage. However, by addingmanagement we have made extensive gains over previous researchefforts that stop at estimates of the quantity and pattern of LULCC.
We identified a number of issues that require further attention.First, we represented patches of DTC but did not provide an avenuefor representing individual trees or sparse woody vegetationintermixed with turfgrass, which is common on residential prop-erties. The ecosystem model BIOME-BGC does not reduce to theresolution of a single tree that may also experience individualmanagement actions such as fertilization. Other ecosystem modelswill need to be pursued in order to represent individual trees usingthe presented framework. However, application of this frameworkwith models that operate on finer resolutions will increase datarequirements and computational overhead, which may delay ourability to scale-up ABM results to improve our understanding of thebroader impacts of land management at large spatial extents.
Second, many additional management activities may be imple-mented. Given the substantial role of DTC in residential C storage,future work could investigate the impacts of fertilization while theforest is young, how balanced fertilization and irrigation may beimplemented, or how over fertilization may be avoided for bothtree cover and turfgrass?
Third, edge effects have been shown to affect C storage(Robinson et al., 2009), but to what degree do they play a roleamong different patches of land cover on residential parcels? Howcan we deal with lateral transfers of energy and the relative impactof biophysical drivers such as site characteristics, landform, andclimate relative to management practices?
6. Conclusions
Land-use and land-management dynamics jointly determineland-cover change and consequentially ecosystem function. Thispaper has presented a framework that extends traditional land-change models to incorporate land-market mechanisms, land-management behaviour, and by linking to an ecosystem processmodel (i.e. BIOME-BGC), estimates of ecosystem function. Each ofthese components contributes something novel to land-changescience.
We have developed a flexible software framework that couplesa LULCC model to a variety of ecosystem process models. By betterrepresenting the natural system in coupled natural-human landsystems, we advance research called for by international andnational institutions (e.g. Global Land Project, U.S. National ScienceFoundation’s Coupled Natural/Human System program) and aim toaddress questions such as: what management strategies haveunintended effects on carbon flux and storagewith andwithout thepresence of land markets; and how does residential demand forproperties depend on current and projected land-managementpractices?
While contemporary land-change research has improved thecoupling of natural and human system models (e.g. Yadav et al.,2008), we go one step further to include land-management prac-tices. By improving our understanding of what drives landownersto perform specific land-management actions as well as how and towhat degree land management can alter ecosystem function, wecan understand the social, economic, and policy conditions thatmay lead a property to be a source or sink of carbon. By combining
Please cite this article in press as: Robinson, D.T., et al., Effects of land mamodelling exurban land-change, Environmental Modelling & Software (2
the processes of land-market exchange, land management, andecosystem impact the framework allows us to ask policy questionsthat may help keep highly fragmented and human-dominatedexurban landscapes acting as carbon sinks, essentially providingan ecosystem service that could help mitigate the effects of climatechange.
Appendix A. Ecophysiology parameters for dense tree cover(deciduous)
Appendix B. Ecophysiology parameters for turfgrass
rkets and land management on ecosystem function: A framework for012), http://dx.doi.org/10.1016/j.envsoft.2012.06.016
(continued )
Ecophys C3 grass
0.0 (1/yr) Annual whole-plant mortality fraction (herbivory)0.0 (1/yr) Annual fire mortality fraction1.0 (ratio) (Allocation) new fine root C:new leaf C0.0 (ratio) (Allocation) new stem C:new leaf C0.0 (ratio) (Allocation) new live wood C:new total wood C0.0 (ratio) (Allocation) new croot C:new stem C0.5 (prop.) (Allocation) current growth proportion25.0a (kg C/kg N) C:N of leaves40.0 (kg C/kg N) C:N of leaf litter, after retranslocation50.0 (kg C/kg N) C:N of fine roots0.0 (kg C/kg N) C:N of live wood0.0 (kg C/kg N) C:N of dead wood0.68 (DIM) Leaf litter labile proportion0.23 (DIM) Leaf litter cellulose proportion0.09 (DIM) Leaf litter lignin proportion0.36 (DIM) Fine root labile proportion0.52 (DIM) Fine root cellulose proportion0.12 (DIM) Fine root lignin proportion0.75 (DIM) Dead wood cellulose proportion0.25 (DIM) Dead wood lignin proportion0.0225 (1/LAI/d) Canopy water interception coefficient0.48 (DIM) Canopy light extinction coefficient2.0 (DIM) All-sided to projected leaf area ratio70.0 (m2/kg C) Canopy average specific leaf area (projected area basis)2.0 (DIM) Ratio of shaded SLA:sunlit SLA0.21 (DIM) Fraction of leaf N in Rubisco0.006 (m/s) Maximum stomatal conductance (projected area basis)0.00006 (m/s) Cuticular conductance (projected area basis)0.04 (m/s) Boundary layer conductance (projected area basis)�0.73 (MPa) Leaf water potential:start of conductance reduction�2.7 (MPa) Leaf water potential:complete conductance reduction1000.0 (Pa) Vapour pressure deficit:start of conductance reduction5000.0 (Pa) Vapour pressure deficit:complete conductance reduction
a Value provided by the on-farm compostable handbook.
D.T. Robinson et al. / Environmental Modelling & Software xxx (2012) 1e1212
References
An, L., Linderman, M., Qi, J., Shortridge, A., Liu, J., 2005. Exploring complexity ina human- environment system: an agent-based spatial model for multidisci-plinary and multiscale integration. Annals of Association of American Geogra-phers 95 (1), 54e79.
Arthur, W.B., Durlauf, S.N., Lane, D., 1997. The Economy as an Evolving ComplexSystem II. In: Santa Fe Institute Studies in the Science of Complexity, vol. XXVII.Addison-Wesley, Reading, MA, 608 pp.
Brown, D.G., Robinson, D.T., 2006. Effects of heterogeneity in residential preferenceson an agent-based model of urban sprawl. Ecology and Society 11 (1), 46[online] URL: http://www.ecologyandsociety.org/vol11/iss1/art46/.
Brown, D.G., Robinson, D.T., An, L., Nassauer, J.I., Zellner, M., Rand, W., Riolo, R.,Page, S.E., Low, B., Wang, Z., 2008. Exurbia from the bottom-up: confrontingempirical challenges to characterizing a complex system. Geoforum 39,805e818.
Deadman, P.J., Robinson, D.T., Moran, E., Brondizio, E., 2004. Colonist householddecisionmaking and land-use change in the Amazon Rainforest: an agent-basedsimulation. Environment and Planning B: Planning and Design 31, 693e709.
Fernandez, L.E., Brown, D.G., Marans, R.W., Nassauer, J.I., 2005. Characterizinglocation preferences in an exurban population: implications for agent basedmodeling. Environment and Planning B: Planning and Design 32 (6), 799e820.
Filatova, T., Parker, D., van der Veen, A., 2009a. Agent-based urban land markets:agent’s pricing behavior, land prices and urban land use change. Journal ofArtificial Societies and Social Simulation 12.
Filatova, T., van der Veen, A., Parker, D.C., 2009b. Land market interactions betweenheterogeneous agents in a heterogeneous landscape: tracing the macro-scaleeffects of individual trade-offs between environmental amenities and dis-amenities. Canadian Journal of Agricultural Economics 57 (4), 431e457.
Fontaine, C.M., Rounsevell, M.D.A., 2009. An agent-based approach to model futureresidential pressure on a regional landscape. Landscape Ecology 24, 1237e1254.
Gaube, V., Kaiser, C., Wildenberg, M., Adensam, H., Fleissner, P., Kobler, J., Lutz, J.,Schaumberger, A., Schaumberger, J., Smetschka, B., Wolf, A., Richter, A.,Haberl, H., 2009. Combining agent-based and stock-flow modelling approachesin a participative analysis of the integrated land system in Reichraming, Austria.Landscape Ecology 24, 1149e1165.
Howe, T.R., Collier, N.T., North, M.J., Parker, M.T., Vos, J.R., 2006. Containing agents:contexts, projections, and agents. In: Sallach, D., Macal, C.M., North, M.J. (Eds.),Agent 2006 Conference on Social Agents: Results and Prospects. ArgonneNational Laboratory and The University of Chicago.
Please cite this article in press as: Robinson, D.T., et al., Effects of land mamodelling exurban land-change, Environmental Modelling & Software (2
Huigen, M.G.A., 2004. First principles of the MameLuke multi-actor modellingframework for land use change, illustrated with a Philippine case study. Journalof Environmental Management 72, 5e21.
Jung, M., LeMaire, G., Zaehle, S., Luyssaert, S., Vetter, M., Churkina, G., Ciais, P.,Viovy, N., Reichstein, M., 2007. Assessing the ability of three land ecosystemmodels to simulate gross carbon uptake of forests from boreal to Mediterraneanclimate in Europe. Biogeosciences 4, 647e656.
Kok, K., Van Delden, H., 2009. Combining two approaches of integrated scenariodevelopment to combat desertification in the Guadalentín watershed, Spain.Environment and Planning B: Planning and Design 36, 49e66.
Linklater, A., 2002. Measuring America: How an Untamed Wilderness Shaped theUnited States and Fulfilled the Promise of Democracy. Walker PublishingCompany, ISBN 0-8027-1396-3.
Milesi, C., Running, S.W., Elvidge, C.D., Dietz, J.B., Tuttle, B.T., Nemani, R.R., 2005.Mapping and modelling the biogeochemical cycling of turfgrasses in the UnitedStates. Environmental Management 36 (3), 426e438.
Monticino, M., Acevedo, M., Callicott, B., Cogdill, T., Lindquist, C., 2007. Coupledhuman and natural systems: a multi-agent-based approach. EnvironmentalModelling and Software 22, 656e663.
Parker, D.C., Brown, D.G., Filatova, T., Riolo, R., Robinson, D.T., Sun, S., 2012. Do landmarkets matter? A modeling ontology and experimental design to test theeffects of land markets for an agent-based model of ex-urban residential land-use change. In: Batty, M., Heppenstall, A., Crooks, A. (Eds.), Spatial Agent-basedModels: Principles, Concepts and Applications, pp. 525e542. http://dx.doi.org/10.1007/978-90-481-8927-4_26.
Rindfuss, R.R., Walsh, S.J., Turner II, B.L., Fox, J., Mishra, V., 2004. Developinga science of land change: challenges and methodological issues. Proceedings ofthe National Academy of Sciences of the United States of America 101,13976e13981.
Robbins, P., Birkenholtz, T., 2003. Turfgrass revolution: measuring the expansion ofthe American lawn. Land Use Policy 30, 181e194.
Robinson, D.T., 2012. Land-cover fragmentation and configuration of ownershipparcels in an exurban landscape. Urban Ecosystems 15, 53e69.
Robinson, D.T., Brown, D.G. , 2009. Evaluating the effects of land-use developmentpolicies on ex-urban forest cover: an integrated agent-based GIS approach.International Journal of Geographical Information Science 23 (9), 1211e1232.
Robinson, D.T., Brown, D.G., Currie, W.S., 2009. Modelling carbon storage in highlyfragmented and human-dominated landscapes: linking land-cover patternsand ecosystem processes. Ecological Modelling 220, 1325e1338.
Running, S.W., Hunt, R.E., 1993. Generalization of a forest ecosystem process modelfor other biomes, BIOME-BGC, and an application for global-scale models. In:Ehleringer, J.R., Field, C.B. (Eds.), Scaling Physiological Processes: Leaf to Globe.Academic Press Inc., pp. 141e158.
Sarmiento, J.L., Sundquist, E.T., 1992. Revised budget for the oceanic uptake ofanthropogenic carbon dioxide. Nature 356, 589e593.
Schaldach, R., Alcamo, J., Koch, J., Kölking, C., Lapola, D.M., Schüngel, J., 2011. Anintegrated approach to modelling land-use change on continental and globalscales. Environmental Modelling and Software 26, 1041e1051.
Schreinemachers, P., Berger, T., 2011. An agent-based simulation model of human-environment interactions in agricultural systems. Environmental Modellingand Software 26, 845e859.
Schultz, W., 1999. A Man’s Turf: the Perfect Lawn. Three River Press, New York.Smajgl, A., Brown, D.G., Valbuena, D., Huigen, M.G.A., 2011. Empirical character-
isation of agent behaviours in socio-ecological systems. EnvironmentalModelling and Software 26 (7), 837e844.
Sundquist, E.T., 1993. The global carbon dioxide budget. Science 259, 934e941.Tatarinov, F.A., Cienciala, E., 2006. Application of BIOME-BGC model to managed
forests. 1. Sensitivity analysis. Forestry and Ecological Management 237,267e279.
Tesfatsion, L., Judd, K.L., 2006. Handbook of Computational Economics. In: Agent-Based Computational Economics, vol. II. Elsevier B.V..
Theobald, D.M., 2005. Landscape patterns of exurban growth in the USA from 1980to 2020. Ecology and Society 10, 32.
Thornton, P.E., Law, B.E., Gholz, H.L., Clark, K.L., Falge, E., Ellsworth, D.S.,Goldstein, A.H., Monson, R.K., Hollinger, D., Falk, M., Chen, J., Sparks, J.P., 2002.Modeling and measuring the effects of disturbance history and climate oncarbon and water budgets in evergreen needleleaf forests. Agricultural andForest Meteorology 113, 185e222.
Turner II, B.L., Lambin, E.F., Reenberg, A., 2007. The emergence of land changescience for global environmental change and sustainability. Proceedings of theNational Academy of Sciences of the United States of America 104,20666e20671.
Verburg, P.H., Berkel, D.v., Doorn, A.v., Eupen, M.v., Heiligenberg, H.A.R.M.v., 2010.Trajectories of land use change in Europe: a model-based exploration of ruralfutures. Landscape Ecology 25 (2), 217e232.
White, A.M., Thornton, P.E., Runnin, S.W., Nemani, R.R., 2000. Parameterization andsensitivity analysis of the BIOME-BGC terrestrial ecosystem model: net primaryproduction controls. Earth Interactions 4 (3), 1e85.
Yadav, V., Del Grosso, S.J., Parton, W.J., Malanson, G.P., 2008. Adding ecosystemfunction to agent-based land use models. Land Use Science 3, 27e40.
Zellner, M.L., Page, S.E., Rand, W., Brown, D.G., Robinson, D.T., Nassauer, J., Low, B.,2009. The emergence of zoning policy games in exurban jurisdictions:informing collective action theory. Land Use Policy 26, 356e367.
rkets and land management on ecosystem function: A framework for012), http://dx.doi.org/10.1016/j.envsoft.2012.06.016
Related Documents


