Scholars' Mine Scholars' Mine Masters Theses Student Theses and Dissertations Fall 2012 Effects of high volumes of fly ash on cement paste Effects of high volumes of fly ash on cement paste Karl Wehking Beckemeier Follow this and additional works at: https://scholarsmine.mst.edu/masters_theses Part of the Civil Engineering Commons Department: Department: Recommended Citation Recommended Citation Beckemeier, Karl Wehking, "Effects of high volumes of fly ash on cement paste" (2012). Masters Theses. 6942. https://scholarsmine.mst.edu/masters_theses/6942 This thesis is brought to you by Scholars' Mine, a service of the Missouri S&T Library and Learning Resources. This work is protected by U. S. Copyright Law. Unauthorized use including reproduction for redistribution requires the permission of the copyright holder. For more information, please contact [email protected].

Welcome message from author
This document is posted to help you gain knowledge. Please leave a comment to let me know what you think about it! Share it to your friends and learn new things together.
Transcript

Scholars' Mine Scholars' Mine
Masters Theses Student Theses and Dissertations
Fall 2012
Effects of high volumes of fly ash on cement paste Effects of high volumes of fly ash on cement paste
Karl Wehking Beckemeier
Follow this and additional works at: https://scholarsmine.mst.edu/masters_theses
Part of the Civil Engineering Commons
Department: Department:
Recommended Citation Recommended Citation Beckemeier, Karl Wehking, "Effects of high volumes of fly ash on cement paste" (2012). Masters Theses. 6942. https://scholarsmine.mst.edu/masters_theses/6942
This thesis is brought to you by Scholars' Mine, a service of the Missouri S&T Library and Learning Resources. This work is protected by U. S. Copyright Law. Unauthorized use including reproduction for redistribution requires the permission of the copyright holder. For more information, please contact [email protected].


EFFECTS OF HIGH VOLUMES OF FLY ASH ON CEMENT PASTE
by
KARL WEHKING BECKEMEIER
A THESIS
Presented to the Faculty of the Graduate School of the
MISSOURI UNIVERSITY OF SCIENCE AND TECHNOLOGY
In Partial Fulfillment of the Requirements for the Degree
MASTER OF SCIENCE IN CIVIL ENGINEERING
2012
Approved by
David N. Richardson, Advisor Jeffery S. Volz John J. Myers

iii
2012
Karl Wehking Beckemeier
All Rights Reserved

iii
ABSTRACT
The study of high-volume fly ash (HVFA) concrete mixtures has become popular
due to the significant environmental and economic benefits which the material may
provide. By including fly ash at 50 percent or greater replacement levels, substantial
benefits could be obtained. However, the inclusion of fly ash can have negative effects,
including incompatibilities between constituents of a mixture. As the fly ash replacement
level increases, the degree and likelihood of these problems increases.
In this study, paste mixtures were made, as part of a larger HVFA concrete study, in
order to determine the degree to which varying levels of fly ash would affect the paste mixtures
and to determine potential methods of mitigating the negative effects of high volumes of fly ash
on concrete mixtures. Five Type I or I/II portland cements were tested in combination with five
Class C fly ashes at 0, 25, 50, and 70 percent replacement levels. The effects of gypsum, calcium
hydroxide, and rapid set cement additions were evaluated at fly ash replacement levels of 50 and
70 percent, and the effects of a Type A/F water-reducing admixture were examined for all fly ash
replacement levels. The paste properties that were evaluated included compressive strength, heat
of hydration, consistency, and setting time.
Analysis of the results showed general trends for increasing fly ash replacement levels,
such as slower strength gain, decreased heat of hydration, delayed setting times, and increased
fluidity of the paste at very early ages. However, there were also many inconsistencies in the
results, which were attributable to sulfate imbalances and increased aluminate hydration at early
ages. It was found that, in many cases, these sulfate imbalances were lessened by the addition of
gypsum. The additions of calcium hydroxide and rapid set cement also showed improvements,
such as increased rates of strength gain and accelerated setting times.

iv
ACKNOWLEDGMENTS
First, I would like to thank Dr. Richardson, my advisor, for his continual
guidance, enthusiasm, and encouragement. This project would not have been possible
without his knowledge and insight throughout all phases of this study.
Aside from my advisor, I would like to thank my other committee members, Dr.
Volz and Dr. Myers. Their dedication to this project and generous lending of equipment
is greatly appreciated.
Sincere thanks go to Mike Lusher, for his support and continued assistance
throughout this project, for fixing/replacing everything I broke over the years, and for
taking on the never-ceasing task of managing the materials labs. Sincere thanks also go to
Drew Davis, whose help throughout this project is greatly appreciated, especially all of
the hours spent running Vicats and pondering the wonders of cementitious materials.
Thanks are also given to those in the campus community, friends, faculty, and staff, who
helped in numerous ways to make this project possible, especially Gary Abbott, Bill
Frederickson, and Scott Parker for all of their help with materials and equipment; Karen
White for her help with all of the administrative processes of graduate education; and
John Bullock for being John Bullock.
I would like to thank my family, especially my mother, father, and brother, for
their continual support and encouragement throughout this project.
Last, but not least, I would like to thank my wife, Nickol, for her patience,
understanding, and encouragement throughout the duration of this endeavor.

v
TABLE OF CONTENTS Page ABSTRACT ..................................................................................................................... iii ACKNOWLEDGMENTS ............................................................................................... iv LIST OF ILLUSTRATIONS ........................................................................................... ix LIST OF TABLES .......................................................................................................... xii SECTION 1. INTRODUCTION ............................................................................................ 1 1.1 STATEMENT OF PROBLEM ........................................................... 1 1.2 OBJECTIVES ..................................................................................... 2 1.3 SCOPE OF INVESTIGATION .......................................................... 2 2. REVIEW OF LITERATURE ........................................................................... 4 2.1 PORTLAND CEMENT HYDRATION ............................................. 4 2.2 FLY ASH PRODUCTION AND CLASSIFICATION ...................... 6 2.3 EFFECTS OF FLY ASH ON HYDRATION ..................................... 7 2.4 INCOMPATIBILITIES IN HVFA MIXTURES.............................. 10 2.5 POWDER ADDITIONS FOR HVFA MIXTURES ......................... 12 2.6 METHODS OF EVALUATING HEAT EVOLUTION .................. 16 2.6.1. Isothermal Calorimetry ..................................................... 16 2.6.2. Semi-Adiabatic Calorimetry ............................................. 17 2.6.3. Adiabatic Calorimetry ....................................................... 18 2.6.4. Solution Calorimetry ......................................................... 19 2.7 DEVELOPMENT OF THE MINIATURE SLUMP TEST .............. 19

vi
2.8 EFFECTS OF HIGH VOLUMES OF FLY ASH ON PASTE PROPERTIES ............................................................................. 20 2.8.1. Compressive Strength ....................................................... 20 2.8.2. Heat Evolution .................................................................. 21 2.8.3. Consistency ....................................................................... 22 2.8.4. Setting Time ...................................................................... 22 3. LABORATORY INVESTIGATION ............................................................. 23 3.1 EXPERIMENTAL DESIGN ............................................................ 23 3.1.1. Screening Study ................................................................ 23 3.1.2. Main Study ........................................................................ 24 3.2 EQUIPMENT ................................................................................... 27 3.2.1. Mixing Equipment ............................................................ 27 3.2.2. Cube Molding Equipment ................................................. 29 3.2.3. Curing Equipment ............................................................. 31 3.2.4. Compressive Strength Testing Equipment........................ 31 3.2.5. Semi-Adiabatic Calorimetry Equipment........................... 32 3.2.6. Miniature Slump Equipment ............................................. 33 3.2.7. Vicat Setting Time and Normal Consistency Equipment ....................................................................... 34 3.3 MATERIALS .................................................................................... 37 3.3.1. Portland Cements .............................................................. 37 3.3.2. Fly Ashes .......................................................................... 38 3.3.3. Powder Additions.............................................................. 38 3.3.4. Water Reducer .................................................................. 40 3.3.5. Water ................................................................................. 40

vii
3.4 TEST PROCEDURES ...................................................................... 41 3.4.1. Pre-blending Dry Constituents .......................................... 41 3.4.2. Determination of Rotational Speeds for Handheld Mixer ............................................................................... 41 3.4.3. Combined Mixing Procedure ............................................ 41 3.4.4. Cube Compressive Strength .............................................. 42 3.4.5. Semi-adiabatic Calorimetry .............................................. 44 3.4.6. Miniature Slump ............................................................... 49 3.4.7. Normal Consistency and Vicat Time of Setting ............... 50 4. RESULTS AND DISCUSSION ..................................................................... 52 4.1 SCREENING STUDY RESULTS ................................................... 52 4.1.1. Cube Compressive Strength .............................................. 52 4.1.2. Semi-adiabatic Calorimetry .............................................. 74 4.1.3. Miniature Slump ............................................................... 88 4.1.4. Vicat Setting Time ............................................................ 94 4.2 MAIN STUDY RESULTS ............................................................... 99 4.2.1. Outlier Analysis ................................................................ 99 4.2.2. Effects of Water Reducer Addition ................................. 110 4.2.3. Effects of Gypsum Addition ........................................... 118 4.2.4. Effects of Calcium Hydroxide-Gypsum Addition .......... 126 4.2.5. Effects of Rapid Set Cement-Gypsum Addition ............. 133 4.3 CORRELATIONS .......................................................................... 140 5. SUMMARY AND CONCLUSIONS ........................................................... 143 5.1 SUMMARY .................................................................................... 143

viii
5.2 CONCLUSIONS............................................................................. 144 5.3 FUTURE RESEARCH ................................................................... 146 APPENDICES A. TESTING PROCEDURES .......................................................................... 148 B. OUTLIER ANALYSIS FOR CALORIMETRY DATA ............................. 174 C. SCREENING STUDY THERMAL CURVES ............................................ 182 D. MAIN STUDY THERMAL CURVES ....................................................... 196 E. SCREENING STUDY MINIATURE SLUMP PLOTS .............................. 207 F. MAIN STUDY MINIATURE SLUMP PLOTS .......................................... 221 REFERENCES ............................................................................................................. 232
VITA ............................................................................................................................. 235

ix
LIST OF ILLUSTRATIONS Page Figure 3.1. Black and Decker Hand Mixer ..................................................................... 27 Figure 3.2. Equipment used in the Combined Mixing Procedure................................... 29 Figure 3.3. Cube Molding Equipment ............................................................................ 30 Figure 3.4. Tinius-Olsen Load Frame and Computer ..................................................... 32 Figure 3.5. F-Cal 4000, Computer, and Cylinder Molds ................................................ 33 Figure 3.6. Miniature Slump Cones and Equipment....................................................... 34 Figure 3.7. Vicat Apparatus with Ring and Glass Plate ................................................. 35 Figure 3.8. Hobart Mixer and Bowl Scraper................................................................... 36 Figure 3.9. Examples of Signal and Noise Quantities .................................................... 46 Figure 3.10. Representation of the ΔT Quantity ............................................................. 47 Figure 3.11. Example of Setting Time Prediction by the Fractions Method .................. 48 Figure 4.1. One-day Compressive Strengths for Cement 1 Combinations ..................... 56 Figure 4.2. 28-day Compressive Strengths for Cement 1 Combinations ....................... 57 Figure 4.3. One-day Compressive Strengths for Cement 2 Combinations ..................... 60 Figure 4.4. 28-day Compressive Strengths for Cement 2 Combinations ....................... 61 Figure 4.5. One-day Compressive Strengths for Cement 3 Combinations ..................... 64 Figure 4.6. 28-day Compressive Strengths for Cement 3 Combinations ....................... 65 Figure 4.7. One-day Compressive Strengths for Cement 4 Combinations ..................... 68 Figure 4.8. 28-day Compressive Strengths for Cement 4 Combinations ....................... 69 Figure 4.9. One-day Compressive Strengths for Cement 5 Combinations ..................... 72 Figure 4.10. 28-day Compressive Strengths for Cement 5 Combinations ..................... 73

x
Figure 4.11. Typical Series of Thermal Curves Showing Delayed Silicate Hydration and Decreased Main Hydration Peaks ............................................... 76 Figure 4.12. Series of Thermal Curves Showing Accelerated Hydration at 70% Fly Ash Replacement .......................................................................................... 77 Figure 4.13. Example of Type A Thermal Curve Shape ................................................ 82 Figure 4.14. Example of Type B Thermal Curve Shape................................................. 82 Figure 4.15. Example of Type C Thermal Curve Shape................................................. 83 Figure 4.16. Example of Type D Thermal Curve Shape ................................................ 83 Figure 4.17. Example of Type E Thermal Curve Shape ................................................. 84 Figure 4.18. Example of Type F Thermal Curve Shape ................................................. 84 Figure 4.19. Example of Type G Thermal Curve Shape ................................................ 85 Figure 4.20. Comparison of Curve Types ....................................................................... 89 Figure 4.21. Example of Miniature Slump Results for Increasing Fly Ash Contents .... 90 Figure 4.22. Effect of Water Reducer on One-Day Cube Strengths for Combination 4-1 ............................................................................................... 111 Figure 4.23. Effect of Water Reducer on One-Day Cube Strengths for Combination 1-3 ............................................................................................... 111 Figure 4.24. Effect of Water Reducer on 56-Day Cube Strengths for Combination 4-1 ............................................................................................... 112 Figure 4.25. Effect of Water Reducer on 56-Day Cube Strengths for Combination 1-3 ............................................................................................... 112 Figure 4.26. Thermal Curves Showing the Retarding Effect of Water Reducer .......... 114 Figure 4.27. Effect of Gypsum Addition on Strength Gain for Combination 4-1 ........ 120 Figure 4.28. Effect of Gypsum Addition on Strength Gain for Combination 1-3 ........ 121 Figure 4.29. Series of Thermal Curves Showing the Effect of Gypsum Addition ....... 122 Figure 4.30. Effect of Lime on Combination 4-1 Mixtures with Four Percent Gypsum ............................................................................................................. 127

xi
Figure 4.31. Effect of Lime on Combination 1-3 Mixtures with Four Percent Gypsum ............................................................................................................. 127 Figure 4.32. Series of Thermal Curves Showing the Effect of Calcium Hydroxide Addition .......................................................................................... 129 Figure 4.33. Effect of RSC on Combination 4-1 Mixtures with Four Percent Gypsum ............................................................................................................. 134 Figure 4.34. Effect of RSC on Combination 1-3 Mixtures with Four Percent Gypsum ............................................................................................................. 134 Figure 4.35. Series of Thermal Curves Showing the Effect of RSC Addition ............. 136 Figure 4.36. Correlation of Percentage Method Final Set Times for All Mixtures ............................................................................................................ 141 Figure 4.37. Correlation of Percentage Method Final Set Times for Type A Mixtures ............................................................................................................ 142

xii
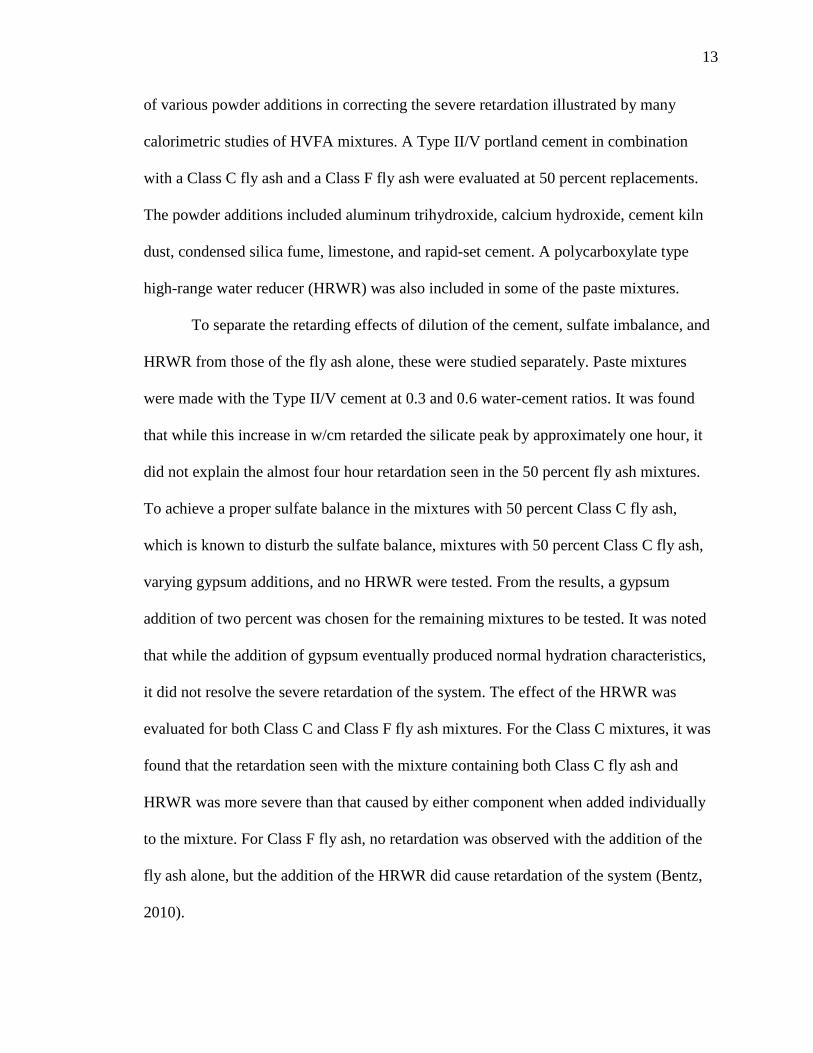
LIST OF TABLES Page Table 3.1. Main Study Combinations ............................................................................. 26 Table 3.2. Hand Mixer Rotational Speeds ...................................................................... 28 Table 3.3. Cement Oxide Analyses (Screening Study) ................................................... 37 Table 3.4. Cement Oxide Analyses (Main Effects Study) .............................................. 37 Table 3.5. Fly Ash Oxide Analyses ................................................................................ 38 Table 3.6. Oxide Analysis of RSC .................................................................................. 39 Table 3.7. CTS Rapid Set Cement Compressive Strength Results ................................. 40 Table 3.8. Combined Mixing Procedure Sequence ........................................................ 43 Table 4.1. 1-Day Cube Strength Outlier Analysis for Cement 1 Combinations............. 54 Table 4.2. 28-Day Cube Strength Outlier Analysis for Cement 1 Combinations........... 55 Table 4.3. 1-Day Cube Strength Outlier Analysis for Cement 2 Combinations............. 58 Table 4.4. 28-Day Cube Strength Outlier Analysis for Cement 2 Combinations........... 59 Table 4.5. 1-Day Cube Strength Outlier Analysis for Cement 3 Combinations............. 62 Table 4.6. 28-Day Cube Strength Outlier Analysis for Cement 3 Combinations........... 63 Table 4.7. 1-Day Cube Strength Outlier Analysis for Cement 4 Combinations............. 66 Table 4.8. 28-Day Cube Strength Outlier Analysis for Cement 4 Combinations........... 67 Table 4.9. 1-Day Cube Strength Outlier Analysis for Cement 5 Combinations............. 70 Table 4.10. 28-Day Cube Strength Outlier Analysis for Cement 5 Combinations......... 71 Table 4.11. Thermal Curve Data for Cement 1 Combinations ....................................... 78 Table 4.12. Thermal Curve Data for Cement 2 Combinations ....................................... 78 Table 4.13. Thermal Curve Data for Cement 3 Combinations ....................................... 79

xiii
Table 4.14. Thermal Curve Data for Cement 4 Combinations ....................................... 79 Table 4.15. Thermal Curve Data for Cement 5 Combinations ....................................... 80 Table 4.16. Miniature Slump Results for Cement 1 ....................................................... 91 Table 4.17. Miniature Slump Results for Cement 2 ....................................................... 91 Table 4.18. Miniature Slump Results for Cement 3 ....................................................... 92 Table 4.19. Miniature Slump Results for Cement 4 ....................................................... 92 Table 4.20. Miniature Slump Results for Cement 5 ....................................................... 93 Table 4.21. Vicat Setting Time Results for Cement 1 .................................................... 95 Table 4.22. Vicat Setting Time Results for Cement 2 .................................................... 95 Table 4.23. Vicat Setting Time Results for Cement 3 .................................................... 96 Table 4.24. Vicat Setting Time Results for Cement 4 .................................................... 96 Table 4.25. Vicat Setting Time Results for Cement 5 .................................................... 97 Table 4.26. Outlier Analysis of 1-Day Cube Strengths for Combination 4-1 Mixtures ............................................................................................................ 100 Table 4.27. Outlier Analysis of 3-Day Cube Strengths for Combination 4-1 Mixtures ............................................................................................................ 101 Table 4.28. Outlier Analysis of 7-Day Cube Strengths for Combination 4-1 Mixtures ............................................................................................................ 102 Table 4.29. Outlier Analysis of 28-Day Cube Strengths for Combination 4-1 Mixtures ............................................................................................................ 103 Table 4.30. Outlier Analysis of 56-Day Cube Strengths for Combination 4-1 Mixtures ............................................................................................................ 104 Table 4.31. Outlier Analysis of 1-Day Cube Strengths for Combination 1-3 Mixtures ............................................................................................................ 105 Table 4.32. Outlier Analysis of 3-Day Cube Strengths for Combination 1-3 Mixtures ............................................................................................................ 106

xiv
Table 4.33. Outlier Analysis of 7-Day Cube Strengths for Combination 1-3 Mixtures ............................................................................................................ 107 Table 4.34. Outlier Analysis of 28-Day Cube Strengths for Combination 1-3 Mixtures ............................................................................................................ 108 Table 4.35. Outlier Analysis of 56-Day Cube Strengths for Combination 1-3 Mixtures ............................................................................................................ 109 Table 4.36. Calorimetry Results for Mixtures with Increasing Water Reducer Dosages ............................................................................................................. 115 Table 4.37. Miniature Slump Results for Mixtures with Increasing Water Reducer Dosages ............................................................................................... 117 Table 4.38. Vicat Results for Mixtures with Increasing Water Reducer Dosages ....... 119 Table 4.39. Calorimetry Results for Mixtures with Increasing Gypsum Additions ..... 123 Table 4.40. Miniature Slump Results for Mixtures with Increasing Gypsum Additions ........................................................................................................... 125 Table 4.41. Vicat Results for Mixtures with Increasing Gypsum Additions ................ 126 Table 4.42. Calorimetry Results for Mixtures with Increasing Calcium Hydroxide Additions and Four Percent Gypsum .............................................. 130 Table 4.43. Miniature Slump Results for Mixtures with Increasing Lime Addition and Four Percent Gypsum ................................................................. 131 Table 4.44. Vicat Results for Mixtures with Increasing Lime Additions ..................... 132 Table 4.45. Calorimetry Results for Mixtures with Increasing RSC Additions and Four Percent Gypsum ................................................................................. 137 Table 4.46. Miniature Slump Results for Mixtures with Increasing RSC Addition and Four Percent Gypsum ................................................................. 138 Table 4.47. Vicat Results for Mixtures with Increasing RSC Additions ...................... 139

1
1. INTRODUCTION
The study of high-volume fly ash concrete mixtures has become popular due to
the potential of the material to provide significant environmental and economic benefits.
By increasing the amount of fly ash introduced into concrete mixtures, less cement would
be produced, which would decrease CO2 emissions, and less fly ash would be placed in
landfills. The use of less cement, along with the sustainability benefits of HVFA
concrete, would also decrease the amount of raw materials which would need to be
extracted to produce portland cement concrete. Immediate economic benefits occur
because portland cement is replaced with a less expensive by-product material. For
properly designed HVFA mixtures, increased durability and long-term strengths would
provide long-term economic benefits, because infrastructure components would have to
be replaced less often. By being able to increase the incorporation of fly ash into concrete
at 50 percent or greater replacements, substantial benefits could be obtained.
1.1 STATEMENT OF PROBLEM
Incorporating fly ash in a concrete mixture provides benefits to both fresh and
hardened properties of the concrete. Improvements in fresh properties include increased
workability, increased pumpability, and reduced bleeding. Hardened concrete benefits
could include greater long-term strength, decreased early-age temperature rise, and
increased durability. The use of fly ash can also have negative effects on concrete
mixtures. These commonly include decreased strengths at early ages, delayed setting
times, loss of certain forms of durability, and lower later strengths. Also,

2
incompatibilities between constituents of the mixture can lead to detrimental effects on
the properties of the concrete.
As the amount of fly ash used in a mixture increases, the degree and likelihood of
the above-mentioned problems increases. Therefore, in high volume fly ash concrete, it is
necessary to assess the degree to which these problems may occur and determine
methods of mitigating these problems in order for HVFA concrete to be a viable
construction material.
1.2 OBJECTIVES
The objectives of this study were to determine the degree to which paste mixtures
are affected by varying levels of Class C fly ash and determine strategies to mitigate the
negative effects of increasing the proportion of fly ash in a paste mixture. The properties
that were evaluated included compressive strength, heat of hydration, consistency, and
setting time.
As part of a larger HVFA concrete project, the paste testing was done to gain
knowledge of the cementitious materials without the effect of coarse and fine aggregates.
Also, the nature of paste testing allowed a greater volume of cementitious combinations
to be evaluated in a given period of time than would have been possible with concrete
testing.
1.3 SCOPE OF INVESTIGATION
To evaluate a variety of cement and fly ash combinations, five Type I portland
cements and five Class C fly ashes were chosen to be representative of those commonly

3
available in the State of Missouri. The levels of fly ash replacement were 0, 25, 50, and
70 percent by mass. The use of gypsum, calcium hydroxide, and rapid set cement were
each evaluated, at two dosage levels, as powder additions to improve properties of the
HVFA combinations. All mixtures were evaluated at a constant water-cementitious
materials ratio (w/cm) of 0.40. Also, a water reducing admixture was added to some of
the mixtures to evaluate its influence on properties of the paste.
The paste mixtures were tested for compressive strength, heat of hydration,
consistency, and setting time. Compressive strength testing was performed using two-
inch cubes at testing ages of 1, 3, 7, 28, and 56 days. The paste setting time was evaluated
for each combination using the Vicat time of set method, in accordance with ASTM C
191. Heat evolution of the paste mixtures was evaluated using a semi-adiabatic field
calorimeter, which collected temperature data on three replicates for each mixture
simultaneously over a 48-hour period. The consistency of the paste mixtures was
evaluated at 2, 5, 15, 30, and 45 minutes after initial mixing using miniature slump cones.

4
2. REVIEW OF LITERATURE
2.1 PORTLAND CEMENT HYDRATION
Four primary compounds make up approximately 90 percent of portland cement
by mass. These compounds are tricalcium silicate (C3S), dicalcium silicate (C2S),
tricalcium aluminate (C3A), and tetracalcium aluminoferrite (C4AF). C3S is also known
as alite and C2S is also known as belite. The remaining portion of the cement consists of a
calcium sulfate source and grinding aids, both of which are added during the grinding
process. The calcium sulfate source, which constitutes four to six percent of the cement,
may be in the form of anhydrous calcium sulfate, calcium sulfate dihydrate, calcium
sulfate hemihydrate, or a combination of these forms. Calcium sulfate dihydrate, also
known as gypsum, is the most common source of sulfate in portland cement.
Hemihydrate is formed during the finish grinding of the cement (Kosmatka, Kerkhoff, &
Panarese, 2003).
The hydration of cement begins immediately with the addition of water to cement.
It is thought that cement hydration takes place by two mechanisms, through-solution
hydration and topochemical hydration, also known as solid-state hydration. Through-
solution hydration is thought to occur during early ages. With this mechanism, the
compounds go in to solution and form hydrates. The solution then becomes
supersaturated and the hydrates precipitate from the solution. The other hydration
mechanism, solid-state hydration, is thought to occur at later ages. With this mechanism,
the compounds do not go into solution and the hydration reactions occur at the surface of
the compounds (Mehta & Monteiro, 1993).

5
The hydration reactions of the aluminates, C3A and C4AF, are immediate upon
contact with water and are both similar. Their rapid reaction is slowed by the inclusion of
a calcium sulfate source. The calcium sulfates go into solution quickly and decrease the
solubility of the aluminates, which retards their hydration. During early hydration, the
sulfate-aluminate ratio in solution is high and ettringite, or high-sulfate, is formed. The
formation of ettringite is primarily responsible for early stiffening, setting, and strength
gain. At later ages, when the sulfate supply is depleted, the aluminate reactions are no
longer suppressed and they begin reacting more rapidly. This causes the already formed
ettringite to become unstable and convert to monosulfate, also known as low-sulfate. It
should be noted that the sulfate-aluminate balance highly influences setting behavior. In
an under-sulfated system, the rapid aluminate reactions will result in flash set, which
involves immediate setting, large amounts of released heat, and low ultimate strengths. In
an extremely over-sulfated system, the high concentration of calcium and sulfate in
solution will result in the quick formation of gypsum. This does not cause large amounts
of heat to be released and can be undone by remixing. However, over-sulfating can lead
to other problems, such as lower strengths and higher amounts of shrinkage (Mehta &
Monteiro, 1993).
The hydration of the silicates, C3S and C2S, results in the formation of calcium
silicate hydrates (C-S-H) and calcium hydroxide (CH). C-S-H has a variable chemical
composition and is primarily responsible for the strength of the paste. CH has a definite
chemical composition and, when compared to C-S-H, has a much lower contribution to
strength. Also, high amounts of CH in a system can lead to durability issues because it
has a much higher solubility in acidic solutions, when compared to C-S-H, and is a

6
necessary component of the delayed, expansive ettringite formation known as sulfate
attack. Therefore, cement pastes with greater amounts of C-S-H and lower amounts of
CH will be stronger and more durable. When compared to C2S, the hydration of C3S
occurs more rapidly, produces less C-S-H, and produces more CH. It contributes to
setting and early strength gain. C2S, which reacts slowly and produces more C-S-H,
contributes to the ultimate strength of the paste. It should also be noted that the presence
of sulfate in solution increases the solubility of the silicate compounds, which increases
the hydration rates of the silicates (Mehta & Monteiro, 1993).
2.2 FLY ASH PRODUCTION AND CLASSIFICATION
Fly ash is a by-product of power production from coal-fired power plants. As the
finely ground coal passes through the furnace, most of the volatile matter and carbon are
burnt off. The mineral impurities remain in the flue gas and fuse together. As the flue gas
leaves the furnace, the ash is cooled rapidly and either agglomerates to form bottom ash
or remains in the gas stream as fly ash. Before leaving the plant, fly ash is removed from
the gasses by electrostatic precipitators or bag filters. The material consists of spherical,
glassy particles that generally require no processing before use in concrete applications
(Malhotra & Mehta, 1996).
Fly ashes are generally categorized as high-calcium or low-calcium, which
corresponds to the ASTM classifications of Class C and Class F, respectively. The four
principle constituents of fly ash are silica (SiO2), alumina (Al2O3), iron (Fe2O3), and
calcium (CaO). The proportions of these constituents vary widely and are dependent on
the source of coal used in production. Generally, Class C fly ashes are produced from

7
sub-bituminous and lignite coal sources, while Class F fly ashes are produced from
bituminous and anthracite coal sources. Carbon may also be present in the fly ash due to
incomplete combustion of the coal. Typical Class C fly ashes have less than 1% carbon,
while some Class F fly ashes may contain up to 20%, based on Loss on Ignition (LOI)
tests (ACI Committee 232, 2003).
To be classified as ASTM Class C, the sum of the SiO2, Al2O3, and Fe2O3
constituents of the fly ash must be greater than 50%. This is lower than the requirements
for Class F, because most Class C fly ashes have CaO contents exceeding 20% (ACI
Committee 232, 2003). In general, these fly ashes possess cementitious as well as
pozzolanic properties.
ASTM requirements state that the sum of the SiO2, Al2O3, and Fe2O3 constituents
of a fly ash must be greater than 70% to be classified as Class F (ACI Committee 232,
2003). This allows for much lower CaO concentrations than in Class C fly ash. Because
of this, Class F fly ashes typically have very little or no cementitious properties of their
own and are primarily pozzolanic.
2.3 EFFECTS OF FLY ASH ON HYDRATION
As mentioned previously, the hydration of the silicates in portland cement
produces C-S-H and CH. With the addition of a pozzolan such as fly ash, silica is added
to the system which reacts with CH in the presence of water to form C-S-H. This is
known as the pozzolanic reaction. The pozzolanic reaction is comparatively slow and
results in slower rates of heat evolution and strength gain. However, the consumption of

8
CH and filling of pores in the paste results in higher ultimate strengths and improved
durability (Mindess, et al., 2003; Mehta & Monteiro, 1993).
Wang, et al. (2006) studied the effect of fly ash and chemical admixtures on the
heat release of paste mixtures. Type I and Type II cements were used in combination with
Class F and Class C fly ashes at 20 percent replacement. Type A, water-reducing, and
Type B, retarding admixtures were also evaluated. It was found that the Class F fly ash
had little effect on the timing of the main hydration peak, but did significantly reduce the
total heat released in the first 24 hours. This reduction in the rate of heat release was
attributed to the dilution of the more reactive cement with less reactive fly ash. The
sulfate depletion peak, usually observed as a shoulder that occurs after the peak on the
main hydration curve, was also not significantly affected, which indicates that the rate of
sulfate consumption was not affected by the fly ash. The use of Class C fly ash resulted in
a severely delayed main hydration curve. As with the Class F fly ash, it also reduced the
total heat released and did not appear to affect the rate of sulfate consumption. However,
since the main hydration curve was delayed, the shoulders, indicating sulfate depletion,
occur before the peak of the main curve. The addition of the chemical admixtures
resulted in significantly delayed main hydration curves for all of the mixtures. The effect
was more pronounced for the Class C fly ash mixtures, which also showed a greater
reduction in the total heat released. For the Type II cement in combination with either fly
ash, the higher admixture dosage caused hydration to almost completely stop.
Jiang, et al.(1999) studied the hydration of paste mixtures made with portland
cement and Class F fly ash at 40, 55, and 70 percent replacement levels. They also varied
the w/cm and included water-reducing and activating admixtures in some of the pastes. It

9
was found that the fly ash mixtures had lower early strengths, but showed greater rates of
strength gain at later ages, when compared to the control mixture. The CH content of the
mixtures at 28 days generally decreased with increasing fly ash contents, though it was
found that the 70 percent fly ash mixture had a higher CH content than both the 40 and 55
percent fly ash mixtures. From pore structure analysis, it was determined that the total
porosity at 28 days increased with increasing fly ash contents. However, the pore size
distributions showed that the pore sizes were decreased with the inclusion of fly ash.
Scanning electron microscopy of the paste microstructure at early and later ages showed
that increasing fly ash contents led to a less dense microstructure and also revealed that,
even at 90 days, unreacted fly ash particles remained in the paste structure. It was also
found in this study that the addition of an activator admixture would increase the activity
of the fly ash.
In a study by Hubert, et al. (2001), the hydration products of high volume fly ash
binders were investigated. Paste mixtures were prepared with portland cement and one of
two fly ashes. Mixtures were made with 0, 60, 70, and 85 percent by weight of each fly
ash. Hydration was stopped after 3, 7, 28, and 90 days to study the hydration products
and pore solution of the hardened paste. It was found that increasing amounts of fly ash
decreased the CH content of the paste. A similar effect was seen with the ettringite
content except that, for one of the fly ashes, the ettringite content was still high compared
to the control, which means it was a hydration product of the fly ash. The other fly ash
had a lower sulfate content and resulted in lower ettringite levels. By observing the
amount of active silica in the pastes, it was determined that the inclusion of fly ash led to
increased C-S-H contents in the paste. The greatest improvement in C-S-H formation for

10
Fly Ash 1 was seen at 85 percent replacement, while the greatest improvement for Fly
Ash 2 was found at 60 percent replacement. However, Fly Ash 2 had a lower silica
content at 85 percent replacement than Fly Ash 1. This was attributed to the higher
reactivity of Fly Ash 2, which would have led to quicker consumption of the CH and an
earlier end to the pozzolanic reaction. From this it was observed that the reactivity of the
fly ash and the amount of available CH should be balanced for optimum C-S-H
formation.
2.4 INCOMPATIBILITIES IN HVFA MIXTURES
The composition of mineral admixtures varies considerably, even between those
that fall under the same classification, such as Class C fly ash. This leads to complexity in
cementitious systems, as the use of mineral admixtures in concrete mixtures is
commonplace. Due to this complexity, problems such as slump loss, delayed setting, and
slow rates of strength gain, are more likely to occur as a result of incompatibilities
between the materials. The most common cause of incompatibility is related to the sulfate
concentration in a system. If there is not a sufficient amount of sulfate, the aluminates
(C3A and C4AF) will react rapidly and consume a large portion of the available calcium
in the system. This will cause the hydration of the silicates (C3S and C2S) to slow down
and possibly stop completely (Roberts & Taylor, 2007).
Using isothermal calorimetry, Lerch (1946) illustrated the effect of insufficient
sulfate levels on portland cement. In the study, cements with differing C3A and alkali
contents were tested with varying amounts of gypsum added. It was found that as the
sulfate levels decreased, the initial (aluminate) peak occurred more rapidly. This occurred

11
because sulfate was not available to decrease the solubility of the aluminates or form a
protective film of hydration products on the surfaces of the particles. The second
(silicate) peak was delayed and suppressed with decreasing sulfate levels. This was
attributed to a depletion of available calcium, by the aluminates, for hydration of the
silicates and a lack of sulfate, which acts to increase the solubility of the silicates. Also,
some mixtures showed an additional peak, which was caused by renewed aluminate
hydration. It was found that this third peak was delayed and suppressed by increasing
gypsum additions.
Roberts and Taylor (2007) discussed incompatibilities related to changing sulfate
requirements with the additions of supplementary cement materials, admixtures, or both.
It was pointed out that while increasing water reducer dosages typically result in delayed
silicate hydration and slightly delayed sulfate depletion, extremely high dosages can
increase initial aluminate hydration, severely delay silicate hydration, and cause sulfate
depletion to occur at earlier times. The effects of Class C fly ash were attributed to the
increased level of calcium aluminates in the system, which can cause the system to
become under-sulfated. This leads to increased aluminate hydration, which consumes
more calcium during the early stages of hydration. Due to a lack of available calcium,
silicate hydration can become depressed and delayed or may stop completely. Also, the
lack of sulfate decreases the solubility of the silicates which will result in slower silicate
hydration.
Cost and Knight (2007) also discussed the use of Class C fly ash as a common
cause of abnormal behavior in concrete, due to increased aluminate levels, along with
high temperatures, sulfate levels, chemical admixtures, and hot-weather concreting

12
practices. It was noted that the potential for erratic behavior may increase in hot-weather
concrete operations if the dosage of Class C fly ash is increased to utilize the retarding
effect of the material. As part of the study, the heat generation of several paste mixtures
was evaluated, using semi-adiabatic calorimetry, to detect incompatibilities. The paste
was made with a Type II cement at varying sulfate levels and a Class C fly ash at varying
replacement levels. The results showed that the only combination to generate a typical
silicate peak was the 3.3% sulfate cement with 10% fly ash. The combinations of this
cement with 25% and 35% fly ash both showed extremely depressed silicate hydration
peaks. The 3.7% sulfate cement with 25% fly ash showed improvement in the silicate
peak, but at 35% fly ash only a small peak was developed. To investigate an additional
increase in sulfate, the sulfate content of the cement was increased to 4.1% in
combination with the 35% replacement level of Class C fly ash. This seemed to
somewhat restore the silicate peak, but it was delayed significantly.
As can be seen, the use of Class C fly ash can cause significant problems in
concrete when the proper sulfate balance has been compromised. High temperatures and
the use of chemical admixtures, such as water reducers, can increase the magnitude of
incompatibility related problems as these can affect the solubility and reaction rate of
compounds in the system (Cost & Knight, 2007).
2.5 POWDER ADDITIONS FOR HVFA MIXTURES
Bentz (2010) noted that for HVFA mixtures to be commonly used in construction,
it would be necessary to ensure improved and consistent early age performance from
these mixtures. In his study, isothermal calorimetry was used to evaluate the effectiveness
13
of various powder additions in correcting the severe retardation illustrated by many
calorimetric studies of HVFA mixtures. A Type II/V portland cement in combination
with a Class C fly ash and a Class F fly ash were evaluated at 50 percent replacements.
The powder additions included aluminum trihydroxide, calcium hydroxide, cement kiln
dust, condensed silica fume, limestone, and rapid-set cement. A polycarboxylate type
high-range water reducer (HRWR) was also included in some of the paste mixtures.
To separate the retarding effects of dilution of the cement, sulfate imbalance, and
HRWR from those of the fly ash alone, these were studied separately. Paste mixtures
were made with the Type II/V cement at 0.3 and 0.6 water-cement ratios. It was found
that while this increase in w/cm retarded the silicate peak by approximately one hour, it
did not explain the almost four hour retardation seen in the 50 percent fly ash mixtures.
To achieve a proper sulfate balance in the mixtures with 50 percent Class C fly ash,
which is known to disturb the sulfate balance, mixtures with 50 percent Class C fly ash,
varying gypsum additions, and no HRWR were tested. From the results, a gypsum
addition of two percent was chosen for the remaining mixtures to be tested. It was noted
that while the addition of gypsum eventually produced normal hydration characteristics,
it did not resolve the severe retardation of the system. The effect of the HRWR was
evaluated for both Class C and Class F fly ash mixtures. For the Class C mixtures, it was
found that the retardation seen with the mixture containing both Class C fly ash and
HRWR was more severe than that caused by either component when added individually
to the mixture. For Class F fly ash, no retardation was observed with the addition of the
fly ash alone, but the addition of the HRWR did cause retardation of the system (Bentz,
2010).

14
The effects of the powder additions were evaluated for the Class C fly ash
mixtures with the two percent gypsum addition. A five percent addition of limestone
powder had little effect on hydration. A 10 percent addition of aluminum trihydroxide did
little to accelerate hydration but did increase the height of the peaks slightly. The 10
percent addition of cement kiln dust caused slight acceleration but more significantly
increased the area under the curve, indicating increased early-age hydration. The five
percent addition of condensed silica fume accelerated hydration by more than one hour,
but this was not enough to restore the timing of the hydration to that seen with the 100
percent cement control mixture. The two other powder additions, calcium hydroxide and
rapid set cement, showed more promise in mitigating retardation of the Class C fly ash
systems (Bentz, 2010).
Calcium hydroxide was added because it has been established that if early
aluminate hydration consumes enough of the available calcium, silicate hydration can be
severely retarded or fail to occur completely. While the addition of gypsum does supply
additional calcium it is likely that this is consumed by aluminate hydration, so the
addition of calcium hydroxide was used to provide additional calcium to the system to aid
in hydration of the silicates. The effect of the five percent, by mass of total cementitious
materials, calcium hydroxide addition was evaluated for mixtures containing no fly ash,
with and without the HRWR. For the mixture without HRWR, an acceleration of
approximately 1.5 hours was observed, along with an increase in the area under the
curve. For the mixture with HRWR, an acceleration of approximately 2.5 hours was
observed. Next, the calcium hydroxide addition was evaluated for the 50 percent fly ash
mixtures with their required HRWR dosages. For the Class C fly ash, an acceleration of

15
approximately 5.5 hours was observed, which almost restored the timing of the hydration
curve to that of the 100 percent cement control mixture. For the Class F fly ash, an
acceleration of approximately 5 hours was observed. These accelerations were verified by
similar accelerations in setting times, which were tested by needle penetration. It was
noted, however, that the calcium hydroxide additions resulted in significantly lower cube
compressive strengths at 28 days for the Class F fly ash mixtures (Bentz, 2010).
Because it was thought that rapid set cement may not be significantly affected by
the retarding effect of the fly ash, it was added in an effort to improve the early hydration
reactions and strength development of the system. Accelerations were observed for 10
and 20 percent additions of rapid set cement to the Class C fly ash mixtures. The 10
percent addition was chosen for further study to avoid the possibility of setting occurring
too quickly with the 20 percent addition. To evaluate the effect of the fly ashes and
HRWR on the rapid set cement alone, mixtures were made with the rapid set cement
alone, rapid set cement with 50 percent fly ash replacements, and rapid set cement with
50 percent fly ash replacements and HRWR addition. It was found that the Class C fly
and HRWR both contributed to retardation in the mixtures. However, the Class F fly ash
accelerated the hydration. In all cases, the mixtures produced peaks which were within
one hour of that of the 100 percent rapid set cement mixture. This indicates that the rapid
set cement is not as sensitive to the effect of fly ash, when compared to the Type II/V
cement. Following the study of the effect of fly ash and HRWR on the rapid set cement,
the rapid set cement was evaluated at a 10 percent addition in the Type II/V cement
mixtures with 50 percent fly replacements and required HRWR dosages. It was found
that the rapid set cement provided two contributions to the system. These were the

16
hydration of the rapid set cement alone and an acceleration of the portland cement-fly ash
combination. For the Class C fly ash mixture, it was observed that the rapid set cement
reacted immediately and provided an acceleration of approximately four hours. For the
Class F fly ash mixture, it was observed that the rapid set cement reactions peaked after
two hours, while the retardation of the system was increased by approximately eight
hours. It was noted that mortar cube compressive strengths at 28 days for the Class C fly
ash with a 10 percent addition of rapid set cement were 105 percent of those obtained
without rapid set cement. For the Class F fly ash with a five percent addition of rapid set
cement, cube compressive strengths at 28 days were 92 percent of those obtained without
the rapid set cement, while the strengths with and without rapid set cement were similar
at 56 days (Bentz, 2010).
2.6 METHODS OF EVALUATING HEAT EVOLUTION
There are many calorimetry methods and tools used to evaluate the heat evolution
of cementitious mixtures. Some of the more widely used calorimeters include isothermal,
semi-adiabatic, adiabatic, and solution calorimeters. The type of calorimetry device,
mixing method, temperature of mixing environment, and sample size can all affect the
results for a given mixture. Also, calorimetry results are reported in different ways,
depending on the type of calorimeter being used. Therefore, it is necessary to have an
understanding of the method behind varying calorimetry techniques when interpreting the
results of heat of hydration experiments (Wang, 2006).
2.6.1. Isothermal Calorimetry. Isothermal calorimetry is used to measure the
rate of heat production of a specimen kept at near isothermal conditions. This means that

17
the temperature of the specimen is kept at a near constant temperature during hydration.
A typical isothermal calorimeter employs two heat flow sensors, each with an attached
specimen vial holder, and a heat sink with a thermostat. A prepared sample is placed in
one of the vials and an inert specimen is placed in the other vial. Each vial is then placed
into one of the vial holders. The heat released during hydration then passes to the heat
flow sensors. The output of the inert specimen sensor is subtracted from the output of the
test specimen sensor to result in the calorimeter output. The heat production is measured
in watts (W) or joules per second (J/s). The results are usually reported in relation to the
specimen mass as mW/g or J/s/g (ASTM C 1679, 2009). Isothermal calorimetry is used
as a precise means of determining the heat produced solely by the cementitious materials
at a given temperature. The results are generally used quantitatively.
2.6.2. Semi-Adiabatic Calorimetry. Semi-adiabatic calorimetry measures the
temperature of a partially insulated specimen over time. There are a variety of semi-
adiabatic systems available that differ in the size of sample used and the degree of
insulation. The objective for a given system is to insulate the sample in a way that
minimizes the influence of the ambient temperature, but also does not retain excessive
heat that would accelerate the hydration of the specimen and distort the thermal profile.
One common system uses plastic cylinder molds as the specimen container. The
container is placed in a cylindrical receptacle in the device, which consists of an insulated
box with a thermistor at the bottom, so that the thermal readings are taken from the
bottom of the specimen. Another common method uses thermocouples or thermistors,
which are inserted into the center of the specimen. With this method, the specimen

18
container is anything that can hold a sufficient sample, such as plastic cylinders or even
coffee cups (Cost, 2009).
Semi-adiabatic calorimetry is generally used as an economical alternative to
isothermal calorimetry that can also be used in field conditions. The results are generally
used for comparative and qualitative evaluation. However, some researchers have used
more elaborate semi-adiabatic methods to achieve quantitative results, such as the
adiabatic temperature rise or predicted setting times. Also, semi-adiabatic conditions may
provide a better model for the thermal conditions inside a non-massive concrete structure,
where gradual heat loss occurs.
2.6.3. Adiabatic Calorimetry. In adiabatic calorimetry, there is no heat loss or
gain experienced by the specimen and the temperature of the specimen is measured
during hydration. An economical adiabatic calorimeter used by Gibbon, Ballim, and
Grieve consisted of a large tank with heater elements, a temperature probe, and stirrers.
Inside of the tank, the specimen container was placed with a temperature probe inserted
in the center of the specimen. The water temperature was controlled to be maintained at
the same temperature as the hydrating sample. After completion of a test, the temperature
readings were used to determine the specific heat and heat of hydration. The heat of
hydration curve was then integrated to give a plot of total heat produced over time
(Gibbon, et al., 1997).
This type of calorimetry is often used to determine the cumulative temperature
rise of the concrete over time. It provides a model of the heat conditions in massive
concrete structures, where there is little or no dissipation of heat.

19
2.6.4. Solution Calorimetry. Solution calorimetry is most often used to
determine the adherence of a hydraulic cement to ASTM specifications on heat of
hydration requirements at 7 and 28 days. However, it may also be used for research
purposes to determine the heat of hydration at any age. The method involves dissolving
two samples in a solution of nitric acid and hydrofluoric acid. One of the samples consists
of the dry cementitious materials, while the other is a corresponding, partially hydrated
paste specimen. The paste specimen is prepared ahead of time and stored in a sealed vile
and placed in a water bath. At the time of testing, the paste specimen is removed from the
vile and crushed with a mortar and pestle until all of the material passes through a No. 20
sieve. The heat of solution of the dissolving specimens is measured and the difference
between the dry and partially hydrated specimens is taken as the heat of hydration
(ASTM C 186, 2005).
2.7 DEVELOPMENT OF THE MINIATURE SLUMP TEST
Kantro (1980) developed the miniature slump test as a rapid means of determining
the effects of admixtures on the rheological properties of cement pastes. In this study, a
miniature slump cone was made of Lucite with a height of 2.25 inches, top diameter of
0.75 inches, and bottom diameter of 1.50 inches. These dimensions were chosen to be in
proportion to the dimensions of the traditional slump cone used for ASTM C 143. After
performing the test, the area of the paste pat was determined. The miniature slump test
was used on paste mixtures with varying water-cement ratios and various admixtures. It
was found that the method was suitable for comparative testing and evaluating loss in
workability. Also, though it was determined that the miniature slump test was more

20
sensitive, it was found that the overall effects observed with the paste testing correlated
with the results of corresponding concrete testing.
Other researchers have utilized the miniature slump cone to evaluate the early
stiffening behavior of pastes (Bhattacharja & Tang, 2001; Roberts & Taylor, 2007). In
these studies, the paste was mixed following a standard procedure and the miniature
slump test was performed at 2, 5, 15, and 30 minutes after the start of mixing. It was
noted that later times, such as 45 minutes, may also be used. The use of an early
stiffening index, which was calculated by dividing the pat area at 30 minutes by the pat
area at 5 minutes, was discussed by Roberts and Taylor (2007). They stated that
calculated indices less than 0.85 are generally considered to indicate rapid stiffening
behavior. It was also noted by these researchers that because pastes are more sensitive to
incompatibilities, paste systems that indicated potential problems may behave normally
in concrete mixtures.
2.8 EFFECTS OF HIGH VOLUMES OF FLY ASH ON PASTE PROPERTIES
2.8.1. Compressive Strength. The rate of strength gain in mixtures containing
high volumes of Class C fly ash will be slower due to the slow rate of the pozzolanic
reaction. This results in lower early strengths. However, the pozzolanic reaction will also
generally produce greater strengths at later ages. This is due to the replacement of the
weak CH products with C-S-H, which is stronger, and the filling of pores with pozzolanic
reaction products, which reduces the overall porosity of the paste and leads to an increase
in strength (Detwiler, et al., 1996).

21
In a study by Jiang, et al. (1999), the strength development of paste mixtures with
varying Class F fly ash contents, water-cementitious materials ratios, and admixture
dosages were evaluated. Fly ash replacements of 40, 55, and 70 percent were used and
the w/cm of these mixtures were between 0.24 and 0.38. It was found that early strengths
decreased with increasing fly ash contents. Also, the fly ash mixtures showed greater
increases in strength gain at later ages, though their strengths at 90 days were still less
than that obtained by the 100 percent cement control mixture.
Bentz, et al. (2010) evaluated the strength gain characteristics of mortars
containing 50 percent of either Class C or Class F fly ash. The strengths were evaluated
at 1, 7, 28, 56, 182, and 365 days. It was found that one day strengths of the fly ash
mixtures were only approximately 30 percent of those achieved with the 100 percent
cement mortar. At later ages, the strengths of these mixtures approached that of the
control. At 365 days, all of the mixtures with 50 percent fly ash had compressive
strengths that were greater than 85 percent of the strength of the control mixture. Also,
while both fly ash mixtures had similar strengths at 1 day, it was found that between 1
and 7 days, the Class C fly ash mixture showed greater strength gains, indicating that the
Class C fly ash contributed more to early hydration reactions.
2.8.2. Heat Evolution. Schindler and Folliard (2003) performed semi-adiabatic
calorimetry on combinations of Type I cement with 15, 25, 35, and 45 percent Class C or
Class F fly ash replacements by volume. The results were then used to back-calculate the
adiabatic temperature rise. It was found that with increasing Class C fly ash replacement,
the total heat of hydration was not significantly affected, but the rate of hydration was
slowed. It is also apparent from these results that the peak temperature decreased with

22
increasing levels of Class C fly ash. With increasing levels of Class F fly ash, the total
heat of hydration and the rate of heat evolution were reduced, which would result in little
heat development at early ages.
Bentz (2010) evaluated the effects of 50 percent Class C and Class F fly ash
replacement on Type II/V cement paste mixtures using isothermal calorimetry. It was
found that the mixtures with Class C fly ash experienced retarded silicate hydration
peaks. Even with the addition of gypsum to correct the sulfate imbalance, the silicate
peak was significantly delayed. For the Class F fly ash mixtures, the silicate peak was not
delayed.
2.8.3. Consistency. Due to their spherical particle shapes, fly ashes are known to
increase the flowability of cementitious mixtures. This occurs because the spherical shape
reduces friction between particles in the mixture (Mindess, et al., 2003).
2.8.4. Setting Time. It has been found by several researchers that the use of fly
ash can significantly delay setting times (ACI Committee 232, 2003). Bentz et al. (2010)
evaluated the effects of 50 percent Class C or Class F fly ash replacement on Type II/V
cement pastes. It was found that initial set was delayed by at least three hours for both
mixtures containing fly ash, when compared to the 100 percent cement control mixture.
For the Class C fly ash mixture, final set was delayed by almost three hours, while a
delay of over four hours was observed for the Class F fly ash mixture. It should be noted
that the Class C fly ash mixture included a two percent addition of gypsum, by mass of
total cementitious materials, to correct the sulfate imbalance caused by the fly ash.

23
3. LABORATORY INVESTIGATION
3.1 EXPERIMENTAL DESIGN
Five Type I portland cements and five Class C fly ashes, which are representative
of those common to the eastern and western portions of the State of Missouri, were
investigated in this study. Each cement was tested in combination with each Class C fly
ash at replacement levels of 0, 25, 50, and 70 percent by mass of cement. The zero
percent replacement level was used as a baseline. The 25 percent replacement level was
chosen since it is typically the highest replacement level used in concrete mixtures
containing fly ash. The 50 and 70 percent replacements levels were chosen based on
previous research at the Missouri University of Science and Technology. Gypsum,
hydrated lime, and rapid set cement were investigated as powder additions. Also, the
addition of a water reducer was examined. In regard to w/cm, a survey of typical
Missouri Department of Transportation (MoDOT) structural and paving revealed that a
w/cm of 0.45 and 0.40 has been used. Because of concerns about low strength for high
volume flyash mixtures, all of the paste mixtures were prepared with a constant water-
cementitious materials ratio (w/cm) of 0.40.
3.1.1. Screening Study. The Screening Study included testing each combination
of Type I cement and Class C fly ash at the four replacement levels, resulting in 80
combinations. These mixtures contained only cement, fly ash, and water. Testing for the
Screening Study included semi-adiabatic calorimetry, cube compressive strength,
miniature slump, and Vicat setting time. Compressive strength tests were performed at
specimen ages of 1 day and 28 days.

24
3.1.2. Main Study. The Main Study investigated the effects of gypsum, hydrated
lime, rapid set cement, and a water reducer on two combinations of cement and fly ash.
The two cement-fly ash combinations were chosen for further study from the Screening
Study based on having the highest and lowest reactivity of the cement-fly ash
combinations. The levels of reactivity of the combinations were based on 1 -day cube
strengths. A low dose, 2.75 fl. oz./cwt., and high dose, 5.00 fl. oz./cwt., of water reducer
were investigated at each level of fly ash replacement. The gypsum, hydrated lime, and
rapid set cement were investigated at the 50 and 70 percent levels of fly ash replacement
with the low dose of water reducer. The gypsum levels were two and four percent of the
actual percentage of fly ash. The hydrated lime and rapid set cement were evaluated at
two levels with a gypsum level of four percent. The hydrated lime levels were five and
ten percent of the actual percentage of fly ash, while the rapid set cement levels were 10
and 20 percent of the actual percentage of fly ash. This resulted in 48 paste mixtures for
the Main Study. Equations 1 through 4, below, show the equations used in calculating the
proportions of the cementitious materials. Nominal % Activator refers to the nominal
percentage of either hydrated lime or rapid set cement used in the mixture, which are
percentages by weight of flyash, as opposed to a total cementitious basis.
100%
100%1
100%ActivatorinalNomGypsuminalNomR
AshFlyActual+++
= (1)
)%(% AshFlyActualRCementPortlandActual = (2)
)%(100%% AshFlyActualGypsuminalNomGypsumActual = (3)

25
)%(100%% AshFlyActualActivatorinalNomActivatorActual = (4)
AshFlyinalNomCementPortlandinalNomR
%%
= (5)
Table 3.1, on the following page, shows the combinations used in the Main Study.
The percentages shown are nominal percentages. Cements are designated “1”, “2”, “3”
,”4”, or “5”, as are the fly ashes. Thus, a combination of Cement 4 and Fly ash 1 would
be “4-1”.Testing for mixtures in the Main Study included semi-adiabatic calorimetry,
cube compressive strength, miniature slump, and Vicat setting time. Compressive
strength testing was performed at specimen ages of 1, 3, 7, 28, and 56 days.

26
Table 3.1. Main Study Combinations
Portland Cement
Fly Ash Cement (%)
Fly Ash (%)
Gypsum (%)
Calcium Hydroxide (%)
Rapid Set Cement (%)
Water Reducer (fl. oz./cwt.)
4 1 100 ----- ----- ----- ----- -----4 1 100 ----- ----- ----- ----- 2.754 1 100 ----- ----- ----- ----- 5.004 1 75 25 ----- ----- ----- -----4 1 75 25 ----- ----- ----- 2.754 1 75 25 ----- ----- ----- 5.004 1 50 50 ----- ----- ----- -----4 1 50 50 ----- ----- ----- 2.754 1 50 50 ----- ----- ----- 5.004 1 50 50 2 ----- ----- 2.754 1 50 50 4 ----- ----- 2.754 1 50 50 4 5 ----- 2.754 1 50 50 4 10 ----- 2.754 1 50 50 4 ----- 10 2.754 1 50 50 4 ----- 20 2.754 1 30 70 ----- ----- ----- -----4 1 30 70 ----- ----- ----- 2.754 1 30 70 ----- ----- ----- 5.004 1 30 70 2 ----- ----- 2.754 1 30 70 4 ----- ----- 2.754 1 30 70 4 5 ----- 2.754 1 30 70 4 10 ----- 2.754 1 30 70 4 ----- 10 2.754 1 30 70 4 ----- 20 2.751 3 ----- ----- ----- ----- -----1 3 ----- ----- ----- ----- 2.751 3 ----- ----- ----- ----- 5.001 3 25 ----- ----- ----- -----1 3 25 ----- ----- ----- 2.751 3 25 ----- ----- ----- 5.001 3 50 ----- ----- ----- -----1 3 50 ----- ----- ----- 2.751 3 50 ----- ----- ----- 5.001 3 50 2 ----- ----- 2.751 3 50 4 ----- ----- 2.751 3 50 4 5 ----- 2.751 3 50 4 10 ----- 2.751 3 50 4 ----- 10 2.751 3 50 4 ----- 20 2.751 3 70 ----- ----- ----- -----1 3 70 ----- ----- ----- 2.751 3 70 ----- ----- ----- 5.001 3 70 2 ----- ----- 2.751 3 70 4 ----- ----- 2.751 3 70 4 5 ----- 2.751 3 70 4 10 ----- 2.751 3 70 4 ----- 10 2.751 3 70 4 ----- 20 2.75

27
3.2 EQUIPMENT
This section covers the equipment used for the mixing and testing procedures
performed in this study. The section below on mixing equipment describes the equipment
used to mix paste batches for the calorimetry, compressive strength, and miniature slump
tests. The equipment used to mix paste batches for the Vicat setting time procedure is
described later under Vicat Setting Time Equipment.
3.2.1. Mixing Equipment. The paste batches for semi-adiabatic calorimetry,
compressive strength, and miniature slump testing were mixed using the same procedure
and equipment. The batches were mixed using a 250-watt Black and Decker Model
MX217 hand mixer with egg beater-style paddles, shown in Figure 3.1, below.
Figure 3.1. Black and Decker Hand Mixer

28
The mixer had six speed settings along with a “Power Boost” option that would
increase the mixing speed when pushed. The rotational speeds for the various settings are
given below in Table 3.2.
Table 3.2. Hand Mixer Rotational Speeds
The paste was mixed in a stainless steel mixing bowl from a Hobart Model A-200
mixer, which had a capacity of 20 quarts. Temperature measurements of the paste, after
mixing, were made using an analog thermometer with a probe length of five inches.
Other equipment included a stopwatch for timing of the mixing procedure and a ladle to
transport the paste mixture from the mixing bowl. Figure 3.2, below, shows the mixing
bowl, thermometer, and other equipment used during mixing.
1 3902 4403 4904 5405 6006 670
Power Boost 700
Speed Setting Rotational Speed (RPM)

29
Figure 3.2. Equipment used in the Combined Mixing Procedure
3.2.2. Cube Molding Equipment. Steel and plastic molds were used to mold the
two-inch paste cubes. The steel molds contained three compartments and consisted of
two sides with a thickness of one half of an inch, four slats with a thickness of two tenths
of an inch, and a base plate with screws for holding the components together. The two
thicker sides each had four grooves to hold the slats in place and the four slats were
inserted between the thicker sides so that they were parallel to each other. This assembly
was held in place on the base plate by two screws on one of the thicker sides and one
screw on the other side, which was also used for tightening the assembly together. The
plastic molds consisted of two side pieces, a base plate, and six thumb screws. The two
side pieces were held together by two of the longer thumb screws to form the cubes

30
diagonal to the length of the mold. The other four screws were used to hold the
assembled side components to the base plate.
Other equipment used to mold the paste cubes included a tamper, trowel, and
vacuum grease. The tamper was made of Plexiglas and had a width of about one inch,
thickness of about one half of an inch, and a length of about four inches. The trowel was
made of steel and had a rectangular blade 4.25 inches long and two inches wide. The
vacuum grease was Dow Corning High-Vacuum Grease and was used to seal together the
components of the cube molds. Figure 3.3, below, shows the cube molding equipment.
Figure 3.3. Cube Molding Equipment

31
3.2.3. Curing Equipment. After three days of curing, the paste cubes were
removed from the molds and placed in buckets of water saturated with hydrated lime.
The buckets had a capacity of five gallons and were stored in a moist room, which had a
relative humidity maintained at 95% or greater. The moist room itself was not explicitly
controlled for temperature, but the temperature was maintained at the same temperature
as the surrounding building and was relatively constant.
3.2.4. Compressive Strength Testing Equipment. The two-inch cube specimens
were tested for compressive strength on a hydraulic, Tinius-Olsen tension/compression
machine with a capacity of 200,000 pounds. The Tinius-Olsen is controlled using a
desktop computer with MTestW software. Two loading platens were used to apply the
load to the two loading faces of the cube specimens. The lower, square loading platen
was about twelve inches tall and had a diagonal dimension of 3.5 inches. It was attached
to a larger, circular loading platen, typically used for cylinder testing, which rested on the
lower table of the Tinius-Olsen machine. The upper, circular loading platen was about
six inches tall and was attached to the upper crosshead of the Tinius-Olsen machine. The
loading block of the upper platen was spherically seated and had a diameter of 3.5 inches.
Figure 3.4 shows the Tinius-Olsen machine with the loading platens and the computer
used to control the machine.

32
Figure 3.4. Tinius-Olsen Load Frame and Computer
Other equipment included digital calipers for measuring the dimensions of the
specimen and sand paper to smooth the loading faces of the specimen. The sand paper
had a grit size of 60. The complete testing method is detailed in Appendix A.
3.2.5. Semi-Adiabatic Calorimetry Equipment. Temperature measurements
were taken on hydrating paste specimens over time using an F-Cal 4000 Field
Calorimeter from Calmetrix, Inc., which is shown in Figure 3.5. The F-Cal 4000 consists
of four receptacles in an insulated box with thermistors at the bottom of each receptacle.
The thermistors, along with a USB port, are connected to a single data logger. The

33
receptacles are sized to hold standard 4”x8” cylinder molds. Plastic 4”x8” cylinder molds
were used in this study.
Figure 3.5. F-Cal 4000, Computer, and Cylinder Molds
Data was collected from the F-Cal 4000 data logger using the CalCommander
v1.3 Software Suite from Calmetrix, Inc. This required the calorimeter to be connected to
a desktop computer with a USB cable. Once data was collected by and exported from the
CalCommander software, data reduction was performed using Microsoft Excel 2010 and
TableCurve 2D software.
3.2.6. Miniature Slump Equipment. Two miniature slump cones were fabricated
from Plexiglas with the dimensions given by Kantro (1980). The inside of the cones had
dimensions in the same proportion as those specified for a standard slump cone as given

34
in ASTM C 143. These dimensions were 0.75 inches for the top diameter, 1.5 inches for
the bottom diameter, and 2.25 inches for the height.
Figure 3.6, shows the two cones used in this study, along with other equipment
used for performing this test, which included a Plexiglas board, plastic discs, and a
spatula. The rectangular Plexiglas board was flat with a smooth surface and had
dimensions of 39 inches by 13 inches by 0.2 inches. The plastic discs were cut from Zip-
Lock bags and had diameters of about two inches. The stainless steel spatula had a length
of four inches and a width of 0.7 inches.
Figure 3.6. Miniature Slump Cones and Equipment
3.2.7. Vicat Setting Time and Normal Consistency Equipment. The Vicat
apparatus described in ASTM C 191 and ASTM C 187 was used for both the Vicat
setting time and normal consistency tests. The apparatus, shown in Figure 3.7, consists of

35
a moveable rod that has one end with a diameter of 10 millimeters and another end with a
removable needle that has a diameter of one millimeter. The rod is held in a frame that
has a scale with a 50 millimeter length divided into one millimeter increments. An
indicator attached to the rod moves along this scale and a set screw in the frame is used to
hold the rod. The conical ring and base plate, which hold the paste, rest on the bottom
portion of the frame. The conical ring is made of rigid plastic and the base plate is made
of glass.
Figure 3.7. Vicat Apparatus with Ring and Glass Plate

36
The paste was mixed using a Hobart Model N50 mixer, bowl, and paddle, which
conform to the requirements of ASTM C 305. The mixer has three speeds and moves the
paddle in both planetary and revolving motions. Other equipment used to perform these
tests included a bowl scraper with a semi-rigid rubber blade as specified in ASTM C 305,
rubber gloves, and a steel trowel with a rectangular blade 4.25 inches long and two inches
wide. Figure 3.8, below, shows the mixer and other equipment discussed above.
Figure 3.8. Hobart Mixer and Bowl Scraper

37
3.3 MATERIALS
3.3.1. Portland Cements. Five portland cements were chosen that were
representative of those commonly used in the eastern and western portions of the State of
Missouri. The cements were all either ASTM Type I or Type I/II. Oxide analyses were
provided by the producers and are included below in Table 3.3.
Table 3.3. Cement Oxide Analyses (Screening Study)
The cement oxide analyses were performed on materials that were produced at a
similar time as those received during the first shipment of materials. A second shipment
of Cement 1 and Cement 4 were received approximately six months after the first
delivery. As can be seen in Table 3.4, below, the analyses are quite similar.
Table 3.4. Cement Oxide Analyses (Main Effects Study)
Cement 1 Type I/II 20.40 4.21 3.62 63.83 2.49 0.20 0.45 0.52Cement 2 Type I/II 19.90 5.10 3.80 62.60 3.00 ----- ----- 0.50Cement 3 Type I/II 20.30 4.69 3.22 63.00 2.82 ----- ----- 0.50Cement 4 Type I 19.85 4.63 3.23 64.08 3.28 0.18 0.48 0.49Cement 5 Type I/II 19.80 4.80 3.10 63.20 3.10 ----- ----- 0.55
Material Type/Class K2O (%) EqAlk (%)SiO2 (%) Al2O3 (%) Fe2O3 (%) CaO (%) SO3 (%) Na2O (%)
1 20.29 4.05 3.64 63.43 2.91 0.2 0.47 0.54 57 4 40004 20 4.6 3.1 63.9 3.1 --- --- 0.53 61 7 3900
SiO2
(%)Na2O (%)
SO3
(%)CaO (%)
Fe2O3
(%)Al2O3
(%)Fineness (cm2/g)
C3A (%)
C3S (%)
EqAlk (%)
K2O (%)
Cement

38
3.3.2. Fly Ashes. Five fly ashes were chosen that were representative of those
commonly used in the eastern and western portions of the State of Missouri. All of the fly
ashes conformed to the requirements for ASTM Class C fly ash. The results of the oxide
analyses for the fly ashes are included in Table 3.5.
Table 3.5. Fly Ash Oxide Analyses
The fly ash oxide analyses were performed by the Materials Research Center
(MRC), at the Missouri University of Science and Technology, on the first shipment of
materials received. . Also, particle size distributions were analyzed by the Ash Grove
Cement Company Technical Center on this initial shipment. A second shipment of Fly
Ash 3 was received approximately six months after the first shipment. Fly Ash 1 was
continually resupplied from bulk shipments to the Missouri University of Science and
Technology.
3.3.3. Powder Additions. Three materials were used as powder additions in the
paste mixtures. These included gypsum, hydrated lime, and rapid set cement. The
gypsum was manufactured from recycled drywall by USA Gypsum. According to the
1 33.72 21.9 7.15 25.31 2.25 1.4 0.41 1.68 11.16 0.372 33.34 20.57 6.15 26.34 1.87 1.63 0.43 1.92 11.17 0.493 35.42 16.88 7.97 23.21 3.46 1.4 0.56 1.78 19.37 3.054 30.55 18.78 7.48 28.43 3.33 1.5 0.45 1.81 10.17 0.575 32.26 19.03 6.24 27.94 2.4 2.2 0.33 2.43 13.04 0.26
LOI (%)
Retained #325 (%)
EqAlk (%)
K2O (%)
Na2O (%)
SO3
(%)CaO (%)
Fe2O3
(%)Al2O3
(%)SiO2
(%)Flyash

39
manufacturer’s website, the material has a calcium sulfate (CaSO4) content of 96.0% and
a moisture content no greater than 2.0%. The hydrated lime was Standard Hydrated Lime
acquired from Mississippi Lime. Typical data from the manufacturer’s website reported
an available calcium hydroxide (Ca(OH)2) content of 96.8%, CaSO4 content of 0.1%, and
free moisture content of 0.7%. The rapid set cement was Rapid Set Cement manufactured
by CTS Cement Manufacturing Corporation. The advertised oxide analysis is shown in
Table 3.6.
Table 3.6. Oxide Analysis of RSC
Parameter Percent
Calcium oxide (CaO) 50.87
Silicon dioxide (SiO2) 15.40
Aluminum oxide (Al2O3) 13.74
Sulfur trioxide (SO3) 12.52
Iron oxide (FesO3) 2.38
Magnesium oxide (MgO) 1.26
Total alkalis (as Na2O) 0.56
Loss on ignition 2.84
Insoluble residue 0.78
Specific gravity 2.98

40
The manufacturer also provided results for modified ASTM C 109 tests
performed with the material. These compressive strength results are given below in Table
3.7.
Table 3.7. CTS Rapid Set Cement Compressive Strength Results
3.3.4. Water Reducer. The water-reducing admixture used in this project was
Glenium 7500 from BASF, which was a polycarboxylate and conformed to ASTM C
494/C 494M requirements for both a Type A, water-reducing admixture and a Type F,
high-range water-reducing admixture. The recommended dosage range provided by the
manufacturer was 2 to 15 fl. oz./cwt. of cementitious materials.
3.3.5. Water. The water used for all of the mixtures was supplied from a single
source of deionized water.
Time Compressive Strength (psi)1.5 hours 25003 hours 500024 hours 650028 days 8000
(Modified ASTM C 109)Rapid Set Cement Compressive Strength

41
3.4 TEST PROCEDURES
3.4.1. Pre-blending Dry Constituents. Prior to mixing of the paste batches, the
dry constituents of the mixture were pre-blended. This was performed by transferring no
more than 1200 grams of the materials into a 4 inchx8 inch plastic cylinder mold in
similar proportions as those used in the mixture. The cap was then placed on the cylinder
and the cylinder was held horizontally with one hand on each end. The cylinder was then
shaken 25 cycles using a six inch throw. This procedure is included in all of the test
procedures in Appendix A.
3.4.2. Determination of Rotational Speeds for Handheld Mixer. An adjustable
rate strobe light was used to determine the rotational speeds for the various settings on
the handheld mixer. To do this, a piece of white tape was attached to a fin of one paddle
and a piece of orange tape was placed on the other paddle. The mixer was then started
and the strobe light was adjusted to flash at different rates until the tape on the paddles
appeared to stop moving. It was also noted that each fin appeared to stop when the proper
rate was set on the light. This rate was read in RPMs from the dial used to adjust the
flashing rate. The rates determined were between 390 and 700 RPM, which is a
reasonable result for this appliance. Judgment had to be used to make sure that higher or
lower speeds were not taken to be the actual speed of the blender, since the stopped-
movement appearance can occur at higher or lower flashing rates on the strobe light that
would be unreasonable for this type of device.
3.4.3. Combined Mixing Procedure. The paste for the cube compressive
strength, semi-adiabatic calorimeter, and miniature slump tests was typically mixed in a
single batch. In order to mix the materials adequately and within the time requirements of

42
the tests being performed, a handheld kitchen mixer was used as recommended by Cost
(T. Cost, personal communication, April 10, 2011). As noted by Cost (2009), the use of
equipment and methods other than those given in ASTM C 305 can shorten mixing times
to as little as 60 seconds. In this study, the initial mixing of the paste batch was
performed in 90 seconds, which allowed the first miniature slump test to be performed at
two minutes after mixing began. The initial mixing consisted of adding the water to the
cementitious materials, allowing the cement to absorb the water for 10 seconds, mixing
for 20 seconds at Speed 2 (440 rpm), and then mixing for 60 seconds at Speed 6 (670
rpm). As noted by Kantro (1980), brief setting of the paste mixture can be avoided by
remixing the paste. This was done in this study by remixing the paste for 30 seconds at
Speed 2 prior to each miniature slump test. The calorimeter specimens were prepared and
inserted into the calorimeter after the 5-minute miniature slump test, which allowed for
early data collection, and the cube specimens were molded after the 15-minute miniature
slump test, so that molding began within 2 minutes and 30 seconds after remixing. In
Table 3.8, on the following page, the complete sequence of testing can be seen.
In some cases, not all of the tests were performed using a single batch of paste.
For these cases, the same mixing and remixing sequences were followed with the tests
being performed at their respective times in the combined mixing procedure.
3.4.4. Cube Compressive Strength. All of the cube molds were sealed with
vacuum grease to prevent the paste from leaking. Excess vacuum grease was removed
from the interior of the molds to avoid deforming the shape of the cubes. The mixing
procedure for the paste followed the combined mixing procedure, which was discussed
previously, using the handheld mixer.

43
Table 3.8. Combined Mixing Procedure Sequence
Elapsed Time (mm:ss)
Action
0:00 Add water to mixing bowl with cementitious materials Record Time (Start Time)
0:10 Start mixing at Speed 2 (440 RPM)
0:30 Start mixing at Speed 6 (670 RPM)
1:30 Stop Mixing Record Temperature of Paste Prepare mini-slump test
2:00 Lift mini-slump cone
4:00 Remix paste at Speed 2
4:30 Prepare mini-slump test
5:00 Lift mini-slump cone Prepare calorimeter specimens Insert calorimeter specimens in F-Cal 4000
10:00 Close and latch the lid of the F-Cal 4000
13:00 Remix paste at Speed 2
13:30 Prepare mini-slump test
15:00 Lift mini-slump cone Mold cement cubes
28:00 Remix paste at Speed 2
28:30 Prepare mini-slump test
30:00 Lift mini-slump cone
43:00 Remix paste at Speed 2
43:30 Prepare mini-slump test
45:00 Lift mini-slump cone
60:00 Measure and record mini-slump diameters

44
The molding of the specimens followed the filling, tamping, and leveling
procedures outlined in ASTM C 109 with a deviation of the time at which molding
began. ASTM C 109 states that specimen molding should begin within two minutes and
30 seconds after completion of the original mixing of the batch. In this study, molding
started after completion of the 15-minute miniature slump test, which would mean that
molding started approximately fourteen minutes after completion of the initial mixing.
However, this molding time was within two minutes and 30 seconds after completion of
the remixing for the 15-minute miniature slump test. Also, it was noted that the paste at
this time was sufficiently fluid to allow for complete consolidation. Following the
completion of the molding procedures, the specimens were placed in the moist room.
Further details on mold removal and specimen storage can be found in the “Compressive
Strength of Cement Cubes” procedure in Appendix A.
The compressive strengths of the cubes were tested on the Tinius-Olsen load
frame at a load rate of 200 pounds/second, which is within the range allowed by ASTM C
109. Prior to loading the specimens, the molded faces of the cubes that were to be loaded,
were sanded to provide plane loading surfaces. The loading faces of the cubes and the
load platens were cleaned of any debris prior to the start of loading.
The complete test procedure is titled “Compressive Strength of Cement Cubes”
and is included in Appendix A.
3.4.5. Semi-adiabatic Calorimetry. Semi-adiabatic calorimetry was performed
for the paste mixtures using an F-Cal 4000 calorimeter with CalCommander software
from Calmetrix. Three paste specimens were inserted into the F-Cal 4000 for each
mixture, with one receptacle containing an inert specimen. It was decided that three

45
specimens should be used for each mixture, instead of testing multiple mixtures
simultaneously, so that the results for a given specimen would not be affected by the
temperature rise of other specimens with different compositions. The inert specimen
consisted of high-silica sand and deionized water with a water-to-sand ratio equal to the
water-to-cementitious materials ratio of 0.40 and mass similar to the paste specimens.
The use of a water and sand combination is intended to better simulate the thermal
conductivity of the paste specimens, when compared to a dry sand inert specimen (T.
Cost, personal communication, April 10, 2011). The mass of the inert specimen was
1250.0 grams and the masses of the paste specimens were 1250.0 grams with a tolerance
of 10.0 grams. This mass is recommended in the F-Cal 4000/8000 User Manual and fills
approximately one-third of the cylinder’s volume. As noted in a draft ASTM for
evaluating hydration using thermal measurements (2011), the “masses of all specimens
that will be compared with each other shall not differ by more than 5%”. A tolerance of
10.0 grams was chosen because it was within this range, was easily accomplished, and
could lessen the variability between specimens when compared to specimens differing in
mass by 5%.
Once logging in the F-Cal 4000 was complete, the data was retrieved using the
CalCommader software. From the software, the data for each logging channel was
exported as a separate Text Document (.txt) file. These were then imported into
Microsoft Excel and the Signal-to-Noise ratio (S/N) was calculated for each of the three
specimens. The Signal is the difference between the highest and lowest temperatures
recorded for the sample being tested. The Noise is the difference between the highest and
lowest temperatures recorded for the inert specimen. Figure 3.9, below, shows an

46
example of the temperature versus time curves resulting from the raw data for a typical
hydrating cement paste sample and corresponding inert specimen. The Signal and Noise
quantities are indicated in the figure. Use of this data will be discussed in a later section.
Figure 3.9. Examples of Signal and Noise Quantities
Cost (2009) noted that the curve generated for the inert specimen should be
subtracted from the curve for the hydrating specimen, so that the resulting data represents
only the heat evolution of the sample and not variances in the ambient temperature. Cost
designated this quantity as ΔT, which is shown below in Figure 3.10. In this study, the
curves for the three specimens were averaged to result in a single hydration curve for

47
each paste mixture. The curve for the inert specimen was then subtracted from this
averaged curve to result in a corrected average hydration curve.
Figure 3.10. Representation of the ΔT Quantity
This corrected curve was then used to calculate predicted setting times using the
Fractions Method and Derivatives Method, as discussed by Sandberg and Liberman
(2007). For the Fractions Method, the main hydration response rise (M) is calculated,
which is the difference between the peak temperature of the main hydration curve and the
lowest temperature during the dormant period, and then two percentage values of the
main hydration response rise are chosen to represent the initial and final set times. For

48
this study, 20% of the main response was chosen for initial set and 50% was chosen for
final set. A representation of the calculated values for the Fractions Method is shown
below in Figure 3.11. For the Derivatives Method, initial set is taken as the time when the
maximum second derivative of the main hydration curve occurs and final set is taken as
the time when the maximum first derivative of the main hydration curve occurs.
Figure 3.11. Example of Setting Time Prediction by the Fractions Method
The complete semi-adiabatic calorimetry procedure, including data reduction, is
titled “Using the F-Cal 4000 & CalCommander Software for Testing Cement Paste” and
is included in Appendix A.

49
Before testing began, a verification of the internal connections was performed, as
suggested in the F-Cal 4000/8000 User Manual, to ensure that the connections had not
been damaged during shipping. This was done by filling four cylinders with water at
110°F and inserting them into the F-Cal 4000. After thirty minutes, the temperature
reading was checked for each of the sensors to ensure that no two sensors differed by
more than 2°F.
3.4.6. Miniature Slump. The paste for the miniature slump test was mixed
according to the combined mixing procedure previously discussed. The test was
performed at 2, 5, 15, 30, and 45 minutes, as was done by Bhattacharja and Tang (2001).
The tests at 2 and 5 minutes were performed 30 seconds after the end of mixing or
remixing. The tests at 15, 30, and 45 minutes were performed one minute and 30 seconds
after the end of remixing to allow for a longer period to fill the cone, which was needed
for stiffer mixtures.
The cones were placed on thin plastic discs, as suggested by Bhattacharja and
Tang (2001), to prevent leaking from the bottom of the cone. The discs had diameters of
two inches and were cut from Zip-Lock sandwich bags.
Previous research (Kantro, 1980; Bhattacharja & Tang, 2001), discussed the use
of a planimeter for measuring the area of the miniature slump pats. To do this, tracings of
the pats were made on paper and measured after the pats had hardened and were
removed. While this method gives more accurate results, time constraints and concerns
about variability introduced by the paper led to the use of diameter measurements for area
determination in this study, which has been found to be an accurate alternative for pat
areas that remain nearly circular. In this study, this method involved taking four diameter

50
measurements, separated by a rotation of 45 degrees, to obtain an average diameter from
which the area was calculated.
The diameter measurements were taken at 60 minutes after the start of mixing.
This time was chosen to allow the later miniature slump tests time to stabilize without
allowing sufficient time for the results of the earlier tests to be affected by shrinkage from
hydration and drying.
The complete test procedure, which was adapted from the procedures given by
Kantro (1980) and Bhattacharja & Tang (2001), is titled “Miniature Slump Cone” and is
included in Appendix A.
3.4.7. Normal Consistency and Vicat Time of Setting. The paste for the normal
consistency test was mixed according the Procedure for Mixing Pastes given in ASTM C
305 with one deviation. In this study, the bowl and paddle were wetted before mixing
commenced to provide a more constant surface condition of these items when multiple
tests were run in succession. Care was taken to ensure that excess water was not present,
which would affect the normal consistency results. Following the mixing procedure,
normal consistency was determined according to ASTM C 187.
The paste from the normal consistency test was used to determine the time of
setting by the Vicat method according to ASTM C 191 with one deviation. The specimen
was kept in the moist room between penetration measurements and was covered with a
plastic sheet while in the moist room to prevent damage to the surface of the specimen
from dripping water. Similar modifications to ASTM C 191 have been made by other
researchers (Bentz & Ferraris, 2010) to prevent evaporation from the surface of the
specimen during the test.

51
For specimens that experienced initial set prior to the first penetration reading at
30 minutes, a penetration of 40 millimeters was assumed at time zero. This made possible
the interpolation of initial set at a penetration of 25 millimeters, as described in ASTM C
191.
The complete test procedure is titled “Time of Setting by Vicat Needle” and is
included in Appendix A.

52
4. RESULTS AND DISCUSSION
4.1 SCREENING STUDY RESULTS
In the Screening Study, paste mixtures were made from the five Type I or I/II
cements, each in combination with the five Class C fly ashes at the 0, 25, 50, and 70
percent replacement levels. Testing of the paste in the Screening Study included cube
compressive strength at one and 28 days, semi-adiabatic calorimetry, miniature slump,
and Vicat setting time.
4.1.1. Cube Compressive Strength. The three cube compressive strength test
results for each mixture were analyzed for outliers using ASTM E 178. Once the analysis
indicated that a value was a possible outlier, the decision was made whether or not to
remove the value from the data using the following criteria:
1. If two of the tests where identical or extremely similar, the ASMT E 178 analysis
indicated that the other value was an outlier, even though it was reasonably close
to the other two values. In this case, the indicated outlier was not considered to be
an actual outlier.
2. Due to the nature of compressive strength testing, it is unlikely that an error in the
procedure would occur which would result in an unreasonably high value.
Because of this, high values, which were indicated to be outliers by the ASTM E
178 analysis, were generally not considered to be actual outliers.
3. In some cases, a value barely crossed the threshold of the ASTM E 178 analysis
to be considered an outlier. In these cases, judgment was used to determine

53
whether the value was an actual outlier, by considering other factors such as
standard deviation and overall magnitude of the values.
If no values were removed, the three results were averaged to obtain the cube
compressive strength for the given mixture. If a value was determined to be an outlier,
the cube compressive strength was taken as the average of the two remaining values. In
the following outlier analysis tables, values that were discarded as actual outliers have
been bolded and the cells containing the values have been shaded.
The outlier analyses for the one and 28 day cube strengths for the Cement 1
combinations are given below in Tables 4.1 and 4.2, respectively. The ASTM E 178
analysis indicated three possible outliers, but only one value, Test 3 of the 28-day tests
for combination 1-2 with 50 percent fly ash replacement, was considered to be an actual
outlier.

54
Table 4.1. 1-Day Cube Strength Outlier Analysis for Cement 1 Combinations
Cement Fly Ash(%) (%) Test 1 Test 2 Test 3 Avg.
Baseline 1 100 0 4917 4145 5018 4693 478 3 5018 4145 1.153 0.680 1.148 NO NO 46931-1 75 25 2727 2709 2979 2805 151 3 2979 2709 1.153 1.152 0.639 NO NO 28051-1 50 50 1176 1274 1288 1246 61 3 1288 1176 1.153 0.688 1.147 NO NO 12461-1 30 70 341 347 310 332 20 3 347 310 1.153 0.720 1.142 NO NO 3321-2 75 25 2925 2840 2878 2881 43 3 2925 2840 1.153 1.035 0.961 NO NO 28811-2 50 50 594 616 619 610 13 3 619 594 1.153 0.677 1.149 NO NO 6101-2 30 70 37 42 42 40 3 3 42 37 1.153 0.625 1.153 NO YES 401-3 75 25 2790 2708 2825 2774 60 3 2825 2708 1.153 0.849 1.102 NO NO 27741-3 50 50 626 656 683 655 29 3 683 626 1.153 0.982 1.017 NO NO 6551-3 30 70 21 11 16 16 5 3 21 11 1.153 1.000 1.000 NO NO 161-4 75 25 2803 2753 2745 2767 31 3 2803 2745 1.153 1.145 0.703 NO NO 27671-4 50 50 334 328 343 335 7 3 343 328 1.153 1.061 0.926 NO NO 3351-4 30 70 66 70 68 68 2 3 70 66 1.153 0.982 1.017 NO NO 681-5 75 25 2802 2993 2977 2924 105 3 2993 2802 1.153 0.653 1.151 NO NO 29241-5 50 50 497 538 510 515 21 3 538 497 1.153 1.099 0.855 NO NO 5151-5 30 70 101 101 96 100 3 3 101 96 1.153 0.620 1.154 NO YES 100
σAverage Cube Strength (psi)
Outlier AnalysisCombination
ProportionsCube Strengths (psi)
OutlierMIN?OutlierMAX?tMINtMAXtCRITMin.Max.n
54

55
Table 4.2. 28-Day Cube Strength Outlier Analysis for Cement 1 Combinations
Cement Fly Ash(%) (%) Test 1 Test 2 Test 3 Avg.
Baseline 1 100 0 11237 11165 11500 11300 176 3 11500 11165 1.153 1.131 0.769 NO NO 113001-1 75 25 10566 11657 10754 10992 583 3 11657 10566 1.153 1.140 0.730 NO NO 109921-1 50 50 8354 8021 7361 7912 506 3 8354 7361 1.153 0.874 1.090 NO NO 79121-1 30 70 3984 4299 4039 4108 168 3 4299 3984 1.153 1.139 0.733 NO NO 41081-2 75 25 10153 9645 9979 9925 258 3 10153 9645 1.153 0.880 1.087 NO NO 99251-2 50 50 7980 7997 7636 7871 204 3 7997 7636 1.153 0.618 1.154 NO YES 79891-2 30 70 4084 3956 4213 4084 128 3 4213 3956 1.153 1.002 0.998 NO NO 40841-3 75 25 11641 10060 10407 10703 831 3 11641 10060 1.153 1.129 0.774 NO NO 107031-3 50 50 7641 8195 7787 7874 287 3 8195 7641 1.153 1.117 0.813 NO NO 78741-3 30 70 2522 2450 2455 2475 40 3 2522 2450 1.153 1.152 0.638 NO NO 24751-4 75 25 9565 9396 10706 9889 712 3 10706 9396 1.153 1.147 0.692 NO NO 98891-4 50 50 8588 8695 9127 8803 285 3 9127 8588 1.153 1.134 0.755 NO NO 88031-4 30 70 5809 6234 6069 6037 214 3 6234 5809 1.153 0.918 1.066 NO NO 60371-5 75 25 11121 11438 11468 11342 192 3 11468 11121 1.153 0.656 1.151 NO NO 113421-5 50 50 8354 8073 8543 8323 236 3 8543 8073 1.153 0.930 1.058 NO NO 83231-5 30 70 5556 5782 5727 5688 118 3 5782 5556 1.153 0.797 1.122 NO NO 5688
CombinationProportions Outlier Analysis
Average Cube Strength (psi)
Cube Strengths (psi)σ n Max. Min. tCRIT tMAX tMIN OutlierMAX? OutlierMIN?
55

56
Figure 4.1, given below, shows the cube strengths after one day for Cement 1 in
combination with each fly ash. As can be seen, the strength decreased significantly with
increasing fly ash replacement levels.
Figure 4.1. One-day Compressive Strengths for Cement 1 Combinations
Figure 4.2, below, shows the cube strengths after 28 days for Cement 1 in
combination with each fly ash. The mixtures with 25 percent fly ash replacement
generally show strengths comparable to the baseline and the combination with 25 percent
of Fly Ash 5 exceeds the baseline strength by about 40 psi. The 70 percent fly ash
mixtures show strengths much lower than the baseline, though not as severely as at one
day.

57
Figure 4.2. 28-day Compressive Strengths for Cement 1 Combinations
The outlier analyses for the one and 28 day cube strengths for the Cement 2
combinations are given, below, in Tables 4.3 and 4.4, respectively. The ASTM E 178
analysis indicated five possible outliers, but none of these were discarded as actual
outliers.

58
Table 4.3. 1-Day Cube Strength Outlier Analysis for Cement 2 Combinations
Cement Fly Ash(%) (%) Test 1 Test 2 Test 3 Avg.
Baseline 2 100 0 4353 4527 4807 4562 229 3 4807 4353 1.153 1.068 0.914 NO NO 45622-1 75 25 2809 2702 2657 2722 78 3 2809 2657 1.153 1.106 0.840 NO NO 27222-1 50 50 1050 1055 1178 1094 73 3 1178 1050 1.153 1.154 0.615 YES NO 10942-1 30 70 398 407 415 407 9 3 415 398 1.153 0.975 1.023 NO NO 4072-2 75 25 2325 2586 2562 2491 144 3 2586 2325 1.153 0.659 1.151 NO NO 24912-2 50 50 929 944 930 934 8 3 944 929 1.153 1.154 0.608 YES NO 9342-2 30 70 168 186 179 178 9 3 186 168 1.153 0.886 1.084 NO NO 1782-3 75 25 2219 2338 2407 2321 95 3 2407 2219 1.153 0.900 1.077 NO NO 23212-3 50 50 827 873 813 837 31 3 873 813 1.153 1.122 0.796 NO NO 8372-3 30 70 64 60 63 62 2 3 64 60 1.153 0.878 1.089 NO NO 622-4 75 25 2677 2645 2649 2657 17 3 2677 2645 1.153 1.149 0.674 NO NO 26572-4 50 50 1052 1063 1041 1052 11 3 1063 1041 1.153 1.012 0.987 NO NO 10522-4 30 70 90 93 88 90 3 3 93 88 1.153 1.039 0.956 NO NO 902-5 75 25 2580 2416 2635 2544 114 3 2635 2416 1.153 0.801 1.121 NO NO 25442-5 50 50 1103 1071 1100 1091 18 3 1103 1071 1.153 0.673 1.149 NO NO 10912-5 30 70 289 288 277 285 7 3 289 277 1.153 0.667 1.150 NO NO 285
tCRIT tMAX tMIN OutlierMAX? OutlierMIN?Cube Strengths (psi)
σ n Max. Min.Combination
Proportions Outlier AnalysisAverage Cube Strength (psi)
58
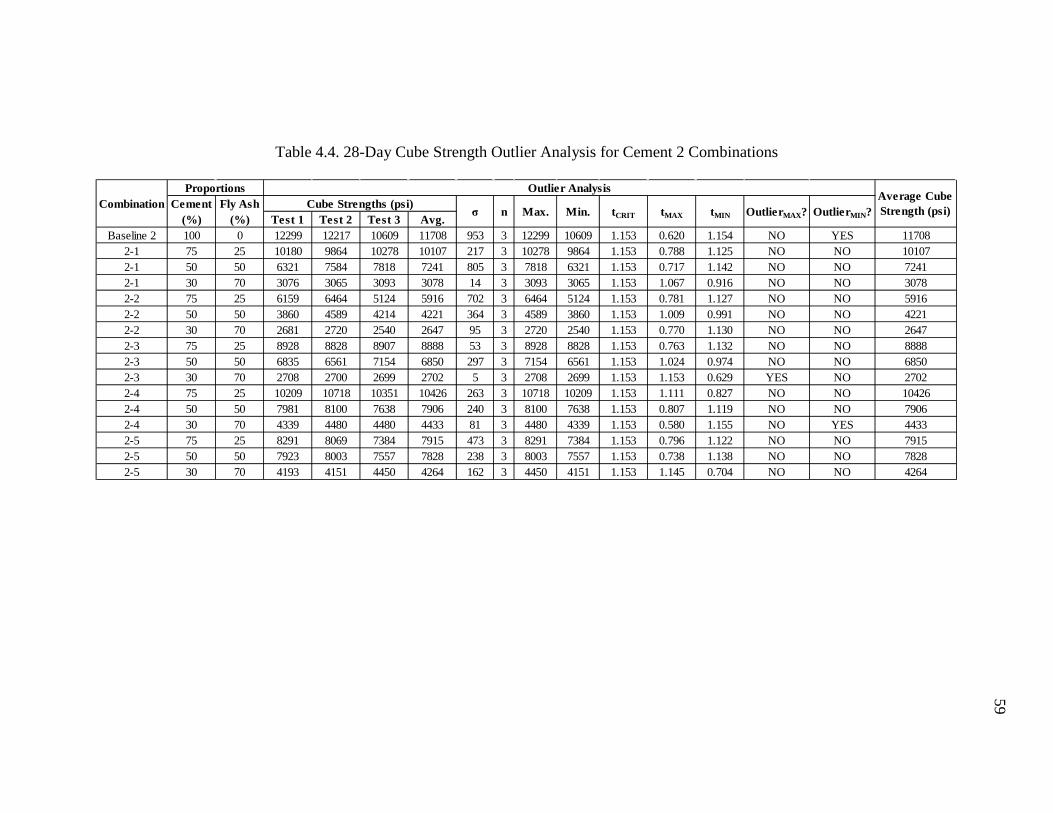
59
Table 4.4. 28-Day Cube Strength Outlier Analysis for Cement 2 Combinations
Cement Fly Ash(%) (%) Test 1 Test 2 Test 3 Avg.
Baseline 2 100 0 12299 12217 10609 11708 953 3 12299 10609 1.153 0.620 1.154 NO YES 117082-1 75 25 10180 9864 10278 10107 217 3 10278 9864 1.153 0.788 1.125 NO NO 101072-1 50 50 6321 7584 7818 7241 805 3 7818 6321 1.153 0.717 1.142 NO NO 72412-1 30 70 3076 3065 3093 3078 14 3 3093 3065 1.153 1.067 0.916 NO NO 30782-2 75 25 6159 6464 5124 5916 702 3 6464 5124 1.153 0.781 1.127 NO NO 59162-2 50 50 3860 4589 4214 4221 364 3 4589 3860 1.153 1.009 0.991 NO NO 42212-2 30 70 2681 2720 2540 2647 95 3 2720 2540 1.153 0.770 1.130 NO NO 26472-3 75 25 8928 8828 8907 8888 53 3 8928 8828 1.153 0.763 1.132 NO NO 88882-3 50 50 6835 6561 7154 6850 297 3 7154 6561 1.153 1.024 0.974 NO NO 68502-3 30 70 2708 2700 2699 2702 5 3 2708 2699 1.153 1.153 0.629 YES NO 27022-4 75 25 10209 10718 10351 10426 263 3 10718 10209 1.153 1.111 0.827 NO NO 104262-4 50 50 7981 8100 7638 7906 240 3 8100 7638 1.153 0.807 1.119 NO NO 79062-4 30 70 4339 4480 4480 4433 81 3 4480 4339 1.153 0.580 1.155 NO YES 44332-5 75 25 8291 8069 7384 7915 473 3 8291 7384 1.153 0.796 1.122 NO NO 79152-5 50 50 7923 8003 7557 7828 238 3 8003 7557 1.153 0.738 1.138 NO NO 78282-5 30 70 4193 4151 4450 4264 162 3 4450 4151 1.153 1.145 0.704 NO NO 4264
Outlier AnalysisAverage Cube Strength (psi)Cube Strengths (psi)
σ n Max. Min. tCRIT tMAX tMIN OutlierMAX? OutlierMIN?Combination
Proportions
59
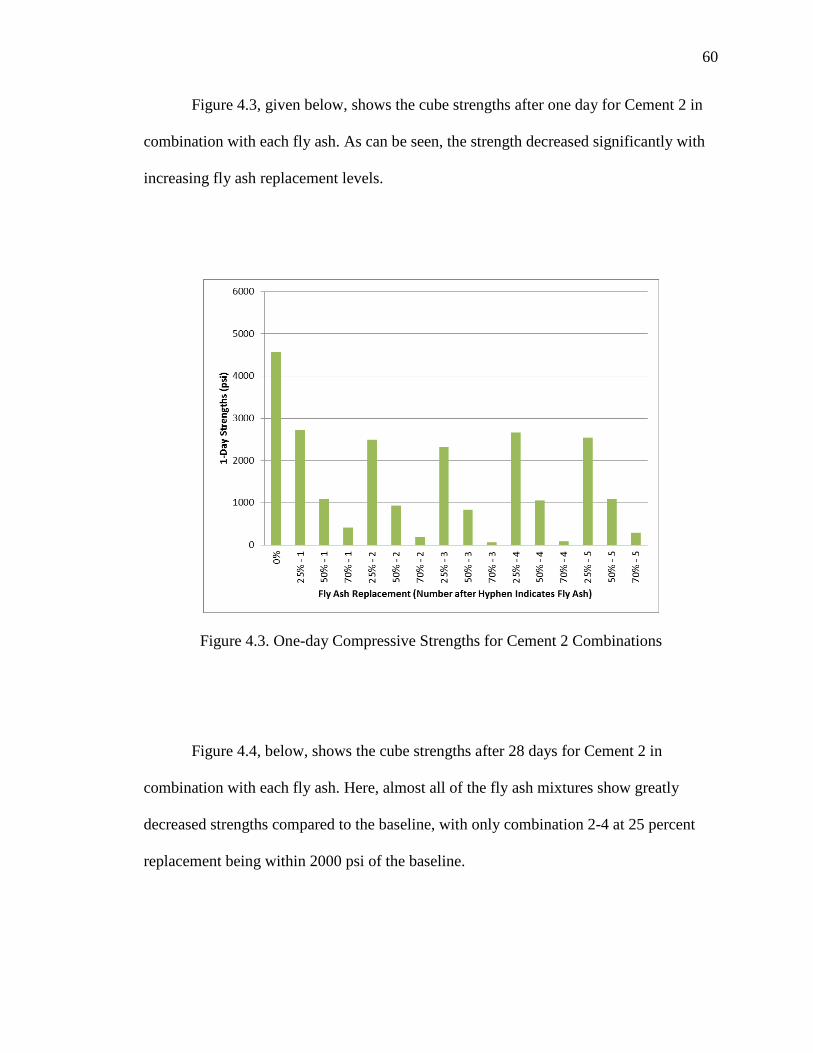
60
Figure 4.3, given below, shows the cube strengths after one day for Cement 2 in
combination with each fly ash. As can be seen, the strength decreased significantly with
increasing fly ash replacement levels.
Figure 4.3. One-day Compressive Strengths for Cement 2 Combinations
Figure 4.4, below, shows the cube strengths after 28 days for Cement 2 in
combination with each fly ash. Here, almost all of the fly ash mixtures show greatly
decreased strengths compared to the baseline, with only combination 2-4 at 25 percent
replacement being within 2000 psi of the baseline.

61
Figure 4.4. 28-day Compressive Strengths for Cement 2 Combinations
The outlier analyses for the one and 28 day cube strengths for the Cement 3
combinations are given, below, in Tables 4.5 and 4.6, respectively. The ASTM E 178
analysis indicated two possible outliers, but neither of these where discarded as actual
outliers.

62
Table 4.5. 1-Day Cube Strength Outlier Analysis for Cement 3 Combinations
Cement Fly Ash(%) (%) Test 1 Test 2 Test 3 Avg.
Baseline 3 100 0 5052 5406 5088 5182 195 3 5406 5052 1.153 1.150 0.666 NO NO 51823-1 75 25 3124 3135 3287 3182 91 3 3287 3124 1.153 1.153 0.633 NO NO 31823-1 50 50 1233 1300 1281 1271 35 3 1300 1233 1.153 0.837 1.107 NO NO 12713-1 30 70 289 316 319 308 16 3 319 289 1.153 0.681 1.148 NO NO 3083-2 75 25 3300 3746 3519 3522 223 3 3746 3300 1.153 1.007 0.993 NO NO 35223-2 50 50 795 814 802 804 9 3 814 795 1.153 1.064 0.920 NO NO 8043-2 30 70 58 53 55 55 3 3 58 53 1.153 1.024 0.974 NO NO 553-3 75 25 3152 2987 3324 3154 169 3 3324 2987 1.153 1.006 0.994 NO NO 31543-3 50 50 912 923 915 917 5 3 923 912 1.153 1.124 0.792 NO NO 9173-3 30 70 23 24 21 22 1 3 24 21 1.153 0.908 1.072 NO NO 223-4 75 25 3336 3005 2983 3108 198 3 3336 2983 1.153 1.153 0.632 NO NO 31083-4 50 50 316 353 347 339 20 3 353 316 1.153 0.715 1.143 NO NO 3393-4 30 70 137 141 140 139 2 3 141 137 1.153 0.926 1.060 NO NO 1393-5 75 25 3413 3262 3310 3329 77 3 3413 3262 1.153 1.098 0.859 NO NO 33293-5 50 50 936 930 911 926 13 3 936 911 1.153 0.785 1.126 NO NO 9263-5 30 70 141 131 140 137 5 3 141 131 1.153 0.645 1.152 NO NO 137
Outlier AnalysisAverage Cube Strength (psi)Cube Strengths (psi)
σ n Max. Min. tCRIT tMAX tMIN OutlierMAX? OutlierMIN?Combination
Proportions
62

63
Table 4.6. 28-Day Cube Strength Outlier Analysis for Cement 3 Combinations
Cement Fly Ash(%) (%) Test 1 Test 2 Test 3 Avg.
Baseline 3 100 0 12430 11309 11679 11806 571 3 12430 11309 1.153 1.092 0.870 NO NO 118063-1 75 25 9235 10653 9769 9886 716 3 10653 9235 1.153 1.072 0.908 NO NO 98863-1 50 50 7068 6931 6979 6993 69 3 7068 6931 1.153 1.084 0.886 NO NO 69933-1 30 70 3647 4595 4715 4319 585 3 4715 3647 1.153 0.677 1.149 NO NO 43193-2 75 25 10797 10371 10376 10514 244 3 10797 10371 1.153 1.155 0.588 YES NO 105143-2 50 50 6864 7011 6278 6718 388 3 7011 6278 1.153 0.757 1.134 NO NO 67183-2 30 70 3768 3832 3855 3818 45 3 3855 3768 1.153 0.814 1.116 NO NO 38183-3 75 25 9491 10100 9438 9676 368 3 10100 9438 1.153 1.152 0.648 NO NO 96763-3 50 50 6730 6798 6911 6813 91 3 6911 6730 1.153 1.071 0.909 NO NO 68133-3 30 70 2326 2383 2346 2351 29 3 2383 2326 1.153 1.086 0.882 NO NO 23513-4 75 25 10871 10499 9894 10421 493 3 10871 9894 1.153 0.912 1.069 NO NO 104213-4 50 50 7450 7688 7937 7692 243 3 7937 7450 1.153 1.007 0.993 NO NO 76923-4 30 70 5019 5644 5396 5353 315 3 5644 5019 1.153 0.925 1.061 NO NO 53533-5 75 25 8594 9648 8732 8991 573 3 9648 8594 1.153 1.146 0.694 NO NO 89913-5 50 50 5824 6302 6048 6058 239 3 6302 5824 1.153 1.020 0.978 NO NO 60583-5 30 70 5455 5451 5522 5476 40 3 5522 5451 1.153 1.154 0.620 YES NO 5476
Outlier AnalysisAverage Cube Strength (psi)Cube Strengths (psi)
σ n Max. Min. tCRIT tMAX tMIN OutlierMAX? OutlierMIN?Combination
Proportions
63

64
The cube strengths at one day for combinations with Cement 3 are shown below
in Figure 4.5. It can be seen that the strength decreased significantly with increasing fly
ash replacement levels.
Figure 4.5. One-day Compressive Strengths for Cement 3 Combinations
Figure 4.6, below, shows the cube strengths after 28 days for Cement 3 in
combination with each fly ash. These combinations show decreasing strength with
increasing fly ash replacement, though not as severely as some of the combinations with
Cement 2.

65
Figure 4.6. 28-day Compressive Strengths for Cement 3 Combinations
The outlier analyses for the one and 28 day cube strengths for the Cement 4
combinations are given, below, in Tables 4.7 and 4.8, respectively. The ASTM E 178
analysis indicated five possible outliers. Only Test 2 of the 1-day strengths for
combination 4-4 with 25 percent fly ash was discarded as an actual outlier.

66
Table 4.7. 1-Day Cube Strength Outlier Analysis for Cement 4 Combinations
Cement Fly Ash(%) (%) Test 1 Test 2 Test 3 Avg.
Baseline 4 100 0 4037 4280 4025 4114 144 3 4280 4025 1.153 1.154 0.620 YES NO 41144-1 75 25 3757 3799 3458 3671 186 3 3799 3458 1.153 0.686 1.147 NO NO 36714-1 50 50 1925 1966 1914 1935 27 3 1966 1914 1.153 1.133 0.758 NO NO 19354-1 30 70 678 628 689 665 32 3 689 628 1.153 0.742 1.137 NO NO 6654-2 75 25 3625 3632 3618 3625 7 3 3632 3618 1.153 1.006 0.994 NO NO 36254-2 50 50 1298 1346 1261 1302 42 3 1346 1261 1.153 1.040 0.954 NO NO 13024-2 30 70 286 271 274 277 8 3 286 271 1.153 1.137 0.743 NO NO 2774-3 75 25 2973 3503 3216 3230 265 3 3503 2973 1.153 1.027 0.971 NO NO 32304-3 50 50 1376 1357 1358 1364 11 3 1376 1357 1.153 1.151 0.656 NO NO 13644-3 30 70 320 308 320 316 7 3 320 308 1.153 0.587 1.155 NO YES 3164-4 75 25 3601 3151 3614 3455 264 3 3614 3151 1.153 0.600 1.154 NO YES 36084-4 50 50 1511 1498 1440 1483 38 3 1511 1440 1.153 0.736 1.138 NO NO 14834-4 30 70 333 341 321 332 10 3 341 321 1.153 0.926 1.060 NO NO 3324-5 75 25 3807 3761 3782 3783 23 3 3807 3761 1.153 1.019 0.979 NO NO 37834-5 50 50 1617 1755 1693 1688 69 3 1755 1617 1.153 0.965 1.031 NO NO 16884-5 30 70 535 527 536 533 5 3 536 527 1.153 0.630 1.153 NO YES 533
OutlierMIN?Min. tCRIT tMAX tMIN OutlierMAX?Combination
Proportions Outlier AnalysisAverage Cube Strength (psi)Cube Strengths (psi)
σ n Max.
66

67
Table 4.8. 28-Day Cube Strength Outlier Analysis for Cement 4 Combinations
Cement Fly Ash(%) (%) Test 1 Test 2 Test 3 Avg.
Baseline 4 100 0 11479 11002 11303 11261 241 3 11479 11002 1.153 0.903 1.075 NO NO 112614-1 75 25 10736 10658 10210 10535 284 3 10736 10210 1.153 0.709 1.144 NO NO 105354-1 50 50 8562 8701 8238 8500 238 3 8701 8238 1.153 0.843 1.105 NO NO 85004-1 30 70 4246 4231 3954 4144 164 3 4246 3954 1.153 0.623 1.153 NO YES 41444-2 75 25 10180 10425 9554 10053 449 3 10425 9554 1.153 0.829 1.111 NO NO 100534-2 50 50 7813 8023 8192 8009 190 3 8192 7813 1.153 0.962 1.034 NO NO 80094-2 30 70 3917 3893 3715 3842 110 3 3917 3715 1.153 0.682 1.148 NO NO 38424-3 75 25 10102 9943 9719 9921 192 3 10102 9719 1.153 0.938 1.052 NO NO 99214-3 50 50 7953 7849 7744 7849 105 3 7953 7744 1.153 0.997 1.003 NO NO 78494-3 30 70 2884 2913 2893 2897 15 3 2913 2884 1.153 1.100 0.855 NO NO 28974-4 75 25 11129 10070 10897 10698 556 3 11129 10070 1.153 0.773 1.129 NO NO 106984-4 50 50 7924 8464 7878 8088 326 3 8464 7878 1.153 1.152 0.646 NO NO 80884-4 30 70 4877 5012 4971 4953 69 3 5012 4877 1.153 0.851 1.102 NO NO 49534-5 75 25 10048 10812 10716 10525 416 3 10812 10048 1.153 0.689 1.147 NO NO 105254-5 50 50 8153 7880 8412 8148 266 3 8412 7880 1.153 0.991 1.008 NO NO 81484-5 30 70 4907 4943 4929 4926 18 3 4943 4907 1.153 0.925 1.061 NO NO 4926
Outlier AnalysisAverage Cube Strength (psi)Cube Strengths (psi)
σ n Max. Min. tCRIT tMAX tMIN OutlierMAX? OutlierMIN?Combination
Proportions
67

68
Figure 4.7, below, shows the cube strengths after one day for Cement 4 in
combination with each fly ash. The 25 percent combinations do not show as great of a
decrease from the baseline compared to the 25 percent combinations with other cements.
It should also be noted that the baseline mixture for Cement 4 had the lowest strength of
all the baseline mixtures.
Figure 4.7. One-day Compressive Strengths for Cement 4 Combinations
The cube strengths at 28 days for combinations with Cement 4 are shown, below,
in Figure 4.8. Here, the 25 percent fly ash mixtures show strengths within 1500 psi of the
baseline. The 70 percent fly ash combinations continue to show significantly decreased
strengths, when compared to the baseline.

69
Figure 4.8. 28-day Compressive Strengths for Cement 4 Combinations
The outlier analyses for the one and 28 day cube strengths for the Cement 5
combinations are given, below, in Tables 4.9 and 4.10, respectively. The ASTM E 178
analysis indicated three possible outliers. Only Test 2 of the 28-day tests for combination
5-2 with 50 percent fly ash was discarded as an actual outlier.

70
Table 4.9. 1-Day Cube Strength Outlier Analysis for Cement 5 Combinations
Cement Fly Ash(%) (%) Test 1 Test 2 Test 3 Avg.
Baseline 5 100 0 4963 4588 4894 4815 200 3 4963 4588 1.153 0.741 1.137 NO NO 48155-1 75 25 3196 3028 3209 3144 101 3 3209 3028 1.153 0.637 1.153 NO NO 31445-1 50 50 1380 1408 1433 1407 26 3 1433 1380 1.153 0.983 1.017 NO NO 14075-1 30 70 610 595 631 612 18 3 631 595 1.153 1.044 0.949 NO NO 6125-2 75 25 3054 3308 2845 3069 232 3 3308 2845 1.153 1.030 0.967 NO NO 30695-2 50 50 934 1012 1049 998 59 3 1049 934 1.153 0.862 1.096 NO NO 9985-2 30 70 192 198 189 193 5 3 198 189 1.153 1.100 0.854 NO NO 1935-3 75 25 2735 2832 2663 2743 85 3 2832 2663 1.153 1.045 0.948 NO NO 27435-3 50 50 874 852 847 858 14 3 874 847 1.153 1.139 0.733 NO NO 8585-3 30 70 109 102 104 105 3 3 109 102 1.153 1.133 0.759 NO NO 1055-4 75 25 2941 3034 2928 2968 58 3 3034 2928 1.153 1.147 0.687 NO NO 29685-4 50 50 1086 1094 1124 1101 20 3 1124 1086 1.153 1.132 0.763 NO NO 11015-4 30 70 96 98 106 100 5 3 106 96 1.153 1.147 0.689 NO NO 1005-5 75 25 3065 3014 3210 3096 102 3 3210 3014 1.153 1.119 0.808 NO NO 30965-5 50 50 1207 1175 1159 1180 24 3 1207 1159 1.153 1.088 0.880 NO NO 11805-5 30 70 310 334 330 325 13 3 334 310 1.153 0.729 1.140 NO NO 325
Outlier AnalysisAverage Cube Strength (psi)Cube Strengths (psi)
σ n Max. Min. tCRIT tMAX tMIN OutlierMAX? OutlierMIN?Combination
Proportions
70

71
Table 4.10. 28-Day Cube Strength Outlier Analysis for Cement 5 Combinations
Cement Fly Ash(%) (%) Test 1 Test 2 Test 3 Avg.
Baseline 5 100 0 12240 12086 12295 12207 109 3 12295 12086 1.153 0.811 1.117 NO NO 122075-1 75 25 11241 9997 12025 11087 1023 3 12025 9997 1.153 0.917 1.066 NO NO 110875-1 50 50 7990 8061 7964 8005 50 3 8061 7964 1.153 1.115 0.817 NO NO 80055-1 30 70 4230 4366 4366 4321 78 3 4366 4230 1.153 0.579 1.155 NO YES 43215-2 75 25 11486 10830 10416 10911 539 3 11486 10416 1.153 1.066 0.917 NO NO 109115-2 50 50 8006 7388 7997 7797 354 3 8006 7388 1.153 0.590 1.155 NO YES 80015-2 30 70 3775 3683 3732 3730 46 3 3775 3683 1.153 0.980 1.019 NO NO 37305-3 75 25 11659 11322 11462 11481 169 3 11659 11322 1.153 1.052 0.939 NO NO 114815-3 50 50 7747 7551 7809 7703 135 3 7809 7551 1.153 0.793 1.123 NO NO 77035-3 30 70 2398 2348 2490 2412 72 3 2490 2348 1.153 1.083 0.888 NO NO 24125-4 75 25 12625 11969 11644 12079 500 3 12625 11644 1.153 1.092 0.872 NO NO 120795-4 50 50 7813 7405 7656 7625 206 3 7813 7405 1.153 0.915 1.067 NO NO 76255-4 30 70 4133 3913 4010 4019 110 3 4133 3913 1.153 1.037 0.958 NO NO 40195-5 75 25 11871 11933 11217 11674 397 3 11933 11217 1.153 0.653 1.151 NO NO 116745-5 50 50 8807 8652 8716 8725 78 3 8807 8652 1.153 1.053 0.936 NO NO 87255-5 30 70 4324 4322 4281 4309 24 3 4324 4281 1.153 0.613 1.154 NO YES 4309
Outlier AnalysisAverage Cube Strength (psi)Cube Strengths (psi)
σ n Max. Min. tCRIT tMAX tMIN OutlierMAX? OutlierMIN?Combination
Proportions
71

72
Figure 4.9, below, shows the cube strengths after one day for Cement 5 in
combination with each fly ash. It can be seen that strength decreased significantly with
increasing fly ash replacement levels.
Figure 4.9. One-day Compressive Strengths for Cement 5 Combinations
The cube strengths at 28 days for combinations with Cement 5 are shown, below,
in Figure 4.10. The 25 percent fly ash combinations shows strengths within 1500 psi of
the baseline and the 25 percent combination with Fly Ash 4 is only 128 psi less than the
baseline. The 50 and 70 percent fly ash combinations continue to show significantly
decreased strength levels, compared to the baseline.

73
Figure 4.10. 28-day Compressive Strengths for Cement 5 Combinations
It can be seen from the results above that increasing fly ash contents leads to
significant reductions in one day strengths. While these strengths are still significantly
reduced at 28 days for mixtures with 50 and 70 percent fly ash, noticeable strength gain
has occurred since the testing at one day. At 28 days, all of the mixtures with 50 percent
fly ash had strengths between approximately 6000 and 8000 psi, except for Cement 2 in
combination with Fly Ash 2 which had a compressive strength closer to 4000 psi. This
shows that particular cement-fly ash combinations may perform much differently than
combinations of similar materials.
The strength gain behavior shown in the results above is typical for mixtures
containing a pozzolan and correlates well with the results of previous researchers (Jiang
et al., 1999; Bentz et al., 2010). During the first day, the pozzolanic reaction has not

74
begun to contribute to the strength of the paste. Between one and 28 days, the slow
pozzolanic reaction has begun to contribute to the strength of the paste. Also, if the
increased aluminate levels have created a sulfate imbalance, rapid aluminate hydration, in
combination with a lack of sulfate, may have led to much slower silicate hydration. This
would lead to significantly slower strength gain.
4.1.2. Semi-adiabatic Calorimetry. Calculations were performed on the raw
temperature log data, from the F-Cal 4000, as discussed in the Laboratory Investigation.
These included the calculation of the Signal-to-Noise Ratios (S/N) for the individual
temperature logs and the prediction of setting times by two methods.
The three Signal-to-Noise Ratios for each test were used as a measure of
resolution of the test and as a means of performing an outlier analysis on the temperature
logs. According to a draft ASTM for evaluating hydration using thermal measurements
(2011), the signal-to-noise ratio “shall be a minimum of 5.0.” While a few of the mixtures
had S/N less than 5.0, it was determined that this was due to low signal values resulting
from mixtures which produced little heat, rather than high levels of noise which would
have significantly affected the results. The outlier analysis was performed using ASTM E
178, which indicated three possible outliers. These values were indicated falsely as
outliers because the other two values in each data set were extremely similar. Due to this,
none of the values were discarded as outliers. The outlier analysis of the calorimetry
results can be found in Appendix B.
Following the evaluation of the S/N for each temperature log, the three logs were
averaged and then corrected for the inert specimen log to obtain the corrected average
thermal curve for each mixture. The values determined from the thermal curve for each

75
mixture included the maximum temperature rise (ΔTmax), the time at which the maximum
temperature rise occurs, and the main hydration response rise (M). The predicted initial
and final set times were also calculated by the Fractions Method and Derivatives Method.
These values are summarized in Tables 4.11 through 4.15, below, for each mixture.
As can be seen in these results, M decreases with increasing fly ash replacement
for most combinations. Two exceptions are combination 1-5 with 70 percent fly ash and
combination 3-5 with 70 percent fly ash.
The predicted final set by the Percentage Method is the time at which 50 percent
of the main hydration response rise has occurred. This value was used to compare the
placement of the curves with respect to time. For the most part, with increasing fly ash
replacement the predicted final set by the Percentage Method occurs at a later time for fly
ash replacements up to 50 percent. The only exception to this is combination 4-5 at 50
percent fly ash replacement, which has a predicted final set 22 minutes earlier than the
combination with 25 percent fly ash replacement. Many of the combinations with 70
percent fly ash replacement showed predicted final set times that occurred earlier than at
50 percent fly ash replacement.
These results correlate well with the findings of Schindler and Folliard (2003) and
Bentz (2010), who noted that up to 50 percent cement replacement with Class C fly ash
resulted in retarded silicate hydration and a decrease in the main hydration peak, as
illustrated in Figure 4.11, below.

76
Figure 4.11. Typical Series of Thermal Curves Showing Delayed Silicate Hydration and
Decreased Main Hydration Peaks
The earlier predicted set times seen with the 70 percent fly ash mixtures, as shown
in Figure 4.12, below, may be explained by sulfate imbalances, which could lead to rapid
aluminate hydration and flash setting behavior. In this case the peak from which the
setting time calculations were made would have been the aluminate hydration peak.

77
Figure 4.12. Series of Thermal Curves Showing Accelerated Hydration at 70% Fly Ash
Replacement

78
Table 4.11. Thermal Curve Data for Cement 1 Combinations
Table 4.12. Thermal Curve Data for Cement 2 Combinations
Initial Set (min)
Final Set (min)
Initial Set (min)
Final Set (min)
Baseline 1 100 0 A 98.91 501 91.62 264 321 303 3251-1 75 25 A 71.81 685 65.54 369 445 246 4581-1 50 50 A 45.50 883 37.46 506 592 577 6131-1 30 70 B 24.45 882 16.85 641 730 755 7691-2 75 25 A 75.56 713 68.02 354 426 385 4201-2 50 50 C 31.59 1256 22.73 488 571 510 5621-2 30 70 B 10.05 599 2.47 493 519 499 5191-3 75 25 A 72.96 749 63.27 392 469 444 4711-3 50 50 C 33.58 1050 24.27 477 572 512 5601-3 30 70 G 22.25 94 12.50 26 41 33 431-4 75 25 A 78.15 829 69.00 425 500 443 4781-4 50 50 D 20.04 642 9.30 445 511 513 5301-4 30 70 G 19.99 197 9.32 61 104 77 1171-5 75 25 A 83.17 756 72.22 391 463 410 4431-5 50 50 D 19.41 597 7.24 426 486 491 5001-5 30 70 G 21.68 204 14.30 64 108 70 110
Percentage Method Derivatives M (°F)Time at ΔTmax
(min)
Setting Time PredictionsΔTmax
(°F)Combination
Proportions
Fly Ash (%)
Cement (%)
Curve Type
Initial Set (min)
Final Set (min)
Initial Set (min)
Final Set (min)
Baseline 2 100 0 A 96.40 521 91.84 305 374 366 3862-1 75 25 A 81.29 705 74.01 380 455 448 4682-1 50 50 A 53.69 763 45.27 455 548 550 5692-1 30 70 B 30.52 819 22.03 573 671 696 7112-2 75 25 A 80.25 714 74.55 374 452 436 4572-2 50 50 A 47.50 822 41.16 438 520 508 5282-2 30 70 E 17.39 757 10.42 541 612 619 6382-3 75 25 A 72.43 644 65.40 376 452 436 4642-3 50 50 A 38.92 861 31.75 462 552 476 5752-3 30 70 E 11.41 627 2.86 471 526 439 5392-4 75 25 A 83.87 744 75.83 413 484 461 4822-4 50 50 C 45.47 927 35.42 481 556 520 5482-4 30 70 E 14.71 588 3.44 471 512 381 5272-5 75 25 A 85.44 738 77.19 414 486 458 4832-5 50 50 C 49.62 977 39.13 508 581 547 5652-5 30 70 ----- ----- ----- ----- ----- ----- ----- -----
ΔTmax
(°F)
Time at ΔTmax
(min)M (°F)
Setting Time PredictionsPercentage Method Derivatives Combination
Proportions
Cement (%)
Fly Ash (%)
Curve Type

79
Table 4.13. Thermal Curve Data for Cement 3 Combinations
Table 4.14. Thermal Curve Data for Cement 4 Combinations
Initial Set (min)
Final Set (min)
Initial Set (min)
Final Set (min)
Baseline 3 100 0 A 111.88 413 104.13 228 284 279 2923-1 75 25 A 94.29 622 84.57 364 427 412 4283-1 50 50 A 55.64 839 44.21 512 581 571 5893-1 30 70 B 28.24 767 16.15 582 652 655 6693-2 75 25 A 94.90 632 87.45 369 429 399 4223-2 50 50 C 43.65 1010 35.26 521 582 547 5733-2 30 70 G 12.26 664 5.09 546 576 556 5693-3 75 25 A 89.61 635 80.68 364 428 409 4253-3 50 50 C 39.26 966 29.80 506 583 544 5823-3 30 70 F 12.15 400 1.86 179 316 259 3663-4 75 25 A 101.17 664 92.04 413 469 433 4513-4 50 50 D 25.77 660 14.02 500 550 533 5613-4 30 70 F 20.99 185 13.23 38 86 73 1493-5 75 25 A 99.82 703 88.10 446 505 456 4773-5 50 50 D 24.73 607 12.11 452 493 474 4923-5 30 70 G 23.04 232 12.19 62 116 71 73
ΔTmax
(°F)
Time at ΔTmax
(min)M (°F)
Setting Time PredictionsPercentage Method Derivatives Combination
Proportions
Cement (%)
Fly Ash (%)
Curve Type
Initial Set (min)
Final Set (min)
Initial Set (min)
Final Set (min)
Baseline 4 100 0 A 108.25 486 102.35 288 353 352 3764-1 75 25 A 99.92 567 90.53 306 374 365 3904-1 50 50 A 58.97 785 50.61 475 573 579 5994-1 30 70 B 35.17 794 25.68 537 640 669 6874-2 75 25 A 81.61 713 77.95 412 513 517 5424-2 50 50 A 57.41 837 50.65 483 578 575 5984-2 30 70 E 17.74 885 12.68 591 696 721 7434-3 75 25 A 78.41 705 71.82 431 526 535 5554-3 50 50 A 45.85 917 37.34 545 642 614 6714-3 30 70 E 16.53 1489 8.42 561 649 623 6624-4 75 25 A 106.63 649 97.37 391 462 449 4664-4 50 50 C 73.23 980 61.22 477 553 514 5364-4 30 70 E 23.63 1150 10.70 503 570 555 5834-5 75 25 A 91.93 791 86.69 474 563 546 5694-5 50 50 A 72.94 881 62.02 463 541 515 5404-5 30 70 E 19.85 681 7.17 512 562 561 574
ΔTmax
(°F)
Time at ΔTmax
(min)M (°F)
Setting Time PredictionsPercentage Method Derivatives Combination
Proportions
Cement (%)
Fly Ash (%)
Curve Type

80
Table 4.15. Thermal Curve Data for Cement 5 Combinations
Along with the data discussed previously, the thermal curve for each combination
was categorized as one of seven curve types based on the general shape of the curve. The
general curve shapes were chosen as those which commonly occurred and had distinct
attributes from the other curve shapes. It should be noted that since the specimens were
not inserted into the calorimeter until approximately 10 minutes following the start of
hydration, the dormant period may or may not be well defined. Also, each curve initially
shows a sharp rise in temperature. This is due to the rapid increase in temperature of the
thermistors, which were at the ambient temperature prior to coming in contact with the
hydrating specimens that had already begun to rise in temperature.
In Appendix C, plots are included that show the curve for the baseline mixture,
along with the curves for the three fly ash replacement levels of each portland cement and
fly ash combination. The curve type for each mixture has been included here in Tables
Initial Set (min)
Final Set (min)
Initial Set (min)
Final Set (min)
Baseline 5 100 0 A 115.40 414 109.28 237 298 299 3135-1 75 25 A 83.82 678 78.40 382 471 471 4945-1 50 50 A 55.05 844 48.54 494 605 615 6395-1 30 70 B 29.81 868 21.08 619 720 754 7665-2 75 25 A 91.18 674 84.30 372 452 441 4615-2 50 50 A 45.15 909 39.35 488 583 568 5995-2 30 70 E 16.81 789 10.55 548 632 386 6725-3 75 25 A 79.41 657 71.89 378 464 470 4905-3 50 50 A 42.77 854 34.77 487 584 610 6255-3 30 70 G 18.46 129 9.85 36 58 41 515-4 75 25 A 85.66 788 79.33 446 534 512 5435-4 50 50 C 46.15 980 35.01 544 625 598 6285-4 30 70 G 14.80 530 1.96 448 476 434 4935-5 75 25 A 91.67 743 85.84 434 518 493 5185-5 50 50 C 50.45 1063 39.70 533 617 570 7005-5 30 70 ----- ----- ----- ----- ----- ----- ----- -----
ΔTmax
(°F)
Time at ΔTmax
(min)M (°F)
Setting Time PredictionsPercentage Method Derivatives Combination
Proportions
Cement (%)
Fly Ash (%)
Curve Type

81
4.11 through 4.15, above. Examples of the curve shapes are shown below in Figures 4.13
through 4.19. Defining characteristics of the seven curve shapes are as follows:
• Type A: Typical curve shape for normally hydrating portland cement. The
dormant period may or may not be well-defined before the main hydration
temperature rise. The main hydration temperature rise is, for the most part,
symmetrical about a vertical line at the time where the peak of the curve occurs.
• Type B: Extremely low magnitude, but abrupt, peak following the dormant
period. This curve is not symmetrical, as Type A was, but shows a sharp rise
before the peak with a lower slope descent following the peak.
• Type C: Lower magnitude and wider overall shape of the main hydration curve,
with an abrupt change in the rate of temperature rise occurring prior to the peak of
the curve.
• Type D: Two separate peaks following a dormant period. The second peak is
significantly larger in magnitude and occurs shortly after the first peak.
• Type E: Abrupt, but low magnitude, rise following a dormant period. Following
the rise, the temperature may remain nearly unchanged for a period or show two
peaks of similar magnitudes. The second peak occurs shortly after the first peak
and may indicate two overlapping hydration peaks.
• Type F: Immediate, but low magnitude, rise which is not followed by a second
peak and appears to approach a ΔT of zero.
• Type G: Abrupt, but low magnitude, initial rise followed by an extended dormant
period and a low magnitude second rise. These curves do not approach a ΔT of
zero during the dormant period.

82
Figure 4.13. Example of Type A Thermal Curve Shape
Figure 4.14. Example of Type B Thermal Curve Shape

83
Figure 4.15. Example of Type C Thermal Curve Shape
Figure 4.16. Example of Type D Thermal Curve Shape

84
Figure 4.17. Example of Type E Thermal Curve Shape
Figure 4.18. Example of Type F Thermal Curve Shape

85
Figure 4.19. Example of Type G Thermal Curve Shape
To explain the curve shapes shown above, a few points which should first be
emphasized include: (1) the role of sulfate in hydration; (2) the effect of rapid aluminate
hydration on the cementitious system; and (3) the effect of alkali content. (1) As
discussed by Lerch (1946), aluminates are less soluble and silicates are more soluble in
solutions containing sulfates. This results in aluminate hydration being retarded and
silicate hydration being accelerated once the sulfates go into solution. Also, it is thought
that rapidly forming ettringite around the particles may assist in slowing the aluminate
reactions. When available sulfate is depleted form the system, renewed aluminate
hydration will occur rapidly and silicate hydration will occur at a significantly slower

86
rate. (2) If hydration of the aluminates is not controlled at early ages by sulfate, calcium
will be rapidly consumed by the aluminates. This results in a lack of available calcium for
silicate hydration and will result in extremely slow or nonexistent silicate hydration
(Roberts & Taylor, 2007). (3) According to Lerch (1946), high alkali concentrations can
result in more rapid reactions between the aluminates and gypsum. This may account for
differences in the heat evolution characteristics of systems which may otherwise appear
to be chemically similar.
Type A curves result from normally hydrating paste systems. When water first
comes in contact with the cement, aluminates go into solution and begin reacting rapidly.
As sulfate goes into solution, the solubility of the aluminates decreases which results in a
dormant period. A contribution to this effect is also made by the formation of ettringite
around the particles. Following the dormant period, the high calcium concentration of the
pore solution causes the silicates to begin hydrating, which is accompanied by a large rise
in temperature. This rise reaches a peak when the hydration products have formed around
the particles sufficiently to slow further hydration, at which point the rate of heat
evolution decreases. With the addition of fly ash, Type A curves will decrease in
magnitude and occur at later times, because the content of the more reactive cement has
been decreased. xThis curve type is associated with fly ash replacement levels of 0 and
25 percent. Also, some 50 percent fly ash mixtures may result in Type A curves.
Type B and E curves occur due to similar processes. In the case of Type B curves,
the sulfate has been consumed and the remaining aluminates being reacting rapidly,
which results in significant heat generation. After the aluminate peak occurs, the thermal
curve decreases abnormally slowly. This may be caused by extremely slow silicate

87
hydration, which would result from a lack of calcium and sulfate. Type E curves suggest
similar behavior, but with less severe sulfate depletion. The plateau shape of these curves
may be the result of partially overlapping aluminate and silicate hydration peaks. Both
Type B and Type E curves are associated with 70 percent fly ash mixtures.
Type C, D, and G curves can be viewed as increasingly severe forms of the same
behavior. For Type C curves, a lack of sulfate results in a rapid aluminate hydration rise,
which occurs during hydration of the silicates. Sufficient calcium is still available for
silicate hydration, but it is retarded by a lack of sulfate, increasing the period over which
the curve occurs. Type D curves may result from a similar process, but with a more
delayed silicate peak due to an even greater lack of sulfate. Type G curves can be
attributed to a severe lack of sulfate, resulting in extremely rapid aluminate hydration
followed by extremely delayed and suppressed silicate hydration. So, as unmet sulfate
demand increases, the aluminate peak occurs earlier and the silicate peak occurs later.
Type C and D curves occur for mixtures with 50 percent fly ash, while Type G curves
occur for 70 percent fly ash mixtures.
Type F curves result from conditions similar to those seen with Type G curves,
except that silicate hydration is severely suppressed or nonexistent. This results from the
consumption of the available calcium by the aluminates during early hydration. As can be
seen, the curve approaches zero following the aluminate reactions, which indicates that
very little or no heat is being generated by the paste. Type F curves are associated with
mixtures containing 70 percent fly ash.
Shown below, in Figure 4.20, are all of the previously discussed curve types on a
single plot for comparison to a typical, Type A, curve. When compared to Type A, Type

88
B curves have a slightly delayed and severely decreased peak. Type C curves are
significantly shorter, broader, and have a “shoulder” occurring before the peak of the
curve. The peak for this curve type is significantly delayed, when compared to a Type A.
Type D curves have two separate peaks, where the second peak is larger than the first and
occurs after the first. Here, the first peak may occur at a similar time as the main peak of
a Type A curve. Type E curves have a delayed, but abrupt, low magnitude rise.
Following the rise, the temperature may show a plateau or two extremely close peaks of
similar magnitude. Type F curves show a sharp, low magnitude peak, which occurs
earlier than the peak of a Type A curve. Following the peak, the ΔT appears to approach
zero. Type G curves have an abrupt, early peak, which is similar to Type F and is
followed by an extended dormant period. Following the dormant period, a second peak
occurs at a time much later than the peaks of the other curve types.
4.1.3. Miniature Slump. The miniature slump test was performed for each
mixture at 2, 5, 15, 30, and 45 minutes after mixing began. Four diameter measurements
were taken for each miniature slump test and then averaged. The average diameter was
used to calculate the area of the paste pat. These values are summarized for each mixture
in Tables 4.16 through 4.20, below. It can been seen from the results that as fly ash
replacement increases the pat area typically increases considerably at 2, 5, and 15
minutes. The results also show that the miniature slump area decreases more rapidly over
time with increasing fly ash levels. From 15 to 45 minutes, the miniature slump results
for a given combination, at 50 and 70 percent fly ash replacement, tend to converge on
the baseline mixture results and either remain above the baseline or drop below the
baseline. The 25 percent fly ash mixtures generally remain higher than the baseline. A

89
typical plot of miniature slump pat area over time for increasing fly ash replacement
levels is shown below in Figure 4.21. Plots of the results for all mixtures can be found in
Appendix E.
Figure 4.20. Comparison of Curve Types

90
Figure 4.21. Example of Miniature Slump Results for Increasing Fly Ash Contents
Roberts & Taylor (2007) discussed the use of an early stiffening index, which is
calculated by dividing the pat area at 30 minutes by the pat area at 5 minutes. Rapid
stiffening is indicated by an index value less than 0.85. This index value was calculated
for each mixture and is also included in the tables below. For all of the combinations with
50 and 70 percent fly ash, a value less than 0.85 was obtained. Cement 5 had the only 100
percent cement mixture with a value less than 0.85. It should also be noted that, for
Cements 2 and 5, a majority of the mixtures had values indicating early stiffening
behavior.

91
Table 4.16. Miniature Slump Results for Cement 1
Table 4.17. Miniature Slump Results for Cement 2
(30-min/5-min)Baseline 1 100 0 2.0 2.7 2.8 2.5 2.7 0.93
1-1 75 25 3.1 3.8 3.7 3.8 3.5 1.021-1 50 50 5.5 4.9 4.8 4.1 4.2 0.841-1 30 70 6.0 4.8 3.9 3.3 3.2 0.691-2 75 25 3.4 3.7 3.6 3.3 3.5 0.871-2 50 50 6.1 5.5 4.9 4.3 4.1 0.791-2 30 70 11.2 8.4 5.6 4.6 4.5 0.551-3 75 25 2.6 3.4 3.4 3.2 3.3 0.951-3 50 50 5.9 4.8 3.8 3.9 3.8 0.831-3 30 70 8.2 6.3 4.5 3.7 3.7 0.591-4 75 25 2.6 3.1 3.1 2.8 2.8 0.891-4 50 50 5.1 4.4 3.2 2.6 2.7 0.591-4 30 70 6.9 5.7 3.3 2.8 2.6 0.501-5 75 25 3.1 3.3 3.1 2.9 3.0 0.871-5 50 50 7.0 5.4 4.4 3.6 3.6 0.681-5 30 70 10.2 10.6 5.5 3.8 3.4 0.36
CombinationProportions
Fly Ash (%)
Cement (%)
Early Stiffening Index45-min
Test30-min
Test15-min
Test5-min Test
2-min Test
Miniature Slump Area (in2)
(30-min/5-min)Baseline 2 100 0 5.0 3.8 4.0 3.8 3.4 0.98
2-1 75 25 6.8 5.4 6.0 5.1 4.8 0.952-1 50 50 11.6 7.9 7.0 6.0 5.9 0.752-1 30 70 13.3 9.2 5.8 4.5 4.7 0.492-2 75 25 6.9 5.4 5.1 4.2 4.2 0.782-2 50 50 10.3 7.5 5.9 5.0 4.7 0.662-2 30 70 13.4 10.7 7.0 5.3 4.8 0.502-3 75 25 6.2 5.2 4.5 3.9 3.9 0.762-3 50 50 9.2 7.0 5.1 4.1 4.1 0.582-3 30 70 13.1 7.5 4.7 3.7 3.7 0.492-4 75 25 6.3 5.2 4.3 3.8 3.7 0.722-4 50 50 7.8 6.5 3.9 3.2 3.1 0.492-4 30 70 9.9 8.7 3.5 2.6 2.7 0.302-5 75 25 7.1 5.6 4.8 4.2 3.9 0.752-5 50 50 11.7 9.1 5.3 4.2 3.8 0.462-5 30 70 14.3 12.7 4.8 3.5 3.3 0.27
CombinationProportions
Cement (%)
Fly Ash (%)
5-min Test
15-min Test
30-min Test
45-min Test
2-min Test
Early Stiffening Index
Miniature Slump Area (in2)

92
Table 4.18. Miniature Slump Results for Cement 3
Table 4.19. Miniature Slump Results for Cement 4
(30-min/5-min)Baseline 3 100 0 2.2 2.4 2.4 2.4 2.4 1.00
3-1 75 25 2.1 3.1 3.1 2.8 2.9 0.903-1 50 50 3.7 4.1 4.0 3.3 3.5 0.813-1 30 70 5.0 4.6 3.4 2.9 2.8 0.633-2 75 25 2.1 3.1 2.9 2.7 2.9 0.903-2 50 50 3.6 4.4 4.0 3.6 3.4 0.833-2 30 70 7.7 6.0 5.3 4.5 4.3 0.753-3 75 25 2.2 2.9 2.8 2.8 2.9 0.963-3 50 50 4.4 4.2 3.9 3.3 3.4 0.793-3 30 70 6.8 6.0 4.5 3.7 3.6 0.613-4 75 25 1.9 2.7 2.6 2.5 2.5 0.933-4 50 50 3.9 3.4 2.9 2.7 2.5 0.793-4 30 70 6.5 5.1 2.9 2.4 2.4 0.473-5 75 25 2.2 3.1 2.9 2.7 2.5 0.863-5 50 50 4.6 4.9 3.6 3.0 2.9 0.613-5 30 70 8.4 6.1 4.1 3.1 3.1 0.50
CombinationProportions
Cement (%)
Fly Ash (%)
2-min Test
5-min Test
15-min Test
30-min Test
Miniature Slump Area (in2)45-min
Test
Early Stiffening Index
(30-min/5-min)Baseline 4 100 0 3.8 3.8 3.8 3.5 3.7 0.92
4-1 75 25 5.4 4.6 4.6 4.2 3.9 0.914-1 50 50 8.3 7.4 6.0 5.4 5.2 0.724-1 30 70 9.2 7.3 5.7 4.7 4.3 0.644-2 75 25 3.0 3.3 4.0 3.5 3.4 1.084-2 50 50 6.8 6.2 4.7 4.5 4.3 0.734-2 30 70 9.3 9.7 6.4 5.3 4.6 0.544-3 75 25 5.0 4.6 4.4 4.1 3.7 0.884-3 50 50 6.2 5.5 4.4 3.9 3.7 0.714-3 30 70 8.8 6.1 4.4 3.5 3.5 0.574-4 75 25 4.5 4.4 3.7 3.3 3.2 0.774-4 50 50 6.9 4.7 3.2 3.0 2.7 0.654-4 30 70 8.0 4.8 2.9 2.7 2.4 0.574-5 75 25 6.4 5.8 4.9 3.7 3.5 0.644-5 50 50 8.9 6.9 4.9 3.8 4.0 0.554-5 30 70 10.0 9.8 4.9 3.4 3.3 0.35
CombinationProportions
Cement (%)
Fly Ash (%)
2-min Test
5-min Test
15-min Test
30-min Test
45-min Test
Miniature Slump Area (in2) Early Stiffening Index

93
Table 4.20. Miniature Slump Results for Cement 5
The increase in miniature slump area with increasing fly ash replacement is
expected, because it is known that fly ash increases workability, due to the spherical and
glassy characteristics of fly ash particles. The more rapid loss in slump area and lower
early stiffening indices seen with increasing fly ash replacement may be explained by
increased aluminate levels and sulfate imbalance, which would lead to rapid setting
behavior.
(30-min/5-min)Baseline 5 100 0 3.1 3.7 3.0 2.8 2.8 0.77
5-1 75 25 5.2 4.8 4.7 4.1 3.9 0.855-1 50 50 6.7 5.9 5.0 4.2 4.0 0.715-1 30 70 9.0 5.0 3.3 2.8 2.7 0.565-2 75 25 5.2 4.8 4.2 3.7 3.6 0.775-2 50 50 8.2 6.7 5.6 4.6 4.4 0.695-2 30 70 11.4 8.3 5.8 4.3 4.2 0.515-3 75 25 5.2 4.7 4.3 3.6 3.8 0.775-3 50 50 6.9 5.8 5.0 4.3 4.1 0.745-3 30 70 10.3 6.6 4.8 3.9 3.5 0.585-4 75 25 4.4 4.3 3.6 3.0 3.0 0.715-4 50 50 6.2 4.7 3.1 2.7 2.8 0.585-4 30 70 8.4 4.8 2.6 2.3 2.1 0.485-5 75 25 5.6 5.3 4.5 3.8 3.5 0.725-5 50 50 8.8 6.9 5.0 3.9 3.7 0.575-5 30 70 14.9 12.2 5.0 3.2 3.2 0.26
CombinationProportions
30-min Test
Miniature Slump Area (in2)Cement
(%)Fly Ash
(%)2-min Test
5-min Test
15-min Test
45-min Test
Early Stiffening Index

94
4.1.4. Vicat Setting Time. The initial and final setting times for each mixture
were determined by the Vicat method according to ASTM C 191. As part of the Vicat
setting time method, the water required to achieve normal consistency of the paste was
determined according to ASTM C 187. The results of the normal consistency and setting
time tests are summarized in Tables 4.21 through 4.25, below, for each mixture. The
results show that, except for Cement 2 combinations, initial set generally increases with
25 percent fly ash replacement and then decreases with 50 and 70 percent fly ash
replacement. For mixtures made with Fly Ashes 1, 2, or 3, final set tended to increase
with fly ash replacement up to 50 percent. For mixtures made with Fly Ashes 4 and 5,
final set generally increased at 25 percent fly ash replacement and then decreased at the
50 and 70 percent replacement levels, similar to initial set. The increases in setting times
for mixtures with 25 to 50 percent fly ash is explained by the retarding effect of fly ash
noted by other researchers including Bentz (2010). The decrease in setting times can be
attributed to sulfate imbalances which are significant enough to produce flash setting
behavior. The differences in the fly ash replacement level at which setting times began to
decrease could be explained by differing sulfate requirements, which would lead to
varying degrees of sulfate imbalance for each system. It should also be noted that the
required water for normal consistency decreased with increasing fly ash replacement
levels for all combinations. This is explained by the increased fluidity achieved when
replacing portland cement with fly ash, which is composed of spherical, glassy particles.

95
Table 4.21. Vicat Setting Time Results for Cement 1
Table 4.22. Vicat Setting Time Results for Cement 2
Baseline 1 100 0 26.0 110 2101-1 75 25 23.0 184 3451-1 50 50 20.5 95 3901-1 30 70 19.5 34 4051-2 75 25 24.0 218 3901-2 50 50 21.0 208 5101-2 30 70 19.5 87 4501-3 75 25 24.5 171 3751-3 50 50 21.5 142 4351-3 30 70 20.0 49 5251-4 75 25 23.0 203 4501-4 50 50 21.0 47 3601-4 30 70 19.0 15 1351-5 75 25 22.5 178 4801-5 50 50 19.0 33 1801-5 30 70 17.5 11 45
ProportionsCement
(%)Fly Ash
(%)Combination Initial Set
(min)Final Set
(min)
Water for Normal Consistency
(0.5%)
Vicat Results
Baseline 2 100 0 25.0 158 2552-1 75 25 22.0 182 3602-1 50 50 19.0 67 3752-1 30 70 18.0 20 4202-2 75 25 21.5 154 3452-2 50 50 20.0 71 4352-2 30 70 19.0 57 4952-3 75 25 22.5 151 3902-3 50 50 21.0 40 6502-3 30 70 19.0 12 1502-4 75 25 21.5 92 3602-4 50 50 20.0 35 3002-4 30 70 18.5 12 902-5 75 25 21.0 80 3452-5 50 50 19.0 13 902-5 30 70 17.5 11 45
CombinationProportions
Cement (%)
Fly Ash (%)
Water for Normal Consistency
(0.5%)
Vicat ResultsInitial Set
(min)Final Set
(min)

96
Table 4.23. Vicat Setting Time Results for Cement 3
Table 4.24. Vicat Setting Time Results for Cement 4
Baseline 3 100 0 25.0 78 1803-1 75 25 23.0 170 3153-1 50 50 20.5 85 3603-1 30 70 19.0 31 2253-2 75 25 23.0 146 3153-2 50 50 20.5 101 4353-2 30 70 19.0 59 4353-3 75 25 23.0 123 3003-3 50 50 21.0 96 4503-3 30 70 19.5 40 3753-4 75 25 23.0 172 3753-4 50 50 21.0 33 3003-4 30 70 19.0 12 603-5 75 25 22.5 124 3453-5 50 50 20.0 12 753-5 30 70 18.5 11 30
CombinationProportions
Cement (%)
Fly Ash (%)
Water for Normal Consistency
(0.5%)
Vicat ResultsInitial Set
(min)Final Set
(min)
Baseline 4 100 0 24.0 81 1804-1 75 25 23.0 132 2704-1 50 50 21.5 107 3004-1 30 70 20.5 14 2854-2 75 25 23.0 213 4504-2 50 50 21.0 78 5254-2 30 70 19.0 53 4804-3 75 25 23.0 238 4354-3 50 50 21.5 101 6604-3 30 70 20.5 48 3004-4 75 25 22.5 125 3604-4 50 50 20.0 34 2704-4 30 70 19.5 12 1054-5 75 25 22.5 123 2554-5 50 50 21.0 15 1954-5 30 70 19.5 11 60
CombinationProportions
Cement (%)
Fly Ash (%)
Water for Normal Consistency
(0.5%)
Vicat ResultsInitial Set
(min)Final Set
(min)

97
Table 4.25. Vicat Setting Time Results for Cement 5
The results of the Screening Study show some general trends in the properties of
paste mixtures with increasing fly ash replacement levels. Cube compressive strengths
were severely decreased at early ages, but experienced significant increases at later ages,
indicating slower rates of strength gain. The thermal curves illustrated that the silicate
hydration peaks were delayed and decreased in magnitude, due to the slower rate and
lower heat production of the pozzolanic reaction. The miniature slump results showed
increasing pat areas at times up to 15 minutes, which can be attributed to the spherical,
glassy characteristics of fly ash. The effects of the fly ash particles were also seen in the
decreased water required to achieve normal consistency, when performing the Vicat
Baseline 5 100 0 26.0 146 2855-1 75 25 23.0 158 3005-1 50 50 20.5 100 4055-1 30 70 19.0 21 4655-2 75 25 24.0 179 3305-2 50 50 21.0 175 4355-2 30 70 19.0 59 4955-3 75 25 24.0 149 3155-3 50 50 21.0 54 3905-3 30 70 20.0 13 1505-4 75 25 23.0 167 3455-4 50 50 21.0 48 3755-4 30 70 19.0 14 1205-5 75 25 22.5 136 3455-5 50 50 19.0 13 1355-5 30 70 18.0 11 45
CombinationProportions
Cement (%)
Fly Ash (%)
Water for Normal Consistency
(0.5%)
Vicat ResultsInitial Set
(min)Final Set
(min)

98
setting time test. Also, many of the Vicat results indicated increases in setting times.
These results are typical for fly ash mixtures, which have slower reaction rates, due to the
pozzolanic reaction, resulting in slower strength gain, decreased heat generation, and
delayed setting times.
Some of the results in the Screening Study contradict the generalizations made in
the previous paragraph. These results may be attributed to sulfate imbalances, which are
increasingly likely at higher fly ash replacement levels. Sulfate imbalances, which cause
accelerated early hydration of the aluminates, can lead to severely slow strength gain,
rapid losses in fluidity, and decreased setting times. The changes in the hydration
reactions of mixtures experiencing sulfate imbalances can also been observed in the
unusual curve shapes obtained from the calorimetry results for these mixtures.

99
4.2 MAIN STUDY RESULTS
In the Main Study, two cement and fly ash combinations were chosen from the
Screening Study for further study with powder additions and a water reducer. The two
combinations, 4-1 and 1-3, were chosen as the most and least reactive combinations
based on one-day cube strength results from the Screening Study. The effect of adding a
water reducer was evaluated at the 0, 25, 50, and 70 percent fly ash replacement levels.
The effects of gypsum, lime, and rapid set cement additions were evaluated at the 50 and
70 percent fly ash replacement levels. Paste testing for the Main Study included cube
compressive strength, semi-adiabatic calorimetry, miniature slump, and Vicat setting
time. Compressive strength testing was performed at 1, 3, 7, 28, and 56 days.
4.2.1. Outlier Analysis. The three cube compressive strength results for each
mixture were evaluated for outliers as discussed above in Section 4.1.1. The results of the
outlier analyses for Combination 4-1 mixtures are shown below in Tables 4.26 through
4.30. The results of the outlier analyses for Combination 1-3 mixtures are shown below in
Tables 4.31 through 4.35. Values which were discarded as outliers have been bolded and
the cell has been shaded. For Combination 4-1, the ASTM E 178 analysis indicated 16
possible outliers. Of these, two values were discarded as actual outliers, while the others
were falsely indicated as outlying values. Two additional values, which were not
indicated as outliers by the ASTM E 178 analysis, were discarded as outliers. For
Combination 1-3, the ASTM E 178 analysis indicated 10 possible outliers. Of these, one
value was discarded as an actual outlier. No other values were discarded as outlying
values. An outlier analysis was also run on the calorimeter data for the Main Study and
has been included in Appendix B.

100
Table 4.26. Outlier Analysis of 1-Day Cube Strengths for Combination 4-1 Mixtures.
Test 1 Test 2 Test 3 Avg.4-1 100 0 0 0 0 0.00 4037 4280 4025 4114 144 3 4280 4025 1.153 1.154 0.620 YES NO 41144-1 100 0 0 0 0 2.75 3597 4577 4424 4199 527 3 4577 3597 1.153 0.717 1.142 NO NO 41994-1 100 0 0 0 0 5.00 5045 5406 5278 5243 183 3 5406 5045 1.153 0.891 1.081 NO NO 52434-1 75 25 0 0 0 0.00 3757 3799 3458 3671 186 3 3799 3458 1.153 0.686 1.147 NO NO 36714-1 75 25 0 0 0 2.75 3436 3396 3327 3387 55 3 3436 3327 1.153 0.900 1.076 NO NO 33874-1 75 25 0 0 0 5.00 2926 2752 2894 2857 93 3 2926 2752 1.153 0.746 1.136 NO NO 28574-1 50 50 0 0 0 0.00 1925 1966 1914 1935 27 3 1966 1914 1.153 1.133 0.758 NO NO 19354-1 50 50 0 0 0 2.75 1370 1375 1399 1381 15 3 1399 1370 1.153 1.144 0.710 NO NO 13814-1 50 50 0 0 0 5.00 1219 1256 1176 1217 40 3 1256 1176 1.153 0.969 1.028 NO NO 12174-1 50 50 2 0 0 2.75 1324 1277 1250 1284 37 3 1324 1250 1.153 1.075 0.902 NO NO 12844-1 50 50 4 0 0 2.75 714 694 722 710 14 3 722 694 1.153 0.829 1.110 NO NO 7104-1 50 50 4 5 0 2.75 609 631 626 622 11 3 631 609 1.153 0.786 1.126 NO NO 6224-1 50 50 4 10 0 2.75 1249 1195 1257 1234 34 3 1257 1195 1.153 0.689 1.147 NO NO 12344-1 50 50 4 0 10 2.75 755 783 784 774 17 3 784 755 1.153 0.606 1.154 NO YES 7744-1 50 50 4 0 20 2.75 1170 1199 1238 1202 34 3 1238 1170 1.153 1.044 0.950 NO NO 12024-1 30 70 0 0 0 0.00 678 628 689 665 32 3 689 628 1.153 0.742 1.137 NO NO 6654-1 30 70 0 0 0 2.75 300 307 321 309 10 3 321 300 1.153 1.098 0.858 NO NO 3094-1 30 70 0 0 0 5.00 362 364 381 369 10 3 381 362 1.153 1.152 0.645 NO NO 3694-1 30 70 2 0 0 2.75 453 457 477 462 13 3 477 453 1.153 1.145 0.704 NO NO 4624-1 30 70 4 0 0 2.75 204 207 225 212 11 3 225 204 1.153 1.142 0.720 NO NO 2124-1 30 70 4 5 0 2.75 556 561 554 557 3 3 561 554 1.153 1.135 0.750 NO NO 5574-1 30 70 4 10 0 2.75 556 546 529 544 13 3 556 529 1.153 0.899 1.077 NO NO 5444-1 30 70 4 0 10 2.75 679 655 693 675 19 3 693 655 1.153 0.906 1.073 NO NO 6754-1 30 70 4 0 20 2.75 816 794 795 802 13 3 816 794 1.153 1.154 0.606 YES NO 802
CombinationNominal Proportions
tCRIT tMAX tMIN OutlierMAX? OutlierMIN?RSC (%)
Lime (%)
Gypsum (%)
Fly Ash (%)
Outlier AnalysisCement
(%)WR
(fl.oz./cwt)
Average Cube Strength (psi)Cube Strengths (psi)
σ n Max. Min.
100

101
Table 4.27. Outlier Analysis of 3-Day Cube Strengths for Combination 4-1 Mixtures.
Test 1 Test 2 Test 3 Avg.4-1 100 0 0 0 0 0.00 8341 8015 7977 8111 200 3 8341 7977 1.153 1.150 0.668 NO NO 81114-1 100 0 0 0 0 2.75 8423 8187 7965 8192 229 3 8423 7965 1.153 1.010 0.989 NO NO 81924-1 100 0 0 0 0 5.00 8908 8708 ----- 8808 ----- -- ----- ----- ----- ----- ----- ----- ----- 88084-1 75 25 0 0 0 0.00 6179 6156 6235 6190 41 3 6235 6156 1.153 1.108 0.836 NO NO 61904-1 75 25 0 0 0 2.75 6754 6807 6775 6779 27 3 6807 6754 1.153 1.063 0.923 NO NO 67794-1 75 25 0 0 0 5.00 6124 6235 6048 6136 94 3 6235 6048 1.153 1.055 0.934 NO NO 61364-1 50 50 0 0 0 0.00 3530 3485 3589 3535 52 3 3589 3485 1.153 1.044 0.949 NO NO 35354-1 50 50 0 0 0 2.75 2937 3372 3534 3281 309 3 3534 2937 1.153 0.820 1.114 NO NO 32814-1 50 50 0 0 0 5.00 3515 3623 3603 3580 57 3 3623 3515 1.153 0.743 1.137 NO NO 35804-1 50 50 2 0 0 2.75 3257 3461 3333 3351 103 3 3461 3257 1.153 1.073 0.906 NO NO 33514-1 50 50 4 0 0 2.75 3416 3334 3237 3329 90 3 3416 3237 1.153 0.970 1.027 NO NO 33294-1 50 50 4 5 0 2.75 3100 3206 3183 3163 56 3 3206 3100 1.153 0.775 1.129 NO NO 31634-1 50 50 4 10 0 2.75 3104 3025 3272 3134 126 3 3272 3025 1.153 1.097 0.860 NO NO 31344-1 50 50 4 0 10 2.75 2978 2973 2871 2940 61 3 2978 2871 1.153 0.617 1.154 NO YES 29404-1 50 50 4 0 20 2.75 3377 3257 3394 3343 75 3 3394 3257 1.153 0.687 1.147 NO NO 33434-1 30 70 0 0 0 0.00 1109 1074 1120 1101 24 3 1120 1074 1.153 0.787 1.125 NO NO 11014-1 30 70 0 0 0 2.75 946 1083 1080 1036 78 3 1083 946 1.153 0.598 1.154 NO YES 10364-1 30 70 0 0 0 5.00 1117 1148 1207 1157 46 3 1207 1117 1.153 1.091 0.873 NO NO 11574-1 30 70 2 0 0 2.75 1261 1284 1323 1289 31 3 1323 1261 1.153 1.069 0.912 NO NO 12894-1 30 70 4 0 0 2.75 1586 1721 1622 1643 70 3 1721 1586 1.153 1.116 0.814 NO NO 16434-1 30 70 4 5 0 2.75 1404 1443 1451 1433 25 3 1451 1404 1.153 0.727 1.140 NO NO 14334-1 30 70 4 10 0 2.75 1291 1255 1247 1264 23 3 1291 1247 1.153 1.140 0.730 NO NO 12644-1 30 70 4 0 10 2.75 1667 1690 1665 1674 14 3 1690 1665 1.153 1.150 0.664 NO NO 16744-1 30 70 4 0 20 2.75 1896 1907 1852 1885 29 3 1907 1852 1.153 0.756 1.134 NO NO 1885
OutlierMIN?Max. Min. tCRIT tMAX tMIN OutlierMAX?Lime (%)
RSC (%)
WR (fl.oz./cwt)
Cube Strengths (psi)Nominal Proportions Outlier Analysis
Average Cube Strength (psi)Cement
(%)Fly Ash
(%)Gypsum
(%) σ nCombination
101

102
Table 4.28. Outlier Analysis of 7-Day Cube Strengths for Combination 4-1 Mixtures.
Test 1 Test 2 Test 3 Avg.4-1 100 0 0 0 0 0.00 9152 9630 10236 9672 543 3 10236 9152 1.153 1.037 0.958 NO NO 96724-1 100 0 0 0 0 2.75 10274 10604 9818 10232 394 3 10604 9818 1.153 0.943 1.049 NO NO 102324-1 100 0 0 0 0 5.00 11053 9988 10764 10602 551 3 11053 9988 1.153 0.820 1.114 NO NO 106024-1 75 25 0 0 0 0.00 7738 7761 8027 7842 160 3 8027 7738 1.153 1.152 0.648 NO NO 78424-1 75 25 0 0 0 2.75 7003 7577 8261 7613 630 3 8261 7003 1.153 1.028 0.969 NO NO 76134-1 75 25 0 0 0 5.00 7214 7812 ----- 7513 ----- -- ----- ----- ----- ----- ----- ----- ----- 75134-1 50 50 0 0 0 0.00 5007 4882 5000 4963 70 3 5007 4882 1.153 0.628 1.153 NO YES 49634-1 50 50 0 0 0 2.75 4926 4737 4901 4855 102 3 4926 4737 1.153 0.694 1.146 NO NO 48554-1 50 50 0 0 0 5.00 4840 5013 5082 4978 125 3 5082 4840 1.153 0.832 1.109 NO NO 49784-1 50 50 2 0 0 2.75 4919 4853 4660 4811 135 3 4919 4660 1.153 0.805 1.119 NO NO 48114-1 50 50 4 0 0 2.75 5135 5032 5188 5118 80 3 5188 5032 1.153 0.878 1.088 NO NO 51184-1 50 50 4 5 0 2.75 4791 4910 4912 4871 69 3 4912 4791 1.153 0.596 1.155 NO YES 48714-1 50 50 4 10 0 2.75 4697 4671 4552 4640 77 3 4697 4552 1.153 0.741 1.137 NO NO 46404-1 50 50 4 0 10 2.75 5386 5066 5444 5299 203 3 5444 5066 1.153 0.713 1.143 NO NO 52994-1 50 50 4 0 20 2.75 5290 5300 5345 5311 30 3 5345 5290 1.153 1.139 0.735 NO NO 53114-1 30 70 0 0 0 0.00 1785 1704 1731 1740 42 3 1785 1704 1.153 1.091 0.873 NO NO 17404-1 30 70 0 0 0 2.75 2075 2073 2020 2056 31 3 2075 2020 1.153 0.610 1.154 NO YES 20564-1 30 70 0 0 0 5.00 2071 2101 2054 2075 24 3 2101 2054 1.153 1.076 0.900 NO NO 20754-1 30 70 2 0 0 2.75 2085 2110 2068 2088 21 3 2110 2068 1.153 1.053 0.937 NO NO 20884-1 30 70 4 0 0 2.75 2352 2481 2490 2441 77 3 2490 2352 1.153 0.631 1.153 NO NO 24414-1 30 70 4 5 0 2.75 2140 2198 2134 2157 35 3 2198 2134 1.153 1.151 0.659 NO NO 21574-1 30 70 4 10 0 2.75 1952 2015 2010 1992 35 3 2015 1952 1.153 0.648 1.152 NO NO 19924-1 30 70 4 0 10 2.75 2710 2885 2785 2793 88 3 2885 2710 1.153 1.044 0.949 NO NO 27934-1 30 70 4 0 20 2.75 2983 3040 3178 3067 100 3 3178 2983 1.153 1.107 0.838 NO NO 3067
Outlier AnalysisCombination
Nominal ProportionsCement
(%)Fly Ash
(%)Gypsum
(%)Lime (%)
RSC (%)
WR (fl.oz./cwt)
Average Cube Strength (psi)Cube Strengths (psi)
σ n Max. Min. tCRIT tMAX tMIN OutlierMAX? OutlierMIN?
102

103
Table 4.29. Outlier Analysis of 28-Day Cube Strengths for Combination 4-1 Mixtures.
Test 1 Test 2 Test 3 Avg.4-1 100 0 0 0 0 0.00 11479 11002 11303 11261 241 3 11479 11002 1.153 0.903 1.075 NO NO 112614-1 100 0 0 0 0 2.75 12541 11329 10859 11576 867 3 12541 10859 1.153 1.112 0.826 NO NO 115764-1 100 0 0 0 0 5.00 13147 10736 13085 12323 1374 3 13147 10736 1.153 0.600 1.154 NO YES 131164-1 75 25 0 0 0 0.00 10736 10658 10210 10535 284 3 10736 10210 1.153 0.709 1.144 NO NO 105354-1 75 25 0 0 0 2.75 10641 11270 11133 11015 331 3 11270 10641 1.153 0.772 1.130 NO NO 110154-1 75 25 0 0 0 5.00 11332 10349 10968 10883 497 3 11332 10349 1.153 0.903 1.075 NO NO 108834-1 50 50 0 0 0 0.00 8562 8701 8238 8500 238 3 8701 8238 1.153 0.843 1.105 NO NO 85004-1 50 50 0 0 0 2.75 6453 6491 6038 6327 252 3 6491 6038 1.153 0.651 1.151 NO NO 63274-1 50 50 0 0 0 5.00 6861 6300 6563 6574 281 3 6861 6300 1.153 1.020 0.979 NO NO 65744-1 50 50 2 0 0 2.75 6739 6933 6821 6831 97 3 6933 6739 1.153 1.048 0.944 NO NO 68314-1 50 50 4 0 0 2.75 6747 7220 6781 6916 264 3 7220 6747 1.153 1.152 0.641 NO NO 69164-1 50 50 4 5 0 2.75 6468 6599 6463 6510 77 3 6599 6463 1.153 1.154 0.605 YES NO 65104-1 50 50 4 10 0 2.75 6123 6125 6231 6160 62 3 6231 6123 1.153 1.155 0.593 YES NO 61604-1 50 50 4 0 10 2.75 6945 7426 7203 7191 241 3 7426 6945 1.153 0.976 1.023 NO NO 71914-1 50 50 4 0 20 2.75 7794 8019 7859 7891 116 3 8019 7794 1.153 1.109 0.834 NO NO 78914-1 30 70 0 0 0 0.00 4246 4231 3954 4144 164 3 4246 3954 1.153 0.623 1.153 NO YES 41444-1 30 70 0 0 0 2.75 2928 2970 3335 3078 224 3 3335 2928 1.153 1.149 0.670 NO NO 30784-1 30 70 0 0 0 5.00 3419 3115 3138 3224 169 3 3419 3115 1.153 1.152 0.642 NO NO 32244-1 30 70 2 0 0 2.75 3184 3201 3118 3168 44 3 3201 3118 1.153 0.755 1.134 NO NO 31684-1 30 70 4 0 0 2.75 3558 3762 3612 3644 106 3 3762 3558 1.153 1.115 0.817 NO NO 36444-1 30 70 4 5 0 2.75 3152 3219 3316 3229 82 3 3316 3152 1.153 1.056 0.932 NO NO 32294-1 30 70 4 10 0 2.75 2765 2808 2748 2774 31 3 2808 2748 1.153 1.112 0.825 NO NO 27744-1 30 70 4 0 10 2.75 3829 3967 3766 3854 103 3 3967 3766 1.153 1.100 0.855 NO NO 38544-1 30 70 4 0 20 2.75 4465 4397 4460 4441 38 3 4465 4397 1.153 0.646 1.152 NO NO 4441
CombinationNominal Proportions
Cement (%)
Fly Ash (%)
Gypsum (%)
Lime (%)
RSC (%)
WR (fl.oz./cwt) OutlierMIN?
Outlier AnalysisAverage Cube Strength (psi)Cube Strengths (psi)
σ n Max. Min. tCRIT tMAX tMIN OutlierMAX?
103

104
Table 4.30. Outlier Analysis of 56-Day Cube Strengths for Combination 4-1 Mixtures.
Test 1 Test 2 Test 3 Avg.4-1 100 0 0 0 0 0.00 13126 12662 12802 12863 238 3 13126 12662 1.153 1.104 0.845 NO NO 128634-1 100 0 0 0 0 2.75 13887 13475 13513 13625 227 3 13887 13475 1.153 1.151 0.660 NO NO 136254-1 100 0 0 0 0 5.00 13996 13474 12402 13291 813 3 13996 12402 1.153 0.868 1.094 NO NO 132914-1 75 25 0 0 0 0.00 12184 10893 10299 11125 963 3 12184 10299 1.153 1.098 0.858 NO NO 111254-1 75 25 0 0 0 2.75 12278 12722 12659 12553 240 3 12722 12278 1.153 0.703 1.145 NO NO 125534-1 75 25 0 0 0 5.00 12838 11237 13140 12405 1022 3 13140 11237 1.153 0.718 1.142 NO NO 129894-1 50 50 0 0 0 0.00 8664 8606 8860 8710 133 3 8860 8606 1.153 1.126 0.784 NO NO 87104-1 50 50 0 0 0 2.75 7725 8220 8268 8071 301 3 8268 7725 1.153 0.656 1.151 NO NO 80714-1 50 50 0 0 0 5.00 8534 8504 8332 8457 109 3 8534 8332 1.153 0.708 1.144 NO NO 84574-1 50 50 2 0 0 2.75 8071 8199 8238 8169 87 3 8238 8071 1.153 0.789 1.125 NO NO 81694-1 50 50 4 0 0 2.75 7896 8369 8359 8208 270 3 8369 7896 1.153 0.596 1.154 NO YES 83644-1 50 50 4 5 0 2.75 6907 7353 7351 7204 257 3 7353 6907 1.153 0.580 1.155 NO YES 72044-1 50 50 4 10 0 2.75 7396 7655 7511 7521 130 3 7655 7396 1.153 1.035 0.961 NO NO 75214-1 50 50 4 0 10 2.75 7597 8470 8588 8218 542 3 8588 7597 1.153 0.683 1.148 NO NO 82184-1 50 50 4 0 20 2.75 8494 7692 8371 8186 432 3 8494 7692 1.153 0.714 1.143 NO NO 81864-1 30 70 0 0 0 0.00 4110 4090 4176 4125 45 3 4176 4090 1.153 1.125 0.789 NO NO 41254-1 30 70 0 0 0 2.75 4322 4325 4433 4360 63 3 4433 4322 1.153 1.154 0.598 YES NO 43604-1 30 70 0 0 0 5.00 4447 4451 4368 4422 47 3 4451 4368 1.153 0.619 1.154 NO YES 44224-1 30 70 2 0 0 2.75 3464 3623 3791 3626 163 3 3791 3464 1.153 1.009 0.991 NO NO 36264-1 30 70 4 0 0 2.75 4251 4282 4027 4187 139 3 4282 4027 1.153 0.686 1.147 NO NO 42674-1 30 70 4 5 0 2.75 3304 3572 3338 3405 146 3 3572 3304 1.153 1.147 0.691 NO NO 34054-1 30 70 4 10 0 2.75 3091 3282 3396 3256 155 3 3396 3091 1.153 0.906 1.073 NO NO 32564-1 30 70 4 0 10 2.75 4457 4720 4745 4641 160 3 4745 4457 1.153 0.655 1.151 NO NO 46414-1 30 70 4 0 20 2.75 5287 5125 5210 5207 81 3 5287 5125 1.153 0.982 1.017 NO NO 5207
CombinationNominal Proportions
Cement (%)
Fly Ash (%)
Gypsum (%)
Lime (%)
RSC (%)
WR (fl.oz./cwt)
Average Cube Strength (psi)Cube Strengths (psi)
σ n Max. Min. tCRIT tMAX tMIN OutlierMAX? OutlierMIN?
Outlier Analysis
104

105
Table 4.31. Outlier Analysis of 1-Day Cube Strengths for Combination 1-3 Mixtures.
Test 1 Test 2 Test 3 Avg.1-3 100 0 0 0 0 0.00 4917 4145 5018 4693 478 3 5018 4145 1.153 0.680 1.148 NO NO 46931-3 100 0 0 0 0 2.75 4088 4336 4103 4176 139 3 4336 4088 1.153 1.153 0.628 YES NO 41761-3 100 0 0 0 0 5.00 3030 3092 3137 3086 54 3 3137 3030 1.153 0.941 1.050 NO NO 30861-3 75 25 0 0 0 0.00 2790 2708 2825 2774 60 3 2825 2708 1.153 0.849 1.102 NO NO 27741-3 75 25 0 0 0 2.75 2064 2002 2028 2031 31 3 2064 2002 1.153 1.052 0.938 NO NO 20311-3 75 25 0 0 0 5.00 1622 1646 1659 1642 19 3 1659 1622 1.153 0.877 1.089 NO NO 16421-3 50 50 0 0 0 0.00 626 656 683 655 29 3 683 626 1.153 0.982 1.017 NO NO 6551-3 50 50 0 0 0 2.75 237 238 242 239 3 3 242 237 1.153 1.080 0.893 NO NO 2391-3 50 50 0 0 0 5.00 131 138 137 135 4 3 138 131 1.153 0.660 1.151 NO NO 1351-3 50 50 2 0 0 2.75 347 351 346 348 3 3 351 346 1.153 1.129 0.774 NO NO 3481-3 50 50 4 0 0 2.75 322 314 309 315 6 3 322 309 1.153 1.078 0.898 NO NO 3151-3 50 50 4 5 0 2.75 659 663 648 656 8 3 663 648 1.153 0.816 1.116 NO NO 6561-3 50 50 4 10 0 2.75 684 685 722 697 22 3 722 684 1.153 1.155 0.594 YES NO 6971-3 50 50 4 0 10 2.75 666 656 660 660 5 3 666 656 1.153 1.080 0.894 NO NO 6601-3 50 50 4 0 20 2.75 622 599 597 606 13 3 622 597 1.153 1.152 0.649 NO NO 6061-3 30 70 0 0 0 0.00 21 11 16 16 5 3 21 11 1.153 1.000 1.000 NO NO 161-3 30 70 0 0 0 2.75 55 58 61 58 3 3 61 55 1.153 1.042 0.952 NO NO 581-3 30 70 0 0 0 5.00 58 56 62 59 3 3 62 56 1.153 1.130 0.772 NO NO 591-3 30 70 2 0 0 2.75 63 65 63 64 1 3 65 63 1.153 1.152 0.641 NO NO 641-3 30 70 4 0 0 2.75 219 207 209 212 6 3 219 207 1.153 1.134 0.755 NO NO 2121-3 30 70 4 5 0 2.75 241 247 244 244 3 3 247 241 1.153 0.945 1.048 NO NO 2441-3 30 70 4 10 0 2.75 231 235 255 240 13 3 255 231 1.153 1.134 0.756 NO NO 2401-3 30 70 4 0 10 2.75 270 286 268 275 10 3 286 268 1.153 1.149 0.672 NO NO 2751-3 30 70 4 0 20 2.75 431 455 444 443 12 3 455 431 1.153 0.959 1.037 NO NO 443
Outlier AnalysisAverage Cube Strength (psi)Cement
(%)Fly Ash
(%)Gypsum
(%)Lime (%)
RSC (%)
WR (fl.oz./cwt)
Cube Strengths (psi)σ OutlierMAX? OutlierMIN?Max. Min. tCRIT tMAX tMIN
Nominal Proportions
nCombination
105

106
Table 4.32. Outlier Analysis of 3-Day Cube Strengths for Combination 1-3 Mixtures.
Test 1 Test 2 Test 3 Avg.1-3 100 0 0 0 0 0.00 8091 7844 7742 7892 179 3 8091 7742 1.153 1.107 0.838 NO NO 78921-3 100 0 0 0 0 2.75 7842 8004 7867 7905 87 3 8004 7842 1.153 1.142 0.718 NO NO 79051-3 100 0 0 0 0 5.00 7641 7684 8046 7790 222 3 8046 7641 1.153 1.149 0.673 NO NO 77901-3 75 25 0 0 0 0.00 4422 5298 4566 4762 470 3 5298 4422 1.153 1.141 0.724 NO NO 47621-3 75 25 0 0 0 2.75 5308 5406 5447 5387 71 3 5447 5308 1.153 0.840 1.106 NO NO 53871-3 75 25 0 0 0 5.00 4815 4989 5079 4961 134 3 5079 4815 1.153 0.878 1.088 NO NO 49611-3 50 50 0 0 0 0.00 2405 2217 2389 2337 104 3 2405 2217 1.153 0.652 1.151 NO NO 23371-3 50 50 0 0 0 2.75 2500 2425 2326 2417 87 3 2500 2326 1.153 0.949 1.044 NO NO 24171-3 50 50 0 0 0 5.00 2182 2125 2169 2159 30 3 2182 2125 1.153 0.775 1.129 NO NO 21591-3 50 50 2 0 0 2.75 2017 2191 2186 2131 99 3 2191 2017 1.153 0.604 1.154 NO YES 21311-3 50 50 4 0 0 2.75 2261 2197 2238 2232 33 3 2261 2197 1.153 0.890 1.082 NO NO 22321-3 50 50 4 5 0 2.75 2563 2608 2677 2616 57 3 2677 2563 1.153 1.059 0.928 NO NO 26161-3 50 50 4 10 0 2.75 2808 2783 2638 2743 92 3 2808 2638 1.153 0.705 1.145 NO NO 27431-3 50 50 4 0 10 2.75 3021 2796 2886 2901 114 3 3021 2796 1.153 1.058 0.929 NO NO 29011-3 50 50 4 0 20 2.75 2997 2948 2848 2931 76 3 2997 2848 1.153 0.865 1.095 NO NO 29311-3 30 70 0 0 0 0.00 74 70 82 75 6 3 82 70 1.153 1.103 0.847 NO NO 751-3 30 70 0 0 0 2.75 70 72 71 71 1 3 72 70 1.153 0.816 1.115 NO NO 711-3 30 70 0 0 0 5.00 78 69 82 76 6 3 82 69 1.153 0.894 1.080 NO NO 761-3 30 70 2 0 0 2.75 453 460 457 457 3 3 460 453 1.153 0.987 1.012 NO NO 4571-3 30 70 4 0 0 2.75 1020 983 991 998 20 3 1020 983 1.153 1.127 0.782 NO NO 9981-3 30 70 4 5 0 2.75 918 929 893 913 18 3 929 893 1.153 0.839 1.107 NO NO 9131-3 30 70 4 10 0 2.75 747 782 813 781 33 3 813 747 1.153 0.977 1.021 NO NO 7811-3 30 70 4 0 10 2.75 1009 1008 1019 1012 6 3 1019 1008 1.153 1.151 0.654 NO NO 10121-3 30 70 4 0 20 2.75 539 630 533 567 54 3 630 533 1.153 1.153 0.628 YES NO 567
CombinationNominal Proportions
Cement (%)
Fly Ash (%)
Gypsum (%)
Lime (%)
RSC (%)
WR (fl.oz./cwt)
Outlier AnalysisAverage Cube Strength (psi)Cube Strengths (psi)
σ n Max. Min. tCRIT tMAX tMIN OutlierMAX? OutlierMIN?
106

107
Table 4.33. Outlier Analysis of 7-Day Cube Strengths for Combination 1-3 Mixtures.
Test 1 Test 2 Test 3 Avg.1-3 100 0 0 0 0 0.00 8746 8851 9396 8998 349 3 9396 8746 1.153 1.142 0.721 NO NO 89981-3 100 0 0 0 0 2.75 9602 8946 8498 9015 555 3 9602 8498 1.153 1.057 0.931 NO NO 90151-3 100 0 0 0 0 5.00 9755 8727 8694 9059 603 3 9755 8694 1.153 1.154 0.604 YES NO 90591-3 75 25 0 0 0 0.00 7086 7253 6762 7034 249 3 7253 6762 1.153 0.878 1.089 NO NO 70341-3 75 25 0 0 0 2.75 7334 7427 7789 7517 241 3 7789 7334 1.153 1.133 0.761 NO NO 75171-3 75 25 0 0 0 5.00 8453 8363 8012 8276 233 3 8453 8012 1.153 0.760 1.133 NO NO 82761-3 50 50 0 0 0 0.00 4050 4287 4318 4218 147 3 4318 4050 1.153 0.680 1.148 NO NO 42181-3 50 50 0 0 0 2.75 4387 4246 4233 4289 85 3 4387 4233 1.153 1.152 0.650 NO NO 42891-3 50 50 0 0 0 5.00 4017 3926 3851 3932 83 3 4017 3851 1.153 1.031 0.966 NO NO 39321-3 50 50 2 0 0 2.75 3954 3981 3978 3971 15 3 3981 3954 1.153 0.659 1.151 NO NO 39711-3 50 50 4 0 0 2.75 4106 4314 4159 4193 108 3 4314 4106 1.153 1.119 0.806 NO NO 41931-3 50 50 4 5 0 2.75 4480 4356 4360 4399 70 3 4480 4356 1.153 1.154 0.605 YES NO 43991-3 50 50 4 10 0 2.75 4170 4102 4282 4185 91 3 4282 4102 1.153 1.071 0.910 NO NO 41851-3 50 50 4 0 10 2.75 4502 4672 4589 4587 85 3 4672 4502 1.153 0.994 1.006 NO NO 45871-3 50 50 4 0 20 2.75 4857 4926 4571 4785 188 3 4926 4571 1.153 0.750 1.135 NO NO 47851-3 30 70 0 0 0 0.00 91 95 94 93 2 3 95 91 1.153 0.899 1.077 NO NO 931-3 30 70 0 0 0 2.75 87 107 114 103 14 3 114 87 1.153 0.795 1.123 NO NO 1031-3 30 70 0 0 0 5.00 103 85 106 98 11 3 106 85 1.153 0.723 1.141 NO NO 981-3 30 70 2 0 0 2.75 1393 1513 1471 1459 61 3 1513 1393 1.153 0.889 1.083 NO NO 14591-3 30 70 4 0 0 2.75 1651 1708 1729 1696 40 3 1729 1651 1.153 0.817 1.115 NO NO 16961-3 30 70 4 5 0 2.75 1584 1659 1545 1596 58 3 1659 1545 1.153 1.089 0.878 NO NO 15961-3 30 70 4 10 0 2.75 1403 1456 1437 1432 27 3 1456 1403 1.153 0.899 1.077 NO NO 14321-3 30 70 4 0 10 2.75 1860 1816 1949 1875 68 3 1949 1816 1.153 1.094 0.867 NO NO 18751-3 30 70 4 0 20 2.75 2432 2435 2427 2431 4 3 2435 2427 1.153 0.881 1.087 NO NO 2431
CombinationNominal Proportions
Cement (%)
Fly Ash (%)
Gypsum (%)
Lime (%)
RSC (%)
WR (fl.oz./cwt) tMAX tMIN OutlierMAX?
Outlier AnalysisAverage Cube Strength (psi)Cube Strengths (psi)
σ n Max. Min. tCRIT OutlierMIN?
107

108
Table 4.34. Outlier Analysis of 28-Day Cube Strengths for Combination 1-3 Mixtures.
Test 1 Test 2 Test 3 Avg.1-3 100 0 0 0 0 0.00 11237 11165 11500 11300 176 3 11500 11165 1.153 1.131 0.769 NO NO 113001-3 100 0 0 0 0 2.75 12902 12812 12291 12668 330 3 12902 12291 1.153 0.709 1.144 NO NO 126681-3 100 0 0 0 0 5.00 11127 12223 11667 11673 548 3 12223 11127 1.153 1.005 0.995 NO NO 116731-3 75 25 0 0 0 0.00 11641 10060 10407 10703 831 3 11641 10060 1.153 1.129 0.774 NO NO 107031-3 75 25 0 0 0 2.75 10421 10604 10706 10577 144 3 10706 10421 1.153 0.892 1.081 NO NO 105771-3 75 25 0 0 0 5.00 11553 10807 11245 11201 375 3 11553 10807 1.153 0.937 1.053 NO NO 112011-3 50 50 0 0 0 0.00 7641 8195 7787 7874 287 3 8195 7641 1.153 1.117 0.813 NO NO 78741-3 50 50 0 0 0 2.75 6015 5570 5900 5828 231 3 6015 5570 1.153 0.807 1.119 NO NO 58281-3 50 50 0 0 0 5.00 6086 6193 5928 6069 133 3 6193 5928 1.153 0.929 1.059 NO NO 60691-3 50 50 2 0 0 2.75 5669 5602 5595 5622 41 3 5669 5595 1.153 1.151 0.659 NO NO 56221-3 50 50 4 0 0 2.75 5855 5724 5905 5828 94 3 5905 5724 1.153 0.823 1.113 NO NO 58281-3 50 50 4 5 0 2.75 5909 6025 5974 5969 58 3 6025 5909 1.153 0.956 1.039 NO NO 59691-3 50 50 4 10 0 2.75 5509 5240 5448 5399 141 3 5509 5240 1.153 0.782 1.127 NO NO 53991-3 50 50 4 0 10 2.75 6600 6651 6732 6661 67 3 6732 6600 1.153 1.065 0.919 NO NO 66611-3 50 50 4 0 20 2.75 7198 7103 7149 7150 47 3 7198 7103 1.153 1.011 0.988 NO NO 71501-3 30 70 0 0 0 0.00 2522 2450 2455 2475 40 3 2522 2450 1.153 1.152 0.638 NO NO 24751-3 30 70 0 0 0 2.75 2523 2679 2560 2588 81 3 2679 2523 1.153 1.124 0.790 NO NO 25881-3 30 70 0 0 0 5.00 2470 2595 2446 2504 80 3 2595 2446 1.153 1.142 0.720 NO NO 25041-3 30 70 2 0 0 2.75 2897 2771 2825 2831 64 3 2897 2771 1.153 1.045 0.948 NO NO 28311-3 30 70 4 0 0 2.75 2705 2995 2970 2890 161 3 2995 2705 1.153 0.652 1.151 NO NO 28901-3 30 70 4 5 0 2.75 2663 2601 2742 2669 70 3 2742 2601 1.153 1.037 0.958 NO NO 26691-3 30 70 4 10 0 2.75 2673 2653 2728 2685 39 3 2728 2653 1.153 1.118 0.808 NO NO 26851-3 30 70 4 0 10 2.75 3594 3436 3601 3544 93 3 3601 3436 1.153 0.612 1.154 NO YES 35441-3 30 70 4 0 20 2.75 4330 4351 4403 4362 38 3 4403 4330 1.153 1.110 0.831 NO NO 4362
CombinationNominal Proportions
Cement (%)
Fly Ash (%)
Gypsum (%)
Lime (%)
RSC (%)
WR (fl.oz./cwt) OutlierMIN?
Outlier AnalysisAverage Cube Strength (psi)Cube Strengths (psi)
σ n Max. Min. tCRIT tMAX tMIN OutlierMAX?
108

109
Table 4.35. Outlier Analysis of 56-Day Cube Strengths for Combination 1-3 Mixtures.
Test 1 Test 2 Test 3 Avg.1-3 100 0 0 0 0 0.00 11599 11509 11856 11655 180 3 11856 11509 1.153 1.118 0.809 NO NO 116551-3 100 0 0 0 0 2.75 13994 14006 13937 13979 37 3 14006 13937 1.153 0.738 1.138 NO NO 139791-3 100 0 0 0 0 5.00 14060 13435 13948 13814 333 3 14060 13435 1.153 0.738 1.138 NO NO 138141-3 75 25 0 0 0 0.00 11716 11789 12010 11838 153 3 12010 11716 1.153 1.121 0.799 NO NO 118381-3 75 25 0 0 0 2.75 11884 11944 11805 11877 69 3 11944 11805 1.153 0.952 1.042 NO NO 118771-3 75 25 0 0 0 5.00 11869 12037 11833 11913 108 3 12037 11833 1.153 1.139 0.735 NO NO 119131-3 50 50 0 0 0 0.00 7466 7650 7323 7480 164 3 7650 7323 1.153 1.039 0.956 NO NO 74801-3 50 50 0 0 0 2.75 6999 6652 7093 6915 232 3 7093 6652 1.153 0.767 1.131 NO NO 69151-3 50 50 0 0 0 5.00 7374 7076 7245 7232 149 3 7374 7076 1.153 0.951 1.043 NO NO 72321-3 50 50 2 0 0 2.75 7172 7494 7395 7354 165 3 7494 7172 1.153 0.852 1.101 NO NO 73541-3 50 50 4 0 0 2.75 6919 7044 6994 6986 63 3 7044 6919 1.153 0.931 1.057 NO NO 69861-3 50 50 4 5 0 2.75 6375 6401 6403 6393 16 3 6403 6375 1.153 0.634 1.153 NO NO 63931-3 50 50 4 10 0 2.75 6156 5881 5878 5972 159 3 6156 5878 1.153 1.155 0.588 YES NO 59721-3 50 50 4 0 10 2.75 8155 8332 8259 8249 89 3 8332 8155 1.153 0.937 1.053 NO NO 82491-3 50 50 4 0 20 2.75 8391 8396 8653 8480 150 3 8653 8391 1.153 1.155 0.595 YES NO 84801-3 30 70 0 0 0 0.00 3126 3210 ----- 3168 ----- -- ----- ----- ----- ----- ----- ----- ----- 31681-3 30 70 0 0 0 2.75 3596 3958 4048 3867 239 3 4048 3596 1.153 0.755 1.134 NO NO 38671-3 30 70 0 0 0 5.00 3316 3504 3423 3414 94 3 3504 3316 1.153 0.951 1.043 NO NO 34141-3 30 70 2 0 0 2.75 3629 3928 3747 3768 151 3 3928 3629 1.153 1.062 0.923 NO NO 37681-3 30 70 4 0 0 2.75 3632 3860 3757 3750 114 3 3860 3632 1.153 0.966 1.031 NO NO 37501-3 30 70 4 5 0 2.75 3224 3321 3329 3291 58 3 3329 3224 1.153 0.643 1.152 NO NO 32911-3 30 70 4 10 0 2.75 3030 3099 3226 3118 100 3 3226 3030 1.153 1.084 0.887 NO NO 31181-3 30 70 4 0 10 2.75 4341 4217 4435 4331 110 3 4435 4217 1.153 0.951 1.043 NO NO 43311-3 30 70 4 0 20 2.75 5507 5977 5955 5813 265 3 5977 5507 1.153 0.619 1.154 NO YES 5966
CombinationNominal Proportions
Cement (%)
Fly Ash (%)
Gypsum (%)
Lime (%)
RSC (%)
WR (fl.oz./cwt) OutlierMAX? OutlierMIN?
Outlier AnalysisAverage Cube Strength (psi)Cube Strengths (psi)
σ n Max. Min. tCRIT tMAX tMIN
109

110
4.2.2. Effects of Water Reducer Addition. The effects of a Type A/F water
reducing admixture were evaluated at a low dose, 2.75 fluid ounces/hundredweight, and a
high dose, 5.00 fluid ounces/hundredweight. These dosages were added to the paste
mixtures at the 0, 25, 50, and 70 percent fly ash replacement levels.
The effect of the water reducer on compressive strength was varied for both
combinations. Figures 4.22 and 4.23 show the effect of the water reducer on one-day
cube strengths for Combinations 4-1 and 1-3, respectively. The 100 percent cement
mixture for Combination 4-1 shows increasing strengths with greater water reducer
dosage. This is expected, because the addition of a water reducer is generally known to
increase dispersion of cement particles, resulting in greater strengths. For Combination 1-
3, however, increasing dosages led to decreased strengths. Also, for the mixtures
containing fly ash, increasing water reducer dosages typically resulted in lower strengths
at one day.
The results of the 56-day cube compressive strength tests with increasing water
reducer dosages for Combinations 4-1 and 1-3 are shown below in Figures 4.24 and 4.25,
respectively. As can be seen, the addition of the water reducer resulted in 56-day
strengths that were similar to or exceeded the baseline mixtures with no water reducer
addition. At ages between one and 56 days, the results generally trended from those at
one day to those at 56 days with respect to the mixtures that did not include the water
reducer.

111
Figure 4.22. Effect of Water Reducer on One-Day Cube Strengths for Combination 4-1
Figure 4.23. Effect of Water Reducer on One-Day Cube Strengths for Combination 1-3

112
Figure 4.24. Effect of Water Reducer on 56-Day Cube Strengths for Combination 4-1
Figure 4.25. Effect of Water Reducer on 56-Day Cube Strengths for Combination 1-3

113
The calorimetry results are shown in Table 4.36 for mixtures with the two water
reducer dosages and corresponding mixtures without the water reducer. As can be seen,
the water reducer addition did not result in significant changes in curve shape for the
mixtures. The exception to this is Combination 1-3 with 70 percent fly ash, which
changed from a Type G to Type F curve with the addition of a water reducer. This may
be explained by the increased dispersion, and therefore increased hydration rate, caused
by the water reducer. This would lead to increased aluminate hydration, which may
suppress silicate hydration if a majority of the calcium was consumed by the aluminates.
The results also show that increased dosages led to a delay in the main hydration curve
for all fly ash replacement levels, based on the predicted final set by the Percentage
Method. An example of this effect is shown in the series of curves in Figure 4.26, below.
Similar effects were found by Bentz (2010) with the addition of a water-reducing
admixture. Two exceptions in this study were Combination 4-1 with 100 percent cement,
which decreased by 39 minutes with the high dosage, and Combination 1-3 with 70
percent fly ash, which decreased 5 minutes with the low dosage. This may be caused by
the effects of sulfate imbalance, as discussed in the Screening Study Results section. The
curves for all mixtures are included in Appendix D.

114
Figure 4.26. Thermal Curves Showing the Retarding Effect of Water Reducer

115
Table 4.36. Calorimetry Results for Mixtures with Increasing Water Reducer Dosages
Initial Set (min)
Final Set (min)
Initial Set (min)
Final Set (min)
4-1 100 0 0 0 0 0.00 A 108.25 486 102.35 288 353 352 3764-1 100 0 0 0 0 2.75 A 107.74 551 105.17 347 413 407 4354-1 100 0 0 0 0 5.00 A 116.16 501 112.74 314 374 373 3954-1 75 25 0 0 0 0.00 A 99.92 567 90.53 306 374 365 3904-1 75 25 0 0 0 2.75 A 97.39 618 91.73 345 420 424 4404-1 75 25 0 0 0 5.00 A 88.80 753 82.75 483 569 572 5924-1 50 50 0 0 0 0.00 A 58.97 785 50.61 475 573 579 5994-1 50 50 0 0 0 2.75 A 59.37 846 50.66 543 639 642 6634-1 50 50 0 0 0 5.00 A 57.82 948 50.06 621 722 722 7444-1 30 70 0 0 0 0.00 B 35.17 794 25.68 537 640 669 6874-1 30 70 0 0 0 2.75 B 28.98 964 20.25 680 796 833 8514-1 30 70 0 0 0 5.00 B 30.61 984 22.88 707 812 473 8531-3 100 0 0 0 0 0.00 A 98.91 501 91.62 264 321 303 3251-3 100 0 0 0 0 2.75 A 103.14 532 95.84 314 378 361 3881-3 100 0 0 0 0 5.00 A 92.43 636 83.58 407 481 477 4961-3 75 25 0 0 0 0.00 A 72.96 749 63.27 392 469 444 4711-3 75 25 0 0 0 2.75 A 80.95 757 70.36 423 490 457 4801-3 75 25 0 0 0 5.00 A 72.64 836 62.53 502 577 544 5751-3 50 50 0 0 0 0.00 C 33.58 1050 24.27 477 572 512 5601-3 50 50 0 0 0 2.75 C 34.69 1245 23.07 493 778 335 4981-3 50 50 0 0 0 5.00 C 30.88 1497 20.77 564 1020 522 5611-3 30 70 0 0 0 0.00 G 22.25 94 12.50 26 41 33 431-3 30 70 0 0 0 2.75 F 19.85 92 12.13 27 36 32 361-3 30 70 0 0 0 5.00 F 19.26 96 12.44 27 38 33 38
M (°F)
Setting Time Predictions
Cement (%)
Fly Ash (%)
Gypsum (%)
Lime (%)
RSC (%)
WR (fl.oz./cwt)
Percentage Method Derivatives Combination
Nominal ProportionsCurve Type
ΔTmax
(°F)
Time at ΔTmax
(min)
115

116
The results of the miniature slump testing for mixtures with the low and high
water reducer dosages are shown below in Table 4.37. Plots of the results can be found in
Appendix E. Generally, as was expected, an increase in water reducer dosage resulted in
increased pat area at all test times. Exceptions to this are the 50% and 70% fly ash
mixtures for Combination 1-3. The low dosage with 50% fly ash and both dosages with
70% fly ash both show rapidly decreasing pat areas over time. For the 70% fly ash
mixtures, some tests at later times were not able to be performed due to the stiffness of
the paste. A sulfate imbalance, which resulted in rapid aluminate hydration, could explain
the rapid setting behavior of some of these mixtures. For the zero and 25 percent fly ash
mixtures at both water reducer dosages, the pat area typically increased at early ages and
then began to gradually decrease, starting at five or fifteen minutes. This may have
occurred because, even though the water reducer was added with the mixing water, it
may have taken a period of time for the admixture to become active. However,
Combination 1-3 with zero percent fly ash had increasing pat areas through 45 minutes
for both dosages. An explanation for this behavior has not yet been found. The 50 and 70
percent fly ash mixtures showed decreasing pat areas over time, except for the 50 percent
fly ash mixtures with the high water reducer dosage, which both increased from two to
five minutes. A majority of the mixtures showed early stiffening behavior according to
the guidelines presented by Roberts & Taylor (2007). Also, many of the mixtures had
early stiffening indices greater than 1.00, which means that the pat areas for these
mixtures increased from five to thirty minutes.
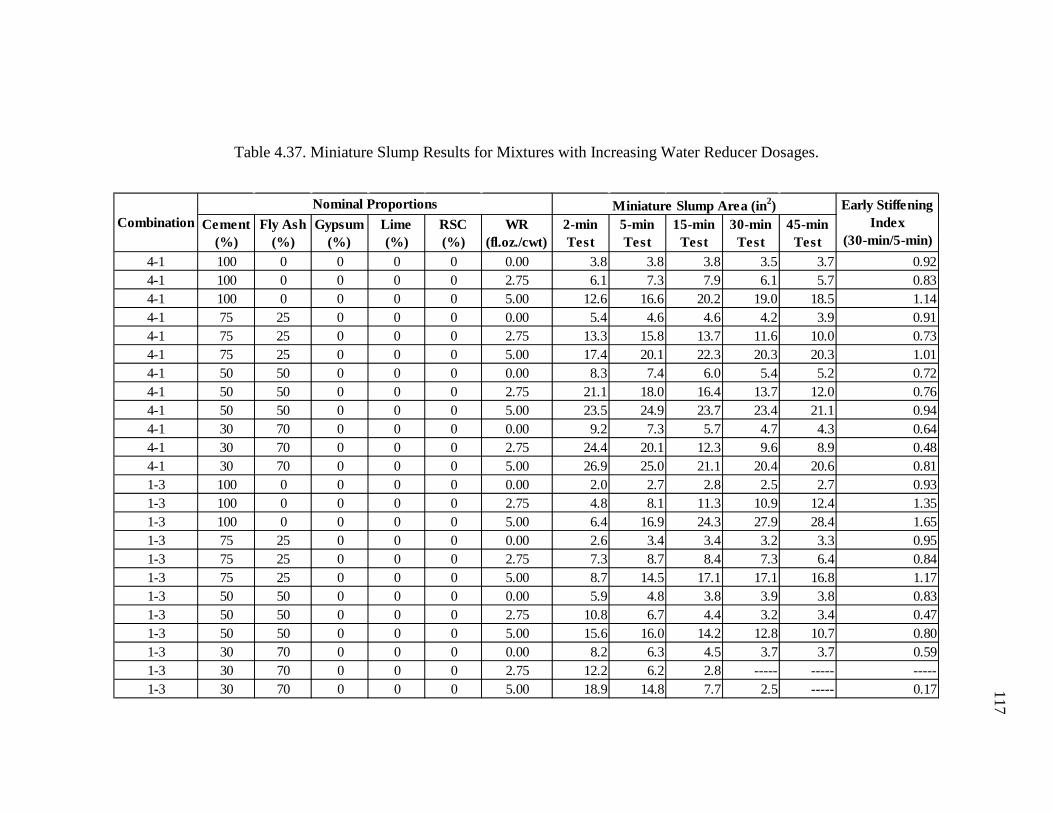
117
Table 4.37. Miniature Slump Results for Mixtures with Increasing Water Reducer Dosages.
4-1 100 0 0 0 0 0.00 3.8 3.8 3.8 3.5 3.7 0.924-1 100 0 0 0 0 2.75 6.1 7.3 7.9 6.1 5.7 0.834-1 100 0 0 0 0 5.00 12.6 16.6 20.2 19.0 18.5 1.144-1 75 25 0 0 0 0.00 5.4 4.6 4.6 4.2 3.9 0.914-1 75 25 0 0 0 2.75 13.3 15.8 13.7 11.6 10.0 0.734-1 75 25 0 0 0 5.00 17.4 20.1 22.3 20.3 20.3 1.014-1 50 50 0 0 0 0.00 8.3 7.4 6.0 5.4 5.2 0.724-1 50 50 0 0 0 2.75 21.1 18.0 16.4 13.7 12.0 0.764-1 50 50 0 0 0 5.00 23.5 24.9 23.7 23.4 21.1 0.944-1 30 70 0 0 0 0.00 9.2 7.3 5.7 4.7 4.3 0.644-1 30 70 0 0 0 2.75 24.4 20.1 12.3 9.6 8.9 0.484-1 30 70 0 0 0 5.00 26.9 25.0 21.1 20.4 20.6 0.811-3 100 0 0 0 0 0.00 2.0 2.7 2.8 2.5 2.7 0.931-3 100 0 0 0 0 2.75 4.8 8.1 11.3 10.9 12.4 1.351-3 100 0 0 0 0 5.00 6.4 16.9 24.3 27.9 28.4 1.651-3 75 25 0 0 0 0.00 2.6 3.4 3.4 3.2 3.3 0.951-3 75 25 0 0 0 2.75 7.3 8.7 8.4 7.3 6.4 0.841-3 75 25 0 0 0 5.00 8.7 14.5 17.1 17.1 16.8 1.171-3 50 50 0 0 0 0.00 5.9 4.8 3.8 3.9 3.8 0.831-3 50 50 0 0 0 2.75 10.8 6.7 4.4 3.2 3.4 0.471-3 50 50 0 0 0 5.00 15.6 16.0 14.2 12.8 10.7 0.801-3 30 70 0 0 0 0.00 8.2 6.3 4.5 3.7 3.7 0.591-3 30 70 0 0 0 2.75 12.2 6.2 2.8 ----- ----- -----1-3 30 70 0 0 0 5.00 18.9 14.8 7.7 2.5 ----- 0.17
CombinationNominal Proportions Miniature Slump Area (in2) Early Stiffening
Index (30-min/5-min)
Cement (%)
Fly Ash (%)
Gypsum (%)
Lime (%)
RSC (%)
WR (fl.oz./cwt)
2-min Test
5-min Test
15-min Test
30-min Test
45-min Test
117

118
Table 4.38, below, summarizes the results of the Vicat setting time test for
mixtures with increasing water reducer dosages. It shows that, generally, as the water
reducer dosage increases, initial set increases, except for Combination 1-3 mixtures with
50 and 70 percent fly ash. Final set also increases with increased water reducer dosage,
except for Combination 1-3 with 70 percent fly ash. Also, the final set time for
Combination 4-1 with 25 percent fly ash decreased by 15 minutes with the low dose, but
increased significantly with the high dose. Sulfate imbalance, resulting in rapid setting
behavior, would explain the decrease in setting times for the mixtures with higher fly ash
contents. The results also show that, as expected, the water required to achieve normal
consistency usually decreased with increased dosages of the water reducer. The mixtures
with 50 and 70 percent fly ash for Combination 1-3 showed little or no change in water
requirement with the addition of the water reducer.
4.2.3. Effects of Gypsum Addition. The effects of gypsum addition were
evaluated for both combinations at the 50 and 70 percent fly ash replacement levels. The
two levels of gypsum addition were two and four percent, nominally.

119
Table 4.38. Vicat Results for Mixtures with Increasing Water Reducer Dosages
The effect of gypsum addition on the strength gain of the two combinations can
be seen below in Figures 4.27 and 4.28. For Combination 4-1, the strengths after one day
were slightly increased with increased gypsum addition, except for the 70 percent fly ash
mixtures at 56 days. Here, the mixture with zero percent gypsum was greater than the 2
percent gypsum mixture and very close to the 4 percent gypsum mixture. Similar trends
were seen for the Combination 1-3 mixtures, but with a significant difference in the 70
percent fly ash mixtures at early ages. As can be seen in the figure below, the 70 percent
fly ash mixture with no gypsum experiences very little strength gain through seven days.
4-1 100 0 0 0 0 0.00 24.0 81 1804-1 100 0 0 0 0 2.75 24.5 138 2554-1 100 0 0 0 0 5.00 23.5 167 3754-1 75 25 0 0 0 0.00 23.0 132 2704-1 75 25 0 0 0 2.75 22.5 137 2554-1 75 25 0 0 0 5.00 21.0 190 4204-1 50 50 0 0 0 0.00 21.5 107 3004-1 50 50 0 0 0 2.75 20.0 87 3454-1 50 50 0 0 0 5.00 18.5 126 4504-1 30 70 0 0 0 0.00 20.5 14 2854-1 30 70 0 0 0 2.75 19.0 18 4204-1 30 70 0 0 0 5.00 16.5 38 4501-3 100 0 0 0 0 0.00 26.0 110 2101-3 100 0 0 0 0 2.75 25.5 147 3151-3 100 0 0 0 0 5.00 24.0 171 3601-3 75 25 0 0 0 0.00 24.5 171 3751-3 75 25 0 0 0 2.75 23.5 214 5101-3 75 25 0 0 0 5.00 23.0 238 5551-3 50 50 0 0 0 0.00 21.5 142 4351-3 50 50 0 0 0 2.75 21.5 65 4951-3 50 50 0 0 0 5.00 21.0 73 5101-3 30 70 0 0 0 0.00 20.0 49 5251-3 30 70 0 0 0 2.75 20.0 17 1351-3 30 70 0 0 0 5.00 20.0 12 90
CombinationNominal Proportions Water for Normal
Consistency (0.5%)
Vicat ResultsCement
(%)Fly Ash
(%)Gypsum
(%)Lime (%)
RSC (%)
WR (fl.oz./cwt)
Initial Set (min)
Final Set (min)

120
The strength gain curve was restored with the addition of 2 percent gypsum and showed
further increases in early strengths with the addition of 4 percent gypsum. This indicates
that the gypsum addition corrected the sulfate imbalance of this system.
Figure 4.27. Effect of Gypsum Addition on Strength Gain for Combination 4-1

121
Figure 4.28. Effect of Gypsum Addition on Strength Gain for Combination 1-3
The calorimetry results for the mixtures containing additional gypsum are shown
in Table 4.39, along with corresponding mixtures without additional gypsum. Plots of the
curves can be found in Appendix D. The curves shapes were not significantly affected by
the addition of gypsum, except for Combination 1-3 with 70 percent fly ash. Here, the
changes in curve shape with increased gypsum additions may be indicative of less severe
sulfate depletion. An asterisk was placed next to the letter C for Combination 1-3 with 50
percent fly ash and 4 percent gypsum. This is because the curve shape for the mixture
was similar to Type C except that the small bump occurred after the curve had reached
the peak temperature. According to ASTM C 1679, this indicates that sulfate depletion
occurred at a later time than it did for the zero and two percent gypsum mixtures. For the

122
Combination 4-1 mixtures, the predicted final set time increased with increasing gypsum
levels. For Combination 1-3, with increasing gypsum levels, the predicted final set time
for the 50 percent fly ash mixture decreased with 2 percent gypsum and then increased
with 4 percent gypsum. The predicted final set time for the 70 percent fly ash mixture
increased with 2 percent gypsum and then decreased with 4 percent gypsum. Figure 4.29
shows a series of thermal curves with increasing gypsum additions. As can be seen, the
overall curve shape is not significantly changed, but the positions of the curves are
slightly delayed.
Figure 4.29. Series of Thermal Curves Showing the Effect of Gypsum Addition

123
Table 4.39. Calorimetry Results for Mixtures with Increasing Gypsum Additions
Initial Set (min)
Final Set (min)
Initial Set (min)
Final Set (min)
4-1 50 50 0 0 0 2.75 A 59.37 846 50.66 543 639 642 6634-1 50 50 2 0 0 2.75 A 58.36 908 49.79 588 697 713 7364-1 50 50 4 0 0 2.75 A 58.34 962 49.42 630 756 788 8134-1 30 70 0 0 0 2.75 B 28.98 964 20.25 680 796 833 8514-1 30 70 2 0 0 2.75 B 33.32 995 25.76 684 812 852 8724-1 30 70 4 0 0 2.75 B 34.39 1148 27.14 787 947 1015 10341-3 50 50 0 0 0 2.75 C 34.69 1245 23.07 493 778 335 4981-3 50 50 2 0 0 2.75 C 33.35 1130 22.69 590 686 672 7041-3 50 50 4 0 0 2.75 C* 39.27 993 28.70 644 756 777 8021-3 30 70 0 0 0 2.75 F 19.85 92 12.13 27 36 32 361-3 30 70 2 0 0 2.75 G 18.41 209 10.76 26 44 55 561-3 30 70 4 0 0 2.75 B 15.62 126 7.52 25 37 50 51
M (°F)
Setting Time Predictions
Cement (%)
Fly Ash (%)
Gypsum (%)
Lime (%)
RSC (%)
WR (fl.oz./cwt)
Percentage Method Derivatives Combination
Nominal ProportionsCurve Type
ΔTmax
(°F)
Time at ΔTmax
(min)
123

124
The miniature slump testing results for mixtures with added gypsum are shown in
Table 4.40, below. Plots of these results can be found in Appendix E. These results show
that for both combinations the addition of gypsum had little effect on the flow of the
paste with 50 percent fly ash. With 70 percent fly ash, Combination 4-1 was not
significantly affect by the 2 percent addition of gypsum, but maintained greater flow over
time with 4 percent gypsum addition. For Combination 1-3 with 70 percent fly ash, the
addition of gypsum appeared to have little effect at early ages. Beyond fifteen minutes,
the miniature slump test was not able to be performed on this mixture without the
addition of gypsum. This indicates that the paste stiffened less over time with the gypsum
additions. All of the mixtures in the table below had early stiffening indices which were
less than the 0.85 criteria. This indicates that all of the mixtures had early stiffening
tendencies, though these were generally lessened with the addition of gypsum.
The Vicat setting time results are shown below in Table 4.41. For Combination 4-
1, at both fly ash replacement levels, the 2 percent gypsum addition increased initial set.
The addition of 4 percent gypsum resulted in an initial set time less than at 2 percent
gypsum but greater than at zero percent gypsum. For Combination 1-3, both gypsum
additions increased initial set time for the 50 percent fly ash mixtures. The 70 percent fly
ash mixture had an initial set time decreased by two minutes with the 2 percent addition,
but increased with the 4 percent addition. The addition of gypsum increased final set
times, except for Combination 4-1 with 70 percent fly ash. The final set time for this
mixture decreased by 15 minutes with the addition of 2 percent gypsum, but increased
with the 4 percent addition. The water required for normal consistency was not affected
by more than 0.5 percent with the addition of gypsum.

125
Table 4.40. Miniature Slump Results for Mixtures with Increasing Gypsum Additions
4-1 50 50 0 0 0 2.75 21.1 18.0 16.4 13.7 12.0 0.764-1 50 50 2 0 0 2.75 20.2 19.6 15.5 13.9 11.8 0.714-1 50 50 4 0 0 2.75 20.1 18.3 15.0 13.2 12.3 0.724-1 30 70 0 0 0 2.75 24.4 20.1 12.3 9.6 8.9 0.484-1 30 70 2 0 0 2.75 24.0 20.1 12.2 9.3 8.7 0.464-1 30 70 4 0 0 2.75 24.2 21.1 15.2 12.8 11.6 0.611-3 50 50 0 0 0 2.75 10.8 6.7 4.4 3.2 3.4 0.471-3 50 50 2 0 0 2.75 9.8 7.6 4.8 4.0 4.0 0.531-3 50 50 4 0 0 2.75 10.4 7.1 4.7 4.0 3.6 0.561-3 30 70 0 0 0 2.75 12.2 6.2 2.8 ----- ----- -----1-3 30 70 2 0 0 2.75 12.8 6.0 3.2 2.3 2.4 0.391-3 30 70 4 0 0 2.75 14.5 6.0 3.1 2.5 2.3 0.42
CombinationNominal Proportions Miniature Slump Area (in2) Early Stiffening
Index (30-min/5-min)
Cement (%)
Fly Ash (%)
Gypsum (%)
Lime (%)
RSC (%)
WR (fl.oz./cwt)
2-min Test
5-min Test
15-min Test
30-min Test
45-min Test
125
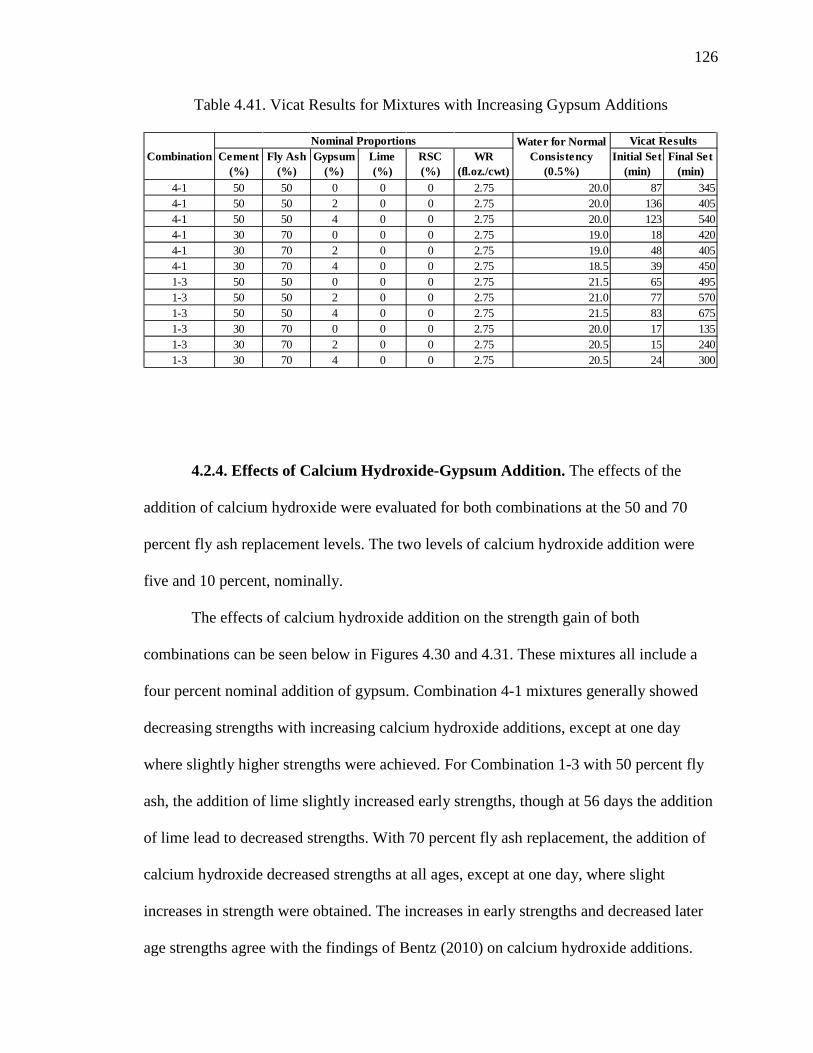
126
Table 4.41. Vicat Results for Mixtures with Increasing Gypsum Additions
4.2.4. Effects of Calcium Hydroxide-Gypsum Addition. The effects of the
addition of calcium hydroxide were evaluated for both combinations at the 50 and 70
percent fly ash replacement levels. The two levels of calcium hydroxide addition were
five and 10 percent, nominally.
The effects of calcium hydroxide addition on the strength gain of both
combinations can be seen below in Figures 4.30 and 4.31. These mixtures all include a
four percent nominal addition of gypsum. Combination 4-1 mixtures generally showed
decreasing strengths with increasing calcium hydroxide additions, except at one day
where slightly higher strengths were achieved. For Combination 1-3 with 50 percent fly
ash, the addition of lime slightly increased early strengths, though at 56 days the addition
of lime lead to decreased strengths. With 70 percent fly ash replacement, the addition of
calcium hydroxide decreased strengths at all ages, except at one day, where slight
increases in strength were obtained. The increases in early strengths and decreased later
age strengths agree with the findings of Bentz (2010) on calcium hydroxide additions.
4-1 50 50 0 0 0 2.75 20.0 87 3454-1 50 50 2 0 0 2.75 20.0 136 4054-1 50 50 4 0 0 2.75 20.0 123 5404-1 30 70 0 0 0 2.75 19.0 18 4204-1 30 70 2 0 0 2.75 19.0 48 4054-1 30 70 4 0 0 2.75 18.5 39 4501-3 50 50 0 0 0 2.75 21.5 65 4951-3 50 50 2 0 0 2.75 21.0 77 5701-3 50 50 4 0 0 2.75 21.5 83 6751-3 30 70 0 0 0 2.75 20.0 17 1351-3 30 70 2 0 0 2.75 20.5 15 2401-3 30 70 4 0 0 2.75 20.5 24 300
CombinationNominal Proportions Water for Normal
Consistency (0.5%)
Vicat ResultsCement
(%)Fly Ash
(%)Gypsum
(%)Lime (%)
RSC (%)
WR (fl.oz./cwt)
Initial Set (min)
Final Set (min)

127
Figure 4.30. Effect of Lime on Combination 4-1 Mixtures with Four Percent Gypsum
Figure 4.31. Effect of Lime on Combination 1-3 Mixtures with Four Percent Gypsum

128
The results of the semi-adiabatic calorimetry testing are shown below in Table
4.42 for mixtures with calcium hydroxide and gypsum. The thermal curves for these
mixtures can be found in Appendix D. These mixtures all include a nominal four percent
addition of gypsum. The curve shapes were not affected by the addition of calcium
hydroxide, expect for Combination 1-3 with 50 percent fly ash. Without calcium
hydroxide this mixture had a Type C curve with sulfate depletion occurring after the main
peak. With both calcium hydroxide additions, this mixture had Type A curves, which are
indicative of a normally hydrating mixture. This indicates that the increase in available
calcium may have accelerated the silicate hydration. The main hydration response rise
(M) changed by less than two degrees for all mixtures with the addition of calcium
hydroxide, indicating that the calcium hydroxide had little effect on the amount of heat
produced by the system. The predicted final set time by the Percentage Method generally
decreased for all mixtures as lime was added to the system, indicating that hydration was
accelerated. A typical series of thermal curves with increasing calcium hydroxide
additions is shown in Figure 4.32, below. This example shows that the curve shape and
magnitude of the main peak are relatively unchanged, while the position of the curve is
shifted to earlier times with calcium hydroxide addition.

129
Figure 4.32. Series of Thermal Curves Showing the Effect of Calcium Hydroxide
Addition
The miniature slump results for the mixtures containing calcium hydroxide and
gypsum are shown, below, in Table 4.43. Plots of these results are given in Appendix E.
For all mixtures at all test times, the miniature slump area decreased with increasing
calcium hydroxide addition, which may have been caused by an increased water demand
from the addition. The change in pat areas over time was similar for all calcium
hydroxide addition levels for all mixtures, including those with no calcium hydroxide.
For Combination 1-3 with 70 percent fly ash, the mixture with 10 percent calcium
hydroxide addition was too stiff to be tested after 15 minutes.

130
Table 4.42. Calorimetry Results for Mixtures with Increasing Calcium Hydroxide Additions and Four Percent Gypsum
Initial Set (min)
Final Set (min)
Initial Set (min)
Final Set (min)
4-1 50 50 4 0 0 2.75 A 58.34 962 49.42 630 756 788 8134-1 50 50 4 5 0 2.75 A 56.58 885 48.06 534 678 723 7454-1 50 50 4 10 0 2.75 A 59.37 631 49.42 325 444 478 4944-1 30 70 4 0 0 2.75 B 34.39 1148 27.14 787 947 1015 10344-1 30 70 4 5 0 2.75 B 37.37 720 28.69 394 547 610 6274-1 30 70 4 10 0 2.75 B 36.38 613 27.54 286 441 514 5271-3 50 50 4 0 0 2.75 C* 39.27 993 28.70 644 756 777 8021-3 50 50 4 5 0 2.75 A 41.25 792 28.62 406 497 496 5231-3 50 50 4 10 0 2.75 A 41.02 702 28.17 317 414 420 4441-3 30 70 4 0 0 2.75 B 15.62 126 7.52 25 37 50 511-3 30 70 4 5 0 2.75 B 21.69 620 6.55 439 508 520 5411-3 30 70 4 10 0 2.75 B 23.83 483 7.29 289 372 191 405
M (°F)
Setting Time Predictions
Cement (%)
Fly Ash (%)
Gypsum (%)
Lime (%)
RSC (%)
WR (fl.oz./cwt)
Percentage Method Derivatives Combination
Nominal ProportionsCurve Type
ΔTmax
(°F)
Time at ΔTmax
(min)
130

131
Table 4.43. Miniature Slump Results for Mixtures with Increasing Lime Addition and Four Percent Gypsum
4-1 50 50 4 0 0 2.75 20.1 18.3 15.0 13.2 12.3 0.724-1 50 50 4 5 0 2.75 15.5 13.8 13.1 11.5 10.6 0.844-1 50 50 4 10 0 2.75 12.2 10.6 8.5 6.5 5.6 0.614-1 30 70 4 0 0 2.75 24.2 21.1 15.2 12.8 11.6 0.614-1 30 70 4 5 0 2.75 16.5 14.4 10.2 7.6 6.8 0.534-1 30 70 4 10 0 2.75 12.2 9.0 6.9 5.5 4.9 0.621-3 50 50 4 0 0 2.75 10.4 7.1 4.7 4.0 3.6 0.561-3 50 50 4 5 0 2.75 7.6 4.1 2.8 2.4 2.3 0.591-3 50 50 4 10 0 2.75 6.8 3.7 2.4 2.2 2.2 0.591-3 30 70 4 0 0 2.75 14.5 6.0 3.1 2.5 2.3 0.421-3 30 70 4 5 0 2.75 9.8 4.4 2.3 2.0 2.1 0.451-3 30 70 4 10 0 2.75 6.4 3.0 2.0 ----- ----- -----
CombinationNominal Proportions Miniature Slump Area (in2) Early Stiffening
Index (30-min/5-min)
Cement (%)
Fly Ash (%)
Gypsum (%)
Lime (%)
RSC (%)
WR (fl.oz./cwt)
2-min Test
5-min Test
15-min Test
30-min Test
45-min Test
131

132
The Vicat setting time results for mixtures with increasing calcium hydroxide
additions are shown below in Table 4.44. The initial set time generally decreased with
increased calcium hydroxide content, except for Combination 4-1 with 70 percent fly ash,
which increased with increasing calcium hydroxide content. Also, the initial set time for
Combination 1-3 with 70 percent fly ash increased by one minute with the addition of
five percent calcium hydroxide. Final set time also generally decreased with additional
calcium hydroxide, except for Combination 4-1 with 70 percent fly ash which had the
same final set time for both addition levels. The general decrease in setting times with
increasing calcium hydroxide contents indicates that the hydration reactions are being
accelerated. For all mixtures, an increase in calcium hydroxide content led to an increase
in the water required for normal consistency. This correlates with the decreased pat areas
of the miniature slump test discussed previously, which indicated that the addition of the
calcium hydroxide increased the water demand of the system.
Table 4.44. Vicat Results for Mixtures with Increasing Lime Additions
4-1 50 50 4 0 0 2.75 20.0 123 5404-1 50 50 4 5 0 2.75 21.0 111 3604-1 50 50 4 10 0 2.75 21.5 101 3154-1 30 70 4 0 0 2.75 18.5 39 4504-1 30 70 4 5 0 2.75 20.5 80 3454-1 30 70 4 10 0 2.75 21.0 92 3451-3 50 50 4 0 0 2.75 21.5 83 6751-3 50 50 4 5 0 2.75 22.5 63 4651-3 50 50 4 10 0 2.75 23.0 46 3601-3 30 70 4 0 0 2.75 20.5 24 3001-3 30 70 4 5 0 2.75 21.5 25 2851-3 30 70 4 10 0 2.75 23.0 14 195
CombinationNominal Proportions Water for Normal
Consistency (0.5%)
Vicat ResultsCement
(%)Fly Ash
(%)Gypsum
(%)Lime (%)
RSC (%)
WR (fl.oz./cwt)
Initial Set (min)
Final Set (min)

133
4.2.5. Effects of Rapid Set Cement-Gypsum Addition. The effects of the
addition of rapid set cement (RSC) were evaluated for both combinations at the 50 and 70
percent fly ash replacement levels. The two levels of rapid set cement addition were
nominally 10 and 20 percent.
The results of the cube compressive strength testing for Combination 4-1 with
rapid set cement are shown below in Figure 4.33. The results of the cube compressive
strength testing for Combination 1-3 with rapid set cement are shown below in Figure
4.34. All of these mixtures include a nominal four percent gypsum addition. For
Combination 4-1 with 50 percent fly ash, an increase in RSC content generally led to an
increase in strength, except at 56 days where RSC addition resulted in decreased
strengths. With 70 percent fly ash, this combination had increased strengths at all ages
with increased RSC additions. For Combination 1-3, increasing RSC additions generally
led to increased strengths at all ages. An exception to this is the 70 percent fly ash
mixture with 20 percent RSC, which gained very little strength from one to three days
and had a lower compressive strength than the 0 and 10 percent RSC mixtures at three
days.

134
Figure 4.33. Effect of RSC on Combination 4-1 Mixtures with Four Percent Gypsum
Figure 4.34. Effect of RSC on Combination 1-3 Mixtures with Four Percent Gypsum

135
The semi-adiabatic calorimetry results for mixtures containing RSC are shown in
Table 4.45, below. These mixtures all contain a nominal four percent gypsum addition.
Plots of the thermal curves for these mixtures can be found in Appendix D. For
Combination 4-1 with 50 percent fly ash, the overall curve shape did not change with the
addition of RSC. For the other mixtures, the addition of RSC resulted in changes in curve
shape. These changes in shape with increasing RSC contents may indicate increasingly
severe sulfate imbalances. This can be seen as the sulfate depletion peak occurs earlier
and the silicate peak occurs later, relative to each other. For both combinations with 50
percent fly ash, the addition of RSC decreased the main hydration response rise. With 70
percent fly ash, the addition of RSC increased the main hydration response rise, except
for Combination 4-1 with 10 percent RSC, which decreased. For both combinations,
increases in RSC generally led to a decrease in the predicted final set time by the
Percentage Method. An exception to this was Combination 1-3 with 70 percent fly ash,
which had increased predicted final set times for both mixtures containing RSC, when
compared to the mixture with no RSC. Figure 4.35, below, shows the thermal curves for
a 70 percent fly ash mixture with increasing RSC contents. As can be seen, the curve
shape is changed, the peak height is increased, and the peak occurs at earlier times.
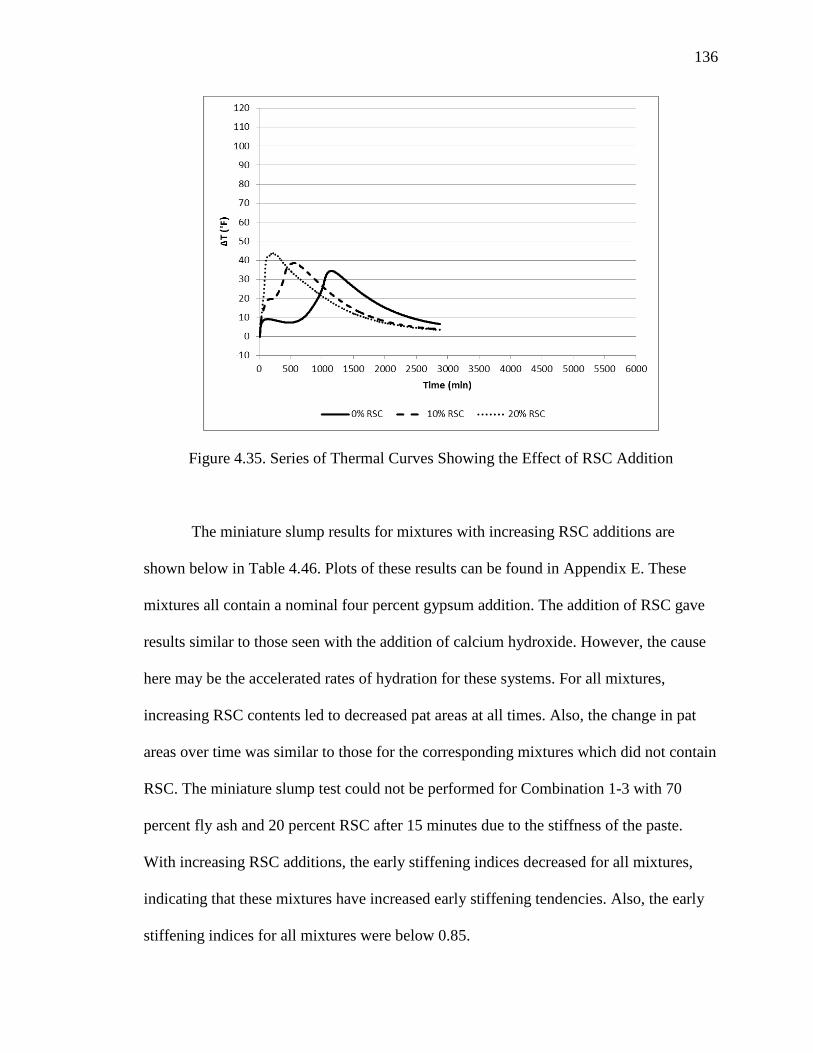
136
Figure 4.35. Series of Thermal Curves Showing the Effect of RSC Addition
The miniature slump results for mixtures with increasing RSC additions are
shown below in Table 4.46. Plots of these results can be found in Appendix E. These
mixtures all contain a nominal four percent gypsum addition. The addition of RSC gave
results similar to those seen with the addition of calcium hydroxide. However, the cause
here may be the accelerated rates of hydration for these systems. For all mixtures,
increasing RSC contents led to decreased pat areas at all times. Also, the change in pat
areas over time was similar to those for the corresponding mixtures which did not contain
RSC. The miniature slump test could not be performed for Combination 1-3 with 70
percent fly ash and 20 percent RSC after 15 minutes due to the stiffness of the paste.
With increasing RSC additions, the early stiffening indices decreased for all mixtures,
indicating that these mixtures have increased early stiffening tendencies. Also, the early
stiffening indices for all mixtures were below 0.85.

137
Table 4.45. Calorimetry Results for Mixtures with Increasing RSC Additions and Four Percent Gypsum
Initial Set (min)
Final Set (min)
Initial Set (min)
Final Set (min)
4-1 50 50 4 0 0 2.75 A 58.34 962 49.42 630 756 788 8134-1 50 50 4 0 10 2.75 A 54.61 726 37.64 433 534 556 5764-1 50 50 4 0 20 2.75 A 54.13 520 29.46 251 318 313 3304-1 30 70 4 0 0 2.75 B 34.39 1148 27.14 787 947 1015 10344-1 30 70 4 0 10 2.75 F 38.50 544 19.25 303 378 392 4054-1 30 70 4 0 20 2.75 F 43.67 210 33.44 56 81 78 871-3 50 50 4 0 0 2.75 C* 39.27 993 28.70 644 756 777 8021-3 50 50 4 0 10 2.75 C 42.30 852 23.98 394 473 411 4401-3 50 50 4 0 20 2.75 D 32.86 171 22.63 55 100 111 1191-3 30 70 4 0 0 2.75 B 15.62 126 7.52 25 37 50 511-3 30 70 4 0 10 2.75 G 30.32 162 18.51 50 84 42 1021-3 30 70 4 0 20 2.75 F 38.42 149 30.08 39 71 72 78
M (°F)
Setting Time Predictions
Cement (%)
Fly Ash (%)
Gypsum (%)
Lime (%)
RSC (%)
WR (fl.oz./cwt)
Percentage Method Derivatives Combination
Nominal ProportionsCurve Type
ΔTmax
(°F)
Time at ΔTmax
(min)
137
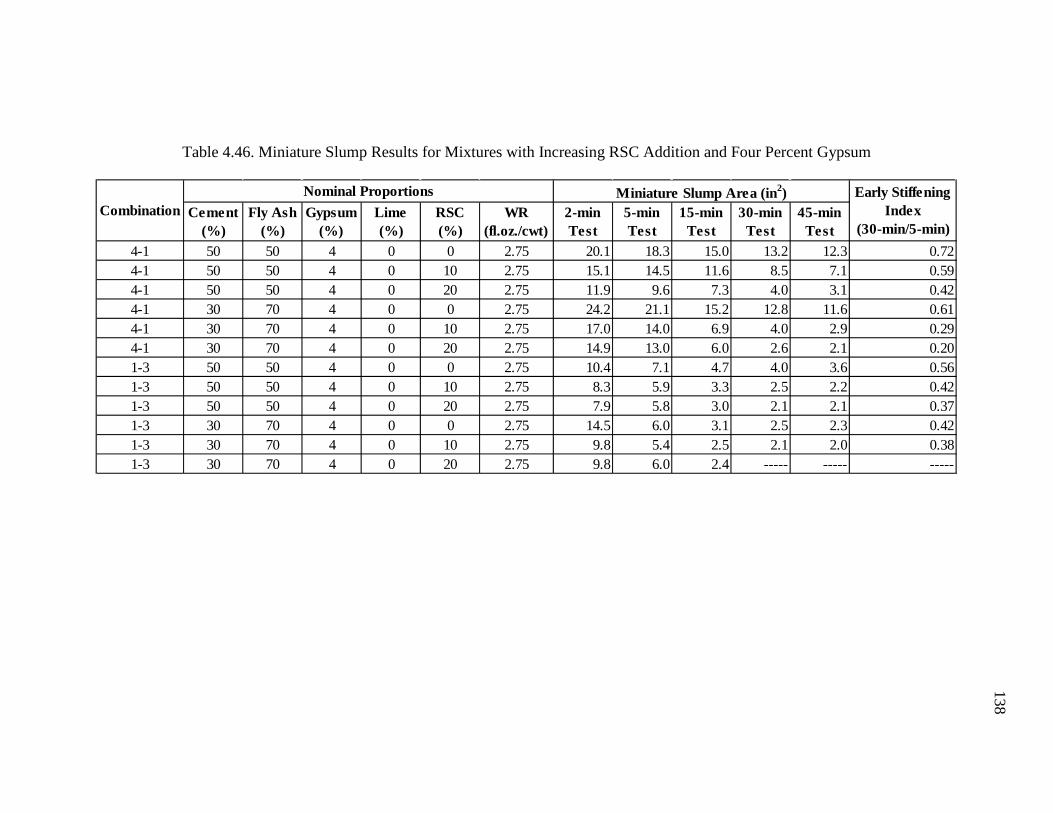
138
Table 4.46. Miniature Slump Results for Mixtures with Increasing RSC Addition and Four Percent Gypsum
4-1 50 50 4 0 0 2.75 20.1 18.3 15.0 13.2 12.3 0.724-1 50 50 4 0 10 2.75 15.1 14.5 11.6 8.5 7.1 0.594-1 50 50 4 0 20 2.75 11.9 9.6 7.3 4.0 3.1 0.424-1 30 70 4 0 0 2.75 24.2 21.1 15.2 12.8 11.6 0.614-1 30 70 4 0 10 2.75 17.0 14.0 6.9 4.0 2.9 0.294-1 30 70 4 0 20 2.75 14.9 13.0 6.0 2.6 2.1 0.201-3 50 50 4 0 0 2.75 10.4 7.1 4.7 4.0 3.6 0.561-3 50 50 4 0 10 2.75 8.3 5.9 3.3 2.5 2.2 0.421-3 50 50 4 0 20 2.75 7.9 5.8 3.0 2.1 2.1 0.371-3 30 70 4 0 0 2.75 14.5 6.0 3.1 2.5 2.3 0.421-3 30 70 4 0 10 2.75 9.8 5.4 2.5 2.1 2.0 0.381-3 30 70 4 0 20 2.75 9.8 6.0 2.4 ----- ----- -----
CombinationNominal Proportions Miniature Slump Area (in2) Early Stiffening
Index (30-min/5-min)
Cement (%)
Fly Ash (%)
Gypsum (%)
Lime (%)
RSC (%)
WR (fl.oz./cwt)
2-min Test
5-min Test
15-min Test
30-min Test
45-min Test
138

139
Table 4.47, below, summarizes the results of the Vicat setting time testing for
mixtures containing RSC. As expected, the initial and final set times for all mixtures
decreased with increasing RSC additions. Also, an increase in RSC content led to an
increase in the water required to achieve normal consistency.
Table 4.47. Vicat Results for Mixtures with Increasing RSC Additions
4-1 50 50 4 0 0 2.75 20.0 123 5404-1 50 50 4 0 10 2.75 20.5 15 3604-1 50 50 4 0 20 2.75 21.0 13 1804-1 30 70 4 0 0 2.75 18.5 39 4504-1 30 70 4 0 10 2.75 19.0 12 1354-1 30 70 4 0 20 2.75 20.0 12 901-3 50 50 4 0 0 2.75 21.5 83 6751-3 50 50 4 0 10 2.75 22.0 44 4501-3 50 50 4 0 20 2.75 22.5 31 1651-3 30 70 4 0 0 2.75 20.5 24 3001-3 30 70 4 0 10 2.75 21.0 12 1201-3 30 70 4 0 20 2.75 22.0 12 75
CombinationNominal Proportions Water for Normal
Consistency (0.5%)
Vicat ResultsCement
(%)Fly Ash
(%)Gypsum
(%)Lime (%)
RSC (%)
WR (fl.oz./cwt)
Initial Set (min)
Final Set (min)

140
4.3 CORRELATIONS
Sandberg and Liberman (2007) evaluated the use of thermal curves from semi-
adiabatic calorimetry to predict initial and final setting times as determined by ASTM C
403. Using the Derivatives and Fractions (or Percentage) Methods, described previously
in the Laboratory Investigation, they were able to find a strong correlation between the
results of the two methods. Cost (2009) also discusses the used of semi-adiabatic
calorimetry results for determining predicted set times, though he emphasizes their use
for comparative, rather than quantitative, purposes. It should be noted that in both cases,
the researchers were comparing the results of concrete testing for both the semi-adiabatic
and setting time tests.
In this study, correlations between predicted set times, as described by Sandberg
and Liberman, and Vicat setting times, according to ASTM C 191, were evaluated. For
the Percentage Method, 20 percent of the main hydration response was taken as initial set
and 50 percent of the main hydration response was taken as final set. Linear correlations
were first evaluated for the results of all mixtures from both the Screening and Main
Studies. This involved the initial and final set times, by each prediction method, being
correlated with the Vicat initial and final set times, respectively and individually. The
best correlation was found between the Vicat final setting time and the predicted final set
by the Percentage Method. This correlation is shown below in Figure 4.36.

141
Figure 4.36. Correlation of Percentage Method Final Set Times for All Mixtures
It was thought that, because many of the mixtures were found to be affected by
sulfate imbalances, a better correlation would exist for those mixtures which showed
hydration characteristics typical of a portland cement. Therefore, the correlation was
evaluated only for mixtures with Type A thermal curve shapes, as determined from the
semi-adiabatic calorimetry testing. The results of this evaluation are shown below in
Figure 4.37.

142
Figure 4.37. Correlation of Percentage Method Final Set Times for Type A Mixtures
As can be seen from the results above, the correlation between the two methods of
evaluating setting times is poor with R-squared values less than 0.4. This may be the
result of various factors including differences in water-cementitious materials ratios and
differences in the curing conditions of the pastes for each test method. The differences in
the w/cm occur because all of the paste mixtures used for the calorimetry testing were
mixed with a w/cm of 0.40, while the paste used in the Vicat procedure was prepared at a
water content that resulted in a paste with normal consistency, according to ASTM C
187. This resulted in different water-cementitious materials ratios for each paste mixture
used in the Vicat procedure. The differences in curing conditions occur because the paste
used for the calorimetry testing was sealed in plastic cylinders and placed in the
calorimeter, while the paste in the Vicat procedure was placed in the moist cure room for
the duration of the test. This resulted in differences in the temperature and relative
humidity at which the pastes for the two procedures were hydrating.

143
5. SUMMARY AND CONCLUSIONS
5.1 SUMMARY
As part of a larger study on high volume fly ash (HVFA) concrete, paste mixtures
were tested to evaluate the effects of Class C fly ash on cementitious systems and to
determine possible solutions for common problems associated with mixtures high in
Class C fly ash content. These problems include extreme delays in setting and slow
strength development.
The first part of the study, the Screening Study, evaluated five Type I or Type I/II
portland cements in combination with five Class C fly ashes. The materials were chosen
to be representative of those commonly used in the state of Missouri. The effects of each
fly ash were evaluated at replacement levels of 0, 25, 50, and 70 percent by mass for each
of the cements. Testing in the Screening Study included cube compressive strength at one
day, cube compressive strength at 28 days, semi-adiabatic calorimetry, miniature slump,
and Vicat setting time.
The second part of the study, the Main Study, evaluated the use of powder
additions for correcting the negative effects seen with the use of high amounts of Class C
fly ash replacement. Here, the most and least reactive cement-fly ash combinations from
the Screening Study were used for further evaluation. The powder additions were each
evaluated at two addition levels for mixtures with 50 and 70 percent fly ash and included
gypsum, calcium hydroxide, and rapid set cement. The effects of a water reducer were
also evaluated for mixtures with 0, 25, 50, and 70 percent fly ash. Testing in the Main
Study included cube compressive strength, semi-adiabatic calorimetry, miniature slump,

144
and Vicat setting time. Compressive strength testing was performed at 1, 3, 7, 28, and 56
days.
5.2 CONCLUSIONS
From the results of the Screening Study, it was apparent that the replacement of
portland cement with Class C fly ash had varied results on the properties of the paste
mixtures. Generally, increasing fly ash contents led to decreased strengths at one and 28
days. The calorimetry results generally showed that the peak temperature was decreased
and the silicate hydration was delayed by increasing the fly ash content. However, it was
also seen that with 50 and 70 percent replacements with fly ash, the hydration curve was
severely affected. The miniature slump results illustrated that as fly ash contents
increased, the fluidity of the paste increased at very early ages, though it was
accompanied by a more severe loss of fluidity over time, which may have been the result
of rapid aluminate hydration, due to a sulfate imbalance. From the results of the Vicat
setting time tests, it was observed that, up to a point, increasing fly ash contents delayed
setting times, after which setting times were significantly shortened. From review of the
literature and previous research, it was determined that many of the inconsistencies
observed in the results of the Screening Study could be attributed to sulfate imbalances in
the cementitious systems. This would explain the significantly changed hydration curves,
severe fluidity loss, and accelerated setting times experienced by many of the 50 and 70
percent fly ash mixtures.

145
The results of the Main Study showed the effects of powder additions and a water
reducer on the paste mixtures. Generally, the addition of the water reducer decreased the
one day strengths of the mixtures containing fly ash, showed similar or increased
strengths at 56 days, had little effect on the shapes of the thermal curves, led to delays in
the main hydration curve, and increased fluidity of the paste at all times. The addition of
gypsum was found to at least partially correct the sulfate imbalances experienced by
some of the mixtures. It was seen that the addition of gypsum significantly improved the
strength gain characteristics of the Combination 1-3 mixture with 70 percent fly ash at
early ages. Also, some of the thermal curves indicated that the sulfate depletion point was
being delayed and suppressed or that silicate hydration was accelerated by increasing
gypsum contents. The calcium hydroxide showed improvements in one day strengths and
appeared to partially mitigate some problems seen in the thermal curves. However,
strengths past one day were found to decrease with increased lime contents. Bentz (2010)
found similar effects from the use of calcium hydroxide and suggested that other sources
of calcium ions be investigated. The use of rapid set cement generally increased
compressive strengths at all ages and accelerated the occurrence of the silicate hydration
peak. However, some of the thermal curves indicated that the rapid set cement might
have worsened any sulfate imbalance in the system. The changes in miniature slump and
Vicat setting time results were similar for both the use of calcium hydroxide and rapid set
cement. The miniature slump results were shown to decrease at all ages for increased
contents of both powders. However, the loss of fluidity over time was not significantly
affected. The Vicat setting times were generally found to decrease with both powders,
indicating that the hydration reactions were accelerated. As with the results of the

146
Screening Study, many of the inconsistencies experienced in the results of the Main
Study can be explained by sulfate imbalances. Though gypsum was added as a source of
additional sulfate, this may not have been sufficient for the increased aluminate levels of
the mixtures with 50 or 70 percent fly ash. It should also be noted that this sulfate
imbalance would adversely affect the hydration of the silicates by decreasing the amounts
of available sulfate and calcium.
5.3 FUTURE RESEARCH
As an extension of the study presented here, further testing should be performed
on the materials to more fully characterize the portland cements, fly ashes, and powder
additions which were utilized. This would provide further insight into the test results that
have been presented, because it is known, for example, that the mineralogical
characteristics of a fly ash plays an important role in the reactivity of the material. Also,
more information about the particle size distributions of the materials would assist in
determining what effect they may have on the fluidity of the paste mixtures.
Bentz (2010) suggested that a source of calcium, other than calcium hydroxide,
should be explored to ensure sufficient calcium is available for hydration of the silicates
without adversely affecting compressive strengths at later ages. Also, the addition of
another sulfate source, such as hemihydrate, should be investigated which would go into
solution more quickly to control the increased aluminate reactions of the HVFA mixtures.
A standardized mixing procedure, which allowed early data collection for
calorimetric or rheological testing, would allow better interlaboratory comparison of the

147
results from paste studies. Many researchers have utilized procedures that achieve
sufficient mixing in under 2 minutes with handheld mixers or high-shear blenders. This
has been done to characterize paste mixtures at ages earlier than would be allowed using
the mixing procedure outlined in ASTM C 305.

148
APPENDIX A
TESTING PROCEDURES

149
Compressive Strength of Cement Cubes (ASTM C 109 and ASTM C 305)
(Revised 6-19-2012)
Equipment 1. Black and Decker 250-Watt Hand Mixer (Model MX217) with egg beater
paddles
2. 20-quart Hobart mixing bowl
3. Plastic ladle
4. Hamilton 1-mL Adjustable Volume SoftGrip Pipette, (readable to 0.01 mL)
5. 3-quart or larger white plastic bowl with spout
6. Metal spoon
7. Small stainless steel spatula
8. Form oil and brush
9. 2” cube molds, tamper, and trowel
10. Analog thermometer with 5-inch probe
11. Sandpaper (Grit #60)
12. Digital calipers
13. Spherically seated circular upper bearing block with a diameter of 3.5
inches
14. Square lower bearing block with a diagonal of 3.5 inches
15. Sper Scientific Humidity/Temperature Monitor (Model 800016)
16. 4x8 in. plastic cylinder mold with lid
17. 12-kg Denver Instrument balance

150
Procedure 1. Apply a coating of vacuum grease to seal the surfaces where the halves of
the mold join. Tighten the halves together and remove any extruded
grease with a cloth.
2. Apply a small amount of vacuum grease to the surfaces of the mold that
will be in contact with the base plate. Clamp the mold down to the base
plate and wipe/scrape away any excess sealant, especially in the corners
to avoid rounded cube edges
3. Apply a thin, even coating of form oil to the interior faces of the mold using
a brush and wipe off any excess oil.
4. Verify that the air temperature is 23.0±3.0°C (68.0-78.8°F), mixing water
temperature is 23.0±2°C (69.8-77.0°F), and that the relative humidity of
the air is not less than 50%. Record these parameters.
5. Using the predetermined mix design, mix the paste using the following
procedure:
a. To blend the dry constituents of the mix: Place about 1000 grams of
the dry materials into a 4”x8” cylinder mold in the same proportions
to be used in the paste mixture, hold the cylinder horizontally with
one hand on each end of the cylinder, and then shake the cylinder
25 cycles using a 6” throw.
b. To dissolve admixtures into the mix water: Place all of the
deionized water into the plastic bowl, use the 1-mL syringe to add
the desired amount of admixture to the water, and use the small
spatula to gently stir the water until all of the admixture is dissolved.
c. Add the premixed cementitious materials to the mixing bowl,
forming a donut shape.
d. Add all of the mix water to the mixing bowl, start the timer, and
record the time (Start Time).
e. Wait 10 seconds to allow the cement to absorb the water.
f. Mix at Speed 2 (440 RPM) for 20 seconds. Rotate the bowl 90°
every 5 seconds.

151
g. Mix at Speed 6 (670 RPM) for 60 seconds. Rotate the bowl 90°
every 15 seconds and occasionally run the mixing paddles along
the side of the bowl.
h. At the end of the initial mixing, record the temperature of the paste.
i. At 4 minutes, remix the paste at Speed 2 for 30 seconds.
j. At 13 minutes, remix the paste at Speed 2 for 30 seconds.
6. Molding the specimens must begin within 2 minutes and 30 seconds after
completion of mixing or remixing.
7. Place a layer of paste in each of the cube compartments of 1 inch (about
half the depth of the mold).
8. Tamp the paste in each compartment 32 times in about 10 seconds, in 4
rounds. Each round consists of 8 adjoining strokes and should be at right
angles to the other rounds. The tamping pressure should be just enough
to ensure uniform filling of the mold.
9. Fill the remaining portion of the molds and repeat the tamping procedure
used on the first layer. Bring in paste that is forced out onto the tops of the
molds during tamping.
10. Draw the flat side of the trowel, with the leading edge slightly raised, once
across the top of each cube at right angles to the length of mold.
11. Draw the flat side of the trowel, with the leading edge slightly raised, lightly
once along the length of the mold.
12. Using the straight edge of the trowel, held perpendicular to the surface of
the mold andwith a sawing motion along the length of the mold, cut the
paste flush with the mold.
13. Immediately, place the specimens in the moist cure room. Protect the
specimens from dripping water by using an arched sheet of thin plastic to
cover the molds.
14. In the case of specimens to be tested for 1-day strengths, remove the
specimens from the molds after 24 hours and proceed to step 15. For all
other cases, remove the specimens from the molds after 72 hours, label
each specimen with the Mix ID and age of testing using a China marker,

152
and place them in buckets of water saturated with hydrated lime (not
aglime) in the moist cure room until they are needed for testing. Then
proceed to step 15. Specimen age at the time of testing and at mold
removal times shall be within the tolerances given below in Table 1.
Cubes tested at 56 days shall have the same age tolerance as cubes
tested at 28 days.
Table 1: Specimen age tolerances
Test Age Permissible Tolerance
24 hours ± ½ hour
3 days ± 1 hour
7 days ± 3 hours
28 days ± 12 hours
15. Transport specimens from the moist room in a saturated towel and keep
the specimens covered with the saturated towel until the time of testing.
16. Use a damp towel to wipe the specimens to a surface-dry condition, and
remove any loose particles.
17. Secure the sandpaper on a flat surface and lightly sand each face of the
specimens to provide plane loading surfaces and remove any fins from the
edges of the specimens.
18. Use a straightedge to check that the faces are plane.
19. Use electronic calipers to measure the width, depth, and height of the
specimens. The width and depth will be used to find the area of the
specimen face perpendicular to the direction of loading. Measurements
should be made across the middle of the specimen.
20. Verify that the spherically seated block is free to tilt.
21. Place a specimen in the testing machine below the center of the upper
bearing block. The specimen should be turned on its side, so that the load
is applied to molded faces.

153
22. Bring the block into uniform contact with the surface of the specimen.
23. Apply the load to the specimen at a rate of 200 lb/s. This rate should be
obtained during the first half of the anticipated maximum load and no
adjustment should be made during the latter half.
24. Record the total maximum load and calculate the compressive strength as
follows:
fm = P/A
where:
fm = compressive strength (psi)
P = total maximum load (lbf)
A = area of loaded surface (in2)

154
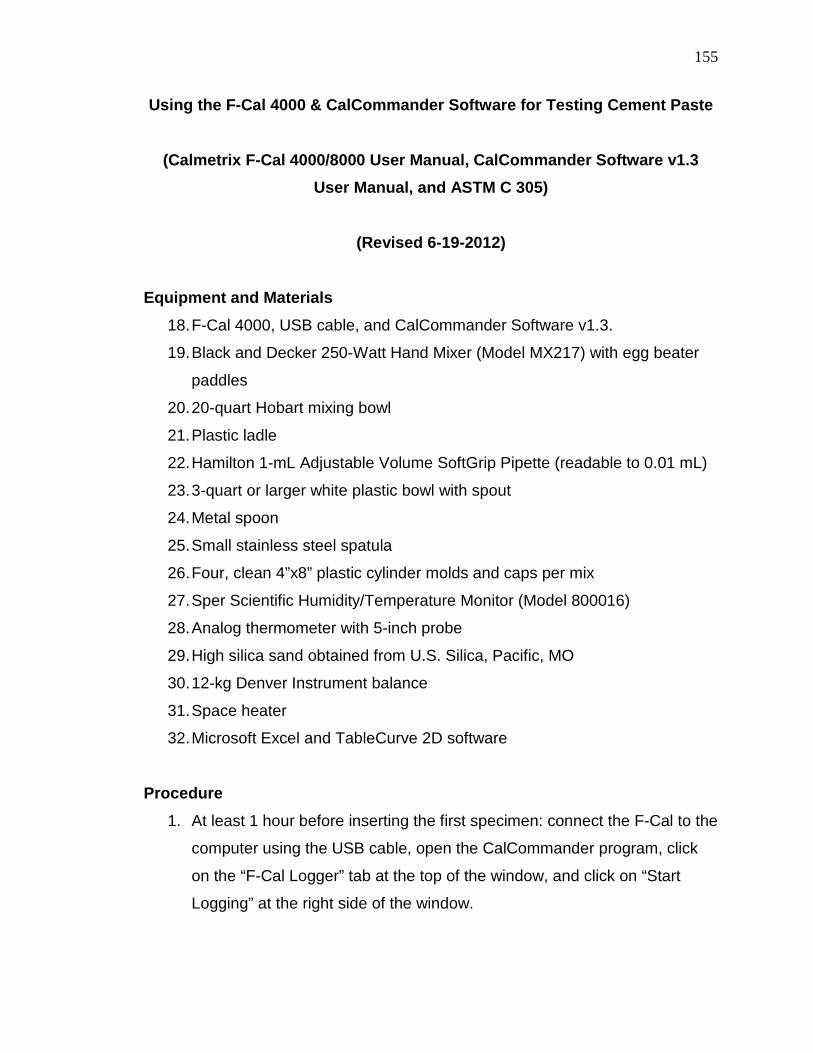
155
Using the F-Cal 4000 & CalCommander Software for Testing Cement Paste
(Calmetrix F-Cal 4000/8000 User Manual, CalCommander Software v1.3 User Manual, and ASTM C 305)
(Revised 6-19-2012)
Equipment and Materials 18. F-Cal 4000, USB cable, and CalCommander Software v1.3.
19. Black and Decker 250-Watt Hand Mixer (Model MX217) with egg beater
paddles
20. 20-quart Hobart mixing bowl
21. Plastic ladle
22. Hamilton 1-mL Adjustable Volume SoftGrip Pipette (readable to 0.01 mL)
23. 3-quart or larger white plastic bowl with spout
24. Metal spoon
25. Small stainless steel spatula
26. Four, clean 4”x8” plastic cylinder molds and caps per mix
27. Sper Scientific Humidity/Temperature Monitor (Model 800016)
28. Analog thermometer with 5-inch probe
29. High silica sand obtained from U.S. Silica, Pacific, MO
30. 12-kg Denver Instrument balance
31. Space heater
32. Microsoft Excel and TableCurve 2D software
Procedure 1. At least 1 hour before inserting the first specimen: connect the F-Cal to the
computer using the USB cable, open the CalCommander program, click
on the “F-Cal Logger” tab at the top of the window, and click on “Start
Logging” at the right side of the window.

156
2. To enter information about the mix: click “Read Configuration from
Logger”, click on the tab in the bottom portion of the window which
corresponds to the slot in which the specimen will be placed in the F-Cal;
enter the Mix ID, Water/Cement Ratio, Cement Source, Cement Content
(lbs/cy), and any SCMs (Type, Percent, and Source); and click “Update
Configuration File” on the right side of the window. Also, make sure the
Sensor Enabled box is checked.
3. Prepare a clean mold with a 1250 gram inert specimen. The inert
specimen consists of high silica sand and deionized water. The proportion
of water to oven-dried sand should reflect the proportion of water to
cementitious materials used in the mixture being tested.
4. Verify that the air temperature is 23.0±3.0°C (68.0-78.8°F), mixing water
temperature is 23.0±2°C (69.8-77.0°F), and that the relative humidity of
the air is not less than 50%. Record these parameters.
5. To blend the dry constituents of the mix: Place about 1000 grams of the
dry materials into a 4”x8” cylinder mold in the same proportions to be used
in the paste mixture, hold the cylinder horizontally with one hand on each
end of the cylinder, and then shake the cylinder 25 cycles using a 6”
throw.
6. To dissolve admixtures into the mix water: Place all of the deionized water
into the plastic bowl, use the 1-mL syringe to add the desired amount of
admixture to the water, and use the small spatula to gently stir the water
until all of the admixture is dissolved.
7. Add the pre-mixed cementitious materials to the mixing bowl, forming a
donut shape.
8. Add all of the mix water to the mixing bowl, start the timer, and record the
time (Start Time).
9. Wait 10 seconds to allow the cement to absorb the water.
10. Mix at Speed 2 (440 RPM) for 20 seconds. Rotate the bowl 90° every 5
seconds.

157
11. Mix at Speed 6 (670 RPM) for 60 seconds. Rotate the bowl 90° every 15
seconds and occasionally run the mixing paddles along the side of the
bowl.
12. At the end of the initial mixing, record the temperature of the paste.
13. At 4 minutes, remix the paste at Speed 2 for 30 seconds.
14. After remixing, pour 1250 grams of paste into each of the three remaining
4”x8” cylinder molds. Tap each cylinder with an open hand 10 times to
remove entrapped air.
15. Quickly cap the molds, ensure that the outsides of the molds are clear of
paste or other debris, and place the molds into the appropriate slots in the
F-Cal (including the mold with the control sand). This should be done
within 10 minutes after the Start Time.
16. Enter the “Mix Date/Time” (noted in step #8) and “Mix Temperature”
(noted in step #12) into the software under the mix information tabs and
click “Update Configuration File”.
17. Disconnect the USB cable from the computer and F-Cal, close and latch
the F-Cal lid, and leave the specimens for at least 48 hours. Note: shorter
logging times may be used depending on the amount of information
desired and prior knowledge of the materials being tested.
(CAUTION: DO NOT MOVE THE F-CAL WHILE TESTING IS IN
PROGRESS)
18. After 48 hours, open the F-Cal lid, reconnect the USB cable, open the
CalCommander software, click the “F-Cal Logger” tab, and click “Read
Data from Logger” at the right side of the window. If it is decided that
logging should cease, click “Stop Logging”.
19. Save the log data by clicking “Read Data from Logger” and then selecting
“Save Log Data to File”.
20. Remove the specimens from the F-Cal.

158
21. To export data: click on “F-Cal Reports” at the top of the CalCommander
software window, click “Add Logs” in the bottom right corner of the screen,
select the appropriate file(s), select “Accept” in the “Add F-Cal/AdiaCal
Logs” window, select the tab corresponding to the channel from which
data is needed, click on “Save Selected Log as Text File” in the bottom
right corner of the screen, input desired file name, and click “Save”.
22. To import data into Microsoft Excel: Open Microsoft Excel, select “Data” at
the top of the screen, go to “Import External Data”, click “Import Data...”,
double-click on the desired text file, click the “Next >” button two times in
the “Text Import Wizard” window, click “Finish”, and then select “OK” in the
“Import Data” window.
23. Record the Signal-to-Noise Ratio for each specimen. The Signal is the
difference between the highest and lowest temperatures recorded for the
sample being tested. The Noise is the difference between the highest and
lowest temperatures recorded for the inert specimen. To calculate the
Signal-to-Noise Ratios:
a. Import the data for each specimen into Excel.
b. Determine the difference between the time logging began and the time
water was added to the cementitious materials (Start Time). This will be
used to determine the log time that corresponds to the Start Time.
c. For each specimen log, find the maximum temperature by using the
MAX function for the range of specimen temperatures starting with the log
time that corresponds to the Start Time and ending at the end of the
logging period. To find the minimum temperature, follow a similar
procedure using the MIN function for the same range.
d. Calculate the Signal for each specimen by subtracting the minimum
specimen temperature from the maximum specimen temperature.
e. Calculate the Noise by subtracting the minimum temperature of the inert
specimen from the maximum temperature of the inert specimen.
f. Divide the Signal for each specimen by the Noise to determine the
Signal-to-Noise ratio for each specimen.

159
24. To estimate set times using the Percentage Method:
a. Import the data for each specimen into Excel.
b. Determine the difference between the time logging began and the time
water was added to the cementitious materials (Start Time). This will be
used to determine the log time that corresponds to the Start Time.
c. Remove all log data prior to the log time corresponding to the Start
Time.
d. Find the average temperature log for the specimens by averaging the
temperatures of the three specimens at every minute for the duration of
the logging.
e. Subtract the inert specimen temperature log from the average
temperature log to determine the corrected average temperature log.
f. Plot the corrected average hydration curve by plotting the corrected
average temperatures against time.
g. Visually examine the curve to determine a time window that
encompasses the dormant period and the peak of the hydration curve.
There will be an initial rise in the temperature near time zero that indicates
the initial rise in temperature of the thermistors from the ambient
temperature to the specimen temperature. This area should not be
considered to be part of the dormant period.
h. Use the MAX and MIN functions, within the time range chosen above,
to determine the maximum and minimum temperatures (ΔTmax and ΔTmin)
of the hydration curve.
i. Using the values from Step 25.h., calculate the main hydration response
rise (M = ΔTmax - ΔTmin), twenty percent of the main hydration response
rise (M20% = 0.2M), and fifty percent of the main hydration response rise
(M50% = 0.5M).
j. Initial Set is taken as the time when 20% of the main hydration response
rise (M20%+ΔTmin) occurs.
k. Final Set is taken as the time when 50% of the main hydration response
rise (M50%+ΔTmin) occurs.

160
25. To estimate set times using the Derivatives Method:
a. Copy and paste the time log and corrected average temperature log
from Step 25, above, into a new Excel file.
b. In TableCurve 2D, click “Import” in the upper left corner of the window
and “Open” the Excel file.
c. In the “Select Columns for X-Y Data Table” window, select
“(1)Sheet1!A” for the X Column, select “(1)Sheet1!B” for the Y Column,
and then select “OK”.
d. In the “Data Description and Variable Names” window, enter a title for
the plot, enter titles for the axes, and select “OK”.
e. Select “Data” at the top of the window, choose “Section Data...”, select
a time range from the dormant period to the peak of the main hydration
curve, click the green checkmark box in the upper left corner, and select
“Yes” in the “Update Data Table” window.
f. Select “Process” at the top of the window, choose “Curve-Fit All
Equations”, and select “Graph Start” after fitting has ceased. The curve-fit
automatically applied has the highest R-squared value and should not be
changed.
g. On the left side of the screen, select “Numeric”. Look toward the bottom
of the “Numeric Summary” screen to find the “1st Deriv max” and the “2nd
Deriv max” with corresponding X-Values.
h. The time for Initial Set is the x-value corresponding to the maximum
second derivative (2nd Deriv max).
i. The time for Final Set is the x-value corresponding to the maximum first
derivative (1st Deriv max).

161

162
Miniature Slump Cone (Kantro (1980) and Bhattacharja & Tang (2001))
(Revised 6-19-2012) Equipment
1. Black and Decker 250-Watt Hand Mixer (Model MX217) with egg beater
paddles
2. 20-quart Hobart mixing bowl
3. Plastic ladle
4. Hamilton 1-mL Adjustable Volume SoftGrip Pipette, (readable to 0.01 mL)
5. 3-quart or larger white plastic bowl with spout
6. Metal spoon
7. Analog thermometer with 5-inch probe
8. Stopwatch
9. Small stainless steel spatula (0.625 in. wide and 4 in. long)

163
10. 2 mini-slump cones
11. Lucite sheet (0.2 inches thick). Label the area of the sheet where each
test will be performed with the time the cone will be lifted (2, 5, 15, 30, 45
minutes)
12. Plastic wrap
13. 5 thin plastic discs (2 in. diameter) cut from Zip-lock bags
14. 12-kg Denver Instrument balance
15. Sper Scientific Humidity/Temperature Monitor (Model 800016)
Procedure
1. Place the 5 plastic discs on the board 8 inches apart on center and at
least 3 inches away from any edge of the board.
2. Place each of the two mini-slump cones on a plastic disc.
3. Verify that the air temperature is 23.0±3.0°C (68.0-78.8°F), mixing water
temperature is 23.0±2°C (69.8-77.0°F), and that the relative humidity of
the air is not less than 50%. Record these parameters.
4. To blend the dry constituents of the mix: Place about 1000 grams of the
dry materials into a plastic 4”x8” cylinder mold in the same proportions to
be used in the paste mixture, hold the cylinder horizontally with one hand
on each end of the cylinder, and then shake the cylinder 25 cycles using a
6” throw.

164
5. To dissolve admixtures into the mix water: Place all of the deionized water
into the plastic bowl, use the 1-mL syringe to add the desired amount of
admixture to the water, and use the small spatula to gently stir the water
until all of the admixture is dissolved.
6. Add all cementitious materials to the mixing bowl, forming a donut shape.
7. Add all of the water to the mixing bowl, start the timer, and record the time
(Start Time).
8. Wait 10 seconds to allow the cement to absorb the water.
9. Mix at Speed 2 (440 RPM) for 20 seconds. Rotate the bowl 90° every 5
seconds.
10. Mix at Speed 6 (670 RPM) for 60 seconds. Rotate the bowl 90° every 15
seconds and occasionally run the mixing paddles along the side of the
bowl.
11. Record the temperature of the paste.
12. At the completion of mixing (1.5 minutes after the Start Time), fill the first
mini-slump cone until a slight hump is formed above the top of the cone.
13. Use the spatula with a rodding motion at a slight angle to remove
entrapped air. The paste should be “rodded” 5 to 10 times.
14. If the paste is depressed below the top of the cone after removing the
entrapped air, use paste spilled on the rim to fill the cone.
15. Use the spatula to strike off the top surface of the cone.
16. At 2 minutes after the Start Time, lift the cone within a few tenths of a
second. The lifting motion should be rapid enough for the bottom of the
cone to be free of the flowing paste, but slow enough to avoid imparting an
upward momentum to the paste as it is flowing from the cone.
17. At 4 minutes after the Start Time, remix the paste remaining in the bowl at
Speed 2 for 30 seconds.
18. Pour the paste into the second cone and remove entrapped air with the
same procedure used above.
19. At 5 minutes after the Start Time, lift the cone.
20. Cover the remaining paste in the mixing bowl using plastic wrap.

165
21. At 13 minutes after the Start Time, uncover the paste and remix the paste
at Speed 2 for 30 seconds.
22. Pour the paste into a clean, dry cone and remove entrapped air with the
same procedure used above.
23. At 15 minutes after the Start Time, lift the cone.
24. Repeat the procedure in Steps 21-23 for slumps at 30 and 45 minutes
after the Start Time. See the table, below, which summarizes the mixing,
pausing, and testing times
25. At 1 hour after the Start Time, measure and record the diameter of each of
the paste pats 4 times using digital calipers. The measurements should
each be rotated 45°.
26. Calculate the average diameter of each pat and use the average diameter
to calculate the area of the pat. Record this area in square inches.

166
Elapsed Time (mm:ss)
Action
0:00 Add water to mixing bowl with cementitious materials Record Time (Start Time)
0:10 Start mixing at Speed 2
0:30 Start mixing at Speed 6
1:30 Stop Mixing Record Temperature of Paste Prepare mini-slump test
2:00 Lift mini-slump cone
4:00 Remix paste at Speed 2
4:30 Prepare mini-slump test
5:00 Lift mini-slump cone
13:00 Remix paste at Speed 2
13:30 Prepare mini-slump test
15:00 Lift mini-slump cone
28:00 Remix paste at Speed 2
28:30 Prepare mini-slump test
30:00 Lift mini-slump cone
43:00 Remix paste at Speed 2
43:30 Prepare mini-slump test
45:00 Lift mini-slump cone
60:00 Measure and record mini-slump diameters

167

168
Time of Setting by Vicat Needle (ASTM C 187, ASTM C 191, and ASTM C 305)
(Revised 6-19-2012)
Equipment 33. 5-quart Hobart mixer (Model N50), bowl, and paddle
34. Bowl scraper with semi-rigid rubber blade
35. Rubber gloves
36. Vicat Apparatus, glass plate, and conical ring
37. Flat trowel
38. Stopwatch
39. Analog thermometer with 5-inch probe
40. 12-kg Denver Instrument balance
41. Sper Scientific Humidity/Temperature Monitor (Model 800016)
Procedure A. Mixing
26. Verify that the air temperature is 23.0±3.0°C (68.0-78.8°F), mixing water
temperature is 23.0±2°C (69.8-77.0°F), and that the relative humidity of
the air is not less than 50%. Record these parameters.
27. Obtain 650 grams of the cementitious materials and the desired amount of
deionized water to be used. (To blend the dry constituents of the mix:
Place about 1000 grams of the dry materials into a 4”x8” cylinder mold in
the same proportions to be used in the paste mixture, hold the cylinder
horizontally with one hand on each end of the cylinder, and then shake the
cylinder 25 cycles using a 6” throw.)
28. Wet the paddle and the inside of the mixing bowl.
29. Place all of the mixing water in the bowl. (To dissolve admixtures into the
mix water: Place all of the deionized water into the plastic bowl, use the 1-
mL syringe to add the desired amount of admixture to the water, and use

169
the small spatula to gently stir the water until all of the admixture is
dissolved.)
30. Add the cementitious materials to the water and wait 30 seconds for the
absorption of water. While waiting, make note of the time the cement was
added (Start Time), attach the bowl and paddle in the Hobart mixer,
secure the latches on the bowl, and then turn the lever on the right side of
the mixer counter-clockwise to lift the bowl into the mixing position.
31. On the left side of the mixer, set the speed to 1.
32. Start the mixer and mix at slow speed for 30 seconds.
33. Stop the mixer for 15 seconds and use the bowl scraper to scrape paste
from the sides of the bowl down into the batch.
34. Set the mixing speed to setting 2.
35. Start the mixer and mix at medium speed for 60 seconds.
36. Stop the mixer and remove the paddle.
B. Normal Consistency
37. Put on rubber gloves and immediately form a portion of the cement paste
into a ball and toss the ball from one hand to the other six times (hands
should be about 6 inches apart).
38. Place the ball in the palm of one hand and press the ball into the larger
end of the ring until the ring is filled with paste.
39. Use a single sweeping motion of the palm of the hand to remove excess
paste at the larger end of the ring and place the large end of the ring onto
the plate.
40. Remove excess paste at the top (smaller end) of the ring using a single
oblique stroke of the trowel held at a slight angle with the top of the ring. If
necessary, smooth the top with no more than two light touches of the
pointed end of the trowel.
41. Center the paste under the 10 mm end of the rod, bring the end of the rod
into contact with the surface of the paste, and tighten the set-screw.

170
42. Set the indicator to zero and release the rod quickly. This must be done
within 30 seconds after mixing is completed.
43. After 30 seconds, read and record the depth of penetration. If this depth is
10±1 mm continue to step 19. If the depth is outside of this range, repeat
steps 2-18, with fresh cement and a different percentage of water, until a
depth of 10±1 mm is obtained.
44. Calculate the amount of water required to the nearest 0.1% and record it
to the nearest 0.5% of the weight of the dry cement.
C. Setting Time
45. Using 650 grams of the cementitious materials and the percentage of
water determined in step 19, repeat steps 3-15 and then continue with
step 21. (Note: The paste remaining from the normal consistency test may
also be used.)
46. Place the specimen in the moist room and do not disturb it for 30 minutes.
Protect the specimen from dripping water by using an arched sheet of thin
plastic to cover the specimen.
47. After the 30 minutes and at 15 minute intervals thereafter until a
penetration of 25 mm or less is obtained, determine the penetration using
the following procedure:
a. Lower the 1 mm diameter needle until it rests on the surface of the
paste.
b. Tighten the setscrew to secure the rod and set the indicator to zero
at the top of the scale.
c. Release the setscrew quickly and let the needle settle for 30
seconds.
d. At the end of the 30 seconds, take the penetration reading.
(Note: Each penetration test should be at least 5 mm from any
previous test and at least 10 mm away from the edge of the
specimen)

171
48. Interpolate to determine the time when a penetration of 25 mm would be
obtained. This elapsed time is the Vicat initial time of setting. Calculate the
initial set time, in minutes, as follows:
Initial Set Time = [(H-E)x(C-25)/(C-D)]+E
where: H = time of first penetration less than 25 mm (min)
E = time of last penetration greater than 25 mm (min)
C = penetration reading at time E (mm)
D = penetration reading at time H (mm)
49. Repeat the procedure described in steps 22a-22d, at 15 minute intervals,
until the needle does not leave a complete circular impression. This
elapsed time is the Vicat final time of setting.
50. Within 90 seconds, perform two additional tests on different areas of the
specimen to verify the final set time.

172

173

174
APPENDIX B
OUTLIER ANALYSIS FOR CALORIMETRY DATA

175
Table B.1. Outlier Analysis of Calorimetry Data for Cement 1 Combinations in the Screening Study
Baseline 1 100 0 14.23 14.49 14.46 14.39 0.14 3 14.49 14.23 1.153 0.686 1.147 NO NO 14.391-1 75 25 18.22 19.08 18.33 18.54 0.47 3 19.08 18.22 1.153 1.147 0.687 NO NO 18.541-1 50 50 16.04 16.52 16.06 16.20 0.27 3 16.52 16.04 1.153 1.154 0.616 YES NO 16.201-1 30 70 3.85 3.90 3.83 3.86 0.04 3 3.90 3.83 1.153 1.132 0.763 NO NO 3.861-2 75 25 7.05 7.42 7.22 7.23 0.19 3 7.42 7.05 1.153 1.033 0.963 NO NO 7.231-2 50 50 6.21 6.54 6.35 6.36 0.17 3 6.54 6.21 1.153 1.049 0.942 NO NO 6.361-2 30 70 4.25 4.32 4.20 4.26 0.06 3 4.32 4.20 1.153 1.044 0.949 NO NO 4.261-3 75 25 10.42 10.88 10.66 10.65 0.23 3 10.88 10.42 1.153 0.976 1.022 NO NO 10.651-3 50 50 12.12 12.89 12.73 12.58 0.41 3 12.89 12.12 1.153 0.763 1.132 NO NO 12.581-3 30 70 4.20 4.19 4.18 4.19 0.01 3 4.20 4.18 1.153 0.844 1.104 NO NO 4.191-4 75 25 12.77 13.34 12.84 12.98 0.31 3 13.34 12.77 1.153 1.146 0.693 NO NO 12.981-4 50 50 9.44 10.17 9.77 9.80 0.37 3 10.17 9.44 1.153 1.030 0.967 NO NO 9.801-4 30 70 10.24 10.46 10.52 10.41 0.15 3 10.52 10.24 1.153 0.769 1.131 NO NO 10.411-5 75 25 10.75 11.40 11.08 11.08 0.32 3 11.40 10.75 1.153 0.995 1.004 NO NO 11.081-5 50 50 11.79 12.61 12.14 12.18 0.41 3 12.61 11.79 1.153 1.046 0.946 NO NO 12.181-5 30 70 ----- 27.19 ----- 27.19 ----- ----- ----- ----- ----- ----- ----- ----- ----- 27.19
Avg. Max. Min. tCRITCombination
ProportionsCement
(%)Fly Ash
(%)
Calorimeter Outlier Analysis
tMAX tMIN OutlierMAX? OutlierMIN? New Avg.(S/N)1 (S/N)2 (S/N)3 σ n
175

176
Table B.2. Outlier Analysis of Calorimetry Data for Cement 2 Combinations in the Screening Study
Baseline 2 100 0 14.39 14.53 14.43 14.45 0.07 3 14.53 14.39 1.153 1.097 0.860 NO NO 14.452-1 75 25 13.97 14.45 14.41 14.28 0.26 3 14.45 13.97 1.153 0.637 1.153 NO NO 14.282-1 50 50 13.61 14.10 13.96 13.89 0.25 3 14.10 13.61 1.153 0.846 1.104 NO NO 13.892-1 30 70 14.83 15.17 14.81 14.94 0.20 3 15.17 14.81 1.153 1.153 0.638 NO NO 14.942-2 75 25 11.50 12.08 11.92 11.83 0.30 3 12.08 11.50 1.153 0.827 1.111 NO NO 11.832-2 50 50 7.12 7.43 7.20 7.25 0.16 3 7.43 7.12 1.153 1.127 0.783 NO NO 7.252-2 30 70 9.33 9.52 9.36 9.41 0.10 3 9.52 9.33 1.153 1.145 0.704 NO NO 9.412-3 75 25 14.65 15.21 14.93 14.93 0.28 3 15.21 14.65 1.153 0.998 1.002 NO NO 14.932-3 50 50 15.64 16.23 15.80 15.89 0.31 3 16.23 15.64 1.153 1.114 0.820 NO NO 15.892-3 30 70 15.11 15.83 15.26 15.40 0.38 3 15.83 15.11 1.153 1.133 0.759 NO NO 15.402-4 75 25 12.18 12.69 12.49 12.46 0.26 3 12.69 12.18 1.153 0.924 1.062 NO NO 12.462-4 50 50 12.44 13.10 12.65 12.73 0.34 3 13.10 12.44 1.153 1.098 0.858 NO NO 12.732-4 30 70 5.94 6.13 6.05 6.04 0.09 3 6.13 5.94 1.153 0.949 1.044 NO NO 6.042-5 75 25 12.87 13.33 13.18 13.13 0.24 3 13.33 12.87 1.153 0.853 1.100 NO NO 13.132-5 50 50 10.18 10.70 10.31 10.40 0.27 3 10.70 10.18 1.153 1.125 0.789 NO NO 10.402-5 30 70 ----- ----- ----- ----- ----- ----- ----- ----- ----- ----- ----- ----- ----- -----
CombinationProportions
Cement (%)
Fly Ash (%)
Calorimeter Outlier Analysis
(S/N)1 (S/N)2 (S/N)3 Avg. σ n Max. Min. tCRIT tMAX tMIN OutlierMAX? OutlierMIN? New Avg.
176

177
Table B.3. Outlier Analysis of Calorimetry Data for Cement 3 Combinations in the Screening Study
Baseline 3 100 0 13.22 13.48 13.20 13.30 0.15 3 13.48 13.20 1.153 1.152 0.640 NO NO 13.303-1 75 25 13.83 14.27 13.86 13.99 0.25 3 14.27 13.83 1.153 1.152 0.649 NO NO 13.993-1 50 50 12.54 13.38 13.14 13.02 0.43 3 13.38 12.54 1.153 0.831 1.110 NO NO 13.023-1 30 70 10.87 11.14 10.94 10.98 0.14 3 11.14 10.87 1.153 1.109 0.834 NO NO 10.983-2 75 25 14.92 15.43 15.24 15.20 0.26 3 15.43 14.92 1.153 0.908 1.071 NO NO 15.203-2 50 50 14.67 15.45 14.86 14.99 0.41 3 15.45 14.67 1.153 1.125 0.788 NO NO 14.993-2 30 70 1.70 1.70 1.71 1.70 0.01 3 1.71 1.70 1.153 1.125 0.788 NO NO 1.703-3 75 25 15.65 15.95 15.75 15.78 0.16 3 15.95 15.65 1.153 1.093 0.870 NO NO 15.783-3 50 50 12.67 13.39 12.96 13.01 0.36 3 13.39 12.67 1.153 1.055 0.933 NO NO 13.013-3 30 70 7.78 8.03 7.81 7.87 0.13 3 8.03 7.78 1.153 1.146 0.697 NO NO 7.873-4 75 25 12.13 12.49 12.36 12.33 0.18 3 12.49 12.13 1.153 0.899 1.077 NO NO 12.333-4 50 50 10.74 11.44 10.94 11.04 0.36 3 11.44 10.74 1.153 1.110 0.832 NO NO 11.043-4 30 70 8.41 8.46 8.40 8.43 0.03 3 8.46 8.40 1.153 1.146 0.696 NO NO 8.433-5 75 25 15.72 16.14 15.80 15.88 0.23 3 16.14 15.72 1.153 1.137 0.745 NO NO 15.883-5 50 50 9.31 9.89 9.43 9.54 0.31 3 9.89 9.31 1.153 1.130 0.769 NO NO 9.543-5 30 70 8.96 9.10 9.05 9.04 0.07 3 9.10 8.96 1.153 0.865 1.095 NO NO 9.04
CombinationProportions
Cement (%)
Fly Ash (%)
Calorimeter Outlier Analysis
(S/N)1 (S/N)2 (S/N)3 Avg. σ n Max. Min. tCRIT tMAX tMIN OutlierMAX? OutlierMIN? New Avg.
177

178
Table B.4. Outlier Analysis of Calorimetry Data for Cement 4 Combinations in the Screening Study
Baseline 4 100 0 14.41 14.55 14.47 14.47 0.07 3 14.55 14.41 1.153 1.052 0.938 NO NO 14.474-1 75 25 11.74 12.25 11.87 11.95 0.27 3 12.25 11.74 1.153 1.119 0.806 NO NO 11.954-1 50 50 11.91 12.26 12.04 12.07 0.18 3 12.26 11.91 1.153 1.076 0.901 NO NO 12.074-1 30 70 8.96 9.10 8.23 8.77 0.47 3 9.10 8.23 1.153 0.724 1.141 NO NO 8.774-2 75 25 17.00 17.89 17.42 17.44 0.44 3 17.89 17.00 1.153 1.016 0.984 NO NO 17.444-2 50 50 13.37 13.72 13.58 13.56 0.18 3 13.72 13.37 1.153 0.937 1.053 NO NO 13.564-2 30 70 2.66 2.70 2.65 2.67 0.03 3 2.70 2.65 1.153 1.146 0.696 NO NO 2.674-3 75 25 12.52 12.94 12.89 12.79 0.23 3 12.94 12.52 1.153 0.681 1.148 NO NO 12.794-3 50 50 10.32 10.71 10.50 10.51 0.20 3 10.71 10.32 1.153 1.013 0.987 NO NO 10.514-3 30 70 5.68 6.00 5.81 5.83 0.16 3 6.00 5.68 1.153 1.064 0.921 NO NO 5.834-4 75 25 11.97 12.25 12.06 12.09 0.14 3 12.25 11.97 1.153 1.096 0.863 NO NO 12.094-4 50 50 12.13 13.01 12.63 12.59 0.44 3 13.01 12.13 1.153 0.952 1.042 NO NO 12.594-4 30 70 5.11 5.45 5.32 5.29 0.17 3 5.45 5.11 1.153 0.913 1.069 NO NO 5.294-5 75 25 16.88 17.08 17.11 17.03 0.13 3 17.11 16.88 1.153 0.693 1.146 NO NO 17.034-5 50 50 11.05 11.74 11.51 11.43 0.35 3 11.74 11.05 1.153 0.873 1.091 NO NO 11.434-5 30 70 20.67 21.35 20.57 20.86 0.42 3 21.35 20.57 1.153 1.147 0.690 NO NO 20.86
CombinationProportions
Cement (%)
Fly Ash (%)
Calorimeter Outlier Analysis
(S/N)1 (S/N)2 (S/N)3 Avg. σ n Max. Min. tCRIT tMAX tMIN OutlierMAX? OutlierMIN? New Avg.
178

179
Table B.5. Outlier Analysis of Calorimetry Data for Cement 5 Combinations in the Screening Study
Baseline 5 100 0 13.92 14.23 14.14 14.10 0.16 3 14.23 13.92 1.153 0.824 1.112 NO NO 14.105-1 75 25 15.14 15.44 15.34 15.31 0.15 3 15.44 15.14 1.153 0.879 1.088 NO NO 15.315-1 50 50 16.22 16.97 16.42 16.54 0.39 3 16.97 16.22 1.153 1.113 0.823 NO NO 16.545-1 30 70 16.21 16.62 16.50 16.44 0.21 3 16.62 16.21 1.153 0.839 1.107 NO NO 16.445-2 75 25 12.66 13.15 12.93 12.91 0.24 3 13.15 12.66 1.153 0.964 1.033 NO NO 12.915-2 50 50 13.16 13.82 13.32 13.43 0.34 3 13.82 13.16 1.153 1.124 0.790 NO NO 13.435-2 30 70 3.15 3.17 3.12 3.14 0.03 3 3.17 3.12 1.153 0.818 1.115 NO NO 3.145-3 75 25 13.41 13.96 13.60 13.66 0.28 3 13.96 13.41 1.153 1.082 0.890 NO NO 13.665-3 50 50 11.31 11.70 11.40 11.47 0.20 3 11.70 11.31 1.153 1.128 0.779 NO NO 11.475-3 30 70 12.09 11.99 11.62 11.90 0.25 3 12.09 11.62 1.153 0.779 1.128 NO NO 11.905-4 75 25 11.10 11.58 11.46 11.38 0.25 3 11.58 11.10 1.153 0.794 1.123 NO NO 11.385-4 50 50 8.13 8.66 8.54 8.44 0.28 3 8.66 8.13 1.153 0.773 1.129 NO NO 8.445-4 30 70 4.14 4.27 4.13 4.18 0.08 3 4.27 4.13 1.153 1.154 0.613 YES NO 4.185-5 75 25 18.10 18.83 18.14 18.36 0.41 3 18.83 18.10 1.153 1.153 0.622 YES NO 18.365-5 50 50 8.32 8.78 8.44 8.51 0.24 3 8.78 8.32 1.153 1.113 0.823 NO NO 8.515-5 30 70 ----- ----- ----- ----- ----- ----- ----- ----- ----- ----- ----- ----- ----- -----
CombinationProportions
Cement (%)
Fly Ash (%)
Calorimeter Outlier Analysis
(S/N)1 (S/N)2 (S/N)3 Avg. σ n Max. Min. tCRIT tMAX tMIN OutlierMAX? OutlierMIN? New Avg.
179

180
Table B.6. Outlier Analysis of Calorimetry Data for Combination 4-1 Mixtures in the Main Study
4-1 100 0 0 0 0 0.00 14.41 14.55 14.47 14.47 0.07 3 14.55 14.41 1.153 1.052 0.938 NO NO 14.474-1 100 0 0 0 0 2.75 14.56 15.05 14.83 14.81 0.24 3 15.05 14.56 1.153 0.953 1.041 NO NO 14.814-1 100 0 0 0 0 5.00 17.02 17.48 17.31 17.27 0.23 3 17.48 17.02 1.153 0.911 1.070 NO NO 17.274-1 75 25 0 0 0 0.00 11.74 12.25 11.87 11.95 0.27 3 12.25 11.74 1.153 1.119 0.806 NO NO 11.954-1 75 25 0 0 0 2.75 11.81 12.03 11.85 11.89 0.12 3 12.03 11.81 1.153 1.134 0.754 NO NO 11.894-1 75 25 0 0 0 5.00 12.23 12.61 12.58 12.47 0.21 3 12.61 12.23 1.153 0.634 1.153 NO NO 12.474-1 50 50 0 0 0 0.00 11.91 12.26 12.04 12.07 0.18 3 12.26 11.91 1.153 1.076 0.901 NO NO 12.074-1 50 50 0 0 0 2.75 11.01 11.70 11.31 11.34 0.35 3 11.70 11.01 1.153 1.041 0.954 NO NO 11.344-1 50 50 0 0 0 5.00 10.67 11.10 10.85 10.87 0.22 3 11.10 10.67 1.153 1.056 0.932 NO NO 10.874-1 50 50 2 0 0 2.75 11.63 12.04 11.90 11.86 0.21 3 12.04 11.63 1.153 0.877 1.089 NO NO 11.864-1 50 50 4 0 0 2.75 11.21 11.70 11.47 11.46 0.24 3 11.70 11.21 1.153 0.973 1.025 NO NO 11.464-1 50 50 4 5 0 2.75 8.88 9.15 9.08 9.04 0.14 3 9.15 8.88 1.153 0.793 1.123 NO NO 9.044-1 50 50 4 10 0 2.75 6.44 6.57 6.50 6.50 0.07 3 6.57 6.44 1.153 1.047 0.946 NO NO 6.504-1 50 50 4 0 10 2.75 10.37 10.81 10.57 10.58 0.22 3 10.81 10.37 1.153 1.036 0.960 NO NO 10.584-1 50 50 4 0 20 2.75 17.11 17.67 17.36 17.38 0.28 3 17.67 17.11 1.153 1.032 0.965 NO NO 17.384-1 30 70 0 0 0 0.00 8.96 9.10 8.23 8.77 0.47 3 9.10 8.23 1.153 0.724 1.141 NO NO 8.774-1 30 70 0 0 0 2.75 4.27 4.40 4.32 4.33 0.07 3 4.40 4.27 1.153 1.082 0.890 NO NO 4.334-1 30 70 0 0 0 5.00 9.86 10.00 9.82 9.89 0.10 3 10.00 9.82 1.153 1.129 0.774 NO NO 9.894-1 30 70 2 0 0 2.75 11.75 12.01 11.89 11.88 0.13 3 12.01 11.75 1.153 0.972 1.026 NO NO 11.884-1 30 70 4 0 0 2.75 7.33 7.65 7.43 7.47 0.16 3 7.65 7.33 1.153 1.089 0.877 NO NO 7.474-1 30 70 4 5 0 2.75 16.97 17.51 17.28 17.25 0.27 3 17.51 16.97 1.153 0.951 1.043 NO NO 17.254-1 30 70 4 10 0 2.75 14.12 14.40 14.27 14.26 0.14 3 14.40 14.12 1.153 0.980 1.018 NO NO 14.264-1 30 70 4 0 10 2.75 13.38 13.77 13.64 13.60 0.20 3 13.77 13.38 1.153 0.860 1.097 NO NO 13.604-1 30 70 4 0 20 2.75 12.68 12.95 12.75 12.79 0.14 3 12.95 12.68 1.153 1.121 0.801 NO NO 12.79
Lime (%)
RSC (%)
WR (fl.oz./cwt)
CombinationNominal Proportions
Cement (%)
Fly Ash (%)
Gypsum (%) tMAX tMIN
Calorimeter Outlier Analysis
OutlierMAX? OutlierMIN? New Avg.(S/N)1 (S/N)2 (S/N)3 Avg. σ n Max. Min. tCRIT
180

181
Table B.7. Outlier Analysis of Calorimetry Data for Combination 1-3 Mixtures in the Main Study
1-3 100 0 0 0 0 0.00 14.23 14.49 14.46 14.39 0.14 3 14.49 14.23 1.153 0.686 1.147 NO NO 14.391-3 100 0 0 0 0 2.75 8.63 8.85 8.83 8.77 0.12 3 8.85 8.63 1.153 0.666 1.150 NO NO 8.771-3 100 0 0 0 0 5.00 12.91 13.14 13.10 13.05 0.12 3 13.14 12.91 1.153 0.756 1.134 NO NO 13.051-3 75 25 0 0 0 0.00 10.42 10.88 10.66 10.65 0.23 3 10.88 10.42 1.153 0.976 1.022 NO NO 10.651-3 75 25 0 0 0 2.75 7.96 8.46 8.11 8.18 0.25 3 8.46 7.96 1.153 1.109 0.834 NO NO 8.181-3 75 25 0 0 0 5.00 10.15 10.61 10.34 10.37 0.23 3 10.61 10.15 1.153 1.046 0.947 NO NO 10.371-3 50 50 0 0 0 0.00 12.12 12.89 12.73 12.58 0.41 3 12.89 12.12 1.153 0.763 1.132 NO NO 12.581-3 50 50 0 0 0 2.75 11.82 12.54 12.10 12.15 0.36 3 12.54 11.82 1.153 1.063 0.922 NO NO 12.151-3 50 50 0 0 0 5.00 9.24 9.91 9.55 9.57 0.34 3 9.91 9.24 1.153 1.023 0.975 NO NO 9.571-3 50 50 2 0 0 2.75 12.11 12.77 12.47 12.45 0.33 3 12.77 12.11 1.153 0.971 1.026 NO NO 12.451-3 50 50 4 0 0 2.75 7.23 7.57 7.40 7.40 0.17 3 7.57 7.23 1.153 0.998 1.002 NO NO 7.401-3 50 50 4 5 0 2.75 7.28 7.72 7.51 7.50 0.22 3 7.72 7.28 1.153 0.990 1.009 NO NO 7.501-3 50 50 4 10 0 2.75 7.23 7.57 7.38 7.39 0.17 3 7.57 7.23 1.153 1.036 0.960 NO NO 7.391-3 50 50 4 0 10 2.75 8.44 8.99 8.80 8.74 0.28 3 8.99 8.44 1.153 0.878 1.089 NO NO 8.741-3 50 50 4 0 20 2.75 10.57 11.34 11.04 10.99 0.39 3 11.34 10.57 1.153 0.923 1.062 NO NO 10.991-3 30 70 0 0 0 0.00 4.20 4.19 4.18 4.19 0.01 3 4.20 4.18 1.153 0.844 1.104 NO NO 4.191-3 30 70 0 0 0 2.75 9.06 9.07 9.10 9.08 0.02 3 9.10 9.06 1.153 1.129 0.776 NO NO 9.081-3 30 70 0 0 0 5.00 6.51 6.55 6.58 6.55 0.03 3 6.58 6.51 1.153 0.984 1.015 NO NO 6.551-3 30 70 2 0 0 2.75 13.72 14.08 13.77 13.86 0.20 3 14.08 13.72 1.153 1.147 0.688 NO NO 13.861-3 30 70 4 0 0 2.75 10.94 11.41 11.08 11.14 0.24 3 11.41 10.94 1.153 1.102 0.850 NO NO 11.141-3 30 70 4 5 0 2.75 13.27 14.11 13.73 13.70 0.42 3 14.11 13.27 1.153 0.969 1.028 NO NO 13.701-3 30 70 4 10 0 2.75 11.34 11.62 11.42 11.46 0.14 3 11.62 11.34 1.153 1.114 0.821 NO NO 11.461-3 30 70 4 0 10 2.75 9.24 9.32 9.43 9.33 0.10 3 9.43 9.24 1.153 1.031 0.966 NO NO 9.331-3 30 70 4 0 20 2.75 8.69 8.67 8.75 8.70 0.04 3 8.75 8.67 1.153 1.123 0.794 NO NO 8.70
WR (fl.oz./cwt)
CombinationNominal Proportions
Cement (%)
Fly Ash (%)
Gypsum (%)
Lime (%)
RSC (%) tMAX tMIN OutlierMAX? OutlierMIN? New Avg.
Calorimeter Outlier Analysis
(S/N)1 (S/N)2 (S/N)3 Avg. σ n Max. Min. tCRIT
181

182
APPENDIX C
SCREENING STUDY THERMAL CURVES

183
Figure C.1. Thermal Curve Plots for Combination 1-1
Figure C.2. Thermal Curve Plots for Combination 1-2

184
Figure C.3. Thermal Curve Plots for Combination 1-3
Figure C.4. Thermal Curve Plots for Combination 1-4

185
Figure C.5. Thermal Curve Plots for Combination 1-5
Figure C.6. Thermal Curve Plots for Combination 2-1

186
Figure C.7. Thermal Curve Plots for Combination 2-2
Figure C.8. Thermal Curve Plots for Combination 2-3

187
Figure C.9. Thermal Curve Plots for Combination 2-4
Figure C.10. Thermal Curve Plots for Combination 2-5

188
Figure C.11. Thermal Curve Plots for Combination 3-1
Figure C.12. Thermal Curve Plots for Combination 3-2

189
Figure C.13. Thermal Curve Plots for Combination 3-3
Figure C.14. Thermal Curve Plots for Combination 3-4

190
Figure C.15. Thermal Curve Plots for Combination 3-5
Figure C.16. Thermal Curve Plots for Combination 4-1

191
Figure C.17. Thermal Curve Plots for Combination 4-2
Figure C.18. Thermal Curve Plots for Combination 4-3

192
Figure C.19. Thermal Curve Plots for Combination 4-4
Figure C.20. Thermal Curve Plots for Combination 4-5

193
Figure C.21. Thermal Curve Plots for Combination 5-1
Figure C.22. Thermal Curve Plots for Combination 5-2

194
Figure C.23. Thermal Curve Plots for Combination 5-3
Figure C.24. Thermal Curve Plots for Combination 5-4

195
Figure C.25. Thermal Curve Plots for Combination 5-5

196
APPENDIX D
MAIN STUDY THERMAL CURVES

197
Figure D.1. Effect of Water Reducer on Combination 4-1 with 0% Fly Ash
Figure D.2. Effect of Water Reducer on Combination 4-1 with 25% Fly Ash

198
Figure D.3. Effect of Water Reducer on Combination 4-1 with 50% Fly Ash
Figure D.4. Effect of Water Reducer on Combination 4-1 with 70% Fly Ash

199
Figure D.5. Effect of Water Reducer on Combination 1-3 with 0% Fly Ash
Figure D.6. Effect of Water Reducer on Combination 1-3 with 25% Fly Ash

200
Figure D.7. Effect of Water Reducer on Combination 1-3 with 50% Fly Ash
Figure D.8. Effect of Water Reducer on Combination 1-3 with 70% Fly Ash

201
Figure D.9. Effects of Gypsum on Combination 4-1 with 50% Fly Ash and Low Dosage
of Water Reducer
Figure D.10. Effects of Gypsum on Combination 4-1 with 70% Fly Ash and Low Dosage
of Water Reducer

202
Figure D.11. Effects of Gypsum on Combination 1-3 with 50% Fly Ash and Low Dosage
of Water Reducer
Figure D.12. Effects of Gypsum on Combination 1-3 with 70% Fly Ash and Low Dosage
of Water Reducer

203
Figure D.13. Effects of Lime on Combination 4-1 with 50% Fly Ash, 4% Gypsum, and
Low Dosage of Water Reducer
Figure D.14. Effects of Lime on Combination 4-1 with 70% Fly Ash, 4% Gypsum, and
Low Dosage of Water Reducer

204
Figure D.15. Effects of Lime on Combination 1-3 with 50% Fly Ash, 4% Gypsum, and
Low Dosage of Water Reducer
Figure D.16. Effects of Lime on Combination 1-3 with 70% Fly Ash, 4% Gypsum, and
Low Dosage of Water Reducer

205
Figure D.17. Effects of Rapid Set Cement on Combination 4-1 with 50% Fly Ash, 4%
Gypsum, and Low Dosage of Water Reducer
Figure D.18. Effects of Rapid Set Cement on Combination 4-1 with 70% Fly Ash, 4%
Gypsum, and Low Dosage of Water Reducer

206
Figure D.19. Effects of Rapid Set Cement on Combination 1-3 with 50% Fly Ash, 4%
Gypsum, and Low Dosage of Water Reducer
Figure D.20. Effects of Rapid Set Cement on Combination 1-3 with 70% Fly Ash, 4%
Gypsum, and Low Dosage of Water Reducer

207
APPENDIX E
SCREENING STUDY MINIATURE SLUMP PLOTS

208
Figure E.1. Miniature Slump Plots for Combination 1-1
Figure E.2. Miniature Slump Plots for Combination 1-2

209
Figure E.3. Miniature Slump Plots for Combination 1-3
Figure E.4. Miniature Slump Plots for Combination 1-4

210
Figure E.5. Miniature Slump Plots for Combination 1-5
Figure E.6. Miniature Slump Plots for Combination 2-1

211
Figure E.7. Miniature Slump Plots for Combination 2-2
Figure E.8. Miniature Slump Plots for Combination 2-3

212
Figure E.9. Miniature Slump Plots for Combination 2-4
Figure E.10. Miniature Slump Plots for Combination 2-5

213
Figure E.11. Miniature Slump Plots for Combination 3-1
Figure E.12. Miniature Slump Plots for Combination 3-2

214
Figure E.13. Miniature Slump Plots for Combination 3-3
Figure E.14. Miniature Slump Plots for Combination 3-4

215
Figure E.15. Miniature Slump Plots for Combination 3-5
Figure E.16. Miniature Slump Plots for Combination 4-1

216
Figure E.17. Miniature Slump Plots for Combination 4-2
Figure E.18. Miniature Slump Plots for Combination 4-3

217
Figure E.19. Miniature Slump Plots for Combination 4-4
Figure E.20. Miniature Slump Plots for Combination 4-5

218
Figure E.21. Miniature Slump Plots for Combination 5-1
Figure E.22. Miniature Slump Plots for Combination 5-2

219
Figure E.23. Miniature Slump Plots for Combination 5-3
Figure E.24. Miniature Slump Plots for Combination 5-4

220
Figure E.25. Miniature Slump Plots for Combination 5-5

221
APPENDIX F
MAIN STUDY MINIATURE SLUMP PLOTS

222
Figure F.1. Effect of Water Reducer on Combination 4-1 with 0% Fly Ash
Figure F.2. Effect of Water Reducer on Combination 4-1 with 25% Fly Ash

223
Figure F.3. Effect of Water Reducer on Combination 4-1 with 50% Fly Ash
Figure F.4. Effect of Water Reducer on Combination 4-1 with 70% Fly Ash

224
Figure F.5. Effect of Water Reducer on Combination 1-3 with 0% Fly Ash
Figure F.6. Effect of Water Reducer on Combination 1-3 with 25% Fly Ash

225
Figure F.7. Effect of Water Reducer on Combination 1-3 with 50% Fly Ash
Figure F.8. Effect of Water Reducer on Combination 1-3 with 70% Fly Ash

226
Figure F.9. Effects of Gypsum on Combination 4-1 with 50% Fly Ash and Low Dosage
of Water Reducer
Figure F.10. Effects of Gypsum on Combination 4-1 with 70% Fly Ash and Low Dosage
of Water Reducer

227
Figure F.11. Effects of Gypsum on Combination 1-3 with 50% Fly Ash and Low Dosage
of Water Reducer
Figure F.12. Effects of Gypsum on Combination 1-3 with 70% Fly Ash and Low Dosage
of Water Reducer

228
Figure F.13. Effects of Lime on Combination 4-1 with 50% Fly Ash, 4% Gypsum, and
Low Dosage of Water Reducer
Figure F.14. Effects of Lime on Combination 4-1 with 70% Fly Ash, 4% Gypsum, and
Low Dosage of Water Reducer

229
Figure F.15. Effects of Lime on Combination 1-3 with 50% Fly Ash, 4% Gypsum, and
Low Dosage of Water Reducer
Figure F.16. Effects of Lime on Combination 1-3 with 70% Fly Ash, 4% Gypsum, and
Low Dosage of Water Reducer

230
Figure F.17. Effects of Rapid Set Cement on Combination 4-1 with 50% Fly Ash, 4%
Gypsum, and Low Dosage of Water Reducer
Figure F.18. Effects of Rapid Set Cement on Combination 4-1 with 70% Fly Ash, 4%
Gypsum, and Low Dosage of Water Reducer

231
Figure F.19. Effects of Rapid Set Cement on Combination 1-3 with 50% Fly Ash, 4%
Gypsum, and Low Dosage of Water Reducer
Figure F.20. Effects of Rapid Set Cement on Combination 1-3 with 70% Fly Ash, 4%
Gypsum, and Low Dosage of Water Reducer

232
REFERENCES
ACI Committee 232. (2003). Use of Fly Ash in Concrete. Detroit, MI: American Concrete Institute.
ASTM C 109. (2008). Standard Test Method for Compressive Strength of Hydraulic Cement Mortars (Using 2-in. or [50-mm] Cube Specimens). West Conshohocken, PA: ASTM International.
ASTM C 143. (2010). Standard Test Methods for Slump of Hydraulic Cement Concrete. West Conshohocken, PA: ASTM International.
ASTM C 1679. (2009). Standard Practice for Measuring Hydration Kinetics of Hydraulic Cementitious Mixtures Using Isothermal Calorimetry. West Conshohocken, PA: ASTM International.
ASTM C 186. (2005). Standard Test Method for Heat of Hydration of Hydraulic Cement. West Conshohocken, PA: ASTM International.
ASTM C 187. (2010). Standard Test Method for Normal Consistency of Hydraulic Cement. West Conshohocken, PA: ASTM International.
ASTM C 191. (2008). Standard Test Methods for Time of Setting of Hydraulic Cement by Vicat Needle. West Conshohocken, PA: ASTM International.
ASTM C 305. (2006). Standard Practice for Mechanical Mixing of Hydraulic Cement Pastes and Mortars of Plastic Consistency. West Conshohocken, PA: ASTM International.
ASTM WK23967. (2011, March 13). Standard Practice for Evaluating Hydration of Hydraulic Cementitious Mixtures Using Thermal Measurements (Draft). West Conshohocken, PA: ASTM International.
Bentz, D. P. (2010). Powder Additions to Mitigate Retardation in High-Volume Fly Ash Mixtures. ACI Materials Journal, 107(5), 508-514.
Bentz, D. P., & Ferraris, C. F. (2010). Rheology and Setting of High Volume Fly Ash Mixtures. Cement and Concrete Composites, 1-12.
Bentz, D. P., Ferreris, C. F., De la Varga, I., Peltz, M. A., & Winpigler, J. A. (2010). Mixture Proportioning Options for Improving High Volume Fly Ash Concretes. International Journal of Pavement Research and Technology, 3(5), 234-240.
Bhattacharja, S., & Tang, F. J. (2001). Rheology of Cement Paste in Concrete with Different Mix Designs and Interlaboratory Evaluation of the Mini-Slump Cone Test. Skokie, Illinois: Portland Cement Association.
Calmetrix. (2010). CalCommander Software v1.3 User Manual. Calmetrix, Inc.

233
Calmetrix. (2010). F-Cal 4000/8000 User Manual. Calmetrix, Inc.
Cost, T. (2009). Thermal Measurements of Hydrating Concrete Mixtures. Silver Spring, Maryland: National Ready Mixed Concrete Association.
Cost, V. T., & Knight, G. (2007). Use of Thermal Measurements to Detect Potential Incompatibilities of Common Concrete Materials. ACI Special Publication 241, 39-58.
Detwiler, R. J., Bhatty, J. I., & Bhattacharja, S. (1996). Supplementary Cementing Materials for Use in Blended Cements. Skokie, Illinois: Portland Cement Association.
Gibbon, G. J. (n.d.). Gibbon, G. J., Ballim, Y., and Grieve, G. R. H. (1997). “A low-cost, computer-controlled adiabatic calorimeter for determining the heat of hydration of concrete.” Journal of Testing and Evaluation, 25(2), 261-266? Hubert, C., Wieker, W., & Heidemann, D. (2001). Investigations of Hydration Products
in High-Volume Fly Ash Binders. ACI Special Publication 199, 83-98.
Jiang, L., Lin, B., & Cai, Y. (1999). Studies on Hydration in High-Volume Fly Ash Concrete Binders. ACI Materials Journal, 96(6), 703-706.
Kantro, D. L. (1980). Influence of Water-Reducing Admixtures on Properties of Cement Paste - A Miniature Slump Test. Cement, Concrete, and Aggregates, 2(2), 95-102.
Kosmatka, S. H., Kerkhoff, B., & Panarese, W. C. (2003). Design and Control of Concrete Mixtures (14th ed.). Skokie, Illinois: Portland Cement Association.
Lerch, W. (1946). The Influence of Gypsum on the Hydration and Properties of Portland Cement Pastes. Chicago: Portland Cement Association.
Malhotra, V. M., & Mehta, P. K. (1996). Pozzolanic and Cementitious Materials (Vol. 1). Amsterdam, The Netherlands: Gordan and Breach.
Mehta, P. K., & Monteiro, P. J. (1993). Concrete: Microstructure, Properties, and Materials (2nd ed.). New York: McGraw-Hill.
Mindess, S., Young, J. F., & Darwin, D. (2003). Concrete (2nd ed.). Upper Saddle River, NJ: Prentice Hall.
Roberts, L. R., & Taylor, P. C. (2007, January). Understanding Cement-SCM-Admixture Interaction Issues. Concrete International, 29(1), 33-41.
Sandberg, J. P., & Liberman, S. (2007). Monitoring and Evaluation of Cement Hydration by Semi-Adiabatic Field Calorimetry. ACI Special Publication 241, 13-23.
Schindler, A. K., & Folliard, K. J. (2003). Influence of Supplementary Cementing Materials on the Heat of Hydration of Concrete. Proc. of Advances in Cement and Concrete IX Conference. Copper Mountain Conference Resort, Colorado.

234
Wang, H., Qi, C., Farzam, H., & Turici, J. (2006, April). Interaction of Materials Used in Concrete. Concrete International, 28(4), pp. 47-52.
Wang, K. (2006). Monitoring Heat Evolution of Concrete Mixtures. National Concrete Pavement Technology Center.

235
VITA
Karl Wehking Beckemeier was born in North Kansas City, Missouri on April 27,
1987, to Kurt and Cynthia Beckemeier. He has one brother, Eric Beckemeier. Karl was
raised in Hardin, Missouri and attended school in Norborne, Missouri, where he
graduated in 2005. He then attended the Missouri University of Science and Technology
and earned his Bachelors of Science degrees in Architectural Engineering and Civil
Engineering. In December of 2012, he earned his Masters of Science degree in Civil
Engineering from the Missouri University of Science and Technology.
While attending the Missouri University of Science and Technology, Karl was a
member of Chi Epsilon, a civil engineering honor society, and Phi Kappa Phi, an honor
society. He also was a Graduate Teaching Assistant for a construction materials course
for four semesters, worked as a Research Assistant during his undergraduate and graduate
studies, and held three summer internships with the Missouri Department of
Transportation.
In June of 2010, Karl married Nickol Marie Enss. At the time of this writing, they
reside in Louisville, Kentucky, where Karl is employed as a quality control engineer for a
company that handles coal combustion products.

236
Related Documents


![Accessories for the Laser Scattering Particle Size ......[Measurement range] 0.01–1000 μm, suits organic solvents Cell volumes: 5 mL, 10 mL, 15 mL Paste Cell The Paste Cell can](https://static.cupdf.com/doc/110x72/5f30a22d4122bd0397092e6d/accessories-for-the-laser-scattering-particle-size-measurement-range-001a1000.jpg)
