Welcome message from author
This document is posted to help you gain knowledge. Please leave a comment to let me know what you think about it! Share it to your friends and learn new things together.
Transcript

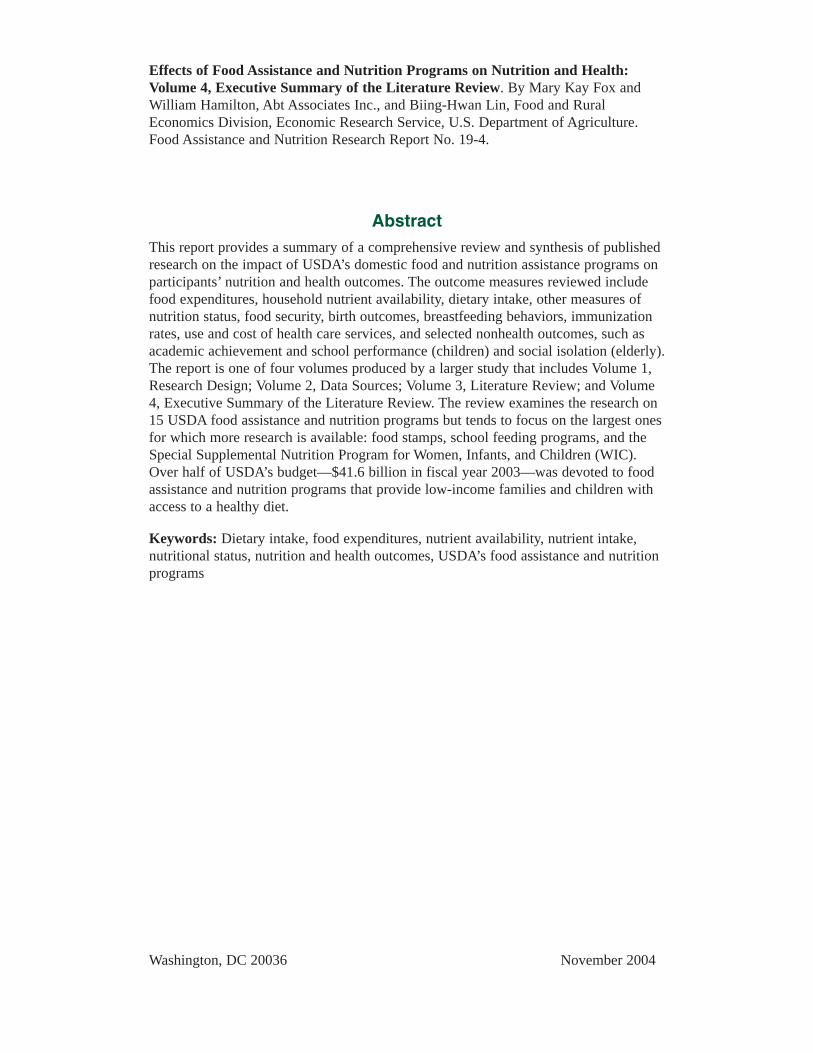
Effects of Food Assistance and Nutrition Programs on Nutrition and Health:Volume 4, Executive Summary of the Literature Review. By Mary Kay Fox andWilliam Hamilton, Abt Associates Inc., and Biing-Hwan Lin, Food and RuralEconomics Division, Economic Research Service, U.S. Department of Agriculture.Food Assistance and Nutrition Research Report No. 19-4.
AbstractThis report provides a summary of a comprehensive review and synthesis of publishedresearch on the impact of USDA’s domestic food and nutrition assistance programs onparticipants’ nutrition and health outcomes. The outcome measures reviewed includefood expenditures, household nutrient availability, dietary intake, other measures ofnutrition status, food security, birth outcomes, breastfeeding behaviors, immunizationrates, use and cost of health care services, and selected nonhealth outcomes, such asacademic achievement and school performance (children) and social isolation (elderly).The report is one of four volumes produced by a larger study that includes Volume 1,Research Design; Volume 2, Data Sources; Volume 3, Literature Review; and Volume4, Executive Summary of the Literature Review. The review examines the research on15 USDA food assistance and nutrition programs but tends to focus on the largest onesfor which more research is available: food stamps, school feeding programs, and theSpecial Supplemental Nutrition Program for Women, Infants, and Children (WIC).Over half of USDA’s budget—$41.6 billion in fiscal year 2003—was devoted to foodassistance and nutrition programs that provide low-income families and children withaccess to a healthy diet.
Keywords: Dietary intake, food expenditures, nutrient availability, nutrient intake,nutritional status, nutrition and health outcomes, USDA’s food assistance and nutritionprograms
Washington, DC 20036 November 2004
AcknowledgmentsMany individuals deserve recognition for their roles in making this report a reality.First and foremost are the authors who contributed to the comprehensive literaturereview on which this report is based. Without their tireless efforts, this summary reportwould not exist. Authors include current and former Abt Associates staff: Joy Behrens,Nancy Burstein, David Connell, Mary Kay Crepinsek, Mary Kay Fox, Frederic Glantz,Cristofer Price, and William Hamilton, as well as consultants Virginia Casey, JohnCook, Peter H. Rossi, and Joanne Tighe.
We also owe a debt of gratitude to colleagues who reviewed and commented on draftsof this report. We acknowledge staff at USDA’s Economic Research Service (JaneReed, Betsy Frazao, Linda Ghelfi, Craig Gundersen, Joanne Guthrie, Bill Levedahl,Vic Oliveira, Mark Prell, David Smallwood, Laura Tiehen, Jay Variyam, and ParkeWilde), Food and Nutrition Service (Steven Carlson, Jay Hirshman, PatriciaMcKinney, Anita Singh, Edward Herzog, Lisa Ramirez-Branum, and Tracy von Ins),and Center for Nutrition Policy and Promotion (Peter Basiotis and Andrea Carlson).Their contributions greatly improved the report.
Sharon Christenson and Daniel Singer deserve special recognition for coordinating theliterature search and document retrieval process for the literature review. And, finally,several people at Abt Associates and the Economic Research Service (ERS) deserveour gratitude for managing production and editing of the report. Eileen MacEnaneyand Eileen Fahey coordinated production of the report at Abt Associates. At ERS,Linda Hatcher completed final editing and coordinated final production, and VicPhillips designed the cover.
We sincerely appreciate the efforts of all these colleagues.
Mary Kay FoxWilliam HamiltonBiing-Hwan Lin
ii E Effects of Food Assistance and Nutrition Programs on Nutrition and Health / FANRR-19-4 Economic Research Service/USDA
ContentsPage
Introduction ..................................................................................................................1Objective and Scope of the Review...........................................................................1Overview of the Literature on Nutrition and Health Outcomes................................3Limitations of Available Research.............................................................................3
Overview of the Findings...........................................................................................10Food Stamp Program ...............................................................................................10WIC Program ...........................................................................................................12National School Lunch Program..............................................................................20School Breakfast Program .......................................................................................23Child and Adult Care Food Program .......................................................................26Summer Food Service Program...............................................................................27The Emergency Food Assistance Program ..............................................................28Nutrition Services Incentive Program......................................................................29Nutrition Assistance Program in Puerto Rico, American Samoa, and
the Northern Marianas ...........................................................................................31Commodity Supplemental Food Program ...............................................................31Food Distribution Program on Indian Reservations and the Trust Territories ........32WIC and Senior Farmers’ Market Programs ...........................................................33Special Milk Program ..............................................................................................33Team Nutrition Initiative and Nutrition Education and Training Program .............34
References ...................................................................................................................36
Appendix A: Summary of Impact Studies Identified in the Literature Review ..............................................................................................43
Appendix B: References Cited in the Literature Review .....................................119
Economic Research Service/USDA Effects of Food Assistance and Nutrition Programs on Nutrition and Health / FANRR-19-4 E iii
iv E Effects of Food Assistance and Nutrition Programs on Nutrition and Health / FANRR-19-4 Economic Research Service/USDA
List of TablesTable Page
1 Federal food assistance and nutrition programs.................................................22 Populations served and benefits provided by Federal food and
nutrition assistance programs ..........................................................................43 Number of studies by program and outcome.....................................................6
List of Appendix Tables1 Studies that examined the impact of the Food Stamp Program on
household food expenditures .........................................................................462 Studies that examined the impact of the Food Stamp Program on
household availability of food energy and nutrients .....................................513 Studies that examined the impact of the Food Stamp Program on
dietary intakes of individuals ........................................................................534 Studies that examined the impact of the Food Stamp Program on
other nutrition and health outcomes ..............................................................575 Studies that examined the impact of prenatal WIC participation on
birth outcomes, including associated health care costs .................................626 Studies that examined the impact of the WIC program on breastfeeding .......717 Studies that examined the impact of the WIC program on nutrition
and health outcomes of pregnant women ......................................................748 Studies that examined the impact of the WIC program on nutrition
and health outcomes of infants and children.................................................779 Studies that examined the impact of the WIC program on nutrition and
health outcomes of nonbreastfeeding postpartum women, breastfeeding women, all WIC participants, or WIC households .......................................87
10 Studies that examined the impact of the National School Lunch Program on students’dietary intakes..............................................................90
11 Studies that examined the impact of the National School Lunch Program on other nutrition and health outcomes ..........................................94
12 Studies that examined the impact of the School Breakfast Program on students’ dietary intakes............................................................................98
13 Studies that examined the impact of universal-free breakfast programs on school performance and behavioral/cognitive outcomes .......................101
14 Studies that examined the impact of the Elderly Nutrition Program on nutrition and health outcomes ................................................................104
15 Studies that examined the impact of the Nutrition Assistance Program in Puerto Rico on household food expenditures and/or nutrient availability ......................................................................................110
16 Studies that examined the impact of the Commodity Supplemental Food Program on nutrition and health outcomes of low-income pregnant women and young children..........................................................................112
17 Studies that examined the impact of the WIC Farmers’ Market Nutrition Program on self-reported fruit and vegetable consumption ........................114
18 Studies that examined the impact of the Special Milk Program on children’s milk consumption........................................................................116
19 Studies that examined the impact of the Team Nutrition Initiative and the Nutrition Education and Training Program on school-age children ......................................................................................118
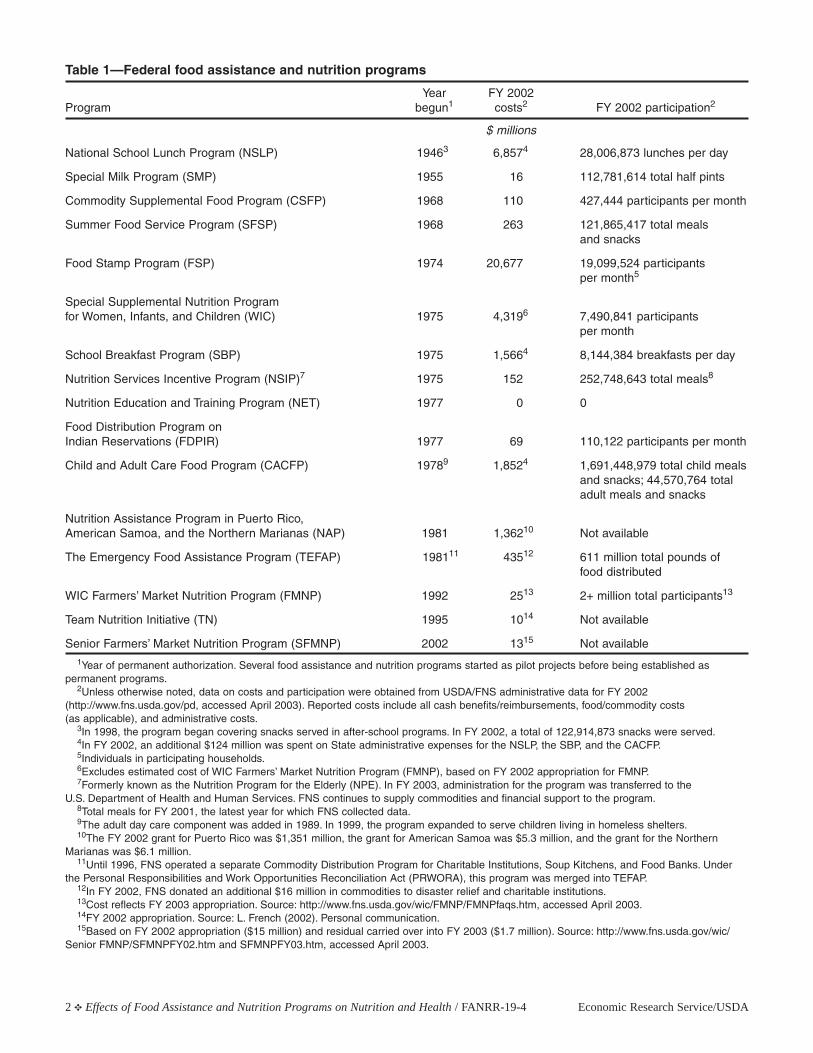
IntroductionSince the mid-1940s, the U.S. Government has beencommitted to ensuring that its citizens neither go hungrynor suffer the consequences of inadequate dietary intake.Over the years, Federal programs have been implement-ed to meet this commitment. Today, the Federal nutri-tion safety net includes 16 distinct food assistance andnutrition programs (FANPs) (table 1). Administered bythe Food and Nutrition Service (FNS), U.S. Departmentof Agriculture (USDA), together the 16 programs werefunded at a level of about $38 billion in fiscal year(FY) 2002.1 An estimated one in five Americans par-ticipated in one or more FANPs at some point duringFY 2002 (Oliveira, 2003).
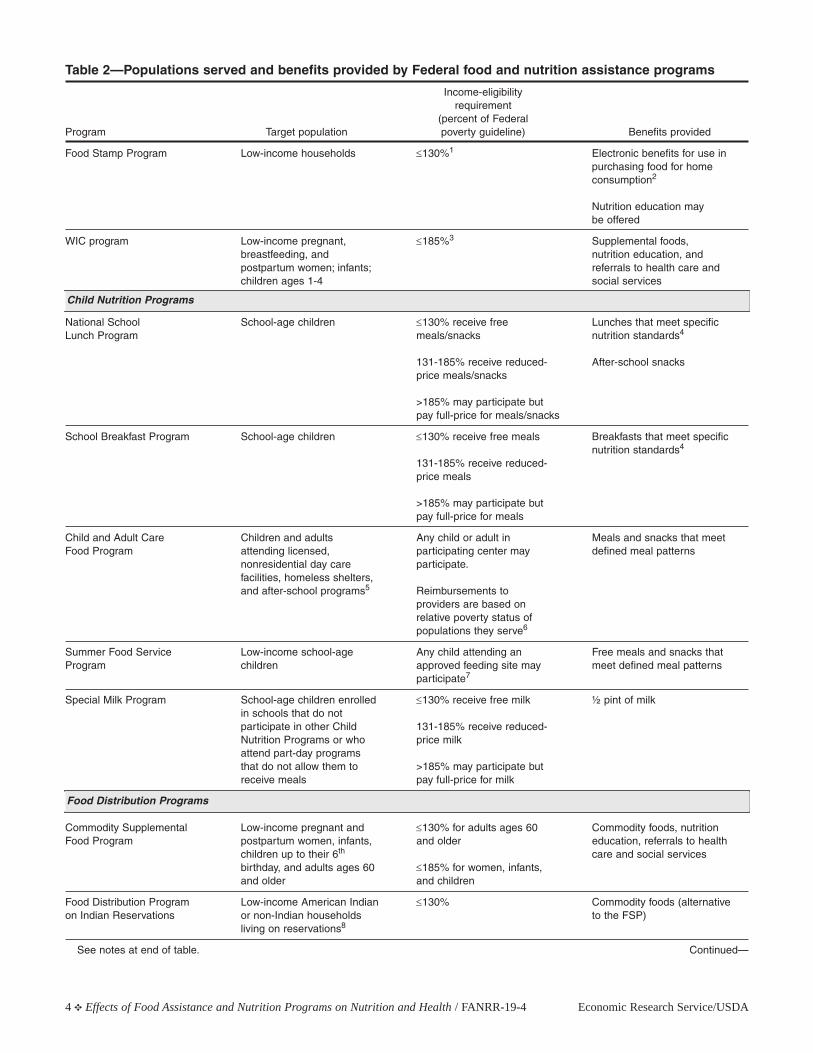
Although FANPs vary greatly in size, target population,and benefit-delivery strategy, all provide vulnerablegroups of citizens with food, the means to purchasefood, and/or with nutrition education (table 2).2 AllFANPs share the main goal of ensuring the health ofvulnerable Americans by providing access to a nutrition-ally adequate diet. In 1998, FNS renewed its commit-ment to nutrition education in all FANPs, with the goalof increasing the role of the programs in improving theNation’s eating habits (USDA/FNS, 2003a). As part ofthis renewed focus, one of two key goals defined inthe FNS strategic plan for 2000-05 is “improved nutri-tion for children and low-income people” (USDA/FNS, 2000a). Core objectives under this goal include
improving food security, promoting healthy foodchoices among FANP participants, and improving thequality of meals, food packages, commodities, andother program benefits. This emphasis on nutrition andnutrition education differentiates the FANPs fromother federally sponsored income support programs.
In recognition of the renewed emphasis on nutritionand nutrition education in the FANPs, as well as theincreasing Federal focus on program accountability,USDA’s Economic Research Service (ERS) contractedwith Abt Associates Inc. to conduct the Nutrition andHealth Outcomes Study. A major focus of the studywas a comprehensive review and synthesis of existingresearch on the impact of FANPs on nutrition- andhealth-related outcomes (see p. 3 for an explanation ofthe term “outcomes”). This report summarizes keyfindings from that effort. Detailed reviews of relevantresearch, on which this summary is based, are pub-lished in a companion volume (Fox, Hamilton, andLin, 2004).3
Objective and Scope of the Review
The objective of the literature review was to summarizecurrent knowledge about the effects of FANP participa-tion on nutrition- and health-related outcomes. The firststep was a comprehensive literature search to identify
Economic Research Service/USDA Effects of Food Assistance and Nutrition Programs on Nutrition and Health / FANRR-19-4 E 1
Effects of Food Assistance andNutrition Programs onNutrition and Health
Volume 4, Executive Summaryof the Literature Review
By Mary Kay Fox, William Hamilton, and Biing-Hwan Lin
1The list of FANPs used here differs slightly from the list used by FNS.FNS considers the Nutrition Education and Training Program and the TeamNutrition Initiative to be part of the National School Lunch Program and theSchool Breakfast Program. FNS also operates the Disaster Relief Program,a program that is not considered in this review because its role in the nutri-tion safety net is substantively different from that of the other FANPs.
2Several programs also provide avenues for distributing surplus agricultural commodities.
3The Nutrition and Health Outcomes Study produced six other reports.Two are companion volumes to this report. One of the reports reviews theresearch designs available to researchers interested in studying the effectsof FANPs (Hamilton and Rossi, 2002), and the other describes existing datasources that might be useful in these endeavors (Logan, Fox, and Lin, 2002).Four additional reports summarize the nutrition and health characteristicsof low-income populations, using data from the third National Health andNutrition Examination Survey (NHANES-III). The reports cover FoodStamp Program participants and nonparticipants (Fox and Cole, 2004a),WIC participants and nonparticipants (Cole and Fox, 2004a), school-agechildren (Fox and Cole, 2004b), and older adults (Cole and Fox, 2004b).
2 E Effects of Food Assistance and Nutrition Programs on Nutrition and Health / FANRR-19-4 Economic Research Service/USDA
Table 1—Federal food assistance and nutrition programs
Year FY 2002Program begun1 costs2 FY 2002 participation2
$ millions
National School Lunch Program (NSLP) 19463 6,8574 28,006,873 lunches per day
Special Milk Program (SMP) 1955 16 112,781,614 total half pints
Commodity Supplemental Food Program (CSFP) 1968 110 427,444 participants per month
Summer Food Service Program (SFSP) 1968 263 121,865,417 total meals and snacks
Food Stamp Program (FSP) 1974 20,677 19,099,524 participantsper month5
Special Supplemental Nutrition Program for Women, Infants, and Children (WIC) 1975 4,3196 7,490,841 participants
per month
School Breakfast Program (SBP) 1975 1,5664 8,144,384 breakfasts per day
Nutrition Services Incentive Program (NSIP)7 1975 152 252,748,643 total meals8
Nutrition Education and Training Program (NET) 1977 0 0
Food Distribution Program on Indian Reservations (FDPIR) 1977 69 110,122 participants per month
Child and Adult Care Food Program (CACFP) 19789 1,8524 1,691,448,979 total child mealsand snacks; 44,570,764 total adult meals and snacks
Nutrition Assistance Program in Puerto Rico, American Samoa, and the Northern Marianas (NAP) 1981 1,36210 Not available
The Emergency Food Assistance Program (TEFAP) 198111 43512 611 million total pounds of food distributed
WIC Farmers’ Market Nutrition Program (FMNP) 1992 2513 2+ million total participants13
Team Nutrition Initiative (TN) 1995 1014 Not available
Senior Farmers’ Market Nutrition Program (SFMNP) 2002 1315 Not available1Year of permanent authorization. Several food assistance and nutrition programs started as pilot projects before being established as
permanent programs.2Unless otherwise noted, data on costs and participation were obtained from USDA/FNS administrative data for FY 2002
(http://www.fns.usda.gov/pd, accessed April 2003). Reported costs include all cash benefits/reimbursements, food/commodity costs (as applicable), and administrative costs.
3In 1998, the program began covering snacks served in after-school programs. In FY 2002, a total of 122,914,873 snacks were served.4In FY 2002, an additional $124 million was spent on State administrative expenses for the NSLP, the SBP, and the CACFP.5Individuals in participating households.6Excludes estimated cost of WIC Farmers’ Market Nutrition Program (FMNP), based on FY 2002 appropriation for FMNP.7Formerly known as the Nutrition Program for the Elderly (NPE). In FY 2003, administration for the program was transferred to the
U.S. Department of Health and Human Services. FNS continues to supply commodities and financial support to the program.8Total meals for FY 2001, the latest year for which FNS collected data.9The adult day care component was added in 1989. In 1999, the program expanded to serve children living in homeless shelters.10The FY 2002 grant for Puerto Rico was $1,351 million, the grant for American Samoa was $5.3 million, and the grant for the Northern
Marianas was $6.1 million.11Until 1996, FNS operated a separate Commodity Distribution Program for Charitable Institutions, Soup Kitchens, and Food Banks. Under
the Personal Responsibilities and Work Opportunities Reconciliation Act (PRWORA), this program was merged into TEFAP.12In FY 2002, FNS donated an additional $16 million in commodities to disaster relief and charitable institutions.13Cost reflects FY 2003 appropriation. Source: http://www.fns.usda.gov/wic/FMNP/FMNPfaqs.htm, accessed April 2003.14FY 2002 appropriation. Source: L. French (2002). Personal communication.15Based on FY 2002 appropriation ($15 million) and residual carried over into FY 2003 ($1.7 million). Source: http://www.fns.usda.gov/wic/
Senior FMNP/SFMNPFY02.htm and SFMNPFY03.htm, accessed April 2003.
potentially relevant research for each FANP.4 The searchcovered published research papers and books, researchreports to government agencies, and unpublishedworks, such as doctoral dissertations, working papersof research institutes, and conference presentations.5
Several hundred citations were identified through theinitial search of selected computerized databases.However, many did not deal directly with the coreobjective of this review and were excluded from fur-ther consideration. These citations included, for exam-ple, general program descriptions, program manuals,research on program participation or participant char-acteristics, and research on program operations, costs,and integrity. In addition, research that involved FANPparticipants but did not explicitly compare participantsand nonparticipants was excluded.
This winnowing process narrowed the list of citations toresearch that explicitly examined the impact of FANPparticipation by comparing nutrition- and health-relat-ed outcomes of program participants and nonpartici-pants. Program-specific authors identified other rele-vant citations as they reviewed papers and reports.
Overview of the Literature on Nutrition and Health Outcomes
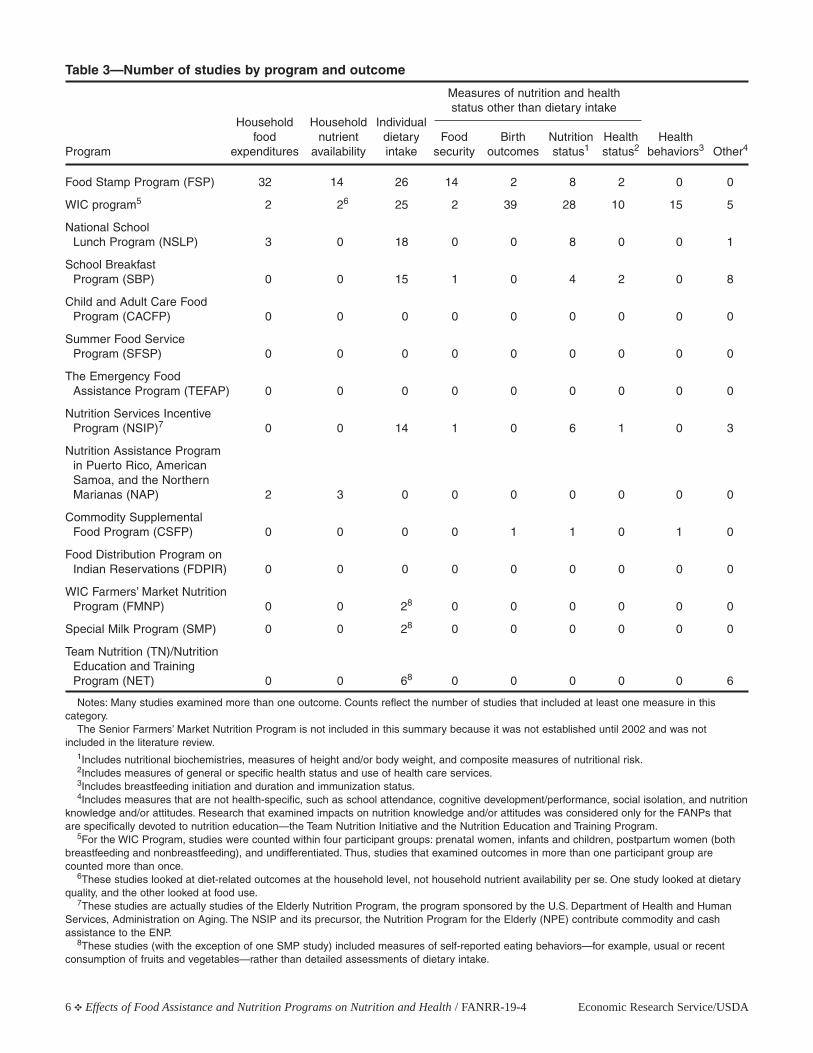
An extensive amount of research has assessed theimpact of specific FANPs on nutrition and health, butthe coverage is neither comprehensive nor even. Table 3shows the number of studies identified for each pro-gram and the major outcomes examined. Outcomescan be grouped into six categories:
• Household food expenditures.
• Household nutrient availability.
• Individual dietary intake.
• Measures of nutrition and health status other thandietary intake (food security, birth outcomes, nutri-tional status, and health status).
• Health-related behaviors.
• Other relevant, but not specifically health-related,outcomes.
The last category includes cognitive development andschool-related performance among children, social iso-lation among the elderly, and nutrition knowledge orattitudes (examined for only the programs focusedspecifically on nutrition education—the NutritionEducation and Training Program and the TeamNutrition Initiative).
Conclusions from studies that have examined the impactof FANP participation on nutrition and health statusmust be interpreted with caution. Establishing causali-ty between FANP participation and long-term nutritionand health outcomes requires that data support a logi-cal time sequence. For long-term outcomes (measuresthat develop over time, such as linear growth and bodyweight), FANP participation must precede the outcomefor a reasonable period of time and be of sufficientintensity to provide a plausible basis for a hypothe-sized impact. In addition, reliable assessment ofimpacts on such measures as linear growth and nutri-tional biochemistries requires at least two measure-ments, one before and one after participation. Finally,a complex interplay of diet, heredity, and environmentinfluence nutrition and health status, which makes thetask of determining the specific impacts of FANPs onthese long-term outcomes a challenge. Comparableconcerns exist for studies that have examined theimpact of FANP participation on food security status.
As table 3 illustrates, the Food Stamp Program (FSP)and the Special Supplemental Nutrition Program forWomen Infants and Children (WIC) have been studiedextensively, and a broad number of outcomes havebeen examined. For several other programs, impactresearch is totally or virtually nonexistent. For some ofthese programs, such as the Food Distribution Programon Indian Reservations (FDPIR), the CommoditySupplemental Food Program (CSFP), and the SpecialMilk Program (SMP), little research of any kind isavailable. For other programs, including the Child andAdult Care Food Program (CACFP), the SummerFood Service Program (SFSP), and The EmergencyFood Assistance Program (TEFAP), research is avail-able, but none of it has focused on measuring programimpacts on individual participants or their households.
Limitations of Available Research
Many studies of the effects of FANP participation onnutrition- and health-related outcomes share three keylimitations. These limitations include research designand the potential for selection bias, the relative age ofthe available research, and the standards used to assessdietary intake.
Economic Research Service/USDA Effects of Food Assistance and Nutrition Programs on Nutrition and Health / FANRR-19-4 E 3
4The Senior Farmers’ Market Nutrition Program was not included in thesearch because the program was not established until 2002.
5The initial search was conducted in 1999 and updated in 2002 beforepreparation of the final version of the report. The 2002 update includedonly published research. Additional published research was incorporatedbefore publication of the report in 2004.
4 E Effects of Food Assistance and Nutrition Programs on Nutrition and Health / FANRR-19-4 Economic Research Service/USDA
Table 2—Populations served and benefits provided by Federal food and nutrition assistance programs
Income-eligibilityrequirement
(percent of FederalProgram Target population poverty guideline) Benefits provided
Food Stamp Program Low-income households ≤130%1 Electronic benefits for use in purchasing food for home consumption2
Nutrition education may be offered
WIC program Low-income pregnant, ≤185%3 Supplemental foods, breastfeeding, and nutrition education, and postpartum women; infants; referrals to health care and children ages 1-4 social services
National School School-age children ≤130% receive free Lunches that meet specific Lunch Program meals/snacks nutrition standards4
131-185% receive reduced- After-school snacksprice meals/snacks
>185% may participate but pay full-price for meals/snacks
School Breakfast Program School-age children ≤130% receive free meals Breakfasts that meet specific nutrition standards4
131-185% receive reduced-price meals
>185% may participate but pay full-price for meals
Child and Adult Care Children and adults Any child or adult in Meals and snacks that meet Food Program attending licensed, participating center may defined meal patterns
nonresidential day care participate.facilities, homeless shelters, and after-school programs5 Reimbursements to
providers are based on relative poverty status of populations they serve6
Summer Food Service Low-income school-age Any child attending an Free meals and snacks that Program children approved feeding site may meet defined meal patterns
participate7
Special Milk Program School-age children enrolled ≤130% receive free milk ½ pint of milkin schools that do not participate in other Child 131-185% receive reduced-Nutrition Programs or who price milk attend part-day programs that do not allow them to >185% may participate but receive meals pay full-price for milk
Commodity Supplemental Low-income pregnant and ≤130% for adults ages 60 Commodity foods, nutrition Food Program postpartum women, infants, and older education, referrals to health
children up to their 6th care and social servicesbirthday, and adults ages 60 ≤185% for women, infants, and older and children
Food Distribution Program Low-income American Indian ≤130% Commodity foods (alternative on Indian Reservations or non-Indian households to the FSP)
living on reservations8
See notes at end of table. Continued—
Child Nutrition Programs
Food Distribution Programs
Economic Research Service/USDA Effects of Food Assistance and Nutrition Programs on Nutrition and Health / FANRR-19-4 E 5
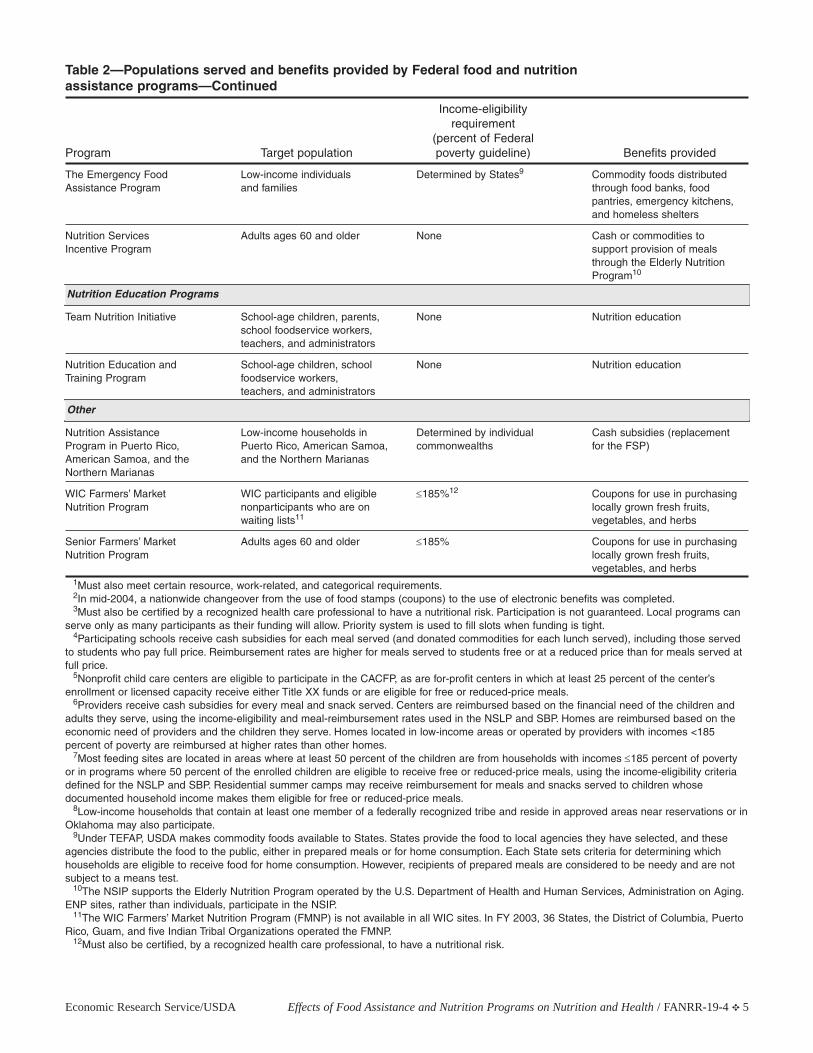
Table 2—Populations served and benefits provided by Federal food and nutrition assistance programs—Continued
Income-eligibilityrequirement
(percent of FederalProgram Target population poverty guideline) Benefits provided
The Emergency Food Low-income individuals Determined by States9 Commodity foods distributed Assistance Program and families through food banks, food
pantries, emergency kitchens, and homeless shelters
Nutrition Services Adults ages 60 and older None Cash or commodities to Incentive Program support provision of meals
through the Elderly Nutrition Program10
Team Nutrition Initiative School-age children, parents, None Nutrition educationschool foodservice workers, teachers, and administrators
Nutrition Education and School-age children, school None Nutrition educationTraining Program foodservice workers,
teachers, and administrators
Nutrition Assistance Low-income households in Determined by individual Cash subsidies (replacement Program in Puerto Rico, Puerto Rico, American Samoa, commonwealths for the FSP)American Samoa, and the and the Northern MarianasNorthern Marianas
WIC Farmers’ Market WIC participants and eligible ≤185%12 Coupons for use in purchasing Nutrition Program nonparticipants who are on locally grown fresh fruits,
waiting lists11 vegetables, and herbs
Senior Farmers’ Market Adults ages 60 and older ≤185% Coupons for use in purchasing Nutrition Program locally grown fresh fruits,
vegetables, and herbs1Must also meet certain resource, work-related, and categorical requirements.2In mid-2004, a nationwide changeover from the use of food stamps (coupons) to the use of electronic benefits was completed.3Must also be certified by a recognized health care professional to have a nutritional risk. Participation is not guaranteed. Local programs can
serve only as many participants as their funding will allow. Priority system is used to fill slots when funding is tight.4Participating schools receive cash subsidies for each meal served (and donated commodities for each lunch served), including those served
to students who pay full price. Reimbursement rates are higher for meals served to students free or at a reduced price than for meals served atfull price.
5Nonprofit child care centers are eligible to participate in the CACFP, as are for-profit centers in which at least 25 percent of the center’s enrollment or licensed capacity receive either Title XX funds or are eligible for free or reduced-price meals.
6Providers receive cash subsidies for every meal and snack served. Centers are reimbursed based on the financial need of the children andadults they serve, using the income-eligibility and meal-reimbursement rates used in the NSLP and SBP. Homes are reimbursed based on theeconomic need of providers and the children they serve. Homes located in low-income areas or operated by providers with incomes <185 percent of poverty are reimbursed at higher rates than other homes.
7Most feeding sites are located in areas where at least 50 percent of the children are from households with incomes ≤185 percent of povertyor in programs where 50 percent of the enrolled children are eligible to receive free or reduced-price meals, using the income-eligibility criteriadefined for the NSLP and SBP. Residential summer camps may receive reimbursement for meals and snacks served to children whose documented household income makes them eligible for free or reduced-price meals.
8Low-income households that contain at least one member of a federally recognized tribe and reside in approved areas near reservations or inOklahoma may also participate.
9Under TEFAP, USDA makes commodity foods available to States. States provide the food to local agencies they have selected, and theseagencies distribute the food to the public, either in prepared meals or for home consumption. Each State sets criteria for determining whichhouseholds are eligible to receive food for home consumption. However, recipients of prepared meals are considered to be needy and are notsubject to a means test.
10The NSIP supports the Elderly Nutrition Program operated by the U.S. Department of Health and Human Services, Administration on Aging.ENP sites, rather than individuals, participate in the NSIP.
11The WIC Farmers’ Market Nutrition Program (FMNP) is not available in all WIC sites. In FY 2003, 36 States, the District of Columbia, PuertoRico, Guam, and five Indian Tribal Organizations operated the FMNP.
12Must also be certified, by a recognized health care professional, to have a nutritional risk.
Nutrition Education Programs
Other
6 E Effects of Food Assistance and Nutrition Programs on Nutrition and Health / FANRR-19-4 Economic Research Service/USDA
Table 3—Number of studies by program and outcome
Measures of nutrition and healthstatus other than dietary intake
Household Household Individualfood nutrient dietary Food Birth Nutrition Health Health
Program expenditures availability intake security outcomes status1 status2 behaviors3 Other4
Food Stamp Program (FSP) 32 14 26 14 2 8 2 0 0
WIC program5 2 26 25 2 39 28 10 15 5
National School Lunch Program (NSLP) 3 0 18 0 0 8 0 0 1
School Breakfast Program (SBP) 0 0 15 1 0 4 2 0 8
Child and Adult Care Food Program (CACFP) 0 0 0 0 0 0 0 0 0
Summer Food Service Program (SFSP) 0 0 0 0 0 0 0 0 0
The Emergency Food Assistance Program (TEFAP) 0 0 0 0 0 0 0 0 0
Nutrition Services Incentive Program (NSIP)7 0 0 14 1 0 6 1 0 3
Nutrition Assistance Program in Puerto Rico, American Samoa, and the Northern Marianas (NAP) 2 3 0 0 0 0 0 0 0
Commodity Supplemental Food Program (CSFP) 0 0 0 0 1 1 0 1 0
Food Distribution Program on Indian Reservations (FDPIR) 0 0 0 0 0 0 0 0 0
WIC Farmers’ Market Nutrition Program (FMNP) 0 0 28 0 0 0 0 0 0
Special Milk Program (SMP) 0 0 28 0 0 0 0 0 0
Team Nutrition (TN)/Nutrition Education and Training Program (NET) 0 0 68 0 0 0 0 0 6
Notes: Many studies examined more than one outcome. Counts reflect the number of studies that included at least one measure in this category.
The Senior Farmers’ Market Nutrition Program is not included in this summary because it was not established until 2002 and was not included in the literature review.
1Includes nutritional biochemistries, measures of height and/or body weight, and composite measures of nutritional risk.2Includes measures of general or specific health status and use of health care services.3Includes breastfeeding initiation and duration and immunization status.4Includes measures that are not health-specific, such as school attendance, cognitive development/performance, social isolation, and nutrition
knowledge and/or attitudes. Research that examined impacts on nutrition knowledge and/or attitudes was considered only for the FANPs thatare specifically devoted to nutrition education—the Team Nutrition Initiative and the Nutrition Education and Training Program.
5For the WIC Program, studies were counted within four participant groups: prenatal women, infants and children, postpartum women (bothbreastfeeding and nonbreastfeeding), and undifferentiated. Thus, studies that examined outcomes in more than one participant group are counted more than once.
6These studies looked at diet-related outcomes at the household level, not household nutrient availability per se. One study looked at dietaryquality, and the other looked at food use.
7These studies are actually studies of the Elderly Nutrition Program, the program sponsored by the U.S. Department of Health and HumanServices, Administration on Aging. The NSIP and its precursor, the Nutrition Program for the Elderly (NPE) contribute commodity and cashassistance to the ENP.
8These studies (with the exception of one SMP study) included measures of self-reported eating behaviors—for example, usual or recent consumption of fruits and vegetables—rather than detailed assessments of dietary intake.
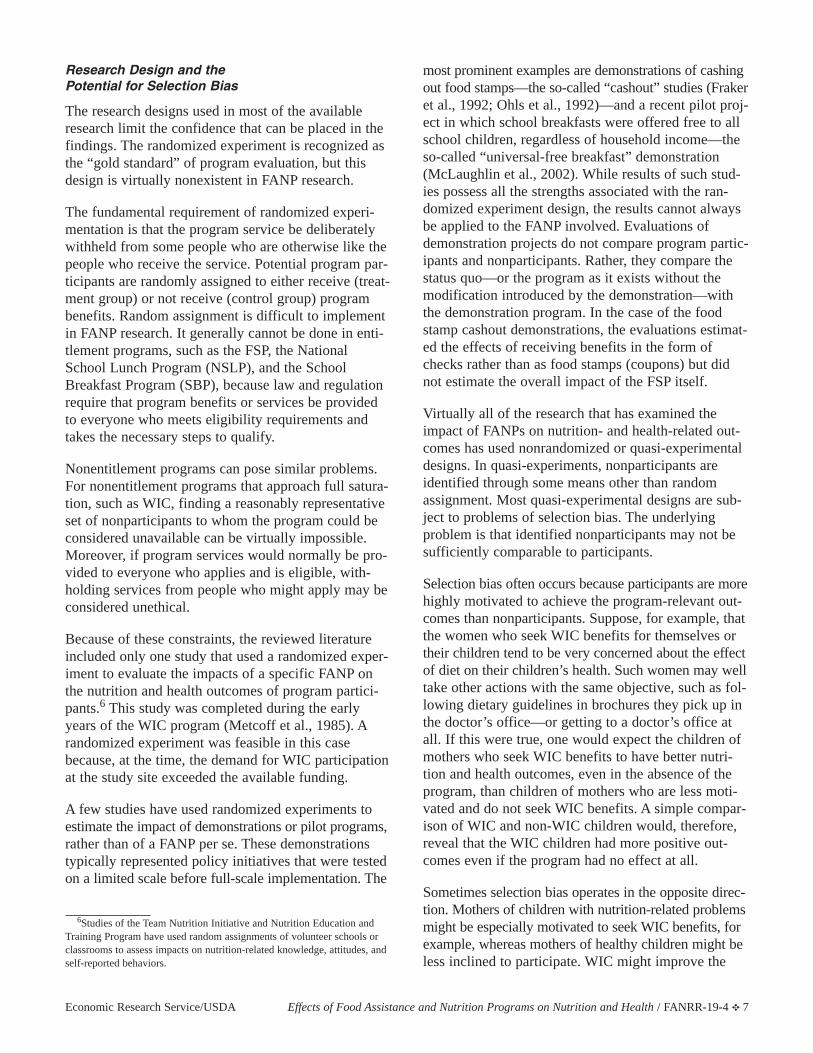
Research Design and the Potential for Selection Bias
The research designs used in most of the availableresearch limit the confidence that can be placed in thefindings. The randomized experiment is recognized asthe “gold standard” of program evaluation, but thisdesign is virtually nonexistent in FANP research.
The fundamental requirement of randomized experi-mentation is that the program service be deliberatelywithheld from some people who are otherwise like thepeople who receive the service. Potential program par-ticipants are randomly assigned to either receive (treat-ment group) or not receive (control group) programbenefits. Random assignment is difficult to implementin FANP research. It generally cannot be done in enti-tlement programs, such as the FSP, the NationalSchool Lunch Program (NSLP), and the SchoolBreakfast Program (SBP), because law and regulationrequire that program benefits or services be providedto everyone who meets eligibility requirements andtakes the necessary steps to qualify.
Nonentitlement programs can pose similar problems.For nonentitlement programs that approach full satura-tion, such as WIC, finding a reasonably representativeset of nonparticipants to whom the program could beconsidered unavailable can be virtually impossible.Moreover, if program services would normally be pro-vided to everyone who applies and is eligible, with-holding services from people who might apply may beconsidered unethical.
Because of these constraints, the reviewed literatureincluded only one study that used a randomized exper-iment to evaluate the impacts of a specific FANP onthe nutrition and health outcomes of program partici-pants.6 This study was completed during the earlyyears of the WIC program (Metcoff et al., 1985). Arandomized experiment was feasible in this casebecause, at the time, the demand for WIC participationat the study site exceeded the available funding.
A few studies have used randomized experiments toestimate the impact of demonstrations or pilot programs,rather than of a FANP per se. These demonstrationstypically represented policy initiatives that were testedon a limited scale before full-scale implementation. The
most prominent examples are demonstrations of cashingout food stamps—the so-called “cashout” studies (Frakeret al., 1992; Ohls et al., 1992)—and a recent pilot proj-ect in which school breakfasts were offered free to allschool children, regardless of household income—theso-called “universal-free breakfast” demonstration(McLaughlin et al., 2002). While results of such stud-ies possess all the strengths associated with the ran-domized experiment design, the results cannot alwaysbe applied to the FANP involved. Evaluations ofdemonstration projects do not compare program partic-ipants and nonparticipants. Rather, they compare thestatus quo—or the program as it exists without themodification introduced by the demonstration—withthe demonstration program. In the case of the foodstamp cashout demonstrations, the evaluations estimat-ed the effects of receiving benefits in the form ofchecks rather than as food stamps (coupons) but didnot estimate the overall impact of the FSP itself.
Virtually all of the research that has examined theimpact of FANPs on nutrition- and health-related out-comes has used nonrandomized or quasi-experimentaldesigns. In quasi-experiments, nonparticipants areidentified through some means other than randomassignment. Most quasi-experimental designs are sub-ject to problems of selection bias. The underlyingproblem is that identified nonparticipants may not besufficiently comparable to participants.
Selection bias often occurs because participants are morehighly motivated to achieve the program-relevant out-comes than nonparticipants. Suppose, for example, thatthe women who seek WIC benefits for themselves ortheir children tend to be very concerned about the effectof diet on their children’s health. Such women may welltake other actions with the same objective, such as fol-lowing dietary guidelines in brochures they pick up inthe doctor’s office—or getting to a doctor’s office atall. If this were true, one would expect the children ofmothers who seek WIC benefits to have better nutri-tion and health outcomes, even in the absence of theprogram, than children of mothers who are less moti-vated and do not seek WIC benefits. A simple compar-ison of WIC and non-WIC children would, therefore,reveal that the WIC children had more positive out-comes even if the program had no effect at all.
Sometimes selection bias operates in the opposite direc-tion. Mothers of children with nutrition-related problemsmight be especially motivated to seek WIC benefits, forexample, whereas mothers of healthy children might beless inclined to participate. WIC might improve the
Economic Research Service/USDA Effects of Food Assistance and Nutrition Programs on Nutrition and Health / FANRR-19-4 E 7
6Studies of the Team Nutrition Initiative and Nutrition Education andTraining Program have used random assignments of volunteer schools orclassrooms to assess impacts on nutrition-related knowledge, attitudes, andself-reported behaviors.
participating children’s condition, but the children mightnot catch up with their nonparticipating, healthier coun-terparts. In this example the simple comparison wouldfind WIC children to have less positive outcomes eventhough the program had a positive effect. The fact thatWIC specifically targets individuals who are at nutri-tional risk increases the likelihood of this type of bias.
Participant motivation toward the program outcome isone of the most common sources of potential bias andone of the most difficult to counteract. Other commonsources of selection bias include need (often proxiedby income), potential for gain (often proxied by thedollar value of the benefit), and the individual’s desirenot to depend on public assistance.
Selection bias may also result from program rules orprocedures. In nonentitlement programs, local staff oftendecide which applicants will be approved for participa-tion based on a combination of program policies andindividual judgment. In all programs, outreach practices,referral networks, office locations and hours, and com-munity customs may make some people more likely toparticipate than others.
Finally, some selection bias occurs when program par-ticipation is based on transitory characteristics. Forexample, some people who qualify for means-testedprograms are permanently poor, or nearly so, andwould be income-eligible for program participation forperiods of many years. Other people who qualify arenot permanently poor, but are at a temporary low pointin a fluctuating income pattern. In an earlier period,their income was high enough that they did not qualifyfor the program, and at some point, they will regainthat level of income. These two types of people mighthave similar incomes at the time they enter the pro-gram, but their subsequent outcomes, in the absence ofthe program, might not be at all similar.
Researchers have used a variety of approaches to try tocounteract selection bias (see Hamilton and Rossi, 2002,or Fox, Hamilton, and Lin, 2004, chapter 2, for adetailed description of these techniques and their relativestrengths and weaknesses). All of these techniques havethe basic objective of making the participant and nonpar-ticipant groups “alike” on certain specified dimensions,thereby minimizing the potential influence of selectionbias on study results. However, none of the techniquescan guarantee that selection bias has been eliminated.
Well-conceived approaches to controlling for selectionbias in FANP research have yielded both plausible and
implausible results. The situations that produceimplausible results cannot be identified a priori, andnone of the customary approaches has consistentlyyielded plausible results. Moreover, a plausible selec-tion bias adjustment has not necessarily accomplishedits purpose just because it is plausible. After decadesof research and debate, the statistical community hasnot yet reached a consensus that any particularapproach will consistently remove selection bias.
In addition, data limitations hamper nearly all attemptsto counter selection bias. Careful theorizing about thedeterminants of participation usually suggests manyfactors that are not measured in existing datasets. Evenwith special data collection, many of the factors per-tain to the period before the individual began partici-pating (or not participating) and cannot be measuredreliably on a retrospective basis.
Although the extent of remaining bias cannot be knownfor sure, testing the robustness of the results is usuallyinformative. A program impact estimate that remainsstable under various alternative specifications is some-what more credible than one that varies dramatically.Of course, if several specifications fail equally toremove the bias, the results will be consistent with oneanother but inaccurate.
Relative Age of the Available Research
Another limitation affecting much of the existingresearch is the relative age of the data. Many of thedatasets used date back to the 1980s and even the1970s. Application of findings from these studies totoday’s FANPs must be done with some caution.Although this general caution applies to all research, acompelling argument can be made that impacts onnutrition- and health-related outcomes are more sensi-tive to temporal considerations than impacts on foodexpenditures. For example, the American food supplyhas changed dramatically in the past 20-30 years, withimportant implications for both nutrient availability atthe household level and individual dietary intakes.Americans are eating substantially more grains thanthey were two decades ago, particularly refined grains,as well as record-high amounts of caloric sweetenersand some dairy products and near-record amounts ofadded fats (Putnam and Gerrior, 1999).
In addition to myriad new products on the market andchanges in food enrichment policies and standards, anumber of sociodemographic trends may have influ-enced food purchasing behaviors. These trendsinclude, for example, an increase in the amount of
8 E Effects of Food Assistance and Nutrition Programs on Nutrition and Health / FANRR-19-4 Economic Research Service/USDA
food eaten away from home, smaller households, moretwo-earner and single-parent households, an agingpopulation, and increased ethnic and racial diversity(Putnam and Gerrior, 1999).
Finally, the design and implementation of someFANPs has changed substantially over the past 30years. Studies based on data from 30, 20, or even 10years ago cannot be assumed to represent current pro-gram operations or participants. As discussed later, thispoint is particularly true for the NSLP and SBP.
Standards Used To Assess Dietary Intake
Most studies that examined the impact of FANPs ondietary intake focused on nutrient intake—most oftenfood energy (kilocalories) and vitamins and minerals—rather than on food intake, and were interested in theadequacy of the diets being consumed rather than thequality. Most studies assessed nutrient intakes as a per-centage of age-and-gender-appropriate RecommendedDietary Allowances (RDAs) rather than as raw intakesin kilocalories, milligrams (mg) or grams (gm)(National Research Council (NRC), 1989a). MostFANP researchers compared mean intakes of partici-pants with intakes of nonparticipants, although someresearchers compared the proportion of individuals ineach group who had intakes below a defined cutoff,generally between 70 and 100 percent of the RDA.The latter approach is less common, perhaps becausean expert panel convened by USDA in the early 1980sspecifically recommended against the use of fixed cut-offs relative to the RDAs as a means of assessing theprevalence of inadequate intakes (NRC, 1986).
In assessing program impacts, researchers generallydeemed a significantly greater mean intake among par-ticipants or a significantly greater percentage of partic-ipants with intakes above a specified cutoff as evi-dence of a positive program effect. Effects were char-acterized as program participation leading to“increased intake(s).” Although these interpretationsare common in the available literature, information ondifferences in the mean percentage of the RDA con-sumed or in the proportion of individuals consumingsome percentage of the RDA does not provide infor-mation on the underlying question: Are FANP partici-pants more likely than nonparticipants to consume anadequate diet? Even when the mean nutrient intake ofa group approximates or exceeds the RDA, a signifi-cant share of the population may have inadequateintakes. On the other hand, use of RDA-based cutoffsseriously overestimates the proportion of a group atrisk of inadequate intake because, by definition, the
RDA exceeds the needs of nearly all (97-98 percent)healthy individuals in the group (Institute of Medicine(IOM), 2001).
Thus, the available research provides an imperfect pic-ture of both the prevalence of inadequate intakes andthe substantive significance of differences in intakes ofFANP participants and nonparticipants. That is, theavailable data provide information on whether FANPparticipants have “increased intakes” of food energy orkey nutrients relative to nonparticipants but do notprovide information on whether these differencesaffect the likelihood that FANP participants consumeadequate amounts of food energy or nutrients.
This imperfect picture of the risk of inadequacy reflectsa limitation in the reference standards and dietary assess-ment methods available when most of the existing FANPresearch was conducted rather than shortcomings inthe research per se. This limitation has been addressedin the Dietary Reference Intakes (DRIs), a revised setof nutrient intake standards that has replaced theRDAs (IOM, 2002a, 2002b, 2000a, 2000b, 1999).
The development of the DRIs has led to statisticallybased guidance on estimating the prevalence of inade-quate intakes of population groups (IOM, 2001). Therecommended approach, referred to as the “EAR cut-point method,” differs in two important ways from theapproach used in previous research. First, assessmentof adequacy is based on the Estimated AverageRequirement (EAR) rather than the RDA. The EAR isthe level of intake estimated to meet the requirementsof half of the healthy individuals in a given gender andlife-stage group.7 It was developed specifically to pro-vide a better standard for assessing the adequacy ofnutrient intakes than is possible with the RDA.
Second, assessment is based on estimates of usualrather than observed intakes. Estimation of usualintakes requires 2 nonconsecutive or 3 consecutivedays of intake data for a subgroup of the population(s)under study. These data are used to adjust the distribu-tion of intakes to remove within-person variation andbetter represent usual intake patterns.
Economic Research Service/USDA Effects of Food Assistance and Nutrition Programs on Nutrition and Health / FANRR-19-4 E 9
7For some nutrients, most notably calcium, available data were insufficientto establish an EAR. In these instances, a different DRI—an Adequate Intake,or AI—was established. The AI is a level of intake that is assumed to beadequate, based on observed or experimentally determined intake estimates.The DRIs also define Tolerable Upper Intake Levels (ULs) for selectednutrients. The UL is the highest intake likely to pose no risk of adversehealth effects. The DRI applications report provides guidance on appropri-ate uses of AIs and ULs in assessing nutrient intakes of groups (IOM, 2001).
Compared with estimates from previous research, therecommended approach is likely to yield lower estimatesof the prevalence of inadequacy because, as noted, usingthe RDA as a reference point for assessing adequacyalways leads to an overestimation of the problem.8Similarly, using observed intakes rather than usualintakes tends to overestimate the percentage of indi-viduals falling below a given cutoff because the distri-bution of observed intakes is usually wider than thedistribution of usual intakes. These improved dietaryassessment methods are just beginning to appear inFANP research (Cole and Fox, 2004a; Ponza et al.,2004; and McLaughlin et al., 2002).
Relatively few studies have looked the impact of FANPparticipation on the quality of dietary intakes, forexample, in comparison with recommendations madein the Dietary Guidelines for Americans (USDA andthe U.S. Department of Health and Human Services(HHS), 2000) and the Food Guide Pyramid (USDA,Center for Nutrition Policy and Promotion (CNPP),1996) or with the Healthy Eating Index (HEI), a sum-mary measure of overall diet quality developed byCNPP (Kennedy et al., 1995). Many of the studiescompleted since the mid-1990s have examined dietaryquality at some level, but few of the earlier studies did.
Overview of the FindingsThe sections that follow summarize key findings fromthe research available for each FANP. Basic backgroundinformation on the subject research can be found indetailed tables provided in appendix A. These tablessummarize important characteristics of each study,including the year published (or written, for nonpub-lished reports), data sources, population studied, samplesize, research design, measure of program participation,and analysis methods. Tables are provided for all FANPsthat had at least one impact study. All identified researchthat described differences between participants andnonparticipants is included in these tables. Althoughsome of the studies had relatively weak designs or usedrudimentary or, in some cases, no statistical analysis,they are included in the interest of completeness.
In interpreting findings from the complete body ofresearch for a given program, greater weight was
given to findings from studies that had the strongestresearch design and analysis methods and that used themost recent data. This report does not comment atlength about the strengths and limitations of variousstudies. These detailed discussions are included inVolume 3 (Fox, Hamilton, and Lin, 2004).
Appendix B includes the reference lists from each pro-gram-specific chapter in Volume 3. The lists can be usedto obtain full citations for studies cited in the appendixA tables. They can also be used to identify related andbackground literature used in preparing the compre-hensive reviews. Because of space constraints, thetables in appendix A cite only the first author’s namefor papers or reports that have more than two authors.
Food Stamp Program
The FSP stands at the intersection of two sets of Federalprograms: those with the primary goal of improvingaccess to adequate diets and those with the primary goalof maintaining income. The FSP is particularly impor-tant because of its universality. It is an entitlement pro-gram with eligibility requirements based almost solelyon financial need, while the other major FANPs are tar-geted toward certain types of individuals or households.
FSP benefits can be used only to purchase food for homeconsumption or seeds and plants used to produce food.Benefits are distributed as electronic transfers, whichcan be redeemed only at participating retail outlets.The Personal Responsibility and Work OpportunityReconciliation Act of 1996 (PRWORA) mandated thatall FSP benefits be distributed via electronic transfers.Nationwide changeover from coupons to electronictransfers was completed in June 2004 (USDA, 2004).
The FSP is the cornerstone of the Nation’s nutritionsafety net. In FY 2002, the total Federal expenditurefor the FSP was $20.7 billion, which accounted forabout 54 percent of the $38 billion Federal expenditurefor all FANPs. The program served more than 19 mil-lion participants per month (table 1). In FY 2003, themaximum monthly food stamp allotment for a familyof four was $471 per month.
The FSP has been extensively researched, with much ofthe research based on secondary analysis of data fromlarge national surveys, such as the Continuing Surveyof Food Intakes by Individuals (CSFII). The bulk ofthe existing research concerns impacts on householdfood expenditures, household nutrient availability, andindividual dietary intakes (app. tables 1-3, pp. 46-56).These three outcomes are logically sequential. The
10 E Effects of Food Assistance and Nutrition Programs on Nutrition and Health / FANRR-19-4 Economic Research Service/USDA
8For some nutrients, the estimated prevalence of inadequate intakes wouldbe lower even if the old approach was replicated using the latest RDAsbecause the new RDAs for some nutrients differ substantially from previousRDAs. For example, for children ages 1-3, the 1989 RDAs for zinc and vita-min C were, respectively, 10 mg and 40 mg. The new RDAs for these nutri-ents are substantially lower, at 3 mg (zinc) and 15 mg (vitamin C).
Economic Research Service/USDA Effects of Food Assistance and Nutrition Programs on Nutrition and Health / FANRR-19-4 E 11
hypothesis is that the FSP benefit leads to increased foodspending, which leads to increased household nutrientavailability, which, leads to increased intakes by indi-vidual household members. However, there are severalreasons why these seemingly obvious effects may notoccur, particularly for nutrients that are in short supply.For example, participating households may increaseexpenditures on food in ways that actually reduce theavailability of some nutrients—for example, by choos-ing foods that are convenient or especially palatablebut lower in nutrients. Participants may also purchasemore expensive forms of the same food, resulting inno net gain in nutrients. In addition, nonparticipantsmay get more of their food from nonpaid sources, suchas friends, relatives, soup kitchens, and food pantries(Gleason et al., 2000).
Similarly, the relationship between nutrient availabilityat the household level and nutrient intake at the individ-ual level may be weakened by several considerations:
• Household members may unequally consume nutri-ents from the food supplies, relative to their needs,depending on their tastes and appetites.
• Some household food supplies are consumed byguests or are wasted.
• Some household members may consume food fromother sources, including restaurants, school cafete-rias, and other nonhome sources.
Moreover, greater nutrient availability is not necessarilya positive outcome. For example, increased expendituresmay lead to greater availability of nutrients and foodcomponents that Americans consume to excess,including fats, cholesterol, sodium, and added sugars.Increased availability of food energy and selectednutrients at the household level does not necessarilytranslate into more adequate diets at the individual levelor into healthier patterns of food intake (for example,eating more fruits and vegetables or whole grains).
Most studies that examined nutrition-related impactsof the FSP, especially the more recent ones, focused onimpacts on the dietary intakes of individuals residingin FSP households. A smaller number of studies exam-ined nutrient availability at the household level.
Food Expenditures
Existing research has consistently shown that the FSPincreases household food expenditures, and that theincrease is greater than what would occur if the same
dollar value of benefits were provided as an unrestrict-ed cash grant. Estimates of the size of the effect vary,depending on the research approach used. The mostreliable estimates come from studies that looked at themarginal propensity to spend on food (MPSF), or theincrease in food expenditures per dollar increase inincome. These studies indicate that the MPSF for foodstamps is in the range of 0.17-0.47, which translatesinto additional food expenditures of between $0.17and $0.47 for every dollar of FSP benefits.
Household Nutrient Availability
The available research suggests that the FSP increaseshousehold availability of food energy and protein. It mayalso increase the availability of a number of vitaminsand minerals. The evidence in this area is weaker,however. The strongest study that reported significanteffects on household availability of vitamins and min-erals used data that were collected in the 1970s, priorto elimination of the purchase requirement.9
Individual Dietary Intake
Existing research has provided little evidence that theFSP consistently affects participants’ dietary intakes.Several studies found that FSP participation increasedvitamin and mineral intakes of young children, but thesefindings were not replicated in the most recent andwell-conducted study (Gleason et al., 2000). Moreover,limitations in measurement techniques and nutrientstandards used in existing research make it impossibleto adequately address the critical research question ofwhether the prevalence of inadequate nutrient intakesdiffers for FSP participants and nonparticipants.
Only a few studies looked at the impact of FSP partici-pation on the intake of carbohydrates, fat, saturatedfat, cholesterol, sodium, or fiber or on patterns of foodintake. For the most part, these studies found little evi-dence of an FSP impact. Gleason et al. (2000) foundthat preschool FSP participants consumed significantlyfewer servings of grains and grain products than com-parably aged nonparticipants and were significantlyless likely to meet the Dietary Guidelines recommen-dation of less than 10 percent of total energy from sat-urated fat. This study also found that FSP adults con-sumed significantly fewer servings of vegetables andless dietary fiber than nonparticipating adults.
9Before 1979, all households of a given size received the same FSP ben-efit in the form of coupons, but they had to pay a certain amount of cash topurchase the coupons. Households with more income paid a greater amount.
Other Nutrition and Health Outcomes
A substantially smaller body of research has examinedimpacts of the FSP on other nutrition- and health-related outcomes (app. table 4, pp. 57-59). More than adozen identified studies examined the impact of theFSP on food security. Some found that FSP householdswere more likely than other low-income households toexperience food insecurity. Others reported an inverserelationship. These conflicting results underscore thecomplexity of the relationship between FANP partici-pation and food security. Food insecurity is likely tolead households to seek food assistance, and receivingfood assistance benefits may subsequently improve thehousehold’s food security. This situation makes esti-mates of FANP impacts on food security particularlyvulnerable to selection bias and reverse causality.
Two recent studies that used sophisticated techniques tocontrol for selection bias help clarify the relationshipbetween FSP participation and food security. Both foundthat, once one controlled for selection bias, there was noevidence of significantly greater levels of food insecurity(or insufficiency) among FSP participants. The analysiscompleted by Gundersen and Oliveira (2001) assessedreported levels of food insufficiency using the so-called“USDA food insufficiency question” that preceded the18-item Federal food security module, the currentlyaccepted standard for measuring household and indi-vidual food security (Price et al., 1997; Bickel et al.,2000). Huffman and Jensen (2003) expanded on thework done by Gundersen and Oliveira, incorporatinginformation on labor force participation decisions andusing the more severe outcome of food insecurity withhunger based on the 18-item Federal food securitymodule. These authors also simulated the effects ofchanges in FSP benefits, unemployment rate, and non-labor income and found that FSP benefits were moreeffective in reducing levels of food insecurity withhunger than pure cash transfers.
A limited number of studies have considered FSPimpacts on other nutrition- and health-related out-comes, including birthweight (two studies), heightand/or weight (six studies, but only one or two for anypopulation subgroup—children, adolescents, adults,elderly), nutritional biochemistries (three studies), andgeneral measures of health status (two studies).Because of the limited number of studies available forany given outcome and population subgroup, as wellas design limitations of the available research, it is notpossible to draw conclusions about FSP impacts inthese areas.
WIC Program
The Special Supplemental Nutrition Program forWomen, Infants, and Children (WIC) was establishedto provide “supplemental nutritious food as an adjunctto good health care during critical times of growth anddevelopment in order to prevent the occurrence ofhealth problems and improve health status...” (P.L. 95-627). WIC targets five specific groups: pregnantwomen, infants, children up their fifth birthday, breast-feeding women (up to 1 year after an infant’s birth),and nonbreastfeeding postpartum women (up to 6months after an infant’s birth). In April 2002, 50 per-cent of all WIC participants were children and 26 per-cent were infants. The remainder were women—11percent pregnant women, 8 percent postpartum non-breastfeeding women, and 6 percent breastfeedingwomen (Bartlett et al., 2003; Kresge, 2003).
Although WIC is a means-tested program (as of April2000, all WIC State agencies used an income-eligibili-ty cutoff of 185 percent of poverty (Bartlett et al.,2002)), being low-income is not sufficient to qualifyfor WIC participation. In addition to being in one ofthe program’s target groups, WIC participants musthave one or more documented nutritional risks.Individual States define the specific criteria used todetermine nutritional risk, but the criteria must beselected from a standardized list defined by FNS.
WIC is not an entitlement program, so the number ofparticipants served each year depends on availablefunding and the cost of running the program. To dealwith the possibility that local programs may not beable to serve all eligible people, WIC uses a prioritysystem to allocate available caseload slots to eligibleapplicants. The priority system is designed to ensurethat available services go to those most in need. Ingeneral, pregnant women, breastfeeding women, andinfants are given higher priority than children and non-breastfeeding postpartum women. In addition, appli-cants with nutritional risks that are based on hemato-logic measures, anthropometric measures, or medicalconditions are given higher priority than applicantswith nutritional risks based on dietary patterns orother characteristics.
The relative importance of the priority system hasdeclined over time as increasing funds have allowedthe program to serve many lower priority individuals.Today, the WIC program serves almost half of allinfants in the U.S. and about a quarter of the childrenages 1-4 (Hirschman, 2004). In FY 2002, the Federal
12 E Effects of Food Assistance and Nutrition Programs on Nutrition and Health / FANRR-19-4 Economic Research Service/USDA
Government spent approximately $4.3 billion on theWIC program, which served 7.5 million participantseach month (table 1).10
WIC was designed to counteract the negative effectsof poverty on prenatal and pediatric health (Kresge,2003). To achieve this goal, the program offers a com-bination of services, including supplemental foods(selected specifically to supply nutrients that may belacking in the diets of low-income pregnant womenand children), nutrition education, and referrals tohealth care and social services. WIC services do notfluctuate by household income. All participants haveaccess to the same basic benefits. The types andamounts of supplemental food provided to each partic-ipant are determined based on participant category, age(for infants), and individual needs and preferences.
An extensive amount of research has investigated theimpact of WIC on health- and nutrition-related out-comes. Given the program’s integral focus on amelio-rating nutritional risks, it is not surprising that, com-pared with research on other FANPs, research on WICincludes many more studies that have looked at out-comes beyond dietary intake. Coverage of the five dif-ferent participant groups is very uneven in the existingresearch. The participant group that has been studiedmost often is prenatal participants, with a particularfocus on program impacts on birthweight and relatedoutcomes, including health care costs. Overall, lessresearch has focused on WIC’s impacts on participat-ing children, but much of the most recent research hasaddressed this information gap. Research on theimpact of the program on women (beyond the impactof prenatal participation on birth outcomes) is lacking,particularly for breastfeeding women and nonbreast-feeding postpartum women.
Birth Outcomes
The impact of prenatal WIC participation has beenestimated by comparing birth outcomes of women whoparticipated in WIC during pregnancy and those whodid not (app. table 5, pp. 62-70). Because of potentialselection bias and other technical limitations, the exist-ing body of research does not provide a definitive con-clusion about WIC’s impact on birth outcomes.However, the evidence is quite compelling and strong-ly suggests that WIC increases mean birthweight,reduces the incidence of low birthweight, and decreas-es birth-related Medicaid costs.
Because of design characteristics that contribute toinherent underestimation or overestimation of WICimpacts and the wide range of impact estimates report-ed in the literature, characterizing the relative size ofWIC’s impact with any confidence is difficult (forexample, the estimated reduction in the prevalence oflow birthweight infants). Moreover, subgroup analysescompleted by some researchers suggest that WICimpacts are likely to be greatest among Blacks andamong the lowest income women—groups with thehighest prevalence of low birthweight.
In addition, many important changes have taken placesince most of the available research was conducted.These changes may influence the extent to which find-ings from previous research apply to the WIC programas it operates today. Some of the most noteworthychanges include: a substantially higher level of programpenetration in most areas of the United States than waspresent in the mid- to late 1980s when most of theresearch was completed (most eligible prenatal appli-cants are able to enroll in the program); more generousMedicaid income-eligibility criteria for pregnant women(including some that exceed the WIC cutoff of 185percent of poverty), which infers automatic income-eligibility for WIC; and the use of standardized nutri-tional risk criteria. Furthermore, welfare reform legis-lation, which did not affect WIC directly, may haveaffected the circumstances of both WIC participantsand nonparticipants. Any of these changes may influ-ence both the presence and size of WIC impacts aswell as variations in impacts across subgroups.
Breastfeeding
Relatively little research has examined the impact ofWIC on breastfeeding (app. table 6, pp. 71-73). Theliterature search identified many studies that haveassessed the impact of specific breastfeeding promo-tion programs on breastfeeding behaviors of WIC par-ticipants. While such studies provide information onthe effectiveness of particular breastfeeding interven-tions (among WIC participants), they provide no infor-mation on the impact of WIC per se.
The literature also includes many descriptive studies thatexamined predictors of breastfeeding behaviors. Thesestudies have demonstrated that women who are AfricanAmerican, less educated, low-income, and younger areless likely to breastfeed than other women. These demo-graphic characteristics are also associated with higherrates of WIC participation, so it is not surprising thatstudies that included WIC participation among the listof potential breastfeeding predictors have almost
Economic Research Service/USDA Effects of Food Assistance and Nutrition Programs on Nutrition and Health / FANRR-19-4 E 13
10Excludes the estimated cost of the WIC Farmers’ Market NutritionProgram.
invariably found a negative association or no associa-tion between WIC participation and breastfeeding.
These negative statistics have prompted substantialcommentary and questions over the years, particularly:Does the formula provided by WIC act as a disincentiveto breastfeeding? Does the WIC program devote ade-quate resources to breastfeeding promotion? Obtainingreliable answers to these questions is complicated bysubstantial selection bias that makes it more likely thatresearchers will find a negative association betweenWIC participation and breastfeeding. As just noted, thedemographic characteristics of women who are leastlikely to breastfeed closely parallel the characteristicsof women who are most likely to participate in WIC.In addition, it is reasonable to assume that women whohave decided to formula feed may be more likely toparticipate in WIC than women who have elected tobreastfeed in order to obtain the free formula. Theincentive to participate may be substantially reducedfor women who have decided to breastfeed.
The available research on WIC’s impact on the breast-feeding behaviors of WIC participants provides nofirm basis for conclusions. Moreover, breastfeedingpromotion efforts in the WIC program have expandedsubstantially since the time most of these studies wereconducted.
Nutrition and Health Characteristics of Pregnant Women
Dietary Intakes. With the exception of two recentdescriptive studies that compared dietary intakes ofWIC participants and nonparticipants without account-ing for measured differences between the two groupsor for selection bias (Mardis and Anand, 2000;Kramer-LeBlanc et al., 1999), all of the studies thathave assessed the impact of WIC participation on thedietary intakes of pregnant women are quite old (app.table 7, pp. 74-76). Indeed, the most recent estimate ofWIC impacts in this area comes from the NationalWIC Evaluation (NWE) (Rush et al., 1988b), whichused data collected in 1983-84.
Evidence from the NWE and other contemporaneousstudies paints a reasonably consistent picture of poten-tial WIC impacts on women’s dietary intakes, suggest-ing that WIC participation increases intakes of foodenergy and most of the nutrients examined, includingfour of the five nutrients traditionally targeted by theprogram—protein, vitamin C, iron, and calcium.Evidence for vitamin A, the fifth WIC nutrient, is lessconsistent. Vitamin A intake, however, is especially
difficult to estimate because the distribution is soskewed (vitamin A is concentrated in large amounts inrelatively few foods). The early evidence also suggeststhat WIC may increase intakes of vitamin B6, whichthe program has targeted in recent years.11
NWE authors (Rush et al., 1988b) pointed out that therelative magnitude of the incremental intakes observedamong pregnant WIC participants were plausible in thatthey were comparable to the levels of supplementationachieved in smaller, intensively controlled clinical trials.Moreover, a thorough analysis of the sources of nutri-ents in women’s diets completed for the NWE con-firmed that differences in the diets of WIC participantsand nonparticipants were attributable to consumptionof WIC foods. Other authors also found similar rela-tionships between observed nutrient intakes and thetypes of food provided in WIC food packages (Endreset al., 1981; Bailey et al., 1983).
In addition to the potential for selection bias, which wasnot addressed in any of this research, findings from suchdated studies are subject to concerns about changes inthe program and its participant groups over time, asdiscussed in the preceding section on birth outcomes.And, as noted previously, a compelling argument can bemade that impacts on diet-related outcomes are moresensitive to temporal considerations than impacts onother outcomes. Finally, limitations in the measurementtechniques and nutrient standards used in this researchmake it impossible to determine whether the reportedincreases in nutrient intake led to a greater prevalenceof adequate intakes among WIC participants.
A recent descriptive analysis of the nutrient intakes ofpregnant WIC participants and nonparticipants also rais-es questions about whether previously observed impactspersist today. Kramer-LeBlanc and her colleagues (1999)used data from the third National Health and NutritionExamination (NHANES-III) to compare nutrient intakesof pregnant WIC participants and income-eligible nonparticipants. In their analysis, the only nutrient forwhich a significant difference was detected in medianintakes was selenium. A comparison of the nutrientintakes of WIC participants and the maximum nutrientcontribution of the WIC food package for pregnantwomen suggested that pregnant WIC participants may
14 E Effects of Food Assistance and Nutrition Programs on Nutrition and Health / FANRR-19-4 Economic Research Service/USDA
11Results from early research do not permit an assessment of the potentialimpact of WIC on intake of folic acid. All of the available studies were com-pleted before the recent widespread fortification of cereals and grain productswith folic acid and before the increased attention to folic acid supplementa-tion during pregnancy. (Inadequate intake of folic acid has been associatedwith neural tube defects (Centers for Disease Control and Prevention, 1992)).
not have redeemed all of their vouchers or consumedall the food provided. Results of this analysis do notconstitute a valid assessment of WIC impacts, and theanalysis may have been hampered by small samplesizes (only 71 WIC participants). Nonetheless, the factthat the analysis showed virtually no overlap withfindings from earlier studies raises questions aboutwhether positive findings from earlier studies stillapply to today’s prenatal WIC participants.
To date, only one study (Mardis and Anand, 2000)assessed intakes of prenatal WIC participants and non-participants in relation to consumption patterns recom-mended in the Dietary Guidelines for Americans.12 Thisanalysis, which used bivariate t-tests to assess differ-ences between groups, found no significant differencesin intakes of total fat, saturated fat, cholesterol, orsodium. Moreover, with the exception of cholesterol,intakes of both participants and nonparticipants exceededrecommended levels. With regard to food intake, nosignificant differences were detected between WICparticipants and nonparticipants in consumption ofgrains, vegetables, fruits, milk, or meats and beans.
Given the increasing prevalence of pregnancy-associatedobesity (Lederman et al., 2002) and the potential rolethe WIC program may be able to play in curtailing thisproblem, it is important to obtain valid estimates ofWIC’s impact on women’s dietary intakes based onmore up-to-date information.
Other Nutrition and Health Outcomes. A handful ofstudies has examined the impact of WIC participationduring pregnancy on other measures of nutritional sta-tus (app. table 7, pp. 74-76). However, the relativepaucity of research on any given measure, as well asdesign and analytic limitations of existing studies,makes drawing firm conclusions about impacts in thisarea impossible. Moreover, such impacts may be diffi-cult to elucidate among pregnant women. For example,assessment of hemoglobin concentration, arguably themost straightforward and widely used measure ofnutritional status among other population groups, iscomplicated during pregnancy by numerous physiolog-ic processes that are not completely understood (Rushet al., 1988b). Adequate assessment of iron status dur-ing pregnancy requires the collection of several morecomplex hematologic indices that are not readily avail-able in most WIC or medical records.
Nutrition and Health Characteristics of Infants and Children
Although infants and children make up more than three-quarters of the total WIC population, very little researchhas been done on these participant groups until recently.Of 41 identified studies (app. table 8, pp. 77-86), 10are based on data collected primarily or exclusively inthe early to mid-1990s, 10 are based on data collectedin the mid- to late 1990s, and 3 used data that werecollected exclusively in 2000 or later or had data col-lection periods that started late in the 1990s and extend-ed beyond 2000. The relative recency of these studies isparticularly important because of the increase in childparticipation experienced during the early 1990s(Oliveira et al., 2002). Studies based on data collectedafter this time are more likely to be generalizable to thecurrent population of WIC children and are less sub-ject to bias associated with restricted program access.
Some studies have included both infants (younger than12 months) and children (1-4 years), but the availableresearch is heavily slanted toward children. Given thatchildren make up 50 percent of the WIC populationoverall, this emphasis is not inappropriate.
Dietary Intakes of Children. Several studies have sug-gested that WIC participation increases children’sintakes of selected nutrients. The most convincing evi-dence comes from a study by Oliveira and Gundersen(2000). The authors used data from the 1994-96 CSFIIand employed a unique strategy to control for selectionbias. They limited their analysis sample to WIC partic-ipants and income-eligible nonparticipants who livedin households where at least one other member was onthe WIC program. The rationale for this restriction wasthat it effectively controlled for key sources of selec-tion bias, including lack of awareness of the WIC pro-gram and resistance to participation because of stigmaor other reasons. The authors acknowledge that twoimportant sources of potential bias remain, both ofwhich are associated with rationing rather than self-selection. The income-eligible nonparticipant groupmay have included (1) children who were not actuallyeligible for WIC because they did not have a certifiednutritional risk and (2) children who were fully eligi-ble but could not participate because the local WICprogram had no available slots. Both of these sourcesof bias would tend to underestimate program impacts.
Findings from the Oliveira and Gundersen study indi-cate that WIC participation significantly increases chil-dren’s intakes of iron, vitamin B6, and folate. Otherstudies suggest that WIC participation may lead to
Economic Research Service/USDA Effects of Food Assistance and Nutrition Programs on Nutrition and Health / FANRR-19-4 E 15
12Kramer-LeBlanc et al. (1999) also report data for intake of total fat,saturated fat, cholesterol, and sodium, but it is the same data reported inMardis and Anand (2000).
reduced intake of added sugar and, among the lowestincome children, to increased intakes of protein, carbo-hydrate, zinc, vitamin E, thiamin, niacin, riboflavin,and magnesium and reduced intake of fat (Rose,Habicht, and Devaney, 1998; Siega-Riz et al., 2004;Kranz and Siega-Riz, 2002). These suggestive findingswould be more convincing if they were replicated inthe restricted sample analyzed by Oliveira andGundersen (Oliveira and Gundersen did not assessintakes of vitamin E, thiamin, niacin, riboflavin, mag-nesium, carbohydrate, or fat).
As noted in previous discussions of available data ondietary intake, evidence that WIC participants consumedgreater amounts of selected nutrients does not necessari-ly mean that WIC participants were more likely thannonparticipants to have adequate diets. Recent data onthe usual nutrient intakes of age-eligible children, esti-mated using state-of-the-art techniques recommended bythe IOM (2001), indicate that the vast majority of bothWIC and non-WIC children have nutritionally adequatediets. Cole and Fox (2004a) found that virtually all chil-dren ages 1-4, regardless of WIC participation status,had adequate usual intakes of iron and zinc. Ponza et al.(2004) reported similar findings for iron for childrenages 1 and 2. As discussed in a subsequent section, theadequacy of children’s usual iron intakes is consistentwith declining levels of anemia in this population andmay reflect an indirect effect of the WIC program on theavailability and use of iron-fortified breakfast cereals.
Neither Cole and Fox (2004a) nor Ponza et al. (2004)assessed intakes of vitamin B6 or folate (the other twonutrients found to be significant in Oliveira’s andGundersen’s analysis) or vitamin E, niacin, riboflavin,thiamin, or magnesium (the other nutrients for whichRose, Habicht, and Devaney (1998) reported a signifi-cant WIC impact). However, in the nationally repre-sentative Feeding Infants and Toddlers Study, Devaneyand her colleagues (2004b) found that less than 1 per-cent of all 1 and 2 year olds had inadequate usualintakes of vitamin B6, riboflavin, thiamin, or magne-sium, and only 2 percent had inadequate usual intakesof folate.13 Three percent had inadequate usual intakesof niacin, and 58 percent had inadequate usual intakesof vitamin E. (The authors urged caution in interpret-ing the finding for vitamin E, given that clinical datafrom NHANES-III do not indicate problems with vita-min E status. They suggested that the high prevalence
of apparently inadequate vitamin E intakes may beassociated with the difficulty of assessing the typesand amounts of fats and oils used in cooking and/orwith variability in food composition databases.)
Data from Devaney et al. (2004b), Cole and Fox(2004a), and Ponza et al. (2004) suggest that theprevalence of inadequate nutrient intakes among veryyoung children is low and that today’s WIC childrenare doing as well nutritionally as their nonparticipatingcounterparts. However, the fact that the descriptiveanalyses completed by Cole and Fox (2004a) andPonza et al. (2004) did not reveal meaningful differ-ences in the prevalence of nutrient inadequacy amongWIC and non-WIC children does not necessarily meanthat the WIC program has no impact on children’sdiets. For example, WIC may be responsible for bring-ing intakes of participating children up to the level ofother children. The question of WIC impacts cannot beassessed even at a basic level without multivariateanalysis techniques that, at a minimum, control formeasured differences between the two groups.
Information about the potential impact of WIC on chil-dren’s intakes of cholesterol, sodium, and fiber or onfood intake relative to recommendations made in theFood Guide Pyramid is very limited. The study byOliveira and Gundersen did not examine children’sdiets along these lines, and the majority of studies thatdid were descriptive studies that assessed differencesbetween groups with bivariate t-tests or did not assessstatistical significance.
Dietary Intakes of Infants. Two relatively dated WICstudies (Rush et al., 1988a; Burstein et al., 1991) pro-vided convincing evidence that WIC participation hada significant impact on the dietary intakes of infants.Both studies found that WIC infants had significantlyhigher intakes of iron than non-WIC infants. Morerecent data from the Feeding Infants and ToddlersStudy (Ponza et al., 2004) showed that WIC infantsages 7-11 months had greater mean usual intakes ofiron than did nonparticipant infants and, more impor-tantly, that the prevalence of adequate usual ironintakes was greater for WIC infants than for non-WICinfants (99 percent vs. 90 percent). The statistical sig-nificance of these differences was not tested.
Rush et al. also found that WIC infants consumed signif-icantly less calcium, magnesium, and phosphorus thannon-WIC infants. Burstein and her colleagues reportedno impact on calcium intake in their main analysis,which assessed the percentage of infants consuming less
16 E Effects of Food Assistance and Nutrition Programs on Nutrition and Health / FANRR-19-4 Economic Research Service/USDA
13Compared with national distributions, the sample used in this studyhad slightly higher incomes and had a smaller percentage of Hispanics(Devaney et al., 2004a).
than 77 percent of the RDA. However, supplementaryanalyses that used mean intakes found, like Rush etal., that WIC infants consumed significantly less calci-um than non-WIC infants.
For the NWE, Rush and his colleagues completed adetailed analysis of the sources of nutrients in infants’diets and found that the greater iron intakes and lowercalcium, magnesium, and phosphorus intakes noted forWIC infants were related. All of these findings wereassociated with an increased use of cow’s milk amongnon-WIC infants. Because the American Academy ofPediatrics recommends that cow’s milk not be fed toinfants less than 12 months of age, the lower intakesof calcium, magnesium, and phosphorus among WICinfants were not interpreted as negative impacts.Burstein and her colleagues (1991) found a similarpattern. Specifically, they found that, among non-breastfed infants, WIC infants were more likely toreceive formula and non-WIC infants were more likelyto receive cow’s milk. Moreover, among formula-fedinfants, WIC infants were more likely to receive iron-fortified formula and non-WIC infants were more like-ly to receive formula that was not fortified with iron.
Recent descriptive studies provide some evidence thatdifferences between WIC infants and non-WIC infantsin the use of cow’s milk may persist today. For example,Kramer-LeBlanc and her colleagues (1999) found that,among infants ages 4-11 months, WIC participantsconsumed significantly less protein, calcium, magne-sium, riboflavin, vitamin B12, and sodium. All of thesenutrients occur in greater concentrations in cow’s milkthan in iron-fortified infant formula. In addition, Coleand Fox (2004a) analyzed the infant feeding inventoryused in NHANES-III and found that WIC participantswere significantly less likely than nonparticipants to befed cow’s milk before 12 months of age.
In contrast, in an analysis of 24-hour intakes, Ponza etal. (2004) found no significant difference between WICinfants and non-WIC infants in the percentage consum-ing cow’s milk. In addition, findings from an inventoryof feeding practices that assessed whether an infant hadever been fed cow’s milk found no difference betweenWIC and non-WIC infants ages 7-11 months. Reportedfeeding of cow’s milk was rare among younger infants(4-6 months). In this age group, however, significantlymore WIC infants than non-WIC infants had been fedcow’s milk at some point. These results should beinterpreted with caution because the comparison groupused in the Ponza et al. analysis included all incomelevels. This may obscure differences between WIC
participants and income-eligible nonparticipants, whoconstitute a more appropriate comparison group.
Burstein and her colleagues (1991) also found that WICparticipation was associated with more appropriate intro-duction of solid foods. WIC infant feeding guidelines,which are based on recommendations of the AmericanAcademy of Pediatrics and other expert groups, recom-mend that no solids be introduced until infants are atleast 4 months of age. Indeed, the WIC food package forinfants younger than 4 months is limited to iron-fortifiedformula. Burstein and her colleagues found that nonpar-ticipant infants were significantly more likely than WICinfants to be fed solid foods before 4 months of age.
It is not clear whether this finding still holds for today’sWIC infants. Based on the infant-feeding inventory inNHANES-III, Cole and Fox (2004a) found no differ-ence between WIC participants and nonparticipants inthe percentage of infants or children who were fedsolid foods before 4 months of age. Similarly, Ponzaand his colleagues (2004) found no differencesbetween WIC participants and nonparticipants in themean ages at which infant cereal and pureed babyfoods were introduced. These data may be less reliablethan the data from the Burstein et al. study, however,because they are based on a more extended recall peri-od.14 In addition, as noted previously, the all-incomecomparison group used by Ponza and his colleaguesmay obscure differences between WIC participants andincome-eligible nonparticipants.
Kramer-LeBlanc et al. (1999) found that carbohydratesand fiber intakes among infants ages 4-11 months weresignificantly lower for WIC participants than forincome-eligible nonparticipants and suggested that thispattern may be associated with earlier introduction andgreater consumption of cereal among non-WIC infants.Data from Ponza et al. (2004) suggest that the differencein cereal consumption may be concentrated among olderinfants and, therefore, not associated with better adher-ence to infant feeding guidelines per se. Ponza and hiscolleagues found no difference between WIC partici-pants and nonparticipants in consumption of either infantcereal or ready-to-eat cereal among infants ages 4-6months. Among infants ages 7-11 months, however, thepercentage consuming ready-to-eat cereal was 77 percentlower for WIC participants than for nonparticipants.
Economic Research Service/USDA Effects of Food Assistance and Nutrition Programs on Nutrition and Health / FANRR-19-4 E 17
14The Burstein et al. (1991) study was limited to 6-month-old infants, socaregivers reported on relatively recent feeding practices. The NHANES-III infant feeding histories analyzed by Cole and Fox (2004a) includedinfants up to 12 months old, and the Ponza et al. (2004) analysis includedonly toddlers ages 12-24 months.
Growth. Many of the earliest efforts to assess WICimpacts on children’s growth were hampered by tech-nical difficulties, such as missing or inaccurate data inmedical records or WIC files and problems withequipment calibration. Self-selection issues have alsoaffected this research. In the NWE, Rush and his col-leagues (1988a) reported differential recruitment ofchildren with abnormal growth (overweight, under-weight, or stunted) into WIC, in keeping with the pro-gram’s focus on individuals with identifiable nutrition-al risks. This pattern of self selection is likely the rea-son for the significantly greater prevalence of under-weight and growth retardation among WIC childrenreported by Cole and Fox (2004a) and Burstein et al.(2000) in their more recent descriptive analyses ofNHANES-III data.
Two recent studies that did not suffer from the method-ological and technical limitations that affected earlierstudies provide evidence to suggest that WIC participa-tion may affect infants’ growth (Black et al., 2004) andreduce the prevalence of failure to thrive (Lee et al.,2000). (Failure to thrive is a general diagnosis that canhave many causes, but the sentinal finding is a failureto gain weight and to grow as expected.)
In recent years, increasing attention has been paid to problems at the opposite end of the growth spectrum—the problem of overweight among children,including very young children. Research that hasexamined this issue is sparse. The studies that havebeen conducted have not found a significant associa-tion between WIC participation and the prevalence ofoverweight.
All of the research in this area is subject to concernsabout selection bias. Moreover, it is doubtful that stud-ies like these can provide definitive answers to ques-tions about WIC’s impact on the growth of infants andchildren. Researchers involved in designing and imple-menting a field test of a study to measure WIC’simpact on children concluded that the only way WIC’simpacts on child growth can be reliably assessed isthrough a longitudinal study that includes serial meas-urements repeated at regular intervals for both WICparticipants and nonparticipants (Puma et al., 1991).
Anemia/Iron Status. The majority of studies thatexamined the relationship between WIC participationand iron status/anemia found that WIC participationwas associated with an increase in mean levels ofhemoglobin or hematocrit and/or a decrease in theprevalence of anemia. In most cases, these differences
were statistically significant. Although each of thestudies reviewed had weaknesses, the consistency offindings across studies is compelling.
The most convincing evidence comes from analysesdone by Yip and his colleagues at the CDC using datafrom the Pediatric Nutrition Surveillance System(PedNSS) (Yip et al., 1987). The CDC researcherslooked at the prevalence of anemia in infants and chil-dren ages 6-60 months between 1975 and 1985, a peri-od of substantial growth in the WIC program. Theydocumented a steady decline in the prevalence of ane-mia, from 7.8 percent in 1975 to 2.9 percent in 1985.Using detailed data from one State, the authors demon-strated that the socioeconomic status of the populationhad remained stable over this period. The authors alsocompared initial and followup measures of hemoglo-bin or hematocrit (taken roughly 6 months apart) forapproximately 73,000 WIC children. The analysisrevealed decreased levels of anemia at followup.
Another CDC analysis reported on trends between 1980and 1991 (Yip et al., 1992). During this period, theprevalence of anemia decreased by more than 5 per-cent for most age- and race/ethnicity-specific sub-groups. Other measures of childhood health monitoredin PedNSS, including the prevalence of low birthweight,low height-for-age, low weight-for-height, and highweight-for-height (overweight), generally remainedstable.
The CDC analyses suggest that WIC has a direct effecton the prevalence of anemia, as well as a probableindirect effect. WIC requires use of iron-fortifiedinfant formulas and includes iron-fortified breakfastcereals in its food packages. Because more than halfof all formula sold in the United States, as well as alarge share of breakfast cereals, are purchased withWIC vouchers, manufacturers have consciouslyfocused on bringing to market iron-fortified productsthat are allowed in WIC food packages (Batten et al.,1990). These foods have assumed a leading position intheir respective markets and have, therefore, beenincreasingly fed to both WIC and non-WIC children.As a result, the WIC program may have contributedto the observed improvement in the prevalence ofanemia in the general population of low-income U.S. children.
General Health Status. Although subject to concernsabout selection bias, two recent studies suggest thatWIC may improve children’s general health status(Black et al., 2004; Carlson and Senauer, 2003).
18 E Effects of Food Assistance and Nutrition Programs on Nutrition and Health / FANRR-19-4 Economic Research Service/USDA
Findings from the Carlson and Senauer study arebased on physician ratings assigned after completionof physical exams in NHANES-III. The authorsfound that children who resided in households whereat least one person participated in WIC were signifi-cantly more likely than children who resided in non-WIC households to be rated as having excellenthealth. This association was strongest for the lowestincome children.
Immunization Status. Findings from the limited num-ber of studies that have assessed the impacts of WICon immunization status, including two recent cross-sectional studies that analyzed data from the NationalImmunization Survey (NIS) for 1999 (Shefer et al.,2001) and 2000 (Luman et al., 2003), generally suggestthat WIC participation had a positive impact on the like-lihood that children will have up-to-date immunizations.Results from all of these studies are highly vulnerableto selection bias, however. Mothers who are motivatedto enroll their child in WIC may be more motivated tokeep the child’s immunizations up to date.
The positive WIC impact suggested by this research, ifreal, may be influenced by an ongoing collaborationbetween USDA and the CDC to use the WIC programas a means to improve immunization rates among theNation’s low-income children. Since the early 1990s, avariety of strategies has been used to promote timelyand complete immunizations among WIC participants(Shefer et al., 2001). Randomized trials have demon-strated that some of these strategies can dramaticallyincrease immunization coverage (Birkhead et al.,1995; Hutchins et al., 1999). In addition, Shefer et al.(2001) used data from the 1999 NIS and data from anannual survey of WIC directors and State immuniza-tion program directors to model the relationshipbetween WIC immunization activities and immuniza-tion rates among WIC children. They found that WICchildren in States with high-intensity immunizationactivities (50 percent or more of WIC childrenenrolled at sites that implemented an immunizationintervention at every WIC visit) had significantly high-er rates of up-to-date immunization at 24 months thandid WIC children in States with low-intensity immu-nization activities (less than 50 percent of WIC chil-dren enrolled at sites that implemented an immuniza-tion intervention and the intervention was implement-ed at only recertification visits). Finally, Dietz et al.(2000) found that a WIC voucher incentive programwas one of eight factors that had a positive, signifi-cant effect on immunization rates in Georgia’s publichealth clinics.
Use and Costs of Health Care Services. Three recentstudies have examined the relationship between chil-dren’s WIC participation and the use of health care serv-ices (Lee et al, 2000; Buescher et al., 2003) and dentalcare services (Lee et al., 2004a). All three studies report-ed that WIC participation had a significant, positiveeffect on the use of health care/dental care services, andthe two studies that examined health care/dental carecosts (Buescher et al., 2003; Lee et al., 2004b) reportedan associated increase in costs for WIC participants.Only the study that looked at the use of dental care serv-ices controlled for selection bias (Lee et al., 2004a).15
Thus, findings from the other two studies are vulnera-ble to potential selection bias—it is possible that chil-dren who have health problems or who use morehealth care services may be more likely to be referredto WIC.
Cognitive Development and Behavior. There is littleevidence that WIC affects children’s cognitive devel-opment or behavior. Few studies have examined out-comes in this area, however, and most suffer fromselection bias, as well as small sample sizes and/ornoncomparability of WIC and non-WIC groups. Thestrongest and most recent study in this area was com-pleted by Kowaleski-Jones and Duncan (2000). Theauthors examined the impact of prenatal WIC partici-pation on temperament and the development of motorand social skills using a fixed-effects model (basedon sibling pairs) to control for selection bias. Theauthors reported that WIC participation decreased thelikelihood that a child would have a difficult tempera-ment; however, the result was significant only at thep <0.10 level.
Food Security. Only one identified study examined theimpact of WIC participation on household food securi-ty (Black et al., 2004). The study found that WICinfants had significantly higher rates of food insecuritythan low-income infants in households that did notparticipate in WIC because caregivers did not per-ceive a need for WIC services. The differencebetween WIC infants and low-income infants who didnot participate in WIC because of access problemswas not significant. As noted previously, assessment ofthe impact of FANP participation on food security isparticularly vulnerable to problems of selection biasand reverse causality.
Economic Research Service/USDA Effects of Food Assistance and Nutrition Programs on Nutrition and Health / FANRR-19-4 E 19
15Lee and her colleagues completed separate analyses of dental care use(Lee et al., 2004a) and costs (Lee et al., 2004b). The former analysis controlled for selection bias, but the latter did not.
Nutrition and Health Characteristics ofNonbreastfeeding Postpartum Women and Breastfeeding Women
Very little is known about the impact of WIC on eithergroup of postpartum WIC participants. Other than thepreviously described study by Kramer-LeBlanc et al.(1999), which assessed nutrient intakes of WIC partici-pants and nonparticipants, the literature search identifiedonly two studies that assessed WIC impacts on non-breastfeeding postpartum WIC participants and onlyone study that looked at the impact of WIC participa-tion on breastfeeding participants (app. table 9, pp. 87-88). The latter study provides little insight because it isa dated local study that used a very small sample ofbreastfeeding WIC participants and an even smallercomparison sample of middle-class women who werenonbreastfeeding (Argeanas and Harrill, 1979).
The two studies that focused on nonbreastfeeding post-partum women provide evidence to suggest that WICparticipation during the postpartum period may havepositive impacts on the women themselves, as well as onthe outcomes of subsequent pregnancies. Caan et al.(1987) assessed women’s weight status at the start of asubsequent pregnancy and the birth outcomes of thatpregnancy. The authors found that extended postpartumWIC participation (5-7 months) increased both weightand length of the second infant at birth. The odds ratioof having a low birthweight infant approached signifi-cance, but, because low birthweight is rare, small sam-ple sizes hampered the analysis. In addition, womenwho had been obese at the start of the previous preg-nancy and had 5-7 months of postpartum WIC partici-pation were 50 percent less likely than comparablewomen with 0-2 months of postpartum participation tobe obese at the start of the subsequent pregnancy.
Pehrsson et al. (2001) found that nonbreastfeedingpostpartum WIC participants who experienced 6 unin-terrupted months of participation were significantly lesslikely to become anemic than comparable women whodid not participate in WIC during the postpartum period.
Neither of these studies provides definitive informa-tion about the impact of WIC participation during thepostpartum period. Exploration of impacts on this low-est priority participant group is needed. If postpartumWIC participation is associated with improved birthoutcomes in the subsequent pregnancy and withimproved nutrition, health, and/or weight status for thewomen, there may be reason to rethink the lower pri-ority assigned to this group. In view of the ongoingobesity epidemic, the potential for WIC to play a role
in addressing pregnancy-related weight retention,which is especially prevalent among minority women(Gore et al., 2003; Abrams et al., 2000), seems particu-larly important.
National School Lunch Program
The NSLP, established in 1946, is the oldest and secondlargest FANP. The NSLP is the cornerstone of the largelyschool-based child nutrition programs. Schools thatparticipate in the NSLP receive Federal reimbursementfor each program meal served to students, with higherreimbursements for lunches served free of charge or ata reduced price to children certified to receive NSLPmeal benefits.16 Since 1998, the program has also cov-ered snacks served to children in after-school pro-grams (USDA/FNS, 2003b). Any child in a participat-ing school is eligible to participate in the NSLP.
In FY 2002, more than 28 million children participatedin the NSLP on an average school day. The programserved more than 4.7 billion lunches and 123 millionafter-school snacks. The total cost for the NSLP was$6.9 billion, about 18 percent of the total Federalexpenditure for FANPs (table 1). Almost 99 percent ofpublic schools and 83 percent of all public and privateschools combined participate in the NSLP.
On an average school day, about 60 percent of childrenin schools that offer the NSLP participate in the pro-gram (Fox et al., 2001). Participation varies withhousehold income, age, and gender. For example, stud-ies have shown that students certified to receive free orreduced-price lunches are more likely to participatethan students who are not certified for meal benefits,elementary school students are more likely to partici-pate than secondary school students, and males aremore likely to participate than females (Fox et al.,2001; Gleason, 1996; Maurer, 1984; Akin et al., 1983).
The literature on the impacts of the NSLP is anchoredby two national evaluations: the National Evaluationof School Nutrition Programs (NESNP), conducted in1980-81 (Wellisch et al., 1983), and the first SchoolNutrition Dietary Assessment Study (SNDA-I), con-ducted in 1991-92 (Burghardt et al., 1993; Devaney etal., 1993). A third national evaluation, the secondSchool Nutrition Dietary Assessment Study (SNDA-II),was conducted in 1998-99 (Fox et al., 2001), but thisstudy did not assess student-level impacts. In additionto these national evaluations, a few studies have used
20 E Effects of Food Assistance and Nutrition Programs on Nutrition and Health / FANRR-19-4 Economic Research Service/USDA
16USDA does not reimburse schools for adult meals, second meals, or a la carte items, including extra servings of components of program meals.
national survey data to assess NSLP impacts, and anumber of studies have examined program impacts insmaller, local samples.
The existing literature on NSLP impacts needs to beconsidered cautiously because program operationschanged substantially after most of the available researchwas completed. In 1995, USDA launched the SchoolMeals Initiative for Healthy Children (SMI). The SMIwas designed specifically to address nutritional short-comings identified in SNDA-I. SNDA-I found that,compared with the Dietary Guidelines (USDA/HHS,1990) and NRC Diet and Health recommendations(NRC, 1989b), NSLP meals were high in fat, saturatedfat, and sodium and low in carbohydrates (Burghardtet al., 1993). At the time, schools were not required tooffer meals that were consistent with these guidelines.
The SMI provides schools with educational and tech-nical resources that can be used to assist foodservicepersonnel in preparing nutritious and appealing mealsand to encourage children to eat more healthful meals.Key components of the SMI include revised nutritionstandards, such as goals for fat and saturated fat con-tent that are consistent with Dietary Guidelines recom-mendations, a major restructuring of menu planningrequirements, and a broad-based nutrition educationprogram known as the Team Nutrition Initiative.17
The Healthy Meals for Healthy Americans Act (P.L.103-448) formally required that school meals be con-sistent with the Dietary Guidelines and that schoolsbegin complying with SMI nutrition standards in the1996-97 school year unless a waiver was granted bythe cognizant State agency. The regulatory requirementthat school meals be consistent with the DietaryGuidelines has been incorporated into the FNS strate-gic plan. The current goal is for all schools to satisfythese standards by 2005 (USDA/FNS, 2000a).
The SMI has been supported by several parallel initia-tives. For example, considerable efforts have beendevoted to improving the nutrient profile of commodityfoods provided to NSLP schools (Buzby and Guthrie,2002). In addition, under the Nutrition Title of the 2002Farm Act, USDA received $6 million for a pilot programto provide fresh and dried fruits and fresh vegetablesto children in elementary and secondary schools. Thepilot program, which was implemented in the 2002-03
school year, was very well received (Buzby et al.,2003) and was expanded under the Child Nutrition andWIC Reauthorization Act of 2004 (P.L. 108-265).
Most recently, policymakers have begun to focus onthe “school nutrition environment” (Ralston et al.,2003; American School Food Service Association(ASFSA), 2003; USDA/FNS, 2000b). A school’s nutri-tion environment includes the nutritional quality ofreimbursable school meals, the availability and nutri-tional quality of competitive (non-NSLP) foods, mealscheduling, physical characteristics of the cafeteria,nutrition education and marketing activities, and theschool’s commitment to nutrition and physical activity.
The SNDA-II study, completed in the early stages ofSMI implementation (the 1998-99 school year), providessome evidence that the nutritional profile of schoolmeals is improving. Although, on average, lunchesoffered to students in 1998-99 continued to exceedDietary Guidelines and NRC recommendations, theywere significantly lower in total fat, saturated fat, andsodium than lunches offered in 1991-92 (as reported inSNDA-I) (Fox et al., 2001). Moreover, schools wereable to reduce fat and saturated fat content withoutdiminishing the relative contribution of school mealsto children’s daily nutrient needs. Since the SNDA-IIdata were collected, efforts to implement the SMInutrition standards have continued at the Federal, State,and local levels. Consequently, even this relatively recentdata may not provide an accurate picture of the nutri-ent content of meals currently offered in the NSLP.
Given the nature and extent of the changes associatedwith the SMI—changes that specifically targeted thenutrient content of school lunches and students’ con-sumption of healthful lunches—the available researchon program impacts is significantly limited. Althoughthe existing research provides information on past andpotential impacts of the NSLP, one cannot assume thatfindings from this research apply to today’s NSLP.New research is essential to understanding the impactof the NSLP as it operates today (Guthrie, 2003).
Students’ Dietary Intakes
Existing NSLP research has focused mainly on impactson students’ dietary intakes at lunch and/or over 24 hours(app. table 10, pp. 90-93). The strongest evidencecomes from the SNDA-I study (Devaney et al., 1993)and from a recent analysis of data from the 1994-96CSFII completed by Gleason and Suitor (2003).SNDA-I researchers controlled for selection bias usingan instrumental variables approach and confirmed the
Economic Research Service/USDA Effects of Food Assistance and Nutrition Programs on Nutrition and Health / FANRR-19-4 E 21
17Goals for sodium and cholesterol content are not included in SMInutrition standards; however, schools are encouraged to monitor levels ofthese dietary components.
robustness of their results using a variety of specifica-tions. Gleason and Suitor improved upon the tech-niques used in SNDA-I to control for selection bias byusing a fixed-effects model. SNDA-I completed sub-group analyses that suggest that some program impactsmay vary by students’ age and household income. Thefindings summarized here apply to students overall.
The evidence is strong that, before the SMI, the NSLPincreased children’s lunchtime intakes of selected vita-mins and minerals (riboflavin, vitamin B12, calcium,phosphorus, magnesium, and zinc). Evidence forriboflavin, calcium, and phosphorus is particularlystrong. Every study that examined intakes of thesenutrients found that NSLP participants had significant-ly higher intakes at lunch than nonparticipants. It isgenerally accepted that this pattern is caused byincreased consumption of milk, which is a concentrat-ed source of all of these nutrients, among NSLP partic-ipants (Lin and Ralston, 2003; Devaney et al., 1993;Radzikowski and Gale, 1984).
Analyses completed by both SNDA-I (Devaney et al.,1993) and NESNP (Wellisch et al., 1983) researcherssuggest that differences in the vitamin and mineralintakes of NSLP participants and nonparticipants atlunch are due to the types of food eaten rather than tothe quantities. Both SNDA-I and NESNP examined thenutrient density of lunches and found that lunches eatenby NSLP participants were higher in nutrient densitythan lunches eaten by nonparticipants. Although onlythe NESNP results were tested for statistical signifi-cance, both groups of investigators concluded that theNSLP increased intakes of selected nutrients by pro-viding lunches that were more dense in those nutrients,rather than by simply providing more food.
The strongest available study (Gleason and Suitor, 2003)suggests that NSLP effects on students’ intakes of vita-mins and minerals persisted over 24 hours. Because oflimitations in the dietary assessment methodologiesused, however, it is not possible to determine whetherNSLP participants were more likely than nonparticipantsto have adequate intakes of these vitamins and minerals.
The evidence is also strong that, before the SMI,NSLP participants consumed less carbohydrate andmore fat and saturated fat (as percentages of total foodenergy) than nonparticipants, both at lunch and over24 hours. Available evidence suggests that the differ-ence in carbohydrate intake was due to decreased con-sumption of added sugars among NSLP participants(Gleason and Suitor, 2003).
Finally, the available evidence indicates that, beforethe SMI, NSLP participation had no significant effecton students’ energy intakes or on sodium or cholesterolintakes. NSLP participation was associated, however,with a significantly greater intake of dietary fiber, bothat lunch and over 24 hours.
A few researchers have looked at food consumptionpatterns of NSLP participants and nonparticipants. Thequality of measures used in these studies varied andnone of these analyses controlled for potential selectionbias. Thus, conclusions about impacts on food consump-tion patterns are more tentative than conclusions aboutimpacts on intake of energy and nutrients. Results of theavailable studies are largely consistent, however, andfit reasonably well with the conclusions about pre-SMIimpacts on energy and nutrient intake.
The available data suggest that NSLP participants con-sumed more milk and vegetables at lunch and fewersweets and snack foods than nonparticipants. Findingsfor other food groups are equivocal. SNDA-I found thata significantly greater proportion of NSLP participantsthan nonparticipants consumed grain products at lunch.
In contrast, Gleason and Suitor (2001) found that, onaverage, NSLP participants consumed significantlyfewer servings of grains at lunch than nonparticipants.In both cases, between-group differences were rela-tively small.
The Gleason and Suitor (2001) finding deserves moreweight than the SNDA-I finding because the formeranalysis looked at the actual number of servings con-sumed (rather than the percentage of children eating atleast one item within the food group) and adjusted fordifferences in observed characteristics of students.Rainville (2001) reported results similar to Gleasonand Suitor (2001) and found that the increase in thenumber of grain items consumed by nonparticipantswas attributable to a high prevalence of sandwiches inlunches from home.
Gleason and Suitor (2001) found no difference betweenNSLP participants and nonparticipants in consumptionof fruits and juices at lunch. However, all of the otherstudies reported that NSLP participants consumedmore fruit and juices than nonparticipants.
Data on food consumption patterns of NSLP partici-pants and nonparticipants over 24 hours are more lim-ited. The available data suggest that some NSLPimpacts on food consumption at lunch were main-tained over 24 hours, while others faded.
22 E Effects of Food Assistance and Nutrition Programs on Nutrition and Health / FANRR-19-4 Economic Research Service/USDA
Other Nutrition and Health Outcomes
A small number of studies have examined NSLPimpacts on other nutrition- and health-related out-comes, such as height and/or weight (six studies), ironstatus (three studies), cholesterol levels (two studies),and cognitive functioning (one study) (app. table 11,pp. 94-95). None of these studies support firm conclu-sions about NSLP effects.
School Breakfast Program
The School Breakfast Program (SBP) began as a pilotprogram in 1966 and was permanently authorized in1975. The intent of the program was to provide break-fast at school to children from poor areas who may nothave eaten breakfast at home and to children in ruralareas who ate an early breakfast, did chores, and thenarrived at school hungry after traveling long distances(Devaney and Stuart, 1998). The program was mod-eled after the NSLP, which had been in existence forsome 20 years when the SBP was established. Thecombination of the NSLP and SBP was intended toprovide “a coordinated and comprehensive child foodservice [program] in schools” (P.L. 89-842).
The SBP operates in essentially the same manner asthe NSLP. Schools that participate in the SBP providebreakfasts to children, regardless of household income.Federal reimbursement is provided for each breakfastserved, with higher reimbursements for breakfastsserved free of charge or at a reduced price to childrencertified to receive NSLP and SBP meal benefits. Anychild in a participating school is eligible to participatein the SBP. In FY 2002, more than 8 million childrenparticipated in the SBP on an average school day.Approximately 1.4 billion meals were served, at a totalFederal cost of $1.6 billion (table 1).
Compared with the NSLP, the SBP is available to fewerchildren and student participation rates are lower. TheSBP is offered in about 78 percent of the schools andinstitutions that offer the NSLP (USDA/FNS, 2003c;USDA/FNS, 2003d). Using data from SNDA-I, Rossi(1998) found that, in schools where the SBP was avail-able, only 78 percent of children who were eligible forfree or reduced-price breakfasts were certified toreceive meal subsidies. And of those certified, only 37percent participated in the breakfast program. Thecombined effect was that, at the time the SNDA-I datawere collected (the 1991-92 school year), only 29 per-cent of children eligible for free and reduced-pricemeals were eating school breakfasts. More recent stud-ies have reported similar findings (Fox et al., 2001).
A major factor affecting application and participationdecisions related to the NSLP and SBP is the per-ceived stigma of receiving free or reduced-price meals(Glantz et al., 1994). Stigma appears to be more of anissue for the SBP and for secondary school studentsthan for the NSLP and elementary school students.Although program regulations require school districtsto ensure that children approved for free and reduced-price meals are not overtly identified, many studentsand parents believe that simply eating a school break-fast carries a stigma. Other factors that have beenidentified as potential barriers to SBP participationinclude scheduling (when breakfast is served relativeto the official start of the school day), meal prices,competing a la carte offerings, bus/transportationissues, lack of time to eat, lack of space, and student preferences for other foods (Reddan et al.,2002; Rosales and Jankowski, 2002; and ProjectBread, 2000).
Some States require that all schools, or schools with aspecific proportion of low-income students, participatein the SBP. Offering a free breakfast to all childrenregardless of family income—or a “universal-free”breakfast program—has become a popular vehicle forincreasing participation in the SBP. In the 1990s, sev-eral States and school districts implemented demon-strations to test the feasibility and impact of such pro-grams. Early results indicated that universal-freebreakfasts substantially increased participation. Programevaluators also reported positive effects on tardiness,absentee rates, academic achievement, and related out-comes. However, most of the demonstrations weresmall in size, used nonexperimental designs, and hadother design and/or data limitations (McLaughlin etal., 2002).
To obtain a more scientifically sound assessment ofthe potential impacts of universal-free school break-fast, Congress established the School BreakfastProgram Pilot Project (SBPP) in 1998 (P.L. 105-336).The project, which began in the 2000-01 school yearand ended at the end of the 2002-03 school year,included a comprehensive evaluation of both theimplementation and impact of universal-free schoolbreakfast. Results from the first year of implementation,including information on impacts on a variety of studentoutcomes, were published in late 2002 (McLaughlin etal., 2002). A final report covering all 3 years of thepilot is expected in 2004.
The existing literature on SBP impacts needs to beconsidered cautiously because program operations
Economic Research Service/USDA Effects of Food Assistance and Nutrition Programs on Nutrition and Health / FANRR-19-4 E 23
changed substantially after most of the availableresearch was completed. The SMI and related initia-tives (see discussion in preceding section on theNSLP) may have affected the meals offered to studentsand students’ consumption of those meals. In addition,concerted efforts have been made in recent years toincrease participation in the SBP. Increased participa-tion may lead to changes in the characteristics of thechildren being served by the program, which, in turn,may lead to changes in program impacts. For thesereasons, new research is essential to understanding thenutrition- and health-related impacts of the SBP as itoperates today (Guthrie, 2003).
SBP research has studied the impacts of the programon two categories of student outcomes: (1) dietaryintake and (2) academic performance and related out-comes such as attendance, tardiness, and behavior. Theevaluation of the SBPP is the only study to look at allof these outcomes concurrently.
Students’ Dietary Intakes
A total of 14 of the identified studies tried to estimateSBP impacts on children’s dietary intakes (app. table12, pp. 98-100). The best data in this area come fromthe SNDA-I study (Gordon et al., 1995; Devaney andStuart, 1998) and the first-year report of the evaluationof the SBPP (McLaughlin, 2002). Both of these stud-ies have limitations, however. SNDA-I provides themost recent nationally representative data and includesstatistical controls for selection bias, but the study wascompleted prior to both the SMI and recent initiativesto increase SBP participation. Data from the SBPPevaluation are more recent—collected in spring2001—but are not nationally representative and arebased on data from six school districts that volunteeredto participate in a universal-free breakfast demonstra-tion. The SBPP evaluation used a randomized experi-mental design; however, the evaluation was designedto assess the impact of universal-free breakfast ratherthan the impact of the SBP per se.
The main analyses completed for the first-year SBPPreport compared the entire treatment group (studentsin schools where universal-free breakfast was avail-able) with the entire control group (students inschools where the standard SBP was available).Results of these analyses provide no information onthe question that is central to understanding theimpact of the SBP: Do the dietary intakes (or otheroutcomes) of students who participate in the SBP dif-fer from those of students who do not participate inthe program?
However, SBPP researchers completed a separateanalysis that does provide some insight on this issue.A statistical procedure (based on Bloom, 1984) wasused to estimate impacts on students who actually par-ticipated in the universal-free breakfast program.Results of this adjustment provide unbiased estimatesof the impact of participating in universal-free schoolbreakfast.18 These findings are suggestive of theimpact of participating in the regular SBP some 6years after the SMI was launched.19
The overarching goal of the SBP is to provide break-fast to children who might otherwise not eat beforestarting the school day. The extent to which the SBPinfluences the likelihood that a child will eat breakfasthas been addressed most thoroughly in a reanalysis ofthe SNDA-I data (Devaney and Stuart, 1998).20 Theanalysis considered three different definitions of“breakfast.” Each definition was based on foods con-sumed between waking and 45 minutes after the startof school and included foods consumed at home and atschool. The three definitions were as follows:
(1) Consumption of any food or beverage (exceptwater).
(2) Consumption of food or beverages that con-tributed more than 10 percent of theRecommended Energy Allowance (REA).
(3) Consumption of food or beverages from at leasttwo of five major food groups PLUS more than10 percent of the REA.
Overall, the availability of the SBP had no significantimpact on the likelihood of breakfast consumption,regardless of the definition used. For students from low-income households, however, availability of the SBPsignificantly increased the likelihood that students wouldeat a more substantial breakfast (a breakfast that satisfiedeither definition 2 or 3). At the same time, availabilityof the SBP significantly reduced the likelihood of
24 E Effects of Food Assistance and Nutrition Programs on Nutrition and Health / FANRR-19-4 Economic Research Service/USDA
18For more information, see McLaughlin et al. (2002), chapter 4 andappendixes C and F.
19The characteristics of meals provided in universal-free breakfast programs are likely to be comparable to those provided in the regular SBP(see McLaughlin et al., 2002). However, the characteristics and consumptionbehaviors of students who choose to participate in universal-free schoolbreakfast and students who choose to participate in the regular SBP maynot be comparable.
20The Evaluation of the SBPP (McLaughlin et al., 2002) assessed theimpact of a universal-free breakfast program on the likelihood that studentswould eat breakfast. These data are not included in this review becausethey have limited applicability to the regular SBP, where free breakfasts areavailable only to students who are certified to receive that benefit.
low-income students eating a nominal breakfast (abreakfast that provided 10 percent or less of the REA).21
SBP impact studies completed before implementationof the SMI are virtually unanimous that the programincreased students’ intakes of three minerals—calcium,phosphorous, and magnesium—both at breakfast, and,when examined, over 24 hours. There is also a consis-tent finding that the SBP increased riboflavin intake atbreakfast but this effect generally did not persist overthe full day. All of these nutrients (calcium, phospho-rus, magnesium, and riboflavin) occur in concentratedamounts in milk.
Findings from pre-SMI studies are less consistent forfood energy and other nutrients and dietary components.SNDA-I, which provides the strongest evidence, foundthat SBP participants consumed significantly morefood energy and protein and less carbohydrate (as apercentage of food energy) at breakfast than nonpartic-ipants (Gordon et al., 1995). In addition, although dif-ferences were not statistically significant, mean intakesof fat and saturated fat, as a percentage of total energyintake, and intakes of cholesterol and sodium weregreater for SBP participants than nonparticipants. Allof these differences persisted over 24 hours.
The evaluation of the SBPP, the only post-SMI studyidentified, found few significant differences betweenenergy and nutrient intakes of universal-free breakfastparticipants, either at breakfast or over 24 hours.Universal-free breakfast participants consumed signifi-cantly more calcium and phosphorus at breakfast thannonparticipants, but neither of these differences per-sisted over 24 hours. Differences for magnesium andriboflavin were not statistically significant for eithertime point. In addition, the SBPP evaluation estimatedusual daily (24-hour) intakes and assessed the impactof universal-free breakfast on the likelihood that stu-dents had adequate intakes, using the approach recent-ly recommended by the IOM (2001). No significantdifferences were found in the prevalence of inadequatenutrient intakes among students who participated inuniversal-free breakfast and those who did not.
The evaluation of the SBPP found no significant dif-ferences in energy and macronutrient intakes of uni-versal-free breakfast participants and nonparticipants,either at breakfast or over 24 hours. Moreover, the
general trend was the reverse of the trend observed inSNDA-I. That is, on average, point estimates for thepercentage of calories from fat and saturated fat werelower for universal-free breakfast participants thannonparticipants. And the SBPP evaluation found thatuniversal-free breakfast participants consumed signifi-cantly less cholesterol than nonparticipants, both atbreakfast and over 24 hours. No significant between-group differences were noted for sodium intake.
While results of the SNDA-I and SBPP studies cannotbe compared directly, the SBPP data suggest a shift inSBP impacts over time that is largely consistent withchanges observed in the nutrient profiles of SBP meals.For example, the SNDA-II study found that breakfastsoffered in 1998-99 provided 5-6 percent less calciumthan breakfasts offered at the time SNDA-I data werecollected (1991-92 school year) (Fox et al., 2001).22
Likewise, breakfasts offered in 1998-99 were significant-ly lower in energy, protein, total fat, saturated fat, cho-lesterol, and sodium than breakfasts offered in 1991-92.
A few studies have examined SBP impacts on stu-dents’ food consumption patterns. Findings fromMcLaughlin et al. (2002) provide the strongest sugges-tive evidence of current SBP impacts. These data indi-cate that universal-free breakfast participants con-sumed significantly more servings of fruit and dairyproducts at breakfast than nonparticipants, and signifi-cantly fewer servings of meats and meat substitutes.However, data on 24-hour intakes indicate that all ofthese effects dissipated over the course of the day.
School Performance and Cognitive/Behavioral Outcomes
Eight of the identified studies attempted to measurethe impact of eating a school breakfast on an array ofschool performance, cognitive, and behavioral out-comes (app. table 13, pp. 101-102). With one excep-tion (Meyers, 1989), these studies evaluated universal-free breakfast programs rather than the actual SBP.Consequently, findings from these studies provide, atbest, suggestive evidence of potential SBP impacts.Because the SBP does not offer breakfasts free ofcharge to all students, impacts observed in demonstra-tions of universal-free breakfast cannot be assumed toapply to the regular SBP.
Economic Research Service/USDA Effects of Food Assistance and Nutrition Programs on Nutrition and Health / FANRR-19-4 E 25
21The results differed slightly for elementary and secondary school students. Among secondary school students, a significantly greater likelihoodof breakfast consumption was observed only for the most stringent definition(two food groups and more than 10 percent of the REA).
22The average calcium content of breakfasts offered at both points intime more than satisfied the program standard of providing one-fourth ofchildren’s daily calcium needs. SNDA-II did not assess magnesium, phosphorus, or riboflavin content.
In this research, impacts on school performance andrelated outcomes were often measured based on groupmembership rather than on individual behavior. Thatis, analyses generally compared the entire treatmentgroup (students in schools where universal-free break-fast was available) with the entire comparison/control group (students in schools where the standardSBP was available). This is a fairly imprecise defini-tion of program participation because it does not takeinto consideration the actual behavior of students inthe two groups of schools—students in either type ofschool may or may not have eaten the breakfasts thatwere offered to them.
The previously described supplementary analysis completed for the evaluation of the SBPP compareduniversal-free breakfast participants with nonpartici-pants based on actual participation in the universal-free breakfast program. Participation was definedbased on same-day participation for short-term out-comes and on cumulative participation over the imple-mentation year for longer term outcomes. This moreprecise definition of universal-free breakfast participa-tion, combined with the randomized design, dictatesthat considerably more credence be given to results ofthe SBPP study than to the other studies. Other factorsthat minimize the credibility of findings from otherstudies are limitation to one geographic area (one cityor State), small sample sizes, and inadequate statisticalcontrol for clustering (Ponza et al., 1999).
The SBPP evaluation found that universal-free break-fast participation had no significant effect on a broadarray of measures, including attendance, tardiness,academic achievement, cognitive functioning, behav-ior, health status, food security, and Body Mass Index.The study found a small but significant and negativeeffect on teacher-rated behavioral opposition amonglong-term participants in universal-free breakfast.23
Child and Adult Care Food Program
The CACFP began in 1968 as a pilot program knownas the Special Food Service Program for Children(SFSPFC). Participation was initially limited to center-based child care in areas with poor economic condi-tions. Beginning in 1976, family child care homeswere also eligible to participate, provided that theymet State licensing requirements, where these wereimposed, or obtained approval from a State or local
agency. Homes had to be sponsored by a nonprofitorganization that assumed responsibility for ensuringcompliance with Federal and State regulations and thatacted as a conduit for meal reimbursements.
The CACFP was authorized as a permanent programin 1978. At the time, the program was focused exclu-sively on children and was called the Child Care FoodProgram (CCFP). In 1987, as a means of increasingsupport for elderly feeding programs, P.L. 100-175amended the Older Americans Act to mandate that theCCFP be expanded to allow eligible adult day carecenters to participate. The program was renamed theChild and Adult Care Food Program and institutionalparticipation was expanded to include centers that pro-vide day care services to people age 60 and older or tofunctionally impaired people age 18 and older. Eligibleadult care centers have the option of participating inthe CACFP or in the HHS-sponsored Elderly NutritionProgram (discussed later in this report) but cannotreceive reimbursement under both programs for thesame meal. The child and adult care components of theprogram are governed by the same rules and regula-tions. However, at the State level, the two componentsmay be administered by separate agencies, at the dis-cretion of the governor.
In 1998, the Child Nutrition Reauthorization Act (P.L.105-336) expanded institutional eligibility for the childcare component of the CACFP to include after-schoolcare programs not participating in the NSLP andhomeless shelters that serve children. Participation ofafter-school programs is limited to those in geographicareas where 50 percent or more of the childrenenrolled in school are eligible for free or reduced-pricemeals in the NSLP. Programs must provide regular,structured activities for children, including educationaland enrichment activities (USDA/FNS, 2003e).
Although the adult component of the CACFP hasincreased steadily over time, the child care componentof the program is substantially larger. In September2002, the program served an average of 2.9 millionchildren and 86,000 adults per day (USDA/FNS,2003e). The $1.9 billion Federal expenditure for FY2002 supported the provision of 1.7 billion meals andsnacks to children and 44.6 million meals and snacksto adults (table 1).
Child and adult care providers who participate in theCACFP are reimbursed at fixed rates for each meal andsnack served. Under current program regulations, childand adult care centers and child care homes may be
26 E Effects of Food Assistance and Nutrition Programs on Nutrition and Health / FANRR-19-4 Economic Research Service/USDA
23This result is based on the first year of a 3-year demonstration andmay not hold across all 3 years.
reimbursed for a maximum of two meals and onesnack or two snacks and one meal per eligible partici-pant per day. Homeless shelters may be reimbursed forup to three meals per child per day and after-schoolprograms may be reimbursed for one snack per childper day. After-school programs in some States are alsoeligible to receive reimbursement for suppers.
To date, no research has examined the impact of theCACFP on participants’ dietary intakes or other nutri-tion- and health-related outcomes. The limited amountof research on the CACFP is almost entirely descrip-tive, focusing on the characteristics of participatinginstitutions, providers, and the children or adults theyserve. An early study of the child care component ofthe program compared the nutrient content of mealsoffered in child care centers that did and did not par-ticipate in the program (then known as the CCFP)(Glantz and O’Neill-Fox, 1982). The study found thatmeals offered in CCFP centers were higher in caloriesand provided greater quantities of a number of differ-ent nutrients. The study design is potentially vulnera-ble to selection bias. Moreover, the study’s results areof questionable importance today because over time somuch has changed in the CACFP program and in thechild care industry in general. Other available researchon the child care component of the program is lessoutdated but provides no information on programimpacts because the research did not include non-CACFP institutions.
The one study that has been completed on the adultcomponent of the program (Ponza et al., 1993) wasalso descriptive and did not compare outcomes forprogram participants and nonparticipants.
The most recent study of the CACFP was a congres-sionally mandated study that examined the effects of anew reimbursement structure designed to increase thenumber of low-income children served in family childcare homes. Under the new reimbursement structure,family child care homes that are (1) located in low-income areas or (2) operated by low-income providershave reimbursement rates similar to the rates thatexisted before the change. (A low-income area isdefined as either an area where at least half of thechildren live in families with incomes below 185 per-cent of the poverty level or an area served by an ele-mentary school in which at least half of the enrolledchildren are eligible for free or reduced-price schoolmeals.) All other homes are reimbursed at substan-tially lower rates than those that were in existencebefore the change.
The change in reimbursement structure has beenreferred to as “tiering.” Tier I homes are those thatreceive the greater reimbursement associated withoperating in a low-income area or being run by a low-income provider. Homes that receive the lower reim-bursement are referred to as Tier II homes.
The mandated evaluation of the effects of tieringfound that the legislative change achieved the desiredobjectives: The number of low-income children servedin family child care homes grew by 80 percentbetween 1995 and 1999, and the number of meal reim-bursements going to low-income children doubled(Hamilton et al., 2001). Moreover, tiering had noadverse effect on either the number or nutritional char-acteristics of meals offered by Tier II providers(Crepinsek et al., 2002).
Summer Food Service Program
The SFSP was created to ensure that low-income chil-dren would have access to nutritionally balancedmeals when school is not in session. The programwas created in 1968 as a 3-year pilot project and waspermanently authorized as an entitlement program inFY 1975.
The SFSP provides funds to eligible organizations toserve nutritious meals and snacks, free of charge, tochildren at approved feeding sites. Organizations eligi-ble to sponsor feeding sites include public or privatenonprofit schools; local government agencies; non-profit community organizations, such as YMCAs andBoys and Girls Clubs; churches; National Youth SportsPrograms (NYSP);24 and residential camps. In FY2002, the SFSP cost $263 million and served about122 million meals and snacks (table 1). In July 2002,during peak participation, the program served about1.9 million children per day.25
In recent years, concerns have escalated about thenumber of low-income children who go withoutFederal meal benefits during the summer. In describ-ing the problem, Under Secretary of Agriculture EricM. Bost pointed out that the 2 million SFSP mealsserved per day in FY 2000 represented only about 12percent of the free and reduced-price meals servedeach day during the regular school year through the
Economic Research Service/USDA Effects of Food Assistance and Nutrition Programs on Nutrition and Health / FANRR-19-4 E 27
24NYSPs are federally funded sports camps for low-income children.Programs are administered by colleges and universities.
25An additional 1.6 million children per day received summer mealsthrough the NSLP as part of summer school programs or year-round schools(based on reported NSLP participation for July 2002 (USDA/FNS, 2003f)).
NSLP (Bost, 2000). Bost deemed this level of SFSPparticipation, which reached “only a fraction of eligi-ble children,” to be “unreasonably low.”26
Several initiatives have been implemented to increasepenetration of the SFSP by attracting more programsponsors, particularly school districts. In late 2000, P.L.106-554 (the Consolidated Appropriations Act), author-ized a special pilot project to increase the number ofchildren participating in the SFSP in Puerto Rico and 13States with low SFSP participation rates (Garnett, 2001;Food Research and Action Center (FRAC), 2001).27 Thepilot project was initially authorized to operate from FY2001 through FY 2003 and was extended by Congressthrough March 2004. It simplified recordkeeping andreporting requirements and provided sites with the maxi-mum per meal reimbursement for both operating (food-service) cost reimbursements and administrative costreimbursements. Moreover, pilot sites were allowedgreater flexibility in using funds from two different reim-bursement streams. Analyses completed by FRAC(FRAC, 2003) and FNS (Singh and Endahl, 2004) indi-cate that States participating in the pilot successfullyincreased SFSP participation. FNS found that, in all 14States combined (considering Puerto Rico a State), thenumber of SFSP sponsors increased by 18 percentbetween July 2000 and July 2003, and average daily par-ticipation increased by 43 percent. Impacts varied sub-stantially across States, however, and based on July 2003data, many pilot States continued to have low SFSP par-ticipation relative to other States. Assessment of thepilot’s impacts was complicated by other SFSP initia-tives that were implemented during the same period.
For example, before the start of SFSP activities forsummer 2002, USDA implemented “seamless summerwaivers” for school districts that operate the NSLP(USDA/FNS, 2002a). The waivers, which ran throughFY 2004, allowed school districts to offer the SFSPwithout having to deal with paperwork and otheradministrative tasks that were previously required. Tasseand Ohls (2003) studied early reaction to and effectsof seamless waivers. Although school district responseto the waivers was generally positive, early evidence
indicated that the waivers had a limited impact on thenumber of children receiving summer meals. On a typ-ical day in summer 2002, an estimated 50,000 childrenreceived meals who would not have done so withoutseamless waivers. Determining the ultimate success ofseamless waivers will require information aboutimpacts during summer 2003 and 2004.
Other actions taken by USDA to increase SFSP sponsor-ship include providing State agencies with the flexibilityto approve deviations in the length of time between mealservices and/or the duration of meal service, when exist-ing requirements pose a barrier to participation, and toconsider closed, enrolled sites that provide servicesexclusively to the “Upward Bound” program as categori-cally eligible for the SFSP. (Income-eligibility thresholdsused for “Upward Bound” are identical to those used inthe SFSP.) Finally, USDA developed a Web-based geo-graphic information tool to help State agencies and otherinterested organizations identify areas that are under-served by the SFSP (Gordon and Briefel, 2003).28
To date, no research has examined the impact of theSFSP on nutrition or health outcomes of participatingchildren. The research that does exist has been descrip-tive, much of it focusing on program operations andthe characteristics of sponsoring organizations. Themost recent such study was completed in March 2003(Gordon and Briefel, 2003). In addition to looking atprogram operations and characteristics, the studylooked at factors that affect participation, the nutrition-al quality of the meals served, and the extent of platewaste. FNS is currently undertaking a qualitative studyto examine what low-income children not participatingin the SFSP do during the summer.
The Emergency Food Assistance Program
The Emergency Food Assistance Program (TEFAP)provides commodity foods to emergency kitchens(often referred to as soup kitchens), homeless shelters,and similar organizations that serve meals to homelessand other needy individuals. Through food banks andfood pantries, the program also provides basic com-modities to low-income households for preparationand consumption at home. USDA purchases commodi-ty foods and processes, packages, and distributes themto designated State agencies, which, in turn, distributethe foods to approved local charitable organizations.
TEFAP evolved from the Federal Surplus Relief Corp-oration, which was established under the Agricultural
28 E Effects of Food Assistance and Nutrition Programs on Nutrition and Health / FANRR-19-4 Economic Research Service/USDA
28Available at www.ers.usda.gov/data/SFSP/.
26There are several reasons that SFSP participation is lower than NSLPparticipation. One is that open SFSP sites must be located in low-incomeneighborhoods, whereas the NSLP is available everywhere; another is thatattendance at SFSP sites is voluntary, while children must attend schoolduring the year (Gordon and Briefel, 2003). In addition, systems that transport students to schools during the normal school year are generallynot operational during the summer months.
27The 13 States are Alaska, Arkansas, Idaho, Indiana, Iowa, Kansas,Kentucky, Nebraska, New Hampshire, North Dakota, Oklahoma, Texas,and Wyoming.
Adjustment Act of 1933 to encourage consumption ofsurplus domestic farm commodities, while providingnutritious foods to needy individuals. The current pro-gram was first authorized as the Temporary EmergencyFood Assistance Program in 1981. The name associat-ed with the acronym TEFAP was changed to TheEmergency Food Assistance Program under the 1990Farm Act. In 1996, PRWORA combined TEFAP withthe previously separate Commodity DistributionPrograms for Charitable Institutions, Soup Kitchens,and Food Banks.
TEFAP foods are distributed free of charge, but indi-viduals who receive TEFAP foods for home use mustmeet eligibility criteria defined by each State. Thetypes of commodities available through TEFAP varyfrom year to year, depending on agricultural conditionsas well as State preferences. In FY 2001, more than 40products were available, including canned and driedfruits; canned vegetables; fruit juice; meat, poultry,and fish; dried egg mix; peanut butter; nonfat drymilk; rice; pasta; and cereal (USDA/FNS, 2003g).
A recently completed study of providers in the U.S.Emergency Food Assistance System (EFAS) found thatTEFAP commodities account for about 14 percent of allfood distributed through the EFAS (Ohls and Saleem-Ismail, 2002). Nationally, 55 percent of emergencykitchens, 52 percent of food pantries, and 84 percentof food banks distribute TEFAP foods. In FY 2002,611 million pounds of food were distributed throughTEFAP at a Federal cost of $435 million (table 1).
The literature search identified no direct evaluations ofTEFAP’s effects on nutrition or health outcomes. Asmall number of studies have examined nutrition andhealth characteristics of people who use programs thatcommonly receive and distribute TEFAP foods, butTEFAP provides only part of the food that these pro-grams distribute and the studies do not specificallymeasure TEFAP’s role.
The recent survey of providers in the EFAS (Ohls andSaleem-Ismail, 2002) offers a detailed and up-to-datepicture of the organizational system and programs thatdistribute TEFAP foods. An associated survey of EFASclients in food pantries and emergency kitchensdescribes the characteristics and experiences of likelyrecipients of TEFAP food (Briefel et al., 2003).
Nutrition Services Incentive Program
The Nutrition Services Incentive Program (NSIP), for-merly known as the Nutrition Program for the Elderly
(NPE), provides cash and/or commodities to agenciesor organizations that sponsor Elderly Nutrition Program(ENP) sites. The ENP, which is administered by HHS’sAdministration on Aging (AoA), is the primary vehiclefor the organization and delivery of nutrition and supportservices to the Nation’s elderly. The ENP provides mealsin both group (congregate feeding sites) and home set-tings (the “Meals on Wheels” program). People ages60 and older, their spouses, and certain others are eli-gible to participate in the ENP. The ENP has no incomeeligibility requirement, although the administering pro-grams typically target lower income persons. Recipientsare encouraged, not required, to contribute toward thecost of the meals they receive.
USDA’s involvement in the ENP began in 1975 whenCongress authorized USDA to donate commodities tothe program. The USDA program, known as theNutrition Program for the Elderly (NPE), providedcommodities to States and Indian Tribal Organizations(ITOs) which, in turn, distributed them to local ENPsites. In 1977, P.L. 95-65 allowed States and ITOs toelect to receive their NPE entitlement in the form ofcash or commodities. Over time, the predominant typeof support provided by the NPE shifted from commodi-ties to cash. In FY 1999, only 2 percent of the $140million NPE appropriation was distributed to ENPmeal providers as commodities (HHS/AoA, 2002).
When the ENP was reauthorized in FY 2000, the namefor the USDA program was changed to the NSIP. Inaddition, the model for administering the program waschanged from a simple reimbursement model to anallocation model. Rather than reimbursing States andITOs per meal based on the number of meals servedthe previous fiscal year, NSIP funds are now distrib-uted to States and ITOs based on the number of mealsserved relative to the total number of meals served byall States and ITOs. The reason for this change was adesire to reward States and ITOs for efficient use ofcash and/or commodities in providing meals to olderadults (USDA/FNS, 2002b).
In FY 2003, responsibility for the administration of theNSIP was transferred from USDA to HHS, althoughUSDA continues to provide financial support anddonated commodities. In FY 2002, USDA’s contribu-tion to the ENP was $152 million (table 1).
No studies have examined the effectiveness of theNSIP (or the former NPE) per se. To understand theimpact of the NSIP, one has to look to research on thelarger program, the ENP. Since the inception of the
Economic Research Service/USDA Effects of Food Assistance and Nutrition Programs on Nutrition and Health / FANRR-19-4 E 29
ENP, two national evaluations and a number of smallerlocal studies have assessed the program’s effective-ness. All of these studies used quasi-experimentaldesigns, with nonparticipants identified in a variety ofways. Selection bias is an issue in all of this research,but only the most recent national study addressed theproblem systematically (although inconclusively)(Ponza et al., 1996).
Most of the studies that have looked at the health andnutrition impacts of the ENP have focused on dietaryintake or nutritional status, although food security hasalso received some attention (app. table 14, pp. 104-107). Some research has also examined the impact ofthe ENP on socialization. While many of the availablestudies are dated—approaching or exceeding 20 yearsold—a comprehensive national evaluation published in1996 provides a reasonably up-to-date perspective onthe nutrition- and health-related impacts of the ENP(Ponza et al., 1996).
Dietary Intakes
The strongest available evidence on the ENP’s impacton dietary intake comes from the National Evaluationof the Elderly Nutrition Program, 1993-95 (Ponza etal., 1996). This study found that both congregate andhome-delivered meal participants had significantlygreater intakes of energy and protein than nonpartici-pants. In addition, ENP participants who received con-gregate meals had significantly greater intakes of awide variety of vitamins and minerals than nonpartici-pants. ENP participants who received home-deliveredmeals also had higher mean intakes than did nonpartic-ipants, but some of these differences did not reach sta-tistical significance. Because of limitations in thedietary assessment methodologies used, determiningwhether ENP participants were more likely than non-participants to have adequate intakes of these vitaminsand minerals is not possible.
No significant differences between ENP participantsand nonparticipants were detected in intakes of totalfat, saturated fat, cholesterol, or sodium. Mean cho-lesterol intakes of both groups were well within therecommended range. However, excessive intake oftotal fat, saturated fat, and sodium, relative to accept-ed recommendations, was a problem for some ENPparticipants.
Other Outcomes
While all studies of the impact of the ENP are subjectto selection bias, studies that looked at measures other
than dietary intake are especially prone to this problembecause the program specifically targets individualswho are at nutritional or social risk. The impact of theENP on more direct measures of nutritionalstatus—including nutritional biochemistries, weightstatus, and a comprehensive measure of nutritionalrisk—has been examined only in small, local studies.The limited information available suggests that ENPparticipation is not associated with obesity and that, infact, thinner, more frail elderly may self-select intothe program. With the possible exception of serumvitamin A, which was positively associated with par-ticipation in the ENP, drawing firm conclusions aboutthe impact of the ENP on nutritional biochemistries isnot possible.
Evidence is mixed about the impact of the ENP onreducing social isolation and promoting quality of lifeamong the elderly. While the perceived benefit ofsocial and support services is high, two national evalu-ations that attempted to systematically measure socialoutcomes of ENP participants, relative to a group ofeligible nonparticipants, employed different measuresof socialization and reported divergent results.
The issue of food security among ENP participants hasnot been well researched, and the relationship is acomplicated one. The 1993-95 evaluation assessedfood security among ENP participants but did not col-lect comparable data for nonparticipants (Ponza et al.,1996). Instead, the authors compared data for ENPparticipants with data for the U.S. elderly populationoverall. Results indicated that, although most ENP par-ticipants reported having enough food to eat, theywere much more likely to experience food insecuritythan elderly people overall. This pattern presumablydoes not reflect an impact of ENP participation butindicates that individuals who choose to participate inthe ENP are more food insecure than the general elder-ly population.
Only one of the identified studies estimated theimpact of ENP participation on food security by com-paring ENP participants with comparable nonpartici-pants (Edwards et al., 1993). The study included asample of elderly diabetics who were either receivinghome-delivered meals or on a waiting list for home-delivered meals. The ENP was found to have a posi-tive effect on food security. Elderly diabetics whowere receiving home-delivered meals were less likely than their counterparts on the waiting list to be food insecure or to go 1 or more days per monthwithout food.
30 E Effects of Food Assistance and Nutrition Programs on Nutrition and Health / FANRR-19-4 Economic Research Service/USDA
Nutrition Assistance Program in Puerto Rico, American Samoa,and the Northern Marianas
The NAP provides food and nutrition assistance tolow-income individuals in Puerto Rico, AmericanSamoa, and the Northern Marianas through blockgrants to territory administrative agencies. The territo-ries provide cash or checks to eligible participants. TheNAP replaced the FSP, which operated in the territo-ries from 1975 through 1982. The 1981 OmnibusBudget Reconciliation Act (OBRA) abolished the FSPin the territories and replaced it with a block grant.Puerto Rican authorities designed the NAP to adminis-ter the block grant beginning in July 1982. The switchfrom the coupon-based FSP to the cash-based NAPwas permanently authorized in September 1985.
The objectives of the NAP and the FSP are identical:to provide low-income households with access to anutritious diet through increased food purchasingpower. Both programs have monthly benefits that varyby household size and net income, and both programsare available to all applicants who meet specified eligi-bility criteria. Major differences between the programsinclude the following:
• Form of benefit. Electronic benefits for the FSP;cash or check for the NAP.29
• Benefit restrictions. FSP benefits are restricted topurchase of food for home consumption. NAP bene-fits are not restricted.
• Size of benefit. NAP benefits are constrained by thesize of the block grant so eligibility requirements arestricter and benefits are generally smaller.
In FY 2002, the NAP block grants were $1.35 billionfor Puerto Rico, $5.3 million for American Samoa, and$6.1 million for the Northern Marianas (table 1).
Very little research has been done on the impacts of theNAP (app. table 15, p. 110). The three studies identifiedin the literature search all focused on Puerto Rico. Allthree studies are considerably dated, having used datafrom the 1977 Puerto Rico Supplement to the Nation-wide Food Consumption Survey (NFCS) and/or the1984 Puerto Rico Household Food Consumption Survey(HFCS). The former survey was conducted while the
FSP was still in place. The latter survey was conductedduring the second full year of NAP operations.
The strongest analysis of food expenditures found apositive impact, as would be expected from a programthat supplements the household’s purchasing power(Beebout et al., 1985). Contradictory findings from theonly other analysis of this outcome probably stem fromweaknesses in the analytic approach (Hama, 1993).
Available evidence on the impact of the NAP on house-hold nutrient availability is limited but suggests small,positive effects. All three of the identified studies lookedat this outcome, using the same database but differentanalytic approaches. All found small increases in house-hold availability of food energy as well as several vita-mins and minerals considered to be potentially problem-atic in the Puerto Rican diet. However, only one studyreported on the statistical significance of observed dif-ferences (Bishop et al., 1996). This study found thatsome nutrient intake distributions improved signifi-cantly after the NAP (iron, vitamin A, and niacin),some worsened significantly (calcium and riboflavin),and some remained the same (magnesium and vitaminB6). In examining impacts by income quintiles, theauthors noted that the improvements reached the low-est income quintile while the negative changes did not.
Bishop and his colleagues also compared energy andnutrient availability among NAP participants and non-participants, using only the 1984 HFCS data. In theseanalyses, the sample was restricted to households inthe lowest quintile of the nutrient distribution underconsideration. Among these high-risk households,NAP participation was associated with greater avail-ability of food energy and six of the seven nutrientsexamined (all but calcium). Differences were statisti-cally significant for iron, magnesium, and vitamin B6.
Commodity Supplemental Food Program
The CSFP was established in 1968, largely in responseto concerns about hunger and malnutrition among vul-nerable low-income populations. The SupplementalFood Program, as it was initially known, was devel-oped as a joint effort between USDA and the U.S.Department of Health, Education, and Welfare (theforerunner of the current HHS). The program providedfood packages, including evaporated milk, corn syrup, and “reinforced” cereals, to low-incomewomen, infants, and preschool children. Food packages were distributed to participants—upon“determination [of need] by a competent medicalauthority”—through health clinics, visiting nurses,
Economic Research Service/USDA Effects of Food Assistance and Nutrition Programs on Nutrition and Health / FANRR-19-4 E 31
29PRWORA mandated that all FSP benefits be distributed as electronictransfers rather than as coupons. Nationwide changeover from coupons toelectronic transfers was completed in June 2004 (USDA, 2004).
and health centers that served low-income populations(Mahoney Monrad et al., 1982).
Over time, other types of social service organizationshave come to serve as local CSFP agencies. In the cur-rent configuration, not all local agencies that providecommodity foods also provide direct health services, butall are encouraged to provide health information andlinkages. In addition, with the inception and growth ofthe WIC program and growing interest in issues relatedto aging, the CSFP has shifted emphasis toward the low-income elderly. Elderly participation in the CSFP beganwith a pilot project in FY 1982. The program contin-ues to serve pregnant and breastfeeding women, newmothers up to 1 year postpartum, infants, and childrenunder age 6. The nonelderly population is similar tothe population served by WIC, but eligible individualscannot participate in both programs at the same time.
The CSFP does not operate in all 50 States. In FY2003, 32 States, the District of Columbia, and 2 Indianreservations were authorized to operate the program(USDA/FNS, 2003h). In FY 2002, 427,000 individuals,the majority of whom were elderly, participated in theCSFP each month. The total Federal expenditure forthe program was $110 million (table 1).
The only identified study to examine CSFP impactsdates back to 1982 (app. table 16, p. 112). The studyincluded only pregnant women and preschool children.For pregnant women, the study found favorableimpacts on birth outcomes such as gestational age,birthweight, and length of hospital stay after birth(Mahony Monrad et al., 1982). The study found someevidence of positive effects for children but generallyhad inconclusive results. Study authors provided littleinformation on the procedures used to identify nonpar-ticipants; however, the study likely suffers from selec-tion bias. The relevance of the study to today’s CSFPis also limited by the fact that it is more than 20 yearsold and provides no information on the current majori-ty participant group (the elderly).
Food Distribution Program on IndianReservations and the Trust Territories
The FDPIR was authorized under the Food Stamp Actof 1977.30 In establishing the FDPIR, Congress citedconcerns that the FSP might not adequately meet the
food assistance needs of low-income American Indianhouseholds living on or near reservations (Usher et al.,1990). The primary concern was that the remote locationof many reservations made it difficult for AmericanIndian households to participate in the FSP. In manyinstances, the distance between the reservation and thelocal FSP offices was substantial and/or food storeswhere FSP coupons could be redeemed were scarce orfar away. Thus, the FDPIR was designed to provide analternative to the FSP for low-income American Indianhouseholds living on or near reservations.
The FDPIR provides monthly supplemental food pack-ages to low-income households living on Indian reserva-tions and to eligible American Indian households livingin approved areas near reservations. Income eligibilityfor the FDPIR is based on federally defined incomeeligibility requirements used in the FSP. However, theFDPIR does not impose FSP requirements related toemployment and training or time limits for able-bodiedadults without dependents (ABAWDs). All householdsresiding on Indian reservations are eligible to participatein the program if they meet income and resource stan-dards. Households living in approved areas near reser-vations or in Oklahoma are eligible to participate if atleast one member of the household is a member of afederally recognized tribe (USDA/FNS, 2003j).
Eligible households may choose to participate in eitherthe FDPIR or the FSP but not both. Participating house-holds receive a monthly food package weighing between50 and 75 pounds. In FY 2003, more than 70 differentfood items were offered, including canned meats, poul-try, and fish; canned fruits, vegetables, and juices; driedfruits; dehydrated potatoes; canned soups; cannedspaghetti sauce; packaged macaroni and cheese andother types of pasta; cereals; rice and other grains;cheese; egg mix; peanuts; peanut butter; low-fat refriedbeans; and nonfat dry and evaporated milks (USDA/FNS, 2003j). Staples, such as flour, cornmeal, bakerymix, corn syrup, vegetable oil, and shortening, are alsooffered. Frozen ground beef and chicken and/or freshproduce are also available to most programs that havefacilities to store and handle these foods.31
In addition to providing food, the FDPIR makes avail-able to participants printed materials, including guid-ance on how to use FDPIR foods as part of a healthydiet, commodity fact sheets that provide storage andpreparation tips, nutrition information and recipes, and
32 E Effects of Food Assistance and Nutrition Programs on Nutrition and Health / FANRR-19-4 Economic Research Service/USDA
31Even when offered, some families are not able to use fresh or frozenfoods because they do not have refrigerators (Ballew et al., 1997).
30The FDPIR was actually the precursor to today’s FSP. After FY 1975,when the FSP was available nationwide, the program served U.S. territories inthe Pacific Islands as well as Indian reservations. Most of the Pacific Islandsites were phased out during the 1980s and 1990s, as the islands convertedfrom U.S. territories to commonwealths (USDA/FNS, 2003i).
a “Nutrition Facts” booklet that lists the ingredientsand nutrient composition of available commodities(USDA/FNS, 2003j). Sponsoring agencies can alsoapply for additional Federal funding to be used specifi-cally for nutrition education.
In FY 2003, the FDPIR was administered by 98 IndianTribal Organizations and five States and provided ben-efits to approximately 243 American Indian tribes(USDA/FNS, 2003j). In FY 2002, the program servedapproximately 110,000 individuals each month at anannual cost of $69 million (table 1).
Very little research has been done on the FDPIR. Theonly program-specific study identified was a nationallyrepresentative study completed by Usher et al. (1990).The study was descriptive in nature, with the primaryobjectives of describing program operations, sociode-mographic characteristics of FDPIR households, thedietary needs and preferences of low-income AmericanIndians, and how the FDPIR addresses those needs.The study also compared availability and acceptabilityof the FDPIR vs. the FSP in providing food assistance.The only other potentially relevant literature docu-ments nutrition and health concerns among AmericanIndians, suggesting a need for the program’s benefits.However, no scientific research has assessed the extentto which the FDPIR meets these needs.
WIC and Senior Farmers’Market Nutrition Programs
The Farmers’ Market Nutrition Programs provide low-income individuals with coupons that can be used tobuy fresh fruits, vegetables, and herbs from authorizedfarmers and farmers’ markets. The WIC Farmers’Market Nutrition Program (FMNP) is affiliated withthe WIC program and serves certified WIC partici-pants and eligible nonparticipants who are on waitinglists. FMNP participants can receive farmers’ marketcoupons totaling $10-$20 per year, usually at thebeginning of the fruit- and vegetable-growing season.Not all WIC programs participate in the FMNP. In FY2003, the FMNP operated in 36 States, the District ofColumbia, Guam, Puerto Rico, and 5 Indian TribalOrganizations (USDA/FNS, 2003k). The Federalappropriation for the FMNP was $25 million for FY2003, and the program served more than 2 million par-ticipants in FY 2002 (table 1).
The Senior Farmers’ Market Nutrition Program(SFMNP) is a new FANP, just started in 2002. TheSFMNP is essentially the same as the WIC version ofthe program but is targeted toward low-income elderly.
Total costs for the program were about $13 million inits first year of operation (table 1). In FY 2003, theSFMNP operated in 35 States, the District of Columbia,Puerto Rico, and 3 Indian Tribal Organizations(USDA/FNS, 2003l). A total of $17 million in fundingwas available, including the FY 2003 appropriation($15 million) and unspent funds from FY 2002(approximately $2 million) (USDA, FNS, 2003l).
The literature search identified two studies that assessednutrition-related impacts of the FMNP by comparingparticipants and nonparticipants (app. table 17, p. 114).32
Both studies used research designs that were quite vul-nerable to selection bias, reported on a very early periodin the program’s operation, and based impact assess-ments on self-reported consumption of fresh fruits andvegetables. One study found that participants ate morefresh fruits and vegetables (Galfond et al., 1991),while the other found no effect (Anliker et al., 1992).
The limited and scientifically flawed research that isavailable on the FMNP does not support a firm conclu-sion about the program’s impact. The small dollarvalue of the FMNP benefit—no more than $20 peryear—suggests that the program’s impact, if any, islikely to be so small that it would be extremely costlyto measure.
Special Milk Program
The Special Milk Program (SMP) operates in schoolsand child care institutions that do not participate inother federally sponsored child nutrition programs (theNSLP, the SBP, or the CACFP). Schools that do par-ticipate in these other programs may also participate in the SMP to provide milk to children enrolled in preschool or kindergarten programs that do not provide meals.
Institutions participating in the SMP provide milk tochildren and receive a Federal subsidy for each halfpint served. Children from households with incomes ator below 130 percent of the Federal poverty level mayreceive milk free of charge. In FY 2002, the programprovided approximately 113 million half pints of milkto low-income children at a Federal cost of $16 mil-lion (table 1).
Research on the SMP is extremely limited. Only twostudies that assessed program impact were identified(app. table 18, p. 116). Both of these studies are based
Economic Research Service/USDA Effects of Food Assistance and Nutrition Programs on Nutrition and Health / FANRR-19-4 E 33
32The SFMNP was not considered in the literature review because it wasnot established until 2002.
on data that are more than 20 years old, reflecting atime when the program was 10-15 times as large as itis today.
The strongest available evidence on the potentialimpact of the SMP, although subject to selection bias,comes from the National Evaluation of SchoolNutrition Programs (NESNP), which collected data inthe 1980-82 school year (Wellisch et al., 1983).Results of this study indicated that SMP participantsconsumed significantly more food energy and proteinthan nonparticipants, as well as more calcium,riboflavin, magnesium, and vitamin B6. These resultsare consistent with the nutrient content of milk.
Team Nutrition Initiative and NutritionEducation and Training Program
The Team Nutrition (TN) Initiative and the NutritionEducation and Training (NET) Program differ fromother FANPs in three important ways.33 First, the pri-mary focus of each program is educational in nature—topromote healthful eating patterns. Neither program pro-vides food or enhances food purchasing power. Second,neither program targets benefits based on householdincome. That is, both programs, which are implementedprimarily in schools, are intended to serve all childrenrather than offering greater benefits to low-income chil-dren (as the NSLP and SBP do) or being limited to chil-dren with specific nutritional risks (as WIC is).34 Finally,target audiences for both TN and NET services extendbeyond children to include teachers, school foodserviceworkers, parents, and community members, all of whommay influence children’s food choices.
After the Senior Farmers’ Market Nutrition Program,which began in 2002, TN is the youngest FANP. It wascreated in 1995 as part of the comprehensive SchoolMeals Initiative (see preceding discussion on theNSLP). The FY 2002 appropriation for TN was $10million (table 1). NET has been authorized for morethan 25 years but has not received funding since FY1998. Relatively little research has been done on eitherTN or NET (app. table 19, p. 118).
Team Nutrition Initiative
The best available information about potential impactsof TN comes from an evaluation of a pilot project that was implemented shortly after the program was
established (USDA/FNS, 1998). The evaluationassessed the impact of TN in three key areas: skill-based nutrition knowledge, nutrition-related motiva-tion and attitude, and food consumption behaviors.The TN pilot was designed to test optimal implemen-tation of the initiative. School districts selected to par-ticipate in the pilot demonstrated capacity to meet therequirements of TN implementation, as well as theassociated evaluation. Four districts were selected toparticipate in an indepth outcome evaluation. Threeother districts participated in a limited process study.
Results of the pilot evaluation, although preliminary andcertainly not generalizable, were promising. For skill-based knowledge, significant and positive impacts werenoted for students’ ability to (1) identify healthier choic-es and (2) apply knowledge of the Food Guide Pyramid.Students’ ability to apply a “balanced diet” concept alsoincreased, relative to pretest scores, but differenceswere not statistically significant. Small but positiveand significant effects were noted for three differentattitude measures. Followup data showed that signifi-cant TN effects were maintained over time, althoughthe size of the impact decreased for three of the fivemeasures that were significant initially. Estimatedimpacts at followup were equivalent to or greater thaninitial impacts only for the general attitudes measureand for perceived consequences of increased consump-tion of fruits, vegetables, and grains. The fact that therelative size of the impacts was small (generally onemore correct answer) did not seem to be attributable toa ceiling effect. The authors suggested that the resultsreflected the short implementation period used for theevaluation and speculated that impacts could be largerwith a more protracted period of intervention.
Effects on observed food selection and consumptionbehaviors in the cafeteria were modest. The only effectsthat were noted in an analysis that combined results forall pilot districts were a slight increase in the number ofgrain foods selected, an associated increase in theamount of grain foods eaten, and a small increase in thediversity of foods eaten (the number of different foodgroups tasted per day and total number of items). No sig-nificant differences were noted for selection or consump-tion of fruits, vegetables, or low-fat milk.
Analysis of three different measures of self-reportedeating behaviors showed that TN had small but statisti-cally significant effects on self-reported behaviors. Thespecific behaviors examined were use of low-fat foods,consumption of fruits and vegetables, and dietary vari-ety (the number of food groups included in meals and
34 E Effects of Food Assistance and Nutrition Programs on Nutrition and Health / FANRR-19-4 Economic Research Service/USDA
33FNS considers the TN to be part of the NSLP and SBP rather than aseparate FANP.
34The TN also provides nutrition education materials to other FANPprograms, such as WIC and the FSP.
snacks eaten the previous day). TN was found to havea small but positive and statistically significant impacton all three measures, but none of the impacts persist-ed over time.
Nutrition Education and Training Program
The only national study of NET was completed duringthe very early stages of the program, between 1979and 1980 (St. Pierre and Rezmovic, 1982). At thatpoint, it was plausible to expect program impacts inonly a few States that had been able to begin imple-mentation almost immediately after funds becameavailable. Moreover, because of the diversity of States’goals, only State-specific impact evaluations weredeemed appropriate.
Consequently, impact assessment was limited to twoStates in which NET was firmly established: Georgiaand Nebraska (St. Pierre and Rezmovic, 1982). InNebraska, a pre-/post-test design showed significant,positive impacts on children’s nutrition-related knowledge (St. Pierre et al., 1981). In addition, somegroups of students were more willing to try new or
previously rejected foods in the school cafeteria ormore likely to have improved their food preferences(based on self-report). Effects on nutrition-related atti-tudes, self-reported eating behaviors, or plate wastewere not consistent. In the Georgia study, NET hadstrong positive effects on nutrition knowledge but lim-ited effects on attitudes and self-reported eating behav-iors (St. Pierre and Glotzer, 1981).
The literature search identified three small local stud-ies that examined the impact of NET interventions onchildren’s nutrition-related knowledge, attitudes,and/or eating behaviors.35 Some of these studies, likethe national evaluation, yielded convincing evidencethat NET nutrition education activities produced atleast short-term improvements in children’s nutritionknowledge and attitudes, but little evidence that theyaffected children’s eating habits.
Economic Research Service/USDA Effects of Food Assistance and Nutrition Programs on Nutrition and Health / FANRR-19-4 E 35
35The literature search included only studies where NET was specificallyidentified and did not include studies that examined impacts on teachers orfoodservice workers. The latter research is sumarized elsewhere (Olson,1994).
ReferencesAbrams, B., S. Altman, and K. Pickett. 2000.“Pregnancy Weight Gain: Still Controversial,” AmericanJournal of Clinical Nutrition 71(5):1233s-41s.
Akin, J.S., D.K. Guilkey, P.S. Haines, et al. 1983.“Impact of the School Lunch Program on NutrientIntakes of School Children,” School Food ServiceResearch Review 7(1):13-18.
American School Food Service Association. 2003.“Legislative Update: Focus on Child NutritionContinues.” Available: http://www.asfsa.org/newsroom/sfsnews/legupdate0803.asp. Accessed August 2003.
Anliker, J.A., M. Winne, and L.T. Drake. 1992.“Evaluation of the Connecticut Farmers’ MarketCoupon Program,” Journal of Nutrition Education24(4):185-91.
Argeanas, S., and I. Harrill. 1979. “Nutrient Intake ofLactating Women Participating in the Colorado WICProgram,” Nutrition Reports International 20(6):805-10.
Bailey, L.B., M.S. O’Farrell-Ray, C.S. Mahan, et al.1983. “Vitamin B6, Iron, and Folacin Status ofPregnant Women,” Nutrition Research 3:783-93.
Ballew, C., L.L. White, K.F. Strauss, et al. 1997.“Intake of Nutrients and Food Sources of NutrientsAmong the Navajo: Findings from the Navajo Health and Nutrition Survey,” Journal of Nutrition27(supplement):2085s-93s.
Bartlett, S., R. Olvera, E. Bobronikov, et al. 2003. Study of WIC Participant and ProgramCharacteristics: 2002. USDA, Food and Nutrition Service.
Bartlett, S., R. Olvera, N. Gill, et al. 2002. WICParticipant and Program Characteristics: 2000.USDA, Food and Nutrition Service.
Batten, S., J. Hirschman, and D. Thomas. 1990.“Impact of the Special Supplemental Food Program on Infants,” Pediatrics 117:S101-09.
Beebout, H., E. Cavin, B. Devaney, et al. 1985.Evaluation of the Nutrition Assistance Program inPuerto Rico: Volume II, Effects on Food Expendituresand Diet Quality. Washington, DC: MathematicaPolicy Research, Inc.
Bickel, G., M. Nord, C. Price, et al. 2000. Guide toMeasuring Household Food Security: Revised 2000.USDA, Food and Nutrition Service.
Birkhead G.S., C.W. LeBaron, P. Parsons, et al. 1995.“The Immunization of Children Enrolled in the SpecialSupplemental Food Program for Women, Infants, andChildren (WIC): The Impact of Different Strategies,”Journal of the American Medical Association274(4):312-16.
Bishop J.A., J.P. Formby, and L.A. Zeager. 1996.“Relative Undernutrition in Puerto Rico underAssistance Programmes,” Applied Economics28(8):1009-17.
Black, M., D. Cutts, D. Frank, et al. 2004. “SpecialSupplemental Nutrition Program for Women, Infants,and Children Participation and Infants’ Growth andHealth: A Multisite Surveillance Study,” Pediatrics114:169-76.
Bloom, H. 1984. “Accounting for No-Shows inExperimental Evaluation Designs,” Evaluation Review8(2):225-46.
Bost, E.M. 2000. “Hunger Doesn’t Take a Vacation.”Message from Under Secretary of Agriculture, Eric M.Bost, posted on Summer Food Service Program web-site. Available: http://www.fns.usda.gov/snd/summer/states/message.html. Accessed March 2002.
Briefel, R., J. Jacobson, N. Clusen, et al. 2003. TheEmergency Food Assistance System—Findings Fromthe Client Survey: Executive Summary. FANRR-32.USDA, Economic Research Service.
Buescher, P.A., S. Horton, B. Devaney, et al. 2003.“Child Participation in WIC: Medicaid Costs and Useof Healthcare Services,” American Journal of PublicHealth 93(1):145-50.
Burghardt, J., A. Gordon, N. Chapman, et al. 1993. TheSchool Nutrition Dietary Assessment Study: School FoodService, Meals Offered, and Dietary Intakes. USDA,Food and Nutrition Service.
Burstein, N., M.K. Fox, J.B. Hiller, et al. 2000. WICGeneral Analysis Project: Profile of WIC Children.USDA, Food and Nutrition Service.
36 E Effects of Food Assistance and Nutrition Programs on Nutrition and Health / FANRR-19-4 Economic Research Service/USDA
Burstein, N., M.K. Fox, and M.J. Puma. 1991. Study ofthe Impact of WIC on the Growth and Development ofChildren: Field Test. Final Report, Volume II:Preliminary Impact Estimates. Cambridge, MA: AbtAssociates Inc.
Buzby, J.C., and J.F. Guthrie. 2002. Plate Waste inSchool Nutrition Programs: Final Report to Congress.E-FAN-02-009. USDA, Economic Research Service.
Buzby, J.C., J. Guthrie, and L.S. Kantor. 2003.Evaluation of the USDA Fruit and Vegetable PilotProgram: Report to Congress. E-FAN-03-006. USDA,Economic Research Service.
Caan, B., D.M. Horgen, S. Margen, et al. 1987.“Benefits Associated with WIC Supplemental FeedingDuring the Interpregnancy Interval,” AmericanJournal of Clinical Nutrition 45:29-41.
Carlson, A., and B. Senauer. 2003. “The Impact of theSpecial Supplemental Nutrition Program for Women,Infants, and Children on Child Health,” AmericanJournal of Agricultural Economics 85(2):479-91.
Centers for Disease Control and Prevention. 1992.“Recommendations for the Use of Folic Acid toReduce the Number of Cases of Spina Bifida andOther Neural Tube Defects,” Morbidity and MortalityWeekly Report 41(RR-14):1-7.
Cole, N., and M.K. Fox. 2004a. Nutrition and HealthCharacteristics of Low-Income Populations: Volume II, WIC Participants and Nonparticipants. E-FAN-04-014-2. USDA, Economic Research Service.
Cole, N., and M.K. Fox. 2004b. Nutrition and HealthCharacteristics of Low-Income Populations: VolumeIV, Older Adults. E-FAN-04-014-4. USDA, EconomicResearch Service.
Crepinsek, M.K., N.R. Burstein, E.B. Lee, et al. 2002.Meals Offered by Tier 2 CACFP Family Child CareProviders—Effects of Lower Meal Reimbursements: AReport to Congress on the Family Child Care HomesLegislative Changes Study. E-FAN-02-006. USDA,Economic Research Service.
Devaney, B.L., A.R. Gordon, and J.A. Burghardt. 1993.The School Nutrition Dietary Assessment Study: DietaryIntakes of Program Participants and Nonparticipants.USDA, Food and Nutrition Service.
Devaney, B., and E. Stuart. 1998. “Eating Breakfast:Effects of the School Breakfast Program,” FamilyEconomics and Nutrition Review 1998:60-62.
Devaney, B., P. Ziegler, L. Kalb, et al. 2004a.“Feeding Infants and Toddlers Study: Overview of theStudy Design,” Journal of the American DieteticAssociation 104(1, Supplement):S8-S13.
Devaney, B., P. Ziegler, S. Pac, et al. 2004b. “NutrientIntakes of Infants and Toddlers,” Journal of the Ameri-can Dietetic Association 104(1, Supplement):S14-S21.
Dietz, V.J., A.L. Baughman, E.F. Dini, et al. 2000.“Vaccination Practices, Policies, and ManagementFactors Associated with High Vaccination CoverageLevels in Georgia Public Clinics,” Archives ofPediatric Adolescent Medicine 154:184-89.
Edwards, D.L., E.A. Frongillo, Jr., B. Rauschenbach,et al. 1993. “Home-delivered Meals Benefit theDiabetic Elderly,” Journal of the American DieteticAssociation 93(5):585-87.
Endres, J., M. Sawicki, and J.A. Casper. 1981. “DietaryAssessment of Pregnant Women in a SupplementalFood Program,” Journal of the American DieteticAssociation 79:121-26.
Food Research and Action Center. 2003. HungerDoesn’t Take a Vacation: Summer Nutrition StatusReport, June 2003. Washington, DC.
Food Research and Action Center. 2001. New PilotMakes Summer Food Participation Easier in 13 Statesand Puerto Rico. Available: http://www.frac.org/html/news/sfsp_pilots.html. Accessed March 2002.
Fox, M.K., and N. Cole. 2004a. Nutrition and HealthCharacteristics of Low-Income Populations: Volume I,Food Stamp Program Participants and Nonparticipants.E-FAN-04-014-1. USDA, Economic Research Service.
Fox, M.K., and N. Cole. 2004b. Nutrition and HealthCharacteristics of Low-Income Populations: VolumeIII, School-Age Children. E-FAN-04-014-3. USDA,Economic Research Service.
Fox, M.K., M.K. Crepinsek, P. Connor, et al. 2001.Second School Nutrition Dietary Assessment Study(SNDA-II): Final Report. USDA, Food and NutritionService.
Economic Research Service/USDA Effects of Food Assistance and Nutrition Programs on Nutrition and Health / FANRR-19-4 E 37
Fox, M.K., W.L. Hamilton, and B.-H. Lin. 2004.Effects of Food Assistance and Nutrition Programs onNutrition and Health: Volume 3, Literature Review.FANRR-19-3. USDA, Economic Research Service.
Fraker, T.M., A.P. Martini, J.C. Ohls, et. al. 1992. TheEvaluation of the Alabama Food Stamp Cash-outDemonstration: Volume 1, Recipient Impacts. USDA,Food and Nutrition Service.
Galfond, G., J. Thompson, and K. Wise. 1991. Evalua-tion of the Farmers Market Coupon DemonstrationProject. USDA, Food and Nutrition Service.
Garnett, S.C. 2001. Implementation of the SummerFood Service Program (SFSP) Pilot ProjectsAuthorized by the Consolidated Appropriations Act,2001. Technical memorandum issued to FNS regionsand State agencies, January 19, 2001.
Glantz, F., R. Berg, D. Porcari, et al. 1994. SchoolLunch and Breakfast Nonparticipants Study. USDA,Food and Nutrition Service.
Glantz, F., and M.K. O’Neill-Fox. 1982. Evaluation ofthe Child Care Food Program: Final Report on theCongressionally Mandated Studies. Volume I.Cambridge, MA: Abt Associates Inc.
Gleason, P.M. 1996. Student Participation in the SchoolNutrition Programs: An Econometric and SimulationModel. USDA, Food and Nutrition Service.
Gleason, P., A. Rangarajan, and C. Olson. 2000.Dietary Intake and Dietary Attitudes Among FoodStamp Participants and Other Low-IncomeIndividuals. USDA, Food and Nutrition Service.
Gleason, P., and C. Suitor. 2003. “Eating at School:How the National School Lunch Program AffectsChildren’s Diets,” American Journal of AgriculturalEconomics 85(4):1047-61.
Gordon, A., and R. Briefel. 2003. Feeding Low-IncomeChildren When School is Out—The Summer FoodService Program: Executive Summary. FANRR-30.USDA, Economic Research Service.
Gordon, A.R., B.L. Devaney, and J.A. Burghardt. 1995.“Dietary Effects of the National School Lunch Programand the School Breakfast Program,” American Journalof Clinical Nutrition 61(1, Supplement):221S-31S.
Gore, S.A., D.M. Brown, and D.S. West. 2003. “TheRole of Postpartum Weight Retention in ObesityAmong Women: A Review of the Evidence,” Annals ofBehavioral Medicine 26(2):149-59.
Gundersen, C., and V. Oliveira. 2001. “The FoodStamp Program and Food Insufficiency,” AmericanJournal of Agricultural Economics 83(4):875-87.
Guthrie, J. 2003. Food Assistance Research Brief—Do Healthy School Meals Cost More? FANRR-34-6.USDA, Economic Research Service.
Hama, M.Y. 1993. Food and Nutrient ConsumptionPatterns of Households in Puerto Rico (NutrientQuality). Unpublished doctoral dissertation, Universityof Maryland.
Hamilton, W., N. Burstein, and M.K. Crepinsek. 2001.Reimbursement Tiering in the CACFP: SummaryReport of the Family Child Care Homes LegislativeChanges Study. FANRR-22. USDA, EconomicResearch Service.
Hamilton, W.L., and P.H. Rossi. 2002. Effects of FoodAssistance and Nutrition Programs on Nutrition andHealth: Volume 1, Research Design. FANRR-19-1.USDA, Economic Research Service.
Hirschman, J. 2004. Presentation to Expert Committeefor Review of Food Practices. Institute of Medicine.February 26, 2004. Available: http://www.iom.edu/object.file/master/19/293/0.pdf. Accessed June 2004.
Huffman, S.K., and H. Jensen. 2003. Do Food Assis-tance Programs Improve Household Food Security?Recent Evidence from the United States. Workingpaper 03-WP-335. Ames, IA: Iowa State University,Center for Agricultural and Rural Development.
Hutchins, S.S., J. Rosenthal, P. Eason, et al. 1999.“Effectiveness and Cost-Effectiveness of Linking theSpecial Supplemental Program for Women, Infants,and Children (WIC) and Immunization Activities,”Journal of Public Health Policy 20(4):408-26.
Institute of Medicine, Food and Nutrition Board.2002a. Dietary Reference Intakes: Vitamin A, VitaminK, Arsenic, Boron, Chromium, Copper, Iodine, Iron,Manganese, Molybdenum, Nickel, Silicon, Vanadium,and Zinc. Washington, DC: National Academy Press.
38 E Effects of Food Assistance and Nutrition Programs on Nutrition and Health / FANRR-19-4 Economic Research Service/USDA
Institute of Medicine, Food and Nutrition Board.2002b. Dietary Reference Intakes: Energy,Carbohydrates, Fiber, Fats, Fatty Acids, Cholesterol,Protein, and Amino Acids (Macronutrients).Washington, DC: National Academy Press.
Institute of Medicine, Food and Nutrition Board. 2001.Dietary Reference Intakes: Application in DietaryAssessment. Washington, DC: National Academy Press.
Institute of Medicine, Food and Nutrition Board.2000a. Dietary Reference Intakes: Thiamin,Riboflavin, Niacin, Vitamin B6, Folate, Vitamin B12,Pantothenic Acid, Biotin, and Choline. Washington,DC: National Academy Press.
Institute of Medicine, Food and Nutrition Board.2000b. Dietary Reference Intakes: Vitamin C, VitaminE, Selenium, and Carotenoids. Washington, DC:National Academy Press.
Institute of Medicine, Food and Nutrition Board. 1999.Dietary Reference Intakes: Calcium, Phosphorus,Magnesium, Vitamin D, Fluoride. Washington, DC:National Academy Press.
Kennedy, E.T., J. Ohls, S. Carlson, et al. 1995. “TheHealthy Eating Index: Design and Applications,”Journal of the American Dietetic Association95(10):1103-09.
Kowaleski-Jones, L., and G.J. Duncan. 2000. Effects ofParticipation in the WIC Food Assistance Program onChildren’s Health and Development: Evidence fromNLSY Children. Discussion Paper No. 1207-00.Madison, WI: Institute for Research on Poverty.
Kramer-LeBlanc, C., A. Mardis, S. Gerrior, et al. 1999.Review of the Nutritional Status of WIC Participants.USDA, Center for Nutrition Policy and Promotion.
Kranz, S., and S.M. Siega-Riz. 2002. “Sociodemo-graphic Determinants of Added Sugar Intake inPreschoolers 2 to 5 Years Old,” Journal of Pediatrics140:667-72.
Kresge, J. 2003. WIC Participant and ProgramCharacteristics: PC2002, Executive Summary. USDA,Food and Nutrition Service.
Lederman, S.A., G. Alfasi, and R.J. Deckelbaum.2002. “Pregnancy-associated Obesity in Black Womenin New York City,” Maternal and Child HealthJournal 6(1):37-42.
Lee, B.J., L. Mackey-Bilaver, and R.M. Goerge. 2000.The Patterns of Food Stamp and WIC Participationand Their Effects on Health and Low-IncomeChildren. JCPR Working Paper No. 129. Chicago, IL:Northwestern University/University of Chicago JointCenter for Poverty Research.
Lee, J.Y., R.G. Rozier, E.C. Norton, et al. 2004a.“Effects of WIC Child Participation on Use of OralHealth Services,” American Journal of Public Health94:772-77.
Lee, J.Y., R.C. Rozier, E.C. Norton, et al. 2004b. “TheEffects of the Women, Infants, and Children’sSupplemental Food Program on Dentally-RelatedMedicaid Expenditures,” Journal of Public HealthDentistry 64:76-81.
Lin, B.-H., and K. Ralston. 2003. Food AssistanceResearch Brief—Competitive Foods: Soft Drinks vs. Milk.FANRR-34-7. USDA, Economic Research Service.
Logan, C., M.K. Fox, and B.-H. Lin. 2002. Effects ofFood Assistance and Nutrition Programs on Nutritionand Health, Volume 2: Data Sources. FANRR-19-2.USDA, Economic Research Service.
Luman, E.T., M.M. McCauley, A. Shefer, et al. 2003.“Maternal Characteristics Associated with Vaccinationof Young Children,” Pediatrics 111(5):1215-18.
Mahony Monrad, D., S.H. Pelavin, R.F. Baker, et al.1982. Evaluation of the Commodity SupplementalFood Program: Final Report—Health and NutritionImpacts of Three Local Projects. USDA, Food andNutrition Service.
Mardis, A., and R. Anand. 2000. A Look at the Diet ofPregnant Women. Nutrition Insights No. 17. USDA,Center for Nutrition Policy and Promotion.
Maurer, K. 1984. “The National Evaluation of SchoolNutrition Programs: Factors Affecting StudentParticipation,” American Journal of Clinical Nutrition40:425-47.
McLaughlin, J., L. Bernstein, M.K. Crepinsek, et al.2002. Evaluation of the School Breakfast ProgramPilot Project: Findings from the First Year ofImplementation. USDA, Food and Nutrition Service.
Economic Research Service/USDA Effects of Food Assistance and Nutrition Programs on Nutrition and Health / FANRR-19-4 E 39
Metcoff, J., P. Costiloe, W.M. Crosby, et al. 1985.“Effect of Food Supplementation (WIC) DuringPregnancy on Birth Weight,” American Journal ofClinical Nutrition 41:933-47.
Meyers, A.F., A.E. Sampson, M. Weitzman, et al.1989. “School Breakfast Program and SchoolPerformance,” American Journal of Disabled Children143:1234-39.
National Research Council. 1989a. RecommendedDietary Allowances, 10th edition. Washington, DC:National Academy Press.
National Research Council. 1989b. Diet and Health:Implications for Reducing Chronic Disease Risk.Washington, DC: National Academy Press.
National Research Council. 1986. Nutrient Adequacy:Assessment Using Food Consumption Surveys.Washington, DC: National Academy Press.
Ohls, J.C., T.M. Fraker, A.P. Martini, et al. 1992. TheEffects of Cash-out on Food Use by Food StampProgram Participants in San Diego. USDA, Food andNutrition Service
Ohls, J., and F. Saleem-Ismail. 2002. The EmergencyFood Assistance System—Findings From the ProviderSurvey, Volume I: Executive Summary. FANRR-16-1.USDA, Economic Research Service.
Oliveira, V. 2003. The Food Assistance Landscape:March 2003. FANRR-28-2. USDA, EconomicResearch Service.
Oliveira, V., and C. Gundersen. 2000. WIC and theNutrient Intake of Children. FANRR-5. USDA,Economic Research Service.
Oliveira, V., E. Racine, J. Olmstead, et al. 2002. TheWIC Program: Background, Trends, and Issues.FANRR-27. USDA, Economic Research Service.
Olson, C.M. 1994. A Review of the Research on theEffects of Training in Nutrition Education onIntermediaries, Paraprofessionals, and Professionals.USDA, Food and Nutrition Service.
Pehrsson, P.R., P.B. Moser-Veillon, L. Sims, et al. 2001.“Postpartum Iron Stats in Nonlactating Participantsand Nonparticipants in the Special SupplementalNutrition Program for Women, Infants, and Children,”American Journal of Clinical Nutrition 73:86-92.
Ponza, M., R. Briefel, W. Corson, et al. 1999.Universal-free School Breakfast Program EvaluationDesign Report: Final Evaluation Design. USDA, Foodand Nutrition Service.
Ponza, M., J. Burghardt, R. Cohen, et al. 1993.National Study of the Adult Component of the Child andAdult Care Food Program (CACFP). Final Report.Volumes I and II. USDA, Food and Nutrition Service.
Ponza, M., B. Devaney, P. Ziegler, et al. 2004. “NutrientIntakes and Food Choices of Infants and ToddlersParticipating in WIC,” Journal of the AmericanDietetic Association 104(1, Supplement):S71-S79.
Ponza, M., J.C. Ohls, B.E. Millen, et al. 1996. ServingElders at Risk: The Older Americans Act NutritionPrograms, National Evaluation of the ElderlyNutrition Program, 1993-1995, Volumes I, II, and III.U.S. Department of Health and Human Services,Administration on Aging.
Price, C., W.L. Hamilton, and J.C. Cook. 1997. Guideto Implementing the Core Food Security Module.USDA, Food and Nutrition Service. (The guide wasrevised and updated in 2000; see Bickel et al., 2000).
Project Bread. 2000. The Massachusetts Child HungerInitiative: An Action Plan To End Child Hunger inMassachusetts. Boston, MA.
Puma, M.J., J. DiPietro, J. Rosenthal, et al. 1991. Studyof the Impact of WIC on the Growth and Developmentof Children: Field Test, Volume 1: FeasibilityAssessment. Cambridge, MA: Abt Associates Inc.
Putnam, J., and S. Gerrior. 1999. “Chapter 7: Trends inthe U.S. Food Supply, 1980-97,” in E. Frazao (ed.),America’s Eating Habits: Changes and Consequences.AIB-750. USDA, Economic Research Service.
Radzikowski, J., and S. Gale. 1984. “The NationalEvaluation of School Nutrition Programs: Conclusions,”American Journal of Clinical Nutrition 40:454-61.
Rainville, A.J. 2001. “Nutritional Quality ofReimbursable School Lunches Compared to LunchesBrought from Home in Elementary Schools in TwoSoutheastern Michigan Districts,” Journal of ChildNutrition & Management 25(1):13-18.
Ralston, K., J. Buzby, and J. Guthrie. 2003. Food Assis-tance Research Brief—A Healthy School Meal Environ-ment. FANRR-34-5. USDA, Economic Research Service.
40 E Effects of Food Assistance and Nutrition Programs on Nutrition and Health / FANRR-19-4 Economic Research Service/USDA
Reddan, J., K. Wahlstrom, and M. Reicks. 2002.“Children’s Perceived Benefits and Barriers inRelation to Eating Breakfast in Schools With orWithout Universal School Breakfast,” Journal ofNutrition Education and Behavior 34(1):47-52.
Rosales, W., and J. Janowski. 2002. The State ofBreakfast in Wisconsin. Milwaukee, WI: Hunger TaskForce of Milwaukee.
Rose, D., J.P. Habicht, and B. Devaney. 1998.“Household Participation in the Food Stamp and WICPrograms Increases the Nutrient Intakes of PreschoolChildren,” Journal of Nutrition 128(3):548-55.
Rossi, P.H. 1998. Feeding the Poor: Assessing FederalFood Aid. Washington, DC: The AEI Press, pp. 44-65.
Rush, D., J. Leighton, N. Sloan, et al. 1988a. “TheNational WIC Evaluation: Evaluation of the SpecialSupplemental Food Program for Women, Infants andChildren, VI: Study of Infants and Children,”American Journal of Clinical Nutrition 48:484-511.
Rush, D., J. Leighton, N. Sloan, et al. 1988b. “TheNational WIC Evaluation: Evaluation of the SpecialSupplemental Food Program for Women, Infants andChildren, V: Longitudinal Study of Pregnant Women,”American Journal of Clinical Nutrition 48:439-83.
Shefer, A.M., E.T. Luman, B.H. Lyons, et al. 2001.“Vaccination Status of Children in the Women, Infants,and Children (WIC) Program: Are We Doing Enoughto Improve Coverage?” American Journal ofPreventive Medicine 20(1, Supplement 1):47-54.
Siega-Riz, S.M., S. Kranz, D. Blanchette, et al. 2004.“The Effect of Participation in the WIC Program onPreschoolers’ Diets,” Journal of Pediatrics 144:229-34.
Singh, A., and J. Endahl. 2004. Evaluation of the 14State Summer Food Service Program Pilot Project.USDA, Food and Nutrition Service.
St. Pierre, R.G., T.D. Cook, and R.B. Straw. 1981. “AnEvaluation of the Nutrition Education and TrainingProgram: Findings from Nebraska,” Evaluation andProgram Planning 4:335-44.
St. Pierre, R.G., and J.A. Glotzer. 1981. An Evaluationof the Georgia Nutrition Education and TrainingProgram. Cambridge, MA: Abt Associates Inc.
St. Pierre, R.G., and V. Rezmovic. 1982. “AnOverview of the National Nutrition Education andTraining Program Evaluation,” Journal of NutritionEducation 14(2):61-66.
Tasse, T., and J. Ohls. 2003. Reaching More HungryChildren: The Seamless Summer Food Waiver. Trendsin Nutrition Policy. Issue Brief No. 1. Princeton, NJ:Mathematica Policy Research.
U.S. Department of Agriculture. 2004. “VenemanAnnounces Full Implementation of Food StampProgram Electronic Benefits Transfer System,” USDANews Release 0251.04, June 22, 2004.
U.S. Department of Agriculture, Center for NutritionPolicy and Promotion. 1996. The Food GuidePyramid. Home and Garden Bulletin No. 252.
U.S. Department of Agriculture, Food and NutritionService. 2003a. “Food Stamp Program NutritionEducation Fact Sheet.” Available: http://www.fns.usda.gov/fsp/menu/admin/nutritioned/fsheet.htm. AccessedApril 2003.
U.S. Department of Agriculture, Food and NutritionService. 2003b. “Afterschool Snacks in the NSLP: BasicQuestions and Answers.” Available: http://www.fns.usda.gov/cnd/Afterschool/NSLP_QA.htm. Accessed July 2003.
U.S. Department of Agriculture, Food and NutritionService. 2003c. “School Breakfast Program: Fact Sheet.”Available: http://www.fns.usda.gov/cnd/breakfast/aboutBFast/bfastfacts.htm. Accessed August 2003.
U.S. Department of Agriculture, Food and NutritionService. 2003d. “Program Fact Sheet: National SchoolLunch Program.” Available: http://www.fns.usda.gov/cnd/Lunch/default.htm. Accessed June 2003.
U.S. Department of Agriculture, Food and NutritionService. 2003e. “Facts about the Child and Adult CareFood Program.” Available: http://www.fns.usda.gov/cnd/care/CACFP/cacfpfaqs.htm. Accessed March 2003.
U.S. Department of Agriculture, Food and NutritionService. 2003f. Program data. Available: http://www.fns.usda.gov/pd. Accessed April 2003.
U.S. Department of Agriculture, Food and NutritionService. 2003g “Food Distribution Fact Sheet: TheEmergency Food Assistance Program.” Available:http://www.fns.usda.gov/fdd/programs/tefap/pfs-tefap.pdf. Accessed April 2003.
Economic Research Service/USDA Effects of Food Assistance and Nutrition Programs on Nutrition and Health / FANRR-19-4 E 41
U.S. Department of Agriculture, Food and NutritionService. 2003h. “Food Distribution Fact Sheet:Commodity Supplemental Food Program.” Available:http://www.fns.usda.gov/fdd/programs/csfp/pfs-csfp.03.pdf. Accessed April 2003.
U.S. Department of Agriculture, Food and NutritionService. 2003i. Footnote on table “Costs of FoodDistribution Programs,” Available: http://www.fns.usda.gov/pd/fd$sum.htm. Accessed April 2003.
U.S. Department of Agriculture, Food and NutritionService. 2003j. “Food Distribution Programs: FAQsAbout FDPIR.” Available: http://www.fns.usda.gov/fdd/programs/fdpir/fdpir-faqs.htm. Accessed June 2003.
U.S. Department of Agriculture, Food and NutritionService. 2003k. “WIC Farmers’ Market NutritionProgram.” Available: http://www.fns.usda.gov/WIC/FMNP/FMNPfaqs.htm. Accessed April 2003.
U.S. Department of Agriculture, Food and NutritionService. 2003l. “FNS Announces FY 2003 SeniorFarmers’ Market Nutrition Program (SFMNP).”Available: http://www.fns.usda.gov/WIC/SeniorFMNP/SFMNPFY03.htm. Accessed April 2003.
U.S. Department of Agriculture, Food and NutritionService. 2002a. “USDA News Release: USDA PlansTo Continue Improving Children’s Access to theSummer Food Service Program.” Available:http://www.fns.usda.gov/news/releases/2002/03/0082.htm. Accessed March 2002.
U.S. Department of Agriculture, Food and NutritionService. 2002b. “Nutrition Services Incentive Program(Formerly NPE).” Available: http://www.fns.usda.gov/fdd/programs/nsip. Accessed March 2002.
U.S. Department of Agriculture, Food and NutritionService. 2000a. “Food and Nutrition Service (FNS)Strategic Plan 2000 to 2005.” Available: http://www.fns.usda.gov/oane/MENU/gpra/FNSStrategicplan.htm.Accessed April 2002.
U.S. Department of Agriculture, Food and NutritionService. 2000b. Changing the Scene: Improving theSchool Nutrition Environment. USDA, Food andNutrition Service. (A tool kit for schools, availablethrough http://www.fns.usda.gov/tn/Healthy/chang-ing.html).
U.S. Department of Agriculture, Food and NutritionService. 1998. The Story of Team Nutrition: PilotStudy Outcome Report.
U.S. Department of Agriculture and U.S. Departmentof Health and Human Services. 2000. Nutrition andYour Health: Dietary Guidelines for Americans, 5thedition. Home and Garden Bulletin No. 232.
U.S. Department of Agriculture and U.S. Departmentof Health and Human Services. 1990. DietaryGuidelines for Americans, 3rd edition. Home andGarden Bulletin No. 232.
U.S. Department of Health and Human Services,Administration on Aging. 2002. Linking Nutrition andHealth: 30 Years of the Older Americans Act NutritionPrograms—Program Milestones: 1954-2002.
Usher, C.L. D.S. Shanklin, and J.B. Wildfire. 1990.Evaluation of the Food Distribution Program onIndian Reservations (FDPIR). Volume I. Final Report.USDA, Food and Nutrition Service.
Wellisch, J.B., S.D. Hanes, L.A. Jordon, et al. 1983.The National Evaluation of School NutritionPrograms: Final Report. Volumes 1 and 2. SantaMonica, CA: Systems Development Corporation.
Yip, R., N. Binkin, L. Fleshood, et al. 1987.“Declining Prevalence of Anemia Among Low-incomeChildren in the United States,” Journal of theAmerican Medical Association 258(12):1619-23.
Yip, R., I. Parvanta, K. Scanlon, et al. 1992. “PediatricNutrition Surveillance System: United States, 1980-91.” Morbidity and Mortality Weekly Report 41(7):1-24.
42 E Effects of Food Assistance and Nutrition Programs on Nutrition and Health / FANRR-19-4 Economic Research Service/USDA
Economic Research Service/USDA Effects of Food Assistance and Nutrition Programs on Nutrition and Health / FANRR-19-4 E 43
Appendix A
Summary of Impact StudiesIdentified in the Literature Review
Note: As discussed in the text, all identified research that described differencesbetween participants and nonparticipants is included in these tables. Although some ofthese studies had weak designs or used rudimentary or, in some cases, no statisticalanalysis, they are included in the interest of completeness. The tables include informa-tion about both design and analysis methods. In interpreting findings from the com-plete body of research for a given program, greater weight was given to findings fromstudies that had the strongest design and analysis methods and that used the mostrecent data.

Economic Research Service/USDA Effects of Food Assistance and Nutrition Programs on Nutrition and Health / FANRR-19-4 E 45
Food Stamp Program
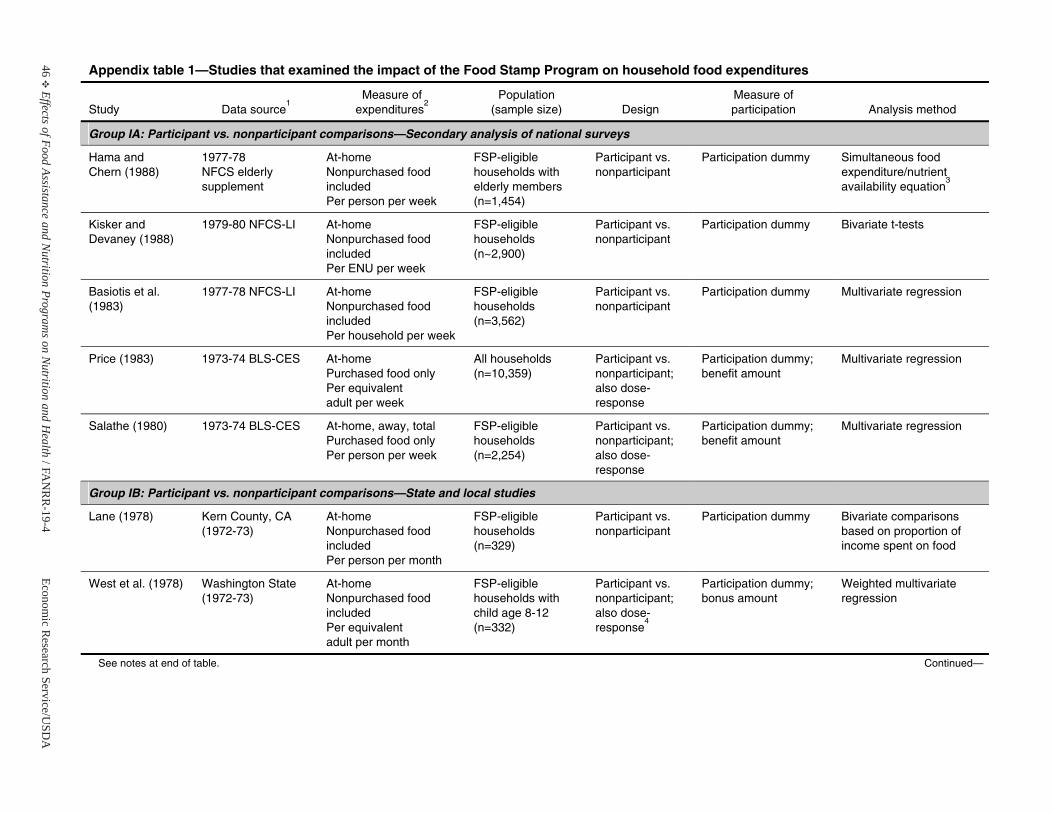
46E
Effects of Food Assistance and Nutrition Program
s on Nutrition and H
ealth / F AN
RR
-19-4Econom
ic Research Service/U
SDA
Appendix table 1—Studies that examined the impact of the Food Stamp Program on household food expenditures
Study Data source1
Measure of expenditures
2Population
(sample size) Design Measure of participation Analysis method
Group IA: Participant vs. nonparticipant comparisons—Secondary analysis of national surveys
Hama and Chern (1988)
1977-78 NFCS elderly supplement
At-home Nonpurchased food includedPer person per week
FSP-eligible households with elderly members (n=1,454)
Participant vs. nonparticipant
Participation dummy Simultaneous food expenditure/nutrient availability equation
3
Kisker and Devaney (1988)
1979-80 NFCS-LI At-home Nonpurchased food includedPer ENU per week
FSP-eligible households (n~2,900)
Participant vs. nonparticipant
Participation dummy Bivariate t-tests
Basiotis et al. (1983)
1977-78 NFCS-LI At-home Nonpurchased food includedPer household per week
FSP-eligible households (n=3,562)
Participant vs. nonparticipant
Participation dummy Multivariate regression
Price (1983) 1973-74 BLS-CES At-home Purchased food only Per equivalent adult per week
All households (n=10,359)
Participant vs. nonparticipant;also dose-response
Participation dummy; benefit amount
Multivariate regression
Salathe (1980) 1973-74 BLS-CES At-home, away, total Purchased food only Per person per week
FSP-eligible households (n=2,254)
Participant vs. nonparticipant;also dose-response
Participation dummy; benefit amount
Multivariate regression
Group IB: Participant vs. nonparticipant comparisons—State and local studies
Lane (1978) Kern County, CA (1972-73)
At-home Nonpurchased food includedPer person per month
FSP-eligible households (n=329)
Participant vs. nonparticipant
Participation dummy Bivariate comparisons based on proportion of income spent on food
West et al. (1978) Washington State (1972-73)
At-home Nonpurchased food includedPer equivalent adult per month
FSP-eligible households with child age 8-12 (n=332)
Participant vs. nonparticipant;also dose-response
4
Participation dummy; bonus amount
Weighted multivariateregression
See notes at end of table. Continued—
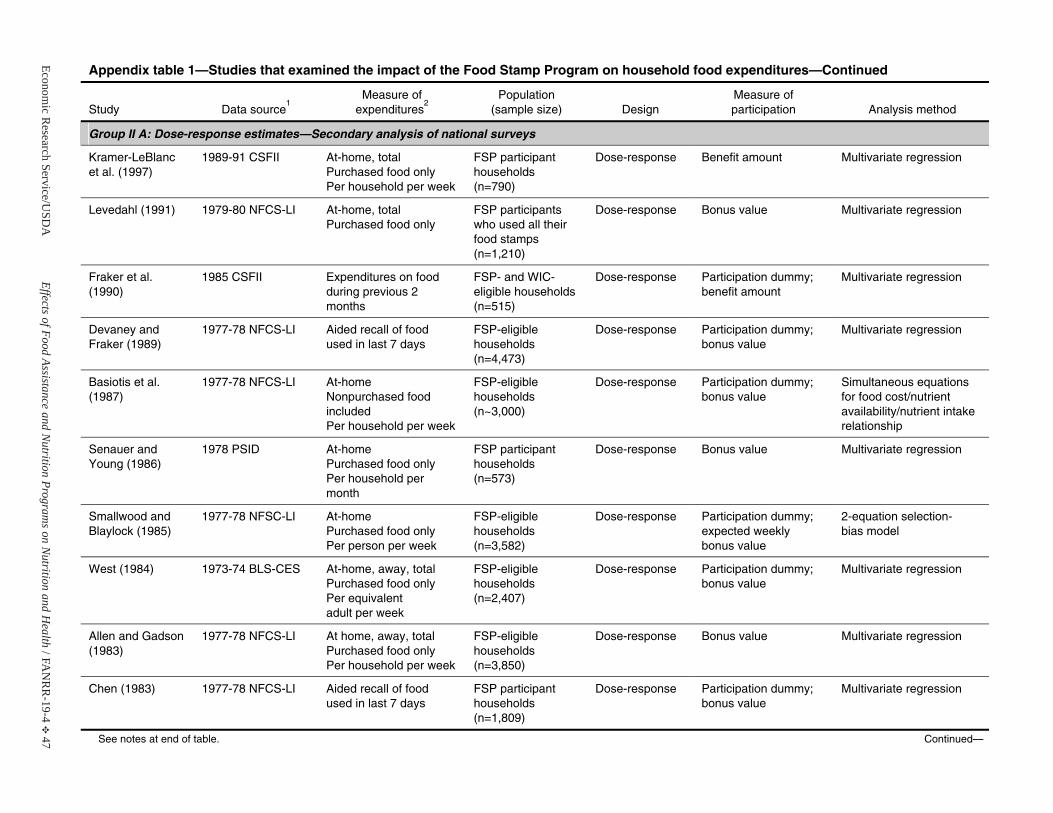
Economic R
esearch Service/USD
AEffects of Food Assistance and N
utrition Programs on N
utrition and Health / F A
NR
R-19-4
E 47
Appendix table 1—Studies that examined the impact of the Food Stamp Program on household food expenditures—Continued
Study Data source1
Measure of expenditures
2Population
(sample size) Design Measure of participation Analysis method
Group II A: Dose-response estimates—Secondary analysis of national surveys
Kramer-LeBlancet al. (1997)
1989-91 CSFII At-home, totalPurchased food only Per household per week
FSP participanthouseholds (n=790)
Dose-response Benefit amount Multivariate regression
Levedahl (1991) 1979-80 NFCS-LI At-home, totalPurchased food only
FSP participants who used all their food stamps (n=1,210)
Dose-response Bonus value Multivariate regression
Fraker et al. (1990)
1985 CSFII Expenditures on food during previous 2 months
FSP- and WIC-eligible households(n=515)
Dose-response Participation dummy;benefit amount
Multivariate regression
Devaney and Fraker (1989)
1977-78 NFCS-LI Aided recall of food used in last 7 days
FSP-eligible households (n=4,473)
Dose-response Participation dummy;bonus value
Multivariate regression
Basiotis et al. (1987)
1977-78 NFCS-LI At-home Nonpurchased food includedPer household per week
FSP-eligible households (n~3,000)
Dose-response Participation dummy;bonus value
Simultaneous equations for food cost/nutrient availability/nutrient intakerelationship
Senauer and Young (1986)
1978 PSID At-home Purchased food only Per household per month
FSP participanthouseholds (n=573)
Dose-response Bonus value Multivariate regression
Smallwood and Blaylock (1985)
1977-78 NFSC-LI At-home Purchased food only Per person per week
FSP-eligible households (n=3,582)
Dose-response Participation dummy;expected weekly bonus value
2-equation selection- bias model
West (1984) 1973-74 BLS-CES At-home, away, total Purchased food only Per equivalent adult per week
FSP-eligible households (n=2,407)
Dose-response Participation dummy;bonus value
Multivariate regression
Allen and Gadson (1983)
1977-78 NFCS-LI At home, away, total Purchased food only Per household per week
FSP-eligible households (n=3,850)
Dose-response Bonus value Multivariate regression
Chen (1983) 1977-78 NFCS-LI Aided recall of food used in last 7 days
FSP participanthouseholds (n=1,809)
Dose-response Participation dummy;bonus value
Multivariate regression
See notes at end of table. Continued—
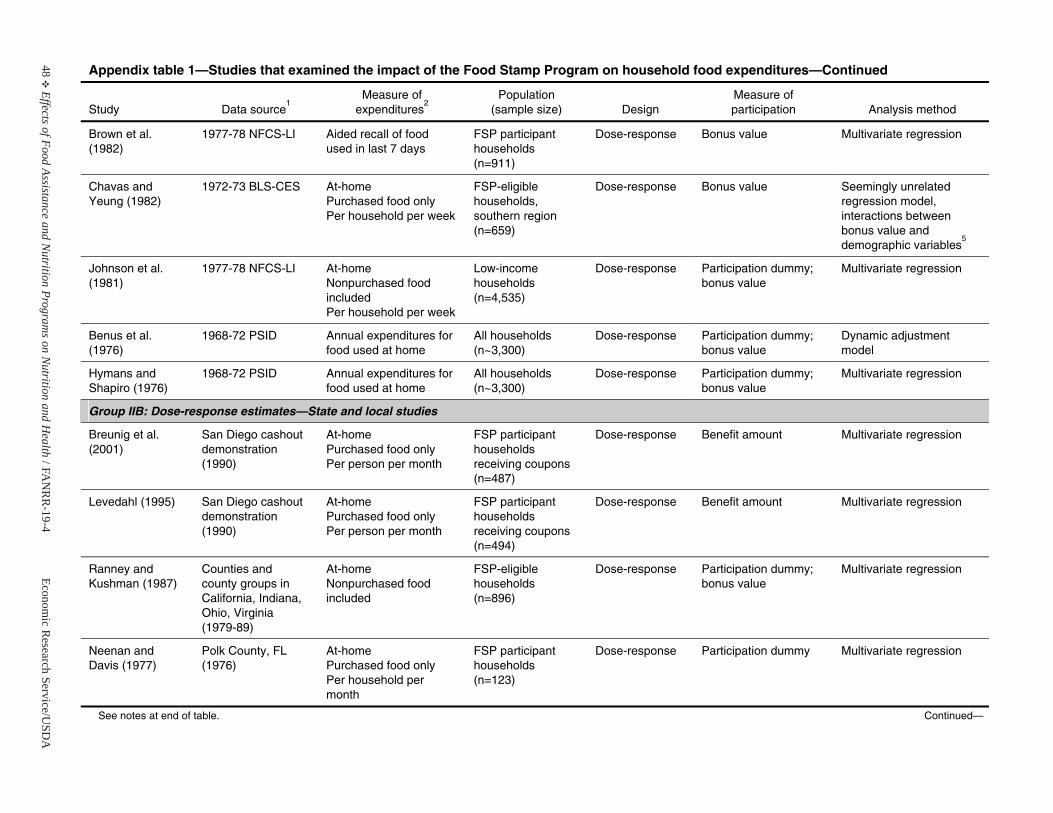
48E
Effects of Food Assistance and Nutrition Program
s on Nutrition and H
ealth / F AN
RR
-19-4Econom
ic Research Service/U
SDA
Appendix table 1—Studies that examined the impact of the Food Stamp Program on household food expenditures—Continued
Study Data source1
Measure of expenditures
2Population
(sample size) Design Measure of participation Analysis method
Brown et al. (1982)
1977-78 NFCS-LI Aided recall of food used in last 7 days
FSP participanthouseholds (n=911)
Dose-response Bonus value Multivariate regression
Chavas and Yeung (1982)
1972-73 BLS-CES At-home Purchased food only Per household per week
FSP-eligible households, southern region(n=659)
Dose-response Bonus value Seemingly unrelatedregression model, interactions between bonus value and demographic variables
5
Johnson et al. (1981)
1977-78 NFCS-LI At-home Nonpurchased food includedPer household per week
Low-income households (n=4,535)
Dose-response Participation dummy; bonus value
Multivariate regression
Benus et al. (1976)
1968-72 PSID Annual expenditures for food used at home
All households (n~3,300)
Dose-response Participation dummy; bonus value
Dynamic adjustment model
Hymans and Shapiro (1976)
1968-72 PSID Annual expenditures for food used at home
All households (n~3,300)
Dose-response Participation dummy; bonus value
Multivariate regression
Group IIB: Dose-response estimates—State and local studies
Breunig et al. (2001)
San Diego cashout demonstration (1990)
At-home Purchased food only Per person per month
FSP participanthouseholds receiving coupons (n=487)
Dose-response Benefit amount Multivariate regression
Levedahl (1995) San Diego cashout demonstration (1990)
At-home Purchased food only Per person per month
FSP participanthouseholds receiving coupons (n=494)
Dose-response Benefit amount Multivariate regression
Ranney and Kushman (1987)
Counties and county groups inCalifornia, Indiana, Ohio, Virginia (1979-89)
At-home Nonpurchased food included
FSP-eligible households (n=896)
Dose-response Participation dummy; bonus value
Multivariate regression
Neenan and Davis (1977)
Polk County, FL (1976)
At-home Purchased food only Per household per month
FSP participanthouseholds (n=123)
Dose-response Participation dummy Multivariate regression
See notes at end of table. Continued—
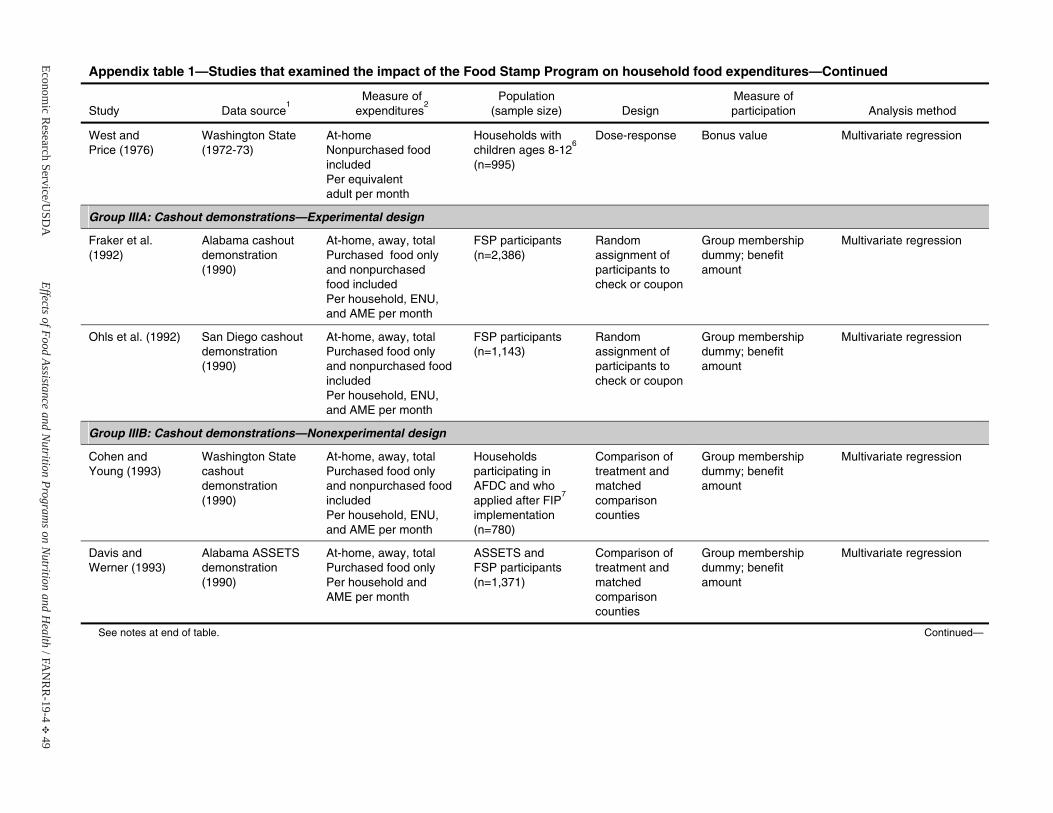
Economic R
esearch Service/USD
AEffects of Food Assistance and N
utrition Programs on N
utrition and Health / F A
NR
R-19-4
E 49
Appendix table 1—Studies that examined the impact of the Food Stamp Program on household food expenditures—Continued
Study Data source1
Measure of expenditures
2Population
(sample size) Design Measure of participation Analysis method
West and Price (1976)
Washington State (1972-73)
At-home Nonpurchased food includedPer equivalent adult per month
Households withchildren ages 8-12
6
(n=995)
Dose-response Bonus value Multivariate regression
Group IIIA: Cashout demonstrations—Experimental design
Fraker et al. (1992)
Alabama cashout demonstration (1990)
At-home, away, total Purchased food only and nonpurchasedfood includedPer household, ENU, and AME per month
FSP participants (n=2,386)
Random assignment of participants to check or coupon
Group membership dummy; benefitamount
Multivariate regression
Ohls et al. (1992) San Diego cashout demonstration (1990)
At-home, away, total Purchased food only and nonpurchased food includedPer household, ENU, and AME per month
FSP participants (n=1,143)
Random assignment of participants to check or coupon
Group membership dummy; benefitamount
Multivariate regression
Group IIIB: Cashout demonstrations—Nonexperimental design
Cohen and Young (1993)
Washington State cashout demonstration (1990)
At-home, away, total Purchased food only and nonpurchased food includedPer household, ENU, and AME per month
Householdsparticipating in AFDC and whoapplied after FIP
7
implementation(n=780)
Comparison of treatment and matched comparison counties
Group membership dummy; benefitamount
Multivariate regression
Davis and Werner (1993)
Alabama ASSETS demonstration (1990)
At-home, away, total Purchased food only Per household and AME per month
ASSETS and FSP participants (n=1,371)
Comparison of treatment and matched comparison counties
Group membership dummy; benefitamount
Multivariate regression
See notes at end of table. Continued—
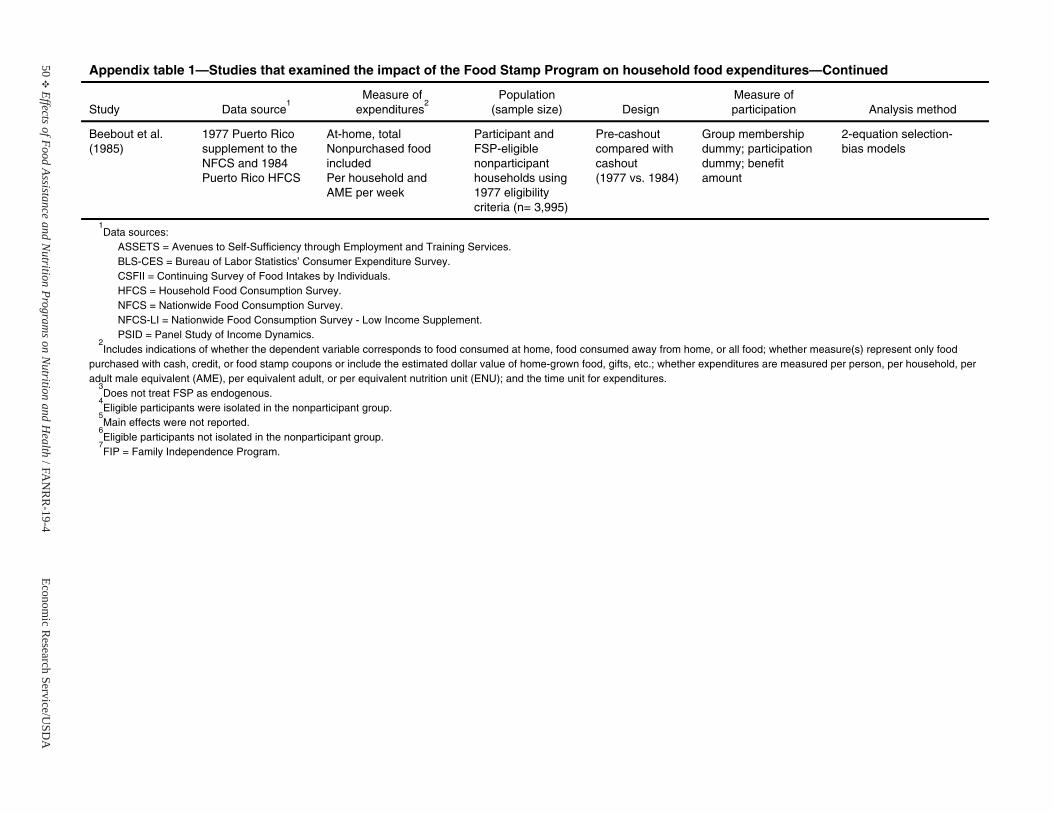
50E
Effects of Food Assistance and Nutrition Program
s on Nutrition and H
ealth / F AN
RR
-19-4Econom
ic Research Service/U
SDA
Appendix table 1—Studies that examined the impact of the Food Stamp Program on household food expenditures—Continued
Study Data source1
Measure of expenditures
2Population
(sample size) Design Measure of participation Analysis method
Beebout et al. (1985)
1977 Puerto Rico supplement to the NFCS and 1984Puerto Rico HFCS
At-home, totalNonpurchased food includedPer household and AME per week
Participant andFSP-eligible nonparticipant households using 1977 eligibility criteria (n= 3,995)
Pre-cashout compared with cashout (1977 vs. 1984)
Group membership dummy; participation dummy; benefitamount
2-equation selection- bias models
1Data sources:
ASSETS = Avenues to Self-Sufficiency through Employment and Training Services. BLS-CES = Bureau of Labor Statistics’ Consumer Expenditure Survey. CSFII = Continuing Survey of Food Intakes by Individuals. HFCS = Household Food Consumption Survey. NFCS = Nationwide Food Consumption Survey. NFCS-LI = Nationwide Food Consumption Survey - Low Income Supplement. PSID = Panel Study of Income Dynamics.
2Includes indications of whether the dependent variable corresponds to food consumed at home, food consumed away from home, or all food; whether measure(s) represent only food
purchased with cash, credit, or food stamp coupons or include the estimated dollar value of home-grown food, gifts, etc.; whether expenditures are measured per person, per household, per adult male equivalent (AME), per equivalent adult, or per equivalent nutrition unit (ENU); and the time unit for expenditures.
3Does not treat FSP as endogenous.
4Eligible participants were isolated in the nonparticipant group.
5Main effects were not reported.
6Eligible participants not isolated in the nonparticipant group.
7FIP = Family Independence Program.
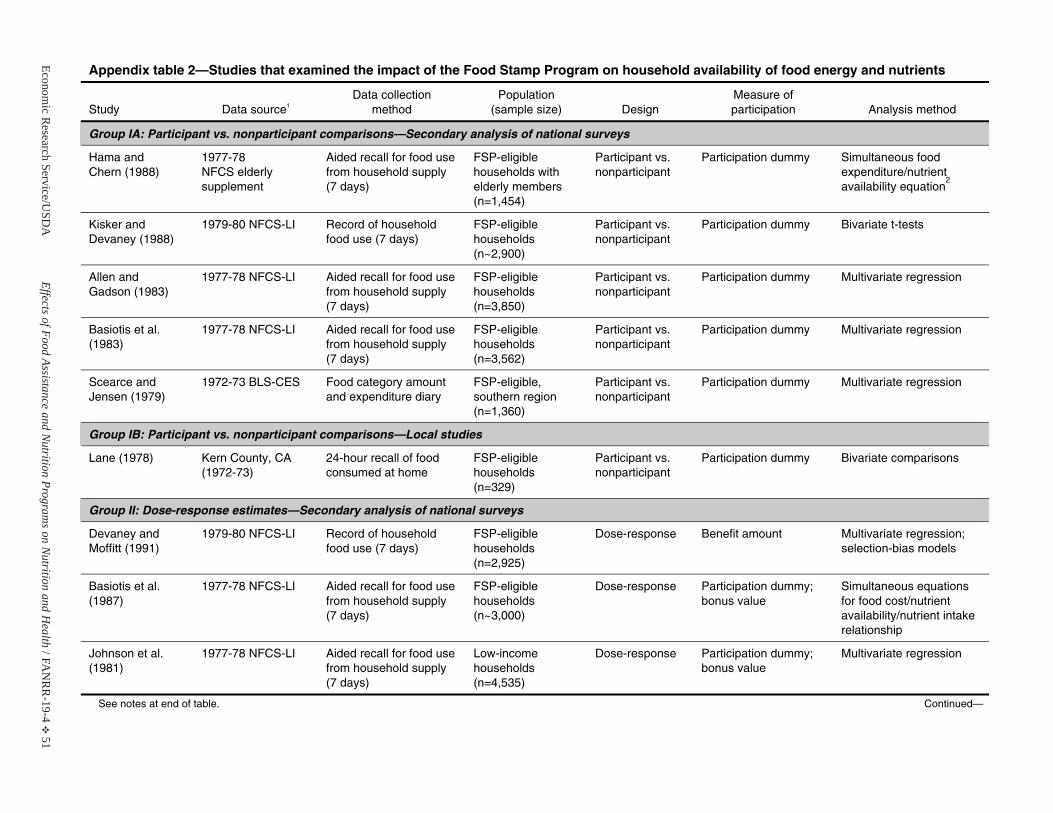
Economic R
esearch Service/USD
AEffects of Food Assistance and N
utrition Programs on N
utrition and Health / F A
NR
R-19-4
E 51
Appendix table 2—Studies that examined the impact of the Food Stamp Program on household availability of food energy and nutrients
Study Data source1
Data collection method
Population(sample size) Design
Measure of participation Analysis method
Group IA: Participant vs. nonparticipant comparisons—Secondary analysis of national surveys
Hama and Chern (1988)
1977-78 NFCS elderlysupplement
Aided recall for food use from household supply (7 days)
FSP-eligible households with elderly members (n=1,454)
Participant vs. nonparticipant
Participation dummy Simultaneous food expenditure/nutrient availability equation
2
Kisker and Devaney (1988)
1979-80 NFCS-LI Record of household food use (7 days)
FSP-eligible households (n~2,900)
Participant vs. nonparticipant
Participation dummy Bivariate t-tests
Allen and Gadson (1983)
1977-78 NFCS-LI Aided recall for food use from household supply (7 days)
FSP-eligible households (n=3,850)
Participant vs. nonparticipant
Participation dummy Multivariate regression
Basiotis et al. (1983)
1977-78 NFCS-LI Aided recall for food use from household supply (7 days)
FSP-eligible households (n=3,562)
Participant vs. nonparticipant
Participation dummy Multivariate regression
Scearce and Jensen (1979)
1972-73 BLS-CES Food category amount and expenditure diary
FSP-eligible, southern region(n=1,360)
Participant vs. nonparticipant
Participation dummy Multivariate regression
Group IB: Participant vs. nonparticipant comparisons—Local studies
Lane (1978) Kern County, CA (1972-73)
24-hour recall of food consumed at home
FSP-eligible households (n=329)
Participant vs. nonparticipant
Participation dummy Bivariate comparisons
Group II: Dose-response estimates—Secondary analysis of national surveys
Devaney and Moffitt (1991)
1979-80 NFCS-LI Record of household food use (7 days)
FSP-eligible households (n=2,925)
Dose-response Benefit amount Multivariate regression; selection-bias models
Basiotis et al. (1987)
1977-78 NFCS-LI Aided recall for food use from household supply (7 days)
FSP-eligible households (n~3,000)
Dose-response Participation dummy;bonus value
Simultaneous equations for food cost/nutrient availability/nutrient intakerelationship
Johnson et al. (1981)
1977-78 NFCS-LI Aided recall for food use from household supply (7 days)
Low-income households (n=4,535)
Dose-response Participation dummy;bonus value
Multivariate regression
See notes at end of table. Continued—
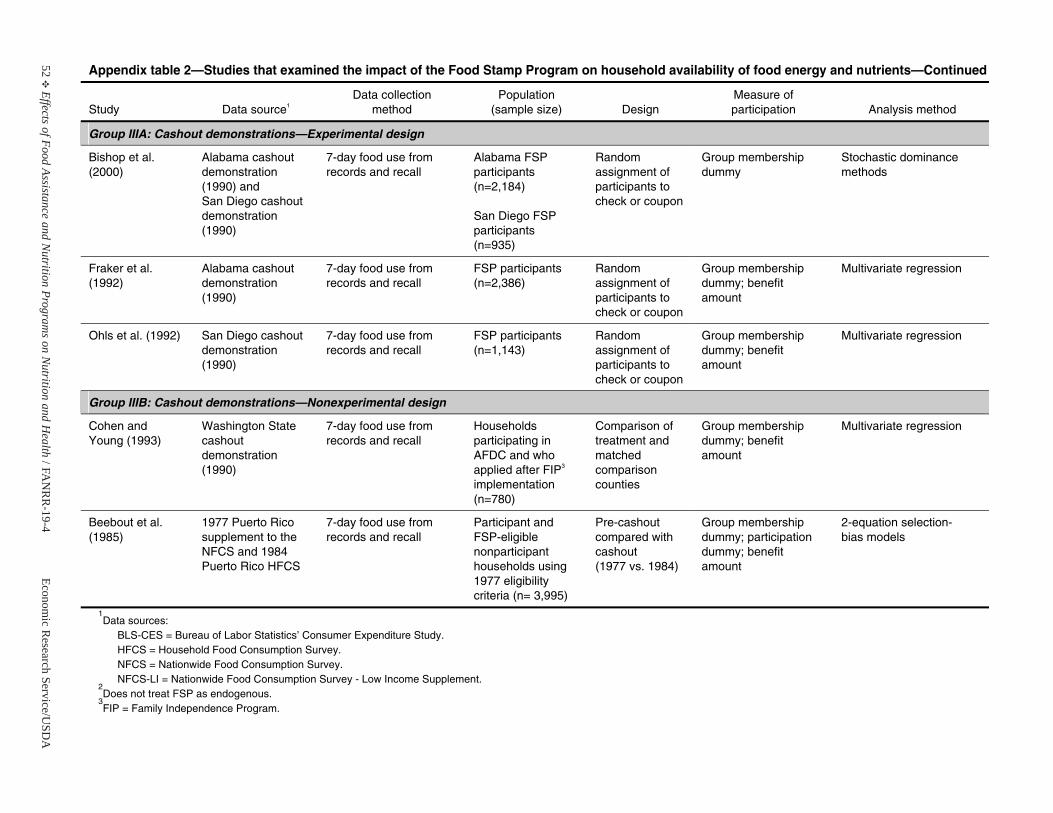
52E
Effects of Food Assistance and Nutrition Program
s on Nutrition and H
ealth / F AN
RR
-19-4Econom
ic Research Service/U
SDA
Appendix table 2—Studies that examined the impact of the Food Stamp Program on household availability of food energy and nutrients—Continued
Study Data source1
Data collection method
Population(sample size) Design
Measure of participation Analysis method
Group IIIA: Cashout demonstrations—Experimental design
Bishop et al. (2000)
Alabama cashout demonstration (1990) and San Diego cashout demonstration (1990)
7-day food use from records and recall
Alabama FSP participants (n=2,184)
San Diego FSP participants (n=935)
Random assignment of participants to check or coupon
Group membership dummy
Stochastic dominance methods
Fraker et al. (1992)
Alabama cashout demonstration (1990)
7-day food use from records and recall
FSP participants (n=2,386)
Random assignment of participants to check or coupon
Group membership dummy; benefitamount
Multivariate regression
Ohls et al. (1992) San Diego cashout demonstration (1990)
7-day food use from records and recall
FSP participants (n=1,143)
Random assignment of participants to check or coupon
Group membership dummy; benefitamount
Multivariate regression
Group IIIB: Cashout demonstrations—Nonexperimental design
Cohen and Young (1993)
Washington State cashout demonstration (1990)
7-day food use from records and recall
Householdsparticipating in AFDC and whoapplied after FIP3
implementation(n=780)
Comparison of treatment and matched comparison counties
Group membership dummy; benefitamount
Multivariate regression
Beebout et al. (1985)
1977 Puerto Rico supplement to the NFCS and 1984Puerto Rico HFCS
7-day food use from records and recall
Participant andFSP-eligible nonparticipant households using 1977 eligibility criteria (n= 3,995)
Pre-cashout compared with cashout (1977 vs. 1984)
Group membership dummy; participation dummy; benefitamount
2-equation selection- bias models
1Data sources:
BLS-CES = Bureau of Labor Statistics’ Consumer Expenditure Study. HFCS = Household Food Consumption Survey. NFCS = Nationwide Food Consumption Survey. NFCS-LI = Nationwide Food Consumption Survey - Low Income Supplement.
2Does not treat FSP as endogenous.
3FIP = Family Independence Program.
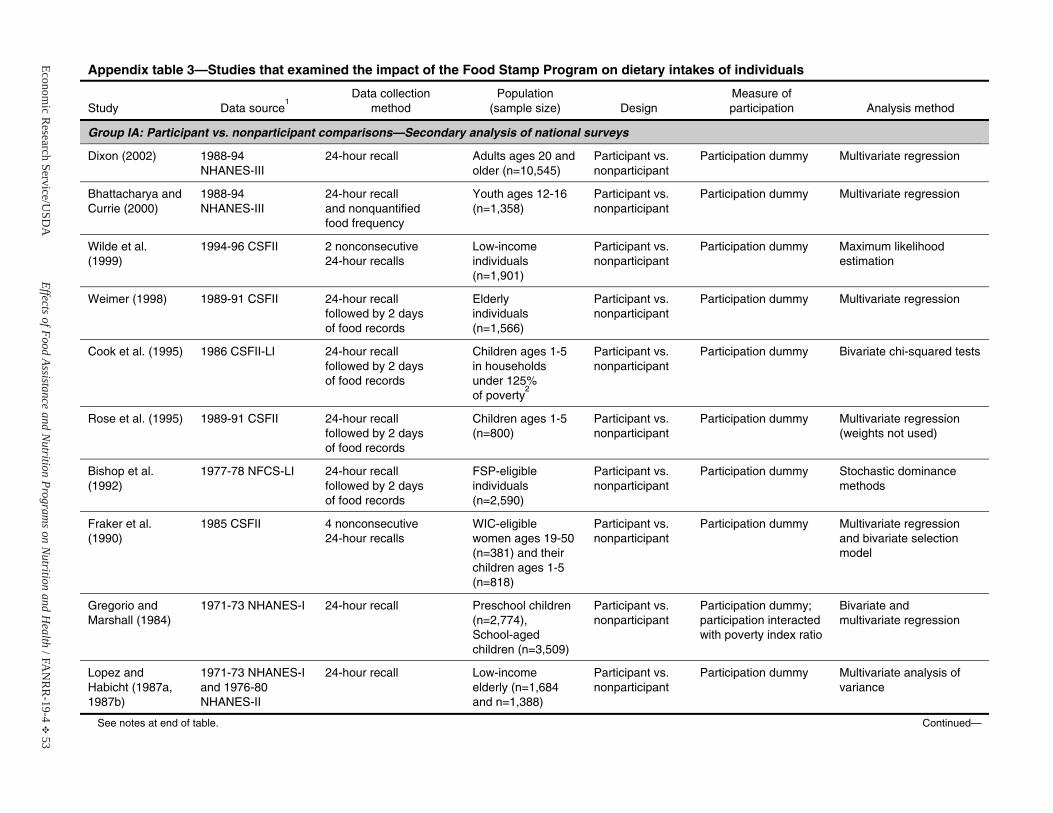
Economic R
esearch Service/USD
AEffects of Food Assistance and N
utrition Programs on N
utrition and Health / F A
NR
R-19-4
E 53
Appendix table 3—Studies that examined the impact of the Food Stamp Program on dietary intakes of individuals
Study Data source1
Data collection method
Population(sample size) Design
Measure of participation Analysis method
Group IA: Participant vs. nonparticipant comparisons—Secondary analysis of national surveys
Dixon (2002) 1988-94 NHANES-III
24-hour recall Adults ages 20 and older (n=10,545)
Participant vs. nonparticipant
Participation dummy Multivariate regression
Bhattacharya and Currie (2000)
1988-94 NHANES-III
24-hour recall and nonquantified food frequency
Youth ages 12-16 (n=1,358)
Participant vs. nonparticipant
Participation dummy Multivariate regression
Wilde et al. (1999)
1994-96 CSFII 2 nonconsecutive 24-hour recalls
Low-income individuals (n=1,901)
Participant vs. nonparticipant
Participation dummy Maximum likelihood estimation
Weimer (1998) 1989-91 CSFII 24-hour recall followed by 2 days of food records
Elderly individuals (n=1,566)
Participant vs. nonparticipant
Participation dummy Multivariate regression
Cook et al. (1995) 1986 CSFII-LI 24-hour recall followed by 2 days of food records
Children ages 1-5 in households under 125% of poverty
2
Participant vs. nonparticipant
Participation dummy Bivariate chi-squared tests
Rose et al. (1995) 1989-91 CSFII 24-hour recall followed by 2 days of food records
Children ages 1-5 (n=800)
Participant vs. nonparticipant
Participation dummy Multivariate regression(weights not used)
Bishop et al. (1992)
1977-78 NFCS-LI 24-hour recall followed by 2 days of food records
FSP-eligible individuals (n=2,590)
Participant vs. nonparticipant
Participation dummy Stochastic dominance methods
Fraker et al. (1990)
1985 CSFII 4 nonconsecutive 24-hour recalls
WIC-eligible women ages 19-50 (n=381) and their children ages 1-5 (n=818)
Participant vs. nonparticipant
Participation dummy Multivariate regressionand bivariate selection model
Gregorio and Marshall (1984)
1971-73 NHANES-I 24-hour recall Preschool children(n=2,774), School-aged children (n=3,509)
Participant vs. nonparticipant
Participation dummy; participation interacted with poverty index ratio
Bivariate and multivariate regression
Lopez and Habicht (1987a, 1987b)
1971-73 NHANES-I and 1976-80 NHANES-II
24-hour recall Low-income elderly (n=1,684and n=1,388)
Participant vs. nonparticipant
Participation dummy Multivariate analysis of variance
See notes at end of table. Continued—
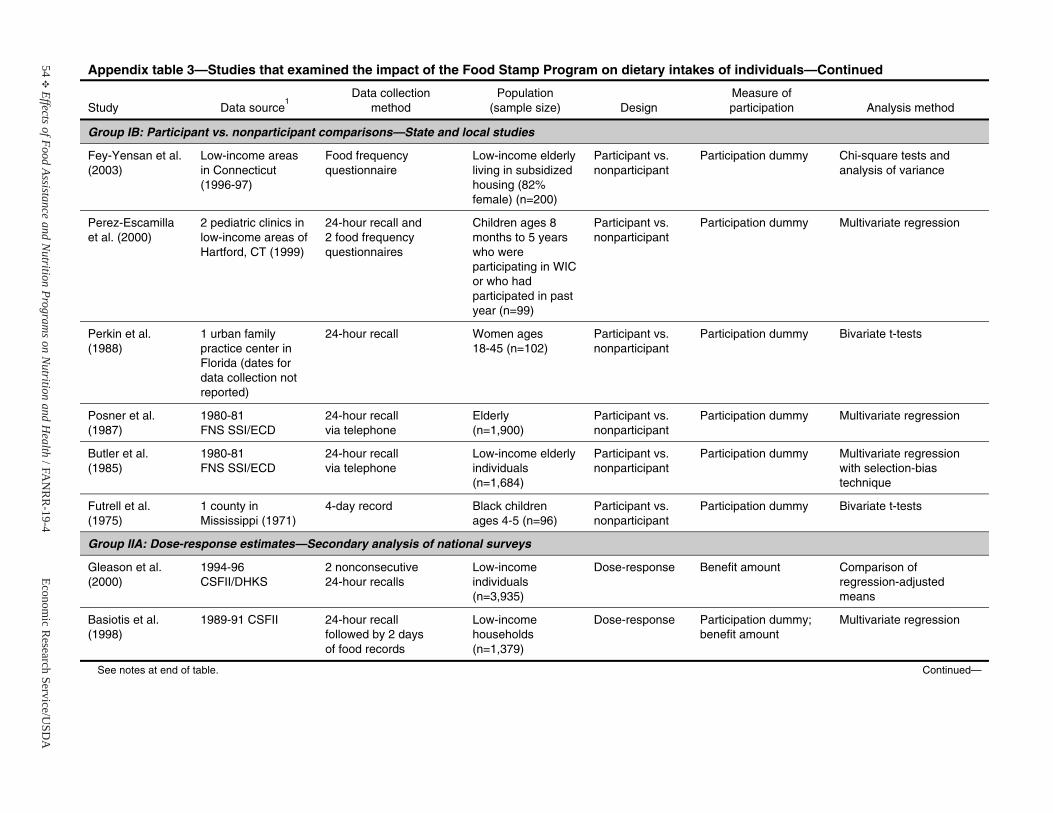
54E
Effects of Food Assistance and Nutrition Program
s on Nutrition and H
ealth / F AN
RR
-19-4Econom
ic Research Service/U
SDA
Appendix table 3—Studies that examined the impact of the Food Stamp Program on dietary intakes of individuals—Continued
Study Data source1
Data collection method
Population(sample size) Design
Measure of participation Analysis method
Group IB: Participant vs. nonparticipant comparisons—State and local studies
Fey-Yensan et al. (2003)
Low-income areas in Connecticut (1996-97)
Food frequency questionnaire
Low-income elderly living in subsidized housing (82% female) (n=200)
Participant vs. nonparticipant
Participation dummy Chi-square tests and analysis of variance
Perez-Escamilla et al. (2000)
2 pediatric clinics in low-income areas of Hartford, CT (1999)
24-hour recall and 2 food frequency questionnaires
Children ages 8 months to 5 years who were participating in WIC or who had participated in past year (n=99)
Participant vs. nonparticipant
Participation dummy Multivariate regression
Perkin et al. (1988)
1 urban family practice center in Florida (dates for data collection not reported)
24-hour recall Women ages 18-45 (n=102)
Participant vs. nonparticipant
Participation dummy Bivariate t-tests
Posner et al. (1987)
1980-81 FNS SSI/ECD
24-hour recall via telephone
Elderly (n=1,900)
Participant vs. nonparticipant
Participation dummy Multivariate regression
Butler et al. (1985)
1980-81 FNS SSI/ECD
24-hour recall via telephone
Low-income elderly individuals (n=1,684)
Participant vs. nonparticipant
Participation dummy Multivariate regressionwith selection-bias technique
Futrell et al. (1975)
1 county in Mississippi (1971)
4-day record Black childrenages 4-5 (n=96)
Participant vs. nonparticipant
Participation dummy Bivariate t-tests
Group IIA: Dose-response estimates—Secondary analysis of national surveys
Gleason et al. (2000)
1994-96 CSFII/DHKS
2 nonconsecutive 24-hour recalls
Low-income individuals (n=3,935)
Dose-response Benefit amount Comparison of regression-adjustedmeans
Basiotis et al. (1998)
1989-91 CSFII 24-hour recall followed by 2 days of food records
Low-income households (n=1,379)
Dose-response Participation dummy;benefit amount
Multivariate regression
See notes at end of table. Continued—
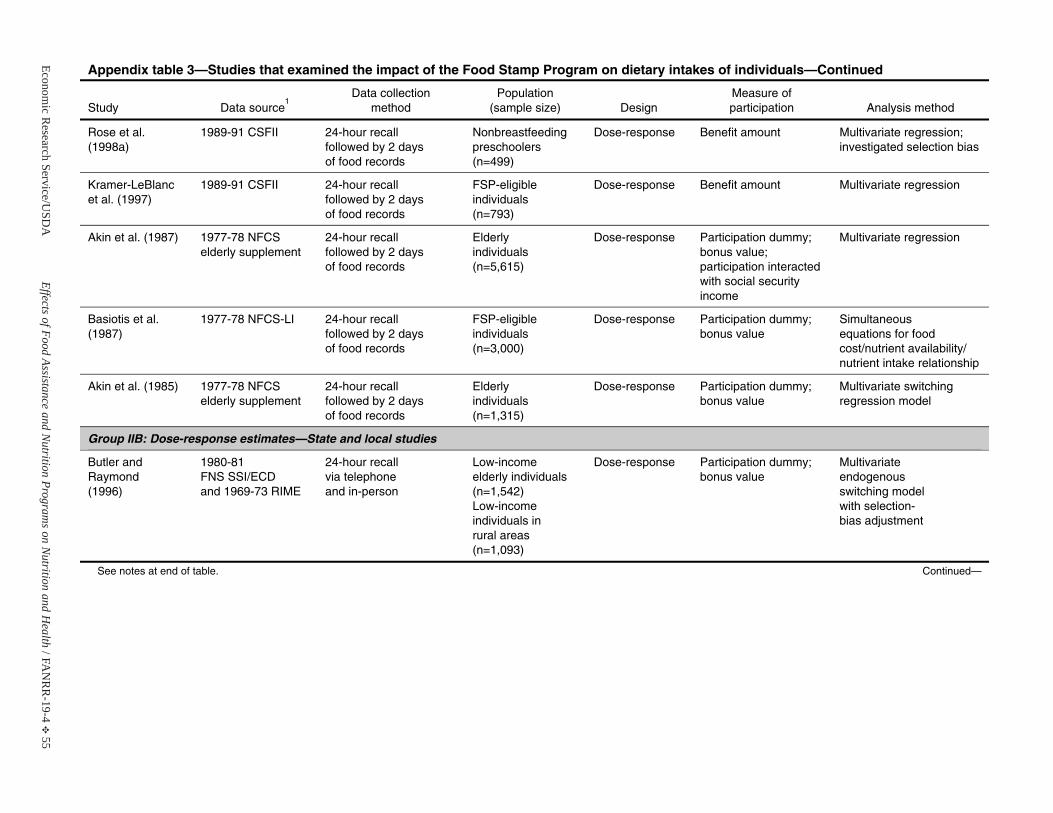
Economic R
esearch Service/USD
AEffects of Food Assistance and N
utrition Programs on N
utrition and Health / F A
NR
R-19-4
E 55
Appendix table 3—Studies that examined the impact of the Food Stamp Program on dietary intakes of individuals—Continued
Study Data source1
Data collection method
Population(sample size) Design
Measure of participation Analysis method
Rose et al. (1998a)
1989-91 CSFII 24-hour recall followed by 2 days of food records
Nonbreastfeeding preschoolers (n=499)
Dose-response Benefit amount Multivariate regression; investigated selection bias
Kramer-LeBlancet al. (1997)
1989-91 CSFII 24-hour recall followed by 2 days of food records
FSP-eligible individuals (n=793)
Dose-response Benefit amount Multivariate regression
Akin et al. (1987) 1977-78 NFCSelderly supplement
24-hour recall followed by 2 days of food records
Elderly individuals (n=5,615)
Dose-response Participation dummy;bonus value; participation interacted with social security income
Multivariate regression
Basiotis et al.(1987)
1977-78 NFCS-LI 24-hour recall followed by 2 days of food records
FSP-eligible individuals (n=3,000)
Dose-response Participation dummy;bonus value
Simultaneous equations for food cost/nutrient availability/ nutrient intake relationship
Akin et al. (1985) 1977-78 NFCSelderly supplement
24-hour recall followed by 2 days of food records
Elderly individuals (n=1,315)
Dose-response Participation dummy;bonus value
Multivariate switching regression model
Group IIB: Dose-response estimates—State and local studies
Butler and Raymond (1996)
1980-81 FNS SSI/ECD and 1969-73 RIME
24-hour recall via telephone and in-person
Low-income elderly individuals(n=1,542) Low-income individuals inrural areas (n=1,093)
Dose-response Participation dummy; bonus value
Multivariate endogenousswitching model with selection-bias adjustment
See notes at end of table. Continued—
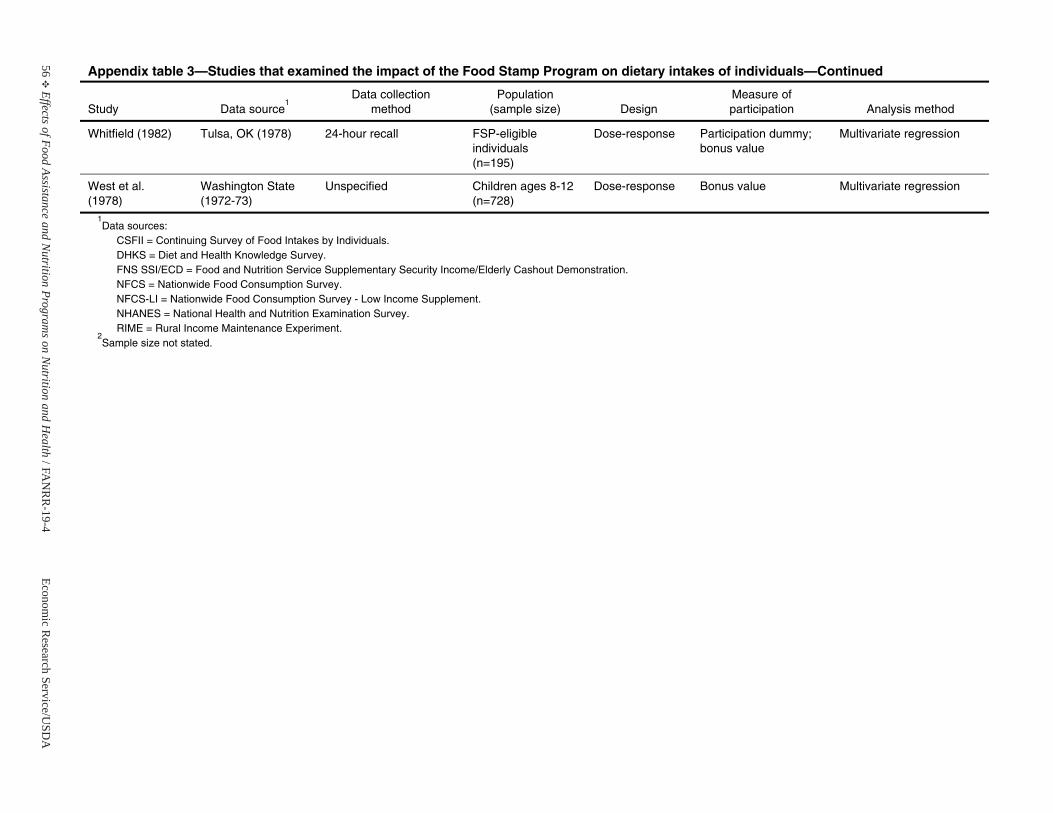
56E
Effects of Food Assistance and Nutrition Program
s on Nutrition and H
ealth / F AN
RR
-19-4Econom
ic Research Service/U
SDA
Appendix table 3—Studies that examined the impact of the Food Stamp Program on dietary intakes of individuals—Continued
Study Data source1
Data collection method
Population(sample size) Design
Measure of participation Analysis method
Whitfield (1982) Tulsa, OK (1978) 24-hour recall FSP-eligible individuals (n=195)
Dose-response Participation dummy; bonus value
Multivariate regression
West et al. (1978)
Washington State (1972-73)
Unspecified Children ages 8-12 (n=728)
Dose-response Bonus value Multivariate regression
1Data sources:
CSFII = Continuing Survey of Food Intakes by Individuals. DHKS = Diet and Health Knowledge Survey. FNS SSI/ECD = Food and Nutrition Service Supplementary Security Income/Elderly Cashout Demonstration. NFCS = Nationwide Food Consumption Survey. NFCS-LI = Nationwide Food Consumption Survey - Low Income Supplement. NHANES = National Health and Nutrition Examination Survey. RIME = Rural Income Maintenance Experiment.
2Sample size not stated.
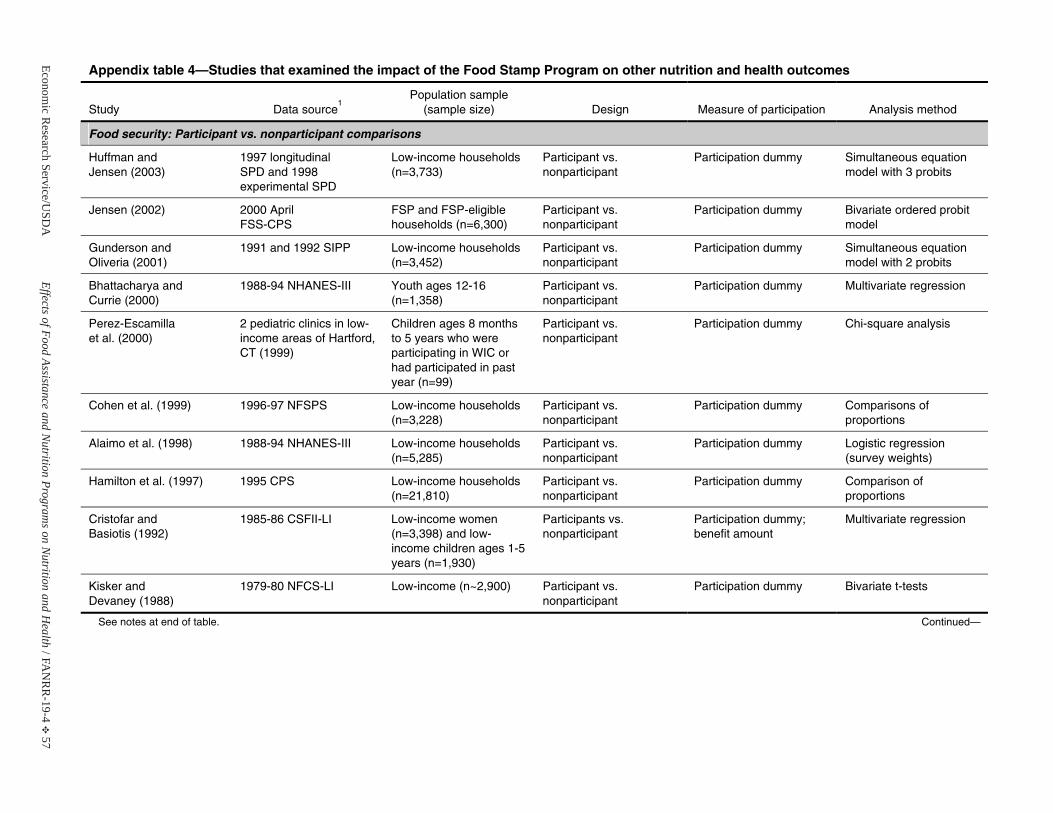
Economic R
esearch Service/USD
AEffects of Food Assistance and N
utrition Programs on N
utrition and Health / F A
NR
R-19-4
E 57
Appendix table 4—Studies that examined the impact of the Food Stamp Program on other nutrition and health outcomes
Study Data source1
Population sample (sample size) Design Measure of participation Analysis method
Food security: Participant vs. nonparticipant comparisons
Huffman and Jensen (2003)
1997 longitudinalSPD and 1998experimental SPD
Low-income households (n=3,733)
Participant vs. nonparticipant
Participation dummy Simultaneous equation model with 3 probits
Jensen (2002) 2000 April FSS-CPS
FSP and FSP-eligiblehouseholds (n=6,300)
Participant vs. nonparticipant
Participation dummy Bivariate ordered probit model
Gunderson and Oliveria (2001)
1991 and 1992 SIPP Low-income households (n=3,452)
Participant vs. nonparticipant
Participation dummy Simultaneous equation model with 2 probits
Bhattacharya and Currie (2000)
1988-94 NHANES-III Youth ages 12-16 (n=1,358)
Participant vs. nonparticipant
Participation dummy Multivariate regression
Perez-Escamilla et al. (2000)
2 pediatric clinics in low-income areas of Hartford, CT (1999)
Children ages 8 months to 5 years who were participating in WIC or had participated in past year (n=99)
Participant vs. nonparticipant
Participation dummy Chi-square analysis
Cohen et al. (1999) 1996-97 NFSPS Low-income households (n=3,228)
Participant vs. nonparticipant
Participation dummy Comparisons ofproportions
Alaimo et al. (1998) 1988-94 NHANES-III Low-income households(n=5,285)
Participant vs. nonparticipant
Participation dummy Logistic regression (survey weights)
Hamilton et al. (1997) 1995 CPS Low-income households (n=21,810)
Participant vs. nonparticipant
Participation dummy Comparison of proportions
Cristofar and Basiotis (1992)
1985-86 CSFII-LI Low-income women (n=3,398) and low-income children ages 1-5 years (n=1,930)
Participants vs. nonparticipant
Participation dummy; benefit amount
Multivariate regression
Kisker and Devaney (1988)
1979-80 NFCS-LI Low-income (n~2,900) Participant vs. nonparticipant
Participation dummy Bivariate t-tests
See notes at end of table. Continued—
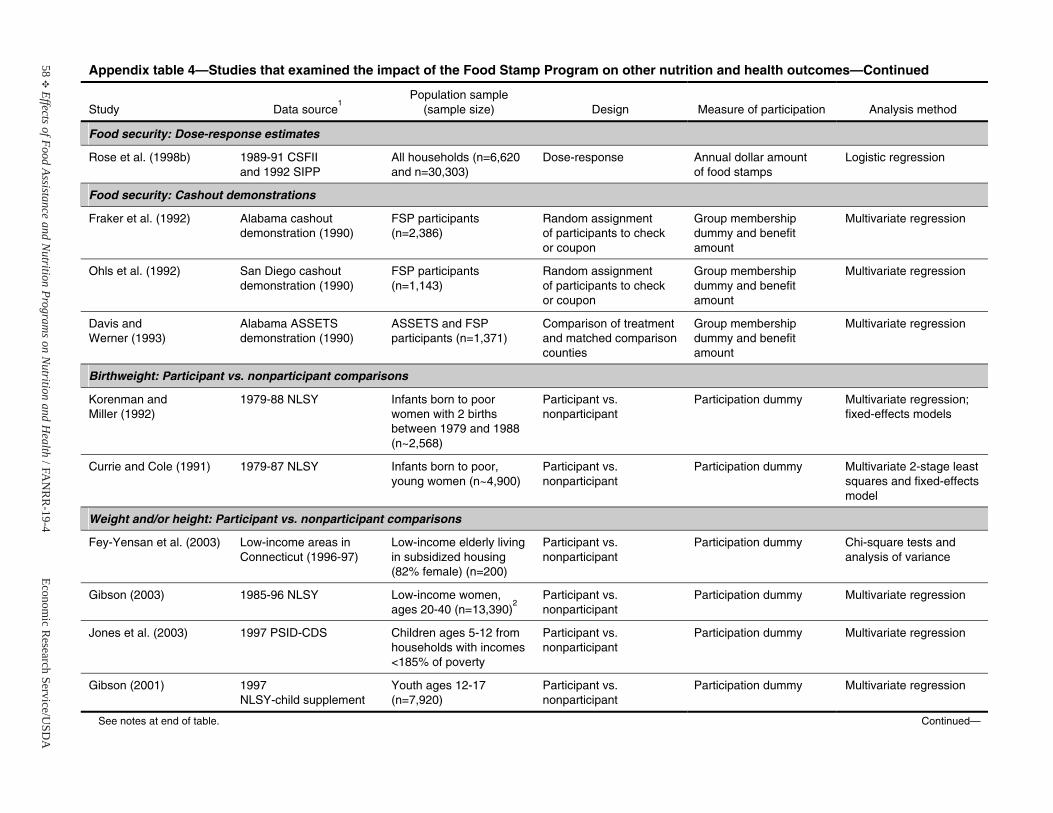
58E
Effects of Food Assistance and Nutrition Program
s on Nutrition and H
ealth / F AN
RR
-19-4Econom
ic Research Service/U
SDA
Appendix table 4—Studies that examined the impact of the Food Stamp Program on other nutrition and health outcomes—Continued
Study Data source1
Population sample (sample size) Design Measure of participation Analysis method
Food security: Dose-response estimates
Rose et al. (1998b) 1989-91 CSFII and 1992 SIPP
All households (n=6,620 and n=30,303)
Dose-response Annual dollar amountof food stamps
Logistic regression
Food security: Cashout demonstrations
Fraker et al. (1992) Alabama cashout demonstration (1990)
FSP participants (n=2,386)
Random assignment of participants to check or coupon
Group membership dummy and benefit amount
Multivariate regression
Ohls et al. (1992) San Diego cashout demonstration (1990)
FSP participants (n=1,143)
Random assignment of participants to check or coupon
Group membership dummy and benefit amount
Multivariate regression
Davis and Werner (1993)
Alabama ASSETS demonstration (1990)
ASSETS and FSP participants (n=1,371)
Comparison of treatment and matched comparison counties
Group membership dummy and benefit amount
Multivariate regression
Birthweight: Participant vs. nonparticipant comparisons
Korenman andMiller (1992)
1979-88 NLSY Infants born to poor women with 2 births between 1979 and 1988 (n~2,568)
Participant vs. nonparticipant
Participation dummy Multivariate regression; fixed-effects models
Currie and Cole (1991) 1979-87 NLSY Infants born to poor, young women (n~4,900)
Participant vs. nonparticipant
Participation dummy Multivariate 2-stage least squares and fixed-effects model
Weight and/or height: Participant vs. nonparticipant comparisons
Fey-Yensan et al. (2003) Low-income areas in Connecticut (1996-97)
Low-income elderly living in subsidized housing (82% female) (n=200)
Participant vs. nonparticipant
Participation dummy Chi-square tests and analysis of variance
Gibson (2003) 1985-96 NLSY Low-income women, ages 20-40 (n=13,390)
2Participant vs. nonparticipant
Participation dummy Multivariate regression
Jones et al. (2003) 1997 PSID-CDS Children ages 5-12 from households with incomes <185% of poverty
Participant vs. nonparticipant
Participation dummy Multivariate regression
Gibson (2001) 1997 NLSY-child supplement
Youth ages 12-17 (n=7,920)
Participant vs. nonparticipant
Participation dummy Multivariate regression
See notes at end of table. Continued—
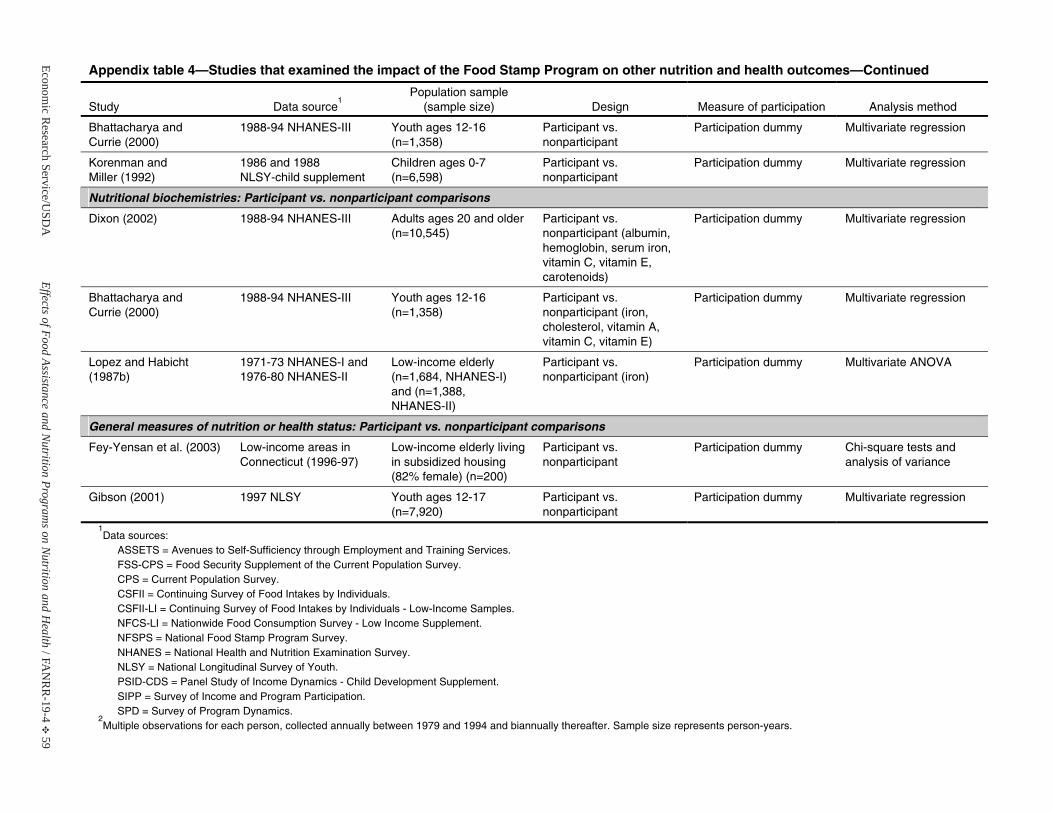
Economic R
esearch Service/USD
AEffects of Food Assistance and N
utrition Programs on N
utrition and Health / F A
NR
R-19-4
E 59
Appendix table 4—Studies that examined the impact of the Food Stamp Program on other nutrition and health outcomes—Continued
Study Data source1
Population sample (sample size) Design Measure of participation Analysis method
Bhattacharya and Currie (2000)
1988-94 NHANES-III Youth ages 12-16 (n=1,358)
Participant vs. nonparticipant
Participation dummy Multivariate regression
Korenman andMiller (1992)
1986 and 1988NLSY-child supplement
Children ages 0-7 (n=6,598)
Participant vs. nonparticipant
Participation dummy Multivariate regression
Nutritional biochemistries: Participant vs. nonparticipant comparisons
Dixon (2002) 1988-94 NHANES-III Adults ages 20 and older (n=10,545)
Participant vs. nonparticipant (albumin, hemoglobin, serum iron, vitamin C, vitamin E, carotenoids)
Participation dummy Multivariate regression
Bhattacharya and Currie (2000)
1988-94 NHANES-III Youth ages 12-16 (n=1,358)
Participant vs. nonparticipant (iron, cholesterol, vitamin A, vitamin C, vitamin E)
Participation dummy Multivariate regression
Lopez and Habicht(1987b)
1971-73 NHANES-I and 1976-80 NHANES-II
Low-income elderly (n=1,684, NHANES-I) and (n=1,388, NHANES-II)
Participant vs. nonparticipant (iron)
Participation dummy Multivariate ANOVA
General measures of nutrition or health status: Participant vs. nonparticipant comparisons
Fey-Yensan et al. (2003) Low-income areas in Connecticut (1996-97)
Low-income elderly living in subsidized housing (82% female) (n=200)
Participant vs. nonparticipant
Participation dummy Chi-square tests and analysis of variance
Gibson (2001) 1997 NLSY Youth ages 12-17 (n=7,920)
Participant vs. nonparticipant
Participation dummy Multivariate regression
1Data sources:
ASSETS = Avenues to Self-Sufficiency through Employment and Training Services. FSS-CPS = Food Security Supplement of the Current Population Survey. CPS = Current Population Survey. CSFII = Continuing Survey of Food Intakes by Individuals. CSFII-LI = Continuing Survey of Food Intakes by Individuals - Low-Income Samples. NFCS-LI = Nationwide Food Consumption Survey - Low Income Supplement. NFSPS = National Food Stamp Program Survey. NHANES = National Health and Nutrition Examination Survey. NLSY = National Longitudinal Survey of Youth. PSID-CDS = Panel Study of Income Dynamics - Child Development Supplement. SIPP = Survey of Income and Program Participation. SPD = Survey of Program Dynamics.
2Multiple observations for each person, collected annually between 1979 and 1994 and biannually thereafter. Sample size represents person-years.

Economic Research Service/USDA Effects of Food Assistance and Nutrition Programs on Nutrition and Health / FANRR-19-4 E 61
WIC Program
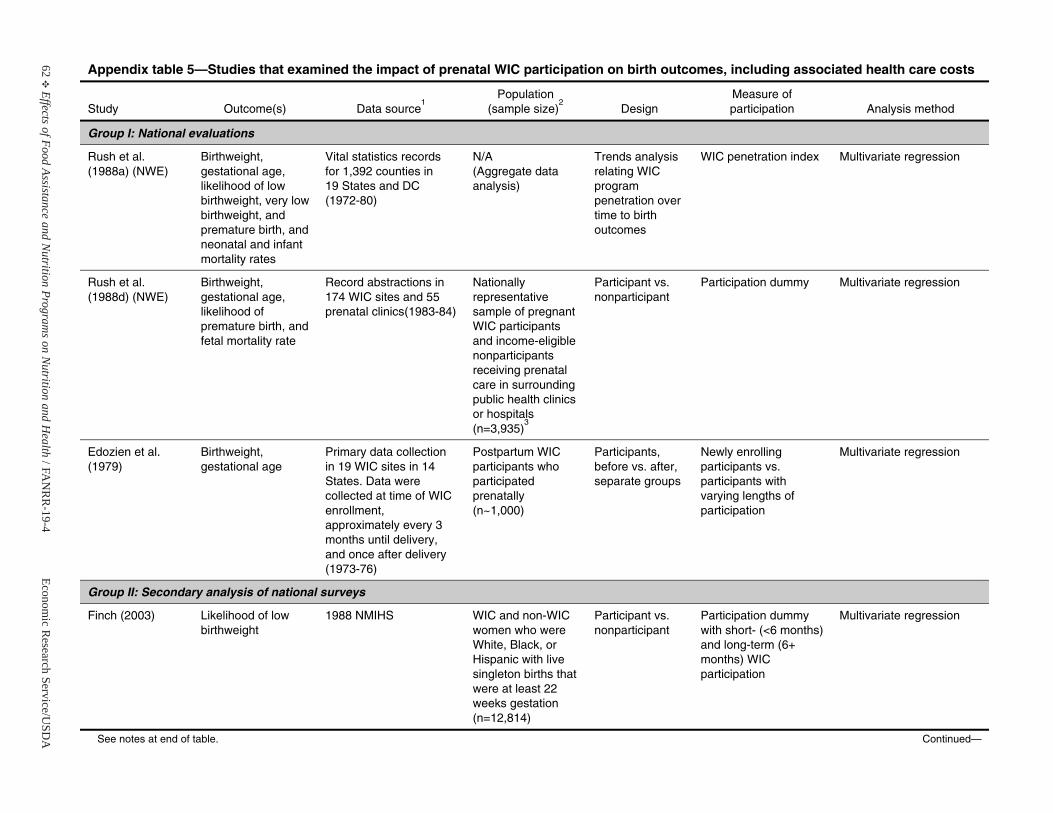
62E
Effects of Food Assistance and Nutrition Program
s on Nutrition and H
ealth / F AN
RR
-19-4Econom
ic Research Service/U
SDA
Appendix table 5—Studies that examined the impact of prenatal WIC participation on birth outcomes, including associated health care costs
Study Outcome(s) Data source1
Population(sample size)
2Design
Measure of participation Analysis method
Group I: National evaluations
Rush et al. (1988a) (NWE)
Birthweight, gestational age,likelihood of low birthweight, very low birthweight, and premature birth, and neonatal and infant mortality rates
Vital statistics records for 1,392 counties in 19 States and DC (1972-80)
N/A (Aggregate data analysis)
Trends analysis relating WIC program penetration over time to birth outcomes
WIC penetration index Multivariate regression
Rush et al. (1988d) (NWE)
Birthweight, gestational age,likelihood of premature birth, and fetal mortality rate
Record abstractions in 174 WIC sites and 55prenatal clinics(1983-84)
Nationally representative sample of pregnant WIC participants and income-eligible nonparticipantsreceiving prenatal care in surrounding public health clinics or hospitals (n=3,935)
3
Participant vs. nonparticipant
Participation dummy Multivariate regression
Edozien et al. (1979)
Birthweight, gestational age
Primary data collection in 19 WIC sites in 14 States. Data were collected at time of WIC enrollment, approximately every 3 months until delivery, and once after delivery (1973-76)
Postpartum WIC participants who participated prenatally (n~1,000)
Participants, before vs. after, separate groups
Newly enrollingparticipants vs. participants with varying lengths of participation
Multivariate regression
Group II: Secondary analysis of national surveys
Finch (2003) Likelihood of low birthweight
1988 NMIHS WIC and non-WIC women who were White, Black, or Hispanic with live singleton births that were at least 22 weeks gestation (n=12,814)
Participant vs. nonparticipant
Participation dummy with short- (<6 months) and long-term (6+months) WIC participation
Multivariate regression
See notes at end of table. Continued—
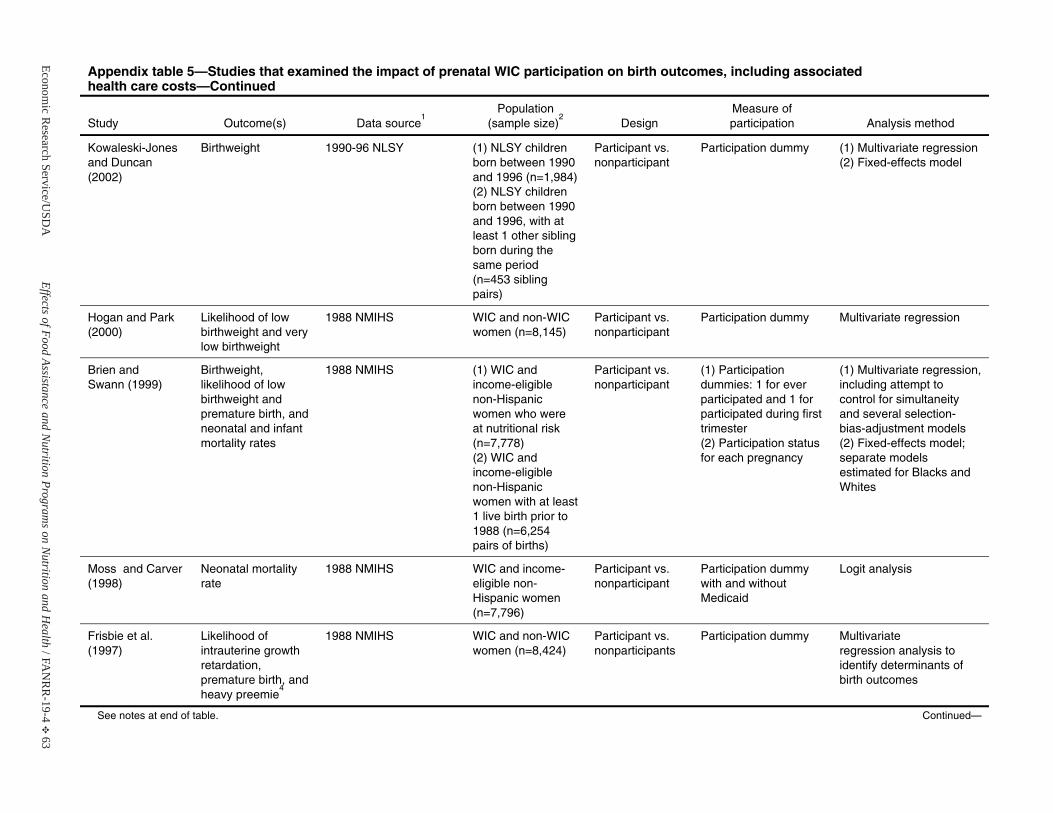
Economic R
esearch Service/USD
AEffects of Food Assistance and N
utrition Programs on N
utrition and Health / F A
NR
R-19-4
E 63
Appendix table 5—Studies that examined the impact of prenatal WIC participation on birth outcomes, including associated health care costs—Continued
Study Outcome(s) Data source1
Population(sample size)
2Design
Measure of participation Analysis method
Kowaleski-Jones and Duncan (2002)
Birthweight 1990-96 NLSY (1) NLSY children born between 1990 and 1996 (n=1,984)(2) NLSY children born between 1990 and 1996, with at least 1 other sibling born during the same period (n=453 sibling pairs)
Participant vs. nonparticipant
Participation dummy (1) Multivariate regression(2) Fixed-effects model
Hogan and Park(2000)
Likelihood of low birthweight and very low birthweight
1988 NMIHS WIC and non-WIC women (n=8,145)
Participant vs. nonparticipant
Participation dummy Multivariate regression
Brien and Swann (1999)
Birthweight, likelihood of low birthweight andpremature birth, and neonatal and infant mortality rates
1988 NMIHS (1) WIC and income-eligiblenon-Hispanic women who were at nutritional risk(n=7,778) (2) WIC and income-eligiblenon-Hispanic women with at least 1 live birth prior to 1988 (n=6,254 pairs of births)
Participant vs. nonparticipant
(1) Participation dummies: 1 for ever participated and 1 for participated during first trimester (2) Participation status for each pregnancy
(1) Multivariate regression, including attempt to control for simultaneity and several selection-bias-adjustment models (2) Fixed-effects model; separate models estimated for Blacks and Whites
Moss and Carver (1998)
Neonatal mortality rate
1988 NMIHS WIC and income-eligible non-Hispanic women (n=7,796)
Participant vs. nonparticipant
Participation dummy with and without Medicaid
Logit analysis
Frisbie et al. (1997)
Likelihood of intrauterine growth retardation, premature birth, and heavy preemie
4
1988 NMIHS WIC and non-WIC women (n=8,424)
Participant vs. nonparticipants
Participation dummy Multivariate regression analysis to identify determinants of birth outcomes
See notes at end of table. Continued—
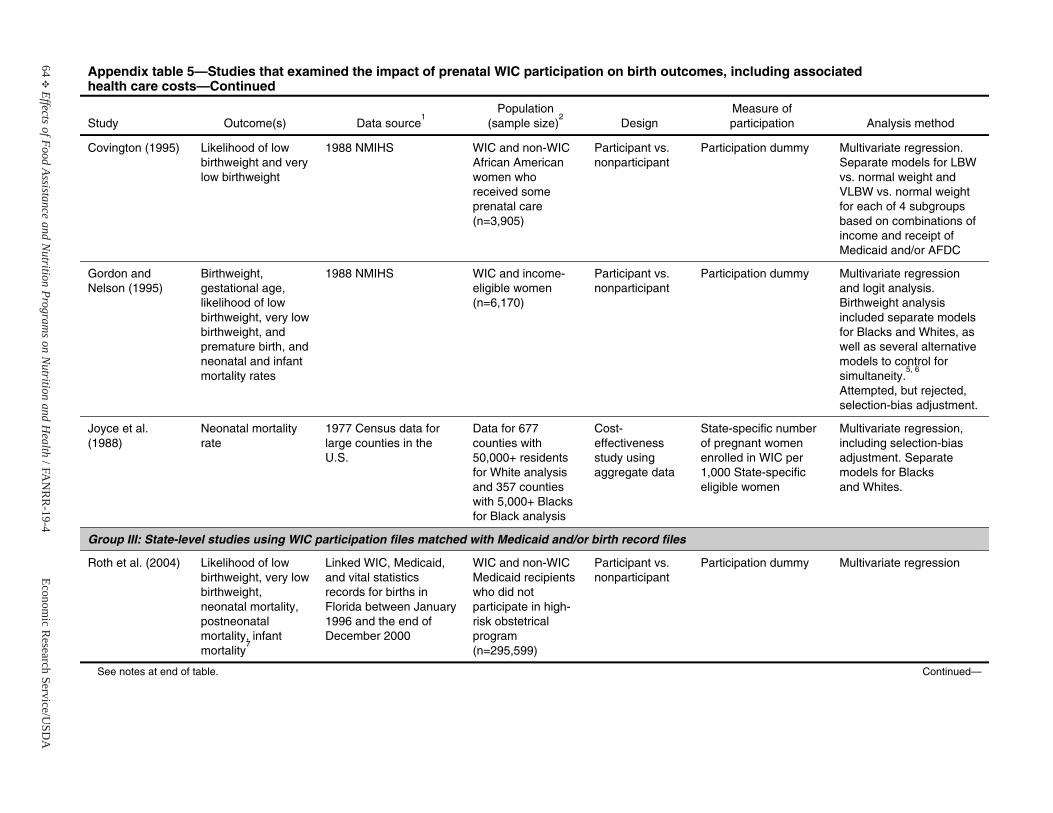
64E
Effects of Food Assistance and Nutrition Program
s on Nutrition and H
ealth / F AN
RR
-19-4Econom
ic Research Service/U
SDA
Appendix table 5—Studies that examined the impact of prenatal WIC participation on birth outcomes, including associated health care costs—Continued
Study Outcome(s) Data source1
Population(sample size)
2Design
Measure of participation Analysis method
Covington (1995) Likelihood of low birthweight and very low birthweight
1988 NMIHS WIC and non-WIC African American women who received some prenatal care (n=3,905)
Participant vs. nonparticipant
Participation dummy Multivariate regression. Separate models for LBWvs. normal weight and VLBW vs. normal weight for each of 4 subgroups based on combinations of income and receipt of Medicaid and/or AFDC
Gordon and Nelson (1995)
Birthweight, gestational age,likelihood of low birthweight, very low birthweight, and premature birth, and neonatal and infant mortality rates
1988 NMIHS WIC and income- eligible women(n=6,170)
Participant vs. nonparticipant
Participation dummy Multivariate regressionand logit analysis. Birthweight analysis included separate models for Blacks and Whites, as well as several alternative models to control for simultaneity.
5, 6
Attempted, but rejected, selection-bias adjustment.
Joyce et al. (1988)
Neonatal mortality rate
1977 Census data for large counties in the U.S.
Data for 677 counties with 50,000+ residents for White analysis and 357 counties with 5,000+ Blacks for Black analysis
Cost-effectiveness study using aggregate data
State-specific number of pregnant women enrolled in WIC per 1,000 State-specific eligible women
Multivariate regression, including selection-bias adjustment. Separate models for Blacks and Whites.
Group III: State-level studies using WIC participation files matched with Medicaid and/or birth record files
Roth et al. (2004) Likelihood of low birthweight, very low birthweight, neonatal mortality, postneonatal mortality, infantmortality
7
Linked WIC, Medicaid, and vital statistics records for births in Florida between January 1996 and the end of December 2000
WIC and non-WIC Medicaid recipients who did not participate in high-risk obstetrical program (n=295,599)
Participant vs. nonparticipant
Participation dummy Multivariate regression
See notes at end of table. Continued—
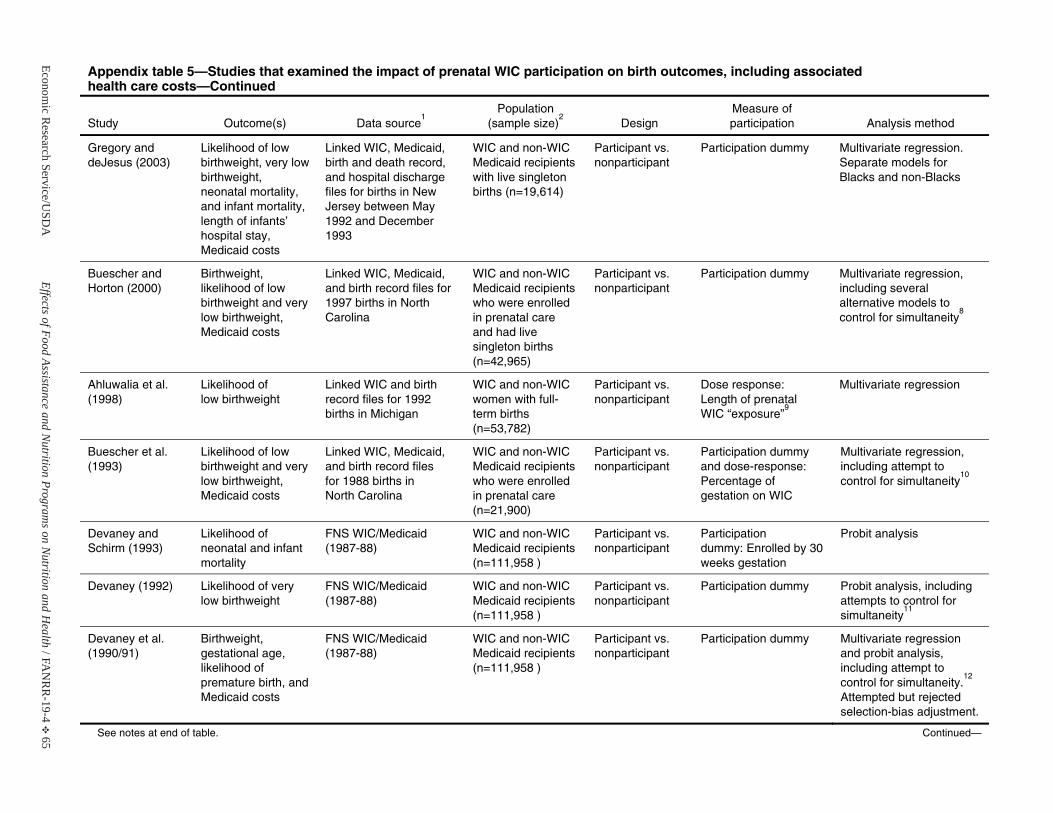
Economic R
esearch Service/USD
AEffects of Food Assistance and N
utrition Programs on N
utrition and Health / F A
NR
R-19-4
E 65
Appendix table 5—Studies that examined the impact of prenatal WIC participation on birth outcomes, including associated health care costs—Continued
Study Outcome(s) Data source1
Population(sample size)
2Design
Measure of participation Analysis method
Gregory and deJesus (2003)
Likelihood of low birthweight, very low birthweight, neonatal mortality, and infant mortality, length of infants’ hospital stay, Medicaid costs
Linked WIC, Medicaid, birth and death record, and hospital dischargefiles for births in New Jersey between May 1992 and December 1993
WIC and non-WIC Medicaid recipients with live singleton births (n=19,614)
Participant vs. nonparticipant
Participation dummy Multivariate regression. Separate models for Blacks and non-Blacks
Buescher and Horton (2000)
Birthweight, likelihood of low birthweight and very low birthweight, Medicaid costs
Linked WIC, Medicaid, and birth record files for 1997 births in North Carolina
WIC and non-WIC Medicaid recipients who were enrolled in prenatal careand had live singleton births(n=42,965)
Participant vs. nonparticipant
Participation dummy Multivariate regression, including several alternative models to control for simultaneity
8
Ahluwalia et al.(1998)
Likelihood of low birthweight
Linked WIC and birth record files for 1992 births in Michigan
WIC and non-WIC women with full-term births (n=53,782)
Participant vs. nonparticipant
Dose response:Length of prenatal WIC “exposure”
9
Multivariate regression
Buescher et al. (1993)
Likelihood of low birthweight and very low birthweight, Medicaid costs
Linked WIC, Medicaid, and birth record files for 1988 births in North Carolina
WIC and non-WIC Medicaid recipients who were enrolled in prenatal care(n=21,900)
Participant vs. nonparticipant
Participation dummy and dose-response: Percentage of gestation on WIC
Multivariate regression, including attempt to control for simultaneity
10
Devaney and Schirm (1993)
Likelihood of neonatal and infant mortality
FNS WIC/Medicaid (1987-88)
WIC and non-WIC Medicaid recipients(n=111,958 )
Participant vs. nonparticipant
Participation dummy: Enrolled by 30 weeks gestation
Probit analysis
Devaney (1992) Likelihood of very low birthweight
FNS WIC/Medicaid (1987-88)
WIC and non-WIC Medicaid recipients(n=111,958 )
Participant vs. nonparticipant
Participation dummy Probit analysis, including attempts to control for simultaneity
11
Devaney et al.(1990/91)
Birthweight, gestational age,likelihood of premature birth, and Medicaid costs
FNS WIC/Medicaid (1987-88)
WIC and non-WIC Medicaid recipients(n=111,958 )
Participant vs. nonparticipant
Participation dummy Multivariate regressionand probit analysis, including attempt to control for simultaneity.
12
Attempted but rejectedselection-bias adjustment.
See notes at end of table. Continued—
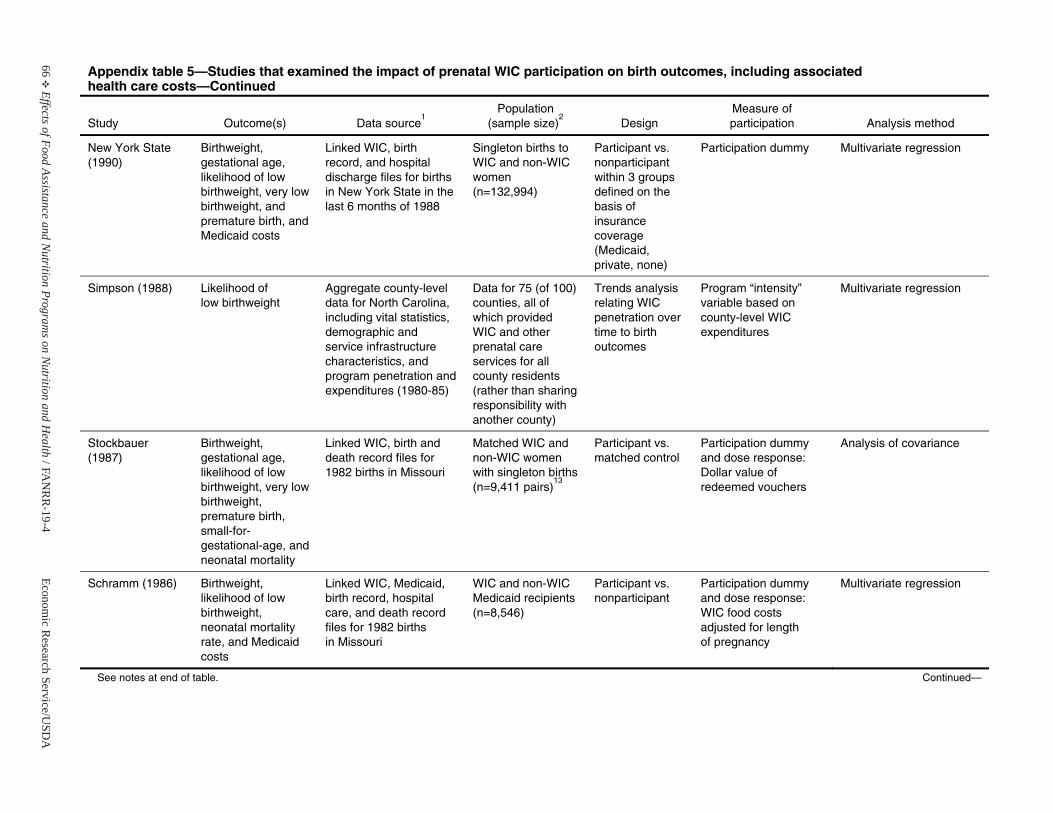
66E
Effects of Food Assistance and Nutrition Program
s on Nutrition and H
ealth / F AN
RR
-19-4Econom
ic Research Service/U
SDA
Appendix table 5—Studies that examined the impact of prenatal WIC participation on birth outcomes, including associated health care costs—Continued
Study Outcome(s) Data source1
Population(sample size)
2Design
Measure of participation Analysis method
New York State (1990)
Birthweight, gestational age,likelihood of low birthweight, very low birthweight, and premature birth, and Medicaid costs
Linked WIC, birth record, and hospital discharge files for births in New York State in the last 6 months of 1988
Singleton births to WIC and non-WIC women (n=132,994)
Participant vs. nonparticipant within 3 groupsdefined on the basis of insurance coverage (Medicaid, private, none)
Participation dummy Multivariate regression
Simpson (1988) Likelihood of low birthweight
Aggregate county-level data for North Carolina, including vital statistics, demographic and service infrastructure characteristics, and program penetration and expenditures (1980-85)
Data for 75 (of 100) counties, all of which providedWIC and other prenatal care services for all county residents (rather than sharing responsibility with another county)
Trends analysis relating WIC penetration over time to birth outcomes
Program “intensity” variable based on county-level WIC expenditures
Multivariate regression
Stockbauer (1987)
Birthweight, gestational age,likelihood of low birthweight, very low birthweight, premature birth,small-for-gestational-age, and neonatal mortality
Linked WIC, birth and death record files for 1982 births in Missouri
Matched WIC and non-WIC women with singleton births(n=9,411 pairs)
13
Participant vs. matched control
Participation dummy and dose response: Dollar value of redeemed vouchers
Analysis of covariance
Schramm (1986) Birthweight, likelihood of low birthweight, neonatal mortality rate, and Medicaid costs
Linked WIC, Medicaid, birth record, hospital care, and death record files for 1982 births in Missouri
WIC and non-WIC Medicaid recipients(n=8,546)
Participant vs. nonparticipant
Participation dummy and dose response: WIC food costs adjusted for length of pregnancy
Multivariate regression
See notes at end of table. Continued—
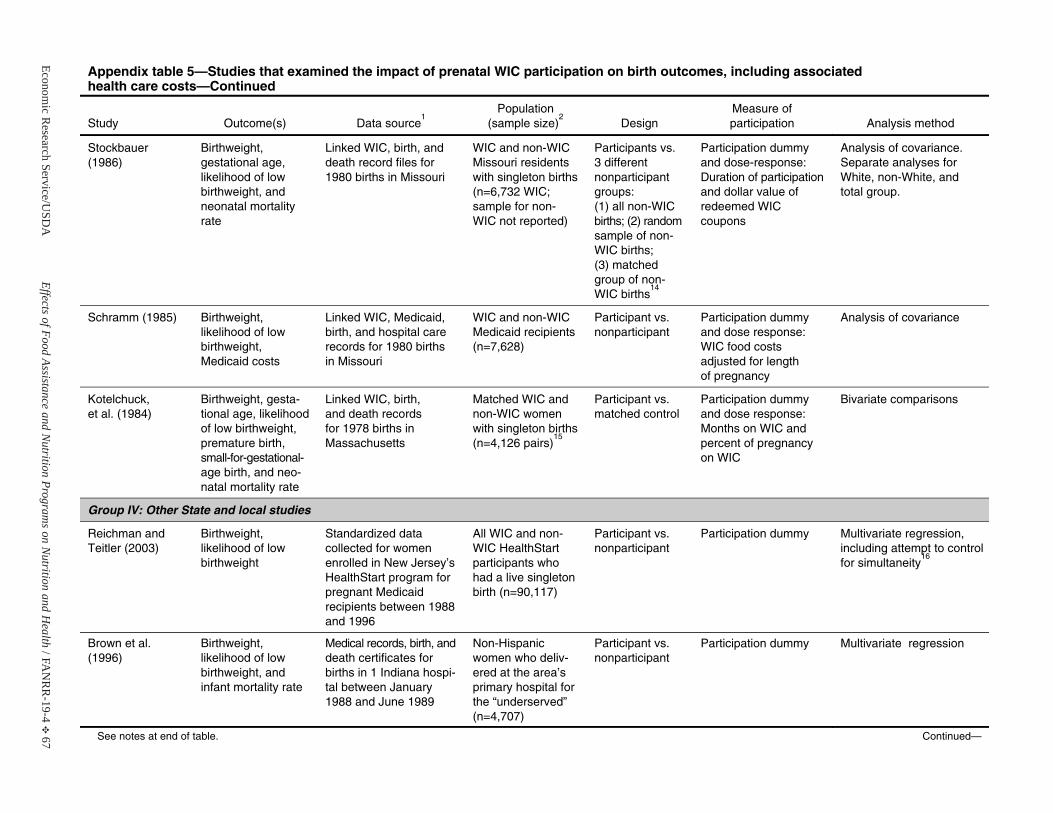
Economic R
esearch Service/USD
AEffects of Food Assistance and N
utrition Programs on N
utrition and Health / F A
NR
R-19-4
E 67
Appendix table 5—Studies that examined the impact of prenatal WIC participation on birth outcomes, including associated health care costs—Continued
Study Outcome(s) Data source1
Population(sample size)
2Design
Measure of participation Analysis method
Stockbauer (1986)
Birthweight, gestational age,likelihood of low birthweight, and neonatal mortality rate
Linked WIC, birth, and death record files for 1980 births in Missouri
WIC and non-WIC Missouri residents with singleton births (n=6,732 WIC; sample for non-WIC not reported)
Participants vs. 3 different nonparticipant groups: (1) all non-WIC births; (2) random sample of non-WIC births; (3) matched group of non-WIC births
14
Participation dummy and dose-response: Duration of participation and dollar value of redeemed WICcoupons
Analysis of covariance. Separate analyses for White, non-White, and total group.
Schramm (1985) Birthweight, likelihood of low birthweight, Medicaid costs
Linked WIC, Medicaid, birth, and hospital care records for 1980 births in Missouri
WIC and non-WIC Medicaid recipients(n=7,628)
Participant vs. nonparticipant
Participation dummy and dose response: WIC food costs adjusted for length of pregnancy
Analysis of covariance
Kotelchuck, et al. (1984)
Birthweight, gesta-tional age, likelihood of low birthweight, premature birth,small-for-gestational-age birth, and neo-natal mortality rate
Linked WIC, birth, and death records for 1978 births in Massachusetts
Matched WIC and non-WIC women with singleton births (n=4,126 pairs)
15
Participant vs. matched control
Participation dummy and dose response: Months on WIC and percent of pregnancy on WIC
Bivariate comparisons
Group IV: Other State and local studies
Reichman and Teitler (2003)
Birthweight, likelihood of low birthweight
Standardized data collected for women enrolled in New Jersey’s HealthStart program for pregnant Medicaid recipients between 1988 and 1996
All WIC and non-WIC HealthStart participants who had a live singleton birth (n=90,117)
Participant vs. nonparticipant
Participation dummy Multivariate regression, including attempt to control for simultaneity
16
Brown et al. (1996)
Birthweight, likelihood of low birthweight, and infant mortality rate
Medical records, birth, and death certificates for births in 1 Indiana hospi-tal between January 1988 and June 1989
Non-Hispanic women who deliv-ered at the area’s primary hospital for the “underserved” (n=4,707)
Participant vs. nonparticipant
Participation dummy Multivariate regression
See notes at end of table. Continued—
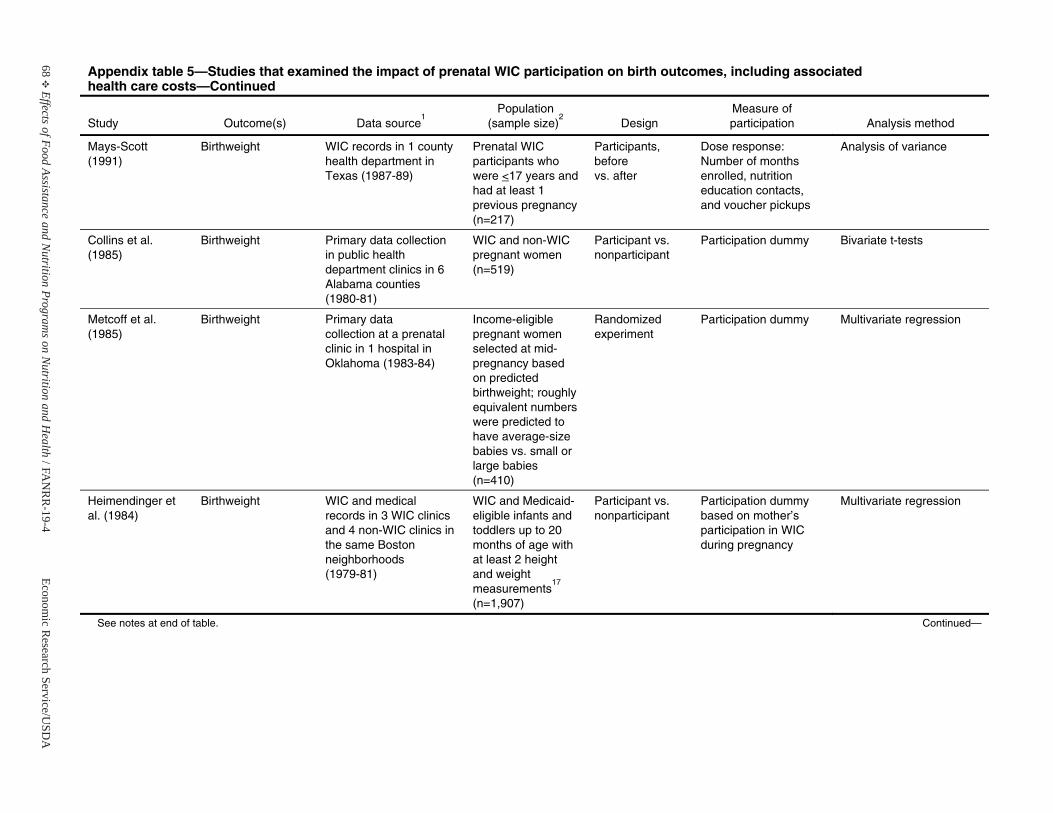
68E
Effects of Food Assistance and Nutrition Program
s on Nutrition and H
ealth / F AN
RR
-19-4Econom
ic Research Service/U
SDA
Appendix table 5—Studies that examined the impact of prenatal WIC participation on birth outcomes, including associated health care costs—Continued
Study Outcome(s) Data source1
Population(sample size)
2Design
Measure of participation Analysis method
Mays-Scott (1991)
Birthweight WIC records in 1 county health department in Texas (1987-89)
Prenatal WIC participants who were <17 years and had at least 1 previous pregnancy (n=217)
Participants, before vs. after
Dose response:Number of months enrolled, nutrition education contacts, and voucher pickups
Analysis of variance
Collins et al. (1985)
Birthweight Primary data collection in public healthdepartment clinics in 6 Alabama counties (1980-81)
WIC and non-WIC pregnant women (n=519)
Participant vs. nonparticipant
Participation dummy Bivariate t-tests
Metcoff et al. (1985)
Birthweight Primary data collection at a prenatal clinic in 1 hospital in Oklahoma (1983-84)
Income-eligible pregnant women selected at mid-pregnancy based on predicted birthweight; roughly equivalent numbers were predicted tohave average-size babies vs. small or large babies (n=410)
Randomized experiment
Participation dummy Multivariate regression
Heimendinger et al. (1984)
Birthweight WIC and medical records in 3 WIC clinics and 4 non-WIC clinics in the same Boston neighborhoods(1979-81)
WIC and Medicaid- eligible infants and toddlers up to 20 months of age with at least 2 height and weight measurements
17
(n=1,907)
Participant vs. nonparticipant
Participation dummy based on mother’s participation in WIC during pregnancy
Multivariate regression
See notes at end of table. Continued—
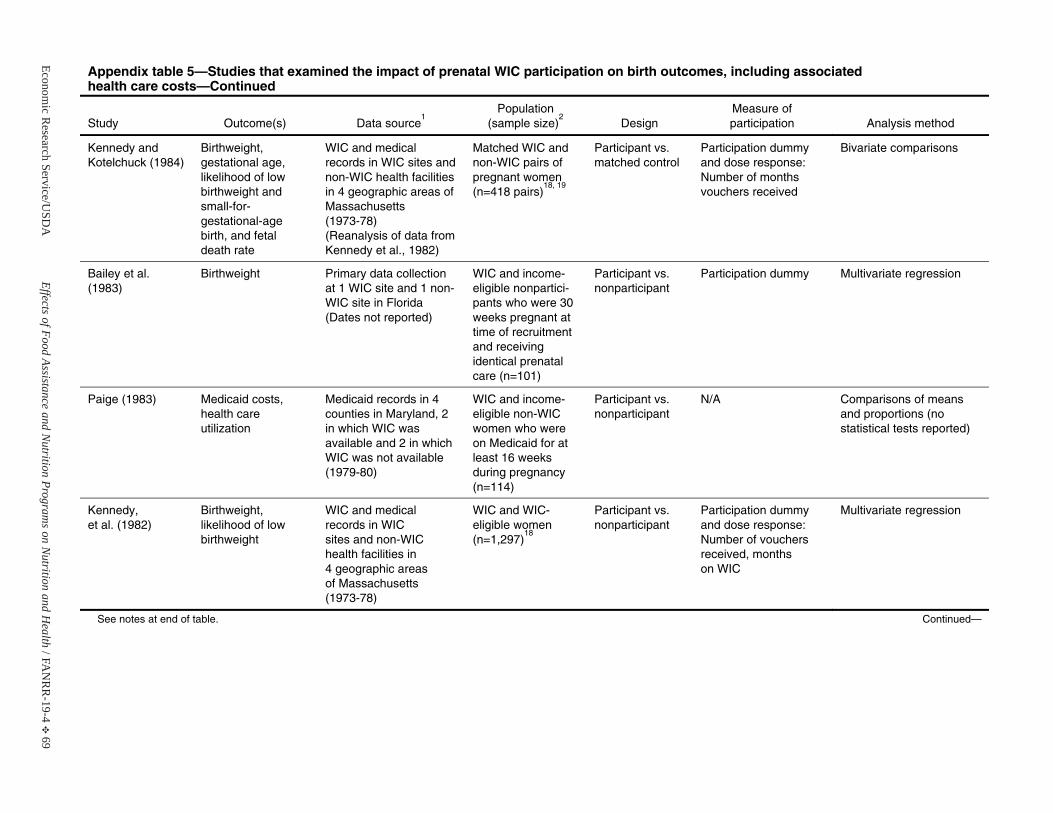
Economic R
esearch Service/USD
AEffects of Food Assistance and N
utrition Programs on N
utrition and Health / F A
NR
R-19-4
E 69
Appendix table 5—Studies that examined the impact of prenatal WIC participation on birth outcomes, including associated health care costs—Continued
Study Outcome(s) Data source1
Population(sample size)
2Design
Measure of participation Analysis method
Kennedy and Kotelchuck (1984)
Birthweight, gestational age,likelihood of low birthweight andsmall-for-gestational-agebirth, and fetal death rate
WIC and medical records in WIC sites and non-WIC health facilities in 4 geographic areas of Massachusetts (1973-78) (Reanalysis of data from Kennedy et al., 1982)
Matched WIC and non-WIC pairs of pregnant women (n=418 pairs)
18, 19
Participant vs. matched control
Participation dummy and dose response: Number of months vouchers received
Bivariate comparisons
Bailey et al. (1983)
Birthweight Primary data collection at 1 WIC site and 1 non-WIC site in Florida (Dates not reported)
WIC and income-eligible nonpartici-pants who were 30 weeks pregnant at time of recruitment and receiving identical prenatal care (n=101)
Participant vs. nonparticipant
Participation dummy Multivariate regression
Paige (1983) Medicaid costs,health care utilization
Medicaid records in 4 counties in Maryland, 2 in which WIC was available and 2 in which WIC was not available (1979-80)
WIC and income-eligible non-WIC women who were on Medicaid for at least 16 weeksduring pregnancy (n=114)
Participant vs. nonparticipant
N/A Comparisons of meansand proportions (no statistical tests reported)
Kennedy, et al. (1982)
Birthweight, likelihood of low birthweight
WIC and medical records in WIC sites and non-WIC health facilities in 4 geographic areas of Massachusetts (1973-78)
WIC and WIC-eligible women(n=1,297)
18
Participant vs. nonparticipant
Participation dummy and dose response: Number of vouchers received, months on WIC
Multivariate regression
See notes at end of table. Continued—
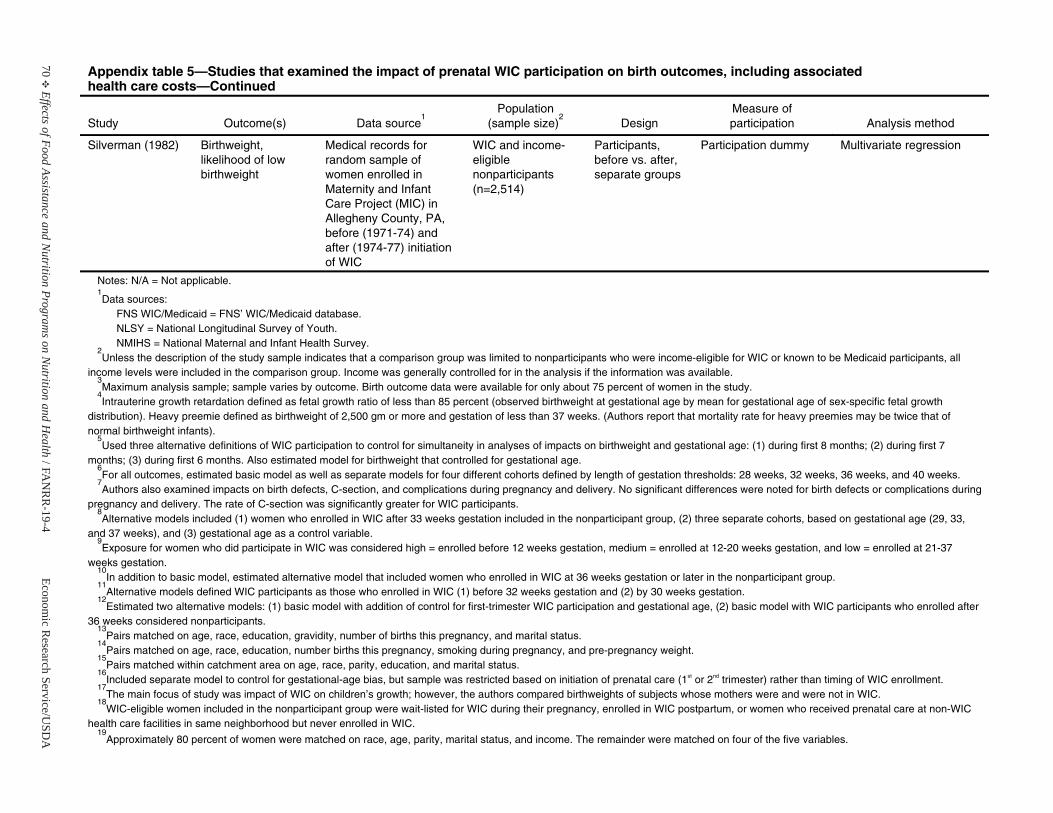
70E
Effects of Food Assistance and Nutrition Program
s on Nutrition and H
ealth / F AN
RR
-19-4Econom
ic Research Service/U
SDA
Appendix table 5—Studies that examined the impact of prenatal WIC participation on birth outcomes, including associated health care costs—Continued
Study Outcome(s) Data source1
Population(sample size)
2Design
Measure of participation Analysis method
Silverman (1982) Birthweight, likelihood of low birthweight
Medical records for random sample of women enrolled in Maternity and Infant Care Project (MIC) in Allegheny County, PA, before (1971-74) and after (1974-77) initiationof WIC
WIC and income-eligiblenonparticipants(n=2,514)
Participants, before vs. after, separate groups
Participation dummy Multivariate regression
Notes: N/A = Not applicable. 1Data sources:
FNS WIC/Medicaid = FNS’ WIC/Medicaid database. NLSY = National Longitudinal Survey of Youth. NMIHS = National Maternal and Infant Health Survey.
2Unless the description of the study sample indicates that a comparison group was limited to nonparticipants who were income-eligible for WIC or known to be Medicaid participants, all
income levels were included in the comparison group. Income was generally controlled for in the analysis if the information was available.3Maximum analysis sample; sample varies by outcome. Birth outcome data were available for only about 75 percent of women in the study.
4Intrauterine growth retardation defined as fetal growth ratio of less than 85 percent (observed birthweight at gestational age by mean for gestational age of sex-specific fetal growth
distribution). Heavy preemie defined as birthweight of 2,500 gm or more and gestation of less than 37 weeks. (Authors report that mortality rate for heavy preemies may be twice that of normal birthweight infants).
5Used three alternative definitions of WIC participation to control for simultaneity in analyses of impacts on birthweight and gestational age: (1) during first 8 months; (2) during first 7
months; (3) during first 6 months. Also estimated model for birthweight that controlled for gestational age. 6For all outcomes, estimated basic model as well as separate models for four different cohorts defined by length of gestation thresholds: 28 weeks, 32 weeks, 36 weeks, and 40 weeks.
7Authors also examined impacts on birth defects, C-section, and complications during pregnancy and delivery. No significant differences were noted for birth defects or complications during
pregnancy and delivery. The rate of C-section was significantly greater for WIC participants. 8Alternative models included (1) women who enrolled in WIC after 33 weeks gestation included in the nonparticipant group, (2) three separate cohorts, based on gestational age (29, 33,
and 37 weeks), and (3) gestational age as a control variable. 9Exposure for women who did participate in WIC was considered high = enrolled before 12 weeks gestation, medium = enrolled at 12-20 weeks gestation, and low = enrolled at 21-37
weeks gestation.10
In addition to basic model, estimated alternative model that included women who enrolled in WIC at 36 weeks gestation or later in the nonparticipant group. 11
Alternative models defined WIC participants as those who enrolled in WIC (1) before 32 weeks gestation and (2) by 30 weeks gestation. 12
Estimated two alternative models: (1) basic model with addition of control for first-trimester WIC participation and gestational age, (2) basic model with WIC participants who enrolled after 36 weeks considered nonparticipants.
13Pairs matched on age, race, education, gravidity, number of births this pregnancy, and marital status.
14Pairs matched on age, race, education, number births this pregnancy, smoking during pregnancy, and pre-pregnancy weight.
15Pairs matched within catchment area on age, race, parity, education, and marital status.
16Included separate model to control for gestational-age bias, but sample was restricted based on initiation of prenatal care (1st or 2nd trimester) rather than timing of WIC enrollment.
17The main focus of study was impact of WIC on children’s growth; however, the authors compared birthweights of subjects whose mothers were and were not in WIC.
18WIC-eligible women included in the nonparticipant group were wait-listed for WIC during their pregnancy, enrolled in WIC postpartum, or women who received prenatal care at non-WIC
health care facilities in same neighborhood but never enrolled in WIC. 19
Approximately 80 percent of women were matched on race, age, parity, marital status, and income. The remainder were matched on four of the five variables.
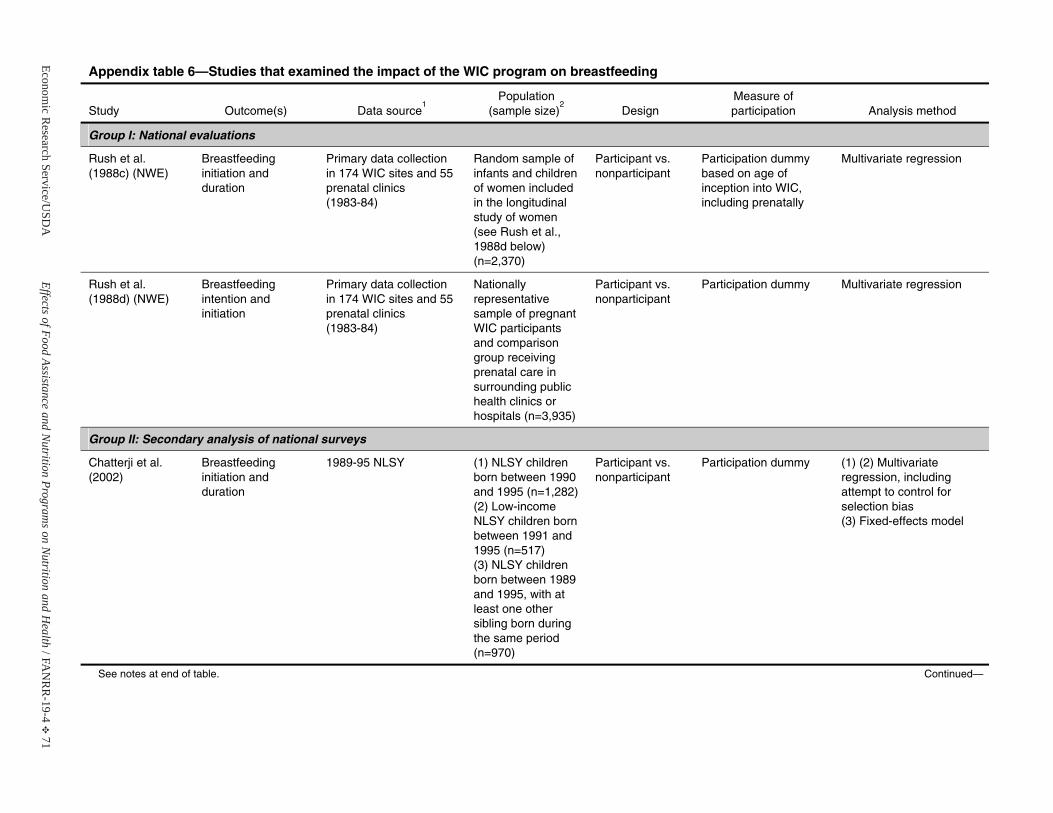
Economic R
esearch Service/USD
AEffects of Food Assistance and N
utrition Programs on N
utrition and Health / F A
NR
R-19-4
E 71
Appendix table 6—Studies that examined the impact of the WIC program on breastfeeding
Study Outcome(s) Data source1
Population(sample size)
2Design
Measure of participation Analysis method
Group I: National evaluations
Rush et al. (1988c) (NWE)
Breastfeeding initiation and duration
Primary data collection in 174 WIC sites and 55 prenatal clinics(1983-84)
Random sample of infants and children of women included in the longitudinal study of women (see Rush et al., 1988d below) (n=2,370)
Participant vs. nonparticipant
Participation dummy based on age of inception into WIC, including prenatally
Multivariate regression
Rush et al. (1988d) (NWE)
Breastfeeding intention and initiation
Primary data collection in 174 WIC sites and 55 prenatal clinics(1983-84)
Nationally representative sample of pregnant WIC participants and comparisongroup receiving prenatal care insurrounding public health clinics orhospitals (n=3,935)
Participant vs. nonparticipant
Participation dummy Multivariate regression
Group II: Secondary analysis of national surveys
Chatterji et al. (2002)
Breastfeeding initiation and duration
1989-95 NLSY (1) NLSY children born between 1990 and 1995 (n=1,282)(2) Low-income NLSY children born between 1991 and 1995 (n=517)(3) NLSY children born between 1989 and 1995, with at least one othersibling born during the same period (n=970)
Participant vs. nonparticipant
Participation dummy (1) (2) Multivariate regression, includingattempt to control for selection bias(3) Fixed-effects model
See notes at end of table. Continued—
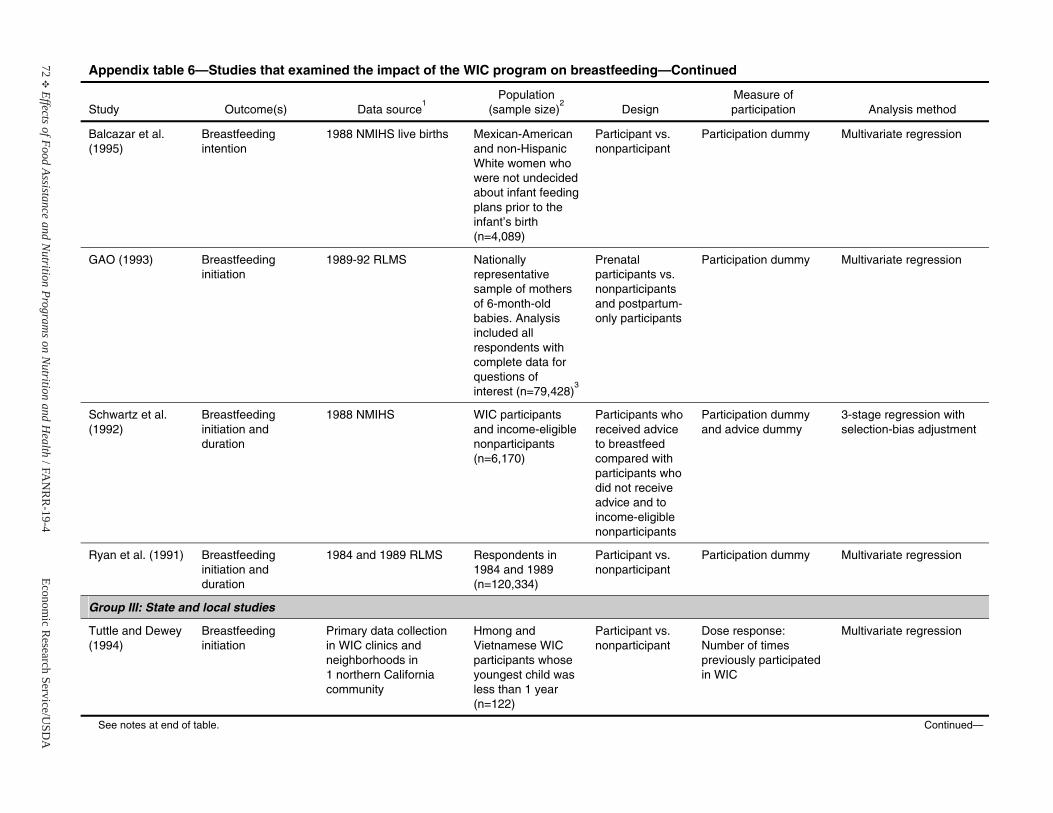
72E
Effects of Food Assistance and Nutrition Program
s on Nutrition and H
ealth / F AN
RR
-19-4Econom
ic Research Service/U
SDA
Appendix table 6—Studies that examined the impact of the WIC program on breastfeeding—Continued
Study Outcome(s) Data source1
Population(sample size)
2Design
Measure of participation Analysis method
Balcazar et al. (1995)
Breastfeeding intention
1988 NMIHS live births Mexican-American and non-Hispanic White women who were not undecided about infant feedingplans prior to the infant’s birth (n=4,089)
Participant vs. nonparticipant
Participation dummy Multivariate regression
GAO (1993) Breastfeeding initiation
1989-92 RLMS Nationally representative sample of mothers of 6-month-old babies. Analysisincluded all respondents with complete data for questions of interest (n=79,428)
3
Prenatalparticipants vs. nonparticipantsand postpartum-only participants
Participation dummy Multivariate regression
Schwartz et al.(1992)
Breastfeeding initiation and duration
1988 NMIHS WIC participants and income-eligible nonparticipants(n=6,170)
Participants who received advice to breastfeed compared with participants who did not receive advice and to income-eligiblenonparticipants
Participation dummy and advice dummy
3-stage regression with selection-bias adjustment
Ryan et al. (1991) Breastfeeding initiation and duration
1984 and 1989 RLMS Respondents in1984 and 1989(n=120,334)
Participant vs. nonparticipant
Participation dummy Multivariate regression
Group III: State and local studies
Tuttle and Dewey (1994)
Breastfeeding initiation
Primary data collection in WIC clinics and neighborhoods in 1 northern California community
Hmong and Vietnamese WIC participants whose youngest child was less than 1 year(n=122)
Participant vs. nonparticipant
Dose response:Number of times previously participatedin WIC
Multivariate regression
See notes at end of table. Continued—
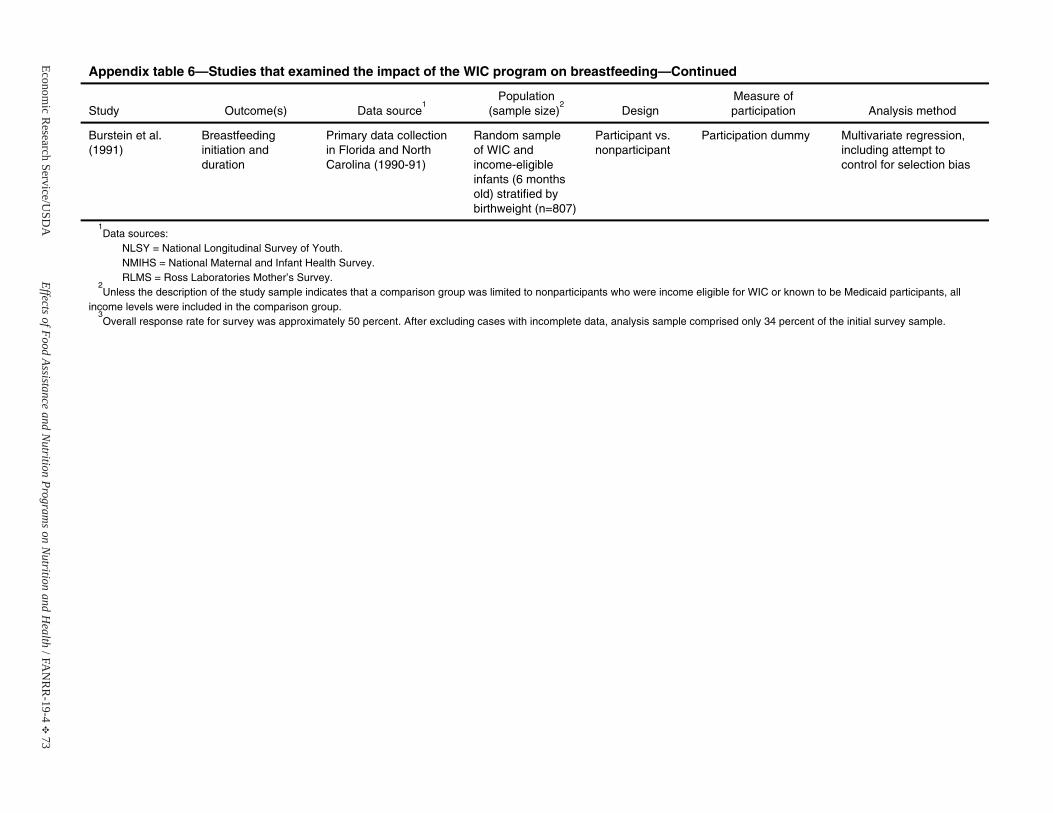
Economic R
esearch Service/USD
AEffects of Food Assistance and N
utrition Programs on N
utrition and Health / F A
NR
R-19-4
E 73
Appendix table 6—Studies that examined the impact of the WIC program on breastfeeding—Continued
Study Outcome(s) Data source1
Population(sample size)
2Design
Measure of participation Analysis method
Burstein et al.(1991)
Breastfeeding initiation and duration
Primary data collection in Florida and North Carolina (1990-91)
Random sampleof WIC and income-eligibleinfants (6 months old) stratified by birthweight (n=807)
Participant vs. nonparticipant
Participation dummy Multivariate regression, including attempt to control for selection bias
1Data sources:
NLSY = National Longitudinal Survey of Youth. NMIHS = National Maternal and Infant Health Survey. RLMS = Ross Laboratories Mother’s Survey.
2Unless the description of the study sample indicates that a comparison group was limited to nonparticipants who were income eligible for WIC or known to be Medicaid participants, all
income levels were included in the comparison group. 3Overall response rate for survey was approximately 50 percent. After excluding cases with incomplete data, analysis sample comprised only 34 percent of the initial survey sample.
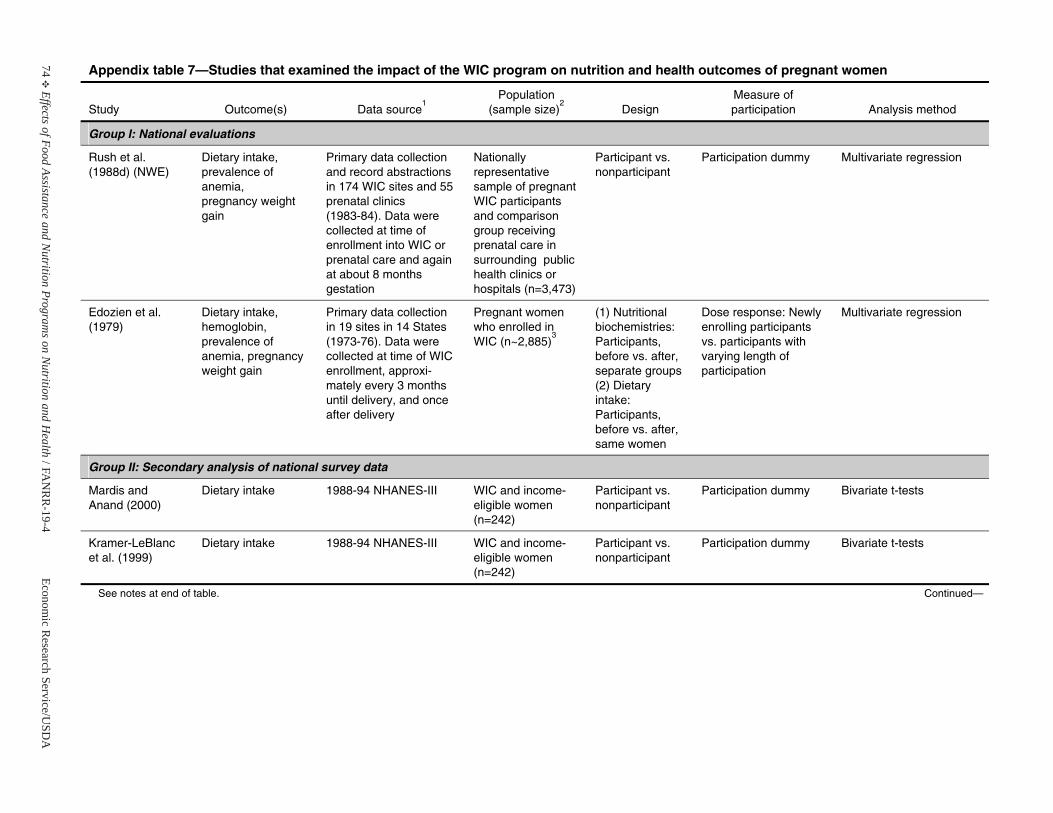
74E
Effects of Food Assistance and Nutrition Program
s on Nutrition and H
ealth / F AN
RR
-19-4Econom
ic Research Service/U
SDA
Appendix table 7—Studies that examined the impact of the WIC program on nutrition and health outcomes of pregnant women
Study Outcome(s) Data source1
Population(sample size)
2Design
Measure of participation Analysis method
Group I: National evaluations
Rush et al. (1988d) (NWE)
Dietary intake,prevalence of anemia, pregnancy weight gain
Primary data collection and record abstractions in 174 WIC sites and 55 prenatal clinics(1983-84). Data were collected at time of enrollment into WIC or prenatal care and again at about 8 months gestation
Nationally representative sample of pregnant WIC participants and comparisongroup receiving prenatal care insurrounding public health clinics orhospitals (n=3,473)
Participant vs. nonparticipant
Participation dummy Multivariate regression
Edozien et al.(1979)
Dietary intake, hemoglobin, prevalence of anemia, pregnancy weight gain
Primary data collection in 19 sites in 14 States (1973-76). Data were collected at time of WIC enrollment, approxi-mately every 3 months until delivery, and once after delivery
Pregnant women who enrolled inWIC (n~2,885)
3
(1) Nutritional biochemistries:Participants, before vs. after, separate groups(2) Dietary intake: Participants, before vs. after, same women
Dose response: Newly enrolling participants vs. participants with varying length of participation
Multivariate regression
Group II: Secondary analysis of national survey data
Mardis and Anand (2000)
Dietary intake 1988-94 NHANES-III WIC and income-eligible women(n=242)
Participant vs. nonparticipant
Participation dummy Bivariate t-tests
Kramer-LeBlancet al. (1999)
Dietary intake 1988-94 NHANES-III WIC and income-eligible women(n=242)
Participant vs. nonparticipant
Participation dummy Bivariate t-tests
See notes at end of table. Continued—
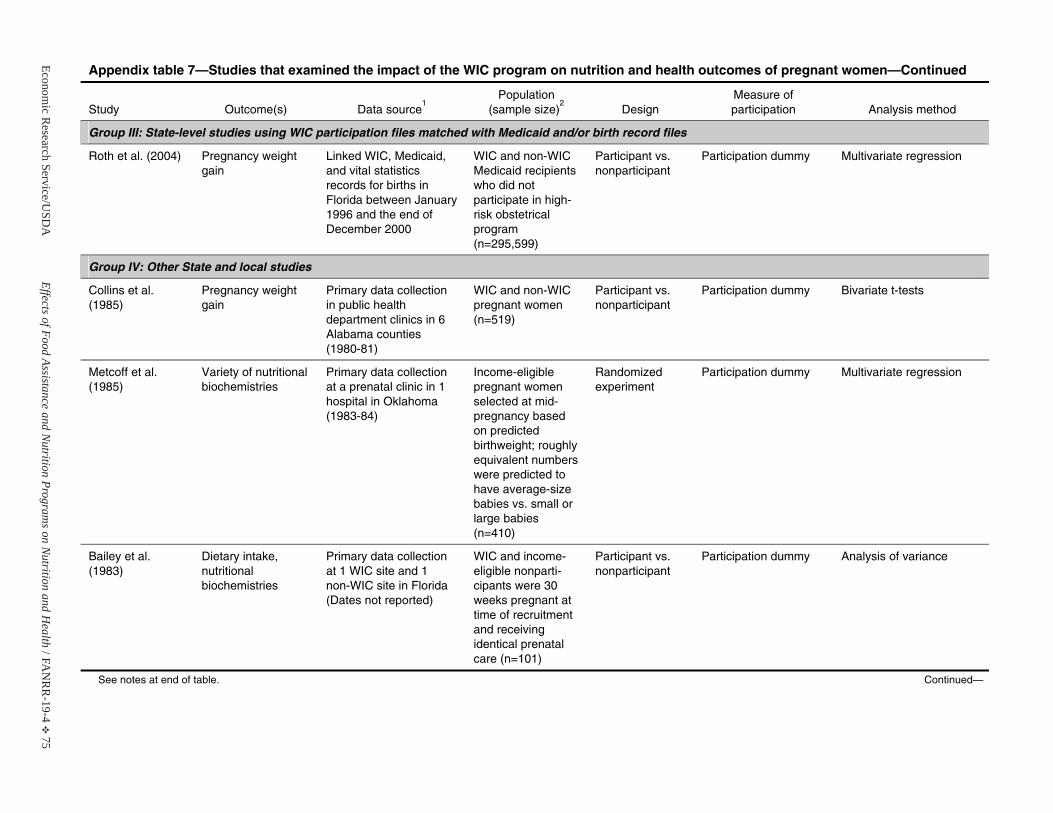
Economic R
esearch Service/USD
AEffects of Food Assistance and N
utrition Programs on N
utrition and Health / F A
NR
R-19-4
E 75
Appendix table 7—Studies that examined the impact of the WIC program on nutrition and health outcomes of pregnant women—Continued
Study Outcome(s) Data source1
Population(sample size)
2Design
Measure of participation Analysis method
Group III: State-level studies using WIC participation files matched with Medicaid and/or birth record files
Roth et al. (2004) Pregnancy weight gain
Linked WIC, Medicaid, and vital statistics records for births in Florida between January 1996 and the end of December 2000
WIC and non-WIC Medicaid recipients who did not participate in high-risk obstetrical program (n=295,599)
Participant vs. nonparticipant
Participation dummy Multivariate regression
Group IV: Other State and local studies
Collins et al. (1985)
Pregnancy weight gain
Primary data collection in public healthdepartment clinics in 6 Alabama counties (1980-81)
WIC and non-WIC pregnant women (n=519)
Participant vs. nonparticipant
Participation dummy Bivariate t-tests
Metcoff et al. (1985)
Variety of nutritional biochemistries
Primary data collection at a prenatal clinic in 1 hospital in Oklahoma (1983-84)
Income-eligible pregnant women selected at mid-pregnancy based on predicted birthweight; roughly equivalent numbers were predicted tohave average-size babies vs. small or large babies (n=410)
Randomized experiment
Participation dummy Multivariate regression
Bailey et al. (1983)
Dietary intake, nutritional biochemistries
Primary data collection at 1 WIC site and 1 non-WIC site in Florida (Dates not reported)
WIC and income-eligible nonparti-cipants were 30weeks pregnant at time of recruitment and receiving identical prenatal care (n=101)
Participant vs. nonparticipant
Participation dummy Analysis of variance
See notes at end of table. Continued—
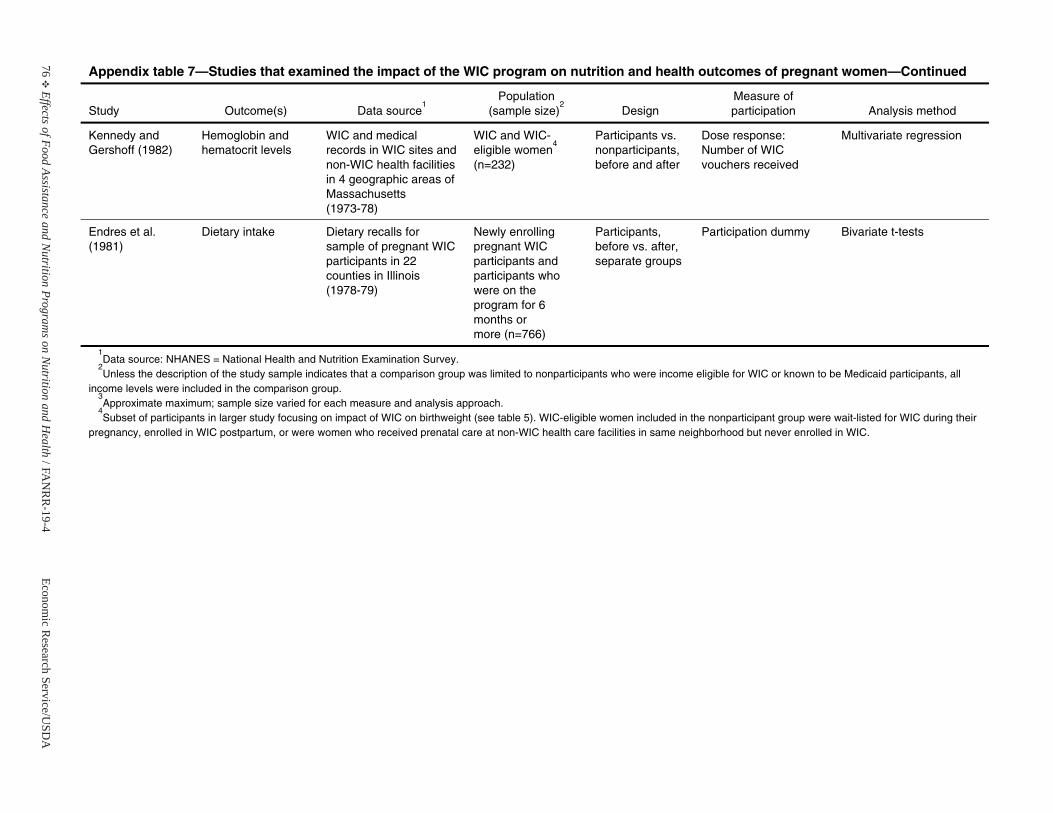
76E
Effects of Food Assistance and Nutrition Program
s on Nutrition and H
ealth / F AN
RR
-19-4Econom
ic Research Service/U
SDA
Appendix table 7—Studies that examined the impact of the WIC program on nutrition and health outcomes of pregnant women—Continued
Study Outcome(s) Data source1
Population(sample size)
2Design
Measure of participation Analysis method
Kennedy and Gershoff (1982)
Hemoglobin andhematocrit levels
WIC and medical records in WIC sites and non-WIC health facilities in 4 geographic areas of Massachusetts (1973-78)
WIC and WIC- eligible women
4
(n=232)
Participants vs. nonparticipants,before and after
Dose response:Number of WIC vouchers received
Multivariate regression
Endres et al. (1981)
Dietary intake Dietary recalls for sample of pregnant WIC participants in 22 counties in Illinois (1978-79)
Newly enrollingpregnant WIC participants and participants who were on the program for 6 months or more (n=766)
Participants, before vs. after, separate groups
Participation dummy Bivariate t-tests
1Data source: NHANES = National Health and Nutrition Examination Survey.
2Unless the description of the study sample indicates that a comparison group was limited to nonparticipants who were income eligible for WIC or known to be Medicaid participants, all
income levels were included in the comparison group. 3Approximate maximum; sample size varied for each measure and analysis approach.
4Subset of participants in larger study focusing on impact of WIC on birthweight (see table 5). WIC-eligible women included in the nonparticipant group were wait-listed for WIC during their
pregnancy, enrolled in WIC postpartum, or were women who received prenatal care at non-WIC health care facilities in same neighborhood but never enrolled in WIC.
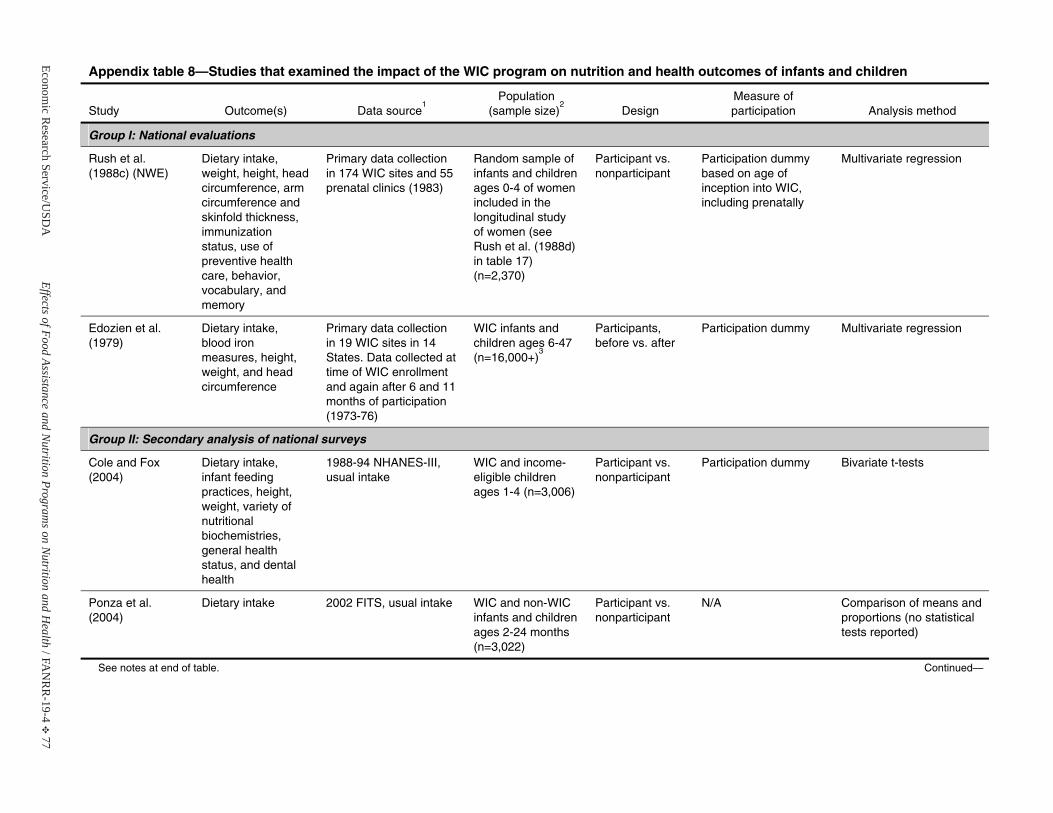
Economic R
esearch Service/USD
AEffects of Food Assistance and N
utrition Programs on N
utrition and Health / F A
NR
R-19-4
E 77
Appendix table 8—Studies that examined the impact of the WIC program on nutrition and health outcomes of infants and children
Study Outcome(s) Data source1
Population(sample size)
2Design
Measure of participation Analysis method
Group I: National evaluations
Rush et al. (1988c) (NWE)
Dietary intake, weight, height, head circumference, arm circumference and skinfold thickness, immunization status, use of preventive health care, behavior,vocabulary, and memory
Primary data collection in 174 WIC sites and 55 prenatal clinics (1983)
Random sample of infants and children ages 0-4 of women included in thelongitudinal study of women (seeRush et al. (1988d) in table 17) (n=2,370)
Participant vs. nonparticipant
Participation dummy based on age of inception into WIC, including prenatally
Multivariate regression
Edozien et al. (1979)
Dietary intake, blood ironmeasures, height, weight, and head circumference
Primary data collection in 19 WIC sites in 14 States. Data collected at time of WIC enrollment and again after 6 and 11 months of participation (1973-76)
WIC infants and children ages 6-47 (n=16,000+)
3
Participants, before vs. after
Participation dummy Multivariate regression
Group II: Secondary analysis of national surveys
Cole and Fox (2004)
Dietary intake, infant feeding practices, height, weight, variety of nutritional biochemistries,general health status, and dental health
1988-94 NHANES-III, usual intake
WIC and income-eligible childrenages 1-4 (n=3,006)
Participant vs. nonparticipant
Participation dummy Bivariate t-tests
Ponza et al. (2004)
Dietary intake 2002 FITS, usual intake WIC and non-WIC infants and children ages 2-24 months (n=3,022)
Participant vs. nonparticipant
N/A Comparison of means and proportions (no statistical tests reported)
See notes at end of table. Continued—
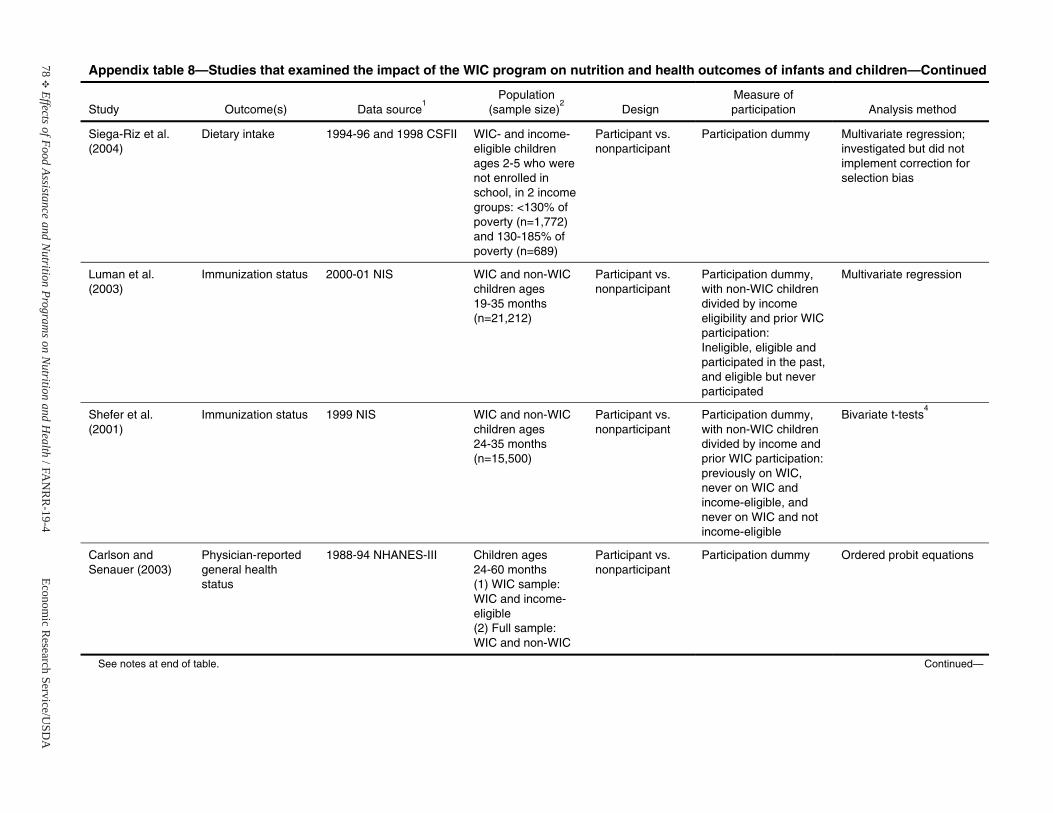
78E
Effects of Food Assistance and Nutrition Program
s on Nutrition and H
ealth / F AN
RR
-19-4Econom
ic Research Service/U
SDA
Appendix table 8—Studies that examined the impact of the WIC program on nutrition and health outcomes of infants and children—Continued
Study Outcome(s) Data source1
Population(sample size)
2Design
Measure of participation Analysis method
Siega-Riz et al.(2004)
Dietary intake 1994-96 and 1998 CSFII WIC- and income-eligible childrenages 2-5 who were not enrolled in school, in 2 income groups: <130% of poverty (n=1,772) and 130-185% of poverty (n=689)
Participant vs. nonparticipant
Participation dummy Multivariate regression; investigated but did not implement correction for selection bias
Luman et al. (2003)
Immunization status 2000-01 NIS WIC and non-WIC children ages 19-35 months (n=21,212)
Participant vs. nonparticipant
Participation dummy, with non-WIC children divided by income eligibility and prior WIC participation: Ineligible, eligible and participated in the past, and eligible but never participated
Multivariate regression
Shefer et al. (2001)
Immunization status 1999 NIS WIC and non-WIC children ages 24-35 months (n=15,500)
Participant vs. nonparticipant
Participation dummy, with non-WIC children divided by income and prior WIC participation: previously on WIC, never on WIC and income-eligible, and never on WIC and not income-eligible
Bivariate t-tests4
Carlson and Senauer (2003)
Physician-reported general health status
1988-94 NHANES-III Children ages 24-60 months(1) WIC sample: WIC and income-eligible(2) Full sample: WIC and non-WIC
Participant vs. nonparticipant
Participation dummy Ordered probit equations
See notes at end of table. Continued—
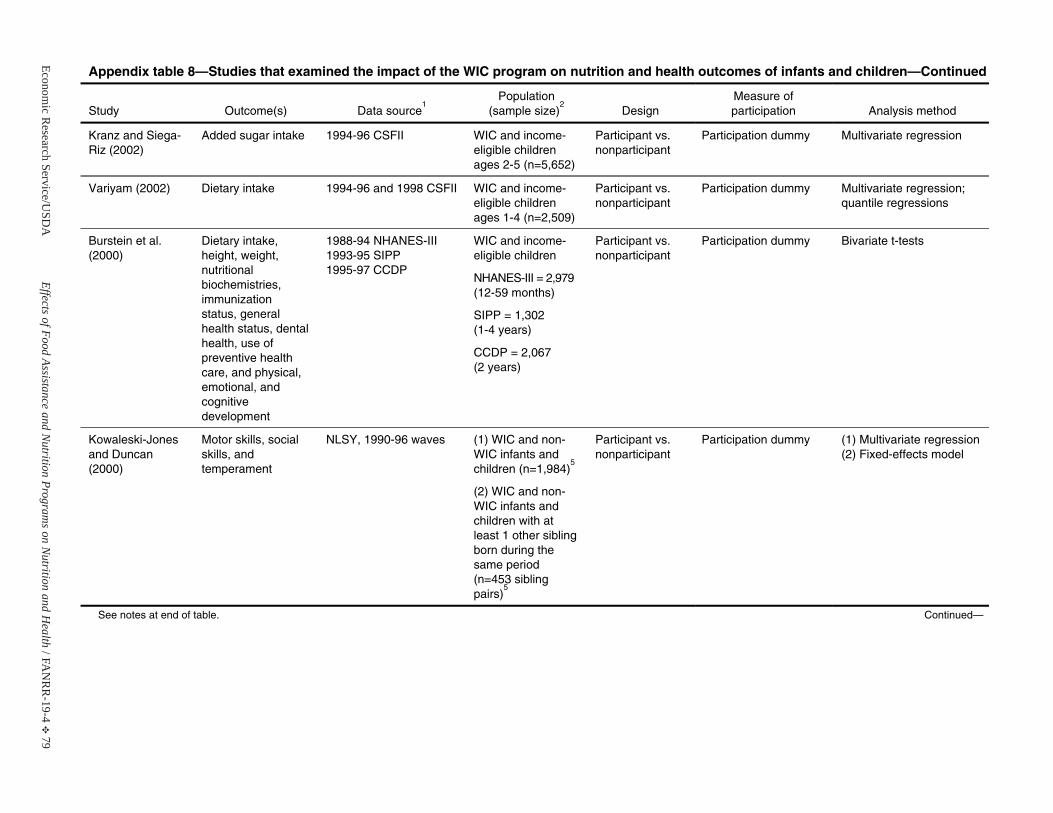
Economic R
esearch Service/USD
AEffects of Food Assistance and N
utrition Programs on N
utrition and Health / F A
NR
R-19-4
E 79
Appendix table 8—Studies that examined the impact of the WIC program on nutrition and health outcomes of infants and children—Continued
Study Outcome(s) Data source1
Population(sample size)
2Design
Measure of participation Analysis method
Kranz and Siega-Riz (2002)
Added sugar intake 1994-96 CSFII WIC and income-eligible childrenages 2-5 (n=5,652)
Participant vs. nonparticipant
Participation dummy Multivariate regression
Variyam (2002) Dietary intake 1994-96 and 1998 CSFII WIC and income-eligible childrenages 1-4 (n=2,509)
Participant vs. nonparticipant
Participation dummy Multivariate regression; quantile regressions
Burstein et al. (2000)
Dietary intake, height, weight, nutritional biochemistries,immunization status, generalhealth status, dental health, use of preventive health care, and physical, emotional, andcognitivedevelopment
1988-94 NHANES-III 1993-95 SIPP1995-97 CCDP
WIC and income-eligible children
NHANES-III = 2,979 (12-59 months)
SIPP = 1,302 (1-4 years)
CCDP = 2,067(2 years)
Participant vs. nonparticipant
Participation dummy Bivariate t-tests
Kowaleski-Jones and Duncan (2000)
Motor skills, social skills, and temperament
NLSY, 1990-96 waves (1) WIC and non-WIC infants and children (n=1,984)
5
(2) WIC and non-WIC infants and children with at least 1 other sibling born during the same period (n=453 sibling pairs)
5
Participant vs. nonparticipant
Participation dummy (1) Multivariate regression(2) Fixed-effects model
See notes at end of table. Continued—
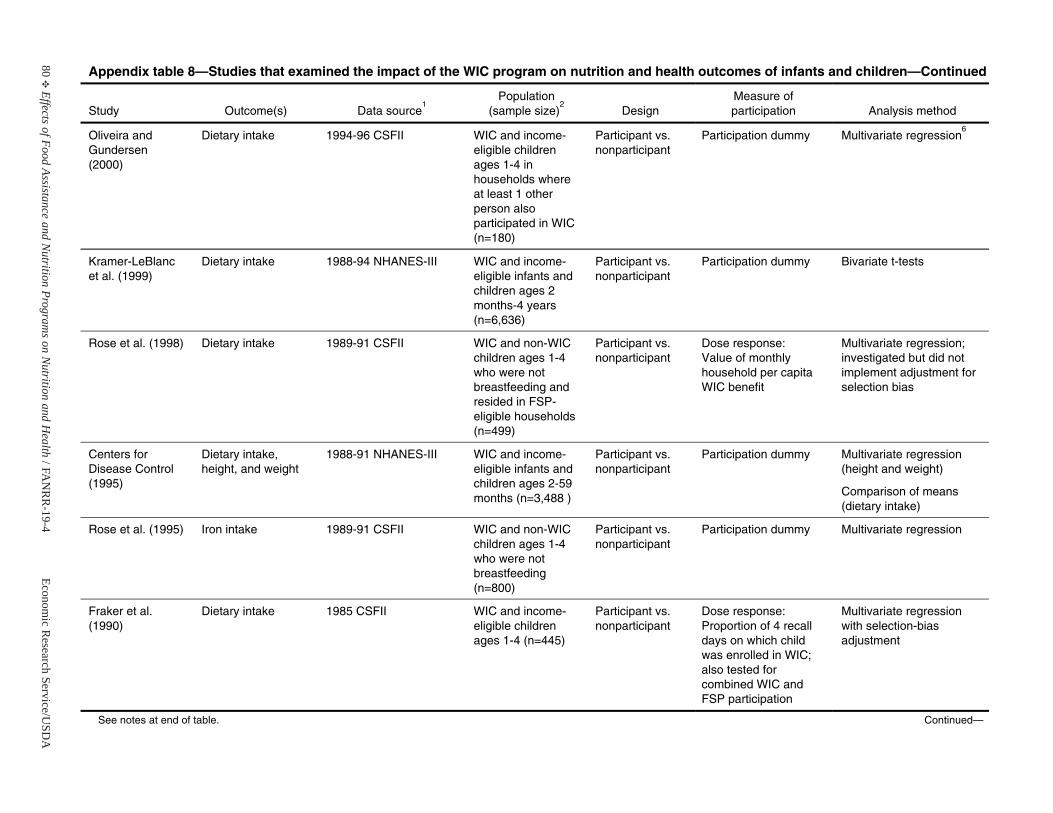
80E
Effects of Food Assistance and Nutrition Program
s on Nutrition and H
ealth / F AN
RR
-19-4Econom
ic Research Service/U
SDA
Appendix table 8—Studies that examined the impact of the WIC program on nutrition and health outcomes of infants and children—Continued
Study Outcome(s) Data source1
Population(sample size)
2Design
Measure of participation Analysis method
Oliveira and Gundersen (2000)
Dietary intake 1994-96 CSFII WIC and income-eligible childrenages 1-4 in households where at least 1 otherperson also participated in WIC (n=180)
Participant vs. nonparticipant
Participation dummy Multivariate regression6
Kramer-LeBlancet al. (1999)
Dietary intake 1988-94 NHANES-III WIC and income-eligible infants and children ages 2months-4 years (n=6,636)
Participant vs. nonparticipant
Participation dummy Bivariate t-tests
Rose et al. (1998) Dietary intake 1989-91 CSFII WIC and non-WIC children ages 1-4 who were not breastfeeding and resided in FSP-eligible households (n=499)
Participant vs. nonparticipant
Dose response:Value of monthly household per capita WIC benefit
Multivariate regression; investigated but did not implement adjustment for selection bias
Centers for Disease Control (1995)
Dietary intake, height, and weight
1988-91 NHANES-III WIC and income-eligible infants and children ages 2-59 months (n=3,488 )
Participant vs. nonparticipant
Participation dummy Multivariate regression(height and weight)
Comparison of means (dietary intake)
Rose et al. (1995) Iron intake 1989-91 CSFII WIC and non-WIC children ages 1-4 who were not breastfeeding (n=800)
Participant vs. nonparticipant
Participation dummy Multivariate regression
Fraker et al. (1990)
Dietary intake 1985 CSFII WIC and income-eligible childrenages 1-4 (n=445)
Participant vs. nonparticipant
Dose response:Proportion of 4 recall days on which child was enrolled in WIC; also tested for combined WIC and FSP participation
Multivariate regressionwith selection-bias adjustment
See notes at end of table. Continued—
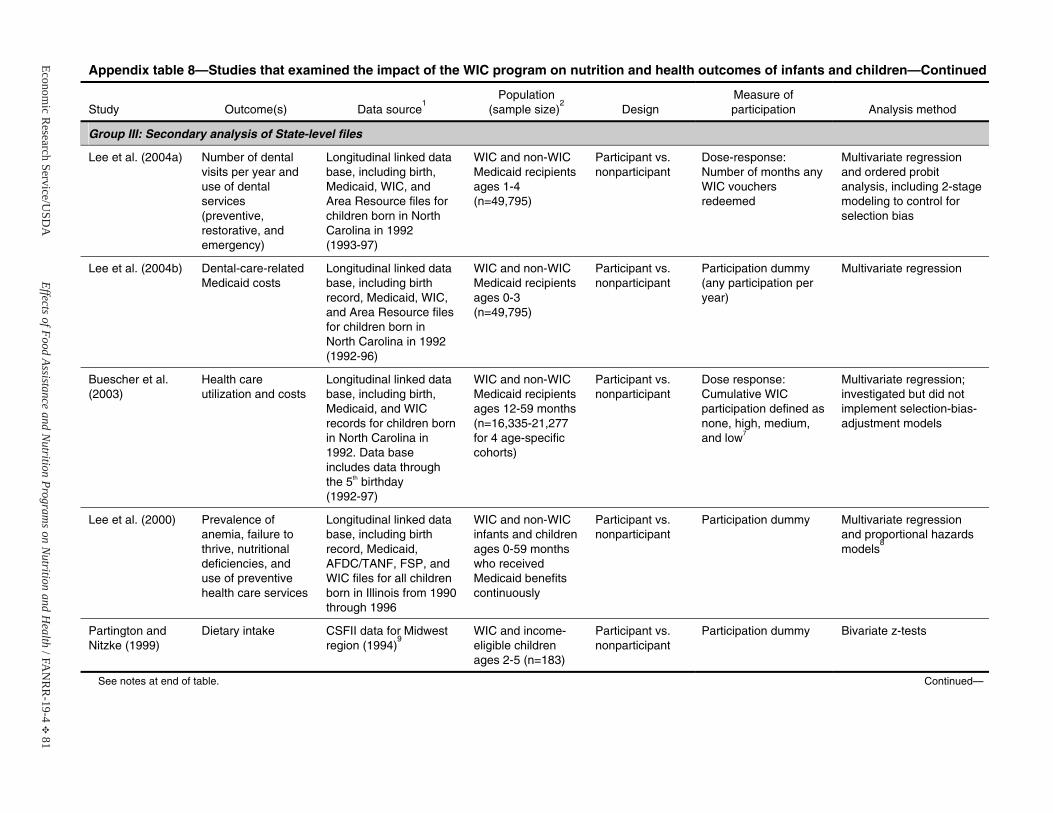
Economic R
esearch Service/USD
AEffects of Food Assistance and N
utrition Programs on N
utrition and Health / F A
NR
R-19-4
E 81
Appendix table 8—Studies that examined the impact of the WIC program on nutrition and health outcomes of infants and children—Continued
Study Outcome(s) Data source1
Population(sample size)
2Design
Measure of participation Analysis method
Group III: Secondary analysis of State-level files
Lee et al. (2004a) Number of dental visits per year and use of dental services (preventive, restorative, and emergency)
Longitudinal linked data base, including birth, Medicaid, WIC, and Area Resource files for children born in North Carolina in 1992(1993-97)
WIC and non-WIC Medicaid recipients ages 1-4 (n=49,795)
Participant vs. nonparticipant
Dose-response: Number of months any WIC vouchers redeemed
Multivariate regressionand ordered probit analysis, including 2-stage modeling to control for selection bias
Lee et al. (2004b) Dental-care-related Medicaid costs
Longitudinal linked data base, including birth record, Medicaid, WIC, and Area Resource files for children born in North Carolina in 1992 (1992-96)
WIC and non-WIC Medicaid recipients ages 0-3 (n=49,795)
Participant vs. nonparticipant
Participation dummy (any participation per year)
Multivariate regression
Buescher et al. (2003)
Health care utilization and costs
Longitudinal linked data base, including birth, Medicaid, and WIC records for children born in North Carolina in 1992. Data base includes data through the 5th birthday (1992-97)
WIC and non-WIC Medicaid recipients ages 12-59 months (n=16,335-21,277 for 4 age-specific cohorts)
Participant vs. nonparticipant
Dose response:Cumulative WIC participation defined as none, high, medium, and low7
Multivariate regression; investigated but did not implement selection-bias-adjustment models
Lee et al. (2000) Prevalence of anemia, failure to thrive, nutritional deficiencies, and use of preventive health care services
Longitudinal linked data base, including birth record, Medicaid, AFDC/TANF, FSP, and WIC files for all children born in Illinois from 1990 through 1996
WIC and non-WIC infants and children ages 0-59 months who receivedMedicaid benefits continuously
Participant vs. nonparticipant
Participation dummy Multivariate regressionand proportional hazards models
8
Partington and Nitzke (1999)
Dietary intake CSFII data for Midwest region (1994)
9WIC and income-eligible childrenages 2-5 (n=183)
Participant vs. nonparticipant
Participation dummy Bivariate z-tests
See notes at end of table. Continued—
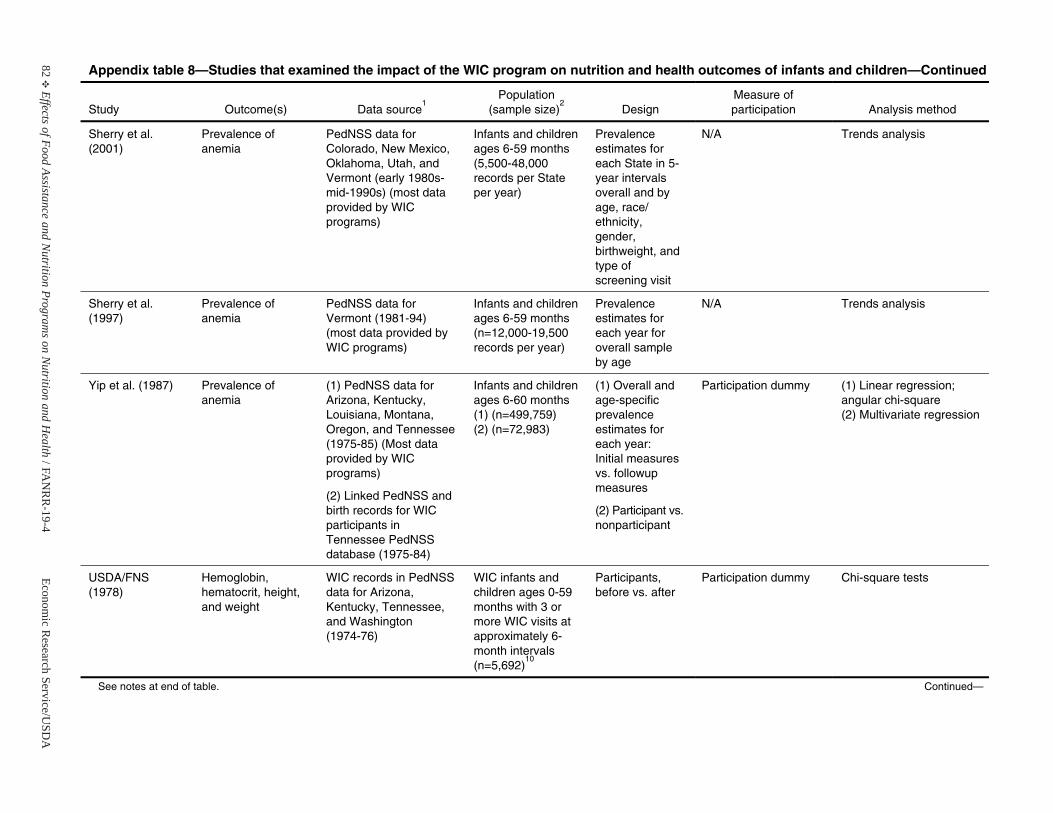
82E
Effects of Food Assistance and Nutrition Program
s on Nutrition and H
ealth / F AN
RR
-19-4Econom
ic Research Service/U
SDA
Appendix table 8—Studies that examined the impact of the WIC program on nutrition and health outcomes of infants and children—Continued
Study Outcome(s) Data source1
Population(sample size)
2Design
Measure of participation Analysis method
Sherry et al. (2001)
Prevalence of anemia
PedNSS data for Colorado, New Mexico, Oklahoma, Utah, and Vermont (early 1980s-mid-1990s) (most data provided by WIC programs)
Infants and children ages 6-59 months (5,500-48,000 records per State per year)
Prevalence estimates for each State in 5-year intervals overall and by age, race/ ethnicity, gender, birthweight, and type of screening visit
N/A Trends analysis
Sherry et al. (1997)
Prevalence of anemia
PedNSS data for Vermont (1981-94) (most data provided by WIC programs)
Infants and children ages 6-59 months (n=12,000-19,500 records per year)
Prevalence estimates for each year for overall sampleby age
N/A Trends analysis
Yip et al. (1987) Prevalence of anemia
(1) PedNSS data for Arizona, Kentucky, Louisiana, Montana, Oregon, and Tennessee (1975-85) (Most data provided by WIC programs)
(2) Linked PedNSS and birth records for WIC participants in Tennessee PedNSS database (1975-84)
Infants and children ages 6-60 months (1) (n=499,759)(2) (n=72,983)
(1) Overall and age-specific prevalence estimates for each year: Initial measuresvs. followup measures
(2) Participant vs. nonparticipant
Participation dummy (1) Linear regression; angular chi-square (2) Multivariate regression
USDA/FNS (1978)
Hemoglobin, hematocrit, height, and weight
WIC records in PedNSS data for Arizona, Kentucky, Tennessee, and Washington(1974-76)
WIC infants and children ages 0-59 months with 3 or more WIC visits at approximately 6-month intervals(n=5,692)
10
Participants, before vs. after
Participation dummy Chi-square tests
See notes at end of table. Continued—
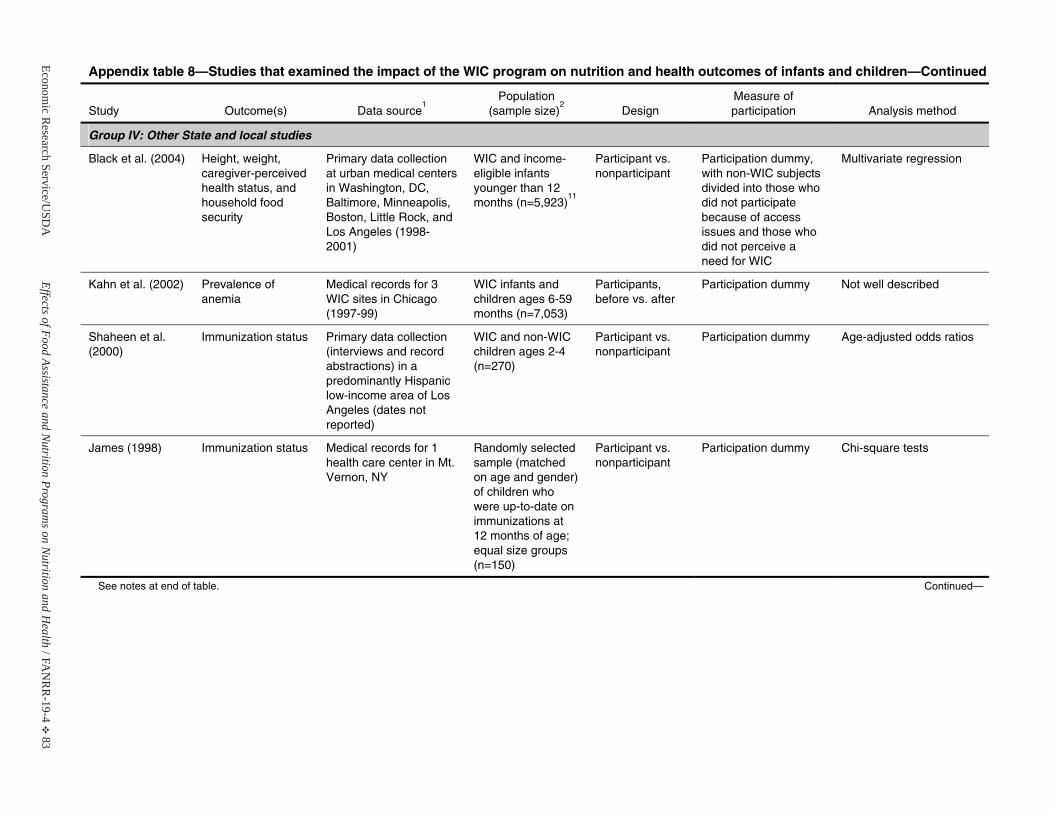
Economic R
esearch Service/USD
AEffects of Food Assistance and N
utrition Programs on N
utrition and Health / F A
NR
R-19-4
E 83
Appendix table 8—Studies that examined the impact of the WIC program on nutrition and health outcomes of infants and children—Continued
Study Outcome(s) Data source1
Population(sample size)
2Design
Measure of participation Analysis method
Group IV: Other State and local studies
Black et al. (2004) Height, weight, caregiver-perceived health status, and household foodsecurity
Primary data collection at urban medical centers in Washington, DC, Baltimore, Minneapolis, Boston, Little Rock, and Los Angeles (1998-2001)
WIC and income-eligible infants younger than 12months (n=5,923)
11
Participant vs. nonparticipant
Participation dummy, with non-WIC subjects divided into those who did not participate because of access issues and those who did not perceive a need for WIC
Multivariate regression
Kahn et al. (2002) Prevalence of anemia
Medical records for 3 WIC sites in Chicago (1997-99)
WIC infants and children ages 6-59 months (n=7,053)
Participants, before vs. after
Participation dummy Not well described
Shaheen et al. (2000)
Immunization status Primary data collection (interviews and record abstractions) in a predominantly Hispanic low-income area of Los Angeles (dates not reported)
WIC and non-WIC children ages 2-4 (n=270)
Participant vs. nonparticipant
Participation dummy Age-adjusted odds ratios
James (1998) Immunization status Medical records for 1 health care center in Mt. Vernon, NY
Randomly selected sample (matched on age and gender) of children whowere up-to-date on immunizations at 12 months of age; equal size groups (n=150)
Participant vs. nonparticipant
Participation dummy Chi-square tests
See notes at end of table. Continued—
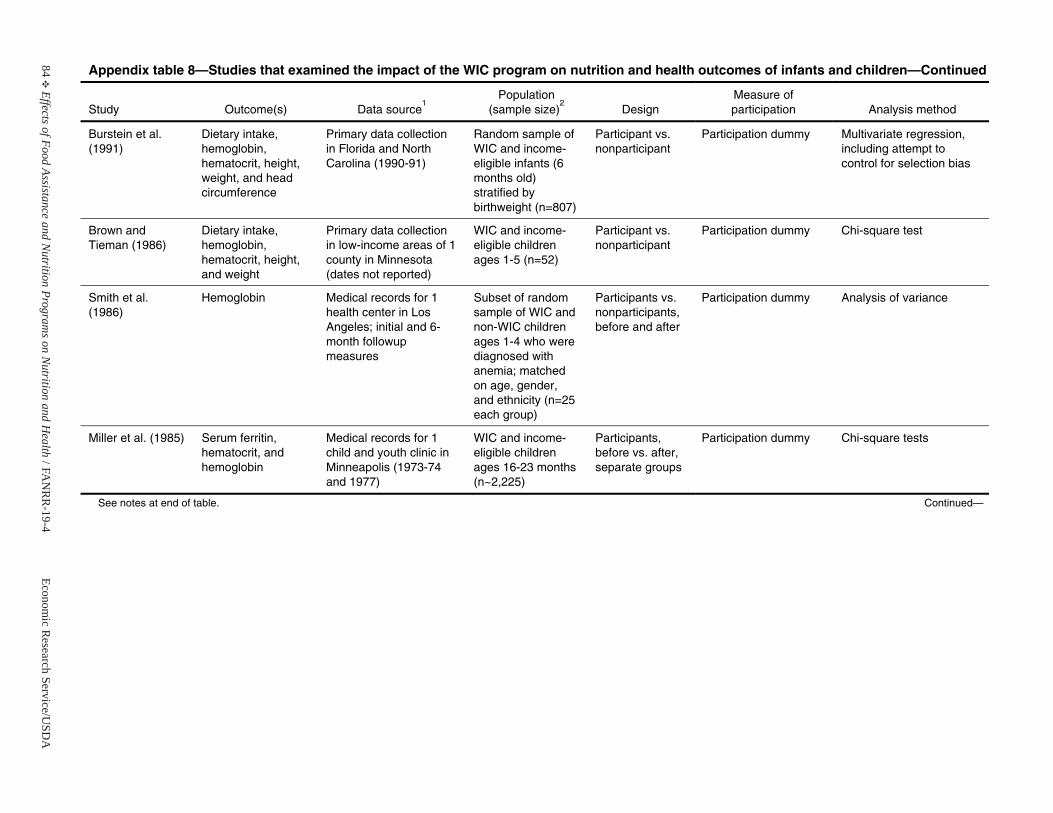
84E
Effects of Food Assistance and Nutrition Program
s on Nutrition and H
ealth / F AN
RR
-19-4Econom
ic Research Service/U
SDA
Appendix table 8—Studies that examined the impact of the WIC program on nutrition and health outcomes of infants and children—Continued
Study Outcome(s) Data source1
Population(sample size)
2Design
Measure of participation Analysis method
Burstein et al. (1991)
Dietary intake, hemoglobin, hematocrit, height, weight, and head circumference
Primary data collection in Florida and North Carolina (1990-91)
Random sample of WIC and income-eligible infants (6 months old) stratified by birthweight (n=807)
Participant vs. nonparticipant
Participation dummy Multivariate regression, including attempt to control for selection bias
Brown and Tieman (1986)
Dietary intake, hemoglobin, hematocrit, height, and weight
Primary data collection in low-income areas of 1 county in Minnesota (dates not reported)
WIC and income-eligible childrenages 1-5 (n=52)
Participant vs. nonparticipant
Participation dummy Chi-square test
Smith et al. (1986)
Hemoglobin Medical records for 1 health center in Los Angeles; initial and 6-month followupmeasures
Subset of random sample of WIC and non-WIC children ages 1-4 who were diagnosed withanemia; matched on age, gender, and ethnicity (n=25 each group)
Participants vs. nonparticipants,before and after
Participation dummy Analysis of variance
Miller et al. (1985) Serum ferritin, hematocrit, and hemoglobin
Medical records for 1 child and youth clinic in Minneapolis (1973-74 and 1977)
WIC and income-eligible childrenages 16-23 months (n~2,225)
Participants, before vs. after, separate groups
Participation dummy Chi-square tests
See notes at end of table. Continued—
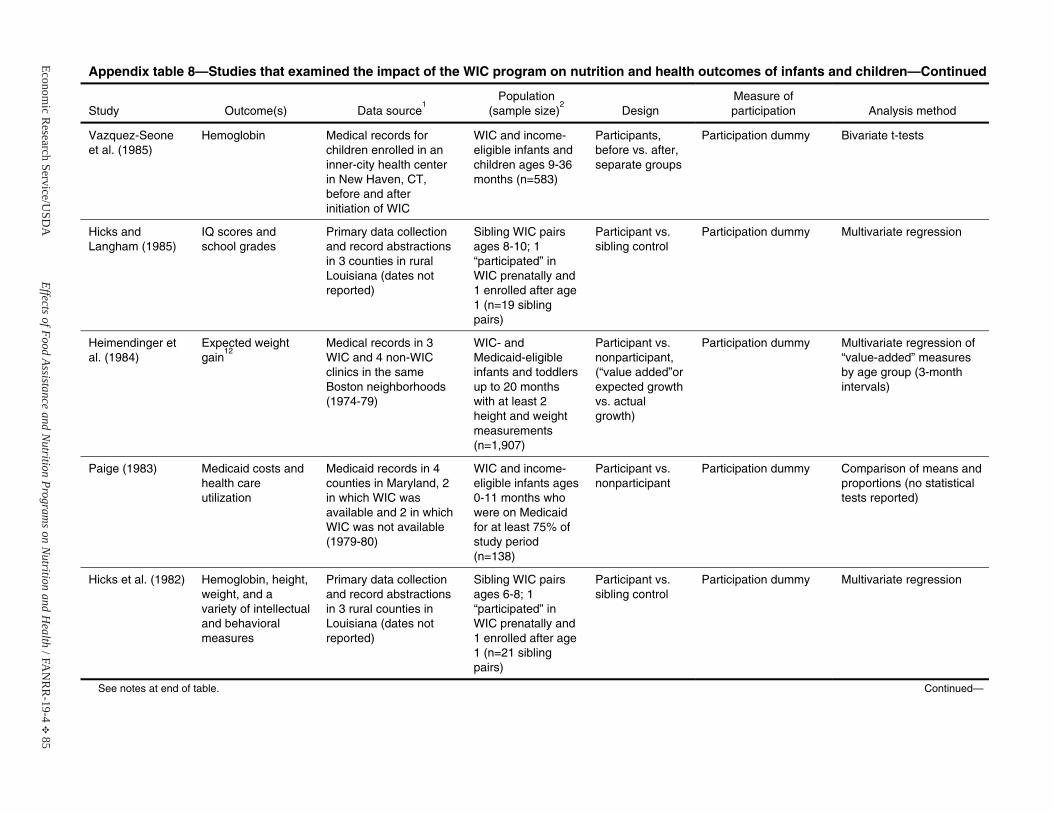
Economic R
esearch Service/USD
AEffects of Food Assistance and N
utrition Programs on N
utrition and Health / F A
NR
R-19-4
E 85
Appendix table 8—Studies that examined the impact of the WIC program on nutrition and health outcomes of infants and children—Continued
Study Outcome(s) Data source1
Population(sample size)
2Design
Measure of participation Analysis method
Vazquez-Seoneet al. (1985)
Hemoglobin Medical records for children enrolled in an inner-city health center in New Haven, CT, before and after initiation of WIC
WIC and income-eligible infants and children ages 9-36 months (n=583)
Participants, before vs. after, separate groups
Participation dummy Bivariate t-tests
Hicks and Langham (1985)
IQ scores and school grades
Primary data collection and record abstractions in 3 counties in rural Louisiana (dates not reported)
Sibling WIC pairs ages 8-10; 1 “participated” inWIC prenatally and 1 enrolled after age 1 (n=19 sibling pairs)
Participant vs. sibling control
Participation dummy Multivariate regression
Heimendinger et al. (1984)
Expected weight gain
12Medical records in 3 WIC and 4 non-WIC clinics in the same Boston neighborhoods (1974-79)
WIC- and Medicaid-eligible infants and toddlers up to 20 monthswith at least 2 height and weight measurements(n=1,907)
Participant vs. nonparticipant,(“value added”or expected growthvs. actual growth)
Participation dummy Multivariate regression of “value-added” measures by age group (3-month intervals)
Paige (1983) Medicaid costs and health care utilization
Medicaid records in 4 counties in Maryland, 2 in which WIC was available and 2 in which WIC was not available (1979-80)
WIC and income-eligible infants ages 0-11 months who were on Medicaid for at least 75% of study period (n=138)
Participant vs. nonparticipant
Participation dummy Comparison of means and proportions (no statistical tests reported)
Hicks et al. (1982) Hemoglobin, height, weight, and a variety of intellectual and behavioralmeasures
Primary data collection and record abstractions in 3 rural counties in Louisiana (dates not reported)
Sibling WIC pairs ages 6-8; 1 “participated” inWIC prenatally and 1 enrolled after age 1 (n=21 sibling pairs)
Participant vs. sibling control
Participation dummy Multivariate regression
See notes at end of table. Continued—
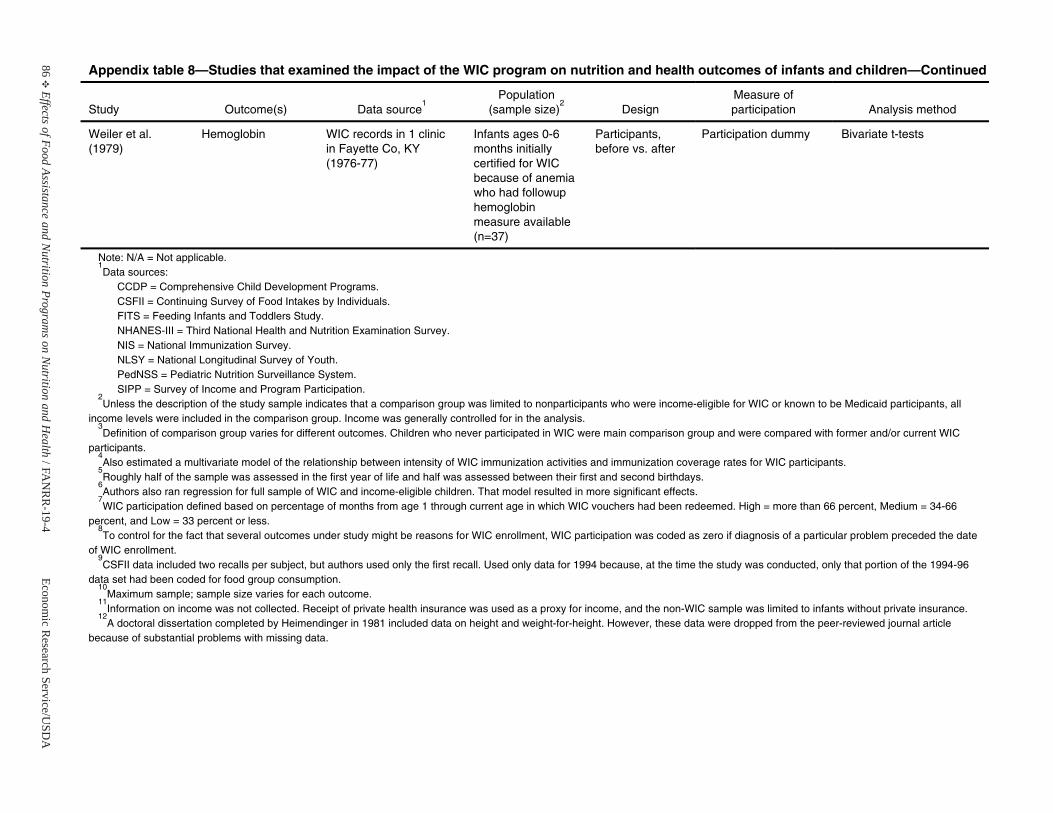
86E
Effects of Food Assistance and Nutrition Program
s on Nutrition and H
ealth / F AN
RR
-19-4Econom
ic Research Service/U
SDA
Appendix table 8—Studies that examined the impact of the WIC program on nutrition and health outcomes of infants and children—Continued
Study Outcome(s) Data source1
Population(sample size)
2Design
Measure of participation Analysis method
Weiler et al. (1979)
Hemoglobin WIC records in 1 clinic in Fayette Co, KY (1976-77)
Infants ages 0-6 months initiallycertified for WIC because of anemia who had followup hemoglobin measure available (n=37)
Participants, before vs. after
Participation dummy Bivariate t-tests
Note: N/A = Not applicable. 1Data sources:
CCDP = Comprehensive Child Development Programs. CSFII = Continuing Survey of Food Intakes by Individuals. FITS = Feeding Infants and Toddlers Study. NHANES-III = Third National Health and Nutrition Examination Survey. NIS = National Immunization Survey. NLSY = National Longitudinal Survey of Youth. PedNSS = Pediatric Nutrition Surveillance System.SIPP = Survey of Income and Program Participation.
2Unless the description of the study sample indicates that a comparison group was limited to nonparticipants who were income-eligible for WIC or known to be Medicaid participants, all
income levels were included in the comparison group. Income was generally controlled for in the analysis. 3Definition of comparison group varies for different outcomes. Children who never participated in WIC were main comparison group and were compared with former and/or current WIC
participants. 4Also estimated a multivariate model of the relationship between intensity of WIC immunization activities and immunization coverage rates for WIC participants.
5Roughly half of the sample was assessed in the first year of life and half was assessed between their first and second birthdays.
6Authors also ran regression for full sample of WIC and income-eligible children. That model resulted in more significant effects.
7WIC participation defined based on percentage of months from age 1 through current age in which WIC vouchers had been redeemed. High = more than 66 percent, Medium = 34-66
percent, and Low = 33 percent or less. 8To control for the fact that several outcomes under study might be reasons for WIC enrollment, WIC participation was coded as zero if diagnosis of a particular problem preceded the date
of WIC enrollment. 9CSFII data included two recalls per subject, but authors used only the first recall. Used only data for 1994 because, at the time the study was conducted, only that portion of the 1994-96
data set had been coded for food group consumption. 10
Maximum sample; sample size varies for each outcome. 11
Information on income was not collected. Receipt of private health insurance was used as a proxy for income, and the non-WIC sample was limited to infants without private insurance. 12
A doctoral dissertation completed by Heimendinger in 1981 included data on height and weight-for-height. However, these data were dropped from the peer-reviewed journal article because of substantial problems with missing data.
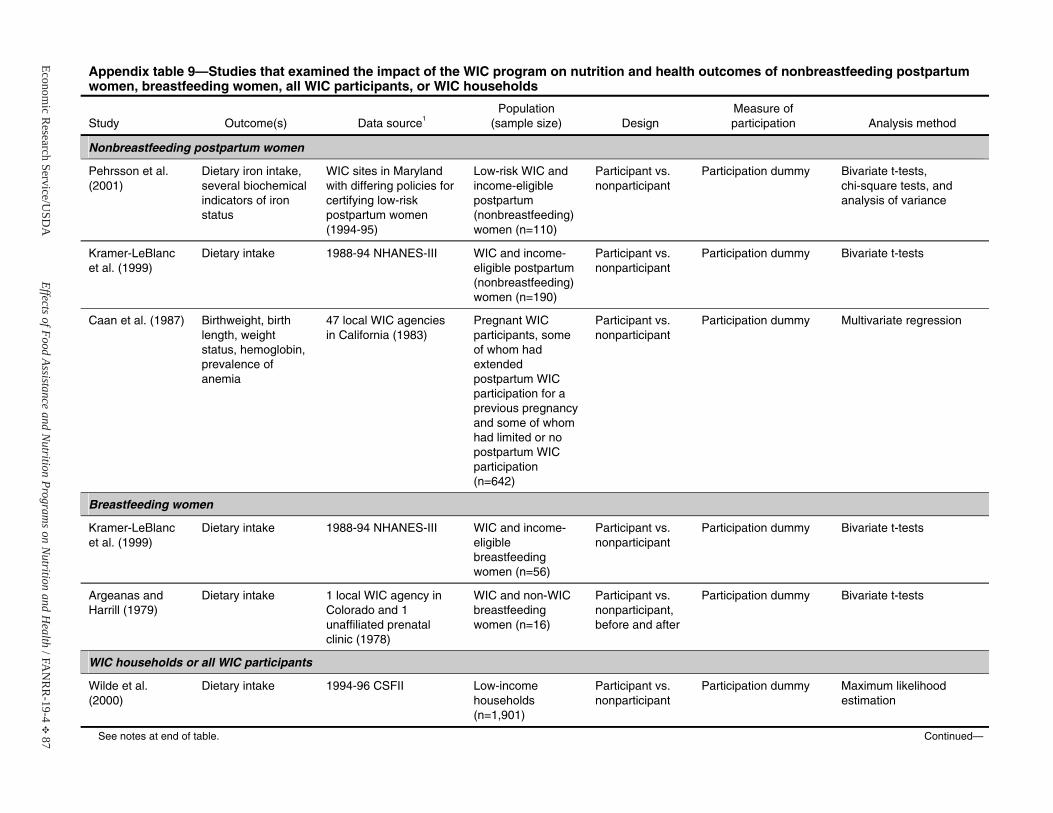
Economic R
esearch Service/USD
AEffects of Food Assistance and N
utrition Programs on N
utrition and Health / F A
NR
R-19-4
E 87
Appendix table 9—Studies that examined the impact of the WIC program on nutrition and health outcomes of nonbreastfeeding postpartum women, breastfeeding women, all WIC participants, or WIC households
Study Outcome(s) Data source1Population
(sample size) Design Measure of participation Analysis method
Nonbreastfeeding postpartum women
Pehrsson et al. (2001)
Dietary iron intake, several biochemical indicators of ironstatus
WIC sites in Marylandwith differing policies for certifying low-risk postpartum women (1994-95)
Low-risk WIC and income-eligiblepostpartum (nonbreastfeeding) women (n=110)
Participant vs. nonparticipant
Participation dummy Bivariate t-tests, chi-square tests, and analysis of variance
Kramer-LeBlancet al. (1999)
Dietary intake 1988-94 NHANES-III WIC and income-eligible postpartum (nonbreastfeeding) women (n=190)
Participant vs. nonparticipant
Participation dummy Bivariate t-tests
Caan et al. (1987) Birthweight, birth length, weight status, hemoglobin, prevalence of anemia
47 local WIC agencies in California (1983)
Pregnant WIC participants, some of whom had extended postpartum WIC participation for a previous pregnancy and some of whom had limited or no postpartum WIC participation (n=642)
Participant vs. nonparticipant
Participation dummy Multivariate regression
Breastfeeding women
Kramer-LeBlancet al. (1999)
Dietary intake 1988-94 NHANES-III WIC and income-eligiblebreastfeeding women (n=56)
Participant vs. nonparticipant
Participation dummy Bivariate t-tests
Argeanas and Harrill (1979)
Dietary intake 1 local WIC agency in Colorado and 1 unaffiliated prenatal clinic (1978)
WIC and non-WIC breastfeeding women (n=16)
Participant vs. nonparticipant,before and after
Participation dummy Bivariate t-tests
WIC households or all WIC participants
Wilde et al. (2000)
Dietary intake 1994-96 CSFII Low-income households (n=1,901)
Participant vs. nonparticipant
Participation dummy Maximum likelihood estimation
See notes at end of table. Continued—
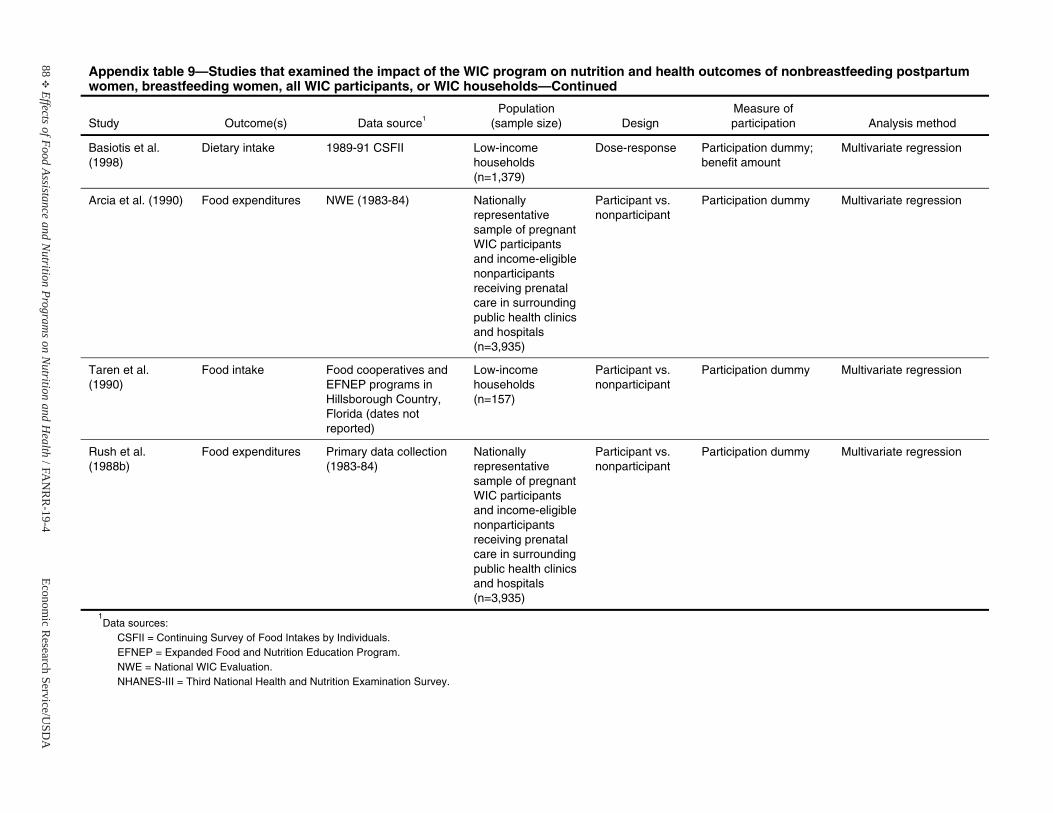
88E
Effects of Food Assistance and Nutrition Program
s on Nutrition and H
ealth / F AN
RR
-19-4Econom
ic Research Service/U
SDA
Appendix table 9—Studies that examined the impact of the WIC program on nutrition and health outcomes of nonbreastfeeding postpartum women, breastfeeding women, all WIC participants, or WIC households—Continued
Study Outcome(s) Data source1Population
(sample size) Design Measure of participation Analysis method
Basiotis et al. (1998)
Dietary intake 1989-91 CSFII Low-income households (n=1,379)
Dose-response Participation dummy;benefit amount
Multivariate regression
Arcia et al. (1990) Food expenditures NWE (1983-84) Nationallyrepresentative sample of pregnant WIC participants and income-eligible nonparticipantsreceiving prenatal care in surrounding public health clinics and hospitals (n=3,935)
Participant vs. nonparticipant
Participation dummy Multivariate regression
Taren et al. (1990)
Food intake Food cooperatives and EFNEP programs in Hillsborough Country, Florida (dates not reported)
Low-income households (n=157)
Participant vs. nonparticipant
Participation dummy Multivariate regression
Rush et al. (1988b)
Food expenditures Primary data collection (1983-84)
Nationally representative sample of pregnant WIC participants and income-eligible nonparticipantsreceiving prenatal care in surrounding public health clinics and hospitals (n=3,935)
Participant vs. nonparticipant
Participation dummy Multivariate regression
1Data sources:
CSFII = Continuing Survey of Food Intakes by Individuals. EFNEP = Expanded Food and Nutrition Education Program. NWE = National WIC Evaluation.NHANES-III = Third National Health and Nutrition Examination Survey.

Economic Research Service/USDA Effects of Food Assistance and Nutrition Programs on Nutrition and Health / FANRR-19-4 E 89
National School Lunch Program
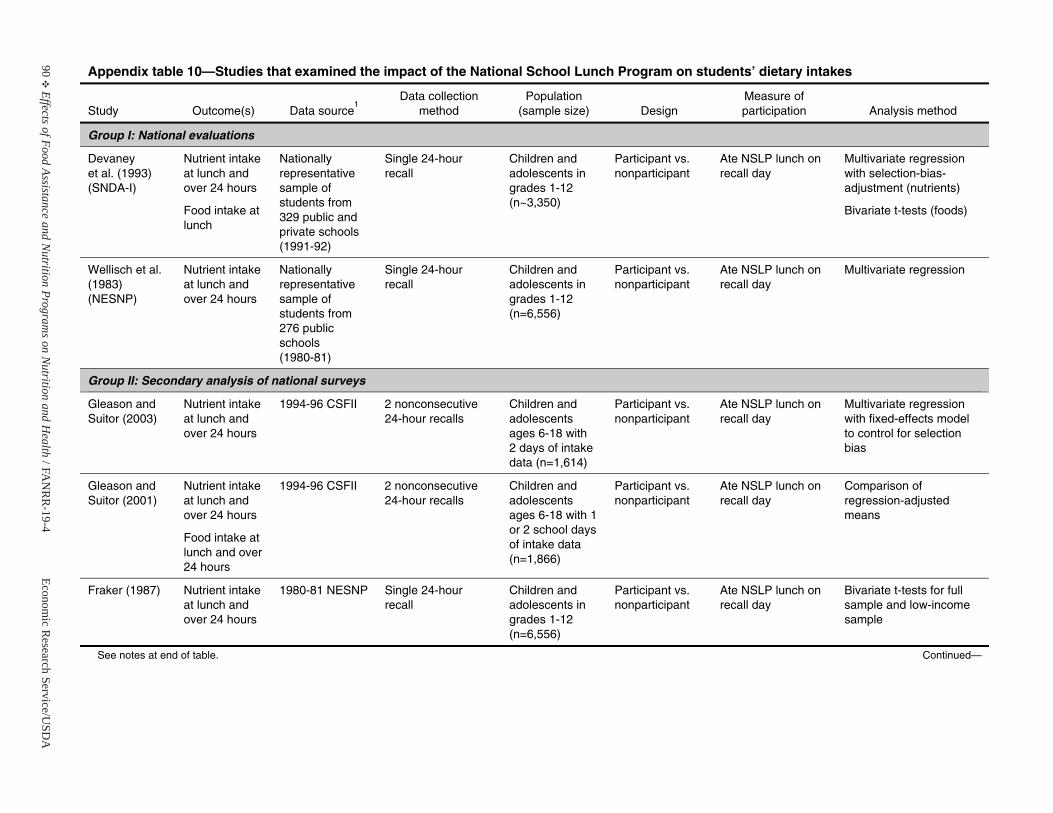
90E
Effects of Food Assistance and Nutrition Program
s on Nutrition and H
ealth / F AN
RR
-19-4Econom
ic Research Service/U
SDA
Appendix table 10—Studies that examined the impact of the National School Lunch Program on students’ dietary intakes
Study Outcome(s) Data source1
Data collection method
Population(sample size) Design
Measure of participation Analysis method
Group I: National evaluations
Devaney et al. (1993) (SNDA-I)
Nutrient intake at lunch and over 24 hours
Food intake at lunch
Nationally representative sample of students from 329 public and private schools(1991-92)
Single 24-hour recall
Children and adolescents in grades 1-12 (n~3,350)
Participant vs. nonparticipant
Ate NSLP lunch on recall day
Multivariate regressionwith selection-bias-adjustment (nutrients)
Bivariate t-tests (foods)
Wellisch et al. (1983) (NESNP)
Nutrient intake at lunch and over 24 hours
Nationally representative sample of students from 276 public schools (1980-81)
Single 24-hour recall
Children and adolescents in grades 1-12 (n=6,556)
Participant vs. nonparticipant
Ate NSLP lunch on recall day
Multivariate regression
Group II: Secondary analysis of national surveys
Gleason and Suitor (2003)
Nutrient intake at lunch and over 24 hours
1994-96 CSFII 2 nonconsecutive 24-hour recalls
Children and adolescents ages 6-18 with 2 days of intakedata (n=1,614)
Participant vs. nonparticipant
Ate NSLP lunch on recall day
Multivariate regressionwith fixed-effects model to control for selection bias
Gleason and Suitor (2001)
Nutrient intake at lunch and over 24 hours
Food intake at lunch and over24 hours
1994-96 CSFII 2 nonconsecutive 24-hour recalls
Children and adolescents ages 6-18 with 1 or 2 school days of intake data (n=1,866)
Participant vs. nonparticipant
Ate NSLP lunch on recall day
Comparison of regression-adjusted means
Fraker (1987) Nutrient intake at lunch and over 24 hours
1980-81 NESNP Single 24-hour recall
Children and adolescents in grades 1-12 (n=6,556)
Participant vs. nonparticipant
Ate NSLP lunch on recall day
Bivariate t-tests for full sample and low-incomesample
See notes at end of table. Continued—
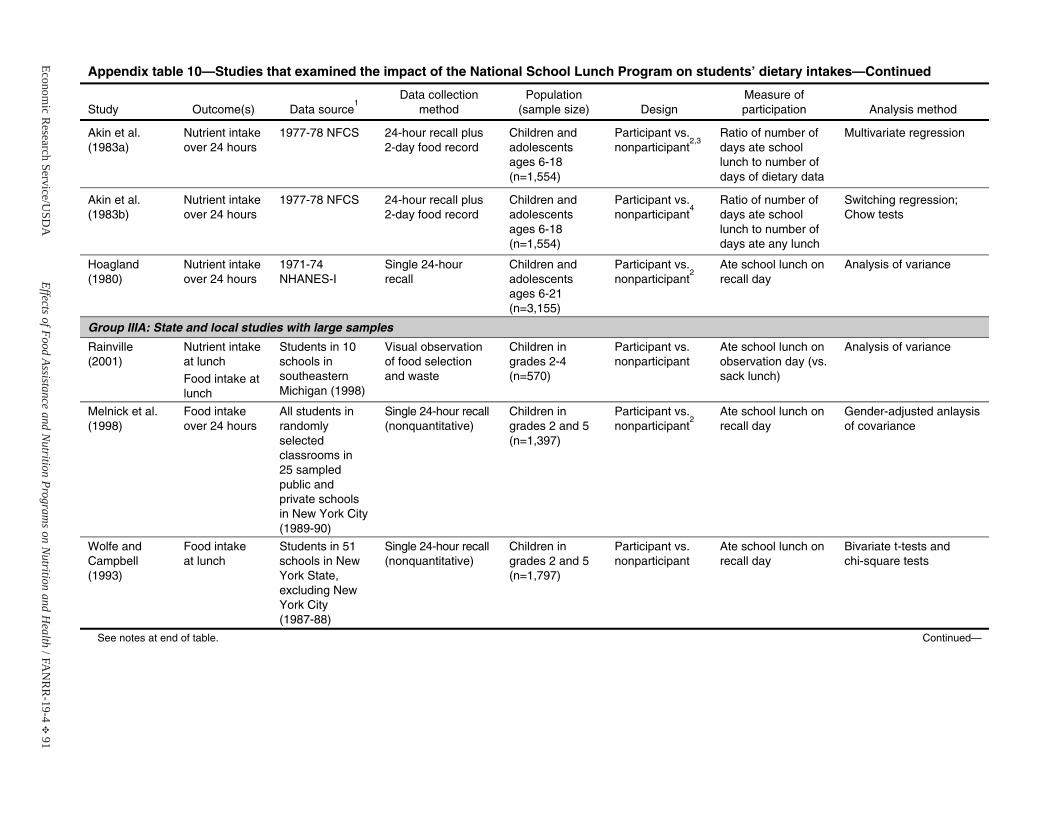
Economic R
esearch Service/USD
AEffects of Food Assistance and N
utrition Programs on N
utrition and Health / F A
NR
R-19-4
E 91
Appendix table 10—Studies that examined the impact of the National School Lunch Program on students’ dietary intakes—Continued
Study Outcome(s) Data source1
Data collection method
Population(sample size) Design
Measure of participation Analysis method
Akin et al. (1983a)
Nutrient intake over 24 hours
1977-78 NFCS 24-hour recall plus 2-day food record
Children and adolescents ages 6-18 (n=1,554)
Participant vs. nonparticipant
2,3Ratio of number of days ate school lunch to number of days of dietary data
Multivariate regression
Akin et al. (1983b)
Nutrient intake over 24 hours
1977-78 NFCS 24-hour recall plus 2-day food record
Children and adolescents ages 6-18 (n=1,554)
Participant vs. nonparticipant
4Ratio of number of days ate school lunch to number of days ate any lunch
Switching regression; Chow tests
Hoagland (1980)
Nutrient intake over 24 hours
1971-74 NHANES-I
Single 24-hour recall
Children and adolescents ages 6-21 (n=3,155)
Participant vs. nonparticipant
2Ate school lunch on recall day
Analysis of variance
Group IIIA: State and local studies with large samples
Rainville (2001)
Nutrient intake at lunch
Food intake at lunch
Students in 10schools insoutheastern Michigan (1998)
Visual observation of food selection and waste
Children ingrades 2-4 (n=570)
Participant vs. nonparticipant
Ate school lunch on observation day (vs. sack lunch)
Analysis of variance
Melnick et al. (1998)
Food intakeover 24 hours
All students in randomly selected classrooms in 25 sampled public and private schoolsin New York City (1989-90)
Single 24-hour recall (nonquantitative)
Children ingrades 2 and 5(n=1,397)
Participant vs. nonparticipant
2Ate school lunch on recall day
Gender-adjusted anlaysis of covariance
Wolfe and Campbell (1993)
Food intakeat lunch
Students in 51schools in NewYork State, excluding New York City (1987-88)
Single 24-hour recall (nonquantitative)
Children ingrades 2 and 5(n=1,797)
Participant vs. nonparticipant
Ate school lunch on recall day
Bivariate t-tests and chi-square tests
See notes at end of table. Continued—
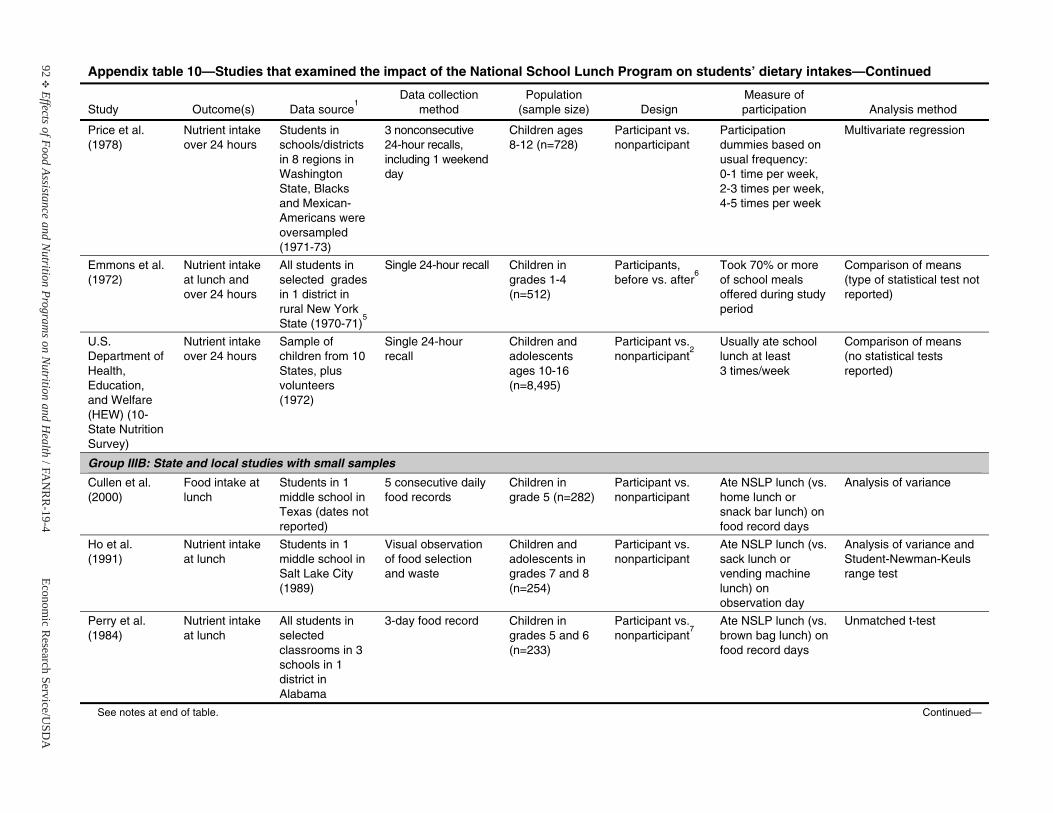
92E
Effects of Food Assistance and Nutrition Program
s on Nutrition and H
ealth / F AN
RR
-19-4Econom
ic Research Service/U
SDA
Appendix table 10—Studies that examined the impact of the National School Lunch Program on students’ dietary intakes—Continued
Study Outcome(s) Data source1
Data collection method
Population(sample size) Design
Measure of participation Analysis method
Price et al. (1978)
Nutrient intake over 24 hours
Students in schools/districts in 8 regions inWashington State, Blacks and Mexican-Americans wereoversampled (1971-73)
3 nonconsecutive 24-hour recalls, including 1 weekend day
Children ages 8-12 (n=728)
Participant vs. nonparticipant
Participation dummies based on usual frequency: 0-1 time per week, 2-3 times per week, 4-5 times per week
Multivariate regression
Emmons et al. (1972)
Nutrient intake at lunch and over 24 hours
All students in selected grades in 1 district in rural New YorkState (1970-71)
5
Single 24-hour recall Children ingrades 1-4 (n=512)
Participants,before vs. after
6Took 70% or more of school meals offered during study period
Comparison of means (type of statistical test not reported)
U.S. Department of Health, Education, and Welfare (HEW) (10-State Nutrition Survey)
Nutrient intake over 24 hours
Sample of children from 10States, plus volunteers (1972)
Single 24-hour recall
Children and adolescents ages 10-16 (n=8,495)
Participant vs. nonparticipant
2Usually ate school lunch at least 3 times/week
Comparison of means (no statistical tests reported)
Group IIIB: State and local studies with small samples
Cullen et al. (2000)
Food intake at lunch
Students in 1 middle school inTexas (dates not reported)
5 consecutive daily food records
Children ingrade 5 (n=282)
Participant vs. nonparticipant
Ate NSLP lunch (vs. home lunch or snack bar lunch) on food record days
Analysis of variance
Ho et al. (1991)
Nutrient intake at lunch
Students in 1 middle school inSalt Lake City (1989)
Visual observation of food selection and waste
Children and adolescents in grades 7 and 8(n=254)
Participant vs. nonparticipant
Ate NSLP lunch (vs. sack lunch or vending machine lunch) on observation day
Analysis of variance and Student-Newman-Keuls range test
Perry et al. (1984)
Nutrient intake at lunch
All students in selected classrooms in 3 schools in 1 district in Alabama
3-day food record Children ingrades 5 and 6(n=233)
Participant vs. nonparticipant
7Ate NSLP lunch (vs. brown bag lunch) on food record days
Unmatched t-test
See notes at end of table. Continued—
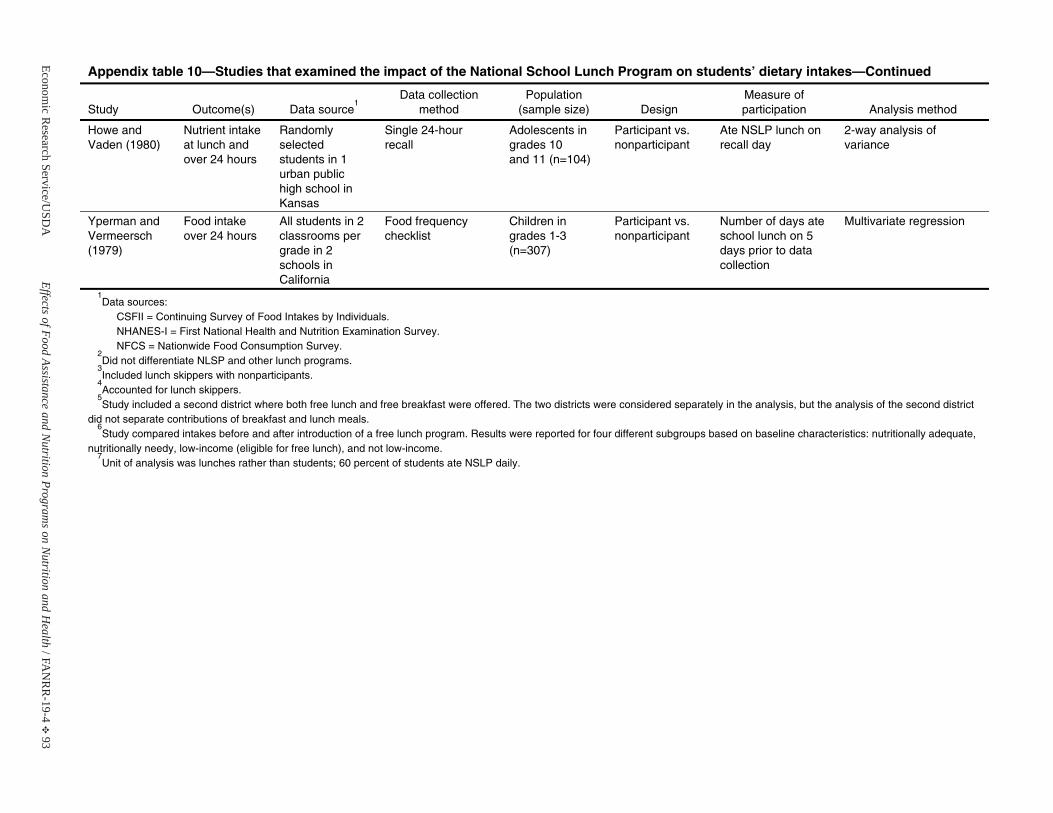
Economic R
esearch Service/USD
AEffects of Food Assistance and N
utrition Programs on N
utrition and Health / F A
NR
R-19-4
E 93
Appendix table 10—Studies that examined the impact of the National School Lunch Program on students’ dietary intakes—Continued
Study Outcome(s) Data source1
Data collection method
Population(sample size) Design
Measure of participation Analysis method
Howe and Vaden (1980)
Nutrient intake at lunch and over 24 hours
Randomly selected students in 1 urban public high school in Kansas
Single 24-hour recall
Adolescents in grades 10 and 11 (n=104)
Participant vs. nonparticipant
Ate NSLP lunch on recall day
2-way analysis of variance
Yperman and Vermeersch (1979)
Food intakeover 24 hours
All students in 2 classrooms pergrade in 2 schools inCalifornia
Food frequency checklist
Children ingrades 1-3 (n=307)
Participant vs. nonparticipant
Number of days ate school lunch on 5 days prior to data collection
Multivariate regression
1Data sources:
CSFII = Continuing Survey of Food Intakes by Individuals. NHANES-I = First National Health and Nutrition Examination Survey.NFCS = Nationwide Food Consumption Survey.
2Did not differentiate NLSP and other lunch programs.
3Included lunch skippers with nonparticipants.
4Accounted for lunch skippers.
5Study included a second district where both free lunch and free breakfast were offered. The two districts were considered separately in the analysis, but the analysis of the second district
did not separate contributions of breakfast and lunch meals. 6Study compared intakes before and after introduction of a free lunch program. Results were reported for four different subgroups based on baseline characteristics: nutritionally adequate,
nutritionally needy, low-income (eligible for free lunch), and not low-income. 7Unit of analysis was lunches rather than students; 60 percent of students ate NSLP daily.
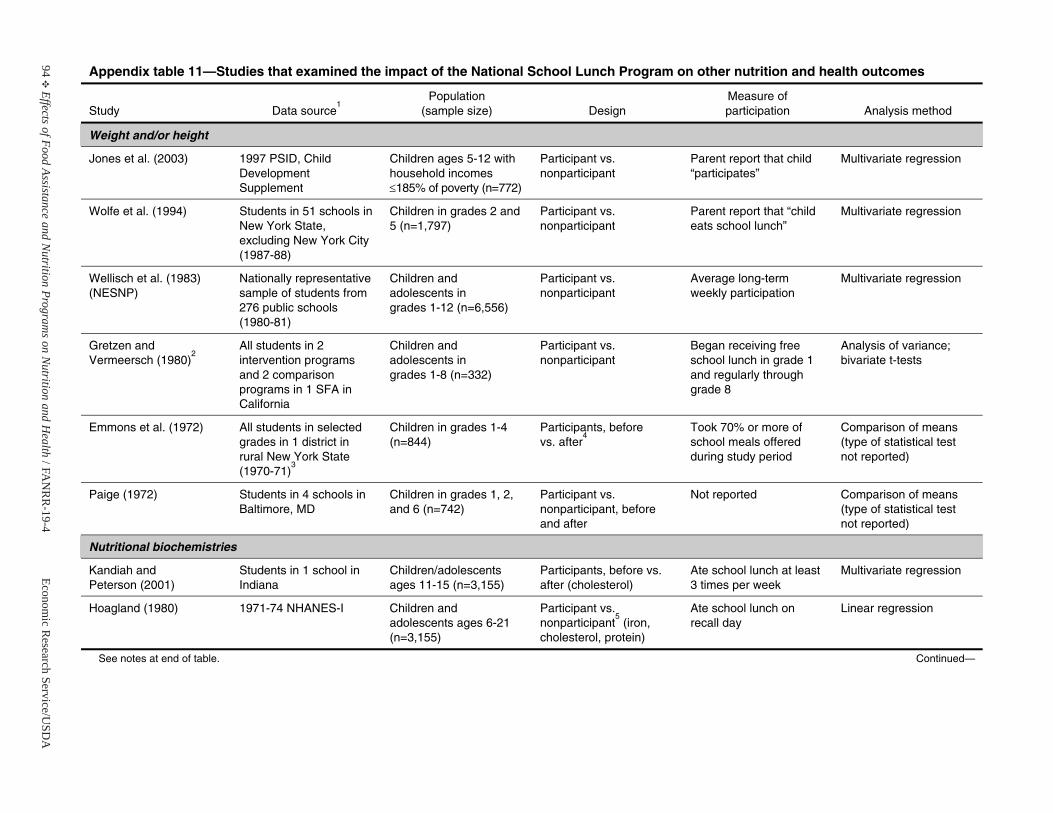
94E
Effects of Food Assistance and Nutrition Program
s on Nutrition and H
ealth / F AN
RR
-19-4Econom
ic Research Service/U
SDA
Appendix table 11—Studies that examined the impact of the National School Lunch Program on other nutrition and health outcomes
Study Data source1
Population(sample size) Design
Measure of participation Analysis method
Weight and/or height
Jones et al. (2003) 1997 PSID, Child Development Supplement
Children ages 5-12 with household incomes d185% of poverty (n=772)
Participant vs. nonparticipant
Parent report that child “participates”
Multivariate regression
Wolfe et al. (1994) Students in 51 schools inNew York State, excluding New York City (1987-88)
Children in grades 2 and 5 (n=1,797)
Participant vs. nonparticipant
Parent report that “childeats school lunch”
Multivariate regression
Wellisch et al. (1983) (NESNP)
Nationally representative sample of students from 276 public schools (1980-81)
Children and adolescents in grades 1-12 (n=6,556)
Participant vs. nonparticipant
Average long-term weekly participation
Multivariate regression
Gretzen and Vermeersch (1980)
2All students in 2 intervention programs and 2 comparison programs in 1 SFA in California
Children and adolescents in grades 1-8 (n=332)
Participant vs. nonparticipant
Began receiving free school lunch in grade 1 and regularly through grade 8
Analysis of variance; bivariate t-tests
Emmons et al. (1972) All students in selectedgrades in 1 district in rural New York State (1970-71)
3
Children in grades 1-4 (n=844)
Participants, before vs. after
4Took 70% or more of school meals offered during study period
Comparison of means (type of statistical test not reported)
Paige (1972) Students in 4 schools inBaltimore, MD
Children in grades 1, 2, and 6 (n=742)
Participant vs. nonparticipant, before and after
Not reported Comparison of means (type of statistical test not reported)
Nutritional biochemistries
Kandiah and Peterson (2001)
Students in 1 school inIndiana
Children/adolescents ages 11-15 (n=3,155)
Participants, before vs. after (cholesterol)
Ate school lunch at least 3 times per week
Multivariate regression
Hoagland (1980) 1971-74 NHANES-I Children and adolescents ages 6-21 (n=3,155)
Participant vs. nonparticipant
5 (iron,
cholesterol, protein)
Ate school lunch on recall day
Linear regression
See notes at end of table. Continued—
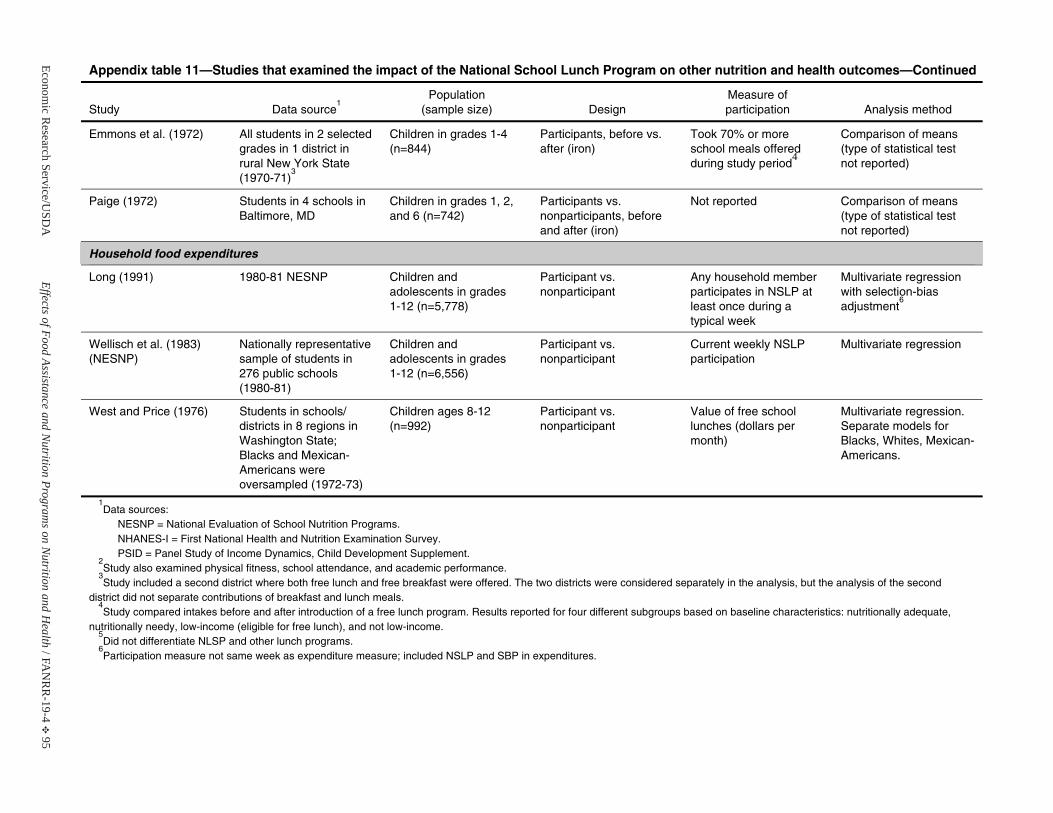
Economic R
esearch Service/USD
AEffects of Food Assistance and N
utrition Programs on N
utrition and Health / F A
NR
R-19-4
E 95
Appendix table 11—Studies that examined the impact of the National School Lunch Program on other nutrition and health outcomes—Continued
Study Data source1
Population(sample size) Design
Measure of participation Analysis method
Emmons et al. (1972) All students in 2 selectedgrades in 1 district in rural New York State (1970-71)
3
Children in grades 1-4 (n=844)
Participants, before vs. after (iron)
Took 70% or more school meals offered during study period
4
Comparison of means (type of statistical test not reported)
Paige (1972) Students in 4 schools inBaltimore, MD
Children in grades 1, 2, and 6 (n=742)
Participants vs. nonparticipants, before and after (iron)
Not reported Comparison of means (type of statistical test not reported)
Household food expenditures
Long (1991) 1980-81 NESNP Children and adolescents in grades 1-12 (n=5,778)
Participant vs. nonparticipant
Any household member participates in NSLP at least once during a typical week
Multivariate regressionwith selection-bias adjustment
6
Wellisch et al. (1983) (NESNP)
Nationally representative sample of students in 276 public schools (1980-81)
Children and adolescents in grades 1-12 (n=6,556)
Participant vs. nonparticipant
Current weekly NSLP participation
Multivariate regression
West and Price (1976) Students in schools/ districts in 8 regions inWashington State; Blacks and Mexican-Americans wereoversampled (1972-73)
Children ages 8-12 (n=992)
Participant vs. nonparticipant
Value of free school lunches (dollars per month)
Multivariate regression. Separate models for Blacks, Whites, Mexican-Americans.
1Data sources:
NESNP = National Evaluation of School Nutrition Programs. NHANES-I = First National Health and Nutrition Examination Survey.PSID = Panel Study of Income Dynamics, Child Development Supplement.
2Study also examined physical fitness, school attendance, and academic performance.
3Study included a second district where both free lunch and free breakfast were offered. The two districts were considered separately in the analysis, but the analysis of the second
district did not separate contributions of breakfast and lunch meals.4Study compared intakes before and after introduction of a free lunch program. Results reported for four different subgroups based on baseline characteristics: nutritionally adequate,
nutritionally needy, low-income (eligible for free lunch), and not low-income. 5Did not differentiate NLSP and other lunch programs.
6Participation measure not same week as expenditure measure; included NSLP and SBP in expenditures.


Economic Research Service/USDA Effects of Food Assistance and Nutrition Programs on Nutrition and Health / FANRR-19-4 E 97
School Breakfast Program

98E
Effects of Food Assistance and Nutrition Program
s on Nutrition and H
ealth / F AN
RR
-19-4Econom
ic Research Service/U
SDA
Appendix table 12—Studies that examined the impact of the School Breakfast Program on students’ dietary intakes
Study Outcome(s) Data source1
Data collection method
Population(sample size) Design
Measure of participation Analysis method
Group I: National evaluations
Devaney and Stuart (1998) (SNDA-I)
Likelihood of eating breakfast
Nationally representative sample of students from 329 public and private schools
Single 24-hour recall
Children and adolescents in grades 1-12 (n=2,966)
Participant vs. nonparticipant
Ate SBP breakfast on recall day
Multivariate regressionwith selection-bias adjustment
Gordon et al. (1995) (SNDA-I)
Nutrient intake at breakfast and over 24 hours
Food intake at breakfast
Nationally representative sample of students from 329 public and private schools
Single 24-hour recall
Children and adolescents in grades 1-12 (n=2,966)
Participant vs. nonparticipant
Ate SBP breakfast on recall day
Multivariate regressionwith selection-bias adjustment (nutrients)
Bivariate t-tests (foods)
Wellisch et al. (1983) (NESNP)
Nutrient intake at breakfast and over 24 hours
2
Nationally representative sample of students from 276 public schools
Single 24-hour recall
Children and adolescents in grades 1-12 (n=2,180)
Participant vs. nonparticipant
Ate SBP breakfast and NSLP lunch on recall day (nonparti-cipants ate NSLP lunch only)
Multivariate regression
Group II: Secondary analysis of national surveys
Gleason and Suitor (2001)
Nutrient intake at breakfast and over 24 hours
Food intake at breakfast and over 24 hours
1994-96 CSFII 2 nonconsecutive 24-hour recalls
Children and adolescents in SBP schools ages 6-18 (n=2,693)
Participant vs. nonparticipant
Ate SBP breakfast on recall day
Comparison of regression-adjusted means
Basiotis et al. (1999)
Nutrient intake over 24 hours
Food intakeover 24 hours
1994-96 CSFII 2 nonconsecutive 24-hour recalls
Low-income children ages 6-18 (sample size not reported)
Participant vs. nonparticipant
Ate SBP breakfast on recall day
Multivariate regression
Devaney and Fraker (1989)
Nutrient intake at breakfast and over 24 hours
1980-81 NESNP Single 24-hour recall
Children ages 5-10 (n=2,118)and 11-21 (n=2,809)
Participant vs. nonparticipant
Ate SBP breakfast on recall day
Multivariate regression
See notes at end of table. Continued—
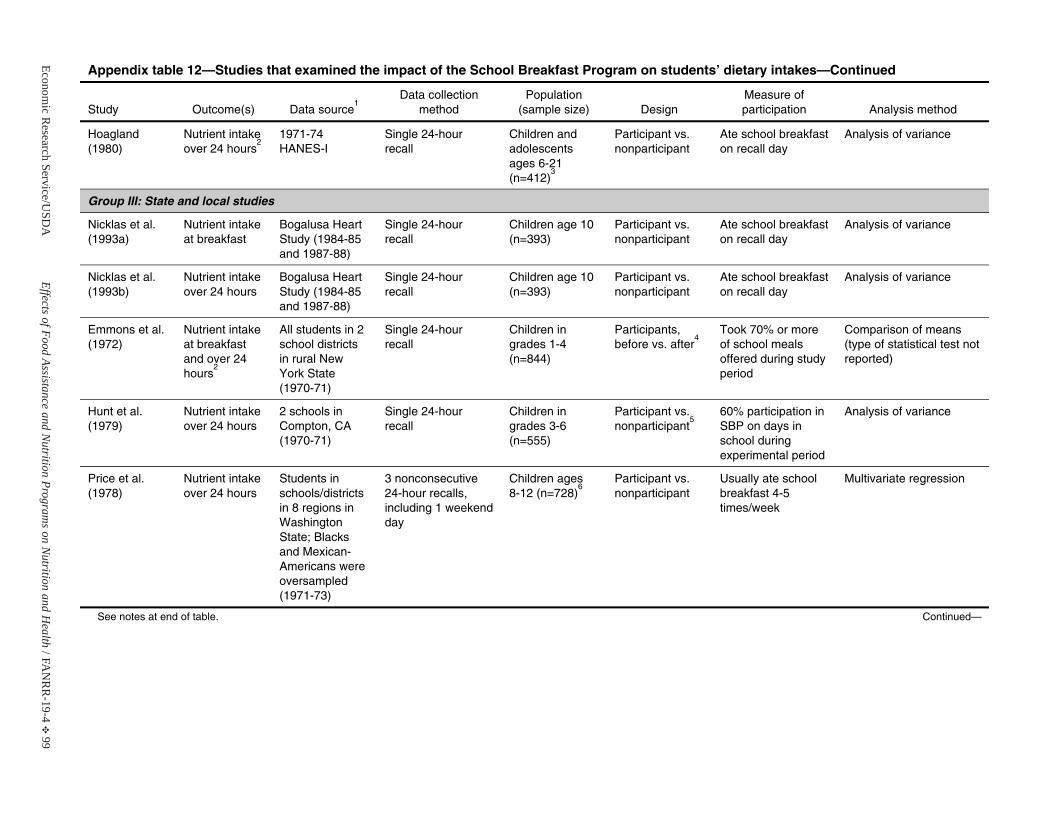
Economic R
esearch Service/USD
AEffects of Food Assistance and N
utrition Programs on N
utrition and Health / F A
NR
R-19-4
E 99
Appendix table 12—Studies that examined the impact of the School Breakfast Program on students’ dietary intakes—Continued
Study Outcome(s) Data source1
Data collection method
Population(sample size) Design
Measure of participation Analysis method
Hoagland (1980)
Nutrient intake over 24 hours
21971-74 HANES-I
Single 24-hour recall
Children and adolescents ages 6-21 (n=412)
3
Participant vs. nonparticipant
Ate school breakfast on recall day
Analysis of variance
Group III: State and local studies
Nicklas et al. (1993a)
Nutrient intake at breakfast
Bogalusa Heart Study (1984-85and 1987-88)
Single 24-hour recall
Children age 10 (n=393)
Participant vs. nonparticipant
Ate school breakfast on recall day
Analysis of variance
Nicklas et al. (1993b)
Nutrient intake over 24 hours
Bogalusa Heart Study (1984-85and 1987-88)
Single 24-hour recall
Children age 10 (n=393)
Participant vs. nonparticipant
Ate school breakfast on recall day
Analysis of variance
Emmons et al. (1972)
Nutrient intake at breakfast and over 24 hours
2
All students in 2 school districts in rural New York State (1970-71)
Single 24-hour recall
Children ingrades 1-4 (n=844)
Participants, before vs. after
4Took 70% or more of school meals offered during study period
Comparison of means (type of statistical test not reported)
Hunt et al. (1979)
Nutrient intake over 24 hours
2 schools in Compton, CA (1970-71)
Single 24-hour recall
Children ingrades 3-6 (n=555)
Participant vs. nonparticipant
560% participation in SBP on days in school during experimental period
Analysis of variance
Price et al. (1978)
Nutrient intake over 24 hours
Students in schools/districts in 8 regions inWashington State; Blacks and Mexican-Americans wereoversampled (1971-73)
3 nonconsecutive 24-hour recalls, including 1 weekend day
Children ages 8-12 (n=728)
6Participant vs. nonparticipant
Usually ate school breakfast 4-5 times/week
Multivariate regression
See notes at end of table. Continued—
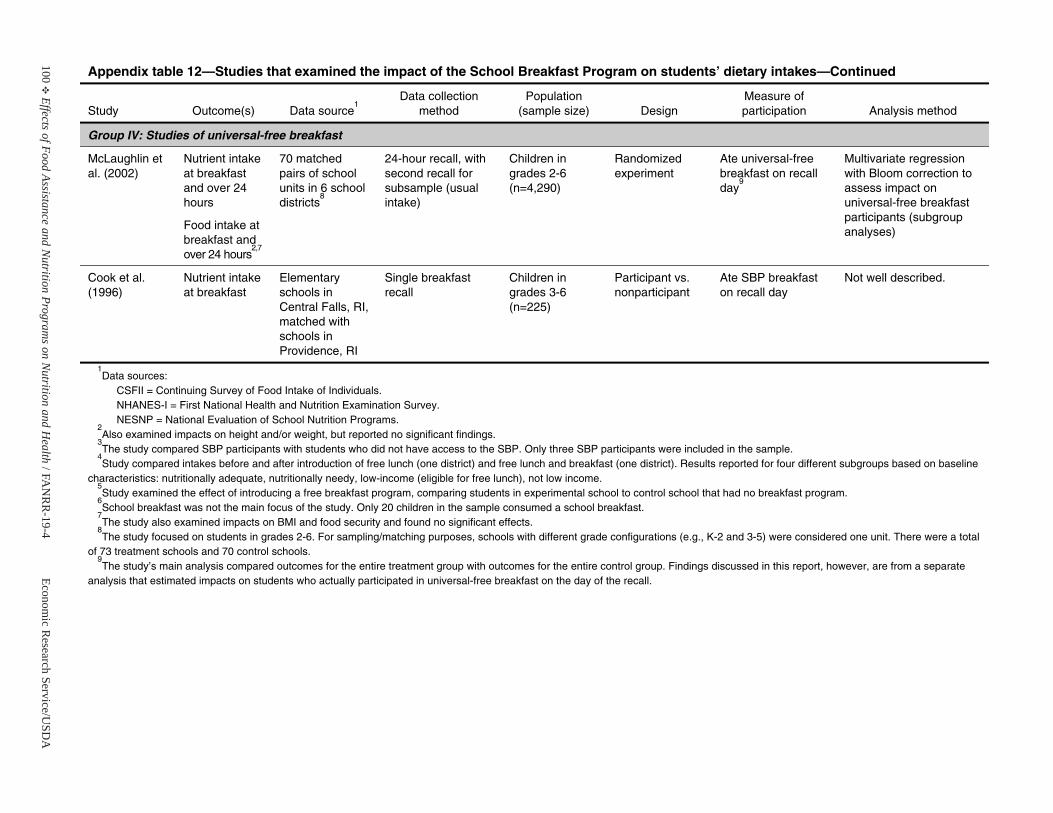
100E
Effects of Food Assistance and Nutrition Program
s on Nutrition and H
ealth / F AN
RR
-19-4Econom
ic Research Service/U
SDA
Appendix table 12—Studies that examined the impact of the School Breakfast Program on students’ dietary intakes—Continued
Study Outcome(s) Data source1
Data collection method
Population(sample size) Design
Measure of participation Analysis method
Group IV: Studies of universal-free breakfast
McLaughlin et al. (2002)
Nutrient intake at breakfast and over 24 hours
Food intake at breakfast and over 24 hours
2,7
70 matched pairs of school units in 6 school districts
8
24-hour recall, with second recall for subsample (usual intake)
Children ingrades 2-6 (n=4,290)
Randomized experiment
Ate universal-free breakfast on recall day
9
Multivariate regressionwith Bloom correction to assess impact on universal-free breakfast participants (subgroup analyses)
Cook et al. (1996)
Nutrient intake at breakfast
Elementary schools inCentral Falls, RI, matched with schools inProvidence, RI
Single breakfast recall
Children ingrades 3-6 (n=225)
Participant vs. nonparticipant
Ate SBP breakfast on recall day
Not well described.
1Data sources:
CSFII = Continuing Survey of Food Intake of Individuals. NHANES-I = First National Health and Nutrition Examination Survey.NESNP = National Evaluation of School Nutrition Programs.
2Also examined impacts on height and/or weight, but reported no significant findings.
3The study compared SBP participants with students who did not have access to the SBP. Only three SBP participants were included in the sample.
4Study compared intakes before and after introduction of free lunch (one district) and free lunch and breakfast (one district). Results reported for four different subgroups based on baseline
characteristics: nutritionally adequate, nutritionally needy, low-income (eligible for free lunch), not low income. 5Study examined the effect of introducing a free breakfast program, comparing students in experimental school to control school that had no breakfast program.
6School breakfast was not the main focus of the study. Only 20 children in the sample consumed a school breakfast.
7The study also examined impacts on BMI and food security and found no significant effects.
8The study focused on students in grades 2-6. For sampling/matching purposes, schools with different grade configurations (e.g., K-2 and 3-5) were considered one unit. There were a total
of 73 treatment schools and 70 control schools. 9The study’s main analysis compared outcomes for the entire treatment group with outcomes for the entire control group. Findings discussed in this report, however, are from a separate
analysis that estimated impacts on students who actually participated in universal-free breakfast on the day of the recall.
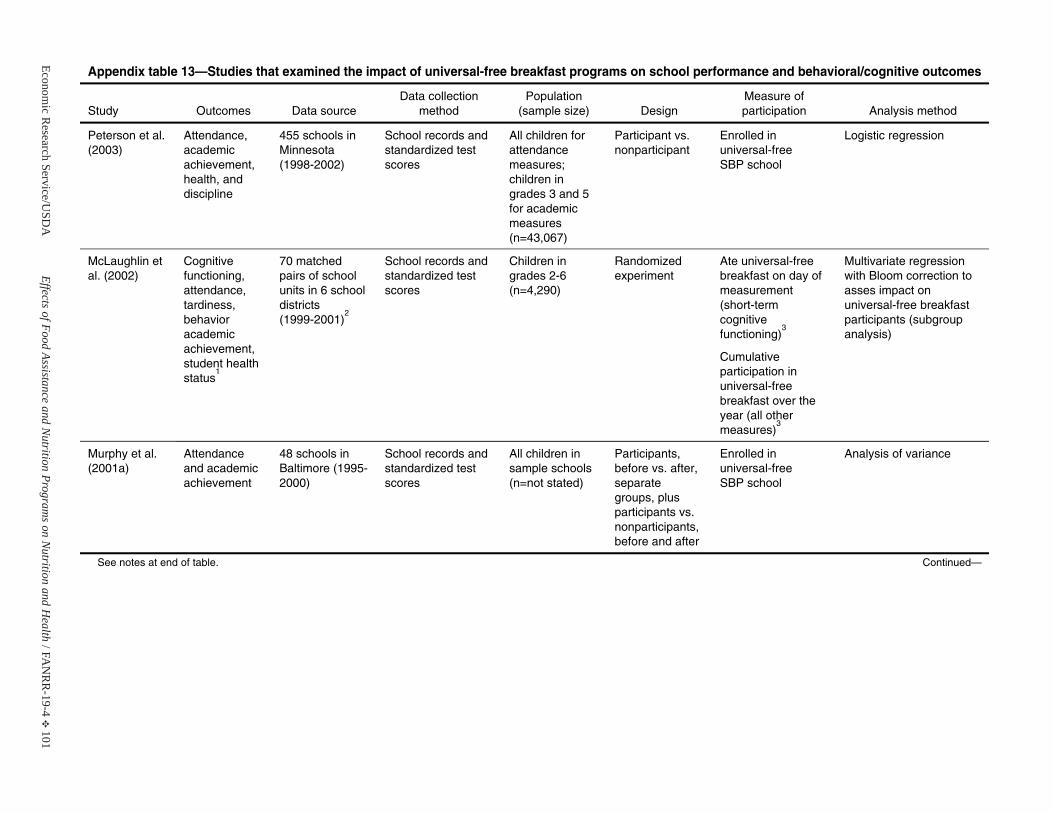
Economic R
esearch Service/USD
AEffects of Food Assistance and N
utrition Programs on N
utrition and Health / F A
NR
R-19-4
E 101
Appendix table 13—Studies that examined the impact of universal-free breakfast programs on school performance and behavioral/cognitive outcomes
Study Outcomes Data source Data collection
method Population
(sample size) Design Measure of participation Analysis method
Peterson et al. (2003)
Attendance, academic achievement, health, and discipline
455 schools inMinnesota (1998-2002)
School records and standardized test scores
All children for attendance measures; children ingrades 3 and 5for academic measures (n=43,067)
Participant vs. nonparticipant
Enrolled inuniversal-free SBP school
Logistic regression
McLaughlin et al. (2002)
Cognitive functioning, attendance, tardiness, behavior academic achievement, student health status
1
70 matched pairs of school units in 6 school districts (1999-2001)
2
School records and standardized test scores
Children ingrades 2-6 (n=4,290)
Randomized experiment
Ate universal-free breakfast on day of measurement (short-term cognitivefunctioning)
3
Cumulative participation in universal-free breakfast over the year (all other measures)
3
Multivariate regressionwith Bloom correction to asses impact on universal-free breakfast participants (subgroup analysis)
Murphy et al. (2001a)
Attendance and academic achievement
48 schools in Baltimore (1995-2000)
School records and standardized test scores
All children insample schools (n=not stated)
Participants, before vs. after, separate groups, plus participants vs. nonparticipants,before and after
Enrolled inuniversal-free SBP school
Analysis of variance
See notes at end of table. Continued—
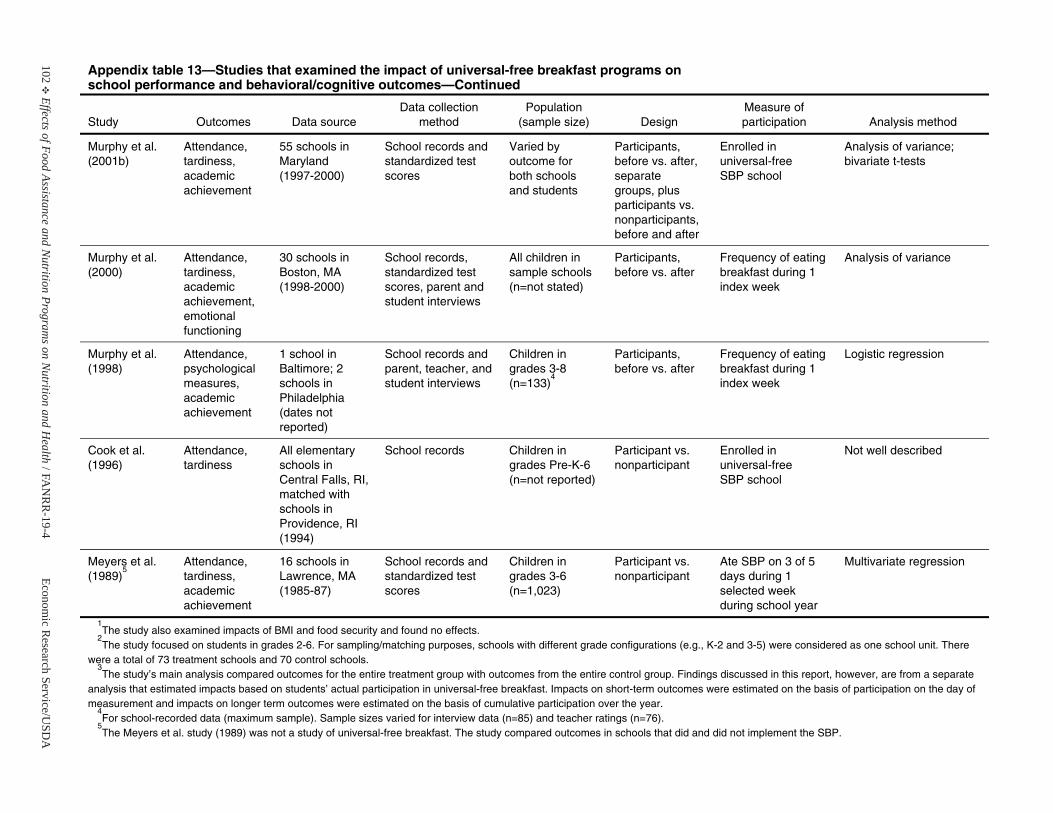
102E
Effects of Food Assistance and Nutrition Program
s on Nutrition and H
ealth / F AN
RR
-19-4Econom
ic Research Service/U
SDA
Appendix table 13—Studies that examined the impact of universal-free breakfast programs on school performance and behavioral/cognitive outcomes—Continued
Study Outcomes Data source Data collection
method Population
(sample size) Design Measure of participation Analysis method
Murphy et al. (2001b)
Attendance, tardiness, academic achievement
55 schools in Maryland (1997-2000)
School records and standardized test scores
Varied by outcome for both schools and students
Participants, before vs. after, separate groups, plus participants vs. nonparticipants,before and after
Enrolled inuniversal-free SBP school
Analysis of variance; bivariate t-tests
Murphy et al. (2000)
Attendance, tardiness, academic achievement, emotional functioning
30 schools in Boston, MA (1998-2000)
School records,standardized test scores, parent and student interviews
All children insample schools (n=not stated)
Participants, before vs. after
Frequency of eating breakfast during 1 index week
Analysis of variance
Murphy et al. (1998)
Attendance, psychological measures, academic achievement
1 school in Baltimore; 2 schools inPhiladelphia (dates not reported)
School records and parent, teacher, and student interviews
Children ingrades 3-8 (n=133)
4
Participants, before vs. after
Frequency of eating breakfast during 1 index week
Logistic regression
Cook et al. (1996)
Attendance, tardiness
All elementary schools inCentral Falls, RI, matched with schools inProvidence, RI(1994)
School records Children ingrades Pre-K-6(n=not reported)
Participant vs. nonparticipant
Enrolled inuniversal-free SBP school
Not well described
Meyers et al. (1989)
5Attendance, tardiness, academic achievement
16 schools in Lawrence, MA (1985-87)
School records and standardized test scores
Children ingrades 3-6 (n=1,023)
Participant vs. nonparticipant
Ate SBP on 3 of 5 days during 1 selected week during school year
Multivariate regression
1The study also examined impacts of BMI and food security and found no effects.
2The study focused on students in grades 2-6. For sampling/matching purposes, schools with different grade configurations (e.g., K-2 and 3-5) were considered as one school unit. There
were a total of 73 treatment schools and 70 control schools. 3The study’s main analysis compared outcomes for the entire treatment group with outcomes from the entire control group. Findings discussed in this report, however, are from a separate
analysis that estimated impacts based on students’ actual participation in universal-free breakfast. Impacts on short-term outcomes were estimated on the basis of participation on the day of measurement and impacts on longer term outcomes were estimated on the basis of cumulative participation over the year.
4For school-recorded data (maximum sample). Sample sizes varied for interview data (n=85) and teacher ratings (n=76).
5The Meyers et al. study (1989) was not a study of universal-free breakfast. The study compared outcomes in schools that did and did not implement the SBP.
Economic Research Service/USDA Effects of Food Assistance and Nutrition Programs on Nutrition and Health / FANRR-19-4 E 103
Nutrition Services Incentive Program(formerly the Nutrition Program for the Elderly
Note: This research actually focused on the Elderly Nutrition Program (ENP), which issponsored by the U.S. Department of Health and Human Services. USDA’s NutritionProgram for the Elderly (NPE), now known as the Nutrition Services IncentiveProgram, provided supplemental commodities to ENP delivery sites, based on a per meal reimbursement rate.
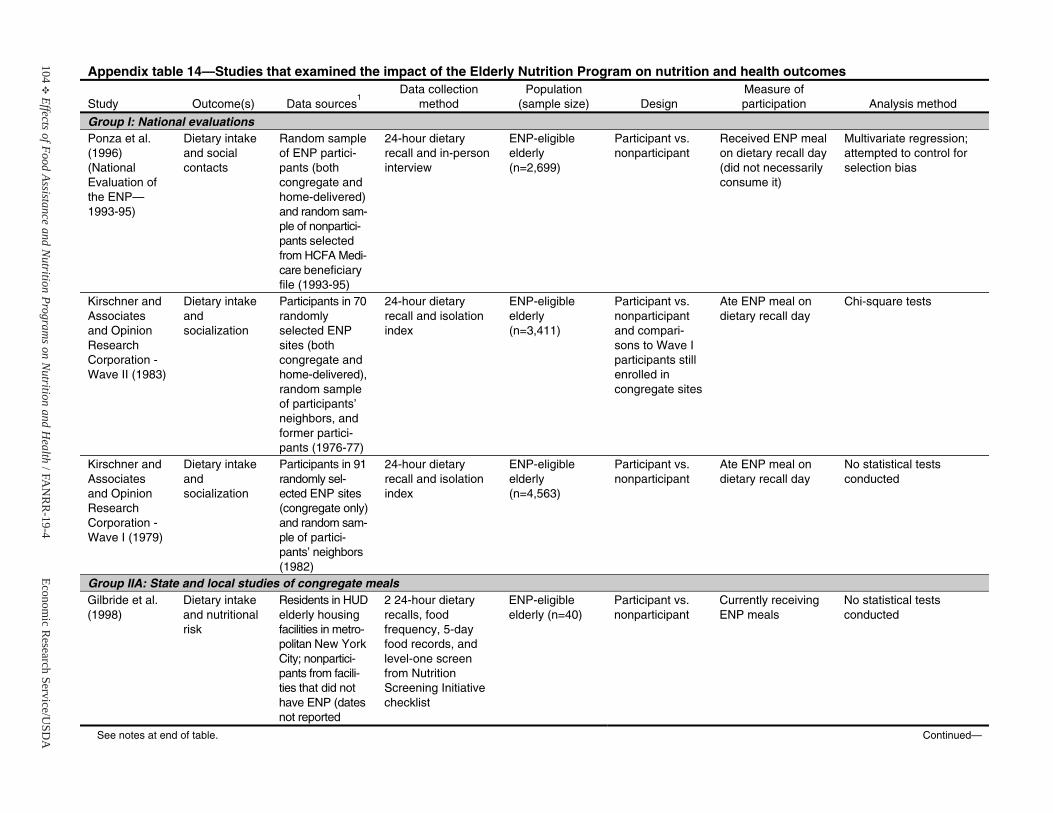
104E
Effects of Food Assistance and Nutrition Program
s on Nutrition and H
ealth / F AN
RR
-19-4Econom
ic Research Service/U
SDA
Appendix table 14—Studies that examined the impact of the Elderly Nutrition Program on nutrition and health outcomes
Study Outcome(s) Data sources1
Data collection method
Population(sample size) Design
Measure of participation Analysis method
Group I: National evaluationsPonza et al. (1996) (National Evaluation of the ENP—1993-95)
Dietary intakeand social contacts
Random sampleof ENP partici-pants (both congregate andhome-delivered) and random sam-ple of nonpartici-pants selectedfrom HCFA Medi-care beneficiaryfile (1993-95)
24-hour dietaryrecall and in-person interview
ENP-eligible elderly (n=2,699)
Participant vs. nonparticipant
Received ENP meal on dietary recall day (did not necessarily consume it)
Multivariate regression; attempted to control for selection bias
Kirschner and Associates and Opinion ResearchCorporation - Wave II (1983)
Dietary intakeand socialization
Participants in 70randomly selected ENP sites (both congregate andhome-delivered), random sampleof participants’ neighbors, andformer partici-pants (1976-77)
24-hour dietaryrecall and isolation index
ENP-eligible elderly (n=3,411)
Participant vs. nonparticipant and compari-sons to Wave I participants still enrolled in congregate sites
Ate ENP meal on dietary recall day
Chi-square tests
Kirschner and Associates and Opinion ResearchCorporation -Wave I (1979)
Dietary intakeand socialization
Participants in 91randomly sel-ected ENP sites(congregate only) and random sam-ple of partici-pants’ neighbors (1982)
24-hour dietaryrecall and isolation index
ENP-eligible elderly (n=4,563)
Participant vs. nonparticipant
Ate ENP meal on dietary recall day
No statistical tests conducted
Group IIA: State and local studies of congregate mealsGilbride et al. (1998)
Dietary intakeand nutritional risk
Residents in HUD elderly housingfacilities in metro-politan New YorkCity; nonpartici-pants from facili-ties that did not have ENP (datesnot reported
2 24-hour dietary recalls, food frequency, 5-day food records, and level-one screen from Nutrition Screening Initiative checklist
ENP-eligible elderly (n=40)
Participant vs. nonparticipant
Currently receiving ENP meals
No statistical tests conducted
See notes at end of table. Continued—
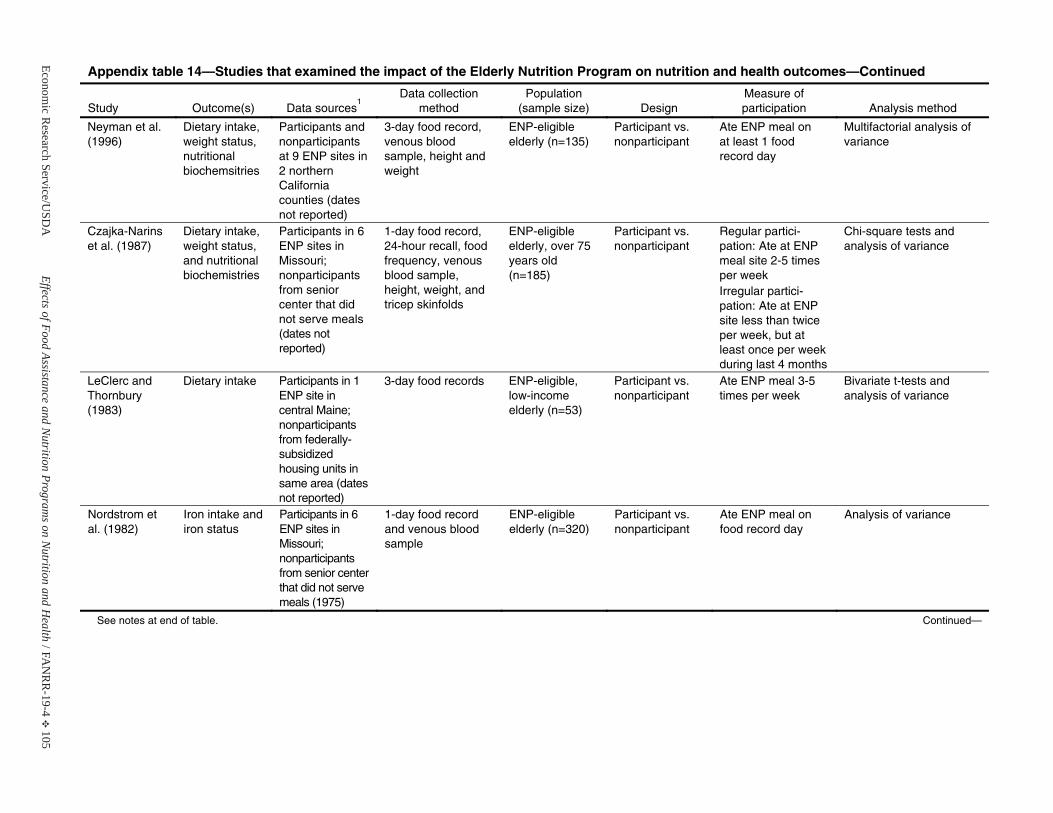
Economic R
esearch Service/USD
AEffects of Food Assistance and N
utrition Programs on N
utrition and Health / F A
NR
R-19-4
E 105
Appendix table 14—Studies that examined the impact of the Elderly Nutrition Program on nutrition and health outcomes—Continued
Study Outcome(s) Data sources1
Data collection method
Population(sample size) Design
Measure of participation Analysis method
Neyman et al. (1996)
Dietary intake, weight status, nutritional biochemsitries
Participants and nonparticipantsat 9 ENP sites in 2 northern California counties (datesnot reported)
3-day food record, venous blood sample, height and weight
ENP-eligible elderly (n=135)
Participant vs. nonparticipant
Ate ENP meal on at least 1 food record day
Multifactorial analysis of variance
Czajka-Narins et al. (1987)
Dietary intake, weight status, and nutritional biochemistries
Participants in 6 ENP sites in Missouri; nonparticipantsfrom senior center that did not serve meals (dates not reported)
1-day food record, 24-hour recall, food frequency, venous blood sample, height, weight, and tricep skinfolds
ENP-eligible elderly, over 75years old (n=185)
Participant vs. nonparticipant
Regular partici-pation: Ate at ENP meal site 2-5 times per week Irregular partici-pation: Ate at ENP site less than twice per week, but at least once per week during last 4 months
Chi-square tests and analysis of variance
LeClerc and Thornbury (1983)
Dietary intake Participants in 1ENP site in central Maine;nonparticipants from federally-subsidized housing units insame area (dates not reported)
3-day food records ENP-eligible, low-income elderly (n=53)
Participant vs. nonparticipant
Ate ENP meal 3-5 times per week
Bivariate t-tests and analysis of variance
Nordstrom et al. (1982)
Iron intake and iron status
Participants in 6 ENP sites in Missouri; nonparticipants from senior center that did not serve meals (1975)
1-day food record and venous blood sample
ENP-eligible elderly (n=320)
Participant vs. nonparticipant
Ate ENP meal on food record day
Analysis of variance
See notes at end of table. Continued—
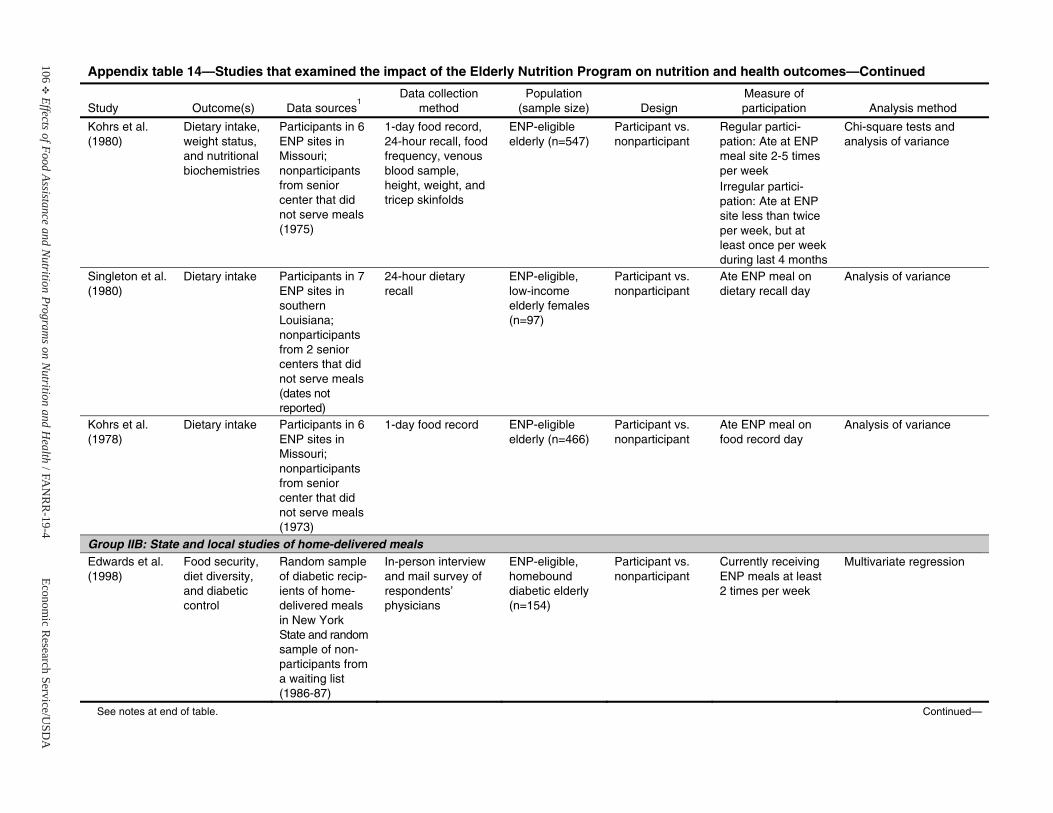
106E
Effects of Food Assistance and Nutrition Program
s on Nutrition and H
ealth / F AN
RR
-19-4Econom
ic Research Service/U
SDA
Appendix table 14—Studies that examined the impact of the Elderly Nutrition Program on nutrition and health outcomes—Continued
Study Outcome(s) Data sources1
Data collection method
Population(sample size) Design
Measure of participation Analysis method
Kohrs et al. (1980)
Dietary intake, weight status, and nutritional biochemistries
Participants in 6 ENP sites in Missouri; nonparticipantsfrom senior center that did not serve meals (1975)
1-day food record, 24-hour recall, food frequency, venous blood sample, height, weight, and tricep skinfolds
ENP-eligible elderly (n=547)
Participant vs. nonparticipant
Regular partici-pation: Ate at ENP meal site 2-5 times per week Irregular partici-pation: Ate at ENP site less than twice per week, but at least once per week during last 4 months
Chi-square tests and analysis of variance
Singleton et al.(1980)
Dietary intake Participants in 7 ENP sites in southern Louisiana; nonparticipantsfrom 2 senior centers that did not serve meals (dates not reported)
24-hour dietaryrecall
ENP-eligible, low-income elderly females(n=97)
Participant vs. nonparticipant
Ate ENP meal on dietary recall day
Analysis of variance
Kohrs et al. (1978)
Dietary intake Participants in 6 ENP sites in Missouri; nonparticipantsfrom senior center that did not serve meals (1973)
1-day food record ENP-eligible elderly (n=466)
Participant vs. nonparticipant
Ate ENP meal on food record day
Analysis of variance
Group IIB: State and local studies of home-delivered mealsEdwards et al. (1998)
Food security, diet diversity, and diabetic control
Random sampleof diabetic recip-ients of home-delivered meals in New York State and random sample of non-participants froma waiting list (1986-87)
In-person interview and mail survey of respondents’ physicians
ENP-eligible, homebound diabetic elderly(n=154)
Participant vs. nonparticipant
Currently receiving ENP meals at least 2 times per week
Multivariate regression
See notes at end of table. Continued—
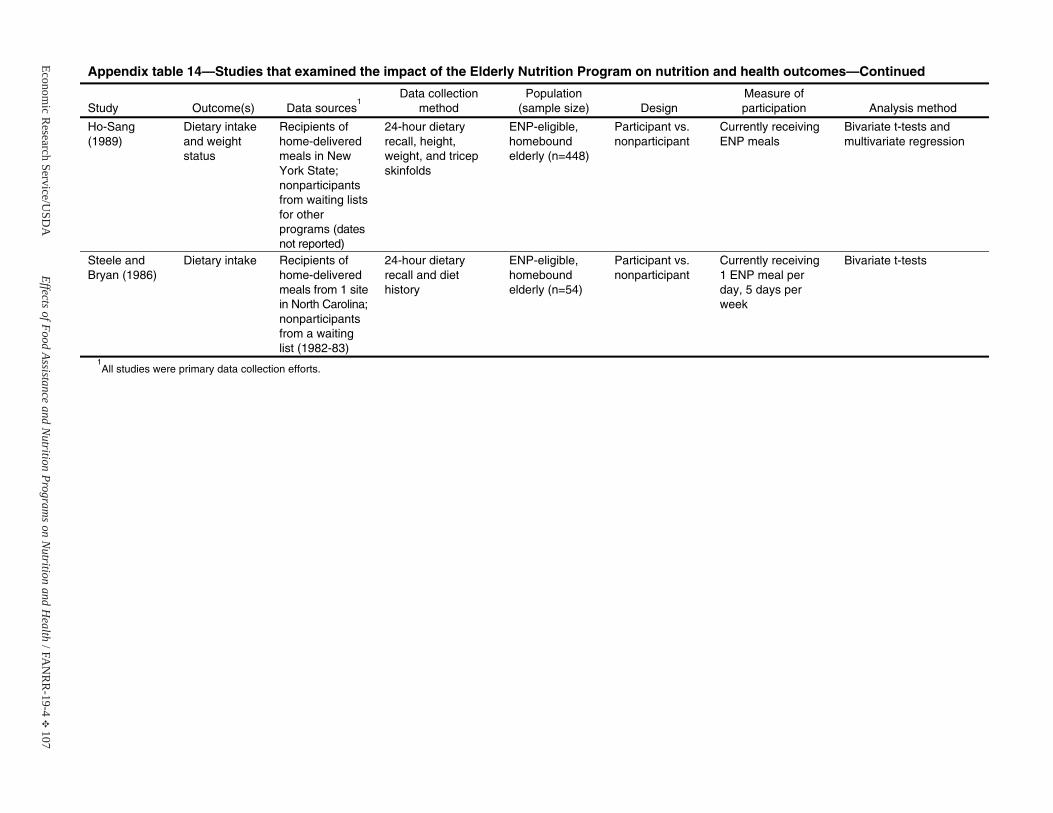
Economic R
esearch Service/USD
AEffects of Food Assistance and N
utrition Programs on N
utrition and Health / F A
NR
R-19-4
E 107
Appendix table 14—Studies that examined the impact of the Elderly Nutrition Program on nutrition and health outcomes—Continued
Study Outcome(s) Data sources1
Data collection method
Population(sample size) Design
Measure of participation Analysis method
Ho-Sang (1989)
Dietary intakeand weight status
Recipients of home-deliveredmeals in New York State; nonparticipantsfrom waiting lists for other programs (datesnot reported)
24-hour dietaryrecall, height, weight, and tricep skinfolds
ENP-eligible, homebound elderly (n=448)
Participant vs. nonparticipant
Currently receiving ENP meals
Bivariate t-tests and multivariate regression
Steele and Bryan (1986)
Dietary intake Recipients of home-deliveredmeals from 1 site in North Carolina; nonparticipantsfrom a waiting list (1982-83)
24-hour dietaryrecall and diet history
ENP-eligible, homebound elderly (n=54)
Participant vs. nonparticipant
Currently receiving 1 ENP meal perday, 5 days perweek
Bivariate t-tests
1All studies were primary data collection efforts.


Economic Research Service/USDA Effects of Food Assistance and Nutrition Programs on Nutrition and Health / FANRR-19-4 E 109
Nutrition Assistance Program in Puerto Rico,American Samoa, and the Northern Marianas
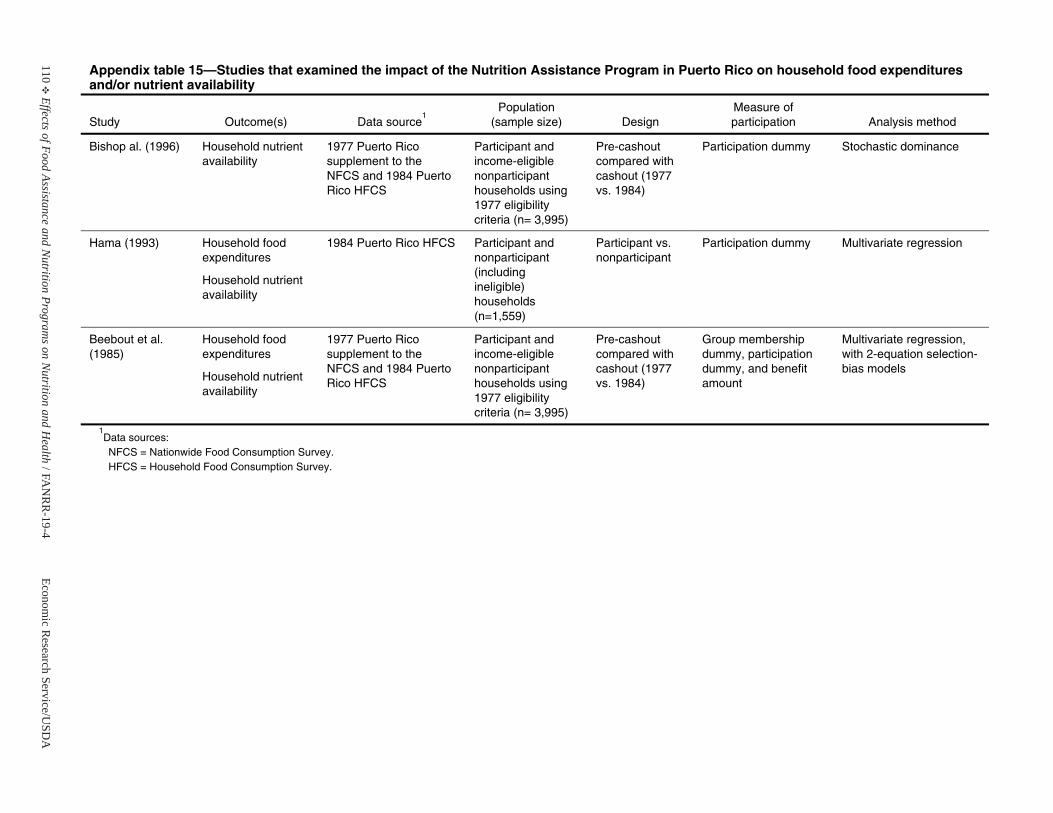
110E
Effects of Food Assistance and Nutrition Program
s on Nutrition and H
ealth / F AN
RR
-19-4Econom
ic Research Service/U
SDA
Appendix table 15—Studies that examined the impact of the Nutrition Assistance Program in Puerto Rico on household food expenditures and/or nutrient availability
Study Outcome(s) Data source1
Population(sample size) Design
Measure of participation Analysis method
Bishop al. (1996) Household nutrient availability
1977 Puerto Rico supplement to the NFCS and 1984 Puerto Rico HFCS
Participant andincome-eligiblenonparticipant households using 1977 eligibility criteria (n= 3,995)
Pre-cashout compared with cashout (1977 vs. 1984)
Participation dummy Stochastic dominance
Hama (1993) Household foodexpenditures
Household nutrient availability
1984 Puerto Rico HFCS Participant andnonparticipant (includingineligible) households (n=1,559)
Participant vs. nonparticipant
Participation dummy Multivariate regression
Beebout et al. (1985)
Household foodexpenditures
Household nutrient availability
1977 Puerto Rico supplement to the NFCS and 1984 Puerto Rico HFCS
Participant andincome-eligiblenonparticipant households using 1977 eligibility criteria (n= 3,995)
Pre-cashout compared with cashout (1977 vs. 1984)
Group membership dummy, participation dummy, and benefit amount
Multivariate regression, with 2-equation selection-bias models
1Data sources: NFCS = Nationwide Food Consumption Survey. HFCS = Household Food Consumption Survey.
Economic Research Service/USDA Effects of Food Assistance and Nutrition Programs on Nutrition and Health / FANRR-19-4 E 111
Commodity Supplemental Food Program
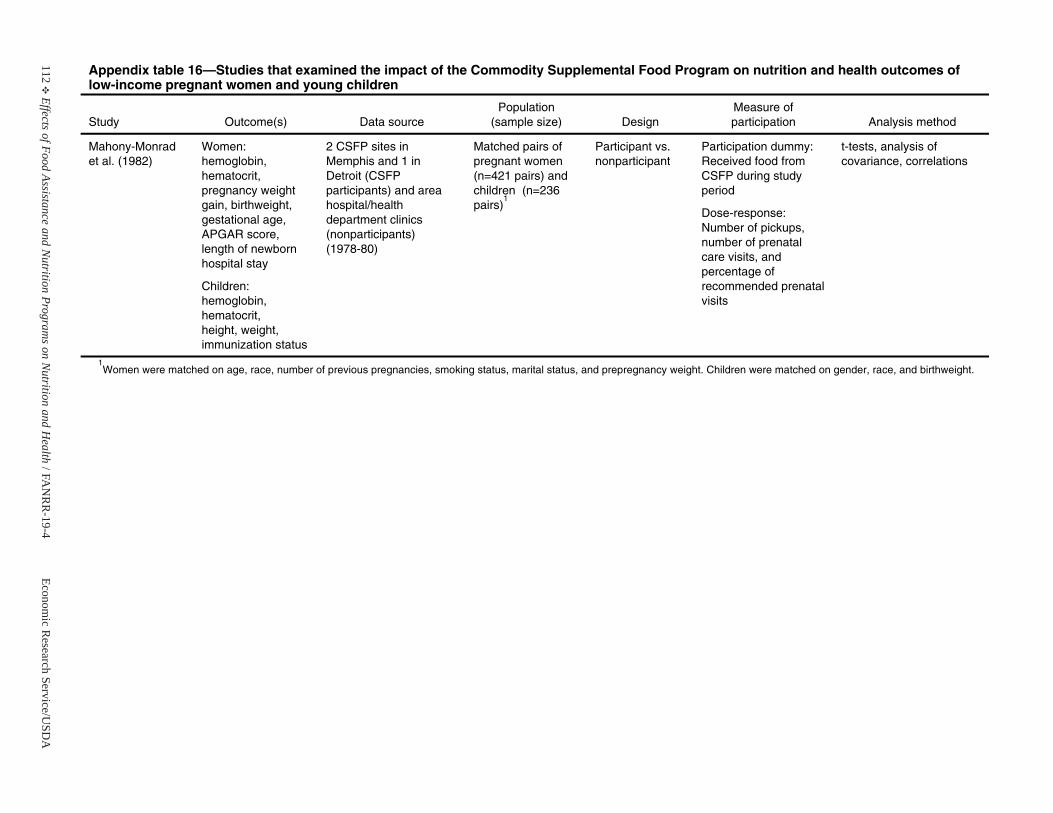
112E
Effects of Food Assistance and Nutrition Program
s on Nutrition and H
ealth / F AN
RR
-19-4Econom
ic Research Service/U
SDA
Appendix table 16—Studies that examined the impact of the Commodity Supplemental Food Program on nutrition and health outcomes of low-income pregnant women and young children
Study Outcome(s) Data source Population
(sample size) Design Measure of participation Analysis method
Mahony-Monradet al. (1982)
Women: hemoglobin, hematocrit, pregnancy weight gain, birthweight, gestational age,APGAR score, length of newborn hospital stay
Children: hemoglobin, hematocrit, height, weight, immunization status
2 CSFP sites in Memphis and 1 in Detroit (CSFP participants) and areahospital/health department clinics (nonparticipants) (1978-80)
Matched pairs of pregnant women (n=421 pairs) and children (n=236pairs)
1
Participant vs. nonparticipant
Participation dummy: Received food from CSFP during study period
Dose-response: Number of pickups, number of prenatal care visits, and percentage of recommended prenatal visits
t-tests, analysis of covariance, correlations
1Women were matched on age, race, number of previous pregnancies, smoking status, marital status, and prepregnancy weight. Children were matched on gender, race, and birthweight.

Economic Research Service/USDA Effects of Food Assistance and Nutrition Programs on Nutrition and Health / FANRR-19-4 E 113
WIC Farmers’ Market Nutrition Program
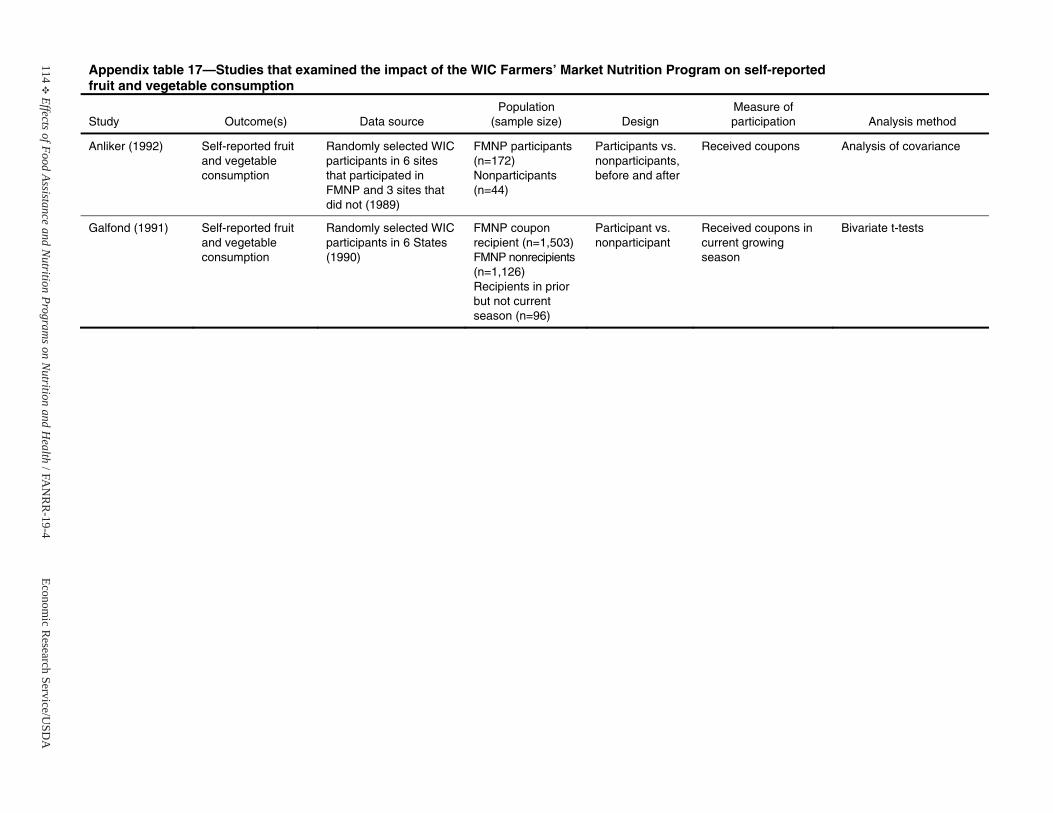
114E
Effects of Food Assistance and Nutrition Program
s on Nutrition and H
ealth / F AN
RR
-19-4Econom
ic Research Service/U
SDA
Appendix table 17—Studies that examined the impact of the WIC Farmers’ Market Nutrition Program on self-reported fruit and vegetable consumption
Study Outcome(s) Data source Population
(sample size) Design Measure of participation Analysis method
Anliker (1992) Self-reported fruit and vegetable consumption
Randomly selected WIC participants in 6 sites that participated in FMNP and 3 sites that did not (1989)
FMNP participants (n=172) Nonparticipants (n=44)
Participants vs. nonparticipants,before and after
Received coupons Analysis of covariance
Galfond (1991) Self-reported fruit and vegetable consumption
Randomly selected WIC participants in 6 States (1990)
FMNP coupon recipient (n=1,503) FMNP nonrecipients (n=1,126) Recipients in prior but not current season (n=96)
Participant vs. nonparticipant
Received coupons in current growing season
Bivariate t-tests

Economic Research Service/USDA Effects of Food Assistance and Nutrition Programs on Nutrition and Health / FANRR-19-4 E 115
Special Milk Program
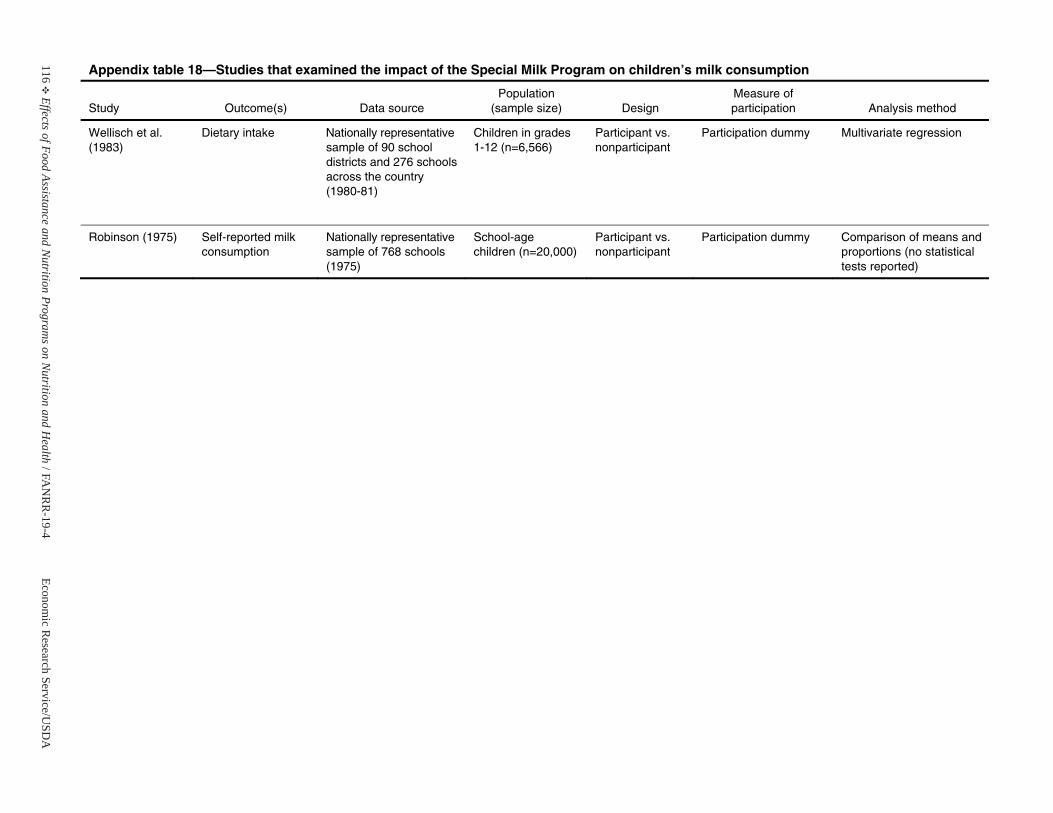
116E
Effects of Food Assistance and Nutrition Program
s on Nutrition and H
ealth / F AN
RR
-19-4Econom
ic Research Service/U
SDA
Appendix table 18—Studies that examined the impact of the Special Milk Program on children’s milk consumption
Study Outcome(s) Data source Population
(sample size) Design Measure of participation Analysis method
Wellisch et al. (1983)
Dietary intake Nationally representativesample of 90 school districts and 276 schools across the country (1980-81)
Children in grades 1-12 (n=6,566)
Participant vs. nonparticipant
Participation dummy Multivariate regression
Robinson (1975) Self-reported milk consumption
Nationally representativesample of 768 schools (1975)
School-age children (n=20,000)
Participant vs. nonparticipant
Participation dummy Comparison of means and proportions (no statistical tests reported)

Economic Research Service/USDA Effects of Food Assistance and Nutrition Programs on Nutrition and Health / FANRR-19-4 E 117
Team Nutrition Initiative andNutrition Education and Training Program
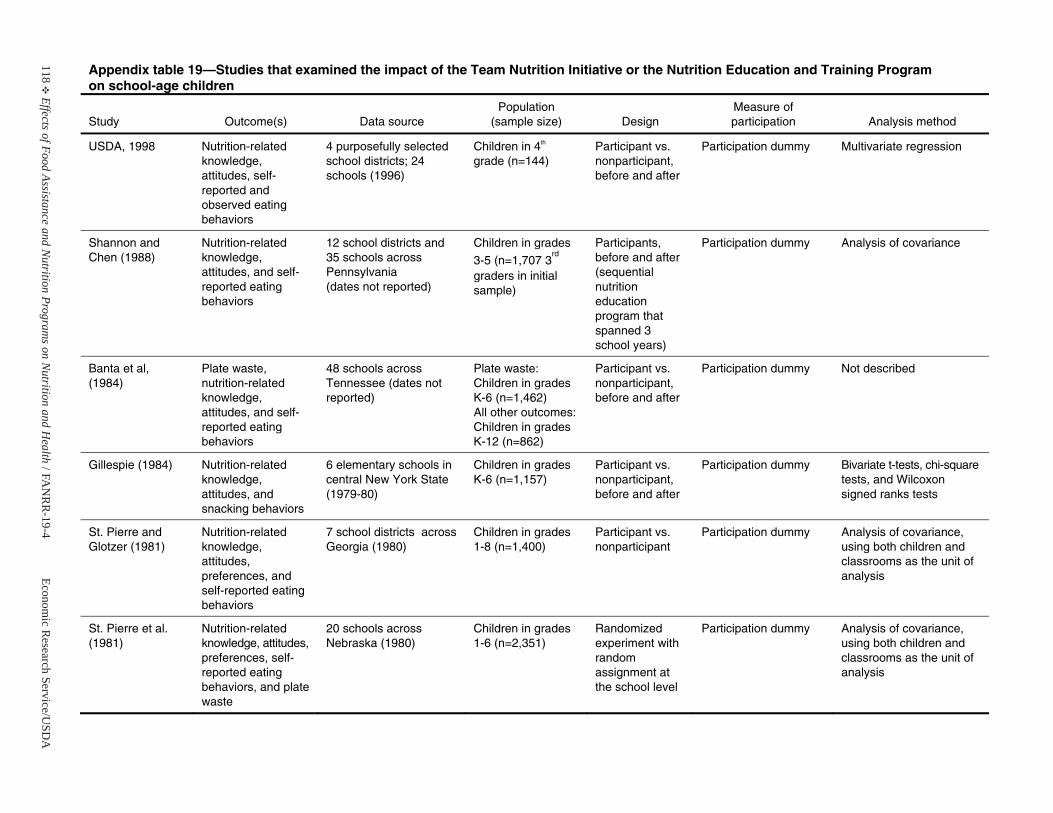
118E
Effects of Food Assistance and Nutrition Program
s on Nutrition and H
ealth / F AN
RR
-19-4Econom
ic Research Service/U
SDA
Appendix table 19—Studies that examined the impact of the Team Nutrition Initiative or the Nutrition Education and Training Program on school-age children
Study Outcome(s) Data source Population
(sample size) Design Measure of participation Analysis method
USDA, 1998 Nutrition-related knowledge, attitudes, self-reported and observed eating behaviors
4 purposefully selected school districts; 24 schools (1996)
Children in 4th
grade (n=144)Participant vs. nonparticipant,before and after
Participation dummy Multivariate regression
Shannon and Chen (1988)
Nutrition-related knowledge, attitudes, and self-reported eatingbehaviors
12 school districts and 35 schools across Pennsylvania (dates not reported)
Children in grades
3-5 (n=1,707 3rd
graders in initial sample)
Participants, before and after (sequential nutritioneducation program that spanned 3 school years)
Participation dummy Analysis of covariance
Banta et al, (1984)
Plate waste, nutrition-related knowledge, attitudes, and self-reported eatingbehaviors
48 schools across Tennessee (dates not reported)
Plate waste: Children in grades K-6 (n=1,462) All other outcomes: Children in grades K-12 (n=862)
Participant vs. nonparticipant,before and after
Participation dummy Not described
Gillespie (1984) Nutrition-related knowledge, attitudes, and snacking behaviors
6 elementary schools incentral New York State (1979-80)
Children in grades K-6 (n=1,157)
Participant vs. nonparticipant,before and after
Participation dummy Bivariate t-tests, chi-square tests, and Wilcoxon signed ranks tests
St. Pierre and Glotzer (1981)
Nutrition-related knowledge, attitudes, preferences, and self-reported eating behaviors
7 school districts across Georgia (1980)
Children in grades 1-8 (n=1,400)
Participant vs. nonparticipant
Participation dummy Analysis of covariance, using both children and classrooms as the unit of analysis
St. Pierre et al. (1981)
Nutrition-related knowledge, attitudes, preferences, self-reported eatingbehaviors, and plate waste
20 schools across Nebraska (1980)
Children in grades 1-6 (n=2,351)
Randomized experiment with random assignment at the school level
Participation dummy Analysis of covariance, using both children and classrooms as the unit of analysis
Economic Research Service/USDA Effects of Food Assistance and Nutrition Programs on Nutrition and Health / FANRR-19-4 E 119
Appendix B
References Cited in the Literature Review

Economic Research Service/USDA Effects of Food Assistance and Nutrition Programs on Nutrition and Health / FANRR-19-4 E 121
Food Stamp Program
122 E Effects of Food Assistance and Nutrition Programs on Nutrition and Health / FANRR-19-4 Economic Research Service/USDA
Akin, J.S., D.K. Guilkey, B.M. Popkin, et al. 1987.“Determinants of Nutrient Intake of the Elderly,”Journal of Applied Gerontology 6(3):227-58.
Akin, J.S., D.K. Guilkey, B.M. Popkin, et al. 1985.“The Impact of Federal Transfer Programs on theNutrient Intake of Elderly Individuals,” Journal ofHuman Resources 20:383-404.
Alaimo, K., R.R. Briefel, E.A. Frongillo, Jr., et al.1998. “Food Insufficiency Exists in the United States:Results from the Third National Health and NutritionExamination Survey (NHANES-III),” AmericanJournal of Public Health 88(3):419-26.
Allen, J.E., and K.E. Gadson. 1983. NutrientConsumption Patterns of Low-Income Households.TB-1685. USDA, Economic Research Service.
Barlow, S., and W. Dietz. 1998. “Obesity Evaluationand Treatment: Expert Committee Recommendations,”Journal of Pediatrics 103(2):e29.
Bartlett, S., and M. Hart. 1987. Food Stamp Recipients’Patterns of Benefit Redemption. Cambridge, MA: AbtAssociates Inc.
Basiotis, P., M. Brown, S.R. Johnson, et al. 1983.“Nutrient Availability, Food Costs, and Food Stamps,”American Journal of Agricultural Economics 65:685-93.
Basiotis, P., S. Johnson, K. Morgan, et al. 1987. “FoodStamps, Food Costs, Nutrient Availability and NutrientIntake,” Journal of Policy Modeling 9:383-404.
Basiotis, P., C. Kramer-LeBlanc, and E. Kennedy.1998. “Maintaining Nutrition Security and Diet Quality:the Role of the Food Stamp Program and WIC,” FamilyEconomics and Nutrition Review 11(1-2):4-16.
Beebout, H., E. Cavin, B. Devaney, et al. 1985.Evaluation of the Nutrition Assistance Program inPuerto Rico: Volume II, Effects on Food Expendituresand Diet Quality. Washington, DC: MathematicaPolicy Research, Inc.
Benus, J., J. Kmenta, and H. Shapiro. 1976. “TheDynamics of Household Budget Allocation to FoodExpenditures,” The Review of Economics and Statistics58:129-38.
Bhattacharya, J., and J. Currie. 2000. Youths atNutritional Risk: Malnourished or Misnourished?Working paper 7686. Cambridge, MA: NationalBureau of Economic Research.
Bishop, J.A., J.P. Formby, and L.A. Zeager. 2000.“The Effect of Food Stamp Cashout onUndernutrition,” Economics Letters 67:75-85.
Bishop, J.A., J.P. Formby, and L.A. Zeager. 1992.“Nutrition and Nonparticipation in the United StatesFood Stamp Program,” Applied Economics24(N9):945-49.
Blaylock, J.R. 1991. “The Impact of EquivalenceScales on the Analysis of Income and Food SpendingDistributions,” Western Journal of AgriculturalEconomics 16(1):11-20.
Breunig, R., I. Dasgupta, C. Gundersen, et al. 2001.Explaining the Food Stamp Cash-Out Puzzle. FANRR-12. USDA, Economic Research Service.
Brown, M., S.R. Johnson, and R.L. Rizek. 1982. FoodStamps and Expenditure Patterns: A StatisticalAnalysis. University of Missouri-Columbia. Reportsubmitted to U.S. Department of Agriculture, Foodand Nutrition Service.
Butler, J.S., J.C. Ohls, and B. Posner. 1985. “TheEffect of the Food Stamp Program on the NutrientIntake of the Eligible Elderly,” Journal of HumanResources 20(3):405-420.
Butler, J.S., and J.E. Raymond. 1996. “The Effect ofthe Food Stamp Program on Nutrient Intake,”Economic Inquiry 34:781-98.
Chavas, J.P., and M.L. Yeung. 1982. “Effects of theFood Stamp Program on Food Consumption in theSouthern United States,” Southern Journal ofAgricultural Economics 14(1):131-39.
Chen, J.S. 1983. Simultaneous Equations Models withQualitative Dependent Variables: A Food StampProgram Participation and Food Cost Analysis.Unpublished doctoral dissertation from University ofMissouri.
Cohen, B., J. Ohls, M. Andrews, et al. 1999. FoodStamp Participants’ Food Security and NutrientAvailability: Final Report. Princeton, NJ: MathematicaPolicy Research, Inc.
Economic Research Service/USDA Effects of Food Assistance and Nutrition Programs on Nutrition and Health / FANRR-19-4 E 123
Cohen, B.E., and N. Young. 1993. “Impacts of theWashington State Food Stamp Cashout Demonstrationon Household Expenditures and Food Use,” in N. Fasciano, D. Hall, and H. Beebout (eds.), NewDirections in Food Stamp Policy Research. PapersPresented at the Food and Nutrition Service ResearchConference, Washington, DC, June 25, 1993, pp. 83-100.
Cole, N. 1997. Patterns of Food Stamp and CashWelfare Benefit Redemption. USDA, Food andConsumer Service.
Cook, J.T., L.P. Sherman, and J.L. Brown. 1995.Impact of Food Stamps on the Dietary Adequacy ofPoor Children. Medford, MA: Center on Hunger,Poverty and Nutrition Policy, Tufts University Schoolof Nutrition.
Cristofar, S., and P. Basiotis. 1992. “Dietary Intakesand Selected Characteristics of Women Ages 19-50Years and Their Children Ages 1-5 Years by ReportedPerception of Food Sufficiency,” Journal of NutritionEducation 24:53-8.
Cunnyngham, K. 2002. Trends in Food Stamp ProgramParticipation Rates: 1994-2000. USDA, Food andNutrition Service.
Currie, J., and N. Cole. 1991. Does Participation inTransfer Programs During Pregnancy Improve BirthWeight? Los Angeles, CA: University of California atLos Angeles.
Davis, E.E., and A. Werner. 1993. The Effects of FoodStamp Cash-out on Participants and Food Retailers inthe Alabama ASSETS Demonstration. Cambridge,MA: Abt Associates Inc.
Devaney, B., and T. Fraker. 1989. “The Effect of FoodStamps on Food Expenditures: An Assessment ofFindings from the Nationwide Food ConsumptionSurvey,” American Journal of Agricultural Economics71(1):99-104.
Devaney, B., and R. Moffitt. 1991. “Dietary Effects ofthe Food Stamp Program,” American Journal ofAgricultural Economics 73(1):202-11.
Dixon, B.L. 2002. “Differences in Dietary Intakes andSerum Nutrients Between Adults from Families WhoReceived Foods Stamps and Adults from FamiliesWho Did Not Receive Food Stamps, NHANES-III,1988-1994,” FASEB Journal 16(4):A234. Abstract ofpaper presented at annual meeting of the ProfessionalResearch Scientists on Experimental Biology, April2002. Slides provided by author.
Fey-Yensan, N., C. English, H. Pacheco, et al. 2003."Elderly Food Stamp Participants Are Different FromEligible Nonparticipants by Level of Nutrition Riskbut Not Nutrient Intake,” Journal of the AmericanDietetic Association 103(1):103-7.
Figlio, D., C. Gundersen, and J. Ziliak. 2000. “TheEffects of the Macroeconomy and Welfare Reform onFood Stamp Caseloads,” American Journal ofAgricultural Economics 82:635-41.
Fraker, T.M. 1990. The Effects of Food Stamps onFood Consumption: A Review of the Literature.USDA, Food and Nutrition Service.
Fraker, T.M., S.K. Long, and C.E. Post. 1990.Analyses of the 1985 Continuing Survey of FoodIntakes by Individuals. Volume I, Estimating UsualDietary Intake, Assessing Dietary Adequacy, andEstimating Program Effects: Applications of ThreeAdvanced Methodologies Using FNS’s Four-DayAnalysis File. USDA, Food and Nutrition Service.
Fraker, T.M., A.P. Martini, J.C. Ohls, et. al. 1992. TheEvaluation of the Alabama Food Stamp Cash-outDemonstration: Volume 1, Recipient Impacts. USDA,Food and Nutrition Service.
Frazao, E. 1999. “Chapter 1: High Costs of Poor EatingPatterns in the United States,” in E. Frazao (ed.),America’s Eating Habits: Changes and Consequences.AIB-750. USDA, Economic Research Service.
Friedman, M. 1957. A Theory of the ConsumptionFunction. Princeton, NJ: Princeton University Press.
Futrell, M.F., L.T. Kilgore, and F. Windam. 1975.“Nutritional Status of Black Preschool Children inMississippi,” Journal of the American DieteticAssociation 66:22-27.
124 E Effects of Food Assistance and Nutrition Programs on Nutrition and Health / FANRR-19-4 Economic Research Service/USDA
Gibson, D. 2003. “Food Stamp Program Participationis Positively Related to Obesity in Low-IncomeWomen,” Journal of Nutrition 133:2225-31.
Gibson, D. 2001. “Poverty, Food Stamp ProgramParticipation and Health: Estimates from theNLSY97,” in R.T. Michael (ed.), Social Awareness:Adolescent Behavior as Adulthood Approaches. NewYork, NY: Russell Sage Foundation.
Gleason, P., A. Rangarajan, and C. Olson. 2000.Dietary Intake and Dietary Attitudes Among FoodStamp Participants and Other Low-IncomeIndividuals. USDA, Food and Nutrition Service.
Gregorio, D.I., and J.R. Marshall. 1984. “Fine TuningWell-Being: Food Stamp Use and NutritionalAdequacy of Children’s Diets,” Social ScienceQuarterly 65:1137-46.
Gundersen, C., and V. Oliveira. 2001. “The FoodStamp Program and Food Insufficiency,” AmericanJournal of Agricultural Economics 83(4):875-87.
Hama, M.Y., and W.S. Chern. 1988. “FoodExpenditure and Nutrient Availability in ElderlyHouseholds,” Journal of Consumer Affairs 22(1):3-19.
Hamilton, W.L., J.T. Cook, W.W. Thompson, et al. 1997.Household Food Security in the United States in 1995:Summary Report of the Food Security MeasurementProject. Cambridge, MA: Abt Associates Inc.
Huffman, S.K., and H. Jensen. 2003. Do Food Assis-tance Programs Improve Household Food Security?Recent Evidence from the United States. Workingpaper 03-WP-335. Ames, IA: Iowa State University,Center for Agricultural and Rural Development.
Hymans, S.H., and H.T. Shapiro. 1976. “TheAllocation of Household Income to Food Consumption,”Journal of Econometrics 4:167-88.
Institute of Medicine, Food and Nutrition Board. 2001.Dietary Reference Intakes: Application in DietaryAssessment. Washington, DC: National Academy Press.
Jacobsen, J., N. Rodriguez-Planas, L. Puffer, et al. 2001.The Consequences of Welfare Reform and EconomicChange for the Food Stamp Program-Illustrationsfrom Microsimulation: Final Report. E-FAN-01-003.USDA, Economic Research Service.
Johnson, S.R., J.A. Burt, and K.J. Morgan. 1981. “TheFood Stamp Program: Participation, Food Cost, andDiet Quality of Low-income Households,” FoodTechnology 35(10):58-70.
Jensen, H. 2002. “Food Insecurity and the Food StampProgram,” American Journal of AgriculturalEconomics 84(5):1215-28.
Jones, S.J., L. Jahns, B. Laraia, and B. Haughton.2003. “Lower Risk of Overweight in School-age FoodInsecure Girls who Participate in Food Assistance:Results from the Panel Study of Income DynamicsChild Development Supplement,” Archives ofPediatrics & Adolescent Medicine 157(8):780-84.
Kennedy, E.T., J. Ohls, S. Carlson, et al. 1995. “TheHealthy Eating Index: Design and Applications,”Journal of the American Dietetic Association95(10):1103-09.
Kisker, E.E., and B. Devaney. 1988. The Food Choicesof Low-Income Households: Final Report. Washington,DC: Mathematica Policy Research, Inc.
Korenman, S., and J. Miller. 1992. Food StampProgram Participation and Maternal and ChildHealth. Report submitted to USDA, Food andNutrition Service.
Kornfeld, R. 2002. Explaining Recent Trends in FoodStamp Program Caseloads: Final Report. E-FAN-02-008. USDA, Economic Research Service.
Kott, P.S. 1990. “The Effects of Food Stamps on FoodExpenditures: Comment,” American Journal ofAgricultural Economics 72:731.
Kramer-LeBlanc, C., P. Basiotis, and E. Kennedy.1997. “Maintaining Food and Nutrition Security in theUnited States with Welfare Reform,” AmericanJournal of Agricultural Economics 79(5):1600-07.
Kuczmarski, R., C. Ogden, L. Guo, et al. 2002. 2000CDC Growth Charts for the United States: Methodsand Development. Vital and Health Statistics Series 11,No. 246. Centers for Disease Control and Prevention,National Center for Health Statistics.
Lane, S. 1978. “Food Distribution and Food StampProgram Effects on Food Consumption and NutritionalAchievement of Low Income Persons in Kern County,California,” American Journal of AgriculturalEconomics 60(1):108-16.
Economic Research Service/USDA Effects of Food Assistance and Nutrition Programs on Nutrition and Health / FANRR-19-4 E 125
Levedahl, J.W. 1995. “A Theoretical and EmpiricalEvaluation of the Functional Forms Used to Estimatethe Food Expenditure Equation of Food StampRecipients,” American Journal of AgriculturalEconomics 77:960-68.
Levedahl, J.W. 1991. The Effect of Food Stamps andIncome on Household Food Expenditures. TB-1794.USDA, Economic Research Service.
Lin, B.-H., J. Guthrie, and E. Frazao. 1999. “Chapter 12:Nutrient Contribution of Food Away from Home,” inE. Frazao (ed.), America’s Eating Habits: Changes andConse-quences. AIB-750. USDA, Economic ResearchService.
Lopez, L.M., and J.P. Habicht. 1987a. “Food Stampsand the Energy Status of the U.S. Elderly Poor,”Journal of the American Dietetic Association87(8):1020-24.
Lopez, L.M., and J.P. Habicht. 1987b. “Food Stampsand the Iron Status of the U.S. Elderly Poor,” Journalof the American Dietetic Association 87(5):598-603.
Moffitt, R. 1989. “Estimating the Value of an In-kindTransfer: The Case of Food Stamps,” Econometrica57(2):385-409.
Neenan, P.H., and C.G. Davis. 1977. Impact of theFood Stamp Program and Expanded Food andNutrition Education Programs on Food Expendituresand Nutrient Intake of Low-Income Rural FloridaHouseholds. Gainesville, FL: Florida AgriculturalExperiment Station, Project AS-01629.
Ohls J.C., and H. Beebout. 1993. “Chapter One: TheContext,” in J.C. Ohls and H. Beebout (eds.) The FoodStamp Program: Design Tradeoffs, Policy, andImpacts. Washington, DC: Mathematica PolicyResearch, Inc., pp. 1-20.
Ohls, J.C., T.M. Fraker, A.P. Martini, et al. 1992. TheEffects of Cash-out on Food Use by Food StampProgram Participants in San Diego. USDA, Food andNutrition Service
Perez-Escamilla, R., A.M. Ferris, L. Drake, et al. 2000.“Food Stamps are Associated with Food Security andDietary Intake of Inner-City Preschoolers from Hartford,Connecticut,” Journal of Nutrition 130:2711-17.
Perkin, J., L.A. Crandall, and S.F. McCann. 1988.“Ethnicity and Food Stamp Program Participation:Effect upon Dietary Intakes of Low-income MothersServed by a North Florida Family Practice Center,”Journal of the American Dietetic Association 88:1081-86.
Posner, B.M., J.C. Ohls, and J.C. Morgan. 1987.“Impact of Food Stamps and Other Variables onNutrient Intake in the Elderly,” Journal of Nutritionfor the Elderly 6(3):3-16.
Prato, A.A., and J.N. Bagali. 1976. “Nutrition andNonnutrition Components of Demand for Food Items,”American Journal of Agricultural Economics 58:563-67.
Price, D.W. 1983. Effects of Socioeconomic Variablesand Food Stamp Participation on the Consumption ofSelected Food Groups. Research Bulletin No. XB0932. Agricultural Research Center, Washington StateUniversity.
Putnam, J., and S. Gerrior. 1999. “Chapter 7: Trends inthe U.S. Food Supply, 1980-97,” in E. Frazao (ed.)America’s Eating Habits: Changes and Consequences.AIB-750. USDA, Economic Research Service.
Ranney, C.K., and J.E. Kushman. 1987. “CashEquivalence, Welfare Stigma, and Food Stamps,”Southern Economics Journal 53(4):1011-27.
Rose, D., J.P. Habicht, and B. Devaney. 1998a.“Household Participation in the Food Stamp and WICPrograms Increases the Nutrient Intakes of PreschoolChildren,” Journal of Nutrition 128(3):548-55.
Rose, D., C. Gundersen, and V. Oliveira. 1998b. Socio-Economic Determinants of Food Insecurity in the UnitedStates. Evidence from the SIPP and CSFII Datasets.TB-1869. USDA, Economic Research Service.
Rose, D., D. Smallwood, and J. Blaylock. 1995.“Socio-economic Factors Associated with the IronIntake of Preschoolers in the United States,” NutritionResearch 15(9):1297-1309.
Rosso, R. 2003. Characteristics of Food StampHouseholds: Fiscal Year 2001. USDA, Food andNutrition Service.
Salathe, L.E. 1980. “The Food Stamp Program andLow-income Households’ Food Purchases,”Agricultural Economic Research 32(4):33-41.
126 E Effects of Food Assistance and Nutrition Programs on Nutrition and Health / FANRR-19-4 Economic Research Service/USDA
Scearce, W.K., and R.B. Jensen. 1979. “Food StampProgram Effects on Availability of Food Nutrients forLow Income Families in the Southern Region of theUnited States,” Southern Journal of AgriculturalEconomics 11(2):113-20.
Senauer, B., and N. Young. 1986. “The Impact of FoodStamps on Food Expenditures: Rejection of theTraditional Model,” American Journal of AgriculturalEconomics 68(1):37-43.
Smallwood, D.M., and J.R. Blaylock. 1985. “Analysisof Food Stamp Program Participation and FoodExpenditures,” Western Journal of AgriculturalEconomics 10(1):41-54.
Southworth, H.M. 1945. “The Economics of PublicMeasures to Subsidize Food Consumption,” Journal ofFarm Economics 27:38-66.
Townsend, M.S., J. Peerson, B. Love, et al. 2000.“Food Insecurity is Positively Related to Overweightin Women,” Journal of Nutrition 131:1738-45.
Tuttle, C. 2002. Characteristics of Food StampHouseholds: Fiscal Year 2001 (Advance report).USDA, Food and Nutrition Service.
U.S. Department of Agriculture. 2004. “VenemanAnnounces Full Implementation of Food StampProgram Electronic Benefits Transfer System,” USDANews Release 0251.04, June 22, 2004.
U.S. Department of Agriculture, Food and NutritionService. 2003a. Program data. Available: http://www.fns.usda.gov/pd. Accessed April 2003.
U.S. Department of Agriculture, Food and NutritionService. 2003b. “Food Stamp Program NutritionEducation Fact Sheet.” Available: http://www.fns.usda.gov/fsp/menu/admin/nutritioned/fsheet.htm. AccessedApril 2003.
U.S. Department of Agriculture, Food and NutritionService. 2001. The Decline in Food StampParticipation: A Report to Congress.
U.S. Department of Agriculture, Food and NutritionService. 2000. “Food and Nutrition Service (FNS)Strategic Plan 2000 to 2005.” Available: http://www.fns.usda.gov/oane/MENU/gpra/FNSStrategicplan.htm.Accessed April 2002.
U.S. Department of Health and Human Services. 2000.Healthy People 2010: Understanding and ImprovingHealth, 2nd Edition.
Wallace, G., and R. Blank. 1999. “What Goes Up MustCome Down? Explaining Recent Changes in PublicAssistance Caseloads,” in S. Danziger (ed.), EconomicConditions and Welfare Reform. Kalamazoo, MI:Upjohn Institute.
Weimer, J.P. 1998. Factors Affecting Nutrient Intake ofthe Elderly. AER-769. USDA., Economic ResearchService.
West, D.A. 1984. Effects of the Food Stamp Programon Food Expenditures. Research Bulletin No. XB0922. Agricultural Research Center, Washington StateUniversity.
West, D.A., and D.W. Price. 1976. “The Effects ofIncome, Assets, Food Programs, and Household Sizeon Food Consumption,” American Journal ofAgricultural Economics 58(1):725-30.
West, D.A., D.W. Price, and D.Z. Price. 1978.“Impacts of the Food Stamp Program on Value ofFood Consumed and Nutrient Intake amongWashington Households with 8-12 Year Old Children,”Western Journal of Agricultural Economics 3:131-44.
Whitfield, R.A. 1982. “A Nutritional Analysis of theFood Stamp Program,” American Journal of PublicHealth 72(8):793-99.
Wilde, P. 2001. “Strong Economy and Welfare ReformContribute to Drop in Food Stamp Rolls,” FoodReview24(1):2-7. USDA, Economic Research Service.
Wilde, P., P. Cook, C. Gundersen, et al. 2000a. TheDecline in Food Stamp Program Participation in the1990s. FANRR-7. USDA, Economic ResearchService.
Wilde, P., S. Hofferth, S. Stanhope, et al. 2000b. “Pre-1997 Trends in Welfare and Food Assistance in aNational Sample of Families,” American Journal ofAgricultural Economics 82(3):642-48.
Wilde, P., P.E. McNamara, and C.K. Ranney. 1999.“The Effects of Income and Food Programs on DietaryQuality: a Seemingly Unrelated Regression Analysiswith Error Components,” American Journal ofAgricultural Economics 81:201-213.

Economic Research Service/USDA Effects of Food Assistance and Nutrition Programs on Nutrition and Health / FANRR-19-4 E 127
WIC Program
128 E Effects of Food Assistance and Nutrition Programs on Nutrition and Health / FANRR-19-4 Economic Research Service/USDA
Abrams, B., S. Altman, and K. Pickett. 2000.“Pregnancy Weight Gain: Still Controversial,” AmericanJournal of Clinical Nutrition 71(5):1233s-41s.
Abt Associates Inc. 2002. National ImmunizationSurvey. 2000 Public Use Data File: Documentation,Code Book and Frequencies. Report prepared for theCenters for Disease Control and Prevention. Availableat: http;//www.cdc.gov/nis/pdfs/niscbk00.pdf.Accessed June 2003.
Ahluwalia, I.B., V.K. Hogan, L. Grummer-Strawn, etal. 1998. “The Effect of WIC Participation on Small-for-gestational-age births: Michigan, 1992,” AmericanJournal of Public Health 88(9):1374-77.
Arcia, G.J., L.A. Crouch, and R.A. Kulka. 1990. “Impactof the WIC Program on Food Expenditures,” AmericanJournal of Agricultural Economics 72:218-26.
Argeanas, S., and I. Harrill. 1979. “Nutrient Intake ofLactating Women Participating in the Colorado WICProgram,” Nutrition Reports International 20(6):805-10.
Bailey, L.B., M.S. O’Farrell-Ray, C.S. Mahan, et al.1983. “Vitamin B6, Iron, and Folacin Status ofPregnant Women,” Nutrition Research 3:783-93.
Balcazar, H., C.M. Trier, and J.A. Cobas. 1995. “WhatPredicts Breastfeeding Intention in Mexican-Americanand Nonhispanic White Women? Evidence from aNational Survey,” Birth 22:74-80.
Bartlett, S., R. Olvera, E. Bobronikov, et al. 2003. Study of WIC Participant and ProgramCharacteristics: 2002. USDA, Food and Nutrition Service.
Bartlett, S., R. Olvera, N. Gill, et al. 2002. WICParticipant and Program Characteristics: 2000.USDA, Food and Nutrition Service.
Basiotis, P., C. Kramer-LeBlanc, and E. Kennedy. 1998.“Maintaining Nutrition Security and Diet Quality: theRole of the Food Stamp Program and WIC,” FamilyEconomics and Nutrition Review 11(1-2):4-16.
Batten, S., J. Hirschman, and D. Thomas. 1990.“Impact of the Special Supplemental Food Program on Infants,” Pediatrics 117:S101-09.
Besharov, D., and P. Germanis. 2001. Rethinking WIC.Washington, DC: The AEI Press.
Birkhead G.S., C.W. LeBaron, P. Parsons, et al. 1995.“The Immunization of Children Enrolled in the SpecialSupplemental Food Program for Women, Infants, andChildren (WIC): The Impact of Different Strategies,”Journal of the American Medical Association274(4):312-16.
Black, M., D. Cutts, D. Frank, et al. 2004. “SpecialSupplemental Nutrition Program for Women, Infants,and Children Participation and Infants’ Growth andHealth: A Multisite Surveillance Study,” Pediatrics114:169-76.
Bogen, D.L. 2002. “Anemia Screening in the SpecialSupplemental Nutrition Program for Women, Infants,and Children: Time for Change?” Pediatrics 156:969-70.
Brien, M.J., and C.A. Swann. 1999. Prenatal WICParticipation and Infant Health: Selection andMaternal Fixed Effects. Unpublished manuscript.
Bronner, Y.L., D.M. Paige, S.M. Gross, et al. 1994.Nutrition Education for Pregnant Women andCaretakers of Infants: A Review of Research. USDA,Food and Nutrition Service.
Brown, H.L., K. Watkins, and H. Hiett. 1996. “TheImpact of the Women, Infants, and Children FoodSupplement Program on Birth Outcomes,” AmericanJournal of Obstetrics and Gynecology 174:1279-83.
Brown, J.E., and P. Tieman. 1986. “Effect of Incomeand WIC on the Dietary Intake of Preschoolers:Results of a Preliminary Study,” Journal of theAmerican Dietetic Association 86:1189-91.
Buescher, P.A., and S. Horton. 2000. Prenatal WICParticipation in Relation to Low Birth Weight andMedicaid Infant Costs in North Carolina - a 1997Update. Study No. 122. Raleigh, NC: North CarolinaDepartment of Health and Human Services, Center forHealth Information and Statistics.
Buescher, P.A., S. Horton, B. Devaney, et al. 2003.“Child Participation in WIC: Medicaid Costs and Useof Healthcare Services,” American Journal of PublicHealth 93(1):145-50.
Economic Research Service/USDA Effects of Food Assistance and Nutrition Programs on Nutrition and Health / FANRR-19-4 E 129
Buescher, P.A., L.C. Larson, M.D. Nelson, et al. 1993.“Prenatal WIC Participation Can Reduce Low BirthWeight and Newborn Medical Costs: a Cost-benefitAnalysis of WIC Participation in North Carolina,”Journal of the American Dietetic Association93(2):163-66.
Burstein, N., M.K. Fox, J.B. Hiller, et al. 2000. WICGeneral Analysis Project: Profile of WIC Children.USDA, Food and Nutrition Service.
Burstein, N., M.K. Fox, and M.J. Puma. 1991. Study ofthe Impact of WIC on the Growth and Development ofChildren: Field Test. Final Report, Volume II:Preliminary Impact Estimates. Cambridge, MA: AbtAssociates Inc.
Caan, B., D.M. Horgen, S. Margen, et al. 1987.“Benefits Associated with WIC Supplemental FeedingDuring the Interpregnancy Interval,” AmericanJournal of Clinical Nutrition 45:29-41.
Carlson, A., and B. Senauer. 2003. “The Impact of theSpecial Supplemental Nutrition Program for Women,Infants, and Children on Child Health," AmericanJournal of Agricultural Economics 85(2):479-91.
Centers for Disease Control and Prevention. 1995.“Nutritional Status of Children Participating in theSpecial Supplemental Nutrition Program for Women,Infants, and Children B United States, 1988-1991,”Morbidity and Mortality Weekly 45(3): 65-69.
Centers for Disease Control and Prevention. 1992.“Recommendations for the Use of Folic Acid toReduce the Number of Cases of Spina Bifida andOther Neural Tube Defects,” Morbidity and MortalityWeekly Report 41(RR-14):1-7.
Chatterji, P., K. Bonuk, S. Dhawan, et al. 2002. WICParticipation and the Initiation and Duration ofBreastfeeding. Discussion Paper No. 1246-02.Madison, WI: Institute for Research on Poverty.
Cole, N., and M.K. Fox. 2004. Nutrition and HealthCharacteristics of Low-Income Populations: Volume II, WIC Participants and Nonparticipants. E-FAN-04-014-2. USDA, Economic Research Service.
Collins, T.R., S.T. DeMellier, J.D. Leeper, et al. 1985.“Supplemental Food Program: Effects on Health andPregnancy Outcome,” Southern Medical Journal78(5):551-55.
Covington, M.T. 1995. Protective Factors in theContent of Prenatal Care Services that PromoteNormal Birth Weight Deliveries Among African-American Women. Unpublished doctoral dissertation,University of North Carolina at Chapel Hill.
Currie, J. 1995. “WIC and School NutritionPrograms,” in J. Currie (ed.), Welfare and the Well-Being of Children. Chur, Switzerland: HarwoodAcademic Publishers, pp.92-103.
Devaney, B. 1992. Very Low Birthweight AmongMedicaid Newborns in Five States: The Effects ofPrenatal WIC Participation. USDA, Food andNutrition Service.
Devaney, B., L. Bilheimer, and J. Schore. 1990. TheSavings in Medicaid Costs for Newborns and TheirMothers from Prenatal WIC Participation in the WICProgram: Volume 1. USDA, Food and Nutrition Service.
Devaney, B., L. Bilheimer, and J. Schore. 1991. The Savings in Medicaid Costs for Newborns andTheir Mothers from Prenatal WIC Participation in the WIC Program: Volume 2. USDA, Food andNutrition Service.
Devaney, B., and A. Schirm. 1993. Infant MortalityAmong Medicaid Newborns in Five States: The Effectsof Prenatal WIC Participation. USDA, Food andNutrition Service.
Devaney, B., P. Ziegler, S. Pac, et al. 2004. “NutrientIntakes of Infants and Toddlers,” Journal of the Ameri-can Dietetic Association 104(1, Supplement):S14-S21.
Dietz, V.J., A.L. Baughman, E.F. Dini, et al. 2000.“Vaccination Practices, Policies, and ManagementFactors Associated with High Vaccination CoverageLevels in Georgia Public Clinics,” Archives ofPediatric Adolescent Medicine 154:184-89.
Edozien J., M.D. Boyd, B. Switzer, et al. 1979.“Medical Evaluation of the Special Supplemental FoodProgram for Women, Infants, and Children,” AmericanJournal of Clinical Nutrition 32:677-92.
Endres, J., M. Sawicki, and J.A. Casper. 1981. “DietaryAssessment of Pregnant Women in a SupplementalFood Program,” Journal of the American DieteticAssociation 79:121-26.
130 E Effects of Food Assistance and Nutrition Programs on Nutrition and Health / FANRR-19-4 Economic Research Service/USDA
Federal Register. 2003. “Special SupplementalNutrition Program for Women, Infants, and Children(WIC): Revisions to the WIC Food Packages.”68(178):53903-10.
Finch, B.K. 2003. “Socioeconomic Gradients and LowBirth-Weight: Empirical and Policy Considerations,”Health Services Research 38(6, Part II):1819-41.
Fox, M.K., N. Burstein, J. Golay, et al. 1998. WICNutrition Education Assessment Study: Final Report.USDA, Food and Nutrition Service.
Fraker, T.M., S.K. Long, and C.E. Post. 1990. Analysisof the 1985 Continuing Survey of Food Intakes byIndividuals. Volume I, Estimating Usual DietaryIntake, Assessing Dietary Adequacy, and EstimatingProgram Effects: Applications of Three AdvancedMethodologies Using FNS’s Four-Day Analysis File.USDA, Food and Nutrition Service.
Frisbie, W.P., M. Biegler, P. deTurk, et al. 1997. “Racialand Ethnic Differences in Determinants of IntrauterineGrowth Retardation and Other Compromised BirthOutcomes,” American Journal of Public Health87(12):1977-83.
Gordon, A., R. Kliman, J. Ohls, et al. 1999. Estimatingthe Number of People Eligible for WIC and the Full-Funding Participation Rate: A Review of the Issues.USDA, Food and Nutrition Service.
Gordon, A., K. Lewis, and L. Radbill. 1997. IncomeVariability Among Families with Pregnant Women,Infants, or Young Children. USDA, Food andConsumer Service.
Gordon, A., and L. Nelson. 1995. Characteristics andOutcomes of WIC Participants and Nonparticipants:Analysis of the 1988 National Maternal and InfantHealth Survey. USDA, Food and Nutrition Service.
Gore, S.A., D.M. Brown, and D.S. West. 2003. “TheRole of Postpartum Weight Retention in ObesityAmong Women: A Review of the Evidence,” Annals ofBehavioral Medicine 26(2):149-59.
Gregory, P., and M. deJesus. 2003. “Racial Differencesin Birth Outcomes and Costs in Relation to PrenatalWIC Participation,” New Jersey Medicine 100(3):29-36.
Heimendinger, J., N. Laird, J. Austin, et al. 1984. “TheEffects of the WIC Program on the Growth ofInfants,” American Journal of Clinical Nutrition 40:1250-57.
Hicks, L.E., and R.A. Langham. 1985. “CognitiveMeasure Stability in Siblings Following EarlyNutritional Supplementation,” Public Health Report100(6):656-62.
Hicks, L.E., R.A. Langham, and J. Takenaka. 1982.“Cognitive and Health Measures Following EarlyNutritional Supplementation: a Sibling Study,”American Journal of Public Health 72(10):1110-18.
Hirschman, J. 2004. Presentation to Expert Committeefor Review of Food Practices. Institute of Medicine.February 26, 2004. Available: http://www.iom.edu/object.file/master/19/293/0.pdf. Accessed June 2004.
Hogan, D.P., and J.M. Park. 2000. “Family Factors andSocial Support in the Developmental Outcomes ofVery Low Birthweight Children,” Clinics inPerinatology 27(2):433-58.
Hutchins, S.S., J. Rosenthal, P. Eason, et al. 1999.“Effectiveness and Cost-Effectiveness of Linking theSpecial Supplemental Program for Women, Infants,and Children (WIC) and Immunization Activities,”Journal of Public Health Policy 20(4):408-26.
Institute of Medicine, Food and Nutrition Board. 2001. Dietary Reference Intakes: Application inDietary Assessment. Washington, DC: NationalAcademy Press.
Institute of Medicine. 2004. Proposed Criteria forSelecting the WIC Food Packages. Washington, DC:National Academy Press.
Institute of Medicine. 1996. WIC Nutrition RiskCriteria: A Scientific Assessment, pp.1-22 and 335-52.Washington, DC: National Academy Press.
Institute of Medicine. 1990. Nutrition DuringPregnancy, Part I: Weight Gain. Washington, DC:National Academy Press.
James, J.M. 1998. Immunization and its Implication onWIC and NonWIC Participants. Unpublished Master’sthesis. New York Medical College.
Economic Research Service/USDA Effects of Food Assistance and Nutrition Programs on Nutrition and Health / FANRR-19-4 E 131
Joyce, T., H. Corman, and M. Grossman . 1988. “ACost-effectiveness Analysis of Strategies to ReduceInfant Mortality,” Medical Care 26(4):348-60.
Kahn, J.L., H.J. Binns, T. Chen, et al. 2002.“Persistence and Emergence of Anemia in ChildrenDuring Participation in the Special SupplementalNutrition Program for Women, Infants, and Children,”Pediatrics 156:1028-32.
Kennedy, E.T., and S. Gershoff. 1982. “Effect of WICSupplemental Feeding on Hemoglobin and Hematocritof Prenatal Patients,” Journal of the American DieteticAssociation 80:227-30.
Kennedy, E.T., S. Gershoff, R. Reed, et al. 1982.“Evaluation of the Effect of WIC SupplementalFeeding on Birth Weight,” Journal of the AmericanDietetic Association 80(3):220-27.
Kennedy, E.T., and M. Kotelchuck. 1984. “The Effectof WIC Supplemental Feeding on Birth Weight: ACase-control Analysis,” American Journal of ClinicalNutrition 40:579-85.
Kotch, J.B., M. McCann, and D. Shanklin. 1989.Assessing the Impact of the WIC Program on Infantsand Children: Final Design Report. Chapel Hill, NC:University of North Carolina.
Kotelchuck, M., J.B. Schwartz, M.T. Anderka, et al.1984. “WIC Participation and Pregnancy Outcomes:Massachusetts Statewide Evaluation Project,”American Journal of Public Health 74(10):1086-92.
Kowaleski-Jones, L., and G.J. Duncan. 2000. Effects ofParticipation in the WIC Food Assistance Program onChildren’s Health and Development: Evidence fromNLSY Children. Discussion Paper No. 1207-00.Madison, WI: Institute for Research on Poverty.
Kowaleski-Jones, L., and G. Duncan. 2002. “Effects ofParticipation in the WIC Program on Birthweight: Evi-dence from the National Longitudinal Survey of Youth,”American Journal of Public Health 92(5):799-804.
Kramer-LeBlanc, C., A. Mardis, S. Gerrior, et al. 1999.Review of the Nutritional Status of WIC Participants.USDA, Center for Nutrition Policy and Promotion.
Kranz, S., and S.M. Siega-Riz. 2002. “Sociodemo-graphic Determinants of Added Sugar Intake inPreschoolers 2 to 5 Years Old,” Journal of Pediatrics140:667-72.
Kresge, J. 2003. WIC Participant and ProgramCharacteristics: PC2002, Executive Summary. USDA,Food and Nutrition Service.
Lederman, S.A., G. Alfasi, and R.J. Deckelbaum.2002. “Pregnancy-associated Obesity in Black Womenin New York City,” Maternal and Child HealthJournal 6(1):37-42.
Lee, B.J., L. Mackey-Bilaver, and R.M. Goerge. 2000.The Patterns of Food Stamp and WIC Participationand Their Effects on Health and Low-IncomeChildren. JCPR Working Paper No. 129. Chicago, IL:Northwestern University/University of Chicago JointCenter for Poverty Research.
Lee, J.Y., R.G. Rozier, E.C. Norton, et al. 2004a.“Effects of WIC Child Participation on Use of OralHealth Services,” American Journal of Public Health94:772-77.
Lee, J.Y., R.C. Rozier, E.C. Norton, et al. 2004b. “TheEffects of the Women, Infants, and Children’sSupplemental Food Program on Dentally-RelatedMedicaid Expenditures,” Journal of Public HealthDentistry 64:76-81.
Logan, C., M.K. Fox, and B.-H. Lin. 2002. Effects ofFood Assistance and Nutrition Programs on Nutritionand Health, Volume 2: Data Sources. FANRR-19-2.USDA, Economic Research Service.
Luman, E.T., M.M. McCauley, A. Shefer, et al. 2003.“Maternal Characteristics Associated with Vaccinationof Young Children,” Pediatrics 111(5):1215-18.
Mardis, A., and R. Anand. 2000. A Look at the Diet ofPregnant Women. Nutrition Insights No. 17. USDA,Center for Nutrition Policy and Promotion.
Mays-Scott, C.L. 1991. Adolescent Pregnancy andInfant Outcome: The Influence of Physiological andSocioeconomic Determinants on Pregnancy Outcome.Unpublished doctoral dissertation, Texas Women’sUniversity.
Metcoff, J., P. Costiloe, W.M. Crosby, et al. 1985.“Effect of Food Supplementation (WIC) DuringPregnancy on Birth Weight,” American Journal ofClinical Nutrition 41:933-47.
Miller, V. S. Swaney, and A. Deinard. 1985. “Impactof the WIC Program on the Iron Status of Infants,”Pediatrics 75(1):100-5.
132 E Effects of Food Assistance and Nutrition Programs on Nutrition and Health / FANRR-19-4 Economic Research Service/USDA
Moss, N.E., and K. Carver. 1998. “The Effect of WICand Medicaid on Infant Mortality in the United States,”American Journal of Public Health 88(9):1354-61.
National Governor’s Association. 2003. MCH Update2002: State Health Coverage for Low-Income PregnantWomen, Children, and Parents. Issue Brief. Washington,DC: NGA Center for Best Practices, June 9, 2003.
New York State Department of Health, Bureau ofNutrition. 1990. The New York State WIC Evaluation:The Association Between Prenatal WIC Participationand Birth Outcomes. Albany, NY.
Okita, J.R. 2004. “IOM Project: Review of the WICFood Packages.” Presentation made to the NationalWIC Association Leadership Conference. March 14,2004. Available: http://www.iom.edu/ object.file/mas-ter/19/309/0.pdf. Accessed June 2004.
Oliveira, V. 2003. WIC and Breastfeeding Rates.FANRR-34-2. USDA, Economic Research Service.
Oliveira, V., and C. Gundersen. 2000. WIC and theNutrient Intake of Children. FANRR-5. USDA,Economic Research Service.
Oliveira, V., E. Racine, J. Olmstead, et al. 2002. TheWIC Program: Background, Trends, and Issues.FANRR-27. USDA, Economic Research Service.
Paige, D.M. 1983. Medical Assistance Costs andUtilization Patterns in WIC Enrollees. Baltimore, MD:Johns Hopkins University, School of Hygiene andPublic Health and the Maryland Department of Healthand Mental Hygiene.
Partington, S., and S. Nitzke. 1999. “Intake of FoodGuide Pyramid Servings: A Comparison of WICChildren in Wisconsin and Children from 1994CSFII,” Journal of Nutrition Education 31:38-42.
Pehrsson, P.R., P.B. Moser-Veillon, L. Sims, et al. 2001.“Postpartum Iron Stats in Nonlactating Participantsand Nonparticipants in the Special SupplementalNutrition Program for Women, Infants, and Children,”American Journal of Clinical Nutrition 73:86-92.
Pollitt, E., and R. Lorimor. 1983. “Effects of WIC onCognitive Development,” American Journal of PublicHealth 73(6):698-700.
Ponza, M., B. Devaney, P. Ziegler, et al. 2004. “NutrientIntakes and Food Choices of Infants and ToddlersParticipating in WIC,” Journal of the AmericanDietetic Association 104(1, Supplement):S71-S79.
Puma, M.J., J. DiPietro, J. Rosenthal, et al. 1991. Studyof the Impact of WIC on the Growth and Developmentof Children: Field Test, Volume 1: FeasibilityAssessment. Cambridge, MA: Abt Associates Inc.
Putnam, J., and S. Gerrior. 1999. “Chapter 7: Trends inthe U.S. Food Supply, 1980-97,” in E. Frazao (ed.),America’s Eating Habits: Changes and Consequences.AIB-750. USDA, Economic Research Service.
Reichman, N.E., and J.O. Teitler. 2003. “Effects ofPsychosocial Risk Factors and Prenatal Interventionson Birthweight: Evidence from New Jersey’s HealthStart Program,” Perspectives on Sexual andReproductive Health 35(3):130-7.
Rose D., J.P. Habicht, and B. Devaney. 1998.“Household Participation in the Food Stamp and WICPrograms Increases the Nutrient Intakes of PreschoolChildren,” Journal of Nutrition 128(3):548-55.
Rose, D., D. Smallwood, and J. Blaylock. 1995.“Socio-economic Factors Associated with the IronIntake of Preschoolers in the United States,” NutritionResearch 15(9):1297-1309.
Rossi, P.H. 1998. Feeding the Poor: Assessing FederalFood Aid. Washington, DC: The AEI Press, pp. 44-65.
Roth, J., J. Yang, S. Wu, et al. 2004. Evaluating theImpact of WIC Participation on Pregnancy Outcomes:Florida, 1996-2000. Presented at the 16th AnnualConference of the Southeast Evaluation Association,January 29-30, 2004. (Initially included in reviewbased on preliminary 2000 presentation at AmericanAcademy of Pediatrics Meeting (Roth et al., 2000)).
Roth, J., S. Wu, R. Carter, et al. 2000. “Impact ofMedicaid Managed Care and WIC Participation onInfant Birth Outcomes,” Pediatric Research 47(9):1309. (Meeting abstract).
Rush D., J.M. Alvir, D.A. Kenny, et al. 1988a. “TheNational WIC Evaluation: Evaluation of the SpecialSupplemental Food Program for Women, Infants andChildren, III: Historical Study of Pregnancy Outcomes,”American Journal of Clinical Nutrition 48:412-28.
Economic Research Service/USDA Effects of Food Assistance and Nutrition Programs on Nutrition and Health / FANRR-19-4 E 133
Rush, D., M.R. Kurzon, W.B. Seaver, et al. 1988b.“The National WIC Evaluation: Evaluation of theSpecial Supplemental Food Program for Women,Infants and Children, VII: Study of FoodExpenditures,” American Journal of Clinical Nutrition 48:512-19.
Rush D., J. Leighton, N.L. Sloan, et al. 1988c. “TheNational WIC Evaluation: Evaluation of the SpecialSupplemental Food Program for Women, Infants andChildren, VI: Study of Infants and Children,”American Journal of Clinical Nutrition 48:484-511.
Rush, D., W.B. Seaver, D.G. Horvitz, et al. 1986. TheNational WIC Evaluation: An Evaluation of theSpecial Supplemental Food Program for Women,Infants and Children, Volumes I-III. USDA, Food andNutrition Service.
Rush D., N.L. Sloan, J. Leighton, et al. 1988d. “TheNational WIC Evaluation: Evaluation of the SpecialSupplemental Food Program for Women, Infants andChildren, V: Longitudinal Study of Pregnant Women,”American Journal of Clinical Nutrition 48:439-83.
Ryan, A.S., D.R. Rush, F.W. Krieger, et al. 1991.“Recent Declines in Breastfeeding in the UnitedStates: 1984 Through 1989,” Pediatrics 88(4):719-27.
Sanders, A., T. Romashko, H. Fleischman, et al. 1990. WIC Breastfeeding Promotion Study andDemonstration: Phase IV Report. USDA, Food andNutrition Service.
Schramm, W.F. 1985. “WIC Prenatal Participation and its Relationship to Newborn Medicaid Costs inMissouri: a Cost/benefit Analysis,” American Journalof Public Health 75(8):851-57.
Schramm, W. F. 1986. “Prenatal Participation in WICRelated to Medicaid Costs for Missouri Newborns:1982 Update,” Public Health Report 101(6):607-15.
Schwartz, J.B., D.K. Guilkey, J.S. Akin, et al. 1992.The WIC Breastfeeding Report: The Relationship ofWIC Program Participation to the Initiation andDuration of Breastfeeding. USDA, Food and Nutrition Service.
Shaheen, M.A., R.R. Frerichs, N. Alexopoulos, et al.2000. “Immunization Coverage Among PredominantlyHispanic Children, Aged 2-3 Years, in Central LosAngeles,” Annals of Epidemiology 10:160-68.
Shefer, A.M., E.T. Luman, B.H. Lyons, et al. 2001.“Vaccination Status of Children in the Women, Infants,and Children (WIC) Program: Are We Doing Enoughto Improve Coverage?” American Journal ofPreventive Medicine 20(1, Supplement 1):47-54.
Sherry, B., D. Bister, and R. Yip. 1997. “Continuationof Decline in Prevalence of Anemia in Low-incomeChildren: the Vermont Experience,” Archives ofPediatrics and Adolescent Medicine 151:928-30.
Sherry, B., Z. Mei, and R. Yip (2001). “Continuationof the Decline in Prevalence of Anemia in Low-Income Infants and Children in Five States,”Pediatrics 107(4):677-82.
Sherry, B., M. Zuogo, and R. Yip (2001). “Continuationof the Decline in Prevalence of Anemia in Low-IncomeInfants and Children in Five States,” Pediatrics107(4):677-82.
Siega-Riz, S.M., S. Kranz, D. Blanchette, et al. 2004.“The Effect of Participation in the WIC Program onPreschoolers’ Diets,” Journal of Pediatrics 144:229-34.
Silverman, P.R. 1982. The Effect of a Local PrenatalNutrition Supplementation Program (WIC) on theBirth Weight of High Risk Infants. Unpublished doctor-al dissertation. University of Pittsburgh.
Simpson, K.N. 1988. Analyzing the Influences ofSelected Public Prevention Programs on LowBirthweight in North Carolina Counties. Unpublisheddoctoral dissertation, University of North Carolina atChapel Hill.
Smith, A., G. Branch, S. Henry, et al. 1986.“Effectiveness of a Nutrition Program for Mothers andTheir Anemic Children,” Journal of the AmericanDietetic Association 86(8):1039-42.
Sondik, E.J. 2003. Letter to State vital statistics regis-trars. Available: http://www.cdc.gov/nchs/vital_certs_rev.htm. Accessed June 2004.
Stockbauer, J.W. 1986. “Evaluation of the MissouriWIC Program: Prenatal Components,” Journal of theAmerican Dietetic Association 86(1):61-67.
Stockbauer, J.W. 1987. “WIC Prenatal Participationand its Relation to Pregnancy Outcomes in Missouri:A Second Look,” American Journal of Public Health77(7):813-18.
134 E Effects of Food Assistance and Nutrition Programs on Nutrition and Health / FANRR-19-4 Economic Research Service/USDA
Taren, D.L., W. Clark, M. Chernesky, et al. 1990.“Weekly Food Servings and Participation in SocialPrograms among Low-income Families,” AmericanJournal of Public Health 80(11):1376-78.
Tognetti, J., J.D. Hirschman, and J.E. McLaughlin.1991. “Decline in Breastfeeding?” Pediatrics 88(4):873-74.
Tuttle, C.R. and K.G. Dewey. 1994. “Determinants ofInfant Feeding Choices Among Southeast AsianImmigrants in Northern California,” Journal of theAmerican Dietetic Association 94(3):282-86.
U.S. Department of Agriculture, Food and NutritionService. 1978. CDC Analysis of Nutritional Indices forSelected WIC Participants.
U.S. Department of Agriculture, Food and NutritionService. 2003a. “Legislative History of BreastfeedingPromotion Requirements in WIC.” Available:http://www.fns.usda.gov/wic/ breast-feeding/bflegishistory.htm. Accessed August 2003.
U.S. Department of Agriculture, Food and NutritionService. 2003b. Program data. Available: http://www.fns.usda.gov/pd. Accessed August 2003.
U.S. Department of Agriculture, Food and NutritionService. 2003c. “WIC Program, Benefits and Services:WIC Food Package.” Available: http://www.fns.usda.gov/wic/benefitsandservices/ foodpckg.HTM.Accessed August 2003.
U.S. Department of Agriculture, Food and NutritionService. 2003d. “Women, Infants, and Children:Frequently Asked Questions About WIC.” Available:http://www.fns.usda.gov/WIC/FAQs/faq.htm#8.Accessed November 2003.
U.S. Department of Health and Human Services. 2000.Healthy People 2010: Understanding and ImprovingHealth, 2nd edition.
U.S. General Accounting Office. 1992. EarlyIntervention: Federal Investments Like WIC CanProduce Savings. GAO/HRD-92-18. Washington, DC:US Government Printing Office.
U.S. General Accounting Office. 1993. Breastfeeding:WIC’s Efforts to Promote Breastfeeding HaveIncreased. GAO/HRD-94-13. Washington, DC: U.S.Government Printing Office.
Variyam, J. 2002. “WIC Participation and the NutrientIntake of Preschoolers.” Unpublished paper.
Vazquez-Seoane, P., R. Windom, and H. A. Pearson.1985. “Disappearance of Iron-deficiency Anemia in aHigh-risk Infant Population Given Supplemental Iron,”New England Journal of Medicine 313(19):1239-40.
Ver Ploeg, M. and D. Betson. 2003. EstimatingEligibility and Participation for the WIC Program:Final Report. Washington, DC: National Academy Press.
Weiler, P.G., P. Stalker, S.W. Jennings, et al. 1979.“Anemia as a Criterion for Evaluation of a SpecialSupplemental Food Program for Women, Infants andChildren,” Pediatrics 63(4):584-90.
Weimer, J. 1998. Breastfeeding Promotion Research:The ES/WIC Nutrition Education Initiative andEconomic Considerations. AIB-744. USDA, EconomicResearch Service.
Wilde, P.E., P.E. McNamara, and C.K. Ranney. 2000.The Effect on Dietary Quality of Participation in theFood Stamp and WIC Programs. FANRR-9. USDA,Economic Research Service.
Yip, R., N. Binkin, L. Fleshood, et al. 1987.“Declining Prevalence of Anemia Among Low-incomeChildren in the United States,” Journal of theAmerican Medical Association 258(12):1619-23.
Yip, R., I. Parvanta, K. Scanlon, et al. 1992. “PediatricNutrition Surveillance System: United States, 1980-91.” Morbidity and Mortality Weekly Report 41(7):1-24.

Economic Research Service/USDA Effects of Food Assistance and Nutrition Programs on Nutrition and Health / FANRR-19-4 E 135
National School Lunch Program
136 E Effects of Food Assistance and Nutrition Programs on Nutrition and Health / FANRR-19-4 Economic Research Service/USDA
Abraham, S., M. Chattopadhyay, M. Montgomery, et al.2002. The School Meals Initiative Implementation Study:Third Year Report. USDA, Food and Nutrition Service.
Akin, J.S., D.K. Guilkey, P.S. Haines, et al. 1983a.“Impact of the School Lunch Program on NutrientIntakes of School Children,” School Food ServiceResearch Review 7(1):13-18.
Akin, J.S., D.K. Guilkey, and B.M. Popkin. 1983b.“The School Lunch Program and Nutrient Intake: aSwitching Regression Analysis,” American Journal of Agricultural Economics 65(3):477-85.
American School Food Service Association. 2003.“Legislative Update: Focus on Child NutritionContinues.” Available: http://www.asfsa.org/newsroom/sfsnews/legupdate0803.asp. Accessed August 2003.
Baranowski, T., and B.G. Simons-Morton. 1991.“Dietary and Physical Activity Assessment in School-age Children: Measurement Issues,” Journal of SchoolHealth 61:195-97.
Baxter, S.D., W.O. Thompson, A.F. Smith, et al. 2003.“Reverse Versus Forward Order Reporting and theAccuracy of Fourth-graders’ Recalls of School Breakfastand School Lunch,” Journal of the American DieteticAssociation 100(8):911-18.
Baxter, S.D., W.O. Thompson, and H.C. Davis. 2000.“Prompting Methods Affect the Accuracy of Children'sSchool Lunch Recalls,” Journal of the AmericanDietetic Association 100(8):911-18.
Burghardt, J., A. Gordon, N. Chapman, et al. 1993. TheSchool Nutrition Dietary Assessment Study: School FoodService, Meals Offered, and Dietary Intakes. USDA,Food and Nutrition Service.
Burghardt, J.A. and B.L. Devaney (eds.) 1995.“Background of the School Nutrition DietaryAssessment Study,” American Journal of ClinicalNutrition 61(1, Supplement):178S-181S.
Buzby, J.C., and J.F. Guthrie. 2002. Plate Waste inSchool Nutrition Programs: Final Report to Congress.E-FAN-02-009. USDA, Economic Research Service.
Buzby, J.C., J. Guthrie, and L.S. Kantor. 2003.Evaluation of the USDA Fruit and Vegetable PilotProgram: Report to Congress. E-FAN-03-006. USDA,Economic Research Service.
Centers for Disease Control and Prevention. 2003.“CDC Growth Chart Training Modules.” Available:http://www.cdc.gov/nccdphp/dnpa. Accessed May2003.
Cullen, K.W., J. Egan, T. Baranowski, et al. 2000.“Effect of a la Carte and Snack Bar Foods at Schoolon Children’s Lunchtime Intake of Fruits andVegetables,” Journal of the American DieteticAssociation 100(12):1482-86.
Devaney, B.L., M.R. Ellwood, and J.M. Love. 1997.“Programs That Mitigate the Effects of Poverty onChildren,” Future Child 7(2):88-112.
Devaney, B.L., A.R. Gordon, and J.A. Burghardt. 1993.The School Nutrition Dietary Assessment Study: DietaryIntakes of Program Participants and Nonparticipants.USDA, Food and Nutrition Service.
Emmons, L., M. Hayes, and D.L. Call. 1972. “A Studyof School Feeding Programs. I. Economic Elgibilityand Nutritional Need. II. Effects on Children withDifferent Economic and Nutritional Needs,” Journal ofthe American Dietetic Association 61(9):262-75.
Fox, M.K., M.K. Crepinsek, P. Connor, et al. 2001.Second School Nutrition Dietary Assessment Study(SNDA-II): Final Report. USDA, Food and NutritionService.
Fraker, T. 1987. Final Report: The Sodium and Macro-nutrient Content of USDA School Lunches. USDA,Food and Nutrition Service.
French, S.A., M. Story, J.A. Fulkerson, and A.F.Gerlach. 2003. “Food Environment in SecondarySchools: a la Carte, Vending Machines, and FoodPolicies and Prac-tices,” American Journal of PublicHealth 93(7):1161-67.
Gleason, P., and C. Suitor. 2003. “Eating at School:How the National School Lunch Program AffectsChildren’s Diets,” American Journal of AgriculturalEconomics 85(4):1047-61.
Gleason, P., and C. Suitor. 2001. Children’s Diets inthe Mid-1990’s: Dietary Intake and Its Relationshipwith School Meal Participation. USDA, Food andNutrition Service.
Gleason, P.M. 1996. Student Participation in the SchoolNutrition Programs: An Econometric and SimulationModel. USDA, Food and Nutrition Service.
Economic Research Service/USDA Effects of Food Assistance and Nutrition Programs on Nutrition and Health / FANRR-19-4 E 137
Glengdahl, M.C., and C.D. Seaborn. 1999. “Comparisonof Cost and Selected Nutrients of the National SchoolHot Lunch, a la Carte, and Combination of SchoolLunch/a la Carte Menus,” Journal of the AmericanDietetic Association 99(Supplement):A-49. Abstract ofpaper presented at annual meeting of the AmericanDietetic Association, October 1991.
Gretzen, D., and J.A. Vermeersch. 1980. “HealthStatus and School Achievement of Children from HeadStart and Free School Lunch Programs,” Public HealthReports 95(4):362-68.
Guthrie, J. 2003. Food Assistance Research Brief—Do Healthy School Meals Cost More? FANRR-34-6.USDA, Economic Research Service.
Ho, C.S., R.A. Gould, L.N. Jensen, et al. 1991.“Evaluation of the Nutrient Content of School, Sackand Vending Lunch of Junior High Students,” SchoolFood Service Research Review 15(2):85-90.
Hoagland, G.W. 1980. Feeding Children: FederalChild Nutrition Policies in the 1980s. Washington,DC: U.S. Government Printing Office.
Howe, S.M., and A.G. Vaden. 1980. “FactorsDifferentiating Participants and Nonparticipants of theNational School Lunch Program. I. Nutrient Intake ofHigh School Students,” Journal of the AmericanDietetic Association 76(5):451-58.
Institute of Medicine, Food and Nutrition Board. 2001.Dietary Reference Intakes: Application in DietaryAssessment. Washington, DC: National AcademyPress.
Jones, S.J., L. Jahns, B. Laraia, and B. Haughton.2003. “Lower Risk of Overweight in School-agedFood Insecure Girls who Participate in FoodAssistance: Results from the Panel Study of IncomeDynamics Child Development Supplement,” Archivesof Pediatrics & Adolescent Medicine 157(8):780-84.
Kandiah, J., and C. Peterson. 2001. “National SchoolBreakfast and Lunch Meals: Blood Lipid Levels inPrepubescents,” FASEB Journal 15(4):A273. Abstractof paper presented at the annual meeting of theFederation of American Societies for ExperimentalBiology, March 2001.
Kubik, M.Y., L.A. Lytle, P.J. Perry, and M. Story.2003. “The Association of the School Food ServiceEnvironment with Dietary Behaviors of YoungAdolescents,” American Journal of Public Health93(7):1168-73.
Lin, B.-H., and K. Ralston. 2003. Food AssistanceResearch Brief—Competitive Foods: Soft Drinks vs. Milk.FANRR-34-7. USDA, Economic Research Service.
Long, S.K. 1991. “Do the School Nutrition ProgramsSupplement Household Food Expenditures?” Journalof Human Resources 26(4):654-78.
Maurer, K. 1984. “The National Evaluation of SchoolNutrition Programs: Factors Affecting StudentParticipation,” American Journal of Clinical Nutrition40:425-47.
Medlin, C., and J.D. Skinner. 1988. “IndividualDietary Intake Methodology: a 50-year Review ofProgress,” Journal of the American DieteticAssociation 88:1250-57.
Melnik, T.A., S.J. Rhoades, K.R. Wales, et al. 1998.“Food Consumption Patterns of Elementary SchoolChildren in New York City,” Journal of the AmericanDietetic Association 98(2):159-64.
National Research Council. 1989. Diet and Health:Implications for Reducing Chronic Disease Risk.Washington, DC: National Academy Press.
Nestle, M. 2000. “Soft Drink Pouring Rights,” PublicHealth Reports 115:308-17.
Paige, D. 1972. “The School Feeding Program: AnUnderachiever,” Journal of School Health 42(7):392-95.
Perry, L.H., E.C. Shannon, K. Stitt, et al. 1984. “StudentLunch Practices: a Comparison of Cost and DietaryAdequacy of School Lunch and Brown Bag Lunches,”School Food Service Research Review 8(2):114-18.
Price, D.W., D.A. West, G.E. Scheier, et al. 1978.“Food Delivery Programs and Other Factors AffectingNutrient Intake of Children,” American Journal ofAgricultural Economics 60(4):609-18.
Puma, M.J., J. DiPietro, J. Rosenthal, D. Connell, et al.1991. Study of the Impact of WIC on the Growth andDevelopment of Children: Field Test, Volume 1: Feas-ibility Assessment. Cambridge, MA: Abt Associates Inc.
138 E Effects of Food Assistance and Nutrition Programs on Nutrition and Health / FANRR-19-4 Economic Research Service/USDA
Radzikowski, J., and S. Gale. 1984. “The NationalEvaluation of School Nutrition Programs: Conclusions,”American Journal of Clinical Nutrition 40:454-61.
Rainville, A.J. 2001. “Nutritional Quality ofReimbursable School Lunches Compared to LunchesBrought from Home in Elementary Schools in TwoSoutheastern Michigan Districts,” Journal of ChildNutrition & Management 25(1):13-18.
Ralston, K., J. Buzby, and J. Guthrie. 2003. Food Assis-tance Research Brief—A Healthy School Meal Environ-ment. FANRR-34-5. USDA, Economic Research Service.
Rossi, P.H. 1998. “The School Meals Programs,” inFeeding the Poor: Assessing Federal Food Aid.Washington, DC: The AEI Press, pp. 66-80.
Rush, D. 1984. “The National Evaluation of SchoolNutrition Programs: Editor’s Technical Notes,”American Journal of Clinical Nutrition 40:462-64.
U.S. Department of Agriculture, Food, Nutrition, andConsumer Services. 2001. Foods Sold in Competitionwith USDA School Meal Programs: A Report toCongress. Available: http://www.fns.usda.gov/cnd/lunch/CompetitiveFoods/report_congress.htm.
U.S. Department of Agriculture, Food and NutritionService. 2003a. Program data. Available: http://www.fns.usda.gov/pd. Accessed April 2003.
U.S. Department of Agriculture, Food and NutritionService. 2003b. “Afterschool Snacks in the NSLP: BasicQuestions and Answers.” Available: http://www.fns.usda.gov/cnd/Afterschool/NSLP_QA.htm. Accessed July 2003.
U.S. Department of Agriculture, Food and NutritionService. 2003c. “Program Fact Sheet: National SchoolLunch Program.” Available: http://www.fnsusda.gov/cnd/Lunch/default.htm. Accessed June 2003.
U.S. Department of Agriculture, Food and NutritionService. 2002. “Team Nutrition Policy Statement.”Available: http://www.fns.usda.gov/tn/grants/TN_PolicyStatement.pdf. Accessed April 2002.
U.S. Department of Agriculture, Food and NutritionService. 2000a. “Food and Nutrition Service (FNS)Strategic Plan 2000 to 2005.” Available: http://www.fns.usda.gov/oane/MENU/gpra/FNSStrategicplan.htm.Accessed April 2002.
U.S. Department of Agriculture, Food and NutritionService. 2000b. Changing the Scene: Improving theSchool Nutrition Environment. USDA, Food andNutrition Service. (A tool kit for schools, availablethrough http://www.fns.usda.gov/tn/Healthy/chang-ing.html).
U.S. Department of Agriculture and U.S. Departmentof Health and Human Services. 1990. Nutrition andYour Health: Dietary Guidelines for Americans, 3rdedition. Home and Garden Bulletin No. 232.
U.S. Department of Health, Education and Welfare.1972. Ten-Nutrition Survey: 1968-1970. Highlights.
Wechsler, H., N., Brener, S. Kuester, and C. Miller.2001. “Food Service and Foods and BeveragesAvailable at School: Results from the School HealthPolicies and Programs Study 2000,” Journal of SchoolHealth 71(7):313-23.
Wellisch, J.B., S.D. Hanes, L.A. Jordon, et al. 1983.The National Evaluation of School NutritionPrograms: Final Report. Volumes 1 and 2. SantaMonica, CA: Systems Development Corporation.
West, D.A., and D.W. Price. 1976. “The Effects ofIncome, Assets, Food Programs, and Household Sizeon Food Consumption,” American Journal ofAgricultural Economics 58(1):725-30.
Wolfe, W.S., and C.C. Campbell. 1993. “Food pattern,diet quality, and related characteristics of schoolchild-ren in New York State,” Journal of the AmericanDietetic Association 93(11):1280-84.
Wolfe, W.S., C.C. Campbell, E.A. Frongillo, et al.1994. “Overweight Schoolchildren in New York State:Prevalence and Characteristics,” American Journal ofPublic Health 84(5):807-13.
Yperman, A.M., and J.A. Vermeersch. 1979. “FactorsAssociated with Children’s Food Habits,” Journal ofNutrition Education 11(2):72-76.
Zive, M.M., J.P. Elder, J.J. Prochaska, et al. 2002.“Sources of Dietary Fat in Middle Schools,”Preventive Medicine 35(4):376-82.

Economic Research Service/USDA Effects of Food Assistance and Nutrition Programs on Nutrition and Health / FANRR-19-4 E 139
School Breakfast Program
140 E Effects of Food Assistance and Nutrition Programs on Nutrition and Health / FANRR-19-4 Economic Research Service/USDA
Abraham, S., M. Chattopadhyay, M. Montgomery, et al.2002. The School Meals Initiative Implementation Study:Third Year Report. USDA, Food and Nutrition Service.
Basiotis, P., M. Lino, and R.S. Anand. 1999. EatingBreakfast Greatly Improves Schoolchildren’s DietQuality. Nutrition Insights No. 15. USDA, Center forNutrition Polity and Promotion.
Bloom, H. 1984. “Accounting for No-Shows inExperimental Evaluation Designs,” Evaluation Review8(2):225-46.
Briefel, R., et al. 1999. Universal-free SchoolBreakfast Program Evaluation Design Project: Reviewof Literature on Breakfast and Learning. USDA, Foodand Nutrition Service.
Burghardt, J., A. Gordon, N. Chapman, et al. 1993.The School Nutrition Dietary Assessment Study:School Food Service, Meals Offered, and DietaryIntakes. USDA, Food and Nutrition Service.
Cook, J.T., O. Punam, and G.L. Kelly 1996.Evaluation of a Universally-Free School BreakfastProgram Demonstration Project: Central Falls, RhodeIsland. Medford, MA: Tufts University, Center onHunger, Poverty, and Nutrition Policy.
Devaney, B., and T. Fraker. 1989. “The DietaryImpacts of the School Breakfast Program,” AmericanJournal of Agricultural Economics 71(4):932-48.
Devaney, B., and E. Stuart. 1998. “Eating Breakfast:Effects of the School Breakfast Program,” FamilyEconomics and Nutrition Review 1998:60-62.
Emmons, L., M. Hayes, and D.L. Call. 1972. “A Studyof School Feeding Programs. I. Economic Elgibilityand Nutritional Need. II. Effects on Children withDifferent Economic and Nutritional Needs,” Journal ofthe American Dietetic Association 61(9):262-75.
Food Research and Action Center. 2003. SchoolBreakfast Scorecard: 2002. Washington, DC.
Fox, M.K., M.K. Crepinsek, P. Connor, et al. 2001.The Second School Nutrition Dietary Assessment Study(SNDA-II): Final Report. USDA, Food and NutritionService.
Glantz, F., R. Berg, D. Porcari, et al. 1994. SchoolLunch and Breakfast Nonparticipants Study. USDA,Food and Nutrition Service.
Gleason, P., and C. Suitor. 2001. Children’s Diets inthe Mid-1990’s: Dietary Intake and Its Relationshipwith School Meal Participation. USDA, Food andNutrition Service.
Gordon, A.R., B.L. Devaney, and J.A. Burghardt. 1995.“Dietary Effects of the National School Lunch Programand the School Breakfast Program,” American Journalof Clinical Nutrition 61(1, Supplement):221S-31S.
Guthrie, J. 2003. Food Assistance Research Brief—Do Healthy School Meals Cost More? FANRR-34-6.USDA, Economic Research Service.
Hoagland, G.W. 1980. Feeding Children: FederalChild Nutrition Policies in the 1980s. Washington,DC: U.S. Government Printing Office.
Hunt, I.F., H.M. Lieberman, A.H. Coulson, et al. 1979.“Effect of a Breakfast Program on the Nutrient Intakeof Black Children,” Ecology of Food and Nutrition8(1):21-28.
Jacobson, J. et al. 2001. Designs for Measuring Howthe School Breakfast Program Affects Learning.E-FAN-01-013. USDA, Economic Research Service.
McLaughlin, J., L. Bernstein, M.K. Crepinsek, et al.2002. Evaluation of the School Breakfast ProgramPilot Project: Findings from the First Year ofImplementation. USDA, Food and Nutrition Service.
Meyers, A.F., A.E. Sampson, M. Weitzman, et al.1989. “School Breakfast Program and SchoolPerformance,” American Journal of Disabled Children143:1234-39.
Murphy, J.M., M. Pagano, and S.J. Bishop. 2001a.Impact of a Universally-Free, In-Classroom SchoolBreakfast Program on Performance: Results from theAbell Foundation’s Baltimore Breakfast ChallengeEvaluation. Boston, MA: Massachusetts GeneralHospital.
Murphy, J.M., and M. Pagano. 2001b. Effects of aUniversally Free, In-Classroom School BreakfastProgram: Final Report from the Third Year of theMaryland Meals for Achievement Evaluation. Boston,MA: Massachusetts General Hospital.
Economic Research Service/USDA Effects of Food Assistance and Nutrition Programs on Nutrition and Health / FANRR-19-4 E 141
Murphy, J.M., M. Pagano, K. Patton, et al. 2000.Boston Public Schools Universal Breakfast Program:Final Evaluation Report. Boston, MA: MassachusettsGeneral Hospital.
Murphy, J.M., M.E. Pagano, J. Nachmani, et al. 1998.“The Relationship of School Breakfast to Psychosocialand Academic Functioning: Cross-sectional andLongitudinal Observations in an Inner-city SchoolSample,” Archives of Pediatrics and AdolescentMedicine 152(9):899-907.
Nicklas, T.A., B. Weihang, and G. Berenson. 1993a.“Nutrient Contribution of the Breakfast MealClassified by Source in 10-year-old Children: Homeversus School,” School Food Service Research Review17(2):125-32.
Nicklas, T.A., B. Weihang, L. Webber, et al. 1993b.“Breakfast Consumption Affects Adequacy of TotalDaily Intake in Children,” Journal of the AmericanDietetic Association 93(8):886-91.
Peterson, K., M. Davison, K. Wahlstrom, et al. 2003.Fast Break to Learning School Breakfast Program: AReport of the Second Year Results, 2001-2002.Minneapolis, MN: University of Minnesota.
Ponza, M., R. Briefel, W. Corson, et al. 1999.Universal-free School Breakfast Program EvaluationDesign Report: Final Evaluation Design. USDA, Foodand Nutrition Service.
Price, D.W., D.A. West, G.E. Scheier, et al. 1978.“Food Delivery Programs and Other Factors AffectingNutrient Intake of Children,” American Journal ofAgricultural Economics 60(4):609-18.
Project Bread. 2000. The Massachusetts Child HungerInitiative: An Action Plan To End Child Hunger inMassachusetts. Boston, MA.
Reddan, J., K. Wahlstrom, and M. Reicks. 2002.“Children’s Perceived Benefits and Barriers inRelation to Eating Breakfast in Schools With orWithout Universal School Breakfast,” Journal ofNutrition Education and Behavior 34(1):47-52.
Rosales, W., and J. Janowski. 2002. The State ofBreakfast in Wisconsin. Milwaukee, WI: Hunger TaskForce of Milwaukee.
Rossi, P.H. 1998. Feeding the Poor: Assessing FederalFood Aid. Washington, D.C.: The AEI Press.
U.S. Department of Agriculture, Food and NutritionService. 2003a. Program data. Available: http://www.fns.usda.gov/pd. Accessed April 2003.
U.S. Department of Agriculture, Food and NutritionService. 2003c. “School Breakfast Program: Fact Sheet.”Available: http://www.fns.usda.gov/cnd/breakfast/aboutBFast/bfastfacts.htm. Accessed August 2003.
U.S. Department of Agriculture, Food and NutritionService. 2003c. “Program Fact Sheet: National SchoolLunch Program.” Available: http://www.fns.usda.gov/cnd/Lunch/default.htm. Accessed June 2003.
U.S. Department of Agriculture, Food and NutritionService. 2003d. “Provision 1, 2, & 3 Fact Sheet.”Available: http://www.fns.usda.gov/cnd/governance/prov-1-2-3/prov1_2_3Factsheet.htm. Accessed August2003.
U.S. Department of Agriculture, Food and NutritionService. 2000. “Food and Nutrition Service (FNS)Strategic Plan 2000 to 2005.” Available: http://www.fns.usda.gov/oane/MENU/gpra/FNSStrategicplan.htm.Accessed April 2002.
Wellisch, J.B., S.D. Hanes, L.A. Jordon, et al. 1983.The National Evaluation of School NutritionPrograms: Final Report. Volumes 1 and 2. SantaMonica, CA: Systems Development Corporation.


Economic Research Service/USDA Effects of Food Assistance and Nutrition Programs on Nutrition and Health / FANRR-19-4 E 143
Child and Adult Care Food Program
144 E Effects of Food Assistance and Nutrition Programs on Nutrition and Health / FANRR-19-4 Economic Research Service/USDA
American Dietetic Association. 1999. “Position of theAmerican Dietetic Association: Nutrition Standards forChild Care Programs,” Journal of the AmericanDietetic Association 99(8):981-88.
American Dietetic Association. 1994. “Position of theAmerican Dietetic Association: Nutrition Standards forChild Care Programs,” Journal of the AmericanDietetic Association 94:323-28.
Briley, M.E., A.C. Buller, C.R. Roberts-Gray, et al. 1989.“What Is on the Menu at the Child Care Center?”Journal of the American Dietetic Association89(6):771-74.
Briley, M.E., C.R. Roberts-Gray, S.T. Jastrow, and J.Vickers. 1999. “Dietary Intake at The Child-CareCenter and Away: Are Parents and Care ProvidersWorking as Partners or at Cross-Purposes?” Journal of the American Dietetic Association 99:950-54.
Briley, M.E., C.R. Roberts-Gray, and S. Rowe. 1993.“What Can Children Learn from the Menu at the ChildCare Center?” Journal of Community Health18(6):363-73.
Burghardt, J., A. Gordon, N. Chapman, et al. 1993.The School Nutrition Dietary Assessment Study:School Food Service, Meals Offered, and DietaryIntakes. USDA, Food and Nutrition Service.
Crepinsek, M.K, and N. Burstein. 2004. MaternalEmployment and Children’s Nutrition: Volumes I andII. E-FAN-04-006. USDA, Economic Research Service.
Crepinsek, M.K., N.R. Burstein, E.B. Lee, et al. 2002.Meals Offered by Tier 2 CACFP Family Child CareProviders—Effects of Lower Meal Reimbursements: AReport to Congress on the Family Child Care HomesLegislative Changes Study. E-FAN-02-006. USDA,Economic Research Service.
Domer, J.A. 1983. “Nutrition in a Private Day CareCenter,” Journal of the American Dietetic Association82:290-93.
Drake, M.A. 1992. “Menu Evaluation, Nutrient Intakeof Young Children, and Nutrition Knowledge of MenuPlanners in Child Care Centers in Missouri,” Journalof Nutritional Education 24:145-48.
Drake, M.A. 1991. “Anthropometry, Biochemical IronIndexes, and Energy Nutrient Intake of PreschoolChildren: Comparison of Intake at Daycare Center andat Home,” Journal of the American DieteticAssociation 91:1587.
Fox, M.K, and M.J. Cutler. 1996. The Child NutritionHomeless Demonstration Project: Year 3 Report.Cambridge, MA: Abt Associates Inc.
Fox, M.K., F.B. Glantz, L. Geitz, et al. 1997. EarlyChildhood and Child Care Study: NutritionalAssessment of the CACFP. Volume II. Final Report.USDA, Food and Consumer Service.
Garnett, S. 2003. “Child and Adult Care Food Program(CACFP): Update on For-Profit Center Eligibility.”Available: http://www.fns.usda.gov/cnd/care/Regs&Policy/ForProfits/extension.htm. Accessed April 2003.
Glantz, F., D.T. Rodda, M.J. Cutler, et al. 1997. EarlyChildhood and Child Care Study: Profile ofParticipants in the CACFP. Volume I. Final Report.USDA, Food and Consumer Service.
Glantz, F., J.A. Layer, and M. Battaglia. 1988. Study ofthe Child Care Food Program. Cambridge, MA: AbtAssociates Inc.
Glantz, F., N. Goodrich, D. Wagner, et al. 1983.Evaluation of the Child Care Food Program: Resultsof the Child Impact Study Telephone Survey and PilotStudy. Cambridge, MA: Abt Associates Inc.
Glantz, F., and M.K. O’Neill-Fox. 1982. Evaluation ofthe Child Care Food Program: Final Report on theCongressionally Mandated Studies. Volume I.Cambridge, MA: Abt Associates Inc.
Hamilton, W., N. Burstein, and M.K. Crepinsek. 2001.Reimbursement Tiering in the CACFP: SummaryReport of the Family Child Care Homes LegislativeChanges Study. FANRR-22. USDA, EconomicResearch Service.
Macro International. 1991. Study of the Child NutritionHomeless Demonstration: Final Report - Year 1.USDA, Food and Nutrition Service.
Ponza, M., J. Burghardt, R. Cohen, et al. 1993.National Study of the Adult Component of the Child andAdult Care Food Program (CACFP). Final Report.Volumes I and II. USDA, Food and Nutrition Service.
Economic Research Service/USDA Effects of Food Assistance and Nutrition Programs on Nutrition and Health / FANRR-19-4 E 145
U.S. Department of Agriculture, Food and NutritionService. 2003. Program data. Available http://www.fns.usda.gov/pd. Accessed April 2003.
U.S. Department of Agriculture, Food and NutritionService. 2003a. “Facts about the Child and Adult CareFood Program.” Available: http://www.fns.usda.gov/cnd/care/CACFP/cacfpfaqs.htm. Accessed March 2003.
U.S. Department of Agriculture, Food and NutritionService. 2002b. “Child Nutrition Programs: AfterschoolSnacks Fact Sheet.” Available http://www.fns.usda.gov/cnd/governance/AfterschoolFactSheet.htm.Accessed March 2002.
U.S. Department of Agriculture, Food and NutritionService. 2002c. “Child and Adult Care Food Program:Facts About Reimbursement for Suppers Available toAfterschool Care Programs.” Available: http://www.fns.usda.gov/cnd/care/Regs&Policy/snacks/supper-faqs.htm. Accessed March 2002.
U.S. Department of Agriculture and U.S. Departmentof Health and Human Services. 2000. Nutrition andYour Health: Dietary Guidelines for Americans, 5thedition. Home and Garden Bulletin No. 232.
U.S. Department of Agriculture and U.S. Departmentof Health and Human Services. 1995. Nutrition andYour Health: Dietary Guidelines for Americans, 4thedition. Home and Garden Bulletin No. 232.

Economic Research Service/USDA Effects of Food Assistance and Nutrition Programs on Nutrition and Health / FANRR-19-4 E 147
Summer Food Service Program
148 E Effects of Food Assistance and Nutrition Programs on Nutrition and Health / FANRR-19-4 Economic Research Service/USDA
Bost, E.M. 2000. “Hunger Doesn’t Take a Vacation.”Message from Under Secretary of Agriculture, Eric M.Bost, posted on Summer Food Service Program web-site. Available: http://www.fns.usda.gov/snd/summer/states/message.html. Accessed March 2002.
Decker, P.T., E.E. Kisker, J. Patch, et al. 1990. AnEvaluation of the Summer Food Service Demonstration.Final Report. Princeton, NJ: Mathematica PolicyResearch, Inc.
Food Research and Action Center. 2003. HungerDoesn’t Take a Vacation: Summer Nutrition StatusReport, June 2003. Washington, DC.
Food Research and Action Center. 2001. New PilotMakes Summer Food Participation Easier in 13 Statesand Puerto Rico. Available: http://www.frac.org/html/news/sfsp_pilots.html. Accessed March 2002.
Food Research and Action Center. 1995. HungerDoesn’t Take a Vacation: A Status Report on theSummer Food Service Program for Children, Thirdedition. Washington, DC.
Food Research and Action Center. 1993. NewOpportunities: A Status Report on the Summer FoodService Program for Children. Washington, DC.
Fox, M.K., M.K. Crepinsek, P. Connor, et al. 2001.School Nutrition Dietary Assessment Study II (SNDA-II): Summary of Findings. USDA, Food and Nutrition Service.
Garnett, S.C. 2001. Implementation of the SummerFood Service Program (SFSP) Pilot ProjectsAuthorized by the Consolidated Appropriations Act,2001. Technical memorandum issued to FNS regionsand State agencies, January 19, 2001.
Gordon, A., and R. Briefel. 2003. Feeding Low-IncomeChildren When School is Out—The Summer FoodService Program: Executive Summary. FANRR-30.USDA, Economic Research Service.
Ohls, J., E. Cavin, E. Kisker, et al. 1988. AnEvaluation of the Summer Food Service Program:Final Report. FANRR-30. USDA, Food and NutritionService.
Reger, C.C., E. O’Neil, T.A. Nicklas, et al. 1996.“Plate Waste of School Lunches Served to Children ina Low-Socioeconomic Elementary School in SouthLouisiana,” School Food Service Research Review20(supplement):13-19.
Robinson, R.A. 1998. Effects of changes made to theSummer Food Service Program. Testimony before theSubcommittee on Early Childhood, Youth andFamilies, Committee on Education and the Workforce,U.S. House of Representatives. Washington, DC: U.S.General Accounting Office.
Shotland, J., and D. Loonin. 1988. Patterns of Risk:The Nutritional Status of the Rural Poor. Washington,DC: Public Voice for Food and Health Policy.
Singh, A., and J. Endahl. 2004. Evaluation of the 14State Summer Food Service Program Pilot Project.USDA, Food and Nutrition Service.
Tasse, T., and J. Ohls. 2003. Reaching More HungryChildren: The Seamless Summer Food Waiver. Trendsin Nutrition Policy. Issue Brief No. 1. Princeton, NJ:Mathematica Policy Research.
U.S. Department of Agriculture, Food and NutritionService. 2003. Program data. Available: http://www.fns.usda.gov/pd. Accessed April 2003.
U.S. Department of Agriculture, Food and NutritionService. 2002a. “Summer Food Service Program:Frequently Asked Questions.” Available: http://www.fns.usda.gov/cnd/summer/about/faq.html). AccessedMarch 2002.
U.S. Department of Agriculture, Food and NutritionService. 2002b. “Summer Food Service Program:Sponsors.” Available: http://www.fns.usda.gov/cnd/summer/sponsors/index.html). Accessed March 2002.
U.S. Department of Agriculture, Food and NutritionService. 2002c. “USDA News Release: USDA PlansTo Continue Improving Children’s Access to theSummer Food Service Program.” Available:http://www.fns.usda.gov/news/releases/2002/03/0082.htm. Accessed March 2002.
Wehler, C.A., R.I. Scott, and J.J. Anderson. 1991. ASurvey of Childhood Hunger in the United States.Community Childhood Hunger Identification Project.Washington, DC: Food Research and Action Center.
Economic Research Service/USDA Effects of Food Assistance and Nutrition Programs on Nutrition and Health / FANRR-19-4 E 149
The Emergency Food Assistance Program
150 E Effects of Food Assistance and Nutrition Programs on Nutrition and Health / FANRR-19-4 Economic Research Service/USDA
Bickel, G., M. Nord, C. Price, et al. 2000. Guide toMeasuring Household Food Security: Revised 2000.USDA, Food and Nutrition Service.
Bowering, J., K.L. Clancy, and J. Poppendieck. 1991.“Characteristics of a Random Sample of EmergencyFood Program Users in New York: II. Soup Kitchens,”American Journal of Public Health 81(7):914-17.
Briefel, R., J. Jacobson, N. Clusen, et al. 2003. TheEmergency Food Assistance System—Findings Fromthe Client Survey: Executive Summary. FANRR-32.USDA, Economic Research Service.
Burt, M.A., and B.E. Cohen. 1988. Feeding theHomeless: Does the Prepared Meals Provision Help?A Report to Congress on the Prepared Meal Provision,Volumes I and II. Washington, DC: The UrbanInstitute.
Clancy, K.L., J. Bowering, and J. Poppendieck. 1991.“Characteristics of a Random Sample of EmergencyFood Program Users in New York: I. Food Pantries,”American Journal of Public Health 81(7):911-14.
Levedahl, J.W., N. Ballenger, and C. Harold. 1994.Comparing the Emergency Food Assistance Programand the Food Stamp Program: RecipientCharacteristics, Market Effects, and Benefit/CostRatios. AER-689. USDA, Economic Research Service.
Nord, M., M. Andrews, and S. Carlson. 2002.Household Food Security in the United States, 2001.FANRR-29. USDA, Economic Research Service.
Ohls, J., and F. Saleem-Ismail. 2002. The EmergencyFood Assistance System—Findings From the ProviderSurvey, Volume I: Executive Summary. FANRR-16-1.USDA, Economic Research Service.
Ponza, M. 1990. “The Effectiveness of USDA FoodAssistance Programs in Meeting the Food and NutritionNeeds of the Low-Income Elderly,” Food Stamp PolicyIssues: Results from Recent Research. Paper presented atthe Food and Nutrition Service Research Conference inWashington, DC, February 22, 1990.
Ponza, M., and L. Wray. 1990. Evaluation of the FoodAssistance Needs of the Low-Income Elderly and TheirParticipation in USDA Programs. USDA, Food andNutrition Service.
Quality Planning Corporation and Abel, Daft, andEarley. 1987. A Study of the Temporary EmergencyFood Assistance Program (TEFAP). USDA, Food andNutrition Service.
U.S. Department of Agriculture, Food and NutritionService. 2003a. “Food Distribution Fact Sheet: TheEmergency Food Assistance Program.” Available:http://www.fns.usda.gov/fdd/programs/tefap/pfs-tefap.pdf. Accessed April 2003.
U.S. Department of Agriculture, Food and NutritionService. 2003b. Program data. Available: http://www.fns.usda.gov/pd. Accessed April 2003.
Economic Research Service/USDA Effects of Food Assistance and Nutrition Programs on Nutrition and Health / FANRR-19-4 E 151
Nutrition Services Incentive Program(formerly the Nutrition Program for the Elderly
Note: This research actually focused on the Elderly Nutrition Program (ENP), which issponsored by the U.S. Department of Health and Human Services. USDA’s NutritionProgram for the Elderly (NPE), now known as the Nutrition Services IncentiveProgram, provided supplemental commodities to ENP delivery sites, based on a permeal reimbursement rate.
152 E Effects of Food Assistance and Nutrition Programs on Nutrition and Health / FANRR-19-4 Economic Research Service/USDA
Balsam, A.L., A.F. Sullivan, B.E. Millen, and B.L.Rogers. 2000. “Service Innovations in the ElderlyNutrition Program: Two Decades of Accomplishments,”Journal of Nutrition for the Elderly 19(4):41-48.
Balsam, A.L., and B.L. Rogers. 1991. “Serving Eldersin Greatest Social and Economic Need: The Challengeto the Elderly Nutrition Program,” Journal of Agingand Social Policy 3(2):41-55.
Caliendo, M.A. 1980. “Factors Influencing the DietaryStatus of Participants in the National NutritionProgram for the Elderly. 1. Population Characteristicsand Nutritional Intakes,” Journal of Nutrition for theElderly 1(1):23-39.
Caliendo, M.A., and M. Batcher. 1980. “FactorsInfluencing the Dietary Status of Participants in theNational Nutrition Program for the Elderly. 2.Relationships Between Dietary Quality, ProgramParticipation, and Selected Variables,” Journal ofNutrition for the Elderly 1(1):41-53.
Caliendo, M.A., and J. Smith. 1981. “PreliminaryObservations on the Dietary Status of Participants inthe Title III-C Meal Program,” Journal of Nutrition forthe Elderly 1(3-4):21-39.
Cohen, B.E., M.R. Burt, and M.M. Schulte. 1993.Hunger and Food Insecurity Among the Elderly.Washington, DC: Urban Institute.
Czajka-Narins, D.M., M.B. Kohrs, J. Tsui, et al. 1987.“Nutritional and Biochemical Effects of NutritionPrograms in the Elderly,” Clinics in GeriatricMedicine 3(2):275-87.
Dwyer, J.T., and J. Mayer. 1997. Update on Risks ofMalnutrition in Older Americans: Perspectives fromNew Studies. Bethesda, MD: National AgingInformation Center.
Edwards, D.L., E.A. Frongillo, Jr., B. Rauschenbach,et al. 1993. “Home-delivered Meals Benefit theDiabetic Elderly,” Journal of the American DieteticAssociation 93(5):585-87.
Food Research and Action Center. 1987. A NationalSurvey of Nutritional Risk among the Elderly.Washington, DC: Food Research and Action Center.
Gilbride, J.A., E.J. Amella, E.B. Breines, et al. 1998.“Nutrition and Health Status Assessment ofCommunity-residing Elderly in New York City: a PilotStudy,” Journal of the American Dietetic Association98(5):554-58.
Grandjean, A.C., L.L. Korth, G.C. Kara, et al. 1981.“Nutritional Status of Elderly Participants in aCongregate Meals Program,” Journal of the AmericanDietetic Association 78:324-29.
Ho-Sang, G.M. 1989. Evaluation of the SupplementalNutrition Assistance Program for the Frail Elderly inNew York State. Unpublished doctoral dissertationfrom Cornell University.
Kim, K.K., E.S. Yu, W.T. Liu, et al. 1993. “NutritionalStatus of Chinese-, Korean-, and Japanese-AmericanElderly,” Journal of the American Dietetic Association93(12):1416-22.
Kirschner Associates, Inc. and Opinion ResearchCorporation. 1983. An Evaluation of the NutritionServices for the Elderly, Volume 2: Analytic Report.Washington, DC: U.S. Department of Health andHuman Services, Administration on Aging.
Kirschner Associates, Inc. and Opinion ResearchCorporation. 1979. Longitudinal Evaluation of theNational Nutrition Program for the Elderly: Report ofFirst-Wave Findings. Washington, DC: U.S.Department of Health, Education, and Welfare,Administration on Aging.
Kohrs, M.B. 1986. “Effectiveness of NutritionIntervention Programs for the Elderly,” in M. L.Hutchinson and H.N. Munro (eds.), Nutrition andAging. New York, NY: Academic Press.
Kohrs, M.B. 1982. “Evaluation of Nutrition Programsfor the Elderly,” American Journal of ClinicalNutrition 36(4):812-18.
Kohrs, M.B., J. Nordstrom, E.L. Plowman, et al. 1980.“Association of Participation in a Nutritional Programfor the Elderly with Nutritional Status,” AmericanJournal of Clinical Nutrition 33(12):2643-56.
Kohrs, M.B., P. O’Hanlon, and D. Eklund. 1978. “TitleVII - Nutrition Program for the Elderly. I. Contributionto One Day’s Dietary Intake,” Journal of the AmericanDietetic Association 72(5):487-92.
Economic Research Service/USDA Effects of Food Assistance and Nutrition Programs on Nutrition and Health / FANRR-19-4 E 153
LeClerc, H.L., and M.E. Thornbury. 1983. “DietaryIntakes of Title III Meal Program Recipients andNonrecipients,” Journal of the American DieteticAssociation 83(5):573-77.
National Research Council. 1989. RecommendedDietary Allowances, 10th edition. Washington, DC:National Academy Press.
Neyman, M.R., S. Zidenberg-Cherr, and R.B.McDonald. 1996. “Effect of Participation inCongregate-site Meal Programs on Nutritional Statusof the Healthy Elderly,” Journal of the AmericanDietetic Association 96(5):475-83.
Nordstrom, J.W., O.G. Abrahams, and M.B. Kohrs.1982. “Anemia among Noninstitutionalized WhiteElderly,” Nutrition Reports International 25(1):97-105.
O’Shaughnessy, C. 1990. CRS Report for Congress:Older Americans Act Nutrition Program. Library ofCongress.
Ponza, M., J.C. Ohls, B.E. Millen, et al. 1996. ServingElders at Risk: The Older Americans Act NutritionPrograms, National Evaluation of the ElderlyNutrition Program, 1993-1995, Volumes I, II, and III.U.S. Department of Health and Human Services,Administration on Aging.
Ponza, M., J.C. Ohls, and B.M. Posner. 1994. ElderlyNutrition Program Evaluation Literature Review.Princeton, NJ: Mathematica Policy Research, Inc.
Posner, B.M. 1979. Nutrition and the Elderly: PolicyDevelopment, Program Planning, and Evaluation.Chapter 8: Summary of Conclusions, InterventionDesign Implications, and Future Research Needs.Lexington, MA: Lexington Books, pp. 147-175.
Posner, B.M., A.M. Jette, K.W. Smith, et al. 1993.“Nutrition and Health Risks in the Elderly: TheNutrition Screening Initiative,” American Journal ofPublic Health 83(7):972-78.
Roe, D.A. 1989. “Nutritional Surveillance of theElderly: Methods to Determine Program Impact andUnmet Need,” Nutrition Today 24(5):24-29.
Russell, R.M., and P.M. Suter. 1993. “VitaminRequirements of Elderly People: an Update,”American Journal of Clinical Nutrition 58:4-14.
Singleton, N., M.H. Overstreet, and P.E. Schilling.1980. “Dietary Intakes and Characteristics of TwoGroups of Elderly Females,” Journal of Nutrition forthe Elderly 1(1):77-89.
Steele, M.F., and J.D. Bryan. 1986. “Dietary Intake ofHomebound Elderly Recipients and Nonrecipients ofHome-delivered Meals,” Journal of Nutrition for theElderly 5(2):23-34.
Stevens, D.A., L.E. Grivetti, and R.B. McDonald.1992. “Nutrient Intake of Urban and Rural ElderlyReceiving Home-delivered Meals,” Journal of theAmerican Dietetic Association 92:714-718.
U.S. Department of Agriculture, Food and NutritionService. 2003. Program data. Available: http://www.fns.usda.gov/pd. Accessed April 2003.
U.S. Department of Agriculture, Food and NutritionService. 2002. “Nutrition Services Incentive Program(Formerly NPE).” Available: http://www.fns.usda.gov/fdd/programs/nsip. Accessed March 2002.
U.S. Department of Health and Human Services,Administration on Aging. 2002. Linking Nutrition andHealth: 30 Years of the Older Americans Act NutritionPrograms—Program Milestones: 1954-2002.
Vaughan, L.A., and M.M. Manore. 1988. “DietaryPatterns and Nutritional Status of Low Income, Free-living Elderly,” Food Nutrition News 60(5):27-30.
Wellman, N., L.Y. Rosenzwieg, and J.L. Lloyd. 2002.“Thirty Years of the Older Americans NutritionProgram,” Journal of the American DieteticAssociation 102(3):348-50.

Economic Research Service/USDA Effects of Food Assistance and Nutrition Programs on Nutrition and Health / FANRR-19-4 E 155
Nutrition Assistance Program in Puerto Rico,American Samoa, and the Northern Marianas
156 E Effects of Food Assistance and Nutrition Programs on Nutrition and Health / FANRR-19-4 Economic Research Service/USDA
Andrews, M., and Pinchuk, R. 1984. The Puerto RicanNutrition Assistance Program: A Case Study in theDynamics of Food and Agricultural Policymaking.Publication No. F-02216-1-85. New Brunswick, NJ:New Jersey Agricultural Experiment Station.
Beebout, H., E. Cavin, B. Devaney, et al. 1985.Evaluation of the Nutrition Assistance Program inPuerto Rico: Volume II, Effects on Food Expendituresand Diet Quality. Washington, DC: MathematicaPolicy Research, Inc.
Bishop J.A., J.P. Formby, and L.A. Zeager. 1996.“Relative Undernutrition in Puerto Rico underAssistance Programmes,” Applied Economics28(8):1009-17.
Burstein, N., C. Price, P.H. Rossi, et al. 2004. “Chapter 3, The Food Stamp Program,” in M.K. Fox,W.L. Hamilton, and B.-H. Lin (eds.), Effects of FoodAssistance and Nutrition Programs on Nutrition andHealth: Volume 3, Literature Review. FANRR-19-3.USDA, Economic Research Service.
Hama, M.Y. 1993. Food and Nutrient ConsumptionPatterns of Households in Puerto Rico (NutrientQuality). Unpublished doctoral dissertation, Universityof Maryland.
Moffitt, R. 1989. “Estimating the Value of an In-KindTransfer: The Case of Food Stamps,” Econometrica57 (2):385-409.
Ohls, J.C., T.M. Fraker, A.P. Martini, et al. 1992.Effects of Cash-out on Food Use by Food StampProgram Participants in San Diego. USDA, Food andNutrition Service.
U.S. Department of Agriculture, Food and NutritionService. 2003. Program data. Available: http://www.fns.usda.gov/pd. Accessed April 2003.
U.S. Department of Agriculture, Food and NutritionService. 1983. Evaluation of the Puerto Rico NutritionAssistance Program. USDA, Food and NutritionService.
U.S. General Accounting Office. 1992. FoodAssistance: Nutritional Conditions and ProgramAlternatives in Puerto Rico. Report to CongressionalCommittees No. GAO/RCED-92-114.
U.S. General Accounting Office. 1978. ProblemsPersist in the Puerto Rico Food Stamp Program, theNation’s Largest. Report by the Comptroller Generalof the United States No. CED-78-84.
Economic Research Service/USDA Effects of Food Assistance and Nutrition Programs on Nutrition and Health / FANRR-19-4 E 157
Commodity Supplemental Food Program
158 E Effects of Food Assistance and Nutrition Programs on Nutrition and Health / FANRR-19-4 Economic Research Service/USDA
Koughan, N., and C. Atkinson. 1993. “NutritionScreening Initiative and the Louisiana Food forSeniors Experience,” Journal of the Louisiana StateMedical Society 145(10):447-49.
Mahony Monrad, D., S.H. Pelavin, R.F. Baker, et al.1982. Evaluation of the Commodity SupplementalFood Program: Final Report—Health and NutritionImpacts of Three Local Projects. USDA, Food andNutrition Service.
Posner, B.M., A.M. Jette, K.W. Smith, et al. 1993.“Nutrition and Health Risks in the Elderly: TheNutrition Screening Initiative,” American Journal ofPublic Health 83(7):972-78.
Schoenborn, C.A., P.F. Adams, and P.M. Barnes. 2002.Body Weight Status of Adults: United States, 1997-98.Advance Data From Vital and Health Statistics No.330. Centers for Disease Control and Prevention,National Center for Health Statistics, September 6,2002.
U.S. Department of Agriculture, Food and NutritionService. 2003a. “Food Distribution Fact Sheet:Commodity Supplemental Food Program.” Available:http://www.fns.usda.gov/fdd/programs/csfp/pfs-csfp.03.pdf. Accessed April 2003.
U.S. Department of Agriculture, Food and NutritionService. 2003b. Program data. Available: http://www.fns.usda.gov/pd. Accessed April 2003.
Economic Research Service/USDA Effects of Food Assistance and Nutrition Programs on Nutrition and Health / FANRR-19-4 E 159
Food Distribution Program onIndian Reservations
160 E Effects of Food Assistance and Nutrition Programs on Nutrition and Health / FANRR-19-4 Economic Research Service/USDA
Ballew, C., L.L. White, K.F. Strauss, et al. 1997.“Intake of Nutrients and Food Sources of NutrientsAmong the Navajo: Findings from the Navajo Health and Nutrition Survey,” Journal of Nutrition27(supplement):2085s-93s.
Basiotis, P., M. Lino, and R. Anand. 1999. “The DietQuality of American Indians: Evidence from theContinuing Survey of Food Intake by Individuals,”Nutrition Insights 12(March 1999).
Brown, A.C., and B. Brenton. 1994. “Dietary Surveyof Hopi Native American Elementary Students,”Journal of the American Dietetic Association94(5):517-22.
Burrows, N.R., L.S. Geiss, M.M. Engelgau, and K.J.Acton. 2000. “Prevalence of Diabetes Among NativeAmericans and Alaska Natives, 1990-1997: AnIncreasing Burden,” Diabetes Care 23(12):1786-90.
Calloway, D.H., and J.C. Gibbs. 1976. “Food Patternsand Food Assistance Programs in the Cocopah Com-munity,” Ecology of Food and Nutrition 5(4):183-96.
Campos-Outcalt, D., J. Ellis, M. Aickin, et al. 1995.“Prevalence of Cardiovascular Disease Risk Factors ina Southwestern Native American Tribe,” Public HealthReports 110:742-48.
Centers for Disease Control and Prevention. 1998.“Prevalence of Diagnosed Diabetes Among AmericanIndians/Alaskan Natives: United States, 1996,”Morbidity and Mortality Weekly Report 47:901-04.
Cole, S.M., N.I. Teufel-Shone, C.K. Ritenbaugh, et al.2001. “Dietary Intake and Food Patterns of ZuniAdolescents,” Journal of the American DieteticAssociation 101(7):802-06.
Davis, J., R. Hiwalker, C. Ward, et al. 2002. “Is theFood Stamp Program an Adequate Safety Net forAmerican Indian Reservations? The NorthernCheyenne Case,” in A. Vandeman (ed.), FoodAssistance and Nutrition Research Small GrantsProgram: Executive Summaries of 2000 ResearchGrants. FANRR-20. USDA, Economic ResearchService.
deGonzague, B., O. Receveur, D. Wedll, et al. 1999.“Dietary Intake and Body Mass Index of Adults inTwo Ojibwe Communities,” Journal of the AmericanDietetic Association 99(6):710-16.
Dillinger, T.L., S.C. Jett, M. J. Macri, and L.E. Grivetti.1999. “Feast or Famine: Supplemental Food Programsand Their Impacts on Two American IndianCommunities in California,” International Journal ofFood Science and Nutrition 50(3):173-87.
Gittelsohn, J., M.S. Wolever, S.B. Harris, et al. 1998.“Specific Patterns of Food Consumption andPreparation are Associated with Diabetes and Obesityin a Native American Community,” Journal ofNutrition 128:541-47.
Grant, R.C., M. Arcand, C. Plumage, and M.G White,Jr. 2000. “Federal Food Programs, Traditional Foods,and the Gros Ventre and Assiniboine Nations of theFort Belknap Indian Reservation,” in A. Vandeman(ed.), Food Assistance and Nutrition Research SmallGrants Program: Executive Summaries of 1998Research Grants. FANRR-10. USDA, EconomicResearch Service.
Harnack, L., M. Story, and B.H. Rock. 1999. “Diet andPhysical Activity Patterns of Lakota Indian Adults.”Journal of the American Dietetic Association99(7):829-35.
Jackson, Y. 1993. “Height, Weight, and Body MassIndex of American Indian Schoolchildren,” Journal ofthe American Dietetic Association 93(10):1136-40.
Lopez, D., T. Reader, and P. Buseck. 2002. CommunityAttitudes Toward Traditional Tohono O’odham Foods.Sells, AZ: Tohono O’odham Community Action andTohono O’odham Community College.
McMurry, M.P., M.T. Cerqueira, S.L. Connor, andW.E. Connor. 1991. “Changes in Lipid andLipoprotein Levels and Body Weight in TarahumaraIndians after Consumption of an Affluent Diet,” NewEngland Journal of Medicine 325:1704-08.
Murphy, N.J., C.D. Schraer, M.C. Thiele, et al. 1995.“Dietary Change and Obesity Associated with GlucoseIntolerance in Alaska Natives,” Journal of theAmerican Dietetic Association 95:676-82.
Economic Research Service/USDA Effects of Food Assistance and Nutrition Programs on Nutrition and Health / FANRR-19-4 E 161
Popkin, B.M. 1994. “The Nutrition Transition in Low-income Countries: An Emerging Crisis,” NutritionReview 52:285-98.
Smith, C.J., R.G. Nelson, S.A. Hardy et al. 1996.“Survey of the Diet of Pima Indians UsingQuantitative Food Frequency Assessment and 24-hourRecall: The Diabetic Renal Study.” Journal of theAmerican Dietetic Association 96:778-84.
Smith, C.J., E.M. Manahan, and S.G. Pablo. 1993.“Food Habit and Cultural Changes Among the PimaIndians.” In Joe, J.R. and R.S. Young (Eds.) Diabetesas a Disease of Civilization. Berlin, New York:Mouton de Gruyter.
Story, M., D. Neumark-Sztainer, M.D. Resnick, et al.1998a. “Psychosocial Factors and Health BehaviorsAssociated with Inadequate Fruit and Vegetable Intakeamong American-Indian and Alaska-NativeAdolescents.” Journal of Nutrition Education30(2):100-06.
Story, M., K.F. Strauss, E. Zephier, et al. 1998b.“Nutritional Concerns in American Indians and AlaskaNatives: Transitions and Future Directions,” Journal ofthe American Dietetic Association 98(2):170-76.
Swinburn, B.A., V. L. Boyce, R.N. Bergman, et al.1991. “Deterioration in Carbohydrate Metabolism andLipoprotein Changes Induced by Modern, High-fatDiet in Pima Indians and Caucasians,” Journal ofClinical Endocrinology and Metabolism 73:156-65.
Teufel, N. I. and D. Dufour. 1990. “Patterns of FoodUse and Nutrient Intake of Obese and Non-obeseHaulapai Indian Women of Arizona,” Journal of theAmerican Dietetic Association 90(9):1229-35.
U.S. Department of Agriculture, Food and NutritionService. 2003a. Footnote on table “Costs of FoodDistribution Programs,” Available: http://www.fns.usda.gov/pd/fd$sum.htm. Accessed April 2003.
U.S. Department of Agriculture, Food and NutritionService. 2003b. “Food Distribution Programs: FAQsAbout FDPIR.” Available: http://www.fns.usda.gov/fdd/programs/fdpir/fdpir-faqs.htm. Accessed June 2003.
U.S. Department of Agriculture, Food and NutritionService. 2003c. Program data. Available: http://www.fns.usda.gov/pd. Accessed April 2003.
U.S. Department of Agriculture, Food and NutritionService. 2002. “Nutrition Program Facts: The FoodDistribution Program on Indian Reservations.”Available: http://www.fns.usda.gov/fdd/programs/fdpir/pdpirfaq.htm. Accessed March 2002.
U.S. Department of Agriculture, Food and NutritionService. 1995. Improving USDA Commodities: 1995Tri-Agency Commodity Specification Review Report.USDA, Food and Nutrition Service.
U.S. General Accounting Office. 1990. FoodAssistance Programs: Recipient and Expert Views onFood Assistance at Four Indian Reservations: Reportto Congressional Requesters.
U.S. Senate Committee on Indian Affairs and SenateCommittee on Nutrition and Forestry. 1993. Barriersto Participation in the Food Stamp Program andOther Programs of the Department of Agriculture byPeople Residing on Indian Lands: Joint HearingBefore the Committee on Indian Affairs, United StatesSenate, and the Committee on Agriculture, UnitedStates One Hundred Third Congress, First Session.
Usher, C.L. D.S. Shanklin, and J.B. Wildfire. 1990.Evaluation of the Food Distribution Program onIndian Reservations (FDPIR). Volume I. Final Report.USDA, Food and Nutrition Service.
Van Duzen, J., J.P. Carter, and R. Vander Zwagg.1976. “Protein and Calorie Malnutrition amongPreschool Navajo Indian Children, a Follow-up.”American Journal of Clinical Nutrition 29(6):657-62.
Vaughan, L.A., D.C. Benyshek, and J.F. Martin. 1997.“Food Acquisition Habits, Nutrient Intakes, andAnthropometric Data of Havasupai Adults,” Journal ofthe American Dietetic Association 97(11):1275-82.
Williams, D.E., W.C. Knowler, C.J. Smith, et al. 2001.“The Effect of Indian or Anglo Dietary Preference onthe Incidence of Diabetes in Pima Indians,” DiabetesCare 24(5):811-16.
Wolfe, W.S., and D. Sanjur. 1988. “Contemporary Dietand Body Weight of Navajo Women Receiving FoodAssistance: An Ethnographic and NutritionalInvestigation,” Journal of the American DieteticAssociation 88:822-27.


Economic Research Service/USDA Effects of Food Assistance and Nutrition Programs on Nutrition and Health / FANRR-19-4 E 163
WIC Farmers’ Market Nutrition Program
164 E Effects of Food Assistance and Nutrition Programs on Nutrition and Health / FANRR-19-4 Economic Research Service/USDA
Anliker, J.A., M. Winne, and L.T. Drake. 1992.“Evaluation of the Connecticut Farmers’ MarketCoupon Program,” Journal of Nutrition Education24(4):185-91.
Galfond, G., J. Thompson, and K. Wise. 1991. Evalua-tion of the Farmers Market Coupon DemonstrationProject. USDA, Food and Nutrition Service.
House Committee on Agriculture. 1992. Impact of theFarmers’ Market Nutrition Act of 1991 on Marketsand the Marketing of Fresh Fruits and Vegetables:Testimony Before the Subcommittee on DomesticMarketing, Consumer and Nutrition. One HundredSecond Congress, Second Session. Subcommittee onDomestic Marketing, Consumer and Nutrition.
Just, R.E., and Q. Weninger. 1997. “EconomicEvaluation of the Farmer’ Market Nutrition Program,”American Journal of Agricultural Economics79(3):902-17.
National Association of Farmers’ Market NutritionPrograms. 1996. Program Impact Report for the 1995 WIC Farmer’ Market Nutrition Program.Washington, DC.
Nutrition Week. 1995. “Farmers’ Market ProgramFulfilling its Dual Mission, National SurveyIndicates,” 25(16):1-2.
Nutrition Week. 1991. “Experiments Link Farmers toFood Program Clients.” 21(22):4-5.
U.S. Department of Agriculture, Food and NutritionService. 2003l. “FNS Announces FY 2003 SeniorFarmers’ Market Nutrition Program (SFMNP).”Available: http://www.fns.usda.gov/WIC/SeniorFMNP/SFMNPFY03.htm. Accessed April 2003.
U.S. Department of Agriculture, Food and NutritionService. 2003b. “WIC Farmers’ Market NutritionProgram.” Available: http://www.fns.usda.gov/WIC/FMNP/FMNPfaqs.htm. Accessed April 2003.
Economic Research Service/USDA Effects of Food Assistance and Nutrition Programs on Nutrition and Health / FANRR-19-4 E 165
Special Milk Program
166 E Effects of Food Assistance and Nutrition Programs on Nutrition and Health / FANRR-19-4 Economic Research Service/USDA
Paige, D.M., and G.G. Graham. 1974. “School MilkPrograms and Negro Children: a NutritionalDilemma,” Journal of School Health 44(1):8-10.
Robinson, J.S. 1975. Special Milk Program Evaluationand National School Lunch Program Survey. USDA,Food and Nutrition Service.
U.S. Department of Agriculture, Farm Service Agency.2003. “Fact Sheet: November 1999. Commodity CreditCorporation.” Available: http://www.fsa.usda.gov/pas/publications/facts/htm/ccc99.htm. Accessed April 2003.
U.S. Department of Agriculture, Food and NutritionService. 2003. Program data. Available: http://www.fns.usda.gov/pd. Accessed April 2003.
U.S. Department of Agriculture, Food and NutritionService. 2002. “Special Milk Program: Fact Sheet.”Available: http://www.fns.usda.gov/cnd/milk/about-milk/faqs.htm. Accessed March 2002.
Wellisch, J.B., S.D. Hanes, L.A. Jordan, et al. 1983.The National Evaluation of School NutritionPrograms: Final Report. Volumes 1 and 2. SantaMonica, CA: Systems Development Corporation.

Economic Research Service/USDA Effects of Food Assistance and Nutrition Programs on Nutrition and Health / FANRR-19-4 E 167
Team Nutrition Initiative andNutrition Education and Training Program
168 E Effects of Food Assistance and Nutrition Programs on Nutrition and Health / FANRR-19-4 Economic Research Service/USDA
Banta, T., and J.L. Cunningham. 1982. A Chance to DoIt Right: Assessing the Impact on Participants of a State-Wide Nutrition Education Program. Paper presented atthe Annual Meeting of the American EducationalResearch Association, New York, NY, March 19-23.
Banta, T.W., J.L. Cunningham, W.W. Jozwiak, et al.1984. “Comprehensive Evaluation of a State NutritionEducation and Training Program,” Education105(4):376-81.
Burghardt, J., A. Gordon, N. Chapman, et al. 1993.The School Nutrition Dietary Assessment Study:School Food Service, Meals Offered, and DietaryIntakes. USDA, Food and Nutrition Service.
Connell, D.B., R.R. Turner, and E.F. Mason. 1985.“Summary of findings of the School Health EducationEvaluation: health promotion effectiveness, implementa-tion, and costs,” Journal of School Health 55(8):316-21.
Contento, I.R., A.D. Manning, and B. Shannon. 1992.“Research Perspective on School based NutritionEducation.” Journal of Nutritional Education24(5):247-60.
French, L. 2002. Personal communication.
Gillespie, A.H. 1984. “Evaluation of Nutrition Educationand Training Mini-grant Programs,” Journal ofNutritional Education 16(1):8-12.
Kalina, B.B., C.A. Phillips, and H.V. Minns. 1989.“The NET Program: a 10-Year Perspective,” Journalof Nutritional Education 21(1):38-42.
Lytle, L.A. 1994. Nutrition Education for School-AgedChildren: A Review of Research. USDA, Food andNutrition Service.
Maretzki, A.N. 1979. “A Perspective on NutritionEducation and Training,” Journal of NutritionalEducation 11(4):176-80.
National Research Council. 1989. Diet and Health:Implications for Reducing Chronic Disease Risk.Washington, DC: National Academy Press.
Nelsen, B.J. 1992. “The Role of the FederalGovernment in Promoting Health Through theSchools: Report from the Department of Agriculture,”Journal of School Health 62(4):138-40.
Olson, C.M. 1994. A Review of the Research on theEffects of Training in Nutrition Education onIntermediaries, Paraprofessionals, and Professionals.USDA, Food and Nutrition Service.
Shannon, B., and A.N. Chen. 1988. “A Three-yearSchool-based Nutrition Education Study,” Journal ofNutritional Education 20(3):114-24.
St. Pierre, R.G. 1982. “Specifying Outcomes inNutrition Education Evaluation.” Journal of NutritionEducation 14:49-51.
St. Pierre, R.G., T.D. Cook, and R.B. Straw. 1981. “AnEvaluation of the Nutrition Education and TrainingProgram: Findings from Nebraska,” Evaluation andProgram Planning 4:335-44.
St. Pierre, R.G., and J.A. Glotzer. 1981. An Evaluationof the Georgia Nutrition Education and TrainingProgram. Cambridge, MA: Abt Associates Inc.
St. Pierre, R.G., and V. Rezmovic. 1982. “AnOverview of the National Nutrition Education andTraining Program Evaluation,” Journal of NutritionEducation 14(2):61-66.
U.S. Department of Agriculture, Food and NutritionService. 2002a. “Team Nutrition School EnrollmentForm.” Available: http://www.fns.usda.gov/tn/Join/enrollmntform.pdf. Accessed May 2002.
U.S. Department of Agriculture, Food and NutritionService. 2002a. “Team Nutrition Policy Statement.”Available: http://www.fns.usda.gov/tn/grants/TN_PolicyStatement.pdf). Accessed April 2002.
U.S. Department of Agriculture, Food and NutritionService. 2002b. “Join the Team: CommunicationChannels.” Available: http://www.fns.usda.gov/tn/Join/Ontheteam/communication.html. Accessed April 2002.
U.S. Department of Agriculture, Food and NutritionService. 2002c. NET History. Available: http://www.fns.usda.gov/cnd/NET.NETproghist.htm. AccessedApril 2002.
U.S. Department of Agriculture, Food and NutritionService. 1998. The Story of Team Nutrition: PilotStudy Outcome Report.
U.S. Department of Agriculture and U.S. Departmentof Health and Human Services. 1990. DietaryGuidelines for Americans, 3rd edition. Home andGarden Bulletin No. 232.
Related Documents